Embed Size (px)
Citation preview

Author's personal copy
The B2B-RELPERF scale and scorecard: Bringing relationship marketingtheory into business-to-business practice
Luis Filipe Lages a,b,⁎, Andrew Lancastre a,c,✠, Carmen Lages d
a Faculdade de Economia, Universidade Nova de Lisboa, Campus de Campolide, 1099-032 Lisboa, Portugalb MIT's Deshpande Center for Technological Innovation, USA
c IADE–Instituto de Artes Visuais, Design e Marketing, Av. D.Carlos I, no. 4, 1200, Lisboa, Portugald ISCTE Business School-Lisbon, Av. das Forças Armadas 1649-026 Lisboa, Portugal
Received 23 August 2005; received in revised form 2 July 2006; accepted 7 May 2007Available online 8 August 2007
Abstract
It is becoming increasingly important from both theoretical and managerial perspectives to measure Customer Relationship Management(CRM) as a key intangible asset. This paper seeks to bring relationship marketing theory into practice by developing a new measure of relationshipperformance between two firms, the business-to-business relationship performance (B2B-RELPERF) scale. Survey findings from a sample ofapproximately 400 purchasing managers operating in a B2B e-marketplace reveal that relationship performance is a high-order concept, composedof several distinct, yet related, dimensions: (1) relationship policies and practices, (2) relationship commitment; (3) trust in the relationship, (4)mutual cooperation; and (5) relationship satisfaction. Findings reveal that the B2B-RELPERF scale relates positively and significantly withcustomer loyalty. The paper also presents the B2B-RELPERF balanced scorecard, which combines tangible and intangible metrics. While existingIT solutions usually focus exclusively on the use of tangible CRM indicators, this new tool includes the “voice of the customer”. At the manageriallevel, both the scale and scorecard could act as useful instruments for short- and long-term management, controlling, planning, and improvementof B2B relationships. Implications for relationship marketing theory are also presented.© 2007 Elsevier Inc. All rights reserved.
Keywords: Relationship marketing theory; Balanced scorecard; Electronic markets; e-Commerce; e-Marketplace; Performance measurement; CRM; B2B; Purchasing
1. Introduction
“If you do not measure it, then you cannot manage it!”(Jack Welch, former CEO of General Electric)
At the beginning of the 21st century it is widely accepted thatexisting Customer Relationship Management (CRM) solutions
have much room for improvement. The main reason may befound in a statement by Einstein: “everything that can be counteddoes not necessarily count; everything that counts cannot neces-sarily be counted.” In order to measure what “cannot necessarilybe counted”, existing CRM Information Technologies (IT) solu-tions employ tangible metrics to assess intangible dimensions(e.g. trust and cooperation). Many firm's intangible assetsconstitute unique opportunities for economic (added) value,such as customer relationships, and these can and should bescientifically assessed (Hunt, 1997).
As managers and researchers observe that good versus poorrelationships significantly affect business performance, there is anincreasing concern with achieving a better understanding ofrelationship development with business partners (Lages, Lages,&Lages, 2005a; Lages, Lages, & Lages, 2005b; Lemon, White, &Winer, 2002). Although intangible metrics are of interest toacademics and managers, these two worlds discuss the issue quite
Available online at www.sciencedirect.com
Industrial Marketing Management 37 (2008) 686–697
⁎ Corresponding author. Faculdade de Economia, Universidade Nova deLisboa, Campus de Campolide, 1099-032 Lisboa, Portugal. Tel.: +351213801601; fax: +351 213886073.
E-mail addresses: [email protected] (L.F. Lages), [email protected](A. Lancastre), [email protected] (C. Lages).
URL: http://prof.fe.unl.pt/~lflages (L.F. Lages).✠ Editor's note: Three days after this paper was accepted for publication,Andrew Lancastre passed away due to leukemia. This issue of IMM is dedicatedto his memory.
0019-8501/$ - see front matter © 2007 Elsevier Inc. All rights reserved.doi:10.1016/j.indmarman.2007.05.008

Author's personal copy
differently (Melnyk, Stewart, & Swink, 2004; Likierman, 2004).While most managers do not have the scientific knowledge todevelop reliable measures, most academic researchers are notconcerned with the development of scientific metrics forapplication at the managerial level (Weick, 2001). Within thiscontext, the development of business performance metricsrequires the exploration of synergies between researchers andmanagers in order to develop scientific and reliable measures thatmight be of interest to practitioners, bridging the gap. Moreover,although marketing academics and practitioners have beenexamining relationship marketing since the mid-1980s, asignificant criticism of most relationship marketing studies isthe fact that many studies are based on a single dimension or asingle financial indicator, intended to capture the nature ofcomplex relationships between buyers and suppliers (Yau et al.,2000).
A major priority for the upcoming years is the developmentof B2B metrics, namely in an e-commerce environment(Parasuraman, Zeithaml, & Malhotra, 2005; Parasuraman &Zinkhan, 2002). Despite both managers and academics' interestin understanding relationships in e-commerce, concerted effortshave not materialized (Grewal, Comer, & Mehta, 2001; Klein &Quelch, 1997). This article attempts to help bridge the gap byscientifically developing a new scale that enables, from acustomer perspective, the assessment of relationship perfor-mance in business-to-business (B2B) relationships — namedthe “B2B-RELPERF scale”. Furthermore, the authors use theB2B-RELPERF scale to suggest the development and testing ofthe respective relationship performance scorecard for inclusionin periodic business reports and/or existing CRM IT solutions. Itis believed that the scale (and future scorecard) might help firmsto administer resources more efficiently, by allocating them todifferent customers, and identifying deviations from objectives.Given the development of different customer relationship pro-cesses, this can also help a firm to establish its annual prioritiesin terms of marketing efforts. Moreover, a firm can use rela-tionship performance metrics as a motivation and reward toolfor managers and their teams (e.g., bonus, promotion) byrelying on comprehensive data. Finally, these metrics can sup-port the development, monitoring, improvement and bench-marking of customer relationship processes (see Lages et al.,2005a,b).
This paper starts by presenting the five dimensions of theB2B-RELPERF scale. We then refine the preliminary scaleusing qualitative research and testing it through a field surveyof approximately 400 purchasing managers of small andmedium-sized enterprises (SMEs) in an e-marketplace. Wealso analyze the impact of the B2B-RELPERF scale oncustomers' loyalty intentions. Finally, we present implicationsfor theory and practice, suggest a B2B-RELPERF scorecard,point out research limitations and define directions for furtherresearch.
2. The B2B-RELPERF scale
A recent meta-analysis of relationship marketing literature(Palmatier, Dant, Grewal, & Evans, 2005) indicates that re-
search in the field should follow a multidimensional perspectivebecause there is no single or best dimension able to capture thefull essence of this phenomenon. Indication of the main con-stituents of a relationship process can be found in the literature.While building on past RM literature, the B2B-RELPERF scalereflects the performance of a buyer–supplier relationshipmarketing process at a specific point in time. This scale is ahigher-order construct composed of five distinct, yet related,dimensions: (1) relationship policies and practices; (2) trust inthe relationship; (3) relationship commitment; (4) mutual coop-eration; and (5) relationship satisfaction.
Following the findings of Dwyer, Schurr and Oh (1987),supported some years later by Jap and Ganesan (2000), thesefive dimensions are key ingredients of a relationship process.Relationship policies and standards of conduct that mark arelational contract take form during the exploration phase, andgo on building during the relationship process. The rudiments oftrust and joint satisfaction established during this phase developin the next stages of the process, leading to increased risk takingwithin the dyad. The expansion process that follows the ex-ploration phase “is a consequence of each party's satisfactionwith the other's role performance”. The resulting perceptions ofgoal congruence and cooperation lead to interactions beyondthose that are strictly required at the outset, resulting in theparties purposefully committing resources to maintain anddevelop the relationship. These findings, supported by therelationship marketing literature (Anderson & Narus, 1990;Morgan & Hunt, 1994; Sirdeshmukh, Singh, & Sabol, 2002),suggest the significance of the identified five dimensions torelationship process performance.
2.1. Relationship policies and practices
Relationship policies and practices represent one of themost important dimensions during a relationship process (Jap& Ganesan, 2000). By establishing clear relationship policiesand practices, the supplier becomes motivated to behave in away that is beneficial to the relationship as a whole, and as aresult, “emerging exchange partners start setting the groundrules for future exchange” (Dwyer et al., 1987: 17). Despitethe well-recognized significance of such policies, few studieshave examined company behaviors and practices specificallyor the mechanisms by which they strengthen a relationship(Sirdeshmukh et al., 2002). Nevertheless, it is recognized thatrelationship policies and practices should include ethicalvalues, such as the supplier showing respect for the customer,because they contribute to the development of the relation-ship between firms and customers (Morgan & Hunt, 1994).Indeed, the extent to which partners have common beliefsabout what behaviors and policies are important, appro-priate, and right, is important to the process of relationshipdevelopment.
Strategic considerations motivate firms to serve their cus-tomers better, and technology is viewed as a means to buildcompetitive advantage. In e-markets, strategic considerations,such as providing better customer service, are particularlysignificant because the virtual world increases the possibility of
687L.F. Lages et al. / Industrial Marketing Management 37 (2008) 686–697

Author's personal copy
suppliers acting opportunistically and customers perceivingaugmented risk and uncertainty (Grewal et al., 2001). Thus,providing better service through quicker and easier problemsolving represents an added relationship value in the electroniccontext and a contribution to the buyer–supplier relationship.
2.2. Trust
In interpersonal relationships trust is defined as the “willing-ness to rely on another party and to take action in circumstanceswhere such actions make one vulnerable to the other party”(Doney, Cannon, &Mullen, 1998, 604). Trust has been extendedto relations between organizations since interorganizational ex-changes are made by individuals from each organization(Aulakh, Kotabe, Sahay, 1996). Thus, trust exists when oneparty has confidence in an exchange partner's reliability andintegrity (Morgan &Hunt, 1994). Trust is an essential ingredientin the creation, development, and maintenance of long-termrelationships between buyers and suppliers (Anderson & Narus,1990; Ganesan, 1994).
According to the findings of Palmatier et al. (2005), trust is akey dimension of (objective) performance. As trust is the cor-nerstone of the strategic partnership and relationship develop-ment process (Moorman, Deshpandé, & Zaltman, 1993;Morgan & Hunt, 1994), it is widely accepted that trust plays acentral role in the development of relationship performance(Dwyer et al., 1987; Morgan & Hunt, 1994). Trust becomeseven more important for relationship and loyalty developmentpurposes when perceived risk is more pronounced. Perceivedrisk in an e-commerce environment is high when compared totraditional commerce, due to spatial and temporal separationbetween buyers and sellers. The internet transaction typicallytakes place from different locations at different times, and goodsor services are delivered after a seller has verified payment.When selecting a supplier, a buyer might consider the possi-bility that the supplier may be an expert in attracting customersand cashing credit cards but not in actually delivering goods orservices (Smith, Bailey, & Brynjolfsson, 1999). Thus, given thehigher perceived risks and uncertainty in the “marketspace,”trust may be even more critical in the buyer–supplier relation-ship development process than in the traditional marketplace.
2.3. Relationship commitment
Relationship commitment is defined as the “desire to devel-op a stable relationship, a willingness to make short-term sac-rifices to maintain the relationship, and a confidence in thestability of the relationship” (Anderson & Weitz, 1992: 19).Commitment is essential for the development of long-termrelationships (Anderson & Narus, 1990; Kumar, Scheer, &Steenkamp, 1995), and is an important indicator of both objec-tive and relationship performance (Roberts, Varki, & Brodie,2003). Moreover, relationship commitment is a means for dif-ferentiating successful relationships from unsuccessful ones(Morgan & Hunt, 1994).
Suppliers in a committed relationship gain greater access tomarket information, which enables them to select a better cus-
tomer-oriented assortment (Anderson & Weitz, 1992), andsimilarly buyers in an e-marketplace receive more relevant up-to-date market and product information, a better assortmentchoice, and order/payment automation (Smith et al., 1999;Weiber & Kollman, 1998). Because both parties receive newbenefits from each other, each has a stronger motivation tobuild, maintain and develop the relationship through renewedcommitted efforts (Kumar et al., 1995). Thus, strong relation-ships are “built on the foundation of mutual commitment”(Berry & Parasuraman, 1991: 139).
In an organizational environment, commitment may beaffective (attachment to an organization), continued (perceivedcost of leaving an organization), or normative (perceived obli-gation to stay with an organization) (Meyer, Allen, & Smith,1993). Of these three, only affective commitment influences thedegree to which the customer wants to maintain a relationshipwith the firm (Roberts et al., 2003). Thus, in the electronicsetting, we assume that relationship commitment is the buyer'sattachment to the supplier and that it leads to the development ofstable, long-term relationships.
2.4. Mutual cooperation
Relationships require cooperative behavior (Morgan & Hunt,1994). Cooperation between partners in a relationship exchangeprocess grows as each partner perceives greater benefits fromworking together than from working independently. Thus,mutual cooperation is defined as “similar or complementarycoordinated actions taken by firms in interdependent relation-ships to achieve mutual outcomes or singular outcomes withexpected reciprocation over time” (Anderson & Narus, 1990:45).
“The e-marketplace is a networked information system thatserves as an enabling infrastructure for buyers and sellers toexchange information, transact, and perform other activities”(Varadarajan & Yadav, 2002: 297). Mutual cooperation in anelectronic environment is viewed in terms of the regularity ofthe interactions and the openness in communication activitiesbetween the buyer and the supplier (Hewett & Bearden, 2001;O'Keefe, O'Connor, & Jung, 1998), and represents animportant element in relationship performance planning, man-agement, and control.
2.5. Relationship satisfaction
Relationship satisfaction refers to “the cognitive and affec-tive evaluation based on personal experience across all …episodes within the relationship” (Roberts et al., 2003: 175).Thus, relationship satisfaction can be considered to be a positiveemotional and rational state resulting from the assessment of thebuyer's working relationship with the supplier (Geyskens,Steenkamp, & Kumar, 1999). Relationship satisfaction sum-marizes the customer's previous interactions with the supplier,which in turn influence expectations of future relationshipdevelopment (Roberts et al., 2003). Customer evaluationof relationship satisfaction with the supplier is critical forthe development of future business exchanges (Cannon &
688 L.F. Lages et al. / Industrial Marketing Management 37 (2008) 686–697
Author's personal copy
Perreault, 1999). Positive interactions lead to long-term con-tinuation of the relationship, thus emphasizing that relationshipsatisfaction is essential to the improvement of relationshipperformance.
3. Method
3.1. Unit of analysis and research setting
The unit of analysis for this research is a specific buyer'srelationship with a specific supplier. The analysis is conducted byexamining the buyer's perspective. It was decided to collectcustomers' data because the customer ultimately decides whetherto purchase from the supplier, and the customer's perception ofthe relationship is likely to predominantly determine its develop-ment and performance (Cannon & Perreault, 1999).
The research setting has two main characteristics we believeto be worth examining when considering relationships:business-to-business and electronic. Business-to-business be-cause recent research findings (Palmatier et al., 2005) reveal thatcustomer relationships lead to higher levels of objectiveperformance in business markets versus consumer markets.Electronic because the e-market environment might beperceived as risky and uncertain, and thus relationshipdevelopment can be particularly relevant and difficult. Elec-tronic business has added a new dimension to businessrelationship discussions (Morgan & Hunt, 2003). In an e-market environment, business is conducted at a distance, andrisks and uncertainties are enhanced because the Internet, whichis a relatively new and complex technology from theconsumer's perspective, presents security problems. Forexample, online suppliers can easily register and track customerdata, which increases the possibility for them to act opportu-nistically. Furthermore, many online buyers may not yet haveaccumulated the necessary shopping experience and relevantknowledge about potential market suppliers or other partners inthis new shopping channel (Einwiller, Ingenhoff, & Schmid,2003), which might undermine their confidence in using it.
3.2. The online business center
The online business center pmelink.pt, selected for thisresearch, sells office goods and services (e.g., office paper,consumables, computers, office furniture, recruitment services,customer credit reports) to SMEs in order to support their corebusinesses. We use pmelink.pt to analyze the extent to which itmight be possible to monitor marketing relationship perfor-mance in a non-critical products' context. The purchasing lit-erature suggests that non-critical items do not have a significantimpact on the finances of most firms, representing a low supplyrisk to most B2B buyers (Kraljic, 1983). It has been argued thatfor routine products, value added strategies play a secondaryrole because the buyer normally relies on exploitation of fullpurchasing power, order volume optimization, and targetedpricing strategies. As long as key purchasing variables (e.g.lowest price and availability/delivery) are addressed by theseller, the buyers will become committed, and all other “added-
value” activities will become secondary.1 The pmelink.ptsupplier delivers non-critical products to SMEs by focusingon added-value services, such as offering management relevantinformation, customer problem solving and advice, productportfolio access and payment convenience, customization andpersonalization, following retention and loyalty strategies.
Interestingly, findings from a previous study (see Lancastre& Lages, 2006) revealed that although pmelink.pt sells routine,or at best non-critical products, the key determinants of buyers'cooperation (a key dimension in a relationship process) withthis seller were essentially marketing relationship dimensions.Surprisingly, product prices (− .05, Pb.05) resulted in a minordeterminant of cooperation, and product delivery showed a non-significant association with that relationship dimension. Hence,by using a sample of pmelink.pt's business customers, it is ourgoal to better understand how it is possible for a firm to monitorand strengthen relationship performance with its customerseven when dealing with non-critical products.
Essentially, pmelink.pt operates among diverse businessesand suppliers: a customer places an order with pmelink.pt,which is forwarded to one of its 30 suppliers, with whom theyhave previously established contractual agreements; an expresscargo carrier takes care of delivery logistics, and pmelink.ptbills the customer. The pmelink.pt online business center wasformed when three major Portuguese groups (Portugal Telecomand two of the main national Banks) recognized an opportunityto market a variety of goods and services to their common clientbase. Portugal Telecom's market penetration is almost 100%and the other two partners together retain around 65% of allSMEs operating in the country as clients. The two banksrealized that during their day-to-day relationships with theirSME's customers, the SMEs were generally strong concerningtheir core businesses but relatively poor in providing supportareas – clerical, office supplies and purchasing, IT, marketing,logistics and so on – vital for relationship development. Thecompany pmelink.pt offered an opportunity through technologyto offer those supporting tools to their SME's customers as wellas to increase their knowledge and business with them.
The online business center pmelink.pt uses an Internet andCRM electronic platform to formulate an integrated e-businessinfrastructure that allows the provision of adequate and reliableinformation, a variety of added-value services, and personali-zation. In addition to products, pmelink.pt offers a range ofbusiness expertise, advice and information through the sameonline connection. As an example, pmelink.pt realized thatSMEs often had difficulty dealing with various legal require-ments. In response, it developed a package of core services thatincludes a search engine for all types of legal documents, asimulator for various fees and taxes, a fiscal calendar withreminders of major dates, and a library of printable officialforms. Not only does the supplier promise fast and efficientdelivery of goods (pmelink.pt promises a 99% delivery successrate within a 24-h timeframe), it also leverages direct costreductions to its clients through bulk ordering and strategicsourcing of materials from key suppliers.
1 We acknowledge an anonymous reviewer for this insight.
689L.F. Lages et al. / Industrial Marketing Management 37 (2008) 686–697

Author's personal copy
Monitoring user activities on the site allows individualvisitors to be segmented, so that campaigns and newsletters canbe targeted more effectively, and loyalty programs can bedeveloped. Based on its unique relationship with its investorsand customers, pmelink.pt aimed to contact and start businesswith around 10% of the 200,000 SMEs operating in Portugal bythe end of its third year of existence.
3.3. Survey instrument development and test
Scale development follows Churchill's (1979) traditionalapproach. On the basis of the literature review and preliminaryfindings, we specified the domain of the construct to includefive Business-to-Business Relationship Performance (B2B-RELPERF) dimensions — relationship policies and practices,trust, relationship commitment, mutual cooperation, and rela-tionship satisfaction. Fifty-two items were developed to mea-sure these five dimensions based on CRM and electronicmarketing literature. These items were then refined through in-depth interviews with the five managers of pmelink.pt involvedin the e-business operations. On the basis of their feedback,some items were removed so that the measures became betteradjusted to the reality of e-markets. Three SME customers thenassessed the final set of items of the B2B-RELPERF scale forcontent and face validity. To pre-test the B2B-RELPERF scale,data were collected through an initial online survey targeting 40SMEs previously selected by the supplier pmelink.pt, consid-ering loyal, regular and infrequent buyers. At the end of thisprocess the scale included the 5 dimensions consideredpreviously. As a consequence of the above-mentioned stagesof the refinement process, the final solution included 38 of the52 initial items.
3.4. Data collection
The exploratory stage was followed by a survey based on anonline questionnaire that we administered to a sample of theSME customers who were responsible for purchasing opera-tions. In line with previous studies conducted by pmelink.pt, theonline survey attached to the firm's periodic online newsletter,resulted in 395 valid questionnaires, which is greater than theminimum number (i.e., 381) required for a 95% confidencelevel. Stratified sampling was accomplished and controlledthrough the data collecting process, using the supplier's custom-ers' loyalty degree strata grouping — loyal, regular, infrequentand new buyers.
3.5. Sample profile and nonresponse bias
Respondents were representative of the main industry andeconomic activities in the primary sector (5%), industrial sector(21%), and services sector (74%). They also regularly pur-chased main product categories (as classified by the supplier):paper (74%), consumable goods (73%), other office products(57%), systems equipment (29%), office furniture (5%), andservices (6%). On the basis of the supplier database, we directedthe survey to individuals who were primarily responsible for
the SMEs' buying centers. Although the job titles of the re-spondents ranged from general manager to financial manager,purchasing manager, and administrative manager, all of therespondents were the main person responsible for their SME'spurchasing operations and most interacted with the supplier on adaily basis. In terms of profile, 20% of the respondent firms hadfewer than 6 months of business experience with the supplier,30% varied between 6 and 12 months, and the remaining 50%had more than 12 months of experience. In this last group, 70%had more than 2 years of experience. This indicates that thoughthe title of the respondents' positions may be wide ranging, allappear to have significant knowledge about the specificpurchasing activities of the firm. Although the respondents'profile suggests a high degree of confidence in the sample, weconsidered it important to test for possible nonresponse bias. Byassessing the differences between the early and late respondents(Armstrong & Overton, 1977), we found no significantdifferences.2
Exploratory Factor Analysis (EFA) was conducted toexamine the factor structure of each variable presented in theconceptual model. EFA is a data simplification technique par-ticularly useful for reducing the number of indicators to amanageable set. EFAwith principal components analysis (PCA)and varimax rotation (when Kaiser's rule is used for factorselection) was performed on the survey data. Varimax rotation isthe most widely used analytical format to analyze orthogonalfactors. This method was selected because although the sub-dimensions may be related, the relationships cannot be antici-pated a priori. The use of an orthogonal rotation has theadvantage of allowing a more intuitive interpretation of theresults (Hair, Anderson, Tatham, & Black, 1998). Coefficientalpha was also computed for the emerged factors in order toassess the validity of the initial scales and further purify thenumber of items for each factor. Five items were removedduring this initial process, two from the factor relationshippolicies and practices (Sirdeshmukh et al., 2002) and three fromthe factor relationship commitment (Anderson & Weitz, 1992).The other 19 items were removed as a consequence of CFA,Fornell and Larcker's (1981) test of variance extracted, andBagozzi's (1980) test of composite reliability.
4. Data analysis
4.1. CFA
CFAwas performed to assess the measurement properties ofthe scales, using full-information maximum likelihood estima-tion procedures in LISREL 8.3 (Jöreskog & Sörbom, 1993). Inthis model, each item is restricted to load on its prespecifiedfactor, with the five first-order factors correlating freely. Thechi-square for this model is significant (χ2 =143.58, d.f.=67,Pb.05). Because the chi-square is sensitive to sample size, we
2 Early respondents were defined as the first 75% of the returnedquestionnaires, and the last 25% were considered to be late respondents. Theseproportions approximate the actual way in which questionnaires were filled in.
690 L.F. Lages et al. / Industrial Marketing Management 37 (2008) 686–697

Author's personal copy
also assessed additional fit indices: (1) non-normed fit index(NNFI), (2) comparative fit index (CFI), incremental fit index(IFI), and standardized root mean square residual (SRMR). TheNNFI, CFI, and IFI, of this model are .99, and the SRMR is .41.Because fit indices can be improved by allowing more terms tobe freely estimated, we also assessed the root mean square errorof approximation (RMSEA), which, for our measurementmodel, is .054. A full listing of the 14 final items and theirscale reliabilities appear in Table 1. The average internal reli-ability (Cronbach α) was .86.
The significant standardized loadings of each item on itsintended construct (average loading size was .83) evidencedunidimensionality. Table 1 shows that all constructs presentthe desirable levels of composite reliability (Bagozzi, 1980).
Table 1 also shows that Fornell and Larcker's (1981) index ofvariance extracted was greater than the recommended level of.50 for all five constructs.
The construct intercorrelations, which are significantly dif-ferent from 1, reveal evidence of discriminant validity, and theshared variance between any two constructs (i.e., the square oftheir intercorrelation) is less than the average variance explainedin the items by the construct (Fornell & Larcker, 1981;MacKenzie, Podsakoff, & Rich, 1999). The largest squaredmultiple correlation between any two constructs was .53 (.73was the highest correlation [between satisfaction and commit-ment and between satisfaction and trust]), whereas the varianceextracted ranged from .61 to .78.
To assess nomological validity, the measures were testedwith respect to a dimension to which the constructs are sup-posed to be theoretically related (Churchill, 1995). Expecting apositive relationship between relationship performance andloyalty is well grounded in theoretical reasoning. Buyer loyaltyis the intention to perform a set of behaviors that indicate amotivation to maintain a relationship with a supplier, includingallocating a higher share of wallet, engaging in positive word ofmouth, and repeat purchasing (Zeithaml, Berry, & Parasuraman,1996). When suppliers are oriented to the relationship and act ina way that strengthens relationship policies and practices, trust,relationship commitment, cooperative activities, and satisfac-tion, the perceived risk with the specific service supplier islikely to be reduced, enabling the customers to make confidentpredictions about the supplier's future behaviors (Morgan &Hunt, 1994). This helps shape the customers' perceptions abouttheir relationship with suppliers, and enhances their loyalty(Sirdeshmukh et al., 2002). According to recent findings(Palmatier et al., 2005), relationship marketing may buildcustomer loyalty more effectively in this type of research setting(i.e. service offering and business markets).
We used three items for measuring buyer loyalty (α=.93):(1) the buyer's intention to make most future purchases from thesupplier, (2) the buyer's intention to recommend the supplier toother firms, and (3) the buyer's intention to use the supplier thenext time he/she needs to purchase products or services. Wemeasure all items on 7-point Likert scales, anchored by “strong-ly disagree” and “strongly agree” (Sirdeshmukh et al., 2002).We found that loyalty is positively correlated with relationshiporientation (r= .50), relationship commitment (r=.64), trust(r=.53), mutual cooperation (r=.58), and relationship satisfac-tion (r=.80). Given that all of the coefficients are positive andsignificant (Pb.01 or better), we conclude that the performanceof the buyer–seller relationship has a positive impact on loyalty.Thus, we have support for the nomological validity of the fiveproposed measures (Cross & Chaffin, 1982).
4.2. Higher-order factor
We also estimate a second-order factor model of B2B-RELPERF. In addition to obtaining respondents' evaluations onthe five dimensions, the second-order factor model captures thecommon variance among them, which reflects an assessment ofthe B2B relationship performance process. This model includes
Table 1The B2B-RELPERF scale: scale dimensions and items, reliabilities, andvariance extracted
Please rate your agreement with each of thefollowing statements, regarding your relationshipwith Firm X:
α /ρvc(n) /ρ
RPP: Relationship policies and practices .81/.61/.82(Adapted from Sirdeshmukh et al., 2002)
V1 Firm X has policies that show respect for the customer.V2 Firm X has practices that make solving problems easy.V3 Firm X solves my firm's problems quickly.
RCO: Relationship commitment .86/.69/.87(Adapted from Kumar et al., 1995)
V4 Our relationship with Firm X is a long-term partnership.V5 We would not drop Firm X because we like being
associated with it.V6 We want to remain as a customer of Firm X because we
have pride in being associated with a firm that carries atechnological image.
TRUST: Trust in the relationship .91/.78/.91(Adapted from Morgan & Hunt, 1994)In our relationship, Firm X…
V7 is someone to whom I give my confidence.V8 has high integrity.V9 gives us reliable information and advice.
MCO: Mutual cooperation .82/.71/.83(Adapted from Hewett & Bearden, 2001)
V10 My firm and Firm X regularly interact.V11 There is an open communication between our firms.
SAT: Relationship satisfaction .88/.71/.88(Adapted from Cannon & Perreault, 1999)
V12 Overall, we are satisfied with Firm X.V13 We are pleased with what Firm X does for us.V14 If we had to do it again, we would still choose to
use Firm X.
Notes: Firm X = “The supplier” (i.e., pmelink.pt). For purposes of replication ofthis study in other types of B2B relationships, Firm X may be considered anytype of firm (e.g., a manufacturer, buyer, distributor, franchisor, franchisee,exporter, importer, multinational).Cronbach's α = internal reliability (Cronbach, 1951); ρvc(n) = variance extracted(Fornell & Larcker, 1981); and ρ = composite reliability (Bagozzi, 1980).All items are 7-point Likert scales, anchored by “strongly disagree” and“strongly agree.”
691L.F. Lages et al. / Industrial Marketing Management 37 (2008) 686–697
Author's personal copy
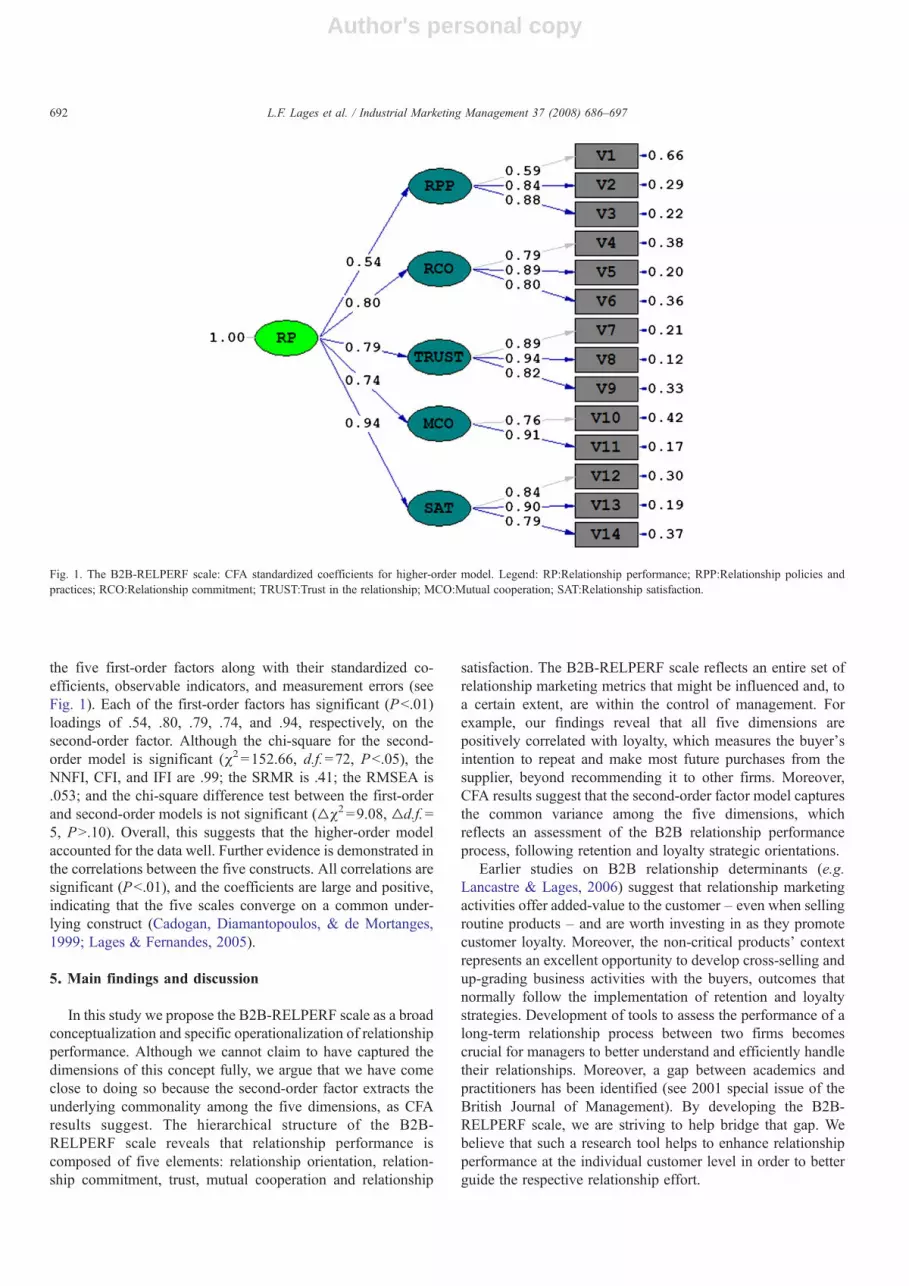
the five first-order factors along with their standardized co-efficients, observable indicators, and measurement errors (seeFig. 1). Each of the first-order factors has significant (Pb.01)loadings of .54, .80, .79, .74, and .94, respectively, on thesecond-order factor. Although the chi-square for the second-order model is significant (χ2 =152.66, d.f.=72, Pb.05), theNNFI, CFI, and IFI are .99; the SRMR is .41; the RMSEA is.053; and the chi-square difference test between the first-orderand second-order models is not significant (▵χ2 =9.08, ▵d.f.=5, PN.10). Overall, this suggests that the higher-order modelaccounted for the data well. Further evidence is demonstrated inthe correlations between the five constructs. All correlations aresignificant (Pb.01), and the coefficients are large and positive,indicating that the five scales converge on a common under-lying construct (Cadogan, Diamantopoulos, & de Mortanges,1999; Lages & Fernandes, 2005).
5. Main findings and discussion
In this study we propose the B2B-RELPERF scale as a broadconceptualization and specific operationalization of relationshipperformance. Although we cannot claim to have captured thedimensions of this concept fully, we argue that we have comeclose to doing so because the second-order factor extracts theunderlying commonality among the five dimensions, as CFAresults suggest. The hierarchical structure of the B2B-RELPERF scale reveals that relationship performance iscomposed of five elements: relationship orientation, relation-ship commitment, trust, mutual cooperation and relationship
satisfaction. The B2B-RELPERF scale reflects an entire set ofrelationship marketing metrics that might be influenced and, toa certain extent, are within the control of management. Forexample, our findings reveal that all five dimensions arepositively correlated with loyalty, which measures the buyer'sintention to repeat and make most future purchases from thesupplier, beyond recommending it to other firms. Moreover,CFA results suggest that the second-order factor model capturesthe common variance among the five dimensions, whichreflects an assessment of the B2B relationship performanceprocess, following retention and loyalty strategic orientations.
Earlier studies on B2B relationship determinants (e.g.Lancastre & Lages, 2006) suggest that relationship marketingactivities offer added-value to the customer – even when sellingroutine products – and are worth investing in as they promotecustomer loyalty. Moreover, the non-critical products' contextrepresents an excellent opportunity to develop cross-selling andup-grading business activities with the buyers, outcomes thatnormally follow the implementation of retention and loyaltystrategies. Development of tools to assess the performance of along-term relationship process between two firms becomescrucial for managers to better understand and efficiently handletheir relationships. Moreover, a gap between academics andpractitioners has been identified (see 2001 special issue of theBritish Journal of Management). By developing the B2B-RELPERF scale, we are striving to help bridge that gap. Webelieve that such a research tool helps to enhance relationshipperformance at the individual customer level in order to betterguide the respective relationship effort.
Fig. 1. The B2B-RELPERF scale: CFA standardized coefficients for higher-order model. Legend: RP:Relationship performance; RPP:Relationship policies andpractices; RCO:Relationship commitment; TRUST:Trust in the relationship; MCO:Mutual cooperation; SAT:Relationship satisfaction.
692 L.F. Lages et al. / Industrial Marketing Management 37 (2008) 686–697

Author's personal copy
One of the implications of these concerns is the suggestionthat from a managerial perspective, the possibility of groupingthe 5 dimensions into a single score allows managers to have astarting point to more easily recognize and monitor the overallrelationship performance with each customer. Indeed, the func-tion of the customer relationship development process is tobuild relationships with preferred customers (Knox, 1998). Notall customers are willing to join a relationship process with thesupplier, nor are they all-important for the supplier to add valueto his business (Christy, Oliver, & Penn, 1996; Grönroos, 1997).In fact, the supplier may expend significant sums of money toretain an unprofitable customer, or to establish and maintain arelationship when the customer does not wish for one. Seg-mentation strategies, based on customer requirements, profit-ability, and customer loyalty are essential (Knox, 1998; Payne& Frow, 1999). This will lead to more productive marketingactivities by developing and increasing individual customerloyalty (Palmatier et al., 2005).
This research develops a buyer–seller relationship measurein an e-business and routine products context. The e-market-place is a particularly interesting environment in which todevelop these metrics because e-business relationships areconducted at a distance, and risks and uncertainties are mag-nified. Despite purchasing literature suggestions that the buyernormally relies on order volume optimization and pricing strat-egies, the routine and non-critical products context represents anopportunity for the supplier to follow added-value relationshipstrategies, in order to develop up-selling, up-grading and cross-selling of its products and services. Moreover, because therelationship process develops through various stages in whichdifferent dimensions contribute in different ways during theprocess (Dwyer et al., 1987; Jap & Ganesan, 2000) we suggestthat the use of a balanced scorecard that weights dimensionsdifferently may capture this process.
6. The B2B-RELPERF scorecard
At a time when B2B relationships are instrumental in thedetermination of enterprises' value and performance, the B2B-RELPERF scale has the potential to help practitioners plan,manage, monitor, and improve their ongoing B2B relationshipsif properly integrated with objective metrics through a balancedscorecard – often available through existing Enterprise Re-source Planning (ERP) and traditional CRM solutions – (seeAppendix).3 This approach of matching objective and subjec-tive metrics has the potential to provide a better understandingof relationship performance constituents, and to increase returnon relationship marketing investments (see: Bolton, 2004;Lehmann, 2004).
Managers are often judged not only by the performance ofdifferent relationship processes, but also by the priorities theyassign to the relationships. The recommendation is to compare
each current year (Y) weighted score with that of the previousyear (Y−1) because problems are easier to detect by the size ofthe gap between a current year's metrics and the base score fromthe previous year. This annual feedback enables marketers tomake corrections and helps them define goals and priorities forthe relationships in the following year. To define each rela-tionship process goal and degree of priority, firms might alsoconsider existing objective metrics per customer and industrybenchmarks, such as sales or margins by product category,frequency of sales and respective deviation standard, promotionsales and costs (in the case of pmelink.pt). Another possibility isto set sub-goal intervals for the B2B-RELPERF scorecard (e.g.on a quarterly or half-year basis). The major advantage of this isthat quarterly or half-year feedback would enable marketers toreview relationship performance trends and to make correctionsmore frequently, in response to the changing environment(Abernathy, 1997). In this way, periodic scheduled reviews withthe B2B-RELPERF scorecard could be extremely useful inmonitoring and improving relationship and loyalty strategies.
Regarding the B2B-RELPERF scorecard development andimplementation, data from longitudinal studies are required totest it. We present some recommendations below. The first stepis to enter under “customer description” the name of the cus-tomers to be analyzed. Second, under the “objective metrics”column(s), identify existing financial or other objective metrics(e.g. sales, profits, sales frequency, operational costs, lifetimevalue) and establish a ranking for each customer. Then, askcustomers to assess the 14 items in the B2B-RELPERF scale ona 7-point Likert scale (see Table 1). The next step is to assess theaverage score for each of the five B2B-RELPERF dimensionsand multiply them by their weights. These results should bepresented under the “relationship performance dimensions”column. The relationship process develops through mutuallearning stages in which relationship policies and practices,trust, relationship commitment, mutual cooperation, andrelationship satisfaction are critical issues. Depending on therelationship stage, different factors might present differentweightings. Weightings should differ across the various cus-tomers' relationship processes, depending on the differentphases of relationship development. Hence, it is important thatthe management team agrees on the weightings of each dimen-sion before its implementation and future assessment. The sumof the five weighted dimensions represents the final RPScore percustomer. The RPWeightedScore is the result of multiplying thefinal RPScore by the weight of each customer to overall rela-tionship performance. Each RP weight to overall relationshipperformance must take into consideration different factors, suchas the firm's mission and objectives, the firm's strategy, anddifferent insights from managers. A final RELPERFScore resultsfrom the sum of all individual RPWeightedScores.
7. Limitations and further relationship marketing research
Although this study provides a number of new insights, itis important to note its limitations. A first limitation regards thespecificities of this study's research context and respondents—Portuguese SMEs' relationships with an internet-based supplier.
3 An IT solution is also being developed while using as a basis the B2B-RELPERF Scale and the B2B-RELPERF Scorecard. For further informationplease contact the first author.
693L.F. Lages et al. / Industrial Marketing Management 37 (2008) 686–697
Author's personal copy
While enhancing the focus of this research, it may limit thegeneralization of the results to some degree, at the same timecreating the need for further research, in this environment andother contexts. Another limitation results from the fact thatresearch relies only on the responses of the buyers. Ideally,researchers should collect data from both sides of the dyad.However, as research in relationship marketing is still at an earlystage of development, we begin with the buyer's view to betterunderstand the components of B2B relationship performance, asin many situations the buyer is the one that decides if he wishesor not to continue the relationship, while evaluating the added-value that results from his relationship with the supplier. A thirdlimitation is that our research instrument (i.e., the questionnaire)may have created common method variance. This could beparticularly problematic if the respondents were aware of theconceptual framework of interest. However, we did not explainthe specific purpose of the study to them, and we mixed andseparated the construct items (Jap, 2001; Lages & Montgomery,2005). Furthermore, we guaranteed confidentiality to all surveyparticipants for self-presentation reasons, which also helps toreduce the possibility of bias in issues such as relationshippolicies and practices, trust, commitment, cooperation, andsatisfaction (Singh, 2000). In addition, if common method biasexists, a CFA containing all constructs should produce a single-method factor (Podsakoff and Organ, 1986). The goodness-of-fit indices (NNFI= .85, CFI= .87, IFI= .87, and RMSEA=.191)indicate a poor fit, which suggests that biasing from commonmethod variance is unlikely (Lages and Lages, 2004). Hence,due to the potential pitfalls of this tool, our efforts to develop theB2B-RELPERF scale should be seen as a starting point,considered as part of a larger effort to help managers andresearchers capture relationship performance. Nevertheless,future operationalization of the B2B-RELPERF scorecard isencouraged, through a combination of objective and intangiblemetrics, as earlier discussed, to help overcome the issue ofcommon method bias.4
This study provides a foundation for significant researchendeavors to advance the field. Additional research is requiredthat analyzes the antecedents and consequences of the B2B-RELPERF scale (see Lages et al., in press). In addition to itsrelationship with loyalty, further research must investigate howthis scale is related to other established constructs in therelationship marketing field, such as transaction-specificinvestments. We recommend further research that tests theB2B-RELPERF scale on the suppliers' side and on both sides ofthe dyad. Consider testing the scale in different settings and in awide range of activities, such as exporter–importer andfranchiser–franchisee relationships, and whether findings aredifferent depending on the buying situation of the customers oron the customer profile. Relationships in an internationalcontext transcend national boundaries, and are particularlycomplex because they are affected by socio-cultural, and otherenvironmental differences. When applying the scale to different
contexts, we encourage researchers to add new items and factorsin order to continue refining the B2B-RELPERF scale.
8. Conclusions
In this economic environment when corporate budgets arebeing squeezed, Chief Marketing Officers are kept up at nightby worry, trying to justify their expenditures and their existence.They believe that what they are doing has value, and they haveto figure out how to demonstrate that value to skeptical CEOsand CFOs (Reibstein, 2004).
As a direct response to a recent observation in the literature(Morgan & Hunt, 2003), we hope that this paper will helpcultivate knowledge on relationship management theory whileshedding light on B2B relationships that are supported by newinformation and communication technologies. Moreover, ata time when researchers are challenged to present studies withmanagerial implications (Marketing Science Institute, 2004), theB2B-RELPERF scale and the B2B-RELPERF scorecard mightbe used to address the managerial needs of B2B relationshipperformance planning, implementation, and control. By usingthe B2B-RELPERF scale and the B2B-RELPERF scorecard toassess the performance of a buyer–supplier relationship process,managers can better understand the constituent elements of therelationship process, which in turn aids managers in selecting,using, and controlling the most adequate marketing tools foreach of these elements. These tools may also help managersunderstand differences that exist in the relationship processdevelopment phases among different customers or groups andcan enable managers to handle such differences more efficientlyand effectively. Moreover, by defining actions that addresspotential problems during the relationship marketing processdevelopment, managers can ultimately influence their firm'srelationship orientation, retention, and loyalty strategies. Finally,by balancing and complementing financial and other operationalmeasures with intangible customer metrics, the B2B-RELPERFbalanced scorecard allows for better monitoring of relationshipperformance at both the customer and corporate levels, whilehelping to focus the entire organization on long-term strategyand improving shareholder value (Kaplan & Norton, 1992,1996, 2000). As a whole, in addition to addressing the relation-ship marketing area, this paper may also enrich knowledge in thee-commerce and purchasing literature.
Acknowledgements
This research was funded by the following research grants tothe first author: NOVA FORUM, NOVA EGIDE, and 6thEuropean Framework Programwhile affiliatedwithUniversidadeNova de Lisboa; FCT-EU while a Visiting Scholar at LondonBusiness School and MIT's Deshpande Center for TechnologicalInnovation. Andrew Lancastre thanks UNIDCOM/IADE, andCarmen Lages thanks UNIDE/ISCTE. The authors acknowledgeIMM editor, three IMM anonymous reviewers, and theparticipants and reviewers of 2005 CRM (Russia), 2005 ICRM(Canada) and 2007 EMAC (Iceland) conferences for commentson earlier versions of this manuscript.4 We acknowledge an anonymous reviewer for this insight.
694 L.F. Lages et al. / Industrial Marketing Management 37 (2008) 686–697
Author's personal copy
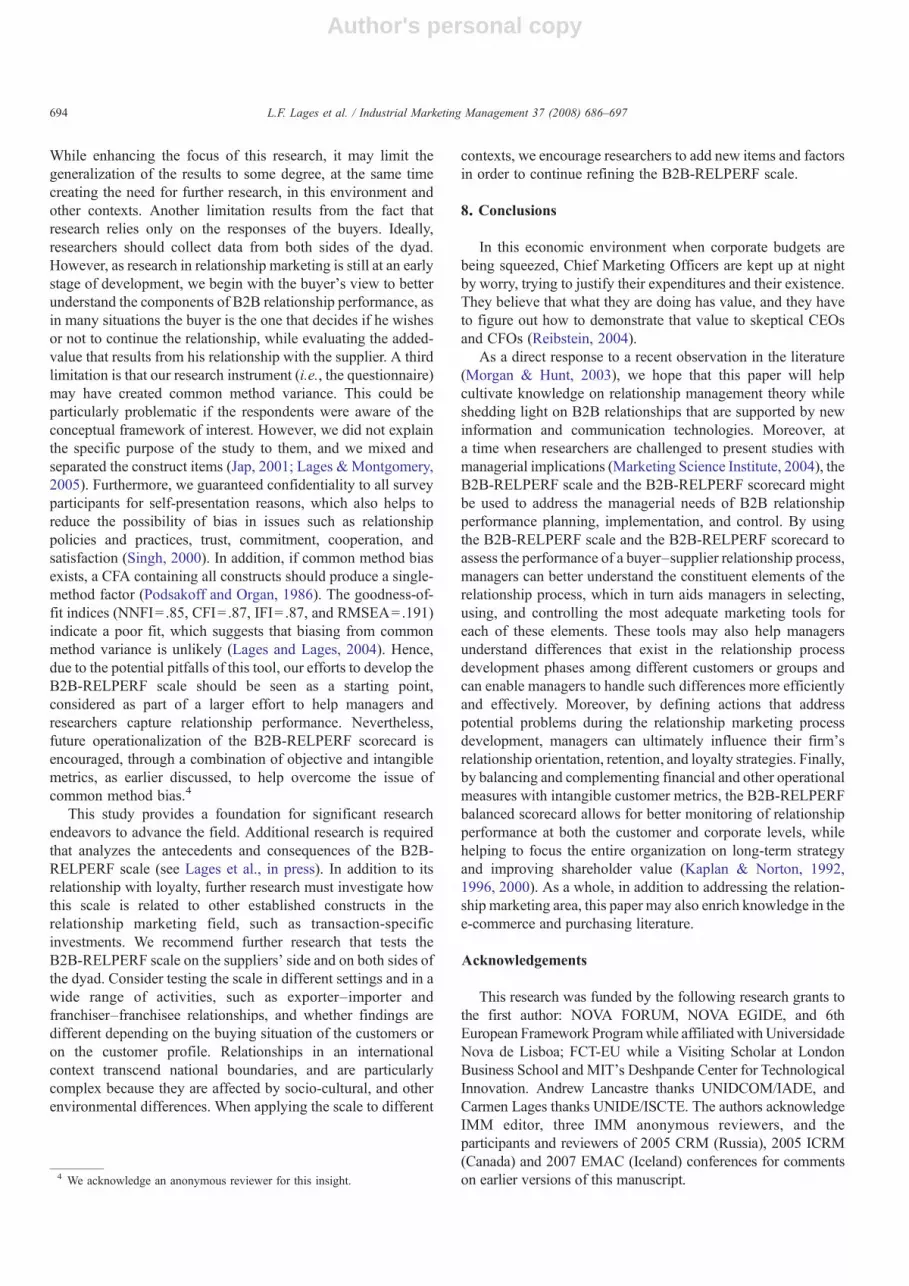
Appendix A
The B2B-RELPERF Scorecard
Customerdescription
Objective metrics Subjective metrics
Relationship performance dimensions Relationship performance Year Y−1 Year Y+1
Objective metrica Rankinga RPPScore: RCOScore: TRUSTScore: MCOScore: SATScore: RPScore × Weight to overallrelationship perform.(%)
= RPWeightedScore Base(s)b Goal(s)b Priorityb
3-itemaverage×weight (%)
3-itemaverage×weight (%)
3-itemaverage×weight (%)
2-itemaverage×weight (%)
3-itemaverage×weight (%)
Customer1 _____ ____ ____ ___×___ ___×___ ___×___ ___×___ ___×___ _______ ×_______ =_______ ______ ______ ______Customer2 _____ ____ ____ ___×___ ___×___ ___×___ ___×___ ___×___ _______ ×_______ =_______ ______ ______ ______Customer3 _____ ____ ____ ___×___ ___×___ ___×___ ___×___ ___×___ _______ ×_______ =_______ ______ _____ _____Customern … … …. … … … … … … … … … … …
Sum = RELPERFScore
Notes: RPScore=RP1WeightedScore+RP2WeightedScore+RP3WeightedScore+RP4WeightedScore+RPnWeightedScore
RPScore=RPPScore+TRUSTScore+RCOScore+MCOScore+SATScore
RELPERFScore = overall relationships performance, RPP = relationship policies and practices, RCO = relationship commitment, TRUST = trust in the relationship, MCO = mutual cooperation, and SAT = relationshipsatisfaction.aThis column should be repeated according to the number of existing objective performance metrics (e.g., sales volume, profit, costs). If more than one objective metric is available, a final ranking of objective relationshipperformance should be created while taking into consideration different weights for each objective metric.bThese fields should take into consideration the RPWeightedScore and, if possible, existing objective metric(s).
695L.F.
Lages
etal.
/Industrial
Marketing
Managem
ent37
(2008)686–697
Author's personal copy
References
Abernathy, W. (1997). Balanced scorecards make teamwork a reality. Journalfor Quality and Participation, 20(5), 58−59.
Anderson, J. C., & Narus, J. A. (1990, January). A model of distributor firm andmanufacturer firm working partnerships. Journal of Marketing, 54, 42−58.
Anderson, E., & Weitz, B. (1992, February). The use of pledges to build andsustain commitment in distribution channels. Journal of MarketingResearch, 29, 18−34.
Armstrong, J., & Overton, T. (1977, August). Estimating nonresponse bias inmail surveys. Journal of Marketing Research, 14, 396−402.
Aulakh, P., Kotabe, M., & Sahay, A. (1996). Trust and performance in cross-border marketing partnerships: A behavioural approach. Journal ofInternational Business Studies, 27(5), 1005−1032.
Bagozzi, R. P. (1980). Causal models in marketing. New York: John Wiley.Berry, L., & Parasuraman, A. (1991). Marketing services: Competing through
quality. New York: The Free Press.Bolton, R. N. (2004, Oct). Linking marketing to financial performance and firm
value, MSI Special Section. Journal of Marketing, 68, 73−75.Cadogan, J. W., Diamantopoulos, A., & de Mortanges, C. P. (1999). A measure
of export market orientation: Scale development and cross-culturalvalidation. Journal of International Business Studies, 30(4), 689−707.
Cannon, J., & Perreault, W. (1999, November). Buyer–seller relationships inbusiness markets. Journal of Marketing Research, 36, 439−460.
Churchill, G. A., Jr. (1979, February). A paradigm for developing better measuresof marketing constructs. Journal of Marketing Research, 16, 64−73.
Churchill, G. A., Jr. (1995). Marketing research: Methodological foundations.Chicago: Dryden Press.
Christy, R., Oliver, G., & Penn, J. (1996). Relationship marketing in consumermarkets. Journal of Marketing Management, 12, 175−187.
Cronbach, L. J. (1951, September). Coefficient alpha and the internal structureof tests. Psychometrika, 16, 297−334.
Cross, E. M., & Chaffin, W. W. (1982). Use of the binomial theorem ininterpreting results of multiple tests of significance. Educational andPsychological Measurement, 42, 25−34.
Doney, P. M., Cannon, J., & Mullen, M. (1998). Understanding the influence ofnational culture on the development of trust. Academy of ManagementReview, 23(3), 602−621.
Dwyer, F., Schurr, P., & Oh, S. (1987, April). Developing buyer–sellerrelationships. Journal of Marketing, 51, 11−27.
Einwiller, S., Ingenhoff, D., & Schmid, B. (2003). A model of trust andreputation in electronic commerce. Proceedings from the EMAC 32ndConference Glasgow: University of Strathclyde.
Fornell, C. D., & Larcker, F. (1981, February). Evaluating structural equationmodels with unobservable variables and measurement errors. Journal ofMarketing Research, 18, 39−50.
Ganesan, S. (1994, April). Determinants of long-term orientation in buyer–sellerrelationships. Journal of Marketing, 58, 1−19.
Geyskens, I., Steenkamp, J., & Kumar, N. (1999, May). A meta-analysis ofsatisfaction in marketing channel relationships. Journal of MarketingResearch, 36, 223−238.
Grewal, R., Comer, J., & Mehta, R. (2001, July). An investigation into theantecedents of organizational participation in business-to-business electronicmarkets. Journal of Marketing, 65, 17−33.
Grönroos, C. (1997). Value-driven relational marketing: From products toresources and competencies. Journal ofMarketingManagement, 13, 407−419.
Hair, J., Jr., Anderson, R., Tatham, R., & Black, W. (1998). Multivariate dataanalysis, 5th. New York: Prentice Hall International.
Hewett, K., & Bearden, W. (2001, October). Dependence, trust, and relationalbehavior on the part of foreign subsidiary marketing operations: Implicationsfor managing global marketing operations. Journal of Marketing, 65, 51−66.
Hunt, S. (1997).Competing through relationships:Grounding relationshipmarketingin resource-advantage theory. Journal of Marketing Management, 13, 431−445.
Jap, S. D. (2001, February). “Pie sharing” in complex collaboration contexts.Journal of Marketing Research, 38, 86−99.
Jap, S. D., & Ganesan, S. (2000). Control mechanisms and the relationship lifecycle: Implications for safeguarding specific investments and developingcommitment. Journal of Marketing Research, 37(2), 227−245.
Jöreskog,K.G.,&Sörbom,D. (1993).LISREL 8: Structural equationmodelingwiththe SIMPLIS command language.Hillsdale, NJ: Lawrence Erlbaum Associates.
Kaplan, R. S., & Norton, D. (1992). The balanced scorecard-measures that driveperformance. Harvard Business Review, 70(1), 71−79.
Kaplan, R. S., & Norton, D. (1996). The balanced scorecard. Cambridge, MA:Harvard Business School Press.
Kaplan, R. S., & Norton, D. (2000, September-October). Having trouble withyour strategy? Then map it. Harvard Business Review, 167−176.
Klein, L., & Quelch, J. (1997). Business-to-business market making on theinternet. International Marketing Review, 14(5), 345−361.
Knox, S. (1998, December). Loyalty-based segmentation and the customerdevelopment process. European Management Journal, 16(8), 729−737.
Kraljic, P. (1983, September-October). Purchasing must become supplymanagement. Harvard Business Review, 109−117.
Kumar, N., Scheer, L. K., & Steenkamp, J. E. (1995, February). The effects ofsupplier fairness on vulnerable resellers. Journal of Marketing Research,32, 5−65.
Lages, L. F., & Lages, C. R. (2004). The STEP scale: A measure of short-termexport performance improvement. Journal of International Marketing, 12(1), 36−56.
Lages, L. F., & Fernandes, J. (2005). The SERPVAL scale: A multi-iteminstrument for measuring service personal values. Journal of BusinessResearch, 58(11), 1562−1572.
Lages, L. F., & Montgomery, D. B. (2005). The relationship between exportassistance and performance improvement in Portuguese export ventures: Anempirical testing of the mediating role of pricing strategy adaptation. Eur-opean Journal of Marketing, 39(7/8), 755−784.
Lages, C., Lages, C. R., & Lages, L. F. (2005). The RELQUAL scale: A measureof relationship quality in export market ventures. Journal of BusinessResearch, 58(8), 1040−1048.
Lages, L. F., Lages, C., & Lages, C. R. (2005). Bringing export performancemetrics into annual reports: The APEV scale and the PERFEX scorecard.Journal of International Marketing, 13(3), 79−104.
Lages, L.F., Jap, S.D., Griffith, D.A., (in press). The role of past performance inexport ventures: A short-term reactive approach. Journal of InternationalBusiness Studies.
Lancastre, A., & Lages, L. F. (2006). The relationship between buyer and a B2Be-marketplace: Cooperation determinants in an electronic market context.Industrial Marketing Management, 35(6), 774−789.
Lehmann, D. R. (2004, Oct). Metrics for making marketing matter, MSI SpecialSection. Journal of Marketing, 68, 73−75.
Lemon, K. N., White, T. B., & Winer, R. S. (2002). Dynamic customerrelationship management: Incorporating future considerations into theservice retention decision. Journal of Marketing, 66(1), 1−14.
Likierman, A. (2004). Ideas and practice: Why “academic” should not mean“irrelevant.”. Keynote speech at the 2004 Conference of the PerformanceMeasurement Association, Centre for Business Performance Edinburgh,UK: Performance Measurement Association.
MacKenzie, S. B., Podsakoff, P. M., & Rich, G. A. (1999). Transformational andtransactional leadership and salesperson performance. Journal of theAcademy of Marketing Science, 29(2), 115−134.
Marketing Science Institute, 2002–2004 research priorities. 2004 (http://www.msi.org/msi/rp0204.cfm#Overview).
Melnyk, S. A., Stewart, D. M., & Swink, M. (2004). Metrics and performancemeasurement in operations management: Dealing with the metrics maze.Journal of Operations Management, 22(3), 209−217.
Meyer, J., Allen, N., & Smith, C. (1993). Commitment to organizations andoccupations: Extension and test of a three-component conceptualization.Journal of Applied Psychology, 78(4), 538−551.
Moorman, C., Deshpandé, R., & Zaltman, G. (1993, January). Factors affectingtrust in market research relationships. Journal of Marketing, 57, 81−101.
Morgan, R, & Hunt, S. (2003). An interview with Rob Morgan and Shelby Hunt.(http://www.incites.com/papersMMorgan_n_Hunt.html) accessedMay 1, 2004.
Morgan, R. M., & Hunt, S. D. (1994, July). The commitment–trust theory ofrelationship marketing. Journal of Marketing, 58, 20−38.
O'Keefe, R., O'Connor, G., & Jung, H. (1998). Early adopters of the Web as aretail medium: Small company winners and losers. European Journal ofMarketing, 32(7/8), 629−643.
696 L.F. Lages et al. / Industrial Marketing Management 37 (2008) 686–697
Author's personal copy
Palmatier, R. W., Dant, R. P., Grewal, D., & Evans, K. (2005). A meta-analysisof the nomological network surrounding relationship marketing. Cam-bridge, Mass.: Marketing Science Institute.
Parasuraman, A., Zeithaml, V., & Malhotra, A. (2005). E-S-QUAL: A multiple-item scale for assessing electronic service quality. Journal of ServiceResearch, 7(3), 213−233.
Parasuraman, A., & Zinkhan, G. (2002). Marketing to and serving customersthrough the Internet: An overview and research agenda. Journal of theAcademy of Marketing Science, 30(4), 286−295.
Payne, A., & Frow, P. (1999). Developing a segmented service strategy:Improving measurement in relationship marketing. Journal of MarketingManagement, 15, 797−818.
Podsakoff, P. M., & Organ, D.W. (1986). Self-reports in organizational research:Problems and perspectives. Journal of Management, 12(4), 531−544.
Reibstein, D. (2004). Connecting marketing metrics to financial consequences.Speech given at the Wharton Marketing Conference, 18 October 2004 http://knowledge.wharton.openn.edu/
Roberts, K., Varki, S., & Brodie, R. (2003). Measuring the quality ofrelationships in consumer services: An empirical study. European Journalof Marketing, 37(1/2), 169−196.
Singh, J. (2000, April). Performance productivity and quality of frontlineemployees in service organizations. Journal of Marketing, 64, 15−34.
Sirdeshmukh, J., Singh, J., & Sabol, B. (2002, January). Consumer trust, value,and loyalty in relational exchanges. Journal of Marketing, 66, 15−37.
Smith, M., Bailey, J., & Brynjolfsson, E. (1999, March). Understanding digitalmarkets: Review and assessment. eBusiness Center, MIT Sloan School ofManagement, vol. 140 http://ebusiness.mit.edu
Varadarajan, P. R., & Yadav, M. (2002). Marketing strategy and the Internet: Anorganizing framework. Journal of the Academy of Marketing Science, 30(4), 296−312.
Weiber, R., & Kollman, T. (1998). Competitive advantages in virtual markets:Perspectives of information-based marketing in cyberspace. EuropeanJournal of Marketing, 32(7/8), 603−615.
Weick, K. E. (2001). Gapping the relevance bridge: Fashions meet fundamentals inmanagement research.British Journal ofManagement, 12, 71−75 Special Issue.
Yau, O., McFetridge, P., Chow, R., Lee, J., Sin, L., & Tse, A. (2000). Is relationshipmarketing for everyone?European Journal of Marketing, 34(9/10), 1111−1127.
Zeithaml, V. A., Berry, L. L., & Parasuraman, A. (1996). The behavioralconsequences of service quality. Journal of Marketing, 60(2), 31−46.
Luis Filipe Lages (PhD, Warwick) is Associate Professor of Marketing andInternational Business at Faculdade de Economia, Universidade Nova Lisboa,Portugal and Visiting Scholar at MIT's Deshpande Center for TechnologicalInnovation, USA. His research interests include measurement and monitoring ofintangibles, international marketing, innovation/disinnovation strategy, andtechnology-market transfer. His publications appeared in Industrial MarketingManagement, Journal of International Business Studies, Journal of InternationalMarketing, Journal of Business Research, European Journal of Marketing, MSIReports, among others.
Andrew Lancastre (PhD, ISCTE) is Associate Professor of Marketing at IADE-Instituto de Artes Visuais, Design eMarketing in Lisbon, and Visiting Professor ofMarketing Strategy at Faculdade Economia, Universidade Nova Lisboa, Portugal.Previously, he was a marketing manager at British Petroleum and Renault. Mainareas of interest cover relationship marketing, B2B activities, SMEs, andinternational marketing. His work is published in Industrial Marketing Manage-ment and in the proceedings of leading conferences in the marketing field.
Carmen Lages (PhD, Warwick) is Assistant Professor of Marketing at ISCTEBusiness School-Lisbon, Portugal. Her research interests include relationshipmarketing, social marketing, and marketing communications. She haspublished in the Journal of Business Research, European Journal of Marketing,Journal of International Marketing, among others.
697L.F. Lages et al. / Industrial Marketing Management 37 (2008) 686–697