Embed Size (px)
Citation preview
applied sciences
Review
The Application of Cryogenic Laser Physics to theDevelopment of High Average Power Ultra-ShortPulse LasersDavid C. Brown 1,*, Sten Tornegård 1, Joseph Kolis 2, Colin McMillen 2, Cheryl Moore 1,2,Liurukara Sanjeewa 2 and Christopher Hancock 1
Received: 21 November 2015; Accepted: 5 January 2016; Published: 20 January 2016Academic Editor: Malte C. Kaluza
1 Snake Creek Lasers, LLC, 26741 State Route 267, Friendsville, PA 18818, USA;[email protected] (S.T.); [email protected] (C.M.);[email protected] (C.H.)
2 Department of Chemistry, Clemson University, Clemson, SC 29634-0973, USA; [email protected] (J.K.);[email protected] (C.M.); [email protected] (L.S.)
* Correspondence: [email protected]; Tex: +570-553-1122; Fax: +570-553-1139
Abstract: Ultrafast laser physics continues to advance at a rapid pace, driven primarily by thedevelopment of more powerful and sophisticated diode-pumping sources, the development of newlaser materials, and new laser and amplification approaches such as optical parametric chirped-pulseamplification. The rapid development of high average power cryogenic laser sources seems likely toplay a crucial role in realizing the long-sought goal of powerful ultrafast sources that offer concomitanthigh peak and average powers. In this paper, we review the optical, thermal, thermo-optic andlaser parameters important to cryogenic laser technology, recently achieved laser and laser materialsprogress, the progression of cryogenic laser technology, discuss the importance of cryogenic lasertechnology in ultrafast laser science, and what advances are likely to be achieved in the near-future.
Keywords: ultrafast lasers; diode-pumped; cryogenic lasers; high-peak-power lasers;high-average-power lasers
1. Introduction and History of Cryogenic Lasers
The history of the development of cryogenic lasers may roughly be divided into two distinct eras,which we refer to as the historical and the modern. The historical era covers the early use of cryogenictechnology to effect the demonstration of new solid-state lasers, and was focused on the spectroscopicand lasing properties using flashlamp optical pumping, while in the modern era, the advent of diodeoptical pumping and the increased understanding of the physical properties of laser crystals has ledto a comprehensive approach to the development of cryogenic lasers. The comprehensive approachembraces not just the spectroscopic and lasing properties, but includes all of the physical propertiesneeded to successfully design and demonstrate advanced cryogenic laser devices. Such propertiesinclude mechanical, thermal, thermo-optic and optical properties such as the index of refraction aswell as the crystal dispersion properties. Other defining features of the modern era are the maturationof open and closed cycle cryogenic cooling methods and the rapid development and availability ofpowerful diode laser sources for pumping solid-state lasers.
In 1991, the first demonstration of a liquid nitrogen (LN2) cooled diode-pumped Yb:YAG laserwas reported by Lacovara et al. [1], and we rather arbitrarily define the year of publication of thatpaper as the start of the modern era, because it combined cryogenic-cooling with a diode-pumpedYb:YAG laser crystal. Some may argue or imply that the development of cryogenic lasers in the modern
Appl. Sci. 2016, 6, 23; doi:10.3390/app6010023 www.mdpi.com/journal/applsci
Appl. Sci. 2016, 6, 23 2 of 74
era is really nothing new, simply because cryogenically-cooled lasers were first demonstrated in theearly years of the development of solid-state lasers and there exist a number of early cryogenic laserpatents. Such arguments however ignore the reality that during the historical period all cryogeniclasers were flashlamp-pumped with concomitant large heat generation in the solid-state laser crystal,significantly reducing the effectiveness of cryogenic-cooling. In addition, the modern era has as itsgoal the demonstration of cryogenic laser technology whose average power scaling is well-understoodand is firmly grounded in the detailed measured properties of a number of key laser host physicalparameters. The long-sought goal of laser physicists, engineers, and designers to produce neardiffraction-limited output lasers while operating at very high average powers and efficiency, andwhose output parameters are invariant to average power, is now being realized. It is important toemphasize and acknowledge the countless individual contributors whom have made this goal a reality,spanning both the historical and modern periods of together almost seven decades. It is gratifyingthat the promise of cryogenic lasers, articulated in an article one decade ago [2] and another 8 yearsago [3], is beginning to be realized. Yet it is also exciting to contemplate that we have only just begunto realize the vast potential of cryogenic lasers, and that could not be more true than in the nascentfield of cryogenic ultrafast lasers.
This article discusses cryogenic laser technology, with a particular emphasis on the application ofthat technology to the development of ultrafast lasers. The intersection of cryogenic and ultrafast lasertechnologies will undoubtedly provide powerful new laser sources capable of producing extraordinaryassociative peak and average powers in the near future. We refer to these new lasers as HAPP (HighAverage and Peak Power) lasers.
1.1. The Historical Era
Good reviews of the use of cryogenic-cooling in the development of solid-state lasers have beenpresented by members of our group [2], the Massachusetts Institute of Technology (MIT) LincolnLaboratory laser group [3], and by the laser group at Q-Peak [4]. Of particular note are the works ofKeyes and Quist [5] whom used a GaAs diode laser to pump a U3+:CaF2 laser (the first diode-pumpedlaser), wherein both the diode laser and the laser crystal were cryogenically-cooled, the pioneeringTi:Al2O3 work of Moulton [6] which demonstrated increased power output using a liquid nitrogencooled (at 77 K) crystal, an effect that was attributed to the increased Al2O3 thermal conductivity,and the development of a number of tunable laser materials by Moulton [7–10]. The pioneeringwork of Schulz and Henion [11] whom demonstrated 350 W of output power from a liquid-nitrogencooled Ti:Al2O3 crystal, over 200 times what could be obtained at room temperature, is particularlynoteworthy since those researchers were the first to our knowledge to carefully examine the crucial rolematerials properties such as thermal conductivity, thermal expansion coefficient, and the thermo-opticcoefficient (dn/dT) play in substantially reducing thermal aberrations and stresses as temperature islowered from room temperature to 77 K in sapphire. An evaluation of the data available at the time,summarized in Table I of [11], revealed that the thermal conductivity of Al2O3 increased from 0.33 to10 W/(cm¨K) as temperature was lowered from 300 K to 77 K, a greater than 30 times improvement.The thermo-optic coefficient decreased from 12.8 ˆ 10´6/K at 300 K to 1.9 ˆ 10´6/K, a factor of 6.7,while the thermal expansion coefficient decreased from 5 ˆ 10´6/K at 300 K to 0.34 ˆ 10´6/K at 77 K,a factor of 14.7. In cooling the Ti:Al2O3 laser to 77 K, the authors were able to demonstrate about a200 times decrease in the thermo-optical refractive index changes. Other early references of note includethe demonstration of a tunable phonon-terminated Ni2+:MgF2 laser by Johnson, Guggenheim, andThomas [12] at Bell Telephone Laboratories in 1963, and the development of a compact liquid nitrogencooled system that produced CW emission from Nd3+:YAG laser crystal as well as an ABC-YAG lasercrystal [13]. In Europe, an early cryogenic Ho:YAG laser was demonstrated in 1975; an output of 50 Wwas achieved with liquid nitrogen cooling [14].
In addition to laser demonstrations, cryogenic cooling has previously been used in spectroscopicsolid-state laser crystal investigations to help elucidate the physics, energy level structure, and
Appl. Sci. 2016, 6, 23 3 of 74
determine energy level assignments, for many rare-earth and transition metal activator ions. The lasercrystal books by Kaminskii [15,16] are particularly noteworthy, documenting many of the Stark levelstructures and energy assignments in use today at room temperature, 77 K, and in some cases down toliquid He temperature at about 4 K. Those publications are very useful resources that include historicalspectroscopic and laser investigations from around the world, including many from Russia and formerSoviet Republics whose many contributions were not fully acknowledged until after the dissolution ofthe Soviet Union in 1991.
Early cryogenic laser patents were issued in the United States to Bowness [17] for a liquid nitrogencooled ruby laser, and to McMahon [18] for a cryogenically-cooled ruby laser. Other early cryogenicwork in the United States was performed at Sanders Associates (now BAE Systems, Inc., Arlington,VA, USA), in Nashua, NH.
1.2. The Modern Era
The genesis of our cryogenic laser program was the publication of the Schulz and Henion paperin 1991 [11]. Starting in 1995, we investigated whether or not the favorable laser and thermal effectsexhibited by Ti:Al2O3 might not be operative in other laser crystals as well, and in particular forthe well-developed laser material Y3Al5O12. After a thorough literature search, we found enoughhigh quality previously published thermal conductivity and thermal expansion coefficient data tobegin to at first examine thermal and stress induced changes in undoped YAG, with a view towardsunderstanding the detailed ramifications of lowering the temperature from room temperature to 77 K.That work led to the award and completion of a Phase I Small Business Innovation Research (SBIR)contract in 1997, with the Final Report published in 1998 [19]. Work completed prior to and during thatcontract led to three publications [20–22] during 1997 and 1998 in which the average power scalingbehavior and the reduction of thermally-induced aberrations were thoroughly explored and quantifiedfor the first time using a unified theoretical framework. In [20], we were the first group to use a finiteelement thermal and stress analysis code with continuously variable materials parameters (thermalconductivity, thermal expansion coefficient, and the elastic parameters Young’s modulus and Poisson’sratio, as a function of temperature), to simulate the expected performance of solid-state YAG amplifiersat 77 K. The continuously variable thermal and elastic parameters were generated by good fits to thedata existing at the time. Applying the theory to Nd:YAG and Yb:YAG lasers, we showed that theprevious results obtained for Ti:Al2O3 lasers [11] could indeed be emulated using other oxide laserhosts such as YAG, and that very favorable, but non-linear, scaling to very high average powers couldbe obtained by operating YAG at 77 K. We also showed for the first time that when a continuouslyvarying thermal conductivity is employed in the finite-element simulations, non-quadratic temperatureprofiles are obtained.
In addition to exploring the scaling properties of cryogenically-cooled YAG lasers, in [20] we alsoexplored how thermally-induced aberrations vary with temperature, and showed that without takingthe thermo-optic effect into account, approximately a factor of 10 improvement could take place byoperating at 77 K, due to the deduction of the thermal profile by an increased thermal conductivity,and by the near elimination of stress-optic effects. We also lamented the apparent lack of thermo-optic(β = dn/dT) data for YAG and other optical materials as temperature is lowered from 300 to 77 K, butpointed out that the expected trend of β towards zero as temperature is lowered would further increasethe reduction in thermo-optic effects in cryogenic lasers. The basic principles of low thermo-opticeffects in the host YAG were correctly predicted in this article, confirming our previous conjecturethat YAG and other oxide laser host crystals would behave very much like the oxide crystal Ti:Al2O3
demonstrated experimentally previously [11].The publication of the first accurate YAG thermo-optic coefficients by Fan and Daneu in 1998 [23]
enabled us to further extend our results to include β, and in the following papers in 1998 [21,22], wepresented the first comprehensive theoretical description of the expected reduced thermal distortion at77 K in YAG for rod amplifiers, and nonlinear thermal and stress effects in YAG slabs, as well as the
Appl. Sci. 2016, 6, 23 4 of 74
scaling behavior. The results presented in [20–22] assumed an undoped host YAG thermal conductivityvariation with temperature, and did not include a description of the reduction in thermal conductivityin certain materials as the lasing ion dopant density increases. This effect will be further exploredlater in this article. During 1998 Fan et al. [24] presented the first experimental confirmation, usinga 940 nm diode-pumped Yb:YAG crystal, that cooling the Yb:YAG crystal to 77 K resulted in a largereduction in thermo-optic effects, as well as a CW power output of 40 W. Further confirmation of thelarge reduction in thermal effects, in Nd:YAG, was provided in 2004 by Glur et al. [25].
In 2005 we published an article further confirming the trends discussed in the aforementioned [2].To provide confirmation that the same general behavior of the thermal conductivity, thermal expansioncoefficient, and dn/dT could be expected in other crystals, we showed additional literature data. Forthe thermal conductivity, we showed data for LiF, MgO, Al2O3, C, YbAG, LuAG, and YAG, all ofwhich displayed significant increases at temperatures were lowered to 77 K and below. As expected,the behavior of the thermal conductivities for undoped crystals is dominated by the specific heatCv, which theoretically increases as approximately the inverse of the absolute temperature between300 and 77 K. It is not surprising that fluoride and oxide hosts display the same general trend. For thethermal expansion data, we plotted data for seven different crystals, including the recently publisheddata of the MIT Lincoln Lab group [23,26], all of which could be seen converging towards a value closeto zero at low temperatures. For the thermo-optic coefficient dn/dT, we used the MIT data as wellas literature data found for both axes of Al2O3, ZnSe, Ge, and Si. In all cases substantial decreasesin dn/dT were found as temperature is lowered. These results showed conclusively that the sametrends for the thermal conductivity, thermal expansion coefficient, and dn/dT were apparent acrossa wide sampling of crystals. In addition to examining critical laser materials parameters, our paperalso presented for preliminary cryogenic absorption cross-section data for Yb:YAG, measured between300 and 77 K, and later presented in a more detailed publication [27]. Previously, absorption coefficientsfor Yb:YAG at 300 and 77 K were presented in [24]. A significant finding of that work was that at77 K the 940 nm pump band doubled in intensity and narrowed, but remained broad enough forpumping with conventional diode pump sources. For quasi-three-level Yb materials like Yb:YAGthat display finite ground-state laser absorption at room temperature, cryogenic-cooling also resultsin 4-level performance at 77 K, reducing the pump density needed to achieve transparency from asignificant value to almost zero. We point out here that the large increase in the stimulated-emissioncross-section from a value of about 1.8 ˆ 10´20 cm2 at room temperature [1] to 1.1 ˆ 10´19 cm2 at80 K [3] by approximately a factor of 6 reduces the saturation fluence and intensity by the same factor,thus positively affecting the extraction and overall efficiencies that may be achieved. To achieve goodamplifier extraction efficiency the incident amplifier fluence must take a value of at least 2 times thesaturation fluence, and for Gaussian beams must be even higher [28]. A much smaller saturationfluence enhances the likelihood of being able to operate below the damage threshold fluence while atthe same time achieving efficient extraction efficiency.
Also in 2005, an impressive paper that for the first time measured the detailed thermo-opticproperties of a large sampling of laser crystals from 300 to 80 K (Y3Al5O12 (YAG), Lu3Al5O12 (LuAG),YAlO3 (YALO), LiYF4 (YLF), LiLuF4 (LuLF), BaY2F8 (BYF), KGd(WO4)2 (KGW), and KY(WO4)2 (KYW))was published by the MIT Lincoln Laboratory group [29]. Measurements of the thermal diffusivity,specific heat at constant pressure, thermal conductivity, thermal expansion coefficient, optical pathlength thermo-optic coefficient, and the thermo-optic coefficient dn/dT were presented. This articlealso reported measurements of the thermal diffusivity and thermal conductivity for Yb doped samplesof Y3Al5O12, YAlO3, and LiYF4 as well, and identified the doping density as an important parameterto consider in the design of cryogenic lasers. Further materials properties measurements by this grouphave appeared in subsequent publications. In [3], additional thermo-optic measurements are providedfor ceramic and single-crystal YAG, GGG, GdVO4, and Y2O3. Spectroscopic data are also presented forYb:YAG and Yb:YLF. A third publication [30] provides thermo-optic data for the sesquioxide ceramiclaser materials Y2O3, Lu2O3, Sc2O3, as well as for YLF, YSO, GSAG, and YVO4.

Appl. Sci. 2016, 6, 23 5 of 74
The modern cryogenic laser period began with the publications of the first experimentalcryogenic Yb:YAG laser [1], and a significantly performance-enhanced Ti:Al2O3 laser [11], both in1991. Subsequent theoretical and experimental work in the years 1995–1998 confirmed that not onlycan enhanced laser properties be obtained by cryogenic-cooling, but that dramatic reductions inthermo-optic distortion and enhanced mechanical properties can be realized as well. Thermo-opticproperties were not emphasized in the historical era, where the focus was mainly on laser physics,kinetics, and spectroscopy. Thus in our opinion, what is new is that that in the modern era, laserphysicists, designers, and engineers have for the first time fully appreciated that the entire set ofphysical crystal properties (optical, laser kinetics, thermal, thermo-optic, and elastic) must be takeninto account to effect successful laser outcomes. Appreciation of this reality has and will continue todrive the demonstration of much higher average power lasers, as well as HAPP lasers, in the future.The concurrent work of our group and that at the MIT Lincoln Laboratory has solved the longeststanding problem in the development of solid-state lasers: the near-elimination of deleterious thermaleffects. This point cannot be emphasized enough. The manipulation of the thermo-optic properties ofsolid-state laser hosts through the use of cryogenic-cooling has been proven capable of providing bothhigh average power and near-vanishing thermally-induced aberrations. This results in output beamswhose divergence and transverse beam size are virtually constant, without the use of any externalbeam correction. Beam-parameter independent lasers are highly desirable for harmonic generation, aswell as for many other scientific, commercial, and military applications.
In addition to the development of other oxide lasers, and in particular the development of Ybbased lasers, cryogenic-cooling has advanced the performance of Ti:Al2O3 ultrafast laser technology aswell. Unlike Yb materials like Yb:YAG, Yb:LuAG, Yb:Lu2O3, Yb:YLF, and others which all have smallquantum defects and thus minimal heat loads, for Ti:Al2O3 lasers, where optical-pumping usuallytakes place near 532 nm, the quantum defect for lasing near the peak of the gain profile near 790 nmis about 33%, a value > 3–5 times that of typical Yb based materials. The large heat load of Ti:Al2O3
however can be largely be mitigated by cooling the sapphire-based material to 77 K where the thermalconductivity is dramatically larger, and by the substantial reductions in the thermal expansion andthermo-optic coefficients [11]. The first use of a Ti:Al2O3 cryogenically-cooled amplifier was reportedin [31]; the second-stage amplifier, pumped with 25 W of 527 nm power from doubled Nd:YLF lasers,was cooled to 125 K, resulting in an increase of the thermal focal length from 0.45 to 5.6 m, by a factorof about 125. This approach has been discussed and used by a number of researchers [32–35]. The useof cryogenic-cooling in ultrafast lasers will be further discussed later in this article.
2. Review of Cryogenic-Cooling Benefits
In this section we review the many benefits that accrue from the implementation ofcryogenic-cooling in solid-state lasers. We begin by first examining in Section A. the origin of thermalaberrations in solid-state lasers, in B. the most important crystal thermal parameters: the thermalconductivity k, followed by the thermal expansion coefficient α, and the thermo-optic coefficientβ = dn/dT. In C. we discuss crystal elastic parameters and in D. crystal spectroscopic, kinetic,optical, lasing, nonlinear, and dispersion parameters. We also discuss the motivations for the criticalexamination of the functional dependence of each parameter on absolute temperature.
2.1. Thermal Aberrations in Solid-State Lasers
Crystalline solid-state lasers are optically-pumped devices. The first solid-state laser,demonstrated by Maiman [36], was a flashlamp-pumped ruby laser. Xe and Kr flashlamps andother similar sources, still in use today for some applications, were the pump source of choicefor many decades of the twentieth century, and beginning in the 1980’s their dominance has beenslowly eroded as narrow band diode pump sources of increasing power have become available.Diode laser technology has developed rapidly and today is the pumping source of choice for mostapplications, with only the specific cost (Monetary Unit/Watt) preventing its adoption in the highest
Appl. Sci. 2016, 6, 23 6 of 74
power applications. Typical Xe flashlamps used in inertial confinement fusion (ICF) applicationsproduced output irradiances with black-body temperatures near 9000 K or more, and with spectraloutputs spanning the range of 150 to 1700 nm. Due to the finite number of Nd absorption bands andthe continuous nature of the black-body radiation, the absorption efficiency was poor, with most ofthe Xe pump radiation being deposited in the pump chamber housing the lasing element, even fortypical Nd:Glass compositions where the absorption bands were significantly wider than say Nd:YAG.For the absorbed light, ratios of inversion to heat density were typically only 1.5, hence for everyjoule of inversion energy produced, 0.67 joules of heat were generated as well. Nd lasers dominatedthe development landscape, and Yb based lasers were largely ignored due to their poor absorptionefficiency. The low repetition rate of ICF laser systems may largely be attributed to the use of flashlamppump sources. As of this writing, the conversion from flashlamp-pumping to diode-pumping is wellunder way and accelerating, and modern diode-pumped lasers, many based upon Yb crystallinematerials, produce only about 80 mJ of heat energy per joule absorbed, a decrease when comparedto Nd:Glass laser systems of a factor of over 8. The reduction in the amount of heat generated isgreater than two orders of magnitude when the poor absorption of Xe flashlamp radiation is takeninto account.
Thermal aberrations are produced in laser crystals by the production of heat, primarily from theoptical-pumping process, by stimulated-emission, and by fluorescence. In some crystals, upconversion,two-photon absorption, non-unity quantum efficiencies, and other effects may also provide additionalheating. The total index change ∆nT in an isotropic (anaxial) laser crystal due to temperature changesmay be written as the sum of three terms:
∆nT “ ∆nβ ` ∆nα ` ∆nS (1)
where ∆nβ is due to the thermo-optic coefficient β, ∆nα due to the thermal expansion coefficient,and ∆nS is produced by the stresses (or equivalently the strains) in the crystal. For a laser rod whosebarrel is maintained at a constant temperature, the proportional optical phases ∆φr,ϕ in the radial(r) and azimuthal (ϕ) directions due to thermal heating producing a temperature change ∆T can bewritten [21]
∆φr,φ “2π
λ¨∆nr,φL
“
ˆ
2π
λ
˙
¨
ˆ
Q0
4 k
˙
““
β` 4n30α¨C0
‰
¨ r20 ´
“
β` 2n30 α Cr,ϕ
‰
¨ r2‰ ¨ L(2)
In Equation (2), L is the crystal length, n0 the index of refraction, Q0 the uniform heat density, kthe thermal conductivity, r0 the rod radius, and C0, Cr, and Cϕ are photoelastic constants. It can beseen that the phase varies quadratically with the radius r. It is also clear that if α = β = 0, the phases∆ϕr,ϕ would be zero for all r, regardless of the value of Q0. Equation (2) results from the plane-strainapproximation in which the aspect ratio of the rod (L/2r0) >> 1. In that approximation, physicalchanges in the optical pathlength are ignored. In real amplifiers, bulging of the rod faces occurs,an effect that is directly attributable to the thermal expansion coefficient. A similar equation can bederived for the plane stress case ((L/2r0) << 1), typical of active-mirror or thin disk amplifiers:
∆φr,ϕ “2π
λ¨∆nr,φL
“
ˆ
2π
λ
˙
¨
ˆ
Q0
4 k
˙
““
β` 4n30α¨C0
‰
¨ r20 `
“
pn0 ´ 1qα pν` 1q ´ 2n30 α Cr,φ
‰
¨ r2‰ ¨ L
(3)
For the plane-stress case of Equation (3), by inspection again we see that if α = β = 0, the phases∆φr,ϕ are again zero.In rare cases, most notably for certain Nd:Glass laser compositions with negative
Appl. Sci. 2016, 6, 23 7 of 74
values of β, and when stress-induced index changes can be ignored, one can achieve ∆nT “ 0. We canwrite Equation (1), ignoring the stress term, as
∆nT “ ∆nβ ` ∆nα “ rβ` pn0 ´ 1qαs∆T (4)
Thus the index variation and resulting phase can be identically zero if
S “ pβ` pn0 ´ 1qαq “ 0 (5)
This is the condition for athermal operation, and was first employed in connection with thedevelopment of Nd laser phosphate glasses for high-peak-power inertial confinement fusion lasersystems to reduce thermal distortion [37].
For cryogenic-cooling, we employ a different strategy. While our goal is to achieve ∆ϕ = 0, formost crystals finite values of α, β, ν, and E at 77 K allow us to simply approach that condition. Aswe will see in the following paragraphs, the most successful strategy to date is to reduce the thermalaberrations to residual levels by exploiting the favorable scaling of critical parameters by reducingthe operating temperature to the cryogenic regime, which we define here as <150 K. There are a fewcrystalline cases in which condition Equation (5) can be approached or satisfied over some temperaturerange. For Nd:YLF lasers for example, it is well known that one can exploit the negative value ofβ using the a-axis (σ) transition at 1047 nm. More recent measurements [29] of β for the c and aaxes of the uniaxial crystal YLF show that negative values of β for both axes persist even down to100 K, allowing the condition Equation (5) to be approached across the entire temperature range forboth axes, with Sπ = ´1.88 ˆ 10´6/K and Sσ = 1.81 ˆ 10´6/K at 300 K. At 100 K, one finds thatSπ = ´0.31 ˆ 10´6/K and Sσ = 0.56 ˆ 10´6/K, so condition Equation (5) is even more closelyapproached at 100 K. Another rare example is the closely related material LuLF, a uniaxial crystalwhich also possesses the property that β is negative for the c and a axes [29], however as temperatureis lowered both axes become increasingly negative down to about 170 K where β begins to increase,the opposite of YLF in which β increases as temperature is lowered. Calculations show that at atemperature near 250 K, Equation (5) can be satisfied identically. As we will see in the data we examinelater in this article, for most crystals parameters k, β, and α scale favorably as temperature is loweredsuch that thermal aberrations nearly vanish.
For the case where the prime motivation is to eliminate or reduce aberrations to residual levels,we can define two figures-of-merit Γ as follows:
ΓT “k
α β ηhT (6)
ΓS “k p1´ νq
α E ηhT (7)
Figure of merit ΓT addresses changes in the index of refraction due to temperature gradients,and ΓS the change in the index due to stress (or strain) effects. To reduce thermal aberrations, wewish to maximize the value of ΓT . This is achieved by maximizing the value of k to minimize thethermal gradients, minimizing the values of α and β, and by minimizing the amount of heat generatedby minimizing the value of the total heat fraction ηh
T . The heat fraction is formally defined as thefraction of the absorbed light converted to heat. It includes contributions from the quantum defect,fluorescence, and stimulated-emission. Yb based materials are particularly attractive for producing lowηh
T values, due to the lack of concentration-quenching, excited-state absorption, and upconversion,processes that plague other laser materials like Nd:YAG or Nd:YVO4, and Nd:YLF for example. ForYb based laser materials such as Yb:YAG, we have published a detailed kinetics model [38] that allowsthe simple calculation of ηh
T . The model recognizes two distinct heating mechanisms, the first due to

Appl. Sci. 2016, 6, 23 8 of 74
Boltzmann heating (or cooling), and the second due to the photon related processes of fluorescenceand stimulated-emission. In general, the heat fraction for Yb:YAG is defined by the equation
ηTh “
QBh `QP
hQA
“ A` Bηex ` C p1´ ηexq (8)
where QA is the total absorbed power density, QBh the Boltzmann heat density, and QP
h the photonheat density. The quantities A, B, and C are constants and ηex is the laser extraction efficiency. Theconstants A, B, and C are associated with Boltzmann heating or cooling, stimulated-emission, andfluorescence respectively. For complete laser extraction only the first and second terms contribute,since the fluorescence is zero, whereas for no laser extraction the first and third terms contribute. Inmost cases the extraction efficiency is between those two limits, and Equation (8) allows the simplecalculation of the total heat load when both stimulated-emission and fluorescence are operative.
Equation (7) is the figure of merit for considering stress effects only. It arises naturally from theconsideration of the stresses generated in laser crystals due to thermal gradients. For a rod amplifier,using the plane-strain approximation [21], the stresses can be calculated from the well-known equations
σrr “Q0
16Ms
´
r2 ´ r20
¯
(9)
σϕϕ “Q0
16Ms
´
3r2 ´ r20
¯
(10)
σzz “Q0
8Ms
´
2r2 ´ r20
¯
(11)
and for a slab amplifier in the plane-strain approximation, from [22]
σxx “ σzz “Q0
2Ms
ˆ
2y2 ´t2
12
˙
(12)
Equations (9)–(12) show that the obtained stress is proportional to the heat density and inverselyproportional to Ms, a quantity known as the materials parameter, and expressed as
Ms “k p1´ νq
αE(13)
The materials parameter is then a mixture of thermal and elastic constants. To reduce the stressone wants to maximize the value of Ms , and that is the motivation for the use of the figure of meritΓS. To minimize stress contributions to the change in the index of refraction, the appropriate strategyis to maximize k, minimize α, E, and ηT
h , and minimize the value of ν. While other similar figuresof merit have been used [3], we prefer our approach where the contributing factors to the change inindex of refraction from purely thermal effects and thermally-induced stress are clearly separated. Ifdesired, however, after eliminating duplicate parameters (k and α in Equations (6) and (7)) we canwrite a simple overall multiplicative figure-of-merit Γ as
Γ “ ΓT¨ ΓS Ñk p1´ νq
α Eβηh“
MSβ¨ηh
(14)
Laser materials with the highest figure of merit therefore should have a large value for MS, andminimum values for β and ηh.

Appl. Sci. 2016, 6, 23 9 of 74
2.2. Thermal Parameters
2.2.1. Thermal Conductivity
Thermal conductivity k is a very important laser design parameter, and understanding its’dependence on temperature and dopant density is crucial to implementing cryogenic laser designs. Wefirst examine the standard quadratic equation used for determining the CW temperature distributionin a rod or slab laser [21,22]. For a slab laser the temperature T(y) as a function of slab thickness isgiven by
T pyq “ T0 ´Q0y2
2k(15)
The slab center temperature is T0, Q0 is the (assumed uniform) heat power density, k the thermalconductivity, and y the distance from the slab center, where 0 ď y ď (t/2) and t is the slab thickness.Newton’s law of cooling is used as he boundary condition at y = ˘t/2.To reduce the temperaturedifferential between the center and the edge of the slab, important in reducing the thermal aberrations,we want to reduce or eliminate the thermal gradient given by
dTdy“ ´
Q0
ky (16)
From Equation (16) we see that reducing the thermal gradient is equivalent to reducing the ratio(Q0/k). Reducing the heat fraction in a laser material reduces Q0; the other way to reduce the gradientis to increase k. Both of these strategies are used in modern diode-pumped lasers; for diode-pumpedYb lasers in particular, heat fractions are much reduced when compared to older materials such asNd:YAG, Nd:YLF, or Nd:YVO4. Here we recount how cryogenic-cooling has been used to obtain muchlarger k values. We can also see from Equation (16) that for flashlamp-pumped lasers where Q0 valuescan be an order of magnitude or two larger than the modest values obtained with diode-pumpedlasers, thermal gradients are very much larger.
Thermal aberrations can be substantially reduced by using diode-pumping to reduce the heatfraction, and cryogenic-cooling to increase k. In Equation (15), the thermal conductivity is treated as aconstant, independent of temperature or doping density. One can include the temperature dependenceusing a number of methods. We may write the CW heat equation for an infinite slab element as
´d
dy
„
k pTq ¨dTdy
“ Q0 (17)
As we will explore later in this article, theoretically the thermal conductivity varies approximatelyas (1/T) in the region of interest from room temperature to 77 K. We can write a simple relationship forthe thermal conductivity dependence on T as
k pTq “ k0¨TAT
(18)
where k0 is the thermal conductivity at ambient temperature TA = 300 K. Substituting in Equation (16)and integrating results in the analytical solution
T pyq “ T0¨Expˆ
´Q0y2
2k0TA
˙
(19)
This equation allows the computation of the temperature in any slab in which the thermalconductivity varies as (1/T). It should be noted that, as first reported in [20], the equation is then
Appl. Sci. 2016, 6, 23 10 of 74
no longer quadratic. The derived equation satisfies the boundary condition that T(y = 0) = T0. Fory = ˘t/2, we find the edge temperature Te:
Te “ T0¨Expˆ
´Q0t2
8k0TA
˙
(20)
Equation (20) allows the calculation of the edge temperature, knowing T0. Often Te is fixed atroom temperature by a temperature controlled water chiller, or by liquid nitrogen (LN2), and in thatcase Equation (20) may be used to calculate the slab center temperature T0. It should be noted that asexpected, for small Q0, Equation (20) can be expanded in a Taylor series. Keeping only the first term,we find
T pyq “ T0
ˆ
1´Q0y2
2k0TA
˙
“ limpT0{TAqÑ1
T0 ´Q0y2
2k0¨
„
T0
TA
“ T0 ´Q0y2
2k0(21)
or the equation reverts to the k = constant case. For any finite value of Q0, the temperature, and thusthe thermal aberrations are not quadratic with y, and thus not correctable using a simple lens. From apractical standpoint, for lower values of Q0, this effect can be ignored.
Equation (19) may be differentiated, to find the temperature gradient
dTdy“ ´
„
T0
TA
¨
„
Q0
k0
y¨ Expˆ
´Q0y2
2k0TA
˙
(22)
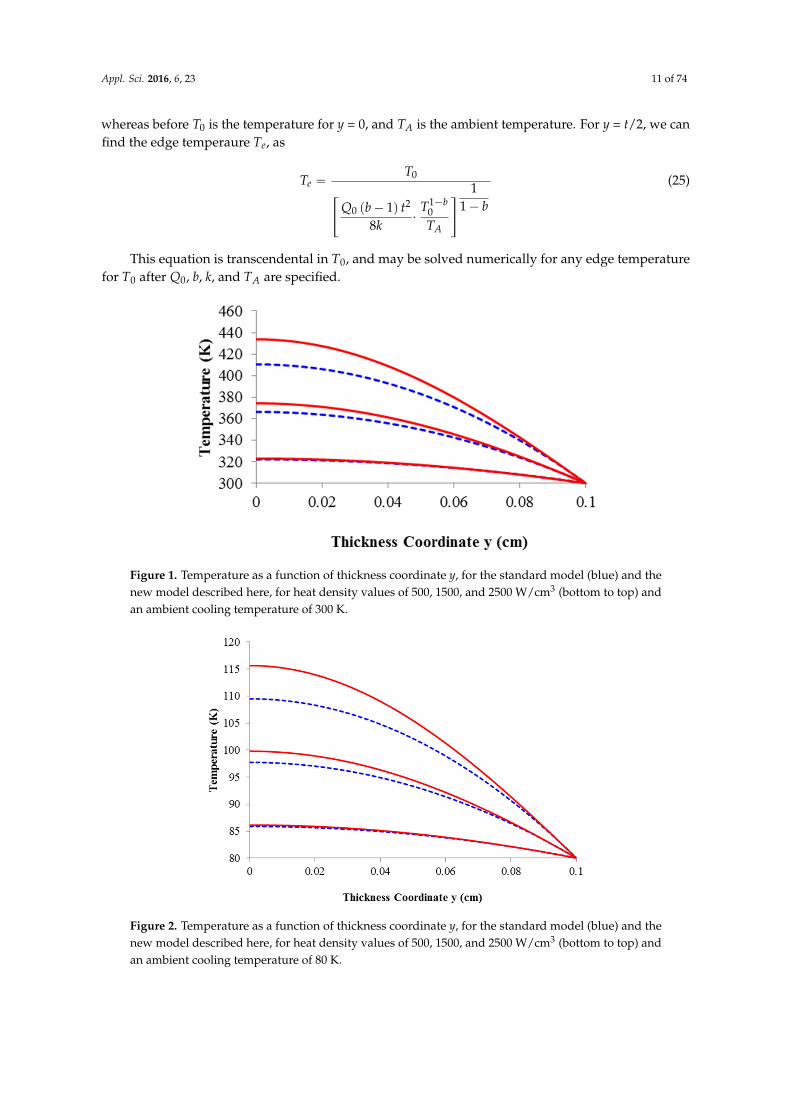
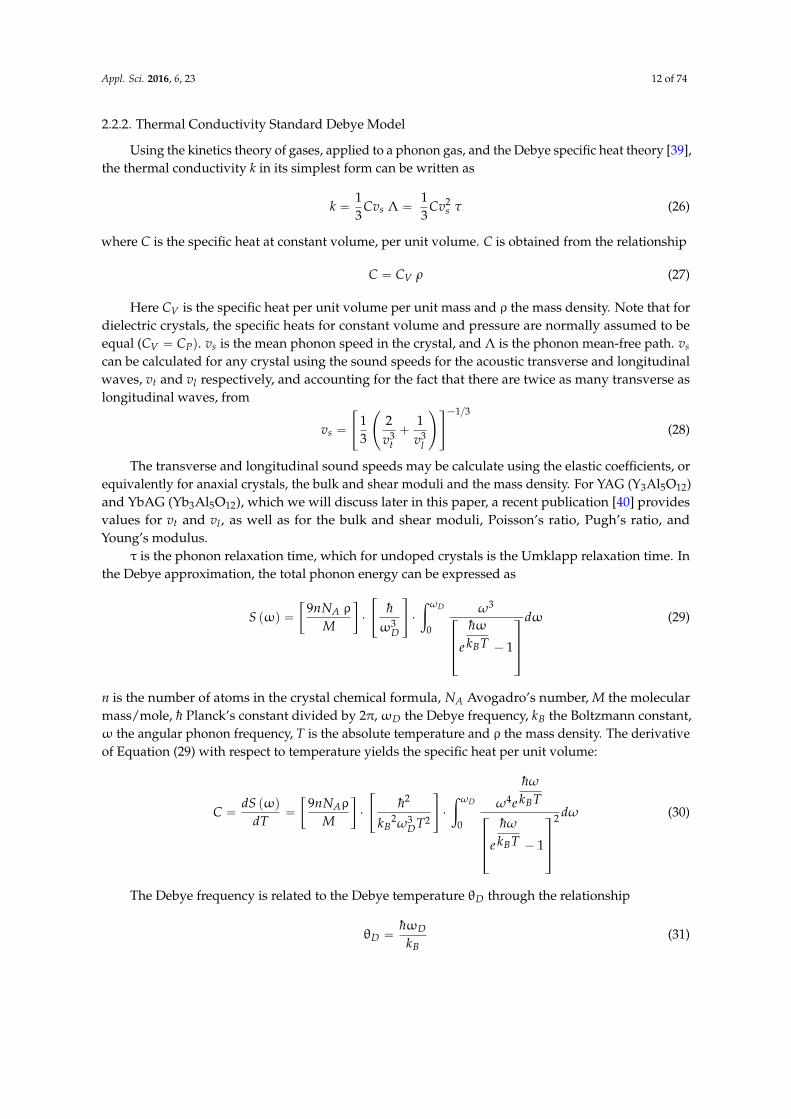
Here we see that reducing the ratio (Q0/k0) is required in this case as well to reduce the thermalprofile, except that in this more realistic case, the decrease in the thermal gradient is faster that in thestandard case. Figure 1 shows calculation results from the standard Equations (15) and (19) derivedhere. Temperature as a function of the slab thickness coordinate y is shown for three cases of heatdensity, 500, 1500, and 2500 W/cm3, and for a slab edge temperature of 300 K. Note that we assumethat Equation (18) is valid above room temperature as well. The same plot is shown in Figure 2 foran edge temperature of 80 K. The thermal conductivity is scaled according to Equation (18), and wasassumed to be 0.112 W/(cm¨K) at 300 K, and 0.424 W/(cm¨K) at 80 K. The difference between thestandard model and ours is small at 500 W/cm3 and below, whereas at the largest heat densities of1500 and 2500 W/cm3, the difference strongly increases. For 300 K, the difference between the twomodels for 2500 W/cm3 amounts to 23.2 K; for 80 K the difference is 6.10 degrees. The fundamentalreason for the temperature increase using our model is the decrease in the thermal conductivity thatoccurs as one moves towards the slab center where the temperature is maximum. This effect is ignoredin the standard model. As the ambient or cooling temperature decreases to 80 K, the enhanced thermalconductivity for all temperatures reduces the difference between the two models.
We have solved the CW heat equation, ignoring the z-dependence, for rod elements as well, andfind the following similar equation:
T prq “ T0¨Expˆ
´Q0r2
4TA
˙
(23)
For cases in which the thermal conductivity does not vary as (1/T), but with a power of T (1/Tb)for example, we can still obtain an analytical solution, albeit a transcendental one. The solution for aslab with b > 1 is
T pyq “T0
«
Q0 pb´ 1q y2
2 k¨
T1´b0TA
ff
11´ b
(24)
Appl. Sci. 2016, 6, 23 11 of 74
whereas before T0 is the temperature for y = 0, and TA is the ambient temperature. For y = t/2, we canfind the edge temperaure Te, as
Te “T0
«
Q0 pb´ 1q t2
8k¨
T1´b0TA
ff
11´ b
(25)
This equation is transcendental in T0, and may be solved numerically for any edge temperaturefor T0 after Q0, b, k, and TA are specified.
Appl. Sci. 2016, 6, 23 10 of 73
Here we see that reducing the ratio (Q0/k0) is required in this case as well to reduce the thermal profile, except that in this more realistic case, the decrease in the thermal gradient is faster that in the standard case. Figure 1 shows calculation results from the standard Equations (15) and (19) derived here. Temperature as a function of the slab thickness coordinate y is shown for three cases of heat density, 500, 1500, and 2500 W/cm3, and for a slab edge temperature of 300 K. Note that we assume that Equation (18) is valid above room temperature as well. The same plot is shown in Figure 2 for an edge temperature of 80 K. The thermal conductivity is scaled according to Equation (18), and was assumed to be 0.112 W/(cm·K) at 300 K, and 0.424 W/(cm·K) at 80 K. The difference between the standard model and ours is small at 500 W/cm3 and below, whereas at the largest heat densities of 1500 and 2500 W/cm3, the difference strongly increases. For 300 K, the difference between the two models for 2500 W/cm3 amounts to 23.2 K; for 80 K the difference is 6.10 degrees. The fundamental reason for the temperature increase using our model is the decrease in the thermal conductivity that occurs as one moves towards the slab center where the temperature is maximum. This effect is ignored in the standard model. As the ambient or cooling temperature decreases to 80 K, the enhanced thermal conductivity for all temperatures reduces the difference between the two models.
We have solved the CW heat equation, ignoring the z-dependence, for rod elements as well, and find the following similar equation: ( ) = ∙ Exp − 4 (23)
For cases in which the thermal conductivity does not vary as (1/T), but with a power of T (1/Tb) for example, we can still obtain an analytical solution, albeit a transcendental one. The solution for a slab with b > 1 is ( ) = ( − 1)2 ∙
(24)
whereas before is the temperature for y = 0, and is the ambient temperature. For y = t/2, we can find the edge temperaure Te, as = ( − 1)8 ∙
(25)
This equation is transcendental in T0, and may be solved numerically for any edge temperature for T0 after , b, k, and TA are specified.
Figure 1. Temperature as a function of thickness coordinate y, for the standard model (blue) and the new model described here, for heat density values of 500, 1500, and 2500 W/cm3 (bottom to top) and an ambient cooling temperature of 300 K.
Figure 1. Temperature as a function of thickness coordinate y, for the standard model (blue) and thenew model described here, for heat density values of 500, 1500, and 2500 W/cm3 (bottom to top) andan ambient cooling temperature of 300 K.
Appl. Sci. 2016, 6, 23 11 of 73
Figure 2. Temperature as a function of thickness coordinate y, for the standard model (blue) and the new model described here, for heat density values of 500, 1500, and 2500 W/cm3 (bottom to top) and an ambient cooling temperature of 80 K.
2.2.2. Thermal Conductivity Standard Debye Model
Using the kinetics theory of gases, applied to a phonon gas, and the Debye specific heat theory [39], the thermal conductivity k in its simplest form can be written as = 13 Λ = 13 (26)
where is the specific heat at constant volume, per unit volume. C is obtained from the relationship = (27)
Here is the specific heat per unit volume per unit mass and ρ the mass density. Note that for dielectric crystals, the specific heats for constant volume and pressure are normally assumed to be equal ( = ). vs is the mean phonon speed in the crystal, and Λ is the phonon mean-free path. vs can be calculated for any crystal using the sound speeds for the acoustic transverse and longitudinal waves, vt and vl respectively, and accounting for the fact that there are twice as many transverse as longitudinal waves, from
= 13 2 + 1 / (28)
The transverse and longitudinal sound speeds may be calculate using the elastic coefficients, or equivalently for anaxial crystals, the bulk and shear moduli and the mass density. For YAG (Y3Al5O12) and YbAG (Yb3Al5O12), which we will discuss later in this paper, a recent publication [40] provides values for vt and vl, as well as for the bulk and shear moduli, Poisson’s ratio, Pugh’s ratio, and Young’s modulus.
τ is the phonon relaxation time, which for undoped crystals is the Umklapp relaxation time. In the Debye approximation, the total phonon energy can be expressed as (ω) = 9 ρ ∙ ħ
ω∙ ħω − 1 ω
(29)
Figure 2. Temperature as a function of thickness coordinate y, for the standard model (blue) and thenew model described here, for heat density values of 500, 1500, and 2500 W/cm3 (bottom to top) andan ambient cooling temperature of 80 K.
Appl. Sci. 2016, 6, 23 12 of 74
2.2.2. Thermal Conductivity Standard Debye Model
Using the kinetics theory of gases, applied to a phonon gas, and the Debye specific heat theory [39],the thermal conductivity k in its simplest form can be written as
k “13
Cvs Λ “13
Cv2s τ (26)
where C is the specific heat at constant volume, per unit volume. C is obtained from the relationship
C “ CV ρ (27)
Here CV is the specific heat per unit volume per unit mass and ρ the mass density. Note that fordielectric crystals, the specific heats for constant volume and pressure are normally assumed to beequal (CV “ CPq. vs is the mean phonon speed in the crystal, and Λ is the phonon mean-free path. vs
can be calculated for any crystal using the sound speeds for the acoustic transverse and longitudinalwaves, vt and vl respectively, and accounting for the fact that there are twice as many transverse aslongitudinal waves, from
vs “
«
13
˜
2v3
t`
1v3
l
¸ff´1{3
(28)
The transverse and longitudinal sound speeds may be calculate using the elastic coefficients, orequivalently for anaxial crystals, the bulk and shear moduli and the mass density. For YAG (Y3Al5O12)and YbAG (Yb3Al5O12), which we will discuss later in this paper, a recent publication [40] providesvalues for vt and vl , as well as for the bulk and shear moduli, Poisson’s ratio, Pugh’s ratio, andYoung’s modulus.
τ is the phonon relaxation time, which for undoped crystals is the Umklapp relaxation time. Inthe Debye approximation, the total phonon energy can be expressed as
S pωq “„
9nNA ρ
M
¨
«
hω3
D
ff
¨
ż ωD
0
ω3»
—
–
e
hωkBT ´ 1
fi
ffi
fl
dω (29)
n is the number of atoms in the crystal chemical formula, NA Avogadro’s number, M the molecularmass/mole, h Planck’s constant divided by 2π,ωD the Debye frequency, kB the Boltzmann constant,ω the angular phonon frequency, T is the absolute temperature and ρ the mass density. The derivativeof Equation (29) with respect to temperature yields the specific heat per unit volume:
C “dS pωq
dT“
„
9nNAρ
M
¨
«
h2
kB2ω3
DT2
ff
¨
ż ωD
0
ω4e
hω
kBT»
—
–
e
hω
kBT ´ 1
fi
ffi
fl
2 dω (30)
The Debye frequency is related to the Debye temperature θD through the relationship
θD “hωD
kB(31)
Appl. Sci. 2016, 6, 23 13 of 74
If we define the ratios x = hω{kBT and xD “ hωD{kBT, divide by ρ, and paramaterizeEquation (29), we find the standard Debye expression for the specific heat [39]:
CV “
„
9nNAM
¨
ˆ
TθD
˙3¨
ż xD
0
x4ex
rex ´ 1s2dx (32)
where x is integrated from 0 to xD.There are two often-used limits to Equation (32). For large temperature values (T >> θD), the
exponential function may be expanded in a Taylor series, with the result being the constant
CV “3nNAkB
M(33)
This result is known as the Dulong-Petit law. As an approximation to the Debye model, thefollowing equation is often used for any T [41]:
CV “
„
9nNAkBM
¨1
1`5
4π4
ˆ
θDT
˙3 (34)
If we take the limit as T Ñ 0, we find the following equation
CV »
ˆ
12π4
5
˙
¨
ˆ
nNAkBM
˙„
TθD
3(35)
This equation correctly predicts the T3 dependence of the specific heat for low temperatures, andis known as the Debye-T3 law.
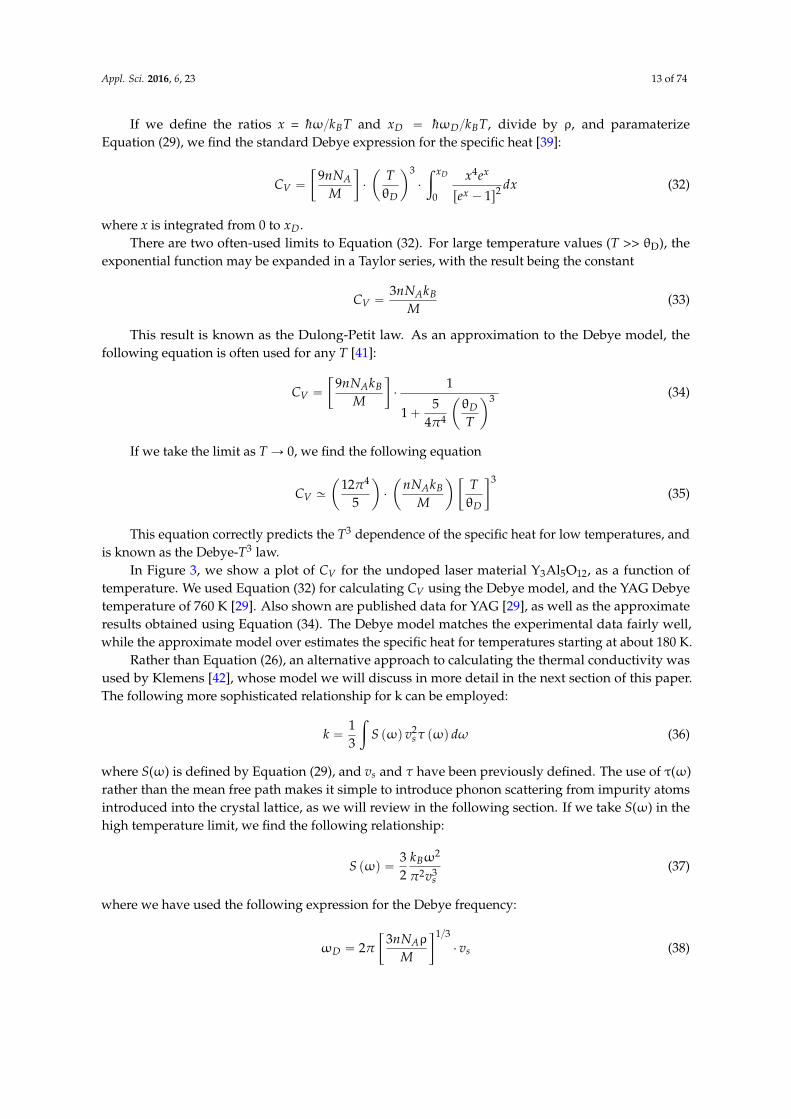
In Figure 3, we show a plot of CV for the undoped laser material Y3Al5O12, as a function oftemperature. We used Equation (32) for calculating CV using the Debye model, and the YAG Debyetemperature of 760 K [29]. Also shown are published data for YAG [29], as well as the approximateresults obtained using Equation (34). The Debye model matches the experimental data fairly well,while the approximate model over estimates the specific heat for temperatures starting at about 180 K.
Rather than Equation (26), an alternative approach to calculating the thermal conductivity wasused by Klemens [42], whose model we will discuss in more detail in the next section of this paper.The following more sophisticated relationship for k can be employed:
k “13
ż
S pωq v2s τ pωq dω (36)
where S(ω) is defined by Equation (29), and vs and τ have been previously defined. The use of τ(ω)rather than the mean free path makes it simple to introduce phonon scattering from impurity atomsintroduced into the crystal lattice, as we will review in the following section. If we take S(ω) in thehigh temperature limit, we find the following relationship:
S pωq “32
kBω2
π2v3s
(37)
where we have used the following expression for the Debye frequency:
ωD “ 2π
„
3nNAρ
M
1{3¨ vs (38)
Appl. Sci. 2016, 6, 23 14 of 74
Inserting Equation (37) into Equation (36), and assuming that the phonon speed vs is a constant,we obtain
k “kB
2π2vs¨
ż ωD
0ω2τ pωq dω (39)
This equation has been used by Klemens [42] to calculate k when scattering defects are dopedinto a crystal. It should be noted however that this equation is strictly valid only when T >> θD. Formost laser materials, and particularly in the temperature range of interest here, about 77–300 K, thiscondition is violated but nevertheless often used because it can provide analytical results.
Appl. Sci. 2016, 6, 23 13 of 73
where we have used the following expression for the Debye frequency:
ω = 2 3 ρ / ∙ (38)
Inserting Equation (37) into Equation (36), and assuming that the phonon speed is a constant, we obtain = 2 ∙ ω τ(ω) ω (39)
This equation has been used by Klemens [42] to calculate k when scattering defects are doped into a crystal. It should be noted however that this equation is strictly valid only when T >> θ . For most laser materials, and particularly in the temperature range of interest here, about 77–300 K, this condition is violated but nevertheless often used because it can provide analytical results.
Figure 3. Specific heat for the undoped laser material Y3Al5O12 as a function of temperature. Shown are the calculated values (solid blue line) using Equation (32), the values obtained with the specific heat approximation of Equation (34) (dashed red line), and the experimental data from [29].
2.2.3. Thermal Conductivity: The Influence of Dopant Density
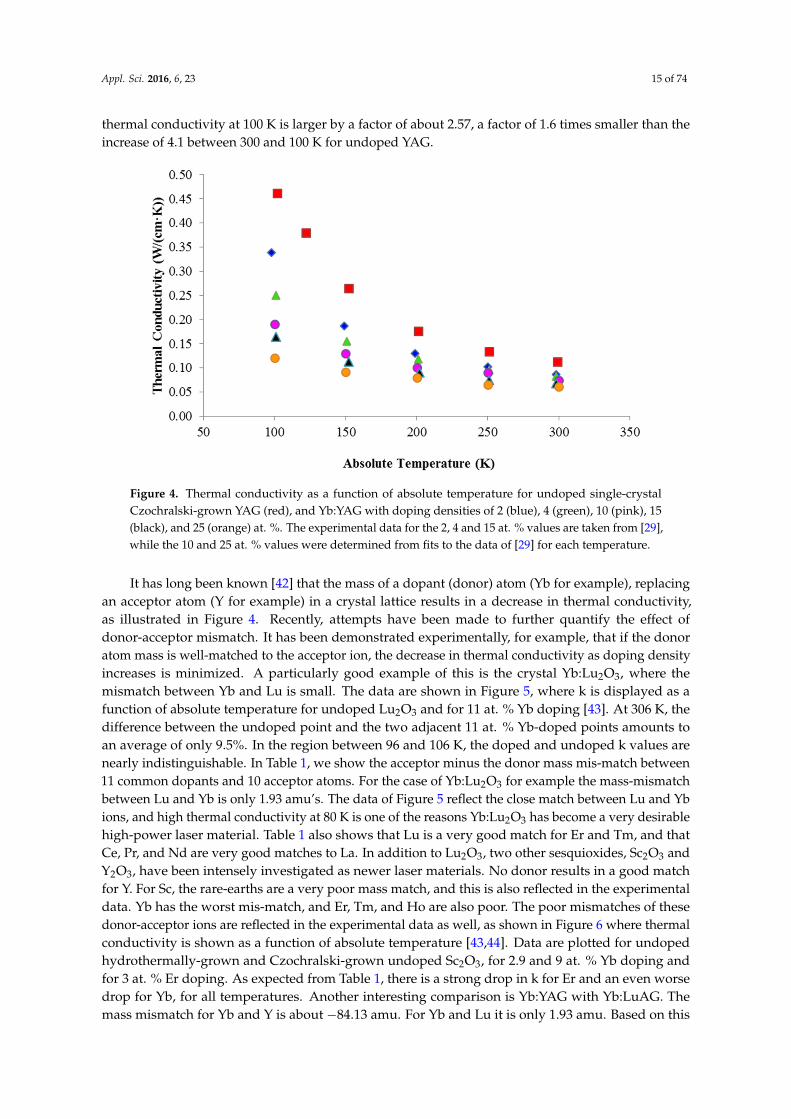
The thermal conductivity of doped laser materials is strongly affected by the presence of impurities, and in particular the doping density of lasing ions. Small quantities of dopant ions have a minimal effect on thermal conductivity, while ever increasing dopant densities degrade the thermal conductivity in an inverse relationship. This may be seen in Figure 4 wherein we display the thermal conductivity as a function of absolute temperature for the laser material YAG, for the undoped case, and for Yb concentrations of 2, 4, 10, 15, and 25 at. %. The 2, 4, and 15 Yb at. % values are obtained from [29], and the 10 and 25 at. % values are estimated from computer best fits to the data of [29] for each temperature. If we examine the data at 100 K for example, compared with the room temperature data at 300 K, we see that for the undoped sample the thermal conductivity value is 0.461 W/(cm·K), whereas the thermal conductivity for 10 at. % Yb is 0.190 W/(cm·K), and for 25 at. % Yb only 0.120 W/(cm·K). Thus at 100 K the drop in thermal conductivities amount to reductions of 0.41 and 0.26 respectively, when compared to the undoped value. The thermal conductivity at 300 K for the undoped case is 0.112 W/(cm·K), and 0.061 W/(cm·K) for the 25 at. % Yb doping case. Thus if we compare the undoped cases at 100 K and 300 K, we find the thermal conductivity larger by a factor of 4.1 at 100 K. For the 25 at. % Yb case however, if we compare the 100 K and the 300 K data, we see that the thermal conductivity rises by a factor of about 1.97 between 300 and 100 K, but also
Figure 3. Specific heat for the undoped laser material Y3Al5O12 as a function of temperature. Shownare the calculated values (solid blue line) using Equation (32), the values obtained with the specificheat approximation of Equation (34) (dashed red line), and the experimental data from [29].
2.2.3. Thermal Conductivity: The Influence of Dopant Density
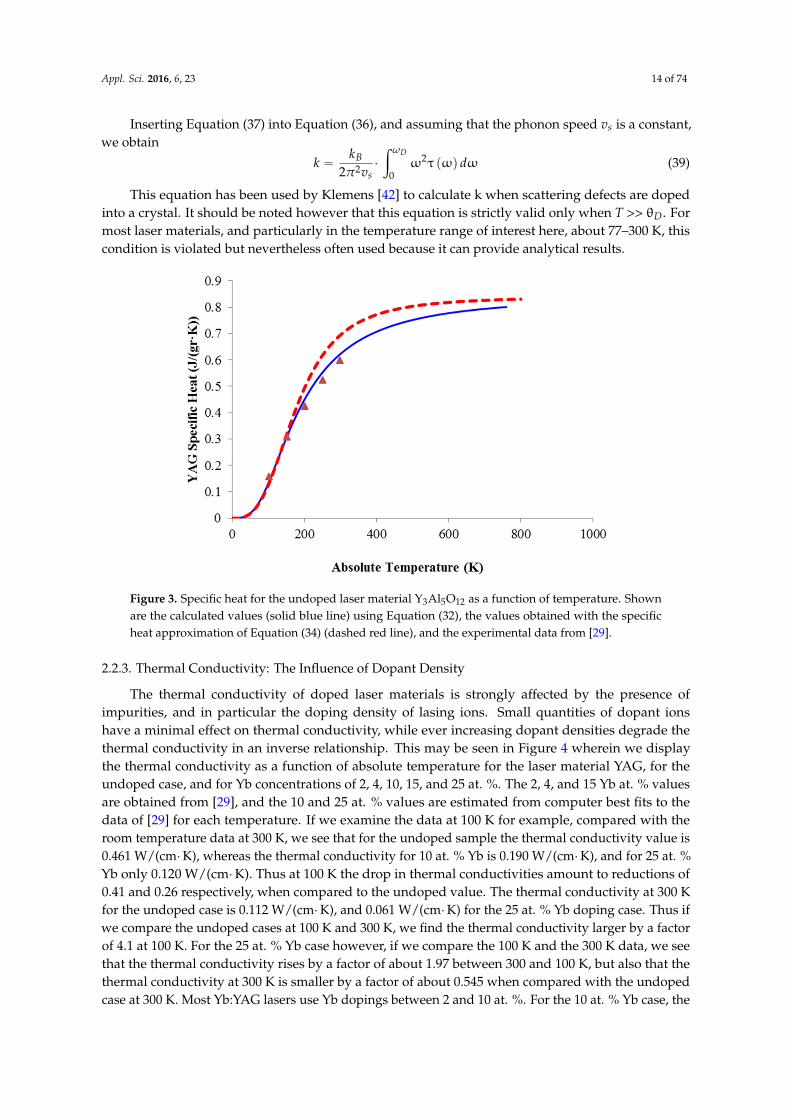
The thermal conductivity of doped laser materials is strongly affected by the presence ofimpurities, and in particular the doping density of lasing ions. Small quantities of dopant ionshave a minimal effect on thermal conductivity, while ever increasing dopant densities degrade thethermal conductivity in an inverse relationship. This may be seen in Figure 4 wherein we displaythe thermal conductivity as a function of absolute temperature for the laser material YAG, for theundoped case, and for Yb concentrations of 2, 4, 10, 15, and 25 at. %. The 2, 4, and 15 Yb at. % valuesare obtained from [29], and the 10 and 25 at. % values are estimated from computer best fits to thedata of [29] for each temperature. If we examine the data at 100 K for example, compared with theroom temperature data at 300 K, we see that for the undoped sample the thermal conductivity value is0.461 W/(cm¨K), whereas the thermal conductivity for 10 at. % Yb is 0.190 W/(cm¨K), and for 25 at. %Yb only 0.120 W/(cm¨K). Thus at 100 K the drop in thermal conductivities amount to reductions of0.41 and 0.26 respectively, when compared to the undoped value. The thermal conductivity at 300 Kfor the undoped case is 0.112 W/(cm¨K), and 0.061 W/(cm¨K) for the 25 at. % Yb doping case. Thus ifwe compare the undoped cases at 100 K and 300 K, we find the thermal conductivity larger by a factorof 4.1 at 100 K. For the 25 at. % Yb case however, if we compare the 100 K and the 300 K data, we seethat the thermal conductivity rises by a factor of about 1.97 between 300 and 100 K, but also that thethermal conductivity at 300 K is smaller by a factor of about 0.545 when compared with the undopedcase at 300 K. Most Yb:YAG lasers use Yb dopings between 2 and 10 at. %. For the 10 at. % Yb case, the
Appl. Sci. 2016, 6, 23 15 of 74
thermal conductivity at 100 K is larger by a factor of about 2.57, a factor of 1.6 times smaller than theincrease of 4.1 between 300 and 100 K for undoped YAG.
Appl. Sci. 2016, 6, 23 14 of 73
that the thermal conductivity at 300 K is smaller by a factor of about 0.545 when compared with the undoped case at 300 K. Most Yb:YAG lasers use Yb dopings between 2 and 10 at. %. For the 10 at. % Yb case, the thermal conductivity at 100 K is larger by a factor of about 2.57, a factor of 1.6 times smaller than the increase of 4.1 between 300 and 100 K for undoped YAG.
Figure 4. Thermal conductivity as a function of absolute temperature for undoped single-crystal Czochralski-grown YAG (red), and Yb:YAG with doping densities of 2 (blue), 4 (green), 10 (pink), 15 (black), and 25 (orange) at. %. The experimental data for the 2, 4 and 15 at. % values are taken from [29], while the 10 and 25 at. % values were determined from fits to the data of [29] for each temperature.
It has long been known [42] that the mass of a dopant (donor) atom (Yb for example), replacing an acceptor atom (Y for example) in a crystal lattice results in a decrease in thermal conductivity, as illustrated in Figure 4. Recently, attempts have been made to further quantify the effect of donor-acceptor mismatch. It has been demonstrated experimentally, for example, that if the donor atom mass is well-matched to the acceptor ion, the decrease in thermal conductivity as doping density increases is minimized. A particularly good example of this is the crystal Yb:Lu2O3, where the mismatch between Yb and Lu is small. The data are shown in Figure 5, where k is displayed as a function of absolute temperature for undoped Lu2O3 and for 11 at. % Yb doping [43]. At 306 K, the difference between the undoped point and the two adjacent 11 at. % Yb-doped points amounts to an average of only 9.5%. In the region between 96 and 106 K, the doped and undoped k values are nearly indistinguishable. In Table 1, we show the acceptor minus the donor mass mis-match between 11 common dopants and 10 acceptor atoms. For the case of Yb:Lu2O3 for example the mass-mismatch between Lu and Yb is only 1.93 amu’s. The data of Figure 5 reflect the close match between Lu and Yb ions, and high thermal conductivity at 80 K is one of the reasons Yb:Lu2O3 has become a very desirable high-power laser material. Table 1 also shows that Lu is a very good match for Er and Tm, and that Ce, Pr, and Nd are very good matches to La. In addition to Lu2O3, two other sesquioxides, Sc2O3 and Y2O3, have been intensely investigated as newer laser materials. No donor results in a good match for Y. For Sc, the rare-earths are a very poor mass match, and this is also reflected in the experimental data. Yb has the worst mis-match, and Er, Tm, and Ho are also poor. The poor mismatches of these donor-acceptor ions are reflected in the experimental data as well, as shown in Figure 6 where thermal conductivity is shown as a function of absolute temperature [43,44]. Data are plotted for undoped hydrothermally-grown and Czochralski-grown undoped Sc2O3, for 2.9 and 9 at. % Yb doping and for 3 at. % Er doping. As expected from Table 1, there is a strong drop in k for Er and an even worse drop for Yb, for all temperatures. Another interesting comparison is
Figure 4. Thermal conductivity as a function of absolute temperature for undoped single-crystalCzochralski-grown YAG (red), and Yb:YAG with doping densities of 2 (blue), 4 (green), 10 (pink), 15(black), and 25 (orange) at. %. The experimental data for the 2, 4 and 15 at. % values are taken from [29],while the 10 and 25 at. % values were determined from fits to the data of [29] for each temperature.
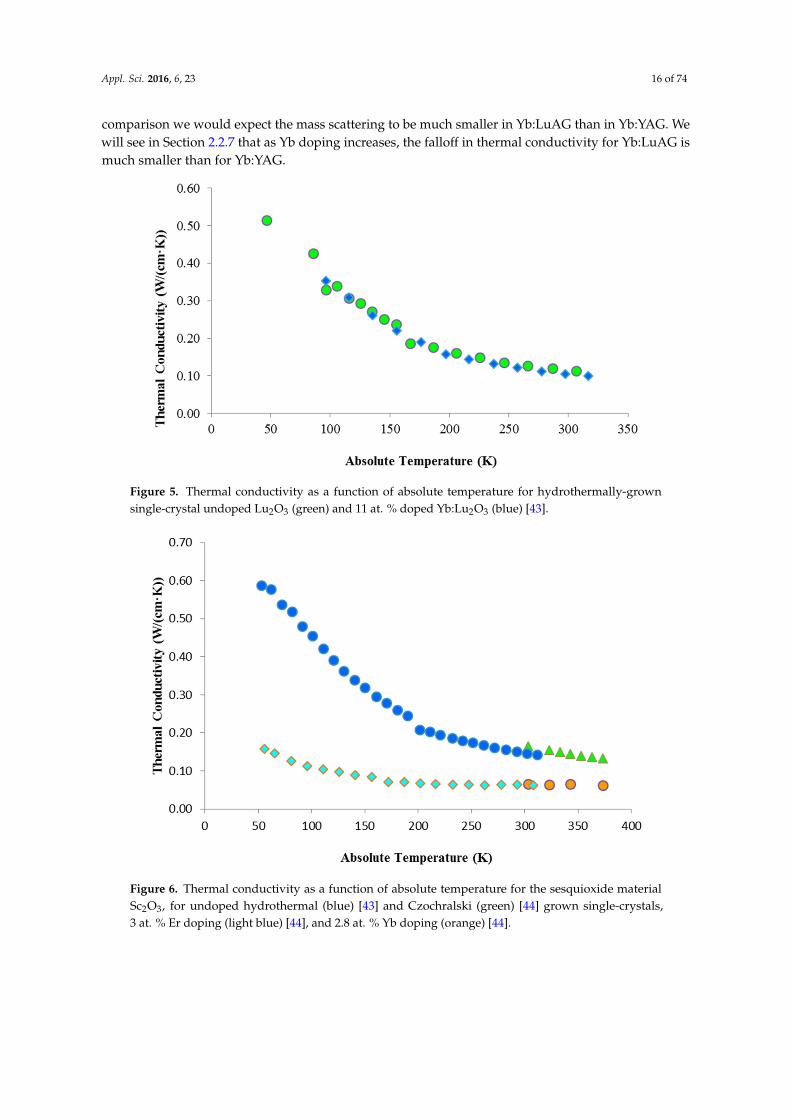
It has long been known [42] that the mass of a dopant (donor) atom (Yb for example), replacingan acceptor atom (Y for example) in a crystal lattice results in a decrease in thermal conductivity,as illustrated in Figure 4. Recently, attempts have been made to further quantify the effect ofdonor-acceptor mismatch. It has been demonstrated experimentally, for example, that if the donoratom mass is well-matched to the acceptor ion, the decrease in thermal conductivity as doping densityincreases is minimized. A particularly good example of this is the crystal Yb:Lu2O3, where themismatch between Yb and Lu is small. The data are shown in Figure 5, where k is displayed as afunction of absolute temperature for undoped Lu2O3 and for 11 at. % Yb doping [43]. At 306 K, thedifference between the undoped point and the two adjacent 11 at. % Yb-doped points amounts toan average of only 9.5%. In the region between 96 and 106 K, the doped and undoped k values arenearly indistinguishable. In Table 1, we show the acceptor minus the donor mass mis-match between11 common dopants and 10 acceptor atoms. For the case of Yb:Lu2O3 for example the mass-mismatchbetween Lu and Yb is only 1.93 amu’s. The data of Figure 5 reflect the close match between Lu and Ybions, and high thermal conductivity at 80 K is one of the reasons Yb:Lu2O3 has become a very desirablehigh-power laser material. Table 1 also shows that Lu is a very good match for Er and Tm, and thatCe, Pr, and Nd are very good matches to La. In addition to Lu2O3, two other sesquioxides, Sc2O3 andY2O3, have been intensely investigated as newer laser materials. No donor results in a good matchfor Y. For Sc, the rare-earths are a very poor mass match, and this is also reflected in the experimentaldata. Yb has the worst mis-match, and Er, Tm, and Ho are also poor. The poor mismatches of thesedonor-acceptor ions are reflected in the experimental data as well, as shown in Figure 6 where thermalconductivity is shown as a function of absolute temperature [43,44]. Data are plotted for undopedhydrothermally-grown and Czochralski-grown undoped Sc2O3, for 2.9 and 9 at. % Yb doping andfor 3 at. % Er doping. As expected from Table 1, there is a strong drop in k for Er and an even worsedrop for Yb, for all temperatures. Another interesting comparison is Yb:YAG with Yb:LuAG. Themass mismatch for Yb and Y is about ´84.13 amu. For Yb and Lu it is only 1.93 amu. Based on this
Appl. Sci. 2016, 6, 23 16 of 74
comparison we would expect the mass scattering to be much smaller in Yb:LuAG than in Yb:YAG. Wewill see in Section 2.2.7 that as Yb doping increases, the falloff in thermal conductivity for Yb:LuAG ismuch smaller than for Yb:YAG.
Appl. Sci. 2016, 6, 23 15 of 73
Yb:YAG with Yb:LuAG. The mass mismatch for Yb and Y is about −84.13 amu. For Yb and Lu it is only 1.93 amu. Based on this comparison we would expect the mass scattering to be much smaller in Yb:LuAG than in Yb:YAG. We will see in Section 2.2.7 that as Yb doping increases, the falloff in thermal conductivity for Yb:LuAG is much smaller than for Yb:YAG.
Figure 5. Thermal conductivity as a function of absolute temperature for hydrothermally-grown single-crystal undoped Lu2O3 (green) and 11 at. % doped Yb:Lu2O3 (blue) [43].
Figure 6. Thermal conductivity as a function of absolute temperature for the sesquioxide material Sc2O3, for undoped hydrothermal (blue) [43] and Czochralski (green) [44] grown single-crystals, 3 at. % Er doping (light blue) [44], and 2.8 at. % Yb doping (orange) [44].
Figure 5. Thermal conductivity as a function of absolute temperature for hydrothermally-grownsingle-crystal undoped Lu2O3 (green) and 11 at. % doped Yb:Lu2O3 (blue) [43].
Appl. Sci. 2016, 6, 23 15 of 73
Yb:YAG with Yb:LuAG. The mass mismatch for Yb and Y is about −84.13 amu. For Yb and Lu it is only 1.93 amu. Based on this comparison we would expect the mass scattering to be much smaller in Yb:LuAG than in Yb:YAG. We will see in Section 2.2.7 that as Yb doping increases, the falloff in thermal conductivity for Yb:LuAG is much smaller than for Yb:YAG.
Figure 5. Thermal conductivity as a function of absolute temperature for hydrothermally-grown single-crystal undoped Lu2O3 (green) and 11 at. % doped Yb:Lu2O3 (blue) [43].
Figure 6. Thermal conductivity as a function of absolute temperature for the sesquioxide material Sc2O3, for undoped hydrothermal (blue) [43] and Czochralski (green) [44] grown single-crystals, 3 at. % Er doping (light blue) [44], and 2.8 at. % Yb doping (orange) [44].
Figure 6. Thermal conductivity as a function of absolute temperature for the sesquioxide materialSc2O3, for undoped hydrothermal (blue) [43] and Czochralski (green) [44] grown single-crystals,3 at. % Er doping (light blue) [44], and 2.8 at. % Yb doping (orange) [44].

Appl. Sci. 2016, 6, 23 17 of 74
Table 1. Donor-Acceptor atomic numbers, weights, and weight differences for common dopants (donors) and acceptors.
Donor At. NumberAcceptor Li Mg Al K Ca Sc Y La Gd Lu
At. Number 3 12 13 19 20 21 39 57 64 71
At. Weight (amu) 6.94 24.31 26.98 39.10 40.08 44.96 88.91 139.91 157.25 174.97
Ti 22 47.87 ´44.87 56.87 ´20.89 ´8.77 ´7.79 ´2.91 41.04 92.04 109.38 127.10V 23 50.94 ´47.94 59.94 ´23.96 ´11.84 ´10.86 ´5.99 37.96 88.96 106.31 124.03Cr 24 52.00 ´49.00 61.00 ´25.01 ´12.90 ´11.92 ´7.04 36.91 87.91 105.25 122.97Co 27 58.93 ´55.93 67.93 ´31.95 ´19.84 ´18.86 ´13.98 29.97 80.97 98.32 116.03Ni 28 58.69 ´55.69 67.69 ´31.71 ´19.60 ´18.62 ´13.74 30.21 81.21 98.56 116.27Ce 58 140.12 ´137.12 149.12 ´113.13 101.02 ´100.04 ´95.16 ´51.21 ´0.21 17.14 34.85Pr 59 140.91 ´137.91 149.91 ´113.93 101.81 ´100.83 ´95.95 ´52.00 ´1.00 16.34 34.06Nd 60 144.24 ´141.24 153.24 ´117.26 105.14 ´104.16 ´99.28 ´55.33 ´4.33 13.01 30.73Sm 62 150.36 ´147.36 159.36 ´123.38 111.26 ´110.28 105.40 ´61.45 ´10.45 6.89 24.61Eu 63 151.97 ´148.97 160.97 ´124.98 112.87 ´111.89 107.01 ´63.06 ´12.06 5.28 23.00Dy 66 162.50 ´159.50 171.50 ´135.52 123.40 ´122.42 117.54 ´73.59 ´22.59 ´5.25 12.47Ho 67 164.93 ´161.93 173.93 ´137.95 125.83 ´124.85 119.97 ´76.02 ´25.02 ´7.68 10.04Er 68 167.26 ´164.26 176.26 ´140.28 128.16 ´127.18 122.30 ´78.35 ´27.35 ´10.01 7.71Tm 69 168.93 ´165.93 177.93 ´141.95 129.84 ´128.86 123.98 ´80.03 ´29.03 ´11.68 6.03Yb 70 173.04 ´170.04 182.04 ´146.06 133.94 ´132.96 128.08 ´84.13 ´33.13 ´15.79 1.93
Appl. Sci. 2016, 6, 23 18 of 74
2.2.4. Thermal Conductivity Temperature Dependence
Many thermal conductivity models use the Debye high temperature limit of Equation (33). Sincethen Cv is independent of temperature, the phonon speed is nearly independent of temperature,and the mean free path is inversely proportional to the temperature T, we find that in the hightemperature region
k2 “ k1¨
ˆ
T1
T2
˙b(40)
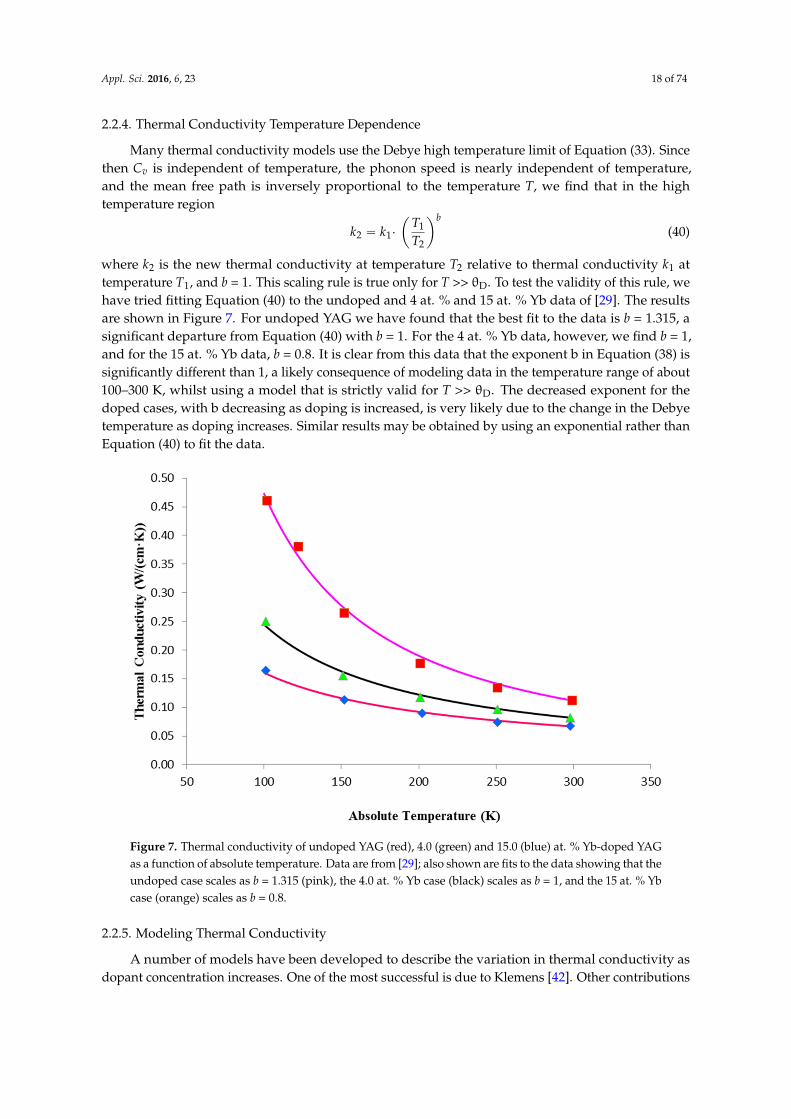
where k2 is the new thermal conductivity at temperature T2 relative to thermal conductivity k1 attemperature T1, and b = 1. This scaling rule is true only for T >> θD. To test the validity of this rule, wehave tried fitting Equation (40) to the undoped and 4 at. % and 15 at. % Yb data of [29]. The resultsare shown in Figure 7. For undoped YAG we have found that the best fit to the data is b = 1.315, asignificant departure from Equation (40) with b = 1. For the 4 at. % Yb data, however, we find b = 1,and for the 15 at. % Yb data, b = 0.8. It is clear from this data that the exponent b in Equation (38) issignificantly different than 1, a likely consequence of modeling data in the temperature range of about100–300 K, whilst using a model that is strictly valid for T >> θD. The decreased exponent for thedoped cases, with b decreasing as doping is increased, is very likely due to the change in the Debyetemperature as doping increases. Similar results may be obtained by using an exponential rather thanEquation (40) to fit the data.
Appl. Sci. 2016, 6, 23 17 of 73
2.2.4. Thermal Conductivity Temperature Dependence
Many thermal conductivity models use the Debye high temperature limit of Equation (33). Since then Cv is independent of temperature, the phonon speed is nearly independent of temperature, and the mean free path is inversely proportional to the temperature T, we find that in the high temperature region = ∙ (40)
where is the new thermal conductivity at temperature relative to thermal conductivity at temperature T1, and b = 1. This scaling rule is true only for T >> θ . To test the validity of this rule, we have tried fitting Equation (40) to the undoped and 4 at. % and 15 at. % Yb data of [29]. The results are shown in Figure 7. For undoped YAG we have found that the best fit to the data is b = 1.315, a significant departure from Equation (40) with b = 1. For the 4 at. % Yb data, however, we find b = 1, and for the 15 at. % Yb data, b = 0.8. It is clear from this data that the exponent b in Equation (38) is significantly different than 1, a likely consequence of modeling data in the temperature range of about 100–300 K, whilst using a model that is strictly valid for T >> θ . The decreased exponent for the doped cases, with b decreasing as doping is increased, is very likely due to the change in the Debye temperature as doping increases. Similar results may be obtained by using an exponential rather than Equation (40) to fit the data.
Figure 7. Thermal conductivity of undoped YAG (red), 4.0 (green) and 15.0 (blue) at. % Yb-doped YAG as a function of absolute temperature. Data are from [29]; also shown are fits to the data showing that the undoped case scales as b = 1.315 (pink), the 4.0 at. % Yb case (black) scales as b = 1, and the 15 at. % Yb case (orange) scales as b = 0.8.
2.2.5. Modeling Thermal Conductivity
A number of models have been developed to describe the variation in thermal conductivity as dopant concentration increases. One of the most successful is due to Klemens [42]. Other contributions were made by Slack and Oliver [45] and Holland [46]. A similar model was discussed in [47]. We follow the treatment of Klemens [42], who defines two relaxation times τ and τ as
Figure 7. Thermal conductivity of undoped YAG (red), 4.0 (green) and 15.0 (blue) at. % Yb-doped YAGas a function of absolute temperature. Data are from [29]; also shown are fits to the data showing that theundoped case scales as b = 1.315 (pink), the 4.0 at. % Yb case (black) scales as b = 1, and the 15 at. % Ybcase (orange) scales as b = 0.8.
2.2.5. Modeling Thermal Conductivity
A number of models have been developed to describe the variation in thermal conductivity asdopant concentration increases. One of the most successful is due to Klemens [42]. Other contributions
Appl. Sci. 2016, 6, 23 19 of 74
were made by Slack and Oliver [45] and Holland [46]. A similar model was discussed in [47]. Wefollow the treatment of Klemens [42], who defines two relaxation times τU and τD as
1τU
“ Bω2 ,1
τD“ Aω4 (41)
The relaxation time τU is associated with Umklapp anharmonic three-phonon scattering, while τDis the relaxation time for acoustic phonon scattering from dopants or impurities. The equation for τDis analagous to the Rayleigh scattering of optical photons, which has the same frequency dependence.The quantity A is a constant that depends on the mass difference between donor and acceptor ions, theunit cell volume, and the phonon speed. A can formally be written
A “a3
4πv3s¨ δ (42)
In Equation (42), a is the unit cell lattice parameter, vs the speed of sound in the crystal, and δ isthe mass-mismatch variance, given by
δ “ÿ
i
xi
„
Mi ´MM
2(43)
and M isM “
ÿ
i
xi Mi (44)
The quantity xi is the concentration parameter of the donor atoms, and satisfies the inequality0 ď xi ď 1. B in Equation (39) is a constant that is proportional to the temperature. ForUmklapp and dopant scattering together, the effective phonon relaxation time τe is calculated usingMatthiessen’s rule:
1τe“
1τU`
1τD
(45)
Substituting in Equation (39), and using Equation (41), we find
k “kB
2π2vs¨
ż ωD
0
ω2
1τU`
1τD
dω “kB
2π2vs¨
ż ωD
0
ω2
Bω2 ` Aω4 dω (46)
We can define a characteristic frequency ω0 using the condition τU pω0q “ τD pω0q where theimpurity scattering time constant is equal to the intrinsic Umklapp time constant. This condition canbe expressed as, using Equation (41):
1Bω2
0“
1Aω4
0(47)
This may be re-arranged to yield
ω0 “
c
BA
(48)
Equation (46) may be simplified to give
k “kB
2π2vsB¨
ż ωD
0
1
1`ˆ
AB
˙
ω2dω (49)
Appl. Sci. 2016, 6, 23 20 of 74
The integral is Equation (49) may be solved analytically, yielding
k “kBω0
2π2vsB¨ tan´1
ˆ
ωDω0
˙
(50)
We now define the intrinsic thermal conductivity k0 by setting A = 0 in Equation (47), and takingk = k0, the following results:
k0 “kBωD
2π2vsB(51)
Dividing Equation (50) by Equation (51), we obtain the result
k “ k0¨
ˆ
ω0
ωD
˙
¨ tan´1ˆ
ωDω0
˙
(52)
By use of Equation (39) and with B being proportional to the temperature T, we can useEquation (48) to get
ω0 “ K
c
Tδ
(53)
where K is a proportionality constant. We then define a constant ξ as
ξ “ωDK
(54)
so thatω0{ωD is expressed asω0
ωD“
1ξ
c
Tδ
(55)
Substituting Equation (55) into Equation (52) gives the final result:
k “ k0¨
˜
1ξ
c
Tδ
¸
¨ tan´1
˜
ξ
c
δ
T
¸
(56)
Knowing k0, T, and δ, we can now calculate the thermal conductivity using ξ as a fitting constant.Turning our attention to the binary laser crystal system YAG and YbAG, we can use Vegard’s Law forsolid solution to write the intrinsic thermal conductivity as
k0 “ kY0 p1´ xq ` kYb
0 x (57)
whereas before x is the concentration parameter for Yb, and kY0 and kYb
0 are the zero-doping intrinsicthermal conductivities of YAG and YbAG respectively.
To obtain k as a function of Yb doping density, at any temperature, we then use thefollowing relationship:
k “”
kY0 p1´ xq ` kYb
0 xı
¨
˜
1ξ
c
Tδ
¸
¨ tan´1
˜
ξ
c
δ
T
¸
(58)
This model has been previously discussed in the Dissertations of Klopp and Fredrich-Thornton [48,49].At a temperature of 300 K, and using the intrinsic thermal conductivities of YAG and YbAG,
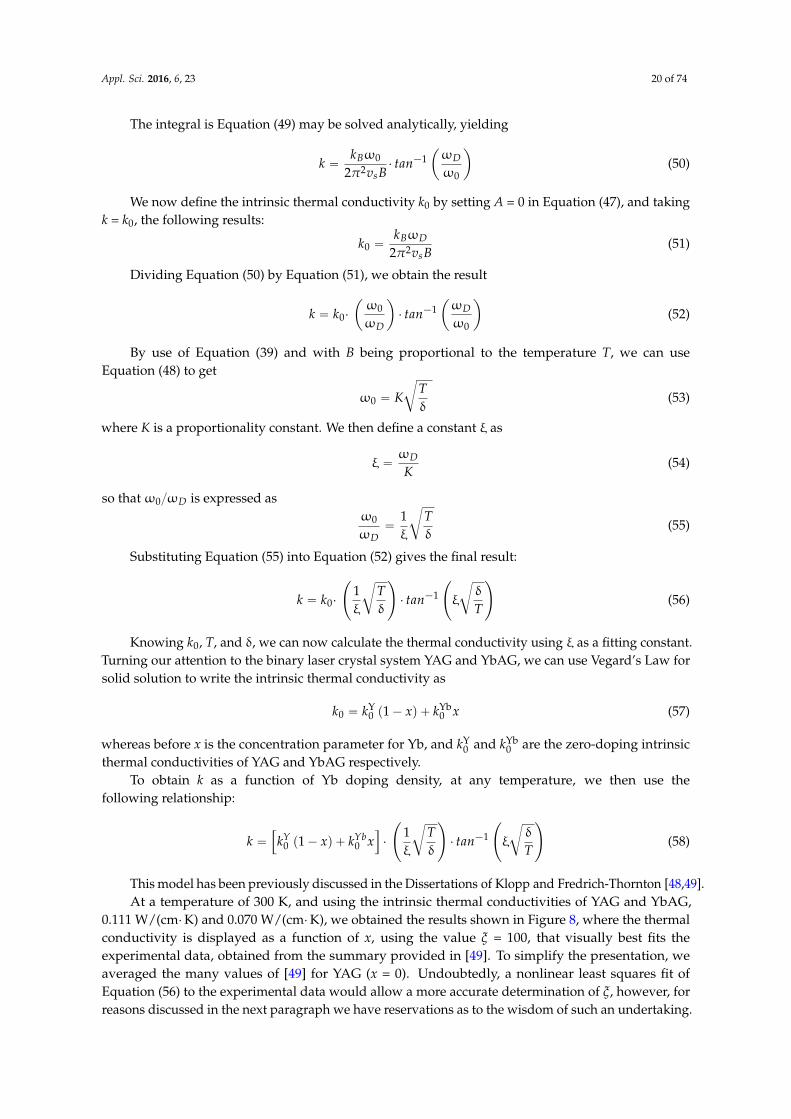
0.111 W/(cm¨K) and 0.070 W/(cm¨K), we obtained the results shown in Figure 8, where the thermalconductivity is displayed as a function of x, using the value ξ = 100, that visually best fits theexperimental data, obtained from the summary provided in [49]. To simplify the presentation, weaveraged the many values of [49] for YAG (x = 0). Undoubtedly, a nonlinear least squares fit ofEquation (56) to the experimental data would allow a more accurate determination of ξ, however, forreasons discussed in the next paragraph we have reservations as to the wisdom of such an undertaking.
Appl. Sci. 2016, 6, 23 21 of 74Appl. Sci. 2016, 6, 23 20 of 73
Figure 8. Thermal conductivity calculated using the Klemens model [42] as a function of concentration parameter x for the binary solid solution YAG-YbAG. Data points are taken from the comprehensive summary found in [49].
While this model qualitatively explains the concentration dependence of k, and of course because of Equation (57) duplicates the two end point thermal conductivities for YAG and LuAG, it is very likely that the appearance of accurately fitting the experimental data is illusory, because such a curve requires more than one constant to be theoretically duplicated. Another aspect of the Klemens model that is disquieting is that it treats the case where Y acoustic phonons are scattered as Yb ions are doped into the crystal, where the Yb concentration varies from 0%–100%, but ignores the reciprocal scattering of Yb ions from Y ions when Y is substituted into YbAG. Also, it is clear that beyond a Yb doping concentration of 50%, the crystal is predominantly YbAG rather than YAG. It should also be pointed out that YAG and YbAG have significantly different Debye temperatures of 760 and 575 K respectively [40]. Because of the interaction between the two crystal lattices, it is unlikely that a Vegard’s law linear relationship exists that can be used to estimate the values of the Debye temperature for x values in the range 0 1. The Klemens model uses only a single Debye temperature to describe the entire range of dopings, and for simplicity makes the assumption that one is operating at the high temperature limit where ≫θ , well beyond the region of interest for room temperature and cryogenic lasers. We will discuss progress towards an alternative model in the following section.
2.2.6. Extended Thermal Conductivity Model
Using the formalism shown in Section 2.2.5, we have developed an alternative model that splits the thermal conductivity into two components, kY(x) and kYb(x) whose properties are somewhat more physical, is symmetric with respect to the interchange of Y and Yb, and that has the reasonable boundary conditions that as x → 0, kYb(x) → 0, and for x → 1, kY(x) → 0. The thermal conductivity for any value of the doping parameter x can then be written as the equations = (1 − ) + (59)
and
Figure 8. Thermal conductivity calculated using the Klemens model [42] as a function of concentrationparameter x for the binary solid solution YAG-YbAG. Data points are taken from the comprehensivesummary found in [49].
While this model qualitatively explains the concentration dependence of k, and of course becauseof Equation (57) duplicates the two end point thermal conductivities for YAG and LuAG, it is verylikely that the appearance of accurately fitting the experimental data is illusory, because such a curverequires more than one constant to be theoretically duplicated. Another aspect of the Klemens modelthat is disquieting is that it treats the case where Y acoustic phonons are scattered as Yb ions aredoped into the crystal, where the Yb concentration varies from 0%–100%, but ignores the reciprocalscattering of Yb ions from Y ions when Y is substituted into YbAG. Also, it is clear that beyond a Ybdoping concentration of 50%, the crystal is predominantly YbAG rather than YAG. It should also bepointed out that YAG and YbAG have significantly different Debye temperatures of 760 and 575 Krespectively [40]. Because of the interaction between the two crystal lattices, it is unlikely that aVegard’s law linear relationship exists that can be used to estimate the values of the Debye temperaturefor x values in the range 0 ă x ă 1. The Klemens model uses only a single Debye temperature todescribe the entire range of dopings, and for simplicity makes the assumption that one is operating atthe high temperature limit where T " θD, well beyond the region of interest for room temperature andcryogenic lasers. We will discuss progress towards an alternative model in the following section.
2.2.6. Extended Thermal Conductivity Model
Using the formalism shown in Section 2.2.5, we have developed an alternative model that splitsthe thermal conductivity into two components, kY(x) and kYb(x) whose properties are somewhatmore physical, is symmetric with respect to the interchange of Y and Yb, and that has the reasonableboundary conditions that as xÑ 0, kYb(x)Ñ 0, and for xÑ 1, kY(x)Ñ 0. The thermal conductivity forany value of the doping parameter x can then be written as the equations
k “ p1´ xq kY ` xkYb (59)
and
k pxq “ p1´ xq ¨ˆ
koYξY
˙
¨
c
TδY¨ tan´1
˜
ξY¨
c
δYT
¸
` x¨ˆ
koYbξYb
˙
¨
c
TδYb
¨ tan´1
˜
ξYb¨
c
δYbT
¸ (60)
Appl. Sci. 2016, 6, 23 22 of 74
These equations satisfy the aforementioned boundary conditions, are symmetric upon theinterchange of Y and Yb, and are physically reasonable since now a crystal may be viewed as asolid solution of two separate scattering materials rather than a single crystal with impurity dopingadded, and there are now two constants ξY and ξYb that may be adjusted to fit the experimental data.The quantities koY and koYb are the experimental values of the thermal conductivity of YAG and YbAG.The mass scattering terms δY and δYb are now given by the expressions
δY “ p1´ xq ¨„
pMY ´MqM
2; δYb “ x¨
„
pMYb ´MqM
2(61)
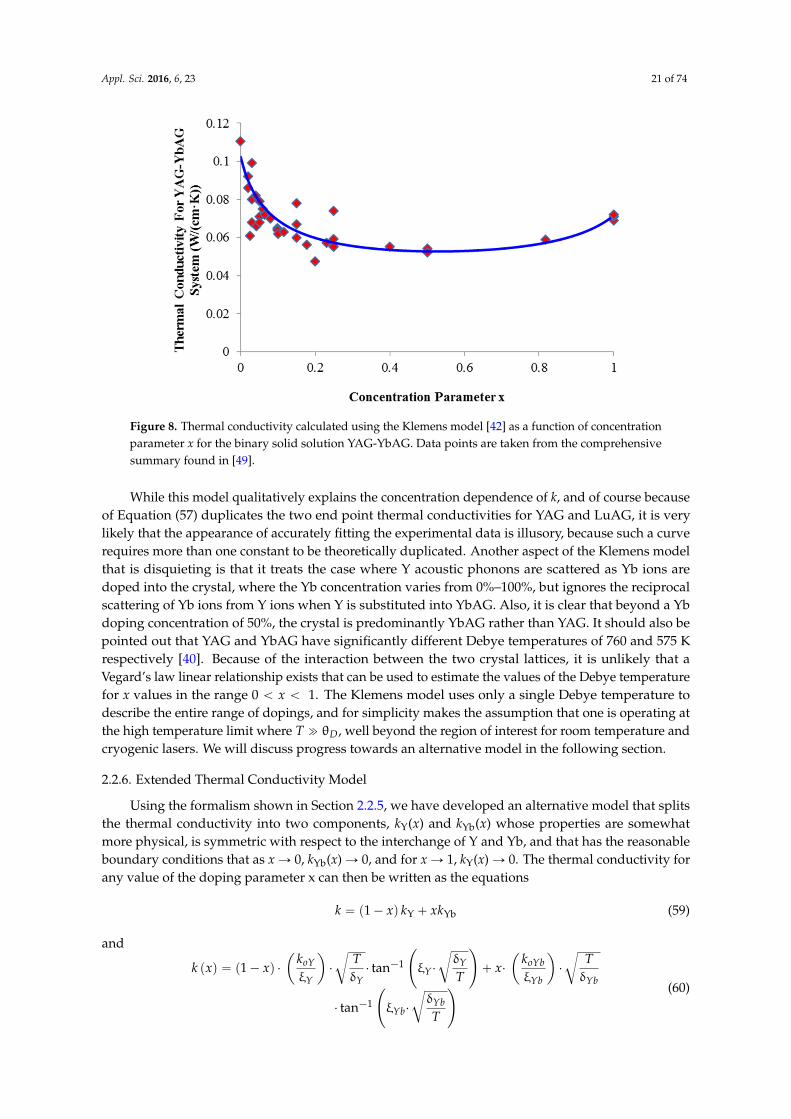
where M is given by Equation (44), and MY and MYb are the atomic masses of Y and Yb respectively.In Figure 9, we shown a fit to the experimental data summarized in [49]. The thermal conductivity
kY goes to 0 for x = 1 and for x = 0, kYb = 0, as expected. The minimum appears to be closer tox = 0.35 than to x = 0.5 as found in the previous plot, Figure 8, but without a better more consistentdata set, it is difficult to ascertain exactly where it is with any accuracy. The position of the minimumis determined by how quickly the thermal conductivities decrease as a function of x. The equality ofthe two thermal conductivities occurs at x = 0.4.
Appl. Sci. 2016, 6, 23 21 of 73
( ) = (1 − ) ∙ξ
∙δ
∙ ξ ∙ δ + ∙ξ
∙δ
∙ ξ ∙ δ
(60)
These equations satisfy the aforementioned boundary conditions, are symmetric upon the interchange of Y and Yb, and are physically reasonable since now a crystal may be viewed as a solid solution of two separate scattering materials rather than a single crystal with impurity doping added, and there are now two constants ξ and ξ that may be adjusted to fit the experimental data. The quantities and are the experimental values of the thermal conductivity of YAG and YbAG. The mass scattering terms δ and δ are now given by the expressions
δ = (1 − ) ∙ ( − ) ; δ = ∙ ( − ) (61)
where M is given by Equation (44), and and are the atomic masses of Y and Yb respectively.
In Figure 9, we shown a fit to the experimental data summarized in [49]. The thermal conductivity goes to 0 for x = 1 and for x = 0, = 0, as expected. The minimum appears to be closer to x = 0.35 than to x = 0.5 as found in the previous plot, Figure 8, but without a better more consistent data set, it is difficult to ascertain exactly where it is with any accuracy. The position of the minimum is determined by how quickly the thermal conductivities decrease as a function of x. The equality of the two thermal conductivities occurs at x = 0.4.
Figure 9. Thermal conductivities (blue), (red), and k (green) calculated using our model as a function of concentration parameter x for the binary solid solution YAG-YbAG. Data points are taken from the comprehensive summary found in [49]. Constants used in this plot are ξ = 300 and ξ = 50.
This new model seems to offer more flexibility with regard to fitting experimental data, however we view this as only a first step in developing a more comprehensive model that can be used to predict in advance the thermal conductivities of arbitrary laser crystals. Because the Klemens
Figure 9. Thermal conductivities kY (blue), kYb (red), and k (green) calculated using our model as afunction of concentration parameter x for the binary solid solution YAG-YbAG. Data points are takenfrom the comprehensive summary found in [49]. Constants used in this plot are ξY = 300 and ξYb = 50.
This new model seems to offer more flexibility with regard to fitting experimental data, howeverwe view this as only a first step in developing a more comprehensive model that can be used to predictin advance the thermal conductivities of arbitrary laser crystals. Because the Klemens model that westarted with is only valid for T >> θD, a reasonable next step is to combine the approach describedhere with Equation (36), and to solve for the thermal conductivity without approximation, usingnumerical methods.
Appl. Sci. 2016, 6, 23 23 of 74
2.2.7. Other Reported Thermal Conductivity Measurements Including Commonly UsedAncillary Materials
Since our 2005 paper [2], the measurement of thermal conductivity values has accelerated, withmost common laser materials being tabulated. In this section, we show plots of most of the datareported in the literature for single-crystal growth. Measurements for ceramic laser materials have notbeen included due to their well-known dependence on pore size. We showed previously (Figure 4) thethermal conductivity of YAG and Yb-doped YAG as a function of temperature and doping density(Figure 4), and for a number of undoped and Yb-doped sesquioxide laser materials (Figures 5 and 6).Here we show similar plots for many other laser materials. We start with the biaxial laser materialYALO (YAlO3), where Figure 10 shows thermal conductivity as a function of absolute temperature forundoped and 5 at. % Yb doped cases. Measurements of k were performed for the a, b, and c crystalaxes [29]. Due to the moderate mass mismatch between Yb and Y (Table 1), the k values for 5 at. % Ybdoping are significantly less than the undoped values. Figure 11 shows k values for undoped YAG andLuAG [3,29,45], whilst Figure 12 plots the thermal conductivities of YAG and LuAG as a function ofYb doping density [50] and for undoped and Tm-doped Lu2O3 [51]. These data show that for less thanabout 4 at. % Yb Yb:YAG is superior while for greater than 4 at. % Yb:LuAG is the better choice. Thesmall change in k for Yb:LuAG as doping density increases is due to the very small mass mismatchbetween Yb and Lu. Similarly, for Tm:Lu2O3, the mass mismatch between Tm and Lu is very small,and the thermal conductivity decreases very slowly with Tm concentration. Figure 13 plots k as afunction of absolute temperature for the uniaxial laser material YLF, for undoped and 5 at. % and25 at. % doped Yb cases [29,30]. The large drop in k for 5 and 25 at. % Yb dopings is a consequence ofthe moderate mass mismatch between Yb and Y. Figure 14 shows k for the recently developed undopedbiaxial laser materials BYW, KGW, and KYW [29]. In Figure 15 we show the thermal conductivityof the important uniaxial ultrafast laser material CaF2, for undoped, 1 at. %, 3 at. % and 5 at. %,obtained from a number of sources [44,52–54]. It is important to point out that the very rapid drop ink for increased Yb doping density is partially due to the very large mass mismatch between Ca andYb (see Table 1). According to [54], between about 1–3 at. % Yb doping, where k is almost flat from100–300 K, larger dopings drive the crystal structure towards clustering and increasingly glasslikebehavior, resulting in k values that decrease with decreasing temperature, rather than the increase in kwhich we have seen is almost a universal phenomenon with pure crystalline materials. This type ofbehavior is also displayed by laser glasses, and other important optical materials often used in ultrafastlaser systems. One reviewer of this paper has pointed out that mass-mismatch may play the lesserrole in this case. Figure 16 for example, shows the thermal conductivity of fused silica (SiO2) [55],an anaxial optical material, as a function of temperature. It displays a monotonic decrease in k astemperature is lowered, as expected due to a locally disordered crystal structure that severely limitsthe phonon mean free path. In Figure 17 the thermal conductivity values for the GdVO4 c and a axes,the YSO b-axis, and for GSAG are shown as a function of absolute temperature [3,30].
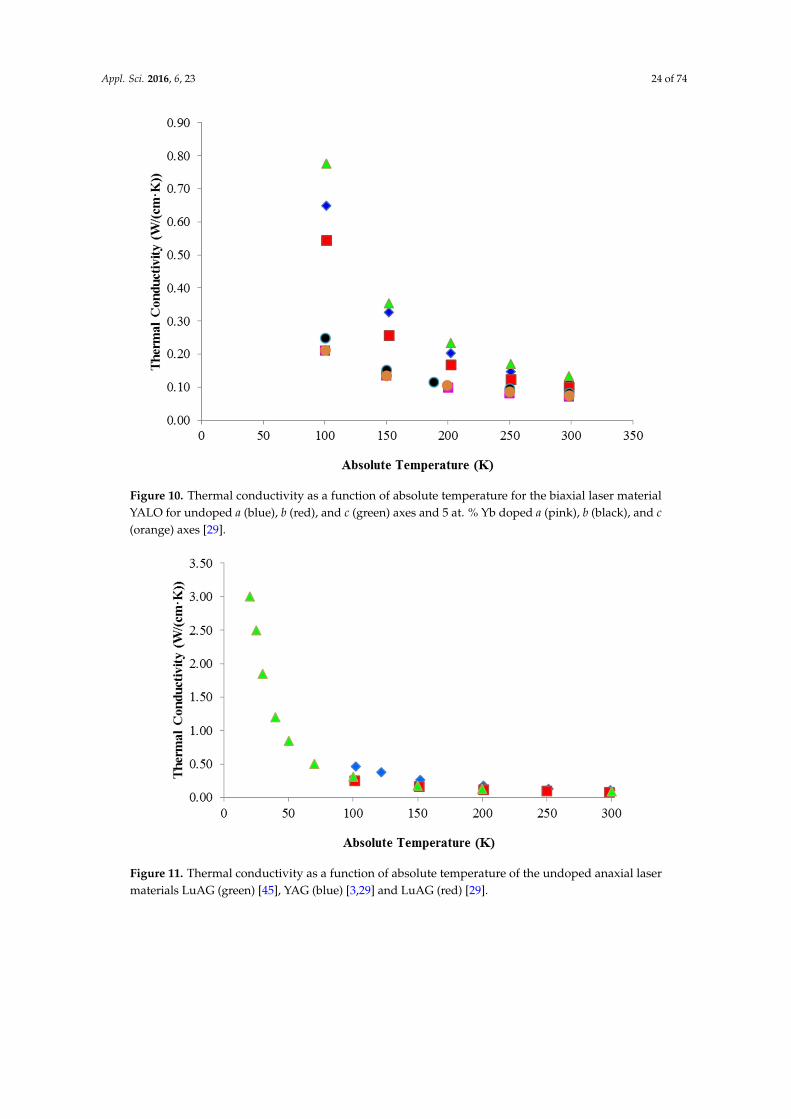
Appl. Sci. 2016, 6, 23 24 of 74Appl. Sci. 2016, 6, 23 23 of 73
Figure 10. Thermal conductivity as a function of absolute temperature for the biaxial laser material YALO for undoped a (blue), b (red), and c (green) axes and 5 at. % Yb doped a (pink), b (black), and c (orange) axes [29].
Figure 11. Thermal conductivity as a function of absolute temperature of the undoped anaxial laser materials LuAG (green) [45], YAG (blue) [3,29] and LuAG (red) [29].
Figure 10. Thermal conductivity as a function of absolute temperature for the biaxial laser materialYALO for undoped a (blue), b (red), and c (green) axes and 5 at. % Yb doped a (pink), b (black), and c(orange) axes [29].
Appl. Sci. 2016, 6, 23 23 of 73
Figure 10. Thermal conductivity as a function of absolute temperature for the biaxial laser material YALO for undoped a (blue), b (red), and c (green) axes and 5 at. % Yb doped a (pink), b (black), and c (orange) axes [29].
Figure 11. Thermal conductivity as a function of absolute temperature of the undoped anaxial laser materials LuAG (green) [45], YAG (blue) [3,29] and LuAG (red) [29]. Figure 11. Thermal conductivity as a function of absolute temperature of the undoped anaxial lasermaterials LuAG (green) [45], YAG (blue) [3,29] and LuAG (red) [29].

Appl. Sci. 2016, 6, 23 25 of 74Appl. Sci. 2016, 6, 23 24 of 73
Figure 12. Thermal conductivity of the anaxial laser materials Yb:YAG (blue) [50], Yb:LuAG (red) [50], and Tm:Lu2O3 (green) as a function of Yb doping concentration at room temperature [51].
Figure 13. Thermal conductivity as a function of absolute temperature of the uniaxial laser material YLF for undoped, a (blue) and c axes (green), 5 at. % doped, a (red) and c (black) axes, and 25 at. % doped a (pink) and c axes (orange) [29,30].
Figure 12. Thermal conductivity of the anaxial laser materials Yb:YAG (blue) [50], Yb:LuAG (red) [50],and Tm:Lu2O3 (green) as a function of Yb doping concentration at room temperature [51].
Appl. Sci. 2016, 6, 23 24 of 73
Figure 12. Thermal conductivity of the anaxial laser materials Yb:YAG (blue) [50], Yb:LuAG (red) [50], and Tm:Lu2O3 (green) as a function of Yb doping concentration at room temperature [51].
Figure 13. Thermal conductivity as a function of absolute temperature of the uniaxial laser material YLF for undoped, a (blue) and c axes (green), 5 at. % doped, a (red) and c (black) axes, and 25 at. % doped a (pink) and c axes (orange) [29,30].
Figure 13. Thermal conductivity as a function of absolute temperature of the uniaxial laser materialYLF for undoped, a (blue) and c axes (green), 5 at. % doped, a (red) and c (black) axes, and 25 at. %doped a (pink) and c axes (orange) [29,30].

Appl. Sci. 2016, 6, 23 26 of 74Appl. Sci. 2016, 6, 23 25 of 73
Figure 14. Thermal conductivity as a function of absolute temperature for the undoped biaxial laser materials BYW (blue), KGW (green), and KYW (red) along the b-axes [29].
Figure 15. Thermal conductivity as a function of absolute temperature of the anaxial laser material CaF2, for undoped (red [52], blue [53], pink [45], yellow [54]), 1 (black [54]), 3 (orange [53], light blue [54]) and 5 (green [54]) at. % doped Yb cases.
Figure 14. Thermal conductivity as a function of absolute temperature for the undoped biaxial lasermaterials BYW (blue), KGW (green), and KYW (red) along the b-axes [29].
Appl. Sci. 2016, 6, 23 25 of 73
Figure 14. Thermal conductivity as a function of absolute temperature for the undoped biaxial laser materials BYW (blue), KGW (green), and KYW (red) along the b-axes [29].
Figure 15. Thermal conductivity as a function of absolute temperature of the anaxial laser material CaF2, for undoped (red [52], blue [53], pink [45], yellow [54]), 1 (black [54]), 3 (orange [53], light blue [54]) and 5 (green [54]) at. % doped Yb cases.
Figure 15. Thermal conductivity as a function of absolute temperature of the anaxial laser materialCaF2, for undoped (red [52], blue [53], pink [45], yellow [54]), 1 (black [54]), 3 (orange [53], lightblue [54]) and 5 (green [54]) at. % doped Yb cases.
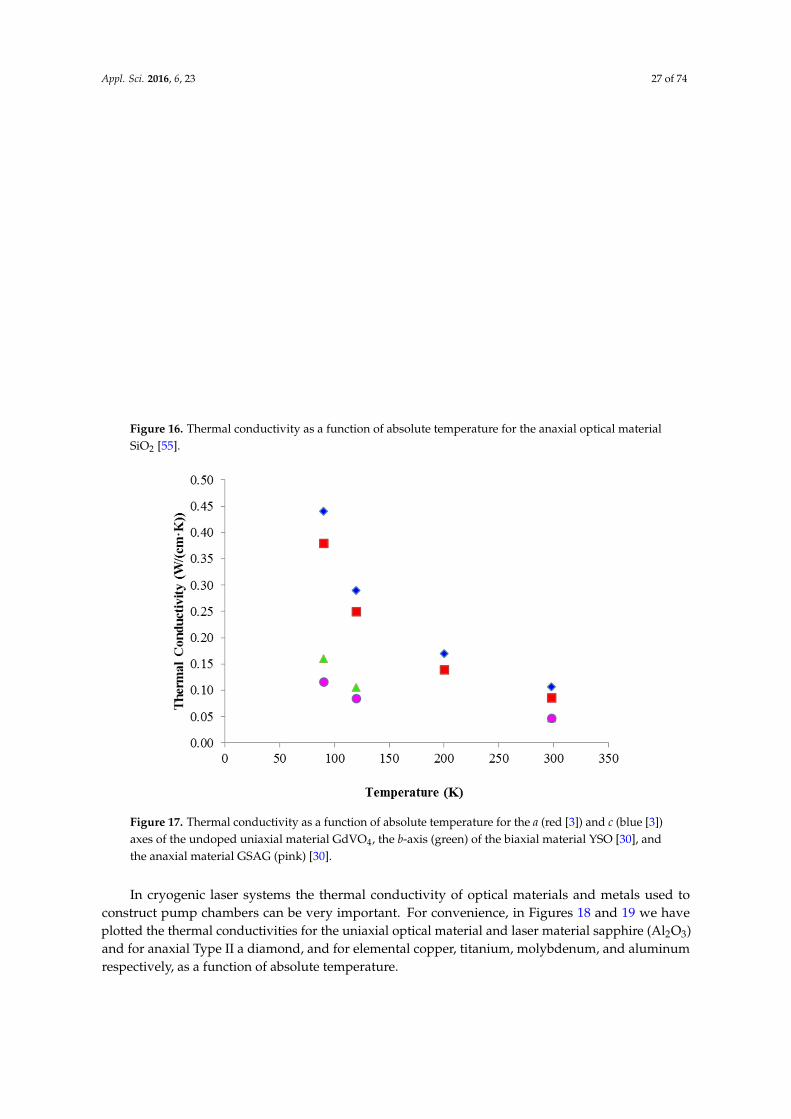
Appl. Sci. 2016, 6, 23 27 of 74Appl. Sci. 2016, 6, 23 26 of 73
Figure 16. Thermal conductivity as a function of absolute temperature for the anaxial optical material SiO2 [55].
Figure 17. Thermal conductivity as a function of absolute temperature for the a (red [3]) and c (blue [3]) axes of the undoped uniaxial material GdVO4, the b-axis (green) of the biaxial material YSO [30], and the anaxial material GSAG (pink) [30].
In cryogenic laser systems the thermal conductivity of optical materials and metals used to construct pump chambers can be very important. For convenience, in Figures 18 and 19 we have plotted the thermal conductivities for the uniaxial optical material and laser material sapphire (Al2O3) and for anaxial Type II a diamond, and for elemental copper, titanium, molybdenum, and aluminum respectively, as a function of absolute temperature.
Figure 16. Thermal conductivity as a function of absolute temperature for the anaxial optical materialSiO2 [55].
Appl. Sci. 2016, 6, 23 26 of 73
Figure 16. Thermal conductivity as a function of absolute temperature for the anaxial optical material SiO2 [55].
Figure 17. Thermal conductivity as a function of absolute temperature for the a (red [3]) and c (blue [3]) axes of the undoped uniaxial material GdVO4, the b-axis (green) of the biaxial material YSO [30], and the anaxial material GSAG (pink) [30].
In cryogenic laser systems the thermal conductivity of optical materials and metals used to construct pump chambers can be very important. For convenience, in Figures 18 and 19 we have plotted the thermal conductivities for the uniaxial optical material and laser material sapphire (Al2O3) and for anaxial Type II a diamond, and for elemental copper, titanium, molybdenum, and aluminum respectively, as a function of absolute temperature.
Figure 17. Thermal conductivity as a function of absolute temperature for the a (red [3]) and c (blue [3])axes of the undoped uniaxial material GdVO4, the b-axis (green) of the biaxial material YSO [30], andthe anaxial material GSAG (pink) [30].
In cryogenic laser systems the thermal conductivity of optical materials and metals used toconstruct pump chambers can be very important. For convenience, in Figures 18 and 19 we haveplotted the thermal conductivities for the uniaxial optical material and laser material sapphire (Al2O3)and for anaxial Type II a diamond, and for elemental copper, titanium, molybdenum, and aluminumrespectively, as a function of absolute temperature.
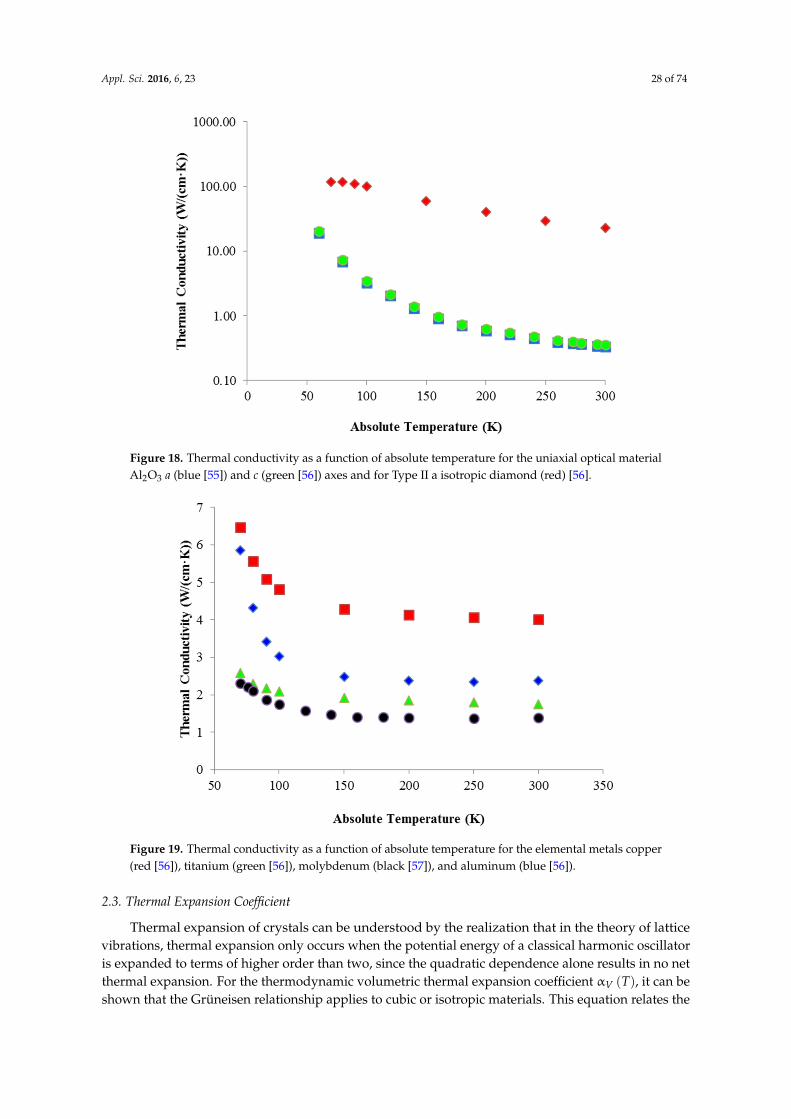
Appl. Sci. 2016, 6, 23 28 of 74Appl. Sci. 2016, 6, 23 27 of 73
Figure 18. Thermal conductivity as a function of absolute temperature for the uniaxial optical material Al2O3 a (blue [55]) and c (green [56]) axes and for Type II a isotropic diamond (red) [56].
Figure 19. Thermal conductivity as a function of absolute temperature for the elemental metals copper (red [56]), titanium (green [56]), molybdenum (black [57]), and aluminum (blue [56]).
2.3. Thermal Expansion Coefficient
Thermal expansion of crystals can be understood by the realization that in the theory of lattice vibrations, thermal expansion only occurs when the potential energy of a classical harmonic oscillator is expanded to terms of higher order than two, since the quadratic dependence alone results in no net thermal expansion. For the thermodynamic volumetric thermal expansion coefficient α ( ), it can be shown that the Grüneisen relationship applies to cubic or isotropic materials. This equation relates the Grüneisen constant γ , the bulk isothermal elastic modulus BT and the crystal mass density ρ to the bulk thermal expansion coefficient according to
Figure 18. Thermal conductivity as a function of absolute temperature for the uniaxial optical materialAl2O3 a (blue [55]) and c (green [56]) axes and for Type II a isotropic diamond (red) [56].
Appl. Sci. 2016, 6, 23 27 of 73
Figure 18. Thermal conductivity as a function of absolute temperature for the uniaxial optical material Al2O3 a (blue [55]) and c (green [56]) axes and for Type II a isotropic diamond (red) [56].
Figure 19. Thermal conductivity as a function of absolute temperature for the elemental metals copper (red [56]), titanium (green [56]), molybdenum (black [57]), and aluminum (blue [56]).
2.3. Thermal Expansion Coefficient
Thermal expansion of crystals can be understood by the realization that in the theory of lattice vibrations, thermal expansion only occurs when the potential energy of a classical harmonic oscillator is expanded to terms of higher order than two, since the quadratic dependence alone results in no net thermal expansion. For the thermodynamic volumetric thermal expansion coefficient α ( ), it can be shown that the Grüneisen relationship applies to cubic or isotropic materials. This equation relates the Grüneisen constant γ , the bulk isothermal elastic modulus BT and the crystal mass density ρ to the bulk thermal expansion coefficient according to
Figure 19. Thermal conductivity as a function of absolute temperature for the elemental metals copper(red [56]), titanium (green [56]), molybdenum (black [57]), and aluminum (blue [56]).
2.3. Thermal Expansion Coefficient
Thermal expansion of crystals can be understood by the realization that in the theory of latticevibrations, thermal expansion only occurs when the potential energy of a classical harmonic oscillatoris expanded to terms of higher order than two, since the quadratic dependence alone results in no netthermal expansion. For the thermodynamic volumetric thermal expansion coefficient αV pTq, it can beshown that the Grüneisen relationship applies to cubic or isotropic materials. This equation relates the
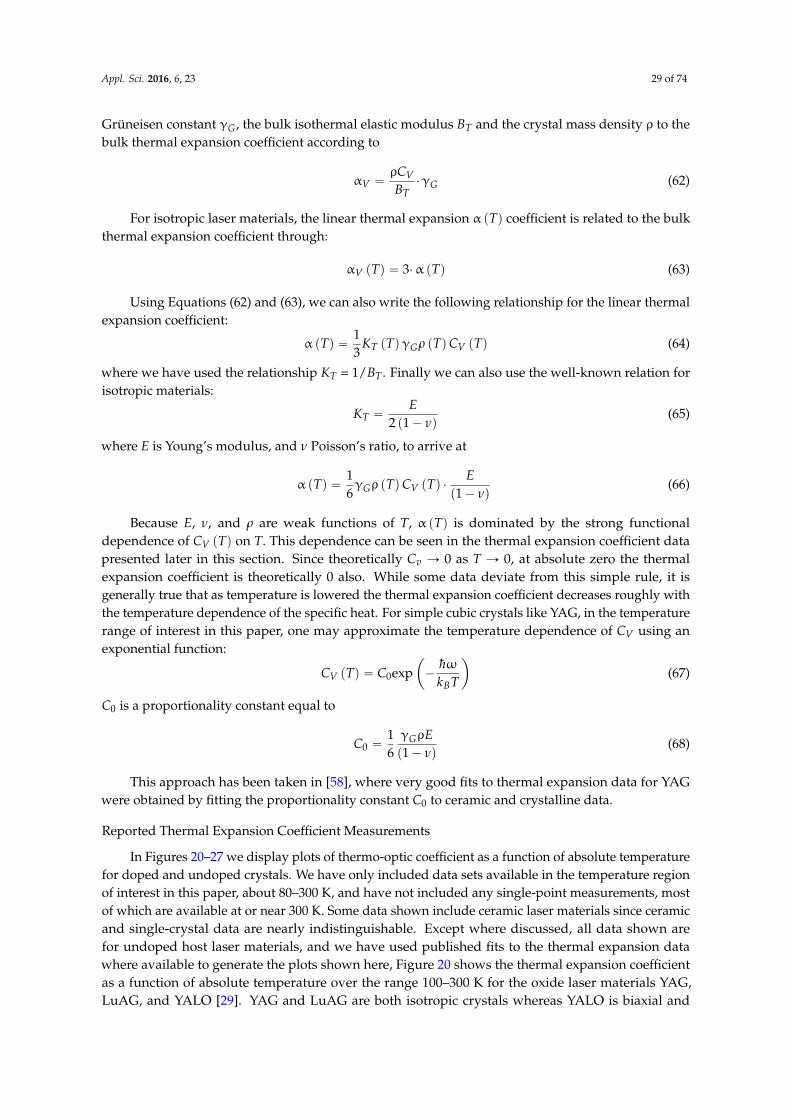
Appl. Sci. 2016, 6, 23 29 of 74
Grüneisen constant γG, the bulk isothermal elastic modulus BT and the crystal mass density ρ to thebulk thermal expansion coefficient according to
αV “ρCVBT
¨γG (62)
For isotropic laser materials, the linear thermal expansion α pTq coefficient is related to the bulkthermal expansion coefficient through:
αV pTq “ 3¨α pTq (63)
Using Equations (62) and (63), we can also write the following relationship for the linear thermalexpansion coefficient:
α pTq “13
KT pTqγGρ pTqCV pTq (64)
where we have used the relationship KT = 1/BT . Finally we can also use the well-known relation forisotropic materials:
KT “E
2 p1´ νq(65)
where E is Young’s modulus, and ν Poisson’s ratio, to arrive at
α pTq “16γGρ pTqCV pTq ¨
Ep1´ νq
(66)
Because E, ν, and ρ are weak functions of T, α pTq is dominated by the strong functionaldependence of CV pTq on T. This dependence can be seen in the thermal expansion coefficient datapresented later in this section. Since theoretically Cv Ñ 0 as T Ñ 0, at absolute zero the thermalexpansion coefficient is theoretically 0 also. While some data deviate from this simple rule, it isgenerally true that as temperature is lowered the thermal expansion coefficient decreases roughly withthe temperature dependence of the specific heat. For simple cubic crystals like YAG, in the temperaturerange of interest in this paper, one may approximate the temperature dependence of CV using anexponential function:
CV pTq “ C0expˆ
´hωkBT
˙
(67)
C0 is a proportionality constant equal to
C0 “16γGρEp1´ νq
(68)
This approach has been taken in [58], where very good fits to thermal expansion data for YAGwere obtained by fitting the proportionality constant C0 to ceramic and crystalline data.
Reported Thermal Expansion Coefficient Measurements
In Figures 20–27 we display plots of thermo-optic coefficient as a function of absolute temperaturefor doped and undoped crystals. We have only included data sets available in the temperature regionof interest in this paper, about 80–300 K, and have not included any single-point measurements, mostof which are available at or near 300 K. Some data shown include ceramic laser materials since ceramicand single-crystal data are nearly indistinguishable. Except where discussed, all data shown arefor undoped host laser materials, and we have used published fits to the thermal expansion datawhere available to generate the plots shown here, Figure 20 shows the thermal expansion coefficientas a function of absolute temperature over the range 100–300 K for the oxide laser materials YAG,LuAG, and YALO [29]. YAG and LuAG are both isotropic crystals whereas YALO is biaxial and
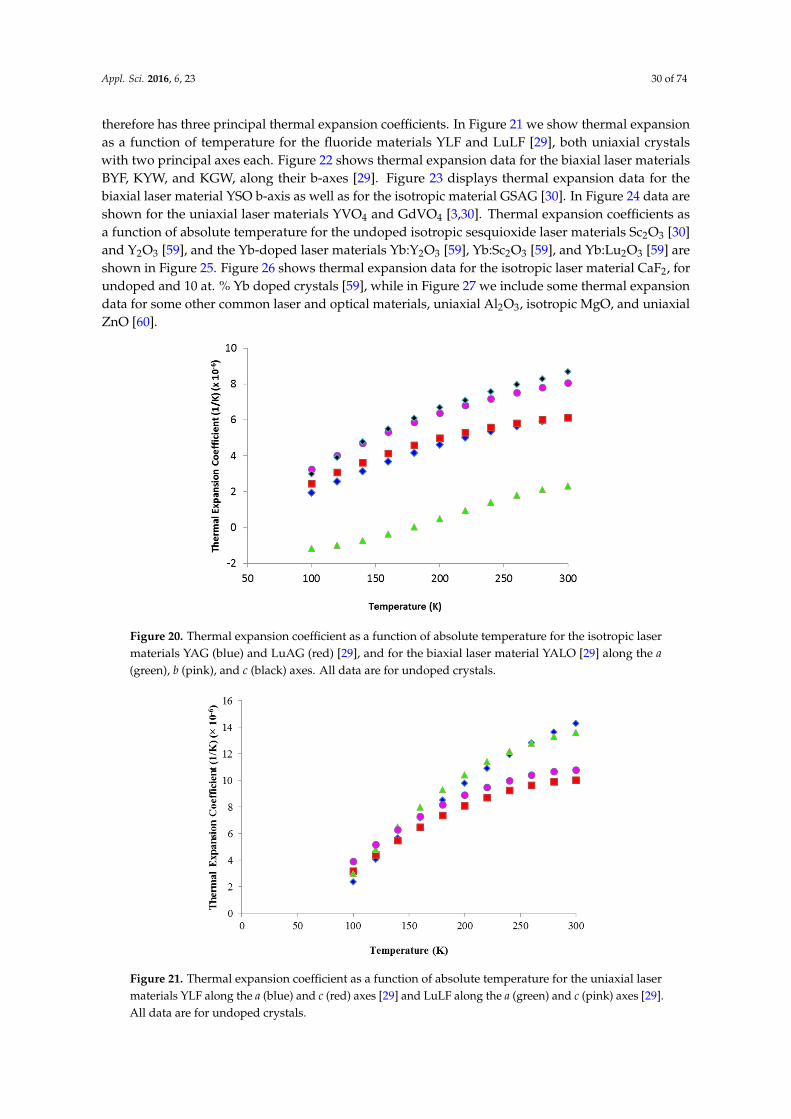
Appl. Sci. 2016, 6, 23 30 of 74
therefore has three principal thermal expansion coefficients. In Figure 21 we show thermal expansionas a function of temperature for the fluoride materials YLF and LuLF [29], both uniaxial crystalswith two principal axes each. Figure 22 shows thermal expansion data for the biaxial laser materialsBYF, KYW, and KGW, along their b-axes [29]. Figure 23 displays thermal expansion data for thebiaxial laser material YSO b-axis as well as for the isotropic material GSAG [30]. In Figure 24 data areshown for the uniaxial laser materials YVO4 and GdVO4 [3,30]. Thermal expansion coefficients asa function of absolute temperature for the undoped isotropic sesquioxide laser materials Sc2O3 [30]and Y2O3 [59], and the Yb-doped laser materials Yb:Y2O3 [59], Yb:Sc2O3 [59], and Yb:Lu2O3 [59] areshown in Figure 25. Figure 26 shows thermal expansion data for the isotropic laser material CaF2, forundoped and 10 at. % Yb doped crystals [59], while in Figure 27 we include some thermal expansiondata for some other common laser and optical materials, uniaxial Al2O3, isotropic MgO, and uniaxialZnO [60].
Appl. Sci. 2016, 6, 23 29 of 73
expansion coefficients as a function of absolute temperature for the undoped isotropic sesquioxide laser materials Sc2O3 [30] and Y2O3 [59], and the Yb-doped laser materials Yb:Y2O3 [59], Yb:Sc2O3 [59], and Yb:Lu2O3 [59] are shown in Figure 25. Figure 26 shows thermal expansion data for the isotropic laser material CaF2, for undoped and 10 at. % Yb doped crystals [59], while in Figure 27 we include some thermal expansion data for some other common laser and optical materials, uniaxial Al2O3, isotropic MgO, and uniaxial ZnO [60].
Figure 20. Thermal expansion coefficient as a function of absolute temperature for the isotropic laser materials YAG (blue) and LuAG (red) [29], and for the biaxial laser material YALO [29] along the a (green), b (pink), and c (black) axes. All data are for undoped crystals.
Figure 21. Thermal expansion coefficient as a function of absolute temperature for the uniaxial laser materials YLF along the a (blue) and c (red) axes [29] and LuLF along the a (green) and c (pink) axes [29]. All data are for undoped crystals.
Figure 20. Thermal expansion coefficient as a function of absolute temperature for the isotropic lasermaterials YAG (blue) and LuAG (red) [29], and for the biaxial laser material YALO [29] along the a(green), b (pink), and c (black) axes. All data are for undoped crystals.
Appl. Sci. 2016, 6, 23 29 of 73
expansion coefficients as a function of absolute temperature for the undoped isotropic sesquioxide laser materials Sc2O3 [30] and Y2O3 [59], and the Yb-doped laser materials Yb:Y2O3 [59], Yb:Sc2O3 [59], and Yb:Lu2O3 [59] are shown in Figure 25. Figure 26 shows thermal expansion data for the isotropic laser material CaF2, for undoped and 10 at. % Yb doped crystals [59], while in Figure 27 we include some thermal expansion data for some other common laser and optical materials, uniaxial Al2O3, isotropic MgO, and uniaxial ZnO [60].
Figure 20. Thermal expansion coefficient as a function of absolute temperature for the isotropic laser materials YAG (blue) and LuAG (red) [29], and for the biaxial laser material YALO [29] along the a (green), b (pink), and c (black) axes. All data are for undoped crystals.
Figure 21. Thermal expansion coefficient as a function of absolute temperature for the uniaxial laser materials YLF along the a (blue) and c (red) axes [29] and LuLF along the a (green) and c (pink) axes [29]. All data are for undoped crystals.
Figure 21. Thermal expansion coefficient as a function of absolute temperature for the uniaxial lasermaterials YLF along the a (blue) and c (red) axes [29] and LuLF along the a (green) and c (pink) axes [29].All data are for undoped crystals.
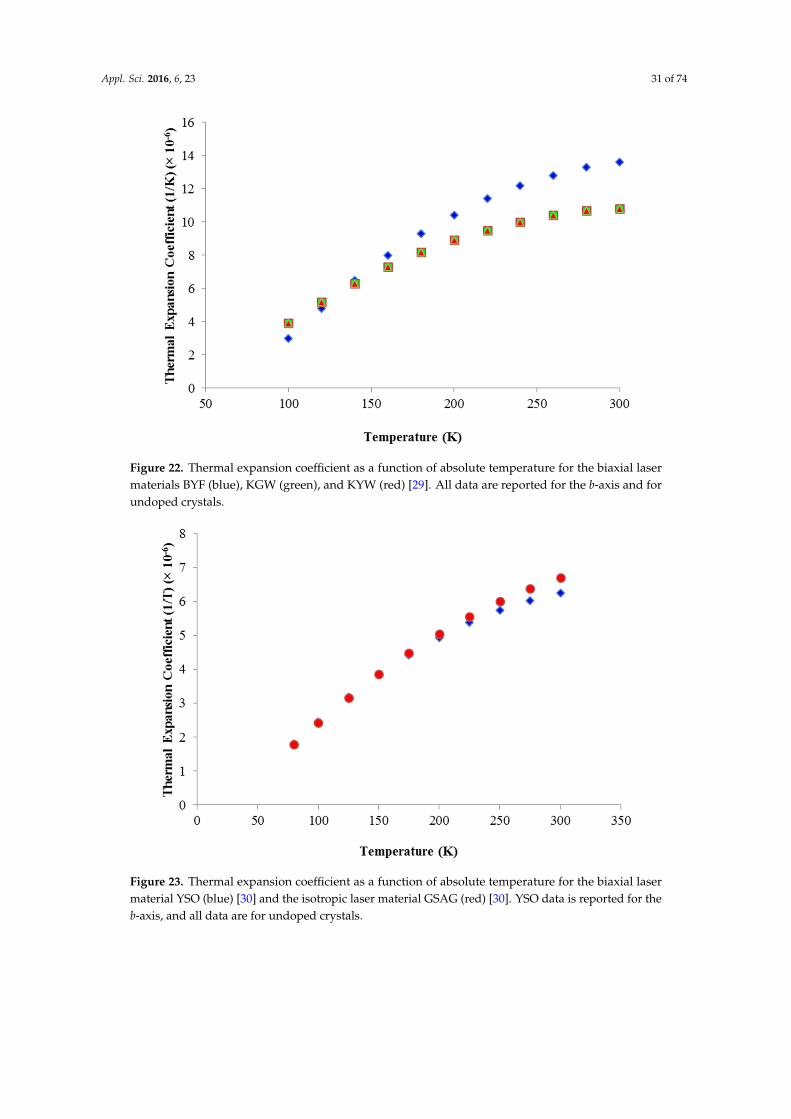
Appl. Sci. 2016, 6, 23 31 of 74Appl. Sci. 2016, 6, 23 30 of 73
Figure 22. Thermal expansion coefficient as a function of absolute temperature for the biaxial laser materials BYF (blue), KGW (green), and KYW (red) [29]. All data are reported for the b-axis and for undoped crystals.
Figure 23. Thermal expansion coefficient as a function of absolute temperature for the biaxial laser material YSO (blue) [30] and the isotropic laser material GSAG (red) [30]. YSO data is reported for the b-axis, and all data are for undoped crystals.
Figure 22. Thermal expansion coefficient as a function of absolute temperature for the biaxial lasermaterials BYF (blue), KGW (green), and KYW (red) [29]. All data are reported for the b-axis and forundoped crystals.
Appl. Sci. 2016, 6, 23 30 of 73
Figure 22. Thermal expansion coefficient as a function of absolute temperature for the biaxial laser materials BYF (blue), KGW (green), and KYW (red) [29]. All data are reported for the b-axis and for undoped crystals.
Figure 23. Thermal expansion coefficient as a function of absolute temperature for the biaxial laser material YSO (blue) [30] and the isotropic laser material GSAG (red) [30]. YSO data is reported for the b-axis, and all data are for undoped crystals.
Figure 23. Thermal expansion coefficient as a function of absolute temperature for the biaxial lasermaterial YSO (blue) [30] and the isotropic laser material GSAG (red) [30]. YSO data is reported for theb-axis, and all data are for undoped crystals.

Appl. Sci. 2016, 6, 23 32 of 74Appl. Sci. 2016, 6, 23 31 of 73
Figure 24. Thermal expansion coefficient as a function of absolute temperature for the uniaxial laser materials YVO4 [30] along the a (pink) and c (green) axes, and GdVO4 along the a (red) and c (blue) axes [3]. All data are for undoped crystals.
Figure 25. Thermal expansion coefficient as a function of absolute temperature for the undoped isotropic sesquioxide laser materials Sc2O3 (blue) [30] and Y2O3 (red) [59], and the 10 at. % Yb-doped laser material Yb:Y2O3 (green) [59], the 1 at. % Yb-doped material Yb:Sc2O3 (pink) [59], and 1 at. % Yb-doped material Yb:Lu2O3 (black) [59].
Figure 24. Thermal expansion coefficient as a function of absolute temperature for the uniaxial lasermaterials YVO4 [30] along the a (pink) and c (green) axes, and GdVO4 along the a (red) and c (blue)axes [3]. All data are for undoped crystals.
Appl. Sci. 2016, 6, 23 31 of 73
Figure 24. Thermal expansion coefficient as a function of absolute temperature for the uniaxial laser materials YVO4 [30] along the a (pink) and c (green) axes, and GdVO4 along the a (red) and c (blue) axes [3]. All data are for undoped crystals.
Figure 25. Thermal expansion coefficient as a function of absolute temperature for the undoped isotropic sesquioxide laser materials Sc2O3 (blue) [30] and Y2O3 (red) [59], and the 10 at. % Yb-doped laser material Yb:Y2O3 (green) [59], the 1 at. % Yb-doped material Yb:Sc2O3 (pink) [59], and 1 at. % Yb-doped material Yb:Lu2O3 (black) [59].
Figure 25. Thermal expansion coefficient as a function of absolute temperature for the undopedisotropic sesquioxide laser materials Sc2O3 (blue) [30] and Y2O3 (red) [59], and the 10 at. % Yb-dopedlaser material Yb:Y2O3 (green) [59], the 1 at. % Yb-doped material Yb:Sc2O3 (pink) [59], and 1 at. %Yb-doped material Yb:Lu2O3 (black) [59].
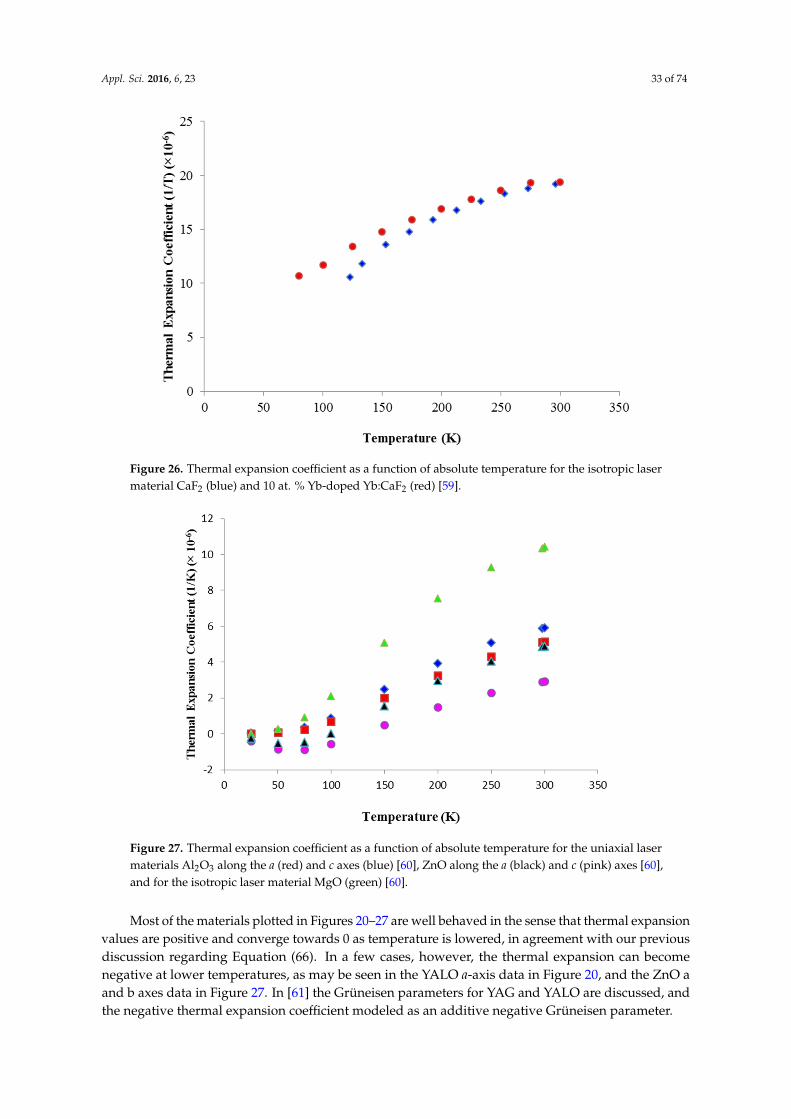
Appl. Sci. 2016, 6, 23 33 of 74Appl. Sci. 2016, 6, 23 32 of 73
Figure 26. Thermal expansion coefficient as a function of absolute temperature for the isotropic laser material CaF2 (blue) and 10 at. % Yb-doped Yb:CaF2 (red) [59].
Figure 27. Thermal expansion coefficient as a function of absolute temperature for the uniaxial laser materials Al2O3 along the a (red) and c axes (blue) [60], ZnO along the a (black) and c (pink) axes [60], and for the isotropic laser material MgO (green) [60].
Most of the materials plotted in Figures 20–27 are well behaved in the sense that thermal expansion values are positive and converge towards 0 as temperature is lowered, in agreement with our previous discussion regarding Equation (66). In a few cases, however, the thermal expansion can become negative at lower temperatures, as may be seen in the YALO a-axis data in Figure 20, and the ZnO a and b axes data in Figure 27. In [61] the Grüneisen parameters for YAG and YALO are discussed, and the negative thermal expansion coefficient modeled as an additive negative Grüneisen parameter.
Figure 26. Thermal expansion coefficient as a function of absolute temperature for the isotropic lasermaterial CaF2 (blue) and 10 at. % Yb-doped Yb:CaF2 (red) [59].
Appl. Sci. 2016, 6, 23 32 of 73
Figure 26. Thermal expansion coefficient as a function of absolute temperature for the isotropic laser material CaF2 (blue) and 10 at. % Yb-doped Yb:CaF2 (red) [59].
Figure 27. Thermal expansion coefficient as a function of absolute temperature for the uniaxial laser materials Al2O3 along the a (red) and c axes (blue) [60], ZnO along the a (black) and c (pink) axes [60], and for the isotropic laser material MgO (green) [60].
Most of the materials plotted in Figures 20–27 are well behaved in the sense that thermal expansion values are positive and converge towards 0 as temperature is lowered, in agreement with our previous discussion regarding Equation (66). In a few cases, however, the thermal expansion can become negative at lower temperatures, as may be seen in the YALO a-axis data in Figure 20, and the ZnO a and b axes data in Figure 27. In [61] the Grüneisen parameters for YAG and YALO are discussed, and the negative thermal expansion coefficient modeled as an additive negative Grüneisen parameter.
Figure 27. Thermal expansion coefficient as a function of absolute temperature for the uniaxial lasermaterials Al2O3 along the a (red) and c axes (blue) [60], ZnO along the a (black) and c (pink) axes [60],and for the isotropic laser material MgO (green) [60].
Most of the materials plotted in Figures 20–27 are well behaved in the sense that thermal expansionvalues are positive and converge towards 0 as temperature is lowered, in agreement with our previousdiscussion regarding Equation (66). In a few cases, however, the thermal expansion can becomenegative at lower temperatures, as may be seen in the YALO a-axis data in Figure 20, and the ZnO aand b axes data in Figure 27. In [61] the Grüneisen parameters for YAG and YALO are discussed, andthe negative thermal expansion coefficient modeled as an additive negative Grüneisen parameter.

Appl. Sci. 2016, 6, 23 34 of 74
2.4. Thermo-Optic Coefficient Measurements
As with the thermal expansion data of the previous section of this paper, in this section we includeonly data where nearly complete data sets are available in most of the temperature range of 80–300 K,and ignore single temperature point data. Unlike our previous discussion of the thermal conductivityand thermal expansion coefficient, the theoretical foundation for the thermo-optic coefficient is notnearly as developed, and we refer the reader to previous publications [2,3,29] for more backgroundinformation. In this section, we show in Figures 28–32 the best data sets we were able to find inthe literature, mostly generated at a wavelength of 1064 nm. Other data is available at 632.8 nm forexample, and where 1064 nm data are unavailable, we will present that data here.
Figure 28 shows thermo-optic coefficient data for the oxide laser materials YAG, LuAG, and YALO,along their principal axes [29]. In Figure 29 we show the very interesting data for the thermo-opticcoefficients of the fluoride laser materials YLF and LuLF [29]. The thermo-optic coefficients for bothmaterials are negative across the entire temperature range of interest, for YLF in a monotonicallydecreasing way as temperature trends towards zero, and in a much more complicated way for LuLF.The negative value of dn/dT for YLF is often used to minimize thermal aberrations near roomtemperature by partially compensating for the positive thermal expansion coefficient. This methodis obviously still helpful but of less utility as temperature is lowered for cryogenic laser operation.Figure 30 shows the thermo-optic coefficients for YVO4 and GdVO4 [3,30] along their principal axes,all of which remain positive in the temperature range of interest. The YSO b-axis remains positiveas well [30], as shown in Figure 31, but for CaF2 the thermo-optic coefficient is negative for alltemperatures, for both doped and undoped cases. The data for CaF2 were obtained for a wavelength of632.8 nm [59], but are included here due to the lack of similar data near 1020 nm. For the sesquioxides,data are available only for Y2O3 and Sc2O3 [3,30] and shown in Figure 32. While single-point datanear 1030 nm and 300 K and data collected at 632.8 nm are available over the temperature range ofinterest [59], we have not included that data here.
Appl. Sci. 2016, 6, 23 33 of 73
2.4. Thermo-Optic Coefficient Measurements
As with the thermal expansion data of the previous section of this paper, in this section we include only data where nearly complete data sets are available in most of the temperature range of 80–300 K, and ignore single temperature point data. Unlike our previous discussion of the thermal conductivity and thermal expansion coefficient, the theoretical foundation for the thermo-optic coefficient is not nearly as developed, and we refer the reader to previous publications [2,3,29] for more background information. In this section, we show in Figures 28–32 the best data sets we were able to find in the literature, mostly generated at a wavelength of 1064 nm. Other data is available at 632.8 nm for example, and where 1064 nm data are unavailable, we will present that data here.
Figure 28 shows thermo-optic coefficient data for the oxide laser materials YAG, LuAG, and YALO, along their principal axes [29]. In Figure 29 we show the very interesting data for the thermo-optic coefficients of the fluoride laser materials YLF and LuLF [29]. The thermo-optic coefficients for both materials are negative across the entire temperature range of interest, for YLF in a monotonically decreasing way as temperature trends towards zero, and in a much more complicated way for LuLF. The negative value of dn/dT for YLF is often used to minimize thermal aberrations near room temperature by partially compensating for the positive thermal expansion coefficient. This method is obviously still helpful but of less utility as temperature is lowered for cryogenic laser operation. Figure 30 shows the thermo-optic coefficients for YVO4 and GdVO4 [3,30] along their principal axes, all of which remain positive in the temperature range of interest. The YSO b-axis remains positive as well [30], as shown in Figure 31, but for CaF2 the thermo-optic coefficient is negative for all temperatures, for both doped and undoped cases. The data for CaF2 were obtained for a wavelength of 632.8 nm [59], but are included here due to the lack of similar data near 1020 nm. For the sesquioxides, data are available only for Y2O3 and Sc2O3 [3,30] and shown in Figure 32. While single-point data near 1030 nm and 300 K and data collected at 632.8 nm are available over the temperature range of interest [59], we have not included that data here.
Figure 28. Thermo-optic coefficient as a function of absolute temperature for YAG (green) [29], LuAG (red) [29], and the three principal axes, a (blue), b (black), and c (pink) of YALO [29], measured at the wavelength of 1064 nm.
Figure 28. Thermo-optic coefficient as a function of absolute temperature for YAG (green) [29], LuAG(red) [29], and the three principal axes, a (blue), b (black), and c (pink) of YALO [29], measured at thewavelength of 1064 nm.
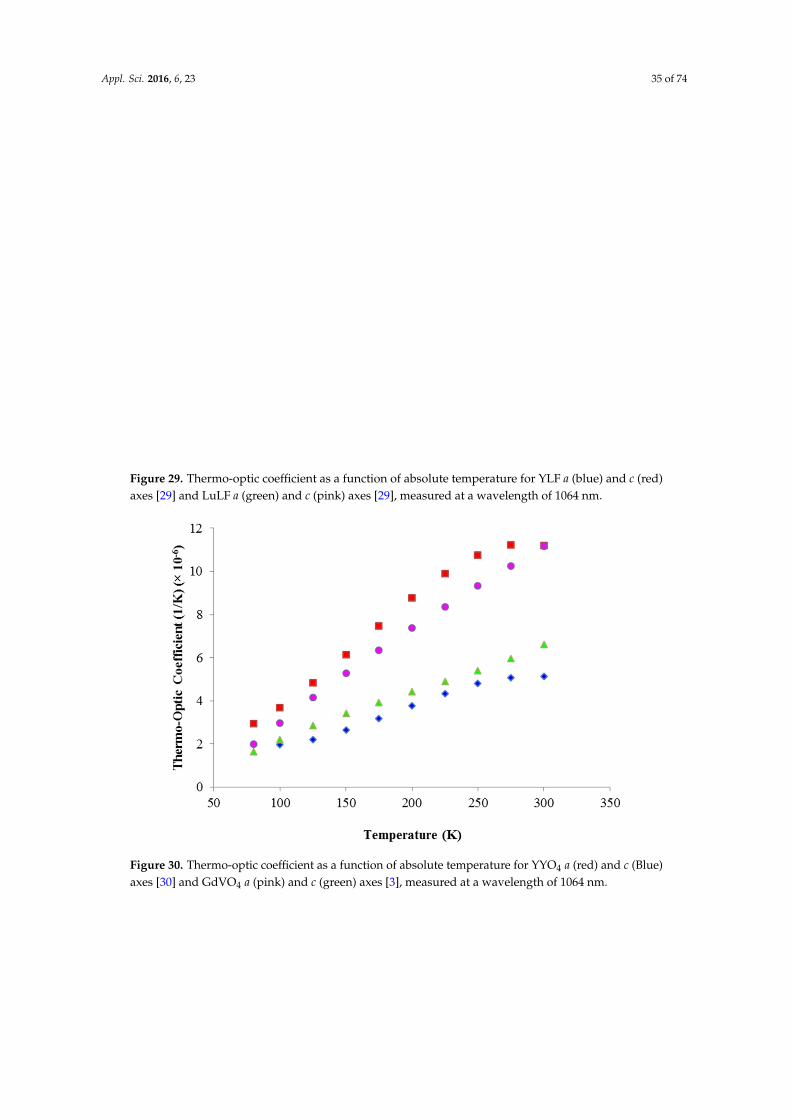
Appl. Sci. 2016, 6, 23 35 of 74Appl. Sci. 2016, 6, 23 34 of 73
Figure 29. Thermo-optic coefficient as a function of absolute temperature for YLF a (blue) and c (red) axes [29] and LuLF a (green) and c (pink) axes [29], measured at a wavelength of 1064 nm.
Figure 30. Thermo-optic coefficient as a function of absolute temperature for YYO4 a (red) and c (Blue) axes [30] and GdVO4 a (pink) and c (green) axes [3], measured at a wavelength of 1064 nm.
Figure 29. Thermo-optic coefficient as a function of absolute temperature for YLF a (blue) and c (red)axes [29] and LuLF a (green) and c (pink) axes [29], measured at a wavelength of 1064 nm.
Appl. Sci. 2016, 6, 23 34 of 73
Figure 29. Thermo-optic coefficient as a function of absolute temperature for YLF a (blue) and c (red) axes [29] and LuLF a (green) and c (pink) axes [29], measured at a wavelength of 1064 nm.
Figure 30. Thermo-optic coefficient as a function of absolute temperature for YYO4 a (red) and c (Blue) axes [30] and GdVO4 a (pink) and c (green) axes [3], measured at a wavelength of 1064 nm. Figure 30. Thermo-optic coefficient as a function of absolute temperature for YYO4 a (red) and c (Blue)axes [30] and GdVO4 a (pink) and c (green) axes [3], measured at a wavelength of 1064 nm.
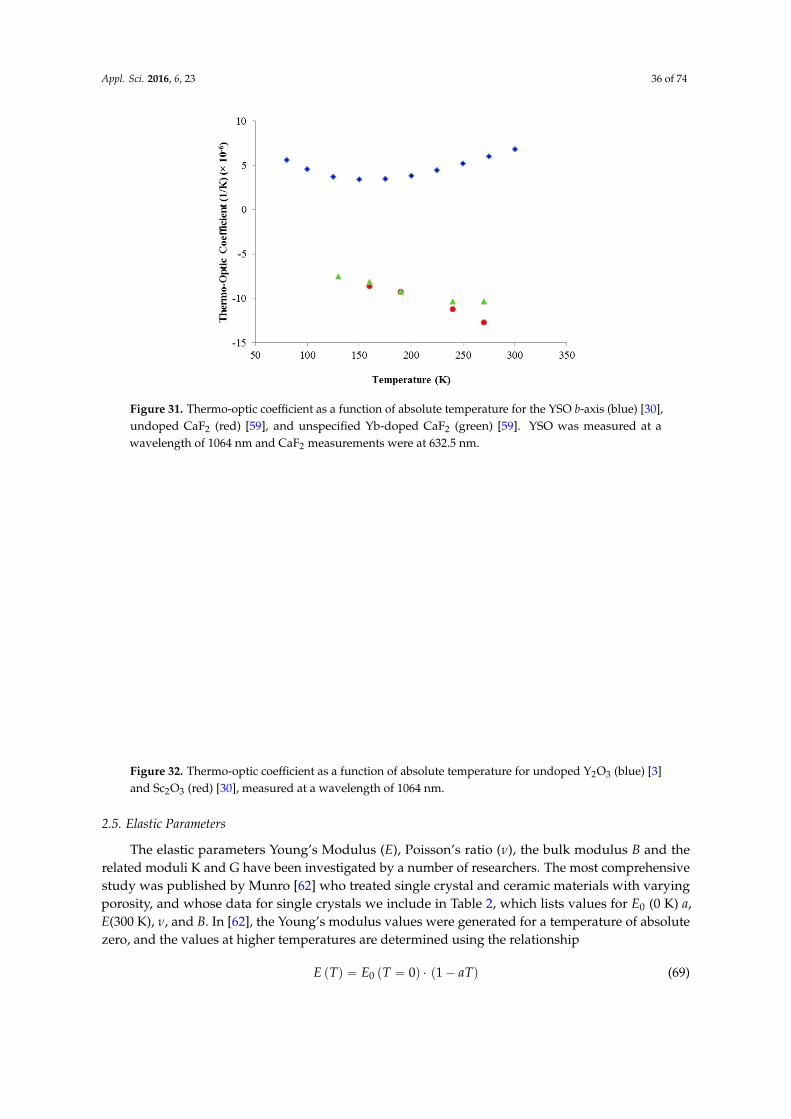
Appl. Sci. 2016, 6, 23 36 of 74
Appl. Sci. 2016, 6, 23 35 of 73
Figure 31. Thermo-optic coefficient as a function of absolute temperature for the YSO b-axis (blue) [30], undoped CaF2 (red) [59], and unspecified Yb-doped CaF2 (green) [59]. YSO was measured at a wavelength of 1064 nm and CaF2 measurements were at 632.5 nm.
Figure 32. Thermo-optic coefficient as a function of absolute temperature for undoped Y2O3 (blue) [3] and Sc2O3 (red) [30], measured at a wavelength of 1064 nm.
2.5. Elastic Parameters
The elastic parameters Young’s Modulus (E), Poisson’s ratio (ν), the bulk modulus B and the related moduli K and G have been investigated by a number of researchers. The most comprehensive study was published by Munro [62] who treated single crystal and ceramic materials with varying porosity, and whose data for single crystals we include in Table 2, which lists values
Figure 31. Thermo-optic coefficient as a function of absolute temperature for the YSO b-axis (blue) [30],undoped CaF2 (red) [59], and unspecified Yb-doped CaF2 (green) [59]. YSO was measured at awavelength of 1064 nm and CaF2 measurements were at 632.5 nm.
Appl. Sci. 2016, 6, 23 35 of 73
Figure 31. Thermo-optic coefficient as a function of absolute temperature for the YSO b-axis (blue) [30], undoped CaF2 (red) [59], and unspecified Yb-doped CaF2 (green) [59]. YSO was measured at a wavelength of 1064 nm and CaF2 measurements were at 632.5 nm.
Figure 32. Thermo-optic coefficient as a function of absolute temperature for undoped Y2O3 (blue) [3] and Sc2O3 (red) [30], measured at a wavelength of 1064 nm.
2.5. Elastic Parameters
The elastic parameters Young’s Modulus (E), Poisson’s ratio (ν), the bulk modulus B and the related moduli K and G have been investigated by a number of researchers. The most comprehensive study was published by Munro [62] who treated single crystal and ceramic materials with varying porosity, and whose data for single crystals we include in Table 2, which lists values
Figure 32. Thermo-optic coefficient as a function of absolute temperature for undoped Y2O3 (blue) [3]and Sc2O3 (red) [30], measured at a wavelength of 1064 nm.
2.5. Elastic Parameters
The elastic parameters Young’s Modulus (E), Poisson’s ratio (ν), the bulk modulus B and therelated moduli K and G have been investigated by a number of researchers. The most comprehensivestudy was published by Munro [62] who treated single crystal and ceramic materials with varyingporosity, and whose data for single crystals we include in Table 2, which lists values for E0 (0 K) a,E(300 K), ν, and B. In [62], the Young’s modulus values were generated for a temperature of absolutezero, and the values at higher temperatures are determined using the relationship
E pTq “ E0 pT “ 0q ¨ p1´ aTq (69)
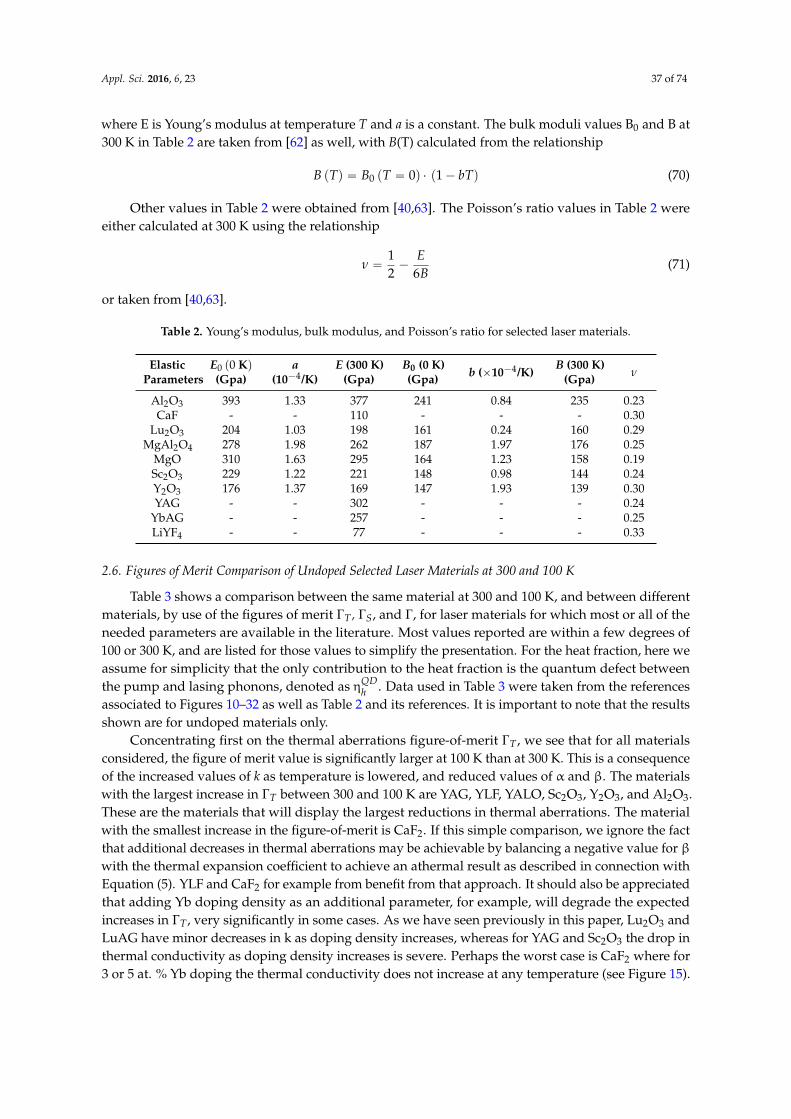
Appl. Sci. 2016, 6, 23 37 of 74
where E is Young’s modulus at temperature T and a is a constant. The bulk moduli values B0 and B at300 K in Table 2 are taken from [62] as well, with B(T) calculated from the relationship
B pTq “ B0 pT “ 0q ¨ p1´ bTq (70)
Other values in Table 2 were obtained from [40,63]. The Poisson’s ratio values in Table 2 wereeither calculated at 300 K using the relationship
ν “12´
E6B
(71)
or taken from [40,63].
Table 2. Young’s modulus, bulk modulus, and Poisson’s ratio for selected laser materials.
ElasticParameters
E0 p0 Kq(Gpa)
a(10´4/K)
E (300 K)(Gpa)
B0 (0 K)(Gpa) b (ˆ10´4/K)
B (300 K)(Gpa) ν
Al2O3 393 1.33 377 241 0.84 235 0.23CaF - - 110 - - - 0.30
Lu2O3 204 1.03 198 161 0.24 160 0.29MgAl2O4 278 1.98 262 187 1.97 176 0.25
MgO 310 1.63 295 164 1.23 158 0.19Sc2O3 229 1.22 221 148 0.98 144 0.24Y2O3 176 1.37 169 147 1.93 139 0.30YAG - - 302 - - - 0.24
YbAG - - 257 - - - 0.25LiYF4 - - 77 - - - 0.33
2.6. Figures of Merit Comparison of Undoped Selected Laser Materials at 300 and 100 K
Table 3 shows a comparison between the same material at 300 and 100 K, and between differentmaterials, by use of the figures of merit ΓT , ΓS, and Γ, for laser materials for which most or all of theneeded parameters are available in the literature. Most values reported are within a few degrees of100 or 300 K, and are listed for those values to simplify the presentation. For the heat fraction, here weassume for simplicity that the only contribution to the heat fraction is the quantum defect betweenthe pump and lasing phonons, denoted as ηQD
h . Data used in Table 3 were taken from the referencesassociated to Figures 10–32 as well as Table 2 and its references. It is important to note that the resultsshown are for undoped materials only.
Concentrating first on the thermal aberrations figure-of-merit ΓT , we see that for all materialsconsidered, the figure of merit value is significantly larger at 100 K than at 300 K. This is a consequenceof the increased values of k as temperature is lowered, and reduced values of α and β. The materialswith the largest increase in ΓT between 300 and 100 K are YAG, YLF, YALO, Sc2O3, Y2O3, and Al2O3.These are the materials that will display the largest reductions in thermal aberrations. The materialwith the smallest increase in the figure-of-merit is CaF2. If this simple comparison, we ignore the factthat additional decreases in thermal aberrations may be achievable by balancing a negative value for βwith the thermal expansion coefficient to achieve an athermal result as described in connection withEquation (5). YLF and CaF2 for example from benefit from that approach. It should also be appreciatedthat adding Yb doping density as an additional parameter, for example, will degrade the expectedincreases in ΓT , very significantly in some cases. As we have seen previously in this paper, Lu2O3 andLuAG have minor decreases in k as doping density increases, whereas for YAG and Sc2O3 the drop inthermal conductivity as doping density increases is severe. Perhaps the worst case is CaF2 where for3 or 5 at. % Yb doping the thermal conductivity does not increase at any temperature (see Figure 15).
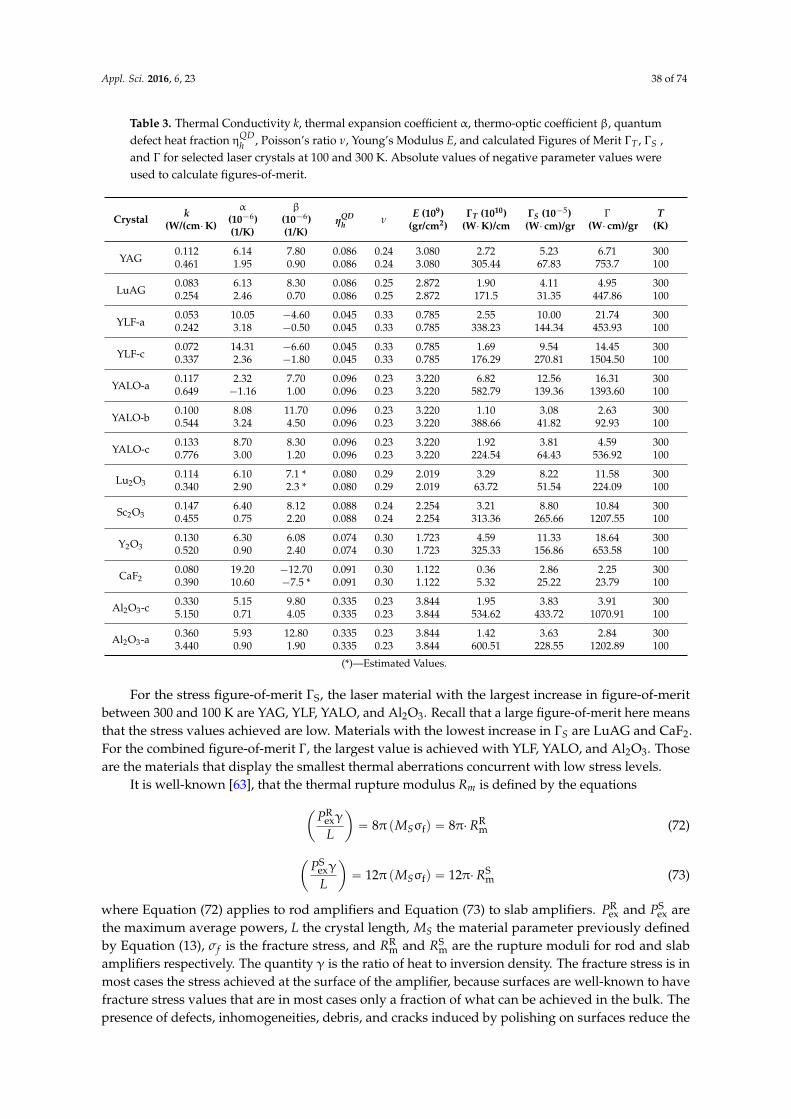
Appl. Sci. 2016, 6, 23 38 of 74
Table 3. Thermal Conductivity k, thermal expansion coefficient α, thermo-optic coefficient β, quantumdefect heat fraction ηQD
h , Poisson’s ratio ν, Young’s Modulus E, and calculated Figures of Merit ΓT , ΓS ,and Γ for selected laser crystals at 100 and 300 K. Absolute values of negative parameter values wereused to calculate figures-of-merit.
Crystal k(W/(cm¨K)
α(10´6)(1/K)
β(10´6)(1/K)
ηQDh ν
E (109)(gr/cm2)
ΓT (1010)(W¨K)/cm
ΓS (10´5)(W¨ cm)/gr
Γ(W¨ cm)/gr
T(K)
YAG0.112 6.14 7.80 0.086 0.24 3.080 2.72 5.23 6.71 3000.461 1.95 0.90 0.086 0.24 3.080 305.44 67.83 753.7 100
LuAG0.083 6.13 8.30 0.086 0.25 2.872 1.90 4.11 4.95 3000.254 2.46 0.70 0.086 0.25 2.872 171.5 31.35 447.86 100
YLF-a0.053 10.05 ´4.60 0.045 0.33 0.785 2.55 10.00 21.74 3000.242 3.18 ´0.50 0.045 0.33 0.785 338.23 144.34 453.93 100
YLF-c0.072 14.31 ´6.60 0.045 0.33 0.785 1.69 9.54 14.45 3000.337 2.36 ´1.80 0.045 0.33 0.785 176.29 270.81 1504.50 100
YALO-a0.117 2.32 7.70 0.096 0.23 3.220 6.82 12.56 16.31 3000.649 ´1.16 1.00 0.096 0.23 3.220 582.79 139.36 1393.60 100
YALO-b0.100 8.08 11.70 0.096 0.23 3.220 1.10 3.08 2.63 3000.544 3.24 4.50 0.096 0.23 3.220 388.66 41.82 92.93 100
YALO-c0.133 8.70 8.30 0.096 0.23 3.220 1.92 3.81 4.59 3000.776 3.00 1.20 0.096 0.23 3.220 224.54 64.43 536.92 100
Lu2O30.114 6.10 7.1 * 0.080 0.29 2.019 3.29 8.22 11.58 3000.340 2.90 2.3 * 0.080 0.29 2.019 63.72 51.54 224.09 100
Sc2O30.147 6.40 8.12 0.088 0.24 2.254 3.21 8.80 10.84 3000.455 0.75 2.20 0.088 0.24 2.254 313.36 265.66 1207.55 100
Y2O30.130 6.30 6.08 0.074 0.30 1.723 4.59 11.33 18.64 3000.520 0.90 2.40 0.074 0.30 1.723 325.33 156.86 653.58 100
CaF20.080 19.20 ´12.70 0.091 0.30 1.122 0.36 2.86 2.25 3000.390 10.60 ´7.5 * 0.091 0.30 1.122 5.32 25.22 23.79 100
Al2O3-c 0.330 5.15 9.80 0.335 0.23 3.844 1.95 3.83 3.91 3005.150 0.71 4.05 0.335 0.23 3.844 534.62 433.72 1070.91 100
Al2O3-a 0.360 5.93 12.80 0.335 0.23 3.844 1.42 3.63 2.84 3003.440 0.90 1.90 0.335 0.23 3.844 600.51 228.55 1202.89 100
(*)—Estimated Values.
For the stress figure-of-merit ΓS, the laser material with the largest increase in figure-of-meritbetween 300 and 100 K are YAG, YLF, YALO, and Al2O3. Recall that a large figure-of-merit here meansthat the stress values achieved are low. Materials with the lowest increase in ΓS are LuAG and CaF2.For the combined figure-of-merit Γ, the largest value is achieved with YLF, YALO, and Al2O3. Thoseare the materials that display the smallest thermal aberrations concurrent with low stress levels.
It is well-known [63], that the thermal rupture modulus Rm is defined by the equations
ˆ
PRexγ
L
˙
“ 8π pMSσfq “ 8π¨RRm (72)
ˆ
PSexγ
L
˙
“ 12π pMSσfq “ 12π¨RSm (73)
where Equation (72) applies to rod amplifiers and Equation (73) to slab amplifiers. PRex and PS
ex arethe maximum average powers, L the crystal length, MS the material parameter previously definedby Equation (13), σf is the fracture stress, and RR
m and RSm are the rupture moduli for rod and slab
amplifiers respectively. The quantity γ is the ratio of heat to inversion density. The fracture stress is inmost cases the stress achieved at the surface of the amplifier, because surfaces are well-known to havefracture stress values that are in most cases only a fraction of what can be achieved in the bulk. Thepresence of defects, inhomogeneities, debris, and cracks induced by polishing on surfaces reduce the
Appl. Sci. 2016, 6, 23 39 of 74
fracture stress; in some cases such cracks and other irregularities can be removed by etching processes.As can be seen from Equations (72) and (73), the maximum extractable average power is achievedwhen the surface stress is equal to the fracture stress. Because the induced stress in a rod or slab crystalis in all cases inversely proportional to the material parameter MS, maximizing it will result in theminimum stresses for any given heat density Q0. Because the stress figure-of-merit ΓS is MS dividedby the constant heat fraction, we see from Equations (72) and (73) that ΓS is then also a measure ofthe average power capability of any laser material. This is simply because maximizing MS results inminimum surface stress, and a small surface stress results in increased average power capability.
In any high average power laser solid-state there is always a tradeoff between wanting to achievemaximum average power whilst at the same time producing the best possible beam quality. These twoconflicting requirements can be addressed in a global sense using figures-of-merit ΓT
w1 and ΓSw2 with
weighing factors p0 ď wi ď 1q that assign no importance (0) or highest importance (1) to the thermal orstress figures-of-merit.
2.7. Spectroscopic, Lasing, Linear and Nonlinear Optical Parameters
Ultrafast laser technology has for many decades been dominated by the laser material Ti:Al2O3,although other wide-bandwidth materials such as laser dyes, Nd:Glass, Yb:Glass, Cr:BeAl2O4
(Alexandrite), Cr:LiSAF, Cr:LiCAF, and Cr:Mg2SiO4 (Forsterite) have all played a significant rolein the development of ultrafast sources. In the past two decades fiber laser ultrafast sources havecome to the fore as well. In this paper, we are interested in exploring the development of ultrafastlasers with both high peak and high average power. The rapid development in the past 15 years ofYb-based ultrafast sources, and the further development of Ti:Al2O3 lasers both seem destined to fillthe performance gap between previous ultrafast sources that demonstrated very high peak powers,but in general also very low average powers, and those that are required in the modern era. Thealmost concurrent development of cryogenic laser technology and the development of new Yb ultrafastsources heralds the development of a new generation of laser devices that will make possible excitingadvancements in a number of scientific fields.
2.7.1. Spectroscopic and Lasing Parameters
Cryogenic cooling is not just limited to just mitigating thermal effects in solid-state laser media.Laser kinetics and spectroscopy, as well as many important laser parameters are enhanced as well. Ofall the rare-earth and transition-metal lasing ions that have been investigated, Yb3+ is of particularinterest. Because of the inefficiency of flashlamp pumping, the development of Yb lasers was delayeduntil the introduction of laser diode pump sources. Yb based lasers are free of the efficiency limitingprocesses of concentration quenching, excited-state absorption, and upconversion that plague manyother solid-state lasers. Figure 33 shows a typical Yb energy level configuration, in this case for thenewer laser material Yb:Lu2O3. Yb has only two manifolds, identified as the ground state manifold2F7/2, and an 2F5/2 excited state manifold. Most Yb laser have laser transitions near 1029 nm ((1,1) to(0,3) transition), with some also lasing near 1080 nm ((1,1) to (0,4)) transition. The spectral absorptionof Yb baser materials all display bands in the pump regions located near 940 nm, correspondingto the (0,1) to (1,2) transition, and the zero-phonon line absorption near 976 nm from the (0,1) to(1,1) transition.
Diode-pumping Yb:YAG near 940 nm can be accomplished using commercially available diodearrays and leads to a small heat fraction of about 9%, whilst pumping near 976 nm results in a verysmall heat fraction of < about 5%. Some laser materials like Yb:YAG have such narrow linewidths at969 nm that they cannot be efficiently pumped at cryogenic temperatures [3]. The recent developmentof narrow-band Volume Bragg Grating (VBG) diode pump sources at 976 nm does however allow thepumping of the zero-phonon line for some laser materials at room temperature and broader band Ybmaterials at cryogenic temperatures. It is a significant advantage of Yb laser materials that they display
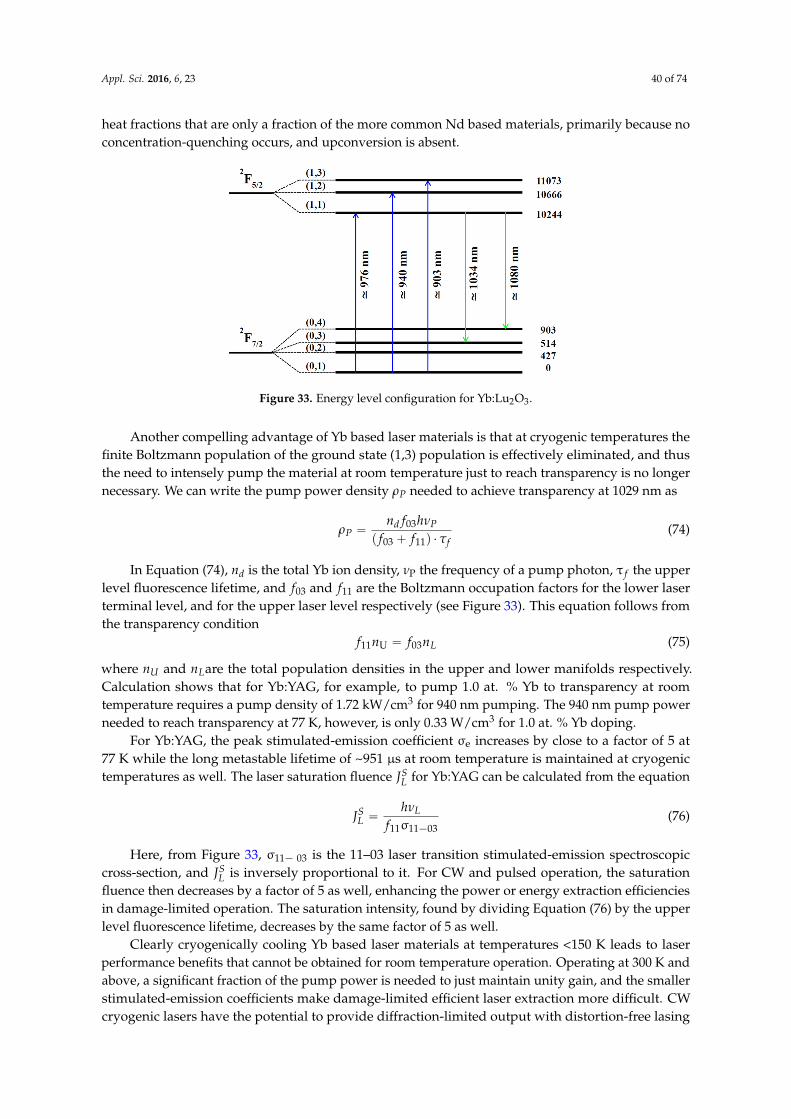
Appl. Sci. 2016, 6, 23 40 of 74
heat fractions that are only a fraction of the more common Nd based materials, primarily because noconcentration-quenching occurs, and upconversion is absent.Appl. Sci. 2016, 6, 23 39 of 73
Figure 33. Energy level configuration for Yb:Lu2O3.
Diode-pumping Yb:YAG near 940 nm can be accomplished using commercially available diode arrays and leads to a small heat fraction of about 9%, whilst pumping near 976 nm results in a very small heat fraction of < about 5%. Some laser materials like Yb:YAG have such narrow linewidths at 969 nm that they cannot be efficiently pumped at cryogenic temperatures [3]. The recent development of narrow-band Volume Bragg Grating (VBG) diode pump sources at 976 nm does however allow the pumping of the zero-phonon line for some laser materials at room temperature and broader band Yb materials at cryogenic temperatures. It is a significant advantage of Yb laser materials that they display heat fractions that are only a fraction of the more common Nd based materials, primarily because no concentration-quenching occurs, and upconversion is absent.
Another compelling advantage of Yb based laser materials is that at cryogenic temperatures the finite Boltzmann population of the ground state (1,3) population is effectively eliminated, and thus the need to intensely pump the material at room temperature just to reach transparency is no longer necessary. We can write the pump power density needed to achieve transparency at 1029 nm as = ( + ) ∙ (74)
In Equation (74), is the total Yb ion density, the frequency of a pump photon, τ the upper level fluorescence lifetime, and and are the Boltzmann occupation factors for the lower laser terminal level, and for the upper laser level respectively (see Figure 33). This equation follows from the transparency condition = (75)
where and are the total population densities in the upper and lower manifolds respectively. Calculation shows that for Yb:YAG, for example, to pump 1.0 at. % Yb to transparency at room temperature requires a pump density of 1.72 kW/cm3 for 940 nm pumping. The 940 nm pump power needed to reach transparency at 77 K, however, is only 0.33 W/cm3 for 1.0 at. % Yb doping.
For Yb:YAG, the peak stimulated-emission coefficient σ increases by close to a factor of 5 at 77 K while the long metastable lifetime of ~951 µs at room temperature is maintained at cryogenic temperatures as well. The laser saturation fluence for Yb:YAG can be calculated from the equation = σ (76)
Here, from Figure 33, σ is the 11–03 laser transition stimulated-emission spectroscopic cross-section, and is inversely proportional to it. For CW and pulsed operation, the saturation fluence then decreases by a factor of 5 as well, enhancing the power or energy extraction efficiencies
Figure 33. Energy level configuration for Yb:Lu2O3.
Another compelling advantage of Yb based laser materials is that at cryogenic temperatures thefinite Boltzmann population of the ground state (1,3) population is effectively eliminated, and thusthe need to intensely pump the material at room temperature just to reach transparency is no longernecessary. We can write the pump power density ρP needed to achieve transparency at 1029 nm as
ρP “nd f03hνP
p f03 ` f11q ¨ τf(74)
In Equation (74), nd is the total Yb ion density, νP the frequency of a pump photon, τ f the upperlevel fluorescence lifetime, and f03 and f11 are the Boltzmann occupation factors for the lower laserterminal level, and for the upper laser level respectively (see Figure 33). This equation follows fromthe transparency condition
f11nU “ f03nL (75)
where nU and nLare the total population densities in the upper and lower manifolds respectively.Calculation shows that for Yb:YAG, for example, to pump 1.0 at. % Yb to transparency at roomtemperature requires a pump density of 1.72 kW/cm3 for 940 nm pumping. The 940 nm pump powerneeded to reach transparency at 77 K, however, is only 0.33 W/cm3 for 1.0 at. % Yb doping.
For Yb:YAG, the peak stimulated-emission coefficient σe increases by close to a factor of 5 at77 K while the long metastable lifetime of ~951 µs at room temperature is maintained at cryogenictemperatures as well. The laser saturation fluence JS
L for Yb:YAG can be calculated from the equation
JSL “
hνLf11σ11´03
(76)
Here, from Figure 33, σ11´ 03 is the 11–03 laser transition stimulated-emission spectroscopiccross-section, and JS
L is inversely proportional to it. For CW and pulsed operation, the saturationfluence then decreases by a factor of 5 as well, enhancing the power or energy extraction efficienciesin damage-limited operation. The saturation intensity, found by dividing Equation (76) by the upperlevel fluorescence lifetime, decreases by the same factor of 5 as well.
Clearly cryogenically cooling Yb based laser materials at temperatures <150 K leads to laserperformance benefits that cannot be obtained for room temperature operation. Operating at 300 K andabove, a significant fraction of the pump power is needed to just maintain unity gain, and the smallerstimulated-emission coefficients make damage-limited efficient laser extraction more difficult. CWcryogenic lasers have the potential to provide diffraction-limited output with distortion-free lasing

Appl. Sci. 2016, 6, 23 41 of 74
elements and with a high wallplug efficiency (laser output average power divided by electrical inputpower to the diode arrays ,greater than 30% using a typical demonstrated optical-optical efficiencyof 55% and a typical 55% efficiency for laser diode sources. As diode laser efficiencies continue toincrease with time, perhaps to greater than 80%, and CW optical-optical efficiencies are improved to ashigh as 85%, Yb laser wallplug efficiencies may eventually exceed 70%. These efficiency estimates donot of course include any ancillary equipment need to operate the laser.
There are other benefits that accrue from cryogenic cooling. The absorption cross-section forYb:YAG at the primary pump wavelength of 941 nm increases by over a factor of two. At 77 K, thedoping density can be reduced by about the same factor to achieve the same absorption. Anotherimportant feature of the absorption spectrum at 77 K is that the absorption bandwidth around941 nm narrows but still remains very broad. Similar absorption improvements are obtained inother Yb laser materials as well. This is important because the same diode arrays used to pump atroom temperature will work well at 77 K. Lower density, less expensive diode pump sources can alsobe used at 77 K for some pumping configurations because a large pump power density is not neededto reach transparency. Another benefit is that the use of end-caps to suppress the strain-distortion atthe ends of rod amplifiers can be in most cases be eliminated.
2.7.2. Linear and Nonlinear Optical Parameters
The use of cryogenic laser technology to enable the development of advanced laser systemsthat have both high peak and high average with excellent beam-quality is an approach that hasnow been proven. So far in this paper we have outlined the many reasons to seriously consider thecryogenic-cooling approach, and have reviewed many of the relevant materials parameters and theirdependence on temperature. The path to high-average-power lasers is now well-mapped, however,with regard to ultrafast operation we have just begun to develop the technology because many ofthe relevant ultrafast parameters for low temperature operation are not known and the database ofsuch properties is at present very limited. The design of ultrafast laser systems requires a detailedknowledge of both the nonlinear optical properties of laser crystals as well as other optical materialsused in constructing such systems, and in addition demands a detailed knowledge of the dispersionproperties as well. For ultrafast operation, a detailed knowledge of the linear and nonlinear indicesof refraction are needed to accomplish competent designs. It is fortunate that for most of the lasermaterials discussed here, good Sellmeier equations are available in the literature, and are discussedlater in this paper, but readers should appreciate that at the present time most reported measurementsof the index of refraction and available Sellmeier equations are at or near room temperature. Sellmeier(or Cauchy or Laurent equations) are used to calculate the first, second, third, and fourth-orderdispersion parameters needed to achieve dispersion compensation and balancing in ultrafast lasersystems, and unfortunately relatively few measurements can be found at cryogenic temperatures.Similarly, the values of the nonlinear index of refraction n2 for various crystals and optical materialsare well-known only at room temperature.
For ultrafast laser systems with pulsewidths down to the picosecond regime, nonlinear effectssuch as self-phase-modulation and self-focusing are the principal concerns, and dispersion effects canbe mostly ignored. Below about 5–10 ps, however both nonlinear and dispersion effects must be takeninto account to enable good ultrafast designs. Here we first consider just nonlinear effects, and thelimitations they place on ultrafast system performance.
Nonlinear Effects in Ultrafast Lasers
Other than laser-induced optical damage, a subject that we shall discuss in Section 2.7.3, themajor performance-limiting factor affecting ultrafast performance in solid-state laser systems is theexistence of a finite nonlinear index of refraction n2. Much of the early work on inertial-confinementfusion involved the use of flashlamp-pumped laser glasses doped with Nd, driven by picosecondduration Nd:YLF mode-locked oscillators with typical FWHM pulse durations in the range 50–200 ps.

Appl. Sci. 2016, 6, 23 42 of 74
When scaling such systems to ever larger energy/pulse and peak powers, it was discovered thatwhole-beam and small-scale self-focusing, caused by the nonlinear index, were the principal limitingfactors, and managing and reducing such effects was a major design goal. Good summaries of theunderstanding and design tools used to design picosecond high-peak-power laser systems may befound in [37,64]; in addition a very good summary of the most important papers addressing thephenomena of self-focusing and the design and performance of such systems may be found in [65]. Itshould be pointed out that in those early systems dispersion management was not a significant designissue and CPA was just in its infancy.
For a laser pule traveling through a nonlinear medium, a finite nonlinear index leads to thetemporal phenomena of self-phase-modulation, resulting in a temporally dependent phase modulation.Spatial phase modulation can lead to whole-beam and small-scale self-focusing [37,64]. In general thethreshold for the formation of small-scale-self-focusing is significantly lower than that for whole-beamself-focusing. Small-scale self-focusing is caused by either phase or amplitude perturbations of a laserbeam, due to dust particles, index inhomogeneities or inclusions. Such perturbations lead to localizedself-focusing, resulting ultimately in self-trapped filaments that leave permanent “angel hair” tracksin the laser media. Another source of self-focused filaments is diffraction from hard apertures in thelaser system, principally from the edges of laser amplifiers. If uncontrolled, small-scale-self-focusingcan lead to a large fraction of the system output beam being lost to large-angle scattering in a halosurrounding the main laser beam. While we will not review in detail the methods for suppressingsmall-scale-self-focusing in this article, we mention that the imaging of apodized laser beams, the useof vacuum spatial filters, and relay-imaging throughout the entire laser system have been found tobe effective tools [37]. Today, the use of the chirped-pulse-amplification (CPA) technique, invented atThe Laboratory For Laser Energetics at the University of Rochester by Strickland and Mourou [66],in which ultrafast pulses are spectrally stretched to a much longer pulsewidth for amplification, andthen re-compressed at the system output, can be used to largely avoid nonlinear effects as well as takeadvantage of a higher damage threshold obtained as pulsewidth increases. Calculating in advance thesusceptibility of an ultrafast system to nonlinear and damage effects is an important part of ultrafastlaser system design, and here we discuss the standard method for doing so.
To manage whole beam and small-scale self-focusing in high peak power laser ultrafast systems, aknowledge of the nonlinear index n2 and the corresponding nonlinear coefficient γN is essential.A standard and often-used measure of the severity of nonlinear effects in laser systems is theB-integral [37,64], formally defined as
B pr, z, tq “ ∆ϕNL pr, z, tq “2π
λ¨
ż
γN I pr, z, tq dz (77)
where B is in general a function of the beam radius r, propagation location z, and time t, I(r,z,t) isthe radially, longitudinally, and temporally varying laser intensity, the wavelength λ, and z is thepropagation length parameter. The B-integral is the nonlinear phase accumulation ∆ϕNL pr, z, tq dueto the nonlinear index n2, and in laser systems must be calculated for all optical and gain elementsencountered by the propagating beam. It is customary to calculate the maximum value of the B-integralwhere the intensity I is maximum (t = 0). For spatially Gaussian beams, the B-integral value at thebeam edge is typically very small, and only the on-axis value for r = 0 is normally specified. Thesame holds true for higher-order super-Gaussian beams where the intensity at the beam edge becomesinsignificant. For any arbitrary spatial beam profile, is easy to use Equation (72) in a computer codeand calculate the B-integral profile at any location in a laser amplifier or system. The nonlinear indexcan be calculated using the relationship [37,64]
n2 “12π2
n02c¨χp3q (78)
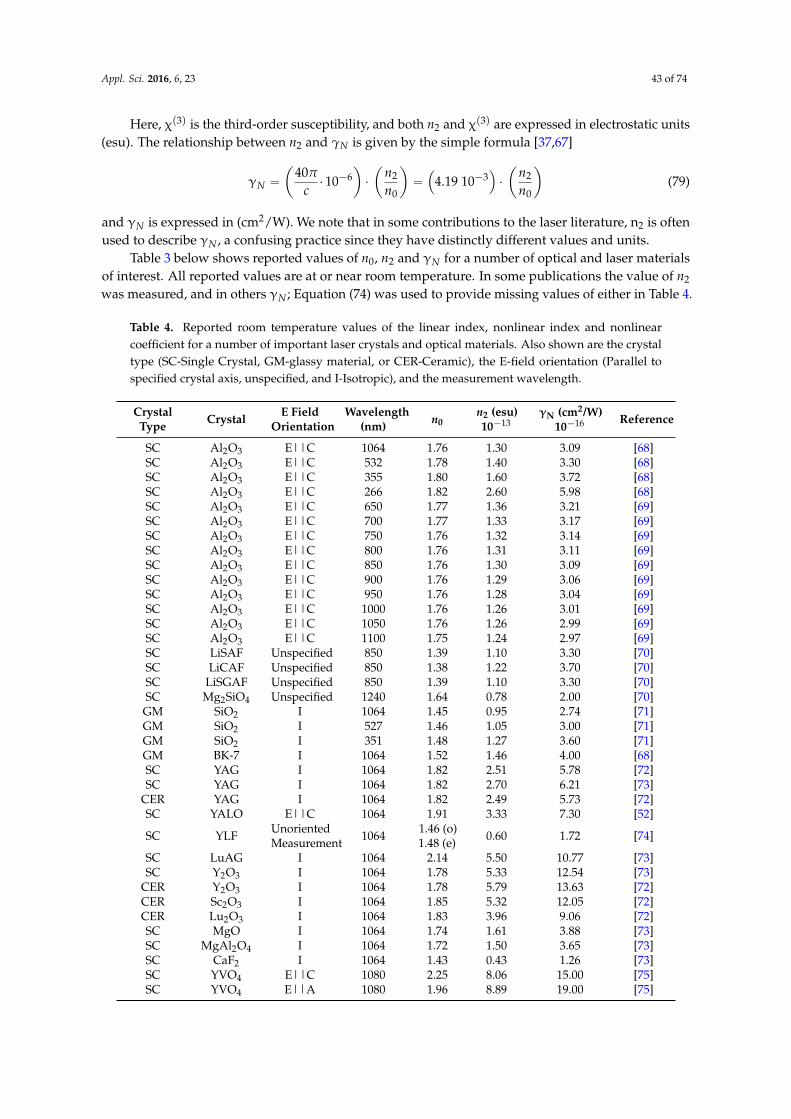
Appl. Sci. 2016, 6, 23 43 of 74
Here, χp3q is the third-order susceptibility, and both n2 and χp3q are expressed in electrostatic units(esu). The relationship between n2 and γN is given by the simple formula [37,67]
γN “
ˆ
40π
c¨ 10´6
˙
¨
ˆ
n2
n0
˙
“
´
4.19 10´3¯
¨
ˆ
n2
n0
˙
(79)
and γN is expressed in (cm2/W). We note that in some contributions to the laser literature, n2 is oftenused to describe γN , a confusing practice since they have distinctly different values and units.
Table 3 below shows reported values of n0, n2 and γN for a number of optical and laser materialsof interest. All reported values are at or near room temperature. In some publications the value of n2
was measured, and in others γN ; Equation (74) was used to provide missing values of either in Table 4.
Table 4. Reported room temperature values of the linear index, nonlinear index and nonlinearcoefficient for a number of important laser crystals and optical materials. Also shown are the crystaltype (SC-Single Crystal, GM-glassy material, or CER-Ceramic), the E-field orientation (Parallel tospecified crystal axis, unspecified, and I-Isotropic), and the measurement wavelength.
CrystalType Crystal E Field
OrientationWavelength
(nm) n0n2 (esu)10´13
γN (cm2/W)10´16 Reference
SC Al2O3 E||C 1064 1.76 1.30 3.09 [68]SC Al2O3 E||C 532 1.78 1.40 3.30 [68]SC Al2O3 E||C 355 1.80 1.60 3.72 [68]SC Al2O3 E||C 266 1.82 2.60 5.98 [68]SC Al2O3 E||C 650 1.77 1.36 3.21 [69]SC Al2O3 E||C 700 1.77 1.33 3.17 [69]SC Al2O3 E||C 750 1.76 1.32 3.14 [69]SC Al2O3 E||C 800 1.76 1.31 3.11 [69]SC Al2O3 E||C 850 1.76 1.30 3.09 [69]SC Al2O3 E||C 900 1.76 1.29 3.06 [69]SC Al2O3 E||C 950 1.76 1.28 3.04 [69]SC Al2O3 E||C 1000 1.76 1.26 3.01 [69]SC Al2O3 E||C 1050 1.76 1.26 2.99 [69]SC Al2O3 E||C 1100 1.75 1.24 2.97 [69]SC LiSAF Unspecified 850 1.39 1.10 3.30 [70]SC LiCAF Unspecified 850 1.38 1.22 3.70 [70]SC LiSGAF Unspecified 850 1.39 1.10 3.30 [70]SC Mg2SiO4 Unspecified 1240 1.64 0.78 2.00 [70]GM SiO2 I 1064 1.45 0.95 2.74 [71]GM SiO2 I 527 1.46 1.05 3.00 [71]GM SiO2 I 351 1.48 1.27 3.60 [71]GM BK-7 I 1064 1.52 1.46 4.00 [68]SC YAG I 1064 1.82 2.51 5.78 [72]SC YAG I 1064 1.82 2.70 6.21 [73]
CER YAG I 1064 1.82 2.49 5.73 [72]SC YALO E||C 1064 1.91 3.33 7.30 [52]
SC YLF UnorientedMeasurement 1064 1.46 (o)
1.48 (e) 0.60 1.72 [74]
SC LuAG I 1064 2.14 5.50 10.77 [73]SC Y2O3 I 1064 1.78 5.33 12.54 [73]
CER Y2O3 I 1064 1.78 5.79 13.63 [72]CER Sc2O3 I 1064 1.85 5.32 12.05 [72]CER Lu2O3 I 1064 1.83 3.96 9.06 [72]SC MgO I 1064 1.74 1.61 3.88 [73]SC MgAl2O4 I 1064 1.72 1.50 3.65 [73]SC CaF2 I 1064 1.43 0.43 1.26 [73]SC YVO4 E||C 1080 2.25 8.06 15.00 [75]SC YVO4 E||A 1080 1.96 8.89 19.00 [75]

Appl. Sci. 2016, 6, 23 44 of 74
Table 4. Cont.
CrystalType Crystal E Field
OrientationWavelength
(nm) n0n2 (esu)10´13
γN (cm2/W)10´16 Reference
SC YVO4UnorientedMeasurement 1064 2.06 (1) 10.62 21.60 [76]
SC GdVO4UnorientedMeasurement 1064 2.08 (2) 8.34 16.80 [76]
SC KGW E||Nm 800–1600 1.99 9.50 20.00 [77]SC KGW E||Np 800–1600 2.03 7.27 15.00 [77]SC KYW E||Nm 1080 2.01 4.80 10.00 [75]Gas Air I 400 1 0.00128 0.00536 [78]Gas Air I 800 1 0.00072 0.00301 [78]
(1) , (2): Measurements of γN along c-axis and orthogonal b-axis found to be the same.
Al2O3, LiSAF, LiCAF, LiSGAF, Mg2SiO4, SiO2, YLF, MgO, MgAl2O4, and CaF2 all exhibit rathersmall nonlinear index values in the spectral region 800–1100 nm. YAG, YALO, and LuAG displaysomewhat larger values, while the sesquioxides Y2O3, Sc2O3, and Lu2O3 show a substantial increase,followed by the vanadates YVO4 and GdVO4 and the tungstates KGW and KYW which display thelargest nonlinear index values. A much larger nonlinear index for many commonly mode-lockedmaterials like YVO4, KGW, and KYW makes Kerr lens mode locking easier to achieve, but will providechallenges to suppress nonlinear effects in scaled up ultrafast systems consisting of multiple amplifiers.Minimizing B-integral contributions in ultrafast systems utilizing some of these newer materials willlikely force designers to consider thin lasing elements such as thin-disk lasers for some applications,however, the thinner the lasing element the more troublesome the suppression of parasitics andamplified-spontaneous-emission, so undoubtedly tradeoffs will need to be made. Also, thin lasingelements have low gain as well, and require multi-passing of the element for good extraction, thusincreasing the B-integral and negating any advantage.
The system B-integral, Bsys, obtained by adding up the nonlinear phase contributions from all thelaser and optical elements encountered by a beam, is a useful measure of the susceptibility of a systemto small-scale-self-focusing damage. In general, Bsys values of <1.5 radians are very safe, whereasvalues greater than about 2.5 are very concerning. While these observations are only generally true,minimizing the possibility of system damage due to nonlinear effects is very dependent on systemcleanliness and the avoidance of diffraction effects.
In very short-pulse ultrafast CPA systems such as Ti:Al2O3, the generation of pulsewidths<20–30 fs requires that the accumulation of second, third, and fourth order dispersion phase inthe amplifier portion of the system be compensated, a feat normally accomplished by the use ofcompressors that can be adjusted to cancel out second, third, and fourth order phase. In femtosecondlaser systems the accumulation of nonlinear phase due the B-integral is also an important consideration,and Equation (77) is re-written
B pr, z, tq “ ∆ϕNL pr, z, tq “ 2π¨
żˆ
1λ
˙
γN I pr, z, tq dz (80)
reflecting the fact that temporal nonlinear phase Fourier maps into spectral phase. Because of theresulting nonlinear group delay, reducing the B-integral value to <1 has advantages in that thecompensation of small amounts of nonlinear group delay in the compressor can be achieved.
Dispersion Effects in Ultrafast Lasers
The understanding of dispersion is a very important aspect of ultrafast laser technology,particularly for pulsewidths <about 10 ps, and into the fs and as regimes, and the successfulmanagement of dispersion is prerequisite to the success of ultrafast laser systems. Here, we review thedescription of dispersion and apply the formalism to the calculation of the first, second, third, and
Appl. Sci. 2016, 6, 23 45 of 74
fourth-order dispersion for a number of important laser materials. We first consider the variation ofthe linear index of refraction with wavelength or frequency. If we consider an input pulse if field Ein(t)with spectrum Ain(ω) propagating through a dispersive dielectric crystal, the output pulse can bewritten as the Fourier relationship
Eout ptq “ˆ
12π
˙
¨
ż
Ain pωq eiωteiψpωqdω (81)
ω is the angular frequency, and ψ pωq is the spectral phase at frequency ω. Upon passage througha medium of length L, we can relate the spectral phase to the propagation constant of the mediumβ(ω), through
ψ pωq “ ´β pωq ¨ L (82)
It is commonplace [70] to expand both ψ pωq and β pωq about a central frequency ω0 using aTaylor series approach, resulting in
ψ pωq “ ψ pω0q `Bψ
Bω¨ pω´ω0q `
12B2ψ
Bω2 ¨ pω´ω0q2`
16B3ψ
Bω3 ¨ pω´ω0q3` . . . (83)
or,
ψ pωq “ ψ pω0q `ψ1¨ pω´ω0q `12ψ2¨ pω´ω0q
2`
16ψ3¨ pω´ω0q
3` . . . (84)
β(ω) is then given by
β pωq “ β pω0q `β1¨ pω´ω0q `12β2¨ pω´ω0q
2`
16β3¨ pω´ω0q
3` . . . (85)
and we write in general
ψn “Bnψ
Bωn , βn “Bnβ
Bωn (86)
The derivatives are evaluated atω “ ω0, and we also have
ψn “ ´ βn¨ L (87)
β(ω) can also be expressed as
β pωq “ω n pωq
c(88)
where c is the speed of light. Using Equation (88) we can then calculate the dispersion parameters βi as
β1 “dβdω
“ n pωq `ωdndω
(89)
β2 “d2β
dω2 “ 2dndω
`ωd2ndω2 (90)
β3 “d3β
dω3 “ 3d2ndω2 `ω
d3ndω3 (91)
β3 “d3β
dω3 “ 4d3ndω3 `ω
d4ndω4 (92)
Most index of refraction dispersion equations are expressed in terms of wavelength, rather thanangular frequency. The most common dispersion equation used is the Sellmeier equation, often writtenin its’ most general form as
n pλq2 “ A0 `ÿ
i
Aiλ2
´
λ2 ´ λ2i
¯ (93)
Appl. Sci. 2016, 6, 23 46 of 74
Here n is the wavelength dependent index of refraction, and A0, Ai and λi are fitting constants. Inmany cases A0 “ 1, and i is usually ď 4. Another equation often found in the literature is the Laurentseries formula,
n pλq2 “ A` B¨ λ2 `ÿ
i
Ci
λ2i (94)
where A, B, and Ci are constants, and the index i takes the values 1, 2, 3, and 4. The Cauchy equation isalso often used, which may be obtained by setting B = 0 in Equation (94). For the calculations reportedbelow in this paper, the appropriate index equation was converted to angular frequency, resulting inthe following frequency dependent Sellmeier equation:
n pωq2 “ A0 `ÿ
i
Aiωi2
`
ωi2 ´ω2
˘ (95)
Table 5 shows calculated values of the index of refraction, the wavelength the values werecalculated at, and the first, second, third, and fourth order dispersion coefficients. In addition,references are provided to allow interested readers to know what form of the index equation wasused, as well as the values of the constants. We have included crystals and optical materials oftenused in ultrafast lasers, including Ti:Al2O3, Cr:LiSAF, Cr:LiCAF, and a number of Yb laser materials.Some entries in Table 5 have also served as a check on the calculational accuracy. For example, forBK-7 at 800 nm and fused silica (SiO2) at 800 nm, the calculated dispersion parameter values agreeclosely with previously published results [32]. For Ti:Al2O3, the dispersion parameters were calculatedfor a Sellmeier equation used for sapphire grown using the heat exchanger method (HEM) [79],and are similar to previously published results [32], but a one-to-one comparison cannot be madebecause the data and Sellmeier equations used in [32] were not revealed. The variation of the index ofrefraction with wavelength can also be slightly different depending upon the crystal growth method,and the corresponding Sellmeier equations will be somewhat different as well, and it is likely thatsuch differences explain the variation between our calculations and [32]. We have included in Table 5not only legacy materials like LiSAF, LiCAF, YAG, YALO, and YLF, but also the newer sesquioxidelaser materials Y2O3, Sc2O3, and Lu2O3, and the tungstate materials KGW, KYW, and KYbW. One casedeserves mentioning here: that of Cr:LiSAF. We found published values for the second (21.0 fs2/mm)and third-order (185.0 fs3/mm) dispersion coefficients for the e-axis [70] that do not agree well withour results, nor with those found elsewhere [80]. Values in [70] were calculated using the Sellmeierequations of [81]. We calculated β2 and β3 using both the Sellmeier equations of Peterson [81] andPayne [82]. While both Sellmeier equations differ substantially from the measured values, the dataof Peterson [81] gave the worst agreement, so in Table 5 we show our calculated values (7.9 fs2/mm)and (15.7 fs3/mm) obtained using the Payne Sellmeier equation. It has been noted however [80], thateven the Payne Sellmeier equations give results considerably different from the measured results. Inaddition, our results differ from the calculated results of [80], where the reported calculated valuesusing the same Sellmeier equation are (9.7 fs2/mm) and (28.6 fs3/mm). While we have endeavoredto calculate accurate values for the dispersion parameters reported in Table 5, and have checked andcompared our results to other values found in the literature where available, readers should be awarethat coding long and tedious Sellmeier, Cauchy, Laurent, and other equations and their derivatives upto the fourth order may lead to some inadvertent errors being present.
We conclude this section of the paper by again pointing out that all of the Sellmeier equationsand calculated values for the dispersion parameters are for room-temperature operation. It is nowwell-known that the value of the index of refraction at room temperature are diminished at lower(cryogenic) temperatures by the thermo-optic coefficient dn/dT. Calculation shows that if the changein index of refraction for YAG for example by integrating the thermo-optic coefficient over the range300 to 100 K, the index value at 300 K is affected in the third decimal place. For a variation of theindex in the third decimal place, the Sellmeier equation will change as well, and thus will all of the
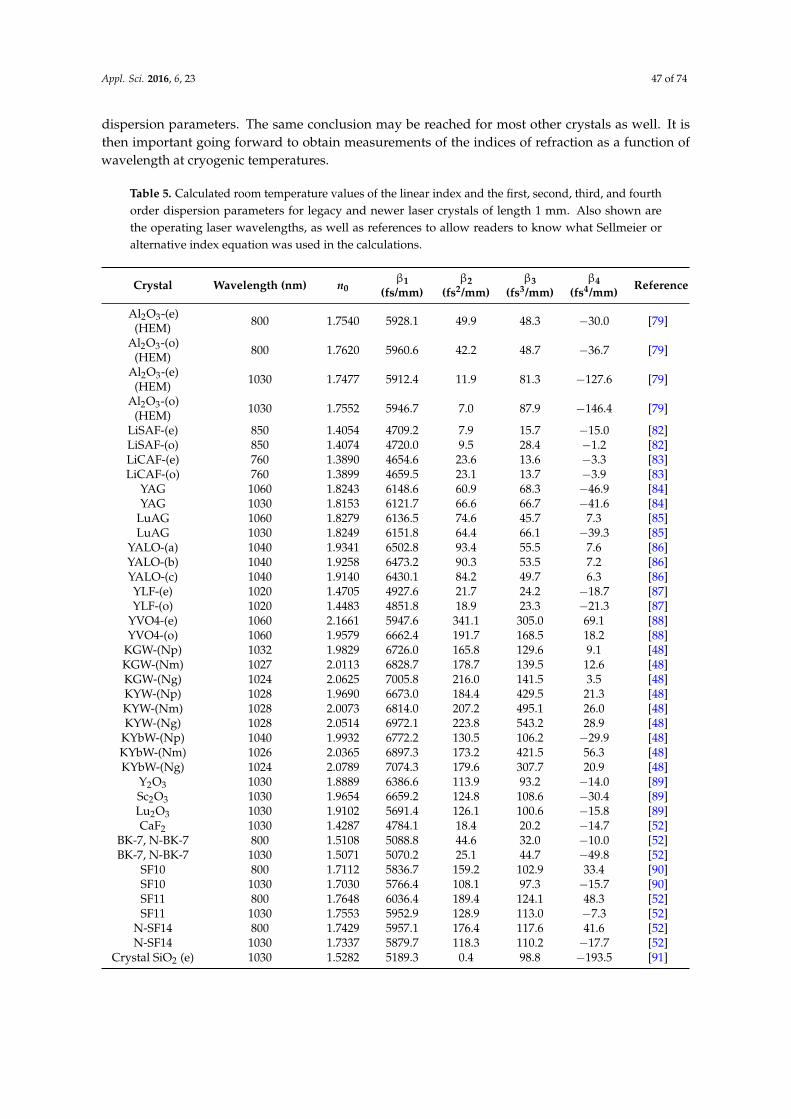
Appl. Sci. 2016, 6, 23 47 of 74
dispersion parameters. The same conclusion may be reached for most other crystals as well. It isthen important going forward to obtain measurements of the indices of refraction as a function ofwavelength at cryogenic temperatures.
Table 5. Calculated room temperature values of the linear index and the first, second, third, and fourthorder dispersion parameters for legacy and newer laser crystals of length 1 mm. Also shown arethe operating laser wavelengths, as well as references to allow readers to know what Sellmeier oralternative index equation was used in the calculations.
Crystal Wavelength (nm) n0β1
(fs/mm)β2
(fs2/mm)β3
(fs3/mm)β4
(fs4/mm) Reference
Al2O3-(e)(HEM) 800 1.7540 5928.1 49.9 48.3 ´30.0 [79]
Al2O3-(o)(HEM) 800 1.7620 5960.6 42.2 48.7 ´36.7 [79]
Al2O3-(e)(HEM) 1030 1.7477 5912.4 11.9 81.3 ´127.6 [79]
Al2O3-(o)(HEM) 1030 1.7552 5946.7 7.0 87.9 ´146.4 [79]
LiSAF-(e) 850 1.4054 4709.2 7.9 15.7 ´15.0 [82]LiSAF-(o) 850 1.4074 4720.0 9.5 28.4 ´1.2 [82]LiCAF-(e) 760 1.3890 4654.6 23.6 13.6 ´3.3 [83]LiCAF-(o) 760 1.3899 4659.5 23.1 13.7 ´3.9 [83]
YAG 1060 1.8243 6148.6 60.9 68.3 ´46.9 [84]YAG 1030 1.8153 6121.7 66.6 66.7 ´41.6 [84]
LuAG 1060 1.8279 6136.5 74.6 45.7 7.3 [85]LuAG 1030 1.8249 6151.8 64.4 66.1 ´39.3 [85]
YALO-(a) 1040 1.9341 6502.8 93.4 55.5 7.6 [86]YALO-(b) 1040 1.9258 6473.2 90.3 53.5 7.2 [86]YALO-(c) 1040 1.9140 6430.1 84.2 49.7 6.3 [86]YLF-(e) 1020 1.4705 4927.6 21.7 24.2 ´18.7 [87]YLF-(o) 1020 1.4483 4851.8 18.9 23.3 ´21.3 [87]
YVO4-(e) 1060 2.1661 5947.6 341.1 305.0 69.1 [88]YVO4-(o) 1060 1.9579 6662.4 191.7 168.5 18.2 [88]
KGW-(Np) 1032 1.9829 6726.0 165.8 129.6 9.1 [48]KGW-(Nm) 1027 2.0113 6828.7 178.7 139.5 12.6 [48]KGW-(Ng) 1024 2.0625 7005.8 216.0 141.5 3.5 [48]KYW-(Np) 1028 1.9690 6673.0 184.4 429.5 21.3 [48]KYW-(Nm) 1028 2.0073 6814.0 207.2 495.1 26.0 [48]KYW-(Ng) 1028 2.0514 6972.1 223.8 543.2 28.9 [48]
KYbW-(Np) 1040 1.9932 6772.2 130.5 106.2 ´29.9 [48]KYbW-(Nm) 1026 2.0365 6897.3 173.2 421.5 56.3 [48]KYbW-(Ng) 1024 2.0789 7074.3 179.6 307.7 20.9 [48]
Y2O3 1030 1.8889 6386.6 113.9 93.2 ´14.0 [89]Sc2O3 1030 1.9654 6659.2 124.8 108.6 ´30.4 [89]Lu2O3 1030 1.9102 5691.4 126.1 100.6 ´15.8 [89]CaF2 1030 1.4287 4784.1 18.4 20.2 ´14.7 [52]
BK-7, N-BK-7 800 1.5108 5088.8 44.6 32.0 ´10.0 [52]BK-7, N-BK-7 1030 1.5071 5070.2 25.1 44.7 ´49.8 [52]
SF10 800 1.7112 5836.7 159.2 102.9 33.4 [90]SF10 1030 1.7030 5766.4 108.1 97.3 ´15.7 [90]SF11 800 1.7648 6036.4 189.4 124.1 48.3 [52]SF11 1030 1.7553 5952.9 128.9 113.0 ´7.3 [52]
N-SF14 800 1.7429 5957.1 176.4 117.6 41.6 [52]N-SF14 1030 1.7337 5879.7 118.3 110.2 ´17.7 [52]
Crystal SiO2 (e) 1030 1.5282 5189.3 0.4 98.8 ´193.5 [91]
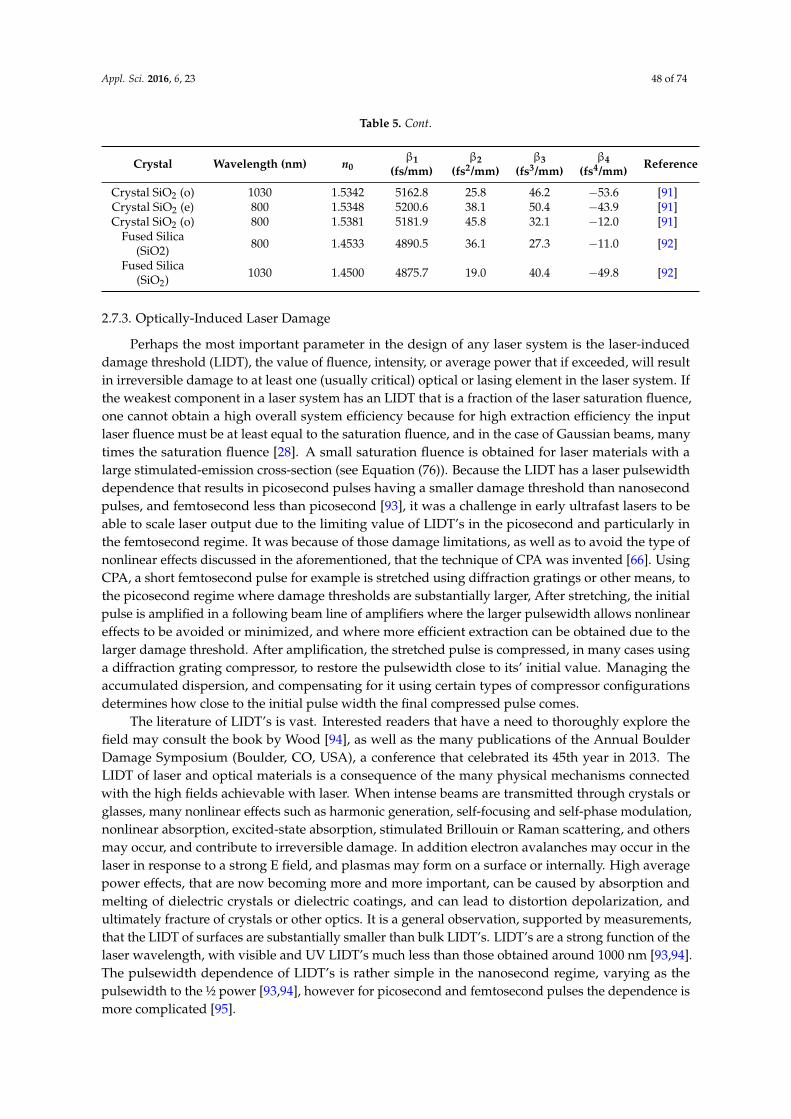
Appl. Sci. 2016, 6, 23 48 of 74
Table 5. Cont.
Crystal Wavelength (nm) n0β1
(fs/mm)β2
(fs2/mm)β3
(fs3/mm)β4
(fs4/mm) Reference
Crystal SiO2 (o) 1030 1.5342 5162.8 25.8 46.2 ´53.6 [91]Crystal SiO2 (e) 800 1.5348 5200.6 38.1 50.4 ´43.9 [91]Crystal SiO2 (o) 800 1.5381 5181.9 45.8 32.1 ´12.0 [91]
Fused Silica(SiO2) 800 1.4533 4890.5 36.1 27.3 ´11.0 [92]
Fused Silica(SiO2) 1030 1.4500 4875.7 19.0 40.4 ´49.8 [92]
2.7.3. Optically-Induced Laser Damage
Perhaps the most important parameter in the design of any laser system is the laser-induceddamage threshold (LIDT), the value of fluence, intensity, or average power that if exceeded, will resultin irreversible damage to at least one (usually critical) optical or lasing element in the laser system. Ifthe weakest component in a laser system has an LIDT that is a fraction of the laser saturation fluence,one cannot obtain a high overall system efficiency because for high extraction efficiency the inputlaser fluence must be at least equal to the saturation fluence, and in the case of Gaussian beams, manytimes the saturation fluence [28]. A small saturation fluence is obtained for laser materials with alarge stimulated-emission cross-section (see Equation (76)). Because the LIDT has a laser pulsewidthdependence that results in picosecond pulses having a smaller damage threshold than nanosecondpulses, and femtosecond less than picosecond [93], it was a challenge in early ultrafast lasers to beable to scale laser output due to the limiting value of LIDT’s in the picosecond and particularly inthe femtosecond regime. It was because of those damage limitations, as well as to avoid the type ofnonlinear effects discussed in the aforementioned, that the technique of CPA was invented [66]. UsingCPA, a short femtosecond pulse for example is stretched using diffraction gratings or other means, tothe picosecond regime where damage thresholds are substantially larger, After stretching, the initialpulse is amplified in a following beam line of amplifiers where the larger pulsewidth allows nonlineareffects to be avoided or minimized, and where more efficient extraction can be obtained due to thelarger damage threshold. After amplification, the stretched pulse is compressed, in many cases usinga diffraction grating compressor, to restore the pulsewidth close to its’ initial value. Managing theaccumulated dispersion, and compensating for it using certain types of compressor configurationsdetermines how close to the initial pulse width the final compressed pulse comes.
The literature of LIDT’s is vast. Interested readers that have a need to thoroughly explore thefield may consult the book by Wood [94], as well as the many publications of the Annual BoulderDamage Symposium (Boulder, CO, USA), a conference that celebrated its 45th year in 2013. TheLIDT of laser and optical materials is a consequence of the many physical mechanisms connectedwith the high fields achievable with laser. When intense beams are transmitted through crystals orglasses, many nonlinear effects such as harmonic generation, self-focusing and self-phase modulation,nonlinear absorption, excited-state absorption, stimulated Brillouin or Raman scattering, and othersmay occur, and contribute to irreversible damage. In addition electron avalanches may occur in thelaser in response to a strong E field, and plasmas may form on a surface or internally. High averagepower effects, that are now becoming more and more important, can be caused by absorption andmelting of dielectric crystals or dielectric coatings, and can lead to distortion depolarization, andultimately fracture of crystals or other optics. It is a general observation, supported by measurements,that the LIDT of surfaces are substantially smaller than bulk LIDT’s. LIDT’s are a strong function of thelaser wavelength, with visible and UV LIDT’s much less than those obtained around 1000 nm [93,94].The pulsewidth dependence of LIDT’s is rather simple in the nanosecond regime, varying as thepulsewidth to the ½ power [93,94], however for picosecond and femtosecond pulses the dependence ismore complicated [95].
Appl. Sci. 2016, 6, 23 49 of 74
It is a shortcoming of the present state-of-the-art that high average power effects have received farless attention than high peak power effects. Now that we are witnessing the advent of laser systemsthat have concurrent high and peak average powers, much attention will be focused in the nearfuture on determining the LIDT’s of laser crystals and optics under very extreme conditions. LIDT’sat low temperature are scarce and in most cases have not been measured. Recently a publicationreported a reduced damage threshold at cryogenic temperatures relative to the room temperaturevalue [96]. This in contrast to a number of publications that have reported increased damage thresholdsat cryogenic temperatures [97–99]. Increased laser damage threshold measurement efforts at cryogenictemperatures are needed to further our understanding of the design of cryogenic laser devices and toincrease our knowledge of the scaling of the damage threshold with temperature.
2.7.4. Spectral and Laser Properties of Traditional and New Laser Materials
The design and performance of ultrafast lasers is critically dependent upon the spectral and laserproperties of the amplifier materials used. We have already, in the aforementioned, discussed theimportant nonlinear parameters and the dispersion parameters needed to optimize the performanceof ultrafast lasers. Here, we review the spectral properties of a number of important laser materials,including a number of legacy ultrafast materials as well as some newer laser materials, all based uponthe Yb3+ lasing ion. A more complete compilation of properties for most Yb based laser materials willbe presented elsewhere [100]; here we show only Yb materials for which both room and cryogenictemperature data are available. Table 6 shows the laser material, the crystal classification (anaxial (A)and uniaxial (U)), the absorption span δλabs (FWHM) and wavelength of peak absorption λP
abs, theabsorption bandwidth ∆λabs (FWHM), peak absorption cross-section σP
abs, the wavelength of the peakstimulated-emission cross-section λP
em, the emission bandwidth ∆λem (FWHM), the value of the peakstimulated-emission cross-section σP
em, the upper level (2F5/2) fluorescence lifetime τF, the absolutetemperature, and the references from whence the data were taken [3,6,30,101–110].
The three legacy laser materials shown, Ti:Al2O3, Cr:LiSAF, and Cr:LiCAF, are uniaxial and weshow data for the cases E||c and E||a, and at room temperature. While Ti:Al2O3 is often cooled tonear 77 K to reduce thermal aberrations [31,33–35], little data is available in the literature regardingthe spectral properties at that temperature. For Cr:LiSAF and Cr:LiCAF, we were not able to findany cryogenic data available in the literature. The bandwidths for these materials indicate that fortransform-limited Gaussian pulses, pulsewidths of as short as 4, 6, and 7 fs can be achieved, in theabsence of gain-narrowing.
For the Yb materials Yb:CaF2, Yb:LuAG, Yb:YAG, and Yb:YLF, complete sets of spectralparameters are available at room temperature and near 77 K, and both are shown in Table 6. Wehave also included the recently developed sesquioxide laser materials Yb:Lu2O3, Yb:Sc2O3, andYb:Y2O3, but complete data sets are available at present only at 300 K. The first Yb laser material to beinvestigated at cryogenic temperature was Yb:YAG [1], but the emission bandwidth is narrow and onlycapable of producing Gaussian transform-limited pulses of about 1 ps at 80 K, due to the narrowergain bandwidth [3]. The material Yb:LuAG, very similar to Yb:YAG, is capable of producing 1.4 pspulses. The first Yb:YLF laser operated at cryogenic temperatures was reported in [109]. Yb:YLF is aninteresting ultrafast cryogenic laser material, due to the wide emission bandwidths for both π and σpolarizations. For E||c and E||a at 300 K, the shortest transform-limited Gaussian pulsewidths thatcan be obtained are about 43 and 57 fs at 300 K, and 191 and 55 fs at 79 K. The material is robust andhas relatively high thermal and stress figures of merit (Table 3). The first demonstration of combiningtwo Yb laser materials together (Yb:YAG and Yb:GSAG) to broaden the gain bandwidth, producedrecompressed shorter pulses of ~1.6 ps duration [110]. Not all of the spectral properties of Yb:GSAGare known, particularly at room temperature, but we have included the known properties in Table 6.
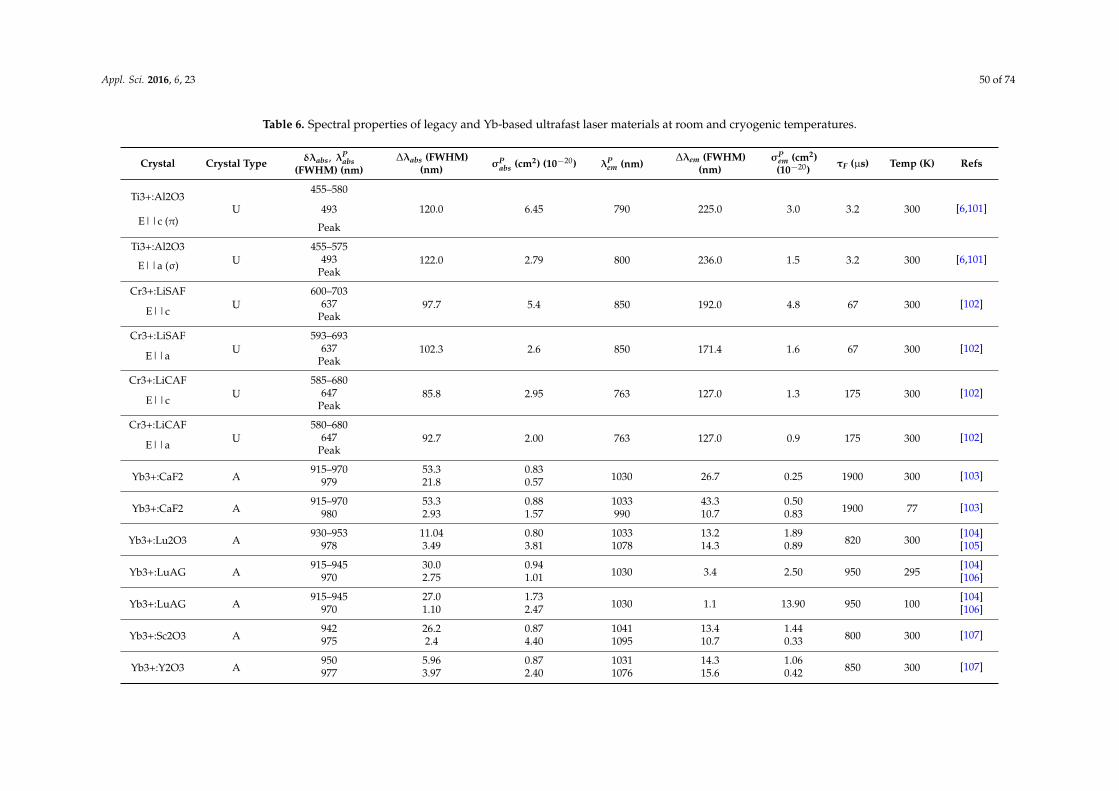
Appl. Sci. 2016, 6, 23 50 of 74
Table 6. Spectral properties of legacy and Yb-based ultrafast laser materials at room and cryogenic temperatures.
Crystal Crystal Type δλabs, λPabs
(FWHM) (nm)∆λabs (FWHM)
(nm) σPabs (cm2) (10´20) λP
em (nm)∆λem (FWHM)
(nm)σP
em (cm2)(10´20) τF (µs) Temp (K) Refs
Ti3+:Al2O3U
455–580
120.0 6.45 790 225.0 3.0 3.2 300 [6,101]493E||c (π) Peak
Ti3+:Al2O3U
455–575122.0 2.79 800 236.0 1.5 3.2 300 [6,101]E||a (σ) 493
Peak
Cr3+:LiSAFU
600–70397.7 5.4 850 192.0 4.8 67 300 [102]
E||c637
Peak
Cr3+:LiSAFU
593–693102.3 2.6 850 171.4 1.6 67 300 [102]
E||a637
Peak
Cr3+:LiCAFU
585–68085.8 2.95 763 127.0 1.3 175 300 [102]
E||c647
Peak
Cr3+:LiCAFU
580–68092.7 2.00 763 127.0 0.9 175 300 [102]
E||a647
Peak
Yb3+:CaF2 A915–970 53.3 0.83
1030 26.7 0.25 1900 300 [103]979 21.8 0.57
Yb3+:CaF2 A915–970 53.3 0.88 1033 43.3 0.50
1900 77 [103]980 2.93 1.57 990 10.7 0.83
Yb3+:Lu2O3 A930–953 11.04 0.80 1033 13.2 1.89
820 300[104]
978 3.49 3.81 1078 14.3 0.89 [105]
Yb3+:LuAG A915–945 30.0 0.94
1030 3.4 2.50 950 295[104]
970 2.75 1.01 [106]
Yb3+:LuAG A915–945 27.0 1.73
1030 1.1 13.90 950 100[104]
970 1.10 2.47 [106]
Yb3+:Sc2O3 A942 26.2 0.87 1041 13.4 1.44
800 300 [107]975 2.4 4.40 1095 10.7 0.33
Yb3+:Y2O3 A950 5.96 0.87 1031 14.3 1.06
850 300 [107]977 3.97 2.40 1076 15.6 0.42
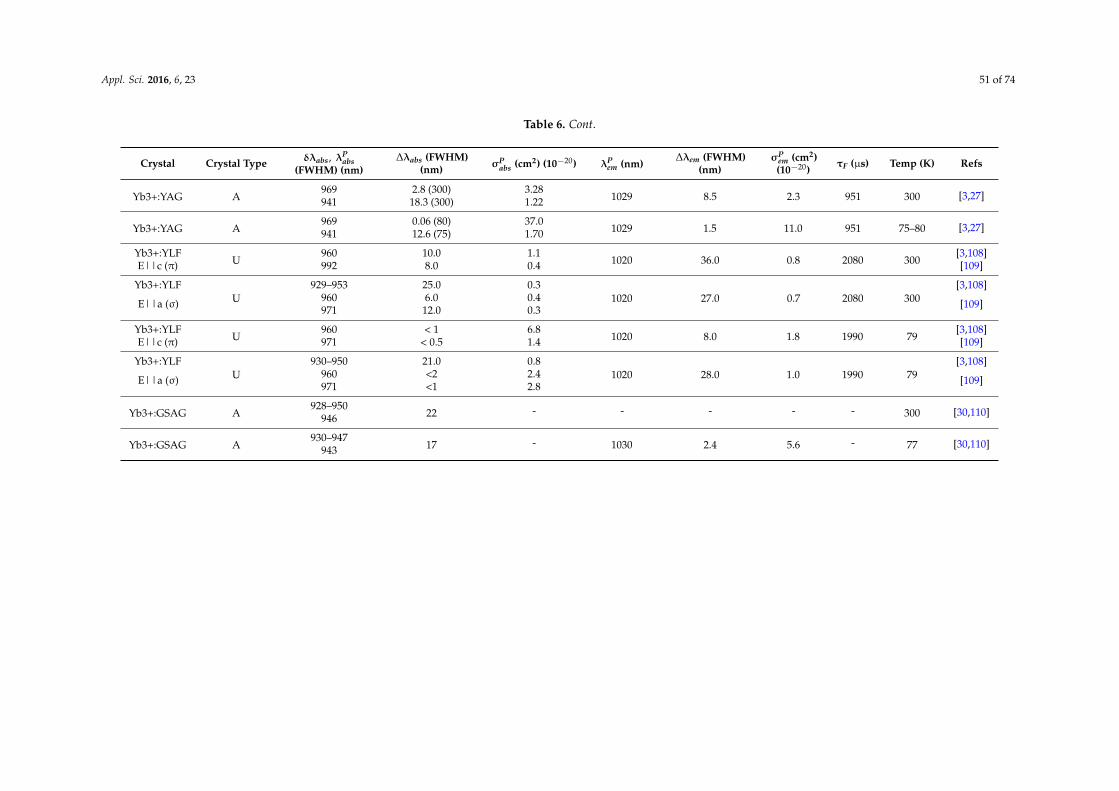
Appl. Sci. 2016, 6, 23 51 of 74
Table 6. Cont.
Crystal Crystal Type δλabs, λPabs
(FWHM) (nm)∆λabs (FWHM)
(nm) σPabs (cm2) (10´20) λP
em (nm)∆λem (FWHM)
(nm)σP
em (cm2)(10´20) τF (µs) Temp (K) Refs
Yb3+:YAG A969 2.8 (300) 3.28
1029 8.5 2.3 951 300 [3,27]941 18.3 (300) 1.22
Yb3+:YAG A969 0.06 (80) 37.0
1029 1.5 11.0 951 75–80 [3,27]941 12.6 (75) 1.70
Yb3+:YLFU
960 10.0 1.11020 36.0 0.8 2080 300
[3,108]E||c (π) 992 8.0 0.4 [109]
Yb3+:YLFU
929–953 25.0 0.31020 27.0 0.7 2080 300
[3,108]
E||a (σ) 960 6.0 0.4[109]971 12.0 0.3
Yb3+:YLFU
960 < 1 6.81020 8.0 1.8 1990 79
[3,108]E||c (π) 971 < 0.5 1.4 [109]
Yb3+:YLFU
930–950 21.0 0.81020 28.0 1.0 1990 79
[3,108]
E||a (σ) 960 <2 2.4[109]971 <1 2.8
Yb3+:GSAG A928–950
22 - - - - - 300 [30,110]946
Yb3+:GSAG A930–947
17 - 1030 2.4 5.6 - 77 [30,110]943
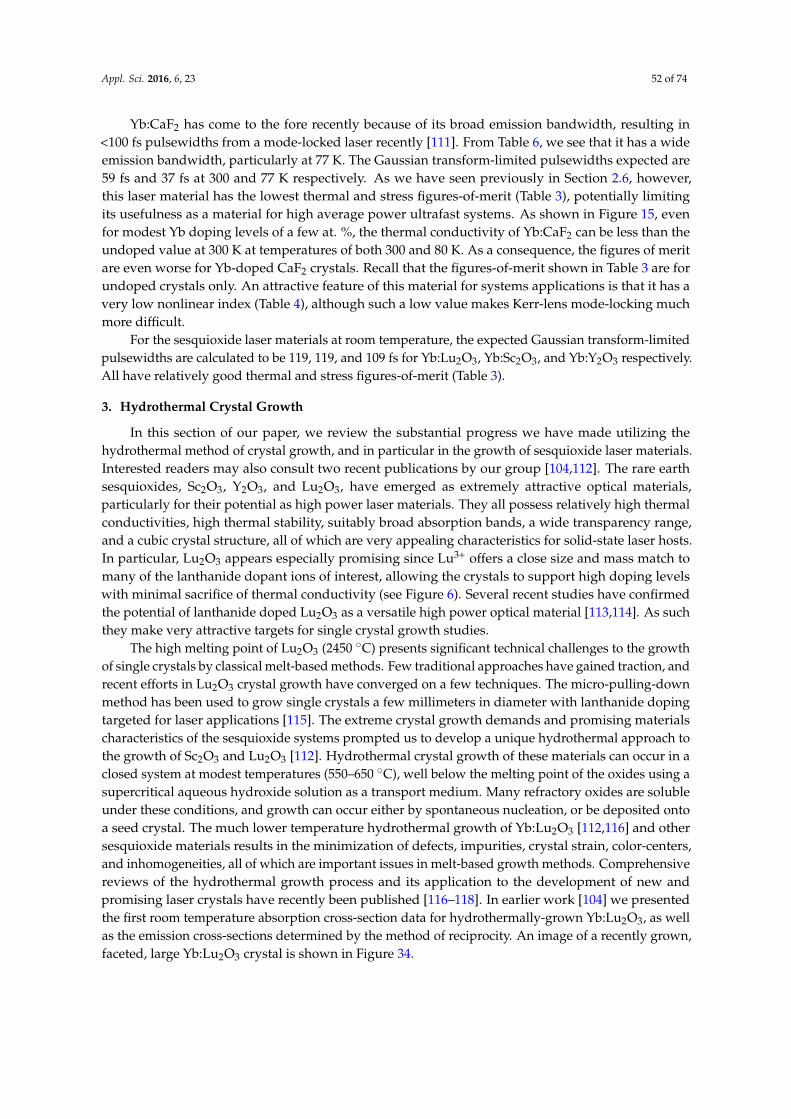
Appl. Sci. 2016, 6, 23 52 of 74
Yb:CaF2 has come to the fore recently because of its broad emission bandwidth, resulting in<100 fs pulsewidths from a mode-locked laser recently [111]. From Table 6, we see that it has a wideemission bandwidth, particularly at 77 K. The Gaussian transform-limited pulsewidths expected are59 fs and 37 fs at 300 and 77 K respectively. As we have seen previously in Section 2.6, however,this laser material has the lowest thermal and stress figures-of-merit (Table 3), potentially limitingits usefulness as a material for high average power ultrafast systems. As shown in Figure 15, evenfor modest Yb doping levels of a few at. %, the thermal conductivity of Yb:CaF2 can be less than theundoped value at 300 K at temperatures of both 300 and 80 K. As a consequence, the figures of meritare even worse for Yb-doped CaF2 crystals. Recall that the figures-of-merit shown in Table 3 are forundoped crystals only. An attractive feature of this material for systems applications is that it has avery low nonlinear index (Table 4), although such a low value makes Kerr-lens mode-locking muchmore difficult.
For the sesquioxide laser materials at room temperature, the expected Gaussian transform-limitedpulsewidths are calculated to be 119, 119, and 109 fs for Yb:Lu2O3, Yb:Sc2O3, and Yb:Y2O3 respectively.All have relatively good thermal and stress figures-of-merit (Table 3).
3. Hydrothermal Crystal Growth
In this section of our paper, we review the substantial progress we have made utilizing thehydrothermal method of crystal growth, and in particular in the growth of sesquioxide laser materials.Interested readers may also consult two recent publications by our group [104,112]. The rare earthsesquioxides, Sc2O3, Y2O3, and Lu2O3, have emerged as extremely attractive optical materials,particularly for their potential as high power laser materials. They all possess relatively high thermalconductivities, high thermal stability, suitably broad absorption bands, a wide transparency range,and a cubic crystal structure, all of which are very appealing characteristics for solid-state laser hosts.In particular, Lu2O3 appears especially promising since Lu3+ offers a close size and mass match tomany of the lanthanide dopant ions of interest, allowing the crystals to support high doping levelswith minimal sacrifice of thermal conductivity (see Figure 6). Several recent studies have confirmedthe potential of lanthanide doped Lu2O3 as a versatile high power optical material [113,114]. As suchthey make very attractive targets for single crystal growth studies.
The high melting point of Lu2O3 (2450 ˝C) presents significant technical challenges to the growthof single crystals by classical melt-based methods. Few traditional approaches have gained traction, andrecent efforts in Lu2O3 crystal growth have converged on a few techniques. The micro-pulling-downmethod has been used to grow single crystals a few millimeters in diameter with lanthanide dopingtargeted for laser applications [115]. The extreme crystal growth demands and promising materialscharacteristics of the sesquioxide systems prompted us to develop a unique hydrothermal approach tothe growth of Sc2O3 and Lu2O3 [112]. Hydrothermal crystal growth of these materials can occur in aclosed system at modest temperatures (550–650 ˝C), well below the melting point of the oxides using asupercritical aqueous hydroxide solution as a transport medium. Many refractory oxides are solubleunder these conditions, and growth can occur either by spontaneous nucleation, or be deposited ontoa seed crystal. The much lower temperature hydrothermal growth of Yb:Lu2O3 [112,116] and othersesquioxide materials results in the minimization of defects, impurities, crystal strain, color-centers,and inhomogeneities, all of which are important issues in melt-based growth methods. Comprehensivereviews of the hydrothermal growth process and its application to the development of new andpromising laser crystals have recently been published [116–118]. In earlier work [104] we presentedthe first room temperature absorption cross-section data for hydrothermally-grown Yb:Lu2O3, as wellas the emission cross-sections determined by the method of reciprocity. An image of a recently grown,faceted, large Yb:Lu2O3 crystal is shown in Figure 34.
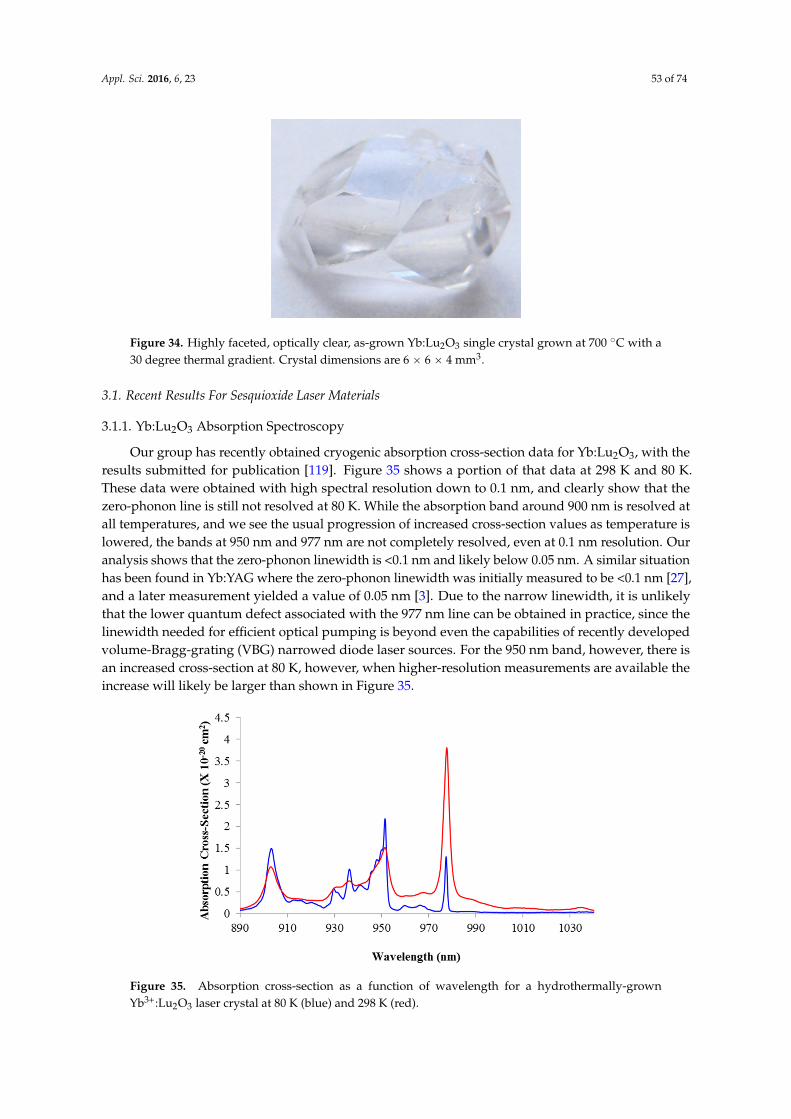
Appl. Sci. 2016, 6, 23 53 of 74
Appl. Sci. 2016, 6, 23 51 of 73
For the sesquioxide laser materials at room temperature, the expected Gaussian transform-limited pulsewidths are calculated to be 119, 119, and 109 fs for Yb:Lu2O3, Yb:Sc2O3, and Yb:Y2O3 respectively. All have relatively good thermal and stress figures-of-merit (Table 3).
3. Hydrothermal Crystal Growth
In this section of our paper, we review the substantial progress we have made utilizing the hydrothermal method of crystal growth, and in particular in the growth of sesquioxide laser materials. Interested readers may also consult two recent publications by our group [104,112]. The rare earth sesquioxides, Sc2O3, Y2O3, and Lu2O3, have emerged as extremely attractive optical materials, particularly for their potential as high power laser materials. They all possess relatively high thermal conductivities, high thermal stability, suitably broad absorption bands, a wide transparency range, and a cubic crystal structure, all of which are very appealing characteristics for solid-state laser hosts. In particular, Lu2O3 appears especially promising since Lu3+ offers a close size and mass match to many of the lanthanide dopant ions of interest, allowing the crystals to support high doping levels with minimal sacrifice of thermal conductivity (see Figure 6). Several recent studies have confirmed the potential of lanthanide doped Lu2O3 as a versatile high power optical material [113,114]. As such they make very attractive targets for single crystal growth studies.
The high melting point of Lu2O3 (2450 °C) presents significant technical challenges to the growth of single crystals by classical melt-based methods. Few traditional approaches have gained traction, and recent efforts in Lu2O3 crystal growth have converged on a few techniques. The micro-pulling-down method has been used to grow single crystals a few millimeters in diameter with lanthanide doping targeted for laser applications [115]. The extreme crystal growth demands and promising materials characteristics of the sesquioxide systems prompted us to develop a unique hydrothermal approach to the growth of Sc2O3 and Lu2O3 [112]. Hydrothermal crystal growth of these materials can occur in a closed system at modest temperatures (550–650 °C), well below the melting point of the oxides using a supercritical aqueous hydroxide solution as a transport medium. Many refractory oxides are soluble under these conditions, and growth can occur either by spontaneous nucleation, or be deposited onto a seed crystal. The much lower temperature hydrothermal growth of Yb:Lu2O3 [112,116] and other sesquioxide materials results in the minimization of defects, impurities, crystal strain, color-centers, and inhomogeneities, all of which are important issues in melt-based growth methods. Comprehensive reviews of the hydrothermal growth process and its application to the development of new and promising laser crystals have recently been published [116–118]. In earlier work [104] we presented the first room temperature absorption cross-section data for hydrothermally-grown Yb:Lu2O3, as well as the emission cross-sections determined by the method of reciprocity. An image of a recently grown, faceted, large Yb:Lu2O3 crystal is shown in Figure 34.
Figure 34. Highly faceted, optically clear, as-grown Yb:Lu2O3 single crystal grown at 700 °C with a 30 degree thermal gradient. Crystal dimensions are 6 × 6 × 4 mm3. Figure 34. Highly faceted, optically clear, as-grown Yb:Lu2O3 single crystal grown at 700 ˝C with a
30 degree thermal gradient. Crystal dimensions are 6 ˆ 6 ˆ 4 mm3.
3.1. Recent Results For Sesquioxide Laser Materials
3.1.1. Yb:Lu2O3 Absorption Spectroscopy
Our group has recently obtained cryogenic absorption cross-section data for Yb:Lu2O3, with theresults submitted for publication [119]. Figure 35 shows a portion of that data at 298 K and 80 K.These data were obtained with high spectral resolution down to 0.1 nm, and clearly show that thezero-phonon line is still not resolved at 80 K. While the absorption band around 900 nm is resolved atall temperatures, and we see the usual progression of increased cross-section values as temperature islowered, the bands at 950 nm and 977 nm are not completely resolved, even at 0.1 nm resolution. Ouranalysis shows that the zero-phonon linewidth is <0.1 nm and likely below 0.05 nm. A similar situationhas been found in Yb:YAG where the zero-phonon linewidth was initially measured to be <0.1 nm [27],and a later measurement yielded a value of 0.05 nm [3]. Due to the narrow linewidth, it is unlikelythat the lower quantum defect associated with the 977 nm line can be obtained in practice, since thelinewidth needed for efficient optical pumping is beyond even the capabilities of recently developedvolume-Bragg-grating (VBG) narrowed diode laser sources. For the 950 nm band, however, there isan increased cross-section at 80 K, however, when higher-resolution measurements are available theincrease will likely be larger than shown in Figure 35.
Appl. Sci. 2016, 6, 23 52 of 73
3.1. Recent Results For Sesquioxide Laser Materials
3.1.1. Yb:Lu2O3 Absorption Spectroscopy
Our group has recently obtained cryogenic absorption cross-section data for Yb:Lu2O3, with the results submitted for publication [119]. Figure 35 shows a portion of that data at 298 K and 80 K. These data were obtained with high spectral resolution down to 0.1 nm, and clearly show that the zero-phonon line is still not resolved at 80 K. While the absorption band around 900 nm is resolved at all temperatures, and we see the usual progression of increased cross-section values as temperature is lowered, the bands at 950 nm and 977 nm are not completely resolved, even at 0.1 nm resolution. Our analysis shows that the zero-phonon linewidth is <0.1 nm and likely below 0.05 nm. A similar situation has been found in Yb:YAG where the zero-phonon linewidth was initially measured to be <0.1 nm [27], and a later measurement yielded a value of 0.05 nm [3]. Due to the narrow linewidth, it is unlikely that the lower quantum defect associated with the 977 nm line can be obtained in practice, since the linewidth needed for efficient optical pumping is beyond even the capabilities of recently developed volume-Bragg-grating (VBG) narrowed diode laser sources. For the 950 nm band, however, there is an increased cross-section at 80 K, however, when higher-resolution measurements are available the increase will likely be larger than shown in Figure 35.
Figure 35. Absorption cross-section as a function of wavelength for a hydrothermally-grown Yb3+:Lu2O3 laser crystal at 80 K (blue) and 298 K (red).
3.1.2. Sm:YAG and Sm:LuAG For The Suppression of Parasitic Oscillations and Amplified Spontaneous Emission
We have investigated the hydrothermal growth of both Sm:YAG and Sm:LuAG. Sm is a well-known 1064 nm absorber, and has been used as Sm:Glass and Sm:YAG for some time as a suppressor of parasitic oscillations and amplified spontaneous emission (ASE). Figure 36 shows a side view of a Nd:YAG laser rod with an external Sm:YAG cladding layer on the barrel. In the absence of the Sm:YAG coating, it is well-known that a polished barrel will result in the oscillation of transverse straight-across surface mode, ring modes, and longitudinal (bulk) parasitic oscillation modes that will clamp the laser gain. In some cases, a surface parasitic located at the pump beam entrance face will have the lowest threshold. To eliminate parasitics and minimize ASE, such rods usually have ground barrels. Grinding of course results in sub-surface fractures that limit the power handling capability of the rod. A highly-doped layer of Sm:YAG can be used to suppress the parasitics and minimize ASE losses.
Figure 35. Absorption cross-section as a function of wavelength for a hydrothermally-grownYb3+:Lu2O3 laser crystal at 80 K (blue) and 298 K (red).

Appl. Sci. 2016, 6, 23 54 of 74
3.1.2. Sm:YAG and Sm:LuAG For The Suppression of Parasitic Oscillations and AmplifiedSpontaneous Emission
We have investigated the hydrothermal growth of both Sm:YAG and Sm:LuAG. Sm is awell-known 1064 nm absorber, and has been used as Sm:Glass and Sm:YAG for some time as asuppressor of parasitic oscillations and amplified spontaneous emission (ASE). Figure 36 shows a sideview of a Nd:YAG laser rod with an external Sm:YAG cladding layer on the barrel. In the absence ofthe Sm:YAG coating, it is well-known that a polished barrel will result in the oscillation of transversestraight-across surface mode, ring modes, and longitudinal (bulk) parasitic oscillation modes that willclamp the laser gain. In some cases, a surface parasitic located at the pump beam entrance face willhave the lowest threshold. To eliminate parasitics and minimize ASE, such rods usually have groundbarrels. Grinding of course results in sub-surface fractures that limit the power handling capabilityof the rod. A highly-doped layer of Sm:YAG can be used to suppress the parasitics and minimizeASE losses.Appl. Sci. 2016, 6, 23 53 of 73
Figure 36. Side view of an end-pumped laser rod or slab, showing the emitted fluorescence and absorption in Sm:YAG cladding layer. The non-uniform absorption gives rise to a possible surface parasitic at the pump beam entrance face where the transverse gain is largest.
Our interest in these materials began in 2012 when we demonstrated, for the first time, that we could grow epitaxial-like layers of Sm:YAG on Nd:YAG substrates [120]. A more recent example of this is shown in Figure 37. A Nd-doped rectangular cm sized laser crystal was used, and a highly doped layer of Sm:YAG was successfully grown on all six external surfaces. After layer growth, the end faces of the crystal are ground to remove the Sm:YAG, and polished and dielectrically-coated to allow 1064.2 nm lasing. In practice, this type of layer may be grown on any Nd:YAG laser crystal, and can be used to suppress parasitics and ASE. Previously, other researchers have reported Sm:YAG clad ceramic Nd:YAG rods [121,122] and disks [123]. In our work, we are primarily interested in providing a method that can be use on commonly used Czochralski-grown single crystals, without using expensive methods like diffusion-bonding.
Figures 38 and 39 show the absorption cross-sections as a function of wavelength for Sm:YAG and Sm:LuAG. We are particularly interested in the region near 1064 nm. To look at the potential of these materials as parasitics and ASE suppressors, we have compared the two materials in Figure 40, where we show the normalized cross-sections as a function of wavelength from 1050 to 1100 nm. The cross-section values for Sm:YAG and Sm:LuAG are nearly identical at 1064.2 (Nd:YAG) and 1064.4 nm (Nd:LuAG). Sm:YAG and Sm:LuAG, which may be grown as epitaxial layers on Nd:YAG, and Nd:LuAG, will then be effective parasitic and ASE absorbers for those materials.
Figure 37. Rectangular Nd:YAG crystal with hydrothermally-grown Sm:YAG layer for parasitics and amplified-spontaneous-emission suppression. After the growth of the layer, the Sm:YAG is removed from the end faces by polishing and the surfaces dielectric coated.
Figure 36. Side view of an end-pumped laser rod or slab, showing the emitted fluorescence andabsorption in Sm:YAG cladding layer. The non-uniform absorption gives rise to a possible surfaceparasitic at the pump beam entrance face where the transverse gain is largest.
Our interest in these materials began in 2012 when we demonstrated, for the first time, that wecould grow epitaxial-like layers of Sm:YAG on Nd:YAG substrates [120]. A more recent example ofthis is shown in Figure 37. A Nd-doped rectangular cm sized laser crystal was used, and a highlydoped layer of Sm:YAG was successfully grown on all six external surfaces. After layer growth, theend faces of the crystal are ground to remove the Sm:YAG, and polished and dielectrically-coated toallow 1064.2 nm lasing. In practice, this type of layer may be grown on any Nd:YAG laser crystal,and can be used to suppress parasitics and ASE. Previously, other researchers have reported Sm:YAGclad ceramic Nd:YAG rods [121,122] and disks [123]. In our work, we are primarily interested inproviding a method that can be use on commonly used Czochralski-grown single crystals, withoutusing expensive methods like diffusion-bonding.
Figures 38 and 39 show the absorption cross-sections as a function of wavelength for Sm:YAGand Sm:LuAG. We are particularly interested in the region near 1064 nm. To look at the potential ofthese materials as parasitics and ASE suppressors, we have compared the two materials in Figure 40,where we show the normalized cross-sections as a function of wavelength from 1050 to 1100 nm.The cross-section values for Sm:YAG and Sm:LuAG are nearly identical at 1064.2 (Nd:YAG) and
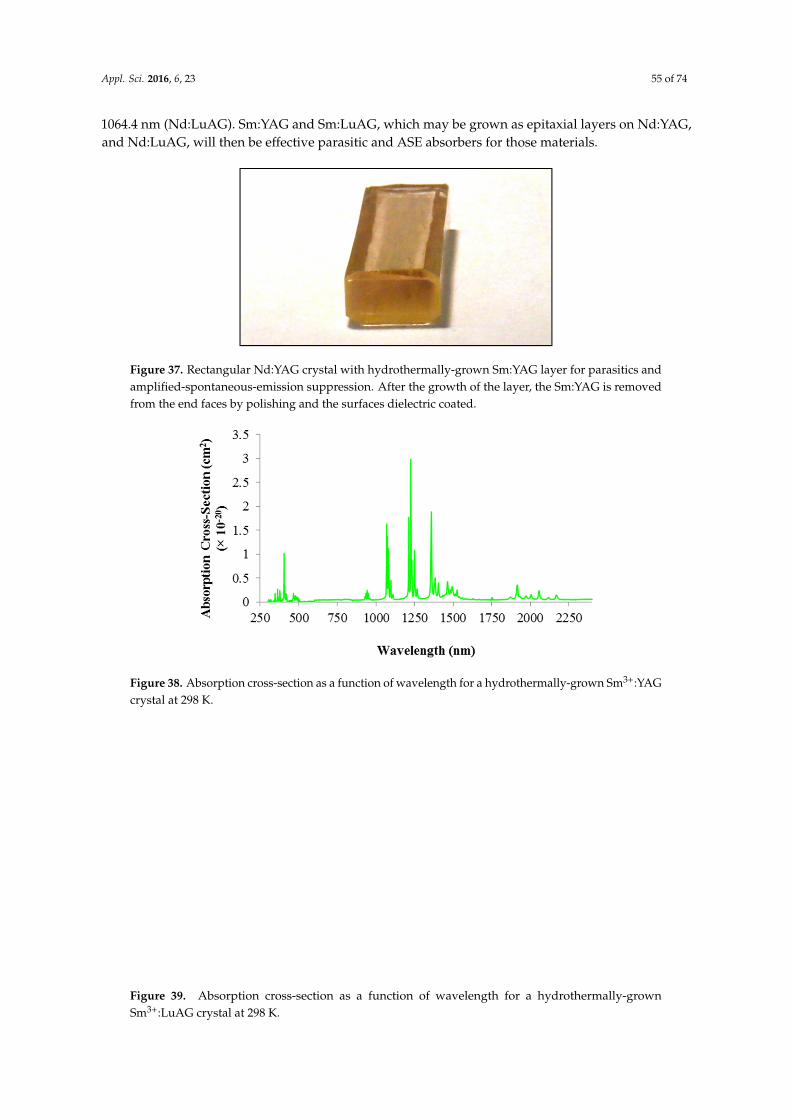
Appl. Sci. 2016, 6, 23 55 of 74
1064.4 nm (Nd:LuAG). Sm:YAG and Sm:LuAG, which may be grown as epitaxial layers on Nd:YAG,and Nd:LuAG, will then be effective parasitic and ASE absorbers for those materials.
Appl. Sci. 2016, 6, 23 53 of 73
Figure 36. Side view of an end-pumped laser rod or slab, showing the emitted fluorescence and absorption in Sm:YAG cladding layer. The non-uniform absorption gives rise to a possible surface parasitic at the pump beam entrance face where the transverse gain is largest.
Our interest in these materials began in 2012 when we demonstrated, for the first time, that we could grow epitaxial-like layers of Sm:YAG on Nd:YAG substrates [120]. A more recent example of this is shown in Figure 37. A Nd-doped rectangular cm sized laser crystal was used, and a highly doped layer of Sm:YAG was successfully grown on all six external surfaces. After layer growth, the end faces of the crystal are ground to remove the Sm:YAG, and polished and dielectrically-coated to allow 1064.2 nm lasing. In practice, this type of layer may be grown on any Nd:YAG laser crystal, and can be used to suppress parasitics and ASE. Previously, other researchers have reported Sm:YAG clad ceramic Nd:YAG rods [121,122] and disks [123]. In our work, we are primarily interested in providing a method that can be use on commonly used Czochralski-grown single crystals, without using expensive methods like diffusion-bonding.
Figures 38 and 39 show the absorption cross-sections as a function of wavelength for Sm:YAG and Sm:LuAG. We are particularly interested in the region near 1064 nm. To look at the potential of these materials as parasitics and ASE suppressors, we have compared the two materials in Figure 40, where we show the normalized cross-sections as a function of wavelength from 1050 to 1100 nm. The cross-section values for Sm:YAG and Sm:LuAG are nearly identical at 1064.2 (Nd:YAG) and 1064.4 nm (Nd:LuAG). Sm:YAG and Sm:LuAG, which may be grown as epitaxial layers on Nd:YAG, and Nd:LuAG, will then be effective parasitic and ASE absorbers for those materials.
Figure 37. Rectangular Nd:YAG crystal with hydrothermally-grown Sm:YAG layer for parasitics and amplified-spontaneous-emission suppression. After the growth of the layer, the Sm:YAG is removed from the end faces by polishing and the surfaces dielectric coated.
Figure 37. Rectangular Nd:YAG crystal with hydrothermally-grown Sm:YAG layer for parasitics andamplified-spontaneous-emission suppression. After the growth of the layer, the Sm:YAG is removedfrom the end faces by polishing and the surfaces dielectric coated.Appl. Sci. 2016, 6, 23 54 of 73
Figure 38. Absorption cross-section as a function of wavelength for a hydrothermally-grown Sm3+:YAG crystal at 298 K.
Figure 39. Absorption cross-section as a function of wavelength for a hydrothermally-grown Sm3+:LuAG crystal at 298 K.
Figure 40. Normalized absorption cross-section as a function of wavelength in the region from 1050 to 1100 nm, for the Sm-doped materials Sm:YAG (green) and Sm:LuAG (blue).
Figure 38. Absorption cross-section as a function of wavelength for a hydrothermally-grown Sm3+:YAGcrystal at 298 K.
Appl. Sci. 2016, 6, 23 54 of 73
Figure 38. Absorption cross-section as a function of wavelength for a hydrothermally-grown Sm3+:YAG crystal at 298 K.
Figure 39. Absorption cross-section as a function of wavelength for a hydrothermally-grown Sm3+:LuAG crystal at 298 K.
Figure 40. Normalized absorption cross-section as a function of wavelength in the region from 1050 to 1100 nm, for the Sm-doped materials Sm:YAG (green) and Sm:LuAG (blue).
Figure 39. Absorption cross-section as a function of wavelength for a hydrothermally-grownSm3+:LuAG crystal at 298 K.
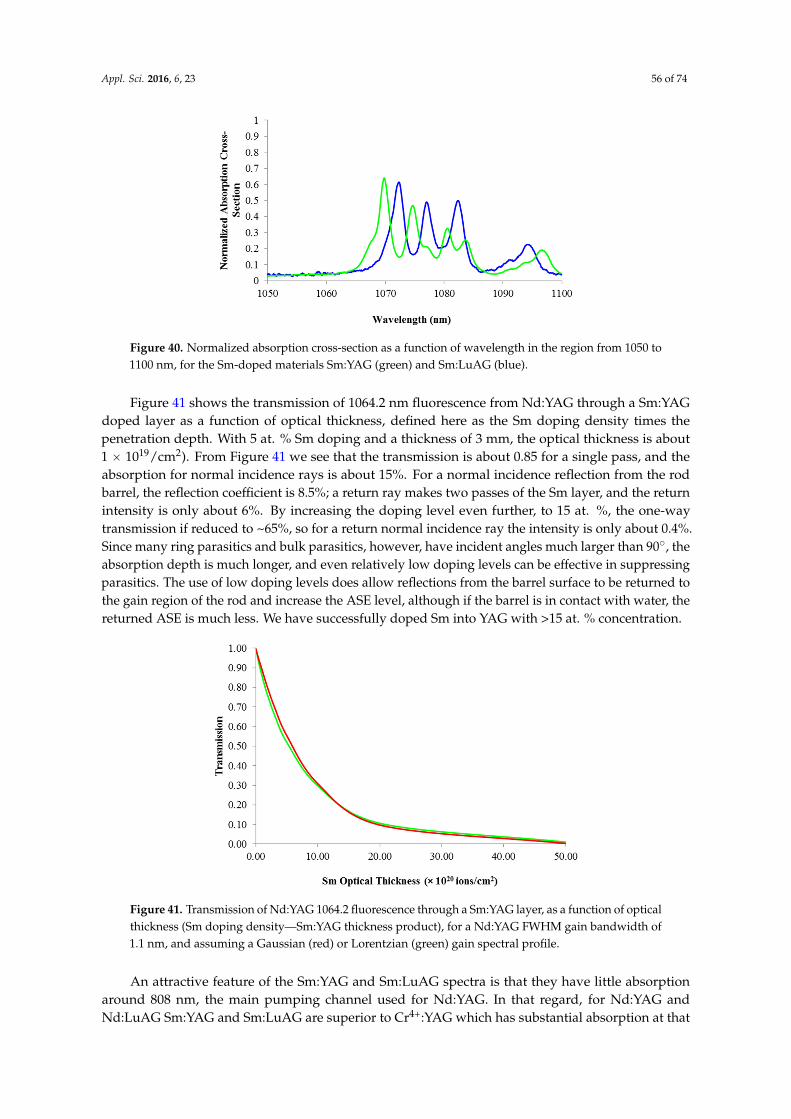
Appl. Sci. 2016, 6, 23 56 of 74
Appl. Sci. 2016, 6, 23 54 of 73
Figure 38. Absorption cross-section as a function of wavelength for a hydrothermally-grown Sm3+:YAG crystal at 298 K.
Figure 39. Absorption cross-section as a function of wavelength for a hydrothermally-grown Sm3+:LuAG crystal at 298 K.
Figure 40. Normalized absorption cross-section as a function of wavelength in the region from 1050 to 1100 nm, for the Sm-doped materials Sm:YAG (green) and Sm:LuAG (blue).
Figure 40. Normalized absorption cross-section as a function of wavelength in the region from 1050 to1100 nm, for the Sm-doped materials Sm:YAG (green) and Sm:LuAG (blue).
Figure 41 shows the transmission of 1064.2 nm fluorescence from Nd:YAG through a Sm:YAGdoped layer as a function of optical thickness, defined here as the Sm doping density times thepenetration depth. With 5 at. % Sm doping and a thickness of 3 mm, the optical thickness is about1 ˆ 1019/cm2). From Figure 41 we see that the transmission is about 0.85 for a single pass, and theabsorption for normal incidence rays is about 15%. For a normal incidence reflection from the rodbarrel, the reflection coefficient is 8.5%; a return ray makes two passes of the Sm layer, and the returnintensity is only about 6%. By increasing the doping level even further, to 15 at. %, the one-waytransmission if reduced to ~65%, so for a return normal incidence ray the intensity is only about 0.4%.Since many ring parasitics and bulk parasitics, however, have incident angles much larger than 90˝, theabsorption depth is much longer, and even relatively low doping levels can be effective in suppressingparasitics. The use of low doping levels does allow reflections from the barrel surface to be returned tothe gain region of the rod and increase the ASE level, although if the barrel is in contact with water, thereturned ASE is much less. We have successfully doped Sm into YAG with >15 at. % concentration.
Appl. Sci. 2016, 6, 23 55 of 73
Figure 41 shows the transmission of 1064.2 nm fluorescence from Nd:YAG through a Sm:YAG doped layer as a function of optical thickness, defined here as the Sm doping density times the penetration depth. With 5 at. % Sm doping and a thickness of 3 mm, the optical thickness is about 1 × 10¹⁹/cm2). From Figure 41 we see that the transmission is about 0.85 for a single pass, and the absorption for normal incidence rays is about 15%. For a normal incidence reflection from the rod barrel, the reflection coefficient is 8.5%; a return ray makes two passes of the Sm layer, and the return intensity is only about 6%. By increasing the doping level even further, to 15 at. %, the one-way transmission if reduced to ~65%, so for a return normal incidence ray the intensity is only about 0.4%. Since many ring parasitics and bulk parasitics, however, have incident angles much larger than 90°, the absorption depth is much longer, and even relatively low doping levels can be effective in suppressing parasitics. The use of low doping levels does allow reflections from the barrel surface to be returned to the gain region of the rod and increase the ASE level, although if the barrel is in contact with water, the returned ASE is much less. We have successfully doped Sm into YAG with >15 at. % concentration.
Figure 41. Transmission of Nd:YAG 1064.2 fluorescence through a Sm:YAG layer, as a function of optical thickness (Sm doping density—Sm:YAG thickness product), for a Nd:YAG FWHM gain bandwidth of 1.1 nm, and assuming a Gaussian (red) or Lorentzian (green) gain spectral profile.
An attractive feature of the Sm:YAG and Sm:LuAG spectra is that they have little absorption around 808 nm, the main pumping channel used for Nd:YAG. In that regard, for Nd:YAG and Nd:LuAG Sm:YAG and Sm:LuAG are superior to Cr4+:YAG which has substantial absorption at that wavelength and can be partially bleached by the pump diodes. That consideration is particularly important for transverse-pumping geometries.
For higher average power lasers, placing a Sm absorbing layer directly on the outside surface of a rod or other lasing crystal geometry may not be the optimum solution, because the absorption of high densities of heat in the Sm cladding later will result in complicated radially varying temperature profiles, leading to unwanted stresses in the doped lasing region. The best solution may be to grow an undoped buffer layer between the lasing and absorbing regions, as well as to have a Sm gradient layer whose doping is lowest next to the undoped region and highest at the edge. Hydrothermal growth is capable of producing such gradient doped layers [120].
Figure 41. Transmission of Nd:YAG 1064.2 fluorescence through a Sm:YAG layer, as a function of opticalthickness (Sm doping density—Sm:YAG thickness product), for a Nd:YAG FWHM gain bandwidth of1.1 nm, and assuming a Gaussian (red) or Lorentzian (green) gain spectral profile.
An attractive feature of the Sm:YAG and Sm:LuAG spectra is that they have little absorptionaround 808 nm, the main pumping channel used for Nd:YAG. In that regard, for Nd:YAG andNd:LuAG Sm:YAG and Sm:LuAG are superior to Cr4+:YAG which has substantial absorption at that
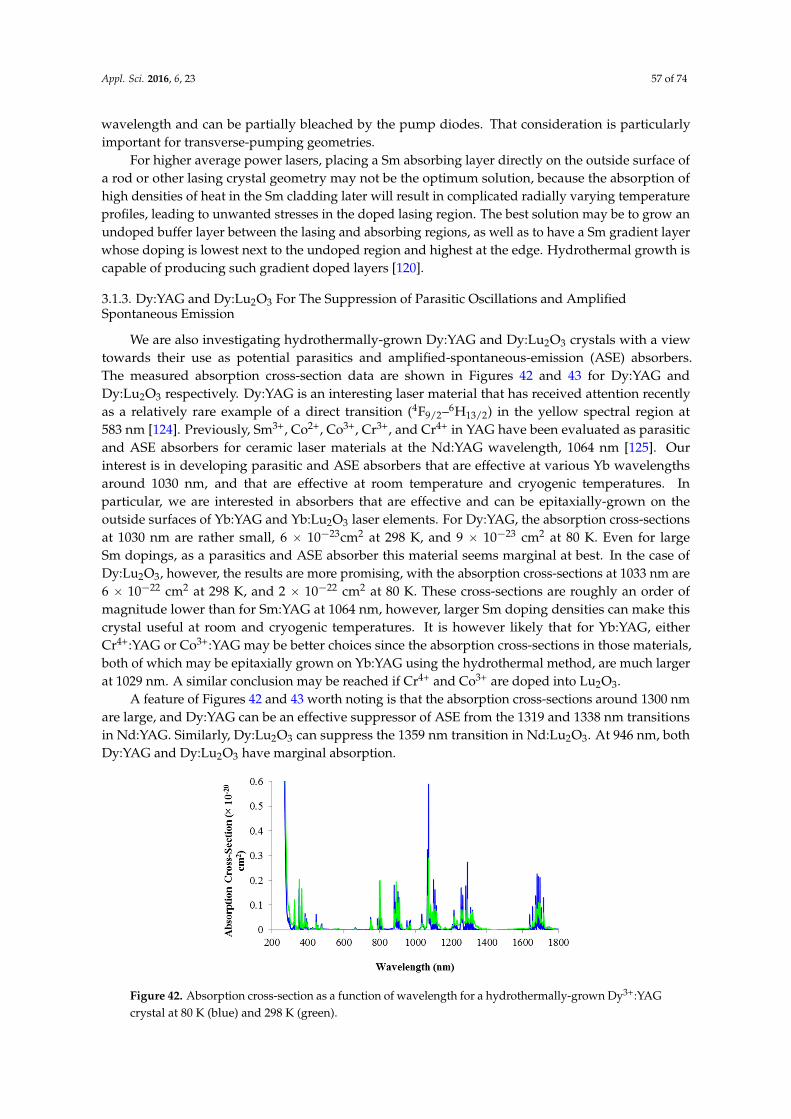
Appl. Sci. 2016, 6, 23 57 of 74
wavelength and can be partially bleached by the pump diodes. That consideration is particularlyimportant for transverse-pumping geometries.
For higher average power lasers, placing a Sm absorbing layer directly on the outside surface ofa rod or other lasing crystal geometry may not be the optimum solution, because the absorption ofhigh densities of heat in the Sm cladding later will result in complicated radially varying temperatureprofiles, leading to unwanted stresses in the doped lasing region. The best solution may be to grow anundoped buffer layer between the lasing and absorbing regions, as well as to have a Sm gradient layerwhose doping is lowest next to the undoped region and highest at the edge. Hydrothermal growth iscapable of producing such gradient doped layers [120].
3.1.3. Dy:YAG and Dy:Lu2O3 For The Suppression of Parasitic Oscillations and AmplifiedSpontaneous Emission
We are also investigating hydrothermally-grown Dy:YAG and Dy:Lu2O3 crystals with a viewtowards their use as potential parasitics and amplified-spontaneous-emission (ASE) absorbers.The measured absorption cross-section data are shown in Figures 42 and 43 for Dy:YAG andDy:Lu2O3 respectively. Dy:YAG is an interesting laser material that has received attention recentlyas a relatively rare example of a direct transition (4F9/2–6H13/2) in the yellow spectral region at583 nm [124]. Previously, Sm3+, Co2+, Co3+, Cr3+, and Cr4+ in YAG have been evaluated as parasiticand ASE absorbers for ceramic laser materials at the Nd:YAG wavelength, 1064 nm [125]. Ourinterest is in developing parasitic and ASE absorbers that are effective at various Yb wavelengthsaround 1030 nm, and that are effective at room temperature and cryogenic temperatures. Inparticular, we are interested in absorbers that are effective and can be epitaxially-grown on theoutside surfaces of Yb:YAG and Yb:Lu2O3 laser elements. For Dy:YAG, the absorption cross-sectionsat 1030 nm are rather small, 6 ˆ 10´23cm2 at 298 K, and 9 ˆ 10´23 cm2 at 80 K. Even for largeSm dopings, as a parasitics and ASE absorber this material seems marginal at best. In the case ofDy:Lu2O3, however, the results are more promising, with the absorption cross-sections at 1033 nm are6 ˆ 10´22 cm2 at 298 K, and 2 ˆ 10´22 cm2 at 80 K. These cross-sections are roughly an order ofmagnitude lower than for Sm:YAG at 1064 nm, however, larger Sm doping densities can make thiscrystal useful at room and cryogenic temperatures. It is however likely that for Yb:YAG, eitherCr4+:YAG or Co3+:YAG may be better choices since the absorption cross-sections in those materials,both of which may be epitaxially grown on Yb:YAG using the hydrothermal method, are much largerat 1029 nm. A similar conclusion may be reached if Cr4+ and Co3+ are doped into Lu2O3.
A feature of Figures 42 and 43 worth noting is that the absorption cross-sections around 1300 nmare large, and Dy:YAG can be an effective suppressor of ASE from the 1319 and 1338 nm transitionsin Nd:YAG. Similarly, Dy:Lu2O3 can suppress the 1359 nm transition in Nd:Lu2O3. At 946 nm, bothDy:YAG and Dy:Lu2O3 have marginal absorption.
Appl. Sci. 2016, 6, 23 56 of 73
3.1.3. Dy:YAG and Dy:Lu2O3 For The Suppression of Parasitic Oscillations and Amplified Spontaneous Emission
We are also investigating hydrothermally-grown Dy:YAG and Dy:Lu2O3 crystals with a view towards their use as potential parasitics and amplified-spontaneous-emission (ASE) absorbers. The measured absorption cross-section data are shown in Figures 42 and 43 for Dy:YAG and Dy:Lu2O3 respectively. Dy:YAG is an interesting laser material that has received attention recently as a relatively rare example of a direct transition (4F9/2–6H13/2) in the yellow spectral region at 583 nm [124]. Previously, Sm3+, Co2+, Co3+, Cr3+, and Cr4+ in YAG have been evaluated as parasitic and ASE absorbers for ceramic laser materials at the Nd:YAG wavelength, 1064 nm [125]. Our interest is in developing parasitic and ASE absorbers that are effective at various Yb wavelengths around 1030 nm, and that are effective at room temperature and cryogenic temperatures. In particular, we are interested in absorbers that are effective and can be epitaxially-grown on the outside surfaces of Yb:YAG and Yb:Lu2O3 laser elements. For Dy:YAG, the absorption cross-sections at 1030 nm are rather small, 6 × 10⁻²³cm2 at 298 K, and 9 × 10⁻²³ cm2 at 80 K. Even for large Sm dopings, as a parasitics and ASE absorber this material seems marginal at best. In the case of Dy:Lu2O3, however, the results are more promising, with the absorption cross-sections at 1033 nm are 6 × 10⁻²² cm2 at 298 K, and 2 × 10⁻²² cm2 at 80 K. These cross-sections are roughly an order of magnitude lower than for Sm:YAG at 1064 nm, however, larger Sm doping densities can make this crystal useful at room and cryogenic temperatures. It is however likely that for Yb:YAG, either Cr4+:YAG or Co3+:YAG may be better choices since the absorption cross-sections in those materials, both of which may be epitaxially grown on Yb:YAG using the hydrothermal method, are much larger at 1029 nm. A similar conclusion may be reached if Cr4+ and Co3+ are doped into Lu2O3.
A feature of Figures 42 and 43 worth noting is that the absorption cross-sections around 1300 nm are large, and Dy:YAG can be an effective suppressor of ASE from the 1319 and 1338 nm transitions in Nd:YAG. Similarly, Dy:Lu2O3 can suppress the 1359 nm transition in Nd:Lu2O3. At 946 nm, both Dy:YAG and Dy:Lu2O3 have marginal absorption.
Figure 42. Absorption cross-section as a function of wavelength for a hydrothermally-grown Dy3+:YAG crystal at 80 K (blue) and 298 K (green).
Figure 42. Absorption cross-section as a function of wavelength for a hydrothermally-grown Dy3+:YAGcrystal at 80 K (blue) and 298 K (green).
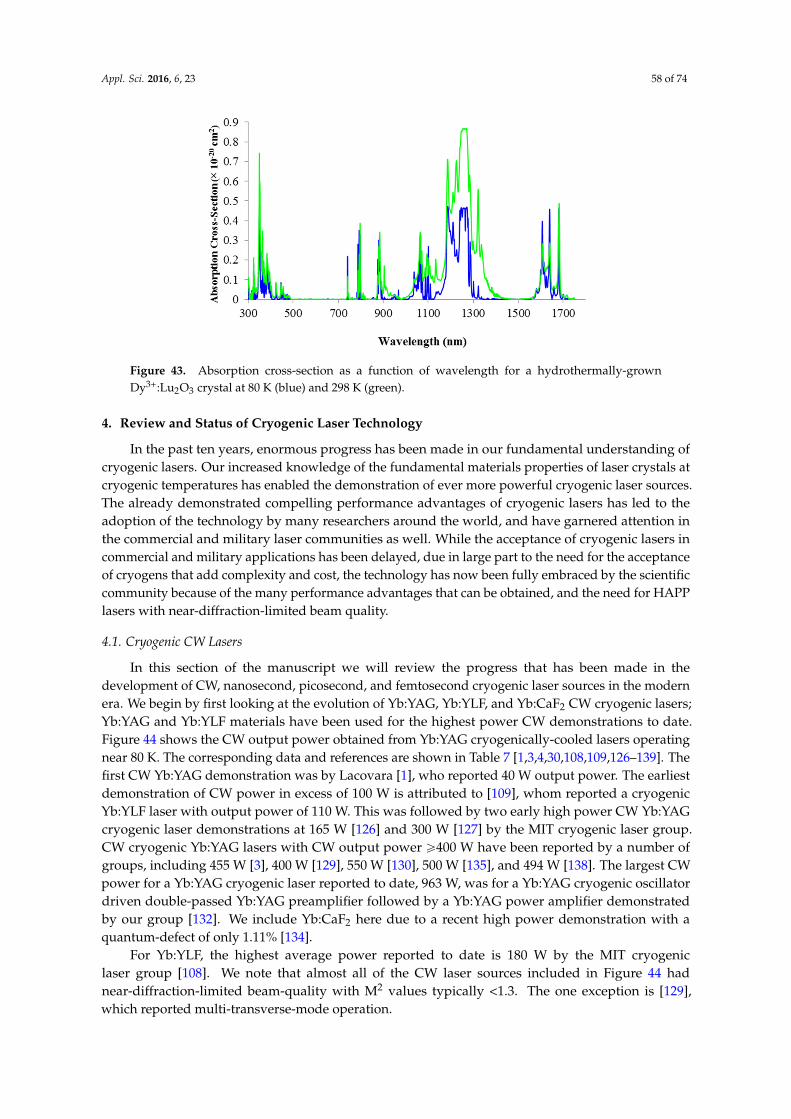
Appl. Sci. 2016, 6, 23 58 of 74Appl. Sci. 2016, 6, 23 57 of 73
Figure 43. Absorption cross-section as a function of wavelength for a hydrothermally-grown Dy3+:Lu2O3 crystal at 80 K (blue) and 298 K (green).
4. Review and Status of Cryogenic Laser Technology
In the past ten years, enormous progress has been made in our fundamental understanding of cryogenic lasers. Our increased knowledge of the fundamental materials properties of laser crystals at cryogenic temperatures has enabled the demonstration of ever more powerful cryogenic laser sources. The already demonstrated compelling performance advantages of cryogenic lasers has led to the adoption of the technology by many researchers around the world, and have garnered attention in the commercial and military laser communities as well. While the acceptance of cryogenic lasers in commercial and military applications has been delayed, due in large part to the need for the acceptance of cryogens that add complexity and cost, the technology has now been fully embraced by the scientific community because of the many performance advantages that can be obtained, and the need for HAPP lasers with near-diffraction-limited beam quality.
4.1. Cryogenic CW Lasers
In this section of the manuscript we will review the progress that has been made in the development of CW, nanosecond, picosecond, and femtosecond cryogenic laser sources in the modern era. We begin by first looking at the evolution of Yb:YAG, Yb:YLF, and Yb:CaF2 CW cryogenic lasers; Yb:YAG and Yb:YLF materials have been used for the highest power CW demonstrations to date. Figure 44 shows the CW output power obtained from Yb:YAG cryogenically-cooled lasers operating near 80 K. The corresponding data and references are shown in Table 7 [1,3,4,30,108,109,126–139]. The first CW Yb:YAG demonstration was by Lacovara [1], who reported 40 W output power. The earliest demonstration of CW power in excess of 100 W is attributed to [109], whom reported a cryogenic Yb:YLF laser with output power of 110 W. This was followed by two early high power CW Yb:YAG cryogenic laser demonstrations at 165 W [126] and 300 W [127] by the MIT cryogenic laser group. CW cryogenic Yb:YAG lasers with CW output power ≥400 W have been reported by a number of groups, including 455 W [3], 400 W [129], 550 W [130], 500 W [135], and 494 W [138]. The largest CW power for a Yb:YAG cryogenic laser reported to date, 963 W, was for a Yb:YAG cryogenic oscillator driven double-passed Yb:YAG preamplifier followed by a Yb:YAG power amplifier demonstrated by our group [132]. We include Yb:CaF2 here due to a recent high power demonstration with a quantum-defect of only 1.11% [134].
For Yb:YLF, the highest average power reported to date is 180 W by the MIT cryogenic laser group [108]. We note that almost all of the CW laser sources included in Figure 44 had near-diffraction-limited beam-quality with M2 values typically <1.3. The one exception is [129], which reported multi-transverse-mode operation.
Figure 43. Absorption cross-section as a function of wavelength for a hydrothermally-grownDy3+:Lu2O3 crystal at 80 K (blue) and 298 K (green).
4. Review and Status of Cryogenic Laser Technology
In the past ten years, enormous progress has been made in our fundamental understanding ofcryogenic lasers. Our increased knowledge of the fundamental materials properties of laser crystals atcryogenic temperatures has enabled the demonstration of ever more powerful cryogenic laser sources.The already demonstrated compelling performance advantages of cryogenic lasers has led to theadoption of the technology by many researchers around the world, and have garnered attention inthe commercial and military laser communities as well. While the acceptance of cryogenic lasers incommercial and military applications has been delayed, due in large part to the need for the acceptanceof cryogens that add complexity and cost, the technology has now been fully embraced by the scientificcommunity because of the many performance advantages that can be obtained, and the need for HAPPlasers with near-diffraction-limited beam quality.
4.1. Cryogenic CW Lasers
In this section of the manuscript we will review the progress that has been made in thedevelopment of CW, nanosecond, picosecond, and femtosecond cryogenic laser sources in the modernera. We begin by first looking at the evolution of Yb:YAG, Yb:YLF, and Yb:CaF2 CW cryogenic lasers;Yb:YAG and Yb:YLF materials have been used for the highest power CW demonstrations to date.Figure 44 shows the CW output power obtained from Yb:YAG cryogenically-cooled lasers operatingnear 80 K. The corresponding data and references are shown in Table 7 [1,3,4,30,108,109,126–139]. Thefirst CW Yb:YAG demonstration was by Lacovara [1], who reported 40 W output power. The earliestdemonstration of CW power in excess of 100 W is attributed to [109], whom reported a cryogenicYb:YLF laser with output power of 110 W. This was followed by two early high power CW Yb:YAGcryogenic laser demonstrations at 165 W [126] and 300 W [127] by the MIT cryogenic laser group.CW cryogenic Yb:YAG lasers with CW output power ě400 W have been reported by a number ofgroups, including 455 W [3], 400 W [129], 550 W [130], 500 W [135], and 494 W [138]. The largest CWpower for a Yb:YAG cryogenic laser reported to date, 963 W, was for a Yb:YAG cryogenic oscillatordriven double-passed Yb:YAG preamplifier followed by a Yb:YAG power amplifier demonstratedby our group [132]. We include Yb:CaF2 here due to a recent high power demonstration with aquantum-defect of only 1.11% [134].
For Yb:YLF, the highest average power reported to date is 180 W by the MIT cryogeniclaser group [108]. We note that almost all of the CW laser sources included in Figure 44 hadnear-diffraction-limited beam-quality with M2 values typically <1.3. The one exception is [129],which reported multi-transverse-mode operation.
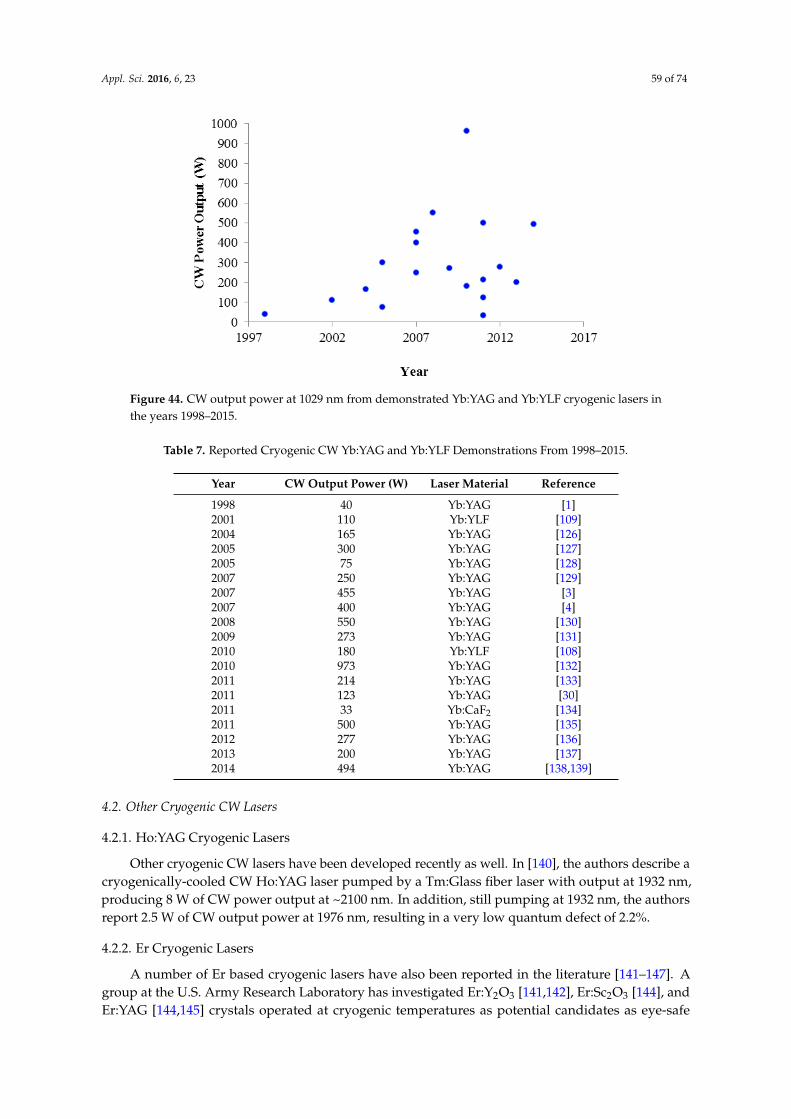
Appl. Sci. 2016, 6, 23 59 of 74Appl. Sci. 2016, 6, 23 58 of 73
Figure 44. CW output power at 1029 nm from demonstrated Yb:YAG and Yb:YLF cryogenic lasers in the years 1998–2015.
Table 7. Reported Cryogenic CW Yb:YAG and Yb:YLF Demonstrations From 1998–2015.
Year CW Output Power (W) Laser Material Reference 1998 40 Yb:YAG [1] 2001 110 Yb:YLF [109] 2004 165 Yb:YAG [126] 2005 300 Yb:YAG [127] 2005 75 Yb:YAG [128] 2007 250 Yb:YAG [129] 2007 455 Yb:YAG [3] 2007 400 Yb:YAG [4] 2008 550 Yb:YAG [130] 2009 273 Yb:YAG [131] 2010 180 Yb:YLF [108] 2010 973 Yb:YAG [132] 2011 214 Yb:YAG [133] 2011 123 Yb:YAG [30] 2011 33 Yb:CaF2 [134] 2011 500 Yb:YAG [135] 2012 277 Yb:YAG [136] 2013 200 Yb:YAG [137] 2014 494 Yb:YAG [138,139]
4.2. Other Cryogenic CW Lasers
4.2.1. Ho:YAG Cryogenic Lasers
Other cryogenic CW lasers have been developed recently as well. In [140], the authors describe a cryogenically-cooled CW Ho:YAG laser pumped by a Tm:Glass fiber laser with output at 1932 nm, producing 8 W of CW power output at ~2100 nm. In addition, still pumping at 1932 nm, the authors report 2.5 W of CW output power at 1976 nm, resulting in a very low quantum defect of 2.2%.
4.2.2. Er Cryogenic Lasers
A number of Er based cryogenic lasers have also been reported in the literature [141–147]. A group at the U.S. Army Research Laboratory has investigated Er:Y2O3 [141,142], Er:Sc2O3 [144], and
Figure 44. CW output power at 1029 nm from demonstrated Yb:YAG and Yb:YLF cryogenic lasers inthe years 1998–2015.
Table 7. Reported Cryogenic CW Yb:YAG and Yb:YLF Demonstrations From 1998–2015.
Year CW Output Power (W) Laser Material Reference
1998 40 Yb:YAG [1]2001 110 Yb:YLF [109]2004 165 Yb:YAG [126]2005 300 Yb:YAG [127]2005 75 Yb:YAG [128]2007 250 Yb:YAG [129]2007 455 Yb:YAG [3]2007 400 Yb:YAG [4]2008 550 Yb:YAG [130]2009 273 Yb:YAG [131]2010 180 Yb:YLF [108]2010 973 Yb:YAG [132]2011 214 Yb:YAG [133]2011 123 Yb:YAG [30]2011 33 Yb:CaF2 [134]2011 500 Yb:YAG [135]2012 277 Yb:YAG [136]2013 200 Yb:YAG [137]2014 494 Yb:YAG [138,139]
4.2. Other Cryogenic CW Lasers
4.2.1. Ho:YAG Cryogenic Lasers
Other cryogenic CW lasers have been developed recently as well. In [140], the authors describe acryogenically-cooled CW Ho:YAG laser pumped by a Tm:Glass fiber laser with output at 1932 nm,producing 8 W of CW power output at ~2100 nm. In addition, still pumping at 1932 nm, the authorsreport 2.5 W of CW output power at 1976 nm, resulting in a very low quantum defect of 2.2%.
4.2.2. Er Cryogenic Lasers
A number of Er based cryogenic lasers have also been reported in the literature [141–147]. Agroup at the U.S. Army Research Laboratory has investigated Er:Y2O3 [141,142], Er:Sc2O3 [144], andEr:YAG [144,145] crystals operated at cryogenic temperatures as potential candidates as eye-safe
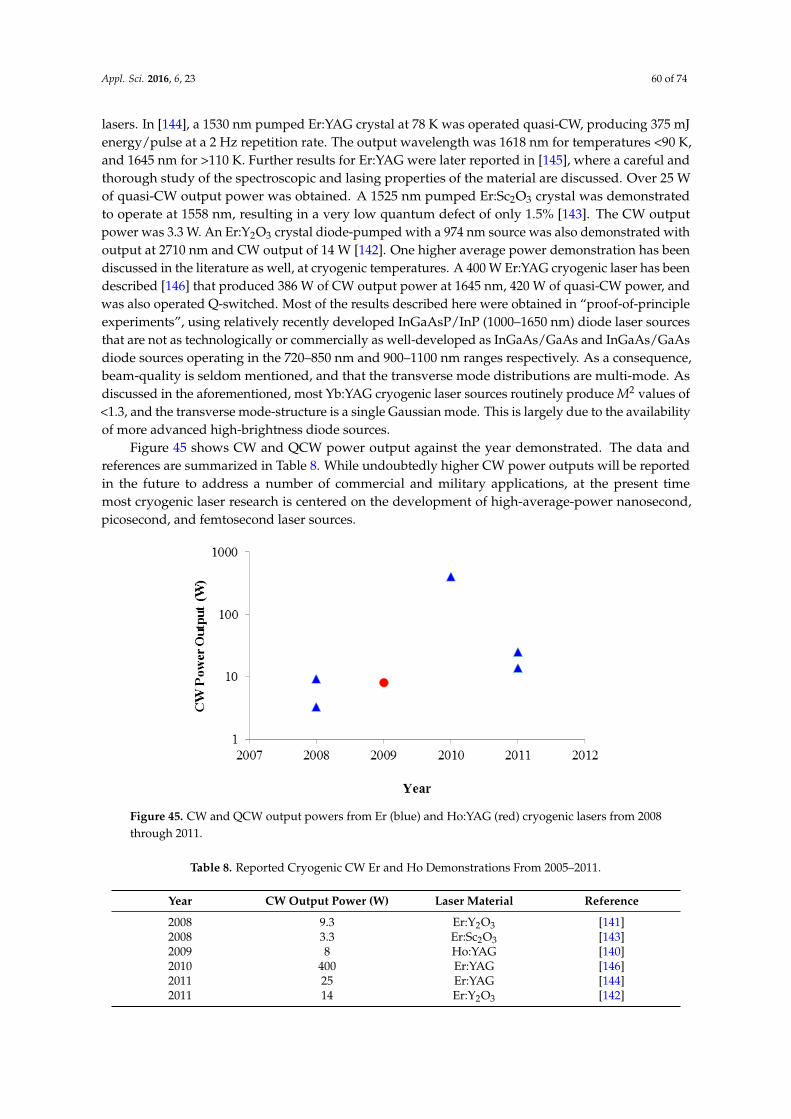
Appl. Sci. 2016, 6, 23 60 of 74
lasers. In [144], a 1530 nm pumped Er:YAG crystal at 78 K was operated quasi-CW, producing 375 mJenergy/pulse at a 2 Hz repetition rate. The output wavelength was 1618 nm for temperatures <90 K,and 1645 nm for >110 K. Further results for Er:YAG were later reported in [145], where a careful andthorough study of the spectroscopic and lasing properties of the material are discussed. Over 25 Wof quasi-CW output power was obtained. A 1525 nm pumped Er:Sc2O3 crystal was demonstratedto operate at 1558 nm, resulting in a very low quantum defect of only 1.5% [143]. The CW outputpower was 3.3 W. An Er:Y2O3 crystal diode-pumped with a 974 nm source was also demonstrated withoutput at 2710 nm and CW output of 14 W [142]. One higher average power demonstration has beendiscussed in the literature as well, at cryogenic temperatures. A 400 W Er:YAG cryogenic laser has beendescribed [146] that produced 386 W of CW output power at 1645 nm, 420 W of quasi-CW power, andwas also operated Q-switched. Most of the results described here were obtained in “proof-of-principleexperiments”, using relatively recently developed InGaAsP/InP (1000–1650 nm) diode laser sourcesthat are not as technologically or commercially as well-developed as InGaAs/GaAs and InGaAs/GaAsdiode sources operating in the 720–850 nm and 900–1100 nm ranges respectively. As a consequence,beam-quality is seldom mentioned, and that the transverse mode distributions are multi-mode. Asdiscussed in the aforementioned, most Yb:YAG cryogenic laser sources routinely produce M2 values of<1.3, and the transverse mode-structure is a single Gaussian mode. This is largely due to the availabilityof more advanced high-brightness diode sources.
Figure 45 shows CW and QCW power output against the year demonstrated. The data andreferences are summarized in Table 8. While undoubtedly higher CW power outputs will be reportedin the future to address a number of commercial and military applications, at the present timemost cryogenic laser research is centered on the development of high-average-power nanosecond,picosecond, and femtosecond laser sources.
Appl. Sci. 2016, 6, 23 59 of 73
Er:YAG [144,145] crystals operated at cryogenic temperatures as potential candidates as eye-safe lasers. In [144], a 1530 nm pumped Er:YAG crystal at 78 K was operated quasi-CW, producing 375 mJ energy/pulse at a 2 Hz repetition rate. The output wavelength was 1618 nm for temperatures <90 K, and 1645 nm for >110 K. Further results for Er:YAG were later reported in [145], where a careful and thorough study of the spectroscopic and lasing properties of the material are discussed. Over 25 W of quasi-CW output power was obtained. A 1525 nm pumped Er:Sc2O3 crystal was demonstrated to operate at 1558 nm, resulting in a very low quantum defect of only 1.5% [143]. The CW output power was 3.3 W. An Er:Y2O3 crystal diode-pumped with a 974 nm source was also demonstrated with output at 2710 nm and CW output of 14 W [142]. One higher average power demonstration has been discussed in the literature as well, at cryogenic temperatures. A 400 W Er:YAG cryogenic laser has been described [146] that produced 386 W of CW output power at 1645 nm, 420 W of quasi-CW power, and was also operated Q-switched. Most of the results described here were obtained in “proof-of-principle experiments”, using relatively recently developed InGaAsP/InP (1000–1650 nm) diode laser sources that are not as technologically or commercially as well-developed as InGaAs/GaAs and InGaAs/GaAs diode sources operating in the 720–850 nm and 900–1100 nm ranges respectively. As a consequence, beam-quality is seldom mentioned, and that the transverse mode distributions are multi-mode. As discussed in the aforementioned, most Yb:YAG cryogenic laser sources routinely produce M2 values of <1.3, and the transverse mode-structure is a single Gaussian mode. This is largely due to the availability of more advanced high-brightness diode sources.
Figure 45 shows CW and QCW power output against the year demonstrated. The data and references are summarized in Table 8. While undoubtedly higher CW power outputs will be reported in the future to address a number of commercial and military applications, at the present time most cryogenic laser research is centered on the development of high-average-power nanosecond, picosecond, and femtosecond laser sources.
Figure 45. CW and QCW output powers from Er (blue) and Ho:YAG (red) cryogenic lasers from 2008 through 2011.
Table 8. Reported Cryogenic CW Er and Ho Demonstrations From 2005–2011.
Year CW Output Power (W) Laser Material Reference 2008 9.3 Er:Y2O3 [141] 2008 3.3 Er:Sc2O3 [143] 2009 8 Ho:YAG [140] 2010 400 Er:YAG [146] 2011 25 Er:YAG [144] 2011 14 Er:Y2O3 [142]
Figure 45. CW and QCW output powers from Er (blue) and Ho:YAG (red) cryogenic lasers from 2008through 2011.
Table 8. Reported Cryogenic CW Er and Ho Demonstrations From 2005–2011.
Year CW Output Power (W) Laser Material Reference
2008 9.3 Er:Y2O3 [141]2008 3.3 Er:Sc2O3 [143]2009 8 Ho:YAG [140]2010 400 Er:YAG [146]2011 25 Er:YAG [144]2011 14 Er:Y2O3 [142]
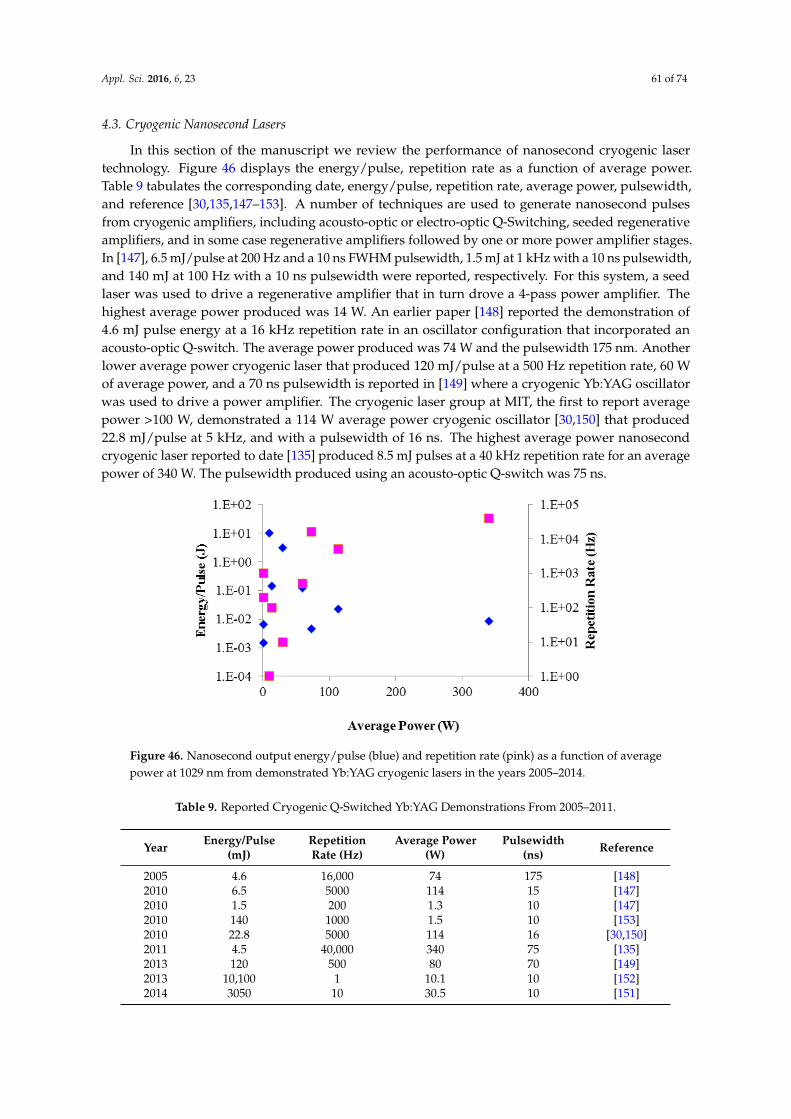
Appl. Sci. 2016, 6, 23 61 of 74
4.3. Cryogenic Nanosecond Lasers
In this section of the manuscript we review the performance of nanosecond cryogenic lasertechnology. Figure 46 displays the energy/pulse, repetition rate as a function of average power.Table 9 tabulates the corresponding date, energy/pulse, repetition rate, average power, pulsewidth,and reference [30,135,147–153]. A number of techniques are used to generate nanosecond pulsesfrom cryogenic amplifiers, including acousto-optic or electro-optic Q-Switching, seeded regenerativeamplifiers, and in some case regenerative amplifiers followed by one or more power amplifier stages.In [147], 6.5 mJ/pulse at 200 Hz and a 10 ns FWHM pulsewidth, 1.5 mJ at 1 kHz with a 10 ns pulsewidth,and 140 mJ at 100 Hz with a 10 ns pulsewidth were reported, respectively. For this system, a seedlaser was used to drive a regenerative amplifier that in turn drove a 4-pass power amplifier. Thehighest average power produced was 14 W. An earlier paper [148] reported the demonstration of4.6 mJ pulse energy at a 16 kHz repetition rate in an oscillator configuration that incorporated anacousto-optic Q-switch. The average power produced was 74 W and the pulsewidth 175 nm. Anotherlower average power cryogenic laser that produced 120 mJ/pulse at a 500 Hz repetition rate, 60 Wof average power, and a 70 ns pulsewidth is reported in [149] where a cryogenic Yb:YAG oscillatorwas used to drive a power amplifier. The cryogenic laser group at MIT, the first to report averagepower >100 W, demonstrated a 114 W average power cryogenic oscillator [30,150] that produced22.8 mJ/pulse at 5 kHz, and with a pulsewidth of 16 ns. The highest average power nanosecondcryogenic laser reported to date [135] produced 8.5 mJ pulses at a 40 kHz repetition rate for an averagepower of 340 W. The pulsewidth produced using an acousto-optic Q-switch was 75 ns.
Appl. Sci. 2016, 6, 23 60 of 73
4.3. Cryogenic Nanosecond Lasers
In this section of the manuscript we review the performance of nanosecond cryogenic laser technology. Figure 46 displays the energy/pulse, repetition rate as a function of average power. Table 9 tabulates the corresponding date, energy/pulse, repetition rate, average power, pulsewidth, and reference [30,135,147–153]. A number of techniques are used to generate nanosecond pulses from cryogenic amplifiers, including acousto-optic or electro-optic Q-Switching, seeded regenerative amplifiers, and in some case regenerative amplifiers followed by one or more power amplifier stages. In [147], 6.5 mJ/pulse at 200 Hz and a 10 ns FWHM pulsewidth, 1.5 mJ at 1 kHz with a 10 ns pulsewidth, and 140 mJ at 100 Hz with a 10 ns pulsewidth were reported, respectively. For this system, a seed laser was used to drive a regenerative amplifier that in turn drove a 4-pass power amplifier. The highest average power produced was 14 W. An earlier paper [148] reported the demonstration of 4.6 mJ pulse energy at a 16 kHz repetition rate in an oscillator configuration that incorporated an acousto-optic Q-switch. The average power produced was 74 W and the pulsewidth 175 nm. Another lower average power cryogenic laser that produced 120 mJ/pulse at a 500 Hz repetition rate, 60 W of average power, and a 70 ns pulsewidth is reported in [149] where a cryogenic Yb:YAG oscillator was used to drive a power amplifier. The cryogenic laser group at MIT, the first to report average power >100 W, demonstrated a 114 W average power cryogenic oscillator [30,150] that produced 22.8 mJ/pulse at 5 kHz, and with a pulsewidth of 16 ns. The highest average power nanosecond cryogenic laser reported to date [135] produced 8.5 mJ pulses at a 40 kHz repetition rate for an average power of 340 W. The pulsewidth produced using an acousto-optic Q-switch was 75 ns.
Figure 46. Nanosecond output energy/pulse (blue) and repetition rate (pink) as a function of average power at 1029 nm from demonstrated Yb:YAG cryogenic lasers in the years 2005–2014.
Table 9. Reported Cryogenic Q-Switched Yb:YAG Demonstrations From 2005–2011.
Year Energy/Pulse
(mJ) Repetition Rate
(Hz) Average Power
(W) Pulsewidth
(ns) Reference
2005 4.6 16,000 74 175 [148] 2010 6.5 5000 114 15 [147] 2010 1.5 200 1.3 10 [147] 2010 140 1000 1.5 10 [153] 2010 22.8 5000 114 16 [30,150] 2011 4.5 40,000 340 75 [135] 2013 120 500 80 70 [149] 2013 10,100 1 10.1 10 [152] 2014 3050 10 30.5 10 [151]
Figure 46. Nanosecond output energy/pulse (blue) and repetition rate (pink) as a function of averagepower at 1029 nm from demonstrated Yb:YAG cryogenic lasers in the years 2005–2014.
Table 9. Reported Cryogenic Q-Switched Yb:YAG Demonstrations From 2005–2011.
Year Energy/Pulse(mJ)
RepetitionRate (Hz)
Average Power(W)
Pulsewidth(ns) Reference
2005 4.6 16,000 74 175 [148]2010 6.5 5000 114 15 [147]2010 1.5 200 1.3 10 [147]2010 140 1000 1.5 10 [153]2010 22.8 5000 114 16 [30,150]2011 4.5 40,000 340 75 [135]2013 120 500 80 70 [149]2013 10,100 1 10.1 10 [152]2014 3050 10 30.5 10 [151]
Appl. Sci. 2016, 6, 23 62 of 74
Two high energy/pulse, low repetition rate cryogenic nanosecond lasers have been reported inthe literature. The first [151] achieved 3.05 J/pulse at 10 Hz for an average power of 30.5 W and with a10 ns pulsewidth, using a seeded regenerative amplifier followed by active-mirror pre-amplifier andpower amplifier stages. The largest energy/pulse was demonstrated in connection with the DiPOLE(Diode-Pumped Optical Laser Experiment) project [152]; 10.1 J/pulse at a 1 Hz repetition rate wasobtained with a 10 ns pulsewidth and producing 10.1 W of average power. The laser can also produce6.4 J/pulse at 10 Hz repetition rate. This laser system is innovative in that it uses cryogenically cooledHe gas to remove heat from a parallel array of Yb:YAG laser slabs in an arrangement very reminiscentof the Mercury laser project at Lawrence Livermore National Laboratory (LLNL) in the US, where theconcept of using stacks of aerodynamically shaped slab holders originated [154]. While we have notspecifically discussed the methods of cryogenic-cooling in this article, here we mention that the use ofHe at cryogenic temperatures to cool laser crystals is in its infancy. Another innovative way to coollaser disks and slabs has recently been published [155] that uses a static He layer that separates anactive-mirror amplifier from a copper plate cooled to 77 K using liquid nitrogen. This technique caneliminate the soldering of laser disks to high thermal conductivity materials such as Cu or CuW, andsubstantially increases the lifetime of HR coatings on active-mirror disks that can be degraded fromcontact with liquid coolants such as water or liquid nitrogen.
4.4. Cryogenic Ultrafast (Picosecond and Femtosecond) Lasers
In this final section of our paper, we discuss the application of cryogenic laser technologyto enhancing the performance of ultrafast lasers operating in the picosecond and femtosecondregimes. Cryogenic cooling has been implemented to enhance the performance of Ti:Al2O3 inrecent years [31,33–35], for example, and even commercial companies have begun to incorporatethe technology. The enhancement of Ti:Al2O3 ultrafast systems at present incorporates closed cycleGifford-McMahon or pulse tube coolers to reduce thermal focusing, usually in the pre-amplifier stageof a chirped-pulse-amplification (CPA) system. While the thermal properties of such systems areimproved, dramatic improvements have not been demonstrated, partly because sapphire alreadyhas a large thermal conductivity at room temperature. State-of-the-art Ti:Al2O3 CPA systems havebeen limited in average power for quite some time to <100 W. Orders of magnitude increases in theaverage power capability of Ti:Al2O3 however may be achieved through the development of powerfulnew cryogenic pump lasers, providing kilowatt average power capability. Several current efforts toproduce picosecond high average power cryogenic lasers at the 1 J/pulse level and greater at kHzrepetition rates, discussed later in this section, provide validation to designs capable of producinghigh average power nanosecond cryogenic frequency-doubled green lasers with high efficiency, tobe used as pump sources for high-average-power CPA Ti:Al2O3 lasers. At the present time greenpump sources are typically limited to 10–30 Hz repetition rates, although lower peak power systemscan operate at kHz repetition rates as well. To produce HAPP Ti:Al2O3 systems with high peak andaverage powers, however, it is likely that all Ti:Al2O3 amplifiers as well as their pump lasers will needto be cryogenically-cooled.
A second application for cryogenic laser technology for ultrafast lasers is to build strong joule-levelpumps operating with kHz repetition rates, to drive optical parametric chirped-pulse-amplification(OPCPA) ultrafast systems, recently described as third-generation femtosecond technology [156].Parametric amplification has garnered much attention recently because it generates only small amountsof heat and is capable of providing very broad gain bandwidths allowing the production of few-cyclesystems. The development of borate based nonlinear crystals such as BBO and LBO, materials with highdamage thresholds, has considerably aided the development of OPCPA femtosecond lasers. OPCPAhas already produced femtosecond laser performance, and is presently limited by currently availablepump sources. The need for better pump sources has been discussed in the literature [156,157], withnear universal agreement that high average power pumps with very good beam-quality and pulsedurations near ~1 ps and operating in the near-infrared regions are required. Near-infrared sources
Appl. Sci. 2016, 6, 23 63 of 74
such as Yb operating near 1030 nm are expected to provide fundamental, second, and third harmonicpumping at high average power, and the recent intensive development of Yb based cryogenic lasersources seem well-positioned to address this need.
In Table 10, we show reported demonstrations of cryogenic Yb:YAG, Yb:YLF, and Yb:Y2O3 in thetime period 2003 through 2015, and the output parameters that were achieved. We list, in order fromleft to right, the year, the crystal type, the pulse energy Ep, repetition rate νr, average power Pav, thegain bandwith ∆λC (from Table 6), laser operating wavelength λL, the Gaussian transform-limitedpulsewidth δtTL, the seed bandwidth ∆λS, the seed pulsewidth δtTLS, the amplifier bandwidth ∆λA,the amplifier expected pulsewidth δtTLA, the measured output pulsewidth δtMEAS, the peak powerPP, and the corresponding reference [30,110,132,155,158–169]. Other acronyms found in the Tableare BC (before-recompression), AC (after-recompression), R (cryogenic regenerative amplifier), SHG(second-harmonic-generation), UC for (not re-compressed), and E for estimated. We also use σ todenote use of the σ transition in Yb:YLF. The majority of demonstrations listed in Table 10 involve theuse of multi-pass cryogenic Yb:YAG or Yb:YLF amplifiers to boost the peak and average powers ofpicosecond laser systems, with most systems targeted for use as pumps in OPCPA femtosecond lasers.Another application of interest is the generation of table-top X-ray lasers. We also show in Table 10 thefrequency-doubled results, where applicable. Most of the reported cryogenic systems in Table 10 usethe CPA technique to stretch seed pulses so as to obtain a higher damage threshold; in a few cases,direct amplification was used to avoid the losses and added complexity of CPA systems.
The Gaussian transform-limited pulsewidth δtTL is calculated for cryogenic temperatures near80 K, and uses the bandwidths taken from Table 6 as well as the operating wavelength of the specificlaser system. The bandwidth of the seed laser, ∆λS, is taken from the referenced paper where provided,and used to calculated the transform-limited output pulsewidth δtS value supported by that bandwidth.For the cryogenic multi-pass or regenerative amplifier, the amplifier bandwidth ∆λA measurementreported in the publication is stated, and again the transform-limited pulse duration δtA supported bythat value is calculated. We then show the reported pulsewidth measurement δtMEAS, allowing one toascertain, in the reported stretcher-compressor CPA systems, how closely the obtained pulsewidthafter compression is to the transform-limited value. The transform-limited pulsewidth for Yb:YAGat 80 K is about 1.04 ps (bandwidth of about 1.5 nm at 80 K), a value that has not yet been closelyapproached. This is a consequence of gain-narrowing that takes place in multi-pass amplifiers, andparticularly in regenerative amplifiers where many passes of the gain medium occur. Regenerativeamplifiers can have bandwidths <0.2 nm, so the obtained output pulsewidths tend to be > about 8 ps.Imperfect compression stretches the pulses even further. A number of techniques have been usedto reduce the effects of gain-narrowing and to provide a seed laser for the demonstrations listed inTable 10 with broadband pulses entering the regenerative amplifier. In order to obtain pulsewidths inthe femtosecond regime, researchers have sought laser materials with a broader bandwidth at 80 K.One such material is Yb:YLF, which has a gain bandwidth of about 27 nm and is capable of producing~100 fs pulses. Table 10 shows that sub-ps pulses have been produced by two groups [155,167]. Othermaterials such as Yb:GSAG [30] have been developed as well to drive obtained pulsewidths from Ybbased lasers into the femtosecond regime. Yb:CaF2 has also been recently developed as a promising fslaser materials, due to a broad bandwidth that remains broad even at 80 K. At room temperature, aYb:CaF2 laser is reported with a pulsewidth of 99 fs [111]. A cryogenic laser using the closely relatedmaterial Yb:CaNaF2 laser has produced 173 fs pulses [170]. While we have not discussed a number ofpromising Yb based laser materials in this paper, choosing to concentrate here only on significant highaverage as well as peak power results at cryogenic temperatures, it is clear that Yb lasers are an activeand vibrant research topic today, and that in the near future other newer laser materials will be used toadvance the state-of-the-art.

Appl. Sci. 2016, 6, 23 64 of 74
Table 10. Reported Yb:YAG, Yb:YLF, and Yb:Y2O3 Cryogenic Picosecond and Femtosecond Demonstrations From 2003–2015.
Year CrystalType
Ep (mJ) νr (Hz) Pav (W) ∆λC (nm)Table 6 λL (nm) δtTL (ps) ∆λS (nm) δtTLS
(ps)∆λA(nm)
δtTLA(ps)
δtMEAS(ps) PP (W) Ref
2003 Yb:YLF 30 ˆ 10´3 BC 20 3.6 27.0 1017 0.097 15 0.101 5 0.304 0.795 11.64 ˆ 109 [155]σ 18 ˆ 10´3 AC
2007 Yb:YAG 0.296 ˆ 10´3 80 ˆ 102 24.0 1.5 1029 1.038 1.45 10.7 1.33 11.7 11.7 25.6 ˆ 106 [158]
2007 Yb:YAG 0.99 ˆ 10´3 20 ˆ 103 19.8 1.5 1029 1.038 1.45 10.7 1.33 11.7 11.7 84.6 ˆ 106 [158]
2007 Yb:YAGSHG
8 ˆ 10´3 BC10 ˆ 103
0.0751.5
10291.038 17.0 0.092 0.5 3.1
34.5217.5 ˆ 106 [159]7.5 ˆ 10´3 AC 0.019 515 25.0
1.9 ˆ 10´3
2008 Yb:YAG 3.7 ˆ 10´6 78 ˆ 106 287 1.5 1029 1.038 0.4 3.89 0.3 5.2 5.5 0.67 ˆ 106 [160]
2009 Yb:YAG 3.1 ˆ 10´678 ˆ 106 240 1.5 1029 1.038 0.4 3.89
0.3 5.2 8.0 0.39 ˆ 106
[161]0.2 1.9 6.4 0.26 ˆ 106
SHG 1.8 ˆ 10´6 130 515
2009 Yb:YAG 1.45 BC 10 10.2 1.5 1029 1.038 - - - - 8.5 0.12 ˆ 1012 [162]1.02 AC
2010 Yb:YAG 40 ˆ 10´3 BC 2 ˆ 103 80 1.5 1029 1.038 0.24 6.49 0.10 15.0 - 2.13 ˆ 109 [163]32 ˆ 10´6 AC
2010Yb:YAG 15.16 ˆ 10´6
50 ˆ 106758
1.51029
1.038 0.82 1.90 0.16 9.7 12.4 1.23 ˆ 106[132]
SHG 1.20 ˆ 10´6 60 515 11.8 0.10 ˆ 106
2011Yb:YAG 8.38 x10´6
50 ˆ 106419
1.51029
1.038 0.82 1.90 0.16 9.7 12.4 0.68 ˆ 106[164]
SHG 4.02 x 10´6 201 515 12.4 0.32 ˆ 106
2011 Yb:YAG 20 ˆ 10´3 BC 2 ˆ 103 20 1.5 1029 1.038 0.70 2.22 0.24 6.5 14.2 0.915 ˆ 109 [165]13 ˆ 10´3 AC
2011 Yb:YAG 140 ˆ 10´3 BC 100 10 1.5 1029 1.038 0.55 2.83 0.35 4.45 4.8 20.83 ˆ 109 [166]100 ˆ 10´3 AC
2011 Yb:YAG 23 ˆ 10´3 UC 5 ˆ 103 115 1.5 1030 1.040 1.0 1.56 0.30 5.2 - 4.4 ˆ 109 (E) [30]
2011 Yb:YAG+ 14.6 ˆ 10´3 BC 5 ˆ 103 60 - 1030 - 1.1 1.42 0.70 2.2 1.6 7.5 ˆ 109 [30]Yb:GSAG 12 ˆ 10´3 AC
2012 Yb:YLF10.6 ˆ 10´3 10 ˆ 103 106 27.0 1020 1.038 2.40 0.65 2.20 0.71 0.865 12.3 ˆ 109 [167]σ
2014 Yb:Y2O3 0.70 ˆ 10´31 ˆ 103 0.70 14.3 1031 0.109 - - - - - - [168](R) (UC)
2015 Yb:YAG 100 ˆ 10´3 (UC) 250 25.0 1.5 1029 1.038 - - - - - - [169]2015 Yb:YAG 72 1 72 1.5 1030.5 1.038 1.0 1.57 0.35 4.45 5.9 8.0 ˆ 109 [110]
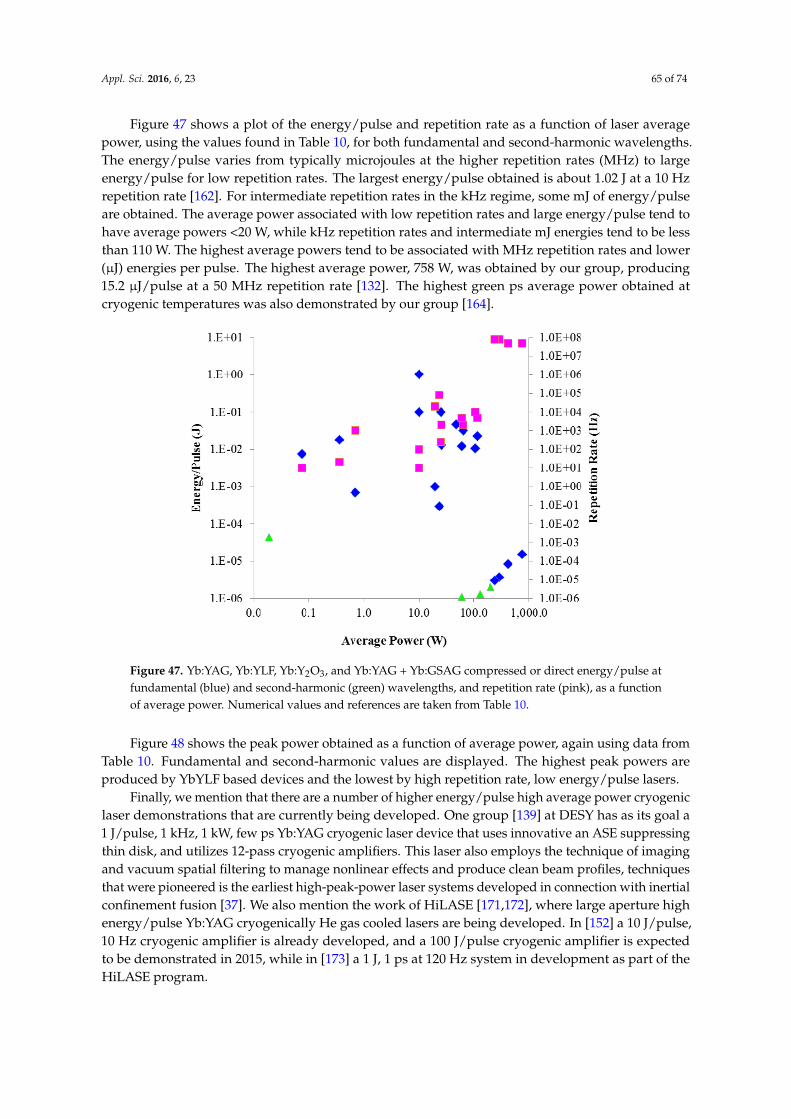
Appl. Sci. 2016, 6, 23 65 of 74
Figure 47 shows a plot of the energy/pulse and repetition rate as a function of laser averagepower, using the values found in Table 10, for both fundamental and second-harmonic wavelengths.The energy/pulse varies from typically microjoules at the higher repetition rates (MHz) to largeenergy/pulse for low repetition rates. The largest energy/pulse obtained is about 1.02 J at a 10 Hzrepetition rate [162]. For intermediate repetition rates in the kHz regime, some mJ of energy/pulseare obtained. The average power associated with low repetition rates and large energy/pulse tend tohave average powers <20 W, while kHz repetition rates and intermediate mJ energies tend to be lessthan 110 W. The highest average powers tend to be associated with MHz repetition rates and lower(µJ) energies per pulse. The highest average power, 758 W, was obtained by our group, producing15.2 µJ/pulse at a 50 MHz repetition rate [132]. The highest green ps average power obtained atcryogenic temperatures was also demonstrated by our group [164].
Appl. Sci. 2016, 6, 23 64 of 73
Figure 47 shows a plot of the energy/pulse and repetition rate as a function of laser average power, using the values found in Table 10, for both fundamental and second-harmonic wavelengths. The energy/pulse varies from typically microjoules at the higher repetition rates (MHz) to large energy/pulse for low repetition rates. The largest energy/pulse obtained is about 1.02 J at a 10 Hz repetition rate [162]. For intermediate repetition rates in the kHz regime, some mJ of energy/pulse are obtained. The average power associated with low repetition rates and large energy/pulse tend to have average powers <20 W, while kHz repetition rates and intermediate mJ energies tend to be less than 110 W. The highest average powers tend to be associated with MHz repetition rates and lower (µJ) energies per pulse. The highest average power, 758 W, was obtained by our group, producing 15.2 µJ/pulse at a 50 MHz repetition rate [132]. The highest green ps average power obtained at cryogenic temperatures was also demonstrated by our group [164].
Figure 47. Yb:YAG, Yb:YLF, Yb:Y2O3, and Yb:YAG + Yb:GSAG compressed or direct energy/pulse at fundamental (blue) and second-harmonic (green) wavelengths, and repetition rate (pink), as a function of average power. Numerical values and references are taken from Table 10.
Figure 48 shows the peak power obtained as a function of average power, again using data from Table 10. Fundamental and second-harmonic values are displayed. The highest peak powers are produced by YbYLF based devices and the lowest by high repetition rate, low energy/pulse lasers.
Finally, we mention that there are a number of higher energy/pulse high average power cryogenic laser demonstrations that are currently being developed. One group [139] at DESY has as its goal a 1 J/pulse, 1 kHz, 1 kW, few ps Yb:YAG cryogenic laser device that uses innovative an ASE suppressing thin disk, and utilizes 12-pass cryogenic amplifiers. This laser also employs the technique of imaging and vacuum spatial filtering to manage nonlinear effects and produce clean beam profiles, techniques that were pioneered is the earliest high-peak-power laser systems developed in connection with inertial confinement fusion [37]. We also mention the work of HiLASE [171,172], where large aperture high energy/pulse Yb:YAG cryogenically He gas cooled lasers are being developed. In [152] a 10 J/pulse, 10 Hz cryogenic amplifier is already developed, and a 100 J/pulse cryogenic amplifier is expected to be demonstrated in 2015, while in [173] a 1 J, 1 ps at 120 Hz system in development as part of the HiLASE program.
Figure 47. Yb:YAG, Yb:YLF, Yb:Y2O3, and Yb:YAG + Yb:GSAG compressed or direct energy/pulse atfundamental (blue) and second-harmonic (green) wavelengths, and repetition rate (pink), as a functionof average power. Numerical values and references are taken from Table 10.
Figure 48 shows the peak power obtained as a function of average power, again using data fromTable 10. Fundamental and second-harmonic values are displayed. The highest peak powers areproduced by YbYLF based devices and the lowest by high repetition rate, low energy/pulse lasers.
Finally, we mention that there are a number of higher energy/pulse high average power cryogeniclaser demonstrations that are currently being developed. One group [139] at DESY has as its goal a1 J/pulse, 1 kHz, 1 kW, few ps Yb:YAG cryogenic laser device that uses innovative an ASE suppressingthin disk, and utilizes 12-pass cryogenic amplifiers. This laser also employs the technique of imagingand vacuum spatial filtering to manage nonlinear effects and produce clean beam profiles, techniquesthat were pioneered is the earliest high-peak-power laser systems developed in connection with inertialconfinement fusion [37]. We also mention the work of HiLASE [171,172], where large aperture highenergy/pulse Yb:YAG cryogenically He gas cooled lasers are being developed. In [152] a 10 J/pulse,10 Hz cryogenic amplifier is already developed, and a 100 J/pulse cryogenic amplifier is expectedto be demonstrated in 2015, while in [173] a 1 J, 1 ps at 120 Hz system in development as part of theHiLASE program.
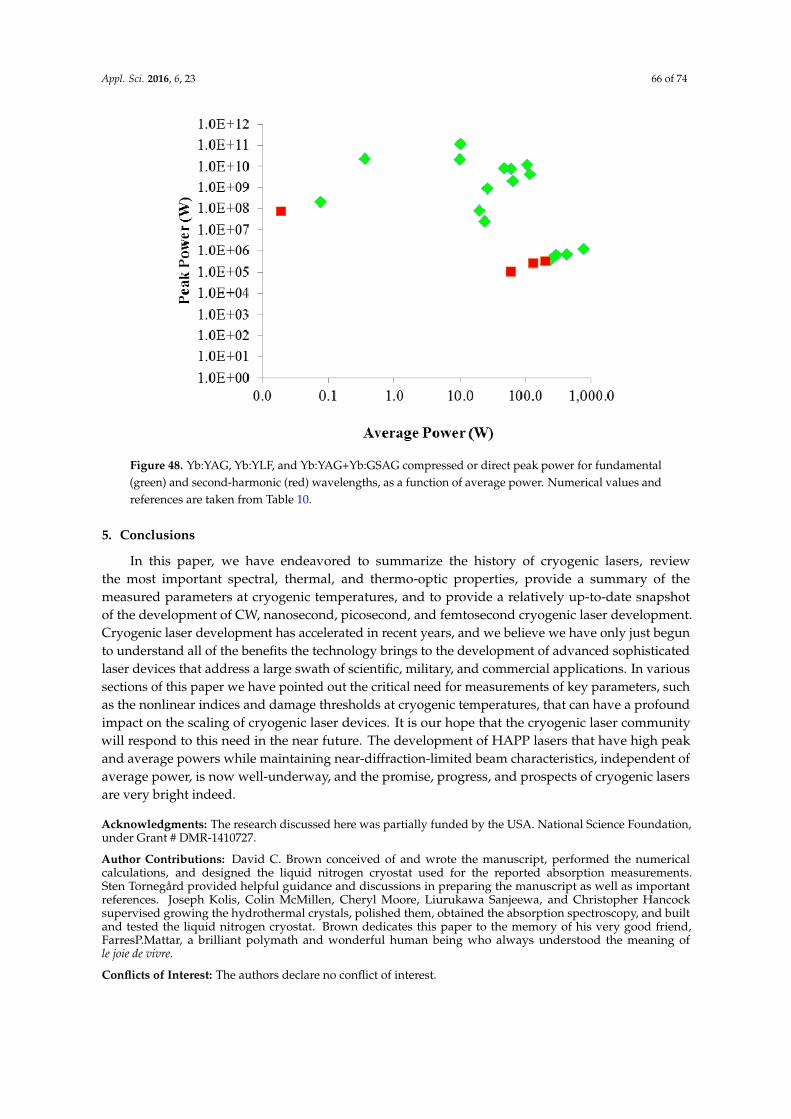
Appl. Sci. 2016, 6, 23 66 of 74Appl. Sci. 2016, 6, 23 65 of 73
Figure 48. Yb:YAG, Yb:YLF, and Yb:YAG+Yb:GSAG compressed or direct peak power for fundamental (green) and second-harmonic (red) wavelengths, as a function of average power. Numerical values and references are taken from Table 10.
5. Conclusions
In this paper, we have endeavored to summarize the history of cryogenic lasers, review the most important spectral, thermal, and thermo-optic properties, provide a summary of the measured parameters at cryogenic temperatures, and to provide a relatively up-to-date snapshot of the development of CW, nanosecond, picosecond, and femtosecond cryogenic laser development. Cryogenic laser development has accelerated in recent years, and we believe we have only just begun to understand all of the benefits the technology brings to the development of advanced sophisticated laser devices that address a large swath of scientific, military, and commercial applications. In various sections of this paper we have pointed out the critical need for measurements of key parameters, such as the nonlinear indices and damage thresholds at cryogenic temperatures, that can have a profound impact on the scaling of cryogenic laser devices. It is our hope that the cryogenic laser community will respond to this need in the near future. The development of HAPP lasers that have high peak and average powers while maintaining near-diffraction-limited beam characteristics, independent of average power, is now well-underway, and the promise, progress, and prospects of cryogenic lasers are very bright indeed.
Acknowledgments: The research discussed here was partially funded by the USA. National Science Foundation, under Grant # DMR-1410727.
Author Contributions: David C. Brown conceived of and wrote the manuscript, performed the numerical calculations, and designed the liquid nitrogen cryostat used for the reported absorption measurements. Sten Tornegård provided helpful guidance and discussions in preparing the manuscript as well as important references. Joseph Kolis, Colin McMillen, Cheryl Moore, Liurukawa Sanjeewa, and Christopher Hancock supervised growing the hydrothermal crystals, polished them, obtained the absorption spectroscopy, and built and tested the liquid nitrogen cryostat. Brown dedicates this paper to the memory of his very good friend, FarresP.Mattar, a brilliant polymath and wonderful human being who always understood the meaning of le joie de vivre.
Conflicts of Interest: The authors declare no conflict of interest.
References
Figure 48. Yb:YAG, Yb:YLF, and Yb:YAG+Yb:GSAG compressed or direct peak power for fundamental(green) and second-harmonic (red) wavelengths, as a function of average power. Numerical values andreferences are taken from Table 10.
5. Conclusions
In this paper, we have endeavored to summarize the history of cryogenic lasers, reviewthe most important spectral, thermal, and thermo-optic properties, provide a summary of themeasured parameters at cryogenic temperatures, and to provide a relatively up-to-date snapshotof the development of CW, nanosecond, picosecond, and femtosecond cryogenic laser development.Cryogenic laser development has accelerated in recent years, and we believe we have only just begunto understand all of the benefits the technology brings to the development of advanced sophisticatedlaser devices that address a large swath of scientific, military, and commercial applications. In varioussections of this paper we have pointed out the critical need for measurements of key parameters, suchas the nonlinear indices and damage thresholds at cryogenic temperatures, that can have a profoundimpact on the scaling of cryogenic laser devices. It is our hope that the cryogenic laser communitywill respond to this need in the near future. The development of HAPP lasers that have high peakand average powers while maintaining near-diffraction-limited beam characteristics, independent ofaverage power, is now well-underway, and the promise, progress, and prospects of cryogenic lasersare very bright indeed.
Acknowledgments: The research discussed here was partially funded by the USA. National Science Foundation,under Grant # DMR-1410727.
Author Contributions: David C. Brown conceived of and wrote the manuscript, performed the numericalcalculations, and designed the liquid nitrogen cryostat used for the reported absorption measurements.Sten Tornegård provided helpful guidance and discussions in preparing the manuscript as well as importantreferences. Joseph Kolis, Colin McMillen, Cheryl Moore, Liurukawa Sanjeewa, and Christopher Hancocksupervised growing the hydrothermal crystals, polished them, obtained the absorption spectroscopy, and builtand tested the liquid nitrogen cryostat. Brown dedicates this paper to the memory of his very good friend,FarresP.Mattar, a brilliant polymath and wonderful human being who always understood the meaning ofle joie de vivre.
Conflicts of Interest: The authors declare no conflict of interest.
Appl. Sci. 2016, 6, 23 67 of 74
References
1. Lacovara, P.; Choi, H.K.; Wang, C.A.; Aggarwal, R.L.; Fan, T.Y. Room-temperature diode-pumped Yb:YAGlaser. Opt. Lett. 1991, 16, 1089–1091. [CrossRef] [PubMed]
2. Brown, D.C. The promise of cryogenic lasers. IEEE J. Sel. Top. Quantum Electron. 2005, 11, 587–599. [CrossRef]3. Fan, T.Y.; Ripin, D.J.; Aggarwal, R.L.; Ochoa, J.R.; Chann, B.; Tilleman, M.; Spitzberg, J. Cryogenic Yb3+-doped
solid-state lasers, Invited Paper. IEEE J. Sel. Top. Quantum Electron. 2007, 13, 448–459. [CrossRef]4. Wall, K.F.; Moulton, P.F. High power operation of cryogenic Yb:YAG. In Proceedings of the SPIE, San Jose,
CA, USA, 23 January 2007.5. Keyes, R.J.; Quist, T.M. Injection luminescent pumping of CaF2:U3+ with GaAs diode lasers. Appl. Phys. Lett.
1974, 4, 50–52. [CrossRef]6. Moulton, P.F. Spectroscopic and laser characteristics of Ti:Al2O3. J. Opt. Soc. Am. B 1986, 3, 125–133.
[CrossRef]7. Moulton, P.F. Efficient cw optically pumped Ni:MgF2 laser. Opt. Lett. 1978, 3, 164–166. [CrossRef] [PubMed]8. Moulton, P.F. Broadly tunable cw operation of Ni:MgF2 and Co:MgF2 lasers. Appl. Phys. Lett. 1979, 35,
838–840. [CrossRef]9. Moulton, P.F. Pulse-pumped operation of divalent transition-metal lasers. IEEE J. Quantum Electron. 1982, 18,
1185–1188. [CrossRef]10. Moulton, P.F. An investigation of the Co:MgF2 system. IEEE J. Quantum Electron. 1985, 21, 1582–1595.
[CrossRef]11. Schulz, P.A. Liquid-nitrogen-cooled Ti:Al2O3 laser. IEEE J. Quantum Electron. 1991, 27, 1039–1047. [CrossRef]12. Johnson, J.F.; Dietz, R.E.; Guggenheim, H.J. Optical maser oscillation from Ni2+ in MgF2 involving
simultaneous emission of phonons. Phys. Rev. Lett. 1963, 11, 318–320. [CrossRef]13. Doehler, J.; Solin, S.A. A compact efficient liquid nitrogen system for cooling solid state lasers: Application
to YAG:Nd3+ and ABC-YAG. Rev. Sci. Instr. 1972, 43, 1189–1193. [CrossRef]14. Beck, R.; Gürs, K. Ho laser with 50-W output and 6.5% slope efficiency. J. Appl. Phys. 1975, 48, 5224–5225.
[CrossRef]15. Kaminskii, A.A. Laser Crystals; Springer-Verlag: Berlin, Germany; Heidelberg, Germany; New York, NY,
USA, 1990.16. Kaminskii, A.A. Crystalline Lasers: Physical Processes and Operating Schemes; CRC Press: Boca Raton, FL,
USA, 1996.17. Bowess, C. Liquid Nitrogen Cooled Ruby Laser. US Patent 3339150, 29 August 1967.18. McMahon, D.H. Cooling System for Laser Media. US Patent 3676798, 11 July 1972.19. Brown, D.C.; Nelson, R. Ultra-high-average-power diode-pumped Nd:YAG and Yb:YAG lasers. BMDO
Phase I Small Business Innovation Research Contract # N00P14-97-P-2064 Final Report. 1998.20. Brown, D.C. Ultrahigh-average-power diode-pumped Nd:YAG and Yb:YAG lasers. IEEE J. Quantum Electron.
1997, 33, 863–873. [CrossRef]21. Brown, D.C. Nonlinear Thermal Distortion in YAG Rod Amplifiers. IEEE J. Quantum Electron. 1998, 33,
2383–2392. [CrossRef]22. Brown, D.C. Nonlinear Thermal and Stress Effects and Scaling Behavior of YAG Slab Amplifiers. IEEE J.
Quantum Electron. 1998, 33, 2393–2402. [CrossRef]23. Fan, T.Y.; Daneu, J.J. Thermal coefficients of the optical path length and refractive index in YAG. Appl. Opt.
1998, 37, 1735–1637. [CrossRef]24. Fan, T.Y.; Crow, T.; Hoden, B. Cooled Yb:YAG for high power solid-state lasers. In Airborne Laser Advanced
Technology (Proceedings of SPIE); SPIE Press: Bellingham, MA, USA, 1998; Volume 3381, pp. 200–215.25. Glur, H.; Lavi, R.; Grat, T. Reductions of thermally induced lenses in Nd; YAG with low temperatures. IEEE
J. Quantum Electron. 2004, 40, 499–503. [CrossRef]26. Wynne, R.; Daneu, J.J.; Fan, T.Y. Thermal coefficients of the expansion and refractive index in YAG. Appl.
Opt. 1999, 38, 3282–3284. [CrossRef] [PubMed]27. Brown, D.C.; Cone, R.L.; Sun, Y.; Equall, R.W. Yb:YAG absorption at ambient and cryogenic temperatures.
IEEE J. Sel. Top. Quantum Electron. 2005, 11, 604–612. [CrossRef]28. Brown, D.C.; Bruno, T.M.; Vitali, V. Saturated Absorption Effects in CW-Pumped Solid-State Lasers. IEEE J.
Quantum Electron. 2010, 40, 1717–1725. [CrossRef]
Appl. Sci. 2016, 6, 23 68 of 74
29. Aggarwal, R.L.; Ripin, D.J.; Ochoa, J.R.; Fan, T.Y. Measurement of thermo-optic properties of Y3Al5O12,Lu3Al5O12, YAlO3, LiYF4, BaY2F8, KGd(WO4)2, and KY(WO4)2 laser crystals in the 80–300 K temperaturerange. J. Appl. Phys. 2005, 98, 1–14.
30. Rand, D.; Miller, D.; Ripin, D.J.; Fan, T.Y. Cryogenic Yb3+-doped materials for pulsed solid-state laserapplications. Opt. Mater. Express 2011, 1, 434–450. [CrossRef]
31. Backus, S.; Durfee, C.G., III; Mourou, G.; Kapteyn, H.; Murnane, M.M. 0.2-TW laser system at 1 Hz. Opt. Lett.1997, 22, 1256–1258. [CrossRef] [PubMed]
32. Backus, S.; Durfee, C.G., III; Murnane, M.M.; Kapteyn, H. High power ultrafast lasers. Rev. Sci. Instrum.1998, 69, 1207–1223. [CrossRef]
33. Matsushima, I.; Yashiro, H.; Tomie, T. A 37% efficiency, kilohertz repetition rate cryogenically cooledTi:Sapphire regenerative amplifier. Jpn. J. Appl. Phys. 2005, 25, L823–L826. [CrossRef]
34. Dantan, A.; Laurat, J.; Ourjoumtsev, A.; Tualle-Brouri, R.; Grangier, P. Femtosecond Ti:Sapphire cryogenicamplifier with high gain and MHz repetition rate. Opt. Express 2007, 15, 8864–8870. [CrossRef] [PubMed]
35. Planchon, T.A.; Amir, W.; Childress, C.; Squier, J.A.; Durfee, C.G. Measurement of pump-induced transientlensing in a cryogenically-cooled high average power Ti:Sapphire amplifier. Opt. Express 2008, 16,18557–18564. [CrossRef] [PubMed]
36. Maiman, T.H. Stimulated Optical Radiation in Ruby. Nature 1960, 187, 493–494. [CrossRef]37. Brown, D.C. High-Peak-Power Nd:Glass Laser Systems. In Springer Series in Optical Sciences; Springer-Verlag:
Berlin, Germany; Heidelberg, Germany, 1981.38. Brown, D.C.; Vitali, V.A. Yb:YAG kinetics model including saturation and power conservation. IEEE J.
Quantum Electron. 2011, 47, 3–12. [CrossRef]39. Kittel, C. Introduction to Solid-State Physics, 8th ed.; John Wiley and Sons, Inc.: Hoboken, NJ, USA, 2005.40. Zhou, Y.; Xiang, H.; Feng, Z. Theoretical investigation on mechanical and thermal properties of a promising
thermal barrier material: Yb3Al5O12. J. Mater. Sci. Technol. 2014, 30, 631–638. [CrossRef]41. Jiji, L.M. Heat Conduction, 3rd ed.; Springer-Verlag: Berlin, Germany; Heidelberg, Germany; New York, NY,
USA, 2009.42. Klemens, P.G. Thermal resistance due to point defects at high temperature. Phys. Rev. 1960, 119, 507–509.
[CrossRef]43. McMillen, C.D.; Thompson, D.; Tritt, T.; Kolis, J.W. Hydrothermal single crystal growth of Lu2O3 and
lanthanide doped Lu2O3. Cryst. Growth Des. 2011, 11, 4386–4391. [CrossRef]44. Greibner, U.; Petrov, V.; Petermann, K.; Peters, V. Passively mode-locked Yb:Lu2O3 laser. Opt. Express 2004,
12, 3125–3130. [CrossRef]45. Slack, G.A.; Oliver, D.W. Thermal conductivity of garnets and phonon scattering by rare-earth ions. Phys.
Rev. 1971, 4, 592–609. [CrossRef]46. Holland, M.G. Thermal conductivity of several optical maser materials. J. Appl. Phys. 1962, 33, 2910–2911.
[CrossRef]47. Padture, N.P.; Klemens, P.G. Low thermal conductivity in garnets. J. Am. Ceram. Soc. 1997, 80, 1018–1020.
[CrossRef]48. Klopp, P. New Yb3+-Doped Laser Materials and Their Application in Continuous-Wave and Mode-Locked
Lasers. Ph.D. Thesis, University of Berlin, Berlin, Germany, 2006.49. Fredrich-Thornton, S.T. Nonlinear Losses in Single Crystalline and Ceramic Yb:YAG Thin Disk Lasers. Ph.D.
Thesis, University of Hamburg, Hamburg, Germany, 2010.50. Beil, K.; Saraceno, C.J.; Schriber, C.; Emaury, F.; Heckl, O.H.; Baer, C.R.E.; Golling, M.; Südmeyer, T.; Keller, U.;
Kränkel, C.; et al. Yb-doped mixed sesquioxides for ultrashort pulse generation in the thin disk laser setup.Appl. Phys. B Lasers Opt. 2013, 113, 13–18. [CrossRef]
51. Koopman, P.; Lamrini, S.; Scholle, K.; Fuhrberg, P.; Petermann, K.; Huber, G. High Power Diode Pumped 1µm laser operation of Tm:Lu2O3. In Proceedings of the CLEO/QELS Conference 2010, Optical Society ofAmerica Paper CMDD1, San Jose, CA, USA, 16–21 May 2010.
52. Nikogosyan, D.N. Properties of Optical and Laser-Related Materials: A Handbook; John Wiley and Sons, Inc.:Hoboken, NJ, USA, 1998.

Appl. Sci. 2016, 6, 23 69 of 74
53. Garrec, B.L.; Cardinali, V.; Bourdet, G. Thermo-optical measurements of ytterbium doped ceramics (Sc2O3,Y2O3, Lu2O3, YAG) and crystals (YAG, CaF2) at cryogenic temperatures. In High-Power, High-Energy, andHigh-Intensity Laser Technology; and Research Using Extreme Light; Entering New Frontiers with Petawatt-ClassLasers Proceedings of SPIE; Hein, J., Korn, G., Silva, L.O., Eds.; SPIE Press: Bellingham, WA, USA, 2013.[CrossRef]
54. Popov, P.A.; Federov, P.P.; Kuznetsov, V.A.; Konyushkin, V.A.; Osiko, V.V.; Basiev, T.T. Thermal conductivityof single crystals of Ca1´xYbxF2+x solid solutions. Dokl. Phys. 2008, 53, 198–200. [CrossRef]
55. Toulokian, Y.S.; Kirby, R.K.; Taylor, R.E.; Lee, T.Y.R. Thermophysical Properties of Matter; Plenum Press: NewYork, NY, USA, and London, UK, 1977.
56. Linde, D.R., Ed.; Handbook of Chemistry and Physics, 76th ed.; CRC Press: Boca Raton, FL, USA, 1995.57. Powell, R.L.; Blanpied, W.A. Thermal conductivity of metals and alloys at low temperature. In National
Bureau of Standards Circular 556; U.S. Government Printing Office: Washington, D.C., USA, 1954.58. Yasuhara, R.; Furuse, H.; Iwamoto, A.; Kawanaka, J.; Yagatitani, T. Evaluation of thermo-optic characteristics
of cryogenically cooled Yb:YAG ceramics. Opt. Express 2012, 20, 29532–29539. [CrossRef] [PubMed]59. Cardinalli, V.; Marmois, E.; Garrec, B.L.; Bourdet, G. Determination of the thermo-optic coefficient dn/dT of
ytterbium doped ceramics (Sc2O3, Y2O3, Lu2O3, YAG) and crystals (YAG, CaF2) and neodymium dopedphosphate glass at cryogenic temperature. Opt. Mater. 2012, 34, 990–994. [CrossRef]
60. Reeber, R.R.; Wang, K. Lattice parameters and thermal expansion of important semiconductors and theirsubstrates. Mater. Res. Soc. Symp. 2000, 622, T635.1–T635.6. [CrossRef]
61. Senyshyn, A.; Vasylechko, L. Low temperature crystal structure behavior of complex yttrium aluminumoxides YAlO3 and Y3Al5O12. Acta Phys. Pol. A 2013, 124, 329–335. [CrossRef]
62. Munro, R.G. Analytical representations of elastic moduli data with simultaneous dependence on temperatureand porosity. J. Res. Natl. Inst. Stand. Technol. 2004, 109, 497–503. [CrossRef]
63. Krupke, W.F.; Shinn, M.D.; Marion, J.E.; Caird, J.A.; Stokowski, S.E. Spectroscopic, optical, andthermomechnical properties of neodymium- and chromium-doped gadolinium scandium gallium garnet.J. Opt. Soc. Am. B 1986, 3, 102–114. [CrossRef]
64. Boyd, R.W.; Lukishova, S.G. Topics in Applied Physics. In Self-Focusing: Past and Present; Springer-Verlag:New York, NY, USA, 2009.
65. Soures, J.M. Selected Papers on High Power Lasers; SPIE Press: Bellingham, MA, USA, 1991.66. Strickland, D.; Mourou, G. Compression of amplified chirped optical pulses. Opt. Commun. 1985, 56, 219–221.
[CrossRef]67. Boyd, R.W. Nonlinear Optics, 2nd ed.; Academic Press: London, UK; San Diego, CA, USA, 2003.68. DeSalvo, R.; Said, A.A.; Hagan, D.J.; van Stryland, E.W.; Sheik-Bahae, M. Infrared to ultraviolet measurements
of two-photon absorption and n2 in wide bandgap solids. IEE J. Quantum Electron. 1996, 32, 1324–1333.[CrossRef]
69. Major, A.; Yoshino, F.; Nikolakakos, I.; Aitchison, J.S.; Smith, P.W.E. Dispersion of the nonlinear index insapphire. Opt. Lett. 2004, 29, 602–604. [CrossRef] [PubMed]
70. Diels, J.C. Ultrashort Laser Pulse Phenomena, 2nd ed.; Elsevier, Inc.: Amsterdam, The Netherlands, 2006.71. Milam, D. Review and assessment of measured values of the nonlinear refractive-index coefficient of fused
silica. Appl. Opt. 1998, 37, 546–550. [CrossRef] [PubMed]72. Senatsky, Y.; Shirahawa, A.; Sato, Y.; Hagiwara, J.; Lu, J.; Ueda, K.; Yagi, H.; Yanagitani, T. Nonlinear refractive
index of ceramic laser media and perspectives on their usage in a high-power laser driver. Laser Phys. Lett.2004, 1, 500–506. [CrossRef]
73. Sanghera, J.; Kim, W.; Villalobos, G.; Shaw, B.; Baker, C.; Frantz, J.; Sadowski, B.; Aggarwal, I. Ceramic LaserMaterials. Materials 2012, 5, 258–277. [CrossRef]
74. Milam, D. Nonlinear refractive index of fluoride crystals. Appl. Phys. Lett. 1977, 32, 822–825. [CrossRef]75. Lagatsky, A.A.; Sarmani, A.R.; Brown, C.T.A.; Sibbett, W.; Kisel, V.E.; Selivanov, A.G.; Denisov, I.A.;
Troshlin, A.E.; Yumashev, K.V.; Kuleshov, N.V.; et al. Yb3+-doped YVO4 crystal for efficient kerr-lensmode locking in solid-state lasers. Opt. Lett. 2005, 30, 3234–3236. [CrossRef] [PubMed]
76. Vodchits, A.I.; Orlovich, V.A.; Apanasevich, P.A. Nonlinear refractive index of vanadate crystals in the nearIR region. J. Appl. Spectrosc. 2012, 78, 918–921. [CrossRef]
Appl. Sci. 2016, 6, 23 70 of 74
77. Major, A.; Nikolakakos, I.; Aitchison, J.S.; Ferguson, A.I.; Langford, N.; Smith, P.W.E. Characterization of thenonlinear refractive index of the laser crystal Yb:KGd(WO4)2. Appl. Phys. B Lasers Opt. 2003, 77, 433–436.[CrossRef]
78. Geints, Y.E.; Kabanov, A.M.; Zemlyanov, A.A.; Bykova, E.E.; Bukin, O.A.; Golik, S.S. Kerr-driven nonlinearrefractive index of air at 800 and 400 nm measured through femtosecond laser pulse filimentation. Appl.Phys. Lett. 2011, 99, 1–3. [CrossRef]
79. DeFranzo, A.C.; Pazol, B.G. Index of refraction measurement of sapphire at low temperatures and visiblewavelengths. Appl. Opt. 1993, 32, 2224–2234. [CrossRef] [PubMed]
80. Uemura, S.; Torizuka, K. Development of a diode-pumped kerr-lens mode-locked Cr:LiSAF laser. IEEE J.Quantum Electron. 2003, 39, 68–73. [CrossRef]
81. Peterson, R.D.; Pham, A.T.; Jensson, H.P.; Cassanho, A.; Castillo, V. Thermo-optical comparison of LiSAF,LiCAF, and LiSGaF. In Proceedings of the Advanced Solid-State Laser Conference, Boston, MA, USA,31 January 1999.
82. Payne, S.A.; Smith, L.K.; Beach, R.L.; Chai, B.H.T.; Tassano, J.K.; DeLoach, L.D.; Kway, W.L.; Solarz, R.W.;Krupke, W.F. Properties of Cr:LiSrAlF6 crystals for laser operation. Appl. Opt. 1994, 33, 5526–5536. [CrossRef][PubMed]
83. Woods, B.W.; Payne, S.A.; Marion, J.E.; Hughes, R.S.; Davis, L.E. Thermomechanical and thermo-opticalproperties of the LiCaAlF6:Cr3+ laser material. J. Opt. Soc. Am. B 1991, 8, 970–977. [CrossRef]
84. Ileri, B. Lattice Matching of Epitaxial Rare-Earth-Doped Dielectric PLD-Films. Ph.D. Thesis, University ofHamburg, Hamburg, Germany, 2007.
85. Weber, M.J. Handbook of Optical Materials: Supplement 2; CRC Press: Boca Raton, FL, USA, 2003.86. Morrison, C.A.; Leavitt, R.P. Handbook on the Physics and Chemistry of Rare Earths; North-Holland: Amsterdam,
The Netherlands, 1982.87. Barnes, N.P.; Gettemy, D.J. Temperature variation of the refractive indices of yttrium lithium flouride. J. Opt.
Soc. Am. 1980, 70, 1244–1247. [CrossRef]88. Zelmon, D.E.; Lee, J.J.; Currin, K.M.; Northridge, J.M.; Perlov, D. Revisiting the optical properties of Nd
doped yttrium orthovanadates. Appl. Opt. 2010, 49, 644–647. [CrossRef] [PubMed]89. Zelmon, D.E.; Northridge, J.M.; Haynes, N.D.; Perlov, D.; Petermann, K. Temperature-dependent Sellmeier
equations for rare-earth sesquioxides. Appl. Opt. 2013, 52, 3824–3828. [CrossRef] [PubMed]90. Paunescu, G. Ytterbium-Doped Femtosecond Solid-State Lasers. Ph.D. Thesis, Friedrich-Schiller University,
Jena, Germany, 2006.91. Singh, J. Optical Properties of Condensed Matter and Applications; John Wiley and Sons, Ltd.: Hoboken, NJ,
USA, 2006.92. Malitson, I.H. Interspeciman comparison of the refractive index of fused silica. JOSA 1965, 55, 1205–1209.
[CrossRef]93. Koechner, W. Solid-State Laser Engineering, 5th ed.; Springer Series in Optical Sciences; Springer-Verlag: Berlin,
Germany; Heidelberg, Germany, 1999.94. Wood, R.M. Laser-Induced Damage of Optical Materials; Series in Optics and Optoelectronics; Institute of
Physics Publishing: Bristol, UK, 2003.95. Stuart, B.C.; Feit, M.D.; Herman, S.; Rubenchik, A.M.; Shore, B.W.; Perry, M.D. Optical ablation by high-power
short-pulse lasers. J. Opt. Soc. Am. B 1996, 13, 459–468. [CrossRef]96. Wang, H.; Zhang, W.; He, H. Laser-induced damage behaviors of antireflective coatings at cryogenic
condition. Appl. Opt. 2012, 51, 8687–8692. [CrossRef] [PubMed]97. Yang, L.; Yuan, H.D.; Deng, H.X.; Xiang, X.; Zheng, W.G.; He, S.B.; Jiang, Y.; Lv, H.B.; Ye, L.; Wang, H.J.; et al.
Influence of ambient temperature on nanosecond and picosecond laser-induced bulk damage of fused silica.Adv. Cond. Matter Phys. 2014, 2014, 1–7. [CrossRef]
98. Mikami, K.; Motokoshi, S.; Fujita, M.; Jitsuno, T.; Kawanaka, J.; Yasuhara, R. Temperature dependence oflaser-induced damage threshold in silica glass. J. Phys. Conf. Ser. 2010, 244, 1–7. [CrossRef]
99. Mikami, K.; Motokoshi, S.; Somekawa, T.; Jitsuno, T.; Fujita, M.; Tanake, K.A. Temperature dependenceof laser-induced damage threshold of optical coatings at different pulsewidths. Opt. Express 2013, 21,28719–28728. [CrossRef] [PubMed]

Appl. Sci. 2016, 6, 23 71 of 74
100. Brown, D.C.; Tornegård, S.; Kolis, J. Cryogenic nanosecond and picosecond high average and peak power(HAPP) pump lasers for ultrafast applications, Paper Submitted to High Power Laser Sci. and Engin. 2015.
101. Eggleston, J.M.; DeShazer, L.G.; Kangas, K.W. Characteristics and kinetics of Ti:Sapphire oscillators. IEEE J.Quantum Electron. 1988, 24, 1009–1015. [CrossRef]
102. Chase, L.L.; Payne, S.A.; Smith, L.K.; Kway, W.L.; Newkirk, H.W.; Chai, B.H.T.; Long, M. Laser performanceand spectroscopy of Cr3+ in LiCaAlF6 and LiSrAlF6. In Proceedings of the Advanced Solid-State LasersConference, Cape Cod, MA, USA, 1 May 1989.
103. Ricaud, S.; Papadopoulos, D.N.; Camy, P.; Moncorge, R.; Courjaud, A.; Mottay, E.; Georges, P.; Druon, F.Highly efficient, high-power, broadly tunable cryogenically cooled and diode-pumped Yb:CaF2. Opt. Lett.2010, 35, 3757–3759. [CrossRef] [PubMed]
104. Brown, D.C.; McMillen, C.D.; Moore, C.; Kolis, J.W.; Envid, V. Spectral properties of hydrothermally-grownNd:LuAG, Yb:LuAG, and Yb:Lu2O3 laser materials. J. Lumin. 2014, 148, 26–32. [CrossRef]
105. Petermann, K.; Huber, G.; Fornasiero, L.; Kuch, S.; Mix, E.; Peters, V.; Basun, S.A. Rare-earth-dopedsesquioxides. J. Lumin. 2010, 87–89, 973–975. [CrossRef]
106. Körner, J.; Jambunathan, V.; Hein, J.; Siefert, R.; Loeser, M.; Siebold, M.; Schramm, U.; Sikocinshi, P.;Lucianetti, A.; Mocek, T.; et al. Spectroscopic characterization of Yb3+-doped laser materials at cryogenictemperatures. Appl. Phys. B Lasers Opt. 2014, 116, 75–81. [CrossRef]
107. Peters, V. Growth and Spectroscopy of Ytterbium-Doped Sesquioxides. Ph.D. Thesis, University of Hamburg,Hamburg, Germany, 2001.
108. Zapata, L.; Ripin, D.J.; Fan, T.Y. Power scaling of cryogenic Yb:LiYF4 lasers. Opt. Lett. 2010, 35, 1854–1856.[CrossRef] [PubMed]
109. Kawanaka, J.; Yamakawa, K.; Niskioka, H.; Ueda, K. Inproved high-field laser characteristics of adiode-pumped Yb:LiYF4 crystal at low temperature. Opt. Express 2002, 10, 455–460. [CrossRef] [PubMed]
110. Rand, D.A.; Shaw, S.E.J.; Ochoa, J.R.; Ripin, D.J.; Taylor, A.; Fan, T.Y.; Martin, H.; Hawes, S.; Zhang, J.;Sarkisyan, S.; et al. Picosecond pulses from a cryogenically cooled, composite amplifier using Yb:YAG andYb:GSAG. Opt. Lett. 2011, 36, 340–342. [CrossRef] [PubMed]
111. Friebel, F.; Druon, F.; Boudeile, J.; Papadopoulus, D.N.; Hanna, M.; Georges, P.; Camy, P.; Doualon, J.L.;Benayad, A.; Moncorgé, R.; et al. Diode-pumped 99 fs Yb:CaF2 oscillator. Opt. Lett. 2009, 34, 1474–1476.[CrossRef] [PubMed]
112. McMillen, C.; Kolis, J.; Sanjeewa, D.; Moore, C.; Brown, D.C. Hydrothermal growth and spectroscopy ofdoped Lu2O3 single crystals. In Paper presented at 20th American Conference on Crystal Growth andEpitaxy, Nonlinear Optical and Host Materials Session 4, Big Sky, MT, USA, 5 August 2015.
113. Heckl, O.H.; Peters, R.; Krankel, C.; Baer, C.R.E.; Saraceno, C.J.; Sudmeyer, T.; Petermann, K.; Keller, U.;Huber, G. Continuous-wave Yb-doped sesquioxide this disk laser with up to 300 W output and 74% efficiency.In Ultrafast Lasers I Session, AMD1, Advanced Solid-State Photonics Conference, San Diego, CA, USA,31 January–3 February 2010.
114. Peters, R.; Krankel, C.; Petermann, K.; Huber, G. Broadly tunable high-power Yb:Lu2O3 thin disk laser with80% slope efficiency. Opt. Express 2007, 15, 7075–7082. [CrossRef] [PubMed]
115. Mun, J.H.; Jouini, A.; Novoselov, A.; Yoshikawa, A.; Kasamoto, T.; Ohta, H.; Shibata, H.; Isshiki, M.;Waseda, Y.; Boulon, G.; et al. Thermal and optical properties of Yb3+-doped Y2O3 single crystal grown by themicro-pulling-down method. Jpn. J. Appl. Phys. 2006, 45, 5885–5888. [CrossRef]
116. McMillen, C.D.; Kolis, J.W. Hydrothermal single crystal growth of Sc2O3 and lanthanide-doped Sc2O3.J. Cryst. Growth 2008, 310, 1939–1942. [CrossRef]
117. McMillen, C.D.; Kolis, J.W. Bulk single crystal growth from hydrothermal solutions. Philos. Mag. 2012, 92,2686–2711. [CrossRef]
118. McMillen, C.; Mann, M.; Fan, J.; Zhu, L.; Kolis, J.W. Revisiting the hydrothermal growth of YAG. J. Cryst.Growth 2012, 356, 58–64. [CrossRef]
119. Moore, C.A.; Brown, D.C.; Sanjeewa, L.D.; McMillen, C.D.; Kolis, J.W. Yb:Lu2O3 hydrothermally-grownsingle-crystal and ceramic absorption spectra obtained between 298 and 80 K. J. Lumin. accepted forpublication. 2015.
Appl. Sci. 2016, 6, 23 72 of 74
120. Brown, D.C.; Kowalewski, K.; Envid, V.; Zembeck, J.; Kolis, J.W.; McMillen, C.D.; Geisber, H. Advancedsmart multi-functional laser crystals for next generation solid-state lasers. In Technology For Defense andSecurity VIII (Proceedings of SPIE); Dubinskii, M., Post, S., Eds.; SPIE Press: Bellingham, MA, USA, 2014.[CrossRef]
121. Sträβer, A.; Ostermeyer, M. Improving the brightness of side pumped power amplifiers by using core dopedceramic rods. Opt. Express 2006, 14, 6687–6693. [CrossRef]
122. Lucianetti, A.; Weber, R.; Hodel, W.; Weber, H.P.; Papashvili, A.; Konyushkin, V.A.; Basiev, T.T. Beam-qualityimprovement pf a passively Q-switched Nd:YAG laser with a core-doped rod. Appl. Opt. 1999, 38, 1777–1783.[CrossRef] [PubMed]
123. Tsunekane, M.; Taira, T. Diode edge-pumped, composite ceramic Nd:YAG/Sm:YAG microchip lasers. InProceedings of the Frontiers in Optics 2010, Rochester, NY, USA, 2010.
124. Bowman, S.R.; O’Connor, S.; Condon, N.J. Diode pumped yellow dysprosium laser. Opt. Express 2012, 20,12906–12911. [CrossRef] [PubMed]
125. Yagi, H.; Bisson, J.F.; Ueda, K.; Yanagitani, T. Y3Al5O12 ceramic absorbers for the suppression of parasiticoscillations in high-power Nd:YAG lasers. J. Lumin. 2006, 121, 88–94. [CrossRef]
126. Ripin, D.J.; Ochoa, J.R.; Aggarwal, R.L.; Fan, T.Y. 165-W cryogenically cooled Yb:YAG laser. Opt. Lett. 2004,29, 2154–2156. [CrossRef] [PubMed]
127. Ripin, D.J.; Ochoa, J.R.; Aggarwal, R.L.; Fan, T.Y. 300-W cryogenically cooled Yb:YAG laser. IEEE J. QuantumElectron. 2005, 41, 1274–1277. [CrossRef]
128. Tokita, S.; Kawanaka, J.; Fujita, M.; Kawashima, T.; Izawa, Y. Sapphire-conductive end-cooling of high powercryogenic Yb:YAG lasers. Appl. Phys. B Lasers Opt. 2005, 80, 635–638. [CrossRef]
129. Brown, D.C.; Singley, J.M.; Yager, E.; Kuper, J.W.; Lotito, B.J.; Bennett, L.L. Innovative high-power CWYb:YAG laser. In Proceedings of SPIE 6552, Laser Source Technology for Defense and Security III, Orlando,FL, USA, 9 April 2007. [CrossRef]
130. Brown, D.C.; Singley, J.M.; Yager, E.; Kowalewski, K.; Guelzow, J.; Kuper, J.W. Kilowatt class high-power CWYb:YAG laser. In Proceedings of SPIE 6952, Laser Source Technology for Defense and Security IV, Orlando,FL, USA, 16 March 2008. [CrossRef]
131. Furuse, H.; Kawanake, J.; Takeshita, K.; Miyanaga, N.; Saika, T.; Imasaki, K. Total-reflection active-mirrorlaser with cryogenic Yb:YAG ceramics. Opt. Lett. 2009, 34, 3439–3441. [CrossRef] [PubMed]
132. Brown, D.C.; Singley, J.M.; Kowalewski, K.; Guelzow, J.; Vitali, V. High sustained average power cw andultrafast Yb:YAG near-diffraction-limited cryogenic solid-state laser. Opt. Express 2010, 18, 24770–24792.[CrossRef] [PubMed]
133. Furuse, H.; Kawanaka, J.; Miyanga, N.; Saiki, T.; Imasaki, K.; Fujita, M.; Takeshita, K.; Ishii, S.; Izawa, Y.Zig-zag active-mirror laser with cryogenic Yb3+:YAG/YAG composite ceramics. Opt. Express 2011, 19,2448–2455. [CrossRef] [PubMed]
134. Ricaud, S.; Papapdopoulos, D.N.; Pelligrina, A.; Balembois, F.; Georges, P.; Courjaud, A.; Camy, P.;Doualan, J.L.; Moncorgé, R.; Druon, F. High-power diode-pumped cryogenically cooled Yb:CaF2 laserwith extremely low quantum defect. Opt. Lett. 2011, 36, 1602–1604. [CrossRef] [PubMed]
135. Feve, J.P.M.; Shortoff, K.E.; Bohn, M.J.; Brasseur, J.K. High average power diamond Raman laser. Opt. Express2011, 19, 913–922. [CrossRef] [PubMed]
136. Vretenar, N.; Newell, T.C.; Carson, T.; Lucas, T.; Latham, W.P.; Bostanci, H.; Lindauer, J.J.; Saarloos, B.A.;Rini, D.P. Cryogenic ceramic 277 watt Yb:YAG thin-disk laser. Opt. Eng. 2012. [CrossRef]
137. Ganija, M.; Ottaway, D.; Veitch, P.; Munch, J. Cryogenic, high power, near diffraction limited, Yb:YAG slablaser. Opt. Express 2013, 21, 6973–6978. [CrossRef] [PubMed]
138. Fan, T.Y.; Ripin, D.J.; Hybl, J.D.; Gopinath, J.T.; Goyal, A.K.; Rand, D.A.; Augst, S.J.; Ochoa, J.R. CryogenicallyCooled Solid-State Lasers. Recent Developments and Future Prospects; MIT Lincoln Laboratory InternalPresentation: Lexington, MA, USA, 2010.
139. Kärtner, F.X. Laser Technology for Compact X-ray Sources. Doha CLS-Workshop Presentation. 2014.140. Mackenzie, J.I.; Bailey, W.O.S.; Kim, J.W.; Pearson, L.; Shen, D.Y.; Yang, Y.; Clarkson, W.A. Tm:fiber laser
in-band pumping a cryogenically-cooled Ho:YAG laser. In Solid State Lasers XVIII: Technology and Devices(Proceedings of SPIE); Clarkson, W.A., Hodges, N., Shori, R.K., Eds.; Bellingham, MA, USA, 2009. [CrossRef]
141. Ter-Gabrielyan, N.; Merkle, L.D.; Newburgh, G.A.; Dubinskii, M. Resonantly-pumped Er3+:Y2O3 ceramiclaser for remote CO2 monitoring. Laser Phys. 2009, 19, 867–869. [CrossRef]

Appl. Sci. 2016, 6, 23 73 of 74
142. Sunamyan, T.; Kanskar, M.; Xiao, Y.; Kedlaya, D.; Dubinskii, M. High power diode-pumped 2.7-µm Er3+:Y2O3
laser with nearly quantum defect-limited efficiency. Opt. Express 2011, 19, A1082–A1087. [CrossRef][PubMed]
143. Ter-Gabrielyan, N.; Merkle, L.D.; Ikesue, A.; Dubinsii, M. Ultralow quantum-defect eye-safe Er:Sc2O3 laser.Opt. Lett. 2008, 33, 1524–1526. [CrossRef] [PubMed]
144. Ter-Gabrielyan, N.; Dubinskii, M.; Newburgh, G.A.; Michael, A.; Merkle, L.D. Temperature dependence of adiode-pumped cryogenic Er:YAG laser. Opt. Express 2009, 17, 7159–7169. [CrossRef] [PubMed]
145. Ter-Gabrielyan, N.; Fromzel, V.; Merkle, L.D.; Dubinskii, M. Resonant in-band pumping of cryo-cooledEr3+:YAG laser at 1532, 1534, and 1546 nm: a comparative study. Opt. Mater. Express 2011, 1, 223–233.[CrossRef]
146. Seltzer, S.D.; Shaw, M.J.; Kukla, M.J.; Unternahrer, J.R.; Dinndorf, K.M.; Beattie, J.A.; Chickless, E.P. A 400 Wcryogenic Er:YAG slab laser at 1645 nm. In Proceedings of SPIE 7686, Laser Technology for Defense andSecurity VI, Orlando, FL, USA, 5 April 2010. [CrossRef]
147. Kawanaka, J.; Takeuchi, Y.; Yoshida, A.; Pearce, S.J.; Yasuhara, R.; Kawashima, T.; Kan, H. Highly efficientcryogenically-cooled Yb:YAG laser. Laser Phys. 2010, 20, 1079–1084. [CrossRef]
148. Tokita, S.; Kawanaka, J.; Fujita, M.; Kawashima, T.; Izawa, Y. Efficient high-average-power operation of aQ-switched cryogenic Yb:YAG laser oscillator. Jpn. J. Appl. Phys. 2005, 44, L1520–L1531. [CrossRef]
149. Perevezentsev, E.A.; Mukhin, I.B.; Kuznetsov, I.I.; Palashov, O.V.; Khazanov, E.A. Cryogenic disk Yb:YAGlaser with 120 mJ energy at 500 Hz repetition rate. Quantum Electron. 2013, 43, 207–210. [CrossRef]
150. Manni, J.G.; Hybl, J.D.; Rand, D.; Ripin, D.J.; Ochoa, J.R.; Fan, T.Y. 100-W Q-switched cryogenically cooledYb:YAG laser. IEEE J. Quantum Electron. 2010, 46, 95–98. [CrossRef]
151. Cheng, X.; Wang, J.; Yang, Z.; Liu, J.; Li, L.; Shi, X.; Huang, W.; Wang, J.; Chen, W. A high energy nanosecondcryogenic cooled Yb:YAG active-mirror amplifier system. High Power Laser Sci. Eng. 2014, 2, 1–4. [CrossRef]
152. Mason, P.D.; Banerjee, S.; Ertel, K.; Phillips, P.J.; Greenhalgh, J.; Collier, J.L. DiPOLE—An efficirnt and scalablehigh pulse energy and high average power cryogenic gas cooled multi-slab amplifier concept. Plasma FusionRes. 2013, 8, 1–4. [CrossRef]
153. Kawanaka, J.; Yamakawa, K.; Nishioka, H.; Ueda, K. 30-mJ, diode-pumped chirped-pulse Yb:YLFregenerative amplifier. Opt. Lett. 2003, 28, 2121–2123. [CrossRef] [PubMed]
154. Bayramian, A.; Armstrong, P.; Ault, E.; Beach, R.; Bibeau, C.; Caird, J.; Campbell, R.; Chai, B.; Dawson, J.;Ebbers, C.; et al. The Mercury project: A high average power gas-cooled laser for inertial fusion energydevelopment. Fusion Sci. Technol. 2007, 52, 383–387.
155. Lucianetti, A.; Albach, D.; Chanteloup, J.C. Active-mirror-laser-amplifier thermal management with tunablehelium pressure at cryogenic temperatures. Opt. Express 2011, 19, 12766–12780. [CrossRef] [PubMed]
156. Vaupel, A.; Bodnar, N.; Webb, B.; Shah, L.; Richardson, M. Concepts, performance review, and prospects oftable-top, few-cycle optical parametric chirped-pulse amplification. Opt. Engin. 2014, 53, 1–12. [CrossRef]
157. Fattahi, H.; Barros, H.G.; Gorjan, M.; Nubbemeyer, T.; Alsaif, B.; Teisset, C.Y.; Schultze, M.; Prinz, S.;Haefner, M.; Ueffing, M.; et al. Third generation femtosecond technology. Optica 2014, 1, 45–63. [CrossRef]
158. Tokita, S.; Kawanaka, J.; Izawa, Y.; Fujita, M.; Kawashima, T. 23.7-W picosecond cryogenic-Yb:YAG multipassamplifier. Opt. Express 2007, 15, 3955–3961. [CrossRef] [PubMed]
159. Akahane, Y.; Aoyama, M.; Ogawa, K.; Tsuji, K.; Tokita, S.; Kawanaka, J.; Nishioka, H.; Yamakawa, K.High-energy, diode-pumped, picosecond Yb:YAG chirped-pulse regenerative amplifier for pumpingchirped-pulse amplification. Opt. Lett. 2007, 32, 1899–1901. [CrossRef] [PubMed]
160. Hong, K.H.; Siddiqui, A.; Moses, J.; Gopinath, J.; Hybl, J.; Ilday, F.Ö.; Fan, T.Y.; Kärtner, F.X. Generation of287 W, 5.5 ps pulses at 78 MHz repetition rate from a cryogenically cooled Yb:YAG amplifier seeded by afiber chirped-pulse amplification system. Opt. Lett. 2008, 33, 2473–2475. [CrossRef] [PubMed]
161. Hong, K.H.; Lai, C.J.; Siddiqui, A.; Kärtner, F.X. 130-W picosecond green laser based on a frequency-doubledhybrid cryogenic Yb:YAG amplifier. Opt. Express 2009, 19, 16911–16919. [CrossRef] [PubMed]
162. Reagan, B.A.; Curtis, A.H.; Wernsing, K.A.; Furch, F.J.; Luther, B.M.; Rocca, J.J. Development of high energydiode-pumped thick-disk Yb:YAG chirped-pulse-amplification lasers. IEEE J. Quantum Electron. 2012, 48,827–835. [CrossRef]
163. Hong, K.H.; Gopinath, J.T.; Rand, D.; Siddiqui, A.M.; Huang, S.W.; Li, E.; Eggleton, B.J.; Hybl, J.D.; Fan, T.Y.;Kärtner, F.X. High-energy, kHz-repetition-rate, ps cryogenic Yb:YAQ chirped-pulse amplifier. Opt. Lett. 2010,35, 1752–1754. [CrossRef] [PubMed]
Appl. Sci. 2016, 6, 23 74 of 74
164. Kowalewski, K.; Zembec, J.; Envid, V.; Brown, D.C. 201 W picosecond green laser using a mode-locked fiberdriven cryogenic Yb:YAG amplifier system. Opt. Lett. 2012, 37, 4633–4735. [CrossRef] [PubMed]
165. Hong, K.H.; Huang, S.W.; Moses, J.; Fu, X.; Lai, C.J.; Cirmi, G.; Sell, A.; Granados, E.; Keathley, P.; Kärtner, F.X.High-energy, phase-stable, ultrabroadband kHz OPCPA at 2.1 µm pumped by a picosecond cryogenicYb:YAG laser. Opt. Express 2011, 19, 15538–15548. [CrossRef] [PubMed]
166. Curtis, A.H.; Reagan, B.A.; Wernsing, K.A.; Furch, F.J.; Luther, B.M.; Rocca, J.J. Demonstration of a compact100 Hz, 0.1 J, diode-pumped picosecond laser. Opt. Lett. 2011, 36, 2164–2166. [CrossRef] [PubMed]
167. Miller, D.E.; Zapata, L.E.; Ripin, D.J.; Fan, T.Y. Sub-picosecond pulses at 100 W average power from a Yb:YLFchirped-pulse amplification system. Opt. Lett. 2012, 37, 2700–2702. [CrossRef] [PubMed]
168. Petrov, V.V.; Pestryakov, E.V.; Laptev, A.V.; Petrov, V.A.; Kuptsov, G.V. Pump channel of parametric amplifoerof terawatt femtosecond Yb laser system. Atmos. Ocean. Opt. 2014, 27, 344–347. [CrossRef]
169. Zapata, L.E.; Lin, H.; Calendron, A.L.; Cankaya, H.; Hemmer, M.; Reichert, F.; Huang, W.R.; Granados, E.;Hong, K.H.; Kärtner, F.X. Cryogenic Yb:YAG composite-thin-disk for high energy and average poweramplifiers. Opt. Lett. 2015, 40, 2610–2613. [CrossRef] [PubMed]
170. Pugžlys, A.; Andriukaitas, G.; Sidorov, D.; Irshad, A.; Baltuška, A.; Lai, W.J.; Phua, P.B.; Su, L.; Xu, J.;Li, R.; et al. Spectroscopy and lasing of cryogenically cooled Yb, Na:CaF2. Appl. Phys. B Lasers Opt. 2009, 97,339–350. [CrossRef]
171. Divoky, M.; Smrz, M.; Chyla, M.; Sikocinski, P.; Novak, O.; Huynh, J.; Nagisetty, S.S.; Miura, T.; Pilar, J.;Slezak, O.; et al. Overview of the HiLASE project: High average power pulsed DPSSL systems for researchand industry. High Power Laser Sci. Eng. 2014, 2, 1–10. [CrossRef]
172. Novák, O.; Miura, T.; Smrž, M.; Chyla, M.; Nagisetty, S.S.; Mužik, J.; Linnemann, J.; Turcicova, H.;Jambunathan, V.; Slezák, O.; et al. Review, Status of the high average power diode-pumped solid state laserdevelopment at HiLASE. Appl. Sci. 2015, 5, 637–665. [CrossRef]
173. Endo, A.; Sikocinski, P.; Chyla, M.; Miura, T.; Mocek, T.; Sakaue, K.; Washio, M. Cryogenically cooled 1 J, psYb:YAG slab laser for high-brightness laser-Compton X-ray source. In Proceedings of the IPAC, Dresden,Germany, 15–20 June 2014.
© 2016 by the authors; licensee MDPI, Basel, Switzerland. This article is an open accessarticle distributed under the terms and conditions of the Creative Commons by Attribution(CC-BY) license (http://creativecommons.org/licenses/by/4.0/).