Embed Size (px)
Citation preview
University of Groningen
Superfluid helium and cryogenic noble gases as stopping media for ion catchersPurushothaman, Sivaji
IMPORTANT NOTE: You are advised to consult the publisher's version (publisher's PDF) if you wish to cite fromit. Please check the document version below.
Document VersionPublisher's PDF, also known as Version of record
Publication date:2008
Link to publication in University of Groningen/UMCG research database
Citation for published version (APA):Purushothaman, S. (2008). Superfluid helium and cryogenic noble gases as stopping media for ioncatchers. s.n. https://pure.rug.nl/ws/portalfiles/portal/14485731/thesis.pdf
CopyrightOther than for strictly personal use, it is not permitted to download or to forward/distribute the text or part of it without the consent of theauthor(s) and/or copyright holder(s), unless the work is under an open content license (like Creative Commons).
The publication may also be distributed here under the terms of Article 25fa of the Dutch Copyright Act, indicated by the “Taverne” license.More information can be found on the University of Groningen website: https://www.rug.nl/library/open-access/self-archiving-pure/taverne-amendment.
Take-down policyIf you believe that this document breaches copyright please contact us providing details, and we will remove access to the work immediatelyand investigate your claim.
Downloaded from the University of Groningen/UMCG research database (Pure): http://www.rug.nl/research/portal. For technical reasons thenumber of authors shown on this cover page is limited to 10 maximum.
Download date: 19-03-2022
Superfluid Helium and
Cryogenic Noble Gases as
Stopping Media for Ion Catchers


RIJKSUNIVERSITEIT GRONINGEN
Superfluid Helium and
Cryogenic Noble Gases as
Stopping Media for Ion Catchers
Proefschrift
ter verkrijging van het doctoraat in deWiskunde en Natuurwetenschappenaan de Rijksuniversiteit Groningen
op gezag van deRector Magnificus, dr. F. Zwarts,in het openbaar te verdedigen op
vrijdag 28 november 2008om 13:15 uur
door
Sivaji Purushothaman
geboren op 21 december 1978te Kozhikode–Kerala, India

Promotor: Prof. Dr. K. P. JungmannCopromotor: Dr. P. G. Dendooven
Beoordelingscommissie: Prof. Dr. J. ÄystöProf. Dr. Ir. R. A. HoekstraProf. Dr. C. Scheidenberger
ISBN: 978-90-367-3651-0 Printed versionISBN: 978-90-367-3652-7 Electronic version

This work has been performed as part of the research program of the “Stichtingvoor Fundamenteel Onderzoek der Materie” (FOM), which is financially supportedby the “Nederlandse Organisatie voor Wetenschappelijk Onderzoek”; (NWO). Thiswork has been supported by the EU 6th Framework programme “Integrating In-frastructure Initiative - Transnational Access”, Contract Number: 506065 (EURONS)and by the Academy of Finland under the Finnish Centre of Excellence Programme2006-2011 (Nuclear and Accelerator Based Physics Programme at JYFL).
Printed by: Ponsen & Looijen B.V., Wageningen, November 2008.


“An experiment is a question which science poses to nature, and a measurement isthe recording of nature’s answer”
Max PlanckScientific Autobiography and Other Papers, 1949

Contents
1 Introduction 1
2 Physics processes in cryogenic noble gas ion catchers 52.1 Electrons in low temperature helium gas . . . . . . . . . . . . . . . . . 52.2 Positive ions in low temperature helium gas . . . . . . . . . . . . . . . 112.3 Charge recombination . . . . . . . . . . . . . . . . . . . . . . . . . . . . 132.4 Recombination loss factor . . . . . . . . . . . . . . . . . . . . . . . . . . 132.5 Helium ion species . . . . . . . . . . . . . . . . . . . . . . . . . . . . . . 142.6 Recombination coefficient of helium ions . . . . . . . . . . . . . . . . . 162.7 Recombination of noble gas ions in helium . . . . . . . . . . . . . . . . 192.8 Conclusion . . . . . . . . . . . . . . . . . . . . . . . . . . . . . . . . . . . 19
3 Physics processes in superfluid helium ion catchers 213.1 Positive ions in superfluid helium . . . . . . . . . . . . . . . . . . . . . 243.2 Electrons in superfluid helium . . . . . . . . . . . . . . . . . . . . . . . 263.3 Snowball and bubble mobility . . . . . . . . . . . . . . . . . . . . . . . . 273.4 Charge recombination factor in superfluid helium . . . . . . . . . . . . 303.5 Positive ions at the superfluid-vapor interface . . . . . . . . . . . . . . 313.6 Ion extraction across the superfluid-vapor interface . . . . . . . . . . . 343.7 Conclusion . . . . . . . . . . . . . . . . . . . . . . . . . . . . . . . . . . . 36
4 Experimental techniques 374.1 Cryostat . . . . . . . . . . . . . . . . . . . . . . . . . . . . . . . . . . . . 374.2 Experimental cell . . . . . . . . . . . . . . . . . . . . . . . . . . . . . . . 414.3 Gas density in the experimental cell at low temperature . . . . . . . . 504.4 Conclusion . . . . . . . . . . . . . . . . . . . . . . . . . . . . . . . . . . . 54
ix
x
5 Cryogenic noble gas ion catchers 555.1 Off-line measurements . . . . . . . . . . . . . . . . . . . . . . . . . . . . 565.2 On-line measurements . . . . . . . . . . . . . . . . . . . . . . . . . . . . 625.3 Mobility measurements of 219Rn ions in cryogenic noble gases . . . . 695.4 Conclusion . . . . . . . . . . . . . . . . . . . . . . . . . . . . . . . . . . . 74
6 Superfluid helium ion catcher 776.1 Extraction of 219Rn ions across the superfluid-vapor interface . . . . . 776.2 Second sound assisted superfluid surface evaporation . . . . . . . . . 886.3 Conclusion . . . . . . . . . . . . . . . . . . . . . . . . . . . . . . . . . . . 93
7 Conclusion and outlook 95
Summary 101
Samenvatting 103
Acknowledgment 105
List of Figures 109
List of Tables 113
List of Publications 115
References 117
1Introduction
The study of atomic nuclei takes a prominent position in the quest to understandquantum-mechanical many-body systems. Studying merely the naturally oc-
curring atomic nuclei imposes a severe limit since these constitute only 5 % of theabout 7000 combinations of protons and neutrons which are bound by the stronginteraction. Experimental facilities where radioactive nuclei are created and studiedare thus a necessity. The use and study of radioactive nuclei has had a great im-pact on other fields of science (ranging from particle physics to materials science)and has yielded an enormous amount of spin-off technologies and applications[3, 81, 117, 119]. For a long time, high-energy beams of only stable isotopes werereadily available. In the past 25 years, radioactive ion beam (RIB) facilities allowedfor the first time the study of many exotic nuclei with proton or neutron combina-tions very different than those of stable nuclei. This led to the discovery of manynew and unexpected phenomena, such as halo nuclei and the melting of nuclearshells. The construction of next-generation RIB facilities is of the highest priority forthe nuclear physics community. Such a next generation facility will produce beamswith several orders of magnitude higher intensity, allowing new research with awide range of nuclear species much further away from the region of stable nu-clei. In RIB facilities of the in-flight type such as FAIR (Facility for Antiproton andIon Research) at GSI, Germany [45], RIBF (Radioactive Ion Beam Factory), RIKEN,Japan [90], NSCL (National Superconducting Cyclotron Laboratory), MSU, UnitedStates of America [80] and GANIL (Grand Accélérateur National d’Ions Lourds),France [48], radioactive ions are produced and selected at high energies (100 - 1000MeV per nucleon), resulting in a radioactive ion beam of high energy and poorbeam quality (large emittance and large energy spread). Many precision studies ofexotic nuclei far from the valley of stability, such as high-resolution particle spec-troscopy or studies in atom or ion traps, need low-energy beams (typically less thana few tens of keV) of high quality (small emittance and energy spread smaller than1 eV). The same requirements hold for the re-acceleration of the radioactive ionsto a precisely defined energy needed e.g. for nuclear reaction studies with radioac-
1
2 Introduction
tive ions. This makes the transformation of a high-energy, low-quality beam intoa low-energy, high-quality one (a so-called “cold beam”) an essential part of nextgeneration RIB facilities. The essential requirements for such a transformation arespeed and efficiency because the most exotic nuclei have short half-lives (down tomilliseconds) and are produced in small quantities. The so-called “ion catcher”method to perform this transformation is being investigated in several laboratoriesfor use in virtually all existing and planned RIB facilities. It is based on the IGISOLmethod developed in the early 1980’s at the University of Jyväskylä, Finland byJ. Ärje, J. Äystö and collaborators (see [9, 34] for reviews on this topic): the high-energy ions are stopped in a chamber filled with helium gas and extracted throughan exit-hole. The size of the chambers required by the high energy of the RIB (up to2 m long with a pressure of up to 2 bar) makes the use of the gas flow to extract theions from the chamber too slow; guidance by DC electric fields or a combination ofDC and RF fields is therefore an essential, but non-trivial task.
The main aim of this research programme is to check the feasibility of cryogenicnoble gases and superfluid liquid helium as stopping medium. This thesis will dis-cuss these two approaches separately. Physical processes behind both approachesare discussed in the next two chapters and the experimental techniques, results anddiscussion are presented in the following chapters.
The fundamental limit of efficiencies of a noble gas ion catcher has been an openquestion for years. Near and at thermal energies, ions cannot neutralize in collisionswith noble gas atoms due to the high ionization potential of the latter. So in case ofnear zero impurity level, most of the neutralization of ions will happen during theslowing down process. This means that the relative importance of neutralizationand ionization cross sections of the ion in the noble gas during slowing down willdetermine the efficiency limit of a noble gas ion catcher. The relevant physics hasbeen explained since the early days of quantum theory of atomic collisions in thebook “The theory of atomic collisions” by N. F. Mott and H. S. W. Massey [76]. How-ever, accurate charge exchange cross sections could not be calculated accuratelybecause of the mathematical complexity involved. The pioneering work by Hugheset al. on electron capture for singly charged particles like protons and muons [58]had been ignored in the nuclear physics community for some three decades and ledto a series of misunderstandings. Some recent measurements of the average chargestate of low-energy xenon ions in helium are reported by Willmann et al. [130]: theaverage charge state of xenon ions decreases down to about 0.25 at the lowest mea-sured energy of 10 keV in full agreement with the expectations of the early modelsin the relevant range of energies.
What happens to thermalized ions is determined by the presence of impuritiesand the ionization of the noble gas by the energetic ions and possibly by an accel-erator beam or radioactive decay radiation or both [6]. Impurities take part in theneutralization process via three-body recombination involving a free electron andform molecules or adducts with the ions, see e.g. Reference [65]. It is importantto note that the ionizing radiation also plays a role in re-ionizing those ions which
3
have been neutralized. So one of the main factors that could improve the efficiencyof the gas cells is a low impurity level. Over the past 25 years, a lot of technicaldevelopment has focused on removing impurities from and preventing ionizationof the noble gas. Sub-ppb impurity levels have been achieved in noble gas catch-ers that are built according to ultra-high vacuum standards, that are bakeable andfilled with ultra-pure noble gases, see e.g. References [65, 93]. Constructing largeultra-pure gas catchers, although possible, is far from trivial [93]. There is, however,an alternative approach to reach ultra-pure conditions: freezing out the impurities.An added benefit of cryogenic gas catchers comes from the fact that for a constantgas density, the mass flow out of a gas cell is proportional to the square-root ofthe gas temperature. This means that a cryogenic noble gas cell allows easier dif-ferential pumping for the same gas density, or, reversing this argument, allows ahigher density for a constant gas load on the extraction system. The latter meansthat higher energy ions can be stopped or that, for the same ion energy, the gas cellcan be made shorter.
Chapter 4 is dedicated to describe the setup, the methods and the principlesused for the experimental study and the data analysis.
Chapter 2 gives an overview of the physics involved in the processes and a liter-ature survey on the available experimental data within the context of cryogenic no-ble gases. Off-line experiments using recoil ions from a radioactive 223Ra source areperformed to study the feasibility of using a cryogenic noble gas stopping mediumfor high-energy ion beams. Based on the off-line result, an on-line experimen-tal study on the extraction of thermalized 219Rn recoils from an ionized stoppingmedium was conducted. Results from both on-line and off-line experiments and adiscussion of the observed properties are reported in chapter 5.
The much larger density (factor 800) of liquid helium relative to room temper-ature helium gas at 1 bar allows the use of a very small stopping chamber. Thismakes the extraction of the ions very fast, thereby also increasing the efficiencyof ion extraction because of a reduction in neutralization and radioactive decaywhich is important for short-lived nuclei. Also, the guiding by electric fields canbe very simple. The fact that nuclear polarization is preserved in superfluid helium[100, 111, 112, 106, 109, 110] could allow the extraction of polarized beams. At theenvisaged temperatures, the low vapour pressure above the superfluid helium sur-face removes the need for pumping large volumes of helium gas. This new method,if proven successful, could be implemented in many existing and planned laborato-ries around the world. Experimental work to produce a cold radioactive ion beamusing superfluid helium was started at the Department of Physics of the Universityof Jyväskylä about 7 years ago. 219Rn ions created in the alpha decay of 223Ra andrecoiling out of the source were stopped in superfluid helium and extracted intothe vapour phase as positive ions by means of electric fields. This was the firstever observation of the extraction of positive ions from the surface of liquid helium[56, 57, 108].
Different processes, most importantly the dependence of the survival of snow-
4 Introduction
balls on applied electric fields and the dependence of their extraction across thesuperfluid-vapor interface on temperature are studied in the framework of thisproject. Chapter 3 give an essence of the physics tools necessary to understand thephysical processes involved. The experiments described in chapter 6 aim towardsa better understanding of the ion extraction at the superfluid-vapor interface. Fur-ther, as a new idea, the possibility to enhance the ion extraction efficiency by secondsound assisted superfluid surface evaporation is also investigated.
Finally chapter 7 gives concluding remarks and discusses some future researchdirections.
2Physics processes incryogenic noble gasion catchers
This chapter presents a brief review of the properties of electrons and positiveions in cryogenic helium gas. The mobility of electrons and positive ions and
charge recombination processes play a critical role in the efficiency of a cryogenichelium ion catcher.
2.1 Electrons in low temperature helium gas
In the slowing down and thermalization of energetic heavy ion beams in cryogenicnoble gas ion catchers, helium ion-electron pairs are created, resulting in partialionization of the buffer gas. The electrons can be considered as an electron swarm.Such a swarm consists of a small number density n of electrons in a gas (in our casehelium atoms) of much higher number density N. The most important physical pa-rameters of an electron swarm within the parameter range of cryogenic noble gasion catchers are the electron drift velocity vd, the momentum transfer cross-sectionσm, the diffusion coefficient D and the recombination coefficient α. All these param-eters are determined by the ratio E/N of the system where E is the applied electricfield strength. E/N is often expressed in units of “Townsend” whose magnitude isdefined as 1 Td = 10−17 V cm2. It has been traditional to refer to the ratio of the ionicdrift velocity vd to the electric field strength E as the mobility µ, which is relatedto the diffusion coefficient through the Einstein relation (also known as Einstein-Smoluchowski relation) D = µkBTg/e. Here kB is the Boltzmann constant, Tg is thegas temperature and e is the electron charge. This section will summarize the avail-able data of the relevant parameters within the E/N range relevant for cryogenic
5
6 Physics processes in cryogenic noble gas ion catchers
µ0
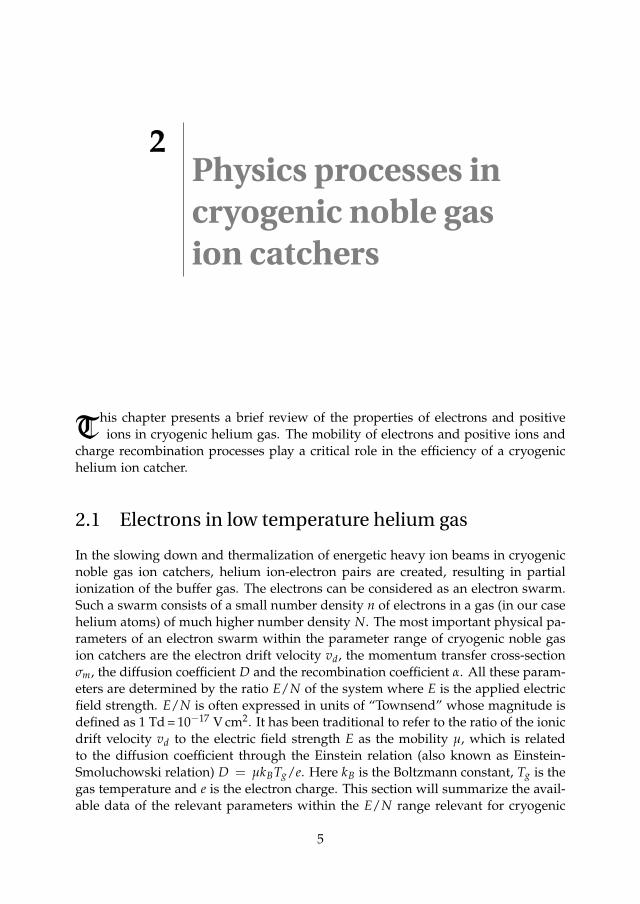
Figure 2.1: Density-normalized zero field electron mobilities µ0N in helium as a function of temper-ature [88].
noble gas ion catchers (10−3 Td 6 E/N 6 1 Td, for E = 1 V cm−1 to 1000 V cm−1
while N = 1020 cm−3 to 1018 cm−3).At lower densities electrons are quasifree. Their wave function is de-localised
and the system can be treated with classical kinetic theory. This treatment assumesthe conduction of electrons in an array of randomly placed scattering centers. Thisclassical approach is valid at low densities and at high temperatures. The basicassumption of the kinetic theory is that the density of scatterers is so low that onlybinary collisions take place. This is valid only if the electron mean free path lc =(Nσm)−1, the electron de Broglie wavelength λT = h/(2πmkBTg)1/2, the atomicsize a and the average inter-atomic distance N−1/3 satisfy both the inequalities lc N−1/3 > a and lc λT . In the limit of vanishingly small electric field (E → 0)the kinetic theory predicts that the density-normalized zero-field mobility, µ0N, ofelectrons is independent of the gas density N [96]
µ0N =43
e(2πmkBTg)1/2
1σm0
, (2.1)
where m is the mass, σm0 the zero energy limit of the momentum transfer cross-section and µ0 the zero field mobility of the electron. Figure 2.1 shows the zero-fieldelectron mobility at different temperatures for different helium gas densities.
A large deviation from classical behavior is observed at high densities and atlow temperatures. For λT/lc ∼ 1 the electron wave interacts with several scattering
2.1 Electrons in low temperature helium gas 7
µ0
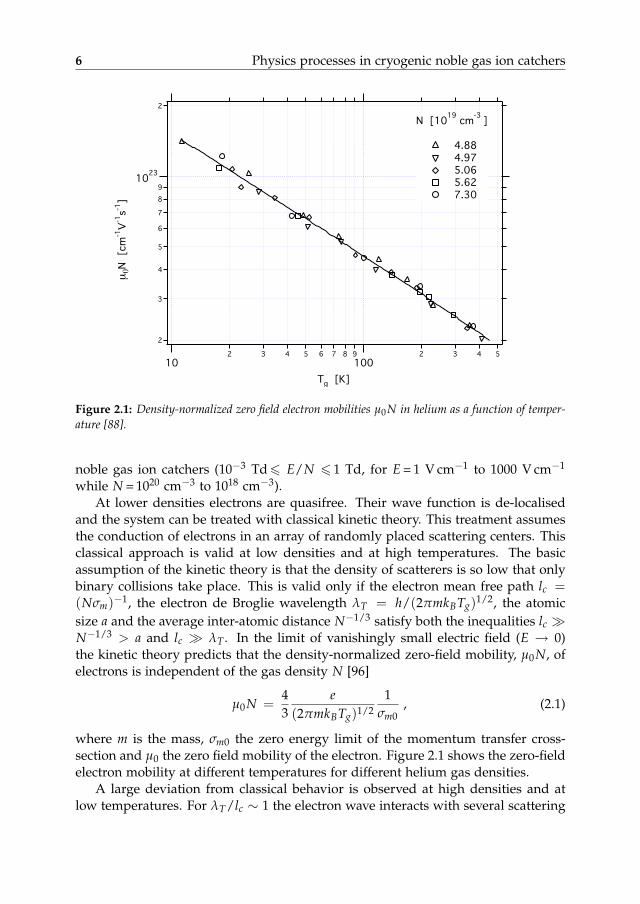
Figure 2.2: Density-normalized zero-field mobility of electrons (µ0N) vs. gas number density (N)of helium for various gas temperature values. Solid lines are summarized from many experimentalresults [53]. The relevant range for cryogenic noble gas ion catchers is indicated.
centers simultaneously and usual complications associated with a random quantummechanical system arise. For gas densities N & 1020 cm−3, density-dependenteffects for a given ratio E/N start to play a role. The deviation of density-normalisedzero-field electron mobilities from the kinetic theory predictions with the increase indensity and decrease in temperature are shown in Figure 2.2. For cryogenic gas ioncatchers, the range of possible E/N and N values are well below the non-classicalregime and the discussions in the following section will hence be restricted to theclassical regime [11].
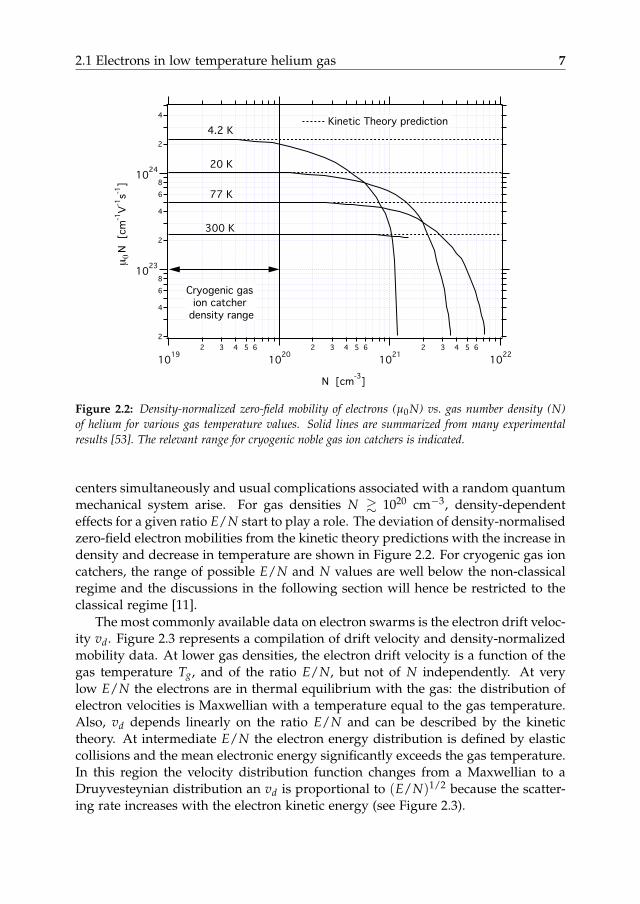
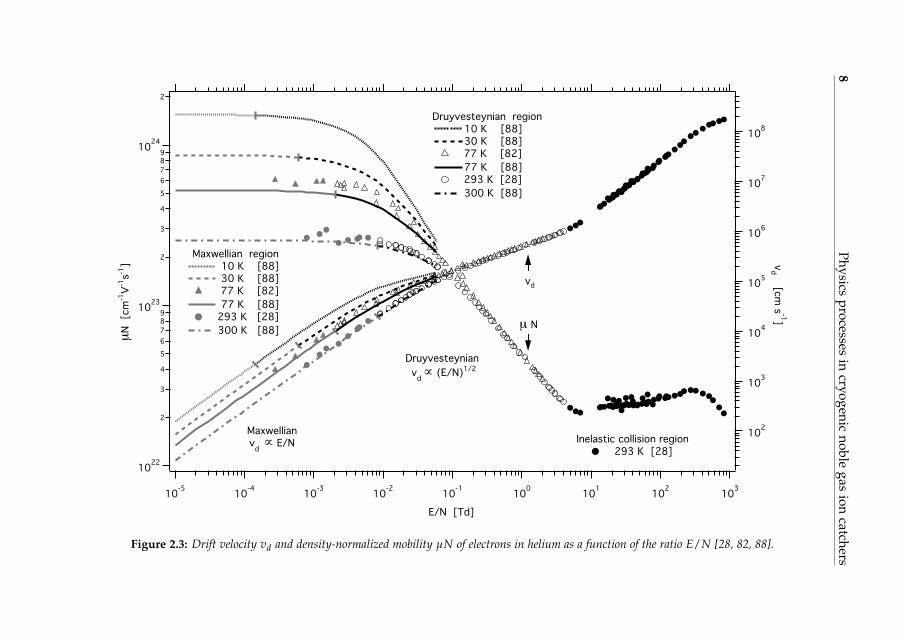
The most commonly available data on electron swarms is the electron drift veloc-ity vd. Figure 2.3 represents a compilation of drift velocity and density-normalizedmobility data. At lower gas densities, the electron drift velocity is a function of thegas temperature Tg, and of the ratio E/N, but not of N independently. At verylow E/N the electrons are in thermal equilibrium with the gas: the distribution ofelectron velocities is Maxwellian with a temperature equal to the gas temperature.Also, vd depends linearly on the ratio E/N and can be described by the kinetictheory. At intermediate E/N the electron energy distribution is defined by elasticcollisions and the mean electronic energy significantly exceeds the gas temperature.In this region the velocity distribution function changes from a Maxwellian to aDruyvesteynian distribution an vd is proportional to (E/N)1/2 because the scatter-ing rate increases with the electron kinetic energy (see Figure 2.3).
8Physics
processesin
cryogenicnoble
gasion
catchers
µ
µ
!
!
Figure 2.3: Drift velocity vd and density-normalized mobility µN of electrons in helium as a function of the ratio E/N [28, 82, 88].
2.1 Electrons in low temperature helium gas 9
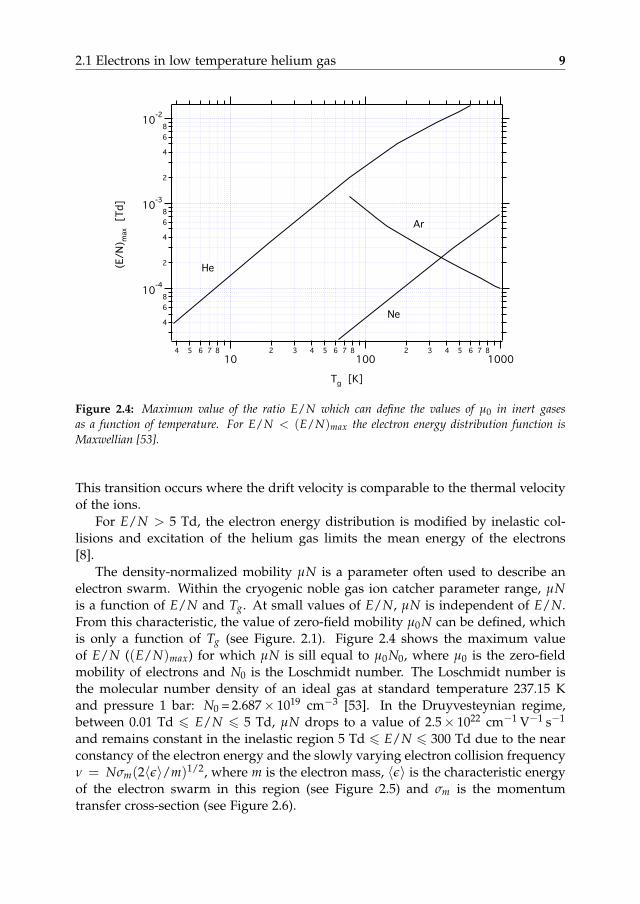
Figure 2.4: Maximum value of the ratio E/N which can define the values of µ0 in inert gasesas a function of temperature. For E/N < (E/N)max the electron energy distribution function isMaxwellian [53].
This transition occurs where the drift velocity is comparable to the thermal velocityof the ions.
For E/N > 5 Td, the electron energy distribution is modified by inelastic col-lisions and excitation of the helium gas limits the mean energy of the electrons[8].
The density-normalized mobility µN is a parameter often used to describe anelectron swarm. Within the cryogenic noble gas ion catcher parameter range, µNis a function of E/N and Tg. At small values of E/N, µN is independent of E/N.From this characteristic, the value of zero-field mobility µ0N can be defined, whichis only a function of Tg (see Figure. 2.1). Figure 2.4 shows the maximum valueof E/N ((E/N)max) for which µN is sill equal to µ0N0, where µ0 is the zero-fieldmobility of electrons and N0 is the Loschmidt number. The Loschmidt number isthe molecular number density of an ideal gas at standard temperature 237.15 Kand pressure 1 bar: N0 = 2.687× 1019 cm−3 [53]. In the Druyvesteynian regime,between 0.01 Td 6 E/N 6 5 Td, µN drops to a value of 2.5× 1022 cm−1 V−1 s−1
and remains constant in the inelastic region 5 Td 6 E/N 6 300 Td due to the nearconstancy of the electron energy and the slowly varying electron collision frequencyν = Nσm(2〈ε〉/m)1/2, where m is the electron mass, 〈ε〉 is the characteristic energyof the electron swarm in this region (see Figure 2.5) and σm is the momentumtransfer cross-section (see Figure 2.6).
10 Physics processes in cryogenic noble gas ion catchers
!"#
µ
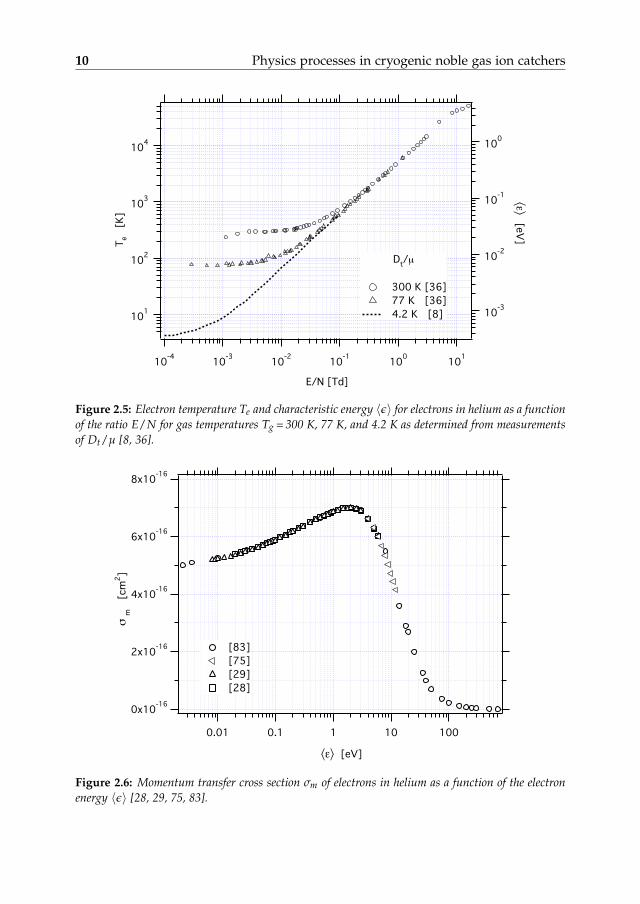
Figure 2.5: Electron temperature Te and characteristic energy 〈ε〉 for electrons in helium as a functionof the ratio E/N for gas temperatures Tg = 300 K, 77 K, and 4.2 K as determined from measurementsof Dt/µ [8, 36].
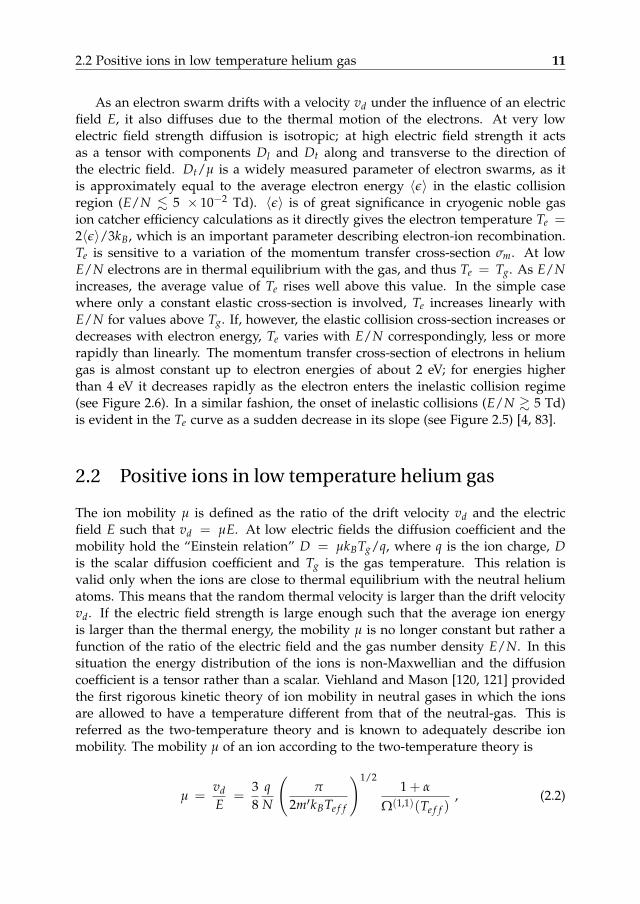
!
"#$
Figure 2.6: Momentum transfer cross section σm of electrons in helium as a function of the electronenergy 〈ε〉 [28, 29, 75, 83].
2.2 Positive ions in low temperature helium gas 11
As an electron swarm drifts with a velocity vd under the influence of an electricfield E, it also diffuses due to the thermal motion of the electrons. At very lowelectric field strength diffusion is isotropic; at high electric field strength it actsas a tensor with components Dl and Dt along and transverse to the direction ofthe electric field. Dt/µ is a widely measured parameter of electron swarms, as itis approximately equal to the average electron energy 〈ε〉 in the elastic collisionregion (E/N . 5 × 10⁻² Td). 〈ε〉 is of great significance in cryogenic noble gasion catcher efficiency calculations as it directly gives the electron temperature Te =2〈ε〉/3kB, which is an important parameter describing electron-ion recombination.Te is sensitive to a variation of the momentum transfer cross-section σm. At lowE/N electrons are in thermal equilibrium with the gas, and thus Te = Tg. As E/Nincreases, the average value of Te rises well above this value. In the simple casewhere only a constant elastic cross-section is involved, Te increases linearly withE/N for values above Tg. If, however, the elastic collision cross-section increases ordecreases with electron energy, Te varies with E/N correspondingly, less or morerapidly than linearly. The momentum transfer cross-section of electrons in heliumgas is almost constant up to electron energies of about 2 eV; for energies higherthan 4 eV it decreases rapidly as the electron enters the inelastic collision regime(see Figure 2.6). In a similar fashion, the onset of inelastic collisions (E/N & 5 Td)is evident in the Te curve as a sudden decrease in its slope (see Figure 2.5) [4, 83].
2.2 Positive ions in low temperature helium gas
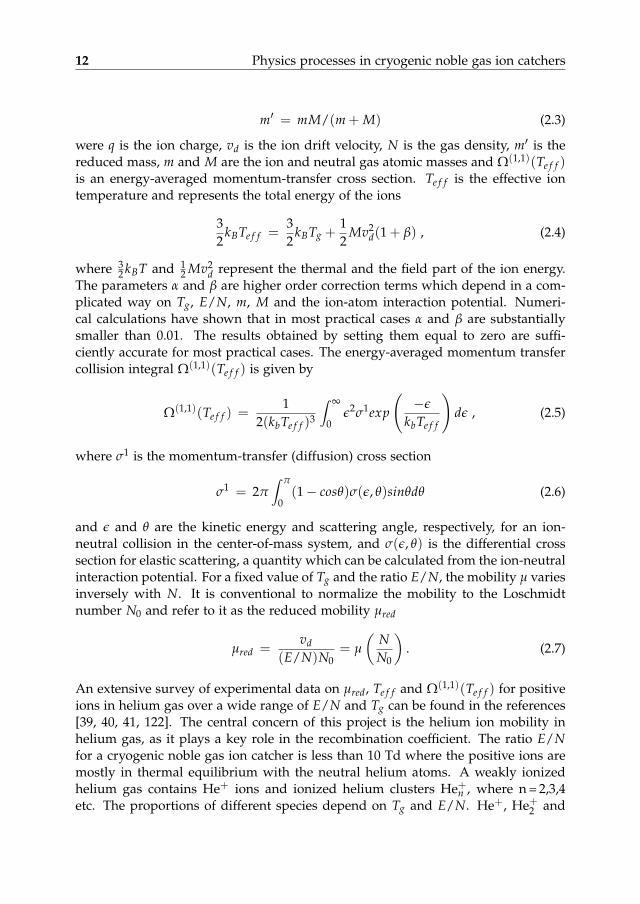
The ion mobility µ is defined as the ratio of the drift velocity vd and the electricfield E such that vd = µE. At low electric fields the diffusion coefficient and themobility hold the “Einstein relation” D = µkBTg/q, where q is the ion charge, Dis the scalar diffusion coefficient and Tg is the gas temperature. This relation isvalid only when the ions are close to thermal equilibrium with the neutral heliumatoms. This means that the random thermal velocity is larger than the drift velocityvd. If the electric field strength is large enough such that the average ion energyis larger than the thermal energy, the mobility µ is no longer constant but rather afunction of the ratio of the electric field and the gas number density E/N. In thissituation the energy distribution of the ions is non-Maxwellian and the diffusioncoefficient is a tensor rather than a scalar. Viehland and Mason [120, 121] providedthe first rigorous kinetic theory of ion mobility in neutral gases in which the ionsare allowed to have a temperature different from that of the neutral-gas. This isreferred as the two-temperature theory and is known to adequately describe ionmobility. The mobility µ of an ion according to the two-temperature theory is
µ =vdE
=38
qN
(π
2m′kBTe f f
)1/21 + α
Ω(1,1)(Te f f ), (2.2)
12 Physics processes in cryogenic noble gas ion catchers
m′ = mM/(m + M) (2.3)
were q is the ion charge, vd is the ion drift velocity, N is the gas density, m′ is thereduced mass, m and M are the ion and neutral gas atomic masses and Ω(1,1)(Te f f )is an energy-averaged momentum-transfer cross section. Te f f is the effective iontemperature and represents the total energy of the ions
32
kBTe f f =32
kBTg +12
Mv2d(1 + β) , (2.4)
where 32 kBT and 1
2 Mv2d represent the thermal and the field part of the ion energy.
The parameters α and β are higher order correction terms which depend in a com-plicated way on Tg, E/N, m, M and the ion-atom interaction potential. Numeri-cal calculations have shown that in most practical cases α and β are substantiallysmaller than 0.01. The results obtained by setting them equal to zero are suffi-ciently accurate for most practical cases. The energy-averaged momentum transfercollision integral Ω(1,1)(Te f f ) is given by
Ω(1,1)(Te f f ) =1
2(kbTe f f )3
∫ ∞
0ε2σ1exp
(−ε
kbTe f f
)dε , (2.5)
where σ1 is the momentum-transfer (diffusion) cross section
σ1 = 2π∫ π
0(1− cosθ)σ(ε, θ)sinθdθ (2.6)
and ε and θ are the kinetic energy and scattering angle, respectively, for an ion-neutral collision in the center-of-mass system, and σ(ε, θ) is the differential crosssection for elastic scattering, a quantity which can be calculated from the ion-neutralinteraction potential. For a fixed value of Tg and the ratio E/N, the mobility µ variesinversely with N. It is conventional to normalize the mobility to the Loschmidtnumber N0 and refer to it as the reduced mobility µred
µred =vd
(E/N)N0= µ
(NN0
). (2.7)
An extensive survey of experimental data on µred, Te f f and Ω(1,1)(Te f f ) for positiveions in helium gas over a wide range of E/N and Tg can be found in the references[39, 40, 41, 122]. The central concern of this project is the helium ion mobility inhelium gas, as it plays a key role in the recombination coefficient. The ratio E/Nfor a cryogenic noble gas ion catcher is less than 10 Td where the positive ions aremostly in thermal equilibrium with the neutral helium atoms. A weakly ionizedhelium gas contains He+ ions and ionized helium clusters He+
n , where n = 2,3,4etc. The proportions of different species depend on Tg and E/N. He+, He+
2 and
2.3 Charge recombination 13
He+3 are the dominant ionic species within the parameter range of cryogenic noble
gas ion catchers and their reduced mobilities µred vary between 10 cm2 V−1 s−1 and20 cm2 V−1 s−1. A detailed description of the formation of helium ionic species canbe found in Section 2.5 and References [35, 54, 86].
2.3 Charge recombination
Stopping and thermalization of high-energy ion beams in a noble gas ion catchercauses ionization of the gas. The recombination of electrons and positive ions inthe presence of neutral atoms is an important mechanism which determines theefficiency of a noble gas ion catcher. In the noble gas ion catcher we are dealingwith a weakly ionized gas rather than a fully stripped plasma. The evolution of theelectron-ion density in the gas cell is of importance as it influences the neutraliza-tion of the ions of interest, the extent of the penetration of the applied electric fieldin the ionization region, which is necessary for the extraction of the ions of interestand possible space-charge effects. The electron-ion density in a gas cell is deter-mined by the balance between charge creation by the incoming beam and chargerecombination. Most of the ions present in the gas cell are helium ions and therecombination process is dominated by the helium recombination coefficient. Forthermalized ions three-body recombination causes neutralization. A detailed dis-cussion of the recombination process in room temperature noble gas can be found inarticles by Huyse et al. and Facina et al. [43, 44, 60]. This section is dedicated to thediscussion of ion-electron recombination processes within the context of cryogenicnoble gas ion catchers.
2.4 Recombination loss factor
The recombination loss factor f is a useful parameter to represent the figure ofmerit of a noble gas ion catcher. The recombination loss factor is the fraction ofions recombining in the ionization region. The efficiency for ion extraction from theionization region is thus (1− f ). The recombination loss factor f in a parallel plateionization chamber can be estimated as [27, 60, 98]
f =Qαd2
6µ+µ−E2 , (2.8)
where Q is the ionization rate density (helium ion-electron pairs cm−3 s−1), d is thedistance between the plates, α is the ion-electron recombination coefficient, µ+ is thepositive ion mobility, µ− is the electron mobility and E is the electric field presentin the ionization region. It is important to note that Equation 2.8 holds true only aslong as f is small [98]. Within the noble gas ion catcher context, d is the lenght ofthe ionization region along the direction of applied electric field. The ion-electron
14 Physics processes in cryogenic noble gas ion catchers
recombination coefficient α will be discussed in forthcoming sections. Electron andpositive ion mobilities in cryogenic helium gas are discussed in previous sections.As the mobility of electrons is 3 - 4 orders of magnitude higher than that of positiveions, a positive ion cloud essentially exists in the ionisation region. The appliedelectric field pushes the ions, removing them from the ionization region. The equi-librium between the ionization of the helium gas and the removal of positive ionsresults in a steady state positive charge density. This positive ion cloud induces avoltage Vind shielding the applied field (i.e. decreasing the effective field)
Vind =
√eQ
4ε0µ+d2 , (2.9)
where e is the electric charge and ε0 the permittivity of the vacuum. As the beamintensity increases, the induced voltage increases. The resulting decrease in theeffective field slows down the removal of ions from the ionisation region, enhancingthe positive charge density and the induced voltage. Due to this positive feedbackmechanism one expects a quick increase in induced voltage with increasing beamintensity up to the point where the effective field becomes zero. In this situationions will drift out of the cloud into a region where the applied field transportsthem. Once the effective electric field becomes small enough, electrons are no longereffectively removed from the ionization region causing an increase in neutralization.The only way to overcome this bottleneck is to apply higher electric fields.
2.5 Helium ion species
A large fraction of the energy loss of energetic ions in helium gas goes towardsthe ionization of helium atoms. On average, 40 eV is needed to create a heliumion-electron pair; less than twice the ionisation energy of 24 eV. Depending ontemperature, pressure and electric drift field, the He+ ions will be transferred toionized helium clusters He+
n . The binding energy of He+2 is 2.5 eV; that of He+
3 is0.17(3) eV [85]. He+
4 is considered very unstable. In this sense, He+2 and He+
3 aremore molecules than clusters, whereas He+
n with n > 4 is a true cluster in the sensethat it is kept together by van der Waals forces. At room temperature, He+ is thedominant ion below 1 mbar; above 5 mbar, He+
2 is dominant. Patterson [85], showsin measurements up to a helium pressure of 40 mbar that He+
3 starts to form below200 K and becomes the main ion at about 120 K. Gerber and Gusinow [49] establishthat He+
3 is dominant at 76 K, 1 ms after an electric discharge for densities aboveabout 3× 1017 cm−3. Delpech and Gauthier [33] suggest that the dominant ion at4.2 K is He+
3 .The temperature dependence of the reaction rate coefficient for the dimerisation
of helium (He+ + 2He→He+2 + He) is k = 3.53× 10⁻²⁹ T−1
g cm−6 s−1, measured be-tween 77 K and 449 K at a helium atomic density of 1.8× 1017 cm−3 and from 5 to
2.5 Helium ion species 15
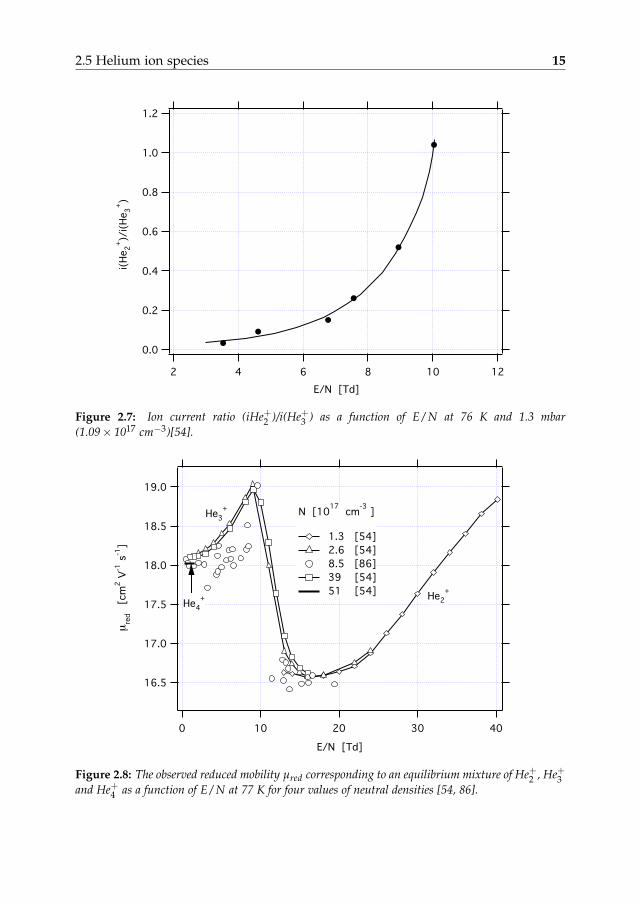
Figure 2.7: Ion current ratio (iHe+2 )/i(He+3 ) as a function of E/N at 76 K and 1.3 mbar(1.09× 1017 cm−3)[54].
µ
Figure 2.8: The observed reduced mobility µred corresponding to an equilibrium mixture of He+2 , He+3and He+4 as a function of E/N at 77 K for four values of neutral densities [54, 86].
16 Physics processes in cryogenic noble gas ion catchers
13 mbar at a temperature of 300 K [79]. One should note here that this work [79]was not aware of the existence of He+
3 ; the results may therefore very well representa sum of He+
2 and He+3 . This gives a dimer formation half-life t1/2 = ln 2/kN2 of 8 ns
at 300 K and of 2 ns at 77 K for a helium atomic density N = 2.71× 1019 cm−3. At76 K, the conversion He+
2 + 2He→He+3 + He is faster than He+ + 2He→He+
2 + He[49]. The conversion frequency of the latter is 1.44(14)× 10−31N2 s−1, causing adimerisation life time of 6 ns at N = 2.71× 1019 cm−3, in fair agreement with thevalue given above. At 76 K, the intensity ratio i(He+
2 )/i(He+3 ) is less than 1013 N−1
[54]; He+3 is thus dominant at all densities relevant for this work.
Helium ion clusters moving at high speed due to an electric drift field can bedestroyed for high E/N. Patterson reports that at 76 K and N = 1.6× 1017 cm−3,He+
3 ions are mostly intact up to E/N = 6 Td, yet mostly destroyed in collisionsat E/N & 13 Td as they are electrically heated. Figure 2.7 shows the rapid in-crease in the breakup of He+
3 at about 9 Td at a temperature of 76 K. Figure 2.8shows the E/N dependence of the observed reduced mobility of molecular he-lium in helium at 77 K [54]. The same author deduces that He+
2 is dominant for(E/N)/N > 6× 10¹⁷ Td cm3.
2.6 Recombination coefficient of helium ions
Let us first consider the recombination of helium ions in helium gas. A goodoverview of this subject is given by Dutton [36]. In general, the recombination coef-ficient depends on temperature and density of the electrons, of the ions and of theneutral gas particles. These temperatures and densities are often interrelated. Wefocus our discussion here on the situation with low electron density (< 1011 cm−3)and rather high pressure (> 10 mbar). We look at the recombination of He+
2 andHe+
3 . The main recombination reactions are
2-body: He+n + e− = He∗n−1 + He
and
3-body: He+n + e−+ He = He∗n−1 + 2He.
The 2-body reaction is characterised by the recombination coefficient or rateconstant α2 (in cm3 s−1); the 3-body reaction by the recombination coefficient α3 (incm6 s−1). The total recombination coefficient is given by
α = α2 + Nα3 (2.10)
where N is the atomic density of the gas. Early work did not take a strong source ofelectrons from penning ionization (ionization in metastable-metastable collisions)into account and thus measured an effective recombination coefficient. If a strongelectron source is present, the recombination coefficient appears smaller. Such
2.6 Recombination coefficient of helium ions 17
electrons are driving these reactions involving helium ions and metastable heliumatoms. The true or actual recombination coefficient can be five times larger [61].
R. Deloche et al. [32] measure the recombination of He+2 at room temperature
and pressures from 7 mbar to 130 mbar. Five different diagnostic tools, i.e. X-bandmicrowave interferometry, X-band microwave radiometry, mass spectrometry, op-tical absorption spectrometry and optical emission spectrometry are used to mea-sure the decay time of attenuation and phase-shift of the wave crossing the plasmabranch, radiation temperature of ionized gas, atomic- and molecular-ion currents,density of atomic and molecular metastables and decay time of excited atomic andmolecular populations. They interpret the data with a mathematical model includ-ing all known elementary processes as a set of coupled partial differential equations.In this way, the rate coefficients of all significant mechanisms are measured simul-taneously such that the complex correlation between ion, metastable and electronconcentration is taken into account. In Deloches’ work the ion temperature is equalto the gas temperature, while the electron temperature is not. The resulting recom-bination coefficient for He+
2 is:
α = (αc + k0N)(Te/293)−x + kene(Te/293)−y , (2.11)
where N is the helium density (cm−3), Te is the electron temperature (K), neis the electron density (cm−3), αc < 5× 1010 cm3 s−1, k0 = 5(1)× 10−27 cm6 s−1,ke = 4.0(5)× 10−20 cm−3 s−1, x = 1(1) and y = 4.0(5). Johnson and Gerardo [62] mea-sure the recombination coefficient for an electron temperature equal to the gastemperature of 300 K to be α = 1.1× 10⁻⁸ + 1.2× 10⁻²⁶N cm3 s−1 for 4.8× 10¹⁷ <N < 1.8× 1018 cm−3. Assuming an electron temperature equal to the gas tempera-ture and an electron density below about 1011 cm−3 (such that the electron-densitydependent term in (Equation. 2.11) can be neglected), we can compare the results of[32] and [62]: for a helium pressure of 100 mbar to 1000 mbar, the two results agreewithin a factor of about 3. Collings et al. [26] measure recombination of He+ at 2.5and 60 mbar (it is not clear if He+ is singled out, or if in fact He+
2 was measuredat 60 mbar). At 60 mbar, they obtain α = 1.8× 10⁻²⁰ ne(Te/300)−4.4 cm3 s−1. Theterms depending on the electron density from [32] (see Equation 2.11) and [26] arethe same within a factor of about 2.
As mentioned above He+3 is the dominant ion at low temperatures. Gerardo and
Deloche [49, 33] show that the recombination coefficient of He+3 at low temperature
is much higher than that of He+2 at room temperature. Gerardo and Gusinow mea-
sure the recombination coeffcient for Tg = Te = 80 K to be 3.4±1.4× 10⁻⁶ cm3 s−1,and show an electron temperature dependence T−a
e , with 0.98 < a < 1.60. Delpechand Gauthier [33] measure at a gas temperature of 4.2 K and a helium density of1.7× 1017 cm−3 to 28.7× 1017 cm−3, while varying the electron temperature from 10to 200 K. They obtain a recombination coefficient = 4.0(6)× 10−4/Te cm3 s−1. Thiswas later verified for Te 6 100 K by [92]. For Te = 80 K, this result agrees with [49],indicating that not the gas temperature, but the electron temperature is the relevantparameter. In cryogenic plasmas, hot electrons play thus a dominant role as the
18 Physics processes in cryogenic noble gas ion catchers
!
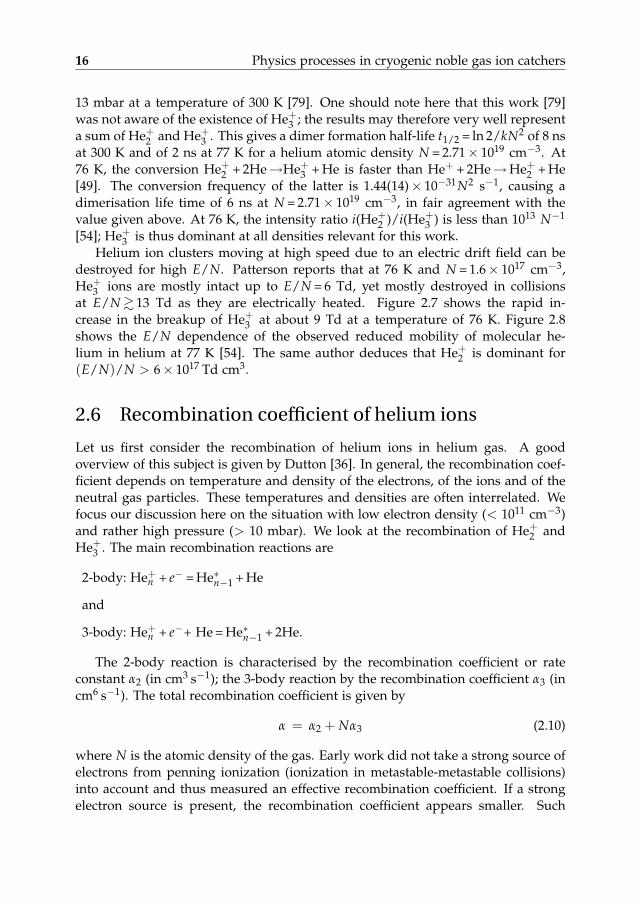
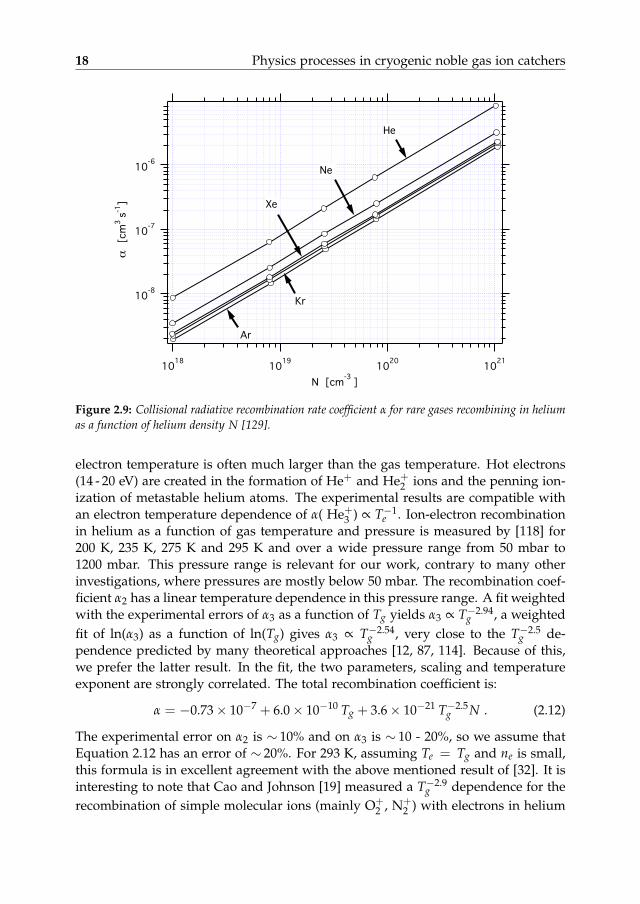
Figure 2.9: Collisional radiative recombination rate coefficient α for rare gases recombining in heliumas a function of helium density N [129].
electron temperature is often much larger than the gas temperature. Hot electrons(14 - 20 eV) are created in the formation of He+ and He+
2 ions and the penning ion-ization of metastable helium atoms. The experimental results are compatible withan electron temperature dependence of α( He+
3 ) ∝ T−1e . Ion-electron recombination
in helium as a function of gas temperature and pressure is measured by [118] for200 K, 235 K, 275 K and 295 K and over a wide pressure range from 50 mbar to1200 mbar. This pressure range is relevant for our work, contrary to many otherinvestigations, where pressures are mostly below 50 mbar. The recombination coef-ficient α2 has a linear temperature dependence in this pressure range. A fit weightedwith the experimental errors of α3 as a function of Tg yields α3 ∝ T−2.94
g , a weightedfit of ln(α3) as a function of ln(Tg) gives α3 ∝ T−2.54
g , very close to the T−2.5g de-
pendence predicted by many theoretical approaches [12, 87, 114]. Because of this,we prefer the latter result. In the fit, the two parameters, scaling and temperatureexponent are strongly correlated. The total recombination coefficient is:
α = −0.73× 10⁻⁷ + 6.0× 10⁻¹⁰ Tg + 3.6× 10⁻²¹ T−2.5g N . (2.12)
The experimental error on α2 is ∼ 10% and on α3 is ∼ 10 - 20%, so we assume thatEquation 2.12 has an error of ∼ 20%. For 293 K, assuming Te = Tg and ne is small,this formula is in excellent agreement with the above mentioned result of [32]. It isinteresting to note that Cao and Johnson [19] measured a T−2.9
g dependence for therecombination of simple molecular ions (mainly O+
2 , N+2 ) with electrons in helium
2.7 Recombination of noble gas ions in helium 19
at densities 2.5×10¹⁹ to 2.9× 1020 cm−3 and gas temperatures of 77 K, 125 K and150 K.
2.7 Recombination of noble gas ions in helium
As this work is mostly concerned with the survival and transport of radon ions inhelium, we here summarize the knowledge on the relevant recombination coeffi-cient. Whitten et al. [129] calculate the recombination coefficient for noble gas ionsX+ recombining in helium, X+ + e− + He→X∗ + He, for a temperature of 300 K andhelium densities from 1018 to 1021 cm−3. The calculations are validated by compar-ing them with experimental results of He+
2 recombining in helium. The calculationis within a factor of 3 from the measurements, which amongst themselves showa variation of the same order. As the values for Ar, Kr and Xe are very close toeach other one can expect that radon will have a very similar value (Figure 2.9) i.e.α = 2.0× 10⁻²⁷N cm3 s−1.
2.8 Conclusion
This chapter presents a literature survey on relevant physical processes in a cryo-genic helium gas ion catcher. Most of the physical processes involved in cryogenicion catchers fall within the classical and elastic collision limit. The positive ion mo-bility is an important parameter determining the efficiency of the extraction of ionsfrom such a device as it determines the extraction time of ions from the stoppingvolume. At the typical helium densities in noble gas ion catchers He+
2 is the dom-inant ion in ionised helium gas above a temperature of about 200 K. Below thistemperature He+
3 is dominant. The typical electric field to density ratio consideredhere is not large enough to induce breakup of He+
3 .The main ion-loss mechanism in a cryogenic helium gas ion catcher is the recom-
bination loss. Recombination of thermalized ions has a negative impact on the totalextraction efficiency, whereas helium ion recombination acts as a positive factor asit decreases the space charge problem associated with the ion beam and removesthe electrons that could otherwise neutralize the ions of interest. The recombina-tion coefficient of helium ions shows a temperature dependence of T−2.5
g which ischaracteristic for the 3-body recombination coefficient α3. The same temperaturebehaviour is observed for simple molecular ions in helium down to 77 K. Recom-bination shows an electron temperature dependence of T−1
e which in turn dependson the ionization method and can be much higher than the gas temperature.

3Physics processes insuperfluid heliumion catchers
Helium has two stable isotopes 4He and 3He. Though 3He has the same chemicalnature as 4He, the lighter mass of 3He and the fact that 3He is a fermion result
in markedly different behavior. Helium was first liquefied by Kamerlingh Onnes in1908 for which he won a Nobel Prize in 1913. This work deals with the propertiesof 4He, and unless specifically stated, it should be assumed that 4He is the isotopebeing discussed and that parameters are given at saturated vapor pressure.
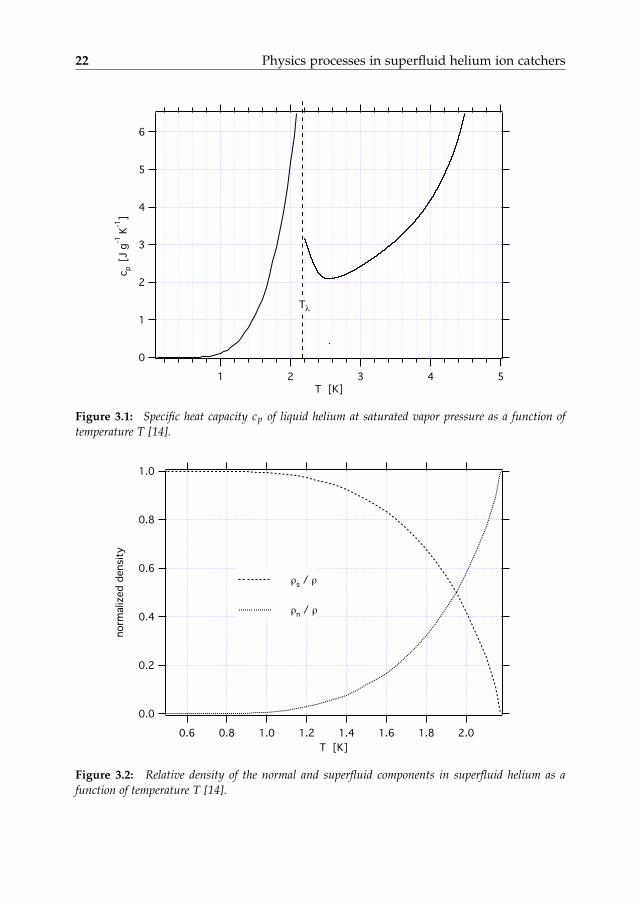
When liquid helium is cooled to 2.172 K, it undergoes a phase transition. Be-cause of the characteristic profile of the heat capacity curve (see Figure 3.1), thetemperature at which the transition takes place is called the lambda temperatureTλ. There is no specific volume change or latent heat involved in the lambda tran-sition. In 1938, P. Kapitza [63] and independently J. F. Allen and A. D. Misener [1]reported the zero viscosity of liquid helium below Tλ. Unlike most fluids, liquid he-lium below Tλ behaves as a non-Newtonian fluid. It was Kapitza who introducedthe term “superfluid” helium to describe the unusual behavior of helium belowTλ. The quantum-mechanical nature of the superfluid helium introduces propertieswhich cannot be explained with a classical treatment.
To account for this unique behavior, F. London [68] suggested that as a single4He atom is a boson, a large collection of 4He atoms can form a Bose-condensate-like state. Although London was right, experimentally it was very difficult to prove.In the mean time another theory known as the two-fluid model was introduced byL. Tisza [115] and L. Landau [66]. The 2-fluid model postulates that the superfluidhelium is composed of two inseparable inter-penetrating fluids, one componentbeing referred to as the normal fluid and the other component as the superfluid.Due to the simplicity and excellent agreement with experimental results, the two-
21
22 Physics processes in superfluid helium ion catchers
!
Figure 3.1: Specific heat capacity cp of liquid helium at saturated vapor pressure as a function oftemperature T [14].
! !
! !
Figure 3.2: Relative density of the normal and superfluid components in superfluid helium as afunction of temperature T [14].
23
Figure 3.3: Entropy S of superfluid helium as a function of temperature T [14].
Figure 3.4: Second sound velocity Css as a function of temperature T [14].
24 Physics processes in superfluid helium ion catchers
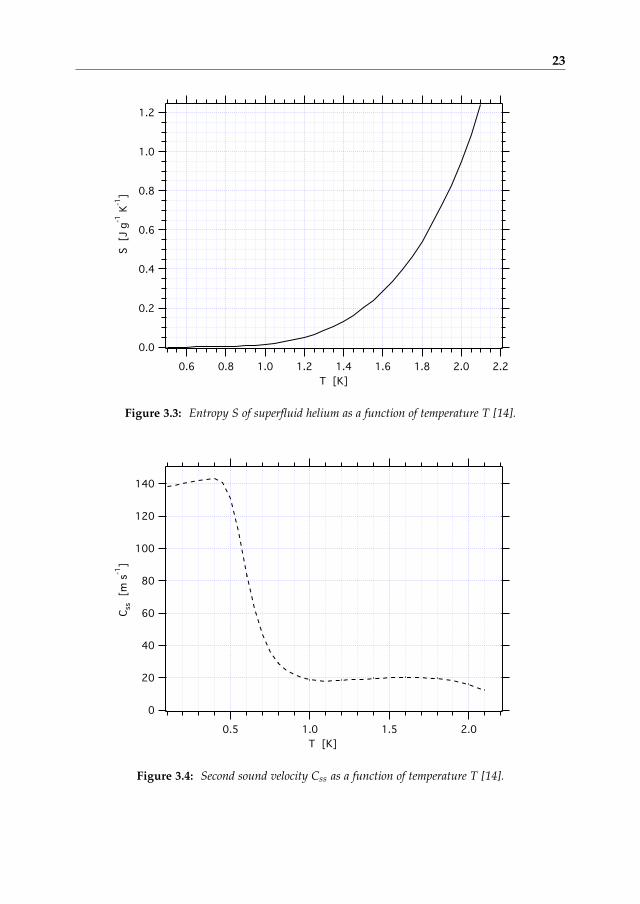
fluid model has dominated the scene for the last 70 years. According to the two-fluid model the density of the superfluid component is given by
ρs = ρ
(1− T
Tλ
)5.6, (3.1)
ρ = ρs + ρn , (3.2)
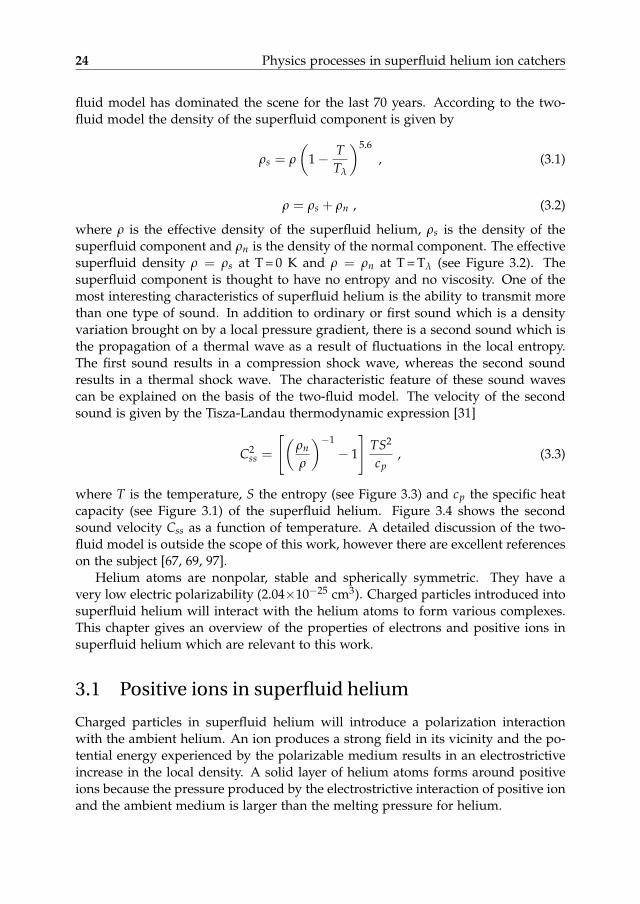
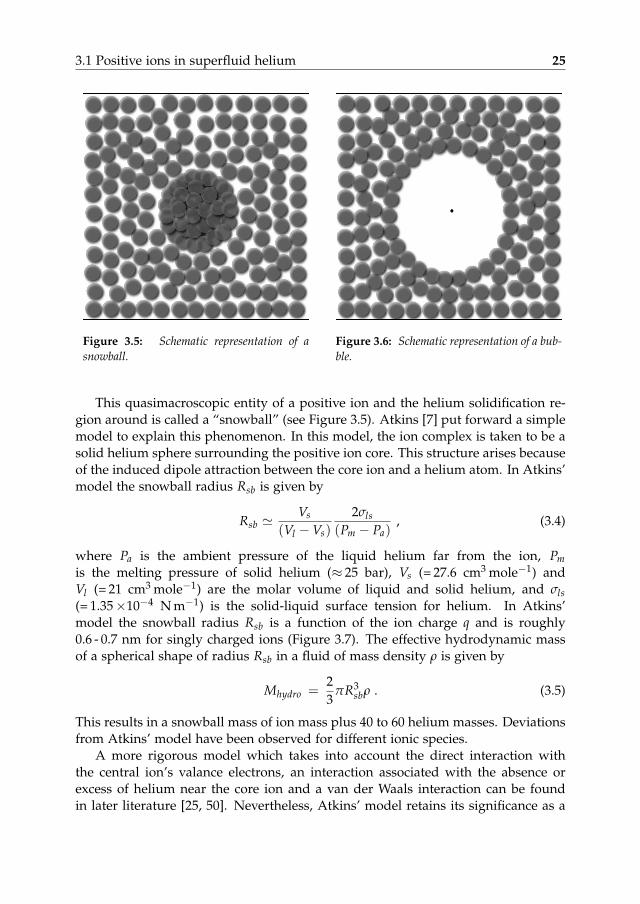
where ρ is the effective density of the superfluid helium, ρs is the density of thesuperfluid component and ρn is the density of the normal component. The effectivesuperfluid density ρ = ρs at T = 0 K and ρ = ρn at T = Tλ (see Figure 3.2). Thesuperfluid component is thought to have no entropy and no viscosity. One of themost interesting characteristics of superfluid helium is the ability to transmit morethan one type of sound. In addition to ordinary or first sound which is a densityvariation brought on by a local pressure gradient, there is a second sound which isthe propagation of a thermal wave as a result of fluctuations in the local entropy.The first sound results in a compression shock wave, whereas the second soundresults in a thermal shock wave. The characteristic feature of these sound wavescan be explained on the basis of the two-fluid model. The velocity of the secondsound is given by the Tisza-Landau thermodynamic expression [31]
C2ss =
[(ρn
ρ
)−1− 1
]TS2
cp, (3.3)
where T is the temperature, S the entropy (see Figure 3.3) and cp the specific heatcapacity (see Figure 3.1) of the superfluid helium. Figure 3.4 shows the secondsound velocity Css as a function of temperature. A detailed discussion of the two-fluid model is outside the scope of this work, however there are excellent referenceson the subject [67, 69, 97].
Helium atoms are nonpolar, stable and spherically symmetric. They have avery low electric polarizability (2.04×10⁻²⁵ cm3). Charged particles introduced intosuperfluid helium will interact with the helium atoms to form various complexes.This chapter gives an overview of the properties of electrons and positive ions insuperfluid helium which are relevant to this work.
3.1 Positive ions in superfluid helium
Charged particles in superfluid helium will introduce a polarization interactionwith the ambient helium. An ion produces a strong field in its vicinity and the po-tential energy experienced by the polarizable medium results in an electrostrictiveincrease in the local density. A solid layer of helium atoms forms around positiveions because the pressure produced by the electrostrictive interaction of positive ionand the ambient medium is larger than the melting pressure for helium.
3.1 Positive ions in superfluid helium 25
Figure 3.5: Schematic representation of asnowball.
Figure 3.6: Schematic representation of a bub-ble.
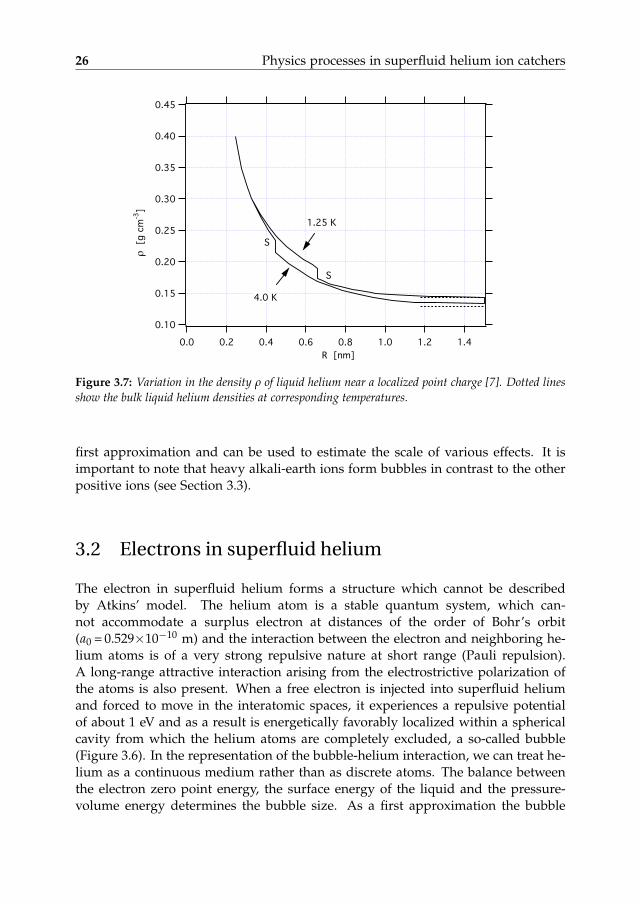
This quasimacroscopic entity of a positive ion and the helium solidification re-gion around is called a “snowball” (see Figure 3.5). Atkins [7] put forward a simplemodel to explain this phenomenon. In this model, the ion complex is taken to be asolid helium sphere surrounding the positive ion core. This structure arises becauseof the induced dipole attraction between the core ion and a helium atom. In Atkins’model the snowball radius Rsb is given by
Rsb 'Vs
(Vl −Vs)2σls
(Pm − Pa), (3.4)
where Pa is the ambient pressure of the liquid helium far from the ion, Pmis the melting pressure of solid helium (≈ 25 bar), Vs (= 27.6 cm3 mole−1) andVl (= 21 cm3 mole−1) are the molar volume of liquid and solid helium, and σls(= 1.35×10⁻⁴ N m−1) is the solid-liquid surface tension for helium. In Atkins’model the snowball radius Rsb is a function of the ion charge q and is roughly0.6 - 0.7 nm for singly charged ions (Figure 3.7). The effective hydrodynamic massof a spherical shape of radius Rsb in a fluid of mass density ρ is given by
Mhydro =23
πR3sbρ . (3.5)
This results in a snowball mass of ion mass plus 40 to 60 helium masses. Deviationsfrom Atkins’ model have been observed for different ionic species.
A more rigorous model which takes into account the direct interaction withthe central ion’s valance electrons, an interaction associated with the absence orexcess of helium near the core ion and a van der Waals interaction can be foundin later literature [25, 50]. Nevertheless, Atkins’ model retains its significance as a
26 Physics processes in superfluid helium ion catchers
!
Figure 3.7: Variation in the density ρ of liquid helium near a localized point charge [7]. Dotted linesshow the bulk liquid helium densities at corresponding temperatures.
first approximation and can be used to estimate the scale of various effects. It isimportant to note that heavy alkali-earth ions form bubbles in contrast to the otherpositive ions (see Section 3.3).
3.2 Electrons in superfluid helium
The electron in superfluid helium forms a structure which cannot be describedby Atkins’ model. The helium atom is a stable quantum system, which can-not accommodate a surplus electron at distances of the order of Bohr’s orbit(a0 = 0.529×10⁻¹⁰ m) and the interaction between the electron and neighboring he-lium atoms is of a very strong repulsive nature at short range (Pauli repulsion).A long-range attractive interaction arising from the electrostrictive polarization ofthe atoms is also present. When a free electron is injected into superfluid heliumand forced to move in the interatomic spaces, it experiences a repulsive potentialof about 1 eV and as a result is energetically favorably localized within a sphericalcavity from which the helium atoms are completely excluded, a so-called bubble(Figure 3.6). In the representation of the bubble-helium interaction, we can treat he-lium as a continuous medium rather than as discrete atoms. The balance betweenthe electron zero point energy, the surface energy of the liquid and the pressure-volume energy determines the bubble size. As a first approximation the bubble
3.3 Snowball and bubble mobility 27
energy can be expressed as [24]
E =h2
8mR2b
+ 4πR2bσs +
43
πR3bPa , (3.6)
where Rb is the bubble radius, m is the electron mass, σs ∼3.7×10⁻⁴ N m−1 is thesurface energy per unit area and h is Planck’s constant. At zero pressure the radiusat which the energy has a minimum is
Rminb =
(h2
32mπσs
)1/4
. (3.7)
This radius is 1.9 nm at 0 K and increases slightly as the temperature goes up. It isimportant to note that the polarization-induced electrostrictive forces which lead tothe snowball formation in the case of positive ions will not play a role in electronbubble formation as Rb Rsb. As the electron mass is negligible, the effective massof an electron bubble is the hydrodynamic mass (Equation 3.5) of 243±5 heliummasses [99]. Similar to electrons, negative ions and heavy alkali earth positive ionsform bubbles [46].
3.3 Snowball and bubble mobility
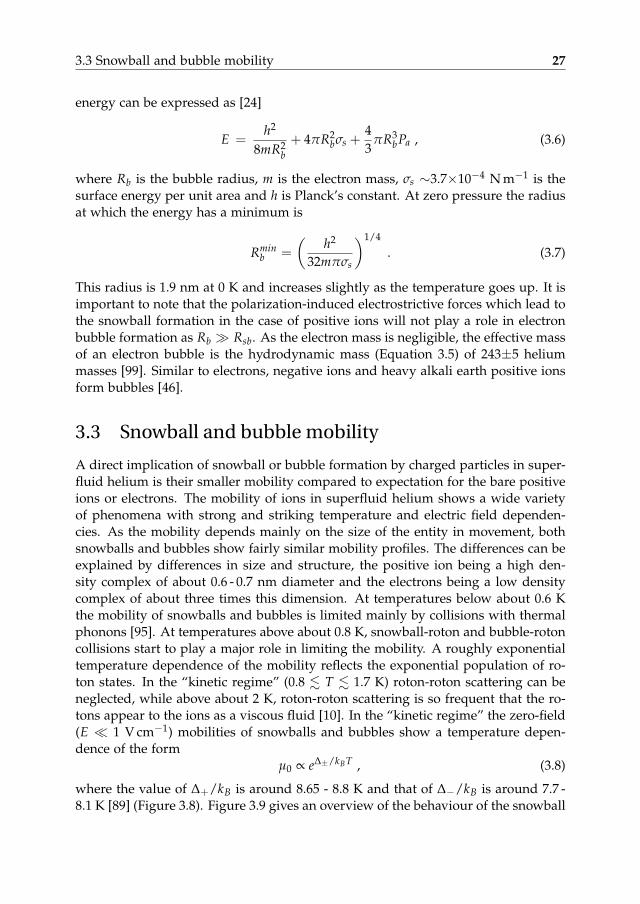
A direct implication of snowball or bubble formation by charged particles in super-fluid helium is their smaller mobility compared to expectation for the bare positiveions or electrons. The mobility of ions in superfluid helium shows a wide varietyof phenomena with strong and striking temperature and electric field dependen-cies. As the mobility depends mainly on the size of the entity in movement, bothsnowballs and bubbles show fairly similar mobility profiles. The differences can beexplained by differences in size and structure, the positive ion being a high den-sity complex of about 0.6 - 0.7 nm diameter and the electrons being a low densitycomplex of about three times this dimension. At temperatures below about 0.6 Kthe mobility of snowballs and bubbles is limited mainly by collisions with thermalphonons [95]. At temperatures above about 0.8 K, snowball-roton and bubble-rotoncollisions start to play a major role in limiting the mobility. A roughly exponentialtemperature dependence of the mobility reflects the exponential population of ro-ton states. In the “kinetic regime” (0.8 . T . 1.7 K) roton-roton scattering can beneglected, while above about 2 K, roton-roton scattering is so frequent that the ro-tons appear to the ions as a viscous fluid [10]. In the “kinetic regime” the zero-field(E 1 V cm−1) mobilities of snowballs and bubbles show a temperature depen-dence of the form
µ0 ∝ e∆±/kBT , (3.8)
where the value of ∆+/kB is around 8.65 - 8.8 K and that of ∆−/kB is around 7.7 -8.1 K [89] (Figure 3.8). Figure 3.9 gives an overview of the behaviour of the snowball
28 Physics processes in superfluid helium ion catchers
µ
!"1
Figure 3.8: Zero field mobilities µ0 of positive ions and electrons in liquid helium as a function ofinverse temperature 1/T [89].
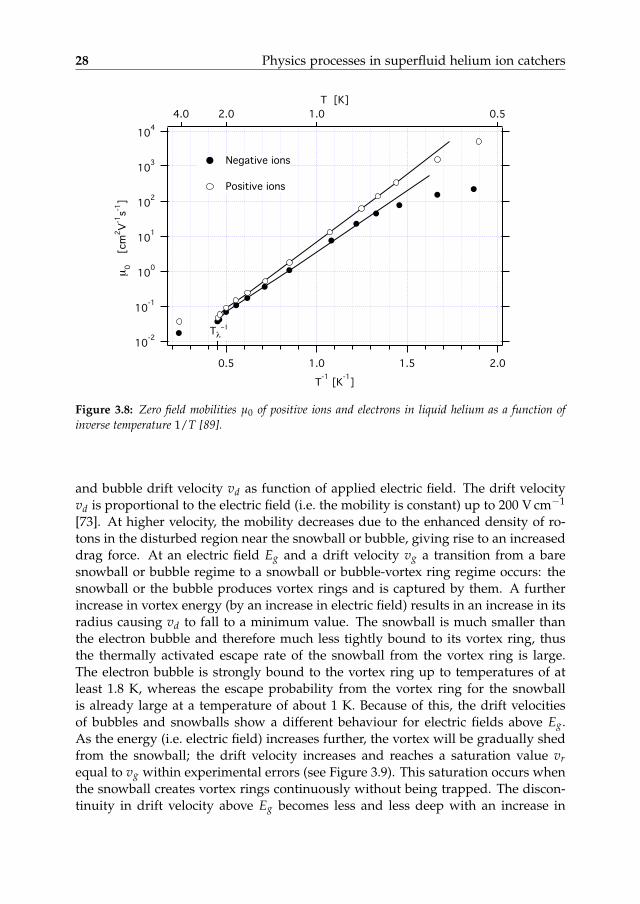
and bubble drift velocity vd as function of applied electric field. The drift velocityvd is proportional to the electric field (i.e. the mobility is constant) up to 200 V cm−1
[73]. At higher velocity, the mobility decreases due to the enhanced density of ro-tons in the disturbed region near the snowball or bubble, giving rise to an increaseddrag force. At an electric field Eg and a drift velocity vg a transition from a baresnowball or bubble regime to a snowball or bubble-vortex ring regime occurs: thesnowball or the bubble produces vortex rings and is captured by them. A furtherincrease in vortex energy (by an increase in electric field) results in an increase in itsradius causing vd to fall to a minimum value. The snowball is much smaller thanthe electron bubble and therefore much less tightly bound to its vortex ring, thusthe thermally activated escape rate of the snowball from the vortex ring is large.The electron bubble is strongly bound to the vortex ring up to temperatures of atleast 1.8 K, whereas the escape probability from the vortex ring for the snowballis already large at a temperature of about 1 K. Because of this, the drift velocitiesof bubbles and snowballs show a different behaviour for electric fields above Eg.As the energy (i.e. electric field) increases further, the vortex will be gradually shedfrom the snowball; the drift velocity increases and reaches a saturation value vrequal to vg within experimental errors (see Figure 3.9). This saturation occurs whenthe snowball creates vortex rings continuously without being trapped. The discon-tinuity in drift velocity above Eg becomes less and less deep with an increase in
3.3 Snowball and bubble mobility 29
Figure 3.9: Drift velocity vd of positive and negative ions as a function of the electric field E [17].vg, Eg and vr are indicated for 1.3 K.
! !
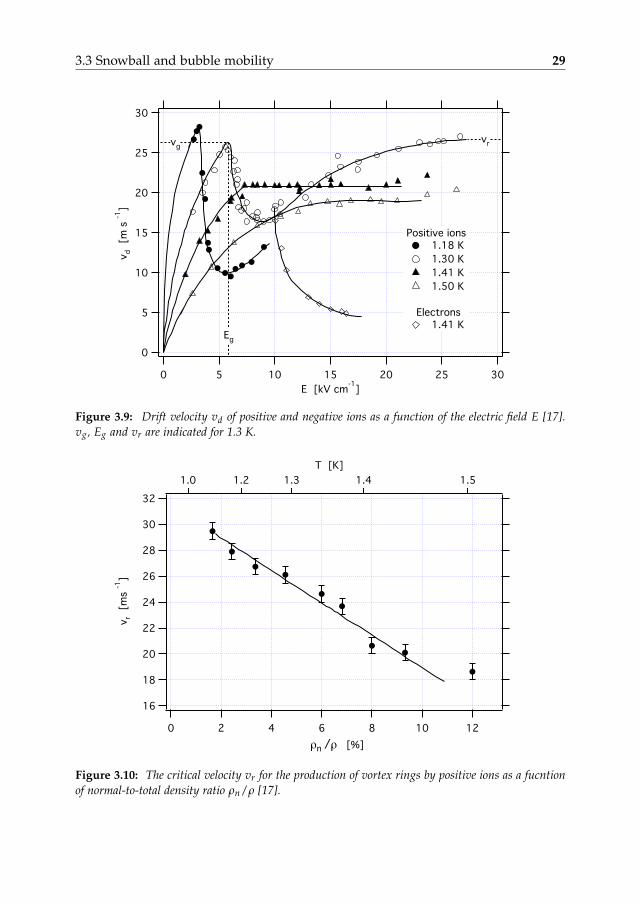
Figure 3.10: The critical velocity vr for the production of vortex rings by positive ions as a fucntionof normal-to-total density ratio ρn/ρ [17].
30 Physics processes in superfluid helium ion catchers
µ!1
µµ
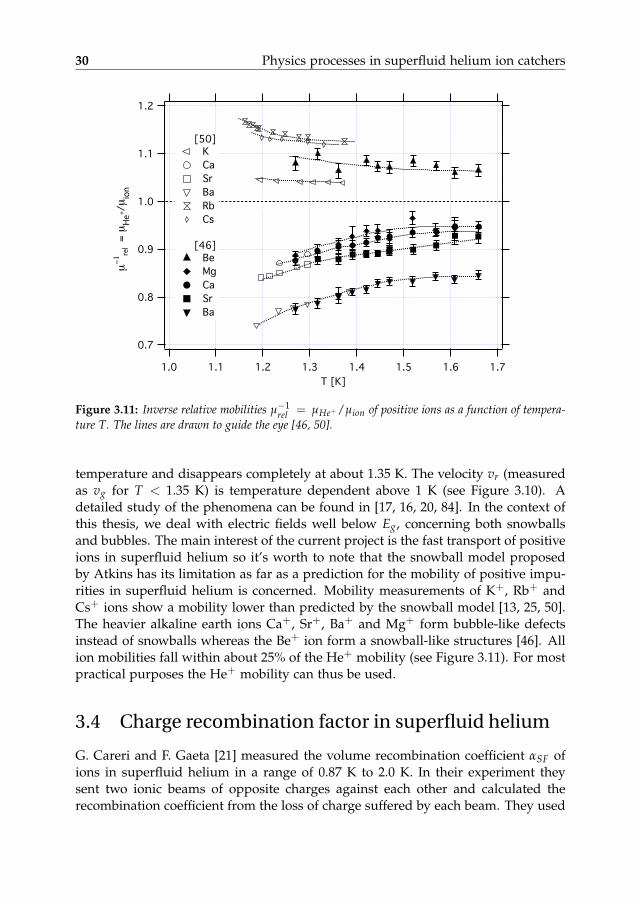
Figure 3.11: Inverse relative mobilities µ−1rel = µHe+ /µion of positive ions as a function of tempera-
ture T. The lines are drawn to guide the eye [46, 50].
temperature and disappears completely at about 1.35 K. The velocity vr (measuredas vg for T < 1.35 K) is temperature dependent above 1 K (see Figure 3.10). Adetailed study of the phenomena can be found in [17, 16, 20, 84]. In the context ofthis thesis, we deal with electric fields well below Eg, concerning both snowballsand bubbles. The main interest of the current project is the fast transport of positiveions in superfluid helium so it’s worth to note that the snowball model proposedby Atkins has its limitation as far as a prediction for the mobility of positive impu-rities in superfluid helium is concerned. Mobility measurements of K+, Rb+ andCs+ ions show a mobility lower than predicted by the snowball model [13, 25, 50].The heavier alkaline earth ions Ca+, Sr+, Ba+ and Mg+ form bubble-like defectsinstead of snowballs whereas the Be+ ion form a snowball-like structures [46]. Allion mobilities fall within about 25% of the He+ mobility (see Figure 3.11). For mostpractical purposes the He+ mobility can thus be used.
3.4 Charge recombination factor in superfluid helium
G. Careri and F. Gaeta [21] measured the volume recombination coefficient αSF ofions in superfluid helium in a range of 0.87 K to 2.0 K. In their experiment theysent two ionic beams of opposite charges against each other and calculated therecombination coefficient from the loss of charge suffered by each beam. They used
3.5 Positive ions at the superfluid-vapor interface 31
!
"
"
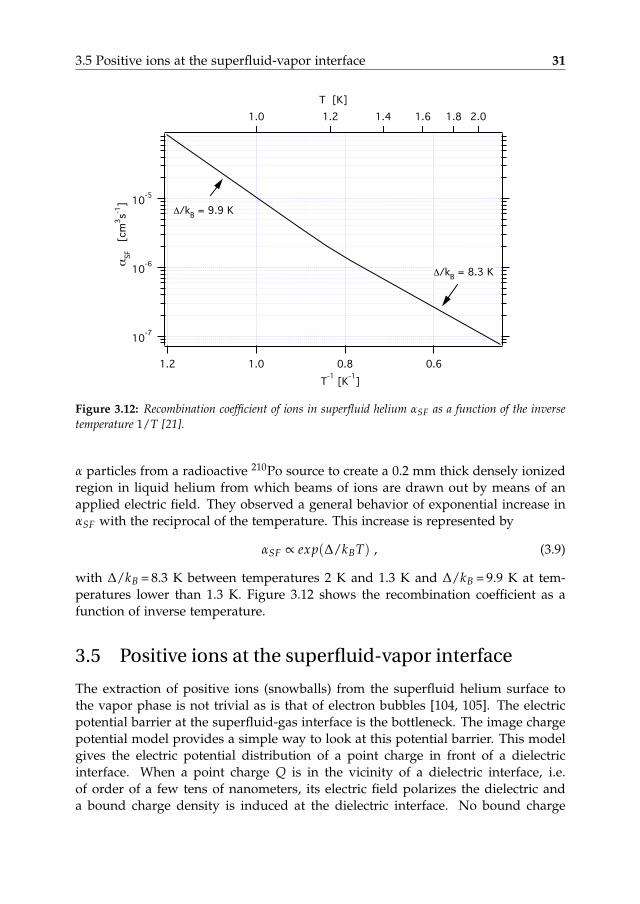
Figure 3.12: Recombination coefficient of ions in superfluid helium αSF as a function of the inversetemperature 1/T [21].
α particles from a radioactive 210Po source to create a 0.2 mm thick densely ionizedregion in liquid helium from which beams of ions are drawn out by means of anapplied electric field. They observed a general behavior of exponential increase inαSF with the reciprocal of the temperature. This increase is represented by
αSF ∝ exp(∆/kBT) , (3.9)
with ∆/kB = 8.3 K between temperatures 2 K and 1.3 K and ∆/kB = 9.9 K at tem-peratures lower than 1.3 K. Figure 3.12 shows the recombination coefficient as afunction of inverse temperature.
3.5 Positive ions at the superfluid-vapor interface
The extraction of positive ions (snowballs) from the superfluid helium surface tothe vapor phase is not trivial as is that of electron bubbles [104, 105]. The electricpotential barrier at the superfluid-gas interface is the bottleneck. The image chargepotential model provides a simple way to look at this potential barrier. This modelgives the electric potential distribution of a point charge in front of a dielectricinterface. When a point charge Q is in the vicinity of a dielectric interface, i.e.of order of a few tens of nanometers, its electric field polarizes the dielectric anda bound charge density is induced at the dielectric interface. No bound charge
32 Physics processes in superfluid helium ion catchers
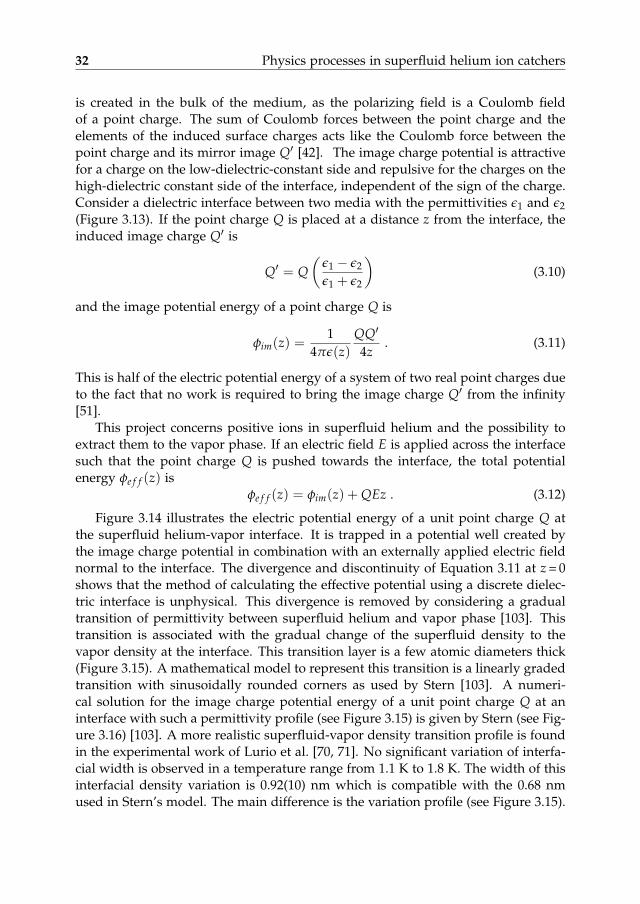
is created in the bulk of the medium, as the polarizing field is a Coulomb fieldof a point charge. The sum of Coulomb forces between the point charge and theelements of the induced surface charges acts like the Coulomb force between thepoint charge and its mirror image Q′ [42]. The image charge potential is attractivefor a charge on the low-dielectric-constant side and repulsive for the charges on thehigh-dielectric constant side of the interface, independent of the sign of the charge.Consider a dielectric interface between two media with the permittivities ε1 and ε2(Figure 3.13). If the point charge Q is placed at a distance z from the interface, theinduced image charge Q′ is
Q′ = Q(
ε1 − ε2
ε1 + ε2
)(3.10)
and the image potential energy of a point charge Q is
φim(z) =1
4πε(z)QQ′
4z. (3.11)
This is half of the electric potential energy of a system of two real point charges dueto the fact that no work is required to bring the image charge Q′ from the infinity[51].
This project concerns positive ions in superfluid helium and the possibility toextract them to the vapor phase. If an electric field E is applied across the interfacesuch that the point charge Q is pushed towards the interface, the total potentialenergy φe f f (z) is
φe f f (z) = φim(z) + QEz . (3.12)
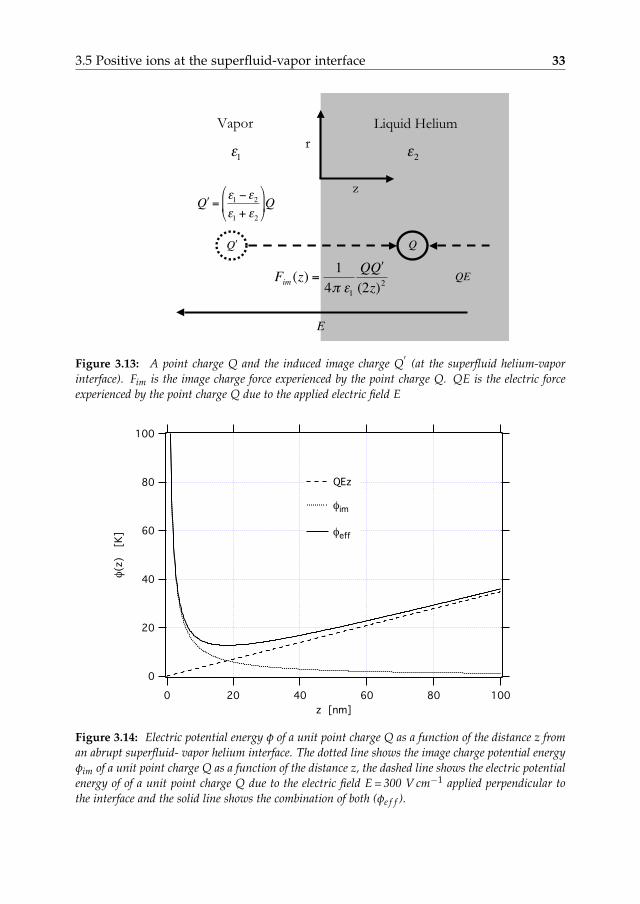
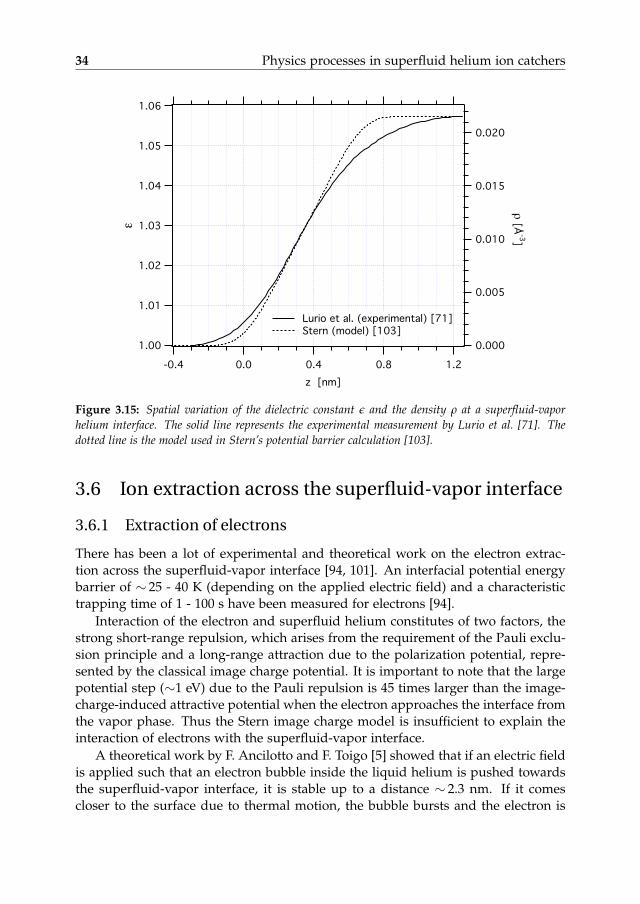
Figure 3.14 illustrates the electric potential energy of a unit point charge Q atthe superfluid helium-vapor interface. It is trapped in a potential well created bythe image charge potential in combination with an externally applied electric fieldnormal to the interface. The divergence and discontinuity of Equation 3.11 at z = 0shows that the method of calculating the effective potential using a discrete dielec-tric interface is unphysical. This divergence is removed by considering a gradualtransition of permittivity between superfluid helium and vapor phase [103]. Thistransition is associated with the gradual change of the superfluid density to thevapor density at the interface. This transition layer is a few atomic diameters thick(Figure 3.15). A mathematical model to represent this transition is a linearly gradedtransition with sinusoidally rounded corners as used by Stern [103]. A numeri-cal solution for the image charge potential energy of a unit point charge Q at aninterface with such a permittivity profile (see Figure 3.15) is given by Stern (see Fig-ure 3.16) [103]. A more realistic superfluid-vapor density transition profile is foundin the experimental work of Lurio et al. [70, 71]. No significant variation of interfa-cial width is observed in a temperature range from 1.1 K to 1.8 K. The width of thisinterfacial density variation is 0.92(10) nm which is compatible with the 0.68 nmused in Stern’s model. The main difference is the variation profile (see Figure 3.15).
3.5 Positive ions at the superfluid-vapor interface 33
Vapor Liquid Helium
! !
QE
r
z
!
" Q =#1$#
2
#1
+ #2
%
& '
(
) * Q
!
Q
!
"1
!
"2
!
E
!
Fim
(z) =1
4" #1
Q $ Q
(2z)2
!
" Q
Figure 3.13: A point charge Q and the induced image charge Q′
(at the superfluid helium-vaporinterface). Fim is the image charge force experienced by the point charge Q. QE is the electric forceexperienced by the point charge Q due to the applied electric field E
!
!
!
Figure 3.14: Electric potential energy φ of a unit point charge Q as a function of the distance z froman abrupt superfluid- vapor helium interface. The dotted line shows the image charge potential energyφim of a unit point charge Q as a function of the distance z, the dashed line shows the electric potentialenergy of of a unit point charge Q due to the electric field E = 300 V cm−1 applied perpendicular tothe interface and the solid line shows the combination of both (φe f f ).
34 Physics processes in superfluid helium ion catchers
!"
Figure 3.15: Spatial variation of the dielectric constant ε and the density ρ at a superfluid-vaporhelium interface. The solid line represents the experimental measurement by Lurio et al. [71]. Thedotted line is the model used in Stern’s potential barrier calculation [103].
3.6 Ion extraction across the superfluid-vapor interface
3.6.1 Extraction of electrons
There has been a lot of experimental and theoretical work on the electron extrac-tion across the superfluid-vapor interface [94, 101]. An interfacial potential energybarrier of ∼ 25 - 40 K (depending on the applied electric field) and a characteristictrapping time of 1 - 100 s have been measured for electrons [94].
Interaction of the electron and superfluid helium constitutes of two factors, thestrong short-range repulsion, which arises from the requirement of the Pauli exclu-sion principle and a long-range attraction due to the polarization potential, repre-sented by the classical image charge potential. It is important to note that the largepotential step (∼1 eV) due to the Pauli repulsion is 45 times larger than the image-charge-induced attractive potential when the electron approaches the interface fromthe vapor phase. Thus the Stern image charge model is insufficient to explain theinteraction of electrons with the superfluid-vapor interface.
A theoretical work by F. Ancilotto and F. Toigo [5] showed that if an electric fieldis applied such that an electron bubble inside the liquid helium is pushed towardsthe superfluid-vapor interface, it is stable up to a distance ∼ 2.3 nm. If it comescloser to the surface due to thermal motion, the bubble bursts and the electron is
3.6 Ion extraction across the superfluid-vapor interface 35
!!
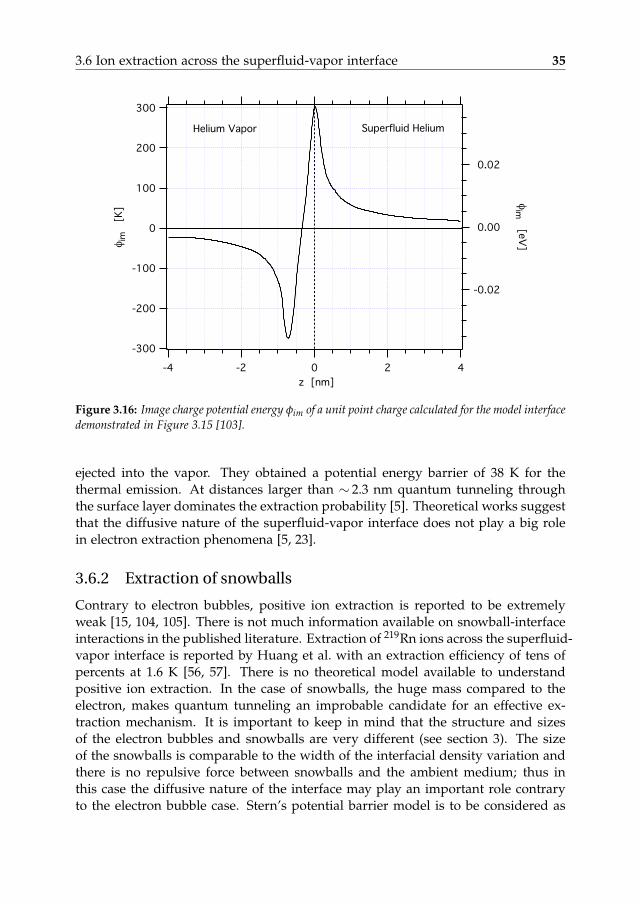
Figure 3.16: Image charge potential energy φim of a unit point charge calculated for the model interfacedemonstrated in Figure 3.15 [103].
ejected into the vapor. They obtained a potential energy barrier of 38 K for thethermal emission. At distances larger than ∼ 2.3 nm quantum tunneling throughthe surface layer dominates the extraction probability [5]. Theoretical works suggestthat the diffusive nature of the superfluid-vapor interface does not play a big rolein electron extraction phenomena [5, 23].
3.6.2 Extraction of snowballs
Contrary to electron bubbles, positive ion extraction is reported to be extremelyweak [15, 104, 105]. There is not much information available on snowball-interfaceinteractions in the published literature. Extraction of 219Rn ions across the superfluid-vapor interface is reported by Huang et al. with an extraction efficiency of tens ofpercents at 1.6 K [56, 57]. There is no theoretical model available to understandpositive ion extraction. In the case of snowballs, the huge mass compared to theelectron, makes quantum tunneling an improbable candidate for an effective ex-traction mechanism. It is important to keep in mind that the structure and sizesof the electron bubbles and snowballs are very different (see section 3). The sizeof the snowballs is comparable to the width of the interfacial density variation andthere is no repulsive force between snowballs and the ambient medium; thus inthis case the diffusive nature of the interface may play an important role contraryto the electron bubble case. Stern’s potential barrier model is to be considered as
36 Physics processes in superfluid helium ion catchers
a first approximation in the case of snowballs, this point is elaborated upon is Sec-tion 6.1.3. A similar potential energy barrier calculation with the interfacial densitytransition profile given by Lurio et al. [70, 71] and inclusion of the surface energymay give a more accurate picture.
As the quantum tunneling effect can be ruled out in the case of snowballs, it’smore realistic to consider a Maxwell-Boltzmann energy distribution of snowballstrapped in a potential well created by the image charge potential in combinationwith an externally applied electric field normal to the interface. A fraction of ionshave energies higher than the potential energy barrier. These ions will cross theinterface into the vapor phase. Kramer [64] and Chandrasekhar [22] have shownthat the escape rate Pth of particles from a potential well in consequence of Brownianmotion is
Pth ∝ exp(−Eb/kBT). (3.13)
where Eb is the height of the potential energy barrier and T is the temperatureof the system. Measuring the extraction efficiency of positive ions as function oftemperature gives the height of the potential energy barrier (see Section 6.1.2).
3.7 Conclusion
This chapter gives an overview of positive helium ion and electron properties in su-perfluid helium. In general, postive ions form “snowballs”, i.e. the density aroundthe ion is increased and electrons form “bubbles”, i.e. a cavity is formed around theobject. The mobility and drift velocity of positive ions in superfluid helium is impor-tant to understand the experimental results on the snowball efficiencies presentedin Chapter 6. The interaction of snowballs with the superfluid-vapor interface isnot yet well understood. The barrier height and location of the potential minimumat the superfluid-vapor interface depend strongly on the details of the density pro-file at the interface. An accurate theoretical description of the extraction of positiveions and the height of the potential energy barrier is not available yet. Thermalexcitation across a potential energy barrier is the most probable explanation.
4Experimentaltechniques
The experimental setup for a cryogenic ion catcher consists mainly of an exper-imental cell and a cryostat which cools down this cell to the desired temper-
ature. Buffer gas can be let in to the experimental cell independently and it canbe filled with the desired buffer gas in order to thermalize and transport ions. Inour measurements we used helium (in its cryogenic gas phase and its superfluidphase), argon and neon (in their cryogenic gas phase).
4.1 Cryostat
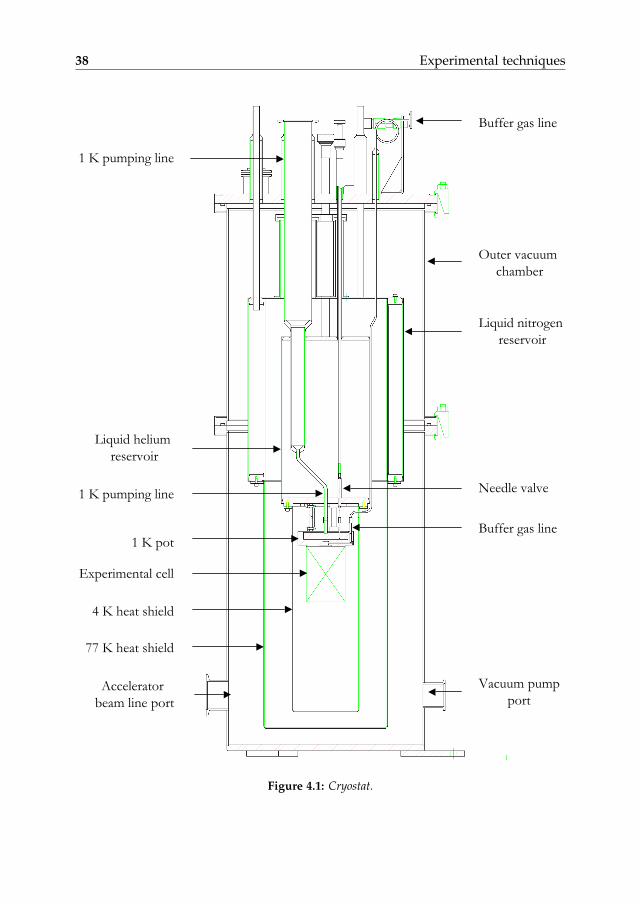
The cryostat used in this project is of “bath cryostat” type which is designed tocontain a sufficient supply of cryogens for a convenient duration of operation with-out refilling (see Figure 4.1). The refilling interval is determined mainly by factorssuch as the inherent heat load of the cryostat, the heat load from the electric cablingand the cooling power needed for the experimental cell. The main components ofthe cryostat are the outer vacuum chamber, the liquid nitrogen reservoir, the liquidhelium reservoir, the 77 K heat shield, the 4 K heat shield and the 1 K pot. Mostparts of the cryostat except the 1 K pot and the heat shields are made of stainlesssteel because of its very low heat conductance. The heat shields and 1 K pot aremade of copper for a good heat conductance with the cryogen reservoirs and aregold-plated for reflection of heat radiation. The cryostat was custom designed andconstructed by Vacuum Specials B.V. (Woerden, Netherlands).
4.1.1 Outer vacuum chamber
The outer vacuum chamber (see Figure 4.1) is at room temperature and its main pur-pose is to provide vacuum for thermal insulation of the whole system. A vacuum
37
38 Experimental techniques
Buffer gas line
Outer vacuum
chamber
Liquid nitrogen
reservoir
Liquid helium
reservoir
1 K pot
Experimental cell
Needle valve
Buffer gas line
1 K pumping line
1 K pumping line
4 K heat shield
77 K heat shield
Vacuum pump
portAccelerator
beam line port
Figure 4.1: Cryostat.

4.1 Cryostat 39
of ∼10−7 mbar is reached after filling with cryogens. The outer vacuum chamberconsists of two parts: (1) the top plate which contains the inlet and outlet portsfor the cryogens, the electric cabling ports and the buffer gas port for the experi-mental cell and (2) the two-piece vacuum chamber, which consists of a cylindricalupper part and a cup-shaped lower part. It is possible to remove the lower partof the chamber or the whole chamber. There are four ports welded on the lowerpart of the chamber in which three act as vacuum accessory ports (pressure gauges,pumps, venting valves) and the fourth as accelerator beam inlet. All three parts areassembled with rubber O-ring seals and clamps.
4.1.2 Liquid nitrogen reservoir
The liquid nitrogen reservoir is an annular stainless steel vessel which can store7.5 liters (Figure 4.1). This reservoir together with a gold-plated copper heat shieldattached to it acts as a heat shield for the inner 4.2 K region. There are threestainless steel tubes connecting the liquid nitrogen reservoir and the top plate of theouter vacuum chamber. These are used as the inlet and outlet ports for the liquidnitrogen. The liquid nitrogen reservoir is wrapped with 25 layers of aluminum-coated polyester foil (NCR2) which acts as super-insulator.
4.1.3 Liquid helium reservoir
The liquid helium reservoir is a cylindrical stainless steel chamber which can holdup to 6 liters (Figure 4.1). It is connected to the top plate of the outer vacuumchamber with four stainless steel tubes which act as a support for this reservoir.These tubes are the (1) liquid helium inlet, (2) the exhaust, (3) the needle valvewhich controls the liquid helium flow from the liquid helium reservoir to the 1 Kpot and (4) the pumping line to the 1 K pot which passes through the liquid heliumreservoir. These four tubes are heat sunk to the liquid nitrogen reservoir. Theliquid helium reservoir is wrapped with 5 layers of aluminum-coated polyester foil(NCR2) as super-insulator. A gold-plated copper heat shield is attached to the liquidhelium reservoir to reflect the heat radiation from the 77 K heat shield towards theexperimental cell (Figure 4.1).
4.1.4 1 K pot
The 1 K pot is a gold-plated copper chamber attached to the liquid helium reservoirwith three carbon fiber bars (Figure 4.1). It is the part of the cryostat system wherethe lowest temperature is attained. Liquid helium can be let in to the 1 K pot fromthe liquid helium reservoir via a needle valve and can be pumped away through apumping line which passes through the liquid helium reservoir (Figure 4.1). The1 K pot is cooled by lowering the vapor pressure inside it. A roots pump with500 m3 h−1 pumping capacity is employed to pump on the 1 K pot. The pumping
40 Experimental techniques
is controlled by a manual valve on top of the pump. The lowest temperature at-tained by this cryostat is 0.92 K; the lowest long term stable temperature achievedis ∼ 1.00 K. The experimental cell is attached to the 1 K pot with an indium sealand screws (see Figure 4.2a). A steel capillary which acts as buffer gas inlet to theexperimental cell passes alongside the liquid helium reservoir and through the 1 Kpot to pre-cool the buffer gas before it enters the experimental cell (Figure 4.1).
4.1.5 Electric cabling
Twelve cryogenic coaxial cables (Type SR - Lake Shore Cryotronics) and 16 0.1 mmdiameter twisted pair insulated copper wires connect the experimental cell to theoutside world. These cables start from vacuum feed-throughs on the top plate andare heat sunk on different temperature stages before they reach the low temperatureregion. The coaxial cables go all the way to the experimental cell. The twisted pairinsulated copper wires end on sockets attached to the bottom of the liquid heliumreservoir. Connections from these 4.2 K sockets to the 1 K pot sockets are madewith thin twisted pair insulated manganin wires. The temperature sensors and theheater are connected with the temperature controller using these 1 K pot sockets.
4.1.6 Helium consumption
The liquid helium consumption of the cryostat is due to the evaporation in theliquid helium reservoir because of the heat load from the 80 K reservoir by radiationand conduction via ports and because of evaporation in the 1 K pot needed tomaintain the temperature of the experimental cell. The heat load due to radiationloss Qrad is given by
Qrad = As × qrad × E×(
11 + n
), (4.1)
where As is the size of the radiating surface (m2), qrad is the black-body radiationheat load per unit area (2 W m−2 between 80 K and 4.2 K and 20 µW m−2 between4.2 K and 1 K), E is the emissivity of the surface 0.1 (for a polished metal surface)and n is the number of layers of super-insulation. The heat load due to conductionloss Qcon is
Qcon =Ac × qcon
L, (4.2)
where Ac is the cross-sectional area of the conducting material, qcon the conductionper unit length (0.317 W mm−1 between 80 K and 4.2 K and 0.6×10⁻³ W mm−1
between 4 K and 1 K, for stainless steel), and L the length of the conducting material.The total heat load on the liquid helium reservoir due to radiation is 0.033 W
and due to conduction is 0.15 W. The radiation heat load on the 1 K pot and ex-perimental cell are very small (2 µW) because they are facing the 4.2 K shield. Theconduction heat load is contributed by the helium input line to the experimental
4.2 Experimental cell 41
cell, the pumping line to the 1 K pot and the cryogenic coaxial cables between ex-perimental cell and the 4.2 K sockets. Together they give a heat loss of 0.034 W.Another heat source of concern is the 223Ra source. For a 223Ra source of 10 kBq theheat load from the absorption of decay products is 50 nW, which is negligible. Thetotal heat load on the helium reservoir is thus 0.22 W. As 1 W evaporates 1.3 litersof helium per hour, the inherent helium consumption of the cryostat is 0.25 litersper hour. The helium consumption during the experiments agrees very well withthis number. Evaporation from the 1 K pot thus gives only a small contribution tothe helium consumption.
4.1.7 Temperature control
A temperature controller (Model 340, Lake Shore Cryotronics) is used to control theexperimental temperature. The controller monitors the temperature with two thin-film resistance temperature sensors (Cernox RTD CX-1030, Lake Shore Cryotronics)and one Pt100 temperature sensor. The Pt100 sensor and one Cernox temperaturesensor are mounted on the 1 K pot. The other Cernox sensor is attached to thebottom of the experimental cell. The operating range for the PT-100 sensor is from873 to 30 K. The calibration for the Cerenox sensors in the range 0.3 K to 40 K wasprovided by the manufacturer. We have extended the Cernox sensor calibrations upto room temperature by comparing them with the Pt100 sensor. The Cernox sensorshave an accuracy of ± 5 mK and a long term-stability of ± 25 mK at 1.4 K. Tempera-ture control is achieved by tuning the cryostat needle valve and the pumping speedsuch that the temperature is below the desired temperature. Then the temperaturecontroller is used to heat up the 1 K pot to the desired temperature by applyingan electric current through a thin wire heater (manganin) wound around a copperblock and installed on the 1 K pot. The Lake Shore temperature controller uses aPID (proportional-integral-derivative controller) control algorithm to compute thecontrol output based on the temperature set-point and feedback from the tempera-ture sensor. A temperature stable to within 1 mK over a period of many hours wasachieved.
4.2 Experimental cell
The experimental cell is made of a copper cylinder. Its top part is attached to the 1 Kpot. The bottom is closed with a copper plate with an indium seal (see Figure 4.2a).Electric connections to the experimental cell are made via stycast feed-throughsin the bottom plate. A steel capillary running from the cryostat top plate to theexperimental cell via the 1 K pot acts as a pumping port and a buffer gas inlet forthe experimental cell. A cernox temperature sensor is attached to the bottom platein order to achieve an accurate temperature control of the experimental cell.
Stycast rods and spacers are used to build up the electrode configuration inside
42 Experimental techniques
the experimental cell. A radioactive ion source, ion trajectory manipulation elec-trodes, an aluminum ion catcher foil and an α-particle detector are assembled incylindrical symmetry (see Figures 4.2b and 4.2c).
Once cooled down to the required temperature, helium gas can be let into theexperimental cell to have cryogenic gas or superfluid helium as stopping mediumfor high-energy radioactive ions. Thermalised ions can be transported to the alu-minum catcher foil using an electric field provided by the set of guiding electrodes(see Figure 4.2d).
4.2.1 Radioactive scource
Many characteristics of ion survival in a stopping medium can be studied usingan “open” α-decaying radioactive source; i.e. a thin source without protective layersuch that α-decay products can recoil out of the source.
Advantages of this type of studies are: (1) no external high-energy ion beam isrequired as the α-decay recoil ions simulate an ion beam; (2) absolute efficienciescan be easily determined as the primary source strength is readily measured.
In this work, 223Ra sources, giving 120 keV 219Rn recoil ions, were used. Wedetect the 219Rn ions via their characteristic α decay. This radioactive decay detec-tion is essentially background-free and sensitive to the decay of a single atom/ion,resulting in very precise measurements over a large dynamic range. 223Ra sourcesare prepared from an open 227Ac source as described in [59]. Details of the decaychain of 227Ac are given in Figure 4.3 and Table 4.1. A schematic picture of thesource preparation set-up is shown in Figure 4.4. The 227Ac source is placed at thebottom of a chamber filled with ∼ 30 mbar helium gas. A copper screw is placed afew centimeters above at a negative potential (-150 to -300 V) relative to the 227Acsource.
223Ra ions, recoiling from the 227Ac source following the α decay of 227Th, arestopped in the helium gas and transported by the electric field onto the tip of thecopper screw. In order to confine the deposition of 223Ra, a plastic tape is wrappedaround the side of the copper screw so that only the tip of the copper screw isvisible from the 227Ac source.
In the first phase of this project, 223Ra sources where provided by the Depart-ment of Physics, University of Jyväskylä, Finland and the Nuclear Physics Institute,University of Mainz, Germany. In Spring 2007 we obtained a 500 kBq 227Ac sourcefrom the International Research Center for Nuclear Material Science, Tohoku Uni-versity, Japan and set up our own 223Ra source preparation unit. Taking care ofthe cleanliness of the system, the maximum recoil collection efficiency of 30% isobtained; resulting in a saturated 223Ra activity of 75 kBq and thus a 219Rn recoilion source strength of 37 500 s−1.
In our experiments we mainly consider the α-line from the 219Rn decay becausethis isotope is the primary recoil ion from the 223Ra source. When using an α-decayrecoil source, the number of recoils entering the stopping volume and the location
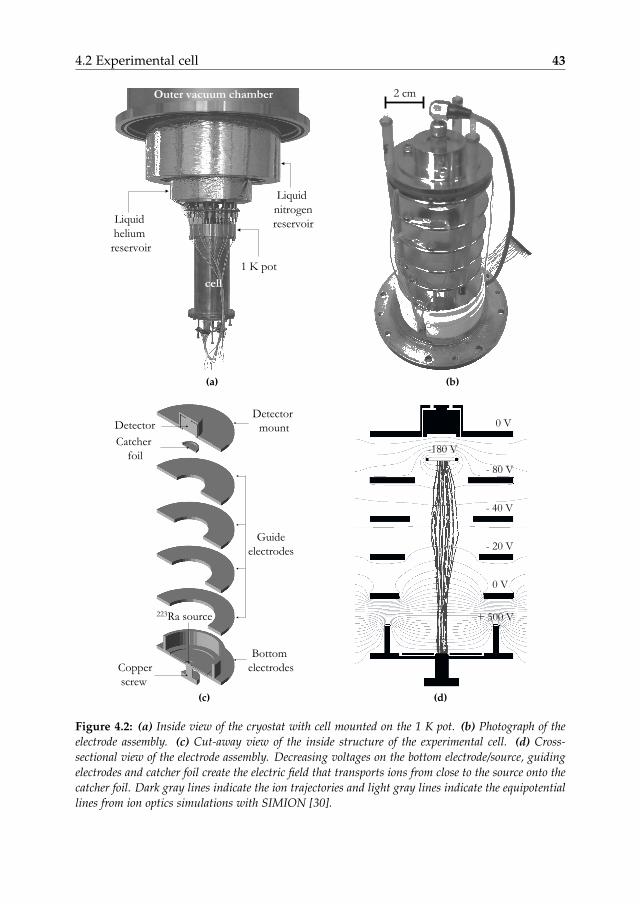
4.2 Experimental cell 43
Outer vacuum chamber
Liquid
nitrogen
reservoirLiquid
helium
reservoir
cell
1 K pot
(a)
2 cm
(b)
Detector
Catcher
foil
223Ra source
Copper
screw
Guide
electrodes
Bottom
electrodes
Detector
mount
(c)
+ 500 V
0 V
- 20 V
- 40 V
-180 V
- 80 V
0 V
(d)
Figure 4.2: (a) Inside view of the cryostat with cell mounted on the 1 K pot. (b) Photograph of theelectrode assembly. (c) Cut-away view of the inside structure of the experimental cell. (d) Cross-sectional view of the electrode assembly. Decreasing voltages on the bottom electrode/source, guidingelectrodes and catcher foil create the electric field that transports ions from close to the source onto thecatcher foil. Dark gray lines indicate the ion trajectories and light gray lines indicate the equipotentiallines from ion optics simulations with SIMION [30].
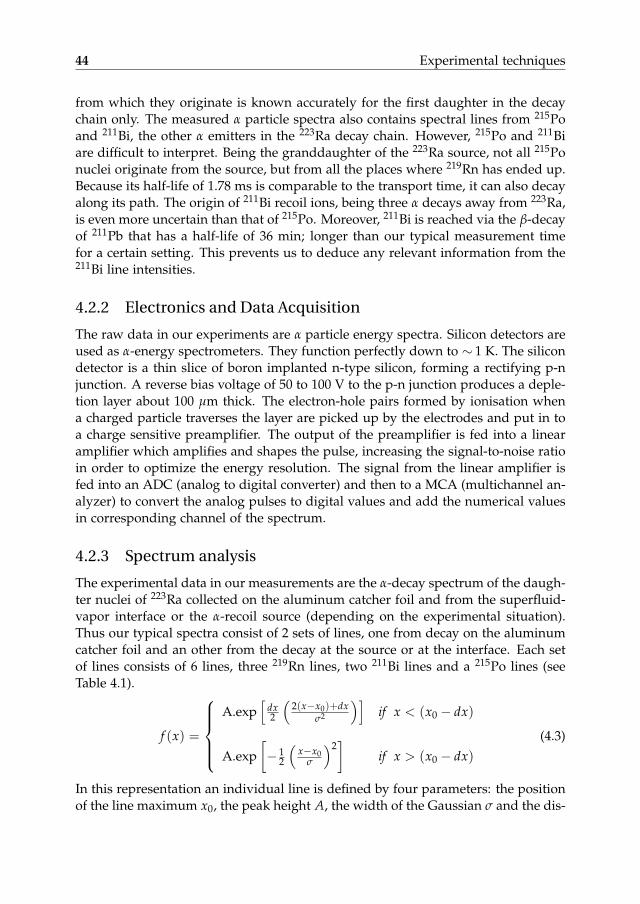
44 Experimental techniques
from which they originate is known accurately for the first daughter in the decaychain only. The measured α particle spectra also contains spectral lines from 215Poand 211Bi, the other α emitters in the 223Ra decay chain. However, 215Po and 211Biare difficult to interpret. Being the granddaughter of the 223Ra source, not all 215Ponuclei originate from the source, but from all the places where 219Rn has ended up.Because its half-life of 1.78 ms is comparable to the transport time, it can also decayalong its path. The origin of 211Bi recoil ions, being three α decays away from 223Ra,is even more uncertain than that of 215Po. Moreover, 211Bi is reached via the β-decayof 211Pb that has a half-life of 36 min; longer than our typical measurement timefor a certain setting. This prevents us to deduce any relevant information from the211Bi line intensities.
4.2.2 Electronics and Data Acquisition
The raw data in our experiments are α particle energy spectra. Silicon detectors areused as α-energy spectrometers. They function perfectly down to ∼ 1 K. The silicondetector is a thin slice of boron implanted n-type silicon, forming a rectifying p-njunction. A reverse bias voltage of 50 to 100 V to the p-n junction produces a deple-tion layer about 100 µm thick. The electron-hole pairs formed by ionisation whena charged particle traverses the layer are picked up by the electrodes and put in toa charge sensitive preamplifier. The output of the preamplifier is fed into a linearamplifier which amplifies and shapes the pulse, increasing the signal-to-noise ratioin order to optimize the energy resolution. The signal from the linear amplifier isfed into an ADC (analog to digital converter) and then to a MCA (multichannel an-alyzer) to convert the analog pulses to digital values and add the numerical valuesin corresponding channel of the spectrum.
4.2.3 Spectrum analysis
The experimental data in our measurements are the α-decay spectrum of the daugh-ter nuclei of 223Ra collected on the aluminum catcher foil and from the superfluid-vapor interface or the α-recoil source (depending on the experimental situation).Thus our typical spectra consist of 2 sets of lines, one from decay on the aluminumcatcher foil and an other from the decay at the source or at the interface. Each setof lines consists of 6 lines, three 219Rn lines, two 211Bi lines and a 215Po lines (seeTable 4.1).
f (x) =
A.exp
[dx2
(2(x−x0)+dx
σ2
)]if x < (x0 − dx)
A.exp[− 1
2
(x−x0
σ
)2]
if x > (x0 − dx)(4.3)
In this representation an individual line is defined by four parameters: the positionof the line maximum x0, the peak height A, the width of the Gaussian σ and the dis-
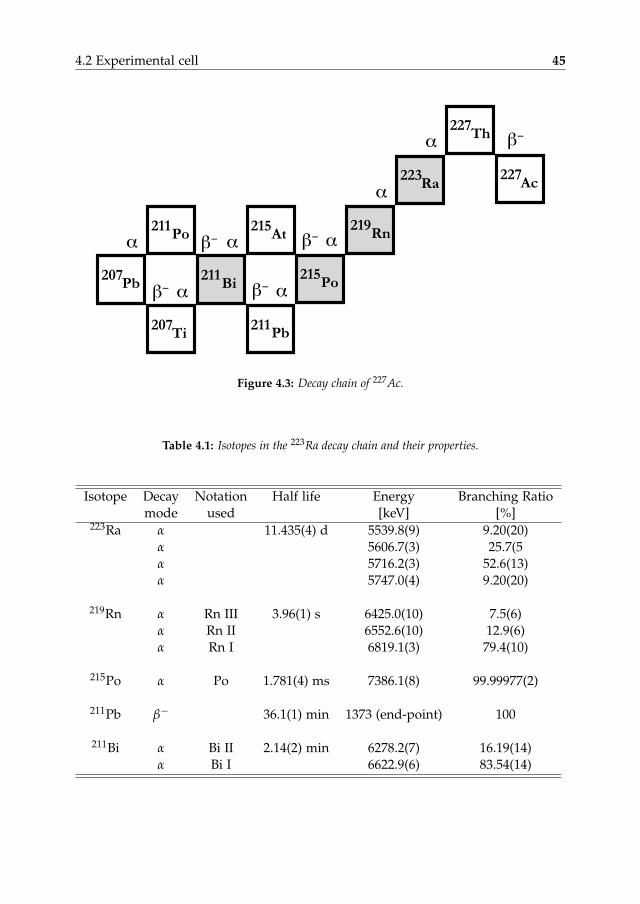
4.2 Experimental cell 45
Pb211
Ac227
Th227
Bi211
Ra223
Po215
Rn219
Ti207
Pb207
!
!
!!
At215
"#
"#"#
Po211
"#!
"#
!
!
Figure 4.3: Decay chain of 227Ac.
Table 4.1: Isotopes in the 223Ra decay chain and their properties.
Isotope Decay Notation Half life Energy Branching Ratiomode used [keV] [%]
223Ra α 11.435(4) d 5539.8(9) 9.20(20)α 5606.7(3) 25.7(5α 5716.2(3) 52.6(13)α 5747.0(4) 9.20(20)
219Rn α Rn III 3.96(1) s 6425.0(10) 7.5(6)α Rn II 6552.6(10) 12.9(6)α Rn I 6819.1(3) 79.4(10)
215Po α Po 1.781(4) ms 7386.1(8) 99.99977(2)
211Pb β− 36.1(1) min 1373 (end-point) 100
211Bi α Bi II 2.14(2) min 6278.2(7) 16.19(14)α Bi I 6622.9(6) 83.54(14)
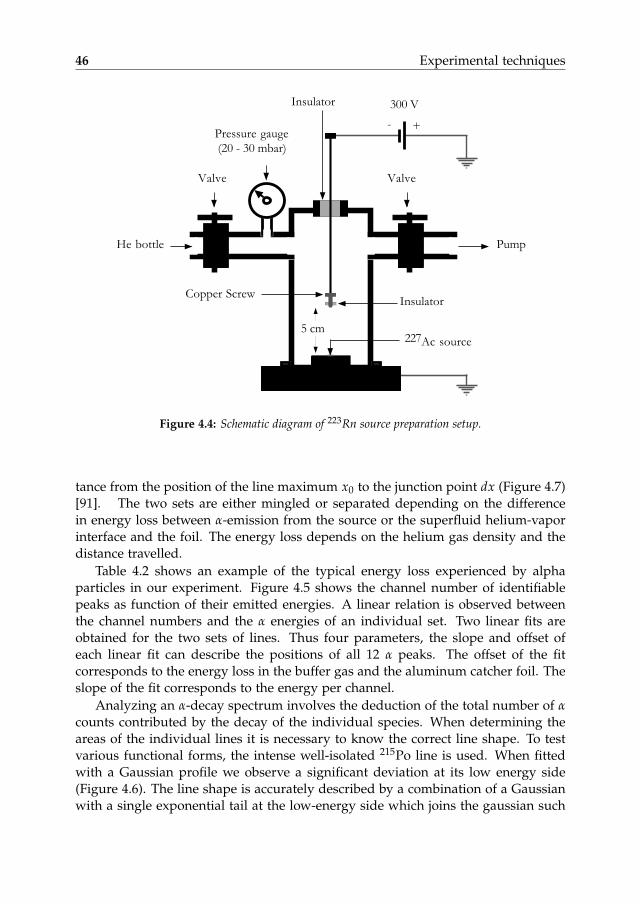
46 Experimental techniques
Copper Screw
227Ac source
Pressure gauge
(20 - 30 mbar)
PumpHe bottle
Valve Valve
300 V
+-
Insulator
Insulator
5 cm
Figure 4.4: Schematic diagram of 223Rn source preparation setup.
tance from the position of the line maximum x0 to the junction point dx (Figure 4.7)[91]. The two sets are either mingled or separated depending on the differencein energy loss between α-emission from the source or the superfluid helium-vaporinterface and the foil. The energy loss depends on the helium gas density and thedistance travelled.
Table 4.2 shows an example of the typical energy loss experienced by alphaparticles in our experiment. Figure 4.5 shows the channel number of identifiablepeaks as function of their emitted energies. A linear relation is observed betweenthe channel numbers and the α energies of an individual set. Two linear fits areobtained for the two sets of lines. Thus four parameters, the slope and offset ofeach linear fit can describe the positions of all 12 α peaks. The offset of the fitcorresponds to the energy loss in the buffer gas and the aluminum catcher foil. Theslope of the fit corresponds to the energy per channel.
Analyzing an α-decay spectrum involves the deduction of the total number of αcounts contributed by the decay of the individual species. When determining theareas of the individual lines it is necessary to know the correct line shape. To testvarious functional forms, the intense well-isolated 215Po line is used. When fittedwith a Gaussian profile we observe a significant deviation at its low energy side(Figure 4.6). The line shape is accurately described by a combination of a Gaussianwith a single exponential tail at the low-energy side which joins the gaussian such
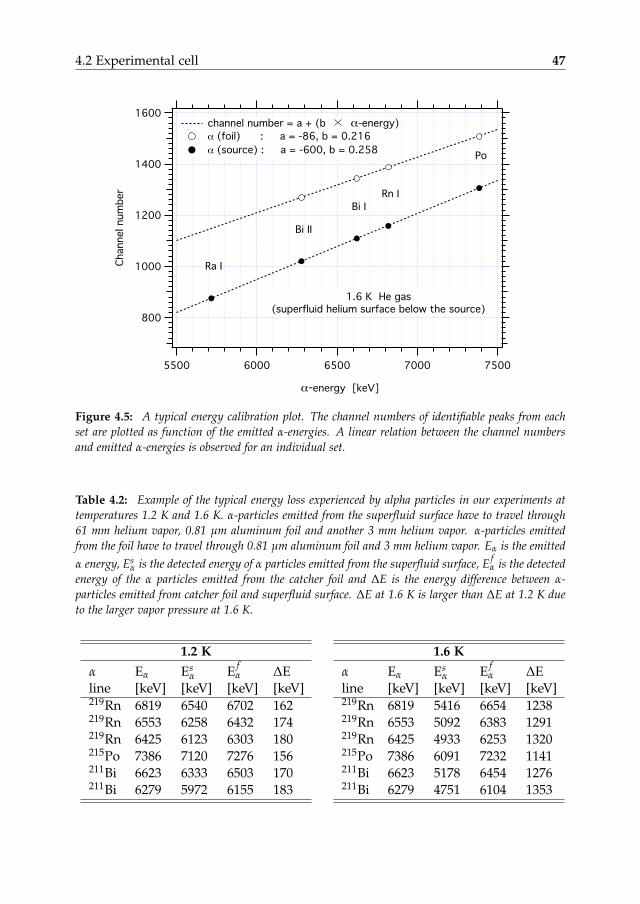
4.2 Experimental cell 47
!
!!!
Figure 4.5: A typical energy calibration plot. The channel numbers of identifiable peaks from eachset are plotted as function of the emitted α-energies. A linear relation between the channel numbersand emitted α-energies is observed for an individual set.
Table 4.2: Example of the typical energy loss experienced by alpha particles in our experiments attemperatures 1.2 K and 1.6 K. α-particles emitted from the superfluid surface have to travel through61 mm helium vapor, 0.81 µm aluminum foil and another 3 mm helium vapor. α-particles emittedfrom the foil have to travel through 0.81 µm aluminum foil and 3 mm helium vapor. Eα is the emittedα energy, Es
α is the detected energy of α particles emitted from the superfluid surface, E fα is the detected
energy of the α particles emitted from the catcher foil and ∆E is the energy difference between α-particles emitted from catcher foil and superfluid surface. ∆E at 1.6 K is larger than ∆E at 1.2 K dueto the larger vapor pressure at 1.6 K.
1.2 Kα Eα Es
α E fα ∆E
line [keV] [keV] [keV] [keV]219Rn 6819 6540 6702 162219Rn 6553 6258 6432 174219Rn 6425 6123 6303 180215Po 7386 7120 7276 156211Bi 6623 6333 6503 170211Bi 6279 5972 6155 183
1.6 Kα Eα Es
α E fα ∆E
line [keV] [keV] [keV] [keV]219Rn 6819 5416 6654 1238219Rn 6553 5092 6383 1291219Rn 6425 4933 6253 1320215Po 7386 6091 7232 1141211Bi 6623 5178 6454 1276211Bi 6279 4751 6104 1353
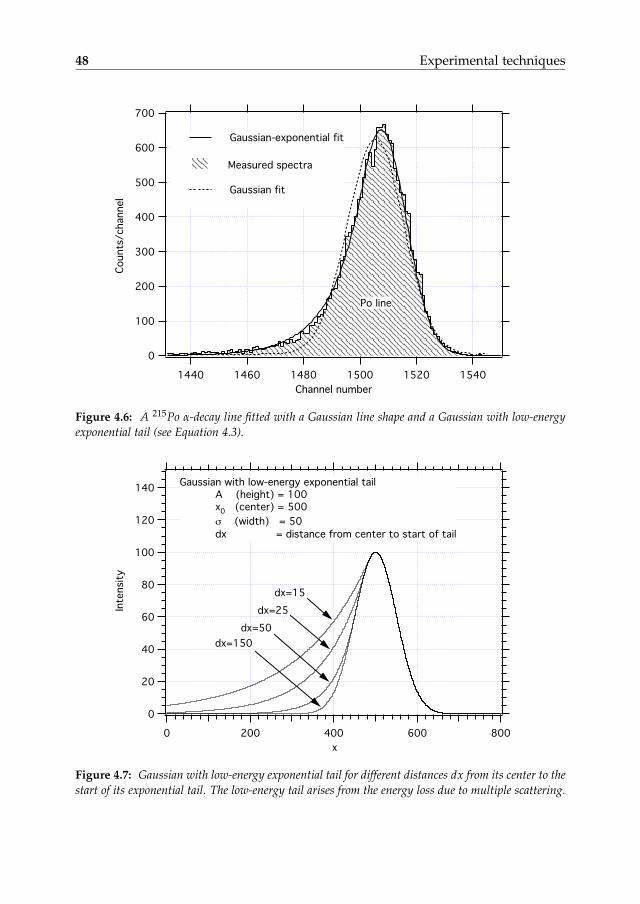
48 Experimental techniques
Figure 4.6: A 215Po α-decay line fitted with a Gaussian line shape and a Gaussian with low-energyexponential tail (see Equation 4.3).
!
Figure 4.7: Gaussian with low-energy exponential tail for different distances dx from its center to thestart of its exponential tail. The low-energy tail arises from the energy loss due to multiple scattering.
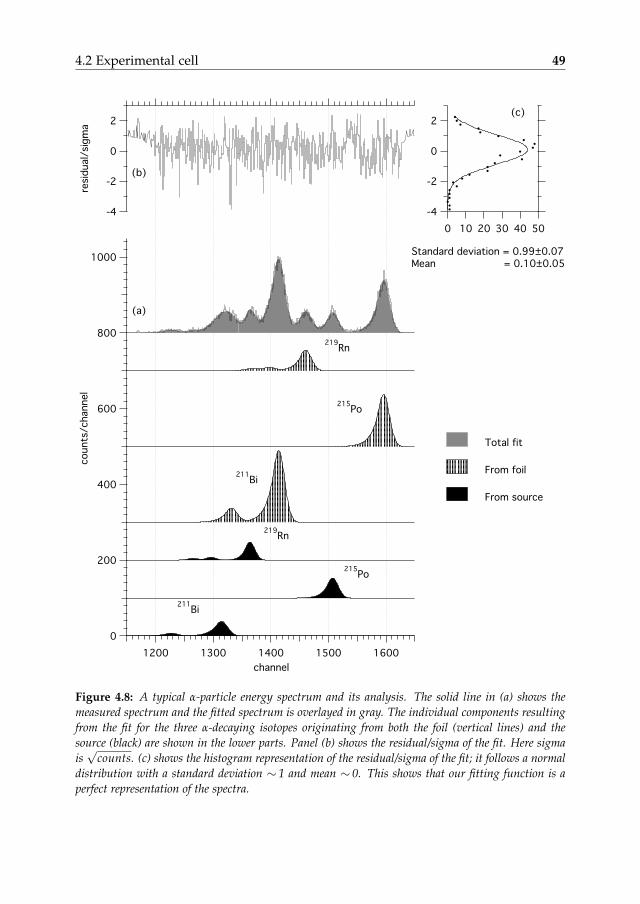
4.2 Experimental cell 49
Figure 4.8: A typical α-particle energy spectrum and its analysis. The solid line in (a) shows themeasured spectrum and the fitted spectrum is overlayed in gray. The individual components resultingfrom the fit for the three α-decaying isotopes originating from both the foil (vertical lines) and thesource (black) are shown in the lower parts. Panel (b) shows the residual/sigma of the fit. Here sigmais√
counts. (c) shows the histogram representation of the residual/sigma of the fit; it follows a normaldistribution with a standard deviation ∼ 1 and mean ∼ 0. This shows that our fitting function is aperfect representation of the spectra.
50 Experimental techniques
that the function and its first derivative are continuous [91]: The total intensity ofsuch a Gaussian-exponential pulse is
I = A
∫ (x0−dx)
∞e[− dx
2 .(
2(t−x0)+dxσ2
)]dt︸ ︷︷ ︸
Exponential part
+∫ ∞
(x0−dx)e
[− 1
2 .(
t−x0σ
)2]dt︸ ︷︷ ︸
Gaussian part
. (4.4)
Figure 4.6 shows the fit of such a function to a single 219Po α-line. We need 48parameters to describe the total spectrum containing 12 lines (12 for peak positions,24 for individual line shapes and 12 for individual intensities). As mentioned beforeonly 4 energy calibration parameters (2 for the interface or source and 2 for thealuminum foil) can describe all the peak positions. This reduces the number offree parameters from 48 to 40. Further, by taking the branching ratios of the 219Rnand 211Bi decays (see Table 4.1) into account, the intensities of 6 lines from thesame location can be represented by 3 parameters. So for two α-decay locations 6parameters describe the intensities of the 12 α-lines. This reduces the number offree parameters further from 40 to 34. It is reasonable to assume that the α-linesbelonging to the different decay branches of the same isotope decaying at the sameposition have the same line shape, σ and dx. Thus with 12 shape parameters (6 forthe α-particles from source or interface and 6 for the α-particles from the catcher foil)we can represent the line shapes of all 12 lines and the number of free parametersis finally reduced to 22.
We use a χ2 minimization technique in our fitting procedure. The IGOR Pro 6data analyzing program [127] is used to carry out the fitting procedure. The initialvalues for different parameters are deduced from strong, well-defined lines in thespectrum. Some of the parameters are fixed and others let free to iterate until theχ2 minimized values are attained. The number of fixed parameters is then reducedin a step by step manner. For low-statistics spectra we have to take the same shapeparameters for every line in each set. Here we assume that the α-particles emittedfrom the same region but from different isotopes result in the same line shape. Thisis often necessary only for 215Po and 219Rn. A typical example of the result of thefitting procedure is shown in Figure 4.8.
4.3 Gas density in the experimental cell at lowtemperature
For the gas catcher measurements the temperature and density are the relevantgas parameters. In practice the temperature and pressure are measured and thedensity is calculated using the ideal gas law. In the setup used in this work thetemperature of the experimental cell is measured directly with sensors attached to
4.3 Gas density in the experimental cell at low temperature 51
the cell and 1 K pot. The pressure in the cell is however not measured directly. Apressure gauge is mounted at the end of the filling capillary on top of the cryo-stat. The pressure gauge is thus at room temperature and measures the pressureof the room-temperature end of the filling capillary. In such a situation, i.e. wheretwo volumes at different temperatures are connected, one cannot simply combinethe temperature measurement of the volume at one temperature with the pressuremeasurement of the volume at the other temperature to obtain the density in eithervolume. This situation is investigated as follows. The cell was filled with gas atroom temperature and then closed. The ratio of the pressure of the warm volumeat room temperature Pw to the temperature of the cold volume in the experimentalcell Tc was followed during cooling down. Many such data sets for different gases,starting pressures and sizes of the warm volume are shown in Figure 4.9, wherethe Pw/Tc ratio is normalised to the ratio P0/T0 before cooling down starts. In theabsence of the effect discussed here the ideal gas law predicts that
Pw/Tc
P0/T0= 1 (4.5)
at all temperatures although pressure and temperature are measured at differentplaces. We see a clear deviation from this. The effect does not depend on the typeof gas nor the pressure at room temperature within the rather limited range studiedhere.
The deviation is larger if the warm volume Vw is bigger relative to the coldvolume Vc. The density in the cold volume can be determined from the measuredTc and Pw. A cold and a warm volume Vc and Vw are connected with a capillary ofnegligible volume. In the setup the capillary to cell volume ratio is a few 10−3. Witheverything at room temperature T0, the ideal gas law holds for the whole system
P0(Vc + Vw) = nRT0 , (4.6)
where P0 is the pressure at room temperature, n is the amount of gas (in mole)in the system and R = 8.31 J mole−1 K−1 is the universal gas constant. During theexperiments the volume Vc is cooled down to a temperature Tc, the volume Vw staysat room temperature T0. The pressures in both volumes are Pc and Pw respectively.This gives the ideal gas law equations in the separate volumes
PcVc = ncRTc , (4.7)
PwVw = nwRT0 , (4.8)
with the total amount of gas unchanged
n = nc + nw , (4.9)
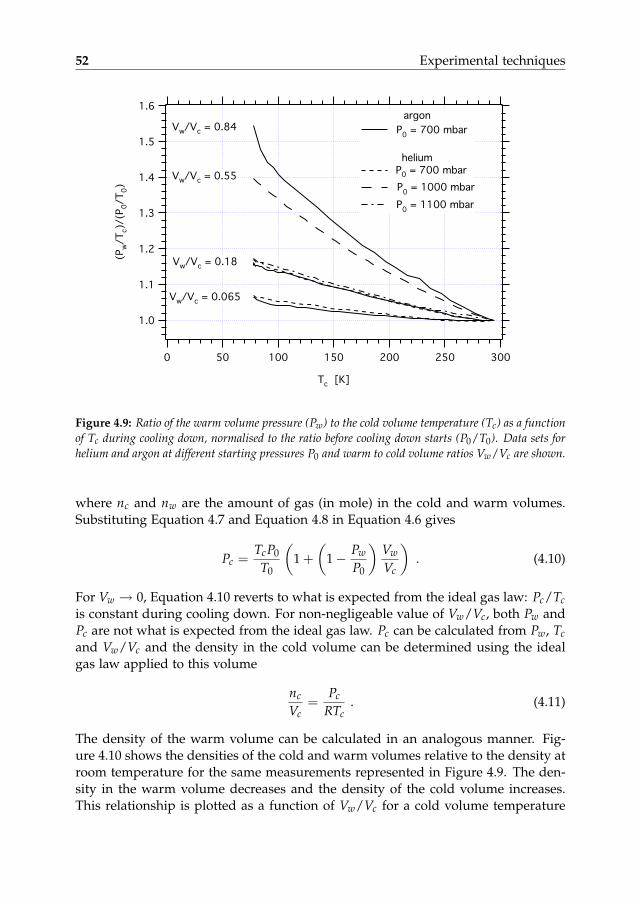
52 Experimental techniques
Figure 4.9: Ratio of the warm volume pressure (Pw) to the cold volume temperature (Tc) as a functionof Tc during cooling down, normalised to the ratio before cooling down starts (P0/T0). Data sets forhelium and argon at different starting pressures P0 and warm to cold volume ratios Vw/Vc are shown.
where nc and nw are the amount of gas (in mole) in the cold and warm volumes.Substituting Equation 4.7 and Equation 4.8 in Equation 4.6 gives
Pc =TcP0
T0
(1 +
(1− Pw
P0
)Vw
Vc
). (4.10)
For Vw → 0, Equation 4.10 reverts to what is expected from the ideal gas law: Pc/Tcis constant during cooling down. For non-negligeable value of Vw/Vc, both Pw andPc are not what is expected from the ideal gas law. Pc can be calculated from Pw, Tcand Vw/Vc and the density in the cold volume can be determined using the idealgas law applied to this volume
nc
Vc=
Pc
RTc. (4.11)
The density of the warm volume can be calculated in an analogous manner. Fig-ure 4.10 shows the densities of the cold and warm volumes relative to the density atroom temperature for the same measurements represented in Figure 4.9. The den-sity in the warm volume decreases and the density of the cold volume increases.This relationship is plotted as a function of Vw/Vc for a cold volume temperature
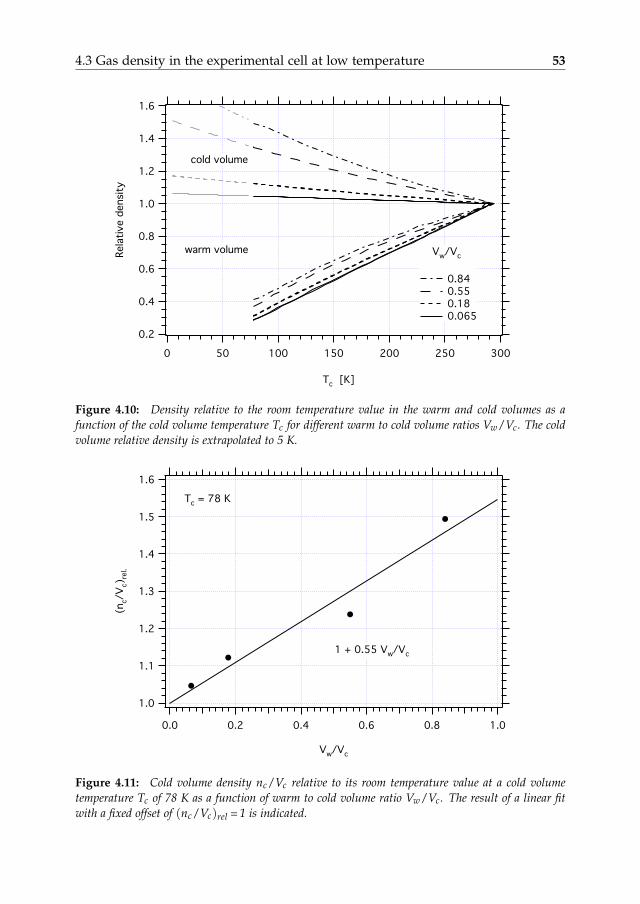
4.3 Gas density in the experimental cell at low temperature 53
Figure 4.10: Density relative to the room temperature value in the warm and cold volumes as afunction of the cold volume temperature Tc for different warm to cold volume ratios Vw/Vc. The coldvolume relative density is extrapolated to 5 K.
Figure 4.11: Cold volume density nc/Vc relative to its room temperature value at a cold volumetemperature Tc of 78 K as a function of warm to cold volume ratio Vw/Vc. The result of a linear fitwith a fixed offset of (nc/Vc)rel = 1 is indicated.
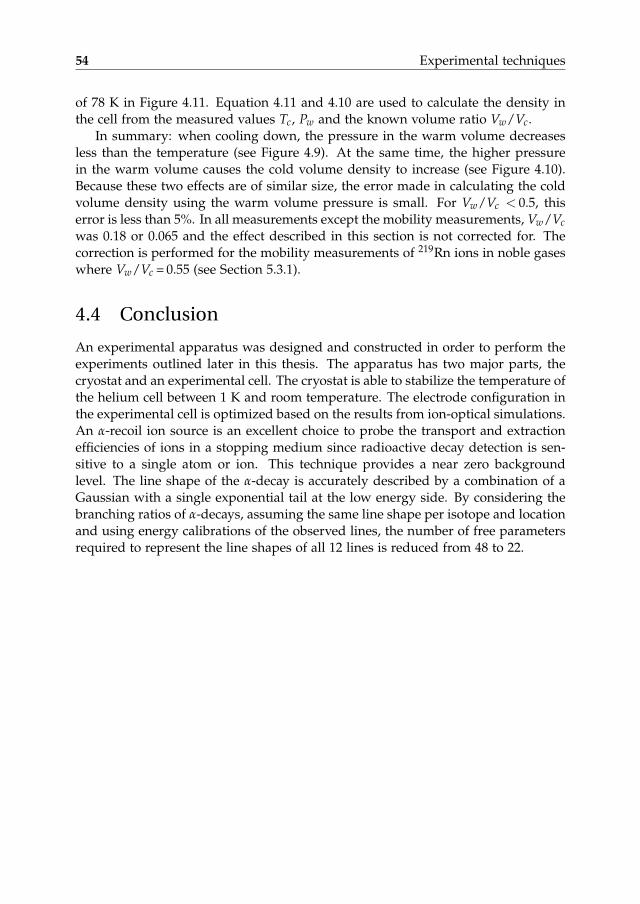
54 Experimental techniques
of 78 K in Figure 4.11. Equation 4.11 and 4.10 are used to calculate the density inthe cell from the measured values Tc, Pw and the known volume ratio Vw/Vc.
In summary: when cooling down, the pressure in the warm volume decreasesless than the temperature (see Figure 4.9). At the same time, the higher pressurein the warm volume causes the cold volume density to increase (see Figure 4.10).Because these two effects are of similar size, the error made in calculating the coldvolume density using the warm volume pressure is small. For Vw/Vc < 0.5, thiserror is less than 5%. In all measurements except the mobility measurements, Vw/Vcwas 0.18 or 0.065 and the effect described in this section is not corrected for. Thecorrection is performed for the mobility measurements of 219Rn ions in noble gaseswhere Vw/Vc = 0.55 (see Section 5.3.1).
4.4 Conclusion
An experimental apparatus was designed and constructed in order to perform theexperiments outlined later in this thesis. The apparatus has two major parts, thecryostat and an experimental cell. The cryostat is able to stabilize the temperature ofthe helium cell between 1 K and room temperature. The electrode configuration inthe experimental cell is optimized based on the results from ion-optical simulations.An α-recoil ion source is an excellent choice to probe the transport and extractionefficiencies of ions in a stopping medium since radioactive decay detection is sen-sitive to a single atom or ion. This technique provides a near zero backgroundlevel. The line shape of the α-decay is accurately described by a combination of aGaussian with a single exponential tail at the low energy side. By considering thebranching ratios of α-decays, assuming the same line shape per isotope and locationand using energy calibrations of the observed lines, the number of free parametersrequired to represent the line shapes of all 12 lines is reduced from 48 to 22.
5Cryogenic noble gasion catchers
An energetic ion slowed down in a noble gas has a finite probability to be in acharged state at the time of thermalization. Under suitable conditions these
ions survive long enough to be transported through and extracted from the stop-ping volume. This is the underlying principle of the use of noble gases to transformhigh-energy nuclear reaction products into low-energy ion beams. At high energiesthe interaction of the ions with noble gas atoms causes slowing down and may alsolead to neutralization by electron transfer. The neutral atom then can be strippedof an electron again. Which process dominates depends on the cross section for therespective processes. Near and at thermal energies, i.e. if the ionization energy ofthe ion Ei(ion) is below the ionization energy of the noble gas Ei(noble) by morethan its kinetic energy Ekin(ion),
Ei(ion) < Ei(noble)− Ekin(ion) , (5.1)
the ions cannot neutralize in collisions with noble gas atoms. Due to the highionization potential of noble gas elements the probability an ion thermalizes in acharged state is large. Ions neutralize upon hitting the wall or any structure insidethe gas catcher. Because the electrode structures inside gas catchers are designed toprevent ions from hitting the walls, neutralization upon colliding with a solid struc-ture is not considered in the following discussion. What happens to thermalizedions is influenced by the presence of impurities and ionized noble gas atoms whichare created by the energetic ions and possibly by an accelerator beam or radioactivedecay radiation [6]. Impurities are involved in the neutralization of ions through3-body recombination involving a free electron to form molecules or adducts withthe ions (see e.g. [65]). It is important to note that the ionizing radiation also playsa role in re-ionizing neutral atoms. Generally speaking, the nuclide of interest willappear as four species: atoms and molecules and both of these in neutral or chargedstates.
55
56 Cryogenic noble gas ion catchers
A lot of technical developments over the past 25 years were devoted to removeimpurities from and to prevent ionization of the noble gas. Sub-ppb impurity levelshave been achieved in devices that are built to ultra-high vacuum standards whichare bakeable and filled with ultra-pure noble gas (see e.g. [65]). The constructionof large ultra-pure gas catchers, although possible [93], is far from trivial. Thereis however another approach to reach ultra-pure conditions: freezing out of theimpurities. We describe here measurements where this approach is investigated forthe first time. This chapter will discuss on-line and off-line-experiments to studythis approach. Mobility measurements of radon ions in cryogenic noble gases arealso discussed.
5.1 Off-line measurements
The basic idea of an off-line experiment is to check the feasibility of a cryogenic no-ble gas ion catcher before going on-line which is technically more challenging andexpensive. This experiment has been designed to investigate the slowing down andtransport of energetic 219Rn ions in helium, neon, and argon gas under cryogenicconditions. The underlying principle is to cool the gas cell to cryogenic temper-atures (< 77 K) in order to ‘freeze out’ the impurities at the cold surfaces of thecell.
5.1.1 Experimental setup
The experimental setup is shown in Figures 5.1 and 5.2. A 223Ra source with atypical source strength of a few thousand Bq is mounted at the bottom of the cellfilled with a noble gas as stopping medium. The ∼ 100 keV α-decay recoil ions willleave the extremely thin 223Ra source if they are emitted in the “upward” direction.They are then thermalized in the noble gas near the source, i.e. at about 0.5 mm in1 bar helium at room temperature (293 K) according to calculations using the TRIM[131] program package which numerically simulates the passage of charged parti-cles through matter. Electrodes provide an electric field to guide the thermalizedions towards a thin (1.7 mg cm−2) aluminum foil in front of a silicon detector whichrecords α particle energy spectra. Ion optics simulations using the SIMION [30]program package, which calculates the electrostatic fields by numerical solution ofthe Poisson equation and allows to simulate the ion trajectory show that no lossesoccur due to the ion transport itself (see Figure 5.2). Ion transport is detected bythe α-decay of ions collected on the aluminum foil. 219Rn ions stick to the cell walland electrodes when the temperature is below about 200 K. The silicon detector alsoobserves with about 10 times lower efficiency α particles directly from the source.Those α particles transferring through the gas suffer a larger energy loss than thoseoriginating from the foil. Therefore both can be unambiguously identified. Differ-ent isotopes are identified based on their known α energies. The 223Ra activity is
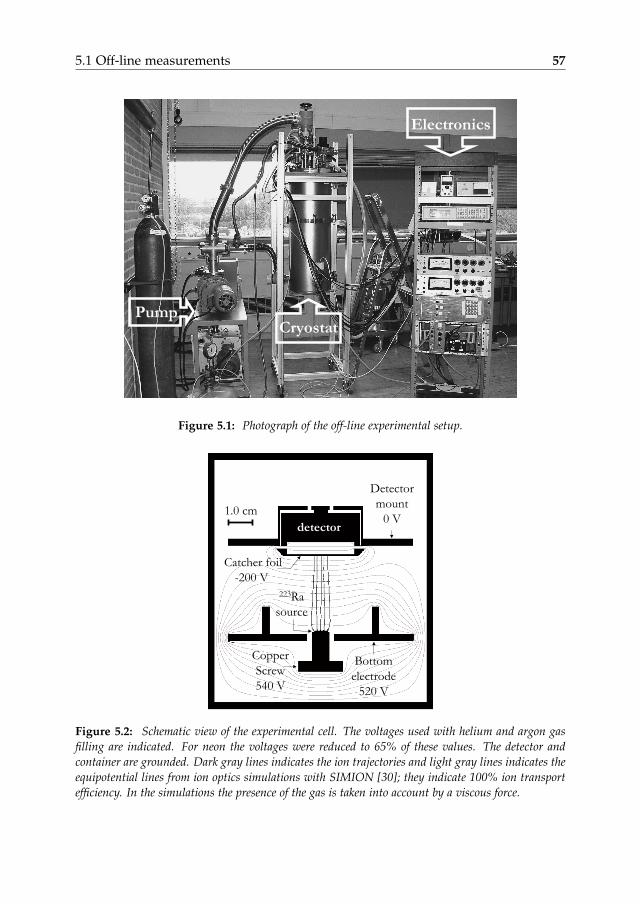
5.1 Off-line measurements 57
PumpCryostat
Electronics
Figure 5.1: Photograph of the off-line experimental setup.
Catcher foil
-200 V
detector
223Ra
source
Bottom
electrode
520 V
Copper
Screw
540 V
1.0 cm
Detector
mount
0 V
Figure 5.2: Schematic view of the experimental cell. The voltages used with helium and argon gasfilling are indicated. For neon the voltages were reduced to 65% of these values. The detector andcontainer are grounded. Dark gray lines indicates the ion trajectories and light gray lines indicates theequipotential lines from ion optics simulations with SIMION [30]; they indicate 100% ion transportefficiency. In the simulations the presence of the gas is taken into account by a viscous force.
58 Cryogenic noble gas ion catchers
960 Bq at the start and 550 Bq at the end of the experiments discussed here. The αparticle detection efficiency is equal to the solid angle of the detector seen from thedecay location (either source or foil). The efficiency that 219Rn recoil ions survive thethermalization and are transported to the aluminum foil can be straightforwardlyobtained by dividing the 219Rn count rate originating from the aluminum foil byhalf of the 223Ra source activity and by the detection efficiency. Decay losses duringtransport can be neglected because the 219Rn half-life of 4.0 s is long relative to thetransport time of order 1 ms for 1 bar helium at room temperature and the electricfield used.
The experimental cell is attached to the so-called 1 K pot of the cryostat (seeSection 4.1). As the experiments reported here aimed to show the effect of thefreezing out of impurities, we did not use high purity gas in the experimental cell atroom temperature. The experimental cell was not at all designed for good pumpingcapability. Moreover, in the case of helium the impurity level at room temperaturewas intentionally increased by adding air to the cell before filling it with helium.If uniformly frozen on all surfaces, 3 mbar of air would form a solid layer on topof the source thick enough to stop the recoils. To prevent this, we chose a 10 timeslower partial air pressure of 0.3 mbar to be on the safe side. This corresponds toan impurity level of about 300 ppm or a density of 1.0×10¹⁶ atoms cm−3 consistingmostly of air. For neon and argon, no extra air was added, and we estimate theimpurity content to be around 100 ppm.
At the start of a measurement series the cell is filled at room temperature with1 bar noble gas and 0.3 mbar of air in the case of helium. The cell is then closedand cooled down to the lowest temperature, at constant gas density in the cell. Forargon gas, measurements are restricted to above 75 K to avoid its condensation.The temperature is then increased in steps and the α particle energy spectrum ismeasured at each step. At each step thermal equilibrium between cell and the noblegas is confirmed by consecutive measurements showing the same α line intensities.Measurements above about 200 K are not useful as radon is not frozen out and the219Rn atoms are floating through the chamber (this is readily apparent from the α-energy spectra). Figure 5.2 indicates the voltages applied to the source, the guidingelectrode, and the aluminum foil for helium and argon in the cell. For neon thesevoltages were lowered to 65 % to prevent electric discharging. This reduces themagnitude of the electric field without changing its profile. Thus for neon the iontracks are the same as in Figure 5.2, only the ion velocity is reduced.
5.1.2 Results and discussion
The efficiency εgas of 219Rn recoil ion transport to the aluminum foil is measured asa function of temperature for helium, neon and argon gas. The results are shown inFigure 5.3. Towards lower temperatures the efficiency is strongly enhanced, startingat about 120 K for all three noble gases. The efficiencies saturate below about90 K. In a separate experiment related to a study of ions in superfluid helium, the
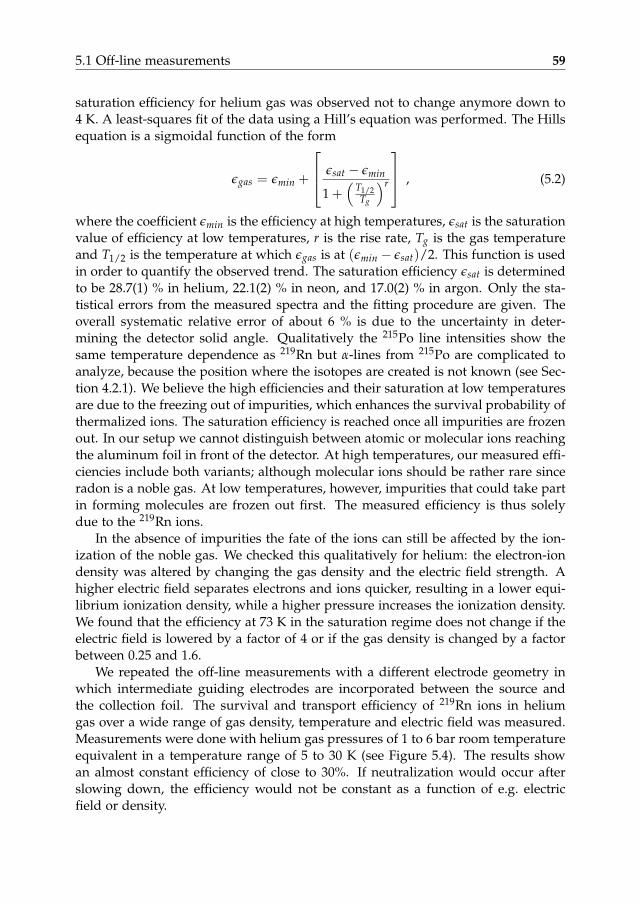
5.1 Off-line measurements 59
saturation efficiency for helium gas was observed not to change anymore down to4 K. A least-squares fit of the data using a Hill’s equation was performed. The Hillsequation is a sigmoidal function of the form
εgas = εmin +
εsat − εmin
1 +(
T1/2Tg
)r
, (5.2)
where the coefficient εmin is the efficiency at high temperatures, εsat is the saturationvalue of efficiency at low temperatures, r is the rise rate, Tg is the gas temperatureand T1/2 is the temperature at which εgas is at (εmin − εsat)/2. This function is usedin order to quantify the observed trend. The saturation efficiency εsat is determinedto be 28.7(1) % in helium, 22.1(2) % in neon, and 17.0(2) % in argon. Only the sta-tistical errors from the measured spectra and the fitting procedure are given. Theoverall systematic relative error of about 6 % is due to the uncertainty in deter-mining the detector solid angle. Qualitatively the 215Po line intensities show thesame temperature dependence as 219Rn but α-lines from 215Po are complicated toanalyze, because the position where the isotopes are created is not known (see Sec-tion 4.2.1). We believe the high efficiencies and their saturation at low temperaturesare due to the freezing out of impurities, which enhances the survival probability ofthermalized ions. The saturation efficiency is reached once all impurities are frozenout. In our setup we cannot distinguish between atomic or molecular ions reachingthe aluminum foil in front of the detector. At high temperatures, our measured effi-ciencies include both variants; although molecular ions should be rather rare sinceradon is a noble gas. At low temperatures, however, impurities that could take partin forming molecules are frozen out first. The measured efficiency is thus solelydue to the 219Rn ions.
In the absence of impurities the fate of the ions can still be affected by the ion-ization of the noble gas. We checked this qualitatively for helium: the electron-iondensity was altered by changing the gas density and the electric field strength. Ahigher electric field separates electrons and ions quicker, resulting in a lower equi-librium ionization density, while a higher pressure increases the ionization density.We found that the efficiency at 73 K in the saturation regime does not change if theelectric field is lowered by a factor of 4 or if the gas density is changed by a factorbetween 0.25 and 1.6.
We repeated the off-line measurements with a different electrode geometry inwhich intermediate guiding electrodes are incorporated between the source andthe collection foil. The survival and transport efficiency of 219Rn ions in heliumgas over a wide range of gas density, temperature and electric field was measured.Measurements were done with helium gas pressures of 1 to 6 bar room temperatureequivalent in a temperature range of 5 to 30 K (see Figure 5.4). The results showan almost constant efficiency of close to 30%. If neutralization would occur afterslowing down, the efficiency would not be constant as a function of e.g. electricfield or density.
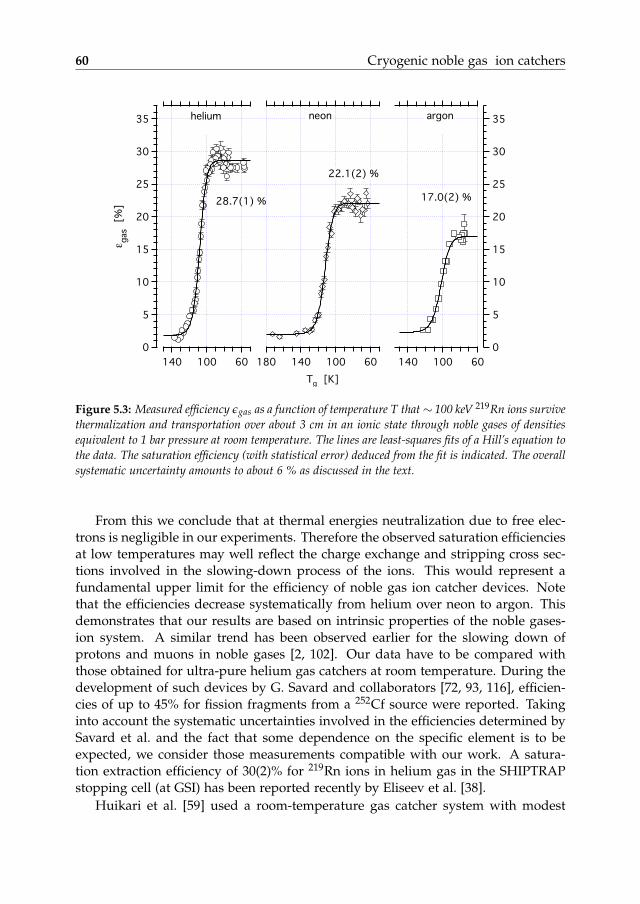
60 Cryogenic noble gas ion catchers
!
Figure 5.3: Measured efficiency εgas as a function of temperature T that∼ 100 keV 219Rn ions survivethermalization and transportation over about 3 cm in an ionic state through noble gases of densitiesequivalent to 1 bar pressure at room temperature. The lines are least-squares fits of a Hill’s equation tothe data. The saturation efficiency (with statistical error) deduced from the fit is indicated. The overallsystematic uncertainty amounts to about 6 % as discussed in the text.
From this we conclude that at thermal energies neutralization due to free elec-trons is negligible in our experiments. Therefore the observed saturation efficienciesat low temperatures may well reflect the charge exchange and stripping cross sec-tions involved in the slowing-down process of the ions. This would represent afundamental upper limit for the efficiency of noble gas ion catcher devices. Notethat the efficiencies decrease systematically from helium over neon to argon. Thisdemonstrates that our results are based on intrinsic properties of the noble gases-ion system. A similar trend has been observed earlier for the slowing down ofprotons and muons in noble gases [2, 102]. Our data have to be compared withthose obtained for ultra-pure helium gas catchers at room temperature. During thedevelopment of such devices by G. Savard and collaborators [72, 93, 116], efficien-cies of up to 45% for fission fragments from a 252Cf source were reported. Takinginto account the systematic uncertainties involved in the efficiencies determined bySavard et al. and the fact that some dependence on the specific element is to beexpected, we consider those measurements compatible with our work. A satura-tion extraction efficiency of 30(2)% for 219Rn ions in helium gas in the SHIPTRAPstopping cell (at GSI) has been reported recently by Eliseev et al. [38].
Huikari et al. [59] used a room-temperature gas catcher system with modest
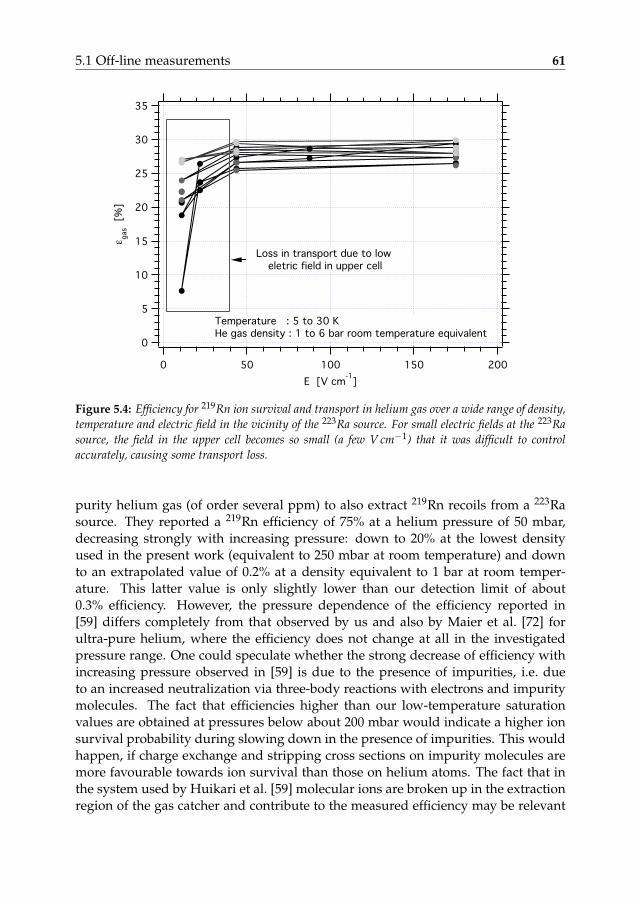
5.1 Off-line measurements 61
!
Figure 5.4: Efficiency for 219Rn ion survival and transport in helium gas over a wide range of density,temperature and electric field in the vicinity of the 223Ra source. For small electric fields at the 223Rasource, the field in the upper cell becomes so small (a few V cm−1) that it was difficult to controlaccurately, causing some transport loss.
purity helium gas (of order several ppm) to also extract 219Rn recoils from a 223Rasource. They reported a 219Rn efficiency of 75% at a helium pressure of 50 mbar,decreasing strongly with increasing pressure: down to 20% at the lowest densityused in the present work (equivalent to 250 mbar at room temperature) and downto an extrapolated value of 0.2% at a density equivalent to 1 bar at room temper-ature. This latter value is only slightly lower than our detection limit of about0.3% efficiency. However, the pressure dependence of the efficiency reported in[59] differs completely from that observed by us and also by Maier et al. [72] forultra-pure helium, where the efficiency does not change at all in the investigatedpressure range. One could speculate whether the strong decrease of efficiency withincreasing pressure observed in [59] is due to the presence of impurities, i.e. dueto an increased neutralization via three-body reactions with electrons and impuritymolecules. The fact that efficiencies higher than our low-temperature saturationvalues are obtained at pressures below about 200 mbar would indicate a higher ionsurvival probability during slowing down in the presence of impurities. This wouldhappen, if charge exchange and stripping cross sections on impurity molecules aremore favourable towards ion survival than those on helium atoms. The fact that inthe system used by Huikari et al. [59] molecular ions are broken up in the extractionregion of the gas catcher and contribute to the measured efficiency may be relevant
62 Cryogenic noble gas ion catchers
in this respect. Dedicated work is needed to understand this issue in detail. Sincegas catchers have to operate at a rather high pressure to provide sufficient stoppingpower, there is no question that ultra-pure conditions need to be employed.
5.2 On-line measurements
The feasibility of cryogenic noble gases as stopping media was demonstrated earlierusing α-decay recoil ions from a 223Ra source. In their main prospected application,gas catchers are employed to stop an ion beam from an accelerator or energeticrecoil ions from a target. On-line operation of a gas catcher differs from its off-line counterpart by the plasma created by the projectile beam. This will introducean additional complication which we didn’t encounter in off-line measurements.A detailed theoretical discussion of this phenomenon is outside of the scope ofthis work but some basic ideas are discussed in section 2.3. Here we investigatedthe effect of ionization of helium gas because this determines the maximum beamintensity the system can handle. A 13 MeV proton beam was used to ionize thehelium gas just above the 223Ra source. The combined efficiency of survival andtransport of the recoil ions over several centimeters was measured as a functionof the ionization density, i.e. beam intensity, the electric field strength, the heliumpressure and the temperature.
5.2.1 Experimental setup
A 223Ra source is placed near the bottom of a closed cylindrical cell. The cell is filledwith the desired amount of helium gas and cooled down to the required tempera-ture. The 223Ra source is part of an electrode system guiding the thermalized ionsover a distance of about 6 cm to a thin aluminum foil in front of a silicon detector.
In helium gas with a density equal to 1 bar pressure at room temperature, i.e.0.18 mg cm−3, α-decay recoil ions from a 223Ra source are stopped within about0.5 mm. At this location the ionization rate density due to both recoil ions and theα activity from the 223Ra source with a typical activity of 5 kBq over a diameterof 4 mm is about 109 ion-electron pairs cm−3 s−1. In the presence of a moderateelectric field no influence of this ionization on the behaviour of the ions is expected.In order to study the effect of the gas ionization we have used a proton beam toionize the region in which the recoil ions are stopped.
Apart from the presence of the proton beam the experimental setup is similarto that used in the off-line experiment (see Section 5.1.1). Therefore, only the newfeatures are described in detail here. A photograph of the setup is shown in Fig-ure 5.5 and a schematic view is shown in Figure 5.6. The most important differenceis that the beam line is coupled to the cryostat and that the beam is let in to thecell. A copper window of 60 µm thickness through which the beam enters and aFaraday cup are incorporated. The electrode geometry is modified by adding three
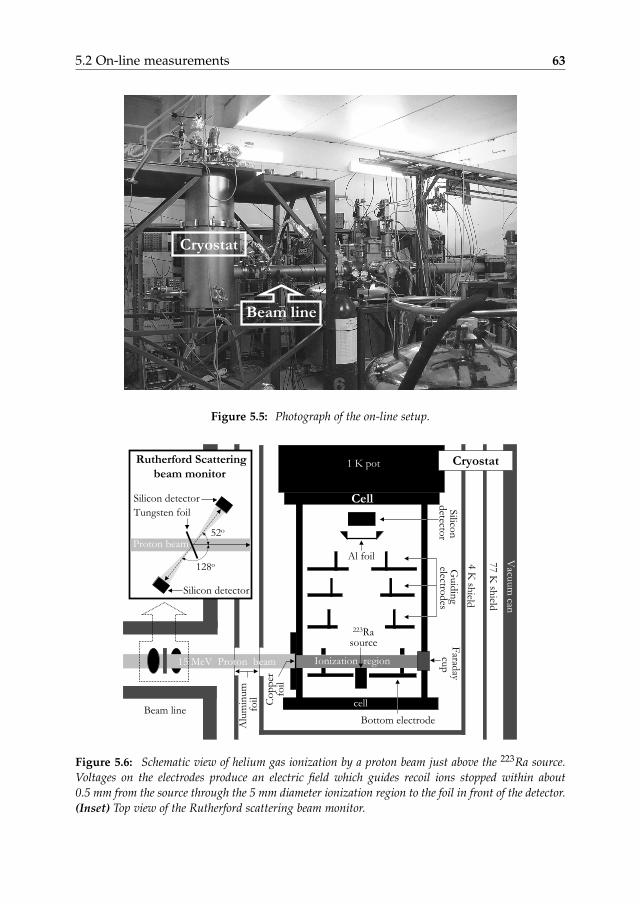
5.2 On-line measurements 63
Beam line
Cryostat
Figure 5.5: Photograph of the on-line setup.
77 K
shield
4 K
shield
Beam line
Guid
ing
electrod
es S
ilicon
detecto
r
Farad
ay cu
p
Al foil
1 K pot
223Rasource
Cryostat
Cell
Bottom electrode
Vacu
um
can
cell
Alu
min
um
fo
il Co
pp
erfo
il
15 MeV Proton beam
Tungsten foil
Silicon detector
Silicon detector
52o
128o
Rutherford Scattering
beam monitor
Proton beam
Ionization region
Figure 5.6: Schematic view of helium gas ionization by a proton beam just above the 223Ra source.Voltages on the electrodes produce an electric field which guides recoil ions stopped within about0.5 mm from the source through the 5 mm diameter ionization region to the foil in front of the detector.(Inset) Top view of the Rutherford scattering beam monitor.
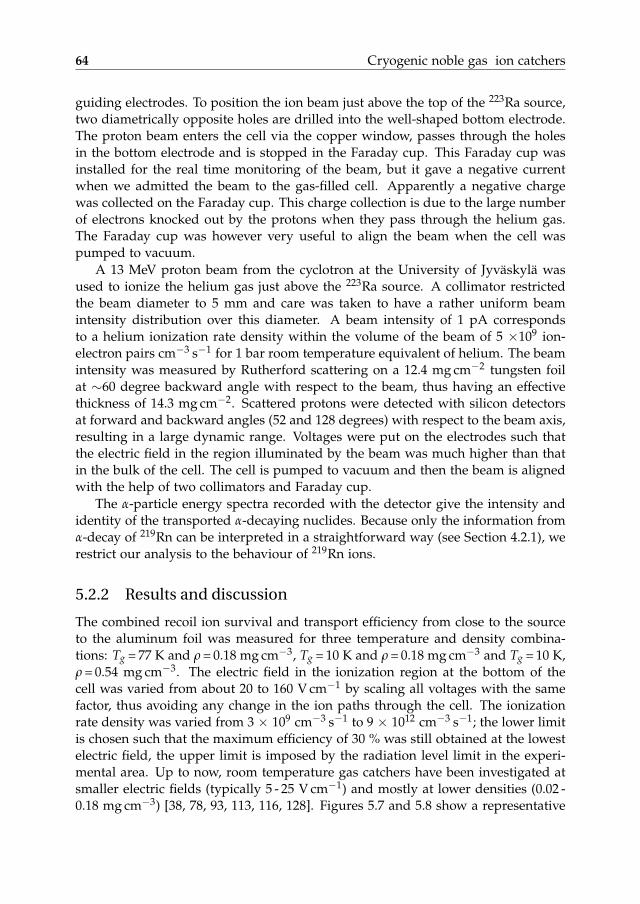
64 Cryogenic noble gas ion catchers
guiding electrodes. To position the ion beam just above the top of the 223Ra source,two diametrically opposite holes are drilled into the well-shaped bottom electrode.The proton beam enters the cell via the copper window, passes through the holesin the bottom electrode and is stopped in the Faraday cup. This Faraday cup wasinstalled for the real time monitoring of the beam, but it gave a negative currentwhen we admitted the beam to the gas-filled cell. Apparently a negative chargewas collected on the Faraday cup. This charge collection is due to the large numberof electrons knocked out by the protons when they pass through the helium gas.The Faraday cup was however very useful to align the beam when the cell waspumped to vacuum.
A 13 MeV proton beam from the cyclotron at the University of Jyväskylä wasused to ionize the helium gas just above the 223Ra source. A collimator restrictedthe beam diameter to 5 mm and care was taken to have a rather uniform beamintensity distribution over this diameter. A beam intensity of 1 pA correspondsto a helium ionization rate density within the volume of the beam of 5 ×10⁹ ion-electron pairs cm−3 s−1 for 1 bar room temperature equivalent of helium. The beamintensity was measured by Rutherford scattering on a 12.4 mg cm−2 tungsten foilat ∼60 degree backward angle with respect to the beam, thus having an effectivethickness of 14.3 mg cm−2. Scattered protons were detected with silicon detectorsat forward and backward angles (52 and 128 degrees) with respect to the beam axis,resulting in a large dynamic range. Voltages were put on the electrodes such thatthe electric field in the region illuminated by the beam was much higher than thatin the bulk of the cell. The cell is pumped to vacuum and then the beam is alignedwith the help of two collimators and Faraday cup.
The α-particle energy spectra recorded with the detector give the intensity andidentity of the transported α-decaying nuclides. Because only the information fromα-decay of 219Rn can be interpreted in a straightforward way (see Section 4.2.1), werestrict our analysis to the behaviour of 219Rn ions.
5.2.2 Results and discussion
The combined recoil ion survival and transport efficiency from close to the sourceto the aluminum foil was measured for three temperature and density combina-tions: Tg = 77 K and ρ = 0.18 mg cm−3, Tg = 10 K and ρ = 0.18 mg cm−3 and Tg = 10 K,ρ = 0.54 mg cm−3. The electric field in the ionization region at the bottom of thecell was varied from about 20 to 160 V cm−1 by scaling all voltages with the samefactor, thus avoiding any change in the ion paths through the cell. The ionizationrate density was varied from 3 × 109 cm−3 s−1 to 9 × 1012 cm−3 s−1; the lower limitis chosen such that the maximum efficiency of 30 % was still obtained at the lowestelectric field, the upper limit is imposed by the radiation level limit in the experi-mental area. Up to now, room temperature gas catchers have been investigated atsmaller electric fields (typically 5 - 25 V cm−1) and mostly at lower densities (0.02 -0.18 mg cm−3) [38, 78, 93, 113, 116, 128]. Figures 5.7 and 5.8 show a representative
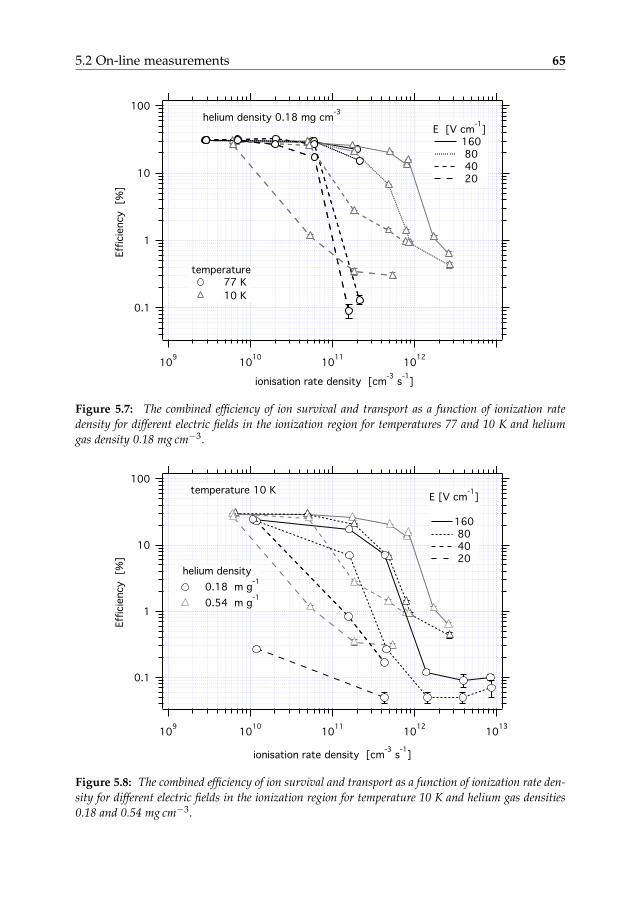
5.2 On-line measurements 65
Figure 5.7: The combined efficiency of ion survival and transport as a function of ionization ratedensity for different electric fields in the ionization region for temperatures 77 and 10 K and heliumgas density 0.18 mg cm−3.
Figure 5.8: The combined efficiency of ion survival and transport as a function of ionization rate den-sity for different electric fields in the ionization region for temperature 10 K and helium gas densities0.18 and 0.54 mg cm−3.
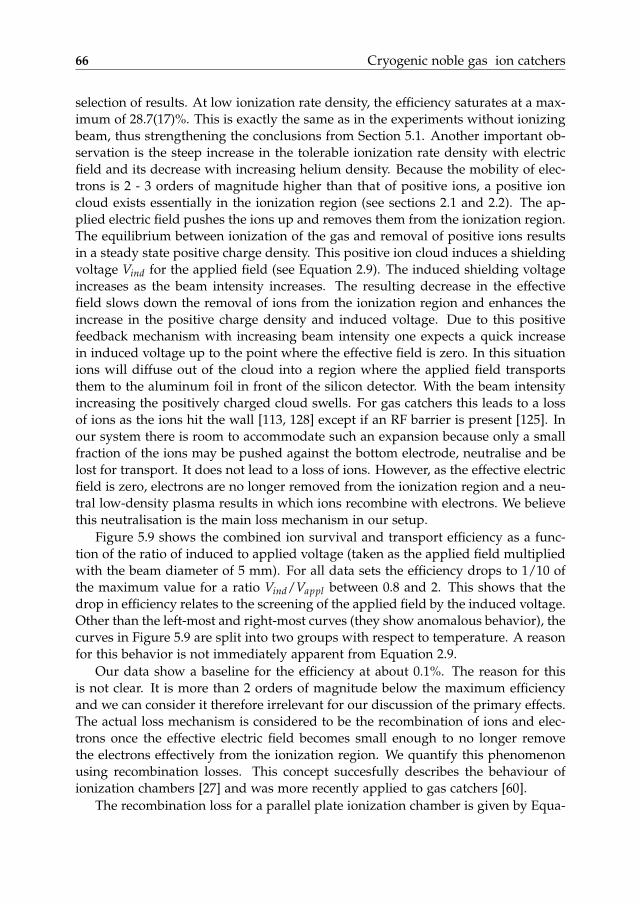
66 Cryogenic noble gas ion catchers
selection of results. At low ionization rate density, the efficiency saturates at a max-imum of 28.7(17)%. This is exactly the same as in the experiments without ionizingbeam, thus strengthening the conclusions from Section 5.1. Another important ob-servation is the steep increase in the tolerable ionization rate density with electricfield and its decrease with increasing helium density. Because the mobility of elec-trons is 2 - 3 orders of magnitude higher than that of positive ions, a positive ioncloud exists essentially in the ionization region (see sections 2.1 and 2.2). The ap-plied electric field pushes the ions up and removes them from the ionization region.The equilibrium between ionization of the gas and removal of positive ions resultsin a steady state positive charge density. This positive ion cloud induces a shieldingvoltage Vind for the applied field (see Equation 2.9). The induced shielding voltageincreases as the beam intensity increases. The resulting decrease in the effectivefield slows down the removal of ions from the ionization region and enhances theincrease in the positive charge density and induced voltage. Due to this positivefeedback mechanism with increasing beam intensity one expects a quick increasein induced voltage up to the point where the effective field is zero. In this situationions will diffuse out of the cloud into a region where the applied field transportsthem to the aluminum foil in front of the silicon detector. With the beam intensityincreasing the positively charged cloud swells. For gas catchers this leads to a lossof ions as the ions hit the wall [113, 128] except if an RF barrier is present [125]. Inour system there is room to accommodate such an expansion because only a smallfraction of the ions may be pushed against the bottom electrode, neutralise and belost for transport. It does not lead to a loss of ions. However, as the effective electricfield is zero, electrons are no longer removed from the ionization region and a neu-tral low-density plasma results in which ions recombine with electrons. We believethis neutralisation is the main loss mechanism in our setup.
Figure 5.9 shows the combined ion survival and transport efficiency as a func-tion of the ratio of induced to applied voltage (taken as the applied field multipliedwith the beam diameter of 5 mm). For all data sets the efficiency drops to 1/10 ofthe maximum value for a ratio Vind/Vappl between 0.8 and 2. This shows that thedrop in efficiency relates to the screening of the applied field by the induced voltage.Other than the left-most and right-most curves (they show anomalous behavior), thecurves in Figure 5.9 are split into two groups with respect to temperature. A reasonfor this behavior is not immediately apparent from Equation 2.9.
Our data show a baseline for the efficiency at about 0.1%. The reason for thisis not clear. It is more than 2 orders of magnitude below the maximum efficiencyand we can consider it therefore irrelevant for our discussion of the primary effects.The actual loss mechanism is considered to be the recombination of ions and elec-trons once the effective electric field becomes small enough to no longer removethe electrons effectively from the ionization region. We quantify this phenomenonusing recombination losses. This concept succesfully describes the behaviour ofionization chambers [27] and was more recently applied to gas catchers [60].
The recombination loss for a parallel plate ionization chamber is given by Equa-
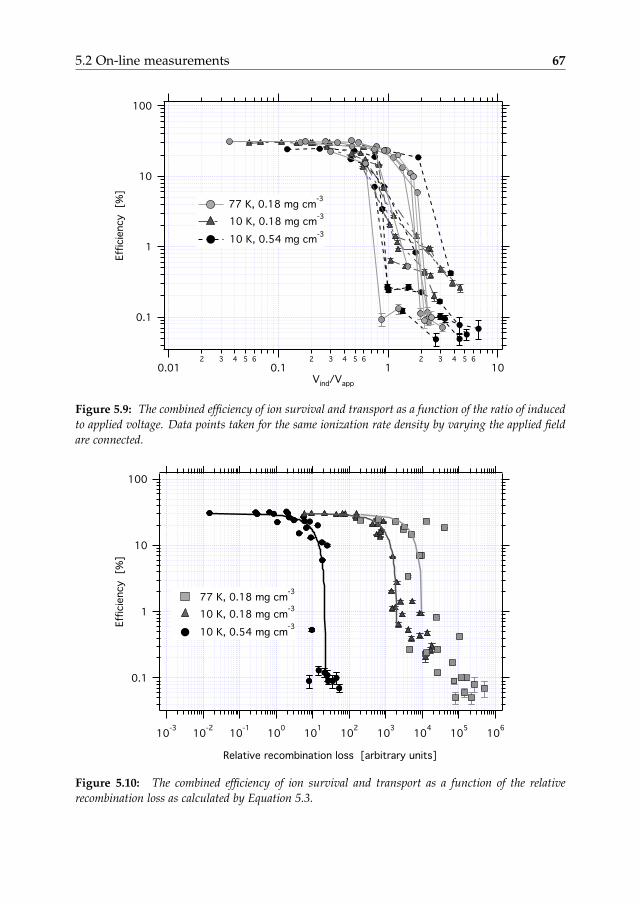
5.2 On-line measurements 67
Figure 5.9: The combined efficiency of ion survival and transport as a function of the ratio of inducedto applied voltage. Data points taken for the same ionization rate density by varying the applied fieldare connected.
Figure 5.10: The combined efficiency of ion survival and transport as a function of the relativerecombination loss as calculated by Equation 5.3.
68 Cryogenic noble gas ion catchers
tion 2.8. Using the fact that the ion mobility scales with the ratio of temperatureand pressure Tg/P we define the following relative recombination loss
frel =Qα
E2(Tg/P)µ−, (5.3)
where Q is the ionization rate (cm−3 s−1), α is the ion-electron recombination co-efficient, µ− the electron mobility and E the applied electric. The charge densityis dominated by helium ions and thus governed by helium ion recombination. Aswe measure the transport efficiency of radon ions, the recombination coefficient ofradon is needed, which is yet unknown. One might assume radon to be similar inits behaviour to helium because both are noble gases. For the helium gas densi-ties and temperatures used in this experiment 3-body recombination dominates the2-body recombination by an order of magnitude (see section 2.5).
In the following analysis we only consider the 3-body recombination coefficientα3 is considered for α. The 3-body recombination coefficient α3 shows a temperaturedependence of T−2.5
g between 200 K and 295 K (see Reference [118] and Section 2.6).We extrapolate the results of [118] down to 10 K and include a T−2.5
g dependence forthe α3 coefficient in the calculation of frel . It is also well documented that recombi-nation depends strongly on the electron temperature (see Section 2.6), which in turndepends on the ionization method and can be much higher than the gas tempera-ture. The temperature or more generally the energy distribution of the electrons, isnot known in our case of ionization by a fast proton beam. We therefore do not takethis effect into account. If the electron temperature is much different from the gastemperature, it is conceivable that any modification of the recombination coefficientwould be independent of the gas temperature. Thus it would not affect the relativerecombination loss. The electron mobility µ− is taken from [88]. The 219Rn ionextraction efficiency εextr from the ionization region is given by
εextr = εmax(1− f ) , (5.4)
where εmax is the maximum efficiency obtained in off-line conditions (∼ 30%) andf is the absolute recombination loss factor (see Equation 2.8). The absolute recom-bination loss can be expressed as
f = K frel , (5.5)
where K is a constant within our measurements. Figure 5.10 shows the efficiencyas a function of the relative recombination loss as calculated with Equation 5.3. Thedata at 1 bar room temperature equivalent density show a rather weak temperaturedependence; the measurements at 10 K show a strong density dependence. Curvesof the form εextr = 30(1− K frel) are shown as guide to the eye. The sharp dropin efficiency indicates that as soon as recombination sets in due to the incompleteseparation of ions and electrons, there is a positive feedback accelerating the recom-bination. The fact that for a certain temperature and density a typical dependence
5.3 Mobility measurements of 219Rn ions in cryogenic noble gases 69
of the form Equation 5.4, shows that the tolerable ionization rate density increaseswith the square of the applied electric field. Maximizing the electric field is there-fore a major design consideration for gas ion catchers.
5.3 Mobility measurements of 219Rn ions in cryogenicnoble gases
The feasibility of a noble gas catcher depends on the extraction efficiency and onhow fast an ion can be extracted from the stopping volume. The extraction timeshould be shorter than the lifetime of the exotic nucleus. The mobility of positiveions is a factor which determines its extraction time from a noble gas ion catcher.
5.3.1 219Rn mobility experiment
The experimental setup used for the mobility measurements is identical to that inFigure 6.1b. The voltages on the electrodes are set to have an electric field as uniformas possible throughout the transport region. The SIMION software is used to findan optimum voltage configuration (see Figure 5.11). Within the first 0.15 cm of theion trajectory, the electric field varies drastically. Along the rest of the trajectorythe electric field is constant within 4.5%. Fluctuations of the electric field E are notimportant as the drift velocity vd ∝ E. In the analysis the average E is used. Thevoltages of the electrodes are lowered proportionately to have lower field strengths.The 219Rn ion transport time through helium, argon and neon gases at differentdensities are measured. An ion transport time window is set by pulsing the voltagesapplied to the 223Ra source and the collection foil. The schematic of the electronicsfor the pulsed measurements is given in Figure 5.12. Pulsing is applied in sucha way that the ion transport is blocked by increasing the foil voltage to a highpositive value, and decreasing the source and bottom electrode voltage to zero.The repetition rate is 1 Hz. The square pulse is fed into the TTL triggered voltagesources which are connected to the foil and the source plus bottom electrode. Thissquare pulse from the pulse generator provides the transport window for the ions.
The width of the transport window is the time during which the electric field isfavorable for the ion transport from the source to the collection foil. The numberof ions transported is measured as a function of transport window width. If thetransport window is larger than the transport time the ions that survived after thethermalization are transported to the collection foil. The fraction of the ions thatarrives at the collection foil increases linearly with increasing transport windowwidth. No ions will be transported to the collection foil if the transport windowwidth is smaller than the ion transport time t0. Thus t0 is the maximum transportwindow width for which the ion intensity is zero. The value of t0 can be foundby extrapolating the data points in the plot of the ion intensity versus transport
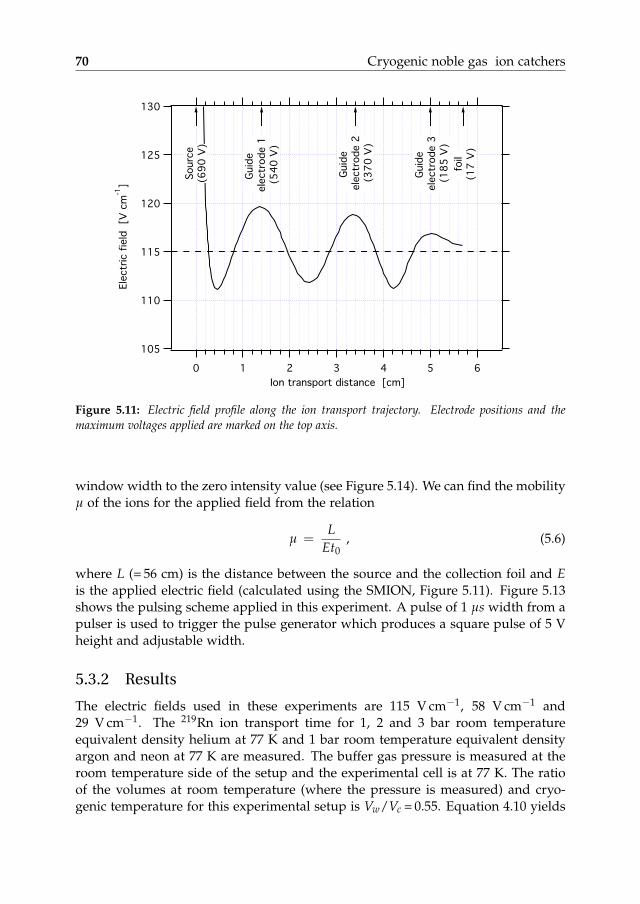
70 Cryogenic noble gas ion catchers
Figure 5.11: Electric field profile along the ion transport trajectory. Electrode positions and themaximum voltages applied are marked on the top axis.
window width to the zero intensity value (see Figure 5.14). We can find the mobilityµ of the ions for the applied field from the relation
µ =L
Et0, (5.6)
where L (= 56 cm) is the distance between the source and the collection foil and Eis the applied electric field (calculated using the SMION, Figure 5.11). Figure 5.13shows the pulsing scheme applied in this experiment. A pulse of 1 µs width from apulser is used to trigger the pulse generator which produces a square pulse of 5 Vheight and adjustable width.
5.3.2 Results
The electric fields used in these experiments are 115 V cm−1, 58 V cm−1 and29 V cm−1. The 219Rn ion transport time for 1, 2 and 3 bar room temperatureequivalent density helium at 77 K and 1 bar room temperature equivalent densityargon and neon at 77 K are measured. The buffer gas pressure is measured at theroom temperature side of the setup and the experimental cell is at 77 K. The ratioof the volumes at room temperature (where the pressure is measured) and cryo-genic temperature for this experimental setup is Vw/Vc = 0.55. Equation 4.10 yields
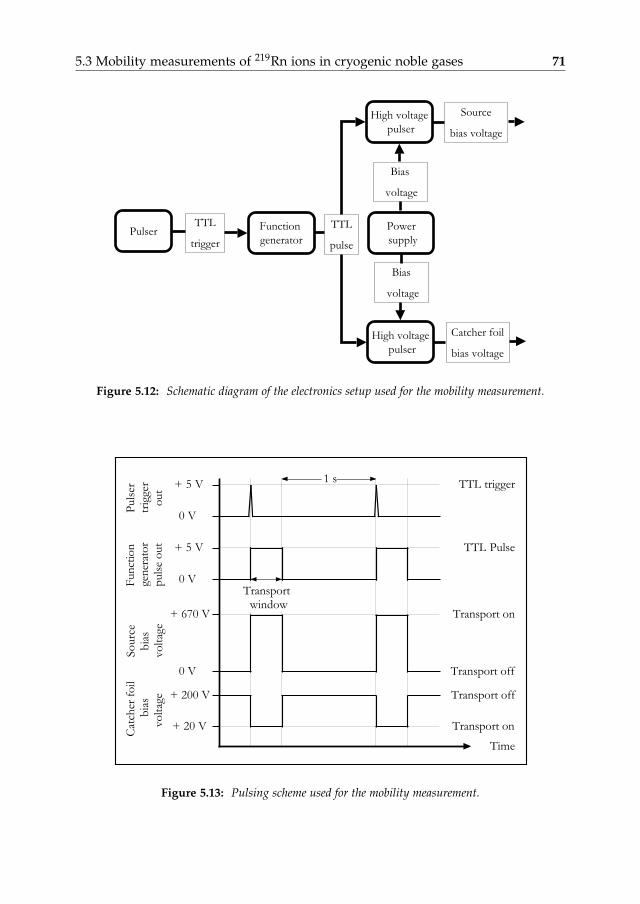
5.3 Mobility measurements of 219Rn ions in cryogenic noble gases 71
Pulser Function
generator
TTL
pulse
Catcher foil
bias voltage
TTL
trigger
Power
supply
High voltage
pulser
High voltage
pulser
Bias
voltage
Bias
voltage
Source
bias voltage
Figure 5.12: Schematic diagram of the electronics setup used for the mobility measurement.
TTL trigger
TTL Pulse
Transport on
Transport off
Transport off
Transport on
Time
+ 5 V
0 V
0 V
+ 5 V
+ 670 V
+ 200 V
0 V
+ 20 V
Cat
cher
fo
il
bia
s
vo
ltag
e
S
ourc
e
b
ias
v
olt
age
Fun
ctio
n
gen
erat
or
puls
e o
ut
P
uls
er
t
rigg
er
out
1 s
Transport window
Figure 5.13: Pulsing scheme used for the mobility measurement.
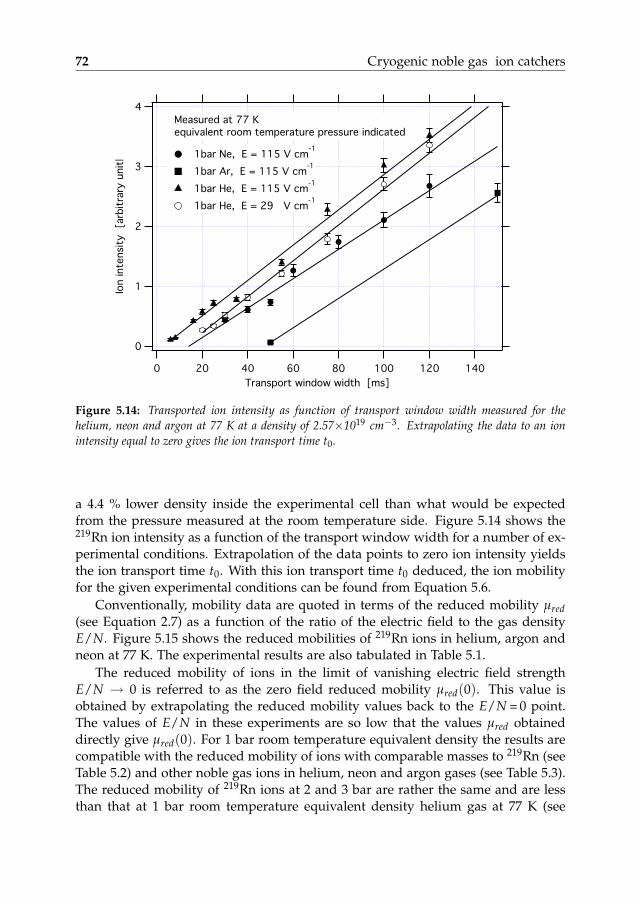
72 Cryogenic noble gas ion catchers
Figure 5.14: Transported ion intensity as function of transport window width measured for thehelium, neon and argon at 77 K at a density of 2.57×1019 cm−3. Extrapolating the data to an ionintensity equal to zero gives the ion transport time t0.
a 4.4 % lower density inside the experimental cell than what would be expectedfrom the pressure measured at the room temperature side. Figure 5.14 shows the219Rn ion intensity as a function of the transport window width for a number of ex-perimental conditions. Extrapolation of the data points to zero ion intensity yieldsthe ion transport time t0. With this ion transport time t0 deduced, the ion mobilityfor the given experimental conditions can be found from Equation 5.6.
Conventionally, mobility data are quoted in terms of the reduced mobility µred(see Equation 2.7) as a function of the ratio of the electric field to the gas densityE/N. Figure 5.15 shows the reduced mobilities of 219Rn ions in helium, argon andneon at 77 K. The experimental results are also tabulated in Table 5.1.
The reduced mobility of ions in the limit of vanishing electric field strengthE/N → 0 is referred to as the zero field reduced mobility µred(0). This value isobtained by extrapolating the reduced mobility values back to the E/N = 0 point.The values of E/N in these experiments are so low that the values µred obtaineddirectly give µred(0). For 1 bar room temperature equivalent density the results arecompatible with the reduced mobility of ions with comparable masses to 219Rn (seeTable 5.2) and other noble gas ions in helium, neon and argon gases (see Table 5.3).The reduced mobility of 219Rn ions at 2 and 3 bar are rather the same and are lessthan that at 1 bar room temperature equivalent density helium gas at 77 K (see
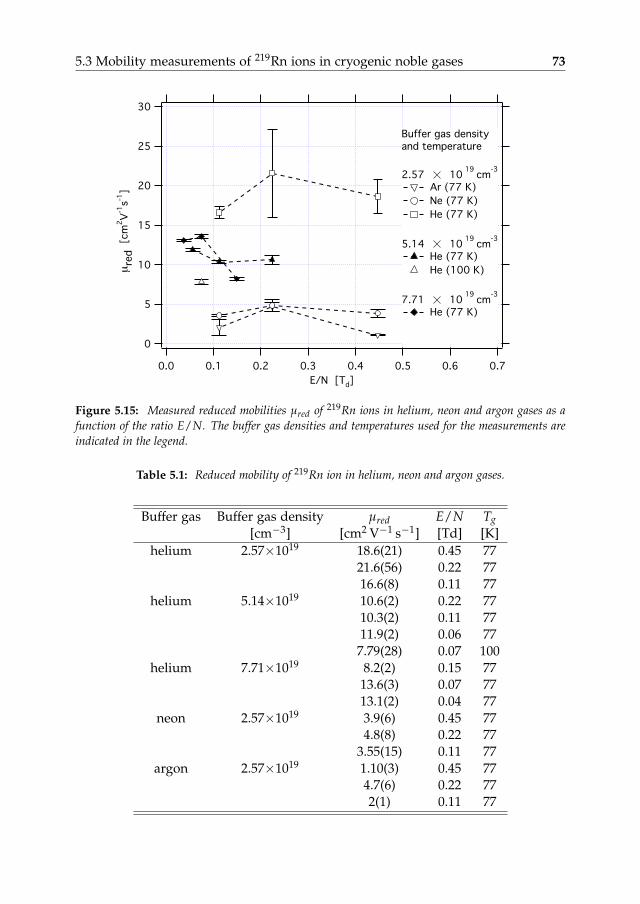
5.3 Mobility measurements of 219Rn ions in cryogenic noble gases 73
µ
Figure 5.15: Measured reduced mobilities µred of 219Rn ions in helium, neon and argon gases as afunction of the ratio E/N. The buffer gas densities and temperatures used for the measurements areindicated in the legend.
Table 5.1: Reduced mobility of 219Rn ion in helium, neon and argon gases.
Buffer gas Buffer gas density µred E/N Tg[cm−3] [cm2 V−1 s−1] [Td] [K]
helium 2.57×10¹⁹ 18.6(21) 0.45 7721.6(56) 0.22 7716.6(8) 0.11 77
helium 5.14×10¹⁹ 10.6(2) 0.22 7710.3(2) 0.11 7711.9(2) 0.06 77
7.79(28) 0.07 100helium 7.71×10¹⁹ 8.2(2) 0.15 77
13.6(3) 0.07 7713.1(2) 0.04 77
neon 2.57×10¹⁹ 3.9(6) 0.45 774.8(8) 0.22 77
3.55(15) 0.11 77argon 2.57×10¹⁹ 1.10(3) 0.45 77
4.7(6) 0.22 772(1) 0.11 77
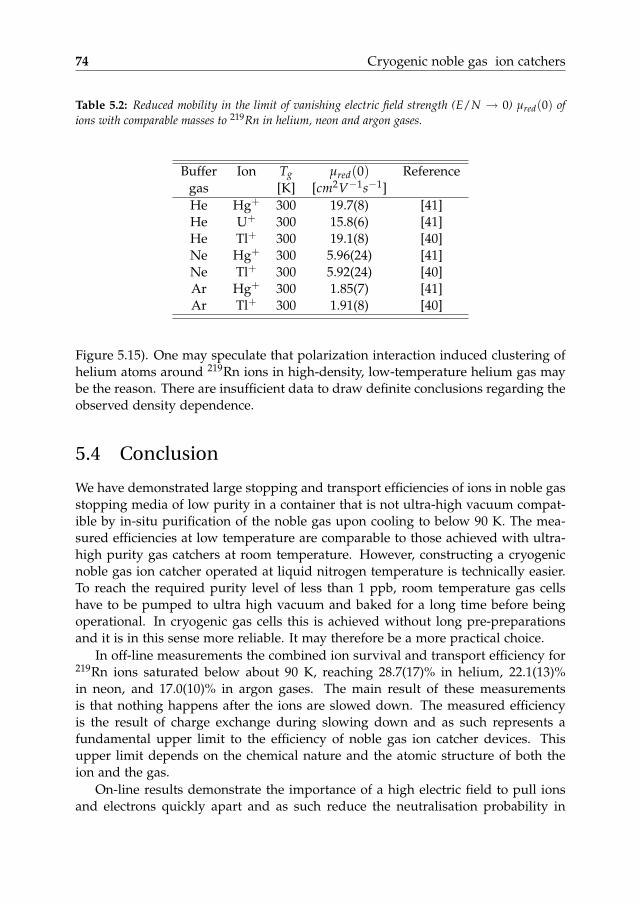
74 Cryogenic noble gas ion catchers
Table 5.2: Reduced mobility in the limit of vanishing electric field strength (E/N → 0) µred(0) ofions with comparable masses to 219Rn in helium, neon and argon gases.
Buffer Ion Tg µred(0) Referencegas [K] [cm2V−1s−1]He Hg+ 300 19.7(8) [41]He U+ 300 15.8(6) [41]He Tl+ 300 19.1(8) [40]Ne Hg+ 300 5.96(24) [41]Ne Tl+ 300 5.92(24) [40]Ar Hg+ 300 1.85(7) [41]Ar Tl+ 300 1.91(8) [40]
Figure 5.15). One may speculate that polarization interaction induced clustering ofhelium atoms around 219Rn ions in high-density, low-temperature helium gas maybe the reason. There are insufficient data to draw definite conclusions regarding theobserved density dependence.
5.4 Conclusion
We have demonstrated large stopping and transport efficiencies of ions in noble gasstopping media of low purity in a container that is not ultra-high vacuum compat-ible by in-situ purification of the noble gas upon cooling to below 90 K. The mea-sured efficiencies at low temperature are comparable to those achieved with ultra-high purity gas catchers at room temperature. However, constructing a cryogenicnoble gas ion catcher operated at liquid nitrogen temperature is technically easier.To reach the required purity level of less than 1 ppb, room temperature gas cellshave to be pumped to ultra high vacuum and baked for a long time before beingoperational. In cryogenic gas cells this is achieved without long pre-preparationsand it is in this sense more reliable. It may therefore be a more practical choice.
In off-line measurements the combined ion survival and transport efficiency for219Rn ions saturated below about 90 K, reaching 28.7(17)% in helium, 22.1(13)%in neon, and 17.0(10)% in argon gases. The main result of these measurementsis that nothing happens after the ions are slowed down. The measured efficiencyis the result of charge exchange during slowing down and as such represents afundamental upper limit to the efficiency of noble gas ion catcher devices. Thisupper limit depends on the chemical nature and the atomic structure of both theion and the gas.
On-line results demonstrate the importance of a high electric field to pull ionsand electrons quickly apart and as such reduce the neutralisation probability in
5.4 Conclusion 75
the ionization region. Both on-line and off-line measurements demonstrate thatcryogenic helium at high density and high electric field is a promising medium foran ion catcher.
The mobility measurements of 219Rn ions in helium, neon and argon at 77 Kgave values comparable to those obtained earlier for xenon in the same gases.
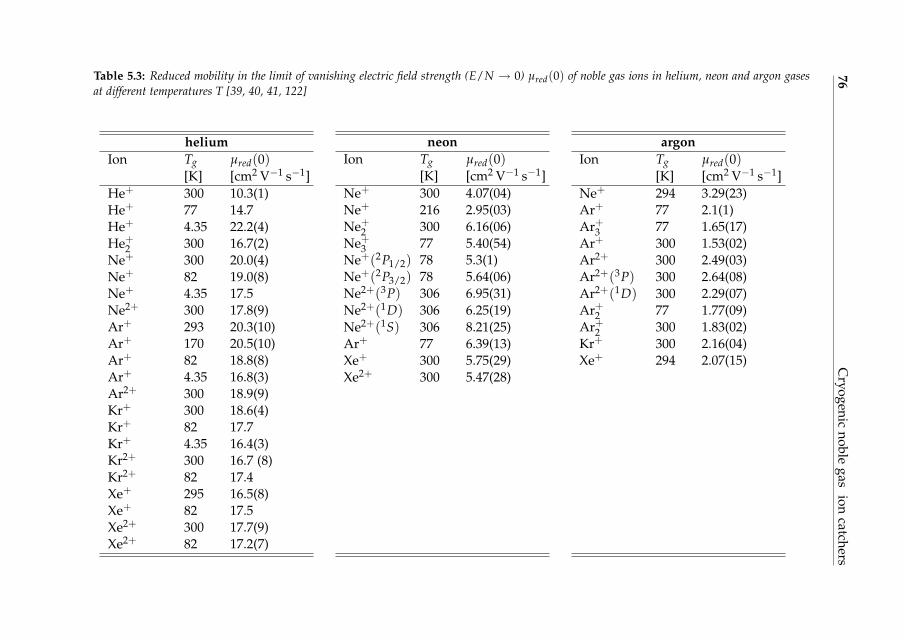
76C
ryogenicnoble
gasion
catchersTable 5.3: Reduced mobility in the limit of vanishing electric field strength (E/N → 0) µred(0) of noble gas ions in helium, neon and argon gasesat different temperatures T [39, 40, 41, 122]
heliumIon Tg µred(0)
[K] [cm2 V−1 s−1]He+ 300 10.3(1)He+ 77 14.7He+ 4.35 22.2(4)He+
2 300 16.7(2)Ne+ 300 20.0(4)Ne+ 82 19.0(8)Ne+ 4.35 17.5Ne2+ 300 17.8(9)Ar+ 293 20.3(10)Ar+ 170 20.5(10)Ar+ 82 18.8(8)Ar+ 4.35 16.8(3)Ar2+ 300 18.9(9)Kr+ 300 18.6(4)Kr+ 82 17.7Kr+ 4.35 16.4(3)Kr2+ 300 16.7 (8)Kr2+ 82 17.4Xe+ 295 16.5(8)Xe+ 82 17.5Xe2+ 300 17.7(9)Xe2+ 82 17.2(7)
neonIon Tg µred(0)
[K] [cm2 V−1 s−1]Ne+ 300 4.07(04)Ne+ 216 2.95(03)Ne+
2 300 6.16(06)Ne+
3 77 5.40(54)Ne+(2P1/2) 78 5.3(1)Ne+(2P3/2) 78 5.64(06)Ne2+(3P) 306 6.95(31)Ne2+(1D) 306 6.25(19)Ne2+(1S) 306 8.21(25)Ar+ 77 6.39(13)Xe+ 300 5.75(29)Xe2+ 300 5.47(28)
argonIon Tg µred(0)
[K] [cm2 V−1 s−1]Ne+ 294 3.29(23)Ar+ 77 2.1(1)Ar+
3 77 1.65(17)Ar+ 300 1.53(02)Ar2+ 300 2.49(03)Ar2+(3P) 300 2.64(08)Ar2+(1D) 300 2.29(07)Ar+
2 77 1.77(09)Ar+
2 300 1.83(02)Kr+ 300 2.16(04)Xe+ 294 2.07(15)
6Superfluid heliumion catcher
Aseries of off-line experiments was carried out at the Department of Physics,University of Jyväskylä (JYFL), Finland in 2001-2002 to investigate the possibil-
ity to use liquid helium as ion catcher stopping medium. The measurements em-ployed 219Rn ions recoiling from 223Ra (see Section 4.2.1) as an ion source. Amongthe reported results was the first observation of the extraction of heavy positiveions across the superfluid helium surface [56, 57, 108]. The efficiency for extrac-tion across the liquid surface was 23(4)% at 1.60 K, the release time was 90(10) msat 1.50 K and the barrier for positive ions moving through a free superfluid-helium surface was 19.4(45) K. Earlier experiments which tried to extract positiveions/snowballs from liquid helium were unsuccessful [15]. A difference is thatin earlier works mostly helium ions were investigated. The electronic structureof heavy ions may have a relation to the different behavior observed in the JYFLexperiments.
The experiments described in this section aim towards a better understanding ofthe ion extraction at the superfluid-vapor interface. Further, as a new idea the pos-sibility to enhance the ion extraction efficiency by second sound assisted superfluidsurface evaporation is also investigated.
6.1 Extraction of 219Rn ions across the superfluid-vaporinterface
6.1.1 Experimental setup
The experiments were carried out inside a helium bath-cryostat working in thetemperature range of 1.0 K to 1.8 K (see Chapter 4).
The principle of this experiment consists of five consecutive steps:
77
78 Superfluid helium ion catcher
1. Thermalization of 219Rn recoil ions in superfluid helium where they sponta-neously form snowballs (see Section 3.1).
2. An electric field pushes the snowballs towards the superfluid-vapor interface.
3. Ions are extracted across the superfluid-vapor interface (see Section 3.5).
4. The extracted ions are transported by an electric field to an aluminum catcherfoil, from where
5. α-particles are detected with a surface barrier spectrometer.
An open 223Ra α-decay-recoil source was mounted at the bottom of the exper-imental cell. Several ring electrodes are used to provide a favorable static electricfield to transport the ions from the source to a thin aluminum catcher foil. The ex-perimental cell is cooled down to superfluid temperature and then helium gas froma room temperature buffer volume is let in to be condensed. The buffer volumefilled with 1 bar helium gas at room temperature gives 23 cm3 superfluid heliumon condensation. The volume profile of the experimental cell is known, thereforethe height of the superfluid helium can be controlled with an accuracy of ∼ 0.5 mmby admitting the appropriate amount of buffer volume fillings to the cold cell. Inthe experiments described here the 223Ra source was covered by 6 mm of liquidhelium.
As long as the source is above the superfluid helium surface, α-particles fromthe source can be recorded by the α-particle detector. Once the α-particles from thesource can no longer be recorded by the detector, an amount of superfluid heliumsufficient to cover the source with about 0.4 mm (the range of α-particles in liquidhelium) is condensed. An applied electric field has been designed with a smallradially focusing component at the superfluid helium surface in order to achieveradial confinement of the ions. Displacement of ions more than a few millimetersaway from the cell axis would lead to transport loss. If an electric field is appliedto guide positive ions from the source to the foil two sets of α-lines can be detected.One set corresponds to the ions which decay at the superfluid-vapor interface; thesecond set originates from the ions which are extracted across the superfluid-vaporinterface and are transported to the aluminum foil and decay there. As explainedin Section 4.2.3 both sets can be unambiguously identified because of the differentenergy loss. Different isotopes are identified based on their known α energies. The223Ra α-lines are not seen in either of these sets since 223Ra is the mother nucleusand as such does not recoil out of the source. With this setup two sets of experi-ments were carried out to measure the snowball efficiency and investigate the ionextraction across the superfluid-vapor interface.
Both experiments were performed with similar setups; they are referred to asexperiment A (see Figure 6.1a) and experiment B (see Figure 6.1b). The differencesbetween experiment A and B are the shape of the 219Rn recoil open ion source, thesource strength, the number of intermediate guiding electrodes and the distance
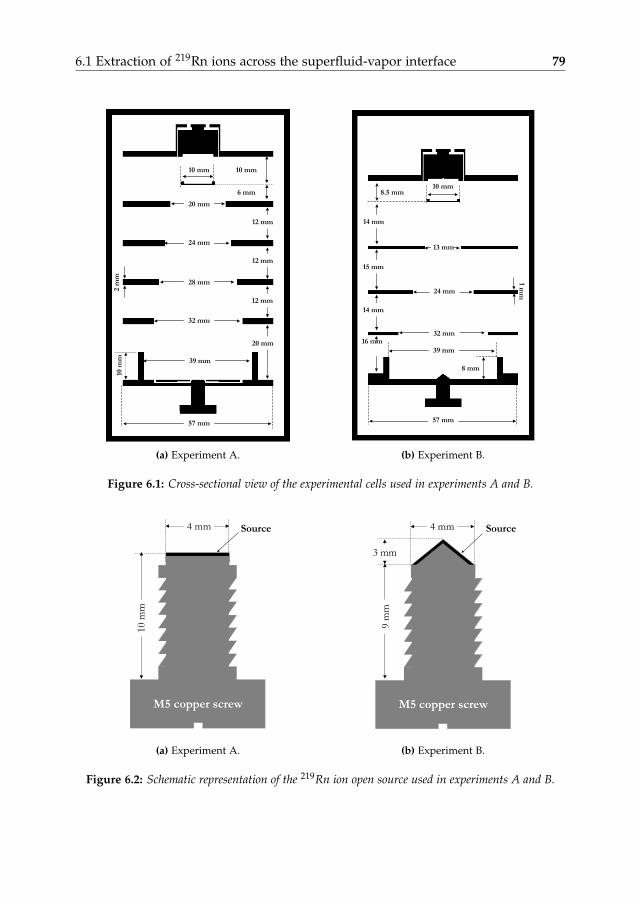
6.1 Extraction of 219Rn ions across the superfluid-vapor interface 79
39 mm
57 mm
32 mm
24 mm
10 mm
8 mm
14 mm
15 mm
14 mm
8.5 mm
13 mm
16 mm
1 m
m
39 mm
12 mm
12 mm
12 mm
20 mm
6 mm
32 mm
28 mm
24 mm
20 mm
10 mm
10 m
m
10 mm
57 mm
2 m
m
(a) Experiment A.
39 mm
57 mm
32 mm
24 mm
10 mm
8 mm
14 mm
15 mm
14 mm
8.5 mm
13 mm
16 mm
1 m
m
39 mm
12 mm
12 mm
12 mm
20 mm
6 mm
32 mm
28 mm
24 mm
20 mm
10 mm
10 m
m
10 mm
57 mm
2 m
m
(b) Experiment B.
Figure 6.1: Cross-sectional view of the experimental cells used in experiments A and B.
10 m
m
M5 copper screw
4 mm4 mm Source
9 m
m
3 mm
Source
M5 copper screw
(a) Experiment A.
10 m
m
M5 copper screw
4 mm4 mm Source
9 m
m
3 mm
Source
M5 copper screw
(b) Experiment B.
Figure 6.2: Schematic representation of the 219Rn ion open source used in experiments A and B.
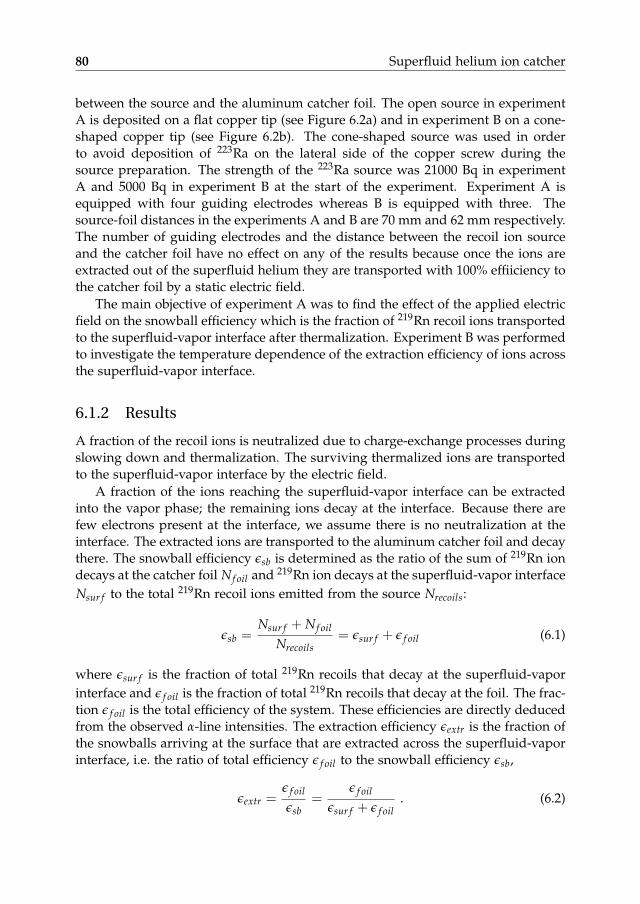
80 Superfluid helium ion catcher
between the source and the aluminum catcher foil. The open source in experimentA is deposited on a flat copper tip (see Figure 6.2a) and in experiment B on a cone-shaped copper tip (see Figure 6.2b). The cone-shaped source was used in orderto avoid deposition of 223Ra on the lateral side of the copper screw during thesource preparation. The strength of the 223Ra source was 21000 Bq in experimentA and 5000 Bq in experiment B at the start of the experiment. Experiment A isequipped with four guiding electrodes whereas B is equipped with three. Thesource-foil distances in the experiments A and B are 70 mm and 62 mm respectively.The number of guiding electrodes and the distance between the recoil ion sourceand the catcher foil have no effect on any of the results because once the ions areextracted out of the superfluid helium they are transported with 100% effiiciency tothe catcher foil by a static electric field.
The main objective of experiment A was to find the effect of the applied electricfield on the snowball efficiency which is the fraction of 219Rn recoil ions transportedto the superfluid-vapor interface after thermalization. Experiment B was performedto investigate the temperature dependence of the extraction efficiency of ions acrossthe superfluid-vapor interface.
6.1.2 Results
A fraction of the recoil ions is neutralized due to charge-exchange processes duringslowing down and thermalization. The surviving thermalized ions are transportedto the superfluid-vapor interface by the electric field.
A fraction of the ions reaching the superfluid-vapor interface can be extractedinto the vapor phase; the remaining ions decay at the interface. Because there arefew electrons present at the interface, we assume there is no neutralization at theinterface. The extracted ions are transported to the aluminum catcher foil and decaythere. The snowball efficiency εsb is determined as the ratio of the sum of 219Rn iondecays at the catcher foil N f oil and 219Rn ion decays at the superfluid-vapor interfaceNsur f to the total 219Rn recoil ions emitted from the source Nrecoils:
εsb =Nsur f + N f oil
Nrecoils= εsur f + ε f oil (6.1)
where εsur f is the fraction of total 219Rn recoils that decay at the superfluid-vaporinterface and ε f oil is the fraction of total 219Rn recoils that decay at the foil. The frac-tion ε f oil is the total efficiency of the system. These efficiencies are directly deducedfrom the observed α-line intensities. The extraction efficiency εextr is the fraction ofthe snowballs arriving at the surface that are extracted across the superfluid-vaporinterface, i.e. the ratio of total efficiency ε f oil to the snowball efficiency εsb,
εextr =ε f oil
εsb=
ε f oil
εsur f + ε f oil. (6.2)
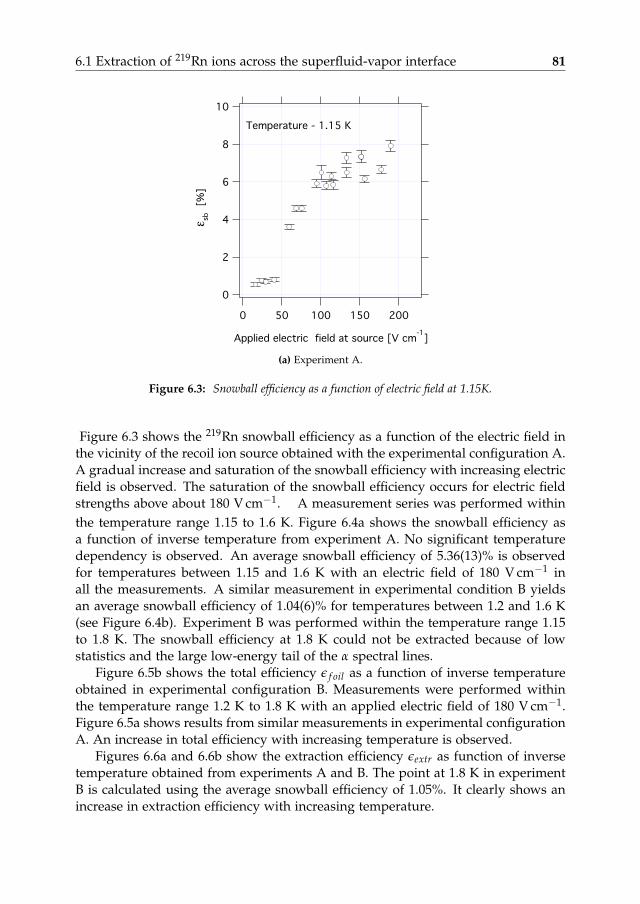
6.1 Extraction of 219Rn ions across the superfluid-vapor interface 81
!
(a) Experiment A.
Figure 6.3: Snowball efficiency as a function of electric field at 1.15K.
Figure 6.3 shows the 219Rn snowball efficiency as a function of the electric field inthe vicinity of the recoil ion source obtained with the experimental configuration A.A gradual increase and saturation of the snowball efficiency with increasing electricfield is observed. The saturation of the snowball efficiency occurs for electric fieldstrengths above about 180 V cm−1. A measurement series was performed withinthe temperature range 1.15 to 1.6 K. Figure 6.4a shows the snowball efficiency asa function of inverse temperature from experiment A. No significant temperaturedependency is observed. An average snowball efficiency of 5.36(13)% is observedfor temperatures between 1.15 and 1.6 K with an electric field of 180 V cm−1 inall the measurements. A similar measurement in experimental condition B yieldsan average snowball efficiency of 1.04(6)% for temperatures between 1.2 and 1.6 K(see Figure 6.4b). Experiment B was performed within the temperature range 1.15to 1.8 K. The snowball efficiency at 1.8 K could not be extracted because of lowstatistics and the large low-energy tail of the α spectral lines.
Figure 6.5b shows the total efficiency ε f oil as a function of inverse temperatureobtained in experimental configuration B. Measurements were performed withinthe temperature range 1.2 K to 1.8 K with an applied electric field of 180 V cm−1.Figure 6.5a shows results from similar measurements in experimental configurationA. An increase in total efficiency with increasing temperature is observed.
Figures 6.6a and 6.6b show the extraction efficiency εextr as function of inversetemperature obtained from experiments A and B. The point at 1.8 K in experimentB is calculated using the average snowball efficiency of 1.05%. It clearly shows anincrease in extraction efficiency with increasing temperature.
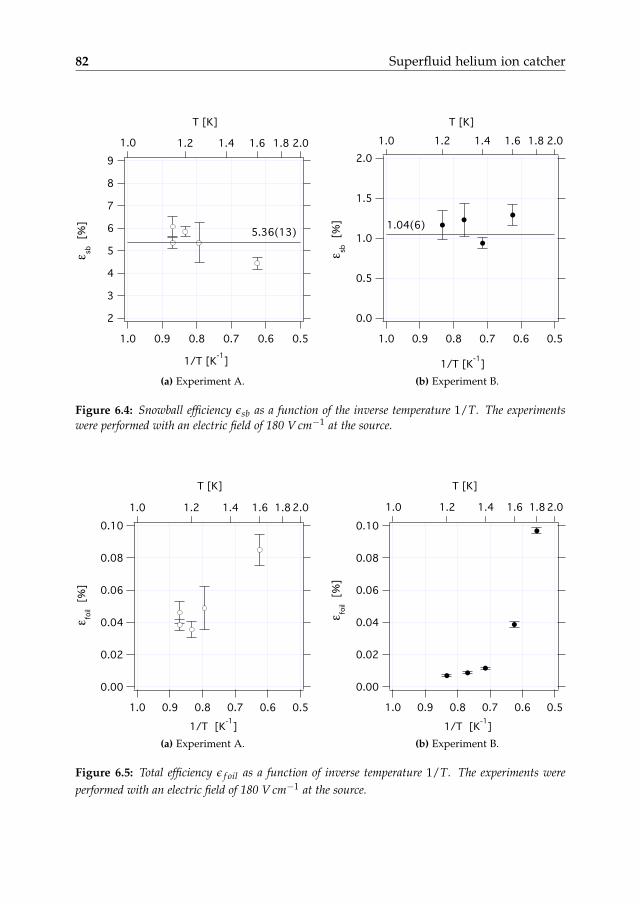
82 Superfluid helium ion catcher!
(a) Experiment A.
!
(b) Experiment B.
Figure 6.4: Snowball efficiency εsb as a function of the inverse temperature 1/T. The experimentswere performed with an electric field of 180 V cm−1 at the source.
!
(a) Experiment A.
!
(b) Experiment B.
Figure 6.5: Total efficiency ε f oil as a function of inverse temperature 1/T. The experiments wereperformed with an electric field of 180 V cm−1 at the source.
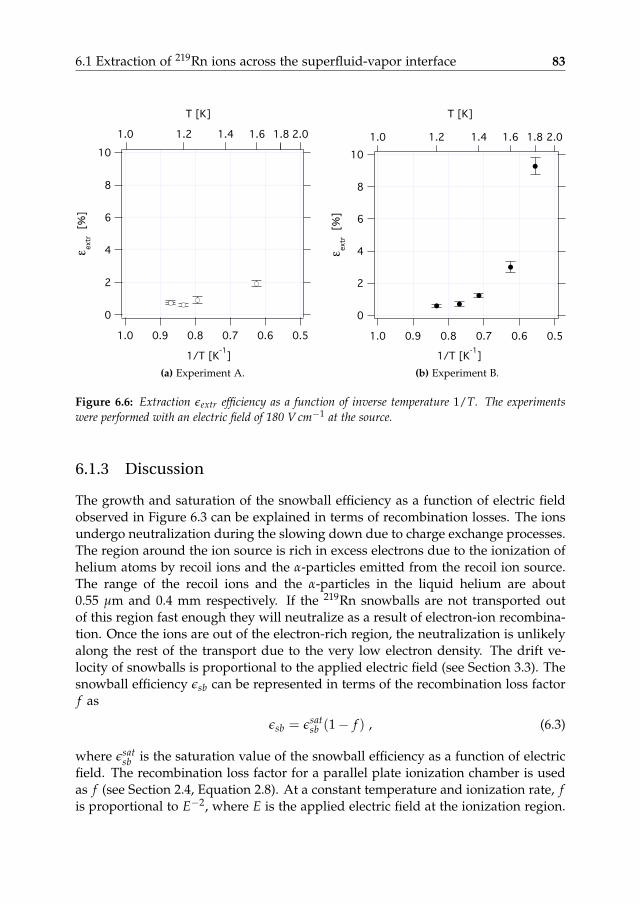
6.1 Extraction of 219Rn ions across the superfluid-vapor interface 83!
(a) Experiment A.
!
(b) Experiment B.
Figure 6.6: Extraction εextr efficiency as a function of inverse temperature 1/T. The experimentswere performed with an electric field of 180 V cm−1 at the source.
6.1.3 Discussion
The growth and saturation of the snowball efficiency as a function of electric fieldobserved in Figure 6.3 can be explained in terms of recombination losses. The ionsundergo neutralization during the slowing down due to charge exchange processes.The region around the ion source is rich in excess electrons due to the ionization ofhelium atoms by recoil ions and the α-particles emitted from the recoil ion source.The range of the recoil ions and the α-particles in the liquid helium are about0.55 µm and 0.4 mm respectively. If the 219Rn snowballs are not transported outof this region fast enough they will neutralize as a result of electron-ion recombina-tion. Once the ions are out of the electron-rich region, the neutralization is unlikelyalong the rest of the transport due to the very low electron density. The drift ve-locity of snowballs is proportional to the applied electric field (see Section 3.3). Thesnowball efficiency εsb can be represented in terms of the recombination loss factorf as
εsb = εsatsb (1− f ) , (6.3)
where εsatsb is the saturation value of the snowball efficiency as a function of electric
field. The recombination loss factor for a parallel plate ionization chamber is usedas f (see Section 2.4, Equation 2.8). At a constant temperature and ionization rate, fis proportional to E−2, where E is the applied electric field at the ionization region.
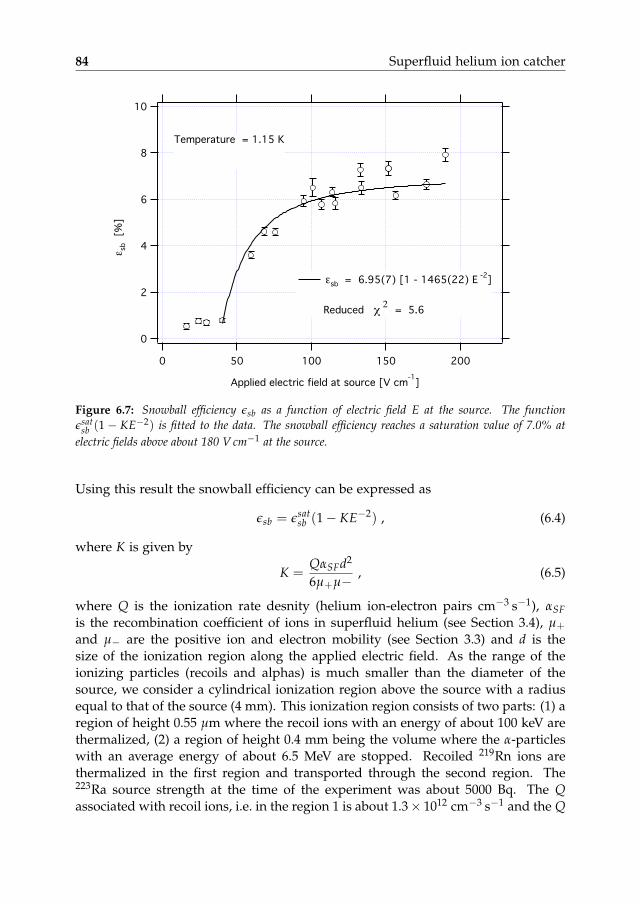
84 Superfluid helium ion catcher
!
!
" 2
Figure 6.7: Snowball efficiency εsb as a function of electric field E at the source. The functionεsat
sb (1− KE−2) is fitted to the data. The snowball efficiency reaches a saturation value of 7.0% atelectric fields above about 180 V cm−1 at the source.
Using this result the snowball efficiency can be expressed as
εsb = εsatsb (1− KE−2) , (6.4)
where K is given by
K =QαSFd2
6µ+µ− , (6.5)
where Q is the ionization rate desnity (helium ion-electron pairs cm−3 s−1), αSFis the recombination coefficient of ions in superfluid helium (see Section 3.4), µ+and µ− are the positive ion and electron mobility (see Section 3.3) and d is thesize of the ionization region along the applied electric field. As the range of theionizing particles (recoils and alphas) is much smaller than the diameter of thesource, we consider a cylindrical ionization region above the source with a radiusequal to that of the source (4 mm). This ionization region consists of two parts: (1) aregion of height 0.55 µm where the recoil ions with an energy of about 100 keV arethermalized, (2) a region of height 0.4 mm being the volume where the α-particleswith an average energy of about 6.5 MeV are stopped. Recoiled 219Rn ions arethermalized in the first region and transported through the second region. The223Ra source strength at the time of the experiment was about 5000 Bq. The Qassociated with recoil ions, i.e. in the region 1 is about 1.3× 1012 cm−3 s−1 and the Q
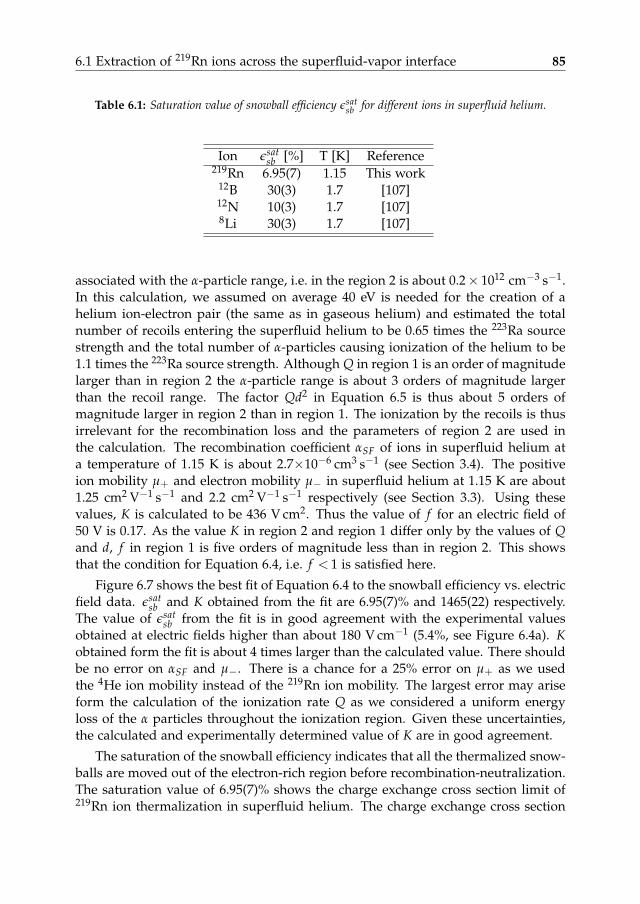
6.1 Extraction of 219Rn ions across the superfluid-vapor interface 85
Table 6.1: Saturation value of snowball efficiency εsatsb for different ions in superfluid helium.
Ion εsatsb [%] T [K] Reference
219Rn 6.95(7) 1.15 This work12B 30(3) 1.7 [107]12N 10(3) 1.7 [107]8Li 30(3) 1.7 [107]
associated with the α-particle range, i.e. in the region 2 is about 0.2× 1012 cm−3 s−1.In this calculation, we assumed on average 40 eV is needed for the creation of ahelium ion-electron pair (the same as in gaseous helium) and estimated the totalnumber of recoils entering the superfluid helium to be 0.65 times the 223Ra sourcestrength and the total number of α-particles causing ionization of the helium to be1.1 times the 223Ra source strength. Although Q in region 1 is an order of magnitudelarger than in region 2 the α-particle range is about 3 orders of magnitude largerthan the recoil range. The factor Qd2 in Equation 6.5 is thus about 5 orders ofmagnitude larger in region 2 than in region 1. The ionization by the recoils is thusirrelevant for the recombination loss and the parameters of region 2 are used inthe calculation. The recombination coefficient αSF of ions in superfluid helium ata temperature of 1.15 K is about 2.7×10⁻⁶ cm3 s−1 (see Section 3.4). The positiveion mobility µ+ and electron mobility µ− in superfluid helium at 1.15 K are about1.25 cm2 V−1 s−1 and 2.2 cm2 V−1 s−1 respectively (see Section 3.3). Using thesevalues, K is calculated to be 436 V cm2. Thus the value of f for an electric field of50 V is 0.17. As the value K in region 2 and region 1 differ only by the values of Qand d, f in region 1 is five orders of magnitude less than in region 2. This showsthat the condition for Equation 6.4, i.e. f < 1 is satisfied here.
Figure 6.7 shows the best fit of Equation 6.4 to the snowball efficiency vs. electricfield data. εsat
sb and K obtained from the fit are 6.95(7)% and 1465(22) respectively.The value of εsat
sb from the fit is in good agreement with the experimental valuesobtained at electric fields higher than about 180 V cm−1 (5.4%, see Figure 6.4a). Kobtained form the fit is about 4 times larger than the calculated value. There shouldbe no error on αSF and µ−. There is a chance for a 25% error on µ+ as we usedthe 4He ion mobility instead of the 219Rn ion mobility. The largest error may ariseform the calculation of the ionization rate Q as we considered a uniform energyloss of the α particles throughout the ionization region. Given these uncertainties,the calculated and experimentally determined value of K are in good agreement.
The saturation of the snowball efficiency indicates that all the thermalized snow-balls are moved out of the electron-rich region before recombination-neutralization.The saturation value of 6.95(7)% shows the charge exchange cross section limit of219Rn ion thermalization in superfluid helium. The charge exchange cross section
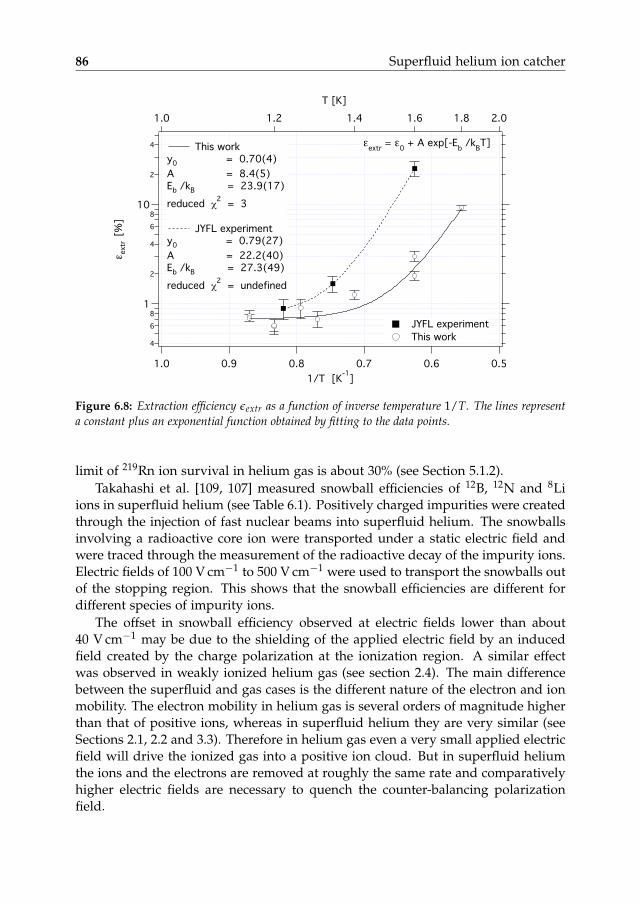
86 Superfluid helium ion catcher
!
"
"
! !
Figure 6.8: Extraction efficiency εextr as a function of inverse temperature 1/T. The lines representa constant plus an exponential function obtained by fitting to the data points.
limit of 219Rn ion survival in helium gas is about 30% (see Section 5.1.2).Takahashi et al. [109, 107] measured snowball efficiencies of 12B, 12N and 8Li
ions in superfluid helium (see Table 6.1). Positively charged impurities were createdthrough the injection of fast nuclear beams into superfluid helium. The snowballsinvolving a radioactive core ion were transported under a static electric field andwere traced through the measurement of the radioactive decay of the impurity ions.Electric fields of 100 V cm−1 to 500 V cm−1 were used to transport the snowballs outof the stopping region. This shows that the snowball efficiencies are different fordifferent species of impurity ions.
The offset in snowball efficiency observed at electric fields lower than about40 V cm−1 may be due to the shielding of the applied electric field by an inducedfield created by the charge polarization at the ionization region. A similar effectwas observed in weakly ionized helium gas (see section 2.4). The main differencebetween the superfluid and gas cases is the different nature of the electron and ionmobility. The electron mobility in helium gas is several orders of magnitude higherthan that of positive ions, whereas in superfluid helium they are very similar (seeSections 2.1, 2.2 and 3.3). Therefore in helium gas even a very small applied electricfield will drive the ionized gas into a positive ion cloud. But in superfluid heliumthe ions and the electrons are removed at roughly the same rate and comparativelyhigher electric fields are necessary to quench the counter-balancing polarizationfield.
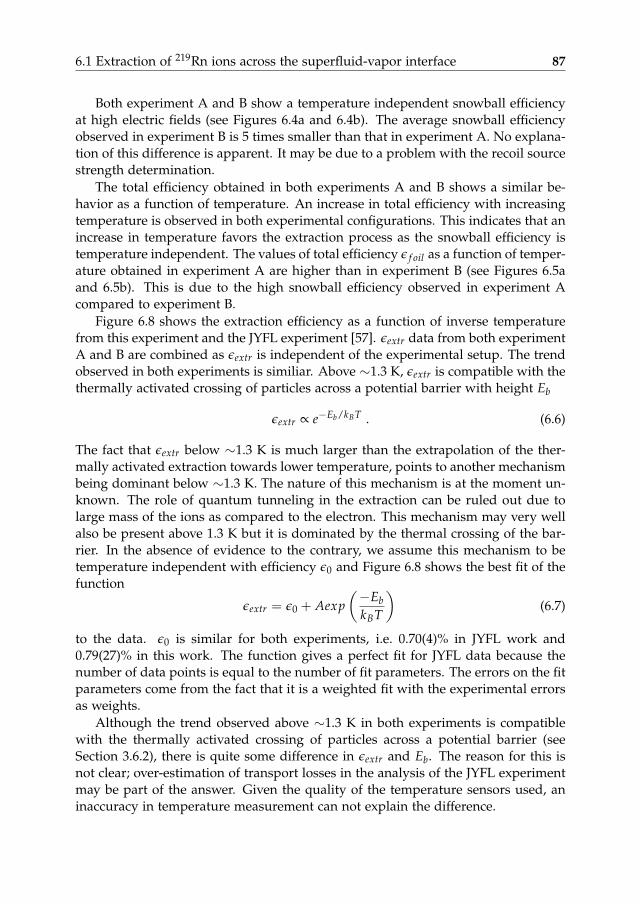
6.1 Extraction of 219Rn ions across the superfluid-vapor interface 87
Both experiment A and B show a temperature independent snowball efficiencyat high electric fields (see Figures 6.4a and 6.4b). The average snowball efficiencyobserved in experiment B is 5 times smaller than that in experiment A. No explana-tion of this difference is apparent. It may be due to a problem with the recoil sourcestrength determination.
The total efficiency obtained in both experiments A and B shows a similar be-havior as a function of temperature. An increase in total efficiency with increasingtemperature is observed in both experimental configurations. This indicates that anincrease in temperature favors the extraction process as the snowball efficiency istemperature independent. The values of total efficiency ε f oil as a function of temper-ature obtained in experiment A are higher than in experiment B (see Figures 6.5aand 6.5b). This is due to the high snowball efficiency observed in experiment Acompared to experiment B.
Figure 6.8 shows the extraction efficiency as a function of inverse temperaturefrom this experiment and the JYFL experiment [57]. εextr data from both experimentA and B are combined as εextr is independent of the experimental setup. The trendobserved in both experiments is similiar. Above ∼1.3 K, εextr is compatible with thethermally activated crossing of particles across a potential barrier with height Eb
εextr ∝ e−Eb/kBT . (6.6)
The fact that εextr below ∼1.3 K is much larger than the extrapolation of the ther-mally activated extraction towards lower temperature, points to another mechanismbeing dominant below ∼1.3 K. The nature of this mechanism is at the moment un-known. The role of quantum tunneling in the extraction can be ruled out due tolarge mass of the ions as compared to the electron. This mechanism may very wellalso be present above 1.3 K but it is dominated by the thermal crossing of the bar-rier. In the absence of evidence to the contrary, we assume this mechanism to betemperature independent with efficiency ε0 and Figure 6.8 shows the best fit of thefunction
εextr = ε0 + Aexp(−EbkBT
)(6.7)
to the data. ε0 is similar for both experiments, i.e. 0.70(4)% in JYFL work and0.79(27)% in this work. The function gives a perfect fit for JYFL data because thenumber of data points is equal to the number of fit parameters. The errors on the fitparameters come from the fact that it is a weighted fit with the experimental errorsas weights.
Although the trend observed above ∼1.3 K in both experiments is compatiblewith the thermally activated crossing of particles across a potential barrier (seeSection 3.6.2), there is quite some difference in εextr and Eb. The reason for this isnot clear; over-estimation of transport losses in the analysis of the JYFL experimentmay be part of the answer. Given the quality of the temperature sensors used, aninaccuracy in temperature measurement can not explain the difference.
88 Superfluid helium ion catcher
No theoretical model has yet been developed which adequately describes pos-itive ion extraction across the superfluid-vapor interface. The most realistic modelfor the potential energy barrier was proposed by Stern [103]. According to thismodel the image charge potential barrier experienced by a unit charge at thesuperfluid-vapor interface is about 300 K. This is about 15 times higher than ourmeasured result (taking an average barrier height from the data sets shown in Fig-ure 6.8 to be 20 K). This difference may arise from the fact that Stern’s model lackssome important physical features of the real situation. Most important is the den-sity profile at the superfluid-vapor interface assumed in the calculation. The widthof the interface used in Sterns’ calculation is 0.68 nm and the experimentally mea-sured value by Lurio et al. is 0.92(10) nm [71]. For the density variation acrossthe interface, Stern considers a linearly graded transition and sinusoidally roundedcorners. A later experimental study by Lurio et al. [70, 71] showed that the ac-tual rate of density change at the superfluid side of the interface is much slowerthan sinusoidal (see Figure 3.15). Stern’s calculation for a Si - SiO2 interface in thesame paper [103] showed that the resulting barrier height strongly depends on thedensity variation rate. Thus for a more realistic image charge potential barrier cal-culation one should include the density profile obtained by Lurio et al. If we believethat the potential barrier present is purely of image charge character, there shouldbe no change in barrier height with respect to temperature because the permittivityof the superfluid helium has a temperature dependence of only about 10−3 K−1.One more important aspect that is missing in Stern’s model is the actual size andstructure of the charge carrier. Stern considered a point charge for his calculation,however in reality the size of the snowball is comparable to the width of the inter-face. We consider it likely that a snowball will deform the liquid helium surface asit comes close enough. Given the fact that image charge potential is very sensitiveto the surface density profile, such deformation is expected to have an influenceon the image charge potential barrier and thus influence the extraction process. Adetailed theoretical study is necessary to understand the mechanism of positive ionextraction across the superfluid-vapor interface.
6.2 Second sound assisted superfluid surfaceevaporation
Second sound is a quantum mechanical phenomenon exclusively known from thesuperfluid phase. It is a heat transfer mechanism by an entropy (or temperature)wave (see Chapter 3). A single second sound pulse can maintain an extremelysharp wavefront in temperature rise. T. Furukawa et al. [47] reported transientevaporation of helium at the superfluid helium surface if a second sound thermalpulse impinges onto the superfluid-vapor interface. This result triggered interestto investigate the possibilities to use this phenomenon to release the ions trappedbelow the superfluid helium surface.
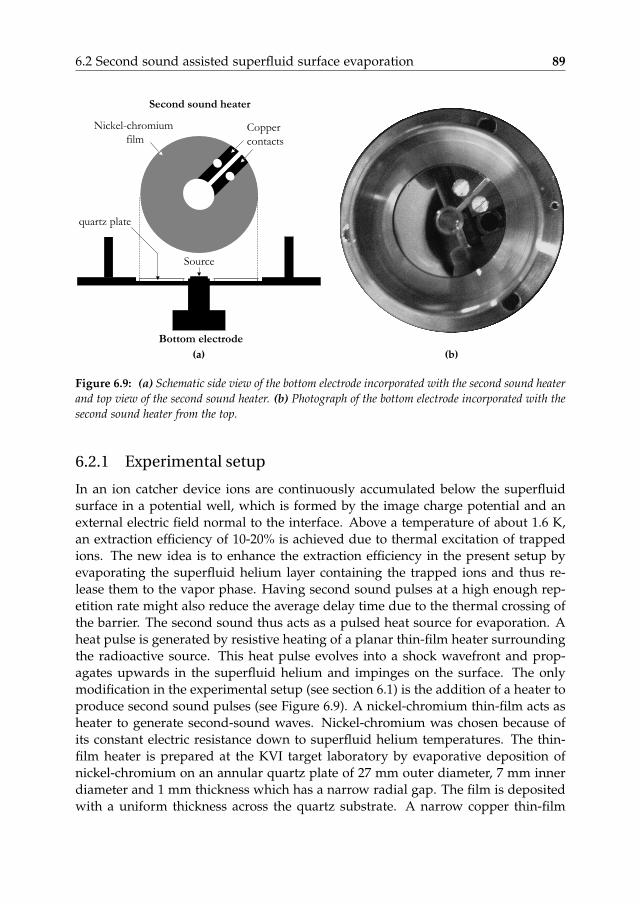
6.2 Second sound assisted superfluid surface evaporation 89
Second sound heater
Source
Bottom electrode
Copper
contacts
quartz plate
Nickel-chromium
film
(a) (b)
Figure 6.9: (a) Schematic side view of the bottom electrode incorporated with the second sound heaterand top view of the second sound heater. (b) Photograph of the bottom electrode incorporated with thesecond sound heater from the top.
6.2.1 Experimental setup
In an ion catcher device ions are continuously accumulated below the superfluidsurface in a potential well, which is formed by the image charge potential and anexternal electric field normal to the interface. Above a temperature of about 1.6 K,an extraction efficiency of 10-20% is achieved due to thermal excitation of trappedions. The new idea is to enhance the extraction efficiency in the present setup byevaporating the superfluid helium layer containing the trapped ions and thus re-lease them to the vapor phase. Having second sound pulses at a high enough rep-etition rate might also reduce the average delay time due to the thermal crossing ofthe barrier. The second sound thus acts as a pulsed heat source for evaporation. Aheat pulse is generated by resistive heating of a planar thin-film heater surroundingthe radioactive source. This heat pulse evolves into a shock wavefront and prop-agates upwards in the superfluid helium and impinges on the surface. The onlymodification in the experimental setup (see section 6.1) is the addition of a heater toproduce second sound pulses (see Figure 6.9). A nickel-chromium thin-film acts asheater to generate second-sound waves. Nickel-chromium was chosen because ofits constant electric resistance down to superfluid helium temperatures. The thin-film heater is prepared at the KVI target laboratory by evaporative deposition ofnickel-chromium on an annular quartz plate of 27 mm outer diameter, 7 mm innerdiameter and 1 mm thickness which has a narrow radial gap. The film is depositedwith a uniform thickness across the quartz substrate. A narrow copper thin-film
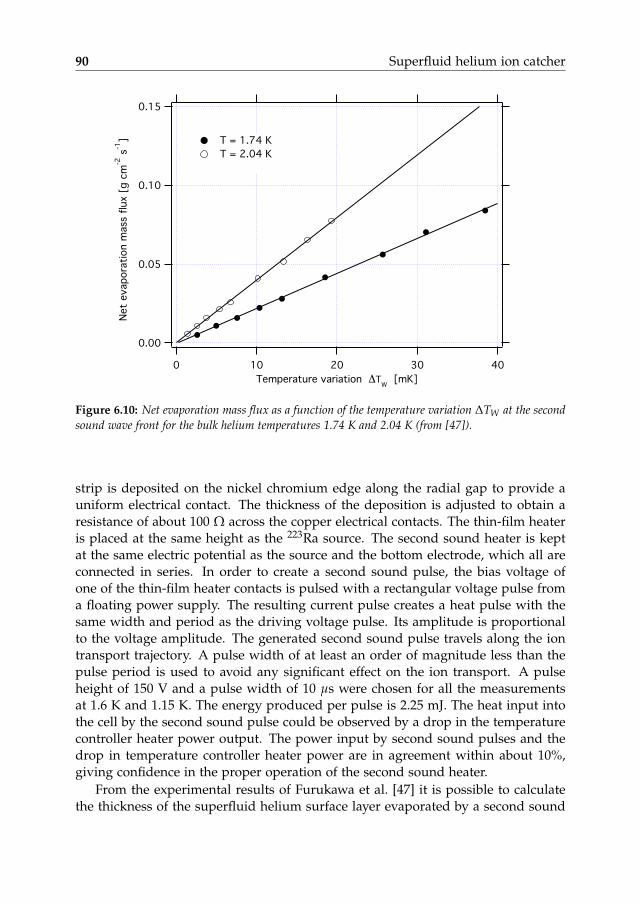
90 Superfluid helium ion catcher
!
Figure 6.10: Net evaporation mass flux as a function of the temperature variation ∆TW at the secondsound wave front for the bulk helium temperatures 1.74 K and 2.04 K (from [47]).
strip is deposited on the nickel chromium edge along the radial gap to provide auniform electrical contact. The thickness of the deposition is adjusted to obtain aresistance of about 100 Ω across the copper electrical contacts. The thin-film heateris placed at the same height as the 223Ra source. The second sound heater is keptat the same electric potential as the source and the bottom electrode, which all areconnected in series. In order to create a second sound pulse, the bias voltage ofone of the thin-film heater contacts is pulsed with a rectangular voltage pulse froma floating power supply. The resulting current pulse creates a heat pulse with thesame width and period as the driving voltage pulse. Its amplitude is proportionalto the voltage amplitude. The generated second sound pulse travels along the iontransport trajectory. A pulse width of at least an order of magnitude less than thepulse period is used to avoid any significant effect on the ion transport. A pulseheight of 150 V and a pulse width of 10 µs were chosen for all the measurementsat 1.6 K and 1.15 K. The energy produced per pulse is 2.25 mJ. The heat input intothe cell by the second sound pulse could be observed by a drop in the temperaturecontroller heater power output. The power input by second sound pulses and thedrop in temperature controller heater power are in agreement within about 10%,giving confidence in the proper operation of the second sound heater.
From the experimental results of Furukawa et al. [47] it is possible to calculatethe thickness of the superfluid helium surface layer evaporated by a second sound
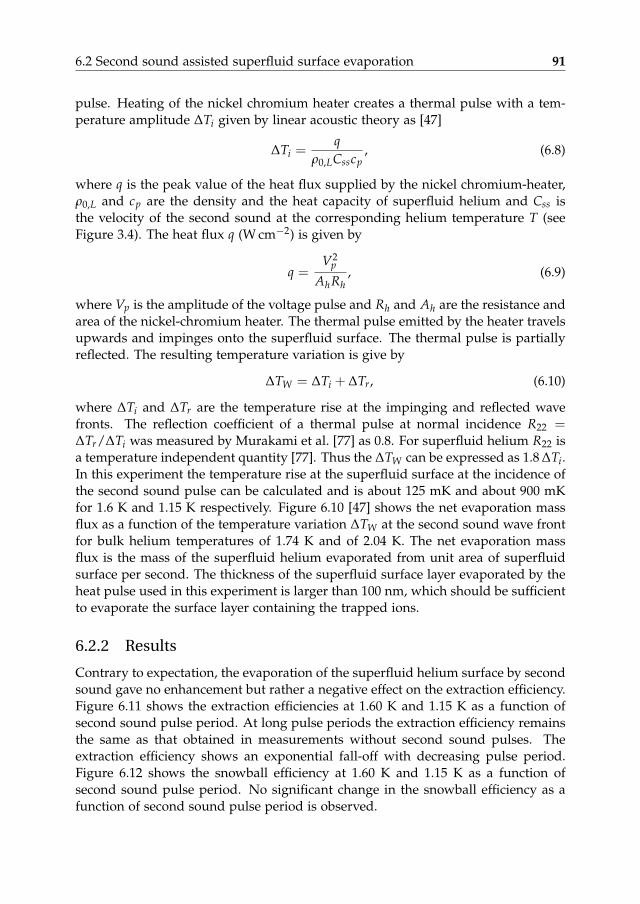
6.2 Second sound assisted superfluid surface evaporation 91
pulse. Heating of the nickel chromium heater creates a thermal pulse with a tem-perature amplitude ∆Ti given by linear acoustic theory as [47]
∆Ti =q
ρ0,LCsscp, (6.8)
where q is the peak value of the heat flux supplied by the nickel chromium-heater,ρ0,L and cp are the density and the heat capacity of superfluid helium and Css isthe velocity of the second sound at the corresponding helium temperature T (seeFigure 3.4). The heat flux q (W cm−2) is given by
q =V2
p
AhRh, (6.9)
where Vp is the amplitude of the voltage pulse and Rh and Ah are the resistance andarea of the nickel-chromium heater. The thermal pulse emitted by the heater travelsupwards and impinges onto the superfluid surface. The thermal pulse is partiallyreflected. The resulting temperature variation is give by
∆TW = ∆Ti + ∆Tr, (6.10)
where ∆Ti and ∆Tr are the temperature rise at the impinging and reflected wavefronts. The reflection coefficient of a thermal pulse at normal incidence R22 =∆Tr/∆Ti was measured by Murakami et al. [77] as 0.8. For superfluid helium R22 isa temperature independent quantity [77]. Thus the ∆TW can be expressed as 1.8 ∆Ti.In this experiment the temperature rise at the superfluid surface at the incidence ofthe second sound pulse can be calculated and is about 125 mK and about 900 mKfor 1.6 K and 1.15 K respectively. Figure 6.10 [47] shows the net evaporation massflux as a function of the temperature variation ∆TW at the second sound wave frontfor bulk helium temperatures of 1.74 K and of 2.04 K. The net evaporation massflux is the mass of the superfluid helium evaporated from unit area of superfluidsurface per second. The thickness of the superfluid surface layer evaporated by theheat pulse used in this experiment is larger than 100 nm, which should be sufficientto evaporate the surface layer containing the trapped ions.
6.2.2 Results
Contrary to expectation, the evaporation of the superfluid helium surface by secondsound gave no enhancement but rather a negative effect on the extraction efficiency.Figure 6.11 shows the extraction efficiencies at 1.60 K and 1.15 K as a function ofsecond sound pulse period. At long pulse periods the extraction efficiency remainsthe same as that obtained in measurements without second sound pulses. Theextraction efficiency shows an exponential fall-off with decreasing pulse period.Figure 6.12 shows the snowball efficiency at 1.60 K and 1.15 K as a function ofsecond sound pulse period. No significant change in the snowball efficiency as afunction of second sound pulse period is observed.
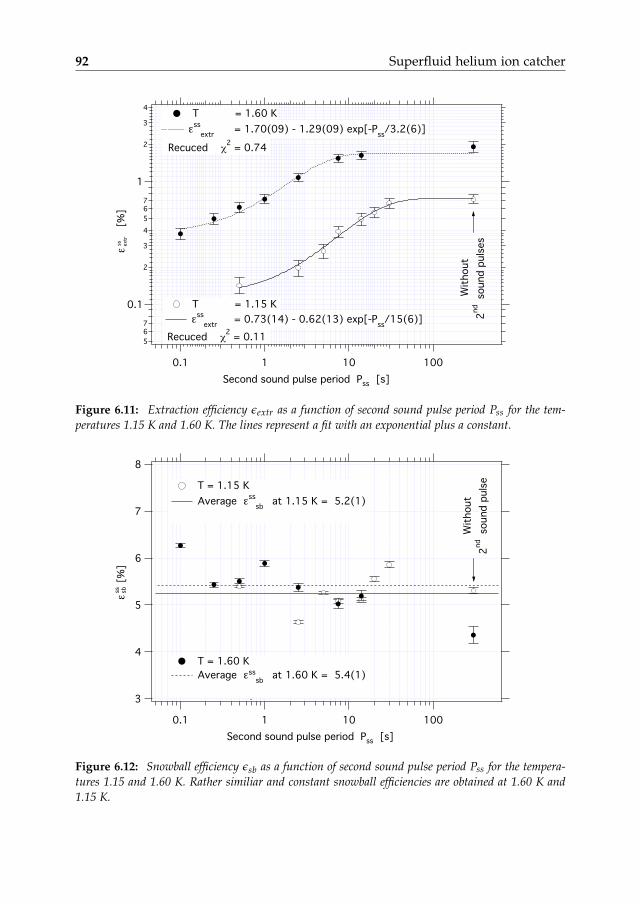
92 Superfluid helium ion catcher
!
!
"
!
"
Figure 6.11: Extraction efficiency εextr as a function of second sound pulse period Pss for the tem-peratures 1.15 K and 1.60 K. The lines represent a fit with an exponential plus a constant.
!
!
!
Figure 6.12: Snowball efficiency εsb as a function of second sound pulse period Pss for the tempera-tures 1.15 and 1.60 K. Rather similiar and constant snowball efficiencies are obtained at 1.60 K and1.15 K.
6.3 Conclusion 93
6.2.3 Discussion
Figure 6.11 shows the extraction efficiency as a function of the second sound pulseperiod. The extraction efficiency decreases with decreasing pulse period; for largepulse periods, the extraction efficiency saturates at the value measured without sec-ond sound pulses. Data points without second sound pulses are from experiment A(see section 6.1.2). Once the second sound pulse hits the superfluid helium surfacethe extraction process is apparently disturbed, and it recovers during the time gapbetween the pulses. Figure 6.11 shows the best fit of the function
εssextr = ε0
extr − Ae−Pss/τ , (6.11)
to the data, where εssextr is the extraction efficiency with second sound pulsing, ε0
extris the extraction efficiency in the absence of second sound pulsing, Pss is the secondsound pulse period and τ is the “recovery time” of the extraction after the creationof a second sound pulse. The recovery times τ for the measurements at 1.60 and1.15 K are 3.2(6) s and 15(6) s respectively, and the extraction efficiencies ε0
extr are1.7(1) and 0.73(14)% respectively.
Figure 6.12 shows the snowball efficiency εsssb at 1.6 and 1.15 K as a function
of the second sound pulse period. No considerable difference in the snowball effi-ciencies between the 1.6 and 1.15 K data is observed. The snowball efficiency ratherremains constant with respect to the second sound pulse period. This indicatesthat the number of ions trapped below the surface layer remains constant regard-less of the destruction of the extraction efficiency. This result also seems to indicatethat the trapped ions move downwards follow the superfluid surface during theevaporation.
No explanation for the observed destruction of extraction phenomenon is yetavailable as the physical processes involved are unknown. A detailed theoreticalstudy is necessary to help understand the results. One may speculate that snowballsattach themselves to vortices created by the second sound pulse. It is known thatsecond sound pulses create quatum turbulence (see e.g. [55]), which in a simplepicture is represented as a tangle of vortex lines (see [123] for a review on quantumturbulence). It is well-known that snowballs attach themselves to vortices [18] andunder certain conditions, quantum turbulence has a long decay time (e.g. Millikenet al. measure a decay time of 1.7 s at 1.45 K [74]). The assumption that 219Rnsnowballs attach themselves to vortices created by the second sounce pulse and aswhile being attached cannot be extracted from superfluid helium together with along turbulence decay time can explain our experimental observations.
6.3 Conclusion
The survival of thermalized snowballs in superfluid helium depends strongly onhow fast they are transported out of the electron-rich region where they are pro-duced from slowed-down recoil ions. The snowball efficiency reaches a saturation
94 Superfluid helium ion catcher
value at sufficiently high electric fields. The electric field strength needed to reachthe saturation depends strongly on the ionization density. The saturation value ofthe snowball efficiency is independent of the superfluid helium temperature.
The exponential increase in the extraction efficiency of positive ions across thesuperfluid-vapor interface with increasing temperature indicates that the extractionis a thermally activated process. Our data between 1.4 and 1.8 K yield a potentialbarrier of about 20 K. The extraction efficiency below about 1.3 K is much larger thanthe extrapolation of thermally activated extraction and points to another mechanismbeing dominant below 1.3 K. This mechanism may very well also be present above1.3 K but it is dominated by the thermal crossing of the barrier. It is interestingto note that the extraction efficiency below 1.3 K is quite similar in all experiments(0.5-0.8%).
The evaporation of the superfluid surface by second sound heat pulses has alasting negative impact on the ion extraction efficiency. It takes 3.2(6) s at 1.60 Kand 15(6) s at 1.15 K for the extraction process to recover from a disturbed state ofyet unknown nature. One may speculate the trapping of ions in the vortex tanglecreated by the second sound induced turbulence.
7Conclusion and outlook
The purpose of this thesis project was to investigate the possibility of using cryo-genic noble gases and superfluid helium as stopping media for ion catchers.
Cryogenic noble gas ion stopping medium
Underlying physics and mechanisms
Based on the literature survey of physical processes in ionized cryogenic heliumgas, the following conclusions are drawn:
• Most physical processes involved in the cryogenic ion catcher fall within theclassical and elastic collision limit. The positive ion mobility is an importantparameter determining the efficiency as it determines the extraction time ofions from the stopping volume.
• Given the helium densities used in noble gas ion catchers, He+2 is the domi-
nant ion in ionised helium gas above a temperature of about 200 K. Below thistemperature, He+
3 is dominant. The electric field to density ratios consideredhere are not large enough to induce the breakup of He+
3 .
• The main ion-loss mechanism in a cryogenic helium gas ion catcher is recom-bination loss. Recombination of thermalized high-energy ions obviously hasa negative impact on the total efficiency whereas helium ion recombinationis a positive factor. Recombination of helium ions decreases the space chargeproblem associated with the ion beam and removes the free electrons from theionization region.
• For the helium gas densities and temperatures relevant for the cryogenic he-lium gas ion catchers, 3-body recombination dominates the 2-body recombi-nation by an order of magnitude.
95

96 Conclusion and outlook
• The recombination coefficient of helium ions shows a temperature depen-dence of T−2.5
g for the 3-body recombination coefficient α3. The same tem-perature dependence is observed for simple molecular ions in helium downto 77 K. Recombination also depends strongly on the electron temperaturewhich in turn depends on the ionization method and can be much higherthan the gas temperature.
• Most of the available data on the recombination mechanism is restricted tohelium gas densities less than 1018 cm−3 at room temperature. A detailed the-oretical and experimental study dedicated to understand the recombinationprocess in low-temperature high-density helium gas is necessary for a deeperunderstanding of the physical processes involved.
Key experimental observations
Off-line experiments on cryogenic helium gas as a stopping medium demonstratedlarge stopping and transport efficiencies of 219Rn ions in noble gas stopping mediaof low purity in a container that is not ultra-high vacuum compatible by in-situpurification of the noble gas upon cooling to below 90 K. In an on-line experimentwe have investigated the survival and transport efficiency of 219Rn ions in high-density cryogenic helium gas, with ionisation of the gas induced by a proton beam.The combined efficiency of ion survival and transport by an applied electric fieldwas measured as a function of ionisation rate density for electric fields and forthree temperature and density combinations. The main results from the off-lineand on-line measurements are:
• For high enough electric field, no neutralization takes place after slowingdown. The measured efficiency is the result of charge exchange during slow-ing down and as such represents a fundamental upper limit to the efficiencyof noble gas ion catcher devices. This upper limit depends on the chemicalnature and the atomic structure of both ion and gas.
• In a separate experiment the mobility of 219Rn ions in helium, neon and argonat 77 K is measured. The results are comparable to those of xenon in therespective gases.
• On-line results demonstrate the importance of a high electric field to quicklypull ions and electrons apart and as such reduce the neutralisation probabilityin the ionization region. Both on-line and off-line measurements demonstratethat the cryogenic helium at high density and high electric field is a promisingmedium for an ion catcher.
• The main conclusion of the studies on cryogenic noble gas ion stopping mediais that helium is the most ideal among noble gases to be used as stoppingmedium for high-energy ion beams due to its high ionization potential.
97
• The measured efficiencies at low temperature are comparable to those achievedwith ultra-high purity gas catchers at room temperature. However, construct-ing a cryogenic noble gas ion catcher operating at liquid nitrogen temperatureis technically easier. To reach the required purity levels of less than 1 ppb,room temperature gas cells have to be pumped to high vacuum and bakedfor a long time before being operational, whereas in cryogenic gas cells this isachieved without long pre-preparations. It may therefore be a more reliableand practical choice.
• The idea of freezing out the impurities in a helium gas catcher has caught theattention of several groups in recent years. Unknown to us at the time of ourexperiments, M. Wada at RIKEN tested a cold trap at liquid nitrogen temper-ature placed inside the gas cell in order to purify the helium gas. Althoughthis system did not maintain a low temperature in the helium gas, an increasein efficiency of a factor of 10 was reported [125, 124]. Wada et al. are planninga fully cryogenic gas cell to be installed at the universal slow RI-beam facility(SLOWRI) at the RIBF at RIKEN [126]. New gas catchers being developed atthe National Superconducting Cyclotron Laboratory at Michigan State Uni-versity are planned to be cryogenic [52]. Plans to replace the gas cell at theSHIPTRAP facility at GSI with a cryogenic version have been presented [37].
Superfluid helium ion stopping medium
Underlying physics and mechanisms
The possibility of superfluid helium as stopping medium for ion catchers is inves-tigated. An overview of the properties of positive ions and electrons in superfluidhelium shows strikingly different behavior due to the different nature of their in-teractions with the ambient medium. This project concentrated on properties ofsnowballs such as their survival and extraction efficiencies. On the basis of the lit-erature survey on underlying physical processes the following observations couldbe made:
• The interaction of snowballs with the superfluid-vapor interface is not wellunderstood. If we believe that the potential barrier present is purely imagecharge character, there should be no change in barrier height with respect totemperature.
• The barrier height and location of the potential minimum at the superfluid-vapor interface depend strongly on the density profile of the interface. Anaccurate theoretical description of the extraction of positive ions and the sizeof the potential barrier is not available yet. For a more realistic image chargepotential barrier calculation one should include the actual density profile ofthe superfluid-vapor interface.
98 Conclusion and outlook
• The size of the snowball is comparable to the width of the interface. Thismay very well influence the extraction process. A detailed theoretical study isnecessary to understand the mechanism of positive ion extraction across thesuperfluid-vapor interface.
• When pushed towards the superfluid-vapor interface, electron bubbles ex-plode as a result of the combination of thermal motion and quantum tunnel-ing and release the bare electron into the vapor phase. This indicates that thestructure of the charged complex plays a key role in the extraction mechanism.
• An experimental study on extraction of alkaline earth metal ions from su-perfluid helium will give a more clear picture of the ion extraction processacross the superfluid-vapor interface. The role of quantum tunneling in theextraction can be ruled out due to large mass of the ions as compared to theelectron.
Key experimental observations
The main objective of the off-line experiments on superfluid helium was to studythe dependence of the survival of snowballs on applied electric fields and the de-pendence of their extraction across the superfluid-vapor interface on temperature.A new idea to enhance the extraction by evaporating the superfluid helium layercontaining the trapped ions and thus release them to the vapor phase is also ex-perimentally investigated. Key results from our experimental studies on superfluidhelium as ion stopping medium are:
• The survival of thermalized snowballs in superfluid helium depends stronglyon how fast they are transported out of the electron-rich region where theyare produced from slowed-down recoil ions. The snowball efficiency reachesa saturation value at sufficiently high electric fields. The electric field strengthneeded to reach saturation depends strongly on the ionization density.
• The exponential increase in the extraction efficiency of positive ions acrossthe superfluid-vapor interface above about 1.3 K with increasing temperatureindicates that the extraction is a thermally activated process. Our data yieldsa potential barrier of about 20 K.
• The extraction efficiency below about 1.3 K is constant and much larger thanthe extrapolation of the thermally activated extraction. This points to anothermechanism being dominant below 1.3 K.
• No clear explanation for the observed phenomenon related to second soundassisted evaporation of the superfluid surface layer is yet available as the phys-ical processes involved are unknown. One may speculate the trapping of ionsin the vortex tangle created by the second sound induced turbulence. A de-tailed theoretical study is necessary to help understand the results.
99
• The constant snowball efficiency for superfluid surface evaporation assistedby second sound pulses indicates that the number of ions trapped below thesurface layer remains constant regardless of the destruction of the extractionefficiency.
• Given extraction efficiencies of positive ions across the superfluid-vapor inter-face, superfluid helium can be used as a stopping medium for ions with highsnowball efficiencies. Snowball efficiencies between 5 to 30% observed fordifferent ionic species and an extraction efficiency of about 30% at 2 K givesa total efficiency between 1 to 10%. The high vapor density at higher tem-peratures is however not favorable for the fast transport of ions in the vaporphase.

Summary
Superfluid helium and cryogenic noble gases asstopping media for high-energy ions
Many scientific disciplines make use of radioactive ions in the form of a low-
energy ion beam or a cold ion or atom cloud. Since radioactive isotopesare often best produced at very high energy, techniques to transform high-energyions efficiently and quickly into low-energy ones are essential. In this context, theusefulness of superfluid helium and cryogenic noble gases was investigated.
The extreme purity of cryogenic noble gases allowed to demonstrate for thefirst time that the maximum efficiency in this kind of systems is determined bythe chance of survival of ions during slowing down. This principal limit, a fewtens of percent, is high enough to make the method of practical use. Experimentsin which high-density cryogenic helium was ionized by a proton beam show theimportance of a large electric field; a field that quickly pulls ions and electronsapart and thus prevents neutralization. We demonstrated that at high fields, themaximum efficiency is maintained at ionization densities many times larger thanachieved up to now with other systems.
Two mechanisms play a role in the extraction of ions out of superfluid helium:thermal excitation, which is strongly temperature dependent, and an as yet un-known temperature independent mechanism. The transition between these two liesat a temperature of about 1.3 Kelvin. The combined efficiency for ion survival inand extraction out of superfluid helium lies between 1 and 10 percent; high enoughfor practical applications.
101

Samenvatting
Supervloeibaar helium en cryogene edelgassen voor hetafremmen van hoogenergetische ionen
Veel wetenschappelijke disciplines maken gebruik van radioactieve isotopen inde vorm van een laagenergetische ionenbundel of een koude ionen- of ato-
menwolk. Omdat radioactieve isotopen vaak optimaal geproduceerd worden bijzeer hoge energieën zijn technieken om hoogenergetische ionen efficiënt en snelom te zetten in ionen met lage energie essentieel. In dit verband werd het nut vansupervloeibaar helium en cryogene edelgassen als afremmedia onderzocht.
Door de extreme zuiverheid van cryogene edelgassen kon voor het eerst wordenaangetoond dat de maximale efficiëntie in dit soort systemen bepaald wordt doorde overlevingskans van de ionen tijdens het afremmen. Deze principiële limietis met enkele tientallen procenten zo hoog dat de methode praktisch nut heeft.Experimenten waarbij cryogeen helium met hoge dichtheid wordt geïoniseerd dooreen protonenbundel tonen het belang van een hoog elektrisch veld aan; een velddat ionen en elektronen snel uit elkaar trekt en zodoende neutralisatie belemmert.Er werd aangetoond dat bij hoge velden de maximale efficiëntie behouden blijft bijionisatiedichtheden die vele malen hoger zijn dan tot nu toe met andere systemenwerd bereikt.
Bij de extractie van ionen uit supervloeibaar helium blijken twee mechanismeneen rol te spelen: thermische excitatie die sterk temperatuursafhankelijk is en eennog onbekend temperatuursonafhankelijk mechanisme. Het omslagpunt tussendeze twee ligt bij een temperatuur van ongeveer 1.3 Kelvin. De gecombineerdeefficientie voor het overleven van ionen in en extractie uit supervloeibaar heliumligt tussen 1 en 10 procent; hoog genoeg voor praktische toepassingen.
103


Acknowledgment
With the completion of this thesis, an immensely enriching phase of my lifecomes to a fruitful conclusion. Further, it is very gratifying to know that thekey results of this project are going to be implemented in a real application
and I would like to thank everybody who directly or indirectly helped me reachthis point.
In one way, this PhD thesis is a testimony to my love of Physics yet, this workcould not have been possible without the personal and professional support ofnumerous people. I am most indebted to Dr. Peter Dendooven for being a patientsupervisor and for his consistent support, guidance and never failing kindness. Heis responsible for involving me in the RIASH project in the first place. Peter andhis wife Liisa Heiman have always been there as good friends and I would like tothank Liisa, her care, support and hospitality during these years.
I would like to express my deep and sincere gratitude to my Promoter, Prof.Klaus Jungmann for his constant support and advice. Not a page has appeared inthis dissertation, which he has not read, reflected and commented on.
I owe a huge debt of gratitude to Prof. Kurt Gloos and Prof. Noriaki Takahashifor all their help, advice and enlightening insights. Their willingness to read andcomment on the manuscript is highly appreciated.
For having accepted to act as members of my Thesis reading committee, as wellas for their valuable suggestions and comments, I warmly thank Prof. Juha Äystö,Prof. Ronnie Hoekstra and Prof. Christoph Scheidenberger.
The help, cooperation and hospitality offered by the Jyväskylä crew, especiallyKari Peräjärvi, Antti Saastamoinen, Heikki Penttilä, Iain Moore and Tetsu Sonada isvery much appreciated. For facilitating the smooth running of on-line experiments,I would also like to acknowledge the contribution made by the mechanical work-shop, electronics department and cyclotron operators at the Department of Physics,University of Jyväskylä (JYFL), Finland.
I would like to thank the Director of KVI, Prof. Muhsin Harakeh for employingme at KVI. Many thanks to Prof. Rob Timmermans, Prof. Hans Wilsschut, Dr.
105
106 Acknowledgment
Gerco Onderwater and Dr. Lorenz Willmann for in depth discussions and support.I am especially grateful to the mechanical workshop, electronics, vacuum and ITdepartments for accommodating my off-schedule 4 pm requests. I would like tothank the personnel and financial departments for helping me through my unusualvisa scenarios. Hans Vorenholt, Harry Timersma, Michel Hevinga, Henk Kooi,Nanko de Vries, Ronald van Wooning, Imko Smid, Willem Olthuis, Hans Dost,Roelof Dussel, Jelke Wieringa, Henk Groter, Alfred Felzel, Hilde Landstra, Hildevan der Meer, I owe you a debt of gratitude. I would also like to thank MarjanKoopmans and Amarins Petitiaux for their excellent organization of the FANTOMstudy weeks.
Many thanks are also due to the many mentors, colleagues, and friends in theNetherlands I came across along the way. I am greatly indebted to Dr. Otto Muskensand Prof. Jaap Dijkhuis for providing me with the opportunity to do my Masterthesis at the Atom Optics & Ultrafast Dynamics group at Utrecht University. Theywere my original source of inspiration for coming to the Netherlands to advancemy education.
I met many wonderful people during my time at KVI. Ahmad, Albert, Alma, An-draey, Andrija, Aran, Dennis, Duurt, Elmaddin, Gabriel, Hossein , Hossein Moeini,Ileana, Leila, Lotje, Marlene, Manisha, Minh, Mohammad, Ola, Ruud, Sadia, Si-mona, Suresh, Sybren, Vanni, Victor and Wilbert, I owe you a bunch for keeping mein good spirits. Special thanks to Oscar Versolato. I am pleased that you acceptedto be my paranymph.
Special thanks to my “smoking room” mates, Johan Messchendorp, Tjalling Ni-jboer, Erwin Bodewits, Mohammad Babai, Alexander Usov and Petra Mossel, formany wonderful conversations we had.
My Keralite friends in Europe; they made here a home away from home. Abdul,Bahju and Achoos, with whom I have spent most of my free time, many thanksfor being there with me in my ups and downs. Noby, Neethu, Anthappan andImmochan, thanks for always keeping your door open for me. Rajiv, Miek, Mini andNaomi, thanks for having me as a member of your family. Sreeji, Divya, Achoos,and Aarchi thank you very much for the nice times together. Nibu, Sherin andTharun, Anaz, Shams, Reshmi, Jeena and Pradeep, Shibu and Prathibha, and allthose wonderful people I met during NANMA events, thanks for all those nicemoments we have had together. Prasanth, Aneesh, Jojo, Marina, Sony and Deepthi,you guys made my stay in Utrecht memorable. My heartfelt thanks to all myCUSAT mates for your support and nice times together. Vinu, Rajesh, Manesh,Mahesh, Abraham, Denny, Mercy, Reshmi, Jyotsna and Lee, thanks for being there,whenever needed.
I would also like to express my deep gratitude to all my teachers who havetaught me through the years. Though only a few of then I mention here byname. I am deeply indebted to Prof. Pappootty, Prof. Suresh, Dr. Ramakrish-nan, Dr. Narayanan, Abdunnur and Sasi from Government College, Madappally,Prof. Rameshbabu, Prof. Kuriakose, Prof. Sabir and Dr. Abdul Rasheed from

Acknowledgment 107
CUSAT for showing the beauty of physics and guiding me through.I have been fortunate in meeting many wonderful people who made my stay
in Groningen unforgettable. Far too many people to mention individually; but mysincere gratitude to them all. In particular, Sarah Dean, Andrea Scaramucci, SophieJaquier, Ana Moreno Monroy, Birgit Schwabl, Linda King, Marta Giulia, LaurenceBianchini, Mirre Boot, Julija Karpoviciute, Ana Lopera, Judit Hauber, Kim Roest,Myrte Cransberg, Joana Seixas, Ulrike Wegner, Christine Walsh, Jorn Veenstra,Tom Trummer, Edurne Jimenez, Tiago Brito, Gregor Schneider, Primoz Pirih, LeahBroussard, Magdalena Sucha, Julia Kleinschmidt, Sophia Zeschitz, Dieke Heer-schop, Anna Oshkalo, Carlos Reis, Christos Pashalidis, Ramesh, Iskander Theuns,Ajay Bailey, thanks for being there!. Special thanks to Annika Stritzke for alwaysbeing there as a “friend in need”. Anni, it means a lot to me that you will stand byme as a paranymph.
I would also like to thank my friends back home; Aneesh, Adheep, Sandesh,Dr. Sunil Kumar, Anu, Neethu, Nitin, Shibu, Navas, Binu, Ranjith (chimbu), Arunanand(Kidu), Abhinand, Gineesh, Saju, Lishma, Rajeesh (kuttan), Lalu, for helpingme get through the difficult times, and for all the emotional support, camaraderie,entertainment, and care they have provided.
These acknowledgments would not be complete without thanking my family fortheir support throughout my seemingly endless years in school. I thank my fatherPurushothaman, my mother Santha, my brother Arjun for standing by me for inwhatever I wanted to do. Their everlasting encouragement and love helped me seeit through calmly to the end. I also wish to extend my thanks to the family of mybetter half Maryam, especially Aliakbar Ghorbani, Fezzeh Mahmoudi and FahimehMahmoudi for their encouragement. And last but obviously not the least to myMaryam: Thank you for your patience, inspiration and love.
Groningen, November 2008

List of Figures
2.1 Density-normalized zero field electron mobilities µ0N in helium as afunction of temperature [88]. . . . . . . . . . . . . . . . . . . . . . . . . 6
2.2 Density-normalized zero-field mobility of electrons (µ0N) vs. gas num-ber density (N) of helium for various gas temperature values. . . . . . 7
2.3 Drift velocity vd and density-normalized mobility µN of electrons inhelium as a function of the ratio E/N [28, 82, 88]. . . . . . . . . . . . . 8
2.4 Maximum value of the ratio E/N which can define the value of µ0 ininert gases as a function of temperature. . . . . . . . . . . . . . . . . . 9
2.5 Electron temperature Te and characteristic energy 〈ε〉 for electrons inhelium as a function of the ratio E/N for gas temperatures Tg = 300 K,77 K, and 4.2 K as determined from measurements of Dt/µ [8, 36]. . . 10
2.6 Momentum transfer cross section σm of electrons in helium as a func-tion of the electron energy 〈ε〉 [28, 29, 75, 83]. . . . . . . . . . . . . . . 10
2.7 Ion current ratio (iHe+2 )/i(He+
3 ) as a function of E/N at 76 K and1.3 mbar (1.09× 1017 cm−3)[54]. . . . . . . . . . . . . . . . . . . . . . . . 15
2.8 The observed reduced mobility µred corresponding to an equilibriummixture of He+
2 , He+3 and He+
4 as a function of E/N at 77 K for fourvalues of neutral densities [54, 86]. . . . . . . . . . . . . . . . . . . . . . 15
2.9 Collisional radiative recombination rate coefficient α for rare gasesrecombining in helium as a function of helium density N [129]. . . . . 18
3.1 Specific heat capacity cp of liquid helium at saturated vapor pressureas a function of temperature T [14]. . . . . . . . . . . . . . . . . . . . . 22
3.2 Relative density of the normal and superfluid components in super-fluid helium as a function of temperature T [14]. . . . . . . . . . . . . . 22
3.3 Entropy S of superfluid helium as a function of temperature T [14]. . 233.4 Second sound velocity Css as a function of temperature T [14]. . . . . 233.5 Schematic representation of a snowball. . . . . . . . . . . . . . . . . . . 25
109
110 List of Figures
3.6 Schematic representation of a bubble. . . . . . . . . . . . . . . . . . . . 253.7 Variation in the density ρ of liquid helium near a localized point
charge [7]. . . . . . . . . . . . . . . . . . . . . . . . . . . . . . . . . . . . 263.8 Zero field mobilities µ0 of positive ions and electrons in liquid helium
as a function of inverse temperature 1/T [89]. . . . . . . . . . . . . . . 283.9 Drift velocity vd of positive and negative ions as a function of the
electric field E [17]. . . . . . . . . . . . . . . . . . . . . . . . . . . . . . . 293.10 The critical velocity vr for the production of vortex rings by positive
ions as a fucntion of normal-to-total density ratio ρn/ρ [17]. . . . . . . 293.11 Inverse relative mobilities µ−1
rel = µHe+ /µion of positive ions as afunction of temperature T. . . . . . . . . . . . . . . . . . . . . . . . . . . 30
3.12 Recombination coefficient of ions in superfluid helium αSF as a func-tion of the inverse temperature 1/T [21]. . . . . . . . . . . . . . . . . . 31
3.13 A point charge Q and the induced image charge Q′
(at the superfluidhelium-vapor interface). Fim is the image charge force experienced bythe point charge Q. QE is the electric force experienced by the pointcharge Q due to the applied electric field E . . . . . . . . . . . . . . . 33
3.14 Electric potential energy φ of a unit point charge Q as a function ofthe distance z from an abrupt superfluid-vapor helium interface. . . . 33
3.15 Spatial variation of the dielectric constant ε and the density ρ at asuperfluid-vapor helium interface. . . . . . . . . . . . . . . . . . . . . . 34
3.16 Image charge potential energy φim of a unit point charge calculatedfor the model interface demonstrated in Figure 3.15 [103]. . . . . . . . 35
4.1 Cryostat. . . . . . . . . . . . . . . . . . . . . . . . . . . . . . . . . . . . . 384.2 Experimental cell. . . . . . . . . . . . . . . . . . . . . . . . . . . . . . . . 434.3 Decay chain of 227Ac. . . . . . . . . . . . . . . . . . . . . . . . . . . . . . 454.4 Schematic diagram of 223Rn source preparation setup. . . . . . . . . . 464.5 A typical energy calibration plot. . . . . . . . . . . . . . . . . . . . . . . 474.6 A 215Po α-decay line fitted with a Gaussian line shape and a Gaussian
with low-energy exponential tail (see Equation 4.3). . . . . . . . . . . . 484.7 Gaussian with low-energy exponential tail for different distances dx
from its center to the start of its exponential tail. The low-energy tailarises from the energy loss due to multiple scattering. . . . . . . . . . 48
4.8 A typical α-particle energy spectrum and its analysis. . . . . . . . . . . 494.9 Ratio of the warm volume pressure (Pw) to the cold volume temper-
ature (Tc) as a function of Tc during cooling down, normalised to theratio before cooling down starts (P0/T0). . . . . . . . . . . . . . . . . . 52
4.10 Density relative to the room temperature value in the warm and coldvolumes as a function of the cold volume temperature Tc for differentwarm to cold volume ratios Vw/Vc. . . . . . . . . . . . . . . . . . . . . 53
List of Figures 111
4.11 Cold volume density nc/Vc relative to its room temperature value ata cold volume temperature Tc of 78 K as a function of warm to coldvolume ratio Vw/Vc. . . . . . . . . . . . . . . . . . . . . . . . . . . . . . 53
5.1 Photograph of the off-line experimental setup. . . . . . . . . . . . . . . 575.2 Schematic view of the off-line experimental cell. . . . . . . . . . . . . . 575.3 Measured efficiency εgas as a function of temperature T. . . . . . . . . 605.4 Efficiency for 219Rn ion survival and transport in helium gas over a
wide range of density, temperature and electric field in the vicinityof the 223Ra source. . . . . . . . . . . . . . . . . . . . . . . . . . . . . . . 61
5.5 Photograph of the on-line setup. . . . . . . . . . . . . . . . . . . . . . . 635.6 Schematic view of the on-line experimental cell. . . . . . . . . . . . . . 635.7 The combined efficiency of ion survival and transport as a function
of ionization rate density for different electric fields in the ioniza-tion region for temperatures 77 and 10 K and helium gas density0.18 mg cm−3. . . . . . . . . . . . . . . . . . . . . . . . . . . . . . . . . . 65
5.8 The combined efficiency of ion survival and transport as a functionof ionization rate density for different electric fields in the ioniza-tion region for temperature 10 K and helium gas densities 0.18 and0.54 mg cm−3. . . . . . . . . . . . . . . . . . . . . . . . . . . . . . . . . . 65
5.9 The combined efficiency of ion survival and transport as a functionof the ratio of induced to applied voltage. . . . . . . . . . . . . . . . . . 67
5.10 The combined efficiency of ion survival and transport as a functionof the relative recombination loss as calculated by Equation 5.3. . . . . 67
5.11 Electric field profile along the ion transport trajectory. Electrode po-sitions and the maximum voltages applied are marked on the topaxis. . . . . . . . . . . . . . . . . . . . . . . . . . . . . . . . . . . . . . . . 70
5.12 Schematic diagram of the electronics setup used for the mobility mea-surement. . . . . . . . . . . . . . . . . . . . . . . . . . . . . . . . . . . . . 71
5.13 Pulsing scheme used for the mobility measurement. . . . . . . . . . . . 715.14 Transported ion intensity as a function of transport window width
measured for helium, neon and argon. . . . . . . . . . . . . . . . . . . . 725.15 Measured reduced mobilities µred of 219Rn ions in helium, neon and
argon gases as a function of the ratio E/N. The buffer gas densitiesand temperatures used for the measurements are indicated in thelegend. . . . . . . . . . . . . . . . . . . . . . . . . . . . . . . . . . . . . . 73
6.1 Cross-sectional view of the experimental cells used in experiments Aand B. . . . . . . . . . . . . . . . . . . . . . . . . . . . . . . . . . . . . . . 79
6.2 Schematic representation of the 219Rn ion open source used in exper-iments A and B. . . . . . . . . . . . . . . . . . . . . . . . . . . . . . . . . 79
6.3 Snowball efficiency as a function of electric field at 1.15K. . . . . . . . 816.4 Snowball efficiency εsb as a function of the inverse temperature 1/T. . 82
112 List of Figures
6.5 Total efficiency ε f oil as a function of inverse temperature 1/T. . . . . . 826.6 Extraction efficiency εextr as a function of inverse temperature 1/T. . . 836.7 Snowball efficiency εsb as a function of electric field E at the source
for experiment A. The function εsatsb (1− KE−2) is fitted to the data. . . 84
6.8 Extraction efficiency εextr as a function of inverse temperature 1/T.The lines represent a constant plus an exponential function obtainedby fitting to the data points. . . . . . . . . . . . . . . . . . . . . . . . . . 86
6.9 (a) Schematic side view of the bottom electrode incorporated withthe second sound heater and top view of the second sound heater.(b) Photograph of the bottom electrode incorporated with the secondsound heater from the top. . . . . . . . . . . . . . . . . . . . . . . . . . . 89
6.10 Net evaporation mass flux as a function of the temperature variation∆TW at the second sound wave front for the bulk helium tempera-tures 1.74 K and 2.04 K (from [47]). . . . . . . . . . . . . . . . . . . . . . 90
6.11 Extraction efficiency εextr as a function of second sound pulse periodPss for the temperatures 1.15 K and 1.60 K . . . . . . . . . . . . . . . . 92
6.12 Snowball efficiency εsb as a function of second sound pulse periodPss for the temperatures 1.15 and 1.60 K. . . . . . . . . . . . . . . . . . 92
List of Tables
4.1 Isotopes in the 223Ra decay chain and their properties. . . . . . . . . . 454.2 Example of the typical energy loss experienced by alpha particles in
our experiments at temperatures 1.2 K and 1.6 K. . . . . . . . . . . . . 47
5.1 Reduced mobility of 219Rn ion in helium, neon and argon gases. . . . 735.2 Reduced mobility in the limit of vanishing electric field strength µred(0)
of ions with comparable masses to 219Rn in helium, neon and argongases. . . . . . . . . . . . . . . . . . . . . . . . . . . . . . . . . . . . . . . 74
5.3 Reduced mobility in the limit of vanishing electric field strength µred(0)of noble gas ions in helium, neon and argon gases at different tem-peratures T [39, 40, 41, 122] . . . . . . . . . . . . . . . . . . . . . . . . . 76
6.1 Saturation value of snowball efficiency εsatsb for different ions in su-
perfluid helium. . . . . . . . . . . . . . . . . . . . . . . . . . . . . . . . 85
113

List of Publications
1. P. Dendooven, S. Purushothaman, and K. Gloos. On a cryogenic noble gas ioncatcher. Nucl. Instrum. Methods. A, 558(2):580–583, 2006.
2. P. Dendooven, on behalf of the TRIµP group and the RIASH group. Newdevelopments in TRIµP and RIASH at KVI. Proceeding of the Frontiers inNuclear Structure, Astrophysics, and Reactions (FINUSTAR), Isle of Kos (Greece),12-17 September 2006. AIP Conf. Proc., 831:39-43, 2006.
3. P. Dendooven, S. Purushothaman, K. Gloos, J. Aysto, N. Takahashi, andW. X. Huang, Radioactive ions and atoms in superfluid helium. Proceeding ofthe Frontiers in Nuclear Structure, Astrophysics, and Reactions (FINUSTAR), Isleof Kos (Greece), 12-17 September 2006. AIP Conf. Proc., 831:39-43, 2006.
4. S. Purushothaman, P. Dendooven, I. Moore, H. Penttilä, J. Ronkainen, A. Saas-tamoinen, J. Äystö, K. Peräjärvi, N. Takahashi and K. Gloos. Cryogenic he-lium as stopping medium for high-energy ions. Proceeding of the Conferenceon Electromagnetic Isotope Separators and Techniques Related to their Applications(EMIS 2007), 24-29 June 2007, Deauville (France), Nucl. Instrum. Methods B,2008 (in press).
5. S. Purushothaman, K. Peräjärvi, M. Ranjan, A. Saastamoinen, K. Gloos,N. Takahashi, and P. Dendooven. Positive ion extraction across the superfluid-vapor helium interface. Proceeding of the 25th International Conference on LowTemperature Physics (LT25), 6-13 August 2008, Amsterdam (Netherlands), sub-mitted to J. Phys: Conf. Ser.
115

References
[1] J. F. Allen and A. D. Misener. Flow of liquid helium II. Nature, 141:75–75,1938.
[2] S. K. Allison. Experimental results on charge-changing collisions of hydrogenand helium atoms and ions at kinetic energies above 0.2 keV. Rev. Mod. Phys.,30(4):1137–1168, 1958.
[3] J. R. Alonso. Medical applications of nuclear physics and heavy-ion beams.Nucl. Phys. A, 685(1-4):454–471, 2001.
[4] L. L. Alves and C. M. Ferreira. Electron kinetics in weakly ionized heliumunder dc and hf applied electric fields. J. Phys. D, 24(4):581–592, 1991.
[5] F. Ancilotto and F. Toigo. Properties of an electron bubble approaching thesurface of liquid helium. Phys. Rev. B, 50(17):12820–12830, 1994.
[6] J. Ärje, J. Äystö, P. Taskinen, J. Honkanen, and K. Valli. Ion guide method foron-line isotope separation. Nucl. Instrum. Methods A, 26(1-3):384–393, 1987.
[7] K. R. Atkins. Ions in liquid helium. Phys. Rev., 116(6):1339–1343, 1959.
[8] V. M. Atrazhev. Delocalisation of electrons in dense helium gas by externalelectric feild. J. Phys. D, 17(5):889–902, 1984.
[9] J. Äystö. Development and applications of the igisol technique. Nucl. Phys. A,693(1-2):477–494, 2001.
[10] R. Barrera and G. Baym. Roton-limited mobility of ions in superfluid He4.Phys. Rev. A, 6(4):1558–1566, 1972.
[11] A. Bartels. Density dependence of electron drift velocities in helium andhydrogen at 77.6 K. Appl. Phys. A, 8(1):59–64, 1975.
117
118 References
[12] D. R. Bates. Classical theory of electron-ion recombination in an ambient gas.J. Phys. B, 13(13):2587–2599, 1980.
[13] M. Beau, H. Gunther, G. zu Putlitz, and B. Tabbert. Atoms and ions in super-fluid helium. Z. Phys. B, 101(2):253–262, 1996.
[14] J. S. Brooks and R. J. Donnelly. The calculated thermodynamic properties ofsuperfluid helium-4. J. Phys. Chem. Ref. Data, 6(1):51–104, 1977.
[15] L. Bruschi, B. Maraviglia, and F. E. Moss. Measurement of a barrier for theextraction of excess electrons from liquid helium. Phys. Rev. Lett., 17(13):682–684, 1966.
[16] L. Bruschi, P. Mazzoldi, and M. Santini. Periodic critical velocities of ions inliquid helium II. Temperature dependence. Phys. Rev., 167(1):203–214, 1968.
[17] L. Bruschi, P. Mazzoldi, and M. Santini. Positive ions in liquid helium II. Thecritical velocity for creation of vortex rings. Phys. Rev. Lett., 21(26):1738–1740,1968.
[18] A. G. Cade. Binding of positive-ion complexes to vortex rings in liquid-heliumII. Phys. Rev. Lett., 15(6):238–239, 1965.
[19] Y. S. Cao and R. Johnsen. Neutral-stabilized electron-ion recombination inambient helium gas. J. Chem. Phys., 94(8):5443–5446, 1991.
[20] G. Careri, S. Cunsolo, and P. Mazzoldi. Periodic discontinuities in the driftvelocity of ions in liquid helium II. Phys. Rev., 136(2A):303–310, 1964.
[21] G. Careri and F. Gaeta. Ionic recombination in liquid helium. Il Nuovo Cimento,20(1):152–160, 1961.
[22] S. Chandrasekhar. Stochastic problems in physics and astronomy. Rev. Mod.Phys., 15(1):1–89, 1943.
[23] E. Cheng, M. W. Cole, and M. H. Cohen. Binding of electrons to the surfaceof liquid helium. Phys. Rev. B, 50(2):1136–1142, 1994.
[24] J. Classen, C. K. Su, M. Mohazzab, and H. J. Maris. Electrons and cavitationin liquid helium. Phys. Rev. B, 57(5):3000–3010, 1998.
[25] M. W. Cole and R. A. Bachman. Structure of positive impurity ions in liquidhelium. Phys. Rev. B, 15(3):1388–1394, 1977.
[26] C. B. Collins, H. S. Hicks, W. E. Wells, and R. Burton. Measurement of therate coefficient for the recombination of He+ with electrons. Phys. Rev. A,6(4):1545–1558, 1972.
[27] C. A. Colmenares. Bakeable ionization chamber for low-level tritium count-ing. Nucl. Instrum. Methods, 114(2):269–275, 1974.
References 119
[28] R. W. Crompton, M. T. Elford, and R. L. Jory. The momentum transfer crosssection for electrons in helium. Aust. J. Phys., 20(4):369–400, 1967.
[29] R. W. Crompton, M. T. Elford, and A. G. Robertson. The momentum transfercross section for electrons in helium derived from drift velocities at 77K.Aust. J. Phys., 23(5):667–681, 1970.
[30] D. A. Dahl. SIMION for the personal computer in reflection. Int. J. MassSpectrom., 200(1-3):3–25, 2000.
[31] D. de Klerk, R. P. Hudson, and J. R. Pellam. Second sound propagation below1K. Phys. Rev., 93(1):28–37, 1954.
[32] R. Deloche, P. Monchicourt, M. Cheret, and F. Lambert. High-pressure heliumafterglow at room temperature. Phys. Rev. A, 13(3):1140–1176, 1976.
[33] J. F. Delpech and J. C. Gauthier. Electron-ion recombination in cryogenichelium plasmas. Phys. Rev. A, 6(5):1932–1939, 1972.
[34] P. Dendooven. The development and status of the IGISOL technique. Nucl.Instrum. Methods B, 126(1-4):182–189, 1997.
[35] A. S. Dickinson, M. S. Lee, and L. A. Viehland. The mobility of He+ ions inhelium gas. J. Phys. B, 32(20):4919–4930, 1999.
[36] J. Dutton. A survey of electron swarm data. J. Phys. Chem. Ref. Data, 4(3):577–856, 1975.
[37] S. Eliseev, M. Block, M. Dworschak, F. Herfurth, H. J. Kluge, A. Martin,C. Rauth, and G. Vorobjev. A new cryogenic gas-filled stopping chamberfor SHIPTRAP. Nucl. Instrum. Methods B, In Press, Corrected Proof, 2008.
[38] S. A. Eliseev, M. Block, A. Chaudhuri, Z. Di, D. Habs, F. Herfurth, H. J. Kluge,J. B. Neumayr, W. R. Plaß, C. Rauth, P. G. Thirolf, G. Vorobjev, and Z. Wang.Extraction efficiency and extraction time of the SHIPTRAP gas-filled stoppingcell. Nucl. Instrum. Methods B, 258(2):479–484, 2007.
[39] H. W. Ellis, E. W. McDaniel, D. L. Albritton, L. A. Viehland, S. L. Lin, andE. A. Mason. Transport properties of gaseous ions over a wide energy range,Part II. At. Data Nucl. Data Tables, 22(3):179–217, 1978.
[40] H. W. Ellis, E. W. McDaniel, D. L. Albritton, L. A. Viehland, S. L. Lin, andE. A. Mason. Transport properties of gaseous ions over a wide energy range,Part III. At. Data Nucl. Data Tables, 31(1):113–151, 1984.
[41] H. W. Ellis, R. Y. Pai, E. W. McDaniel, E. A. Mason, and L. A. Viehland.Transport properties of gaseous ions over a wide energy range. At. Data Nucl.Data Tables, 17(3):177–210, 1976.
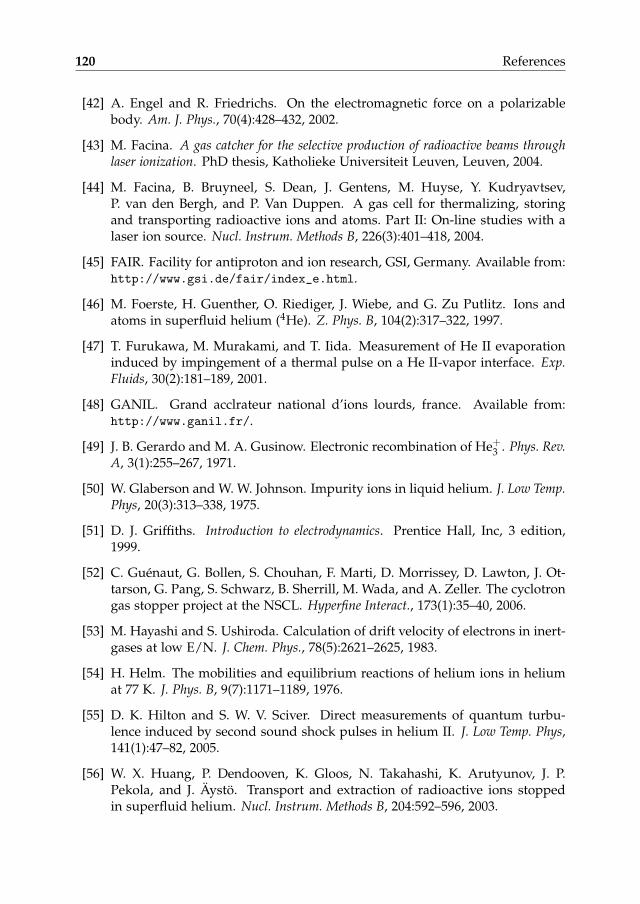
120 References
[42] A. Engel and R. Friedrichs. On the electromagnetic force on a polarizablebody. Am. J. Phys., 70(4):428–432, 2002.
[43] M. Facina. A gas catcher for the selective production of radioactive beams throughlaser ionization. PhD thesis, Katholieke Universiteit Leuven, Leuven, 2004.
[44] M. Facina, B. Bruyneel, S. Dean, J. Gentens, M. Huyse, Y. Kudryavtsev,P. van den Bergh, and P. Van Duppen. A gas cell for thermalizing, storingand transporting radioactive ions and atoms. Part II: On-line studies with alaser ion source. Nucl. Instrum. Methods B, 226(3):401–418, 2004.
[45] FAIR. Facility for antiproton and ion research, GSI, Germany. Available from:http://www.gsi.de/fair/index_e.html.
[46] M. Foerste, H. Guenther, O. Riediger, J. Wiebe, and G. Zu Putlitz. Ions andatoms in superfluid helium (4He). Z. Phys. B, 104(2):317–322, 1997.
[47] T. Furukawa, M. Murakami, and T. Iida. Measurement of He II evaporationinduced by impingement of a thermal pulse on a He II-vapor interface. Exp.Fluids, 30(2):181–189, 2001.
[48] GANIL. Grand acclrateur national d’ions lourds, france. Available from:http://www.ganil.fr/.
[49] J. B. Gerardo and M. A. Gusinow. Electronic recombination of He+3 . Phys. Rev.
A, 3(1):255–267, 1971.
[50] W. Glaberson and W. W. Johnson. Impurity ions in liquid helium. J. Low Temp.Phys, 20(3):313–338, 1975.
[51] D. J. Griffiths. Introduction to electrodynamics. Prentice Hall, Inc, 3 edition,1999.
[52] C. Guénaut, G. Bollen, S. Chouhan, F. Marti, D. Morrissey, D. Lawton, J. Ot-tarson, G. Pang, S. Schwarz, B. Sherrill, M. Wada, and A. Zeller. The cyclotrongas stopper project at the NSCL. Hyperfine Interact., 173(1):35–40, 2006.
[53] M. Hayashi and S. Ushiroda. Calculation of drift velocity of electrons in inert-gases at low E/N. J. Chem. Phys., 78(5):2621–2625, 1983.
[54] H. Helm. The mobilities and equilibrium reactions of helium ions in heliumat 77 K. J. Phys. B, 9(7):1171–1189, 1976.
[55] D. K. Hilton and S. W. V. Sciver. Direct measurements of quantum turbu-lence induced by second sound shock pulses in helium II. J. Low Temp. Phys,141(1):47–82, 2005.
[56] W. X. Huang, P. Dendooven, K. Gloos, N. Takahashi, K. Arutyunov, J. P.Pekola, and J. Äystö. Transport and extraction of radioactive ions stoppedin superfluid helium. Nucl. Instrum. Methods B, 204:592–596, 2003.
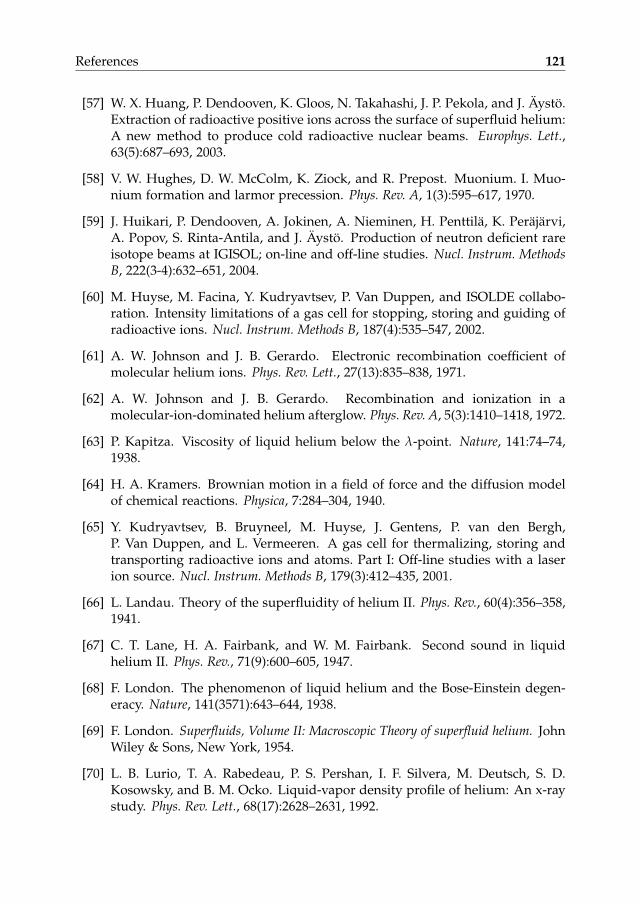
References 121
[57] W. X. Huang, P. Dendooven, K. Gloos, N. Takahashi, J. P. Pekola, and J. Äystö.Extraction of radioactive positive ions across the surface of superfluid helium:A new method to produce cold radioactive nuclear beams. Europhys. Lett.,63(5):687–693, 2003.
[58] V. W. Hughes, D. W. McColm, K. Ziock, and R. Prepost. Muonium. I. Muo-nium formation and larmor precession. Phys. Rev. A, 1(3):595–617, 1970.
[59] J. Huikari, P. Dendooven, A. Jokinen, A. Nieminen, H. Penttilä, K. Peräjärvi,A. Popov, S. Rinta-Antila, and J. Äystö. Production of neutron deficient rareisotope beams at IGISOL; on-line and off-line studies. Nucl. Instrum. MethodsB, 222(3-4):632–651, 2004.
[60] M. Huyse, M. Facina, Y. Kudryavtsev, P. Van Duppen, and ISOLDE collabo-ration. Intensity limitations of a gas cell for stopping, storing and guiding ofradioactive ions. Nucl. Instrum. Methods B, 187(4):535–547, 2002.
[61] A. W. Johnson and J. B. Gerardo. Electronic recombination coefficient ofmolecular helium ions. Phys. Rev. Lett., 27(13):835–838, 1971.
[62] A. W. Johnson and J. B. Gerardo. Recombination and ionization in amolecular-ion-dominated helium afterglow. Phys. Rev. A, 5(3):1410–1418, 1972.
[63] P. Kapitza. Viscosity of liquid helium below the λ-point. Nature, 141:74–74,1938.
[64] H. A. Kramers. Brownian motion in a field of force and the diffusion modelof chemical reactions. Physica, 7:284–304, 1940.
[65] Y. Kudryavtsev, B. Bruyneel, M. Huyse, J. Gentens, P. van den Bergh,P. Van Duppen, and L. Vermeeren. A gas cell for thermalizing, storing andtransporting radioactive ions and atoms. Part I: Off-line studies with a laserion source. Nucl. Instrum. Methods B, 179(3):412–435, 2001.
[66] L. Landau. Theory of the superfluidity of helium II. Phys. Rev., 60(4):356–358,1941.
[67] C. T. Lane, H. A. Fairbank, and W. M. Fairbank. Second sound in liquidhelium II. Phys. Rev., 71(9):600–605, 1947.
[68] F. London. The phenomenon of liquid helium and the Bose-Einstein degen-eracy. Nature, 141(3571):643–644, 1938.
[69] F. London. Superfluids, Volume II: Macroscopic Theory of superfluid helium. JohnWiley & Sons, New York, 1954.
[70] L. B. Lurio, T. A. Rabedeau, P. S. Pershan, I. F. Silvera, M. Deutsch, S. D.Kosowsky, and B. M. Ocko. Liquid-vapor density profile of helium: An x-raystudy. Phys. Rev. Lett., 68(17):2628–2631, 1992.
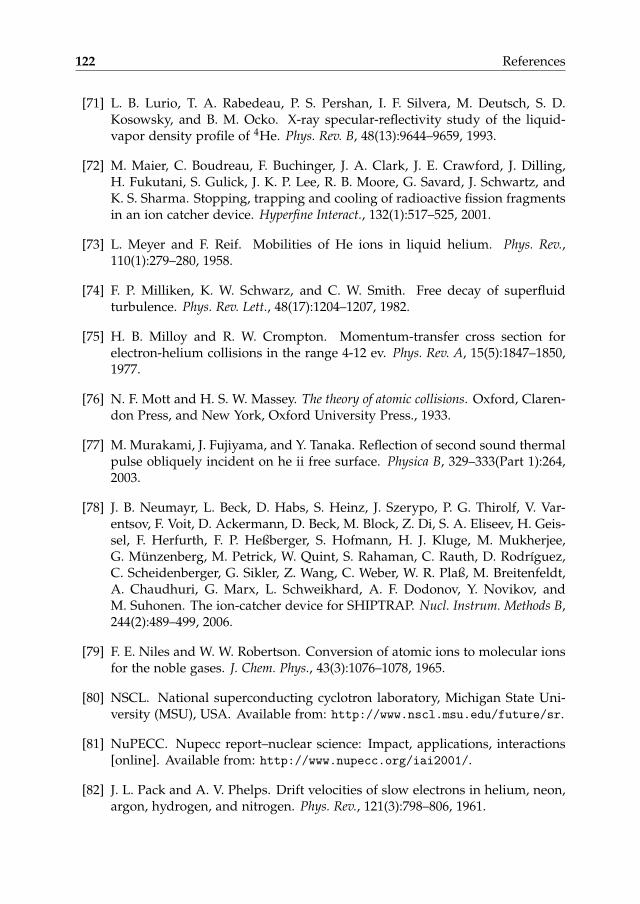
122 References
[71] L. B. Lurio, T. A. Rabedeau, P. S. Pershan, I. F. Silvera, M. Deutsch, S. D.Kosowsky, and B. M. Ocko. X-ray specular-reflectivity study of the liquid-vapor density profile of 4He. Phys. Rev. B, 48(13):9644–9659, 1993.
[72] M. Maier, C. Boudreau, F. Buchinger, J. A. Clark, J. E. Crawford, J. Dilling,H. Fukutani, S. Gulick, J. K. P. Lee, R. B. Moore, G. Savard, J. Schwartz, andK. S. Sharma. Stopping, trapping and cooling of radioactive fission fragmentsin an ion catcher device. Hyperfine Interact., 132(1):517–525, 2001.
[73] L. Meyer and F. Reif. Mobilities of He ions in liquid helium. Phys. Rev.,110(1):279–280, 1958.
[74] F. P. Milliken, K. W. Schwarz, and C. W. Smith. Free decay of superfluidturbulence. Phys. Rev. Lett., 48(17):1204–1207, 1982.
[75] H. B. Milloy and R. W. Crompton. Momentum-transfer cross section forelectron-helium collisions in the range 4-12 ev. Phys. Rev. A, 15(5):1847–1850,1977.
[76] N. F. Mott and H. S. W. Massey. The theory of atomic collisions. Oxford, Claren-don Press, and New York, Oxford University Press., 1933.
[77] M. Murakami, J. Fujiyama, and Y. Tanaka. Reflection of second sound thermalpulse obliquely incident on he ii free surface. Physica B, 329–333(Part 1):264,2003.
[78] J. B. Neumayr, L. Beck, D. Habs, S. Heinz, J. Szerypo, P. G. Thirolf, V. Var-entsov, F. Voit, D. Ackermann, D. Beck, M. Block, Z. Di, S. A. Eliseev, H. Geis-sel, F. Herfurth, F. P. Heßberger, S. Hofmann, H. J. Kluge, M. Mukherjee,G. Münzenberg, M. Petrick, W. Quint, S. Rahaman, C. Rauth, D. Rodríguez,C. Scheidenberger, G. Sikler, Z. Wang, C. Weber, W. R. Plaß, M. Breitenfeldt,A. Chaudhuri, G. Marx, L. Schweikhard, A. F. Dodonov, Y. Novikov, andM. Suhonen. The ion-catcher device for SHIPTRAP. Nucl. Instrum. Methods B,244(2):489–499, 2006.
[79] F. E. Niles and W. W. Robertson. Conversion of atomic ions to molecular ionsfor the noble gases. J. Chem. Phys., 43(3):1076–1078, 1965.
[80] NSCL. National superconducting cyclotron laboratory, Michigan State Uni-versity (MSU), USA. Available from: http://www.nscl.msu.edu/future/sr.
[81] NuPECC. Nupecc report–nuclear science: Impact, applications, interactions[online]. Available from: http://www.nupecc.org/iai2001/.
[82] J. L. Pack and A. V. Phelps. Drift velocities of slow electrons in helium, neon,argon, hydrogen, and nitrogen. Phys. Rev., 121(3):798–806, 1961.
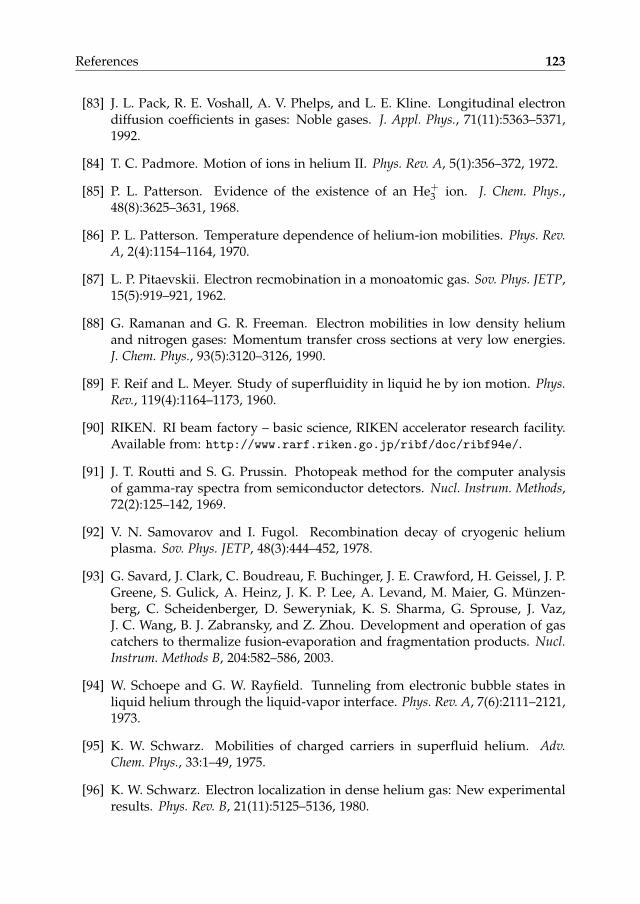
References 123
[83] J. L. Pack, R. E. Voshall, A. V. Phelps, and L. E. Kline. Longitudinal electrondiffusion coefficients in gases: Noble gases. J. Appl. Phys., 71(11):5363–5371,1992.
[84] T. C. Padmore. Motion of ions in helium II. Phys. Rev. A, 5(1):356–372, 1972.
[85] P. L. Patterson. Evidence of the existence of an He+3 ion. J. Chem. Phys.,
48(8):3625–3631, 1968.
[86] P. L. Patterson. Temperature dependence of helium-ion mobilities. Phys. Rev.A, 2(4):1154–1164, 1970.
[87] L. P. Pitaevskii. Electron recmobination in a monoatomic gas. Sov. Phys. JETP,15(5):919–921, 1962.
[88] G. Ramanan and G. R. Freeman. Electron mobilities in low density heliumand nitrogen gases: Momentum transfer cross sections at very low energies.J. Chem. Phys., 93(5):3120–3126, 1990.
[89] F. Reif and L. Meyer. Study of superfluidity in liquid he by ion motion. Phys.Rev., 119(4):1164–1173, 1960.
[90] RIKEN. RI beam factory – basic science, RIKEN accelerator research facility.Available from: http://www.rarf.riken.go.jp/ribf/doc/ribf94e/.
[91] J. T. Routti and S. G. Prussin. Photopeak method for the computer analysisof gamma-ray spectra from semiconductor detectors. Nucl. Instrum. Methods,72(2):125–142, 1969.
[92] V. N. Samovarov and I. Fugol. Recombination decay of cryogenic heliumplasma. Sov. Phys. JETP, 48(3):444–452, 1978.
[93] G. Savard, J. Clark, C. Boudreau, F. Buchinger, J. E. Crawford, H. Geissel, J. P.Greene, S. Gulick, A. Heinz, J. K. P. Lee, A. Levand, M. Maier, G. Münzen-berg, C. Scheidenberger, D. Seweryniak, K. S. Sharma, G. Sprouse, J. Vaz,J. C. Wang, B. J. Zabransky, and Z. Zhou. Development and operation of gascatchers to thermalize fusion-evaporation and fragmentation products. Nucl.Instrum. Methods B, 204:582–586, 2003.
[94] W. Schoepe and G. W. Rayfield. Tunneling from electronic bubble states inliquid helium through the liquid-vapor interface. Phys. Rev. A, 7(6):2111–2121,1973.
[95] K. W. Schwarz. Mobilities of charged carriers in superfluid helium. Adv.Chem. Phys., 33:1–49, 1975.
[96] K. W. Schwarz. Electron localization in dense helium gas: New experimentalresults. Phys. Rev. B, 21(11):5125–5136, 1980.
124 References
[97] S. W. V. Sciver. Helium cryogenic. Plenum Press, New York, 1986.
[98] J. Sharpe. Nuclear radiation detectors. John Wiley & Sons, New York, 1955.
[99] V. B. Shikin. Mobility of charges in liquid, solid, and dense gaseous helium.Sov. phys. usp., 20(3):226–248, 1977.
[100] T. Shimoda, H. Miyatake, S. Mitsuoka, Y. Mizoi, H. Kobayashi, M. Sasaki,T. Shirakura, H. Ueno, H. Izumi, K. Asahi, T. Murakami, S. Morinobu, andN. Takahashi. Preservation of nuclear spin polarization of 12B in superfluid.Nucl. Phys. A, 588(1):235–239, 1995.
[101] W. T. Sommer. Liquid helium as a barrier to electrons. Phys. Rev. Lett.,12(11):271–273, 1964.
[102] R. D. Stambaugh. Part one. Muonium formation in noble gases and negative muonpolarization in helium. Part two. Precision eighth-order solenoid. PhD thesis, YaleUniversity, 1974.
[103] F. Stern. Image potential near a gradual interface between two dielectrics.Phys. Rev. B, 17(12):5009–5015, 1978.
[104] C. M. Surko and F. Reif. Evidence for a new kind of energetic neutral excita-tion in superfluid helium. Phys. Rev. Lett., 20(12):582–585, 1968.
[105] C. M. Surko and F. Reif. Investigation of a new kind of energetic neutralexcitation in superfluid helium. Phys. Rev., 175(1):229–241, 1968.
[106] N. Takahashi. Condensed-matter nuclear physics with radioactive beamssnowballs in superfluid helium. Acta Phys. Pol., 28(1-2):41–46, 1997.
[107] N. Takahashi. Radioactive charge carriers in liquid helium created from fastnuclear beams. Fizika B, 12(2):135–144, 2003.
[108] N. Takahashi, W. X. Huang, K. Gloos, P. Dendooven, J. P. Pekola, and J. Äystö.Production of zero energy radioactive beams through extraction across super-fluid helium surface. Physica B, 329-333(Part 2):1596–1597, 2003.
[109] N. Takahashi, T. Shigematsu, S. Shimizu, K. Horie, Y. Hirayama, H. Izumi,and T. Shimoda. Impurities in superfluid helium detected via radioactivity.Physica B, 284-288(1):89–90, 2000.
[110] N. Takahashi and T. Shimoda. Physics of snowballs - Impurity ions in superfluidhelium in Nucleon-Hadron Many Body System. Oxford Science Publications,1999.
[111] N. Takahashi, T. Shimoda, Y. Fujita, T. Itahashi, and H. Miyatake. Snowballs ofradioactive ions - nuclear spin polarization of core ions. Z. Phys. B, 98(3):347–351, 1995.
References 125
[112] N. Takahashi, T. Shimoda, H. Miyatake, S. Mitsuoka, Y. Mizoi, H. Kobayashi,M. Sasaki, T. Shirakura, H. Ueno, K. Asahi, and S. Morinobu. Freezing-out ofnuclear polarization in radioactive core ions of microclusters, "snowballs" insuperfluid helium. Hyperfine Interact., 97-98(1):469–477, 1996.
[113] A. Takamine, M. Wada, Y. Ishida, T. Nakamura, K. Okada, Y. Yamazaki,T. Kambara, Y. Kanai, T. M. Kojima, Y. Nakai, N. Oshima, A. Yoshida, T. Kubo,S. Ohtani, K. Noda, I. Katayama, P. Hostain, V. Varentsov, and H. Wollnik.Space-charge effects in the catcher gas cell of a rf ion guide. Rev. Sci. Instrum.,76(10):1035031–1035036, 2005.
[114] J. J. Thomson. Recombination of gaseous ions, the chemical combination ofgases, and monomolecular reactions. Philos. Mag, 47:337–378, 1924.
[115] L. Tisza. Transport phenomena in helium II. Nature, 141(3577):913–913, 1938.
[116] W. Trimble, G. Savard, B. Blank, J. A. Clark, F. Buchinger, T. Cocolios, J. E.Crawford, A. Frankel, J. P. Greene, S. Gulick, J. K. P. Lee, A. Levand, M. Por-tillo, K. S. Sharma, J. C. Wang, B. J. Zabransky, and Z. Zhou. Development andfirst on-line tests of the RIA gas catcher prototype. Nucl. Phys. A, 746:415–418,2004.
[117] A. van der Woude. Impact and applications of nuclear science: Opportunitiesand perspectives. Nucl. Phys. A, 583:51–60, 1995.
[118] R. J. van Sonsbeek, R. Cooper, and R. N. Bhave. Pulse radiolysis studies ofion-electron recombination in helium. pressure and temperature effects. J.Chem. Phys., 97(3):1800–1808, 1992.
[119] J. Vervier, J. Äystö, S. Doubre, H.and Galés, G. Morrison, G.and Ricco,D. Schwalm, and K. G. E. Nupecc report – nuclear physics in Europe: High-lights and opportunities [online]. Available from: http://www.nupecc.org/iai2001/.
[120] L. A. Viehland and E. A. Mason. On the relation between gaseous ion mobilityand diffusion coefficients at arbitrary electric field strengths. J. Chem. Phys.,63(7):2913–2915, 1975.
[121] L. A. Viehland and E. A. Mason. Gaseous ion mobility and diffusion in electricfields of arbitrary strength. Ann. Phys., 110(2):287–328, 1978.
[122] L. A. Viehland and E. A. Mason. Transport properties of gaseous ions over awide energy range, part IV. At. Data Nucl. Data Tables, 60(1):37–95, 1995.
[123] W. F. Vinen and J. J. Niemela. Quantum turbulence. J. Low Temp. Phys,128(5):167–231, 2002.
126 References
[124] M. Wada, Y. Ishida, T. Nakamura, A. Takamine, Y. Yamazaki, T. Kambara,H. Ohyama, Y. Kanai, T. M. Kojima, Y. Nakai, A. Yoshida, T. Kubo, Y. Matsuo,Y. Fukuyama, K. Okada, T. Sonoda, S. Ohtani, H. Kawakami, and I. Katayama.On-line collection of 8Li ions from the projectile fragment separator using anrf ion guide system (II). RIKEN Accel. Prog. Rep., 36, 2003.
[125] M. Wada, Y. Ishida, T. Nakamura, Y. Yamazaki, T. Kambara, H. Ohyama,Y. Kanai, T. M. Kojima, Y. Nakai, N. Ohshima, A. Yoshida, T. Kubo, Y. Mat-suo, Y. Fukuyama, K. Okada, T. Sonoda, S. Ohtani, K. Noda, H. Kawakami,and I. Katayama. Slow RI-beams from projectile fragment separators. Nucl.Instrum. Methods B, 204:570–580, 2003.
[126] M. Wada, Y. Yamazaki, T. Kambara, , Y. Kanai, T. M. Kojima, Y. Nakai,A. Ishida, N. Ohshima, T. Kubo, A. Yoshida, I. Katayama, T. Nakamura,K. Okada, H. Iimura, H. Wollnik, H. A. Schuessler, and V. Varentsov. Theuniversal slow RI-beam facility (SLOWRI) [online]. Available from: https://ribf.riken.jp/RIBF-TAC05/12_SLOWRI-mac.pdf.
[127] Wavemetrics Inc. Igor pro 6. Available from: http://www.wavemetrics.com/products/igorpro/igorpro.htm.
[128] L. Weissman, D. J. Morrissey, G. Bollen, D. A. Davies, E. Kwan, P. A. Lofy,P. Schury, S. Schwarz, C. Sumithrarachchi, T. Sun, and R. Ringle. Conversionof 92 MeV/u 38Ca/37K projectile fragments into thermalized ion beams. Nucl.Instrum. Methods A, 540(2-3):245–258, 2005.
[129] B. L. Whitten, L. W. Downes, and W. E. Wells. Collisional radiative recom-bination in high-pressure noble gas mixtures. J. Appl. Phys., 52(3):1255–1258,1981.
[130] L. Willmann, G. P. Berg, U. Dammalapati, S. De, P. Dendooven, O. Dermois,K. Jungmann, A. Mol, C. J. G. Onderwater, A. Rogachevskiy, M. Sohani,E. Traykov, and H. W. Wilschut. Aspects of cooling at the TRIµP facility. InBeam cooling and related topics, volume 821 of AIP Conf. Proc., pages 523–527,2006.
[131] J. F. Ziegler, J. P. Biersack, and U. Littmark. The stopping and range of ions insolids, volume 1. Pergamon Press Inc., New York, 1985.


