Embed Size (px)
Citation preview
120 R. Kampf et al: The Application of ABC Analysis to...
The Application of ABC Analysis to Inventories in the Automatic Industry Utilizing the Cost Saving EffectPrimjena ABC analize za inventar u automatiziranoj proizvodnji koristeći učinak uštede troškova
KEY WORDScost managementinventories management systemABC analysisautomotive industry
DOI 10.17818/NM/2016/SI8UDK 629.33:338.45Preliminary communication / Prethodno priopćenjePaper accepted / Rukopis primljen: 21. 3. 2016.
KLJUČNE RIJEČImenadžment troškovasustav menadžmenta inventaraABC analizaautomobilska industrija
Rudolf KampfFaculty of Technology Institute of Technology and Business in České BudějoviceCzech Republic e-mail: [email protected]
Silvia LorincováDepartment of Business EconomicsFaculty of Wood Sciences and TechnologyTechnical University in ZvolenSlovak Republice-mail: [email protected]
Miloš HitkaDepartment of Business EconomicsFaculty of Wood Sciences and TechnologyTechnical University in ZvolenSlovak Republice-mail: [email protected]
Zdeněk CahaDepartment of ManagementFaculty of Corporate StrategyInstitute of Technology and Business in České Budějovice, Czech Republice-mail: [email protected]
SummaryThe highest levels of management work towards profit maximization, trying to achieve the lowest possible costs and the highest possible revenues. Managers in the automotive industry have the same goal. Nowadays, the automotive industry in Slovakia is based on direct foreign investments. The industry is a key sector and is considered to be the driving force behind the development of the whole economy. ABC Analysis is one of the tools that enable companies to control their costs. It provides detailed information that enables the monitoring of how resources have been utilized within a company. It enables the management to evaluate whether costs correspond with the purpose of their spending. For this research ABC analysis was applied to the conditions within the automotive industry with the aim of utilizing the effect of cost savings. On the basis of the research and statistical calculations a proposal is put forward that enables companies to reduce their costs bound in the inventories. The new system of inventories management will enable company managements to utilize the saved money in another way and to achieve further optimization of the processes.
SažetakNajviša razina u menadžmentu teži maksimizaciji profita, pokušavajući postići najmanje moguće troškove i najveće moguće prihode. Menađeri u automobilskoj industriji imaju isti cilj. Dandanas, automobilska industrija u Slovačkoj temeljena je na izravnim stranim ulaganjima. Proizvodnja je ključni sektor i smatra se da je pokretačka snaga razvoja cjelokupne ekonomije. ABC analiza je jedan od alata koji omogućavaju kompanijama kako kontrolirati svoje troškove. Ona pruža menadžmentu mogućnost evaluacije nadziranja kako su resursi korišteni unutar kompanije. Omogućava menadžmentu procijeniti jesu li troškovi u skladu sa svrhom njihove potrošnje. U cilju ovoga istraživanja ABC analiza je primijenjena na uvjete unutar automobilske industrije s ciljem korištenja efekta uštede troškova. Na temelju istraživanja i statističkih kalkulacija, postavljen je prijedlog koji omogućava kompanijama da smanje troškove koji su u inventaru. Novi sustav menadžmenta inventara omogućit će menadžmentu kompanije koristiti ušteđeni novac na drugi način i postići daljnju optimizaciju procesa.
1. INTRODUCTIONEvery business looks for ways to save. In addition, the current financial crisis is putting pressure on companies to reduce costs. In this context, the necessity to optimise company systems has become imperative [1], [2]. Závadský et al. [3] and Tokarčíková et al. [4] take a similar view. They state that the economic crisis has initiated some optimisation and organisational restructuring in companies. The economic crisis is not alone in stimulating change. The highly competitive environment within the market economy
is forcing business entities to achieve ever greater efficiencies in their processes [5]. The same tendencies also affect the automotive industry, which is based on direct foreign investments. According to Kucharčíková et al. [6], foreign direct investment represents the characteristics of the current globalization of economic, political and social processes in the world.
Activity-Based Costing, also referred to as ABC Analysis, is one of the methods by which automotive companies can manage
121“Naše more” 63(3)/2016., pp. 120-125
costs, and is being widely discussed in western countries [7]. According to Kupkovič and Tóth [8], Activity-Based Costing (ABC Analysis) is a new managerial system for costing, budgeting and accounting, in both a practical and technical way, which represents the causal relationship between the creation of outputs and the activities that would consume the company´s resources to do so. According to Potkány and Petruš [9], the main idea behind the ABC analysis is the fact that activities and not individual outputs are considered to be the cause of costs. ABC Analysis provides detailed information that enables companies to monitor how resources have been utilized within the company, which in turn enables the management to evaluate whether the costs correspond with the purpose of their spending. ABC Analysis enables the more effective management of resources by pointing out the causes of the cost occurrence [10]. As not all the material inputs are of the same importance for a company, these inputs are divided according to their relative proportion in the whole value, according to the quantity, consumption frequency, etc., into groups A, B and C. The main focus of attention is on the group that is of the greatest importance to the company [11]. ABC Analysis also helps to determine costs with regards to different calculation objects, not only products, but also for example, distribution routes, customers, services, etc. This provides the opportunity to utilise additional tools for decision making e.g. analysis of profitability of customers. Výrostová [7] suggests that the method has a significantly higher application in that the method enables us to understand the activity of a particular organization through the processes that are going on within the organization, and in particular how it manages these processes (or activities). The main goal of this paper is to apply ABC analysis to inventories in the automotive industry and to design an inventory management system that is able to reduce costs within the industry.
2. APPLICATION OF ABC ANALYSIS TO INVENTORIES IN THE AUTOMOTIVE INDUSTRY UTILIZING THE COST SAVING EFFECTThe proposed inventory management system designed for the automotive industry was tested at a subcontracted company. The company specializes in designing and manufacturing a wide range of special tools, single-purpose machines and technological components for production lines for the rationalisation and automation of manufacturing processes designed for the automotive industry. A welding jig, a part of a welding device on an automated line is the subject of the optimization of the inventory management system. The jig, designed for use in the automotive industry, consists of 14 components (see Table 1), which can be classified as Category A in terms of the ABC analysis of inventories i.e. material that forms a substantial part of the jig.
The value of Category A materials required for the manufacture of the jig for the automotive industry is EUR 8,740. However, as can be seen in Table 1, the total value of inventories as of 31/12/2015 was EUR 10,860. This means that, other materials aside, the components for the manufacture of the jig account for 80.48% of the total volume of purchased materials. The other materials have only a small influence on the inventories. Their monitoring is often ineffective in terms of time and costs. It is for this reason that only Category A materials are the subject of this research.
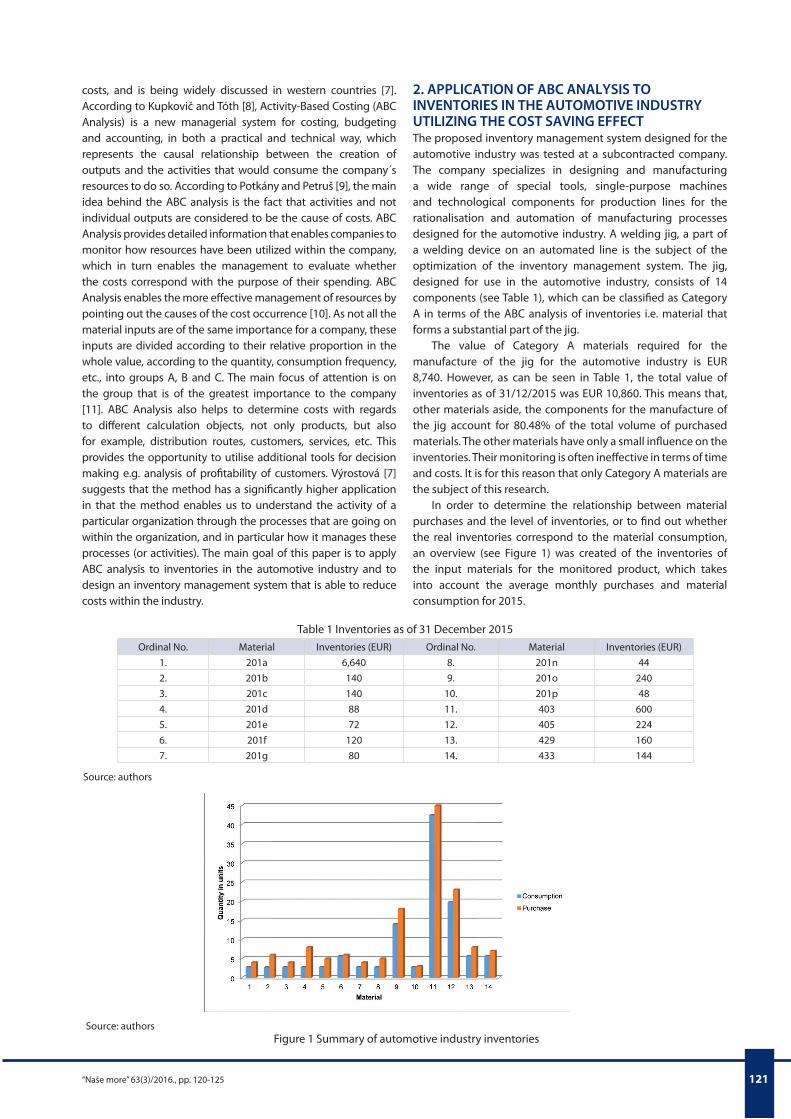
In order to determine the relationship between material purchases and the level of inventories, or to find out whether the real inventories correspond to the material consumption, an overview (see Figure 1) was created of the inventories of the input materials for the monitored product, which takes into account the average monthly purchases and material consumption for 2015.
Table 1 Inventories as of 31 December 2015Ordinal No. Material Inventories (EUR) Ordinal No. Material Inventories (EUR)
1. 201a 6,640 8. 201n 442. 201b 140 9. 201o 2403. 201c 140 10. 201p 484. 201d 88 11. 403 6005. 201e 72 12. 405 2246. 201f 120 13. 429 1607. 201g 80 14. 433 144
Source: authors
Source: authorsFigure 1 Summary of automotive industry inventories
122 R. Kampf et al: The Application of ABC Analysis to...
The overview of the inventories of input materials confirms the disparity between the actual consumption and the quantities of materials purchased on average every month. The consequence of this disparity is that there is an unnecessarily high proportion of capital tied up in the inventories. This offers an opportunity to reduce the inventories.
In 2015, the consumption of the components necessary for the production of the jig fluctuated from month to month depending on the demand in the automotive industry.
For 2016, a 15% growth in demand is expected. This fact affects the assumed consumption of the individual types of material, the expected monthly consumption and the standard deviation.
In 2016, the material consumption for the manufacture of the jig is likely to equal the expected average monthly consumption. The probability that the consumption values will differ is very low. The probability of the occurrence of the given values will decrease with their distance from the average. This fact would only be worth considering if the expected monthly consumption were lower than the requirements for the material. In the opposite case, all the customers could be satisfied. On the basis of these assumptions, we assigned probability values to
the values of the held inventories, for which the consumption would not exceed the specified quantity and the probability values, and for which the consumption would exceed the specified quantity, which would lead to a deficit.
Table 4 shows the quantities of materials that enable the demand to be satisfied. The deviation coverage rate is then: - coverage rate 1 gives the probability of coverage of the
consumption of inventories 82.13%, - coverage rate 1.5 gives the probability of coverage of the
consumption of inventories 92.23 %, - coverage rate 2 gives the probability of coverage of the
consumption of inventories 96.67 %.Further coverage rates are not discussed because of the
high demand for the inventories. With regards to the values of consumption in 2015 and the planned increase in demand i.e. estimated 15%, it is proposed to maintain inventories that are able to satisfy 92.23% of the consumption.
On the basis of a delivery term of 9 days (the period between placing the order for the material(s) and its receipt at the store), we determined the signal inventory, namely by the coefficient 9/30 (for a 30-day month). We rounded the ordered quantity up to whole units because of the delivery conditions and because
Table 2 Materials consumption in 2015
Material / month 1. 2. 3. 4. 5. 6. 7. 8. 9. 10. 11. 12.
Total consumption in 2015 (units)
Average monthly consumption
(units)
Standard deviation
201a 2 2 4 4 2 4 2 2 4 4 2 2 34 2.8 1.031201b 2 2 4 4 2 4 2 2 4 4 2 2 34 2.8 1.031201c 2 2 4 4 2 4 2 2 4 4 2 2 34 2.8 1.031201d 2 2 4 4 2 4 2 2 4 4 2 2 34 2.8 1.031201e 2 2 4 4 2 4 2 2 4 4 2 2 34 2.8 1.031201f 4 4 8 8 4 8 4 4 8 8 4 4 68 5.7 2.059201g 2 2 4 4 2 4 2 2 4 4 2 2 34 2.8 1.031201n 2 2 4 4 2 4 2 2 4 4 2 2 34 2.8 1.031201o 10 10 20 20 10 20 10 10 20 20 10 10 170 14.1 5.149201p 2 2 4 4 2 4 2 2 4 4 2 2 34 2.8 1.031403 30 30 60 60 30 60 30 30 60 60 30 30 510 42.5 15.447405 14 14 28 28 14 28 14 14 28 28 14 14 238 19.8 7.209429 4 4 8 8 4 8 4 4 8 8 4 4 68 5.7 2.059433 4 4 8 8 4 8 4 4 8 8 4 4 68 5.7 2.059
Source: authors
Table 3 Material consumption growth
Material Total consumption for 2015
Expected consumption
growth
Expected total consumption
Expected average monthly consumption
Elevated standard deviation
201a 34 15% 39.1 3.26 1.185201b 34 15% 39.1 3.26 1.185201c 34 15% 39.1 3.26 1.185201d 34 15% 39.1 3.26 1.185201e 34 15% 39.1 3.26 1.185201f 68 15% 78.2 6.51 2.368201g 34 15% 39.1 3.26 1.185201n 34 15% 39.1 3.26 1.185201o 170 15% 195.5 16.29 5.921201p 34 15% 39.1 3.26 1.185403 510 15% 586.5 45.87 17.764405 238 15% 273.7 22.81 8.29429 68 15% 78.2 6.51 2.368433 68 15% 78.2 6.51 2.368
Source: authors
123“Naše more” 63(3)/2016., pp. 120-125
the materials are supplied as a whole. In this way we determined the optimum size of supply for 2016 as well as the optimum time to place an order (see Table 5).
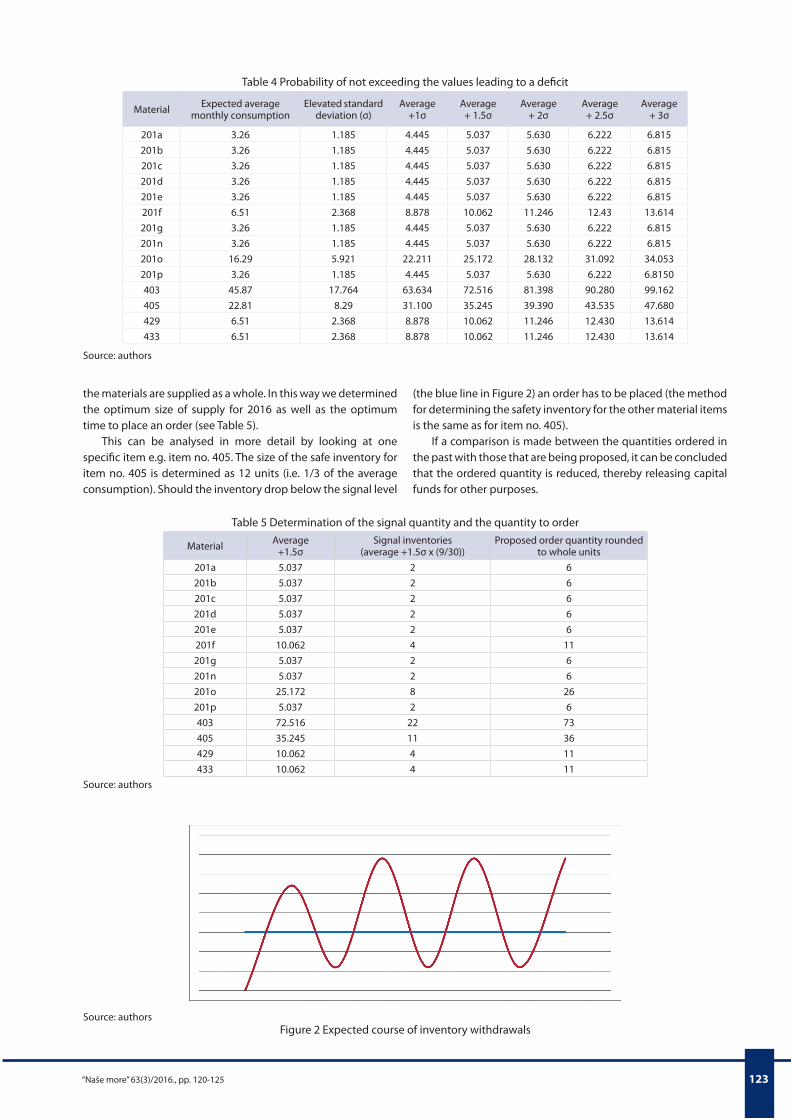
This can be analysed in more detail by looking at one specific item e.g. item no. 405. The size of the safe inventory for item no. 405 is determined as 12 units (i.e. 1/3 of the average consumption). Should the inventory drop below the signal level
(the blue line in Figure 2) an order has to be placed (the method for determining the safety inventory for the other material items is the same as for item no. 405).
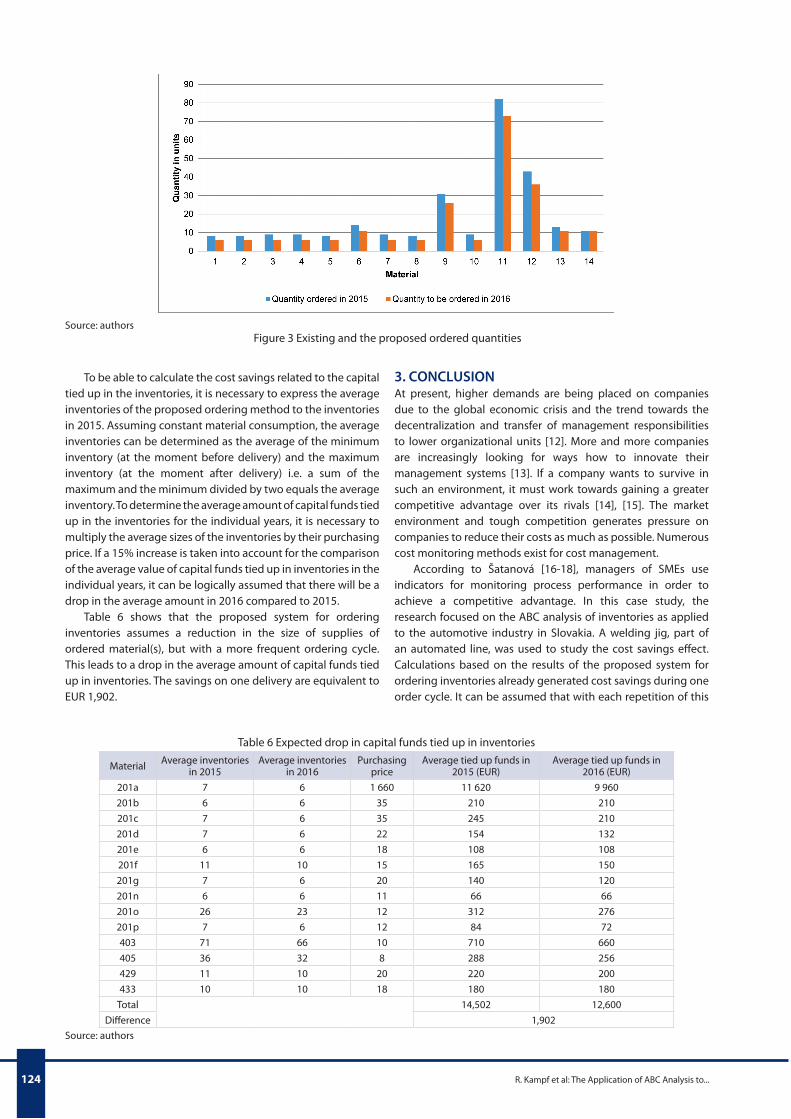
If a comparison is made between the quantities ordered in the past with those that are being proposed, it can be concluded that the ordered quantity is reduced, thereby releasing capital funds for other purposes.
Table 4 Probability of not exceeding the values leading to a deficit
Material Expected average monthly consumption
Elevated standard deviation (σ)
Average +1σ
Average + 1.5σ
Average + 2σ
Average + 2.5σ
Average + 3σ
201a 3.26 1.185 4.445 5.037 5.630 6.222 6.815201b 3.26 1.185 4.445 5.037 5.630 6.222 6.815201c 3.26 1.185 4.445 5.037 5.630 6.222 6.815201d 3.26 1.185 4.445 5.037 5.630 6.222 6.815201e 3.26 1.185 4.445 5.037 5.630 6.222 6.815201f 6.51 2.368 8.878 10.062 11.246 12.43 13.614201g 3.26 1.185 4.445 5.037 5.630 6.222 6.815201n 3.26 1.185 4.445 5.037 5.630 6.222 6.815201o 16.29 5.921 22.211 25.172 28.132 31.092 34.053201p 3.26 1.185 4.445 5.037 5.630 6.222 6.8150403 45.87 17.764 63.634 72.516 81.398 90.280 99.162405 22.81 8.29 31.100 35.245 39.390 43.535 47.680429 6.51 2.368 8.878 10.062 11.246 12.430 13.614433 6.51 2.368 8.878 10.062 11.246 12.430 13.614
Source: authors
Table 5 Determination of the signal quantity and the quantity to order
Material Average +1.5σ
Signal inventories (average +1.5σ x (9/30))
Proposed order quantity rounded to whole units
201a 5.037 2 6201b 5.037 2 6201c 5.037 2 6201d 5.037 2 6201e 5.037 2 6201f 10.062 4 11201g 5.037 2 6201n 5.037 2 6201o 25.172 8 26201p 5.037 2 6403 72.516 22 73405 35.245 11 36429 10.062 4 11433 10.062 4 11
Source: authors
Source: authorsFigure 2 Expected course of inventory withdrawals
124 R. Kampf et al: The Application of ABC Analysis to...
To be able to calculate the cost savings related to the capital tied up in the inventories, it is necessary to express the average inventories of the proposed ordering method to the inventories in 2015. Assuming constant material consumption, the average inventories can be determined as the average of the minimum inventory (at the moment before delivery) and the maximum inventory (at the moment after delivery) i.e. a sum of the maximum and the minimum divided by two equals the average inventory. To determine the average amount of capital funds tied up in the inventories for the individual years, it is necessary to multiply the average sizes of the inventories by their purchasing price. If a 15% increase is taken into account for the comparison of the average value of capital funds tied up in inventories in the individual years, it can be logically assumed that there will be a drop in the average amount in 2016 compared to 2015.
Table 6 shows that the proposed system for ordering inventories assumes a reduction in the size of supplies of ordered material(s), but with a more frequent ordering cycle. This leads to a drop in the average amount of capital funds tied up in inventories. The savings on one delivery are equivalent to EUR 1,902.
Source: authorsFigure 3 Existing and the proposed ordered quantities
3. CONCLUSIONAt present, higher demands are being placed on companies due to the global economic crisis and the trend towards the decentralization and transfer of management responsibilities to lower organizational units [12]. More and more companies are increasingly looking for ways how to innovate their management systems [13]. If a company wants to survive in such an environment, it must work towards gaining a greater competitive advantage over its rivals [14], [15]. The market environment and tough competition generates pressure on companies to reduce their costs as much as possible. Numerous cost monitoring methods exist for cost management.
According to Šatanová [16-18], managers of SMEs use indicators for monitoring process performance in order to achieve a competitive advantage. In this case study, the research focused on the ABC analysis of inventories as applied to the automotive industry in Slovakia. A welding jig, part of an automated line, was used to study the cost savings effect. Calculations based on the results of the proposed system for ordering inventories already generated cost savings during one order cycle. It can be assumed that with each repetition of this
Table 6 Expected drop in capital funds tied up in inventories
Material Average inventories in 2015
Average inventories in 2016
Purchasing price
Average tied up funds in 2015 (EUR)
Average tied up funds in 2016 (EUR)
201a 7 6 1 660 11 620 9 960201b 6 6 35 210 210201c 7 6 35 245 210201d 7 6 22 154 132201e 6 6 18 108 108201f 11 10 15 165 150201g 7 6 20 140 120201n 6 6 11 66 66201o 26 23 12 312 276201p 7 6 12 84 72403 71 66 10 710 660405 36 32 8 288 256429 11 10 20 220 200433 10 10 18 180 180
Total 14,502 12,600Difference 1,902
Source: authors
125“Naše more” 63(3)/2016., pp. 120-125
cycle further cost reductions can be realised, thereby releasing valuable capital funds for other purposes that would otherwise be tied up in inventories. Higher cost effectivity compared to other companies also puts these companies one step ahead of their competitors [18-20].
REFERENCES[1] Nemec, F., S. Lorincová, M. Potkány, D. Raušer. A proposal for the Optimization
of Storage Areas in a Selected Enterprises. Nase more, 2015, Vol. 62 (Special issue). pp. 131-138. ISSN 0469-69255. http://dx.doi.org/10.17818/NM/2015/SI3
[2] Gregorio, J., G. Russo, L. V. Lapao. Pharmaceutical services cost analysis using time-driven activity-based costing: A contribution to improve community pharmacies’ management. Research in Social and Administrative Pharmacy, 2015, pp. 1-11. http://dx.doi.org/10.1016/j.sapharm.2015.08.004
[3] Závadský, J., M. Hitka, M. Potkány. Changes of employee motivation of Slovak enterprises due to global economic crisis. Ekonomie a management, 2015, Vol. 18. pp. 57-66. ISSN 1212-3609. http://dx.doi.org/10.15240/tul/001/2015-1-005
[4] Tokarčíková, E., V. Bartošová, A. Kucharčíková, M. Ďurišová. Automotive Company‘s social responsibility in Slovakia. Proceedings of the 24th International Business Information Management Association Conference - Crafting Global Competitive Economies: 2020 Vision Strategic Planning and Smart Implementation, 2014, pp. 2118-2127.
[5] Droździel, P., Komsta, H., Krzywonos, L. Repair costs and the intensity of vehicle use. Problemy Transportu/Transport Problems, 2013, Vol. 8, Issue 3, pp. 131-138. ISSN 1896-0596.
[6] Kucharčíková, A., E. Tokarčíková, J. Klučka, J. Konušíková. Foreign direct investment: Impact on sustainable development in regions of Slovak republic. Journal of Security and Sustainability Issues, 2015, Vol. 5, No. 1, pp. 59-71. ISSN 2029-7017. Doi: 10.9770/jssi.2015.5.1(5). http://dx.doi.org/10.9770/jssi.2015.5.1(5)
[7] Výrostová, E. ABC/M - Jedna z moderných metód riadenia nákladov. Manažment v teórii a praxi, 2007, Vol. 3, No. 1-2, pp. 20-29. ISSN 1336-7137.
[8] Kupkovič, M., M. Tóth. Comparison of full absorption costing to activity based costing (abc). Ekonomický časopis, 2004, Vol. 52, No. 2.
[9] Potkány, M., P. Petruš. Possibilities of outsourcing utilization by the application of abc calculation in the Slovak wood processing industry. Intercathedra 21, 2005, p. 108-111. ISSN 1640-3622.
[10] Yoshikawa, T. Contemporary Cost Management. London: Chapman & Hall, 1993, 175 p. ISBN 0-412-45210-3.
[11] Jackova, A., Chodasova, Z. Cost analysis and method ABC. Ekonomicko-manazerske spectrum, 2011, Vol. 5, No 2, pp. 103-108. ISSN 1337-0839.
[12] Mihok, J., J. Vidová, J. Janeková. Podnikové hospodárstvo – ekonomika podniku. Košice: Edícia študijnej literatúry, 2007, 212 p. ISBN 978-80-8073-766-5.
[13] Potkány, M. System for establishing intradepartmental prices in Slovak wood processing industry. Drvna industrija, 2005, Vol. 56, No. 4, pp. 177-188. ISSN 0012-6772. ISSN 1847-1153. Doi:10.5552/drind. http://dx.doi.org/10.5552/drind
[14] Kubasakova, I., Simkova, I., Krzywonos, L., Nieoczym, A. The national strategy of logistics and transport in Slovakia. In: Logi - Scientific Journal on Transport and Logistics, 2015, Vol. 6, No. 1, pp. 67-79, ISSN 1804-3216.
[15] Potkány, M., A. Hajduková, K. Teplická. Target costing calculation in the woodworking industry to support demand at a time of global recession. Drewno, 2012, Vol. 187, pp. 89-104. ISSN 1644-3985.
[16] Hitka, M., Kotlínová, M., Štípalová, L. Optimization of the stock in the company Continental automotive systems Slovakia, Ltd. Logi: scientific journal on transport and logistics, 2010, Vol. 1, No. 1, pp. 53-60. ISSN 1804-3216.
[17] Simkova, I., Konecny, V. Key performance indicators in logistics and road transport. In: Logi - Scientific Journal on Transport and Logistics, 2014, Vol. 5, No. 2, pp. 87-96, ISSN 1804-3216.
[18] Simkova, I., Konecny, V., Liscak, S., Stopka, O. Measuring the quality impacts on the performance in transport company. In: Transport Problems, 2015, Vol. 10, No. 3, pp. 113-124. ISSN 1896-0596.
[19] Šatanová, A., Závadský, J., Sedliačiková, M., Potkány, M., Závadská, Z. How Slovak small and medium manufacturing enterprises maintain quality costs: an empirical study and proposal for a suitable model. Total quality management & business excellence, 2015, Vol. 26, No. 11-12, pp. 1146-1160. ISSN 1478-3363.


