Embed Size (px)
Citation preview
EARTH SURFACE PROCESSES AND LANDFORMSEarth Surf. Process. Landforms (2012)Copyright © 2012 John Wiley & Sons, Ltd.Published online in Wiley Online Library(wileyonlinelibrary.com) DOI: 10.1002/esp.3266
Application of 210Pbex inventories to measure nethillslope erosion at burned sitesLauren M. Perreault,1* Elowyn M. Yager1 and Rolf Aalto21 Center for Ecohydraulics Research, University of Idaho, Boise, ID, USA2 Geography, College of Life and Environmental Sciences, University of Exeter, Exeter, UK
Received 1 November 2011; Revised 7 April 2012; Accepted 24 April 2012
*Correspondence to: LaurenM. Perreault, Center for Ecohydraulics Research, University of Idaho, 322 E. Front Street, Boise, ID 83702, USA. E-mail: [email protected]
ABSTRACT: Fallout radionuclides, including lead-210 excess (210Pbex), have been broadly and successfully used to quantify nethillslope sediment transport in agricultural, pastoral and forested landscapes but have only recently been applied in burned terrain.Quantifying post-fire erosion is important because fires can amplify hillslope erosion, impacting terrestrial and aquatic habitat andwater quality. However, we lack a basic understanding of the fate of 210Pbex in fires. To address this knowledge gap, we collectedover 400 soil samples from unburned, moderately and severely burned forested sites in central Idaho. We measured soil 210Pbexcontent at stable reference and eroding sites and in mineral and organic soil components. At all sites, organic matter had the highestconcentration of 210Pbex, representing 30% to 73% of the total activity. At the severely and moderately burned sites, 210Pbexreference inventories were lower by 58% and 41%, with about 40% less organic mass, relative to the unburned site. These resultsindicate that most 210Pbex in our semi-arid, forested sites was bound to organic matter, and that a substantial portion of this leadwas lost due to forest fires. These losses likely occurred through volatilization and wind transport of smoke and ash. In the moderatelyburned site, 210Pbex losses were more spatially variable, potentially due to spatially uneven fire intensity and effects. Despite equalpercent losses of 210Pbex, lower inventories at the burned sites produced lower calculated net erosion rates relative to the unburnedsite. Thus, given methodological uncertainties, 210Pbex losses due to fire, and the subsequent sensitivity of calculated net erosionrates to these lower 210Pbex inventories, we suggest this method should not be used in burned terrain to calculate absolute net erosionand deposition rates. However, within a given burned site, 210Pbex inventories still provide useful information describing relative soillosses and storage across the landscape. Copyright © 2012 John Wiley & Sons, Ltd.
KEYWORDS: erosion; radionuclides; wildfire; geomorphology; 210Pb
Introduction
Forest fires can profoundly affect hillslope erosion rates byphysically and chemically altering soil properties and denudingvegetation (Neary et al., 1999; Shakesby and Doerr, 2006, andreferences cited therein). Increased post-fire erosion can stripnutrients from soil (e.g. Neary et al., 1999; Gimeno-Garciaet al., 2000), increase suspended sediment loads (e.g. Malmonet al., 2007; Moody and Martin, 2009), change channelmorphology (e.g. Benda and Dunne, 1997; Benda et al.,2003), alter aquatic habitat (e.g. Minshall, 2003; Dunhamet al., 2007; Arkle et al., 2010) and increase downstreamsediment delivery rates to reservoirs (e.g. Reneau et al., 2007).Despite the many impacts of such erosion events, post-fireerosion rates remain elusive to quantify and predict. A particularchallenge has been to upscale point-erosion rates to representhillslope or catchment scale sediment yields (Shakesby andDoerr, 2006).In recent decades, 137Cs (cesium-137) and 210Pbex (lead-210
excess) have been increasingly used to quantify net hillslopeerosion rates (Mabit et al., 2008). However, because of declining137Cs inventories (a man-made radionuclide deposited frommid-century atmospheric testing of nuclear weapons), 210Pbex
inventories are becoming more commonly utilized to measureerosion rates (Walling and He, 1999a). A naturally occurringradionuclide, 210Pb (half-life 22�3years) derives from the uraniumdecay series. Although there are numerous additional short-lived,intermediate isotopes, the decay series can be generalized asfollows:
Uranium� 238 ¼> Uranium� 234 ¼> Thorium� 230¼> Radium� 226 ¼> Radon� 222¼> Lead� 210 ¼> Polonium� 210
Of the total amount of 210Pb found in a given soil sample, aportion is ‘supported,’ or in equilibrium, with its progenitor226Ra (radium-226, half-life 1622years). An intermediateradionuclide, 222Rn (radon-222, half-life 3�82days), decays from226Ra in soils. Some 222Rn diffuses out of the soil into theatmosphere where it decays to 210Pb via a series of short-livedintermediate radionuclides; the 210Pb is then deposited via rainor dry fallout (e.g. Nozaki et al., 1978). The concentration of222Rn in the atmosphere – and hence rate of 210Pb fallout – at agiven location is essentially constant when averaged over annualor longer timescales (Appleby, 2008). The atmosphericallydeposited 210Pb is in ‘excess’ of the in situ progenitor 226Ra, and
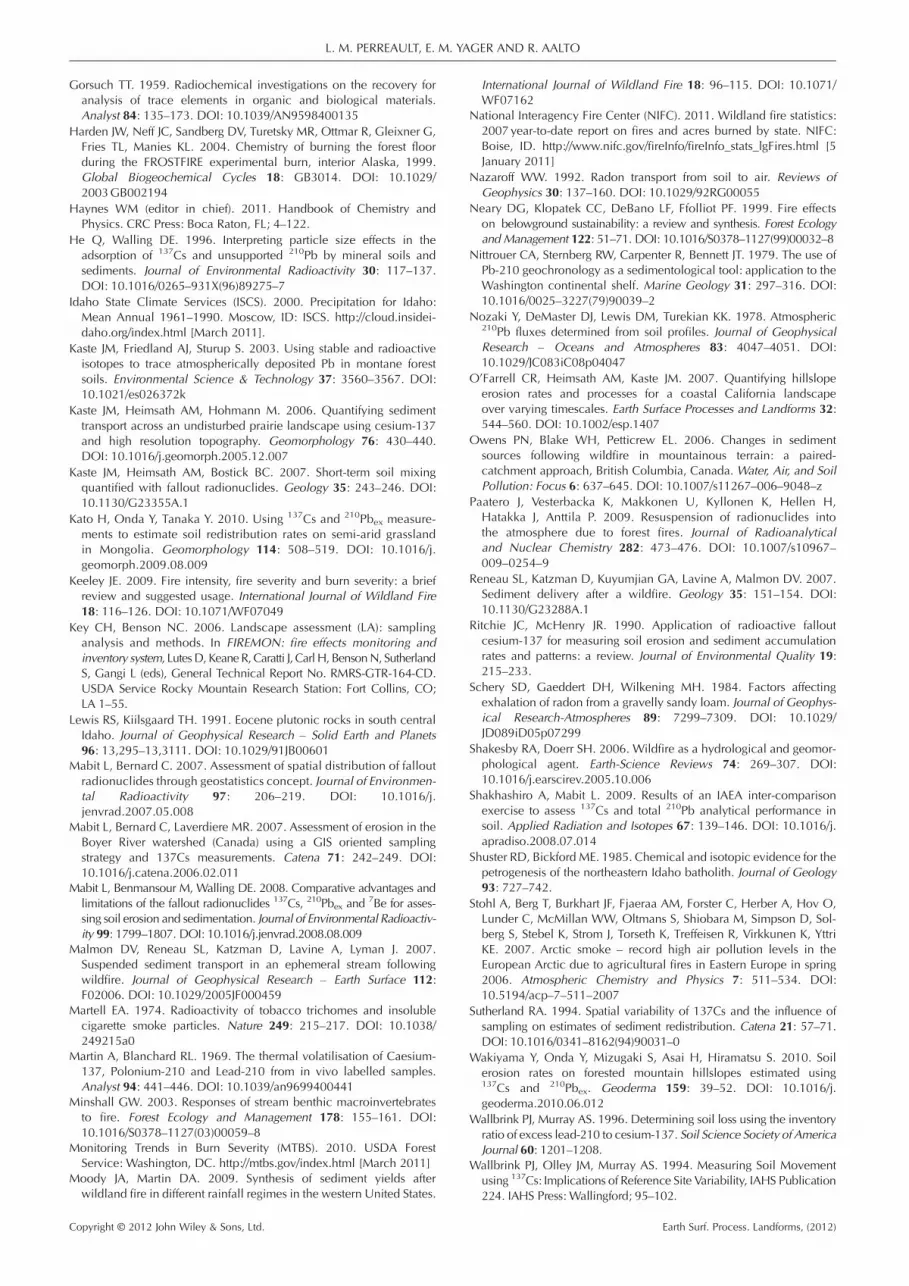
igure 1. Study site location. Fire perimeters and location of studyites with state of Idaho inset.
L. M. PERREAULT, E. M. YAGER AND R. AALTO
thus termed 210Pbex. Once deposited, 210Pbex adsorbs strongly toorganic and mineral material and becomes essentially immobilein the soil profile (e.g. Nozaki et al., 1978). Hence, subsequentredistribution of 210Pbex in a landscape primarily reflects theerosion and deposition of the soil material to which it adheres.The excess component of the total 210Pb inventory (total concen-tration) can therefore be used to construct net sediment transferbudgets. The use of 137Cs to develop sediment budgets is describedin detail by Ritchie andMcHenry (1990), and reviewed for 210Pbexby Mabit et al. (2008).Using 210Pbex inventories requires measuring a mean inven-
tory at a stable reference location (non-eroding or depositingfor at least 60–100 years before sampling), and comparing thisinventory to the total 210Pbex on a hillslope site (e.g. Wallinget al., 2003). A net gain in 210Pbex on a hillslope relative tothe reference indicates net deposition, whereas a net lossindicates net erosion. It is important to explicitly recognize that210Pbex inventories do not measure the total loss of soil(erosion) from a point. Inventories show net erosion or deposition(e.g. Walling and He, 1999b; Walling et al., 2003; Wakiyamaet al., 2010); they indicate the balance between total soil lossand total soil gain at a point. Thus 210Pbex effectively measurespoint soil lowering (denudation) or aggradation. Mathematicalmodels developed by Walling and He (1999b) for 137Cs andmodified by Walling et al. (2003) for 210Pbex are then used toconvert net inventory loss/gain to net erosion/deposition rates.A strength of the 210Pbex method, like 137Cs, is that it can be
used to construct hillslope-scale to catchment-scale sedimentbudgets. For example, in a logged forest plot, Wallbrink et al.(2002) defined landscape units based on logging treatmentand measured mean soil loss/gain in each to construct anoverall plot sediment budget. Other researchers have definedunits based on land-use type or cover (e.g. Walling et al.,2003; Mabit et al., 2007) or physiographic unit (e.g. Blakeet al., 2009). These unit rates can be extrapolated to derive awatershed-scale sediment budget if the unit areas within thewatershed are known. In addition, 60–100 year erosion anddeposition rates can be determined with a single site visit,providing information for a time period that was not directlyobserved. However, temporal trends in erosion rates areobscured because only net total loss or gain, commonlyexpressed as an average annual rate, is measured.Radionuclide inventories have been used extensively to
quantify net soil redistribution in agricultural (Walling and He,1999a; Walling et al., 2003), pastoral (Walling et al., 2003;Kaste et al., 2006; O’Farrell et al., 2007; Kato et al., 2010),and less frequently, forested landscapes (Wallbrink and Murray,1996; Wallbrink et al., 2002; Wakiyama et al., 2010). Thechallenge in using 210Pbex inventories in forested areas is itsnatural spatial heterogeneity (e.g. Wallbrink and Murray,1996; Wallbrink et al., 2002), caused partly by canopyinterception of 210Pbex fallout (e.g. Blake et al., 2009). Forexample, the average total soil 210Pbex concentration variedby over 50% within Australian eucalyptus forests (Wallbrinkand Murray, 1996) and Japanese deciduous forests (Wakiyamaet al., 2010). This variation can be overcome with sufficientsample size, and samples are often combined, thoroughlymixed, and sub-sampled to average the spatial variation andreduce analytical demand (e.g. Wallbrink et al., 1994;Wallbrink et al., 2002). Most recently, 210Pbex inventories havebeen applied to derive net erosion and deposition informationin burned landscapes (Blake et al., 2009). However, asBlake et al. (2009) suggest, this application is novel, and 210Pbbehavior during and following fires and subsequent impacts on210Pbex inventories are not well understood. Nonetheless, theseinventories represent a promising technique for measuringhillslope-scale sediment transport after fires.
Copyright © 2012 John Wiley & Sons, Ltd.
Here we explore the use of 210Pbex inventories to quantifypost-fire net hillslope erosion and deposition. We quantifyand compare the spatial variability of 210Pbex in soil and itsassociation with mineral and organic soil components atunburned, moderately and severely burned sites. Specificallywe ask the following: (1) how does fire affect 210Pb inventories;(2) do these effects vary with burn severity (moderate versussevere); (3) what is the spatial variability of 210Pbex in stableand actively eroding forested sites? Ultimately, we seek toaddress whether 210Pbex inventories can be confidently appliedto burned forests to measure net erosion and deposition ratesand elucidate post-fire processes of sediment transport.
Methods
Site description
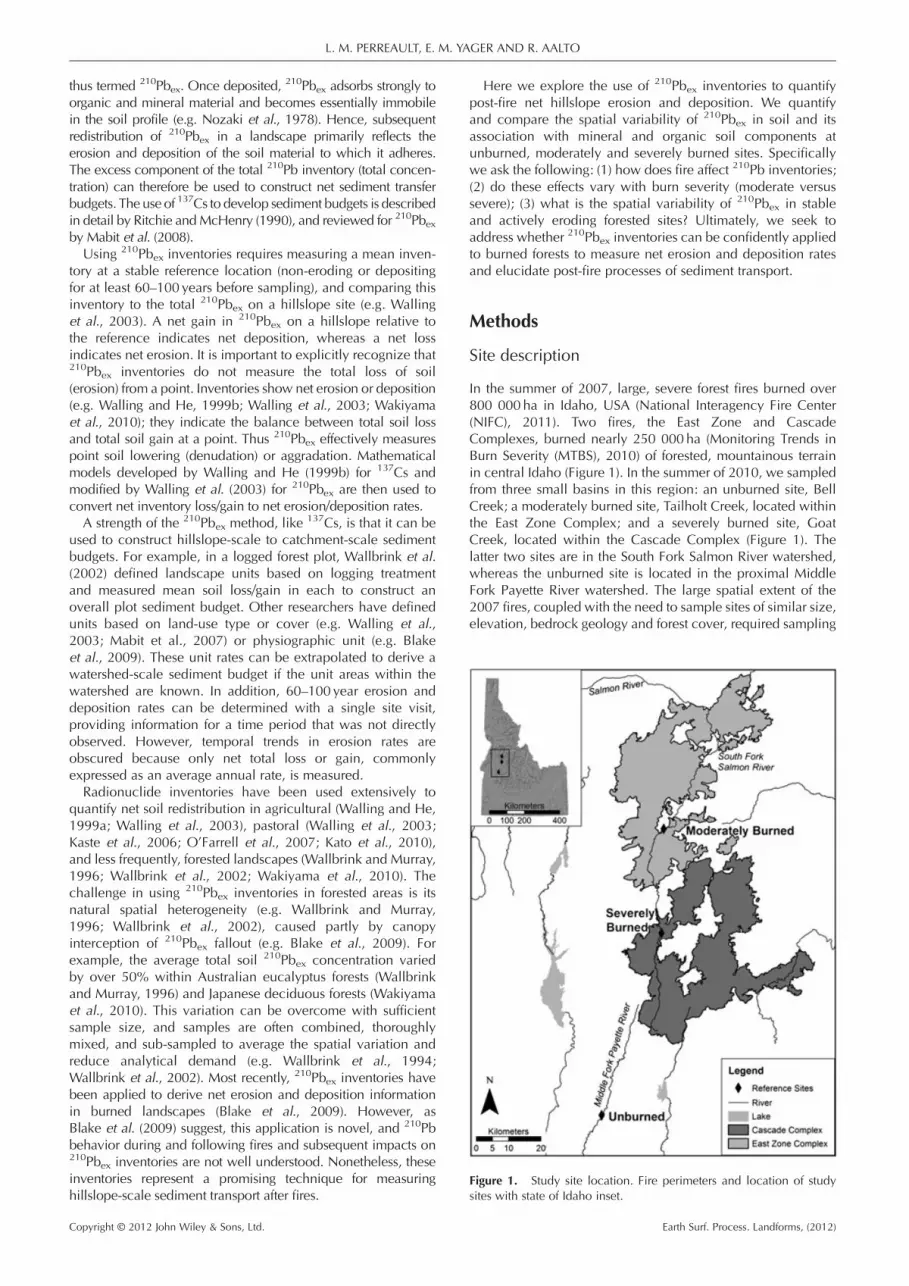
In the summer of 2007, large, severe forest fires burned over800 000 ha in Idaho, USA (National Interagency Fire Center(NIFC), 2011). Two fires, the East Zone and CascadeComplexes, burned nearly 250 000ha (Monitoring Trends inBurn Severity (MTBS), 2010) of forested, mountainous terrainin central Idaho (Figure 1). In the summer of 2010, we sampledfrom three small basins in this region: an unburned site, BellCreek; a moderately burned site, Tailholt Creek, located withinthe East Zone Complex; and a severely burned site, GoatCreek, located within the Cascade Complex (Figure 1). Thelatter two sites are in the South Fork Salmon River watershed,whereas the unburned site is located in the proximal MiddleFork Payette River watershed. The large spatial extent of the2007 fires, coupled with the need to sample sites of similar size,elevation, bedrock geology and forest cover, required sampling
Fs
Earth Surf. Process. Landforms, (2012)
APPLYING 210PBEX INVENTORIES TO MEASURE BURNED HILLSLOPE EROSION
in a different watershed to obtain a comparable unburned site.Neither the unburned nor the moderately burned sites have anyknown history of fire in the 60 years before 2007, and no fieldobservations suggested otherwise (e.g. burned, standing snags).However, a fire of unknown severity burned in the vicinity ofthe severely burned basin in 1994 (Forest Service, 2010).Burn severity was based on Burned Area Reflectance
Classification (BARC) designations and field observations.Extended assessment BARC data were obtained from the(MTBS) (Monitoring Trends in Burn Severity) project (an inter-agency project providing publicly available burn severity data).Burn severity is a measure of the effect of fire on an ecosystem,in contrast to fire intensity, that describes the heat release by afire (Keeley, 2009). BARC designations derive from pre- andpost-fire land reflectance values (i.e. changes in visible biomassand surface exposure) and represent an index gauging fireimpacts on soil and vegetation. These data should be field-validated whenever possible (Key and Benson, 2006). Fieldobservations verified that the high burn severity site wascharacterized by 100% canopy and understory mortality andhad consistently exposed soils. The moderately burned sitewas not mapped within fire boundaries but was adjacent to azone of low to moderate burn severity. Ground observationsverified low to moderate burn severity, with charred logs andsoil, burned understory tree and brush skeletons, and isolatedburned mature trees observed throughout the study site.Because BARC assessments derive from remotely sensed 30mLandsat data, this method commonly underestimates or missesunderstory fires (French et al., 2008) like that of the moderatelyburned site.Each site is underlain by the relatively homogenous
Cretaceous biotite granodiorite of the Idaho batholith (Zienteket al., 2005). Soils developed on this bedrock tend to becoarse-textured, shallow, poorly developed, and highlyerodible (Clayton and Megahan, 1997). The dominant forestcover is mixed Douglas-fir (Pseudotsuga menziesii) andponderosa pine (Pinus ponderosa) (Clayton and Megahan,1997, field observations), and mean site elevations are1040m (unburned basin), 1230m (moderately burned basin)and 1530m (severely burned basin). All sites have KöppenDsc climates, a designation characterized by relatively coldmean annual temperatures and dry, short summer seasons.Mean annual precipitation ranges from 500 to 750mm at thesites (Idaho State Climate Services (ISCS), 2000).
Field methods
Careful selection of stable, non-eroding reference sites iscritical to the use of 210Pbex inventories. Abandoned main stemriver terraces served as reference sites in the unburned andmoderately burned basins. Samples were collected distal fromboth the eroding terrace edge and adjacent hillslopes. Complexand impacted terrain made reference site selection at theseverely burned site more difficult, but we ultimately chose arelatively broad, flat hilltop that was sampled at its center, asfar from the eroding edges as possible. The presence of maturevegetation and intact soil horizons at each reference site furthersuggests that erosion was negligible in these locations.We established a reference site in each study basin because
of the potential for lead volatilization during forest fires. It iswell documented that 210Pb strongly associates with organicmaterial (e.g. Nozaki et al., 1978; Blake et al., 2009; Wakiyamaet al., 2010), and organic material is inherently lost during fires.If we assume that the fire burned equally at both reference andhillslope sites within a basin, then the difference between210Pbex inventories at these sites should only reflect erosion
Copyright © 2012 John Wiley & Sons, Ltd.
and deposition and not be caused by fire-related 210Pbex losses.Our field observations indicated similar burn severity at allsample sites within each basin, justifying this assumption.Nonetheless, we acknowledge the likelihood that fire intensityvaried spatially because of differences in terrain, weather andfuel. The likely difference in fire behavior between referenceand hillslope sites represents a substantial source of uncertaintyinherent to the use of this method in burned terrain.
Based on previous research (Wallbrink et al., 1994;Wallbrink and Murray, 1996), we assumed that mean 210Pbexreference inventories at our forested sites could have coeffi-cients of variation (CV) exceeding 40%. We therefore took 45cores at each of the three reference sites, after Wallbrink et al.(2002) to define a 90% confidence interval about the meanreference inventory. The 45 reference cores in each basin werecollected along three parallel, 15m long transects with 1msample spacing. Each core was collected inside a plastic linertube with a 3�24 cm2 cross-sectional area and a 10 cmminimum length (45 cm maximum, individual core lengthwas determined by the ability of the corer to penetrate andcollect soil onsite). Although wider diameter cores are oftenused to collect soil for radionuclide analysis (e.g. Wallinget al., 2003; Blake et al., 2009), we chose a smaller diametercore because (1) smaller sample masses are required for 210Pbalpha spectrometry analysis (our measurement method) thanfor gamma spectrometry (another common method), and (2)the remote, rugged terrain, combined with the number of corescollected, necessitated smaller samples for efficient access toand transport from sites. We also took 10 cm�10 cm� 10 cmbulk soil samples from each site to obtain adequate mass fordetermining the association between 210Pbex and differentmineral grain size fractions and organic material.
In addition to the reference cores, 12 hillslope core transectswere taken in each basin (unburned, moderately and severelyburned). Two landform types were sampled: planform concavefeatures (i.e. colluvial hollows extending from ridgetop tofootslope) and profile convex hillslopes; hence we establishedsix transects for each landform type per basin. On eachtransect, five sites were sampled from ridgetop to footslope(140m median hillslope length). Core sites were not regularlyspaced but selected to represent general changes in hillslopeform (i.e. changes in gradient, curvature). At each of the fivesample points along a transect, three replicate cores werecollected within 1m2, producing 15 cores total per transect.In sum, we collected 674 core and three bulk soil samplesduring the summer of 2010.
Laboratory methods
For each reference site, two cores were subsampled at 2 cmintervals through depth and analyzed for density, grain sizedistribution and 210Pb concentration. Of the remaining referencecores, three were archived, and 40 were divided into coarse depthintervals (0–2cm, 2–5cm, 5–10cm, 10cm – bottom). Eachinterval was then aggregated across eight cores (from the samesite), producing five composited samples for each depth interval.This type of sample aggregation is common in radionuclide studiesbecause it averages spatial variability and reduces analyticalburden (e.g. Wallbrink et al., 1994; Wallbrink et al., 2002;Wallinget al., 2003; Blake et al., 2009). The composite samples werehomogenized, split to produce ~50g samples, dried (45 �C), andthen subsampled for grain size and 210Pb analysis. The bulk soilsamples were dried (45 �C), weighed, and slaked in deionizedwater to float off organic material (e.g. Blake et al., 2009). Themineral and organic components were again dried, and themineral component was dry sieved into≥2000, 500, 250, 125,
Earth Surf. Process. Landforms, (2012)
L. M. PERREAULT, E. M. YAGER AND R. AALTO
63 and< 63mm grain size fractions. Each mineral fraction and theorganic component was homogenized, split, subsampled,prepared and analyzed for 210Pb concentration.For the majority of the hillslope transect cores, the three
replicate cores taken at each sample location were aggregated,thoroughly mixed, and subsampled (~50 g) to produce a depth-and spatially-averaged sample (e.g. Wallbrink et al., 2002;Walling et al., 2003). Thus in most cases, five compositesamples were analyzed per hillslope transect. However, toobtain a minimum estimate of hillslope spatial variability, wemeasured depth-averaged 210Pb concentration in 15 individualtransect cores for two unburned hillslope transects. Thismethod produced three replicate measurements for each ofthe five core sites per transect, but with only three measure-ments we could not assume a normal distribution of 210Pbconcentration. Therefore median inventories between coresites on each transect were compared for statistical differencesusing a non-parametric, two-sided rank sum test (equivalent tothe Mann–Whitney U-Test) at a=0�05 (Zar, 1994). For anadditional two unburned transects, we aggregated the threecores taken at each sample site in coarse depth intervals(0–2cm, 2–5cm, 5–10cm, 10cm – bottom). Thus we analyzed40 samples for these two transects to assess the depth distributionof 210Pb at actively eroding and depositing hillslope sites. In total,400 unique and composite samples – comprising 677 individualsoil cores – were analyzed for 210Pb content.All preparatory work, 210Pb and grain size analyses were
conducted in the Radiometry Laboratory at the University ofExeter’s Sediment Research Facility. Total 210Pb activity wasmeasured by counting the alpha emissions of polonium-210(210Po), the granddaughter of 210Pb. This method assumes that210Po and 210Pb exist in equilibrium in the sample (Nittroueret al., 1979). In contrast to the commonly used gamma assayof 210Pb activity, alpha spectrometry produces higher accuracyresults and exceptional minimum detectable activities (due tosubstantial gains in detector efficiency, resolution, and verylow background noise). For example, Mabit et al. (2008) reportalpha uncertainties of< 10%, whereas gamma counting resultsin uncertainties of �30–50% when 210Pbex activities are low.Alpha spectrometry also requires less sample mass (0�5–3 g)and produces results that are easily comparable betweenlaboratories. In contrast, Shakhashiro and Mabit (2009) reportthat only 36% of laboratories produced acceptable 210Pbresults with gamma spectrometry. We determined 5�5% 1sanalytical standard error (Aalto and Nittrouer, 2012) fromcombined sample preparation (4�6% subsampling error) andalpha chemistry and counting errors (< 3�0% analytical uncer-tainty for the project average 3000 counts/sample). Averagecounts were used to calculate error because samples weremeasured until at least a minimum total count was reached(Aalto and Nittrouer, 2012). We propagated the standard errorthrough all calculations.The preparation technique involved spiking each sample
with a precisely known activity of manmade 209Po (uncertainly~1%) and using two weak acids (hydrochloric acid, HCl, andnitric acid, HNO3) to leach 210Po from the exterior of mineraland organic material. The 209Po and 210Po, in solution, wasthen autoplated onto silver planchettes from which the alphaemissions from each radionuclide were counted. The 210Poconcentration is calculated from 210Po counts based on therelationship between the 209Po counts and known concentra-tion of the 209Po spike (method developed in Nittrouer et al.,1979; Aalto, 2002; Aalto et al., 2003; Aalto and Dietrich,2005; Aalto and Nittrouer, 2012). By counting the 209Po and210Po leachate concentration, we avoided measuring 210Polocked within mineral grains. This is a preferable techniquegiven the natural occurrence of uranium-238 (238U), progenitor
Copyright © 2012 John Wiley & Sons, Ltd.
of 210Pb, within the granitic Idaho batholith rocks (e.g. Shusterand Bickford, 1985). Plated samples were counted for at least48 hours in the Exeter Radiometry Laboratory to obtain 500210Po counts minimum per sample, and> 2000 countswhenever possible (e.g. Aalto and Nittrouer, 2012). The labora-tory features Ortec Octete Plus alpha spectrometers optimizedto reduce background counts and systematic counting bias tonear-zero levels by: (1) utilizing negatively charged countingtrays and a digitally regulated vacuum chamber air barrier tominimize recoil contamination; (2) monitoring and frequentreplacement of high specification Ortec ULTRA-AS chargedparticle detectors; (3) automated detector integrity monitoringand data collection using AlphaVision software.
Alpha spectrometers cannot directly measure 226Ra, grand-parent of 210Pb, and thus 226Ra cannot be used to determinethe supported fraction of the total 210Pb activity. Given that210Pb reaches an observed activity plateau at depths> 30 cmat our sites, we assumed this activity represented supported210Pb activity below the depth of meteoric input (e.g. Mabitet al., 2008). To calculate 210Pbex we simply subtracted fromall measurement points the supported 210Pb activity, averagedfor each site from the 210Pb concentration of all points below30 cm in the site’s detailed reference cores. We chose tosubtract supported 210Pb activity from all soil samples because,in this semi-arid environment, the litter layer is thinner than2 cm and thus mineral soil existed in all samples. Althoughother researchers have demonstrated a strong associationbetween clay and the 226Ra/214Pb grandparents of 210Pb influvial systems (e.g. Aalto et al., 2008; Aalto and Nittrouer,2012), our mountain soils do not show this relationship andthus we did not normalize 210Pb activity to clay content.Particle grain size analysis of select samples was conductedfor particles< 120mm on Micrometrics 5120 Sedigraphs. Thisfine fraction was separated by wet sieving with a weak sodiumhexametaphosphate solution (Aalto and Nittrouer, 2012).
Calculation of erosion and deposition
To calculate erosion and deposition rates using 210Pbex, thediffusion and advection coefficients (that describe down-soil210Pbex movement) and 210Pbex surface soil concentration mustbe known. We used the detailed 210Pbex depth profiles at eachreference site and an analytical solution to the classic advectionand diffusion equation, presented by Kaste et al. (2007), toestimate the advection (v) and diffusion (D) coefficients.
A zð Þ ¼ A0 expv � ffiffiffiffiffiffiffiffiffiffiffiffiffiffiffiffiffiffiffiffi
v2 þ 4lDp
2Dzð Þ
" #(1)
In Equation 1, the amount of 210Pbex in a volume of soil (A, inBqm–3) at depth (z) is governed by the initial 210Pbex amount (A0,in Bqm–3), an advection term (v, in cm a–1), a diffusion term (D,in cm2 a–1), and the 210Pb radioactive decay constant (l,0�0311 a–1). Following the convention of Kaste et al. (2007), theadvection term describes the downward movement of 210Pbexbound to organic material, and the diffusion term describesdiffusion-like soil mixing.We initially assumed that both diffusionand advection affect 210Pbex distribution in our soils.
We estimated v, D and A0 (reported in Table I) by optimizingthe overall fit of Equation 1 to the measured detailed profiles.Optimization minimized the residual sum of squares betweenmeasured and predicted 210Pbex concentration through depth(similar to Wakiyama et al., 2010). Initially we defined non-zero maximum and minimum v and D values based on theliterature. However, we produced equal or better fits to the
Earth Surf. Process. Landforms, (2012)

TableI.
Summaryofreference
site
210Pbinventories
andsoilch
aracteristics.
nTo
pdep
th(cm)
botto
mdep
th(cm)
Average
den
sity
(gcm
–3)
volume
(cm
3)
210Pb e
x
(Bqkg
–1)
I t(Bqm
–2)
SE(Bqm
–2)
CV(%
)Su
pported
210Pb
(Bqkg
–1)
SE(Bqkg
–1)
A0
(Bqkg
–1)
v(cm
a–1)
D(cm
2a–
1)
Average
percent
siltan
dclay
Unburned
40
02
1�00
6�48
145
5500
110
7�3
12�7
0�26
72010
01�5
44�7
25
1�31
9�72
51�2
510
1�59
16�2
7�39
Moderately
burned
40
02
1�00
6�48
149
3260
93�8
55
9�72
0�31
72280
02�1
49�6
25
1�59
9�72
8�29
510
1�66
16�2
0Severely
burned
40
02
1�03
6�48
62�5
2290
47�4
24
3�25
0�08
31350
01�9
18�6
25
1�73
9�72
12�8
510
2�05
16�2
2�33
Note:I t,
210Pbexinventory;SE,stan
darderroran
drepresen
ts1spropagated
analytical
error;CV,
coeffic
ientofvariation;A0,210Pbexco
ncen
trationin
surfacesoil;
v,ad
vectionco
effic
ient;D,diffusionco
effic
ient.
APPLYING 210PBEX INVENTORIES TO MEASURE BURNED HILLSLOPE EROSION
Copyright © 2012 John Wiley & Sons, Ltd.
measured data by allowing v=0, and estimated the same A0 inboth cases (v= 0 and v 6¼ 0). Although most researchers assumeboth advection and diffusion of 210Pbex occur in soil profiles(e.g. Walling et al., 2003; Kaste et al., 2007; Blake et al.,2009), zero advection is also reported (e.g. Wakiyama et al.,2010). Because the A0 estimate was not changed by adjustingthe advection term (v= 0 and v 6¼ 0), our erosion/depositionrate calculations are not affected by the assumption that v= 0.We determined the timescale represented by 210Pbex invento-
ries at our sites based on the annual 210Pbex flux (Fin). This fluxwas calculated using the measured unburned reference site totalinventory and the equation presented by Kaste et al. (2003).
It ¼ Fin t0ð Þe�l t0ð Þ þ Fin t1ð Þe�l t0�t1ð Þ þ Fin t2ð Þe�l t0�t2ð Þ þ . . . (2)
The annual flux (Fin, in Bqm–2 a–1) was calculated as the yearly
210Pbex fallout rate needed to produce the total measured 210Pbexsoil inventory (It, in Bqm–2), given the 210Pb decay constant (l)and years of input (t1, t2 etc., where t0 =present time). Weassumed the inventory reached approximate equilibrium,defined as< 0�1% annual change in total inventory, at~130years (after Kaste et al., 2003).Our calculated annual flux, 200Bqm–2 a–1, agrees well with
the range of annual flux values reported for California and NewEngland (214–550Bqm–2 a–1, Kaste et al., 2003), throughoutthe United States (130–430Bqm–2 a–1, Nozaki et al., 1978;260Bqm–2 a–1, Appleby and Oldfield, 1992), and NorthAmerica (50–180Bqm–2 a–1, Appleby, 2008). Given that thepast 60 years account for over 85% of the total unburnedreference site inventory, we used a 60 year timescale for neterosion rate calculations (e.g. O’Farrell et al., 2007; Blakeet al., 2009).Net erosion rates were calculated using established mathe-
matical models. Originally developed for 137Cs by Wallingand He (1999b), and adapted to 210Pbex by Walling et al.(2003), average annual net soil erosion rate (R, in kgm–2 a–1)was calculated as follows.
Z t
0PRCu t ’
� �e�l t�t ’ð Þdt ’ ¼ Aloss tð Þ (3)
Here, P is the particle size correlation factor (assumed to beone in our study, discussed later). The lost site inventory (Aloss
(t), in Bqm–2) represented the difference between referenceand hillslope site 210Pbex inventories. The time of record (t)was 60 years, and surface soil concentration (Cu(t), in Bq kg–1)was approximated as A0 (from Equation 1) multiplied bysurface soil density (reported in Table I).
Results
Association of 210Pbex with grain size and organicmatter fractions
Based on the bulk soil sample analysis, the medium to very finesand (500–63 mm) and fine fractions (< 63mm) in undisturbedsoils have nearly identical 210Pbex concentrations within agiven site (Figure 2, Table II). Because we do not observe astrong association between 210Pbex and the fine fraction, weassume P=1 (Equation 3) in the erosion rate model of Wallinget al. (2003). None of the samples shows detectable 210Pbex inthe≥ 2000mm fraction, and all have barely detectable amountsof 210Pbex in the≥ 500mm fraction (Figure 2). For all sites,organic matter has the highest 210Pbex concentration and repre-sents the largest fraction of total activity (Table II). In burned site
Earth Surf. Process. Landforms, (2012)
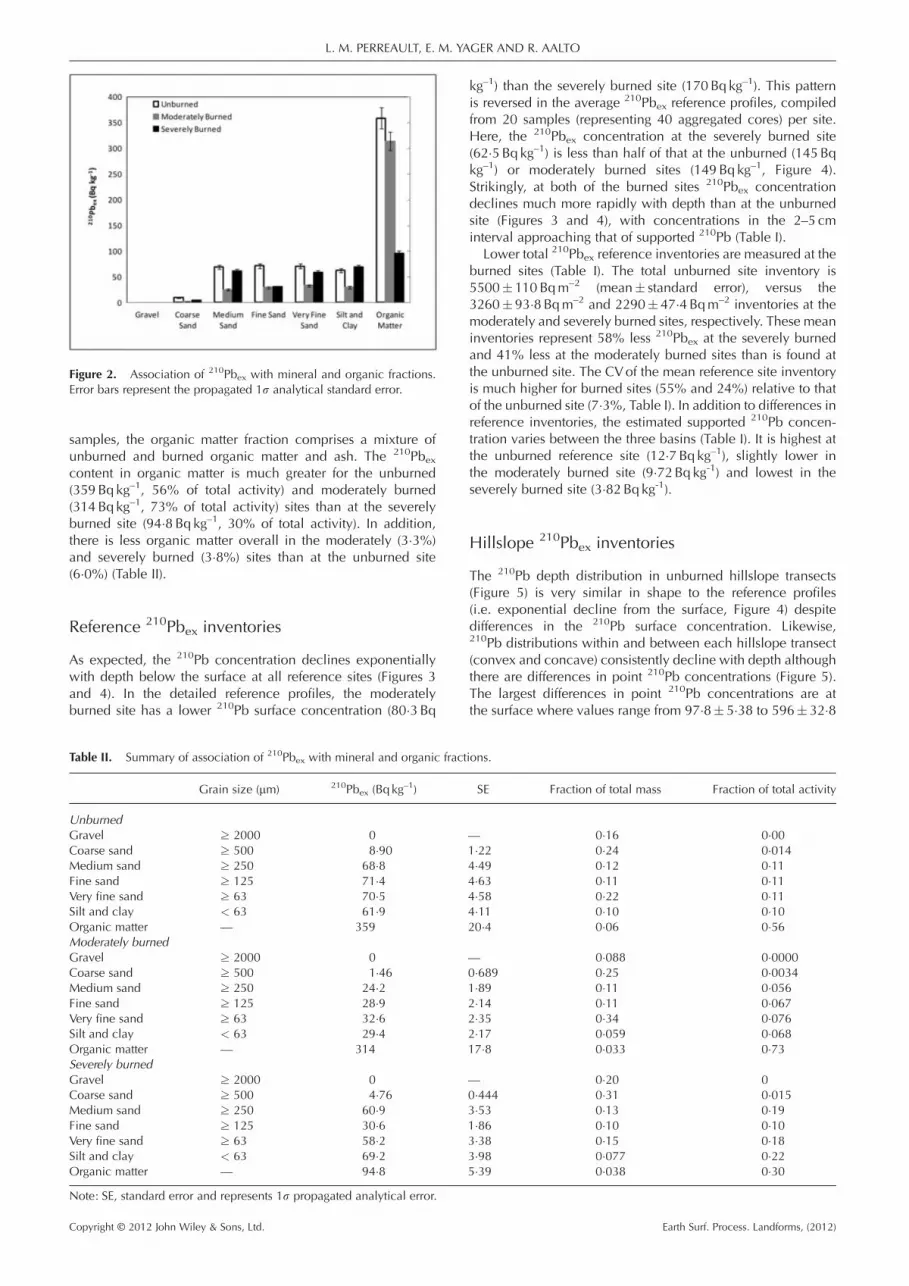
Figure 2. Association of 210Pbex with mineral and organic fractions.Error bars represent the propagated 1s analytical standard error.
L. M. PERREAULT, E. M. YAGER AND R. AALTO
samples, the organic matter fraction comprises a mixture ofunburned and burned organic matter and ash. The 210Pbexcontent in organic matter is much greater for the unburned(359Bq kg–1, 56% of total activity) and moderately burned(314Bq kg–1, 73% of total activity) sites than at the severelyburned site (94�8Bq kg–1, 30% of total activity). In addition,there is less organic matter overall in the moderately (3�3%)and severely burned (3�8%) sites than at the unburned site(6�0%) (Table II).
Reference 210Pbex inventories
As expected, the 210Pb concentration declines exponentiallywith depth below the surface at all reference sites (Figures 3and 4). In the detailed reference profiles, the moderatelyburned site has a lower 210Pb surface concentration (80�3Bq
Table II. Summary of association of 210Pbex with mineral and organic fract
Grain size (mm) 210Pbex (Bq kg–1)
UnburnedGravel ≥ 2000 0Coarse sand ≥ 500 8�90Medium sand ≥ 250 68�8Fine sand ≥ 125 71�4Very fine sand ≥ 63 70�5Silt and clay < 63 61�9Organic matter — 359Moderately burnedGravel ≥ 2000 0Coarse sand ≥ 500 1�46Medium sand ≥ 250 24�2Fine sand ≥ 125 28�9Very fine sand ≥ 63 32�6Silt and clay < 63 29�4Organic matter — 314Severely burnedGravel ≥ 2000 0Coarse sand ≥ 500 4�76Medium sand ≥ 250 60�9Fine sand ≥ 125 30�6Very fine sand ≥ 63 58�2Silt and clay < 63 69�2Organic matter — 94�8Note: SE, standard error and represents 1s propagated analytical error.
Copyright © 2012 John Wiley & Sons, Ltd.
kg–1) than the severely burned site (170Bq kg–1). This patternis reversed in the average 210Pbex reference profiles, compiledfrom 20 samples (representing 40 aggregated cores) per site.Here, the 210Pbex concentration at the severely burned site(62�5Bq kg–1) is less than half of that at the unburned (145Bqkg–1) or moderately burned sites (149Bq kg–1, Figure 4).Strikingly, at both of the burned sites 210Pbex concentrationdeclines much more rapidly with depth than at the unburnedsite (Figures 3 and 4), with concentrations in the 2–5 cminterval approaching that of supported 210Pb (Table I).
Lower total 210Pbex reference inventories are measured at theburned sites (Table I). The total unburned site inventory is5500�110Bqm–2 (mean� standard error), versus the3260�93�8Bqm–2 and 2290�47�4Bqm–2 inventories at themoderately and severely burned sites, respectively. These meaninventories represent 58% less 210Pbex at the severely burnedand 41% less at the moderately burned sites than is found atthe unburned site. The CVof the mean reference site inventoryis much higher for burned sites (55% and 24%) relative to thatof the unburned site (7�3%, Table I). In addition to differences inreference inventories, the estimated supported 210Pb concen-tration varies between the three basins (Table I). It is highest atthe unburned reference site (12�7Bq kg–1), slightly lower inthe moderately burned site (9�72Bq kg-1) and lowest in theseverely burned site (3�82Bq kg-1).
Hillslope 210Pbex inventories
The 210Pb depth distribution in unburned hillslope transects(Figure 5) is very similar in shape to the reference profiles(i.e. exponential decline from the surface, Figure 4) despitedifferences in the 210Pb surface concentration. Likewise,210Pb distributions within and between each hillslope transect(convex and concave) consistently decline with depth althoughthere are differences in point 210Pb concentrations (Figure 5).The largest differences in point 210Pb concentrations are atthe surface where values range from 97�8� 5�38 to 596� 32�8
ions.
SE Fraction of total mass Fraction of total activity
— 0�16 0�001�22 0�24 0�0144�49 0�12 0�114�63 0�11 0�114�58 0�22 0�114�11 0�10 0�1020�4 0�06 0�56
— 0�088 0�00000�689 0�25 0�00341�89 0�11 0�0562�14 0�11 0�0672�35 0�34 0�0762�17 0�059 0�06817�8 0�033 0�73
— 0�20 00�444 0�31 0�0153�53 0�13 0�191�86 0�10 0�103�38 0�15 0�183�98 0�077 0�225�39 0�038 0�30
Earth Surf. Process. Landforms, (2012)
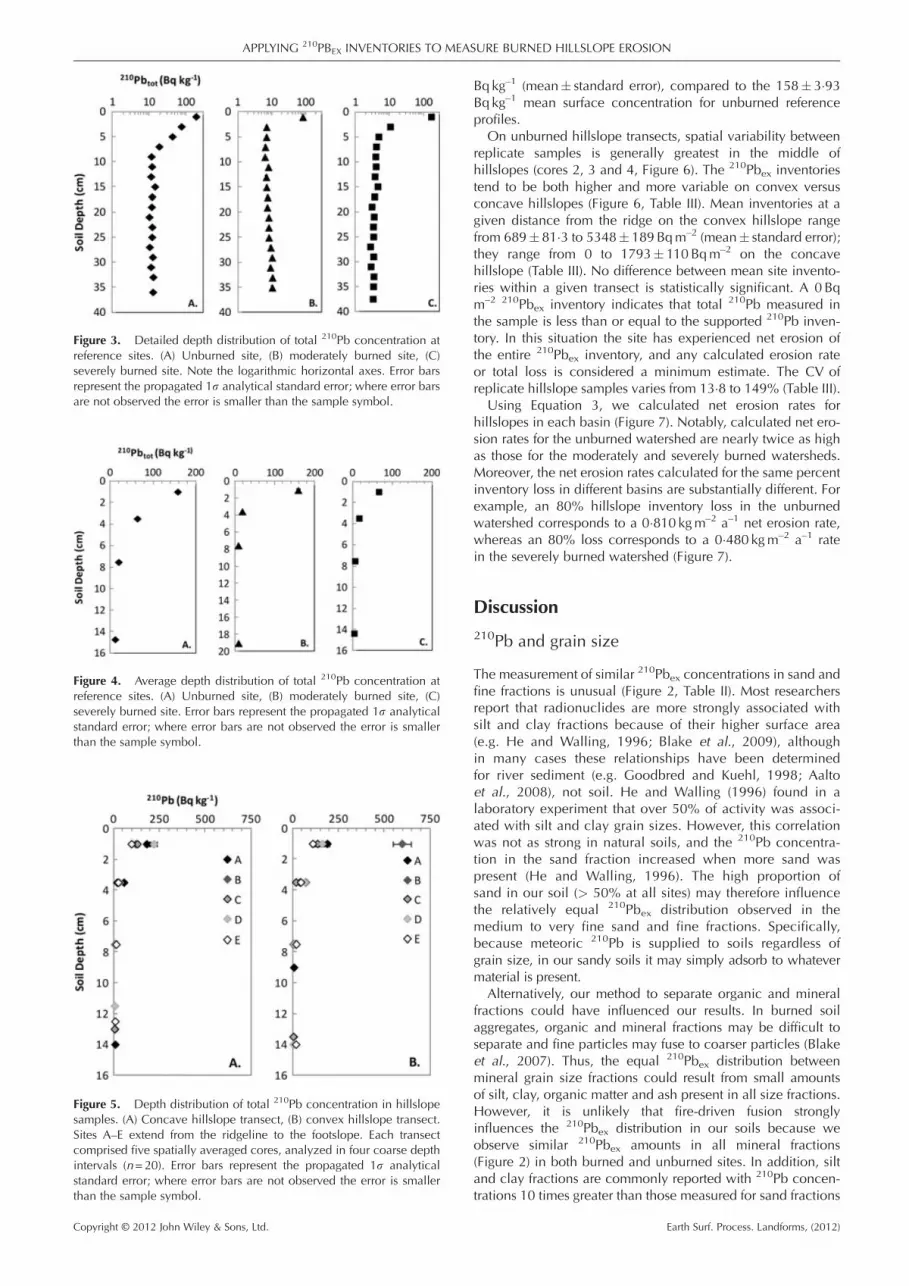
Figure 3. Detailed depth distribution of total 210Pb concentration atreference sites. (A) Unburned site, (B) moderately burned site, (C)severely burned site. Note the logarithmic horizontal axes. Error barsrepresent the propagated 1s analytical standard error; where error barsare not observed the error is smaller than the sample symbol.
Figure 4. Average depth distribution of total 210Pb concentration atreference sites. (A) Unburned site, (B) moderately burned site, (C)severely burned site. Error bars represent the propagated 1s analyticalstandard error; where error bars are not observed the error is smallerthan the sample symbol.
Figure 5. Depth distribution of total 210Pb concentration in hillslopesamples. (A) Concave hillslope transect, (B) convex hillslope transect.Sites A–E extend from the ridgeline to the footslope. Each transectcomprised five spatially averaged cores, analyzed in four coarse depthintervals (n=20). Error bars represent the propagated 1s analyticalstandard error; where error bars are not observed the error is smallerthan the sample symbol.
APPLYING 210PBEX INVENTORIES TO MEASURE BURNED HILLSLOPE EROSION
Copyright © 2012 John Wiley & Sons, Ltd.
Bq kg–1 (mean� standard error), compared to the 158� 3�93Bq kg–1 mean surface concentration for unburned referenceprofiles.
On unburned hillslope transects, spatial variability betweenreplicate samples is generally greatest in the middle ofhillslopes (cores 2, 3 and 4, Figure 6). The 210Pbex inventoriestend to be both higher and more variable on convex versusconcave hillslopes (Figure 6, Table III). Mean inventories at agiven distance from the ridge on the convex hillslope rangefrom 689� 81�3 to 5348� 189Bqm–2 (mean� standard error);they range from 0 to 1793� 110Bqm–2 on the concavehillslope (Table III). No difference between mean site invento-ries within a given transect is statistically significant. A 0Bqm–2 210Pbex inventory indicates that total 210Pb measured inthe sample is less than or equal to the supported 210Pb inven-tory. In this situation the site has experienced net erosion ofthe entire 210Pbex inventory, and any calculated erosion rateor total loss is considered a minimum estimate. The CV ofreplicate hillslope samples varies from 13�8 to 149% (Table III).
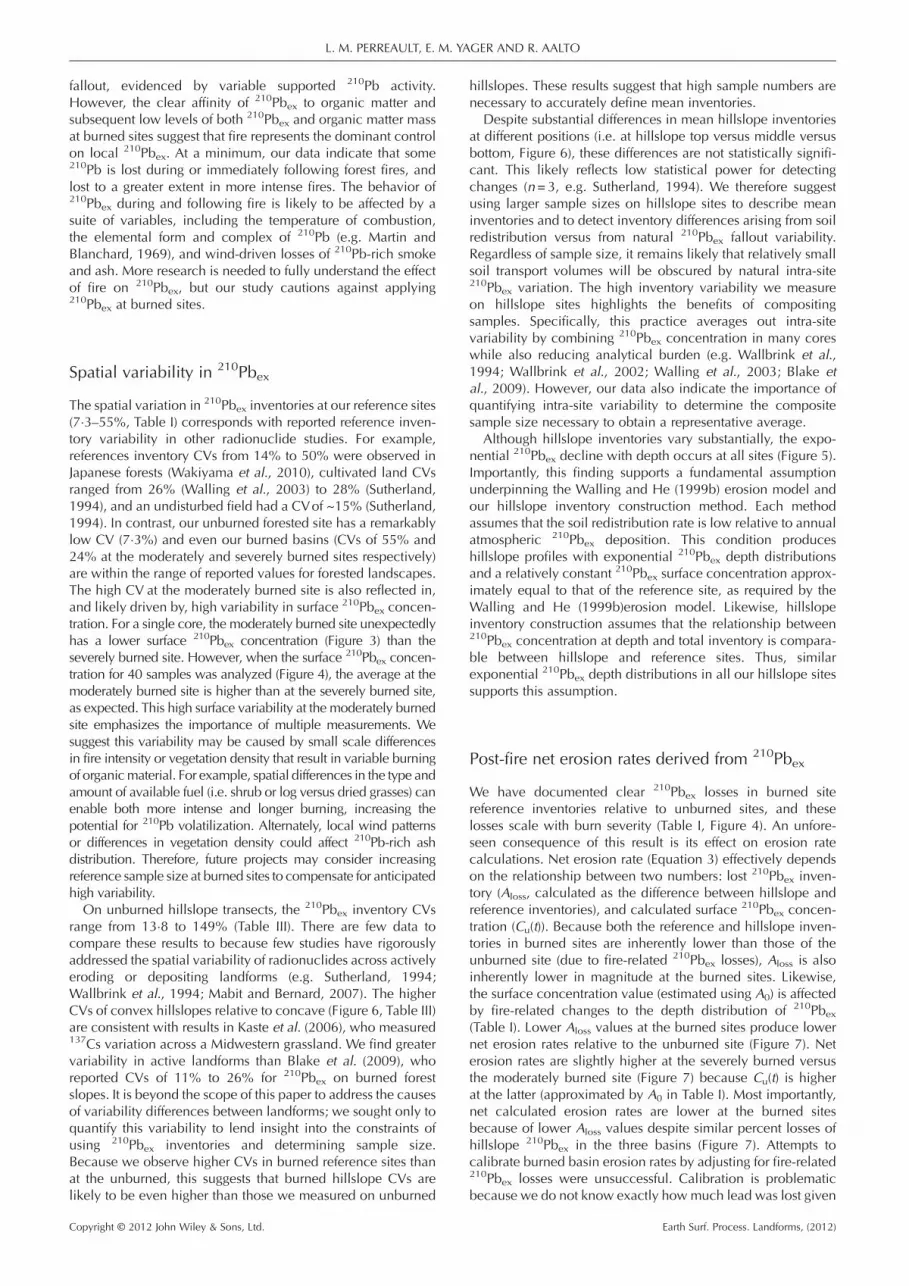
Using Equation 3, we calculated net erosion rates forhillslopes in each basin (Figure 7). Notably, calculated net ero-sion rates for the unburned watershed are nearly twice as highas those for the moderately and severely burned watersheds.Moreover, the net erosion rates calculated for the same percentinventory loss in different basins are substantially different. Forexample, an 80% hillslope inventory loss in the unburnedwatershed corresponds to a 0�810 kgm–2 a–1 net erosion rate,whereas an 80% loss corresponds to a 0�480 kgm–2 a–1 ratein the severely burned watershed (Figure 7).
Discussion210Pb and grain size
The measurement of similar 210Pbex concentrations in sand andfine fractions is unusual (Figure 2, Table II). Most researchersreport that radionuclides are more strongly associated withsilt and clay fractions because of their higher surface area(e.g. He and Walling, 1996; Blake et al., 2009), althoughin many cases these relationships have been determinedfor river sediment (e.g. Goodbred and Kuehl, 1998; Aaltoet al., 2008), not soil. He and Walling (1996) found in alaboratory experiment that over 50% of activity was associ-ated with silt and clay grain sizes. However, this correlationwas not as strong in natural soils, and the 210Pb concentra-tion in the sand fraction increased when more sand waspresent (He and Walling, 1996). The high proportion ofsand in our soil (> 50% at all sites) may therefore influencethe relatively equal 210Pbex distribution observed in themedium to very fine sand and fine fractions. Specifically,because meteoric 210Pb is supplied to soils regardless ofgrain size, in our sandy soils it may simply adsorb to whatevermaterial is present.
Alternatively, our method to separate organic and mineralfractions could have influenced our results. In burned soilaggregates, organic and mineral fractions may be difficult toseparate and fine particles may fuse to coarser particles (Blakeet al., 2007). Thus, the equal 210Pbex distribution betweenmineral grain size fractions could result from small amountsof silt, clay, organic matter and ash present in all size fractions.However, it is unlikely that fire-driven fusion stronglyinfluences the 210Pbex distribution in our soils because weobserve similar 210Pbex amounts in all mineral fractions(Figure 2) in both burned and unburned sites. In addition, siltand clay fractions are commonly reported with 210Pb concen-trations 10 times greater than those measured for sand fractions
Earth Surf. Process. Landforms, (2012)
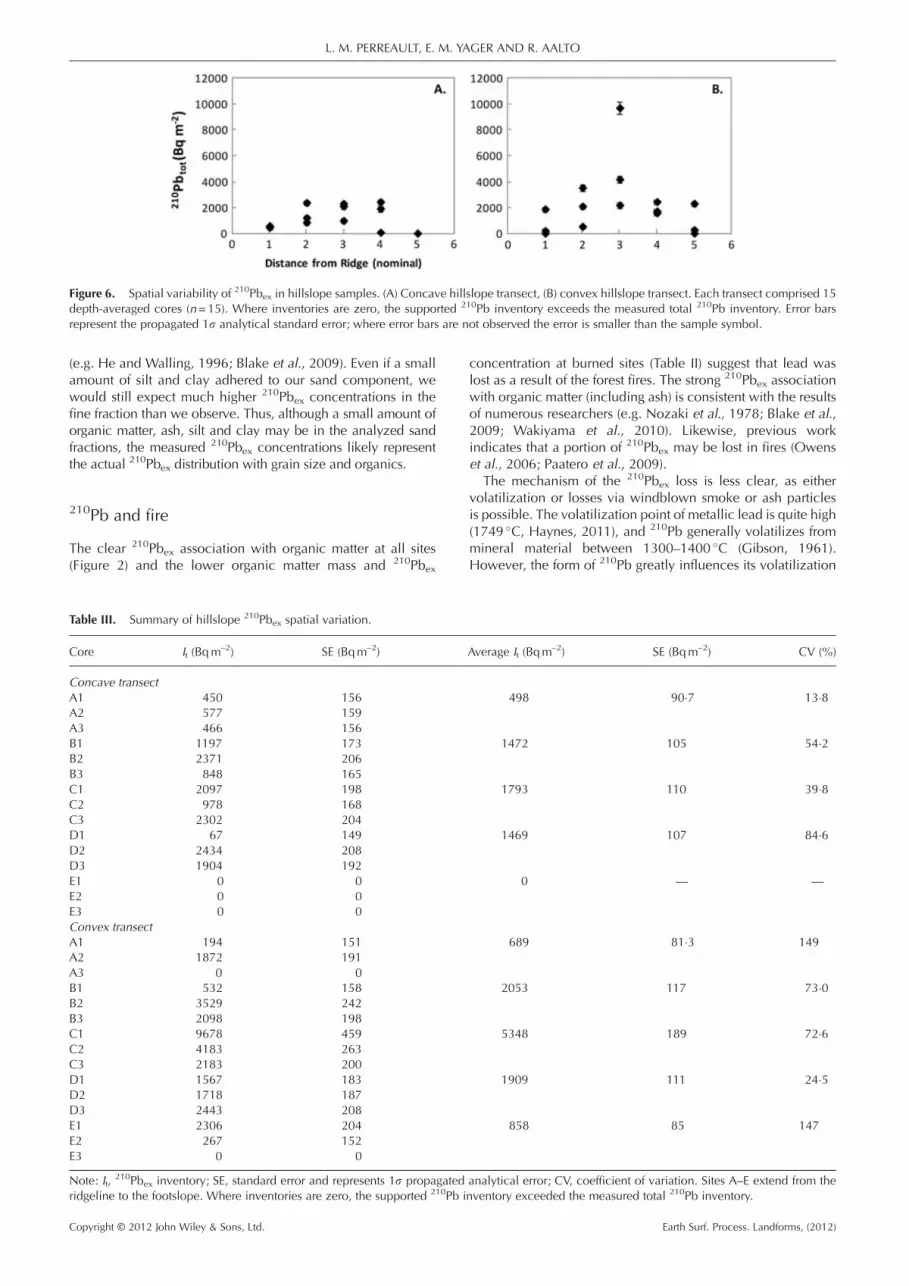
Figure 6. Spatial variability of 210Pbex in hillslope samples. (A) Concave hillslope transect, (B) convex hillslope transect. Each transect comprised 15depth-averaged cores (n=15). Where inventories are zero, the supported 210Pb inventory exceeds the measured total 210Pb inventory. Error barsrepresent the propagated 1s analytical standard error; where error bars are not observed the error is smaller than the sample symbol.
L. M. PERREAULT, E. M. YAGER AND R. AALTO
(e.g. He and Walling, 1996; Blake et al., 2009). Even if a smallamount of silt and clay adhered to our sand component, wewould still expect much higher 210Pbex concentrations in thefine fraction than we observe. Thus, although a small amount oforganic matter, ash, silt and clay may be in the analyzed sandfractions, the measured 210Pbex concentrations likely representthe actual 210Pbex distribution with grain size and organics.
210Pb and fire
The clear 210Pbex association with organic matter at all sites(Figure 2) and the lower organic matter mass and 210Pbex
Table III. Summary of hillslope 210Pbex spatial variation.
Core It (Bqm–2) SE (Bqm–2)
Concave transectA1 450 156A2 577 159A3 466 156B1 1197 173B2 2371 206B3 848 165C1 2097 198C2 978 168C3 2302 204D1 67 149D2 2434 208D3 1904 192E1 0 0E2 0 0E3 0 0Convex transectA1 194 151A2 1872 191A3 0 0B1 532 158B2 3529 242B3 2098 198C1 9678 459C2 4183 263C3 2183 200D1 1567 183D2 1718 187D3 2443 208E1 2306 204E2 267 152E3 0 0
Note: It,210Pbex inventory; SE, standard error and represents 1s propagated
ridgeline to the footslope. Where inventories are zero, the supported 210Pb i
Copyright © 2012 John Wiley & Sons, Ltd.
concentration at burned sites (Table II) suggest that lead waslost as a result of the forest fires. The strong 210Pbex associationwith organic matter (including ash) is consistent with the resultsof numerous researchers (e.g. Nozaki et al., 1978; Blake et al.,2009; Wakiyama et al., 2010). Likewise, previous workindicates that a portion of 210Pbex may be lost in fires (Owenset al., 2006; Paatero et al., 2009).
The mechanism of the 210Pbex loss is less clear, as eithervolatilization or losses via windblown smoke or ash particlesis possible. The volatilization point of metallic lead is quite high(1749 �C, Haynes, 2011), and 210Pb generally volatilizes frommineral material between 1300–1400 �C (Gibson, 1961).However, the form of 210Pb greatly influences its volatilization
Average It (Bqm–2) SE (Bqm–2) CV (%)
498 90�7 13�8
1472 105 54�2
1793 110 39�8
1469 107 84�6
0 — —
689 81�3 149
2053 117 73�0
5348 189 72�6
1909 111 24�5
858 85 147
analytical error; CV, coefficient of variation. Sites A–E extend from thenventory exceeded the measured total 210Pb inventory.
Earth Surf. Process. Landforms, (2012)

Figure 7. Relationship between net inventory loss and calculated neterosion rate. Net inventory loss is the difference between the referenceand hillslope site inventories, expressed as a percent. Problematically,note that for the same percent inventory loss, divergent erosion ratesare calculated in different basins. Only samples with net losses areplotted here for simplicity although samples with net gains were alsomeasured and show the same relationship.
APPLYING 210PBEX INVENTORIES TO MEASURE BURNED HILLSLOPE EROSION
temperature; in the presence of chloride or sulfate, it can be lostat temperatures between 450 and 600 �C (Gorsuch, 1959;Gibson, 1961; Martin and Blanchard, 1969). Although theburning temperature of the 2007 fires is unknown, above-ground fire temperatures can range from 50 to> 1500 �C(Neary et al., 1999), and fire intensity (based partly on temper-ature) tends to correlate with fire severity (Keeley, 2009). Thus itis reasonable to assume that fire temperatures were highenough to volatize some forms of 210Pb, at least at the severelyburned site.Alternatively, even if fire temperatures were insufficient to
volatilize most 210Pbex, previous work indicates that 210Pbremains adsorbed to submicron smoke particles (Martell,1974), and smoke from distant wildfires contains fine particu-lates, including 210Pb (Stohl et al., 2007; Paatero et al., 2009).Therefore, 210Pbex losses may occur during the fire itself viavolatilization or distant transport of smoke particulates withadsorbed 210Pb, or following the fire via wind transportationof 210Pb-rich ash.Problematically, some of this research also suggests that
210Po volatilizes at lower temperatures than 210Pb (Martin andBlanchard, 1969; Martell, 1974; Paatero et al., 2009).Complete 210Po losses frequently occur between 600 and650 �C (Martell, 1974), and partial losses can occur at tempera-tures as low as 200 �C (Martin and Blanchard, 1969). Thegreater volatility of 210Po raises an important methodologicalquestion because alpha spectrometry measures 210Po concen-tration, which we then used to calculate 210Pb concentration.Given the greater volatility of 210Po, is it therefore possible thatthe loss of 210Po in the fire drives our low 210Pb concentrations,despite the actual presence of more 210Pb? The alphaspectrometry technique relies on the assumption that 210Poand 210Pb are in radioactive equilibrium (e.g. Nittrouer et al.,1979), and with a half-life of 138 days, 210Po reaches equilib-rium with 210Pb in about two years (Clayton and Bradley,1995). We measured soil 210Po content three years after thefires and thus 210Po and 210Pb were likely in equilibrium.Nonetheless, we caution researchers using alpha spectrometryto determine 210Pb content following fires to ensure thatsufficient time has passed for 210Po and 210Pb to equilibrate.However, the time elapsed between the fire and sampling
event also introduces substantial uncertainty to methodsutilizing radionuclides. For example, some wind transportationof 210Pb-rich ash likely occurs following fires, and could affect
Copyright © 2012 John Wiley & Sons, Ltd.
hillslope and reference sites variably due to their inherentlydifferent morphologies. Additionally, such inherent differencesbetween hillslopes and flat reference sites likely affects thebehavior of fires. For example, a hillslope fire can burn fuelsmore completely due to the effect of fuel drying in advance ofthe flaming front. Alternately, topography and wind patternsmay cause fires to pass over hillslopes more quickly than flatareas (e.g. Agee, 1993). Differences in fire or wind processesbetween hillslope and reference sites can be difficult to recog-nize, especially given the time elapsed between the fire andsampling event, but are critical to the assumptions underpin-ning radionuclide methods.
In addition to organic matter and lead losses, we observesteep declines in 210Pbex concentrations below the soil surfacein burned basins (Figure 4). These declines may reflect the‘collapse’ of 210Pbex into a thin surface layer following thecombustion of a thicker surface organic layer (Harden et al.,2004; Blake et al., 2009). The relative 210Pbex enrichment inorganic matter in the moderately burned site (73% of the totalactivity, Table II) demonstrates this collapse, whereas greaterfire intensity at the severely burned site likely diminished thiseffect by destroying more surface material. The high fractionof organic matter activity in the moderately burned site alsocontrasts sharply with the relatively low mineral fractionactivity (Figure 2). Soil heating at shallow depths during the fire(e.g. Neary et al., 1999) may have caused 210Pbex losses frommineral grains, explaining the lower 210Pbex concentrationsassociated with mineral fractions at the burned sites relativeto the unburned basin (Figure 2). Some soil heating is probable,given the generally thin (< 1 cm) litter layer observed even inthe unburned basin. However, most of the observed differencein subsurface 210Pbex concentrations between sites is likely dueto local 210Pbex fallout variation caused by 210Pb productiondifferences.
Measured differences in supported 210Pb content betweenbasins (Table I) indicate that local variations in 210Pb produc-tion exist. The production of 210Pb is influenced by radonexhalation and bedrock lithology. The relatively coarser soilat the severely burned sites (18�6% fines, versus 44�7% and49�6% at the unburned and moderately burned sites respec-tively, Table I) may affect 222Rn diffusion. For example, baro-metric pressure, porosity and soil moisture content (the lattertwo influenced by grain size distribution) can alter the 222Rndiffusion rate by an order of magnitude (e.g. Nazaroff, 1992).Moreover, underlying variations in 222Rn bedrock ventilation(i.e. variation in fracture pattern) may also influence 222Rndiffusion through and from soil (Schery et al., 1984).
In addition to variations in soil texture, moisture and bedrockfracturing, differences in bedrock lithology could contribute tosupported 210Pb site differences (Table I). To the best of ourknowledge (e.g. Zientek et al., 2005) and field observations,the underlying bedrock at each site is Cretaceous biotitegranodiorite of the Idaho batholith. However, Tertiary graniticplutons occur throughout the batholith, are often associatedwith mineralization, and are commonly two to four times moreradioactive than the Cretaceous plutons (e.g. Bennet, 1980;Lewis and Kiilsgaard, 1991). It is therefore possible that localvariations in bedrock lithology could be exerting a primarycontrol on the amount of 222Rn, and hence supported 210Pb,released into soils. Lower supported 210Pb concentrationsmeasured in burned basins are unlikely to be caused by fire-driven supported 210Pb losses because these concentrationswere estimated from measurements below 30 cm. Even in themost severe fire conditions, substantial soil heating extendsonly to about 20 cm belowground (Neary et al., 1999).
Thus, the lower 210Pbex inventories we observe in burnedbasins are likely caused partly by local variations in 210Pbex
Earth Surf. Process. Landforms, (2012)
L. M. PERREAULT, E. M. YAGER AND R. AALTO
fallout, evidenced by variable supported 210Pb activity.However, the clear affinity of 210Pbex to organic matter andsubsequent low levels of both 210Pbex and organic matter massat burned sites suggest that fire represents the dominant controlon local 210Pbex. At a minimum, our data indicate that some210Pb is lost during or immediately following forest fires, andlost to a greater extent in more intense fires. The behavior of210Pbex during and following fire is likely to be affected by asuite of variables, including the temperature of combustion,the elemental form and complex of 210Pb (e.g. Martin andBlanchard, 1969), and wind-driven losses of 210Pb-rich smokeand ash. More research is needed to fully understand the effectof fire on 210Pbex, but our study cautions against applying210Pbex at burned sites.
Spatial variability in 210Pbex
The spatial variation in 210Pbex inventories at our reference sites(7�3–55%, Table I) corresponds with reported reference inven-tory variability in other radionuclide studies. For example,references inventory CVs from 14% to 50% were observed inJapanese forests (Wakiyama et al., 2010), cultivated land CVsranged from 26% (Walling et al., 2003) to 28% (Sutherland,1994), and an undisturbed field had a CVof ~15% (Sutherland,1994). In contrast, our unburned forested site has a remarkablylow CV (7�3%) and even our burned basins (CVs of 55% and24% at the moderately and severely burned sites respectively)are within the range of reported values for forested landscapes.The high CV at the moderately burned site is also reflected in,and likely driven by, high variability in surface 210Pbex concen-tration. For a single core, the moderately burned site unexpectedlyhas a lower surface 210Pbex concentration (Figure 3) than theseverely burned site. However, when the surface 210Pbex concen-tration for 40 samples was analyzed (Figure 4), the average at themoderately burned site is higher than at the severely burned site,as expected. This high surface variability at the moderately burnedsite emphasizes the importance of multiple measurements. Wesuggest this variability may be caused by small scale differencesin fire intensity or vegetation density that result in variable burningof organicmaterial. For example, spatial differences in the type andamount of available fuel (i.e. shrub or log versus dried grasses) canenable both more intense and longer burning, increasing thepotential for 210Pb volatilization. Alternately, local wind patternsor differences in vegetation density could affect 210Pb-rich ashdistribution. Therefore, future projects may consider increasingreference sample size at burned sites to compensate for anticipatedhigh variability.On unburned hillslope transects, the 210Pbex inventory CVs
range from 13�8 to 149% (Table III). There are few data tocompare these results to because few studies have rigorouslyaddressed the spatial variability of radionuclides across activelyeroding or depositing landforms (e.g. Sutherland, 1994;Wallbrink et al., 1994; Mabit and Bernard, 2007). The higherCVs of convex hillslopes relative to concave (Figure 6, Table III)are consistent with results in Kaste et al. (2006), who measured137Cs variation across a Midwestern grassland. We find greatervariability in active landforms than Blake et al. (2009), whoreported CVs of 11% to 26% for 210Pbex on burned forestslopes. It is beyond the scope of this paper to address the causesof variability differences between landforms; we sought only toquantify this variability to lend insight into the constraints ofusing 210Pbex inventories and determining sample size.Because we observe higher CVs in burned reference sites thanat the unburned, this suggests that burned hillslope CVs arelikely to be even higher than those we measured on unburned
Copyright © 2012 John Wiley & Sons, Ltd.
hillslopes. These results suggest that high sample numbers arenecessary to accurately define mean inventories.
Despite substantial differences in mean hillslope inventoriesat different positions (i.e. at hillslope top versus middle versusbottom, Figure 6), these differences are not statistically signifi-cant. This likely reflects low statistical power for detectingchanges (n=3, e.g. Sutherland, 1994). We therefore suggestusing larger sample sizes on hillslope sites to describe meaninventories and to detect inventory differences arising from soilredistribution versus from natural 210Pbex fallout variability.Regardless of sample size, it remains likely that relatively smallsoil transport volumes will be obscured by natural intra-site210Pbex variation. The high inventory variability we measureon hillslope sites highlights the benefits of compositingsamples. Specifically, this practice averages out intra-sitevariability by combining 210Pbex concentration in many coreswhile also reducing analytical burden (e.g. Wallbrink et al.,1994; Wallbrink et al., 2002; Walling et al., 2003; Blake etal., 2009). However, our data also indicate the importance ofquantifying intra-site variability to determine the compositesample size necessary to obtain a representative average.
Although hillslope inventories vary substantially, the expo-nential 210Pbex decline with depth occurs at all sites (Figure 5).Importantly, this finding supports a fundamental assumptionunderpinning the Walling and He (1999b) erosion model andour hillslope inventory construction method. Each methodassumes that the soil redistribution rate is low relative to annualatmospheric 210Pbex deposition. This condition produceshillslope profiles with exponential 210Pbex depth distributionsand a relatively constant 210Pbex surface concentration approx-imately equal to that of the reference site, as required by theWalling and He (1999b)erosion model. Likewise, hillslopeinventory construction assumes that the relationship between210Pbex concentration at depth and total inventory is compara-ble between hillslope and reference sites. Thus, similarexponential 210Pbex depth distributions in all our hillslope sitessupports this assumption.
Post-fire net erosion rates derived from 210Pbex
We have documented clear 210Pbex losses in burned sitereference inventories relative to unburned sites, and theselosses scale with burn severity (Table I, Figure 4). An unfore-seen consequence of this result is its effect on erosion ratecalculations. Net erosion rate (Equation 3) effectively dependson the relationship between two numbers: lost 210Pbex inven-tory (Aloss, calculated as the difference between hillslope andreference inventories), and calculated surface 210Pbex concen-tration (Cu(t)). Because both the reference and hillslope inven-tories in burned sites are inherently lower than those of theunburned site (due to fire-related 210Pbex losses), Aloss is alsoinherently lower in magnitude at the burned sites. Likewise,the surface concentration value (estimated using A0) is affectedby fire-related changes to the depth distribution of 210Pbex(Table I). Lower Aloss values at the burned sites produce lowernet erosion rates relative to the unburned site (Figure 7). Neterosion rates are slightly higher at the severely burned versusthe moderately burned site (Figure 7) because Cu(t) is higherat the latter (approximated by A0 in Table I). Most importantly,net calculated erosion rates are lower at the burned sitesbecause of lower Aloss values despite similar percent losses ofhillslope 210Pbex in the three basins (Figure 7). Attempts tocalibrate burned basin erosion rates by adjusting for fire-related210Pbex losses were unsuccessful. Calibration is problematicbecause we do not know exactly how much lead was lost given
Earth Surf. Process. Landforms, (2012)

APPLYING 210PBEX INVENTORIES TO MEASURE BURNED HILLSLOPE EROSION
the likelihood that local 210Pbex fallout, and hence 210Pbexinventories, naturally varies between sites.To our knowledge, the only previous study using 210Pbex
inventories to calculate net erosion rates in burned forests, byBlake et al. (2009), utilized only a single burned reference site.No study has used multiple, substantially different referencesites. Our study is therefore the first to detect a problemwherein net erosion rates scale with the absolute value of the210Pbex inventory. Our results do not invalidate net soil transfersquantified by previous studies, but they do suggest that abso-lute net erosion and deposition rates calculated within aburned watershed are not comparable to other sites and arenot accurate. Assuming that 210Pbex losses due to fire areconsistent throughout a watershed, intra-basin net soil transportcomparisons are still reasonable. Likewise, 210Pbex lost viacombustion may be less problematic at sites where 210Pbex isless strongly associated with organic matter and more so withmineral fractions. Nonetheless, the clear 210Pbex losses wedocument related to the fire, and subsequent sensitivity ofcalculated net erosion rates to these losses, indicate that theuse of 210Pbex in burned watersheds warrants caution andfurther investigation. Our study also implicates the importanceof knowing the 60–100 year fire history of a site before using210Pbex inventories.
Conclusions
We measured the 210Pbex content of soils in unburned, moder-ately and severely burned forested sites to investigate the appli-cation of 210Pbex inventories in burned landscapes. The strongassociation of 210Pbex with organic material greatly impactsthe use of inventories to quantify net erosion and depositionrates in burned watersheds because organic matter is inherentlyconsumed in fires. Our results indicate that 210Pbex losses aregreater related to more severe burns, but 210Pbex distributionsvary more in moderate severity burns where fire behavior ismore spatially diverse. As such, careful quantification of spatialvariability in both reference and hillslope inventories is crucialto differentiate between natural fallout variability and netsoil loss or gain. Most importantly, 210Pbex losses in burnedwatersheds ultimately affect the magnitude of calculated neterosion and deposition rates. This implies that 210Pbex can beused to compare intra-site net sediment losses and gains, butis likely unsuitable to determine absolute net erosion anddeposition rates in burned terrain and for comparing such ratesbetween burned and unburned sites.
Acknowledgments—The authors wish to thank the Payette and BoiseNational Forests for granting access to the study sites, and the staffand students at the University of Exeter Radiometry Laboratory whosehelp was invaluable. Insightful comments from William Blake and ananonymous reviewer helped to strengthen and refine this paper. Thiswork was funded by the NSF Idaho EPSCoR Program and the NationalScience Foundation under award number EPS-0814387.
ReferencesAalto R. 2002. Geomorphic Form and Process of Mass Flux within anActive Orogen: Denudation of the Bolivian Andes and SedimentTransport and Deposition within the Channel-floodplain Systems ofthe Amazonian Foreland, unpublished PhD Thesis, University ofWashington, Seattle, WA; 365pp.
Aalto R, Dietrich WE. 2005. Sediment accumulation determined with210Pb geochronology for Strickland River floodplains, Papua NewGuinea. In Sediment Budgets I, Walling DE, Horowitz J (eds). IAHSPress: Wallingford; 303–309.
Copyright © 2012 John Wiley & Sons, Ltd.
Aalto R, Nittrouer CA. 2012. 210Pb geochronology of flood events inlarge tropical river systems. Philosophical Transactions of the RoyalSociety A 370: 2040–2074. DOI: 10.1098/rsta.2011.0607
Aalto RE, Maurice-Bourgoin L, Dunne T, Montgomery DR, NittrouerCA, Guyot JL. 2003. Episodic sediment accumulation on Amazonianfloodplains influenced by ENSO. Nature 425: 493–497. DOI:10.1038/nature02002
Aalto RE, Lauer JW, Dietrich WE. 2008. Spatial and temporal dynamicsof Strickland River floodplains during the past century. Journal ofGeophysical Research – Earth Surface 113: F01S04. DOI: 10.1029/2006JF000627
Agee JK. 1993. Fire Ecology of Pacific Northwest Forests. Island Press:Washington, DC; 493.
Appleby PG. 2008. Three decades of dating recent sediments by falloutradionuclides: a review. The Holocene 18: 83–93. DOI: 10.1177/0959683607085598
Appleby PG, Oldfield F. 1992. Application of lead-210 to sedimenta-tion studies. In Uranium-series Disequilibrium: Applications to Earth,Marine, and Environmental Sciences, Ivanovich M, Harmon RS (eds).Clarendon Press: Oxford; 731–778.
Arkle RS, Pilliod DS, Strickler K. 2010. Fire, flow and dynamic equilib-rium in stream macroinvertebrate communities. Freshwater Biology55: 299–314. DOI: 10.1111/j.1365–2427.2009.02275.x
Benda L, Dunne T. 1997. Stochastic forcing of sediment routingand storage in channel networks. Water Resources Research 33:2865–2880. DOI: 10.1029/97WR02388
Benda L, Miller D, Bigelow P, Andras K. 2003. Effects of post-wildfireerosion on channel environments, Boise River, Idaho. ForestEcology and Management 178: 105–119. DOI: 10.1016/S0378–1127(03)00056–2
Bennet EH. 1980. Granitic rocks of tertiary age in the Idaho batholithand their relation to mineralization. Economic Geology 75: 278–288.
Blake WH, Droppo IG, Humphreys GS, Doeer SH, Shakesby RA,Wallbrink PJ. 2007. Structural characteristics and behavior of fire-modified soil aggregates. Journal of Geophysical Research – EarthSurface 112: F02020. DOI: 10.1029/2006JF000660
Blake WH, Wallbrink PJ, Wilkinson SN, Humphreys GS, Doerr SH,Shakesby RA, Tomkins KM. 2009. Deriving sediment budgets inwildfire-affected forests using fallout radionuclide tracers. Geomor-phology 104: 105–116. DOI: 10.1016/j.geomorph.2008.08.004
Clayton RF, Bradley EJ. 1995. A cost effective method for determinationfor 210Po and 210Pb in environmental materials. The Science of theTotal Environment 173/174: 23–28. DOI: 10.1016/0048–9697(95)04753–0
Clayton JL, Megahan WF. 1997. Natural erosion rates and theirprediction in the Idaho batholith. Journal of the American WaterResources Association 33: 689–703. DOI: 10.1111/j.1752–1688.1997.tb03542.x
Dunham JB, Rosenberger AE, Luce CH, Rieman BE. 2007. Influencesof wildfire and channel reorganization on spatial and temporalvariation in stream temperature and the distribution of fish and amphi-bians. Ecosystems 10: 335–346. DOI: 10.1007/s10021–007–9029–8
Forest Service. 2010. Boise National Forest Historical FirePolygons. USDA Forest Service, Boise National Forest: Boise,ID. http://www.fs.usda.gov/boise [May 2011].
French NH, Kasischke ES, Hall RJ, Murphy KA, Verbyla DL, Hoy EE,Allen JL. 2008. Using Landsat data to assess fire and burn severityin the North American boreal forest region: an overview andsummary of results. International Journal of Wildland Fire 17:443–462. DOI: 10.1071/WF08007
]Gibson WM. 1961. The Radiochemistry of Lead, National Academy ofSciences National ResearchCouncil Subcommittee on Radiochemistry,NAS-NS 3040. National Academy of Sciences National ResearchCouncil: Washington, DC; 158.
Gimeno-Garcia E, Andreu V, Rubio JL. 2000. Changes in organicmatter, nitrogen, phosphorus and cations in soils as a result offire and water erosion in a Mediterranean landscape. EuropeanJournal of Soil Science 51: 201–210. DOI: 10.1046/j.1365–2389.2000.00310.x
Goodbred SL Jr, Kuehl SA. 1998. Floodplain processes in the BengalBasin and the storage of Ganges-Brahmaputra river sediment: anaccretion study using 137Cs and 210Pb geochronology. SedimentaryGeology 121: 239–258. DOI: 10.1016/S0037–0738(98)00082–7
Earth Surf. Process. Landforms, (2012)
L. M. PERREAULT, E. M. YAGER AND R. AALTO
Gorsuch TT. 1959. Radiochemical investigations on the recovery foranalysis of trace elements in organic and biological materials.Analyst 84: 135–173. DOI: 10.1039/AN9598400135
Harden JW, Neff JC, Sandberg DV, Turetsky MR, Ottmar R, Gleixner G,Fries TL, Manies KL. 2004. Chemistry of burning the forest floorduring the FROSTFIRE experimental burn, interior Alaska, 1999.Global Biogeochemical Cycles 18: GB3014. DOI: 10.1029/2003GB002194
Haynes WM (editor in chief). 2011. Handbook of Chemistry andPhysics. CRC Press: Boca Raton, FL; 4–122.
He Q, Walling DE. 1996. Interpreting particle size effects in theadsorption of 137Cs and unsupported 210Pb by mineral soils andsediments. Journal of Environmental Radioactivity 30: 117–137.DOI: 10.1016/0265–931X(96)89275–7
Idaho State Climate Services (ISCS). 2000. Precipitation for Idaho:Mean Annual 1961–1990. Moscow, ID: ISCS. http://cloud.insidei-daho.org/index.html [March 2011].
Kaste JM, Friedland AJ, Sturup S. 2003. Using stable and radioactiveisotopes to trace atmospherically deposited Pb in montane forestsoils. Environmental Science & Technology 37: 3560–3567. DOI:10.1021/es026372k
Kaste JM, Heimsath AM, Hohmann M. 2006. Quantifying sedimenttransport across an undisturbed prairie landscape using cesium-137and high resolution topography. Geomorphology 76: 430–440.DOI: 10.1016/j.geomorph.2005.12.007
Kaste JM, Heimsath AM, Bostick BC. 2007. Short-term soil mixingquantified with fallout radionuclides. Geology 35: 243–246. DOI:10.1130/G23355A.1
Kato H, Onda Y, Tanaka Y. 2010. Using 137Cs and 210Pbex measure-ments to estimate soil redistribution rates on semi-arid grasslandin Mongolia. Geomorphology 114: 508–519. DOI: 10.1016/j.geomorph.2009.08.009
Keeley JE. 2009. Fire intensity, fire severity and burn severity: a briefreview and suggested usage. International Journal of Wildland Fire18: 116–126. DOI: 10.1071/WF07049
Key CH, Benson NC. 2006. Landscape assessment (LA): samplinganalysis and methods. In FIREMON: fire effects monitoring andinventory system, LutesD, KeaneR, Caratti J, Carl H, BensonN, SutherlandS, Gangi L (eds), General Technical Report No. RMRS-GTR-164-CD.USDA Service Rocky Mountain Research Station: Fort Collins, CO;LA 1–55.
Lewis RS, Kiilsgaard TH. 1991. Eocene plutonic rocks in south centralIdaho. Journal of Geophysical Research – Solid Earth and Planets96: 13,295–13,3111. DOI: 10.1029/91JB00601
Mabit L, Bernard C. 2007. Assessment of spatial distribution of falloutradionuclides through geostatistics concept. Journal of Environmen-tal Radioactivity 97: 206–219. DOI: 10.1016/j.jenvrad.2007.05.008
Mabit L, Bernard C, Laverdiere MR. 2007. Assessment of erosion in theBoyer River watershed (Canada) using a GIS oriented samplingstrategy and 137Cs measurements. Catena 71: 242–249. DOI:10.1016/j.catena.2006.02.011
Mabit L, Benmansour M, Walling DE. 2008. Comparative advantages andlimitations of the fallout radionuclides 137Cs, 210Pbex and
7Be for asses-sing soil erosion and sedimentation. Journal of Environmental Radioactiv-ity 99: 1799–1807. DOI: 10.1016/j.jenvrad.2008.08.009
Malmon DV, Reneau SL, Katzman D, Lavine A, Lyman J. 2007.Suspended sediment transport in an ephemeral stream followingwildfire. Journal of Geophysical Research – Earth Surface 112:F02006. DOI: 10.1029/2005JF000459
Martell EA. 1974. Radioactivity of tobacco trichomes and insolublecigarette smoke particles. Nature 249: 215–217. DOI: 10.1038/249215a0
Martin A, Blanchard RL. 1969. The thermal volatilisation of Caesium-137, Polonium-210 and Lead-210 from in vivo labelled samples.Analyst 94: 441–446. DOI: 10.1039/an9699400441
Minshall GW. 2003. Responses of stream benthic macroinvertebratesto fire. Forest Ecology and Management 178: 155–161. DOI:10.1016/S0378–1127(03)00059–8
Monitoring Trends in Burn Severity (MTBS). 2010. USDA ForestService: Washington, DC. http://mtbs.gov/index.html [March 2011]
Moody JA, Martin DA. 2009. Synthesis of sediment yields afterwildland fire in different rainfall regimes in the western United States.
Copyright © 2012 John Wiley & Sons, Ltd.
International Journal of Wildland Fire 18: 96–115. DOI: 10.1071/WF07162
National Interagency Fire Center (NIFC). 2011. Wildland fire statistics:2007 year-to-date report on fires and acres burned by state. NIFC:Boise, ID. http://www.nifc.gov/fireInfo/fireInfo_stats_lgFires.html [5January 2011]
Nazaroff WW. 1992. Radon transport from soil to air. Reviews ofGeophysics 30: 137–160. DOI: 10.1029/92RG00055
Neary DG, Klopatek CC, DeBano LF, Ffolliot PF. 1999. Fire effectson belowground sustainability: a review and synthesis. Forest Ecologyand Management 122: 51–71. DOI: 10.1016/S0378–1127(99)00032–8
Nittrouer CA, Sternberg RW, Carpenter R, Bennett JT. 1979. The use ofPb-210 geochronology as a sedimentological tool: application to theWashington continental shelf. Marine Geology 31: 297–316. DOI:10.1016/0025–3227(79)90039–2
Nozaki Y, DeMaster DJ, Lewis DM, Turekian KK. 1978. Atmospheric210Pb fluxes determined from soil profiles. Journal of GeophysicalResearch – Oceans and Atmospheres 83: 4047–4051. DOI:10.1029/JC083iC08p04047
O’Farrell CR, Heimsath AM, Kaste JM. 2007. Quantifying hillslopeerosion rates and processes for a coastal California landscapeover varying timescales. Earth Surface Processes and Landforms 32:544–560. DOI: 10.1002/esp.1407
Owens PN, Blake WH, Petticrew EL. 2006. Changes in sedimentsources following wildfire in mountainous terrain: a paired-catchment approach, British Columbia, Canada. Water, Air, and SoilPollution: Focus 6: 637–645. DOI: 10.1007/s11267–006–9048–z
Paatero J, Vesterbacka K, Makkonen U, Kyllonen K, Hellen H,Hatakka J, Anttila P. 2009. Resuspension of radionuclides intothe atmosphere due to forest fires. Journal of Radioanalyticaland Nuclear Chemistry 282: 473–476. DOI: 10.1007/s10967–009–0254–9
Reneau SL, Katzman D, Kuyumjian GA, Lavine A, Malmon DV. 2007.Sediment delivery after a wildfire. Geology 35: 151–154. DOI:10.1130/G23288A.1
Ritchie JC, McHenry JR. 1990. Application of radioactive falloutcesium-137 for measuring soil erosion and sediment accumulationrates and patterns: a review. Journal of Environmental Quality 19:215–233.
Schery SD, Gaeddert DH, Wilkening MH. 1984. Factors affectingexhalation of radon from a gravelly sandy loam. Journal of Geophys-ical Research-Atmospheres 89: 7299–7309. DOI: 10.1029/JD089iD05p07299
Shakesby RA, Doerr SH. 2006. Wildfire as a hydrological and geomor-phological agent. Earth-Science Reviews 74: 269–307. DOI:10.1016/j.earscirev.2005.10.006
Shakhashiro A, Mabit L. 2009. Results of an IAEA inter-comparisonexercise to assess 137Cs and total 210Pb analytical performance insoil. Applied Radiation and Isotopes 67: 139–146. DOI: 10.1016/j.apradiso.2008.07.014
Shuster RD, Bickford ME. 1985. Chemical and isotopic evidence for thepetrogenesis of the northeastern Idaho batholith. Journal of Geology93: 727–742.
Stohl A, Berg T, Burkhart JF, Fjaeraa AM, Forster C, Herber A, Hov O,Lunder C, McMillan WW, Oltmans S, Shiobara M, Simpson D, Sol-berg S, Stebel K, Strom J, Torseth K, Treffeisen R, Virkkunen K, YttriKE. 2007. Arctic smoke – record high air pollution levels in theEuropean Arctic due to agricultural fires in Eastern Europe in spring2006. Atmospheric Chemistry and Physics 7: 511–534. DOI:10.5194/acp–7–511–2007
Sutherland RA. 1994. Spatial variability of 137Cs and the influence ofsampling on estimates of sediment redistribution. Catena 21: 57–71.DOI: 10.1016/0341–8162(94)90031–0
Wakiyama Y, Onda Y, Mizugaki S, Asai H, Hiramatsu S. 2010. Soilerosion rates on forested mountain hillslopes estimated using137Cs and 210Pbex. Geoderma 159: 39–52. DOI: 10.1016/j.geoderma.2010.06.012
Wallbrink PJ, Murray AS. 1996. Determining soil loss using the inventoryratio of excess lead-210 to cesium-137. Soil Science Society of AmericaJournal 60: 1201–1208.
Wallbrink PJ, Olley JM, Murray AS. 1994. Measuring Soil Movementusing 137Cs: Implications of Reference Site Variability, IAHS Publication224. IAHS Press: Wallingford; 95–102.
Earth Surf. Process. Landforms, (2012)

APPLYING 210PBEX INVENTORIES TO MEASURE BURNED HILLSLOPE EROSION
Wallbrink PJ, Roddy BP, Olley JM. 2002. A tracer budget quantifyingsoil redistribution on hillslopes after forest harvesting. Catena 47:179–201. DOI: 10.1016/S0341–8162(01)00185–0
Walling DE, He Q. 1999a. Using fallout lead-210 measurements toestimate soil erosion on cultivated land. Soil Science Society ofAmerica Journal 63: 1404–1412.
WallingDE,HeQ. 1999b. Improvedmodels for estimating soil erosion rates fromcesium-137measurements. Journal of Environmental Quality 28: 611–622.
Walling DE, Collins AL, Sichingabula HM. 2003. Using unsupportedlead-210 measurements to investigate soil erosion and sediment
Copyright © 2012 John Wiley & Sons, Ltd.
delivery in a small Zambian catchment. Geomorphology 52:193–213. DOI: 10.1016/S0169–555X(02)00244–1
Zar JH. 1994. Biostatistical Analysis, 4th edn. Prentice Hall: UpperSaddle River, NJ; 145–158, 195–200, 335, 423.
Zientek ML, Derkey PD, Miller RJ, Causey JD, Bookstrom AA,Carlson MH, Green GN, Frost TP, Boleneus DE, Evans KV,Van Gosen BS, Wilson AB, Larsen JC, Kayser HZ, KelleyWN, Assmus KC. 2005. Spatial Databases for the Geology of theNorthern Rocky Mountains – Idaho, Montana, and Washington,Open-File Report 2005–1235. US Geological Survey: Reston, VA.
Earth Surf. Process. Landforms, (2012)