Embed Size (px)
Citation preview
Author's personal copy
SYSTEMATIC REVIEW
The ActivityStat Hypothesis
The Concept, the Evidence and the Methodologies
Sjaan R. Gomersall • Alex V. Rowlands •
Coralie English • Carol Maher • Tim S. Olds
Published online: 20 December 2012
� Springer International Publishing Switzerland 2012
Abstract
Background The ActivityStat hypothesis suggests that
when physical activity is increased or decreased in one
domain, there will be a compensatory change in another
domain, in order to maintain an overall stable level of
physical activity or energy expenditure over time. The
ActivityStat debate is gaining momentum in the literature
and most of the research to date is based on observational
studies.
Objective The objective of this paper is to conceptually
clarify the ActivityStat hypothesis and to examine the
experimental research aiming to demonstrate or refute
compensation using a systematic review process.
Methods A systematic review was conducted using
electronic database searches with the aim of detecting
studies experimentally investigating the ActivityStat
hypothesis or compensation in physical activity or energy
expenditure. Included studies were critically appraised
using a specifically designed tool to address the conceptual
considerations of the ActivityStat hypothesis.
Results Searches identified 28 studies that met the
inclusion criteria. Publications spanned 26 years and had
multiple methodological approaches, including randomized
and non-randomized controlled trials, crossover designs,
cluster randomized controlled trials and pre-post trials.
Populations of the included studies ranged from children,
to adults and the elderly, across a range of weight statuses
and used both aerobic, resistance and mixed-exercise
interventions. The timeframe of interventions ranged from
1 day to 4 years and outcomes were measured using dou-
bly labelled water, accelerometry, heart rate monitoring,
resting metabolic rate, indirect calorimetry, pedometry,
subjective recall questionnaire and the activity-related time
index. Fifteen of 28 included studies provided evidence of
compensation, while 13 did not. Subgroup analyses by
population, type and duration of intervention, weight status
and study quality also showed mixed findings.
Conclusion There is a substantial body of experimental
literature investigating compensation that has largely been
overlooked in the ActivityStat debate. However, this evi-
dence is currently inconclusive and lacks a cohesive
approach to the question of an ActivityStat. Recommen-
dations for the design of future experimental research
investigating the ActivityStat hypothesis are presented.
1 Introduction
The ActivityStat hypothesis suggests that when physical
activity is increased or decreased in one domain, there will
be a compensatory change in another domain, in order to
maintain an overall stable level of physical activity or
energy expenditure over time [1]. The two primary
Electronic supplementary material The online version of thisarticle (doi:10.1007/s40279-012-0008-7) contains supplementarymaterial, which is available to authorized users.
S. R. Gomersall (&) � A. V. Rowlands � C. Maher � T. S. Olds
Health and Use of Time (HUT) Group,
Sansom Institute for Health Research, University of South
Australia, GPO Box 2471, Adelaide, SA 5001, Australia
e-mail: [email protected]
A. V. Rowlands
Exercise for Health and Human Performance (EHHP) Group,
Sansom Institute for Health Research, University of South
Australia, Adelaide, SA, Australia
C. English
International Centre for Allied Health Evidence (iCAHE),
School of Health Sciences, University of South Australia,
Adelaide, SA, Australia
Sports Med (2013) 43:135–149
DOI 10.1007/s40279-012-0008-7
Author's personal copy
components of the ActivityStat mechanism are therefore
(1) a set point of physical activity or energy expenditure;
and (2) compensatory strategies to maintain physical
activity or energy expenditure at that set point. Thomas
Rowland [1] first put forward the concept of the ‘Activi-
tyStat’ as part of a seminal narrative review on the bio-
logical basis of physical activity. In the large body of
physical activity literature, biological determinants of
activity have historically received little attention compared
with their psychosocial and environmental counterparts.
However, the debate about if and how our biology under-
pins our physical activity and energy expenditure now
appears to be gaining momentum in the literature.
It is important to clarify that the concepts of biological
control of energy expenditure and the ActivityStat
hypothesis are not coextensive. While the ActivityStat
hypothesis assumes a biological basis for the regulation of
physical activity or energy expenditure, evidence of bio-
logical determinants of physical activity or energy expen-
diture is not, per se, evidence of the existence of the
ActivityStat. There is considerable evidence that energy
expenditure is at least partially biologically regulated.
Building on the work of Rowland [1], more recent reviews
by Eisenmann and Wickel [2] and Garland and colleagues
[3] have put forward evidence of plausible neurohumeral
mechanisms for biological control of physical activity
based on both rodent and human research. The Activity-
Stat, however, is a specific model of how biological
mechanisms may operate.
There has been an increasing interest in the ActivityStat
concept of late and recent publications demonstrate that the
issue is hotly contested in the physical activity research
forum [4, 5]. The number of published papers alone pur-
porting to investigate the ActivityStat hypothesis is indic-
ative of a growing trend in the literature. The complete
body of literature on the ActivityStat and its components is
difficult to collate. It includes papers published prior to the
articulation of the ActivityStat hypothesis that have largely
been used to support the concept, papers with post hoc
‘ActivityStat’ analyses of existing data sets, papers that
inadvertently investigate the hypothesis by testing compen-
sation or set points and, more recently, studies that have been
purposefully designed to investigate the ActivityStat. As a
result, there have been many methodological approaches to
this question, with very little consistency in terminology and
without careful consideration of the ActivityStat as a
homeostatic mechanism. And while several reviews are
available on the broader concept of biological control [2, 3, 6,
7] of physical activity and energy expenditure, it is not sur-
prising that there have been no systematic reviews more
specifically of the ActivityStat mechanism.
The purpose of this paper is to conceptually clarify the
ActivityStat hypothesis and to draw together and critically
appraise the empirical research aiming to demonstrate or
refute compensation using a systematic review process. In
doing so, we hope to improve the clarity in discussion and
methodological approaches addressing the existence of an
‘ActivityStat’.
2 Conceptualizing the ActivityStat as a Homeostatic
Model
2.1 The Nature of Homeostatic Systems
As the name suggests, the ActivityStat is proposed as a
homeostatic mechanism, similar to many other biologically
regulated variables [8]. The concept of homeostasis was
first recognized 150 years ago by Claude Bernard, who
described the constancy of the milieu interieur. Walter
Cannon, in 1935, then introduced the term ‘homeostasis’ to
describe this concept [9]. Homeostasis allows for stability
in dynamic systems by the process of negative feedback,
despite continual change taking place both internally and
externally. Whenever an imbalance occurs, regulatory
systems become active to restore baseline or set-point
conditions [8].
A homeostatic mechanism has several prerequisite
components:
• a ‘variable’ that is being regulated;
• an internal ‘set-point zone’, representing the target state
of the system, towards which the feedback loop
regulates the controlled variable;
• a ‘sensor’ monitoring the current state of the variable;
• an ‘integrator’ comparing the target and current states
of the variable;
• an ‘effector’ that acts to change the value of the
variable when the sensor detects a sufficiently large
difference between the current and target values [8].
A well-known example of a homeostatic mechanism is
the way in which internal body temperature is regulated,
despite disruptions in temperature both internally and
externally. In temperature regulation, the ‘set point’ in
humans is approximately 37�C, the ‘sensors’ are located in
the hypothalamus to detect change in core temperature and
the skin to monitor external temperature, the ‘integrator’ is
located in the thermoregulatory centre in the hypothalamus
and the ‘effectors’ include blood vessels, sweat glands and
smooth and skeletal muscle, coordinated by neural sys-
tems. In addition, there are behavioural responses that
contribute to increasing or decreasing temperature [8].
There is little agreement as to the likely somatic hard-
ware associated with an ActivityStat, but it is usually
envisaged in the following way: the ‘set point’ represents a
target level of physical activity or energy expenditure; the
136 S. R. Gomersall et al.
Author's personal copy
‘sensor’ perhaps lies in the hypothalamus in the central
nervous system, where blood-borne cues are interpreted;
the ‘integrator’ is a neural circuit; and the ‘effector’ uses a
hypothalamic feedback loop to dampen down voluntary
activity, through as yet unknown humoral or neural
mechanisms, with the dopaminergic and endocannabinoid
systems suggested as potential mediators [3, 7]. In addition,
the nature of a homeostatic system is symmetrical, sug-
gesting that while an increase in the regulated variable will
result in a dampening by effectors, a decrease would
conversely result in a ramping up by the effectors. In the
case of physical activity or energy expenditure homeosta-
sis, this concept can be referred to as ‘ActivityGenesis’, the
generation of energy expenditure to return the system to its
set point.
Research into the neurobiological control of physical
activity and spontaneous physical activity is currently in its
infancy. However, there is significant evidence to suggest
that there are clear links between biological signalling and
physical activity behaviour, although much is still
unknown about the pathways and their directionality [3].
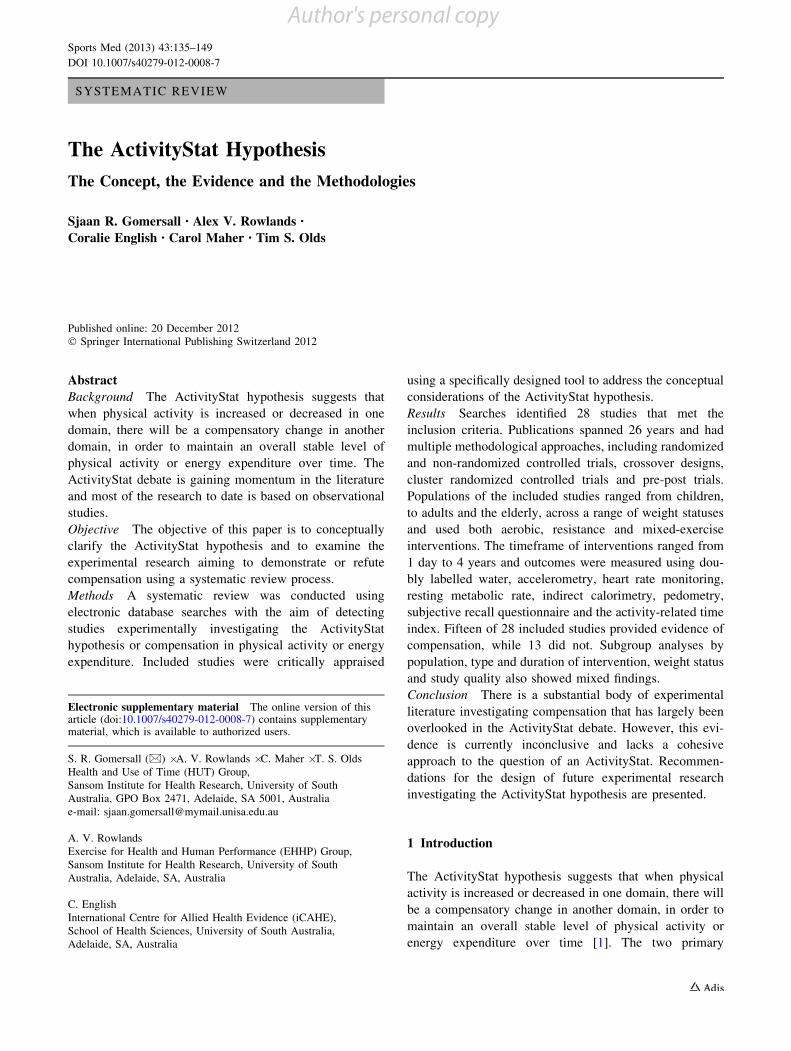
2.2 Patterns of Response in Homeostatic Systems
A schematic representation of a typical response pattern in
a homeostatic mechanism when there is an increase in the
regulated variable is presented in Fig. 1. External pertur-
bation of the system will make it deviate from its target
state, but it will gradually return to its set point as the
effector is activated.
In Fig. 1, the ‘set point’ is the point at which the system
will fluctuate about and the set-point zone is defined by a
band of response variable values within which the effector
is not triggered and outside of which the effector is trig-
gered. The width of the band is the ‘tolerance’ of the
system. If the system deviates from the set point outside of
the tolerance zone, the effector is triggered. It may then
take a period of time to return the system to the target zone
and, in the meantime, there is a degree of ‘overshoot’
(deviation between the actual system state and the target).
Eventually, the effector will bring the system back within
the tolerance zone and eventually back to the set point. The
time it takes from the effector starting and the system
returning to the zone is the ‘lag’ time.
Strong effectors will result in short lag times and small
overshoots, whereas weak effectors will have longer lag
times and large overshoots. At times, the external stimulus
may be so great as to overwhelm the homeostat, at least for
a time. This can occur with sleep, for example, where a
very strong external stimulus can temporarily override
sleep pressure [10]. Should the ActivityStat exist and
function as a homeostatic system, it is important to take
these patterns into consideration when interpreting existing
data or purposefully designing research to support or refute
its existence.
3 Components of the ActivityStat Homeostatic Model
3.1 The Regulated Variable
When considering an ActivityStat, it is important to be
clear about what is being hypothesized as the regulated
variable. Some studies use physical activity as the regu-
lated variable, while others use energy expenditure. While
daily moderate to vigorous physical activity (MVPA) and
daily energy expenditure are usually correlated [11], it is
quite possible that there may be no compensation in MVPA
(i.e. higher levels of physical activity are sustained under
stimulus) with concurrent compensation in energy expen-
diture. This would happen if there were a shift from light
activity to sedentary behaviour (say from 2–3 metabolic
equivalents [METs] to 1–2 METs, where METs are mul-
tiples of basal metabolic rate) or indeed a drop in resting
metabolic rate (RMR). The opposite is also possible,
though on the face of it somewhat less plausible; there may
be compensation in MVPA, but no compensation in energy
expenditure. This would happen if there was a reduction in
MVPA outside of the physical activity programme (e.g.
active transport, stair climbing) with a concurrent shift in
sedentary behaviour to light activity and perhaps an
increase in RMR. Practically, it is important to be clear
about just what is being compensated, as it will determine
which outcome measures are most appropriate.
3.2 Timeframe for Compensation
If compensation does occur, we are currently unsure of the
timeframe. The timeframe for compensation is directly
related to the lag time of the response curve (Fig. 1). It is
Overshoot
Tolerance
Set point
Effector starts
Externalstimulus
Peak
Time
Lag
Back in zone
Fig. 1 Typical response pattern of a homeostatic system when there
is an increase in the regulated variable above the systems set point.
The axis scales are arbitrary
The ActivityStat Hypothesis 137
Author's personal copy
unlikely that an ActivityStat would function within hours or a
day and may be quite slow, operating not from day to day, but
rather over weeks or even months. The timeframe for com-
pensation is of practical importance, as it will direct meth-
odological choices regarding design, frequency of
measurement and the duration of the intervention. This is
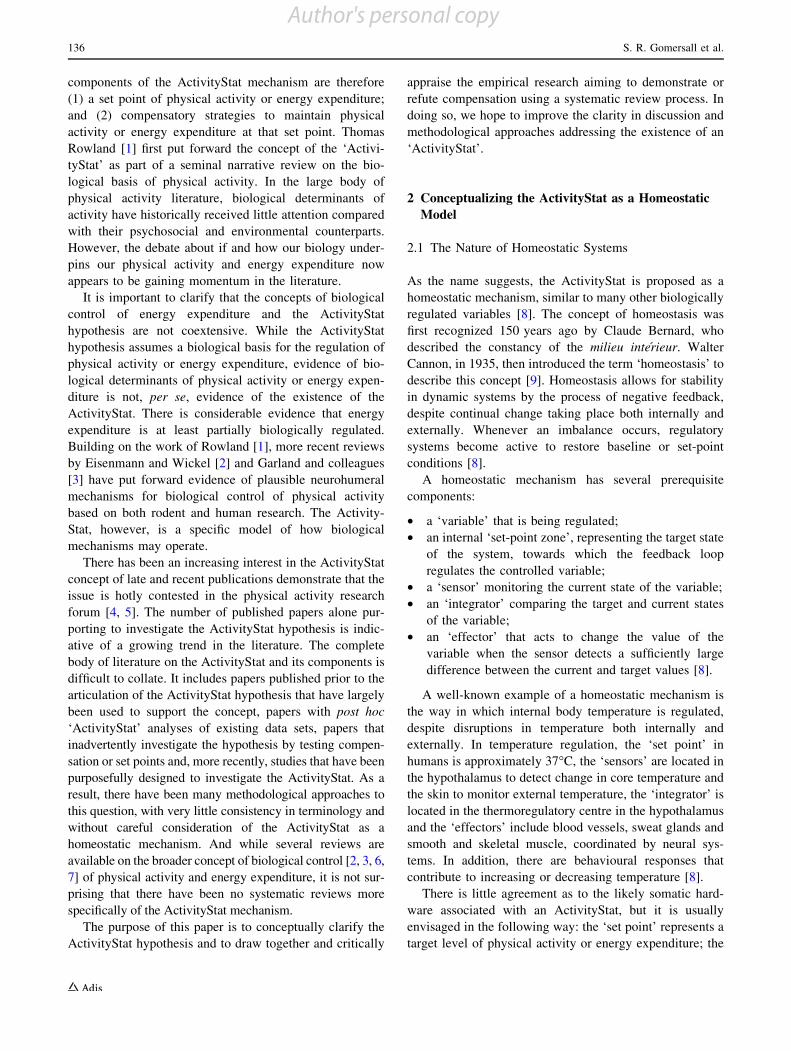
illustrated in Fig. 2, where the light grey curved line shows
physical activity or energy expenditure returning to baseline
after 4 days and the dark grey curved line shows it returning to
baseline after 8 days. If measurements are taken at baseline
and about day 4 (indicated by the arrows and corresponding
circles), there appears to be little compensation for the 8-day
curve, but almost complete compensation for the 4-day curve.
3.3 Tolerance
The tolerance of the system relates to the volume of
stimulus required before a compensatory response will be
triggered. We are currently unsure of what the tolerance of
the hypothesized ActivityStat may be. It is possible, for
example, that in a design with a small exercise dose,
homeostatic compensation will not be triggered because it
is below the sensitivity threshold of the ActivityStat. Fur-
ther, it is not only the intended intensity and duration of the
stimulus that are important when investigating the Activi-
tyStat, but also compliance with the exercise protocol. In
comparison to efficacy studies, where intent-to-treat anal-
yses are appropriate, it is necessary for studies investigating
compensation to conduct a per protocol analysis, as exposure
to the stimulus must be confirmed before drawing conclu-
sions about compensatory behaviours.
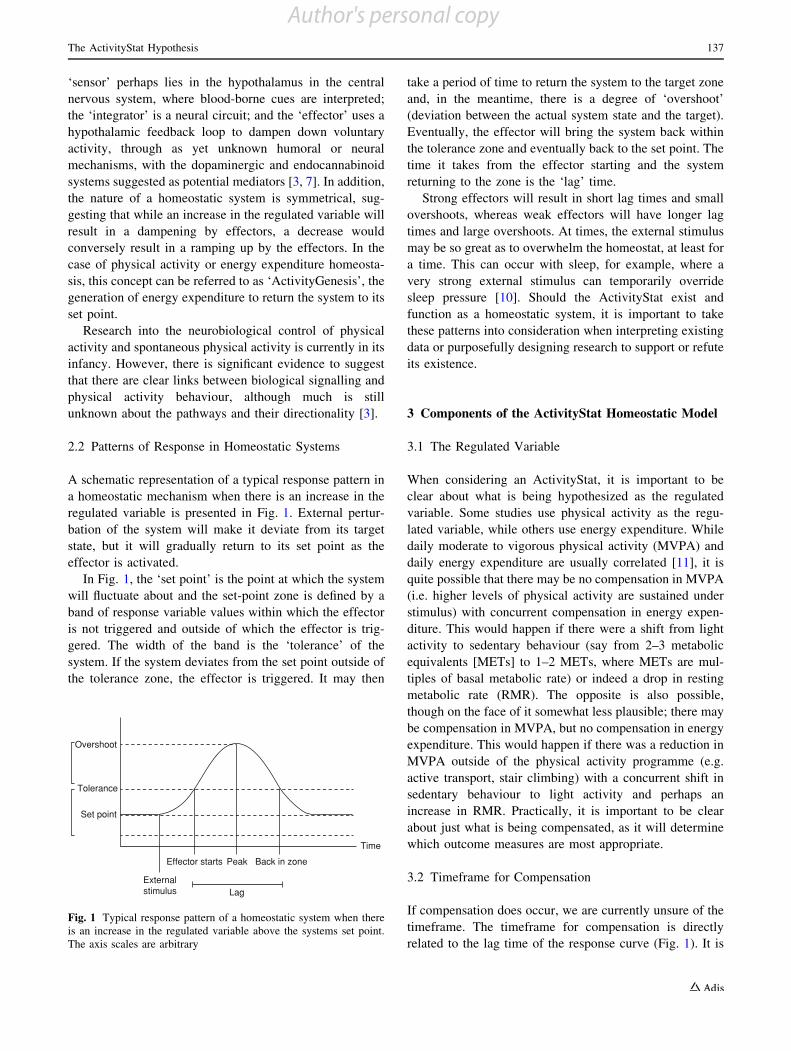
3.4 Variable versus Fixed Set Points
In most familiar homeostats, such as thermostats, the set
point is fixed. However, it is likely that the ActivityStat
setpoint may be flexible and dynamic; varying, for exam-
ple, with season, age or energy intake. It is widely accepted
that total energy expenditure [12] and MVPA [13–15] vary
systematically with age, and physical activity levels are
higher in the warmer months and decline during the colder
seasons [16]. Layered on top of this is a large intra-indi-
vidual variability in daily physical activity levels of
approximately 20% [2, 17]. While all systems show some
variability, high variability represents noise that may mask
the underlying pattern. Figure 3 demonstrates the com-
plexity that variability adds to detecting an ActivityStat.
Panel (a) shows a declining baseline in MVPA; panel
(b) superimposes the effect of seasonal variation;
panel (c) superimposes on that weekly variation; and panel
(d) adds random intraindividual variability.
10
9
8
7
6
5
4
3
2
1
00 4 8
Fig. 2 Two possible responses to an imposed stimulus. The lightgrey curved line shows physical activity or energy expenditure
returning to baseline after 4 days and the dark grey curved line shows
it returning to baseline after 8 days. If measurements are taken at
baseline and about day 4 (indicated by the arrows and corresponding
circles), there appears to be little compensation for the 8-day curve,
but almost complete compensation for the 4-day curve
100
90
80
70
60
50
40
10 11
Age (years)
1210.5 11.5 10 11 1210.5 11.5
100a
c
b
d
90
80
70
60
50
40
Fig. 3 The effects of maturation, seasonal, weekly and random
variability on levels of moderate to vigorous physical activity [2, 13–
17] (units of measurement in the figure are arbitrary). (a) Shows a
declining baseline in moderate to vigorous physical activity;
(b) superimposes the effect of seasonal variation; (c) superimposes
on that weekly variation; and (d) adds random intraindividual
variability
138 S. R. Gomersall et al.

Author's personal copy
4 The Evidence
The first paper to publish data with specific reference to an
ActivityStat was Dale and colleagues in 2000 [18], an
experimental crossover study, only 2 years after Thomas
Rowland initially put forward the concept [1]. Dale et al.
[18] found no compensatory increase in physical activity
after school when lunchtime and physical education
physical activity was restricted in primary school children,
measured using accelerometry. It wasn’t until 6 years later
that Wilkin and colleagues [19] published EarlyBird 16,
which brought considerable attention to the ActivityStat
hypothesis. Wilkin et al. published cross-sectional data
demonstrating in children that there was no difference in
total physical activity as measured by accelerometry
among schools with large differences in timetabled physi-
cal education, and between children who walked to school
and those who were driven to school [19]. Since this paper,
there have been six further publications primarily aiming to
test the ActivityStat hypothesis, five investigating the
ActivityStat in children quantifying physical activity using
accelerometry [20–24] and one investigating it in adults
using pedometry [25]. Three of these seven studies inter-
preted their findings as demonstrating an ActivityStat by
providing evidence of a set point of energy expenditure
[19, 21, 24]. With the exception of Dale and colleagues
[18], whose findings did not support the existence of an
ActivityStat, all of these studies are observational in
design—that is they did not impose an experimental
exercise stimulus.
It is important to acknowledge that these observational,
cross-sectional studies make up the basis of the current
literature specifically addressing the ActivityStat hypo-
thesis. Observational studies play an important role in the
development of new concepts by providing evidence of
association [26]. However, there are several methodologi-
cal limitations to this approach when interpreting results in
the context of a homeostatic model. Observational studies,
by their design, provide little opportunity to investigate the
characteristics of the ActivityStat, instead making a series
of assumptions about its characteristics. These studies
largely assume physical activity as the regulated variable
and are unable to explore the timeframe of compensation or
tolerance of the system as there is no imposed stimulus for
compensation. More importantly, the lack of a control
group means that dynamic set points cannot be accounted
for.
By comparison, experimental studies offer the oppor-
tunity to test the ActivityStat hypothesis by investigating
intra-individual changes in the regulated variable in
response to an imposed stimulus under carefully designed
conditions. Despite some commonly cited experimental
papers in the ActivityStat debate [18, 27, 28], there is no
published review of these studies to date. A systematic
review was therefore undertaken to identify, critique and
synthesize studies experimentally investigating the Activ-
ityStat hypothesis or compensation in physical activity or
energy expenditure.
4.1 Methodology
Published studies were identified through electronic data-
base searches of EBSCOhost (including Academic Search
Premier, CINAHL, Health Source Nursing/Academic
Edition and SPORTDiscusTM), Web of Knowledge
(including MEDLINE and Web of Science), EMBASE,
Scopus and Google Scholar. Search terms combined key
words for the topics of interest (e.g. ‘activitystat’, ‘com-
pensation’, ‘physical activity’, ‘energy expenditure’).
Readers are able to obtain the full search strategy in the
Online Resource (please refer to table 1 [Online Resource
1]). Databases were searched in June 2011 and an update
was performed in December 2011. References of all
retrieved studies were reviewed for further studies.
Searches were restricted to full-text manuscripts and
studies published in the English language. Studies were
selected for inclusion if they met the following criteria:
(1) studies were original research and experimental in
design with an imposed exercise stimulus; (2) the study
made explicit reference to compensation; (3) the study
reported data on compensation of a measure of physical
activity or energy expenditure; and (4) participants were
human, under free-living conditions (other than their
imposed exercise).
Titles and abstracts of all database returns were exam-
ined for inclusion criteria. Studies that either met the
inclusion criteria or where inclusion was unclear were
retrieved in full text. Studies were then read in full and for
the final included studies data were extracted and critical
appraisal was carried out. For the purposes of this sys-
tematic review, a critical appraisal tool was specifically
developed to address the methodological considerations
that are important for investigating compensation and the
ActivityStat hypothesis.
The ActivityStat critical appraisal tool was developed by
the authorship team and includes eight key items to be
considered when investigating compensation: purposefully
designed methodology with measurement of compensation
as the primary aim; clarity of the regulated variable; high-
quality measurement tools; inclusion of a control group;
strength and duration of stimulus; compliance with the
exercise protocol; and sample size. The tool was piloted
with a representative sample of studies and subsequently
modified where necessary. The full tool is available from
the journal website in the Online Resource (please refer to
table 2 [Online Resource 1]).
The ActivityStat Hypothesis 139
Author's personal copy
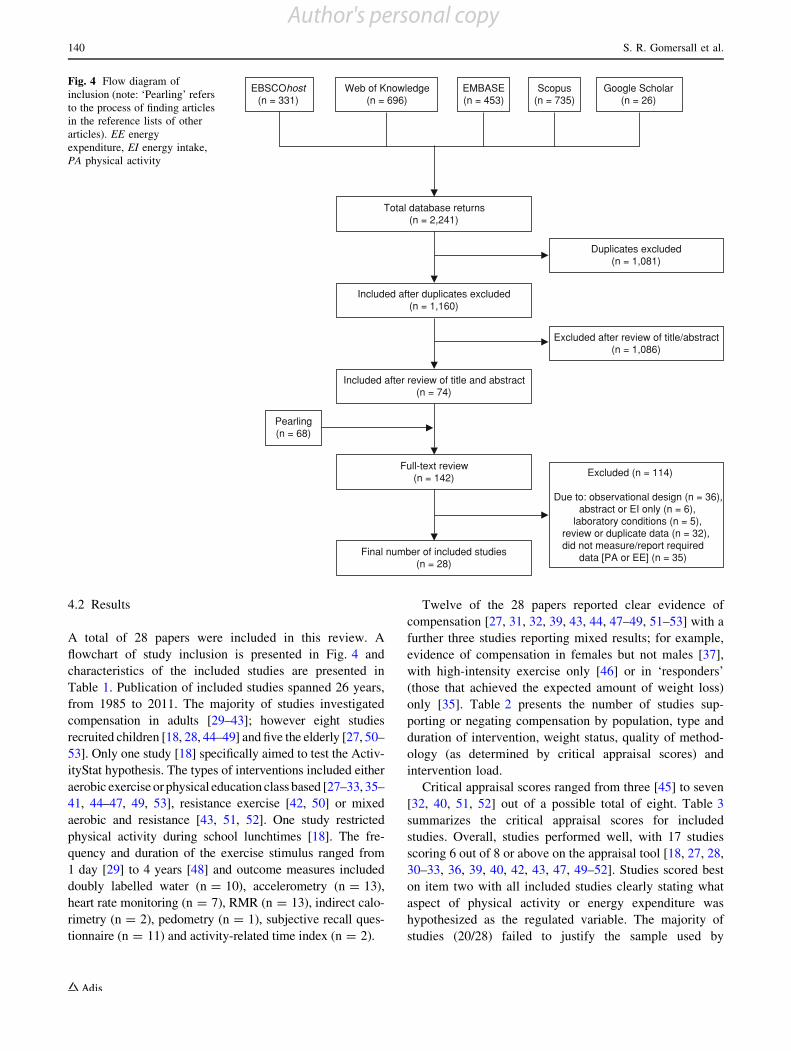
4.2 Results
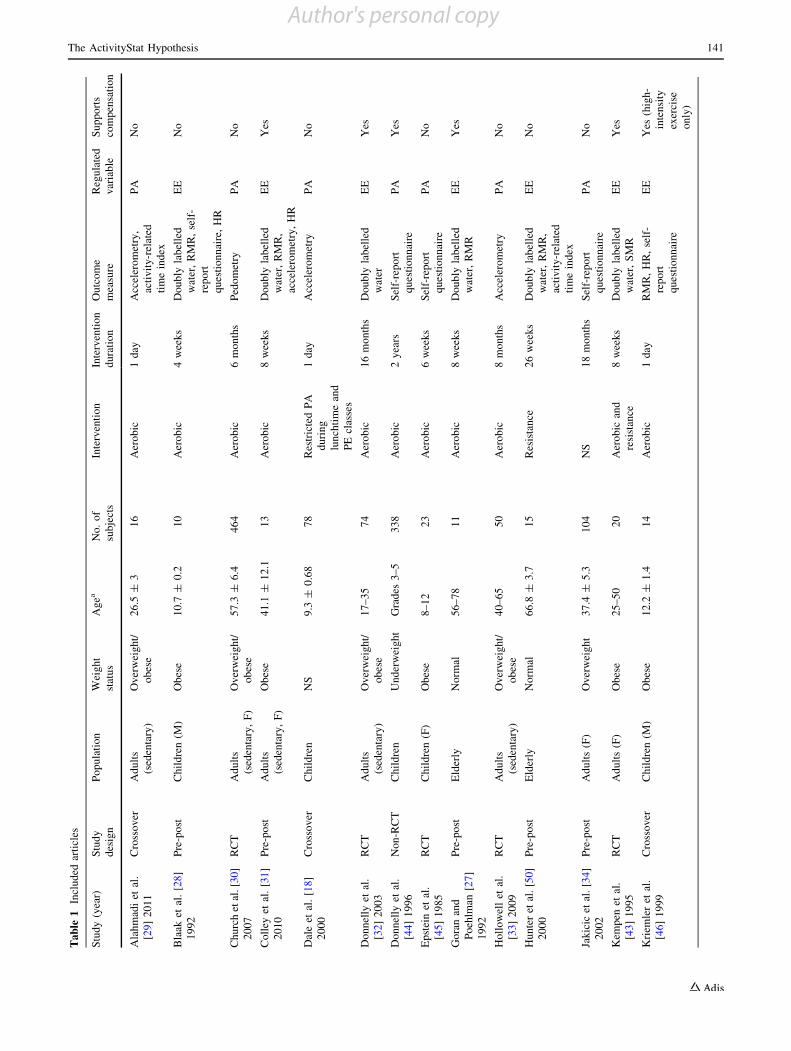
A total of 28 papers were included in this review. A
flowchart of study inclusion is presented in Fig. 4 and
characteristics of the included studies are presented in
Table 1. Publication of included studies spanned 26 years,
from 1985 to 2011. The majority of studies investigated
compensation in adults [29–43]; however eight studies
recruited children [18, 28, 44–49] and five the elderly [27, 50–
53]. Only one study [18] specifically aimed to test the Activ-
ityStat hypothesis. The types of interventions included either
aerobic exercise or physical education class based [27–33, 35–
41, 44–47, 49, 53], resistance exercise [42, 50] or mixed
aerobic and resistance [43, 51, 52]. One study restricted
physical activity during school lunchtimes [18]. The fre-
quency and duration of the exercise stimulus ranged from
1 day [29] to 4 years [48] and outcome measures included
doubly labelled water (n = 10), accelerometry (n = 13),
heart rate monitoring (n = 7), RMR (n = 13), indirect calo-
rimetry (n = 2), pedometry (n = 1), subjective recall ques-
tionnaire (n = 11) and activity-related time index (n = 2).
Twelve of the 28 papers reported clear evidence of
compensation [27, 31, 32, 39, 43, 44, 47–49, 51–53] with a
further three studies reporting mixed results; for example,
evidence of compensation in females but not males [37],
with high-intensity exercise only [46] or in ‘responders’
(those that achieved the expected amount of weight loss)
only [35]. Table 2 presents the number of studies sup-
porting or negating compensation by population, type and
duration of intervention, weight status, quality of method-
ology (as determined by critical appraisal scores) and
intervention load.
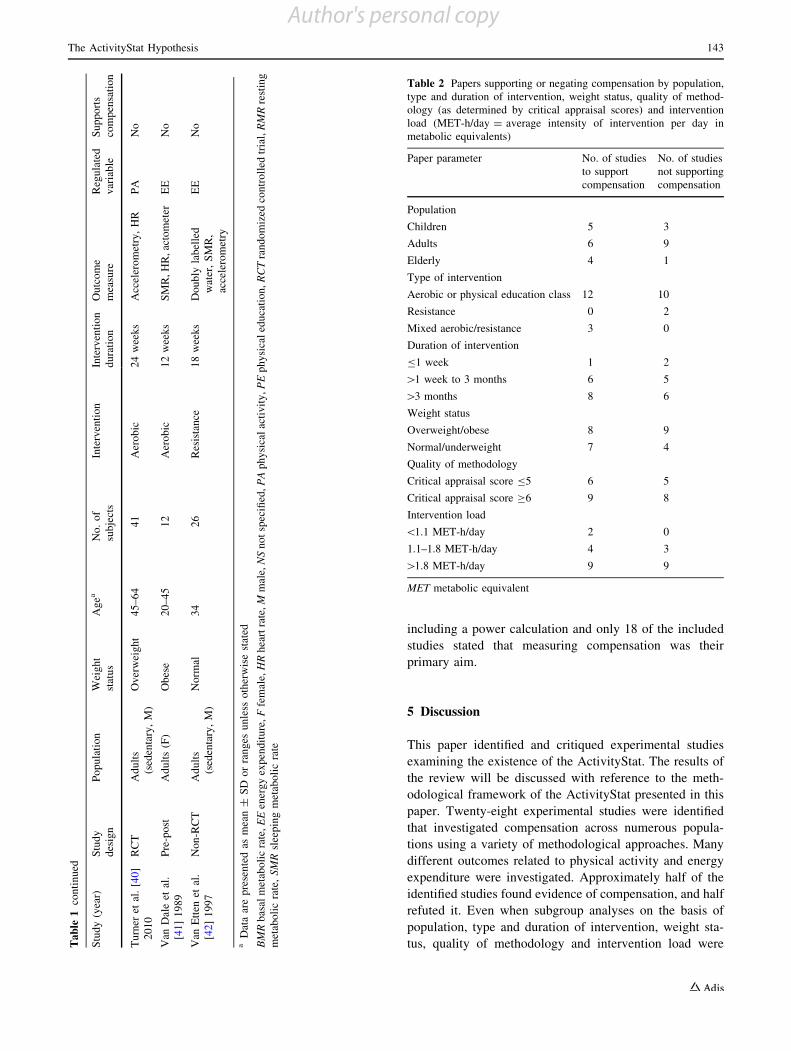
Critical appraisal scores ranged from three [45] to seven
[32, 40, 51, 52] out of a possible total of eight. Table 3
summarizes the critical appraisal scores for included
studies. Overall, studies performed well, with 17 studies
scoring 6 out of 8 or above on the appraisal tool [18, 27, 28,
30–33, 36, 39, 40, 42, 43, 47, 49–52]. Studies scored best
on item two with all included studies clearly stating what
aspect of physical activity or energy expenditure was
hypothesized as the regulated variable. The majority of
studies (20/28) failed to justify the sample used by
EBSCOhost(n = 331)
Web of Knowledge(n = 696)
Total database returns(n = 2,241)
Duplicates excluded(n = 1,081)
Excluded after review of title/abstract(n = 1,086)
Excluded (n = 114)
Due to: observational design (n = 36), abstract or EI only (n = 6), laboratory conditions (n = 5), review or duplicate data (n = 32), did not measure/report required data [PA or EE] (n = 35)
Included after duplicates excluded(n = 1,160)
Included after review of title and abstract(n = 74)
Pearling(n = 68)
Full-text review(n = 142)
Final number of included studies(n = 28)
EMBASE(n = 453)
Scopus(n = 735)
Google Scholar(n = 26)
Fig. 4 Flow diagram of
inclusion (note: ‘Pearling’ refers
to the process of finding articles
in the reference lists of other
articles). EE energy
expenditure, EI energy intake,
PA physical activity
140 S. R. Gomersall et al.
Author's personal copy
Ta
ble
1In
clu
ded
arti
cles
Stu
dy
(yea
r)S
tud
y
des
ign
Po
pu
lati
on
Wei
gh
t
stat
us
Ag
eaN
o.
of
sub
ject
s
Inte
rven
tio
nIn
terv
enti
on
du
rati
on
Ou
tco
me
mea
sure
Reg
ula
ted
var
iab
le
Su
pp
ort
s
com
pen
sati
on
Ala
hm
adi
etal
.
[29
]2
01
1
Cro
sso
ver
Ad
ult
s
(sed
enta
ry)
Ov
erw
eig
ht/
ob
ese
26
.5±
31
6A
ero
bic
1d
ayA
ccel
ero
met
ry,
acti
vit
y-r
elat
ed
tim
ein
dex
PA
No
Bla
aket
al.
[28]
19
92
Pre
-po
stC
hil
dre
n(M
)O
bes
e1
0.7
±0
.21
0A
ero
bic
4w
eek
sD
ou
bly
lab
elle
d
wat
er,
RM
R,
self
-
rep
ort
qu
esti
on
nai
re,
HR
EE
No
Ch
urc
het
al.[3
0]
20
07
RC
TA
du
lts
(sed
enta
ry,
F)
Ov
erw
eig
ht/
ob
ese
57
.3±
6.4
46
4A
ero
bic
6m
on
ths
Ped
om
etry
PA
No
Co
lley
etal
.[3
1]
20
10
Pre
-po
stA
du
lts
(sed
enta
ry,
F)
Ob
ese
41
.1±
12
.11
3A
ero
bic
8w
eek
sD
ou
bly
lab
elle
d
wat
er,
RM
R,
acce
lero
met
ry,
HR
EE
Yes
Dal
eet
al.
[18]
20
00
Cro
sso
ver
Ch
ild
ren
NS
9.3
±0
.68
78
Res
tric
ted
PA
du
rin
g
lun
chti
me
and
PE
clas
ses
1d
ayA
ccel
ero
met
ryP
AN
o
Do
nn
elly
etal
.
[32
]2
00
3
RC
TA
du
lts
(sed
enta
ry)
Ov
erw
eig
ht/
ob
ese
17
–3
57
4A
ero
bic
16
mo
nth
sD
ou
bly
lab
elle
d
wat
er
EE
Yes
Do
nn
elly
etal
.
[44
]1
99
6
No
n-R
CT
Ch
ild
ren
Un
der
wei
gh
tG
rad
es3
–5
33
8A
ero
bic
2y
ears
Sel
f-re
po
rt
qu
esti
on
nai
re
PA
Yes
Ep
stei
net
al.
[45
]1
98
5
RC
TC
hil
dre
n(F
)O
bes
e8
–1
22
3A
ero
bic
6w
eek
sS
elf-
rep
ort
qu
esti
on
nai
re
PA
No
Go
ran
and
Po
ehlm
an[2
7]
19
92
Pre
-po
stE
lder
lyN
orm
al5
6–
78
11
Aer
ob
ic8
wee
ks
Do
ub
lyla
bel
led
wat
er,
RM
R
EE
Yes
Ho
llo
wel
let
al.
[33
]2
00
9
RC
TA
du
lts
(sed
enta
ry)
Ov
erw
eig
ht/
ob
ese
40
–6
55
0A
ero
bic
8m
on
ths
Acc
eler
om
etry
PA
No
Hu
nte
ret
al.
[50]
20
00
Pre
-po
stE
lder
lyN
orm
al6
6.8
±3
.71
5R
esis
tan
ce2
6w
eek
sD
ou
bly
lab
elle
d
wat
er,
RM
R,
acti
vit
y-r
elat
ed
tim
ein
dex
EE
No
Jak
icic
etal
.[3
4]
20
02
Pre
-po
stA
du
lts
(F)
Ov
erw
eig
ht
37
.4±
5.3
10
4N
S1
8m
on
ths
Sel
f-re
po
rt
qu
esti
on
nai
re
PA
No
Kem
pen
etal
.
[43
]1
99
5
RC
TA
du
lts
(F)
Ob
ese
25
–5
02
0A
ero
bic
and
resi
stan
ce
8w
eek
sD
ou
bly
lab
elle
d
wat
er,
SM
R
EE
Yes
Kri
emle
ret
al.
[46
]1
99
9
Cro
sso
ver
Ch
ild
ren
(M)
Ob
ese
12
.2±
1.4
14
Aer
ob
ic1
day
RM
R,
HR
,se
lf-
rep
ort
qu
esti
on
nai
re
EE
Yes
(hig
h-
inte
nsi
ty
exer
cise
on
ly)
The ActivityStat Hypothesis 141
Author's personal copy
Ta
ble
1co
nti
nu
ed
Stu
dy
(yea
r)S
tud
y
des
ign
Po
pu
lati
on
Wei
gh
t
stat
us
Ag
eaN
o.
of
sub
ject
s
Inte
rven
tio
nIn
terv
enti
on
du
rati
on
Ou
tco
me
mea
sure
Reg
ula
ted
var
iab
le
Su
pp
ort
s
com
pen
sati
on
Kri
emle
ret
al.
[47
]2
01
0
Clu
ster
RC
TC
hil
dre
n2
6% ov
erw
eig
ht
Gra
des
1an
d5
49
8T
wo
add
itio
nal
PE
clas
ses,
acti
vit
yb
reak
s
du
rin
g
acad
emic
less
on
s,P
A
ho
mew
ork
9m
on
ths
Acc
eler
om
etry
PA
Yes
Man
tho
uet
al.
[35
]2
01
0
Pre
-po
stA
du
lts
(sed
enta
ry,
F)
Ov
erw
eig
ht/
ob
ese
31
.7±
8.1
34
Aer
ob
ic8
wee
ks
RM
R,
HR
,se
lf-
rep
ort
qu
esti
on
nai
re
EE
Yes (r
esp
on
der
s
on
ly)
Mar
cus
etal
.
[48
]2
00
9
Clu
ster
RC
TC
hil
dre
n1
8.1
%
ov
erw
eig
ht/
ob
ese
6–
10
3,1
35
PE
incr
ease
db
y
30
min
ute
sp
er
day
and
sed
enta
ry
beh
avio
ur
dis
cou
rag
ed
4y
ears
Acc
eler
om
etry
PA
Yes
McL
aug
hli
n
etal
.[3
6]
20
06
Cro
sso
ver
Ad
ult
sN
orm
al2
0–
25
16
Aer
ob
ic8
day
sB
MR
,H
R,
self
-
rep
ort
qu
esti
on
nai
re
EE
No
Mei
jer
etal
.[3
7]
19
91
Pre
-po
stA
du
lts
(sed
enta
ry)
No
rmal
28
–4
13
2A
ero
bic
20
wee
ks
Do
ub
lyla
bel
led
wat
er,
acce
lero
met
ry
EE
Yes
(wo
men
on
ly)
Mei
jer
etal
.[5
1]
19
99
No
n-R
CT
Eld
erly
Ov
erw
eig
ht
[5
52
2A
ero
bic
and
resi
stan
ce
12
wee
ks
BM
R,
acce
lero
met
ryP
AY
es
Mei
jer
etal
.[5
2]
20
00
No
n-R
CT
Eld
erly
Ov
erw
eig
ht
[5
53
3A
ero
bic
and
resi
stan
ce
12
wee
ks
BM
R,
acce
lero
met
ryP
AY
es
Mo
rio
etal
.[5
3]
19
98
Pre
-po
stE
lder
ly
(sed
enta
ry)
No
rmal
62
.8±
2.3
13
Aer
ob
ic1
4w
eek
sS
elf-
rep
ort
qu
esti
on
nai
re,
ind
irec
tw
ho
le-
roo
mca
lori
met
ry
EE
Yes
Rac
ette
etal
.
[38
]1
99
5
RC
TA
du
lts
(F)
Ob
ese
39
±5
23
Aer
ob
ic1
2w
eek
sD
ou
bly
lab
elle
d
wat
er,
RM
R,
HR
,
self
-rep
ort
qu
esti
on
nai
re
EE
No
Red
man
etal
.
[39
]2
00
9
RC
TA
du
lts
Ov
erw
eig
ht
36
.8±
14
8A
ero
bic
6m
on
ths
Do
ub
lyla
bel
led
wat
er,
ind
irec
t
wh
ole
-ro
om
calo
rim
etry
EE
Yes
Sal
lis
etal
.[4
9]
19
97
Pre
-po
stC
hil
dre
nN
SG
rad
es
4an
d5
1,5
38
PE
clas
ses
2y
ears
Sel
f-re
po
rt
qu
esti
on
nai
re,
acce
lero
met
ry
PA
Yes
142 S. R. Gomersall et al.
Author's personal copy
including a power calculation and only 18 of the included
studies stated that measuring compensation was their
primary aim.
5 Discussion
This paper identified and critiqued experimental studies
examining the existence of the ActivityStat. The results of
the review will be discussed with reference to the meth-
odological framework of the ActivityStat presented in this
paper. Twenty-eight experimental studies were identified
that investigated compensation across numerous popula-
tions using a variety of methodological approaches. Many
different outcomes related to physical activity and energy
expenditure were investigated. Approximately half of the
identified studies found evidence of compensation, and half
refuted it. Even when subgroup analyses on the basis of
population, type and duration of intervention, weight sta-
tus, quality of methodology and intervention load were
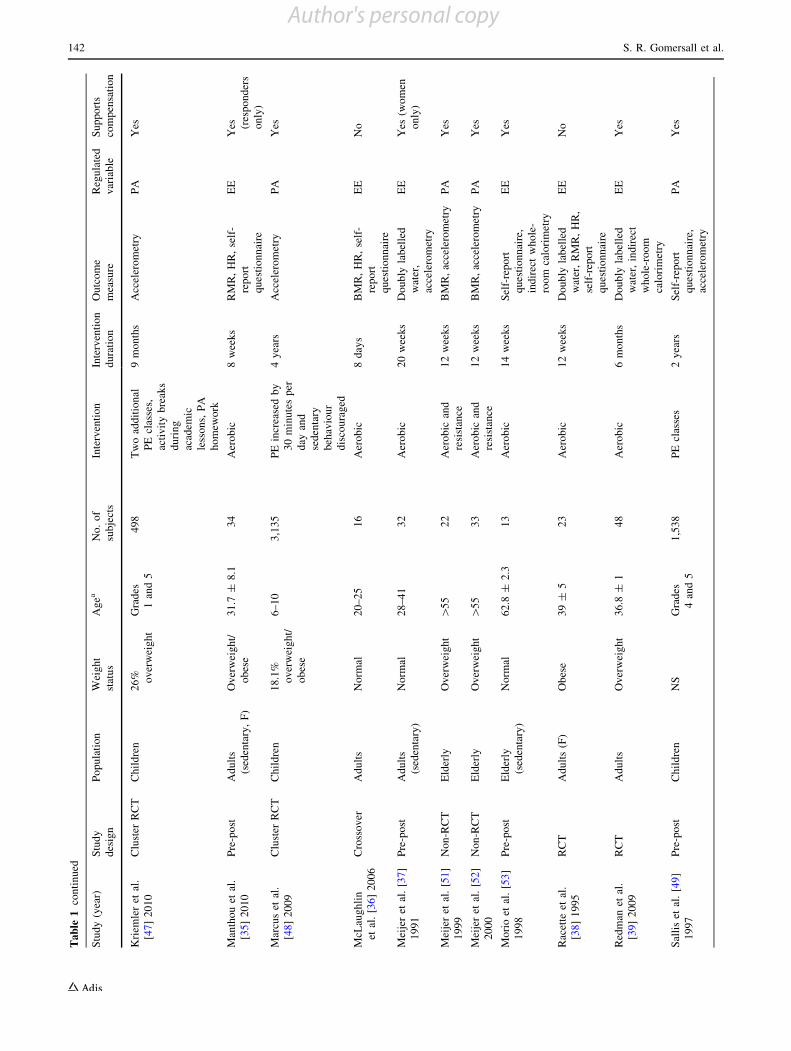
Table 2 Papers supporting or negating compensation by population,
type and duration of intervention, weight status, quality of method-
ology (as determined by critical appraisal scores) and intervention
load (MET-h/day = average intensity of intervention per day in
metabolic equivalents)
Paper parameter No. of studies
to support
compensation
No. of studies
not supporting
compensation
Population
Children 5 3
Adults 6 9
Elderly 4 1
Type of intervention
Aerobic or physical education class 12 10
Resistance 0 2
Mixed aerobic/resistance 3 0
Duration of intervention
B1 week 1 2
[1 week to 3 months 6 5
[3 months 8 6
Weight status
Overweight/obese 8 9
Normal/underweight 7 4
Quality of methodology
Critical appraisal score B5 6 5
Critical appraisal score C6 9 8
Intervention load
\1.1 MET-h/day 2 0
1.1–1.8 MET-h/day 4 3
[1.8 MET-h/day 9 9
MET metabolic equivalent
Ta
ble
1co
nti
nu
ed
Stu
dy
(yea
r)S
tud
y
des
ign
Po
pu
lati
on
Wei
gh
t
stat
us
Ag
eaN
o.
of
sub
ject
s
Inte
rven
tio
nIn
terv
enti
on
du
rati
on
Ou
tco
me
mea
sure
Reg
ula
ted
var
iab
le
Su
pp
ort
s
com
pen
sati
on
Tu
rner
etal
.[4
0]
20
10
RC
TA
du
lts
(sed
enta
ry,
M)
Ov
erw
eig
ht
45
–6
44
1A
ero
bic
24
wee
ks
Acc
eler
om
etry
,H
RP
AN
o
Van
Dal
eet
al.
[41
]1
98
9
Pre
-po
stA
du
lts
(F)
Ob
ese
20
–4
51
2A
ero
bic
12
wee
ks
SM
R,
HR
,ac
tom
eter
EE
No
Van
Ett
enet
al.
[42
]1
99
7
No
n-R
CT
Ad
ult
s
(sed
enta
ry,
M)
No
rmal
34
26
Res
ista
nce
18
wee
ks
Do
ub
lyla
bel
led
wat
er,
SM
R,
acce
lero
met
ry
EE
No
aD
ata
are
pre
sen
ted
asm
ean
±S
Do
rra
ng
esu
nle
sso
ther
wis
est
ated
BM
Rb
asal
met
abo
lic
rate
,E
Een
erg
yex
pen
dit
ure
,F
fem
ale,
HR
hea
rtra
te,
Mm
ale,
NS
no
tsp
ecifi
ed,P
Ap
hy
sica
lac
tiv
ity
,P
Ep
hy
sica
led
uca
tio
n,
RC
Tra
nd
om
ized
con
tro
lled
tria
l,R
MR
rest
ing
met
abo
lic
rate
,S
MR
slee
pin
gm
etab
oli
cra
te
The ActivityStat Hypothesis 143

Author's personal copy
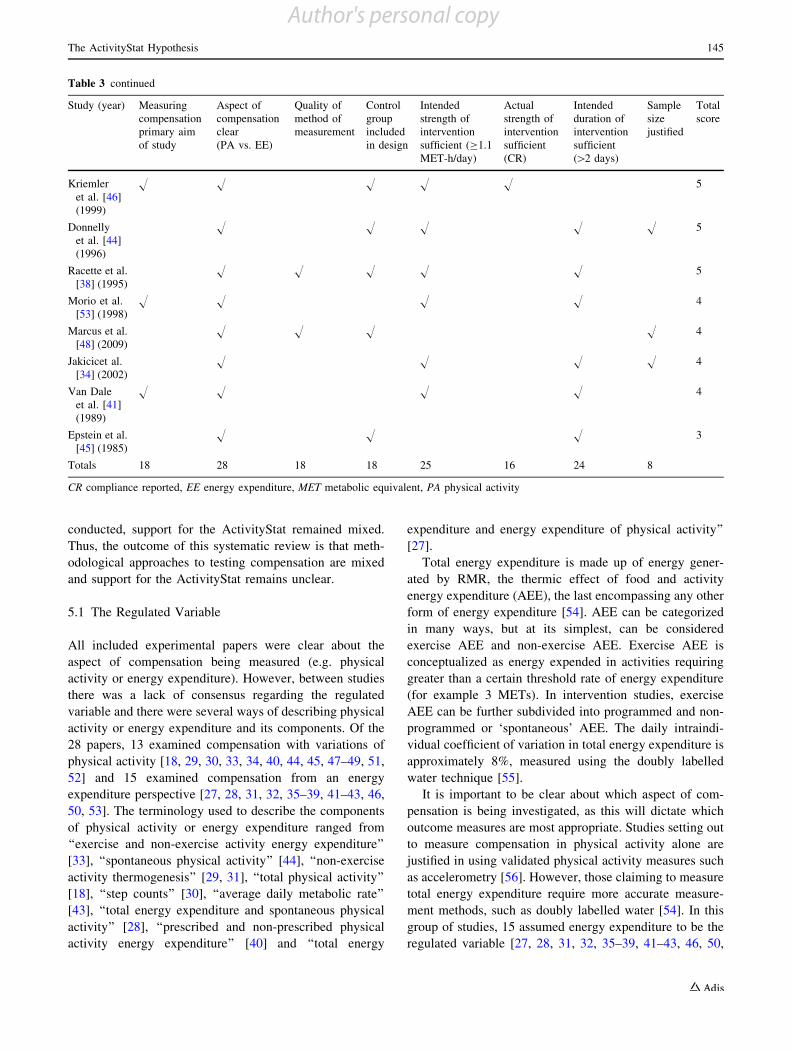
Table 3 Critical appraisal of included studies (MET-h/day = average intensity of intervention per day in metabolic equivalents)
Study (year) Measuring
compensation
primary aim
of study
Aspect of
compensation
clear
(PA vs. EE)
Quality of
method of
measurement
Control
group
included
in design
Intended
strength of
intervention
sufficient (C1.1
MET-h/day)
Actual
strength of
intervention
sufficient
(CR)
Intended
duration of
intervention
sufficient
([2 days)
Sample
size
justified
Total
score
Meijer et al.
[51] (1999)
H H H H H H H 7
Meijer et al.
[52] (2000)
H H H H H H H 7
Turner et al.
[40] (2010)
H H H H H H H 7
Donnelly
et al. [32]
(2003)
H H H H H H H 7
Colley et al.
[31] (2010)
H H H H H H 6
Dale et al.
[18] (2000)
H H H H H H 6
Goran and
Poehlman
[27] (1992)
H H H H H H 6
Hollowell
et al. [33]
(2009)
H H H H H H 6
McLaughlin
et al. [36]
(2006)
H H H H H H 6
Redman
et al. [39]
(2009)
H H H H H H 6
Blaak et al.
[28] (1992)
H H H H H H 6
Kriemler
et al. [47]
(2010)
H H H H H H 6
Sallis et al.
[49] (1997)
H H H H H H 6
Church et al.
[30] (2007)
H H H H H H 6
Hunter et al.
[50] (2000)
H H H H H H 6
Van Etten
et al. [42]
(1997)
H H H H H H 6
Kempen
et al. [43]
(1995)
H H H H H H 6
Manthou
et al. [35]
(2010)
H H H H H 5
Alahmadi
et al. [29]
(2011)
H H H H H 5
Meijer et al.
[37] (1991)
H H H H H 5
144 S. R. Gomersall et al.
Author's personal copy
conducted, support for the ActivityStat remained mixed.
Thus, the outcome of this systematic review is that meth-
odological approaches to testing compensation are mixed
and support for the ActivityStat remains unclear.
5.1 The Regulated Variable
All included experimental papers were clear about the
aspect of compensation being measured (e.g. physical
activity or energy expenditure). However, between studies
there was a lack of consensus regarding the regulated
variable and there were several ways of describing physical
activity or energy expenditure and its components. Of the
28 papers, 13 examined compensation with variations of
physical activity [18, 29, 30, 33, 34, 40, 44, 45, 47–49, 51,
52] and 15 examined compensation from an energy
expenditure perspective [27, 28, 31, 32, 35–39, 41–43, 46,
50, 53]. The terminology used to describe the components
of physical activity or energy expenditure ranged from
‘‘exercise and non-exercise activity energy expenditure’’
[33], ‘‘spontaneous physical activity’’ [44], ‘‘non-exercise
activity thermogenesis’’ [29, 31], ‘‘total physical activity’’
[18], ‘‘step counts’’ [30], ‘‘average daily metabolic rate’’
[43], ‘‘total energy expenditure and spontaneous physical
activity’’ [28], ‘‘prescribed and non-prescribed physical
activity energy expenditure’’ [40] and ‘‘total energy
expenditure and energy expenditure of physical activity’’
[27].
Total energy expenditure is made up of energy gener-
ated by RMR, the thermic effect of food and activity
energy expenditure (AEE), the last encompassing any other
form of energy expenditure [54]. AEE can be categorized
in many ways, but at its simplest, can be considered
exercise AEE and non-exercise AEE. Exercise AEE is
conceptualized as energy expended in activities requiring
greater than a certain threshold rate of energy expenditure
(for example 3 METs). In intervention studies, exercise
AEE can be further subdivided into programmed and non-
programmed or ‘spontaneous’ AEE. The daily intraindi-
vidual coefficient of variation in total energy expenditure is
approximately 8%, measured using the doubly labelled
water technique [55].
It is important to be clear about which aspect of com-
pensation is being investigated, as this will dictate which
outcome measures are most appropriate. Studies setting out
to measure compensation in physical activity alone are
justified in using validated physical activity measures such
as accelerometry [56]. However, those claiming to measure
total energy expenditure require more accurate measure-
ment methods, such as doubly labelled water [54]. In this
group of studies, 15 assumed energy expenditure to be the
regulated variable [27, 28, 31, 32, 35–39, 41–43, 46, 50,
Table 3 continued
Study (year) Measuring
compensation
primary aim
of study
Aspect of
compensation
clear
(PA vs. EE)
Quality of
method of
measurement
Control
group
included
in design
Intended
strength of
intervention
sufficient (C1.1
MET-h/day)
Actual
strength of
intervention
sufficient
(CR)
Intended
duration of
intervention
sufficient
([2 days)
Sample
size
justified
Total
score
Kriemler
et al. [46]
(1999)
H H H H H 5
Donnelly
et al. [44]
(1996)
H H H H H 5
Racette et al.
[38] (1995)
H H H H H 5
Morio et al.
[53] (1998)
H H H H 4
Marcus et al.
[48] (2009)
H H H H 4
Jakicicet al.
[34] (2002)
H H H H 4
Van Dale
et al. [41]
(1989)
H H H H 4
Epstein et al.
[45] (1985)
H H H 3
Totals 18 28 18 18 25 16 24 8
CR compliance reported, EE energy expenditure, MET metabolic equivalent, PA physical activity
The ActivityStat Hypothesis 145
Author's personal copy
53] of which nine supported compensation [27, 31, 32, 35,
37, 39, 43, 46, 53]. In contrast, 13 assumed physical
activity [18, 29, 30, 33, 34, 40, 44, 45, 47–49, 51, 52] to be
the regulated variable, of which six supported compensa-
tion [44, 47–49, 51, 52]. It is important that future papers
investigating the ActivityStat hypothesis include compre-
hensive assessments of changes in both physical activity
and energy expenditure. A consistent approach to termi-
nology will also add clarity to the ActivityStat debate.
In nine of 28 papers, the tools used to measure the
regulated variable were neither gold standard nor had high
validity. Examples include use of subjective recall ques-
tionnaires when investigating physical activity [44, 45],
approximation of total energy expenditure based on heart
rate telemetry [36, 41, 46, 53], and subjective and factorial
methods for estimating total energy expenditure [53].
While heart rate is considered a feasible method for the
estimation of total energy expenditure [57], it must be
acknowledged that doubly labelled water is currently the
gold standard method of measurement. It is encouraging to
note that ten of the 15 studies purporting to measure
compensation in energy expenditure included doubly
labelled water [27, 28, 31, 32, 37–39, 42, 43, 50] and that
six papers coupled this with a measurement of resting,
sleeping or basal metabolic rate [27, 28, 31, 38, 42, 43], as
changes in RMR could potentially account for compensa-
tion in total energy expenditure. The remaining five papers
used a combination of heart rate, actometers, indirect
whole-room calorimetry and self-report recall and resting,
basal or sleeping metabolic rate [35, 36, 41, 46, 53].
Finally, none of the studies included a measure of use of
time. Measurement of time use is gaining increasing pop-
ularity in the physical activity literature. In their traditional
form, subjective physical activity questionnaires have
demonstrated limited reliability and validity [58]. While
use of time measures are also subjective, they have dem-
onstrated improved validity compared with physical
activity questionnaires and they provide a high-resolution
picture of how people use their time in a temporal context
[59]. If there is a net compensation effect in response to a
physical activity intervention, measuring use of time would
allow us to detect how activities and time budgets are being
rearranged and which activities are being altered to
accommodate compensation in physical activity or energy
expenditure.
5.2 Timeframe for Compensation
In the included studies, the duration of the intervention, and
therefore the assumed timeframe for compensation, ranged
from within [18] and between consecutive days [46] and up
to 4 years [48]. Consideration of the timeframe for com-
pensation is important, as it will direct methodological
choices regarding frequency of measurement occasions and
the duration of the intervention. We hypothesized that the
timeframe for compensation is unlikely to be day to day.
This hypothesis is supported with evidence collated in this
review—of the three studies looking at compensation
under one week [18, 29, 46], only one (Kriemler et al. [46])
detected compensation, and this only occurred in one of
their study populations (the high-intensity condition). Most
studies that found evidence of compensation had inter-
vention durations ranging from approximately 1 to
3 months [27, 43, 51–53].
In addition, the timeframe for compensation is particu-
larly important if a crossover design is to be used, which
was the design of several papers included in this review
[18, 29, 36, 46]. McLaughlin and colleagues [36] employed
a crossover design with a 1-week washout for males and
4-week washout for females (to allow for a similar stage in
the menstrual cycle), Alahmadi et al. [29] and Kriemler
et al. [46] employed a 1-week crossover and Dale et al. [18]
did not specify the crossover timeframe. Given that the
timeframe for compensation (if it occurs) has not yet been
established, use of a washout period of just 1 week may
complicate the interpretation of any compensation that may
occur. Interestingly, none of the papers that included a
crossover design supported compensation, except for the
high-intensity intervention group in Kreimler and col-
leagues study [46].
5.3 Tolerance
The volume of the physical activity intervention must be
considered when investigating compensation, as theoreti-
cally it must be above or below the threshold of the system
to trigger a compensatory change. As this threshold is
currently unknown, the authors have used the Australian
guidelines for physical activity as a guide (150 min of
MVPA per week) [60]. In order to compare studies, where
possible the intended load of the intervention was calcu-
lated in MET-h/day, where 1.1 MET-h/day is equivalent to
150 min of moderate physical activity per week and 1.8
MET-h/day is equivalent to 150 min of vigorous physical
activity per week. Of the 27 included studies where load
could be estimated, two [48, 49] studies employed an
intervention with a maximum load that was below 1.1
MET-h/day. Interestingly, both of these papers found
evidence of compensation and were over long periods
(4 and 2 years, respectively). This is compared with seven
studies that used a maximum intervention load of 1.1 to 1.8
MET-h/day [27, 32, 34, 35, 38, 44, 50] and 18 studies that
employed a maximum intervention load greater than 1.8
MET-h/day [18, 28–31, 33, 36, 37, 39–43, 46, 47, 51–53].
Four of seven [27, 32, 35, 44] studies using interventions of
between 1.1 and 1.8 MET-h/day and nine of 18 [31, 37, 39,
146 S. R. Gomersall et al.
Author's personal copy
43, 46, 47, 51–53] studies using interventions greater than
1.8 MET-h/day, respectively, found evidence of compen-
sation. Twelve studies either didn’t report compliance or
their compliance was below the threshold of 1.1 MET-h/
day [33, 34, 37, 38, 41, 43–45, 47–49, 53].
Furthermore, all included studies except for Church
et al. [30], Alahmadi et al. [29], Hollowell et al. [33] and
Kriemler et al. [46] only used one-dose intervention, while
Church et al. [30] compared three volumes of intervention,
at 0.64, 1.3 and 1.9 MET-h/day, respectively. There is a
key advantage to including multiple volume interventions
in studies investigating the ActivityStat hypothesis. These
designs can provide information about the dose-response
relationship between the strength of the intervention stim-
ulus and compensation, which will in turn assist in deter-
mining what the thresholds for compensation may be.
One study, conducted by Dale and colleagues, restricted
children’s physical activity during lunchtime at school to
assess whether there was a compensatory increase in
activity in the after-school period [18]. The equivalent load
for this restriction was 2.7 MET-h/day. No compensation
was evident in this 1-day assessment timeframe. While
restriction of activity is a unique approach to investigating
compensation, it is valid, given that the ActivityStat is
believed to be symmetrical. Dale et al.’s study is the only
experimental paper identified in this review that was
designed explicitly to test the ActivityStat hypothesis
rather than the concept of compensation alone.
5.4 Variable versus Fixed Set Points
In this paper, we have outlined the complexity of mea-
suring compensation given that there is likely to be vari-
ability in the set point. Methodological design, however,
can attempt to account for variable set points over time by
using a control group, recruiting sufficient sample sizes and
using instruments with high levels of precision and accu-
racy. Of the included experimental studies, 18 employed a
control group [18, 29, 30, 32, 33, 36, 38–40, 42–48, 51,
52]; with ten of these using a randomized controlled trial
design [30, 32, 33, 38–40, 43, 45, 47, 48]. Lack of justi-
fication of sample size was the weakest attributes of these
papers, with only eight of 28 including a power calculation
or similar [30, 32, 34, 43, 44, 47–49].
Doubly labelled water is considered to have high levels
of precision and accuracy when measuring energy expen-
diture [61] and it is encouraging to note that ten of 28
studies employed this method, despite the cost associated
with its use. Other measures used include accelerometry,
self-report recall questionnaires, pedometry, heart rate
telemetry, indirect calorimetry and the activity-related time
index. Donnelly et al. [32], Redman et al. [39], Kempen
et al. [43] and Racette et al. [38] are the only studies that
have employed both the gold standard research design of a
randomized controlled trial and the gold standard measure
of doubly labelled water to investigate compensation in
energy expenditure. Interestingly, three of four of these
studies [32, 39, 43], support the notion of compensation.
All four studies also recruited overweight or obese adults
only, potentially suggesting a population-specific effect for
compensatory behaviours that may be a function of
behavioural determinants rather than biological. There may
also be an age-specific effect, with overall, 40% of adult
studies and 63% of child studies reporting compensation.
6 Conclusion
There is a substantial body of experimental literature
investigating compensation that has largely been over-
looked in the ActivityStat debate, with only a handful of
these studies being highly cited in the ActivityStat litera-
ture. When compiling the evidence, it becomes obvious
that there is no clear answer as to the existence of an
ActivityStat and there is little consistency in methodo-
logical approaches used to investigate this hypothesis.
Overall, 46% of identified studies did not provide any
evidence of compensation. Furthermore, the four studies
that received the highest methodological score (7/10) [32,
40, 51, 52] also had conflicting results, with three sup-
porting [32, 51, 52] and one negating [40] the presence of
compensation.
It is evident that the interest in the biological control of
energy expenditure and physical activity is growing and the
ActivityStat is only one potential mechanism through
which biological control might function. Research specif-
ically investigating the ActivityStat hypothesis needs to
move beyond observational investigations where conclu-
sions are limited to associations and shift towards carefully
designed, experimental approaches that consider the con-
ceptual framework of the ActivityStat as a homeostatic
model and can demonstrate causality of compensation.
Further research is also needed to determine whether there
may be potential differences in compensatory behaviours
in other subpopulations, such as between adults and
children or normal and overweight. Based on the existing
ActivityStat literature, the current experimental evidence
for compensation and a conceptual understanding of the
ActivityStat hypothesis, it is possible to put forward rec-
ommendations for designing experiments to further explore
the ActivityStat concept. The following methodological
recommendations are made for future research:
(1) To acknowledge the conceptual distinction between
physical activity or energy expenditure as the regu-
lated variable, discussion around regulation of
The ActivityStat Hypothesis 147
Author's personal copy
physical activity might refer to an ‘ActivityStat’ and
discussion of regulation of energy expenditure to an
‘EnergyStat’.
(2) A variety of tools should be used to quantify both
total energy expenditure and physical activity, includ-
ing (where possible) doubly labelled water, objective
activity monitors and use of time recalls.
(3) To minimize variability, which reduces the signal-
to-noise ratio, high-resolution, reliable and valid
measurement tools should be used.
(4) Activity should be assessed over sufficiently long
periods and sufficiently regularly to detect compen-
sation over periods ranging from days to weeks.
Evidence from this review suggests that compensa-
tion is most likely to be detected between 4 and
12 weeks of an imposed stimulus. It is unlikely that
an ActivityStat would work at a level of within-day
compensation.
(5) The exercise stimulus should be sufficient to trigger
any supposed compensatory mechanism. Ideally, a
range of stimuli of different strengths should be
tested.
(6) To determine the actual stimulus, compliance with
the intervention should be reported and analyses
performed ‘per protocol’.
(7) To check for shifting baselines, a control group
should be used.
Acknowledgements This review was partially funded by a National
Health and Medical Research Council Project Grant (#631916). Ms
Gomersall is supported by an Australian Postgraduate Award Schol-
arship. Dr English is supported by a National Health and Medical
Research Council Training Fellowship (#610312). Dr Maher is sup-
ported by an Australian Research Council post-doctoral fellowship.
The authors have no conflicts of interest that are directly related to the
content of this review.
The authors would like to acknowledge a reviewer of this manu-
script who suggested the term ‘EnergyStat’.
References
1. Rowland TW. The biological basis of physical activity. Med Sci
Sports Exerc. 1998;30(3):392.
2. Eisenmann JC, Wickel EE. The biological basis of physical
activity in children: revisited. Pediatr Exerc Sci. 2009;21(3):
257–72.
3. Garland T Jr, Schutz H, Chappell MA, et al. The biological
control of voluntary exercise, spontaneous physical activity and
daily energy expenditure in relation to obesity: human and rodent
perspectives. J Exp Biol. 2011;214(2):206–29.
4. Reilly J. Can we modulate physical activity in children? Int J
Obes. 2011;35(10):1266–9.
5. Wilkin T. Can we modulate physical activity in children? No Int J
Obes. 2011;35(10):1270–6.
6. Bouchard C, Rankinen T. Are people physically active because of
their genes. Pres Counc Phys Fit. 2006;7:1–8.
7. Thorburn A, Proietto J. Biological determinants of spontaneous
physical activity. Obes Rev. 2000;1(2):87–94.
8. Tortora G, Derrickson B. Principles of anatomy and physiology.
12th ed. Hoboken: Wiley; 2009.
9. Cannon W. Stresses and strains of homeostasis. Am J Med Sci.
1935;1(189):13–4.
10. Taillard J, Philip P, Coste O, et al. The circadian and homeostatic
modulation of sleep pressure during wakefulness differs between
morning and evening chronotypes. J Sleep Res. 2003;12:275–82.
11. Westerterp KR, Plasqui G. Physical activity and human energy
expenditure. Clin Nutr Met Care. 2004;7(6):607.
12. Manini T. Energy expenditure and ageing. Ageing Res Rev.
2010;9:1–11.
13. Sallis JF. Age-related decline in physical activity: a synthesis of
human and animal studies. Med Sci Sports Exerc. 2000;32(9):
1598–600.
14. Troiano R, Berrigan D, Dodd KW, et al. Physical activity in the
United States measured by accelerometer. Med Sci Sports Exerc.
2008;40(1):181–8.
15. Tudor-Locke C, Craig CL, Beets MW, et al. How many steps/day
are enough? for children and adolescents. Int J Behav Nutr Phys
Act. 2011;8:78.
16. Tucker P, Gilliland J. The effect of season and weather on
physical activity: a systematic review. Public Health. 2007;121:
909–22.
17. Levin S, Jacobs D, Ainsworth B, et al. Intra-individual variation
and estimates of usual physical activity. Ann Epidemiol. 1999;9:
481–8.
18. Dale D, Corbin CB, Dale KS. Restricting opportunities to be
active during school time: do children compensate by increasing
physical activity levels after school? Res Q Exerc Sport. 2000;
71(3):240–8.
19. Wilkin TJ, Mallam KM, Metcalf B, et al. Variation in physical
activity lies with the child, not his environment: evidence for an
‘activitystat’ in young children (EarlyBird 16). Int J Obes.
2006;30(7):1050–5.
20. Baggett CD, Stevens J, Catellier DJ, et al. Compensation
or displacement of physical activity in middle-school girls: the
Trial of Activity for Adolescent Girls. Int J Obes. 2010;34(7):
1193–9.
21. Fremeaux A, Mallam K, Metcalf B, et al. The impact of school-
time activity on total physical activity: the activitystat hypothesis
(EarlyBird 46). Int J Obes. 2011;35(10):1277–83.
22. Wickel EE, Eisenmann JC. Contribution of youth sport to total
daily physical activity among 6-to 12-yr-old boys. Med Sci
Sports Exerc. 2007;39(9):1493–500.
23. Goodman A, Mackett RL, Paskins J. Activity compensation and
activity synergy in British 8–13 year olds. Prev Med. 2011;53(4–5):
293–8.
24. Rowlands AV, Pilgrim EL, Eston RG. Seasonal changes in
children’s physical activity: an examination of group changes,
intra-individual variability and consistency in activity pattern
across season. Ann Hum Biol. 2009;36(4):363–78.
25. Lynch KB, Corbin CB, Sidman CL. Testing compensation: does
recreational basketball impact adult activity levels? J Phys Act
Health. 2009;6(3):321–6.
26. Sallis JF, Owen N, Fotheringham MJ. Behavioral epidemiology:
a systematic framework to classify phases of research on health
promotion and disease prevention. Ann Behav Med. 2000;22(4):
294–8.
27. Goran MI, Poehlman ET. Endurance training does not enhance
total energy expenditure in healthy elderly persons. Am J Physiol
Endocrinol Metab. 1992;263(5):E950–7.
28. Blaak EE, Westerterp KR, Bar-Or O, et al. Total energy expen-
diture and spontaneous activity in relation to training in obese
boys. Am J Clin Nutr. 1992;55(4):777.
148 S. R. Gomersall et al.
Author's personal copy
29. Alahmadi MA, Hills AP, King NA, et al. Exercise intensity
influences nonexercise activity thermogenesis in overweight and
obese adults. Med Sci Sports Exerc. 2011;43(4):624–31.
30. Church TS, Earnest CP, Skinner JS, et al. Effects of different
doses of physical activity on cardiorespiratory fitness among
sedentary, overweight or obese postmenopausal women with
elevated blood pressure. JAMA. 2007;297(19):2081–91.
31. Colley RC, Hills AP, King NA, et al. Exercise-induced energy
expenditure: implications for exercise prescription and obesity.
Patient Educ Couns. 2010;79(3):327–32.
32. Donnelly JE, Hill JO, Jacobsen DJ, et al. Effects of a 16-month
randomized controlled exercise trial on body weight and com-
position in young, overweight men and women: the Midwest
Exercise Trial. Arch Intern Med. 2003;163(11):1343–50.
33. Hollowell RP, Willis LH, Slentz CA, et al. Effects of exercise
training amount on physical activity energy expenditure. Med Sci
Sports Exerc. 2009;41(8):1640–4.
34. Jakicic JM, Wing RR, Winters-Hart C. Relationship of physical
activity to eating behaviors and weight loss in women. Med Sci
Sports Exerc. 2002;34(10):1653–9.
35. Manthou E, Gill JMR, Wright A, et al. Behavioral compensatory
adjustments to exercise training in overweight women. Med Sci
Sports Exerc. 2010;42(6):1221–8.
36. McLaughlin R, Malkova D, Nimmo MA. Spontaneous activity
responses to exercise in males and females. Eur J Clin Nutr.
2006;60(9):1055–61.
37. Meijer GAL, Janssen GME, Westerterp K, et al. The effect of a
5-month endurance-training programme on physical activity:
evidence for a sex-difference in the metabolic response to exer-
cise. Eur J Appl Physiol. 1991;62(1):11–7.
38. Racette SB, Schoeller DA, Kushner RF, et al. Exercise enhances
dietary compliance during moderate energy restriction in obese
women. Am J Clin Nutr. 1995;62(2):345–9.
39. Redman LM, Heilbronn LK, Martin CK, et al. Metabolic and
behavioral compensations in response to caloric restriction:
implications for the maintenance of weight loss. PLoS ONE.
2009;4(2):e4377.
40. Turner JE, Markovitch D, Betts JA, et al. Nonprescribed physical
activity energy expenditure is maintained with structured exercise
and implicates a compensatory increase in energy intake. Am J
Clin Nutr. 2010;92(5):1009–16.
41. Van Dale D, Schoffelen P, Ten Hoor F, et al. Effects of addition
of exercise to energy restriction on 24-hour energy expenditure,
sleeping metabolic rate and daily physical activity. Eur J Clin
Nutr. 1989;43(7):441–51.
42. Van Etten LMLA, Westerterp KR, Verstappen FTJ, et al. Effect
of an 18-wk weight-training program on energy expenditure and
physical activity. J Appl Physiol. 1997;82(1):298–304.
43. Kempen KPG, Saris WHM, Westerterp KR. Energy balance
during an 8-wk energy-restricted diet with and without exercise in
obese women. Am J Clin Nutr. 1995;62(4):722–9.
44. Donnelly JE, Jacobsen DJ, Whatley JE, et al. Nutrition and
physical activity program to attenuate obesity and promote
physical and metabolic fitness in elementary school children.
Obes Res. 1996;4(3):229–43.
45. Epstein LH, Wing RR, Penner BC, et al. Effect of diet and
controlled exercise on weight loss in obese children. J Pediatrics.
1985;107(3):358–61.
46. Kriemler S, Hebestreit H, Mikami S, et al. Impact of a single
exercise bout on energy expenditure and spontaneous physical
activity of obese boys. Pediatr Res. 1999;46(1):40–4.
47. Kriemler S, Zahner L, Schindler C, et al. Effect of school based
physical activity programme (KISS) on fitness and adiposity in
primary schoolchildren: cluster randomised controlled trial. BMJ.
2010;340:c785.
48. Marcus C, Nyberg G, Nordenfelt A, et al. A 4-year, cluster-
randomized, controlled childhood obesity prevention study:
STOPP. Int J Obes. 2009;33(4):408–17.
49. Sallis JF, McKenzie TL, Alcaraz JE, et al. The effects of a 2-year
physical education program (SPARK) on physical activity and
fitness in elementary school students. Sports, Play and Active
Recreation for Kids. Am J Public Health. 1997;87(8):1328–34.
50. Hunter GR, Wetzstein CJ, Fields DA, et al. Resistance training
increases total energy expenditure and free-living physical
activity in older adults. J Appl Physiol. 2000;89(3):977–84.
51. Meijer EP, Westerterp KR, Verstappen FTJ. Effect of exercise
training on total daily physical activity in elderly humans. Eur J
Appl Physiol. 1999;80(1):16–21.
52. Meijer EP, Westerterp KR, Verstappen FTJ. Effect of exercise
training on physical activity and substrate utilization in the
elderly. Int J Sports Med. 2000;21(7):499–504.
53. Morio B, Montaurier C, Pickering G, et al. Effects of 14 weeks of
progressive endurance training on energy expenditure in elderly
people. Br J Nutr. 1998;80(6):511–9.
54. Starling R. Use of doubly labeled water and indirect calorimetry
to assess physical activity. In: Welk G, editor. Physical activity
assessments for health-related research. Champaign (IL): Human
Kinetics; 2002. p. 197–209.
55. Black A, Cole T. Within- and between-subject variation in energy
expenditure measured by the doubly-labelled water technique:
implications for validating reported dietary energy intake. Eur J
Clin Nutr. 2000;54:386–94.
56. Swartz A, Strath S, Bassett D, et al. Estimation of energy
expenditure using CSA accelerometers at hip and wrist sites. Med
Sci Sports Exerc. 2000;39(9):S450–6.
57. Rennie K, Hennings S, Mitchell J, et al. Estimating energy
expenditure by heart-rate monitoring without individual calibra-
tion. Med Sci Sports Exerc. 2000;3(6):939–45.
58. Shephard R. Limits to the measurement of habitual physical
activity by questionnaires. Br J Sports Med. 2003;37:197–206.
59. Gomersall S, Olds TS, Ridley K. Development and evaluation of
an adult use-of-time instrument with an energy expenditure focus.
J Sci Med Sport. 2011;14(2):143–8.
60. Australian Government. National physical activity guidelines for
adults. Canberra (ACT): Department of Health and Aged Care;
1999.
61. Cole T, Howard W. Precision and accuracy of doubly labeled
water energy expenditure by multipoint and two point methods.
Am J Physiol Endocrinol Metab. 1992;263(26):E965–73.
The ActivityStat Hypothesis 149


