Embed Size (px)
Citation preview

ARTICLE IN PRESS
0961-9534/$ - se
doi:10.1016/j.bi
�Correspondifax: +3130 253
E-mail addre
Biomass and Bioenergy 29 (2005) 399–418
www.elsevier.com/locate/biombioe
Technological learning and cost reductions in wood fuel supplychains in Sweden
M. Jungingera,�, A. Faaija, R. Bjorhedenb, W.C. Turkenburga
aCopernicus Institute for Sustainable Development & Innovation, Utrecht University, Heidelberglaan 2, 3584 CS Utrecht, The NetherlandsbSchool of Technology and Design, Vaxjo University, Luckligs Plats 1, 351 95 Vaxjo, Sweden
Received 25 October 2004; received in revised form 11 April 2005; accepted 24 June 2005
Available online 22 September 2005
Abstract
With its increasing use, the production costs of primary forest fuel (PFF) have declined over the last three decades in
Sweden. The aims of this study are to quantify cost reductions of PFF production as achieved in Sweden over time, to
identify underlying reasons for these reductions, and to determine whether the experience curve concept can be used to
describe this cost reduction trend. If applicable, the suitability of this concept for future cost reduction analysis and for
use in other countries is explored. The analysis was done using average national PFF price data (as a proxy for
production costs), a number of production cost studies and data on annual Swedish production volumes. Results show
that main cost reductions were achieved in forwarding and chipping of PFF, largely due to learning-by-doing, improved
equipment and changes in organization. The price for wood fuel chips does follow an experience curve from 1975 to
2003 (over nine cumulative doublings). The progress ratio (PR) is calculated at 87%. However, given the uncertainty
in data on PFF price and annual production volumes, the PR may range between 85% and 88%. It is concluded that
in combination with the available supply potential of PFF and with bottom-up assessment of cost reduction
opportunities, experience curves can be valuable tools for assessing future PFF production cost development in Sweden.
A methodological issue that needs to be further explored is how learning took place between Sweden and other
countries, especially with Finland, and how the development of technology and PFF production in these countries
should be combined with the Swedish experiences. This would allow the utilization of the experience curve concept to
estimate cost developments also in other countries with a large potential to supply PFF, but with less developed PFF
supply systems.
r 2005 Elsevier Ltd. All rights reserved.
Keywords: Logging residues; Production cost reductions; Technological learning; Forest fuel supply chains; Experience curve
e front matter r 2005 Elsevier Ltd. All rights reserve
ombioe.2005.06.006
ng author. Tel.: +3130 2537613/00;
7601.
ss: [email protected] (M. Junginger).
1. Introduction and rationale
Biomass is seen as one of the most promisingrenewable energy sources that could contribute
d.
ARTICLE IN PRESS
M. Junginger et al. / Biomass and Bioenergy 29 (2005) 399–418400
substantially to sustainable energy supply includ-ing the reduction of greenhouse gas emissions.However, the present costs of primary biomassfuels are often higher than the costs of competingfossil fuels, especially for energy crops and residuesthat need to be collected for energy use such asprimary forest fuel (PFF). PFF is defined asbranches, tops, small trees and unmerchantablewood left in the forest after the cleaning, thinningor final felling of forest stands. It is then used asfuel without any intermittent applications. Theproduction costs of PFF (as delivered to the plantgate) depend on a number of steps within thelogistic chain, such as harvesting, comminutionand transport.There are ample indications that factors such as
technological progress and upscaling have led tosignificant reductions in production costs of PFFin the past few decades. For example, Roos et al.[1] highlight that factors such as learning (e.g.standardization of procedures) and technologicaldevelopment (e.g. innovation in harvesting andprocessing equipment) contributed to cost reduc-tions and subsequent successful large-scale imple-mentation of biomass district heating in Sweden.Hillring [2] documents the corresponding reduc-tion of market prices for PFF in Sweden. ForFinland, Hakkila [3] reports decreasing cost due todevelopment of new chip procurement systems,corresponding economies-of-scale effects, decreas-ing costs of machinery and shift from delimbedstems to whole trees to logging residues as mainsource of PFF.However, monitoring the influence of the
different advances in biomass fuel supply chainon production costs over a long period of time(e.g. 25 years), including changes in the differentsteps in fuel supply chains, has not been carriedout. Also, little is known on how PFF productioncosts may develop in the near future or on thelonger term. A method to analyze past costdevelopments of technologies is the experiencecurve concept. In this concept, the cost develop-ment of a product or a technology is investigatedas a function of cumulative production, andplotted in a figure with double-logarithmic scale,often resulting in a linear curve, the experiencecurve. Within the field of renewable energy, this
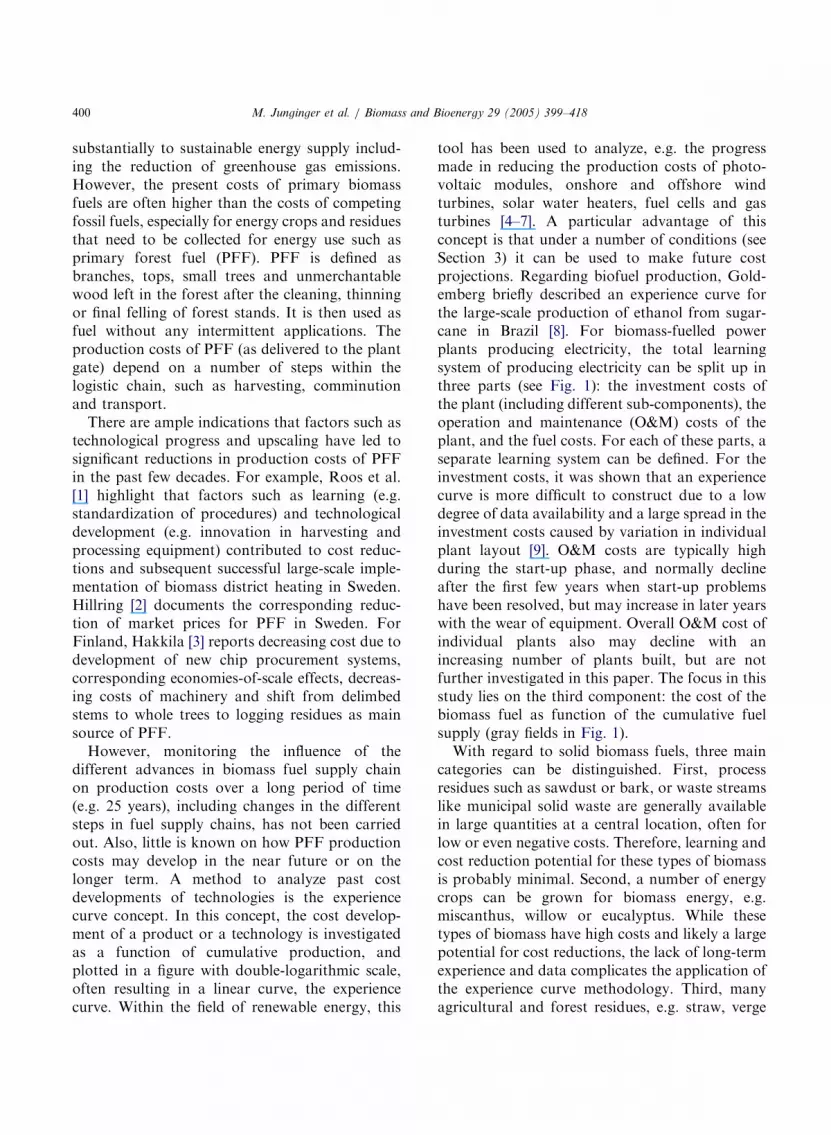
tool has been used to analyze, e.g. the progressmade in reducing the production costs of photo-voltaic modules, onshore and offshore windturbines, solar water heaters, fuel cells and gasturbines [4–7]. A particular advantage of thisconcept is that under a number of conditions (seeSection 3) it can be used to make future costprojections. Regarding biofuel production, Gold-emberg briefly described an experience curve forthe large-scale production of ethanol from sugar-cane in Brazil [8]. For biomass-fuelled powerplants producing electricity, the total learningsystem of producing electricity can be split up inthree parts (see Fig. 1): the investment costs ofthe plant (including different sub-components), theoperation and maintenance (O&M) costs of theplant, and the fuel costs. For each of these parts, aseparate learning system can be defined. For theinvestment costs, it was shown that an experiencecurve is more difficult to construct due to a lowdegree of data availability and a large spread in theinvestment costs caused by variation in individualplant layout [9]. O&M costs are typically highduring the start-up phase, and normally declineafter the first few years when start-up problemshave been resolved, but may increase in later yearswith the wear of equipment. Overall O&M cost ofindividual plants also may decline with anincreasing number of plants built, but are notfurther investigated in this paper. The focus in thisstudy lies on the third component: the cost of thebiomass fuel as function of the cumulative fuelsupply (gray fields in Fig. 1).With regard to solid biomass fuels, three main
categories can be distinguished. First, processresidues such as sawdust or bark, or waste streamslike municipal solid waste are generally availablein large quantities at a central location, often forlow or even negative costs. Therefore, learning andcost reduction potential for these types of biomassis probably minimal. Second, a number of energycrops can be grown for biomass energy, e.g.miscanthus, willow or eucalyptus. While thesetypes of biomass have high costs and likely a largepotential for cost reductions, the lack of long-termexperience and data complicates the application ofthe experience curve methodology. Third, manyagricultural and forest residues, e.g. straw, verge

ARTICLE IN PRESS
Experience curve on investment cost
Experience gained with plant operation
Experience curve on fuel supply
Investment in biomass
fuelled plants
Main components:Fuel feeding systemBoilerGeneratorTurbineHeat exchangeFuel gas cleaningEtc.
Fuel Supply ChainHarvestingForwardingComminutionTransportationEtc.
Operation and
maintenance of the plant
Output:Full-load hours (h)
Output:Capacity (kW
e)
Output:
Fuel (MJth
)
Output:Electricity (kWh
e)
Production ofelectricity frombiofuelledpower plants
Experience curve on electricity
production costs
Input: ( )
�
�
�
�
�
�
�
�
�
�
�
�
Input: ( ) Input: ( )
Input: ( )
Fig. 1. Total learning system for biomass-fuelled power plants producing electricity. The focus in this study lies on the fuel supply
chain learning system.
M. Junginger et al. / Biomass and Bioenergy 29 (2005) 399–418 401
grass or PFF may be utilized. The focus of thisstudy is on PFF production in Sweden due to thelong-term use of PFF in Sweden and the avail-ability of good data. So far, for fuel supply chainsof primary biomass such as PFF, experiencecurves have not been published.The aims of this study are to quantify cost
reductions of PFF production as achieved inSweden and to identify underlying reasons for thisreduction. Also, it is our aim to determine whetherthe experience curve concept can be employed todescribe this trend. If so, the applicability of thisconcept to analyze future cost reductions and toinvestigate the development of primary biomass inother countries will be explored.In the following section, the experience curve
concept is presented. In Section 3, the Swedishenergy policy regarding PFF production and
biomass in general is described briefly. Datacollection and data availability are described inSection 4. The results are presented in Section 5,followed by a sensitivity analysis in Section 6. InSection 7, the possibilities to use the experiencecurve concept to analyze future costs of primarybiomass in Sweden are sketched. Next, a closerlook is taken at the choice of geographical systemboundaries in the analysis. While Sweden is clearlyone of the most advanced countries regarding theproduction of PFF, cost reductions may also havebeen achieved in other countries, and experiencemay have been exchanged between Sweden andother countries. This issue is explored in Section 8.In the same section, it is investigated how insightsfrom the example of Sweden may provide valuablelessons for other countries with large wood fuelresources and (so far) less developed bioenergy

ARTICLE IN PRESS
M. Junginger et al. / Biomass and Bioenergy 29 (2005) 399–418402
systems, e.g. in Central and Eastern Europe.Finally, in Section 9 some general conclusionsare drawn.
2. Methodology—the experience curve concept
Typically, the unit cost of a technologydecreases with increasing penetration of thetechnology. This phenomenon has been frequentlydescribed historically [10,11], starting with serialproduction of airplanes at the beginning of the lastcentury [12]. A special empirical observation isthat costs tend to decline almost at a fixed ratewith every doubling of the cumulative production.This relationship can be described mathematicallyby means of the following curve, the experiencecurve:1
CCum ¼ C0 Cumb, (1)
log CCum ¼ log C0 þ b log Cum; (2)
PR ¼ 2b, (3)
where CCum is the cost per unit, C0 the cost of thefirst unit produced, Cum the cumulative (unit)production; b the experience index (o0), PR theprogress ratio.PR denotes the progress ratio, expressing the
rate of unit cost decline with each doubling ofcumulative shipments. For example, a PR of 0.8implies that after one doubling of cumulativeproduction, unit costs are reduced to 80% of theoriginal costs, i.e. a 20% cost decrease. Thedefinition of the ‘unit’ may vary: in many cases aunit is a product (e.g. a car or an airplane). Inrelation to energy technologies, more often theunit is the capacity of an energy technology (e.g.the capacity of a solar module or a wind turbine)or the amount of electricity produced by atechnology. The experience curve concept hasbeen used and applied for many different energytechnologies; for an overview see [13]. Users may
1In the remainder of this paper, the term experience curve
refers to curves which can be described with formula (1).
Plotting costs vs. cumulative production in a figure with double
logarithmic scales shows the experience curve as a straight line
(see Eq. (2)).
vary from individual cooperations analyzing thespeed with which the costs of their products maydecline, to energy modelers and national policymakers [6].It must be stated that there is no natural law
requiring production costs to follow an experiencecurve. However, this phenomenon has beenobserved empirically numerous times, and anumber of factors can be identified causing thedevelopment of cost reductions:
�
Learning-by-doing and learning-by-using, lead-ing to increased labor efficiency, work speciali-zation and improvements of productionmethods.�
Innovations caused by RD&D (learning-by-searching), leading for example, to the use ofbetter materials or the introduction of new,more effective production processes.�
Improving the network interactions betweenresearch institutes, industry, end users, policymakers, etc. (learning-by-interacting), allowingfor the better diffusion of knowledge.�
Standardization of the product, allowing up-scaling of the production plant (i.e. massproduction).�
Redesigning and upsizing (or downsizing) of theindividual product (e.g. upscaling a gas turbineleads to lower specific cost of the turbine).In many cases a combination of these factorsoccurs, and in addition, the contribution of eachmay change during the development of a productover time. For example, in the early developmentphase, RD&D expenditures may have a significantimpact on cost reductions, while typically duringthe market penetration, cost reduction due to massproduction dominates learning. Some authors alsodifferentiate between effects of (technological)learning (such as the first three factors) and scaleeffects (such as the last two factors). However, inpractice these factors may overlap and maycontribute to cost reductions simultaneously. Fora more elaborate discussion, see for example,[14–16].Regarding the use of experience curves, a
number of issues should be briefly mentioned.

ARTICLE IN PRESS
M. Junginger et al. / Biomass and Bioenergy 29 (2005) 399–418 403
First, in order to compare costs from the pastwith current costs, the data have to be correctedfor inflation. In case only data from one countryare used, normally either the GDP deflator or theconsumer price index is used. In this study, allSwedish financial data have been adjusted forinflation to the year 2002 using the Swedishconsumer price index [17]. Conversion to Eurowas carried out using the average exchange rate of2002 (1h ¼ 9.16 SEK) [18].Second, the experience curve ideally presents
the reduction of production cost. However, ingeneral, data about production costs are keptconfidential, and often only prices are publiclyavailable. Prices can be used as a proxy forproduction costs under the condition that profitmargins are a fairly constant share of total prices[4]. In this case, prices and costs decline with thesame speed. However, it is also possible that pricesare temporarily below actual production cost(forward pricing), remain stable for a prolongedtime (a so-called umbrella phase, due to e.g.an oligopolistic market) while actual produc-tion costs decline, or vary due to variations indemand or changes in tax or subsidy regimes.Prices can also drop dramatically for a shortperiod of time if there are too many suppliers onthe market, causing shakeout effects [4]. In allthese cases, prices cannot be used directly as proxyfor costs. Thus, the analysis should always coverwhether prices have been dominated by produc-tion costs or have also been influenced by otherfactors.Third, next to the system boundaries shown in
Fig. 1, the correct geographical boundaries shouldalso be determined for the learning system.Experience curves are often set up for individualcountries, especially when the aim is to supportand evaluate policy measures. When the focus lieson analyzing the speed with which the costs of atechnology are reduced, it is of importance todetermine whether experience has been gainedfrom developments within the analyzed systemonly, or also from developments outside thissystem. Not including experience gained outsidethe investigated system may lead to seriousdistortions in the results, as shown in the case ofwind turbine cost developments [19].
Other issues, such as whether or not the PR is aconstant or may change with the diffusion of thetechnology or to what extent the concept ofexperience curves can be used for policy making,are not discussed here for sake of brevity. For adetailed discussion of the use of experience curvesin energy technology development, see e.g. [4,6,13,19,20].
3. The Swedish background
3.1. Swedish policy concerning biomass 1975– 2003
Since the late 70s, the use of wood fuels hasstrongly increased in Sweden. Main driving forcesfor developing biomass use for energy were high oilprices in the late 70s and first half of the 80s,development of alternatives for nuclear powerenergy supply and (later) growing awareness of thepossible negative effects of climate change due togreenhouse gas emissions of fossil fuel use. Swedishpolicy has stimulated wood fuel use through anumber of instruments. First of all, the oil crisis inthe early 70s triggered a number of energy RD&Dprograms. The aim of these programs varied overtime accordingly to the driving forces mentionedabove, but basically always included the promotionof biomass use [21,22]. Second, both in the 80s and90s, investment subsidies of up to 25% on boilers ortotal investment costs were available for biomass-fuelled district heating and CHP plants [21,23,24].Further subsidies for biofuelled heating plants wereavailable from the Local Investment Programbetween 1998 and 2002. Since 2003, subsidies areavailable from the climate investment program [25].Third, the introduction of a CO2 tax in 1991 andtaxes on NOx emissions from fossil fuels used forheating strongly improved the competitiveness ofthe use of biomass fuels for the production of heatand electricity [21]. Finally, a number of other policymeasures, e.g. the solid fuel act and the wood fiberact, promoted the increased use of biomass inSweden to some extent [21]. For the future, therenewable electricity certificate system may alsocause increased biomass-based CHP capacity [25].Since its introduction in May 2003, 75% of thecertificates issued were for biomass-based electricity

ARTICLE IN PRESS
0
10
20
30
40
50
60
70
1970 1975 1980 1985 1990 1995 2000 2005
Year
Ann
ual P
FF
pro
duct
ion
(PJ)
PFF production reported in literature
Average estimate PFF production
High estimate PFF production
Low estimate PFF production
Marketed fuel chips
Woodfuel consumption in district heating
Self-sufficiency
Climate change
Alternatives to Nuclear Energy
Fig. 2. Annual PFF production in Sweden in the period 1970–2003 as reported in or derived from literature [27,31,35,39,52–57,60,77].
Using these data points, an average, low and high estimate of PFF production is presented. Marketed wood fuel chip volumes and
consumption of wood fuels in district heating plants are presented for comparison [50,78]. Main driving forces over time behind the
increased use of biomass energy are also shown.
M. Junginger et al. / Biomass and Bioenergy 29 (2005) 399–418404
[26]. Due to beneficial policies, the production ofPFF started off in the second half of the 70s inSweden. Consequently, the development of PFFproduction volumes and costs in Sweden can beinvestigated over a period of almost three decades(see Fig. 2).
3.2. The Swedish PFF supply chains
There are three main PFF sources: slash fromfinal fellings, slash and small trees from thinningsand cleanings, and unmerchantable wood. Slashfrom final fellings constitutes the largest share:over 71% in 1996 [27]. According to most expertsinterviewed, this share has even increased over thelast few years. There are four main supply chainsof PFF from final fellings, which basically differfrom each other with respect to the comminutionstep:
1.
In the terrain-chipping method, the slash isdirectly chipped in the field, collected in a smallcontainer and then brought to the roadside,where the chips are transferred to a truck.
2.
When using the roadside chipping method, theslash is first forwarded to the roadside, where itis chipped directly into a container truck (loadvolume up to 100m3) either by a mobile chipperor a truck-mounted chipper.3.
Terminal chipping is a third option, where theuncomminuted PFF is transported (short dis-tances) to a central terminal, where the slash iscomminuted, and loaded onto large bulk trucks(volume up to 130m3). Occasionally, loose slashis transported to the plant directly (especiallywhen the transport distance is short), andchipped at the plant. Terminal chipping alsoencompasses the tree section method, in whichtrees are felled, cross-cut forwarded and truckedwithout first delimbing the stems [28]. Thismethod was popular in the 80s, but has basicallynot been practiced during the last decade.4.
When a fourth option, the bundling method, isapplied, the PFF are compressed to composite
ARTICLE IN PRESS
Table 1
Overview of the different steps within the four fuel supply chains
Supply chain Location
Clear cutting Roadside Terminal Plant gate
1. Terrain chipping Residues are chipped
into a small container,
and forwarded to the
roadside
Chips are transferred
from small container
to a container truck
— PFF arrive at plant as
chips
2. Roadside chipping Loose slash is
forwarded to the
roadside
Slash is chipped at the
roadside, and blown
into a container truck
— PFF arrive at plant as
chips
3. Terminal chipping Loose slash is
forwarded to the
roadside
Loose residues are
loaded on a container
truck and transported
to a terminal
Residues are chipped
by a stationary chipper
and loaded on a bulk
truck
PFF arrive at plant as
chips
4. Bundling Loose slash is bundled,
and forwarded to the
roadside
Bundles are loaded on
a truck
— Bundles are chipped at
the plant
M. Junginger et al. / Biomass and Bioenergy 29 (2005) 399–418 405
residue logs (CRLs) using a mobile bundler inthe terrain. These CRLs have similar dimen-sions as round wood, and are forwarded toroadside, and transported by truck to the enduser, where comminution takes place.
A summary of the chains is presented in Table 1.For a more elaborate description of these meth-ods, see for example, [29,30]. The first threemethods have been practiced in Sweden since thelate 70s, while the bundling method is still beingtested in Sweden. The most predominant supplychain over the last 20 years in Sweden is roadsidechipping, covering approximately 40% in the early90s [31] to about 75–80% nowadays [32].
4. Data collection and availability
Data on production costs, market prices andproduction volumes of PFF in Sweden werecollected by literature review, the use of Swedishenergy and forestry statistics and a number ofsemi-structured interviews with experts in the field.
4.1. PFF production costs and prices
The production costs of PFF in this study areset at the plant gate, i.e. including steps such as the
felling, forwarding, comminuting, compacting,transportation, stumpage fee and overhead/ad-ministrative costs in relation to these activities, butexcluding costs for storage or further fuel pre-paration at the plant. The availability of data onproduction costs of PFF in Sweden is reasonable.Due to the extensive amount of research carriedout in Sweden on the use of PFF, a number ofproduction cost analyses of PFF supply chainshave been published between 1981 and 2003[32–44]. Also, specific studies regarding steps inthe chain (such as forwarding or truck transport)are available. These studies are sufficient to gaininsights in the development of costs of theindividual steps in the fuel supply chains. How-ever, the production cost data from these studieswere insufficient for the construction of anexperience curve. Therefore PFF prices were usedas proxy for production costs. Regarding data onPFF prices, no exact data were found for theperiod before 1981. Due to the small amountsproduced, no well-developed market existed,and so it is difficult to determine average pricelevels. In this study, estimates given by Hillring,Gustavsson and Nilsson [2,45,46] for the period of1975–1980 were used. From 1981 to 1984, priceswere recorded by Lonner and Parikka [47]. Since1984, prices of PFF have been recorded by theSwedish competition authority (SPK) [35]. From

ARTICLE IN PRESS
M. Junginger et al. / Biomass and Bioenergy 29 (2005) 399–418406
1984, onwards the Swedish Energy Agency STEM(formerly Nutek) monitored the development ofPFF prices in Sweden. Since 1993 this monitoringis executed both per season and per region [48,49].
4.2. PFF production volumes
Annual production volumes of PFF have beenpoorly recorded in Sweden. Only the aggregatedconsumption of all biomass fuels has been monitoredcontinuously since the late 70s [50]. However, thesources of the biomass are not specified, and containalso imported biomass. From 1986 onwards, theproduction of (marketed) wood chips has beenmonitored by the Swedish wood fuel Association[50,51], but it covers production of its members only,thus causing an underestimation. Also, the origin ofthe wood chips is unknown [51]. In the 80s, the sourcewas to a large degree Swedish PFF, but later on alsochips from industry byproducts and recycled woodhave become more significant, thus causing an over-estimation. In addition, the degree to which PFFswere marketed vs. used internally (and thus notrecorded in statistics) is unclear. Only for 2003, adetailed survey was recently published, covering 64producers, and specifying which part of the chips isderived from PFF [52]. Other literature only inciden-tally reports actual production levels of PFF[27,31,35,39,53–59]. The most elaborate study wasperformed by Filipsson [27] who conducted anextensive survey covering the 59 producers of PFFs,though only for production in 1996. In order to obtainmore insights in the relative changes in productionquantities over time, several of the largest PFFmanufacturers were contacted to obtain more histor-ical first-hand data. This proved rather laborious, asmost producers either did not wish to participate inthe survey, or did not possess the required data. Intotal, four producers supplied (fragmented) produc-tion figures under strict conditions.
5. Results
5.1. Production quantities
As described in Section 4, time series on PFF inSweden are not available. Therefore, PFF produc-
tion levels were estimated based on literature (graycircles in Fig. 2) and expert opinions. Overall, astrong increase in annual production during thelate 70s and early 80s is observed. In the second-half of the 80s, with declining oil prices the annualPFF quantities probably declined somewhat.From 1990 onwards, annual quantities are esti-mated to have increased by 10–15% per year [60],though very little actual data from this period areavailable. For 1996, the lower estimate is based ona survey covering all major producers of PFF [27],while the upper estimate covers also additionalsmall-scale production [60]. Since 2000, amountshave likely increased, as slightly higher pricesincreased profit margins. The data obtained fromthe individual producers support these develop-ments in general, but do not show a coherentpicture. Most producers started in the early 80s,but while two have increased their productioncontinuously, two others display (strongly) de-creasing rates after 1996.To parry the uncertainty of this data, next to a
best estimate, a low- and high production scenarioare included, see Fig. 2. The low productionscenario is based on the lowest production figuresavailable between 1977 and 2003. The highproduction scenario differs from the averagescenario for the period 1978–1985, assuming astronger annual increase in PFF productionvolumes, based on the highest available estimatesin this time frame.Regarding consumption, most marketed PFF
was consumed in district heating plants, where itconstituted the major share of wood fuels in the80s. In total, the number of district heating plantsfiring PFF has increased from 1 in 1981 to over130 in 2002 [61]. From 1990 onwards, secondaryresidues such as bark and sawdust and importedwood fuels gained importance as fuel (see Fig. 2),causing a lower growth in annual PFF produc-tion. Since 2000, steadily increasing demand forwood fuels has also caused an increase in PFFproduction.
5.2. Supply chains and production costs
As described in Section 3.2, the roadsidechipping supply chain is predominant in Sweden.

ARTICLE IN PRESS
R2 = 0.67
R2 = 0.77
0.5
1
1.5
2
2.5
3
1980 1982 1984 1986 1988 1990 1992 1994 1996 1998 2000 2002 2004
Year
Pro
duct
ion
cost
(E
uro(
2002
)/G
J)Forwarding to roadside
Chipping at roadside
Fig. 3. Forwarding and chipping cost 1981–2003. Data from literature studies and interviews [31–35,40,42–44,64,65,79–81].
M. Junginger et al. / Biomass and Bioenergy 29 (2005) 399–418 407
Factors influencing the costs for this chain areillustrated below.
Felling costs are normally allocated to the mainproducts (timber and pulp), and not to the PFFproduction costs.2 Due to increased awareness thatthe slash is going to be harvested, harvesteroperators have learned to avoid driving over theresidues, thereby reducing the contamination ofthe slash with rocks and earth. Furthermore, whileslash used to lie randomly distributed over theclear-cutting, nowadays during processing it ispiled next to the timber and pulp wood. Thesechanges in slash treatment have indirectly led tolower costs for the following steps.
Forwarding costs have been lowered mainly dueto the experience gained by learning-by-doing andimproved equipment. Forwarders have adoptedthe method to only ‘cream off the top’, while in theearly days they were often instructed to collect asmuch slash as possible [62]. Regarding equipment,
2So far the revenues of PFF are marginal compared to
revenues from round wood and pulp production. With the
continuing growth of PFF production and potentially increas-
ing revenues, in the future possibly a part of felling costs may
also be attributed to PFF.
often forwarders nowadays are used with anextended slash-carrying capacity. These factorshave increased PFF quality and forwarder pro-ductivity, thereby reducing costs/GJ (see Fig. 3).Another important factor is increased operatorexperience. This is basically important for all stepsinvolving complex human tasks (mainly fellingand forwarding). A well-documented example oflearning-by-doing in PFF harvest is described byBjorheden [28] for tree-section hauling in centralSweden. In this study, a clear increase in produc-tivity (measured in payload/truck) was found ofapproximately 10% within 2 years under constantcircumstances of technology (same machineryused), work object properties (e.g. same tree typesharvested) and conditions of work (e.g. weather orlegislation).Furthermore, chipping costs at the roadside have
been reduced significantly (see Fig. 3). This can beattributed to a large extent to the advantages ofless-contaminated slash at the roadside andtechnical development of chippers. Since 1980,the average roadside chipper has increased inproduction capacity, and technical availability hasincreased from approximately 50% in 1980 to anestimated 90% nowadays [63].

ARTICLE IN PRESS
M. Junginger et al. / Biomass and Bioenergy 29 (2005) 399–418408
In comparison, net transportation costs seem tohave remained stable. The predominant transpor-tation mode is wood chips in containers trucks. Acomparison of transportation costs of chips incontainers from the roadside described in sevenSwedish studies between 1977 and 2000 revealedthat neither fixed nor variable costs have changedsignificantly in real terms (see Fig. 4). This is likelydue to the fact that container transportation ontrucks has been carried out for many decades, andthe potential for cost reductions is probablyminimal. However, the variation shown in Fig. 4ranges from approximately 0.28 Euro/GJ at shortdistances to 0.39 Euro/GJ at long distances.
00 40 80 120 160
0.2
0.4
0.6
0.8
1
1.2
1.4
1.6
1.8
2
Transportation distance (km)
Tra
nspo
rtat
ion
cost
(E
uro(
2002
)/G
J) Project HelträdsutnyttjandeAlexanderson Nilsson AnderssonHektorBrunbergJohansson
Fig. 4. Comparison of chip transportation costs using contain-
ers in Sweden 1977–2000 from seven studies [32,34,40,53,
54,82,83].
Table 2
Comparison of the cost structure of roadside shipping fuel supply ch
PFF production cost (Eu
Year: 1983
Forwarding 1.61 (28.3%)
Chipping 1.89 (33.3%)
Transportation 1.23 (21.6%)
Stumpage fee and other cost 0.95 (16.7%)
Total 5.68 (100%)
In brackets, the relative share of total costs is presented. These numbe
distances to the road, optional roadside storage, transportation dista
Also, as the supply potential is much larger thancurrent demand and the number of plants utilizingPFF has increased (e.g. district heating plantsfrom 1 in 1981 to over 130 in 2002), the averagetransportation distance (50–80 km [64]) has notchanged much over the last 20 years.Another cost factor is a stumpage fee for the
forest owner. The height has varied over the last25 years, mainly depending on the market prices.In addition, administrative/overhead costs havebeen between 10% and 15% of total productioncosts both in early and recent years [38,44,65].Since the early 80s, the developments described
above have led to a significant reduction ofproduction costs. In Table 2, two studies from1983 and 2003 are compared directly. It isconcluded that forwarding cost have been reducedmost (about 58%), followed by chipping costs(about 33%), corresponding well to the generalcost development trends shown in Fig. 3. Thetransportation costs seem also somewhat reduced(15%). However, the transportation distance usedin the SPK study [35] was not given. The reductionmay be due to variations in transportation costsdue to local factors. Overall, the share in totalcosts has increased from 22% to 27%.This is also illustrated by Fig. 5 in which a
number of cost breakdowns are shown of differentsupply chains for PFF production from finalfellings, described in literature between 1981 and2003. The different studies and costs cannot simplybe compared one-on-one, due to differing assump-tions and settings, e.g. average forwarding andtransportation distances, harvesting of green
ains in 1983 and 2003 [35,44]
ro(2002)/GJ) Cost reduction (%)
2003 2003 vs. 1983
0.68 (17.7%) 58
1.27 (33.0%) 33
1.04 (27.2%) 15
0.85 (22.1%) 10
3.84 (100%) 32
rs can vary according to the size of the clear-cutting, forwarding
nce, possible stumpage fee, etc.

ARTICLE IN PRESS
Rc
RcRc
McMc
Rc
Rc
Tc
Rc
Rc
Mc
Rc Rc
0
2
4
6
8
SV
EB
IO (
81)
Nils
son
(82)
SP
K (
83)
Bjö
rhed
en (
85)
Rut
egar
d (8
6)
Lönn
er (
89)
Dan
iels
son
(90)
Hek
tor
(92)
Bru
nber
g (9
4)
Bru
nber
g (9
8)
Bjö
rhed
en (
99)
And
erss
on (
00)
Liss
(03
)
Pro
duct
ion
cost
s (E
uro(
2002
)/G
J)Forwarding Comminution Transportation Stumpage fee Other
Average price level for wood fuel
In Terrain chipping (Tc), chipping costs are included with forwarding cost
Fig. 5. Examples for the cost development and composition of Terrain (Tc), Roadside (Rc) and terMinal (Mc) fuel supply chains in
Sweden from various literature studies [32–44] between 1981 and 2003. Not for all years studies were available. Note that these studies
were not carried out under the same conditions, e.g. average forwarding and transport distances may differ. National average price
levels for fuel chips are also presented for comparison.
M. Junginger et al. / Biomass and Bioenergy 29 (2005) 399–418 409
(fresh) or brown (seasoned) PFF, assumed har-vesting area size, etc. Yet, the overall pictureshows a clear reduction in production costs.
5.3. Prices, market situation and relation to
production costs
Average national data on prices can be regardedas relatively reliable, as they have been monitoredconsistently since the mid-80s. Before 1984, priceinformation is likely to be more uncertain, as alsothe traded PFF volumes were very small. It shouldbe noted that local prices may deviate due tospecific demand and supply conditions. Also,prices may generally be higher during wintertimedue to higher demand by district heating plants. Inthis study, prices averaged over the whole ofSweden and the whole year are used.As can be seen in Fig. 5, the production cost
level has not been much lower than market prices,
especially during the 90s. In the early 90s,regulations regarding the use of sawdust pulpchips for energy use were abandoned [66]. Thiscaused a strong increase in the use of bark,sawdust and refined wood fuels. In addition, sincethe beginning of the 90s and especially from 1995onwards, large-scale imports of various forms ofbiomass (e.g. refined wood fuels, wood chips, talloil and waste wood) occurred, mainly from theBaltic States, but also from Russia, Canada,Finland and other countries [67]. During thisperiod, incidentally, prices were even lower thanproduction costs and some PFF suppliers wentbankrupt. Only since 2001, prices and profitmargins have been going up again, due toincreasing demand and limited supply of second-ary residues.Thus it is concluded that since prices in general
reflect production costs rather well (i.e. no stronglyvarying profit margins) in the past, prices can be

ARTICLE IN PRESS
Cumulative production of PFF in Sweden 1975-2003 (PJ)
Woo
d ch
ip P
rices
(E
uro(
2002
)/G
J)
3
4
5
6
7
8
9
10
11
12
Average production estimate
Low production estimate
PR = 87%, R2= 0.93
PR = 86%, R2= 0.93
High production estimate
PR = 88%, R2= 0.87
Price data weighed
PR = 85%, R2= 0.90
1975
1980
1985
1990
19952003
Umbrella
Shakeout
Priceincrease
1 5 10 50 100 500
Fig. 6. Experience curve for Swedish PFF production from 1975 to 2003. For clarity, only for the best PFF production estimate, actual
data points are given. For the low/high PFF production scenarios (see Fig. 2) and the weighed price data scenario (see Section 6), only
the resulting trend lines are presented. From 1983 to 1987, PFF prices are almost constant, likely due to high oil prices. From 1987 to
1992, prices decline rapidly, probably due to increased competition from low oil prices and other wood fuels. Since 2002, prices appear
to increase, possibly caused by increasing demand for PFF.
M. Junginger et al. / Biomass and Bioenergy 29 (2005) 399–418410
used for devising the experience curve of PFF inSweden. However, as average prices are notdetermined by PFF production alone, in the futurethey may deviate more from production costs, asdemand for PPF is expected to rise further in thenear future.
5.4. Experience curves for Swedish PFF production
Using the annual average production volumesof PFF and the market prices for wood fuel chips,an experience curve for PFF in Sweden wasdevised (Fig. 6). The PR of this curve is about87%,3 measured over more than 10 cumulativedoublings of PFF production in Sweden. Thecorrelation of R2 ¼ 0:93 is quite satisfactory forthis type of analysis [13]. In the time period from
3In an earlier publication [68], a slightly lower PR of 86%
was presented, due to the use of a different fitting algorithm.
1975 until 2003, prices were reduced by 65–70%,from approximately 11 to 3.3–3.8h(2002)/GJ at theplant gate.
6. Sensitivity analysis
There are two main uncertainties in the dataused: the annual PFF production volumes arepartially based on estimates, and the price databefore 1980 are not well recorded. To analyze theeffect of uncertainties in the production volumes,experience curves were devised using the low andhigh production scenario described in Section 5.2.The corresponding PRs are 86% and 88%,respectively (see Fig. 6). As described previously,the price data before 1981 are based on estimates.As data situated at the beginning of an experiencecurve can influence the PR relatively strongly([69]), another experience curve was devised, in

ARTICLE IN PRESS
M. Junginger et al. / Biomass and Bioenergy 29 (2005) 399–418 411
which the price data from 1981 onwards wereweighed by a factor of 10 compared to the databefore 1981. As no indication was available onhow good these estimates are, this factor is chosenrelatively arbitrarily. The resulting PR of thecorresponding experience curve is 85%. Whenleaving out the data before 1981 altogether, the PReven drops to 81%. However, such a strong costreduction is not deemed realistic, as the databefore 1980 are expert estimates, and should notbe completely dismissed.Furthermore, as mentioned in Section 3 the rate
at which production cost and market prices declineis not necessarily identical. From the historicalbackground and from Fig. 6, it can be seen thatPFF prices temporarily remained stable due to thehigh oil prices, while actual production cost mostlikely kept declining. With rapidly declining oilprices from the mid-80s onwards, PFF pricesproducers were forced to lower prices as well, whichled to a number of bankruptcies. These two phasescan also be described as ‘umbrella’ and ‘shakeout’phase (see Section 2). From the early 90s onwards,prices have been very close to costs due tocompetition from secondary wood fuels and im-ported wood (see Section 5.3), and thus the data aremost likely suitable to be used in experience curveanalyses. Since 2001, prices show a tendency toincrease again, due to an increased demand. Whenthe average production scenario is used and theprices are left out from 2001 onward (which showan increasing trend), the change in PR is statisticallyinsignificant. Given the relative uncertainty in bothproduction volumes and prices, a 85–88% range willbe used in the remainder of this paper.
7. Application for future cost reduction analysis in
Sweden
When using experience curves to assess potentialfuture cost reductions, a number of steps arerecommended. First of all, developments shouldbe identified that may bring costs down further inthe future [5]. As was shown in the previoussections, the largest cost reductions have beenachieved in chipping and forwarding, and littlefurther cost reductions are expected here. From
literature and interviews with experts in the field,two main potential developments were identified,that could lead to further cost reductions inSweden:
Increased utilization of pulp wood: The first mainoption may be an increase of production levels ofPFF by using so-called long tops (i.e. more stemwood) for PFF production [70]. This means, thatthe fraction currently used as pulp wood is used asPFF. There are several advantages to this: theyield per hectare is higher, causing a higherproductivity. Compared to the conventional road-side chipping, production costs have been esti-mated to be 16% lower. Second, the relative barkcontent is lower (due to a higher fraction of ‘white’stem wood), for which heating plants are willing topay up to 17% more than for ordinary wood shipsfrom slash [70]. The economic viability of thisoption is mainly depending on the price of pulpchips and PFF. In addition, the fiber industry islikely to perceive such a development as a threat totheir raw material supply.
Application of bundling technology: The secondmain option may be a reduction of transportationcost which so far has shown little cost reduction.One way may be the use of bundling technology.CRLs have a higher density than wood chips, thusdecreasing the transportation costs per ton PFF.These may outweigh the additional bundling costs,especially for large transportation distances[71–73]. The possibility to introduce this technol-ogy on a large scale in Sweden is discussed inSection 8. Another option could be furtheroptimization of the logistics of supply anddemand. As one PFF producer stated, thecoordination between production and demand isoften complex, and incidentally transportationdistances above 100 km occur [74]. Better planningmay result in lower average transportation dis-tances, and thus lower costs.To assess future cost reductions, the experience
curve can be combined with a Swedish fuel supplycurve, taking into account the availability of PFF.For example, taking into account ecological andtechnical restrictions, Lonner et al. [75] found thatabout 340 PJ of PFF may become available inSweden per year at production cost levels between3.2 and 5.8 Euro(2002)/GJ. At a utilization of

ARTICLE IN PRESS
M. Junginger et al. / Biomass and Bioenergy 29 (2005) 399–418412
36 PJ in 2003 and an annual 10% increase of PFFproduction from 2004 until 2020, PFF productionwould amount to ca. 180 PJ in 2020. Thiscorresponds to 1600 PJ cumulative production,another 1.8 doublings compared to current cumu-lative production of PFF. As a rough indication,assuming a PR of 87% and average productioncosts at plant gate of 3.7 h(02)/GJ at present, areduction of average production costs of 24% toca. 2.8 h(02)/GJ could be achieved. Using the PRrange of 85–88%, the cost reduction estimate liesbetween 21% and 26%. These cost reductions maypossibly be achieved by two developments de-scribed above, but should be investigated further.However, such an analysis must also take into
account that with increased production levels alsotransport distances will likely increase, and it maybe necessary to use PFF increasingly from thin-nings or from smaller average lot size, as theavailable PFF volumes from final fellings arelimited [75]. These factors may increase averagePFF production costs, and thus the suggested costreduction is probably too optimistic.4
Furthermore, it must be pointed out again thatproduction cost and market prices are notidentical. So far, supply in most parts of Swedenhas been abundant, keeping prices low. If, how-ever, demand continues to increase in the future,prices might increase as well. This would meanthat prices may no longer be a proxy for costs.However, it would imply also that with continuingdecrease of production costs, a larger amount ofPFF would be economically accessible (e.g. morePFF fuel from thinnings and cleanings).
8. Geographical system boundaries and
applicability for other countries—methodological
considerations
As stated in Section 3, when analyzing the speedwith which technological learning and cost reduc-
4However, longer transportation distances and higher fuel
costs do not necessarily have to lead to higher cost of heat or
electricity. Larger amounts of available wood fuels may allow
the use of larger plants, which generally have higher conversion
efficiencies than small plants, thereby lowering the total
production costs.
tions occur, it is of importance whether significantlearning has also taken place outside the geogra-phical system investigated, and whether there wasany interaction between the system investigatedand other learning systems. In case an internationallearning system exists, an analysis of only a part ofthe learning system may lead to distorted results.In the case of PFF production, only a handful of
countries have had similar production increases ofPFF fuels in the last 30 years, the most importantones being Finland and Austria; so, the number ofpotential candidates to exchange knowledge withis limited. Furthermore, as was shown in previoussections, a large amount of the cost reductionachieved is due to learning-by-doing. This experi-ence (e.g. operator skills) is often dependent onlocal conditions, and is probably not easily‘exported’ compared to exporting machinery. Interms of technology development (such as harvest-ers, forwarders and chippers), Sweden and Finlandwere the most dominant countries in the lastdecades [26]. Also due to the geographical vicinity,Finland and Sweden have had close links. There-fore, Finland seems to be the most likely countrywith which knowledge may have been exchanged,and a comparison between the two countries isdiscussed below.Finland had a similar rise in PFF production
levels in the early 80s, though not to the same levelas Sweden (see Fig. 7 and compare to Fig. 2). Also,production levels declined more strongly in thesecond half of the 80s. Starting in 1992, Finlandhas shown renewed interest in PFF production,and two 5-year R&D programs have been carriedout since. Since 1992, annual production volumessharply increased annually, and it is likely thatannual PFF production in Finland will surpassSweden in 2004. However, when adding up allPFF production over the last decades until 2001, itis estimated that Finland produced an approx-imate cumulative 80 PJ only, compared to over600 PJ of cumulative PFF production in Sweden.In Finland, between 1987 and 1992, prices seem
to remain stable, but during the period 1992–1998a very strong decline in prices occurred, afterwhich prices stabilized again (see Fig. 8). If theprices between 1992 and 1998 were plotted againstthe cumulative produced PFF volume (starting in

ARTICLE IN PRESS
Fig. 7. Use of forest chips since the mid-1950s in Finland (source: Hakkila, 2004, [30]). For comparison with the Swedish production
(see Fig. 1): 1mm3 corresponds to approximately 7.2 PJ.
Cumulative PFF production in Finland (PJ)
30 40 50 60 70 80 90 100
Fin
nish
PF
F p
rices
(E
uro(
2002
)/G
J)
2
3
4
5
6
71992
1998"PR" = 11%
R2= 0.97
Fig. 8. Finnish wood chip production and price levels (all dots)
from 1988 to 2001, and a Finnish ‘experience curve’ from 1992
to 1998 (black dots). Production levels were estimated from Fig.
7, prices are taken from the Finnish energy statistics [76]. All
prices were deflated using the Finnish consumer price index.
M. Junginger et al. / Biomass and Bioenergy 29 (2005) 399–418 413
1970), the resulting experience curve would have aPR of 11% (i.e. 89% cost reduction with everycumulative doubling). Clearly, this rate cannot besustained and also cannot be attributed to theFinnish learning and R&D efforts alone. Morelikely, this rapid decline can be attributed to tworeasons: first of all, the source of PPF changedfrom small delimbed stems via small whole trees(both from thinning operations) to logging resi-dues (from final fellings) [3]. Using the latter ismore economical because of the far higherquantities of PFF available per hectare. Second,it is likely that Finland was able to import a largeamount of technology and experience previouslydeveloped and gained in Sweden [62]. For exam-ple, the bundling concept had been mainlydeveloped in Sweden, and was successfullyadopted in Finland. Only when they reached theSwedish price levels, the prices stabilize again,5
5Actually, price levels are lower than in Sweden. This may be
attributed to several factors: the absence of stumpage fees and
taxes on diesel fuels in Finland, and the predominant harvesting
of green residues in Finland. In Sweden, mainly brown residues
are harvested, which may lead to an increased dry matter loss
and thus higher prices per GJ. In addition, the data given in the
figure are based on Finnish energy statistics data, in which the
transportation distance is not specified [76].
and have been slightly increasing over the last fewyears, most likely due to increasing transportationdistances.As a methodological exercise, an additional
experience curve is devised, in which the cumula-tive production of PFF in Sweden and Finland is

ARTICLE IN PRESS
Combined cumulative PFF production of Sweden and Finland (PJ)
10 100
Sw
edis
h P
FF
pric
es (
Eur
o(20
02)/
GJ)
3
4
5
6
7
8
9
10
11
12
PR = 85%
R2 = 0.97
Fig. 9. Experience curve for Sweden and Finland combined, using the Swedish PFF prices and the combined cumulative PFF
production of Finland and Sweden between 1975 and 2003. Compared to the ‘average production’ experience curve of Sweden alone,
the PR is lower (85% vs. 87%) and the correlation improves (R2 of 0.97 vs. 0.93).
M. Junginger et al. / Biomass and Bioenergy 29 (2005) 399–418414
combined. The resulting curve displays a highcorrelation coefficient (R2 ¼ 0:97), and a PR of85% (see Fig. 9), which is within the range foundfor Sweden alone (85–88%). So, it would seemthat experience was exported from Sweden toFinland, effectively enlarging the learning system.Due to the relatively small cumulative amountproduced in Finland, the impact on the PR is smallin the case of Sweden but very strong in the case ofFinland. It is emphasized, that before any finalconclusions can be drawn from these results, amore detailed investigation should be carried out,about when and to what extent knowledge andtechnology was exchanged between the differentcountries. With the strong ambitions of Finlandfor future production levels, and their currentleading role in technology development, Finlandmay obtain the leading position in the future.Therefore, it seems evident that for future costestimates, the Finnish PFF production volumesand production cost developments should be takeninto account.
For future developments, also another aspect isof importance: Finland increasingly follows adifferent supply chain strategy than Sweden. InSweden, PFF consumers are mainly small-to-medium-scale heating plants, often situated closeto or in residential areas. As quite a large numberof these plants exist, transportation distances ofwood chips are relatively small. These plants oftenhave limited storage capacities, and restrictionsregarding noise and odor emissions. Finland,however, has built recently some very large(CHP) biomass energy plants, including the Alho-mens Kraft plant of 550MWth/240MWe inPietarsaari. These plants require large amountsof biomass, and thus larger transportation dis-tances, which makes CRL transportation favor-able to chip transportation. In addition, largetransportation distances increasingly allow trans-portation by train or boat, increasing transporta-tion efficiency. The large scale also enables theseplants to operate large crushers, which is often notpossible in existing Swedish plants.

ARTICLE IN PRESS
M. Junginger et al. / Biomass and Bioenergy 29 (2005) 399–418 415
This leaves the question, whether and how thePR range of 85–88% might be used for estimatingfuture production costs in other countries, startingto produce PFF, such as many eastern-Europeancountries. One obvious pitfall would be to applythese PR values directly to the (starting) PFFproduction of another country. This would cer-tainly lead to overoptimistic cost reduction projec-tions. Probably, a more sensible approach wouldbe to analyze the extent to which technology andexperience is exported to these countries, andpossibly use the combined PFF production ofthese countries and the production in Scandinaviaas shown in Fig. 9. Factors which would also haveto be taken into account are whether the same fuelsupply chain will be used (e.g. roadside chipping),whether the same technology is used (chippers,forwarders, trucks, etc.), how local circumstancesdiffer from the situation in Scandinavia (e.g.average transportation distances or wage differ-ences between Scandinavia and Eastern Europe),and how the tacit knowledge of Scandinavianoperators and entrepreneurs can be transferred.
9. Conclusions
The analysis has shown that the costs of PFFhave decreased with cumulative production andthat the experience curve concept is suitable todescribe this trend. In Sweden, cost reductionsfollow an experience curve from 1975 to 2003 overnine cumulative doublings of PFF production.The PR was determined to be between 85% and88%. This analysis is based on PFF prices, whichwere found to reflect PFF production costs ratherwell. For the short to medium term, the experiencecurve may be a tool to assess further productioncost development in Sweden, taking into accountthe available potential. This may allow policymakers to estimate cost developments of PFFproduction and to determine policy supportmeasures that may be required for PFF produc-tion accordingly.In regard to the methodology, it was shown that
the experience curve can be applied to PFF supplychains. A methodological issue that needs furtherexploration is how learning took place between
Sweden and other countries, especially Finland,and how the development of technologies used inPFF production in these countries should becombined with the Swedish experiences. It maythen be possible to use the experience curveconcept to estimate PFF cost developments incountries with a large potential of PFF supply butless-developed PFF supply systems. Within theframe of the growing Eastern European marketand the emerging international trade in woodfuels, it is recommended that the production costdevelopments in these new PFF producing coun-tries be monitored. Transferring knowledge andtechnology to these countries may be crucial tolow PFF costs, which (through imports ofbiomass) may also be beneficial to implementationof biomass energy in countries with less abundantbiomass resources.
Acknowledgments
The authors would like to thank the followingpersons for their time and help: Anders Wester-berg, Bengt Hillring, Bengt-Olof Danielsson,Berndt Norden, Goran Hedman, Jan-Erik Liss,Lars-Goran Harrysson, Lotta Tranvik, MagnusThor, Mats Hakansson, Minna Niininen, OlaGalfvensjo, Sven Hogfors, Tomas Gullberg,Tomas Gusten and Ulf Johnsson. We are gratefulto Lena Neij for valuable comments on an earlierdraft of this paper. The main author would like toexpress his gratitude to Vaxjo University forlogistic support.This research was carried out within the frame-
work of the ‘Stimuleringsprogramma Energieon-derzoek’, which was set up by the NetherlandsOrganization for Scientific Research (NWO) andNovem (Nederlandse Onderneming voor Energieen Milieu). The financial support from NWO/Novem is gratefully acknowledged.
References
[1] Roos A, Graham RL, Hektor B, Rakos C. Critical factors
to bioenergy implementation. Biomass and Bioenergy
1999;17(2):113–26.

ARTICLE IN PRESS
M. Junginger et al. / Biomass and Bioenergy 29 (2005) 399–418416
[2] Hillring B. The Swedish woodfuel market. Renewable
energy 1999;16(1–4):1031–6.
[3] Hakkila P. Wood energy in Finland. In: Richardson
J, Bjorheden R, Hakkila P, Lowe AT, Smith CT, editors.
Bioenergy from sustainable forestry: principles and prac-
tices, Coff Harbour, Australia: IEA Bioenergy; 2000.
[4] IEA. Experience curves for energy technology policy.
Paris, France: International Energy Agency; 2000. p. 127.
[5] Junginger M, Faaij A, Turkenburg WC. Cost reduction
opportunities for offshore wind farms. Chapter in:
Learning in renewable energy technology development,
Doctoral thesis, Martin Junginger, Utrecht University,
The Netherlands, 13 May 2005. p. 206.
[6] Neij L, Dannemand Andersen P, Durstewitz M, Helby P,
Hoppe-Kilpper M, Morthorst PE. Experience curves: a
tool for energy policy assessment (EXTOOL), 2003. p. 125.
[7] Goldemberg J (Chair). World energy assessment. Energy
and the challenge of sustainability, United Nations
Development Programme, 2000. p. 508.
[8] Goldemberg J. The evolution of ethanol costs in Brazil.
Energy Policy 1996;24(12):1127–8.
[9] Junginger M, Visser Ed, Faaij A, Claeson Colpier U.
Technological learning and cost reductions of biomass
CHP combustion plants. The case of Sweden. In: Second
World Conference on Biomass for Energy, Industry and
Climate Protection, Rome, Italy, 2004.
[10] Argote L, Epple D. Learning curves in manufacturing.
Science 1990;247(February):920–4.
[11] Boston Consulting Group. Perspectives on experience.
Boston Consulting Group Inc.; 1968.
[12] Wright TP. Factors affecting the cost of airplanes. Journal
of Aeronautical Sciences 1936;3(4):122–8.
[13] McDonald A, Schrattenholzer L. Learning rates for energy
technologies. Energy Policy 2001;29(4):255–61.
[14] Abell DF, Hammond JS. Strategic market planning:
problems and analytical approaches. Englewood Cliffs,
NJ: Prentice Hall; 1979. p. 103–33.
[15] Grubler A. Technology and global change. Cambridge,
UK: Cambridge University Press; 1998.
[16] Kamp L. Learning in wind turbine development.
A comparison between the Netherlands and Denmark,
Doctoral thesis, Utrecht University, 2002. p. 244.
[17] Statistiska Centralbyran (Statistics Sweden). Inflation och
prisniva i Sverige 1830–2003, 2004.
[18] Oanda, Historical currency exchange rates. Available at:
http://www.oanda.com/convert/fxhistory, 2004.
[19] Junginger M, Faaij A, Turkenburg W. Global experience
curves for wind farms. Energy Policy 2004;33(2):133–50.
[20] Neij L. Dynamics of energy systems, Methods of analysing
technology change, Doctoral thesis, Lund University,
1999. p. 48 (and 5 papers).
[21] Hillring B. National strategies for stimulating the use of
bioenergy: policy instruments in Sweden. Biomass and
Bioenergy 1998;14(5/6):425–37.
[22] Silveira S, editor. Building sustainable energy systems,
Swedish experiences. Stockholm: Swedish National Energy
Administration; 2001.
[23] de Visser E. Technological learning in biofuelled combined
heat and power plants in Sweden. Copernicus Institute:
Utrecht, The Netherlands; 2004. p. 108.
[24] Bjorklund A, Niklasson T, Wahlen M. Biomass in Sweden.
Biomass-fired CHP plant in Eskilstuna, Refocus, Septem-
ber 2001. p. 14–8.
[25] Nilsson LJ, Johansson B, Astrand K, Ericsson K,
Svenningsson P, Borjesson P, Neij L. Seeing the wood
for the trees: 25 years of renewable energy policy in
Sweden. Energy for Sustainable Development 2004;8(1):
67–81.
[26] Johansson B. Biomass in Sweden—historic development
and future potential under new policy regimes. In: Second
World Conference on Biomass for Energy, Industry and
Climate Protection, Rome, Italy, 2004.
[27] Filipsson J. Tradbransle—en kartlaggning av produktion,
metoder och forbrukning. Skogforsk Arbetsrapport Nr
403, 1998. p. 38.
[28] Bjorheden R. Learning curves in tree section hauling in
central Sweden. Journal of Forest Engineering 2001;
2001(12):9–17.
[29] Andersson G, Asikainen A, Bjorheden R, Hall PW,
Hudson JB, Jirjis R, Mead DJ, Nurmi J, Weetman GF.
Chapter 3: production of forest energy. In: Richardson J,
et al., editors. Bioenergy from sustainable forestry.
Guiding principles and practice. The Netherlands: Kluwer
Academic Publishers; 2002. p. 49–123.
[30] Hakkila P. Developing technology for large-scale produc-
tion of forest chips. Tekes 2004:99.
[31] Brunberg B. Tillvaratagande av skogsbransle-traddelar
och tradrester. Forskningsstiftelsen Skogsarbeten 1991:54.
[32] Brunberg B, Andersson G, Norden B, Thor M. Uppdrag-
sprojekt Skogsbransle—slutrapport. Redogorelse, nr 6,
Skogforsk, 1998. p. 61.
[33] SVEBIO. Studieresa A—Sodra Skogsenergi. In: SVEBIO
81-Skogsbransle, Dokumentation fran Svenska Bioenergi-
foreningsn studiebesok och symposium i Vaxjo
1981.11.17–18, Vaxjo, Sweden, SVEBIO.
[34] Nilsson PO (Main Author). Projekt 306 538 Berslagterm-
inal. Sammanfattningsrapport for etapp 2, Swedish
University of Agricultural Sciences. Institutionen
for skogsteknik. Uppsatser och Resultat nr 4/1985.
p. 216.
[35] SPK. Priser pa inhemska branslen, Statens pris-och
kartellnamnd, 1984. p. 29.
[36] Rutegard G. Hur mycket kostar tradbranslen? (How much
do wood fuels cost?). In: Skogen i energiforsorjningen,
Skogsfacta Konferenz Nr. 10 1987, 1987, Uppsala,
Sveriges lantbruksuniversitet.
[37] Bjorheden R. Jamtlandbranslen—en utvardering av till-
gangliga produktionssystem for tradbranslen i Ostersunds-
regionen. Institutionen for Skogsteknik, Sveriges
Lantbruksuniversitet, 1986. p. 65.
[38] Lonner G, Parikka M, Tornqvist A. Kostnader och
tillganglighet for avverkningsrester pa lang sikt, Sveriges
Lantbruksuniversitet. SIMS Skog-Industri-Marknad
Studier, 1989. p. 31.

ARTICLE IN PRESS
M. Junginger et al. / Biomass and Bioenergy 29 (2005) 399–418 417
[39] Danielsson BO, Eriksson H, Eriksson M, Lundstrom A,
Lonner G, Lonnstedt L, Nielsson PO, Nystrom K, Rosen
K, Soderberg U, Tornqvist A. Inventeringsstudie biobran-
slepotential i sodra Sverige. Statens vattenfallsverk, 1990.
p. 45.
[40] Hektor B, Parikka M. Biobranslen i Orebro, Vastmans-
lands, Sodermanlands och Uppsala lan, SIMS/Sverige
Lantbruksuniversitet, 1992. p. 20.
[41] Brunberg B, Frohm S, Norden B, Persson J, Wigren C.
Projekt Skogsbransleteknik—slutrapport. Redogorelse, nr
5, Skogforsk, 1994. p. 69.
[42] Bjorheden R. Forest energy in Sweden. Trends in
utilisation, harvesting and supply systems. In: Finnish
bioenergy days, Jyvaskyla. Finland: IEA Bioenergy; 2000.
[43] Andersson G. Technology of fuel chip production in
Sweden. In: Alakangas E, editor. Nordic treasure hunt:
extracting energy from forest residues. Jyvaskyla, Finland:
VTT Technical research Centre of Finland; 2000.
[44] Liss J-E. Kostnadsjamforelse mellan buntsystem och
traditionella flissystem vid uttag av skogsbransle. System-
utveckling/Arbetsvetenskap. Arbetsdokument nr 4/2003,
Institutionen for Matematik, naturvetenskap och technik,
Hogskolan Dalarna, 2003. p. 12.
[45] Gustavsson L. Energy efficiency and competitiveness of
biomass-based energy systems. Energy 1997;22(10):959–67.
[46] Nilsson PO, Lonner G, Hektor B, Jirjis R, Lethikangas P,
Parikka M, Vikinge B. Energi fran Skogen. Uppsala,
Sweden: SLU; 1999. p. 132.
[47] Lonner G, Parikka M. Tradbranslen, Sveriges Lantbruk-
suniversitet. SIMS Skog-Industri-Marknad Studier, 1985.
p. 16.
[48] Nutek. Energirapport 1994, Narings-och teknikutveck-
lingsverket. Bokserien B 1994:9:268.
[49] Statens energimyndighet (STEM). Prisblad for biobran-
slen, torv m m, Eskiltuna, Sweden, 1993–2004.
[50] Skogstyrelsen (National Board of Forestry). Skogsstatis-
tisk arsbok 2003 (Statistical Yearbook of Forestry 2003)
and earlier editions, Jonkoping, Sweden, 2003.
[51] Hogfors S. Personal communication on produced volumes
of primary forestry residues in Sweden, Svenska Trad-
bransleforeningen, 2004.
[52] Hogfors S. Preliminar sammanstallning av Svenska
Tradbransleforeningens statistik over kommersiella lever-
anser av tradbransle 2003 fran 64 st svenska producenter,
Svenska Tradbransleforeningen, 2004.
[53] Projekt Heltradsutnyttjande. Drivning och vidaretransport
vid heltradsutnyttjande. Slutrapportfranprojectgrupp
Drivning. Djursholm: Sveriges skogsvardsforb. (distr.),
1977. p. 73.
[54] Andersson S, Bjorheden R. Skogsbransleuttag—ny teknik.
Utvecklingsbehov for uttag av skogsbranslen speciellt i
anslutning till industriveduttag, Institutionen for Skogste-
knik, Sveriges Lantbruksuniversitet, 1986. p. 74.
[55] Fridh M, Hugosson M, Wester-Kinnander M. Virkesba-
lanser 1992, Skogsstyrelsen, 1983. p. 73.
[56] Statens energiverk. Tradbransle-89. Produktion och anvandn-
ing av tradbranslen 1988, Statens energiverk, 1989. p. 29.
[57] Nilsson N-E. Virkesbalanser 1985: huvudrapporten,
Skogsstyrelsen, 1988. p. 111.
[58] Danielsson BO. Tree harvesting changes in Sweden due to
whole tree harvesting. In: Knutell H, editor. Energy from
forest biomass. Bergen, Norway: Swedish University of
Agricultural Sciences; 1982. p. 19–24.
[59] Sveriges skogsagareforeningars Riksforbund. Various ar-
ticles, Stockholm, Sweden, 1980–1989.
[60] Hogfors S. Varmare marknad for tradbranslen, Skogsaret
1997–1998, 1997. p. 52–9.
[61] Linder L-O. Personal communication of consumption of
PFF in district heating plants in Sweden, Fjarrvarme
(Swedish district heating association), 2004.
[62] Bjorheden R. Personal communication on PFF production
cost development and PFF harvesting practices. Vaxjo,
Sweden: School of Technology and Design, Vaxjo
University; 2004.
[63] Galfvensjo O. Personal communication on chipper devel-
opment, Bruks BioTech AB, Arbra, Sweden, 2004.
[64] Hakansson M, Westerberg A. Personal communication on
production costs and prices of primary forest residues in
South Sweden, Sodra Skogsenergi, Ronneby, Sweden,
2004.
[65] Brunberg B. Operating forest fuel harvesting systems in
Sweden. Results, Skogforsk, Uppsala, Sweden; Issue 4,
1994. p. 4.
[66] Hillring B. Price trends in the Swedish wood-fuel market.
Biomass and Bioenergy 1997;12(1):41–51.
[67] Ericsson K, Nilsson LJ. International biofuel trade—a
study of the Swedish import. Biomass & Bioenergy
2004;26(3):205–20.
[68] Junginger M, Faaij A, Bjorheden R. Technological
learning and cost reductions in woodfuel supply chains.
In: Van Swaaij WPM, Fjallstrom T, Helm P, Grassi A,
editors. Second World Conference on Biomass for Energy,
Industry and Climate Protection. Rome, Italy, 2004.
p. 546–49.
[69] Snik A. Experience curves for photovoltaic energy
technology. Utrecht: Copernicus Institute; 2002. p. 44.
[70] Danielsson BO, Liss J-E. Forstudie avseende ny metod for
uttag av skogsbransle ‘‘Langa toppar’’. Systemutveckling/
Arbetsvetenskap. Arbetsdokument nr 3/2004, Institutio-
nen for Matematik, naturvetenskap och technik, Hogsko-
lan Dalarna, 2004. p. 12.
[71] Johansson J, Liss J-E, Gullberg T, Bjorheden R. Transport
and handling of forest energy bundles—advantages and
problems. Biomass & Bioenergy 2004, in press.
[72] Andersson G, Norden B, Jirjis R, Astrand C. Composite
residue logs cut wood-fuel costs, results. Skogforsk,
Uppsala, Sweden, 2000 (1). p. 4.
[73] Ranta T. Logging residues from regeneration fellings for
biofuel production—a GIS-based availability and supply
cost analysis. PhD thesis, Lappeeranta University, 2002.
p. 182.
[74] Westerberg A. Personal communication on PFF transpor-
tation logistics, Sodra Skogsenergi, Ronneby, Sweden,
2004.

ARTICLE IN PRESS
M. Junginger et al. / Biomass and Bioenergy 29 (2005) 399–418418
[75] Lonner G, Danielsson BO, Vikinge B, Parikka M, Hektor
B, Nilsson PO. Kostnader och tillganglighet for tradbran-
slen pa medelang sikt (Availability and cost of wood fuel in
10 years time), SLU SIMS, 1998. p. 67.
[76] Statistics Finland. Energy statistics 2001, 2003 (Chapter 12).
[77] Filipsson J. Primart skogsbransle i Sverige, Resultat.
Skogforsk, Uppsala, Sweden, No. 17, 1998. p. 4.
[78] Anonymous. Various articles on PFF production levels in
Sweden, mainly issues august 1989, February 1991,
February 1992 & November 1992. Bioenergi 1985–1997.
[79] Larsson M. Skotning av tradrester efter avverkning med
skodare, Resultat, No. 26, 1982. p. 4.
[80] Harrysson LG. Personal communication on chipping
costs, Sabi, Sweden, 2004.
[81] Gusten T. Personal communication on chipping costs,
Vanerbransle, Sweden, 2004.
[82] Alexandersson H, Carlsson T, Radstrom L. Transportal-
ternativ for energiravaror. Forskningsstifelsen Skogsarbe-
ten Redogorelse 1984;5:40.
[83] Johansson J. Vidaretransport av skogsbransle fran un-
gskog med lastbil—kostnaderberakningar (Main hauling
of forest fuels from young stands—cost calculations).
Skogsindustriella institutionen, Skog och Tra, Hogskolan
Dalarna, 2000. p. 19.


