Embed Size (px)
Citation preview

Chen et al. BMC Neurosci (2021) 22:42 https://doi.org/10.1186/s12868-021-00646-z
RESEARCH ARTICLE
Brain size reductions associated with endothelin B receptor mutation, a cause of Hirschsprung’s diseaseKo‑Chin Chen1* , Zan‑Min Song1 and Geoffrey D. Croaker1,2
Abstract
Background: ETB has been reported to regulate neurogenesis and vasoregulation in foetal development. Its dys‑function was known to cause HSCR, an aganglionic colonic disorder with syndromic forms reported to associate with both small heads and developmental delay. We therefore asked, "is CNS maldevelopment a more general feature of ETB mutation?" To investigate, we reviewed the micro‑CT scans of an ETB
−/− model animal, sl/sl rat, and quantitatively evaluated the structural changes of its brain constituents.
Methods: Eleven neonatal rats generated from ETB+/− cross breeding were sacrificed. Micro‑CT scans were com‑
pleted following 1.5% iodine‑staining protocols. All scans were reviewed for morphological changes. Selected organs were segmented semi‑automatically post‑NLM filtering: TBr, T‑CC, T‑CP, OB, Med, Cer, Pit, and S&I Col. Volumetric meas‑urements were made using Drishti rendering software. Rat genotyping was completed following analysis. Statistical comparisons on organ volume, organ growth rate, and organ volume/bodyweight ratios were made between sl/sl and the control groups based on autosomal recessive inheritance. One‑way ANOVA was also performed to evaluate potential dose‑dependent effect.
Results: sl/sl rat has 16.32% lower body weight with 3.53% lower growth rate than the control group. Gross intracra‑nial morphology was preserved in sl/sl rats. However, significant volumetric reduction of 20.33% was detected in TBr; similar reductions were extended to the measurements of T‑CC, T‑CP, OB, Med, and Pit. Consistently, lower brain and selected constituent growth rates were detected in sl/sl rat, ranging from 6.21% to 11.51% reduction. Lower organ volume/bodyweight ratio was detected in sl/sl rats, reflecting disproportional neural changes with respect to body size. No consistent linear relationships exist between ETB copies and intracranial organ size or growth rates.
Conclusion: Although ETB−/− mutant has a normal CNS morphology, significant size reductions in brain and constit‑
uents were detected. These structural changes likely arise from a combination of factors secondary to dysfunctional ET‑1/ET‑3/ETB signalling, including global growth impairment from HSCR‑induced malnutrition and dysregulations in the neurogenesis, angiogenesis, and cerebral vascular control. These changes have important clinical implications, such as autonomic dysfunction or intellectual delay. Although further human study is warranted, our study suggested comprehensive managements are required for HSCR patients, at least in ETB
−/− subtype.
Keywords: Neuroanatomy, Endothelin‑B mutation, Neural impairment, Spotting‑lethal rat, Hirschsprung disease
© The Author(s) 2021. This article is licensed under a Creative Commons Attribution 4.0 International License, which permits use, sharing, adaptation, distribution and reproduction in any medium or format, as long as you give appropriate credit to the original author(s) and the source, provide a link to the Creative Commons licence, and indicate if changes were made. The images or other third party material in this article are included in the article’s Creative Commons licence, unless indicated otherwise in a credit line to the material. If material is not included in the article’s Creative Commons licence and your intended use is not permitted by statutory regulation or exceeds the permitted use, you will need to obtain permission directly from the copyright holder. To view a copy of this licence, visit http:// creat iveco mmons. org/ licen ses/ by/4. 0/. The Creative Commons Public Domain Dedication waiver (http:// creat iveco mmons. org/ publi cdoma in/ zero/1. 0/) applies to the data made available in this article, unless otherwise stated in a credit line to the data.
BackgroundEndothelin receptor B (ETB) is a widely expressed seven-transmembrane G-protein coupled receptor (GPCR) with multiple regulatory controls on embryological
Open Access
BMC Neuroscience
*Correspondence: [email protected] Medical School, Australian National University, Canberra, ACT 2601, AustraliaFull list of author information is available at the end of the article

Page 2 of 13Chen et al. BMC Neurosci (2021) 22:42
development, vasoregulation, and endothelin metabo-lism [1–4]. Although ETB mutation has been well doc-umented to cause Hirschsprung’s disease (HSCR), a paediatric intestinal disease affecting 1/5000 live births, we suspect concurrent intracranial changes is also likely due to the impaired neurogenesis [1, 5, 6]. In this study, we evaluated the neuroanatomical changes associated with ETB mutation by studying the changes detected in spotting-lethal (sl/sl) rat, a HSCR animal model. We hope these findings can provide additional evidence to support ETB’s importance on anatomical development and the notion that HSCR is likely a multi-organ disease, at least in ETB
−/− subtype.Although HSCR is best known for its clinical mani-
festations of intestinal dilatation and toxic megaco-lon sequelae, multi-organ dysfunctions have also been documented [7, 8]. Indeed, clinical impairments of cen-tral nervous system and autonomic system have been exemplified by HSCR-associated syndromes, includ-ing Down syndrome, Waardenburg-Shah syndrome (WS-IV), Haddad syndrome, Goldberg-Shprintzen, and Smith-Lemli-Opitz syndrome [5, 9–12]. This is partially attributable to the polygenetic causes of HSCR, includ-ing mutations in several common genes: proto-oncogene RET (RET), glial cell line derived neurotrophic factor (GDNF), endothelin B-receptor (ETB), endothelin-3 (ET-3), SOX10, endothelin converting enzyme-1 (ECE-1), neurturin (NTN), and Smad interacting protein 1 (SIP1) genes [12, 13]. Among these, RET mutations are the most common, accounting for 50% of familial cases and 15–20% of sporadic cases of HSCR. This is followed by mutations in ETB (5%) and ET-3 genes (< 5%) [13, 14]. Puffenberger et al. (1994), however, demonstrated a W276C missense mutation in ETB gene of an inbred kindred can result 74% and 21% risks for HSCR devel-opment in homozygotes and heterozygotes, respectively [15]. This suggested potential dose effect of ETB and the likely underestimation in its true impact on HSCR and embryological development, possibly due to ETB’s multi-regulatory functions. This notion is further supported by the increasing identifications of novel ETB mutations and polymorphism in sporadic HSCR patients, which further emphasizes its developmental importance [16, 17].
Endothelin receptors (A and B; abbreviated respec-tively as ETA and ETB) have been reported to involve in the neurogenesis of both central and peripheral nervous systems. Mutations in endothelin receptors and endothe-lin (1, 2, and 3; abbreviated respectively as ET-1, 2, and 3) can cause defective embryonic development in neu-ral crest derived structures, in particular melanocytes and enteric nervous systems (ENS) from ETB mutations [18]. Although the importance of ET-3/ETB signalling for migrating neural crest cells of ENS development is
well documented, maintaining the pluripotency of neu-ral crest cells, its impact on the development of central nervous system remains unclear [19, 20]. As previously shown, ETB is widely expressed in mammalian brains, including medulla oblongata, cerebral cortex, hip-pocampus, cerebellum, and striatum [21–24]. Similar distribution is shared by ET-1 and ET-3 [25]. Their co-expressions, therefore, are likely to reflect an undocu-mented importance.
ETB activation by the endothelin mediates vasoregula-tion, smooth muscle contractions, neuropeptide trans-mission, neuronal apoptosis, and potential autonomic control [26–28]. Past studies showed ETB mutations and variants having strong links to hearing deficit, mental retardations, and microcephaly [1, 29]. Concordantly, Yuen et al. (2013) demonstrated marked ETB upregula-tion in the oligodendrocytes of active multiple sclerosis tissue during remyelination, suggesting an active role in neuromodulation. Further studies using rat cerebel-lar cultures showed ETB agonist (BQ-3020) and antago-nist (BQ-788) promotes and inhibits the remyelination processes, respectively [30]. Although no significant difference in oligodendrocyte number was detected between the control and ETB-knockout mice, Swire et al. (2019) reported significantly reduced myelin sheaths in ETB-deficient oligodendrocytes. This phenotypi-cally coincided with the decreased sociability among the affected animals [31]. Furthermore, increased neuronal apoptosis have also been detected in the dentate gyrus, hippocampus, and cerebellum of ETB deficient animals [32–34]. These reports therefore suggested ETB exerts a positive impact on neurogenesis.
On the other hand, several reports have suggested ETB inhibition may be beneficial for remyelination, pos-sibly through its regulation on astrocyte proliferation and vascular control. Back et al. (2005) have reported high molecular weight hyaluronan produced by astro-cytes can inhibit oligodendrocyte progenitors (OPCs) maturation, which is vital to remyelination post-injury [35]. Consistently, Hammond et al. (2015) reported the inhibition or absence of ET-1/ETB signalling in astro-cytes enables oligodendrocyte progenitor cell matura-tion and promotes remyelination following brain injury [36]. Gadea et al. (2008) also demonstrated the infusion of ETB antagonist, BQ-788, to rat corpus callosum can suppress the upregulations of reactive astrogliosis fol-lowing acute demyelination injury. Further studies on cell culture suggested this ET-1/ETB activated astrocyte proliferation is mediated by ERK- and JNK- depend-ent pathways. Inhibitions of these pathways or ETB deficiency may therefore be beneficial to myelination [37]. Furthermore, Grell et al. (2014) and Spray et al. (2017) showed ETB antagonist can suppress cerebral

Page 3 of 13Chen et al. BMC Neurosci (2021) 22:42
hypoperfusion by inhibiting the vasoconstriction in cerebral arteries. Together, these studies suggested ETB
−/− mutants may exhibit neuroprotection through the absence of ETB signalling [38, 39]. Given the omni-presence of ETB and its obvious multimodal actions on neural structures and functions, we adopted a macro-scopic approach to investigate its effect on brain anat-omy and growth.
Prior cell culture studies have suggested possi-ble bimodal actions of ETB on myelination. Although increased neural apoptosis has been reported in ETB defi-cient animals using immunohistochemistry methodology, to the best of our knowledge, no macroscopic analysis has been completed to evaluate the intracranial changes associated with ETB mutations or HSCR. At most, one anecdotal inference was made from a cohort study show-ing the regional prevalence of intracranial abnormalities associated with Mowat-Wilson syndrome, a HSCR-asso-ciated syndrome caused by mutations in ZEB2 gene; however, no direct comments have been made on the physical brain size [40]. We aimed to complement previ-ous studies with further anatomical evidence to support ETB’s importance on the brain development and to clar-ify potential correlation between HSCR and intracranial changes.
In this study, we have chosen sl/sl rat as the study subject. It is a naturally occurred ETB
−/− animal model analogous to human WS-IV syndrome with the follow-ing characteristics: HSCR, hypopigmentation, and con-genital hearing loss [41]. Confirmatory study showed a deletion of 301-bp spanning at the junction between exon1 and intron1 of the ETB gene leading to defective G-protein-coupled receptor, yielding sl/sl rat [29, 41]. Segregation analysis from our rat colony data (n = 475) showed sl/sl rat follows autosomal recessive inheritance (p-value = 0.001) with 95% genetic penetrance for HSCR phenotype, supporting sl/sl rat as a good candidate for studying the phenotype of ETB mutation.
Image acquisitions were performed using X-ray micro-computed tomography (micro-CT) and previously described tissue-preparation methods to examine neu-roanatomical difference between sl/sl rat and the control group [42]. Thorough review on the brain morphology was made and followed by volumetric measurements of selected brain structures. Because neonatal sl/sl rat has not reached growth maturity and may suffer HSCR-induced growth impairment, organ growth rate and organ volume/bodyweight ratios were also determined for comparison.
In this study, we hypothesized the following:
1. Gross intracranial morphology may be preserved in ETB
−/− animals.
2. Reductions in brain and constituent sizes may be presented in ETB
−/− animals with respect to those of the control group (ETB
+/+ & ETB+/−). Reducing
trends may also extend to the organ growth rate and organ volume/bodyweight ratios of ETB
−/− animals.3. Non-uniform anatomical changes associating with
homozygous ETB mutation may be presented across different neural constituents; effect of ETB mutation on neuroanatomy may be regional-dependent.
MethodsCompliance with ethical practiceAll tissues and animals used in this study were handled with strict compliance to both approval bodies: Aus-tralian Capital Territory Health-Human Research Eth-ics Committee (ACTH-HREC) and Australian National University-Animal Experimentation Ethics Committee (ANU-AEEC), approval project number A2011/67.
Rat culling and method of euthanasiaRat samples were generated from cross breeding the heterozygous rats (ETB
+/−). The breeding colony was initially derived from a natural-occurring mutation; this colony has been maintained in the Australian National University (ANU) over the past 15 years.
Eleven neonatal rats were sacrificed in this study, with an average age of 88 h. Each rat was anaesthetized with 5% isoflurane for 15 min and culled via abdominal aor-totomy. The age, gender, weight, and colonic appear-ance were recorded prior to staining. Five-millimetre tail tip of each rat was removed and stored for subsequent genotyping.
Tissue preparation and diffusion staining protocolsFollowing culling, rats’ heads were isolated from the neck and up in preparation for micro-CT scanning. To ensure successful tissue-staining, a diamond-shaped craniotomy in parietal bone was created through the following: cross-incision of five-millimetre through the skull using a dis-section scalpel followed by diagonal excisions of skull using iris scissors.
Post-craniotomy, these tissues were immersed in 10% PBS solution for 30 min to wash out residual body fluid. This was followed by tissue-fixation in 4% formalin solu-tion for 24 h. Next, the formalin was washed out with graded ethanol (EtOH) series over four days: 20%, 50%, 70%, and 90% for 1 day each. These tissue preparations were finalized by seven days of iodine-staining with 1.5% iodine solution in 90% EtOH.
Page 4 of 13Chen et al. BMC Neurosci (2021) 22:42
Image acquisition by micro‑CT scanningAll micro-CT datasets of the rats were acquired using a commercially available Caliper Quantum FX in vivo micro-CT scanner. At the expense of 4.5 min scanning time per scan, acquired in vivo micro-CT data has an image-resolution of 20 µm/voxel. The resultant images were stored as DICOM series with average dataset size of 256 MB.
Prior to quantitative analysis, images of in vivo micro-CT scans were validated with two sets of ex vivo micro-CT scans for quality control. The ex vivo micro-CT scans were acquired by scanning two of the eleven rat-tissues using a custom-built micro-CT system at the Applied Mathematic Department of Australian National Uni-versity. Because ex vivo micro-CT scans have signifi-cantly higher signal-to-noise ratio than in vivo micro-CT images, they provided good reference for image quality control; however, accesses to ex vivo micro-CT scanner were limited. Ex vivo micro-CT data with resolution of 10.7 µm/voxel required fifteen hours of scanning time followed by eight hours of image-processing time via Australia National Computational Infrastructure (NCI) services. The resultant images were stored as netCDF files with each dataset size of 12 GB. All datasets were visualized and analysed with FIJI and Drishti, opensource image rendering software [43, 44].
Image segmentation and volumetric measurementsAll acquired in vivo micro-CT raw data were denoised using non-local means (NLM) algorithms to improve signal-to-noise ratio and hence image clarity for seg-mentation [45]. This code was implemented on a com-puting server built from Intel (R) Core ™ i7-4770 K CPU @3.5 GHz with 32 GB of RAM and Nvidia GeForce GTX Titan Black Kepler GK110 architecture running Linux.
Following image denoising, micro-CT images were seg-mented semi-automatically through individual CT-slices for organs of interest using Drishti paint. This segmenta-tion was verified by two operators. A number of neural organs were selected based on prior literature and organ differentiation on micro-CT scan: total brain (TBr), total cerebral cortex (T-CC), total caudate putamen (T-CP), olfactory bulb (OB), medulla (Med), cerebellum (Cer), pituitary gland (Pit), and superior and inferior colliculus (S&I Col). The posterior border of TBr was standard-ized to 1st cervical spine for comparison across differ-ent samples. Cerebral cortex and caudate putamen were segmented and analysed in respective left and right hemispheres prior to amalgamation of measurements. Superior and inferior colliculus were measured together due to poor differentiation between the two regions on micro-CT scans.
Lastly, the segmented data were rendered, visualized, and volumetrically measured with Drishti for volumetric exploration and presentation [44].
H&E light microscopyH&E light microscopy was completed for two of eleven rats following micro-CT scanning for verification of neu-roanatomical detail presented by micro-CT scans. The tissue processing was conducted in the following steps. The iodine-stained tissues were sectioned longitudinally into blocks of 4 mm in thickness and placed in cassettes. Contrast washout and dehydration were then performed in 90% EtOH for 48 h prior to paraffin embedment at 60 °C. Next, the samples were sliced with a microtome for tissue-sheets of 4 µm in thickness. These tissue-sheets were then laid in water bath of 5–6 °C while being posi-tioned onto labelled-glass slides. These slides were dried overnight at 37 °C.
Progressive H&E staining was then performed. The slides were placed in alum-hematoxylin solutions until the visualization of dark red colour. This was followed by washing and ‘bluing’ with lithium carbonate solution. Finally, the slides were washed before counter-staining with 0.5% eosin alcoholic solution.
All H&E slides were examined with an Olympus IX71 microscope with 4 × magnification.
GenotypingGenotyping was completed following the completion of the quantitative image analysis of rat data to avoid observational bias. It was completed by standard PCR methods. Three wild types (ETB
+/+), three heterozygotes (ETB
+/−), and five sl/sl (ETB−/−) rats were identified. The
average ages of wild-type, heterozygotes, and sl/sl groups were 90.7 h, 96 h, and 83.2 h, respectively.
PCR genotyping was processed through the follow-ing. Five-millimetre tail tips from each of the eleven rats were isolated for lysis using Proteinase K in lysis buffer, which consisted of 100 mM Tris pH 8, 5 mM EDTA, 0.2% SDS, and 200 mM NaCl in distilled water. The DNA was extracted via vortex heating and centrifuging to separate DNA-containing supernatant from the undigested mate-rials. Afterwards, the supernatant was further vortexed and centrifuged to isolate the DNA pellet, followed by 70% EtOH washing and drying. The DNA was then sus-pended and quantified with spectrophotometry. Next, PCR was completed with “Master-Mix” reagent: 10*PCR buffer Qiagen-contained MgCl2, dNTP (10 mM), Primer PS7 (33.3 μM; 5’-CCA CTA AGA CCT CCT GGA CT-3’), Primer PS15 (33.3 μM; 5’-TCA CGA CTT AGA AAG CTA CAC T-3’) and DNA polymerase [46]. The Master-Mix reagent was then pipetted onto PCR plates with fourteen rat DNAs (including the known controls)

Page 5 of 13Chen et al. BMC Neurosci (2021) 22:42
and placed in Veriti 96-Well Thermal-Cycler for PCR. Lastly, electrophoresis was run at 100 V and 55 mA for 1 h. Eleven test-subject DNAs were run against posi-tive controls for wild-type, heterozygote, and sl/sl with molecular weight marker (MassRuler, #SM1263, Fermen-tas) by the side. Electrophoresis gel was visualized with Gel Documentation System DOC-Print VX5 (Vilber Lourmat).
Comparison and Statistical analysisBased on segregation analysis on cumulative colony data showing sl/sl rat phenotype followed autosomal reces-sive inheritance (p-value = 0.001) with high genetic pen-etrance, up to 95% of sl/sl rat exhibited HSCR, statistical comparisons were made between sl/sl (ETB
−/−) and the control group (ETB
+/+ & ETB+/−) to determine the effect
of ETB on structural changes and growth. This approach was consistent with the autosomal recessive inheritance of human WS-IV, a disease caused by ETB
−/− genotype. Nonetheless, we have also performed one-way ANOVA analysis and post hoc Tukey to assess the potential rela-tions between ETB gene dose and the following selected parameters.
The parameters included for comparison were as fol-lows: bodyweight (g), bodyweight growth rates (g/Hr), organ volume (mL), organ volume growth rates (mL/Hr), and organ volume/bodyweight ratios (mL/g). The bodyweight growth rate (g/Hr) was calculated by divid-ing each rat’s bodyweight (g) to its respective age (Hr) at culling and followed by statistical comparison between the control and mutant groups. Similarly, organ volume growth rate (mL/Hr) and organ volume/bodyweight
ratios (mL/g) were calculated from respective volumet-ric measurements (mL), age (Hr), and bodyweight (g) at times of culling.
Standardized comparisons of organ volume growth rate and organ volume/bodyweight ratios were made to exclude potential confounding factors of age and body-size variance. Additionally, these measures provided estimating metrics for the organ changes upon develop-mental maturation of the animals. Moreover, the pro-portionality of individual neural substituent with respect to the total brain (organ/total brain) was compared to explore potential regional-dependent effect of ETB. All parameters were expressed as mean ± sem in figures. The relative parametric difference (%) between sl/sl and the control group was also calculated and reported through-out this study for better appreciation on the degrees of difference.
ResultETB
−/− mutant has lower bodyweight and body growth rateWe compared the bodyweight of the studied animals to evaluate potential growth reduction associated with ETB
−/− mutation. As shown by Fig. 1A, sl/sl rat has 16.32% lower bodyweight than the control group, p-value = 0.03. Although not reaching statistical sig-nificance, a 3.53% deduction in growth rate was also detected, Fig. 1B. Both findings supported potential impairments in global body growth. On the other hand, one-way ANOVA demonstrated no significant variabil-ity in bodyweight or body growth rate among the three genotypes, as shown by Additional file 1: Table S1.
Fig. 1 Homozygous ETB mutation was associated with reductions in bodyweight (A) and bodyweight growth rate (B). sl/sl (ETB−/−) rat has a
significantly lower bodyweight than that of the control group (ETB+/+ & ETB
+/−), 11.40 g versus 13.26 g (df = 9, t‑value = 2.51, p-value = 0.03), A. A similar but smaller difference was observed in the comparison of body growth rate, 0.137 g/Hr versus 0.142 g/Hr (df = 9, t‑value = 0.58, p-value = 0.58), B. This suggested sl/sl rat was likely to have a proportional organ size shrinkage; furthermore, reduced body growth rate suggested developmental impairment may continue to worsen until maturity. *statistically significant, p-value ≤ 0.05

Page 6 of 13Chen et al. BMC Neurosci (2021) 22:42
These observations suggested ETB mutation may be associated with body growth impairment in an autoso-mal recessive manner.
Gross intracranial morphology was overall preserved in ETB
−/−mutantPrevious study has suggested disruptions in the endothelin system can lead to cephalic neural crest cell (CNCC) migration failure and thus marked crani-ofacial defects [47]. However, thorough reviews of sl/sl rat scan (Fig. 2B) demonstrated grossly normal cranial morphology, similar to that of wild type rat (Fig. 2C). As shown by the parasagittal view of micro-CT images and H&E microscopy, Fig. 2B – D, sl/sl rat brain con-tained all the major components as the control group: accumbens nucleus, anterior olfactory bulb, ante-rior pons, hippocampus, cerebellum, caudate puta-men, frontal cortex, hypothalamus, inferior colliculus, medulla, pituitary gland, posterior thalamus, superior colliculus, and thalamus. Additionally, review of facial anatomy did not reveal obvious disfiguration, as shown by Fig. 2A. These suggested intracranial impairments associated with ETB mutation, if any, may be subtle and limited to size variance rather than constituent agenesis or morphological changes.
Homozygous ETB mutation was associated with significant decreases in brain sizeWhile the gross morphology might be preserved, mod-erate volumetric reductions of the brain and constitu-ents were detected in sl/sl mutants. As demonstrated by Fig. 3A, a significant reduction of 20.33% was observed in the brain of sl/sl rat, p-value = 0.02. Furthermore, an average of 20% volumetric reduction was detected across all neural constituents analysed in the sl/sl rat. Struc-tures with statistically significant difference between sl/sl and the control groups were as follow: T-CC (24.60%, p-value = 0.02); T-CP (24.68%, p-value = 0.03); OB (19.13%, p-value = 0.02); Pit (30.08%, p-value = 0.02). Although not reaching the statistical power, the reducing trend in sl/sl rat was also evident in the following: Med (21.05%, p-value = 0.11), Cer (14.22%, p-value = 0.22); S&I col (9.73%, p-value = 0.10).
Additionally, one-way ANOVA showed statistically significant variation in TB, T-CC, and Pit volumes of the
Fig. 2 ETB−/− rat has a grossly normal intracranial morphology.
A, and B represented respective parasagittal micro‑CT views of intracranial morphology and isolated brain of sl/sl (ETB
−/−) rat. A demonstrated the presence of major craniofacial features and neural structures as labelled. B illustrated magnified micro‑CT view of the ETB
−/− brain with additional details, which were also presented in the micro‑CT scans of wildtype (ETB
+/+) rat, C. Lastly, H&E micrograph of the micro‑CT scanned sl/sl rat brain confirmed the presence of the identified structures, D. The anatomical features identified were labelled as follows: Acb accumbens nucleus, AO anterior olfactory bulb, apons anterior pons, CA1 CA1 field of hippocampus, CA3 CA3 field of hippocampus, CER cerebellum, Cpu caudate putamen, FrCtx frontal cortex, Hypo hypothalamus, IC inferior colliculus, med medulla, Pit pituitary gland, PTh posterior thalamus, SC superior colliculus, Th thalamus, U. Inc upper incisor, Tong tongue, Trac trachea, Epi epiglottis, H. b hyoid bone, H. palate hard palate, L. Inc lower incisor, NasCa nasal cavity, Nasop nasopharynx, Orop oropharynx
Page 7 of 13Chen et al. BMC Neurosci (2021) 22:42
three genotypes, as shown by Additional file 2: Table S2A. However, post hoc Tukey revealed significant differences were only presented between the sl/sl and heterozy-gous group; consistent ETB dose-dependent trend was not seen in the wild type, as shown by Additional file 2: Table S2B.
Homozygous ETB mutation was associated with significantly lower intracranial growth rateReduced intracranial organ growth rate was observed in sl/sl group; however, this margin of reduction was smaller than that detected in the volumetric changes. An approximately 10% reduction in growth rate was observed across various brain components in sl/sl rat.
As shown by Fig. 3B, the TBr growth rate of sl/sl rat was 7.35% lower than that of the control group, p-value = 0.07. Consistent decreasing trends were also presented in the following: T-CC (11.42%, p-value = 0.04), T-CP (11.51%, p-value = 0.05), and OB (6.21%, p-value = 0.05). Furthermore, although not reaching the statistical power, similar reductions were observed in the medulla (8.48%, p-value = 0.30) and pitu-itary gland (15.62%, p-value = 0.06) of sl/sl rat. Unexpect-edly, no significant change was detected in the growth
rate of Cer (1.60%, p-value = 0.85) and S&I Col (2.72%, p-value = 0.60). Lastly, no consistent linear relationship was detected between the neural growth rates and ETB gene dose, as shown by one-way ANOVA analysis in Additional file 3: Table S3A.
Overall, we found homozygous ETB mutation was asso-ciated with reduced neural growth rate during develop-ment, an effect likely to persist until maturation age.
Homozygous ETB mutation was associated with lower brain volume/bodyweight indicessl/sl rat has disproportionally larger reductions in its brain volumes than the decreases in its bodyweight. As illustrated by Fig. 3C, sl/sl rat has lower organ volume/bodyweight ratios than the control group: TBr (2.60%, p-value = 0.57), T-CC (6.21%, p-value = 0.15), T-CP (6.30%, p-value = 0.27), OB (1.28%, p-value = 0.60), Med (3.22%, p-value = 0.87), and Pit (11.18%, p-value = 0.08). Albeit statistically underpowered, these findings sug-gested neural development was more sensitive to ETB dysfunction than the bodily growth. And although homozygous ETB mutation seemed to predomi-nantly affect growth negatively, sl/sl rat was found to have larger organ/bodyweight ratios in its Cer (3.17%,
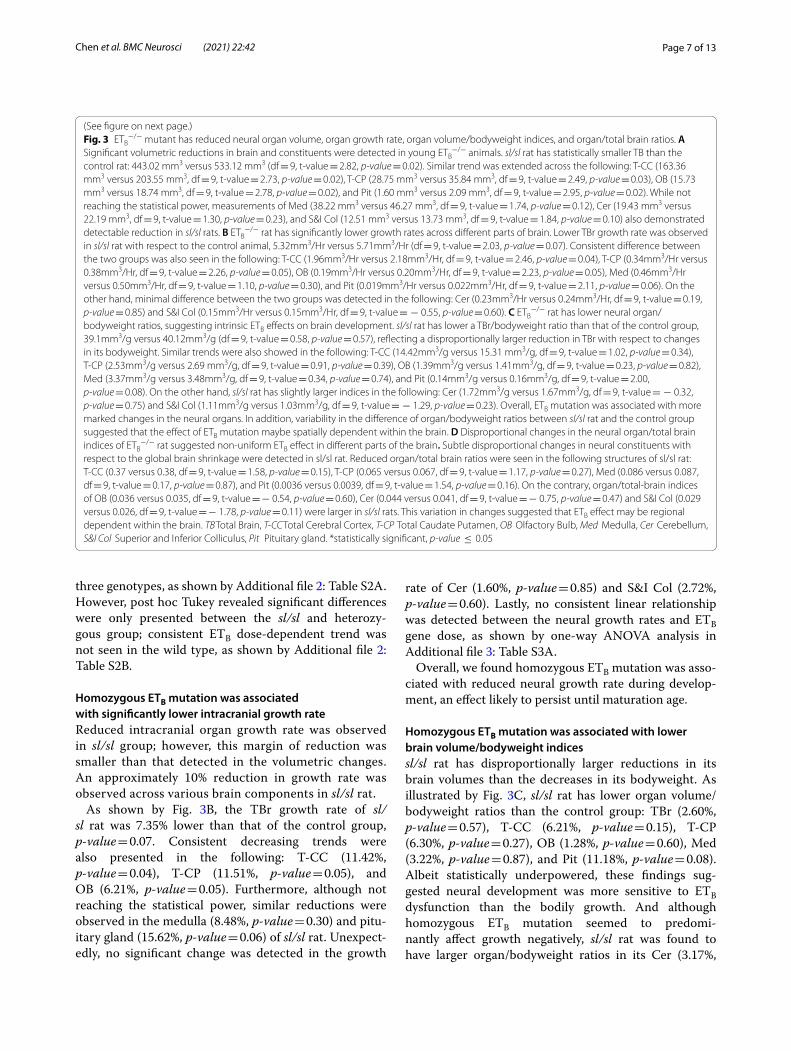
Fig. 3 ETB−/− mutant has reduced neural organ volume, organ growth rate, organ volume/bodyweight indices, and organ/total brain ratios. A
Significant volumetric reductions in brain and constituents were detected in young ETB−/− animals. sl/sl rat has statistically smaller TB than the
control rat: 443.02 mm3 versus 533.12 mm3 (df = 9, t‑value = 2.82, p-value = 0.02). Similar trend was extended across the following: T‑CC (163.36 mm3 versus 203.55 mm3, df = 9, t‑value = 2.73, p-value = 0.02), T‑CP (28.75 mm3 versus 35.84 mm3, df = 9, t‑value = 2.49, p-value = 0.03), OB (15.73 mm3 versus 18.74 mm3, df = 9, t‑value = 2.78, p-value = 0.02), and Pit (1.60 mm3 versus 2.09 mm3, df = 9, t‑value = 2.95, p-value = 0.02). While not reaching the statistical power, measurements of Med (38.22 mm3 versus 46.27 mm3, df = 9, t‑value = 1.74, p-value = 0.12), Cer (19.43 mm3 versus 22.19 mm3, df = 9, t‑value = 1.30, p-value = 0.23), and S&I Col (12.51 mm3 versus 13.73 mm3, df = 9, t‑value = 1.84, p-value = 0.10) also demonstrated detectable reduction in sl/sl rats. B ETB
−/− rat has significantly lower growth rates across different parts of brain. Lower TBr growth rate was observed in sl/sl rat with respect to the control animal, 5.32mm3/Hr versus 5.71mm3/Hr (df = 9, t‑value = 2.03, p-value = 0.07). Consistent difference between the two groups was also seen in the following: T‑CC (1.96mm3/Hr versus 2.18mm3/Hr, df = 9, t‑value = 2.46, p-value = 0.04), T‑CP (0.34mm3/Hr versus 0.38mm3/Hr, df = 9, t‑value = 2.26, p-value = 0.05), OB (0.19mm3/Hr versus 0.20mm3/Hr, df = 9, t‑value = 2.23, p-value = 0.05), Med (0.46mm3/Hr versus 0.50mm3/Hr, df = 9, t‑value = 1.10, p-value = 0.30), and Pit (0.019mm3/Hr versus 0.022mm3/Hr, df = 9, t‑value = 2.11, p-value = 0.06). On the other hand, minimal difference between the two groups was detected in the following: Cer (0.23mm3/Hr versus 0.24mm3/Hr, df = 9, t‑value = 0.19, p-value = 0.85) and S&I Col (0.15mm3/Hr versus 0.15mm3/Hr, df = 9, t‑value = − 0.55, p-value = 0.60). C ETB
−/− rat has lower neural organ/bodyweight ratios, suggesting intrinsic ETB effects on brain development. sl/sl rat has lower a TBr/bodyweight ratio than that of the control group, 39.1mm3/g versus 40.12mm3/g (df = 9, t‑value = 0.58, p-value = 0.57), reflecting a disproportionally larger reduction in TBr with respect to changes in its bodyweight. Similar trends were also showed in the following: T‑CC (14.42mm3/g versus 15.31 mm3/g, df = 9, t‑value = 1.02, p-value = 0.34), T‑CP (2.53mm3/g versus 2.69 mm3/g, df = 9, t‑value = 0.91, p-value = 0.39), OB (1.39mm3/g versus 1.41mm3/g, df = 9, t‑value = 0.23, p-value = 0.82), Med (3.37mm3/g versus 3.48mm3/g, df = 9, t‑value = 0.34, p-value = 0.74), and Pit (0.14mm3/g versus 0.16mm3/g, df = 9, t‑value = 2.00, p-value = 0.08). On the other hand, sl/sl rat has slightly larger indices in the following: Cer (1.72mm3/g versus 1.67mm3/g, df = 9, t‑value = − 0.32, p-value = 0.75) and S&I Col (1.11mm3/g versus 1.03mm3/g, df = 9, t‑value = − 1.29, p-value = 0.23). Overall, ETB mutation was associated with more marked changes in the neural organs. In addition, variability in the difference of organ/bodyweight ratios between sl/sl rat and the control group suggested that the effect of ETB mutation maybe spatially dependent within the brain. D Disproportional changes in the neural organ/total brain indices of ETB
−/− rat suggested non‑uniform ETB effect in different parts of the brain. Subtle disproportional changes in neural constituents with respect to the global brain shrinkage were detected in sl/sl rat. Reduced organ/total brain ratios were seen in the following structures of sl/sl rat: T‑CC (0.37 versus 0.38, df = 9, t‑value = 1.58, p-value = 0.15), T‑CP (0.065 versus 0.067, df = 9, t‑value = 1.17, p-value = 0.27), Med (0.086 versus 0.087, df = 9, t‑value = 0.17, p-value = 0.87), and Pit (0.0036 versus 0.0039, df = 9, t‑value = 1.54, p-value = 0.16). On the contrary, organ/total‑brain indices of OB (0.036 versus 0.035, df = 9, t‑value = − 0.54, p-value = 0.60), Cer (0.044 versus 0.041, df = 9, t‑value = − 0.75, p-value = 0.47) and S&I Col (0.029 versus 0.026, df = 9, t‑value = − 1.78, p-value = 0.11) were larger in sl/sl rats. This variation in changes suggested that ETB effect may be regional dependent within the brain. TB Total Brain, T-CC Total Cerebral Cortex, T-CP Total Caudate Putamen, OB Olfactory Bulb, Med Medulla, Cer Cerebellum, S&I Col Superior and Inferior Colliculus, Pit Pituitary gland. *statistically significant, p-value ≤ 0.05
(See figure on next page.)

Page 8 of 13Chen et al. BMC Neurosci (2021) 22:42

Page 9 of 13Chen et al. BMC Neurosci (2021) 22:42
p-value = 0.47) and S&I Col (6.84%, p-value = 0.23). This raised the possibility that a potential protective mecha-nism associated with ETB
−/− may be presented, albeit this protective effect was likely small. Additionally, non-uniform changes were recorded from different neural structures of sl/sl rat, suggested the impact of ETB muta-tion on anatomical development might be dependent on organ location.
ETB−/− mutant has subtle and non‑uniform changes
across different neural constituents/total brain indicesAs showed by Fig. 3D, sl/sl rat and the control group shared subtle difference between their respective neural organ/TBr indices. Although these differences may be small, ranging from 2 to 8%, they reflected dispropor-tional changes in different neural constituents of ETB
−/− rat. These variations suggested that the effect of ETB on structural growth may be influenced by the target organ locations within the brain.
DiscussionAs evidenced by the anatomical changes detected, we supported the notion that homozygous ETB mutation and associated HSCR were likely linked with intracra-nial changes, at least in the sense of volumetric measure-ments. This finding was consistent with previous in vitro studies and clinical reports citing HSCR’s associations with neurological deficits, as exemplified by Down’s syn-drome, Haddad syndrome, Mowat-Wilson syndrome, and WS-IV [1, 7, 48–51].
It has been suggested that disruption in ET-1/ECE/ETA pathway system can lead to marked craniofacial dys-morphism. [47]. And agenesis of corpus callosum and hippocampus have also been reported in HSCR associ-ated syndromes [50, 52]. Regardless, these gross abnor-malities were not detected in sl/sl rat, as demonstrated by Fig. 2. This observation suggested that while ETB muta-tion may disrupt enteric neural crest cell migration, its direct impact on the migration of cephalic and vagal neu-ral crest precursors may be limited. On the other hand, neurogenic modelling mediated by ETB signalling and the clinical reporting of HSCR-associated mental retardation supported the notion that ETB may possess an adjunct but important role in neural development [3, 53]. Quan-titative analysis on the neuroanatomy was therefore an intuitive investigation.
Many previous studies have demonstrated the presence of ETB receptors in olfactory bulb, cerebral cortex, cau-date putamen, thalamus, hypothalamus, pituitary gland, brain stem and limbic system through the combined use of immunohistochemistry and ETB’s agonist or antago-nists, supporting its importance in brain structures and functions [54–57].
Consistently, two-dimensional (2D) immunofluores-cence studies have demonstrated ETB stimulation by IRL-1620 can lead to neurogenic remodelling, which was likely achieved by increased neurogenesis and angi-ogenesis via elevated vascular endothelial growth fac-tor (VEGF) and nerve growth factor (NGF) [2, 3, 58]. Additionally, Feger et al. (1997) reported that activation of endothelial ETB by ET-1 can trigger vasodilation of basilar artery through the production of nitric oxide [59], thereby improving cerebral perfusion. Consequently, these studies provided the supports that ETB activation promotes neuroprotection. This was indeed consistent with the overall brain size reduction observed in sl/sl rat, which lacks functional ETB during its development. On the other hand, in vitro studies using U0126, a mithramy-cin A (MitA) or mitogen-activated protein kinase (MEK) 1/2 inhibitor, blocks the elevation of ETB-mediated vaso-constriction following cerebral ischemic events, sug-gesting ETB stimulation in vascular smooth muscle cells (VSMC) may worsens neural damage [38, 60, 61] by trig-gering further cerebral hypoperfusion. These conflicting findings suggested the effect of ETB on brain growth may be dynamic and regional-dependent, a pattern consist-ent with our finding, Fig. 3D, showing variability in organ changes with respect to global brain size reduction.
Despite the presentation of a grossly normal brain morphology, a significant structural reduction of 20.33% (p-value = 0.02) was found in the brain volume of sl/sl rat at the age of 88 h. Consistently, a reduction of 7.35% (p-value = 0.07) in brain growth rate also suggested its structural impairment would likely worsen upon devel-opmental maturity. Several factors could have contrib-uted to these impairments. As previously reported by McDougall et al. [62], intrauterine growth restriction can alter the postnatal cerebellum development [62]. While we have not detected an underdevelopment in the birth-weight of sl/sl rat based on our colony data of 864 rats, we did record a bodyweight reduction of 16.32% at the age of 88 h in our studied rats, Fig. 1. This was consist-ent with the fact that adequate maternal uterine per-fusion through functional ETB-mediated vasodilation can be achieved in the heterozygous parents of sl/sl rat [63]; however, postnatal growth of sl/sl rat may later suf-fer the negative effect of HSCR-induced malnutrition and ETB
−/−-mediated mesenteric hypoperfusion [1, 64]. While the brain shrinkage in the sl/sl rat can be partially explained by this bodily growth impairment, dispropor-tionally larger reductions in sl/sl rat brain with respect to changes in its bodyweight, as shown by Fig. 3C, sug-gested additional intrinsic ETB mechanisms on the brain development. Indeed, this was supported by sl/sl rat exhibiting 1.26% to 11.18% smaller organ volume/body-weight indices in TBr, T-CC, TCP, OB, Med, and Pit.
Page 10 of 13Chen et al. BMC Neurosci (2021) 22:42
Interestingly, opposite trend was seen in Cer and S&I Col measurements, with sl/sl rat having 3.17% and 6.84% higher indices, respectively. In conjunction with ETB’s functional duality on vasoregulation and neurogenesis reported previously, our observations likely reflected a potential regional-specific neuroprotection by ETB muta-tion despite its overwhelming negative effects [3, 32–34, 36, 38, 58, 59].
Dysregulation in the neurogenesis, angiogenesis, and cerebral vascular tone have likely contributed to the observed structural changes in sl/sl rat. This may be mediated directly by the ETB expression on neuro-blasts or neural tissue, which promotes cell division and inhibits apoptosis, or by indirect mechanisms including vascular growth stimulation and vasospasm inhibition. Indeed, Nishikawa et al. (2011) showed ETB-stimulation by IRL-1620 accelerates interkinetic nuclear migration (INC) of cortical neural progenitor cells (NPC), whereas inhibition by BQ-788 results in INC deceleration and subsequent mislocalization of NPC [65]. Additionally, Koyama et al. (2011) demonstrated intracerebroven-tricular ETB stimulation increases vascular endothelial growth factor A (VEGF-A), thereby triggering VEGF-receptor signalling in cerebrum but not hippocampus. This suggested regional-dependent neuroprotective effect of ETB, possibly via vascular control [66]. Moreo-ver, the loss of ETB-mediated clearance caused significant elevation of ET-1 in sl/sl rat, thus leading to ET-1/ETA-mediated hyper-vasoconstriction in cerebral vasculature [67]. Albeit minor, endothelial-mediated basal vasodila-tion from ET-1/ETB stimulation was also lost in sl/sl rat [4, 68]. Together, these processes retarded the cerebral growth through impaired neurogenesis and cerebral per-fusion. Conversely, despite findings of overall size reduc-tion in majority of neural constituents of sl/sl rat, small elevation in Cer/bodyweight and S&I Col/bodyweight indices lend some support to the argument that regional brain development may benefit from increased perfusion secondary to reduced ETB-mediated vasoconstriction, for instance, in the VSMC of collicular artery [38]. How-ever, this mutation-associated beneficial effect was likely minor in comparison to the dominant ET-1/ETA effect [38, 61, 69].
If our finding was extrapolatable to human subjects, then the observed structural impairments lend sup-ports to several HSCR-associated clinical anomalies. For instance, marked reductions in total brain (20.33%), cerebral cortex (24.60%), and caudate putamen (24.68%) were not only consistent with prior observa-tions of mental delay in some HSCR patients and but also raised the questions that these patients may be more susceptible to Parkinson’s disease or depression secondary to potential dopamine deficiency [70, 71].
Indeed, Webber’s et al. (1998) have demonstrated that ET-1 stimulation to rat striatum via activation of ETB triggers the release of dopamine [22]. Moreover, detec-tion of medulla shrinkage (21.05%) provided some anatomical supports for dysregulated autonomic func-tions associated with some HSCR patients, as exempli-fied by reports of Haddad syndrome, congenital central hypoventilation syndrome, and cardiac arrhythmias [51, 72]. In addition, volumetric reduction in cerebel-lum, up to 14.22%, supported clinical reports of ataxia observed in WSI-IV patient [12]. This was also consist-ent with increased neural apoptosis and reduced neural proliferations detected in the cerebellum of sl/sl rat [32, 34]. Lastly, size reductions in olfactory bulb (19.13%) and pituitary gland (30.08%) of sl/sl rat were consistent with the ETB distribution [21–24, 73]. While there was no distinctive clinical syndrome currently described to associate HSCR with pituitary dysfunctions, increased risks for familial medullary carcinoma (FMTC) and multiple endocrine neoplasia type II (MEN II) in these patients may be linked to the pituitary structural defects [74–76]. It was again worth noting that these reported measurements were made on immature ani-mals, and as suggested by the growth rate discrepancy illustrated in Fig. 3B, structural defects in ETB
−/− indi-viduals were therefore likely to worsen. Hence, more prominent structural impairments were likely to reflect HSCR-associated functional declines upon maturity.
Lastly, we compared the structural differences among the three genotypes to explore potential dose-dependent effect of ETB. While heterozygote has significantly larger TB, TCC and Pit than those of sl/sl rats, no linear rela-tionship can be drawn from its comparison with the wild-type rat, Additional file 2: Table S2B. We suspected statistical under-power was the likely explanation. How-ever, we also acknowledged that, in conjunction with some reports, our observation was partially consistent with the notion that a single functional ETB gene may be sufficient to prevent neuroapoptosis and mediate ET-1 clearance in some structures, thereby improving cerebral perfusion and exerting some neuroprotection [2, 3, 38, 58, 60, 61, 67]. Overall, it was of little doubt that homozy-gous ETB mutation impairs brain structures. Our findings were consistent with ETB mutation acting as an autoso-mal recessive condition with high penetrance.
In summary, we provided quantitative 3D evidence illustrating structural changes in the brain associating with HSCR, at least in ETB
−/− animal model. These det-rimental effects were not uniform across different brain structures and minor protective effects may be pre-sented, Fig. 3C, D, potentially through reduced cranial vessel tone. Nevertheless, overall findings remained con-sistent with several proposed mechanisms of action by

Page 11 of 13Chen et al. BMC Neurosci (2021) 22:42
ETB, including regulations on angiogenesis, neurogenesis and vasoconstriction [2, 3, 38, 58, 60, 61, 65, 66, 69]. Our results supported functional ETBs have predominantly neuroprotective benefits during neonatal development.
Although we have shown ETB mutation affects brain growth, further study was warranted. We acknowledged a larger sample size would be beneficial along with more efficient image-analysing software to improve sta-tistical power; nevertheless, current finding cannot be overlooked. More importantly, given that we have mac-roscopically identified ETB-affected neural organs, future cell proliferation studies using 5-bromo-2’-deoxyuridine (BrdU) labelling can be useful in confirming reduced neural proliferation microscopically [34]. Moreover, this can also be supplemented by the measurements of VEGF to confirm the angiogenesis reduction in sl/sl rats [2]. Lastly, confirmatory study on basilar arterial dilata-tion using pressure myography can clarify vasoprotective mechanism mediated by ETB [39].
ConclusionDespite exhibiting a grossly normal cranial morphology, an average of 20% volumetric reduction was detected in the brain and constituents of ETB
−/− HSCR model. With no significant differences between wild-type and heterozygous animals, these changes associated with ETB mutation were consistent with autosomal recessive inheritance. The non-uniform neuroanatomical changes observed across different constituents supported prior studies on differential ETB distribution, neurogenesis, and vasoregulation in the brain. Interestingly, a regional-dependent protective effect of ETB may be presented, potentially corresponding to the circulatory distribution through ET-1/ETB-mediated vasoregulation. Overall, our model findings supported the notion that ETB
−/− HSCR patients may exhibit neuroanatomical impairments, con-sistent with prior clinical reports. Although further study involving human subjects was encouraged, this study supported the importance to a more comprehensive management plan for HSCR patients.
AbbreviationsANU‑AEEC: Australian National University Animal Experimentation Ethics Committee; ACTH‑HREC: ACT Health Human Research Ethics Committee; BrdU: 5‑Bromo‑2’‑deoxyuridine; CC: Cerebral cortex; CER: Cerebellum; CNS: Central nervous system; CP: Caudate putamen; Df: Degree of freedom; DICOM: Digital imaging and communications in medicine; DNA: Deoxyribonucleic acid; GDNF: Glial cell line derived neurotrophic factor; GFRα1: GDNF family receptor alpha 1; GI: Gastrointestinal; H&E: Hematoxylin and eosin stain; HSCR: Hirschsprung’s disease; INM: Interkinetic nuclear migration; ECE: Endothelin converting enzyme; ECE‑1: Endothelin converting enzyme‑1; ENS: Enteric nervous system; ET‑1: Endothelin‑1; ET‑3: Endothelin‑3; ETA: Endothelin‑A receptor; ETB: Endothelin‑B receptor; EtOH: Ethanol; Med: Medulla; MEK: Mitogen‑activated protein kinase; MitA: Mithramycin A; Micro‑CT: Micro‑computed tomography; mRNA: Messenger ribonucleic acid; NCC: Neural crest cells; NCI: National Computational Infrastructure; NGF: Nerve growth factor;
NLM: Non‑Local Means; NPC: Neural progenitor cells; NTN: Neurturin; OB: Olfactory bulb; PCR: Polymerase chain reaction; Pit: Pituitary gland; RET: Proto‑oncogene RET; S&I Col: Superior and inferior colliculus; sl/sl: Spotting‑lethal; SOX10: Sry‑related HMg‑Box gene 10; TBr: Total brain; 3D: Three‑dimensional; 2D: Two‑dimensional; VEGF: Vascular endothelial growth factor; VEGF‑A: Vascu‑lar endothelial growth factor‑A; WS‑IV: Waardenburg‑Shah syndrome.
Supplementary InformationThe online version contains supplementary material available at https:// doi. org/ 10. 1186/ s12868‑ 021‑ 00646‑z.
Additional file 1: Table S1: No significant variation was detected in the mean bodyweight (p = 0.0551) or mean body growth (p = 0.9096) of the studied rats, which consisted of three genotypes: ETB
+/+, ETB±, and ETB
−/−. This suggested bodily growth restriction associated with ETB mutation, if presented, was not a dose‑dependent relationship.
Additional file 2: Table S2: One‑way ANOVA showed statistically signifi‑cant variations in the TBr, TCC, and Pit volumetric means of the studied rats: ETB
+/+, ETB+/−, and ETB
−/−. On the contrary, no significant variation was detected in other organ measurements of the three genotypes, as shown by A Post‑hoc Tukey showed significant volumetric difference between the heterozygote (ETB
+/−) and sl/sl (ETB−/−) in TBr (mean differ‑
ence 113.7, SE 38.02, p = 0.0412), TCC (mean difference 52.07, SE 17.24, p = 0.0394), and Pit (mean difference 0.6113, SE 0.1927, p = 0.0315). How‑ever, measurement of wild type (ETB
+/+) was not significantly different from those of the other two groups, as shown by B.
Additional file 3: Table S3: One‑way ANOVA comparison showed no significant difference was detected in the mean organ growth (A), volumetric/bodyweight ratios (B), and organ/whole‑brain ratios (C) of the three genotype rats: ETB
+/+, ETB+/−, and ETB
−/−. These findings suggested that effect of ETB mutation was likely non‑linear to gene doses.
AcknowledgementsThe authors gratefully acknowledge the staff of Australian National University Applied Mathematic Department for their technical support of this project.
Authors’ contributionsConceived the study: KC, ZMS, GDH. Developed the methodology, performed the experiment and analysis: KC, ZMS. Wrote the paper: KC, GDH. All authors read and approved the final manuscript.
FundingNone declared.
Availability of data and materialsFull measurement datasheet is available in Additional File. All original rat micro‑CT files are stored in the Canberra data centre of National Computa‑tional Infrastructure (NCI) Australia for security and processing. Original image files are available upon request. Request may be sent directly to correspond‑ing author at [email protected].
Declarations
Ethical approval and consent to participateAll animals This research project was approved by both Australian Capital Ter‑ritory Health Human Research Ethics Committee (ACTH‑HREC) and Australian National University Animal Experimentation Ethics Committee (ANU‑AEEC), project number A2011/67.
Consent to publishNot applicable.
Competing interestsThe authors declare that they have no competing interests.

Page 12 of 13Chen et al. BMC Neurosci (2021) 22:42
Author details1 Medical School, Australian National University, Canberra, ACT 2601, Australia. 2 The Canberra Hospital, Yamba Drive, Garran, ACT 2605, Australia.
Received: 20 June 2020 Accepted: 8 June 2021
References 1. Skinner MA. Hirschsprung’s disease. Curr Probl Surg. 1996;33(5):389–460. 2. Leonard MG, Gulati A. Endothelin B receptor agonist, IRL‑1620, enhances
angiogenesis and neurogenesis following cerebral ischemia in rats. Brain Res. 2013;1528:28–41.
3. Leonard MG, Prazad P, Puppala B, Gulati A. Selective endothelin‑B recep‑tor stimulation increases vascular endothelial growth factor in the rat brain during postnatal development. Drug research. 2015;65(11):607–13.
4. Namiki A, Hirata Y, Ishikawa M, Moroi M, Aikawa J, Machii K. Endothelin‑1‑ and endothelin‑3‑induced vasorelaxation via common generation of endothelium‑derived nitric oxide. Life Sci. 1992;50(10):677–82.
5. Spouge D, Baird PA. Hirschsprung disease in a large birth cohort. Tera‑tology. 1985;32(2):171–7.
6. Fukuroda T, Fujikawa T, Ozaki S, Ishikawa K, Yano M, Nishikibe M. Clear‑ance of circulating endothelin‑1 by ETB receptors in rats. Biochem Biophys Res Commun. 1994;199(3):1461–5.
7. Ida‑Eto M, Ohgami N, Iida M, Yajima I, Kumasaka MY, Takaiwa K, et al. Partial requirement of endothelin receptor B in spiral gan‑glion neurons for postnatal development of hearing. J Biol Chem. 2011;286(34):29621–6.
8. Hua LL, Vedantham V, Barnes RM, Hu J, Robinson AS, Bressan M, et al. Specification of the mouse cardiac conduction system in the absence of Endothelin signaling. Dev Biol. 2014;393(2):245–54.
9. Patterson K, Toomey KE, Chandra RS. Hirschsprung disease in a 46, XY phenotypic infant girl with Smith‑Lemli‑Opitz syndrome. J Pediatr. 1983;103(3):425–7.
10. Goldberg EL. An epidemiological study of Hirschsprung’s disease. Int J Epidemiol. 1984;13(4):479–85.
11. Haddad GG, Mazza NM, Defendini R, Blanc WA, Driscoll JM, Epstein MA, et al. Congenital failure of automatic control of ventilation, gastrointes‑tinal motility and heart rate. Medicine (Baltimore). 1978;57(6):517–26.
12. Touraine RL, Attie‑Bitach T, Manceau E, Korsch E, Sarda P, Pingault V, et al. Neurological phenotype in Waardenburg syndrome type 4 correlates with novel SOX10 truncating mutations and expression in developing brain. Am J Hum Genet. 2000;66(5):1496–503.
13. Parisi MA, Kapur RP. Genetics of Hirschsprung disease. Curr Opin Pedi‑atr. 2000;12(6):610–7.
14. Kusafuka T, Wang Y, Puri P. Novel mutations of the endothelin‑B recep‑tor gene in isolated patients with Hirschsprung’s disease. Hum Mol Genet. 1996;5(3):347–9.
15. Puffenberger EG, Hosoda K, Washington SS, Nakao K, deWit D, Yanagi‑sawa M, et al. A missense mutation of the endothelin‑B receptor gene in multigenic Hirschsprung’s disease. Cell. 1994;79(7):1257–66.
16. Garcia‑Barcelo M, Sham MH, Lee WS, Lui VC, Chen BL, Wong KK, et al. Highly recurrent RET mutations and novel mutations in genes of the receptor tyrosine kinase and endothelin receptor B pathways in Chinese patients with sporadic Hirschsprung disease. Clin Chem. 2004;50(1):93–100.
17. Kim JH, Yoon KO, Kim H, Kim JK, Kim JW, Lee SK, et al. New variations of the EDNRB gene and its association with sporadic Hirschsprung’s disease in Korea. J Pediatr Surg. 2006;41(10):1708–12.
18. Hosoda K, Hammer RE, Richardson JA, Baynash AG, Cheung JC, Giaid A, et al. Targeted and natural (piebald‑lethal) mutations of endothelin‑B receptor gene produce megacolon associated with spotted coat color in mice. Cell. 1994;79(7):1267–76.
19. Gariepy CE, Williams SC, Richardson JA, Hammer RE, Yanagisawa M. Transgenic expression of the endothelin‑B receptor prevents congeni‑tal intestinal aganglionosis in a rat model of Hirschsprung disease. J Clin Investig. 1998;102(6):1092–101.
20. Baynash AG, Hosoda K, Giaid A, Richardson JA, Emoto N, Hammer RE, et al. Interaction of endothelin‑3 with endothelin‑B receptor is
essential for development of epidermal melanocytes and enteric neurons. Cell. 1994;79(7):1277–85.
21. Kohzuki M, Chai SY, Paxinos G, Karavas A, Casley DJ, Johnston CI, et al. Localization and characterization of endothelin receptor binding sites in the rat brain visualized by in vitro autoradiography. Neuroscience. 1991;42(1):245–60.
22. Webber KM, Pennefather JN, Head GA, van den Buuse M. Endothelin induces dopamine release from rat striatum via endothelin‑B recep‑tors. Neuroscience. 1998;86(4):1173–80.
23. Shibata S, Niwa M, Himeno A, Gana NG, Shigematsu K, Matsumoto M, et al. The endothelin ETA receptor exists in the caudal solitary tract nucleus of the rat brain. Cell Mol Neurobiol. 1997;17(1):151–6.
24. Fernandez‑Durango R, de Juan JA, Zimman H, Moya FJ, Garcia de la Coba M, Fernandez‑Cruz A. Identification of endothelin receptor sub‑type (ETB) in human cerebral cortex using subtype‑selective ligands. Journal of neurochemistry. 1994.62(4):1482–8.
25. Giaid A, Gibson SJ, Herrero MT, Gentleman S, Legon S, Yanagisawa M, et al. Topographical localisation of endothelin mRNA and peptide immunoreactivity in neurones of the human brain. Histochemistry. 1991;95(3):303–14.
26. Yanagisawa M, Kurihara H, Kimura S, Tomobe Y, Kobayashi M, Mitsui Y, et al. A novel potent vasoconstrictor peptide produced by vascular endothelial cells. Nature. 1988;332(6163):411–5.
27. Salvatore S, Vingolo EM. Endothelin‑1 role in human eye: a review. J Ophthalmol. 2010;2010:354645.
28. Uchida Y, Ninomiya H, Saotome M, Nomura A, Ohtsuka M, Yanagisawa M, et al. Endothelin, a novel vasoconstrictor peptide, as potent bron‑choconstrictor. Eur J Pharmacol. 1988;154(2):227–8.
29. Matsushima Y, Shinkai Y, Kobayashi Y, Sakamoto M, Kunieda T, Tachi‑bana M. A mouse model of Waardenburg syndrome type 4 with a new spontaneous mutation of the endothelin‑B receptor gene. Mamm Genome. 2002;13(1):30–5.
30. Yuen TJ, Johnson KR, Miron VE, Zhao C, Quandt J, Harrisingh MC, et al. Identification of endothelin 2 as an inflammatory factor that promotes central nervous system remyelination. Brain. 2013;136(Pt 4):1035–47.
31. Swire M, Kotelevtsev Y, Webb DJ, Lyons DA, Ffrench‑Constant C. Endothelin signalling mediates experience‑dependent myelination in the CNS. Elife. 2019;8:e49493.
32. Vidovic M, Chen MM, Lu QY, Kalloniatis KF, Martin BM, Tan AH, et al. Deficiency in endothelin receptor B reduces proliferation of neuronal progenitors and increases apoptosis in postnatal rat cerebellum. Cell Mol Neurobiol. 2008;28(8):1129–38.
33. Ehrenreich H, Nau TR, Dembowski C, Hasselblatt M, Barth M, Hahn A, et al. Endothelin b receptor deficiency is associated with an increased rate of neuronal apoptosis in the dentate gyrus. Neuroscience. 2000;95(4):993–1001.
34. Xie D, Croaker GD, Li J, Song ZM. Reduced cell proliferation and increased apoptosis in the hippocampal formation in a rat model of Hirschsprung’s disease. Brain Res. 2016;1642:79–86.
35. Back SA, Tuohy TM, Chen H, Wallingford N, Craig A, Struve J, et al. Hya‑luronan accumulates in demyelinated lesions and inhibits oligoden‑drocyte progenitor maturation. Nat Med. 2005;11(9):966–72.
36. Hammond TR, McEllin B, Morton PD, Raymond M, Dupree J, Gallo V. Endothelin‑B receptor activation in astrocytes regulates the rate of oligodendrocyte regeneration during remyelination. Cell Rep. 2015;13(10):2090–7.
37. Gadea A, Schinelli S, Gallo V. Endothelin‑1 Regulates Astrocyte Proliferation and Reactive Gliosis via a JNK/c‑Jun Signaling Pathway. 2008;28(10):2394–408.
38. Grell AS, Thigarajah R, Edvinsson L, Samraj AK. Regulatory mechanism of endothelin receptor B in the cerebral arteries after focal cerebral ischemia. PLoS ONE. 2014;9(12):e113624.
39. S Spray SE Johansson 2017 Enhanced contractility of intraparenchymal arterioles after global cerebral ischaemia in rat ‑ new insights into the development of delayed cerebral hypoperfusion 220 4 417 431
40. Garavelli L, Ivanovski I, Caraffi SG, Santodirocco D, Pollazzon M, Cordelli DM, et al. Neuroimaging findings in Mowat‑Wilson syndrome: a study of 54 patients. Genet Med. 2017;19(6):691–700.
41. Gariepy CE, Cass DT, Yanagisawa M. Null mutation of endothelin recep‑tor type B gene in spotting lethal rats causes aganglionic megacolon and white coat color. Proc Natl Acad Sci USA. 1996;93(2):867–72.
Page 13 of 13Chen et al. BMC Neurosci (2021) 22:42
42. Chen KC, Arad A, Song ZM, Croaker D. High‑definition neural visualiza‑tion of rodent brain using micro‑CT scanning and non‑local‑means processing. BMC Med Imaging. 2018;18(1):38.
43. Schindelin J, Arganda‑Carreras I, Frise E, Kaynig V, Longair M, Pietzsch T, et al. Fiji: an open‑source platform for biological‑image analysis. Nat Meth. 2012;9(7):676–82.
44. Limaye A. Drishti, A volume exploration and Presentation Tool. Devel‑opments in X‑Ray Tomography VIII; 17 October 20122012.
45. Buades A, Coll B, Morel J‑M. A Non‑Local Algorithm for Image Denois‑ing. Proceedings of the 2005 IEEE Computer Society Conference on Computer Vision and Pattern Recognition (CVPR’05) ‑ Volume 2 ‑ Vol‑ume 02. 1069066: IEEE Computer Society; 2005. p. 60–5.
46. Brennan A, Dean CH, Zhang AL, Cass DT, Mirsky R, Jessen KR. Endothe‑lins control the timing of schwann cell generation in vitro and in vivo. Dev Biol. 2000;227(2):545–57.
47. Clouthier DE, Hosoda K, Richardson JA, Williams SC, Yanagisawa H, Kuwaki T, et al. Cranial and cardiac neural crest defects in endothelin‑A receptor‑deficient mice. Development. 1998;125(5):813–24.
48. Slavikova T, Zabojnikova L, Babala J, Varga I. An embryological point of view on associated congenital anomalies of children with Hirschsprung disease. Bratisl Lek Listy. 2015;116(11):640–7.
49. Stoll C, Dott B, Alembik Y, Roth MP. Associated congenital anomalies among cases with Down syndrome. Eur J Med Genet. 2015;58(12):674–80.
50. Van de Putte T, Maruhashi M, Francis A, Nelles L, Kondoh H, Huylebroeck D, et al. Mice lacking ZFHX1B, the gene that codes for Smad‑interacting protein‑1, reveal a role for multiple neural crest cell defects in the etiol‑ogy of Hirschsprung disease‑mental retardation syndrome. Am J Hum Genet. 2003;72(2):465–70.
51. Croaker GDH, Shi E, Simpson E, Cartmill T, Cass DT. Congenital central hypoventilation syndrome and Hirschsprung’s disease. Arch Dis Child. 1998;78(4):316–22.
52. Paz JA, Kim CA, Goossens M, Giurgea I, Marques‑Dias MJ. Mowat‑Wilson syndrome: neurological and molecular study in seven patients. Arq Neuropsiquiatr. 2015;73(1):12–7.
53. Boardman JP, Syrris P, Holder SE, Robertson NJ, Carter N, Lakhoo K. A novel mutation in the endothelin B receptor gene in a patient with Shah‑Waardenburg syndrome and Down syndrome. J Med Genet. 2001;38(9):646–7.
54. Ambar I, Kloog Y, Kochva E, Wollberg Z, Bdolah A, Oron U, et al. Char‑acterization and localization of a novel neuroreceptor for the peptide sarafotoxin. Biochem Biophys Res Commun. 1988;157(3):1104–10.
55. Tsaur ML, Wan YC, Lai FP, Cheng HF. Expression of B‑type endothelin receptor gene during neural development. FEBS Lett. 1997;417(2):208–12.
56. Naidoo V, Naidoo S, Mahabeer R, Raidoo DM. Cellular distribution of the endothelin system in the human brain. J Chem Neuroanat. 2004;27(2):87–98.
57. Koyama Y, Tsujikawa K, Matsuda T, Baba A. Intracerebroventricular admin‑istration of an endothelin ETB receptor agonist increases expressions of GDNF and BDNF in rat brain. Eur J Neurosci. 2003;18(4):887–94.
58. Briyal S, Nguyen C, Leonard M, Gulati A. Stimulation of endothelin B receptors by IRL‑1620 decreases the progression of Alzheimer’s disease. Neuroscience. 2015;301:1–11.
59. Feger GI, Schilling L, Ehrenreich H, Wahl M. Endothelium‑dependent relaxation counteracting the contractile action of endothelin‑1 is partly due to ETB receptor activation. Research Exp Med . 1997;196(6):327–37.
60. Larsen CC, Povlsen GK, Rasmussen MN, Edvinsson L. Improvement in neurological outcome and abolition of cerebrovascular endothelin B
and 5‑hydroxytryptamine 1B receptor upregulation through mitogen‑activated protein kinase kinase 1/2 inhibition after subarachnoid hemor‑rhage in rats. J Neurosurg. 2011;114(4):1143–53.
61. Johansson SE, Larsen SS, Povlsen GK, Edvinsson L. Early MEK1/2 inhibition after global cerebral ischemia in rats reduces brain damage and improves outcome by preventing delayed vasoconstrictor receptor upregulation. PLoS ONE. 2014;9(3):e92417.
62. McDougall ARA, Wiradjaja V, Azhan A, Li A, Hale N, Wlodek ME, et al. Intrauterine growth restriction alters the postnatal development of the rat cerebellum. Dev Neurosci. 2017;39(1–4):215–27.
63. Sun Y, Zhang X, Chen Z, Xu M, Ou M. Reduction of uterine perfusion pres‑sure induced redistribution of endothelin receptor type‑b between the intima and media contributes to the pathogenesis of pregnancy‑induced hypertension. Cellular Physiol Biochem. 2017;44(5):1715–25.
64. Douglas SA, Hiley CR. Endothelium‑dependent vascular activities of endothelin‑like peptides in the isolated superior mesenteric arterial bed of the rat. Br J Pharmacol. 1990;101(1):81–8.
65. Nishikawa K, Ayukawa K, Hara Y, Wada K, Aoki S. Endothelin/endothelin‑B receptor signals regulate ventricle‑directed interkinetic nuclear migration of cerebral cortical neural progenitors. Neurochem Int. 2011;58(3):261–72.
66. Koyama Y, Nagae R, Tokuyama S, Tanaka K. I.c.v administration of an endothelin ET(B) receptor agonist stimulates vascular endothelial growth factor‑A production and activates vascular endothelial growth factor receptors in rat brain. Neuroscience. 2011;192:689–98.
67. Gariepy CE, Ohuchi T, Williams SC, Richardson JA, Yanagisawa M. Salt‑sensitive hypertension in endothelin‑B receptor‑deficient rats. J Clin Investig. 2000;105(7):925–33.
68. Hirata Y, Emori T, Eguchi S, Kanno K, Imai T, Ohta K, et al. Endothelin receptor subtype B mediates synthesis of nitric oxide by cultured bovine endothelial cells. J Clin Investig. 1993;91(4):1367–73.
69. Ansar S, Eftekhari S, Waldsee R, Nilsson E, Nilsson O, Saveland H, et al. MAPK signaling pathway regulates cerebrovascular receptor expression in human cerebral arteries. BMC Neurosci. 2013;14:12.
70. DeLong MR, Wichmann T. Circuits and circuit disorders of the basal ganglia. Arch Neurol. 2007;64(1):20–4.
71. Gilbert CD, Sigman M. Brain states: top‑down influences in sensory processing. Neuron. 2007;54(5):677–96.
72. Gozal D. Congenital central hypoventilation syndrome: an update. Pediatr Pulmonol. 1998;26(4):273–82.
73. Ihara M, Saeki T, Fukuroda T, Kimura S, Ozaki S, Patel AC, et al. A novel radioligand [125I]BQ‑3020 selective for endothelin (ETB) receptors. Life Sci. 1992;51(6):l47‑52.
74. Verdy M, Weber AM, Roy CC, Morin CL, Cadotte M, Brochu P. Hirschsprung’s disease in a family with multiple endocrine neoplasia type 2. J Pediatr Gastroenterol Nutr. 1982;1(4):603–7.
75. Peretz H, Luboshitsky R, Baron E, Biton A, Gershoni R, Usher S, et al. Cys 618 Arg mutation in the RET proto‑oncogene associated with familial medullary thyroid carcinoma and maternally transmitted Hirschsprung’s disease suggesting a role for imprinting. Hum Mutat. 1997;10(2):155–9.
76. Romeo G, Ceccherini I, Celli J, Priolo M, Betsos N, Bonardi G, et al. Associa‑tion of multiple endocrine neoplasia type 2 and Hirschsprung disease. J Intern Med. 1998;243(6):515–20.
Publisher’s NoteSpringer Nature remains neutral with regard to jurisdictional claims in pub‑lished maps and institutional affiliations.


