Embed Size (px)
Citation preview
Project Report
On
“Analysis of Automobile Sector and Valuation ofTata Motors
SUBMITTED TO:-Mr. SUPREET SINGH
Sr. Lecturer
SUBMITTED BY: - ABHINAV GUPTA
Academic guide Corporate guide Mr. SUPREET SINGH Mr. Ashish R Mandhata Sr. Lecturer, Manager,
1
PrefaceAs a part of MBF programme, a student has to pursue a project
duly approved by the Director of the Institute. I had the project
on “Analysis of Automobile Sector and Valuation of Tata Motors”.
The project mainly deals with the analysis of Indian automobile
industry and the performance of Tata Motors which is one of the
major players in the industry. The main idea for selecting this
project is because of the improvement of standard of living of
the people over the years with the idea of small car has brought
in a lot of demand for the automobile industry and in the coming
decades it is expected to grow at a greater pace.
My project is divided into 6 chapters and they are given under.
1. Chapter one deals with the introduction where in I have
discussed the procedure that is going to be followed in
doing the project
2. Chapter two deals with research objective. The primary aim
of the project work under study is to analyse the fast
growing Auto sector of India, and to arrive at the equity
valuation of one of the biggest players in the industry Tata
Motors Ltd. The secondary objective is to undertake detailed
fundamental analysis i.e. economic, industry and company
analysis.
2
3. Chapter three deals with the literature review where in I
discussed the techniques which are going to be incorporated
while doing the project and clearly explained them by taking
in to consideration the different articles I have referred
during the course of study
4. Chapter four deals with the research methodology used i.e.
the various assumptions taken into consideration and the
various valuation techniques used to valuate the company
5. Chapter five deals with the analysis and interpretations
where in I analysed the economy, industry and the company.
6. Chapter six deals with the conclusion, suggestions and
limitations of the study.
CERTIFICATE
This is to certify that “Analysis of Auto sector companies with
reference to Tata Motors and the Valuation of Tata Motors.” was
carried out by Abhinav Gupta as a part of the requirements of
Management of Business Finance (MBF) six semester programme. This
3
study is being submitted for the approval to the Indian Institute
of Finance.
I declare that the form and the content of the above mentioned
project are original and have not been submitted in part or full,
for any other degree or diploma of this or any other
Organization/ Institute/ University.
Signature
:
Name: Pradeep Varma Mudundi
4
CERTIFICATE
This is to certify that “Analysis of Auto sector companies with
reference to Tata Motors and the Valuation of Tata Motors.” was
carried out by Pradeep Varma Mudundi as a part of the
requirements of (BBA) six semester programme. This study is being
submitted for the approval to the Indian Institute of Finance.
Signature:
ABHINAV GUPTA
5

ACKNOWLEDGMENT
This project work has been supported by Varrenyam Consultants
Private Limited. I would like to convey my sincere thanks to Mr.
Ashish R Mandhata, Manager – Business Analysis, who was my
project’s corporate guide.
I am immensely grateful to Mr. SPREET SINGH, Sr. Lecturer,
MAHARAJA AGRASEN INSTITUTE OF ADVANCE STUDIES
(Pradeep Varma Mudundi)
6

7
EXECUTIVE SUMMARY
The main objective of the report is to study the development in
the auto industries from sales to investments. The outlook for
India’s automotive sector is highly promising. In view of
current growth trends and prospect of continuous economic growth
of over 8 per cent, all segments of the auto industry are likely
to see continued growth. Large infrastructure development
projects underway in India combined with favorable government
policies will also drive automotive growth in the next few years.
Easy availability of finance and moderate cost of financing
facilitated by double income families will drive sales in the
next few years. India is also emerging as an outsourcing hub for
global majors. Companies like GM, Ford, Toyota and Hyundai are
implementing their expansion plans in the current year. While
Ford and Toyota continue to leverage India as a source of
components, Hyundai and Suzuki have identified India as a global
source for specific small car models.
India offers a huge growth opportunity for the automobile sector
the domestic market is large and has the potential to grow
further in the future due to positive demographic trends and the
current low penetration levels. Growing consuming class (mn
households-annual income) population and is one of the most
attractive consumer markets in the world today. Income levels
8
across population segments have been growing in India. According
to National Council of Applied Economic Research data, the
consuming class, with an annual income of US$ 980or above, is
growing and is expected to constitute over 80 per cent of the
population by 2009-10.
In addition, a large proportion of the Indian population is
relatively young - in the age group of 20-59 years. This is
expected to further boost the automotive domestic market as a
younger population has a higher consumption index. The rise in
income levels of the Indians and the emergence of the consuming
class that has higher propensity to spend offers great
opportunities for growth to companies across various sectors.
Large target consumer base and rising income levels of India has
nearly 23 per cent of the global
Demand increasing degree of influence by global more information
sophistication trends Changing lifestyles, driving demand for new
segments Consumers in India are now more informed, sophisticated
and demanding. Urban consumers have been especially exposed to
western lifestyles through overseas travel For example, more than
5 million Indians traveled overseas last year and this number is
expected to increase by 15 per cent to 20 per cent per annum An
increase in the number of working women and the prevalence of
nuclear double-income families, especially in urban areas, are
other trends shaping lifestyles. These changes are driving an9
increased need for personal transport, especially in segments
like working women, young executives and teenagers. This has led
to the growth in demand for motorcycles, un-geared and automatic
scooters and compact cars. Across the automobile spectrum,
consumer aspirations are driving demand for upper end models in
all segments.
The Indian automotive industry is well served by the two industry
associations - Society of Indian Automobile Manufacturers (SIAM)
that represents the OEMs and Automotive Components Manufacturers’
Association (ACMA) that represents the components industry. Both
associations actively engage with industry, government and other
stakeholders to promote the interests of the industry and improve
competitiveness.
At the same time, Indian players are likely to increasingly
venture overseas, both for organic growth as well as
acquisitions. The automotive sector in India is poised to become
significant, both in the domestic market as well as globally. The
very recent example of Tata acquiring Ford’s jaguar and land
rover makes it much clearer.
Another objective of this study is to find the intrinsic stock
price of Tata motors as on 1st April 2008. I have done the
fundamental analysis of the company where in I implemented DCF
method to valuate the firm. I have project the cash flows for the10
next five years and I discounted them by using FCFE model and
found the stock price to be 686. The current stock price is
around 603 so the stock is fairly undervalued. So I would like to
call it as an investment option and would recommend a buy for the
investors.
TABLE OF CONTENTS
Particular
page no.
Chapter- 1 Introduction
10
Chapter- 2 Research Objective
11
Chapter -3 Literature review
12
11
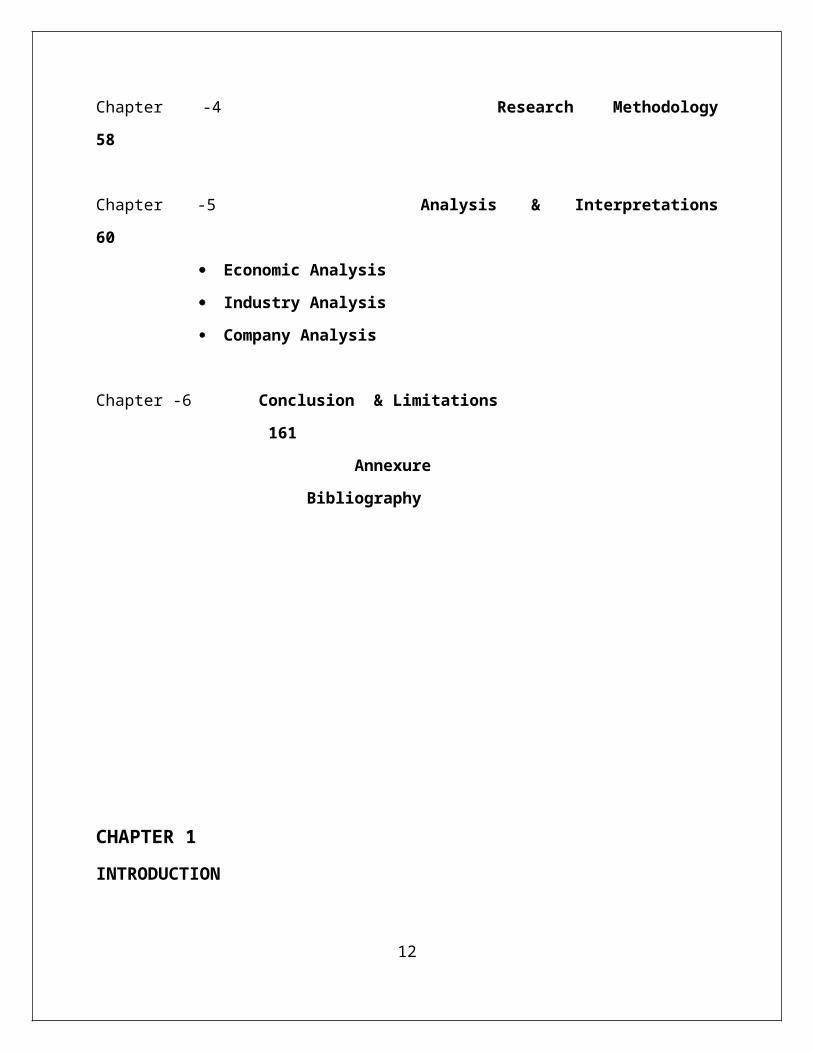
Chapter -4 Research Methodology
58
Chapter -5 Analysis & Interpretations
60
Economic Analysis
Industry Analysis
Company Analysis
Chapter -6 Conclusion & Limitations
161
Annexure
Bibliography
CHAPTER 1INTRODUCTION
12
A large proportion of the Indian population is relatively young -
in the age group of 20-59 years. This is expected to boost the
automotive domestic market as a younger population has a higher
consumption index. The rise in income levels of the Indians and
the emergence of the consuming class that has higher propensity
to spend offers great opportunities for growth to companies
across various sectors.
The project work under study is a humble effort to undertake an
intelligent analysis of the Auto sector of India, and an unbiased
valuation of one of the players in the industry Tata Motors. The
study starts with the Literature review on valuations in brief,
with Economic Analysis, Analysis of Auto sector of India and
world (including porter analysis of Indian auto sector) and
finally analysis of Tata Motors.
The sole aim of this project has been to find out the intrinsic
value of Tata Motors as on 1st April 2008. I have used equity
valuation techniques relating from the discounted cash flow
methods (free cash flow to equity model).Thus I have arrived at a
fair value of per share price.
The DCF value has been arrived after forecasting the financial
statements for the next five years from 2007-2008 to 2011-2012
(year ending 31st march), by discounting back all the future free
13
cash flows to equity with the cost of capital. For the same I
have formulated my own forecasting financial model.
In conclusion I have attempted to present the intrinsic worth of
the stock; it should be taken as a investment call. As per my
findings the stock appears undervalued, so it should be purchased
as on 1st April 2008. This stock is majorly hit due to market
forces otherwise company’s business model looks strong and the
way they are doing their research & Development and models they
plan to launch in the market looks attractive and so company has
a bright future in long run.
CHAPTER 2
RESEARCH OBJECTIVE
The primary aim of the project work under study is to analyse the
fast growing Auto sector of India, and to arrive at the equity
valuation of one of the biggest players in the industry Tata
Motors Ltd.
Sub – objective
The secondary objective is to undertake detailed fundamental
analysis i.e. economic, industry and company analysis.
14
The project aims at study integrating the widely accepted
theoretical methods to practical study under real market
conditions. I have resorted to classical top to down approach. I
began with the analysis and short term prediction of real
economic indicators, then a careful observation of the Auto
sector in India. Finally I presented a comprehensive company
analysis of Tata Motors Ltd to highlight its competitive edge
over the other players and financial strength.
I have also done the comparative analysis of Tata Motors with
major players like Ashok Leyland, Eicher Motors, Force Motors. I
have done the ratio analysis of the major players and compared
with Tata Motors.
The DCF value has been arrived after forecasting the financial
statements for the next five years from 2007-2008 to 2011-2012
(year ending 31st march), by discounting back all the future free
cash flows to equity with the cost of capital. For the same I
have formulated my own forecasting financial model which is
widely accepted free cash flow to equity model. .
15
CHAPTER 3
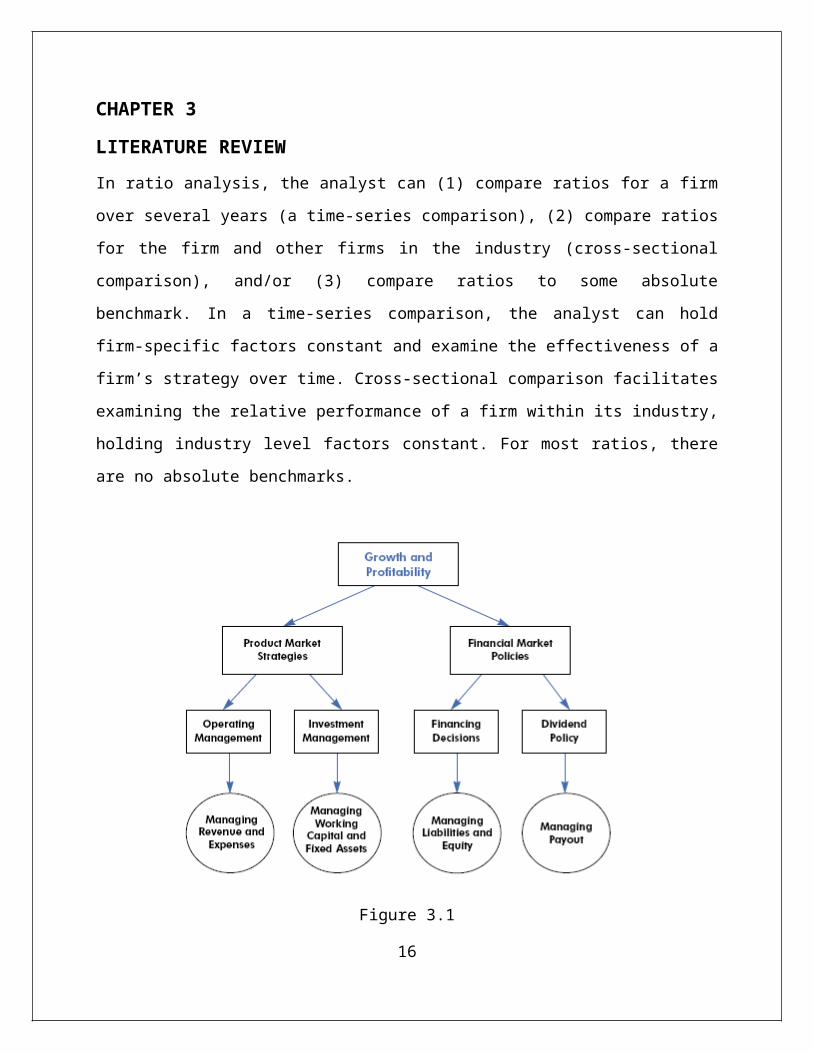
LITERATURE REVIEWIn ratio analysis, the analyst can (1) compare ratios for a firm
over several years (a time-series comparison), (2) compare ratios
for the firm and other firms in the industry (cross-sectional
comparison), and/or (3) compare ratios to some absolute
benchmark. In a time-series comparison, the analyst can hold
firm-specific factors constant and examine the effectiveness of a
firm’s strategy over time. Cross-sectional comparison facilitates
examining the relative performance of a firm within its industry,
holding industry level factors constant. For most ratios, there
are no absolute benchmarks.
Figure 3.1
16
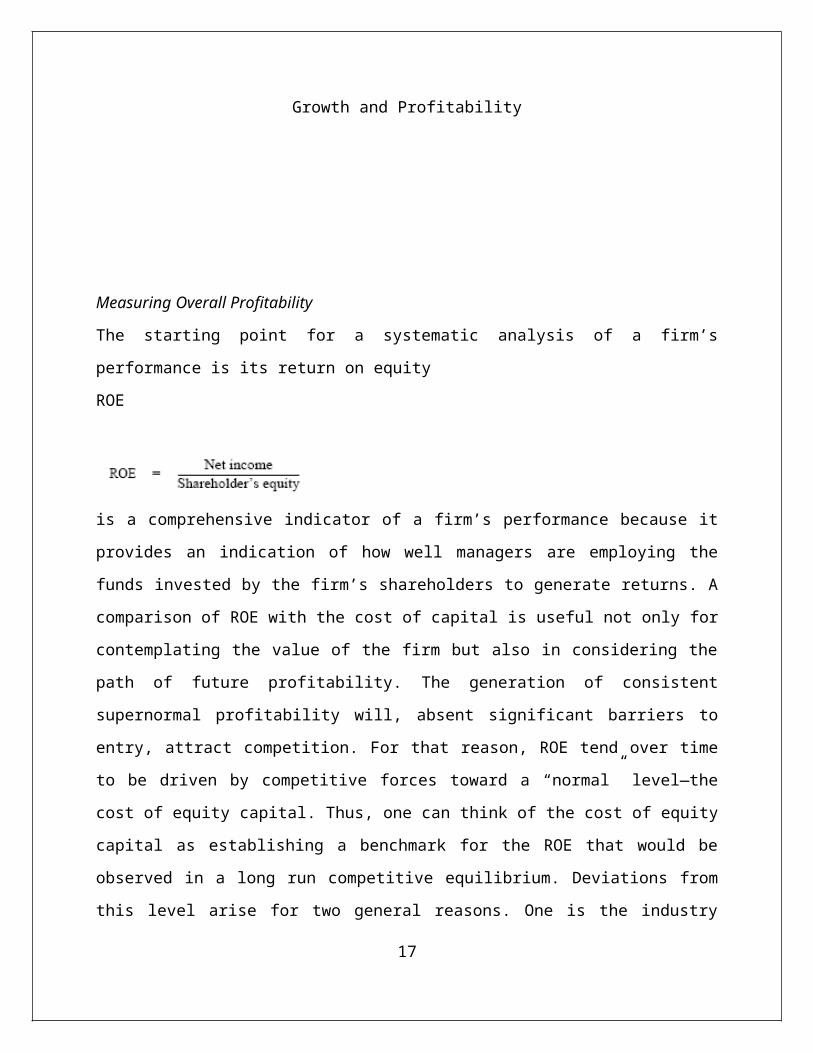
Growth and Profitability
Measuring Overall Profitability
The starting point for a systematic analysis of a firm’s
performance is its return on equity
ROE
is a comprehensive indicator of a firm’s performance because it
provides an indication of how well managers are employing the
funds invested by the firm’s shareholders to generate returns. A
comparison of ROE with the cost of capital is useful not only for
contemplating the value of the firm but also in considering the
path of future profitability. The generation of consistent
supernormal profitability will, absent significant barriers to
entry, attract competition. For that reason, ROE tend over time
to be driven by competitive forces toward a “normal” level—the
cost of equity capital. Thus, one can think of the cost of equity
capital as establishing a benchmark for the ROE that would be
observed in a long run competitive equilibrium. Deviations from
this level arise for two general reasons. One is the industry
17
conditions and competitive strategy that cause a firm to generate
supernormal (or subnormal) economic profits, at least over the
short run. The second is distortions due to accounting. A
company’s ROE is affected by two factors: how profitably it
employs its assets and how big the firm’s asset base is relative
to shareholders’ investment. To understand the effect of these
two factors, ROE can be decomposed into return on assets ( ROA )
and a measure of financial leverage, as follows: ROA tells us how
much profit a company is able to generate for each dollar of
assets invested. Financial leverage indicates how many dollars of
assets the firm is able to deploy for each dollar invested by its
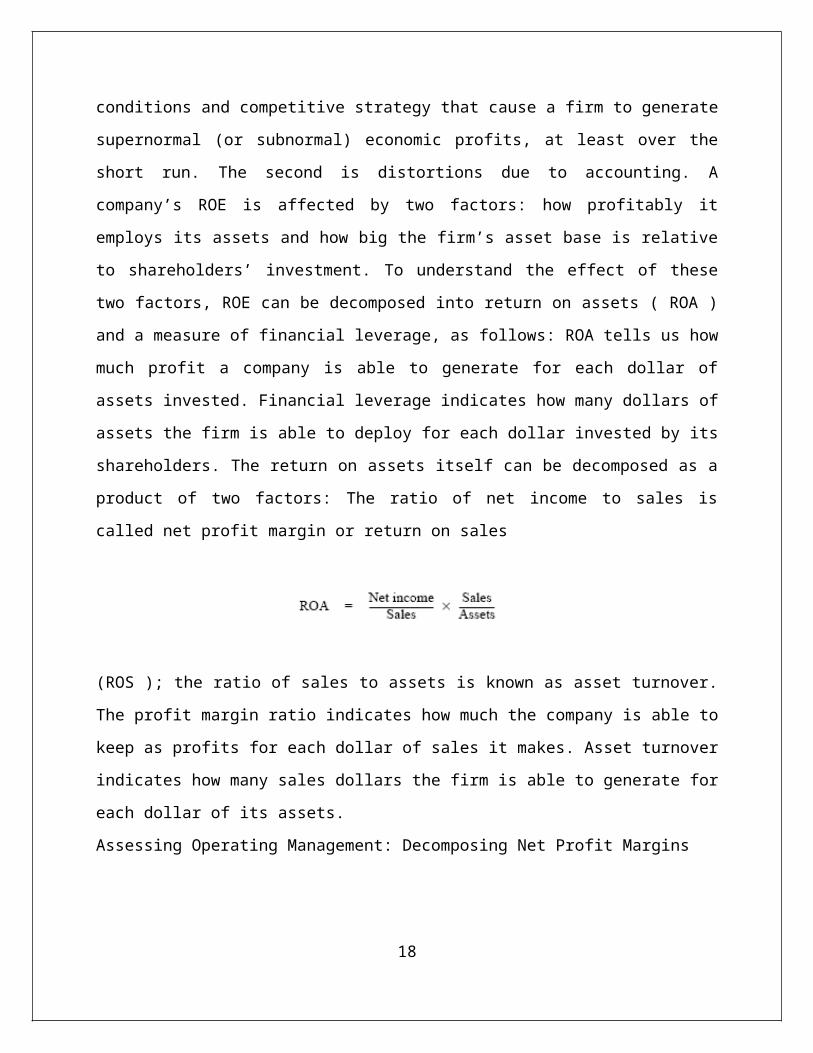
shareholders. The return on assets itself can be decomposed as a
product of two factors: The ratio of net income to sales is
called net profit margin or return on sales
(ROS ); the ratio of sales to assets is known as asset turnover.
The profit margin ratio indicates how much the company is able to
keep as profits for each dollar of sales it makes. Asset turnover
indicates how many sales dollars the firm is able to generate for
each dollar of its assets.
Assessing Operating Management: Decomposing Net Profit Margins
18
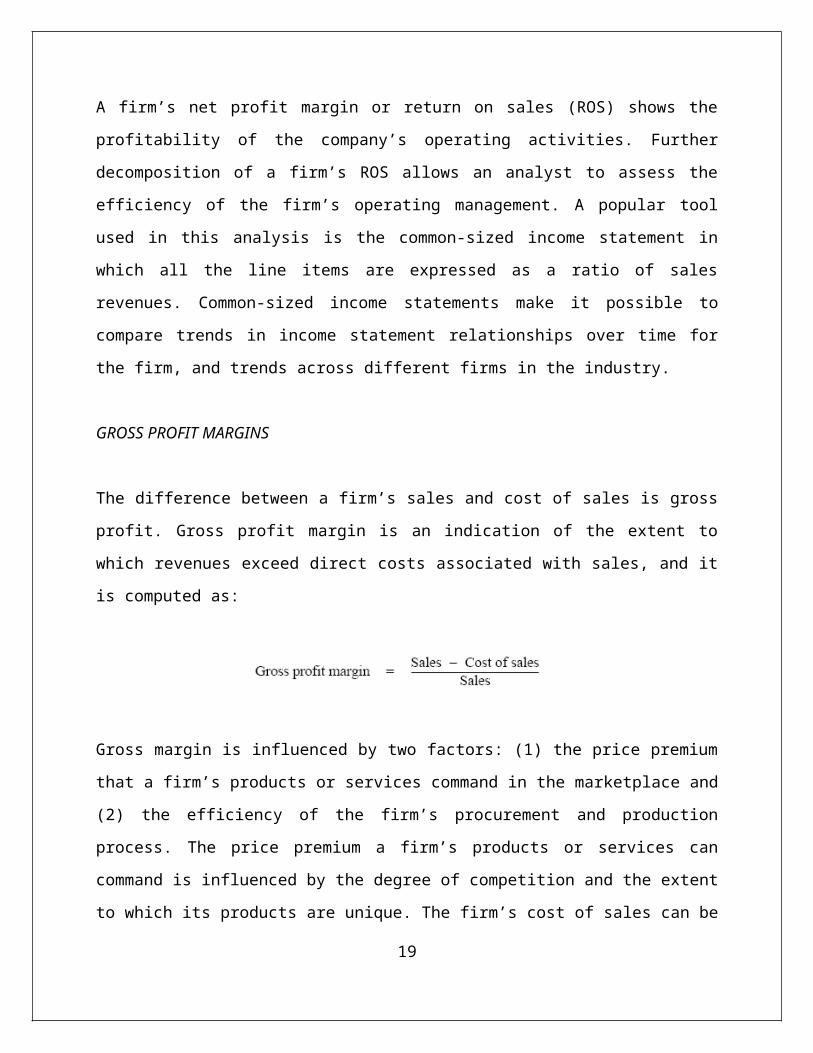
A firm’s net profit margin or return on sales (ROS) shows the
profitability of the company’s operating activities. Further
decomposition of a firm’s ROS allows an analyst to assess the
efficiency of the firm’s operating management. A popular tool
used in this analysis is the common-sized income statement in
which all the line items are expressed as a ratio of sales
revenues. Common-sized income statements make it possible to
compare trends in income statement relationships over time for
the firm, and trends across different firms in the industry.
GROSS PROFIT MARGINS
The difference between a firm’s sales and cost of sales is gross
profit. Gross profit margin is an indication of the extent to
which revenues exceed direct costs associated with sales, and it
is computed as:
Gross margin is influenced by two factors: (1) the price premium
that a firm’s products or services command in the marketplace and
(2) the efficiency of the firm’s procurement and production
process. The price premium a firm’s products or services can
command is influenced by the degree of competition and the extent
to which its products are unique. The firm’s cost of sales can be
19
low when it can purchase its inputs at a lower cost than
competitors and/or run its production processes more efficiently.
This is generally the case when a firm has a low-cost strategy.
EVALUATING INVESTMENT MANAGEMENT:
Decomposing Asset Turnover Asset turnover is the second driver of
a company’s return on equity. Since firms invest considerable
resources in their assets, using them productively is critical to
overall profitability. A detailed analysis of asset turnover
allows the analyst to evaluate the effectiveness of a firm’s
investment management. There are two primary areas of asset
management: (1) working capital management and (2) management of
long-term assets. Working capital is defined as the difference
between a firm’s current assets and current liabilities. However,
this definition does not distinguish between operating components
(such as accounts receivable, inventory, and accounts payable)
and the financing components (such as cash, marketable
securities, and notes payable). An alternative measure that makes
this distinction is operating working capital
Operating working capital (Current assets – cash and marketable
securities)
– (Current liabilities – Short-term and current portion of long-
term debt)
20
LONG-TERM ASSETS MANAGEMENT
Another area of investment management concerns the utilization of
a firm’s long-term assets. It is useful to define a firm’s
investment in long-term assets as follows: Net long-term assets
(Total long-term assets −Non-interest-bearing long-term
liabilities) Long-term assets generally consist of net property,
plant, and equipment (PP&E), intangible assets such as goodwill,
and other assets. Non-interest-bearing long-term liabilities
include such items as deferred taxes. We define net long-term
assets and net working capital in such a way that their sum, net
operating assets, is equal to the sum of net debt and equity, or
net capital. This is consistent with the way we defined operating
ROA. The efficiency with which a firm uses its net long-term
assets is measured by the following two ratios: net long-term
assets as a percent of sales and net long-term asset turnover.
Net long-term asset turnover is defined as:
Putting It All Together: Assessing Sustainable Growth Rate
21
Analysts often use the concept of sustainable growth as a way to
evaluate a firm’s ratios in a comprehensive manner. A firm’s
sustainable growth rate is defined as:
.
The dividend payout ratio is defined as:
Sustainable growth rate is the rate at which a firm can grow
while keeping its profitability and financial policies unchanged.
A firm’s return on equity and its dividend payout policy
determine the pool of funds available for growth. Of course, the
firm can grow at a rate different from its sustainable growth
rate if its profitability, payout policy, or financial leverage
changes. Therefore, the sustainable growth rate provides a
benchmark against which a firm’s growth plans can be evaluated.
If the firm intends to grow at a higher rate than its sustainable
growth rate, one could assess which of the ratios are likely to
change in the process.
CASH FLOW ANALYSIS
22
Ratio analysis discussed above focused on analyzing a firm’s
income statement (net profit margin analysis) or its balance
sheet (asset turnover and financial leverage). The analyst can
get further insights into the firm’s operating, investing, and
financing policies by examining its cash flows. Cash flow
analysis also provides an indication of the quality of the
information in the firm’s income statement and balance sheet.
Reported cash flow statement, firms classify their cash flows
into three categories: cash flow from operations, cash flow
related to investments, and cash flow related to financing
activities. Cash flow from operations is the cash generated by
the firm from the sale of goods and services after paying for the
cost of inputs and operations. Cash flow related to investment
activities shows the cash paid for capital expenditures; inter
corporate investments, acquisitions, and cash received from the
sales of long-term assets. Cash flow related to financing
activities shows the cash raised from (or paid to) the firm’s
stockholders and debt holders. Firms use two cash flow statement
formats: the direct format and the indirect format. The key
difference between the two formats is the way they report cash
flow from operating activities. In the direct cash flow format,
which is used by only a small number of firms in practice,
operating cash receipts and disbursements are reported directly.
In the indirect format, firms derive their operating cash flows
by making adjustments to net income. Because the indirect format
links the cash flow statement with the firm’s income statement23
and balance sheet, many analysts and managers find this format
more useful. SEBI requires Indian companies to maintain the cash
flow in indirect format several factors affect a firm’s ability
to generate positive cash flow from operations. Healthy firms
that are in a steady state should generate more cash from their
customers than they spend on operating expenses. In contrast,
growing firms, especially those investing cash in research and
development, advertising and marketing, or building an
organization to sustain future growth, may experience negative
operating cash flow. Firms’ working capital management also
affects whether they generate positive cash flow from operations.
Firms in the growing stage typically invest some cash flow in
operating working capital items like accounts receivable,
inventories, and accounts payable. Net investments in working
capital are a function of firms’ credit policies (accounts
receivable), payment policies (payables, prepaid expenses, and
accrued liabilities), and expected growth in sales (inventories).
Thus, in interpreting firms’ cash flow from operations after
working capital, it is important to keep in mind their growth
strategy, industry characteristics, and credit policies. The cash
flow analysis model next focuses on cash flows related to long-
term investments. These investments take the form of capital
expenditures; inter corporate investments, and mergers and
acquisitions. Any positive operating cash flow after making
operating working capital investments allows the firm to pursue
long-term growth opportunities. If the firm’s operating cash24
flows after working capital investments are not sufficient to
finance its long-term investments, it has to rely on external
financing to fund its growth. Such firms have less flexibility to
pursue long-term investments than those that can fund their
growth internally. There are both costs and benefits from being
able to fund growth internally. The cost is that managers can use
the internally generated free cash flow to fund unprofitable
investments; such wasteful capital expenditures are less likely
if managers are forced to rely on external capital suppliers.
Reliance on external capital markets may make it difficult for
managers to undertake long-term risky investments if it is not
easy to communicate to the capital markets the benefits from such
investments. Any excess cash flow after these long-term
investments is free cash flow that is available for both debt
holders and equity holders. Payments to debt holders include
interest payments and principal payments. Firms with negative
free cash flow have to borrow additional funds to meet their
interest and debt repayment obligations, or cut some of their
investments in working capital or long-term investments, or issue
additional equity. This situation is clearly financially risky
for the firm. Cash flow after payments to debt holders is free
cash flow available to equity holders. Payments to equity holders
consist of dividend payments and stock repurchases. If firms pay
dividends despite negative free cash flow to equity holders, they
are borrowing money to pay dividends. While this may be feasible
in the short term, it is not prudent for a firm to pay dividends25
to equity holders unless it has a positive free cash flow on a
sustained basis. On the other hand, firms that have a large free
cash flow after debt payments run the risk of wasting that money
on unproductive investments to pursue growth for its own sake. An
analyst, therefore, should carefully examine the investment plans
of such firms. The analyst should focus on a number of cash flow
measures: (1) cash flow from operations before investment in
working capital and interest payments, to examine whether or not
the firm is able to generate a cash surplus from its operations,
(2) cash flow from operations after investment in working
capital, to assess how the firm’s working capital is being
managed and whether or not it has the flexibility to invest in
long-term assets for future growth, (3) free cash flow available
to debt and equity holders, to assess a firm’s ability to meet
its interest and principal payments, and (4) free cash flow
available to equity holders, to assess the firm’s financial
ability to sustain its dividend policy and to identify potential
agency problems from excess free cash flow. These measures have
to be evaluated in the context of the company’s business, its
growth strategy, and its financial policies. Further, changes in
these measures from year to year provide valuable information on
the stability of the cash flow dynamics of the firm.
26
FORECASTING
Most financial statement analysis tasks are undertaken with a
forward-looking decision in mind—and much of the time, it is
useful to summarize the view developed in the analysis with an
explicit forecast. Managers need forecasts for planning and to
provide performance targets; analysts need forecasts to help
communicate their views of the firm’s prospects to investors;
bankers and debt market participants need forecasts to assess the
likelihood of loan repayment. Moreover, there are a variety of
contexts (including but not limited to security analysis) where
the forecast is usefully summarized in the form of an estimate of
the firm’s value—an estimate that, after all, can be viewed as
the best attempt to reflect in a single summary statistic the
manager’s or analyst’s view of the firm’s prospects. Prospective
analysis includes two tasks—forecasting and valuation—that
together represent approaches to explicitly summarizing the
analyst’s forward-looking views.
.
RELATION OF FORECASTING TO OTHER ANALYSIS
Forecasting is not so much a separate analysis as it is a way of
summarizing what has been learned through business strategy
analysis, accounting analysis, and financial analysis.
Business Analysis and Valuation Tools
27
The upshot is that a forecast can be no better than the business
strategy analysis, accounting analysis, and financial analysis
underlying it. However, there are certain techniques and
knowledge that can help a manager or analyst to structure the
best possible forecast, conditional on what has been learned in
the previous steps. Below, we summarize an approach to
structuring the forecast, some information useful in getting
started, and some detailed steps used to forecast earnings,
balance sheet data, and cash flows.
THE TECHNIQUES OF FORECASTING
The Overall Structure of the Forecast The best way to forecast
future performance is to do it comprehensively—producing not only
an earnings forecast, but a forecast of cash flows and the
balance sheet as well. A comprehensive approach is useful, even
in cases where one might be interested primarily in a single
facet of performance, because it guards against unrealistic
implicit assumptions. For example, if an analyst forecasts growth
in sales and earnings for several years without explicit
consideration of the required increases in working capital and
plant assets and the associated financing, the forecast might28
possibly imbed unreasonable assumptions about asset turnover,
leverage, or equity capital infusions. A comprehensive approach
involves many forecasts, but in most cases they are all linked to
the behavior of a few key “drivers.” The drivers vary according
to the type of business involved, but for businesses outside the
financial services sector, the sales forecast is nearly always
one of the key drivers; profit margin is another. When asset
turnover is expected to remain stable—as is often realistic—
working capital accounts and investment in plant should track the
growth in sales closely. Most major expenses also track sales,
subject to expected shifts in profit margins. By linking
forecasts of such amounts to the sales forecast, one can avoid
internal inconsistencies and unrealistic implicit assumptions. In
some contexts, the manager or analyst is interested ultimately in
a forecast of cash flows, not earnings per se. Nevertheless, even
forecasts of cash flows tend to be grounded in practice on
forecasts of accounting numbers, including sales and earnings. Of
course, it would be possible in principle to move directly to
forecasts of cash flows—inflows from customers, outflows to
suppliers and laborers, and so forth—and in some businesses, this
is a convenient way to proceed. In most cases, however, the
growth prospects and profitability of the firm are more readily
framed in terms of accrual-based sales and operating earnings.
These amounts can then be converted to cash flow measures by
adjusting for the effects of noncash expenses and expenditures
for working capital and plant.29
Getting Started: Points of Departure
Every forecast has, at least implicitly, an initial “benchmark”
or point of departure— some notion of how a particular amount,
such as sales or earnings, would be expected to behave in the
absence of detailed information. A possibility that might seem
reasonable—but one that generally turns out not to be very useful
—is the average performance over several prior years. By the time
one has completed a business strategy analysis, an accounting
analysis, and a detailed financial analysis, the resulting
forecast might differ significantly from the original point of
departure. Nevertheless, simply for purposes of having a starting
point that can help anchor the detailed analysis, it is useful to
know how certain key financial statistics behave “on average.”
In the case of some key statistics, such as earnings, a point of
departure or benchmark based only on prior behavior of the number
is more powerful than one might expect. Research demonstrates
that some such benchmarks for earnings are not much less accurate
than the forecasts of professional security analysts, who have
access to a rich information set. Thus, the benchmark is often
not only a good starting point, but also close to the amount
forecast after detailed analysis. Large departures from the
benchmark could be justified only in cases where the firm’s
situation is demonstrably unusual. Reasonable points of departure30
for forecasts of key accounting numbers can be based on the
evidence summarized below. Such evidence may also be useful for
checking the reasonableness of a completed forecast.
THE BEHAVIOR OF SALES GROWTH.
Sales growth rates tend to be “mean-reverting”: firms with above-
average or below-average rates of sales growth tend to revert
over time to a “normal” level (historically in the range of 7 to
9 percent for U.S. firms) within no more than three to ten years.
Figure 10-1 documents this effect for U.S. firms for 1979–1998.
All firms are ranked in terms of their sales growth in 1979 (year
1) and formed into five portfolios based on the relative ranking
of their sales growth in that year. Firms in portfolio 1 have the
top twenty percent of rankings in terms of their sales growth in
1979, and those in portfolio 2 fall into the next twenty percent;
those in portfolio 5 have the bottom twenty percent sales growth
ranks. The sales growth rates of each of the five portfolios
plotted in Figure 10-1 in year +1 to year +10 are averaged across
three experiments. The sales growth rates of firms in each of
these five portfolios are traced from 1979 through the subsequent
nine years (years 2 to 10). The same experiment is repeated with
1984 and then 1989 as the base year (year 1). The figure shows
that the group of firms with the highest growth initially—sales
growth rates of more than 50 percent—experience a decline to
about 6 percent growth rate within three years and are never31
above 13 percent in the next seven years. Those with the lowest
initial growth experience an increase to about 8 percent growth
rate by year 5, and never fall below 5 percent after that. All
five portfolios, irrespective of their starting growth levels,
revert to “normal” levels of sales growth of between 7 and 9
percent within five years. One explanation for the pattern of
sales growth seen in is that as industries and companies mature,
their growth rate slows down due to demand saturation and in
traindustry competition. Therefore, even when a firm is growing
rapidly at present, it is generally unrealistic to extrapolate
the current high growth indefinitely. Of course, how quickly a
firm’s growth rate reverts to the average depends on the
characteristics of its industry and its own competitive position
within an industry.
THE BEHAVIOR OF EARNINGS.
Earnings have been shown, on average, to follow a process that
can be approximated by a “random walk” or “random walk with
drift”; thus, the prior year’s earnings is a good starting point
in considering future earnings potential. Even a simple random
walk forecast—one that predicts next year’s earnings will be
equal to last year’s earnings—is surprisingly useful. One study
documents that professional analysts’ year-ahead forecasts are
only 22 percent more accurate (on average) than a simple random
walk forecast.Thus, a final earnings forecast will usually not32
differ dramatically from a random walk benchmark. The implication
of the evidence is that, in beginning to contemplate future
earnings possibilities, a useful number to start with is last
year’s earnings; the average level of earnings over several prior
years is not. Long-term trends in earnings tend to be sustained
on average, and so they are also worthy of consideration. If
quarterly data are also considered, then some consideration
should usually be given to any departures from the long-run trend
that occurred in the most recent quarter. For most firms, these
most recent changes tend to be partially repeated in subsequent
quarters.
THE BEHAVIOR OF RETURNS ON EQUITY.
Given that prior earnings serves as a useful benchmark for future
earnings, one might expect the same to be true of rates of return
on investment, like ROE. That, however, is not the case, for two
reasons. First, even though the average firm tends to sustain the
current earnings level, this is not true of firms with unusual
levels of ROE. Firms with abnormally high (low) ROE tend to
experience earnings declines (increases).Second, firms with
higher ROEs tend to expand their investment bases more quickly
than others, which causes the denominator of the ROE to increase.33
Of course, if firms could earn returns on the new investments
that match the returns on the old ones, then the level of ROE
would be maintained. However, firms have difficulty pulling that
off. Firms with higher ROEs tend to find that, as time goes by,
their earnings growth does not keep pace with growth in their
investment base, and ROE ultimately falls. The resulting behavior
of ROE and other measures of return on investment is
characterized as “mean-reverting”: firms with above-average or
below-average rates of return tend to revert over time to a
“normal” level (for ROE, historically in the range of 10 to 15
percent for U.S. firms) within no more than ten years.4 Figure
10-2 documents this effect for U.S. firms for 1979–1998. All
firms are ranked in terms of their ROE in 1979 (year 1) and
formed into five portfolios. Firms in portfolio 1 have the top
twenty percent ROE rankings in 1979, those in portfolio 2 fall
into the next twenty percent, and those in portfolio have the
bottom twenty percent sales growth ranks. The average ROE of
firms in each of these five portfolios is then traced through
nine subsequent years (years 2 to 10). The same experiment is
repeated with 1984 and 1989 as the base year (year 1), and the
subsequent years as years +2 to +10. until they reach a level of
13 percent in year 10. Three of the five portfolios record an
average ROE in the range of 13 to 15 percent by year 10, even
though they start out in year 1 with a wide range of average
ROEs. The pattern in Figure 10-2 is not a coincidence; it is
exactly what the economics of competition would predict. The34
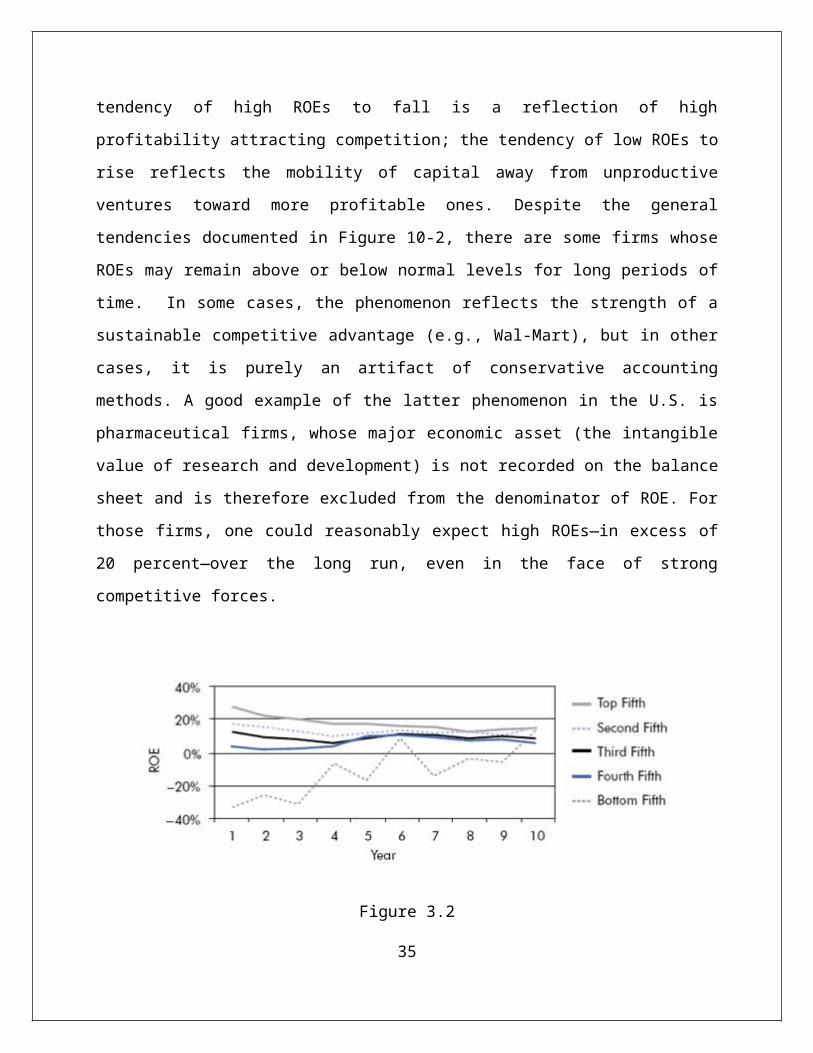
tendency of high ROEs to fall is a reflection of high
profitability attracting competition; the tendency of low ROEs to
rise reflects the mobility of capital away from unproductive
ventures toward more profitable ones. Despite the general
tendencies documented in Figure 10-2, there are some firms whose
ROEs may remain above or below normal levels for long periods of
time. In some cases, the phenomenon reflects the strength of a
sustainable competitive advantage (e.g., Wal-Mart), but in other
cases, it is purely an artifact of conservative accounting
methods. A good example of the latter phenomenon in the U.S. is
pharmaceutical firms, whose major economic asset (the intangible
value of research and development) is not recorded on the balance
sheet and is therefore excluded from the denominator of ROE. For
those firms, one could reasonably expect high ROEs—in excess of
20 percent—over the long run, even in the face of strong
competitive forces.
Figure 3.2
35
Behavior of ROE over time for U.S Companies for 1979-1998
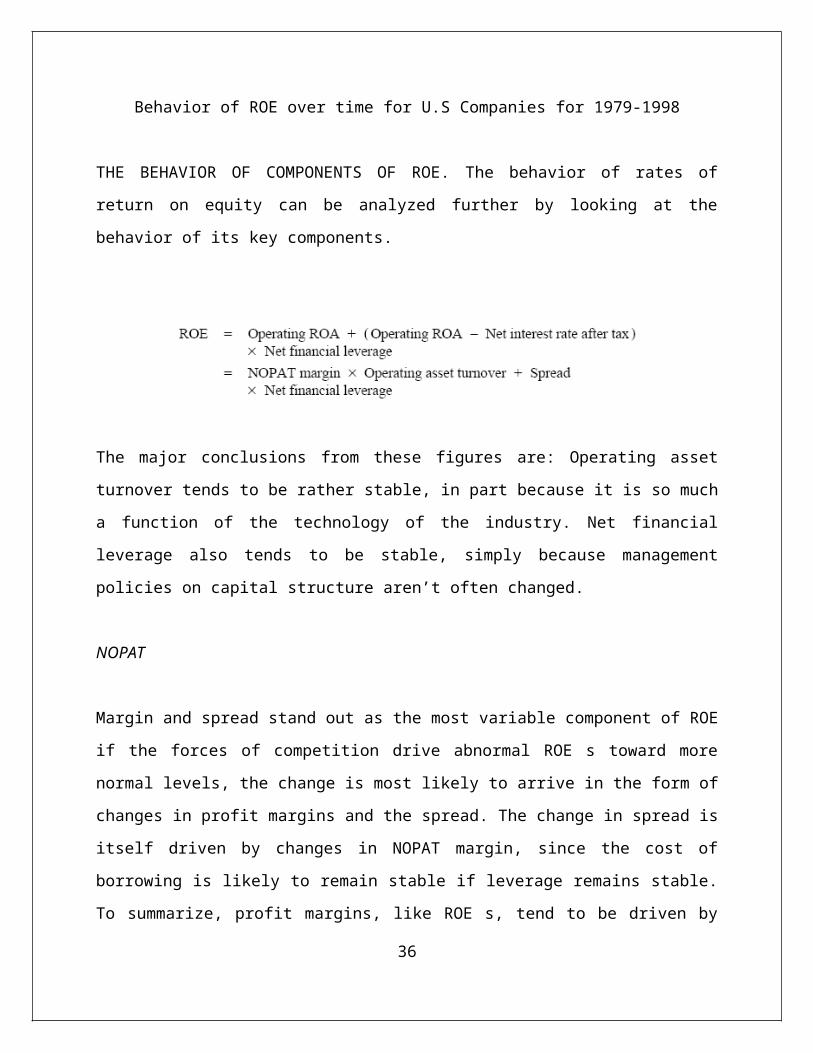
THE BEHAVIOR OF COMPONENTS OF ROE. The behavior of rates of
return on equity can be analyzed further by looking at the
behavior of its key components.
The major conclusions from these figures are: Operating asset
turnover tends to be rather stable, in part because it is so much
a function of the technology of the industry. Net financial
leverage also tends to be stable, simply because management
policies on capital structure aren’t often changed.
NOPAT
Margin and spread stand out as the most variable component of ROE
if the forces of competition drive abnormal ROE s toward more
normal levels, the change is most likely to arrive in the form of
changes in profit margins and the spread. The change in spread is
itself driven by changes in NOPAT margin, since the cost of
borrowing is likely to remain stable if leverage remains stable.
To summarize, profit margins, like ROE s, tend to be driven by
36
competition to “normal” levels over time. However, what
constitutes normal varies widely according to the technology
employed within an industry and the corporate strategy pursued by
the firm—both of which influence turnover and leverage. In a
fully competitive equilibrium, profit margins should remain high
for firms that must operate with a low turnover, and vice versa.
The implication of the above discussion of rates of return and
margins is that a reasonable point of departure for a forecast of
such a statistic should consider more than just the most recent
observation. One should also consider whether that rate or margin
is above or below a normal level. If so, then absent detailed
information to the contrary, one would expect some movement over
time to that norm. Of course, this central tendency might be
overcome in some cases—for example, where the firm has erected
barriers to competition that can protect margins, even for
extended periods. The lesson from the evidence, however, is that
such cases are unusual. In contrast to rates of return and
margins, it is reasonable to assume that asset turnover,
financial leverage, and net interest rate remain constant over
time. Unless there is an explicit change in technology or
financial policy being contemplated for future periods, a
reasonable point of departure for assumptions for these variables
is the current period level. As we proceed below with the steps
involved in producing a detailed forecast, the reader will note
that we draw on the above knowledge of the behavior of accounting
numbers to some extent. However, it is important to keep in mind37
that knowledge of average behavior will not fit all firms well.
The art of financial statements analysis requires not only
knowing what the “normal” patterns are but also expertise in
identifying those firms that will not follow the norm.
ELEMENTS OF THE DETAILED FORECAST
Here we summarize steps that could be followed in producing a
comprehensive forecast.The discussion assumes that the firm being
analyzed is among the vast majority for which the forecast would
reasonably be anchored by a sales forecast.
THE SALES FORECAST
The first step in most forecasting exercises is the sales
prediction. There is no generally accepted approach to
forecasting sales; the approach should be tailored to the context
and should reflect the factors considered in the prior steps of
the analysis. For example, for a large retail firm, a sales
forecast would normally consider the prior year’s sales,
increases due purely to expansion of the number of retail
outlets, and “comparable store growth,” which captures growth in
sales in already-existing stores. The forecast of growth might38
consider such factors as customer acceptance of new product
lines, marketing plans, changes in pricing strategies,
competitors’ behavior, and the expected state of the economy.
Another possible approach—and one that may represent the only
feasible approach when little history exists—is to estimate the
size of the target market, project the degree of market
penetration, and then consider how quickly that degree of
penetration can be achieved.
THE FORECAST OF EXPENSES AND EARNINGS
Expenses should be forecast item by item, since different
expenses may be driven by different factors. However, most major
expenses are clearly related to sales and are therefore naturally
framed as fractions of sales. These include cost of sales and
SG&A expenses. R&D need not track current sales closely; however,
R&D generally tracks sales at least roughly over the long run.
Other expenses are more closely related to drivers other than
sales. Interest expense is driven by debt levels and interest
rates. Depreciation expense should be forecast in a way
consistent with the firm’s depreciation policy; under straight-
line depreciation, the expense would tend to be a fairly stable
fraction of beginning depreciable plant. Tax provisions are
driven by pretax income and factors (such as tax rates applicable
to certain foreign subsidiaries) that have a permanent impact on
39
tax payments. Equity in the income of affiliates is determined by
whatever drives the affiliate’s earnings
THE FORECAST OF BALANCE SHEET ACCOUNTS
Since various balance sheet accounts may be driven by different
factors, they are usually best forecast individually. However,
several asset accounts, including operating working capital
accounts and operating long-term assets, are driven over the long
run by sales activity. Thus, these accounts can be forecast as
fractions of sales, allowing for any expected changes in the
efficiency of asset utilization. If management plans for capital
expenditures are known, they would clearly be useful in
forecasting plant assets. Liability and equity accounts will
depend on a variety of factors, including policies on capital
structure, dividends, and stock repurchases. While it is useful
to project balance sheet accounts in detail for some purposes, it
may be adequate sometimes to project a summary balance sheet that
contains major categories of assets and liabilities along the
lines discussed in the financial analysis chapter— operating
working capital, net operating long-term assets, net debt, and
shareholders’ equity. Such projections are useful for valuing a
company. One simple approach to projecting a summary balance
sheet is as follows: First, one can project operating working
capital and operating long-term assets by making assumptions
about these two asset categories as a fraction of sales. The sum40
of these two items is net operating assets. Next, by making an
assumption about net financial leverage (ratio of net debt to
equity), one can project the amount of debt and equity needed to
support these net operating assets. Therefore, to project summary
balance sheets, one needs to make only three critical
assumptions: ratio of operating working capital to sales, ratio
of operating long-term assets to sales, and the ratio of net debt
to equity.
SENSITIVITY ANALYSIS
The projections discussed thus far represent nothing more than a
“best guess.” Managers and analysts are typically interested in a
broader range of possibilities. For example, in considering the
likelihood that short-term financing will be necessary, it would
be wise to produce projections based on a more pessimistic view
of profit margins and asset turnover. Alternatively, an analyst
estimating the value of INFOSYS should consider the sensitivity
of the estimate to the key assumptions about sales growth, profit
margins, and asset utilization. There is no limit to the number
of possible scenarios that can be considered. One systematic
approach to sensitivity analysis is to start with the key
assumptions underlying a set of forecasts and then examine the
sensitivity to the assumptions with greatest uncertainty in a
given situation. For example, if a company has experienced a
variable pattern of gross margins in the past, it is important to41
make projections using a range of margins. Alternatively, if a
company has announced a significant change in its expansion
strategy, asset utilization assumptions might be more uncertain.
In determining where to invest one’s time in performing
sensitivity analysis, it is therefore important to consider
historical patterns of performance, changes in industry
conditions, and changes in a company’s competitive strategy.
COMPETITIVE FORCES THEORY – MICHAEL E. PORTER
Strategy analysis is an important starting point for the analysis
of financial statements. Strategy analysis allows the analyst to
probe the economics of the firm at a qualitative level so that
the subsequent accounting and financial analysis is grounded in
business reality. Strategy analysis also allows the
identification of the firm’s profit drivers and key risks. This,
in turn, enables the analyst to assess the sustainability of the
firm’s current performance and make realistic forecasts of future
performance. A firm’s value is determined by its ability to earn
a return on its capital in excess of the cost of capital. While a
firm’s cost of capital is determined by the capital markets, its
profit potential is determined by its own strategic choices: (1)
the choice of an industry or a set of industries in which the
firm operates (industry choice), (2) the manner in which the firm
intends to compete with other firms in its chosen industry or
industries (competitive positioning), and (3) the way in which42
the firm expects to create and exploit synergies across the range
of businesses in which it operates (corporate strategy). Strategy
analysis, therefore, involves industry analysis, competitive
strategy analysis, and corporate strategy analysis.
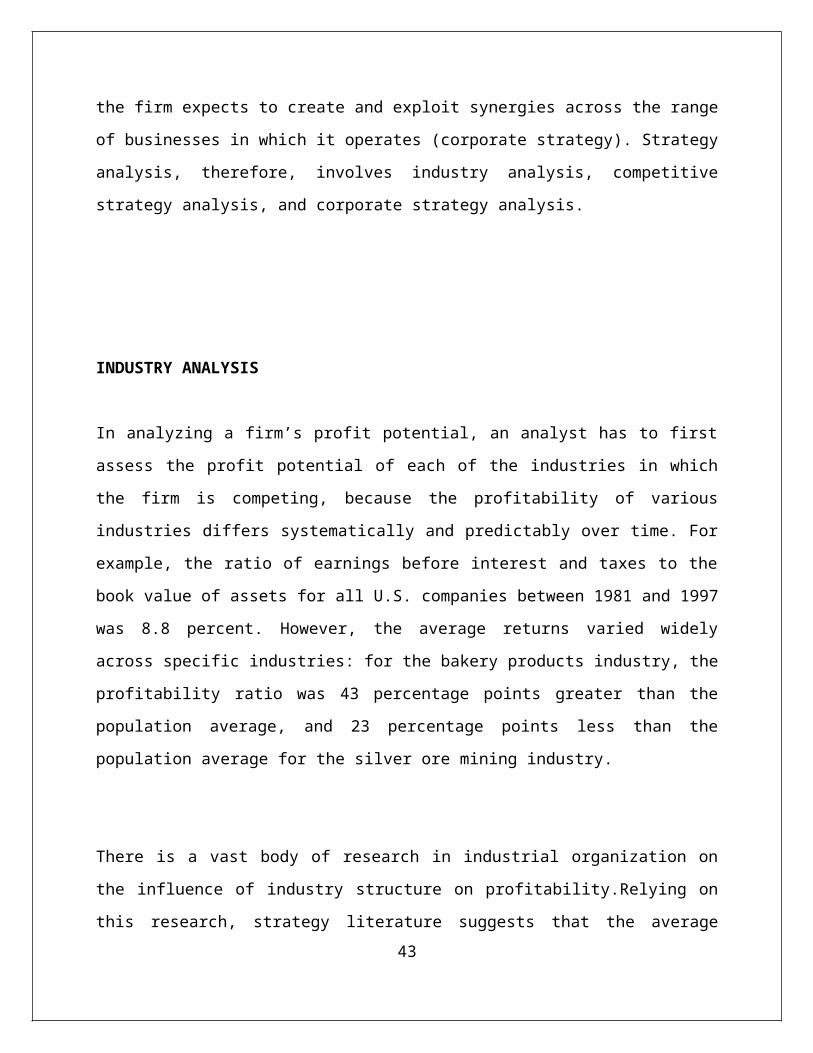
INDUSTRY ANALYSIS
In analyzing a firm’s profit potential, an analyst has to first
assess the profit potential of each of the industries in which
the firm is competing, because the profitability of various
industries differs systematically and predictably over time. For
example, the ratio of earnings before interest and taxes to the
book value of assets for all U.S. companies between 1981 and 1997
was 8.8 percent. However, the average returns varied widely
across specific industries: for the bakery products industry, the
profitability ratio was 43 percentage points greater than the
population average, and 23 percentage points less than the
population average for the silver ore mining industry.
There is a vast body of research in industrial organization on
the influence of industry structure on profitability.Relying on
this research, strategy literature suggests that the average43

profitability of an industry is influenced by the “five forces”
shown in Figure below. According to this framework, the intensity
of competition determines the potential for creating abnormal
profits by the firms in an industry. Whether or not the potential
profits are kept by the industry is determined by the relative
bargaining power of the
44
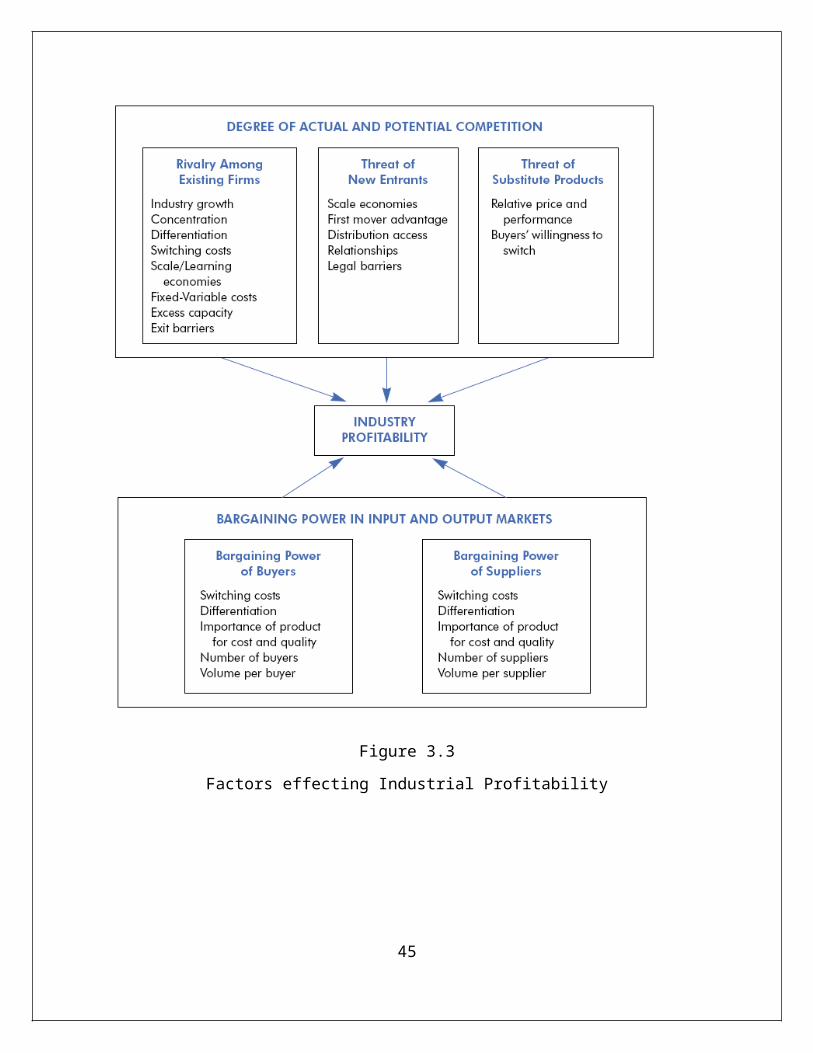
Figure 3.3
Factors effecting Industrial Profitability
45
COMPETITIVE FORCE 1: RIVALRY AMONG EXISTING FIRMS
In most industries, the average level of profitability is
primarily influenced by the nature
Of rivalry among existing firms in the industry. In some
industries, firms compete aggressively, pushing prices close to
(and sometimes below) the marginal cost. In other industries,
firms do not compete aggressively on price. Instead, they find
ways to coordinate their pricing, or compete on non price
dimensions, such as innovation or brand image. Several factors
determine the intensity of competition between existing players
in an industry
INDUSTRY GROWTH RATE
If an industry is growing very rapidly, incumbent firms need not
grab market share from each other to grow. In contrast, in
stagnant industries, the only way existing firms can grow is by
taking share away from the other players. In this situation, one
can expect price wars among firms in the industry.
CONCENTRATION AND BALANCE OF COMPETITORS
The number of firms in an industry and their relative sizes
determine the degree of concentration in an industry. The degree
of concentration influences the extent to which firms in an46
industry can coordinate their pricing and other competitive
moves. For example, if there is one dominant firm in an industry
(such as IBM in the mainframe computer industry in the 1970s), it
can set and enforce the rules of competition. Similarly, if there
are only two or three equal-sized players (such as Coke and Pepsi
in the U.S. soft-drink industry), they can implicitly cooperate
with each other to avoid destructive price competition. If an
industry is fragmented, price competition is likely to be severe.
DEGREE OF DIFFERENTIATION AND SWITCHING COSTS.
The extent to which firms in an industry can avoid head-on
competition depends on the extent to which they can differentiate
their products and services. If the products in an industry are
very similar, customers are ready to switch from one competitor
to another purely on the basis of price. Switching costs also
determine customers’ propensity to move from one product to
another. When switching costs are low, there is a greater
incentive for firms in an industry to engage in price
competition.
SCALE/LEARNING ECONOMIES AND THE RATIO OF FIXED TO VARIABLE COSTS.
If there is a steep learning curve or there are other types of
scale economies in an industry, size becomes an important factor
for firms in the industry. In such situations, there are47
incentives to engage in aggressive competition for market share.
Similarly, if the ratio of fixed to variable costs is high, firms
have an incentive to reduce prices to utilize installed capacity.
The airline industry, where price wars are quite common, is an
example of this type of situation.
EXCESS CAPACITY AND EXIT BARRIERS.
If capacity in an industry is larger than customer demand, there
is a strong incentive for firms to cut prices to fill capacity.
The problem of excess capacity is likely to be exacerbated if
there are significant barriers for firms to exit the industry.
Exit barriers are high when the assets are specialized, or if
there are regulations which make exit costly.
COMPETITIVE FORCE 2: THREAT OF NEW ENTRANTS
The potential for earning abnormal profits will attract new
entrants to an industry. The very threat of new firms entering an
industry potentially constrains the pricing of existing firms
within it. Therefore, the ease with which new firms can enter an
industry is a key determinant of its profitability. Several
factors determine the height of barriers to entry in an industry:
48
ECONOMIES OF SCALE.
When there are large economies of scale, new entrants face the
choice of having either to invest in a large capacity which might
not be utilized right away, or to enter with less than the
optimum capacity. Either way, new entrants will at least
initially suffer from a cost disadvantage in competing with
existing firms. Economies of scale might arise from large
investments in research and development (the pharmaceutical or
jet engine industries), in brand advertising (soft-drink
industry), or in physical plant and equipment (telecommunications
industry).
FIRST MOVER ADVANTAGE.
Early entrants in an industry may deter future entrants if there
are first mover advantages. For example, first movers might be
able to set industry standards, or enter into exclusive
arrangements with suppliers of cheap raw materials. They may also
acquire scarce government licenses to operate in regulated
industries. Finally, if there are learning economies, early firms
will have an absolute cost advantage over new entrants. First
mover advantages are also likely to be large when there are
significant switching costs for customers once they start using
existing products. For example, switching costs faced by the
49
users of Microsoft’s DOS operating system make it difficult for
software companies to market a new operating system.
ACCESS TO CHANNELS OF DISTRIBUTION AND RELATIONSHIPS.
Limited capacity in the existing distribution channels and high
costs of developing new channels can act as powerful barriers to
entry. For example, a new entrant into the domestic auto industry
in the U.S. is likely to face formidable barriers because of the
difficulty of developing a dealer network. Similarly, new
consumer goods manufacturers find it difficult to obtain
supermarket shelf space for their products. Existing
relationships between firms and customers in an industry also
make it difficult for new firms to enter an industry. Industry
examples of this include auditing, investment banking, and
advertising.
LEGAL BARRIERS
There are many industries in which legal barriers, such as
patents and copyrights in research-intensive industries, limit
entry. Similarly, licensing regulations limit entry into taxi
services, medical services, broadcasting, and telecommunications
industries.50
COMPETITIVE FORCE 3: THREAT OF SUBSTITUTE PRODUCTS
The third dimension of competition in an industry is the threat
of substitute products or services. Relevant substitutes are not
necessarily those that have the same form as the existing
products, but those that perform the same function. For example,
airlines and car rental services might be substitutes for each
other when it comes to travel over short distances. Similarly,
plastic bottles and metal cans substitute for each other as
packaging in the beverage industry. In some cases, threat of
substitution comes not from customers’ switching to another
product but from utilizing technologies that allow them to do
without, or use less of, the existing products. For example,
energy-conserving technologies allow customers to reduce their
consumption of electricity and fossil fuels. The threat of
substitutes depends on the relative price and performance of the
competing products or services, and on customers’ willingness to
substitute. Customers’ perception of whether two products are
substitutes depends to some extent on whether they perform the
same function for a similar price. If two products perform an
identical function, then it would be difficult for them to differ
from each other in price. However, customers’ willingness to
switch is often the critical factor in making this competitive
dynamic work. For example, even when tap water and bottled water
serve the same function, many customers may be unwilling to51
substitute the former for the latter, enabling bottlers to charge
a price premium. Similarly, designer label clothing commands a
price premium even if it is not superior in terms of basic
functionality, because customers place a value on the image
offered by designer labels.
RELATIVE BARGAINING POWER IN INPUT AND OUTPUT MARKETS
While the degree of competition in an industry determines whether
or not there is Potential to earn abnormal profits, the actual profits
are influenced by the industry’s bargaining power with its
suppliers and customers. On the input side, firms enter into
transactions with suppliers of labor, raw materials and
components, and finances. On the output side, firms either sell
directly to the final customers, or enter into contracts with
intermediaries in the distribution chain. In all these
transactions, the relative economic power of the two sides is
important to the overall profitability of the industry firms.
COMPETITIVE FORCE 4: BARGAINING POWER OF BUYERS
Two factors determine the power of buyers: price sensitivity and
relative bargaining power. Price sensitivity determines the
extent to which buyers care to bargain on price; relative
bargaining power determines the extent to which they will succeed
in forcing the price down.52
PRICE SENSITIVITY. Buyers are more price sensitive when the
product is undifferentiated and there are few switching costs.
The sensitivity of buyers to price also depends on the importance
of the product to their own cost structure. When the product
represents a large fraction of the buyers’ cost (for example, the
packaging material for soft-drink producers), the buyer is likely
to expend the resources necessary to shop for a lower cost
alternative. In contrast, if the product is a small fraction of
the buyers’ cost (for example, windshield wipers for automobile
manufacturers), it may not pay to expend resources to search for
lower-cost alternatives. Further, the importance of the product
to the buyers’ product quality also determines whether or not
price becomes the most important determinant of the buying
decision.
RELATIVE BARGAINING POWER
Even if buyers are price sensitive, they may not be able to
achieve low prices unless they have a strong bargaining position.
Relative bargaining power in a transaction depends, ultimately,
on the cost to each party of not doing business with the other
party. The buyers’ bargaining power is determined by the number
of buyers relative to the number of suppliers, volume of
purchases by a single buyer, number of alternative products
available to the buyer, buyers’ costs of switching from one53
product to another, and the threat of backward integration by the
buyers. For example, in the automobile industry, car
manufacturers have considerable power over component
manufacturers because auto companies are large buyers, with
several alternative suppliers to choose from, and switching costs
are relatively low. In contrast, in the personal computer
industry, computer makers have low bargaining power relative to
the operating system software producers because of high switching
costs.
COMPETITIVE FORCE 5: BARGAINING POWER OF SUPPLIERS
The analysis of the relative power of suppliers is a mirror image
of the analysis of the buyer’s power in an industry. Suppliers
are powerful when there are only a few companies and there are
few substitutes available to their customers. For example, in the
soft- drink industry, Coke and Pepsi are very powerful relative
to the bottlers. In contrast, metal can suppliers to the soft
drink industry are not very powerful because of intense
competition among can producers and the threat of substitution of
cans by plastic bottles. Suppliers also have a lot of power over
buyers when the suppliers’ product or service is critical to
buyers’ business. For example, airline pilots have a strong
bargaining power in the airline industry. Suppliers also tend to
be powerful when they pose a credible threat of forward
integration. For example, IBM is powerful relative to mainframe54
computer leasing companies because of IBM’s unique position as a
mainframe supplier, and its own presence in the computer leasing
business.
COMPETITIVE STRATEGY ANALYSIS
The profitability of a firm is influenced not only by its
industry structure but also by the strategic choices it makes in
positioning itself in the industry. While there are many ways to
characterize a firm’s business strategy, as Figure 2-2 shows,
there are two generic competitive strategies: (1) cost leadership
and (2) differentiation. Both these strategies can potentially
allow a firm to build a sustainable competitive advantage.
STRATEGIES FOR CREATING COMPETITIVE ADVANTAGE
Strategy researchers have traditionally viewed cost leadership
and differentiation as mutually exclusive strategies. Firms that
straddle the two strategies are considered to be “stuck in the
middle” and are expected to earn low profitability. These firms
run the risk of not being able to attract price conscious
customers because their costs are too high; they are also unable
to provide adequate differentiation to attract premium price
customers.
55

56
CHAPTER 4
RESEARCH METHODOLOGY:
The Indian economy is growing at a rate never achieved in the
past. The Auto sector is undoubtedly one of the fastest growing
sectors, creating global giants of tomorrow like Tata Motors,
Ashok Leyland, Mahindra & Mahindra. So I have analysed the Auto
sector to support the rationale behind investing in this sector.
As per my analysis, Tata Motors clearly holds the competitive
advantage among the top Auto players, so I undertook a detailed
valuation by making use of the following research methods. I used
of top down approach for stock selection. The intention behind
fundamental analysis is find out the intrinsic worth of the
stock. Economic, industry and company analysis has been done to
justify our basic aim of top to bottom approach of stock
selection.
I have tried to do the fundamental Analysis in this project.
Fundamental Analysis consists of three parts
1. Economic Analysis : In this I have tried to study the past
and future scenario of Indian Economy and have used various
economic indicators to do so .Some of them are GDP growth
rate , Per capita GDP , Fiscal deficit etc.
2. Industry Analysis: In this I have tried to study the world
Auto Industry, Indian auto industry, Also did the comparison
57
of different players in the industry. I have also mentioned
whole of the sector financials and major ratios and there
growth over the past three years. I also studied the auto
industries key points and on the basis of that did the
porter analysis of the whole Industry.
3. Company Analysis : In this I have studied the whole
company’s business profile , tried to study the past
financial statements and on the basis of that I have
projected the future 5 years financial statements and the
balance sheet . I have also analyzed the expected major
ratio which company would keep in the future and have
compared them with the past . To find out the intrinsic
value of the stock I have used Discounted Cash flow
technique. In discounted Cash flow techniques the major
method which I have used in this project is Free Cash Flow
to Equity
SOURCES OF DATA COLLECTION
The primary source of data were Tata Motors annual reports and
official company website www.Tatamotors.com
The other sources of data collection are mainly secondary like,
journals, newspapers, research reports, capital market service
providers, available literature, estimation of analysts, annual
reports. Here an indicative list is presented
58
National Stock Exchange
Bombay Stock Exchange
Economic and political weekly
Capital market line magazine
Religare Securities Pvt Ltd.
Security Exchange Board of India
Ministry of Finance
Economic Survey ( third quarter 2006-2007)
Moneytary policy review (Reserve Bank of India)
Nasscom-Mckinsey reports
CHAPTER 5
ANALYSIS AND INTERPRETATION
59
ECONOMY ANALYSIS
STATE OF ECONOMY
The economy has moved decisively to a higher growth phase. Till a
few years ago, there was still a debate among informed observers
about whether the economy had moved above the 5 to 6 per cent
average growth seen since the 1980s. There is now no doubt that
the economy has moved to a higher growth plane, with growth in
GDP at market prices exceeding 8 per cent in every year since
2003-04. The projected economic growth of 8.7 per cent for 2007-
08 is fully in line with this trend. There was acceleration in
domestic investment and saving rates to drive growth and provide
the resources for meeting the 9 per cent (average) growth target
of the Eleventh Five-Year Plan. Macroeconomic fundamentals
continue to inspire confidence and the investment climate is full
of optimism. Buoyant growth of government revenues made it
possible to maintain fiscal consolidation as mandated under the
Fiscal Responsibility and Budget Management Act (FRBMA). The
decisive change in growth trend also means that the economy was,
perhaps, not fully prepared for the different set of challenges
that accompany fast growth. Inflation flared up in the last half
of 2006-07 and was successfully contained during the current
year, despite a global hardening of commodity prices and an
upsurge in capital inflows. An appreciation of the rupee, a
slowdown in the consumer goods segment of industry and
Infrastructure (both physical and social) constraints, remained60
of concern. Raising growth to double digit will therefore require
additional reforms.
PER CAPITA INCOME:
Growth is of interest not for its own sake but for the
improvement in public welfare that it brings about. Economic
growth, and in particular the growth in per capita income, is a
broad quantitative indicator of the progress made in improving
public welfare. Per capita consumption is another quantitative
indicator that is useful for judging welfare improvement. It is
therefore appropriate to start by looking at the changes in real
(i.e. at constant prices) per capita income and consumption. The
pace of economic improvement has moved up considerably during the
last five years (including 2007-08). The rate of growth of per
capita income as measured by per capita GDP at market prices
(constant 1999-2000 prices) grew by an annual average rate of 3.1
per cent during the 12- year period, 1980-81 to 1991-92. It
accelerated marginally to 3.7 per cent per annum during the next
11 years, 1992-93 to 2002-03. Since then there has been a sharp
acceleration in the growth of per capita income, almost doubling
to an average of 7.2 per cent per annum (2003-04 to 2007-08). The
growth rate of per capita income in 2007-08 is projected to be
7.2 per cent, the same as the average of the five years to the
current year.
61
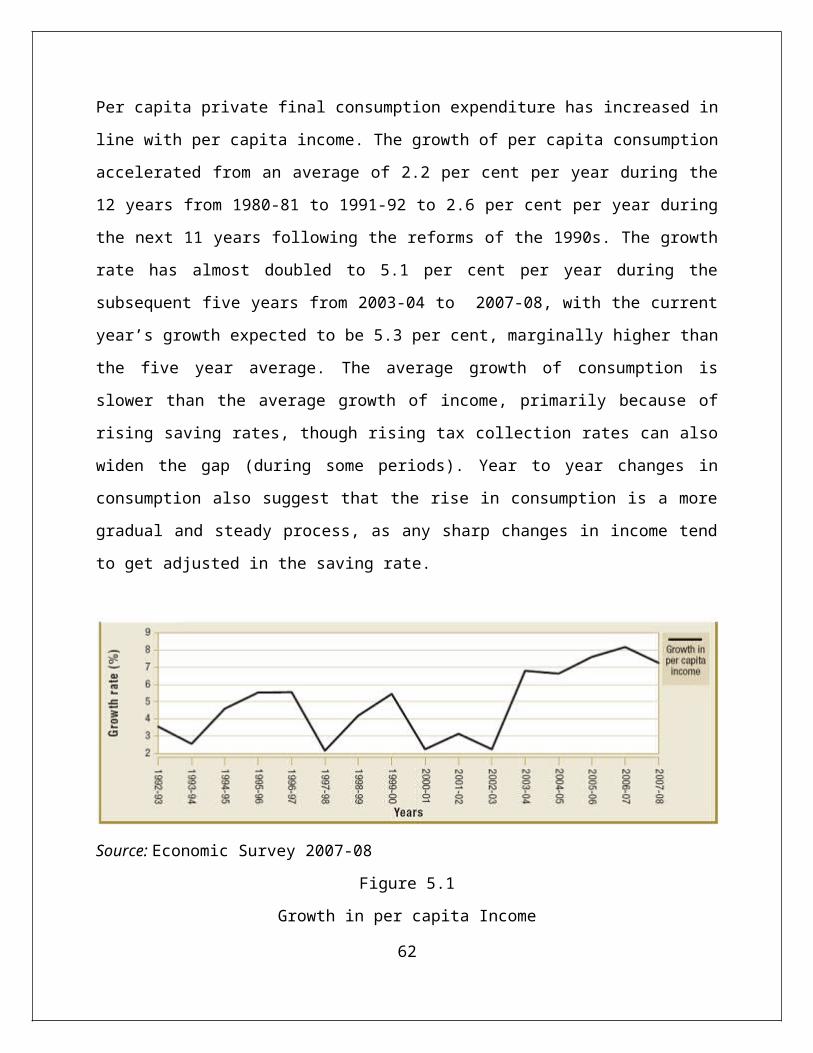
Per capita private final consumption expenditure has increased in
line with per capita income. The growth of per capita consumption
accelerated from an average of 2.2 per cent per year during the
12 years from 1980-81 to 1991-92 to 2.6 per cent per year during
the next 11 years following the reforms of the 1990s. The growth
rate has almost doubled to 5.1 per cent per year during the
subsequent five years from 2003-04 to 2007-08, with the current
year’s growth expected to be 5.3 per cent, marginally higher than
the five year average. The average growth of consumption is
slower than the average growth of income, primarily because of
rising saving rates, though rising tax collection rates can also
widen the gap (during some periods). Year to year changes in
consumption also suggest that the rise in consumption is a more
gradual and steady process, as any sharp changes in income tend
to get adjusted in the saving rate.
Source: Economic Survey 2007-08
Figure 5.1
Growth in per capita Income
62
ECONOMIC GROWTH:
GDP at current market prices is projected at Rs. 46,93,602 crore
in 2007-08 by the Central Statistical Organisation (CSO) in its
advance estimates (AE) of Gross Domestic Product. Thus, in the
current fiscal year, the size of the Indian economy at market
exchange rate will cross US$ 1 trillion. At the nominal exchange
rate (average of April-December 2007) GDP is projected to be US$
1.16 trillion in 2007-08. Per capita income at nominal exchange
rate is estimated at US$ 1,021. According to the World Bank
system of classification of countries as low income, middle
income and high income, India is still in the category of low
income countries.
The (per capita) GDP at purchasing power parity is conceptually a
better indicator of the relative size of the economy than the
(per capita) GDP at market exchange rates. There are, however,
practical difficulties in deriving GDP at PPP, and we now have
two different estimates of the PPP conversion factor for 2005.
India’s GDP at PPP is estimated at US$ 5.16 trillion or US$ 3.19
trillion depending on whether the old or new conversion factor is
used. In the former case, India is the third largest economy in
the world after the United States and China, while in the latter
it is the fifth largest (behind Japan and Germany).
63
GDP at factor cost at constant 1999-2000 prices is projected by
the CSO to grow at 8.7 per cent in 2007-08. This represents a
deceleration from the unexpectedly high growth of 9.4 per cent
and 9.6 per cent, respectively, in the previous two years. With
the economy modernizing, globalizing and growing rapidly, some
degree of cyclical fluctuation is to be expected. This was taken
into account while setting the Eleventh Five Year Plan (2007-08
to 2011-12) growth target of 9 per cent (both in the approach
paper and in the NDC approved plan). Given the over 9 per cent
growth in the last two years of the Tenth Five Year Plan it was
argued that the Eleventh Five Year Plan target could be set at 10
to 11 per cent as 9 per cent had already been achieved.
Maintaining growth rate at 9 per cent will be a challenge and
raising it to two digits will be an even greater one.
The deceleration of growth in 2007-08 is generally spread across
most of the sectors except electricity, community services and
the composite category “trade, hotels, transport &
communications”. The deceleration in the growth of the
agriculture sector is attributed to the slackening in the growth
of rabi crops. Manufacturing and construction, which grew at 12
per cent in 2006-07, decelerated by about 2.5 percentage points
in 2007-08. The slower growth of consumer durables (as reflected
in the IIP) was the most important factor in the slowdown of
manufacturing. Cement and steel, the key inputs into
construction, grew by 7.4 per cent and 6.5 per cent respectively,64
during April-November 2007- 08, down from 10.8 per cent and 11.2
per cent in the previous year,dampening the growth in the
construction sector. There was also a deceleration in the growth
of revenue earning freight traffic by railways, passengers
handled at airports, and bank credit in April-November 2007-08,
which formed the basis for the full year assessment.
Growth in 2006-07 initially estimated at 9.2 per cent in February
2007 was revised upwards to 9.4 per cent in May 2007 and further
to 9.6 per cent in the Quick Estimates released by the CSO on
January 31, 2008. This suggests that upward adjustments in the
2007-08 projections are possible.
The observed growth of 7.8 per cent in the Tenth Five Year Plan
(2002-07), the highest so far for any plan period, is only
marginally short of the target of 8 per cent. The dismal growth
rate of 3.8 per cent during the first year of the plan was made
up by an upsurge in growth in the next four years to an average
of 8.8 per cent. A notable feature of growth during the Tenth
Five Year Plan was the resurgence of manufacturing. There was a
sharp acceleration in the growth of manufacturing from 3.3 per
cent during the Ninth Five Year Plan to 8.6 per cent during the
Tenth Five Year Plan. The average growth of manufacturing during
the five years ending 2007-08 is expected to be about 9.1 per
cent. The contribution of manufacturing to overall growth
increased from about 9.6 per cent during the Ninth Five Year Plan65
to about 17.7 per cent during the Tenth Five Year Plan. The
growth in the services sector continued to be broad based. Among
the subsectors of services, “transport and communication” has
been the fastest growing with growth averaging 15.3 per cent per
annum during the Tenth Five Year Plan period followed by
“construction”. The impressive progress in the telecommunication
sector and higher growth in rail, road and port traffic played an
important role in the growth of this sector. Besides
manufacturing the two other sectors whose contribution to growth
has increased over the two plans are construction and
communications. The contribution of the construction sector
increased to 10.8 per cent during the Tenth Five Year Plan from
7.5 per cent during the Ninth Five Year Plan, while that of
telecom increased to 11.4 per cent from 6 per cent over the two
plans. The growth of “financial services” comprising banking,
insurance and business services, after declining to 5.6 per cent
in 2003-04 bounced back to 8.7 per cent in 2004- 05, 11.4 per
cent in 2005-06 and 13.9 per cent in 2006-07. Manufacturing,
construction and communication were the leading sectors in the
acceleration of growth during the Tenth Five Year Plan, judged by
their increased contribution to growth.
Ninth Five Year Plan. Weather induced fluctuations considerably
influenced the GDP growth for
agriculture. In 2002-03, the cumulative rainfall of North-East
and South-West monsoon was -33 per cent and -19 per cent,66
respectively, of the long period averages (LPA). Similarly, in
2004-05, the cumulative rainfall was -13 per cent and -11 per
cent from LPA for South-West and North-East monsoon,
respectively. The secular decline in the share of agriculture
sector in GDP continued, with a decline from 24 per cent in 2001-
02 to 17.5 per cent in 2007-08.
AGGREGATE DEMAND
The most important contribution to demand growth has come from
investment, while the external trade made negligible or negative
contribution. The growth of GDP at market prices accelerated from
3.8 per cent in 2002-03 to 9.7 per cent in 2006-07, giving an
average annual growth of 7.9 per cent for the Tenth Five Year
Plan. The average rate of growth of gross capital formation
during the Tenth Five Year Plan has more than tripled to 17.3 per
cent per year from an average growth of 5.3 per cent per annum in
the Ninth Five Year Plan. Consequently, its contribution to
overall demand, as measured by the increase in GDP at market
prices, tripled from 19 per cent in the Ninth Five Year Plan to
65 per cent in the Tenth Five Year Plan. The most important
component of investment, namely, gross fixed investment, grew by
an average of 14.3 per cent per annum during the Tenth Five Year
Plan period.
67
The relative share of private consumption in GDP was 60.9 per
cent while gross fixed capital formation had a share of 27 per
cent. Though the average growth of private consumption (PFCE)
accelerated somewhat to 5.9 per cent per annum from 5 per cent,
its contribution to growth of demand declined from 59 per cent to
46 per cent between the two plans. The contribution of net
exports of goods and services to overall demand also declined
between the two plans to a negative 5 per cent. Thus the external
trade has had a dampening effect on aggregate demand during the
just completed plan. Export growth, because of its spillover
effects on productivity and efficiency, can, however, still act
as a driver of growth.
NAS projections for 2007-08 show a deceleration in the GDP growth
at market prices in line with its growth at factor cost. They
also show a deceleration in the growth of consumption, both
public and private, and acceleration in the rate of growth of
gross fixed capital formation. The higher growth in the gross
capital formation is projected to improve its share in GDP at
market prices to 32.6 per cent in 2007-08 compared to a share of
23.6 per cent in 2002-03. GDCF is projected to grow by 20 per
cent and PFCE at 6.8 per cent in 2007-08, both of them above the
average of the just completed plan.
SAVINGS AND INVESTMENT
68
A notable feature of the recent GDP growth has been a sharply
rising trend in gross domestic investment and saving, with the
former rising by 13.1 per cent of GDP and the latter by 11.3 per
cent of GDP over five years till 2006-07. The average investment
ratio for the Tenth Five Year Plan at 31.4 per cent was higher
than that for the Ninth Five Year Plan, while the average saving
rate was also 31.4 per cent of GDP higher than the average ratio
of 23.6 per cent during the Ninth Five Year Plan.
The 1990s reforms transformed the investment climate, improved
business confidence and generated a wave of entrepreneurial
optimism. This has led to a gradual improvement in
competitiveness of the entire corporate sector, resurgence in the
manufacturing sector and acceleration in the rate of investment.
The FRBMA mandated fiscal correction path was also helpful in
raising the credibility of the Government with respect to fiscal
deficits, in which India was at the bottom of global rankings.
This has improved perceptions about the long-term macroeconomic
stability of the economy. Moderate tax rates, coupled with
buoyant sales growth, increased the internal accruals of the
corporate sector.
The improved investment climate and strong macro fundamentals
also led to an upsurge in foreign direct investment. The combined
effect of these factors was reflected in an increase in the
investment rate from 25.2 per cent of GDP in the first year of69
the Tenth Five Year Plan to 35.9 per cent of GDP in the last
year. The higher investment was able to absorb the domestic
savings and also generated an appetite for absorption of capital
inflows from abroad.
Gross domestic savings as a proportion of GDP continued to
improve, rising from 26.4 per cent in 2002-03 to 34.8 per cent in
2006-07 with an average of 31.4 per cent during the Tenth Five
Year Plan. The savings-investment gap which remained positive
during 2001-04 became negative thereafter. In a modern economy,
the excess of domestic saving over domestic investment suggests a
deflationary situation in which demand has not kept pace with
increased capacity. Thus the reversal of the saving-investment
balance should be viewed as a correction of the domestic supply-
demand balance, occurring through above normal (and welcome)
increase in demand during 2005-06 and 2006-07.
SAVINGS
Both private and public savings have contributed to higher
overall savings. Private savings have risen by 6.1 per cent
points of GDP over the Tenth Five Year Plan period while public
sector savings increased by 5.2 per cent of GDP. Both have
increased steadily over this period, though private savings
appear to have reached a plateau in 2005-06 (Table 1.5). The
savings from the private corporate sector were particularly
buoyant, while the turnaround in public sector savings from70
negative to positive from 2003-04 onwards is heartening. The
increase in private savings is due to a (more than) doubling of
the rate of corporate saving over the plan period. Savings of the
household sector were stable at 23 to 24 per cent of GDP,
averaging 23.7 per cent during the Tenth Five Year Plan. The
physical and financial components of the household savings also
remained stable. With the upsurge in private corporate and public
sector savings, the share of the household sector in gross
domestic savings declined from 94.3 per cent in 2001-02 to 68.4
per cent in 2006-07.
INDUSTRY
The first eight months of the current fiscal, till November 2007,
witnessed a moderate slowdown in the growth of the industrial
sector. The slowdown has mainly been on account of the
manufacturing sector. The mining and quarrying sector grew at a
faster pace, while the growth in
electricity remained unchanged from April-November 2006.
Nonetheless, the 9.2 per cent growth achieved during April-
November 2007 by the industrial sector, when seen against the
backdrop of the robust growth during the preceding four years,
suggests that the buoyancy in this
sector has continued, albeit with a degree of moderation71
Two important changes have occurred in the growth pattern of the
use-based industrial categories during April-November 2007
compared to the corresponding period in 2006 (Table 8.2). First,
capital goods have grown at an accelerated pace, over a high base
attained in the previous years, which augurs well for the
required industrial capacity addition. Secondly, the consumer
durables basket that forms part of the Index of Industrial
Production (IIP) showed a negative growth during the period,
thereby forcing a visible decline in the growth of the total
consumer goods basket, despite reasonable growth in the non-
durables. The contrasting patterns of growth in capital goods and
consumer durables
Only one out of the 17 two-digit industrial groups — metal
products & parts -- recorded a negative growth during April-
November 2007. Of the remaining 16 industry groups, four have
registered growth of less than 5 per cent, five have registered
growth rates between 5 per cent and 10 per cent and four have
registered growth rates between 10 per cent and 15 per cent. The
remaining three industry groups, namely, “other manufacturing
industries”, “basic metal and alloy industries” and “wood and
wood products", "furniture and fixtures”, which together
accounted for 12.8 per cent weight of the IIP, recorded growth
rates in excess of 15 per cent.
72
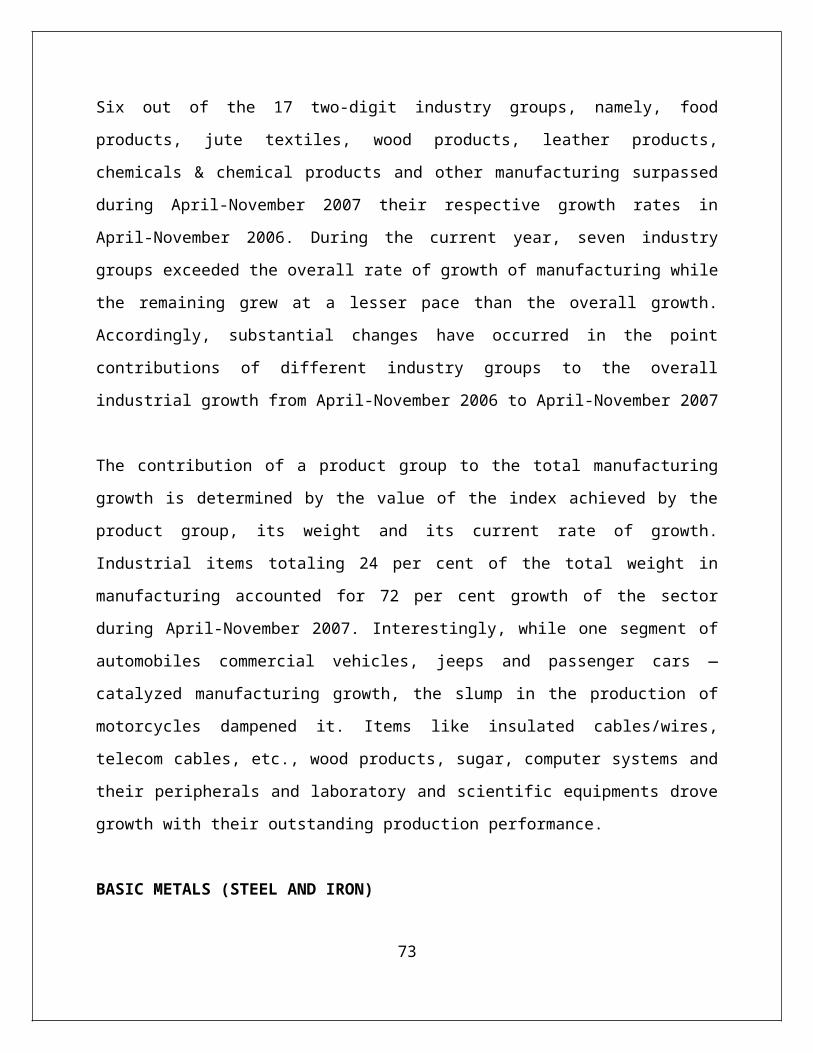
Six out of the 17 two-digit industry groups, namely, food
products, jute textiles, wood products, leather products,
chemicals & chemical products and other manufacturing surpassed
during April-November 2007 their respective growth rates in
April-November 2006. During the current year, seven industry
groups exceeded the overall rate of growth of manufacturing while
the remaining grew at a lesser pace than the overall growth.
Accordingly, substantial changes have occurred in the point
contributions of different industry groups to the overall
industrial growth from April-November 2006 to April-November 2007
The contribution of a product group to the total manufacturing
growth is determined by the value of the index achieved by the
product group, its weight and its current rate of growth.
Industrial items totaling 24 per cent of the total weight in
manufacturing accounted for 72 per cent growth of the sector
during April-November 2007. Interestingly, while one segment of
automobiles commercial vehicles, jeeps and passenger cars —
catalyzed manufacturing growth, the slump in the production of
motorcycles dampened it. Items like insulated cables/wires,
telecom cables, etc., wood products, sugar, computer systems and
their peripherals and laboratory and scientific equipments drove
growth with their outstanding production performance.
BASIC METALS (STEEL AND IRON)
73
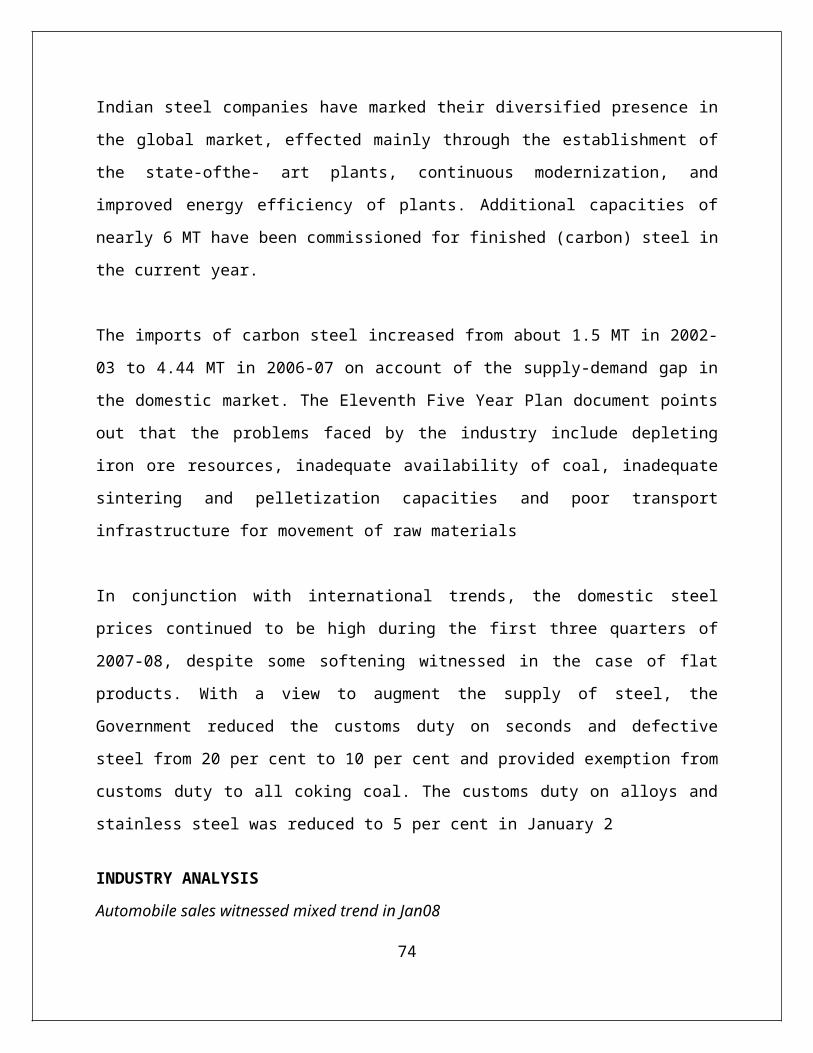
Indian steel companies have marked their diversified presence in
the global market, effected mainly through the establishment of
the state-ofthe- art plants, continuous modernization, and
improved energy efficiency of plants. Additional capacities of
nearly 6 MT have been commissioned for finished (carbon) steel in
the current year.
The imports of carbon steel increased from about 1.5 MT in 2002-
03 to 4.44 MT in 2006-07 on account of the supply-demand gap in
the domestic market. The Eleventh Five Year Plan document points
out that the problems faced by the industry include depleting
iron ore resources, inadequate availability of coal, inadequate
sintering and pelletization capacities and poor transport
infrastructure for movement of raw materials
In conjunction with international trends, the domestic steel
prices continued to be high during the first three quarters of
2007-08, despite some softening witnessed in the case of flat
products. With a view to augment the supply of steel, the
Government reduced the customs duty on seconds and defective
steel from 20 per cent to 10 per cent and provided exemption from
customs duty to all coking coal. The customs duty on alloys and
stainless steel was reduced to 5 per cent in January 2
INDUSTRY ANALYSIS
Automobile sales witnessed mixed trend in Jan08
74
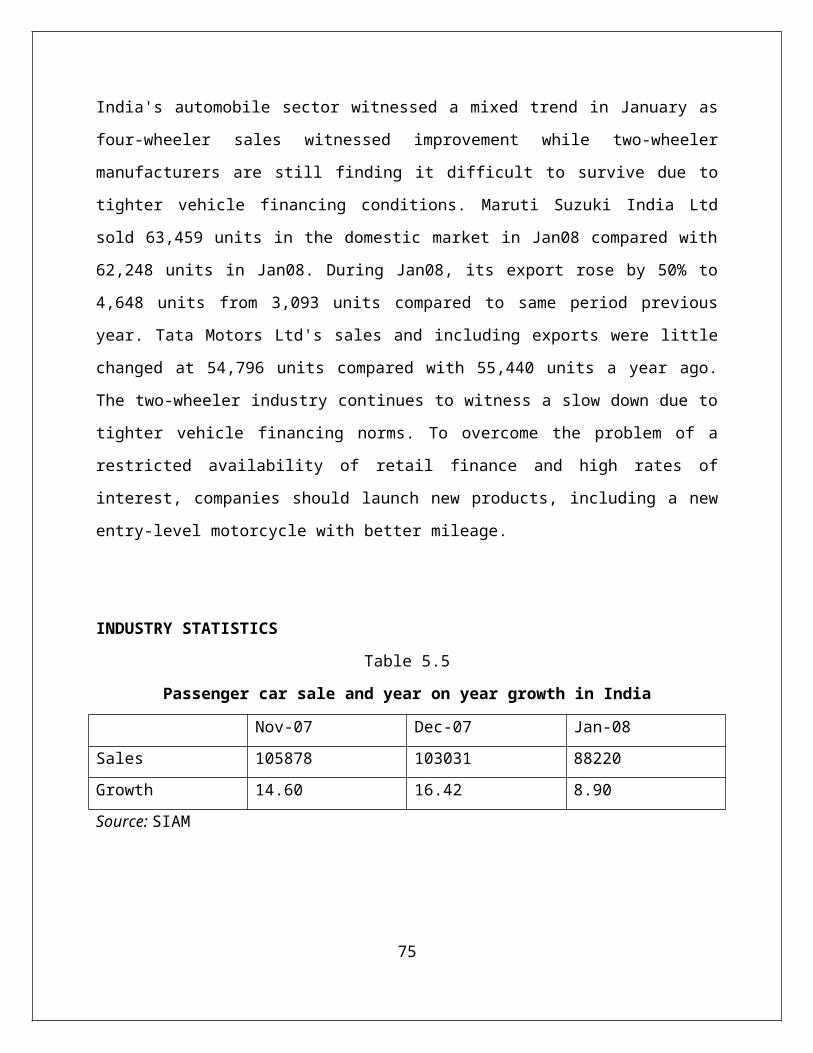
India's automobile sector witnessed a mixed trend in January as
four-wheeler sales witnessed improvement while two-wheeler
manufacturers are still finding it difficult to survive due to
tighter vehicle financing conditions. Maruti Suzuki India Ltd
sold 63,459 units in the domestic market in Jan08 compared with
62,248 units in Jan08. During Jan08, its export rose by 50% to
4,648 units from 3,093 units compared to same period previous
year. Tata Motors Ltd's sales and including exports were little
changed at 54,796 units compared with 55,440 units a year ago.
The two-wheeler industry continues to witness a slow down due to
tighter vehicle financing norms. To overcome the problem of a
restricted availability of retail finance and high rates of
interest, companies should launch new products, including a new
entry-level motorcycle with better mileage.
INDUSTRY STATISTICS
Table 5.5
Passenger car sale and year on year growth in India
Nov-07 Dec-07 Jan-08Sales 105878 103031 88220Growth 14.60 16.42 8.90Source: SIAM
75
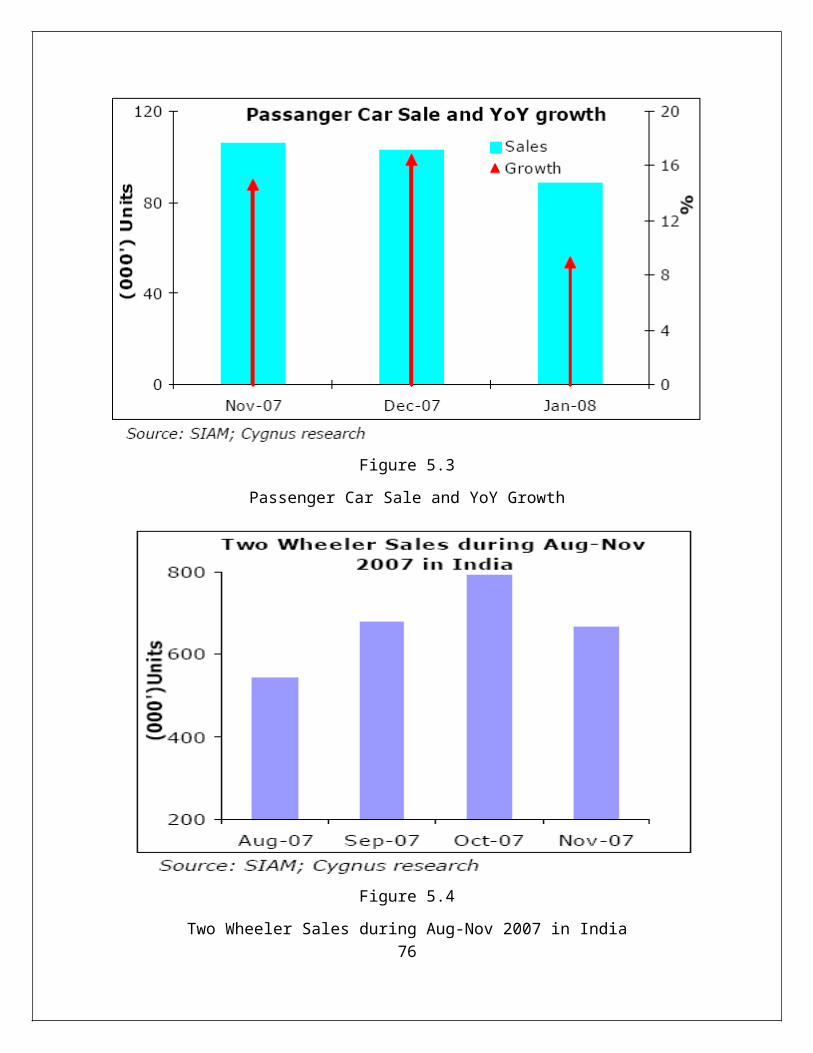
Figure 5.3
Passenger Car Sale and YoY Growth
Figure 5.4
Two Wheeler Sales during Aug-Nov 2007 in India76
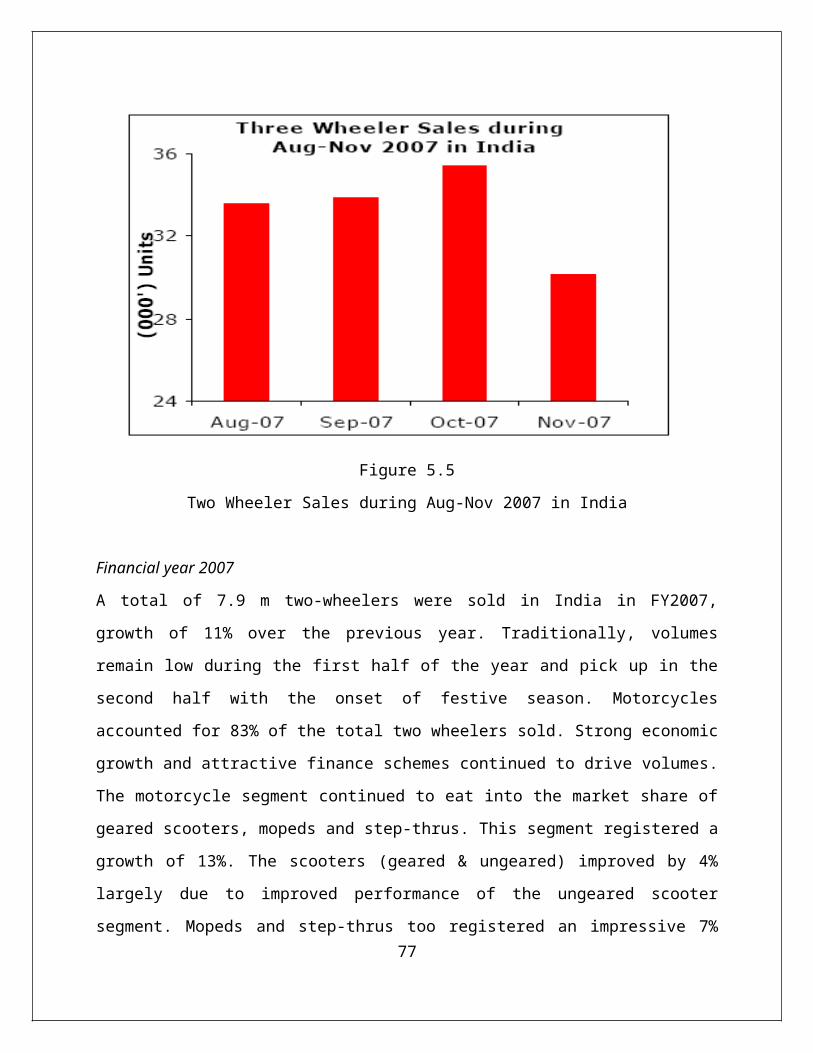
Figure 5.5
Two Wheeler Sales during Aug-Nov 2007 in India
Financial year 2007
A total of 7.9 m two-wheelers were sold in India in FY2007,
growth of 11% over the previous year. Traditionally, volumes
remain low during the first half of the year and pick up in the
second half with the onset of festive season. Motorcycles
accounted for 83% of the total two wheelers sold. Strong economic
growth and attractive finance schemes continued to drive volumes.
The motorcycle segment continued to eat into the market share of
geared scooters, mopeds and step-thrus. This segment registered a
growth of 13%. The scooters (geared & ungeared) improved by 4%
largely due to improved performance of the ungeared scooter
segment. Mopeds and step-thrus too registered an impressive 7%77
increase in sales. Manufacturers continued to shift focus from
this segment, realising its limited growth potential. The 3-
wheeler segment clocked an impressive growth of 12% backed by 14%
rise in demand for goods carrier. The passenger segment on the
other hand grew by 11%.
The medium and heavy commercial vehicles (M/HCVs) grew by an
impressive 33%. For the sixth year in a row, this segment notched
up robust growth in volumes, led by multi-axle vehicles, tractor-
trailers and tippers. Availability of freight and low cost retail
finance continued to fuel growth. LCVs on the other hand,
outperformed their HCV peers marginally as volumes grew 34%. The
growth in the segment was largely propelled by ‘Ace’, the sub one
tonner from Tata Motors, whose volumes stood at nearly 75,000
units.
The tractor industry registered a growth of 17% YoY. Riding on
the wave of structural changes, the industry continued on the
growth path during the year. Favorable monsoon, higher farm
support prices and greater disbursal of micro finance loans drove
tractor sales in the country. The utility and multi-purpose
vehicles combined registered a 16% growth. After growing at a
single-digit rate in FY06, sales of passenger vehicles grew at a
more aggressive rate in FY07. Passenger car demand grew by a
delectable 22%, once again led by 31% growth in the B-segment.
78
However, A-segment sales (Maruti 800) continued to decline due to
shift in preference towards the B-segment.
Prospects
The government spending on infrastructure in roads and airports
and higher GDP growth in the future will benefit the auto sector
in general. We expect a slew of launches in the Segment 'B' and
Segment ‘C’ of passenger cars. Utility vehicle segment is
expected to grow at around 6% to 8% in the long-term.
In the 2-wheeler segment, motorcycles are expected to witness a
flurry of new model launches. Though the market size is expected
to grow by 10% to 12%, competitive pressure could keep prices and
margins under control. TVS, Honda and Hero Honda are poised to
benefit from higher demand for ungeared scooters in the urban and
rural markets. Bajaj has also re-entered this segment with
superior technology products, and to that extent, competition is
likely to increase.
Riding the wave of structural changes taking place in the
country, the tractor industry has registered growth for three
consecutive years. This was after three years in the wilderness.
While good monsoon is a positive for the sector, given the fact
that the country has had erratic rainfall in the past, there is a
risk of fall in the demand due to a bad monsoon. But the longer-
term picture is impressive in light of poor mechanisation levels79
in the country’s farm sector and the thrust of the government on
improving the rural infrastructure.
With an estimated 40% of CVs plying on the roads 10 years old,
demand for HCVs is expected to grow by 6% to 8% from FY08
onwards. Also adding to the positives are higher crop output,
industrial sector growth and favorable interest rate environment.
While the industry is cyclical in nature, we expect this factor
to weaken in the medium term arising out of structural changes in
the industry. The privatisation of select state transport
undertakings and hiking of bus fares bodes well for the bus
segment.
PRODUCT FOCUS
PASSENGER CARS
Introduction
A passenger car is a road motor vehicle, other than a motor
cycle, intended for the carriage of passengers and designed to
seat no more than nine persons (including the driver). The term
"passenger car" therefore covers microcars (need no permit to be
driven), taxis and hired passenger cars, provided that they have
fewer than ten seats. This category may also include pick-ups.Not
widely known, the Indian passenger car industry started with the
General Motors Bombay as far back as the late 1920s. It was
80
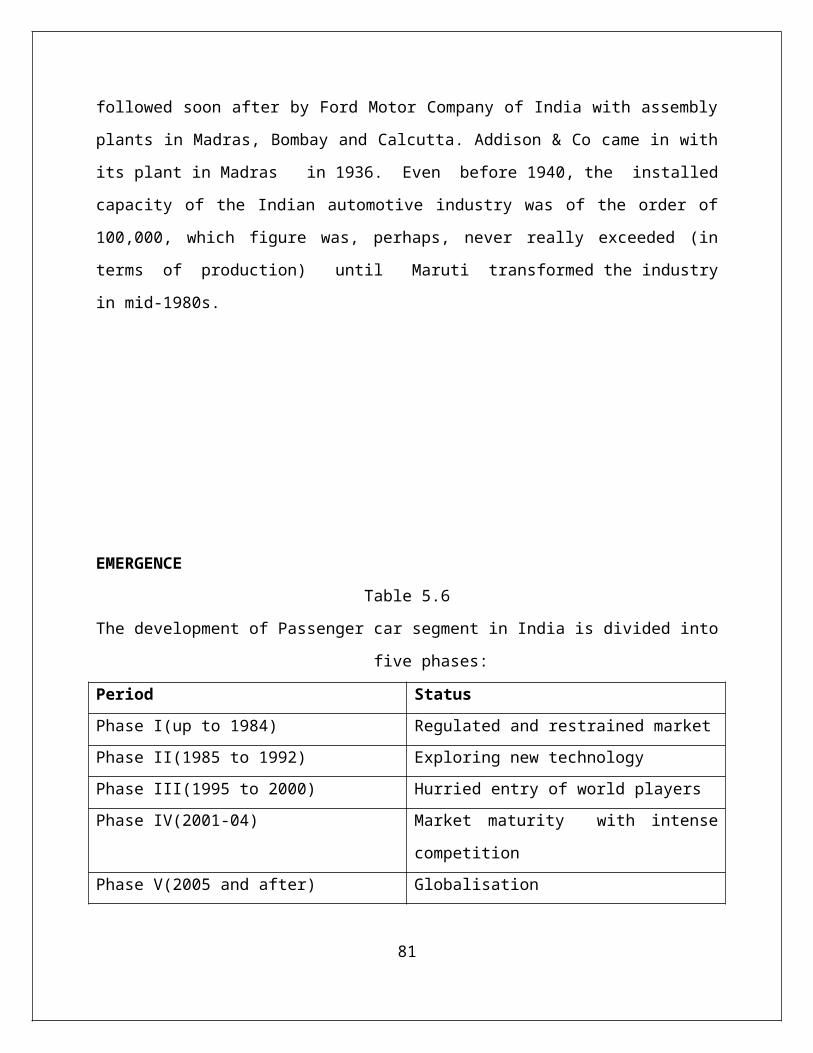
followed soon after by Ford Motor Company of India with assembly
plants in Madras, Bombay and Calcutta. Addison & Co came in with
its plant in Madras in 1936. Even before 1940, the installed
capacity of the Indian automotive industry was of the order of
100,000, which figure was, perhaps, never really exceeded (in
terms of production) until Maruti transformed the industry
in mid-1980s.
EMERGENCE
Table 5.6
The development of Passenger car segment in India is divided into
five phases:
Period StatusPhase I(up to 1984) Regulated and restrained marketPhase II(1985 to 1992) Exploring new technologyPhase III(1995 to 2000) Hurried entry of world playersPhase IV(2001-04) Market maturity with intense
competitionPhase V(2005 and after) Globalisation
81
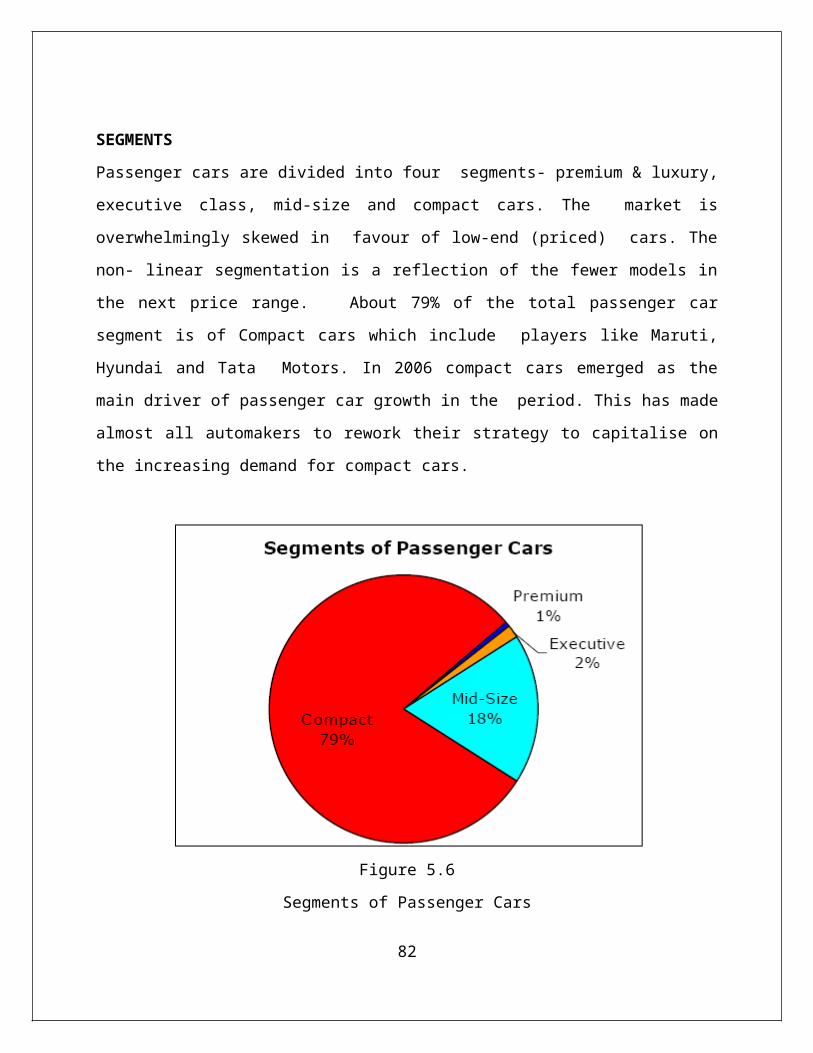
SEGMENTS
Passenger cars are divided into four segments- premium & luxury,
executive class, mid-size and compact cars. The market is
overwhelmingly skewed in favour of low-end (priced) cars. The
non- linear segmentation is a reflection of the fewer models in
the next price range. About 79% of the total passenger car
segment is of Compact cars which include players like Maruti,
Hyundai and Tata Motors. In 2006 compact cars emerged as the
main driver of passenger car growth in the period. This has made
almost all automakers to rework their strategy to capitalise on
the increasing demand for compact cars.
Figure 5.6
Segments of Passenger Cars
82
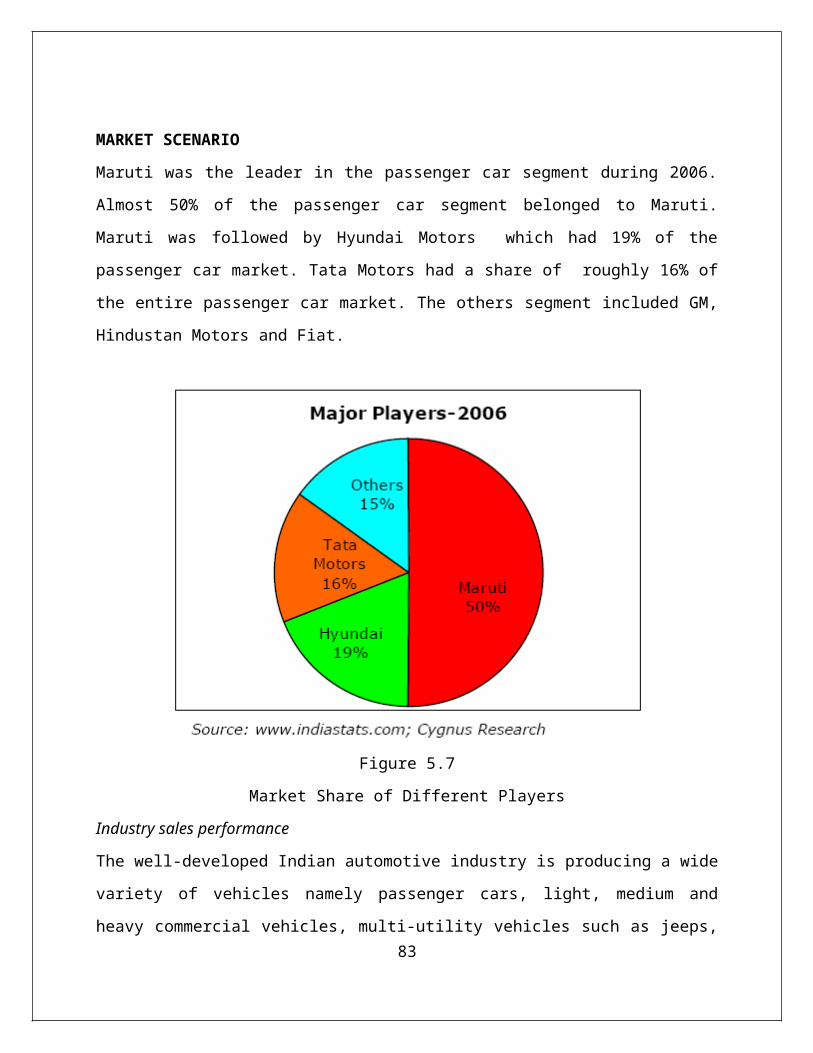
MARKET SCENARIO
Maruti was the leader in the passenger car segment during 2006.
Almost 50% of the passenger car segment belonged to Maruti.
Maruti was followed by Hyundai Motors which had 19% of the
passenger car market. Tata Motors had a share of roughly 16% of
the entire passenger car market. The others segment included GM,
Hindustan Motors and Fiat.
Figure 5.7
Market Share of Different Players
Industry sales performance
The well-developed Indian automotive industry is producing a wide
variety of vehicles namely passenger cars, light, medium and
heavy commercial vehicles, multi-utility vehicles such as jeeps,83
scooters, motorcycles, mopeds, three wheelers and tractors.
Automobile industry has registered a drop of 4.48% in the sales
of vehicles to 7,192,829 units for 2007from 7,530,166 for 2006.
The sales volume declined due to drop in sales of two-wheeler,
three-wheeler and commercial vehicles segments. These segments
contributed to over 80% sales for industry. Two-wheeler segment
sales slipped by 7.71% to 5,469,412 units and three-wheeler
segment dipped by 7.76% to 276,362 and commercial vehicles
segments dipped by 3.98% to 184,679 units 2007. Passenger car
sales have outperformed the industry in terms of sales. The
passenger car segment has registered 13.39% growth in sales to
1,108,504 units in 2007 compared with 2006.
PASSENGER CAR SEGMENT
Maruti drives segment growth
In December 2007, passenger car segment registered a growth of
8.9% to 88,220 units comparedwith December 2006. Carmakers sold
103,031 units in November 2007, against 88,501 in the same month
of the previous year, a growth of 16.4%. In October, sales rose
by 14.6% to 105,878 units. The growth was driven by small cars
from Maruti Suzuki India Ltd. Passenger cars have given84
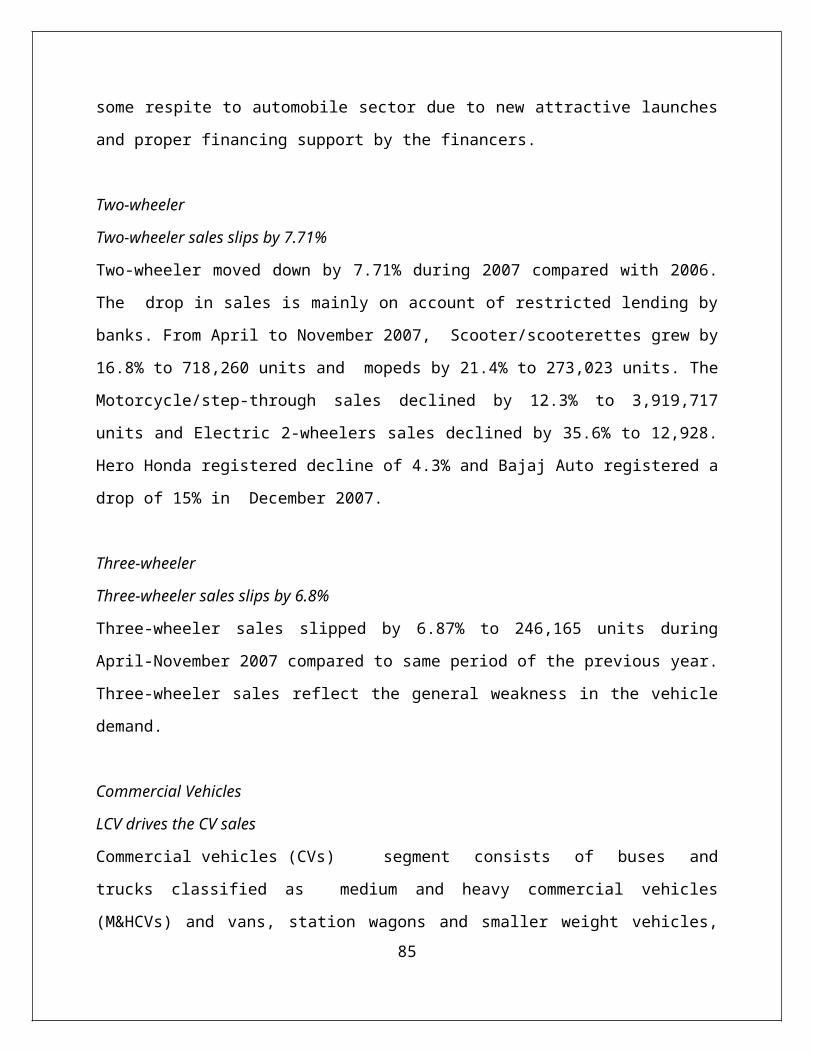
some respite to automobile sector due to new attractive launches
and proper financing support by the financers.
Two-wheeler
Two-wheeler sales slips by 7.71%
Two-wheeler moved down by 7.71% during 2007 compared with 2006.
The drop in sales is mainly on account of restricted lending by
banks. From April to November 2007, Scooter/scooterettes grew by
16.8% to 718,260 units and mopeds by 21.4% to 273,023 units. The
Motorcycle/step-through sales declined by 12.3% to 3,919,717
units and Electric 2-wheelers sales declined by 35.6% to 12,928.
Hero Honda registered decline of 4.3% and Bajaj Auto registered a
drop of 15% in December 2007.
Three-wheeler
Three-wheeler sales slips by 6.8%
Three-wheeler sales slipped by 6.87% to 246,165 units during
April-November 2007 compared to same period of the previous year.
Three-wheeler sales reflect the general weakness in the vehicle
demand.
Commercial Vehicles
LCV drives the CV sales
Commercial vehicles (CVs) segment consists of buses and
trucks classified as medium and heavy commercial vehicles
(M&HCVs) and vans, station wagons and smaller weight vehicles,85
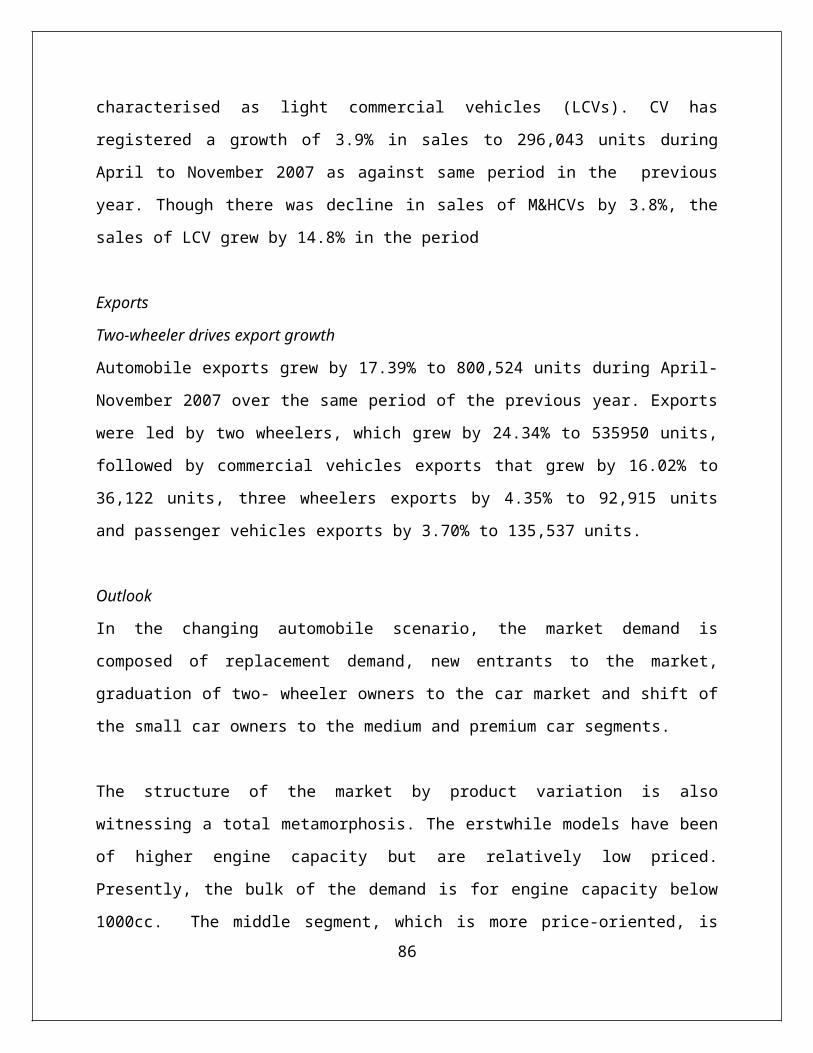
characterised as light commercial vehicles (LCVs). CV has
registered a growth of 3.9% in sales to 296,043 units during
April to November 2007 as against same period in the previous
year. Though there was decline in sales of M&HCVs by 3.8%, the
sales of LCV grew by 14.8% in the period
Exports
Two-wheeler drives export growth
Automobile exports grew by 17.39% to 800,524 units during April-
November 2007 over the same period of the previous year. Exports
were led by two wheelers, which grew by 24.34% to 535950 units,
followed by commercial vehicles exports that grew by 16.02% to
36,122 units, three wheelers exports by 4.35% to 92,915 units
and passenger vehicles exports by 3.70% to 135,537 units.
Outlook
In the changing automobile scenario, the market demand is
composed of replacement demand, new entrants to the market,
graduation of two- wheeler owners to the car market and shift of
the small car owners to the medium and premium car segments.
The structure of the market by product variation is also
witnessing a total metamorphosis. The erstwhile models have been
of higher engine capacity but are relatively low priced.
Presently, the bulk of the demand is for engine capacity below
1000cc. The middle segment, which is more price-oriented, is86
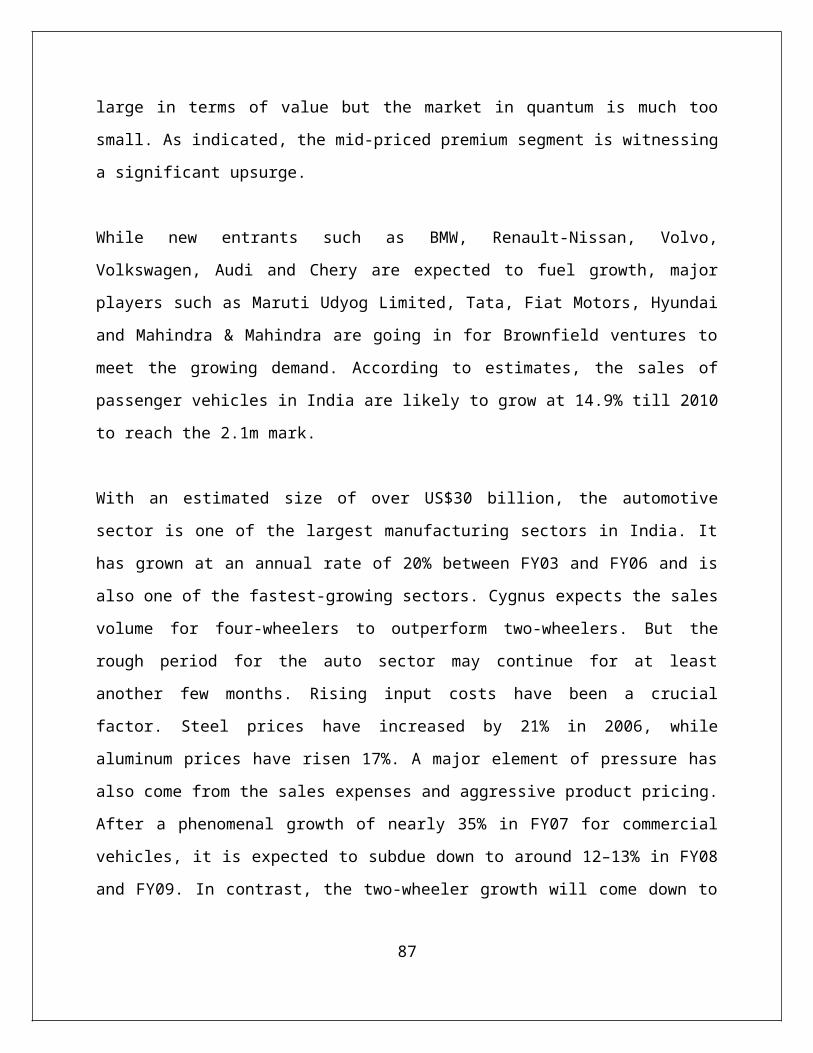
large in terms of value but the market in quantum is much too
small. As indicated, the mid-priced premium segment is witnessing
a significant upsurge.
While new entrants such as BMW, Renault-Nissan, Volvo,
Volkswagen, Audi and Chery are expected to fuel growth, major
players such as Maruti Udyog Limited, Tata, Fiat Motors, Hyundai
and Mahindra & Mahindra are going in for Brownfield ventures to
meet the growing demand. According to estimates, the sales of
passenger vehicles in India are likely to grow at 14.9% till 2010
to reach the 2.1m mark.
With an estimated size of over US$30 billion, the automotive
sector is one of the largest manufacturing sectors in India. It
has grown at an annual rate of 20% between FY03 and FY06 and is
also one of the fastest-growing sectors. Cygnus expects the sales
volume for four-wheelers to outperform two-wheelers. But the
rough period for the auto sector may continue for at least
another few months. Rising input costs have been a crucial
factor. Steel prices have increased by 21% in 2006, while
aluminum prices have risen 17%. A major element of pressure has
also come from the sales expenses and aggressive product pricing.
After a phenomenal growth of nearly 35% in FY07 for commercial
vehicles, it is expected to subdue down to around 12–13% in FY08
and FY09. In contrast, the two-wheeler growth will come down to
87
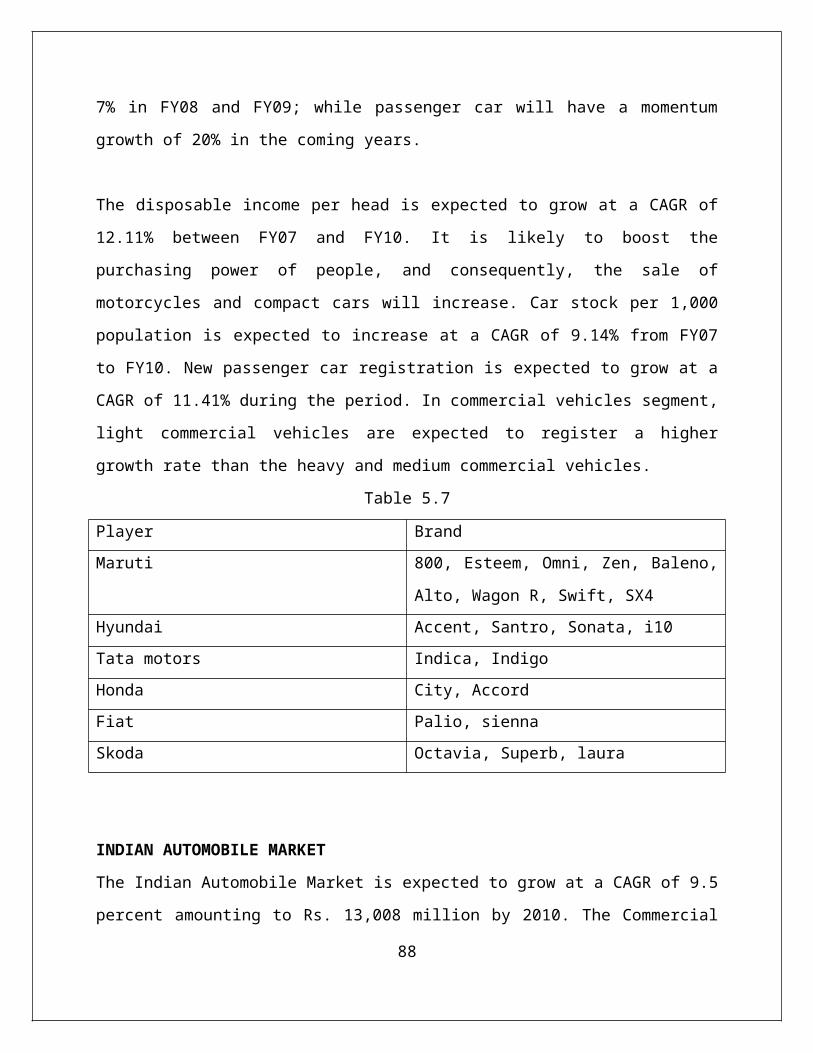
7% in FY08 and FY09; while passenger car will have a momentum
growth of 20% in the coming years.
The disposable income per head is expected to grow at a CAGR of
12.11% between FY07 and FY10. It is likely to boost the
purchasing power of people, and consequently, the sale of
motorcycles and compact cars will increase. Car stock per 1,000
population is expected to increase at a CAGR of 9.14% from FY07
to FY10. New passenger car registration is expected to grow at a
CAGR of 11.41% during the period. In commercial vehicles segment,
light commercial vehicles are expected to register a higher
growth rate than the heavy and medium commercial vehicles.
Table 5.7
Player BrandMaruti 800, Esteem, Omni, Zen, Baleno,
Alto, Wagon R, Swift, SX4Hyundai Accent, Santro, Sonata, i10Tata motors Indica, IndigoHonda City, AccordFiat Palio, siennaSkoda Octavia, Superb, laura
INDIAN AUTOMOBILE MARKET
The Indian Automobile Market is expected to grow at a CAGR of 9.5
percent amounting to Rs. 13,008 million by 2010. The Commercial
88
Vehicle Segment has been contributing to the automobile market to
a great extent.
Many foreign companies have been investing in the Indian
Automobile Market in various ways such as technology transfers,
joint ventures, strategic alliances, exports, and financial
collaborations. The auto market in India can boast of attractive
finance schemes, increasing purchasing power, and launch of the
latest products.
Total sales of major car manufacturers in India registered a
figure of 0.674 million units at the end of March, 2007. The
number of car exports in India was 39,295 units. General Motors,
Maruti, and Honda accounted for 60 percent of the market sales at
the end of April, 2007. There has been an increase in the
purchase of motorcycles and cars both, in the rural as well as
urban areas.
Some vital statistics regarding the automobile market in India
has been mentioned below:
Two wheelers - 2nd largest in the world
Commercial Vehicle - 4th largest in the world
Passenger car- 11th largest in the world
As such, the Indian automobile market comprises of a wide variety
of vehicles such as light, medium, and heavy commercial vehicles,89
cars, scooters, mopeds, motor cycles, 3 wheelers, and multi-
utility vehicles such as jeeps and trucks.
The modern automobile market in India has been considering key
issues in the process of growth:
Customer care, and not just 'service'
Domestic as well as multinational investments
Searing through cut-throat competition
Road safety
Anti-pollution norms
Coordination with the government to enable advancement
Used vehicle trade
The future of Indian Automobile market is bright as it looks
forward to manufacturing and implementing new innovations such as
electric cars as provided by Reva, alternate fuels like CNG and
LPG, and probably customized Internet automobile orders.
Car market in India
Over the last few decades. the car market in India have been in a
burgeoning stage with all types of cars flooding the market in
order to meet the demands of Indian customers who are
increasingly exposed to state-of-the-world automobiles and want
the best when it comes to purchasing a car.
It is expected that by 2030, the Indian car market will be the90
3rd largest car market across the globe. Small cars seem to be
ruling the roost in the Indian automobile market with over 7.5
lakh small cars being sold in India in 2006-07. The main
encouraging factors for the success story of the car market in
India are the increase in the opportunity for new investments,
the rise in the GDP rate, the growing per capita income, massive
population, and high ownership capacity.
The liberalization policies followed by the Indian government had
been inviting foreign investors and manufacturers to participate
in the car market in India. The recent trend within the new
generation to get work in the software based sector has led to
the rise in the income level and change in the lifestyle which
has further led to the increase in the demand for different
varieties of cars among them. Moreover, there are many financing
companies providing easy car loans at reasonable interest rates
and affordable installments.
The car Market in India is crowded with all varieties of car
models like the small cars, mid-size cars, luxury cars, super
luxury cars, and sports utility vehicles. Initially the most
popular car model dominating the Car Market in India was the
Ambassador, which however today gave way to numerous new models
like Maruti, Fiat, Hyundai, BMW, and many others. Moreover, there
are many other models of cars in the pipeline, to be launched in
91
the car market in India.
Some of the leading brands dominating the car market in India at
present are Hindustan Motors, Reva Electric Car Co., Fiat India
Private Ltd., Daimler Chrysler India Private Ltd, Ford India
Ltd., Honda Siel Cars India Ltd., General Motors India, Hyundai
Motors India Ltd., Skoda Auto India Private Ltd., and Toyota
Kirloskar Motor Ltd. Since the demand for foreign cars are
increasing with time, big brands like Mercedes Benz, Aston
Martin, Ferrari, and Rolls-Royce have long since made a foray
into the Indian car market.
Two wheeler market in India
The two-wheeler market in India is the biggest contributor to the
automobile industry with a size of Rs.100,000 million. The two-
wheeler market in India comprises of 3 types of vehicles, namely
motorcycles, scooters, and mopeds.
Foreign collaborations have been playing a major role in the
growth of the Indian two-wheeler market, and most of them are
Japanese firms. The modern two-wheeler firms in India have been
manufacturing new categories of two wheelers such as Step Thrus
and Scooterettes. These have been produced by combining two or
more two-wheeler segments. Foreign firms have already taken
initiatives to own their two-wheeler subsidiaries in India.
92
Among the 3 segments of the Indian two wheeler market, major
growth trends have been seen in the motorcycle segment over the
last four to five years. One good reason for such increase in
demand for motorcycles is due to its resistance and balance even
on bad road conditions. Most of the rural areas in India do not
have decent roads and hence the need for good, shock-resistant,
and steady two-wheelers such as motorcycles had been felt.
Some of the major players in the Indian motorcycles market are
Hero Honda CBZ, Bajaj Pulsar, TVS and Apache. Other brands
include Splendor, Passion, Fiero, Victor, Star City, Boxer, CD
Dawn, Karizma, Caliber, etc. Having classified the motorcycle
brands into economy, executive, and premium segments, Bajaj
stands as the leader in the economy segment, Hero Honda leads in
the executive segment, and there is a competition in the premium
segment between Hero Honda and Bajaj.
The following are the main factors that affect two-wheeler sales
in India:
Increase in credit and financing for auto vehicles - Two-
wheeler loans and financing has been on the rise.
93
Increase in consumer's salary - Due to opportunities offered
by multinationals the disposable incomes of salaried
individuals have increase manifold.
Constant petrol prices - Today, the government of India has
been working on reducing subsidies on kerosene and diesel
which will keep petrol prices at more or less the same
level.
Delay in initiation of Mass Transport System - Probably a
future threat to the two-wheeler market, the implementation
of the mass transport system has been delayed.
However, the two-wheeler market in India is a fast growing market
due to its technological advancements in product manufacturing
and emphasis on design innovation.
Heavy vehicles market in India
Heavy Vehicles Market in India comprises of trucks, Machines,
Ambulances, and School Buses. The popular heavy vehicle brands in
India are Volvo, Eicher, Tata, Telco, Ashok Leyland, Bajaj Tempo,
and Swaraj Mazda.
Following are the major players in the Indian heavy vehicles
market:
Ashok Leyland: A major manufacturer in the Heavy Vehicles Market
in India, Ashok Leyland has been leading in its technology and
innovation. Its product ideas are being utilized by many other
94
commercial vehicle companies. Factories are located at Bhandara,
Hosur, Alwar, and Ennore.
Eicher Motors Limited: Founded in 1982, Eicher is a leading
manufacturer of trucks and buses. It has technological
expertise from Mitsubishi Motors Corporation of Japan. Its
operations are located at Thane and Pitampur.
Tata Motors Limited: Began its heavy vehicles manufacture in
1983. In 2005 it manufactured 'Tata Ace' a mini truck.
Heavy vehicle brands under its banner are Novus trucks,
Starbus and Globus buses, and defense vehicles.
Swaraj Enterprise Limited: It is known for its tractor
manufacture both in India as well as USA. Swaraj Mazda
Limited was promoted in 1983 and today it is a large
manufacturer of heavy vehicles. Some of its products are
school buses, CNG buses, fire brigades, ambulances, etc.
Force Motors Limited: Formerly known as Bajaj Tempo Limited,
Force had started operating in 1950 and has been
successfully manufacturing heavy commercial vehicles along
with other vehicles since then. Its operations are at
Pithampur and Akurdi.
The heavy vehicles market in India has been reflecting steady
growth with the above mentioned key manufacturers vying to outdo
each other in this segment by constantly trying to upgrade their
technology and production processes. With foreign investments in
the Indian vehicle market and world class technology, India is95
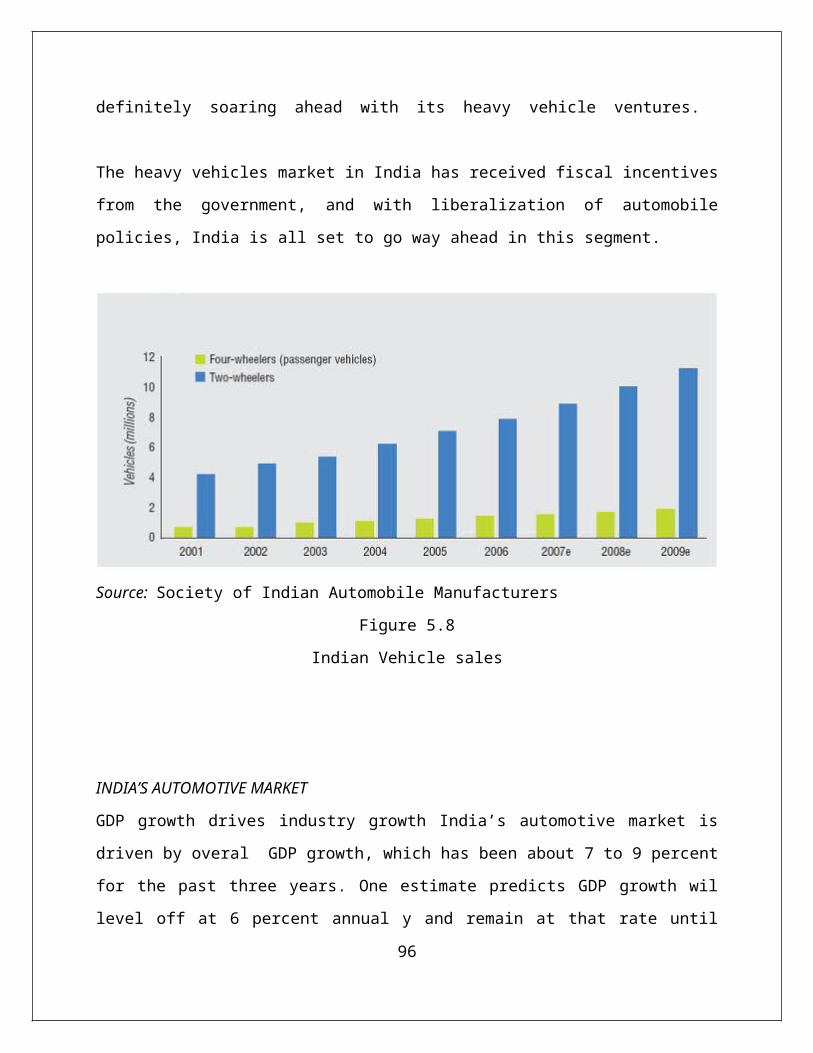
definitely soaring ahead with its heavy vehicle ventures.
The heavy vehicles market in India has received fiscal incentives
from the government, and with liberalization of automobile
policies, India is all set to go way ahead in this segment.
Source: Society of Indian Automobile Manufacturers
Figure 5.8
Indian Vehicle sales
INDIA’S AUTOMOTIVE MARKET
GDP growth drives industry growth India’s automotive market is
driven by overal GDP growth, which has been about 7 to 9 percent
for the past three years. One estimate predicts GDP growth wil
level off at 6 percent annual y and remain at that rate until
96
2020.4 As a developing automotive economy, India today ranks very
low in terms of vehicles per 1000 people, but past experience in
other markets suggests that as GDP per capita grows, the
automotive market should also grow, as shown in Figure 3.
A GDP per capita of US$3,000 is considered the inflection point
where four-wheeler sales begin growing at a faster pace.5
However, one executive notes that there are 40 million Indian
households that can afford a four-wheeler today but are not
buying one. This executive lists a combination of issues that are
dissuading potential buyers in India from actually buying a car:
• They don’t need a car.
• They are uncertain about the cost of operation.
• Roads are not good enough.
• Congestion makes driving unappealing.
• Parking space is not sufficient.
• They don’t know how to drive.
• They are unsure whether some manufacturers will last as long
as the vehicle, creating a “trust” gap.
Any combination of these issues may cause people to delay
purchasing a vehicle, but it is unclear which solutions would
cause reluctant buyers to change their minds.
Several interviewees highlight the dampening effect of recessions
on their fragile economy. One executive explains it this way:
“The last five years have shown continued growth, and everything97
is great now. But people worry about the end of the cycle. In
general, a recession comes every seven or eight years.”
Recessions create cautionary spending. One executive describes
this as India’s “scarcity use” economy, one in which families
find ways to continual y reuse products until the products
completely wear out.
The domestic market forecast is cautiously optimistic The recent
optimism concerning the Indian automotive market is based on a
compound annual growth rate (CAGR) since 2001 of 15.4 percent for
four-wheelers and 13.3 percent for two-wheelers.6 Our Indian
industry interviewees expect a doubling and tripling of four-
wheeler sales by 2010 and 2015, respectively. The number of four-
wheelers sold in 2006-2007 was about 1.4 million, and a doubling
(2.8 million) or tripling (4.2 million) of that figure would make
India one of the top ten countries in terms of vehicle sales.7
The interviewees also see 2005’s sales of nearly 7 million two-
wheelers increasing 60 percent to 11 million by 2010 and by 240
percent to 17 million by 2015.
98
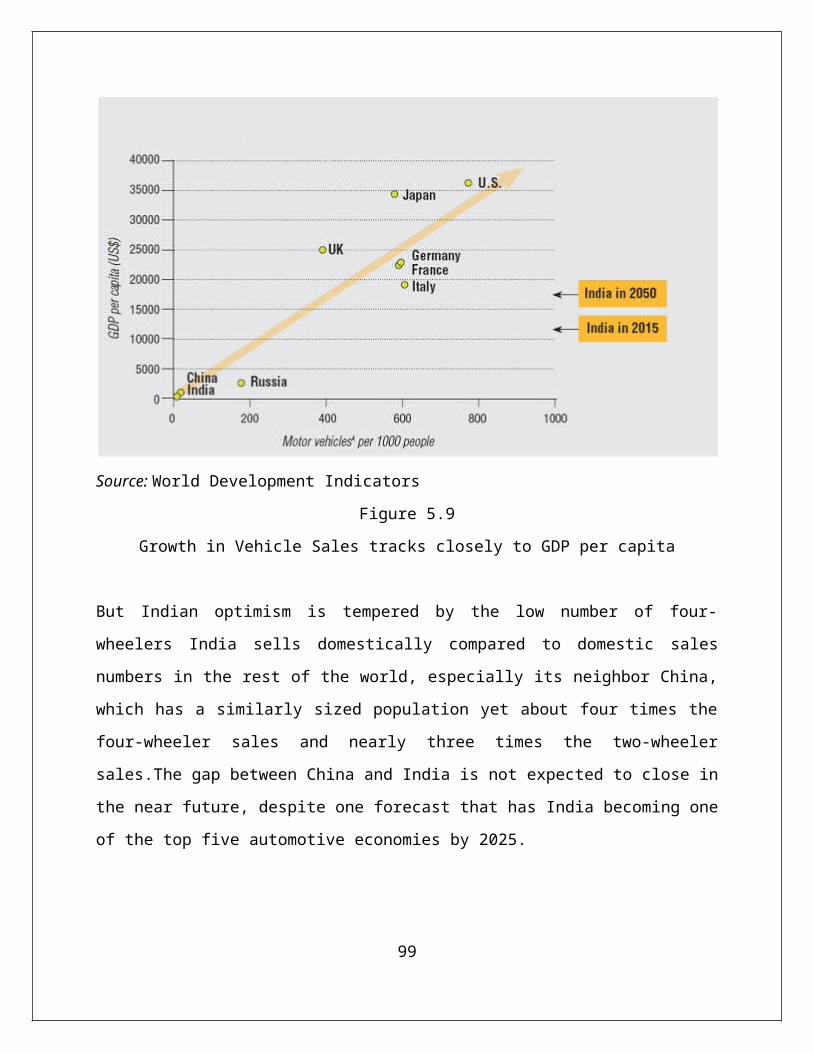
Source: World Development Indicators
Figure 5.9
Growth in Vehicle Sales tracks closely to GDP per capita
But Indian optimism is tempered by the low number of four-
wheelers India sells domestically compared to domestic sales
numbers in the rest of the world, especially its neighbor China,
which has a similarly sized population yet about four times the
four-wheeler sales and nearly three times the two-wheeler
sales.The gap between China and India is not expected to close in
the near future, despite one forecast that has India becoming one
of the top five automotive economies by 2025.
99
The impact of infrastructure on the market is crucial
Infrastructure permeates almost every discussion with our
interviewees about the current and future market. It impacts the
types of vehicles sold both now and in the future. For both
domestic sales and exports, many interviewees see a direct
relationship between infrastructure improvements and growth of
the auto industry. Roads in India’s large cities continue to be
plagued by overcrowding, with large delivery trucks, small cars,
three-wheelers, two-wheelers, pedestrians, and the occasional
cart drawn by a cow, al sharing the same road. Today, the
combination of fuel cost and insufficient infrastructure has led
Indian consumers to purchase primarily two-wheelers and small
cars. So, even though some people can afford larger cars, many
purchase smaller ones.
Financing systems are strong One of the key differences between
India and China today is their respective financial institutions
and systems. While China’s systems are still in the process of
modernizing, India’s financial institutions are already mature.
India has a financial loan system for purchasing vehicles that
can serve as the basis for the development of India’s automotive
industry for years to come. In developed economies, 60 to 80
percent of vehicle buyers use financing for their purchases. Our
interviewees estimate that, in India, 77 percent of four-wheelers
and 50 to 60 percent of two-wheelers are currently financed.
100
Forty percent of the interviewees think financing already plays a
major role in vehicle sales and will change only marginal y in
the future. However, they cited two areas that may affect future
growth: the ability of financial institutions to assess risk of
potential countryside buyers and lowering interest rates to match
Western countries (which improves the ratio of interest rate to
earnings of Indian households, making vehicle ownership more
affordable).
The dealer body is underdeveloped In general, our interviewees do
not see the dealer body as being very successful today, with
brands largely selling themselves rather than dealers selling the
brands. Dealers currently own their franchises, but there are few
multiple-franchise dealers selling more than one brand at one
location. One executive thinks that the Indian market will
someday resemble the U. S. market, which has nearly 20,000
dealers across the country. Another executive thinks networks of
service only workshops will manage a large part of after-sales
service. A number of interviewees envision consolidation of
current dealers into groups of dealers, creating large dealer
groups. Based on these diverse opinions, it looks like buyers
will need to make some important decisions about their
relationships with dealers, and their final decisions will help
shape the future of the dealer body.
101
The most significant market-related themes from our interviews
focus on three points:
• Will the small car be India’s automotive destiny?
• Understanding India’s consumers will be key to future market
success.
• Exporting to the world market will be a challenge.
WILL THE SMALL CAR BE INDIA’S AUTOMOTIVE DESTINY?
Two aspects of the future domestic vehicle market stand out when
speaking to our Indian interviewees. First, the target of four-
wheeler sales is the large number of two-wheeler owners. And
second, the bulk of four-wheeler sales wil be small cars.
A significant migration from two- to four-wheelers is expected.
The two-wheeler market is composed of motorcycles, scooters, and
mopeds and represents 75 percent of India’s annual new vehicle
sales.10 Interviewed executives believe that many of these buyers
will migrate to four-wheelers not only because of increases in
GDP per capita, but also because of the development of small ,
inexpensive four-wheelers. The expected delivery of the Tata
Group’s “1 lakh car” (a price of approximately US$2,500) is the
prime example interviewees use to describe the potential
affordability of four-wheelers and India’s developing expertise
in small cars. There are differing predictions about the
introduction of the “1 lakh car” into the vehicle market. One
executive thinks, “If they really come out with a US$2,500 car,102
there will be, at a minimum, a 10- to 15-percent shift from two-
wheelers to four-wheelers.” Other predictions are much greater –
some say a million consumers will migrate.
In most developed countries, used vehicles are transition
vehicles for buyers who are not ready to migrate to new vehicles.
But because Indians tend to keep their vehicles until they are no
longer usable, India lacks a large stable of newer-model used
vehicles. Hence, India’s used vehicle market is very immature and
is not expected to grow, adding more reason for interviewees to
predict that buyers will move from two-wheelers to new,
inexpensive four-wheelers.
Small cars dominate Practical y al of India’s manufacturers
(domestic, foreign, and JV) offer a variety of small cars in
different price ranges. But the “1 lakh car” is priced close to
that of a high-end two-wheeler, making it easier for buyers to
migrate. The competition has always been fierce in this ultra-
low-price segment, with local JVs such as Maruti Udyog (the
Maruti-Suzuki JV) selling the 2007 model of its very popular
Maruti 800 for about US$5,000, along with three other low-priced
models.
Foreign competition is also gearing up. Renault recently formed a
JV with Mahindra & Mahindra to build its low-cost Logan car as
well as an even less expensive vehicle. Other global103
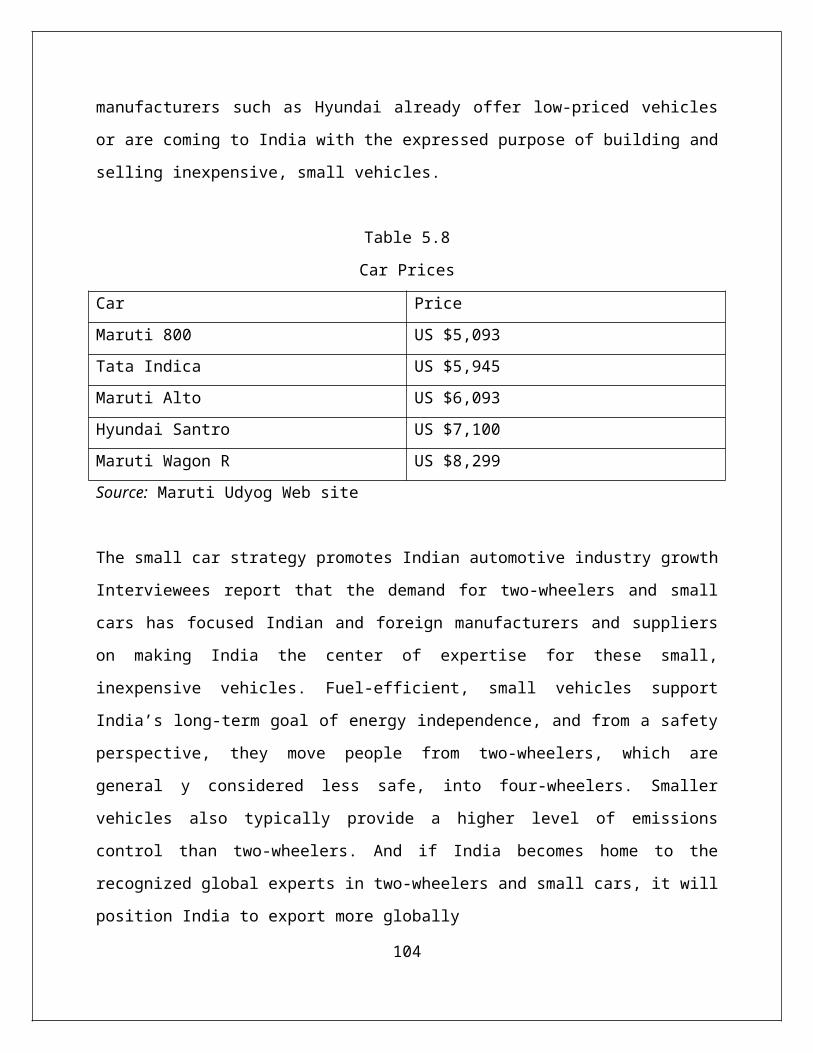
manufacturers such as Hyundai already offer low-priced vehicles
or are coming to India with the expressed purpose of building and
selling inexpensive, small vehicles.
Table 5.8
Car Prices
Car PriceMaruti 800 US $5,093Tata Indica US $5,945Maruti Alto US $6,093Hyundai Santro US $7,100Maruti Wagon R US $8,299Source: Maruti Udyog Web site
The small car strategy promotes Indian automotive industry growth
Interviewees report that the demand for two-wheelers and small
cars has focused Indian and foreign manufacturers and suppliers
on making India the center of expertise for these small,
inexpensive vehicles. Fuel-efficient, small vehicles support
India’s long-term goal of energy independence, and from a safety
perspective, they move people from two-wheelers, which are
general y considered less safe, into four-wheelers. Smaller
vehicles also typically provide a higher level of emissions
control than two-wheelers. And if India becomes home to the
recognized global experts in two-wheelers and small cars, it will
position India to export more globally
104
But there are some potential drawbacks to this strategy. The
introduction of very inexpensive four-wheelers to the Indian
market might trigger the migration of two-wheeler buyers to four-
wheelers before the nation’s infrastructure is improved and
expanded. This could cause even more congestion in the short
term. Fuel consumption could also increase dramatically. And the
low levels of safety and emissions equipment on these vehicles
might make them attractive exports only to developing economies
rather than developed economies. Exports to developed economies
will face formidable competition from global manufacturers with
their own inexpensive small cars. In the final analysis, the
Indian automotive industry’s aspiration of growing through the
development of small, inexpensive cars is a reasonable one, built
on the desire to improve India’s economy now rather than wait for
incomes to reach levels of developed economies. But there are
potential unintended consequences that Indians must be aware of
as they pursue this strategy.
Understanding India’s consumers will be key to future market success
Understanding how to market to India’s diverse consumers is very
important for success in this marketplace. Interviewees described
today’s top-priority vehicle purchasing factors as price, fuel
economy, brand image, and after-sales service (quality and
styling were not at the top of the list as they are in developed
markets): 105
Price and fuel economy: Considering the current state of India’s
economic development, it is not surprising that price and fuel
economy are the top purchasing factors for buyers. The Indian
government currently offers an 8-percent excise tax reduction on
the cost of vehicles that have low engine displacement (<1200
cubic centimeters). It also controls the cost of gasoline. In
India, fuel purchases represent a larger proportion of a family’s
income than in Western countries.
Brand: Interviewees ranked brand second only to price and fuel
economy. Buyers tend to purchase vehicle brands based on their
perceptions of what a vehicle says about them.
After-sales service: Indian consumers generally keep their
vehicles until they are no longer usable, making after-sales
service capabilities a crucial factor in buying decisions. As a
consequence, it is not only price and vehicle characteristics but
also the reputation for superior after-sales service that helps
sell new vehicles. One executive observes the importance of the
dealer network in this process, “Manufacturers need a dispersed
service network with quality manpower and superior capabilities
for obtaining replacement parts and handling customers. Today,
dealers are only half as efficient as they need to be in this
area. They need to handle customers without rupturing the
relationship.”106
Vehicle purchase factors will change in the future. A very
different picture emerges when interviewees predict the main
vehicle purchasing factors over the next five to ten years.
Executives clearly see greater emphasis on brand image and status
as well as increased buyer sophistication in evaluating what a
vehicle has to offer. They believe consumers will strike a
balance in terms of performance, features, and safety, while at
the same time considering the price and fuel efficiency of a
vehicle. The increasing importance of status and brands may
signal a developing car culture.
A number of interviewees think vehicle prices will not rise in
the future. They believe competition will remain keen among
strong domestic and foreign manufacturers, creating continual
price pressures throughout the system. Several executives focused
on the effect of taxes on the final price of the vehicle. One
executive suggested that taxes represent as much as 40 percent of
the final price of the vehicle, with taxes cascading on top of
other taxes.
Exporting to the world market will be a challenge
One of the most serious issues that Indian automotive
manufacturers and suppliers face is the export of low-cost
vehicles and components. One executive summarizes the realistic
attitude of most of our interviewees, “There is a happy picture107
where everyone is euphoric about the positive side of Indian
exports [exporting more] and then there is a sad picture where we
have not done really well [total is still low relative to other
markets].” Interviewees estimate a significant increase in
vehicle (~20 percent) and component (~30percent) exports in both
2010 and 2015, but this is not a dramatic overall change
considering India’s low beginning point.
Exporting creates an additional burden on Indian companies as
they develop their products and their local market. Interviewees
report that India has important advantages, such as low-cost
manufacturing and design, English language proficiency, adequate
intellectual property protection, government support, a young and
talented workforce, availability of raw materials, and the
potential to build world-class quality at low prices. But
interviewees also report a significant number of challenges that
could potential y outweigh these advantages, including the need
to:
• Understand export markets, which involve understanding foreign
consumers and developing a range of models, a stronger brand
presence, and dealership networks.
• Develop products that can succeed in developed as well as
developing economies.
• Manage difficult global supply chain logistics.
• Increase manufacturing scale to global levels.
• Build resources to survive a large recall campaign.108
• Improve technology development, such as technology features
that differentiate the company, or engines that conform to global
norms.
• Upgrade Indian port facilities to support high export volumes.
These are significant challenges that may delay expected export
growth, especially for vehicles. They may also force Indian
manufacturers and suppliers to establish JVs with larger global
companies to reach global scale more quickly.
India’s production capabilities
The combination of great optimism mixed with significant
challenges that characterizes India’s automotive market also
extends to its production capabilities.
India’s automotive production has experienced tremendous growth
since the start of the millennium. Total vehicle production is up
about 80 percent since 2001, although as Figure 5 shows, the bulk
of production is still two-wheel vehicles. The Indian auto
components industry has also grown fast, as Figure 6 shows.
Overall, the automotive industry in India has come a long way in
a short time.
But India faces big challenges if it is to meet its goal of
becoming a world-class automotive production center. India’s
production levels for four-wheelers are still small compared to
other countries. India today produces only 10 percent of the109
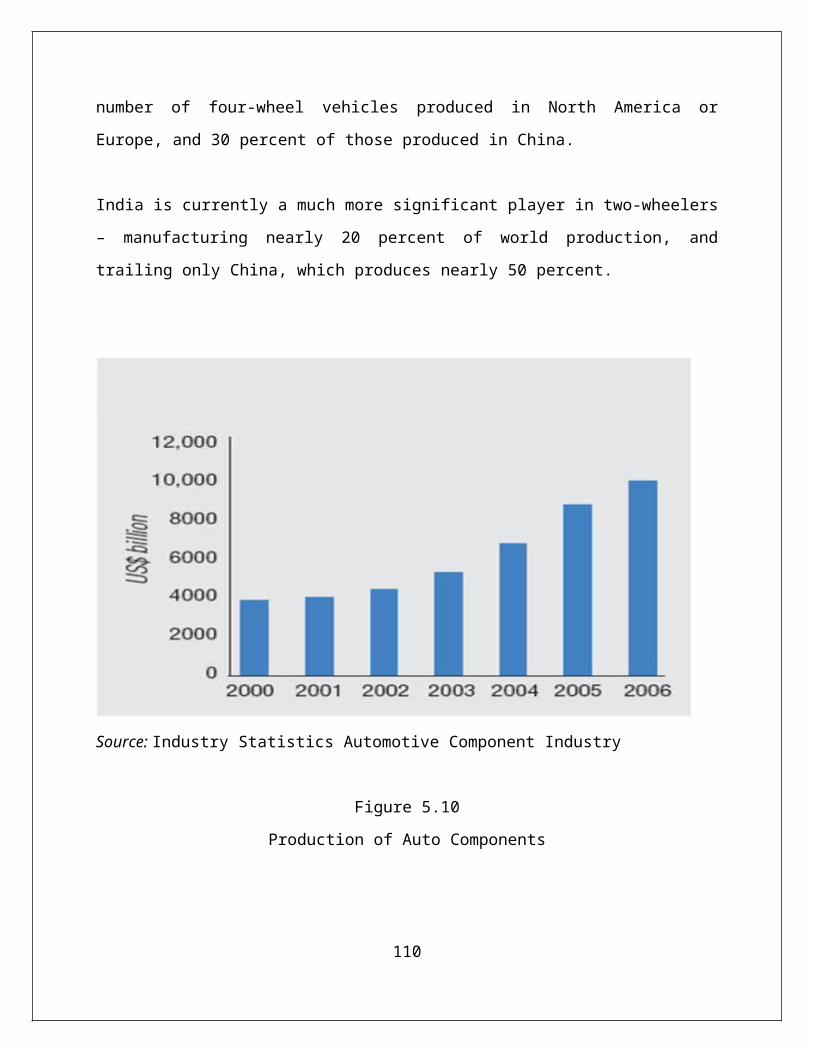
number of four-wheel vehicles produced in North America or
Europe, and 30 percent of those produced in China.
India is currently a much more significant player in two-wheelers
– manufacturing nearly 20 percent of world production, and
trailing only China, which produces nearly 50 percent.
Source: Industry Statistics Automotive Component Industry
Figure 5.10
Production of Auto Components
110
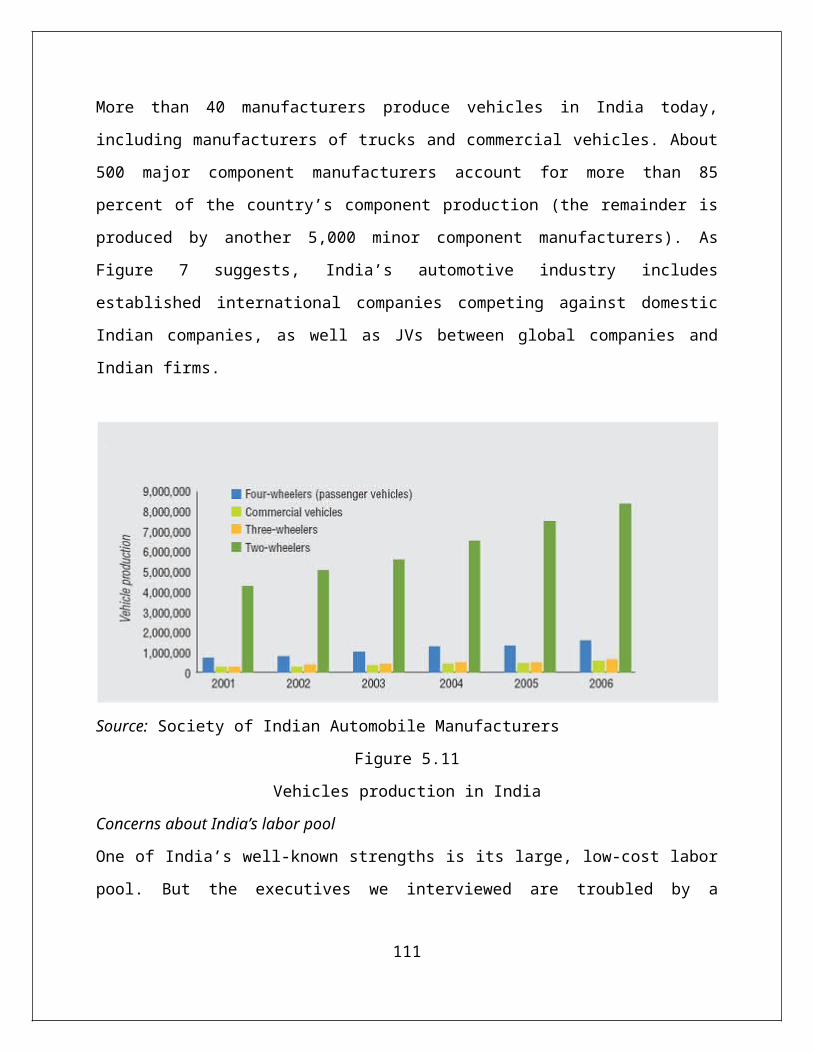
More than 40 manufacturers produce vehicles in India today,
including manufacturers of trucks and commercial vehicles. About
500 major component manufacturers account for more than 85
percent of the country’s component production (the remainder is
produced by another 5,000 minor component manufacturers). As
Figure 7 suggests, India’s automotive industry includes
established international companies competing against domestic
Indian companies, as well as JVs between global companies and
Indian firms.
Source: Society of Indian Automobile Manufacturers
Figure 5.11
Vehicles production in India
Concerns about India’s labor pool
One of India’s well-known strengths is its large, low-cost labor
pool. But the executives we interviewed are troubled by a
111
shortage of skilled labor, as well as by inflexible labor
regulations and the threat of rising wages. Skills are limited.
Several interviewed executives noted the quality and quantity of
skilled labor as problematic, especially the lack of engineers.
One executive explains that “graduates are not capable. They need
a complete training process.” According to another, “the number
of available people (trained engineers) is much less than the
demand.” Another interviewee commented that “every kid from
college has four job offers. They want a 15-percent raise in one
year, or they think they need to join another company. There are
not enough people to do the job.” However, one executive takes a
longer view, saying that the “skill’s issue will ease over the
next ten years,” indicating that the ongoing government and
industry actions to provide supplemental training and new
education centers will make an impact.
Executives also report that labor churn, where employees move to
rival firms for better compensation or conditions, is a growing
problem. One says, “In the auto industry, job changes occur
frequently, with about 20-percent attrition rate … 40 to 45
percent in certain cases.”
Labor regulations present hurdles our interviewees view India’s
labor laws as a hindrance to future growth and investment. One
executive suggests, “Indian labor is over protected. It is not a
flexible system.” Another says, “Labor laws are strict and112
inflexible. It is hard to right-size a company.” This situation
has led to a practice of employing a small group of core
employees and a larger number of temporary workers who can easily
be let go. Executives generally look to the government to fix
this problem, but they recognize, as one interviewee remarked,
that “it will take a long time to reform because this is a
democratic country.”
Wages may become a problem several executives note that wage
growth might start to price India out of the market. As one
interviewee explains, “India is a low-cost labor country, but
wages are rising. Ten years down the line India’s wage structure
will be similar to that of the West. Wages have risen about 20
percent in the last couple of years.”
External challenges: Infrastructure, oil supply, and air quality
The executives we interviewed see India’s automotive industry as
significantly impacted by its infrastructure, oil supply, and air
quality. India’s government-issued, ten-year Automotive Mission
Plan, discussed earlier in this report, shares this view of
infrastructure as a crucial factor in the success of the
industry.
As part of our survey, we asked each interviewee to assess the
top three external challenges the industry faces. They ranked
infrastructure as, by far, the number one challenge, followed by113
oil security, with air quality as third. We believe these results
indicate infrastructure is one area where executives feel India
can act to solve issues. Oil security, on the other hand, is much
more dependent on the global market for oil. And air quality is
viewed as already being addressed, with India closing the gap
with the European Union in adhering to Euro emissions norms.
Despite the external challenges, the future appears bright to
those we interviewed. They seem hopeful that each issue can be
methodically overcome – either by government or private industry,
or a partnership of both.
Infrastructure
Designing an automotive infrastructure for over one billion
people is a daunting task for a developed economy, but developing
economies must also contend with other challenges, including
limited funds and inadequate roads. For India, the lack of roads
may affect consumer buying decisions. Lack of port capacity may
restrict export growth. And lack of power availability may slow
industry development.
Transportation infrastructure is a vital element to the
automotive industry Most of the executives interviewed agreed –
road construction is key, and it is a task only India’s
government can tackle. As one executive state, “There is a
direct relationship between better connectivity of the114
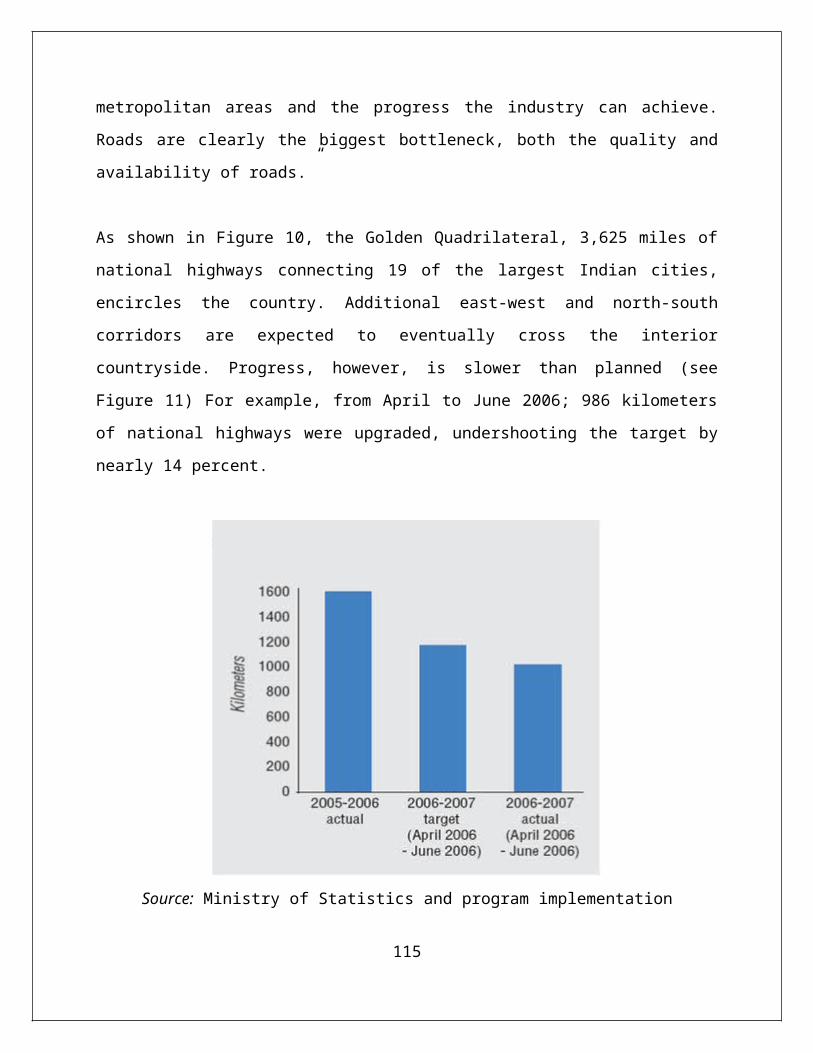
metropolitan areas and the progress the industry can achieve.
Roads are clearly the biggest bottleneck, both the quality and
availability of roads.”
As shown in Figure 10, the Golden Quadrilateral, 3,625 miles of
national highways connecting 19 of the largest Indian cities,
encircles the country. Additional east-west and north-south
corridors are expected to eventually cross the interior
countryside. Progress, however, is slower than planned (see
Figure 11) For example, from April to June 2006; 986 kilometers
of national highways were upgraded, undershooting the target by
nearly 14 percent.
Source: Ministry of Statistics and program implementation
115
Figure 5.12
Upgrade of National highways
COMPANY ANALYSIS
Profile
Tata Motors Limited is India's largest automobile company, with
revenues of Rs. 32,426 crores (USD 7.2 billion) in 2006-07. It is
the leader by far in commercial vehicles in each segment, and the
second largest in the passenger vehicles market with winning
products in the compact, midsize car and utility vehicle
segments. The company is the world's fifth largest medium and
116
heavy commercial vehicle manufacturer, and the world's second
largest medium and heavy bus manufacturer.
The company's 22,000 employees are guided by the vision to be
"best in the manner in which we operate, best in the products we
deliver, and best in our value system and ethics." Tata Motors
helps its employees realize their potential through innovative HR
practices. The company's goal is to empower and provide employees
with dynamic career paths in congruence with corporate
objectives. All-round potential development and performance
improvement is ensured by regular in-house and external training.
The company has won several awards recognizing its training
programmes.
Established in 1945, Tata Motors' presence indeed cuts across the
length and breadth of India. Over 4 million Tata vehicles ply on
Indian roads, since the first rolled out in 1954. The company's
manufacturing base is spread across India - Jamshedpur
(Jharkhand) in the east, Pune (Maharashtra) in the west, and in
the north in Lucknow (Uttar Pradesh) and Pantnagar (Uttarakhand).
A new plant is being set up in Singur (close to Kolkata in West
Bengal) to manufacture the company's small car. The nation-wide
dealership, sales, services and spare parts network comprises
over 2,000 touch points. The company also has a strong auto
finance operation, TML Financial Services Limited, supporting
customers to purchase Tata Motors vehicles.
117
Tata Motors, the first company from India's engineering sector to
be listed in the New York Stock Exchange (September 2004), has
also emerged as an international automobile company. In 2004, it
acquired the Daewoo Commercial Vehicles Company, Korea's second
largest truck maker. The rechristened Tata Daewoo Commercial
Vehicles Company has launched several new products in the Korean
market, while also exporting these products to several
international markets. Today two-thirds of heavy commercial
vehicle exports out of South Korea are from Tata Daewoo. In 2005,
Tata Motors acquired a 21% stake in Hispano Carrocera, a reputed
Spanish bus and coach manufacturer, with an option to acquire the
remaining stake as well. Hispano's presence is being expanded in
other markets. In 2006, it formed a joint venture with the
Brazil-based Marcopolo, a global leader in body-building for
buses and coaches to manufacture fully-built buses and coaches
for India and select international markets. Tata Motors also
entered into a joint venture in 2006 with Thonburi Automotive
Assembly Plant Company of Thailand to manufacture and market the
company's pickup vehicles in Thailand. In 2006, Tata Motors and
Fiat Auto formed an industrial joint venture at Ranjangaon (near
Pune in Maharashtra, India) to produce both Fiat and Tata cars
and Fiat powertrains for the Indian and overseas markets; Tata
Motors already distributes and markets Fiat branded cars in
India. In 2007, Tata Motors and Fiat Auto entered into an
agreement for a Tata license to build a pick-up vehicle bearing
the Fiat nameplate at Fiat Group Automobiles' Plant at Córdoba,118
Argentina. The pick-up will be sold in South and Central America
and select European markets.
The foundation of the company’s growth is a deep understanding of
economic stimuli and customer needs, and the ability to translate
them into customer-desired offerings through leading edge R&D.
The R&D establishment includes a team of 1400 scientists and
engineers. The company's Engineering Research Centre was
established in 1966, and has facilities in Pune, Jamshedpur and
Lucknow. The ERC has enabled pioneering technologies and
products. It was Tata Motors, which developed the first
indigenously developed Light Commercial Vehicle, India's first
Sports Utility Vehicle and, in 1998, the Tata Indica, India's
first fully indigenous passenger car. Within two years of launch,
Tata Indica became India's largest selling car in its segment.
The ERC in Pune, among whose facilities are India's only
certified crash-test facility and hemi-anechoic chamber for
testing of noise and vibration, has received several awards from
the Government of India. Some of the more prominent amongst them
are the National Award for Research and Development Efforts in
Industry in the Mechanical Engineering Industries sector in 1999,
the National Award for Successful Commercialization of Indigenous
Technology by an Industrial Concern in 2000, and the CSIR Diamond
Jubilee Technology Award in 2004.
The company set up the Tata Motors European Technical Centre
(TMETC) in 2005 in the UK. TMETC is engaged in design engineering119
and development of products, supporting Tata Motors' skill sets.
Tata Daewoo Commercial Vehicle Company and Hispano Carrocera also
have R&D establishments at Gunsan in South Korea and Zaragoza in
Spain.
The pace of new product development has quickened through an
organisation-wide structured New Product Introduction (NPI)
process. The process with its formal structure for introducing
new vehicles in the market, brings in greater discipline in
project execution. The NPI process helped Tata Motors create a
new segment, in 2005, by launching the Tata Ace, India’s first
indigenously developed mini-truck. The years to come will see the
introduction of several other innovative vehicles, all rooted in
emerging customer needs. Besides product development, R&D is also
focussing on environment-friendly technologies in emissions and
alternative fuels.
Through its subsidiaries, the company is engaged in engineering
and automotive solutions, construction equipment manufacturing,
automotive vehicle components manufacturing and supply chain
activities, machine tools and factory automation solutions, high-
precision tooling and plastic and electronic components for
automotive and computer applications, and automotive retailing
and service operations.
True to the tradition of the Tata Group, Tata Motors is committed
in letter and spirit to Corporate Social Responsibility. It is a
120
signatory to the United Nations Global Compact, and is engaged in
community and social initiatives on labour and environment
standards in compliance with the principles of the Global
Compact. In accordance with this, it plays an active role in
community development, serving rural communities adjacent to its
manufacturing locations.
With the foundation of its rich heritage, Tata Motors today is
etching a refulgent future.
Tata Motors Limited manufactures commercial and passenger
vehicles primarily in India. It offers passenger cars, multi-
utility vehicles, and pick-ups; medium and heavy commercial
vehicles, such as rigid trucks, tractor trailers, and tippers;
intermediate, light, and small commercial trucks; buses; and
defence related vehicles. The company, through its subsidiaries,
also engages in the provision of engineering and automotive
solutions; manufacture of construction equipment; automotive
vehicle components manufacturing and supply chain activities; and
provision of machine tools and factory automation solutions, as
121
well as offers high-precision tooling, and plastic and electronic
components for automotive and computer applications. In
addition, it provides automotive retailing and services, as well
as financing for the vehicles sold by the company. The company
markets its products in Europe, Africa, the Middle East, south
Asia, South East Asia, and Australia. Tata Motors was founded in
1945 as Tata Locomotive and Engineering Company Limited and
changed its name to Tata Engineering and Locomotive Company
Limited in 1960. Subsequently, it changed its name to Tata Motors
Limited in 2003. Tata Motors is based in Mumbai, India. Tata
Motors Limited is a part of Tata Group.
Product Portfolio
Tata Motors' product range covers passenger cars, multi-utility
vehicles as well as light, medium and heavy commercial vehicles
for goods and passenger transport. The company developed India's
first indigenously developed light commercial vehicle, India's
first sports utility vehicle and, in 1998, the Tata Indica —
India's first indigenously manufactured passenger car. Within two
years of launch, Tata Indica became India's largest selling car
in its segment
Global Presence
In addition to the growth opportunities in the domestic market,
the company is pursuing growth through acquisitions. In 2004, it
acquired the Daewoo Commercial Vehicle Company, Korea's second-122
largest truck maker, now named Tata Daewoo Commercial Vehicles
Company. In 2005, Tata Motors acquired a 21% stake in Hispano
Carrocera, a reputed Spanish bus and coach manufacturer, with an
option to acquire the remaining stake as well.
Operational Performance
Sales improved
During OND07, the Company's net sales jumped by 4.24% as against
OND06 – from Rs69,568.40m to Rs72,518.30m.The income from the
operations includes income from the transfer of technology to two
subsidiary companies and a gain on transfer of activity relating
to financing of Construction Equipment to Tata Capital Ltd.
During OND07 pursuant to the agreement signed with Flat Group
automobiles SpA Italy and Fiat India Automobiles Pvt Ltd (FIAPL)
for establishment of joint venture to manufacture passenger cars
engines and transmissions at Ranjangaon in India.
Financial Performance
Margins shrivelled
OPM during OND07 reduced to 12.75%. During OND07 there was
increase in the plastic cost which resulted in the shrinkage of
margins.
123
The total operational expenditure as percentage of sales was
around 88% during OND07 as compared to 86% during OND06. The
operating profit fell by 1.43% YoY during OND07. During OND07
the Company sold 11.11 % of its holding in its 100% subsidiary HV
Axies Ltd (HVAL). Profit on sale of these shares amounting to
Rs650m is included in other income. Due to increase in the
interest charges and depreciation as percentage of sales, the NPM
got affected. NPM went down to 6.88% during OND07.
Stock Performance
The Indian economy grew at a healthy 9% plus, boosting investor
confidence further. During this 52week period, the 30-share BSE
Sensex went up by 39.83% or 5,153 points during this period
under consideration - from 12,938 to 18,091 - between Feb07 and
Jan08. The price-to-earning multiple rose to over 25. Foreign
investors feel India is still a very attractive place to invest.
During the same period the Company’s share price fell by 9.9%.
The 52 week high was around Rs926.90 and 52 week low was around
Rs535. Market cap in Jan08 was around Rs272.22 billion.
Recent Strategies
Tata Motors, through its joint venture with Fiat, gained access
to Fiat’s diesel engine technology and is likely to gain access
to the latter’s strong overseas distribution network for its
124
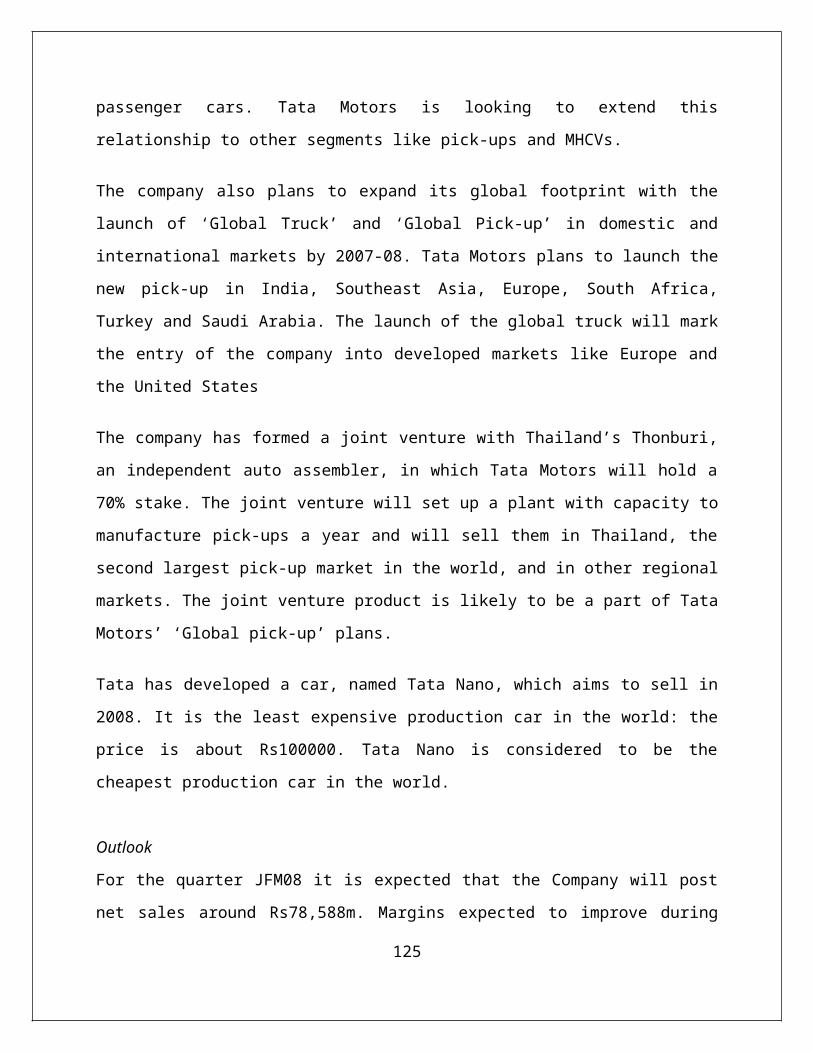
passenger cars. Tata Motors is looking to extend this
relationship to other segments like pick-ups and MHCVs.
The company also plans to expand its global footprint with the
launch of ‘Global Truck’ and ‘Global Pick-up’ in domestic and
international markets by 2007-08. Tata Motors plans to launch the
new pick-up in India, Southeast Asia, Europe, South Africa,
Turkey and Saudi Arabia. The launch of the global truck will mark
the entry of the company into developed markets like Europe and
the United States
The company has formed a joint venture with Thailand’s Thonburi,
an independent auto assembler, in which Tata Motors will hold a
70% stake. The joint venture will set up a plant with capacity to
manufacture pick-ups a year and will sell them in Thailand, the
second largest pick-up market in the world, and in other regional
markets. The joint venture product is likely to be a part of Tata
Motors’ ‘Global pick-up’ plans.
Tata has developed a car, named Tata Nano, which aims to sell in
2008. It is the least expensive production car in the world: the
price is about Rs100000. Tata Nano is considered to be the
cheapest production car in the world.
Outlook
For the quarter JFM08 it is expected that the Company will post
net sales around Rs78,588m. Margins expected to improve during
125
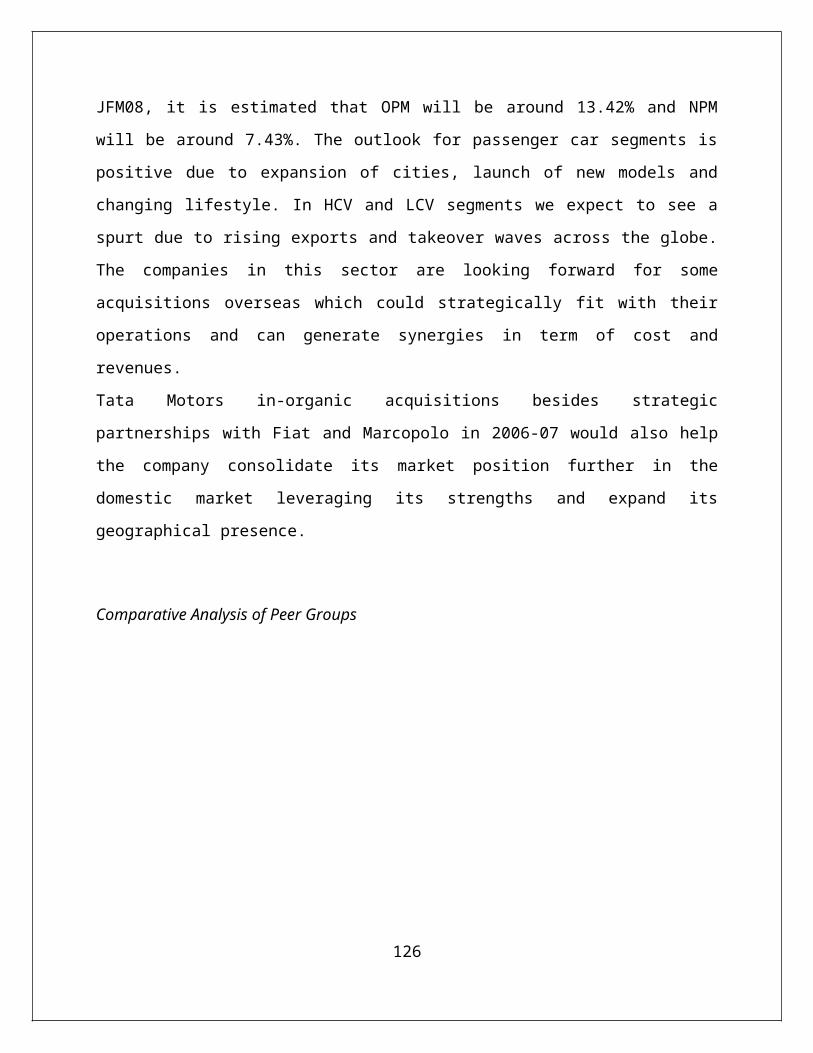
JFM08, it is estimated that OPM will be around 13.42% and NPM
will be around 7.43%. The outlook for passenger car segments is
positive due to expansion of cities, launch of new models and
changing lifestyle. In HCV and LCV segments we expect to see a
spurt due to rising exports and takeover waves across the globe.
The companies in this sector are looking forward for some
acquisitions overseas which could strategically fit with their
operations and can generate synergies in term of cost and
revenues.
Tata Motors in-organic acquisitions besides strategic
partnerships with Fiat and Marcopolo in 2006-07 would also help
the company consolidate its market position further in the
domestic market leveraging its strengths and expand its
geographical presence.
Comparative Analysis of Peer Groups
126
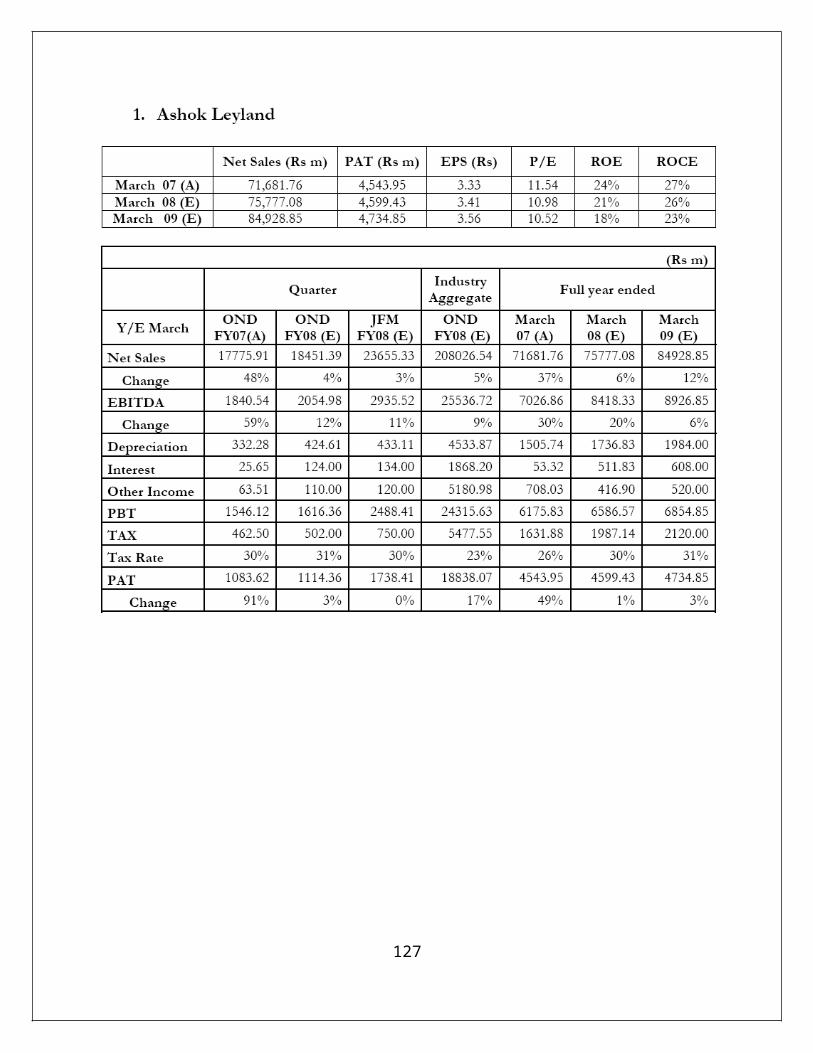
127
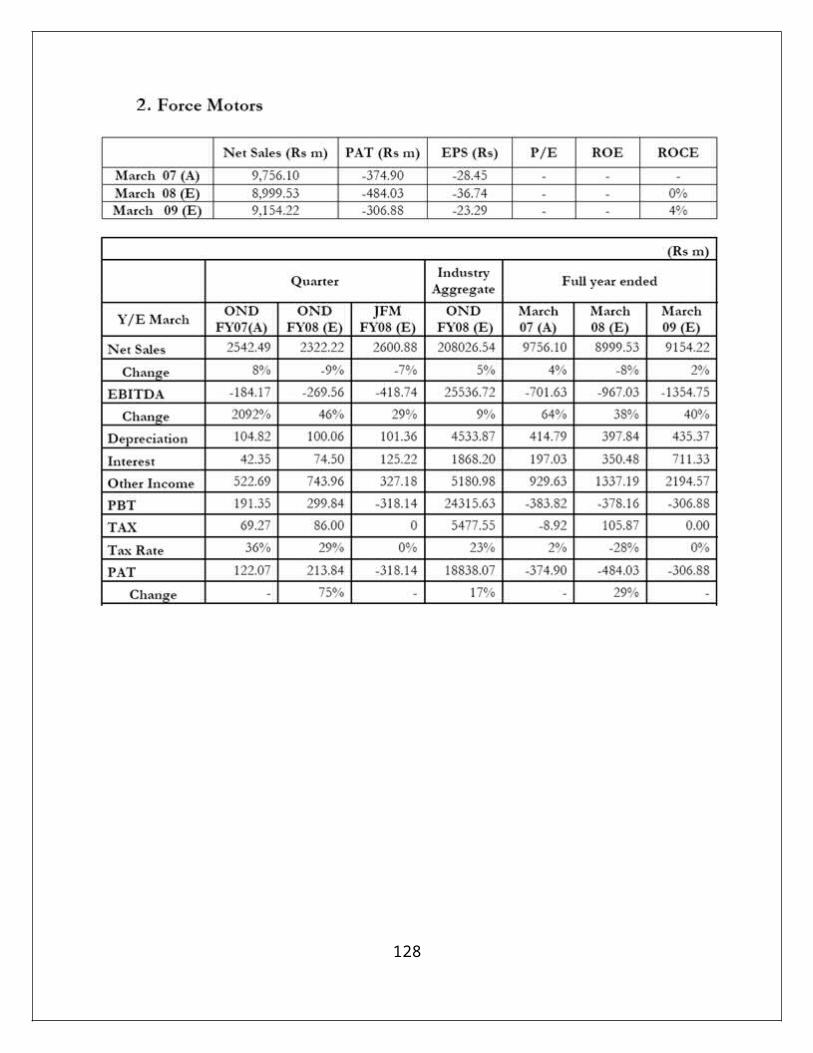
128
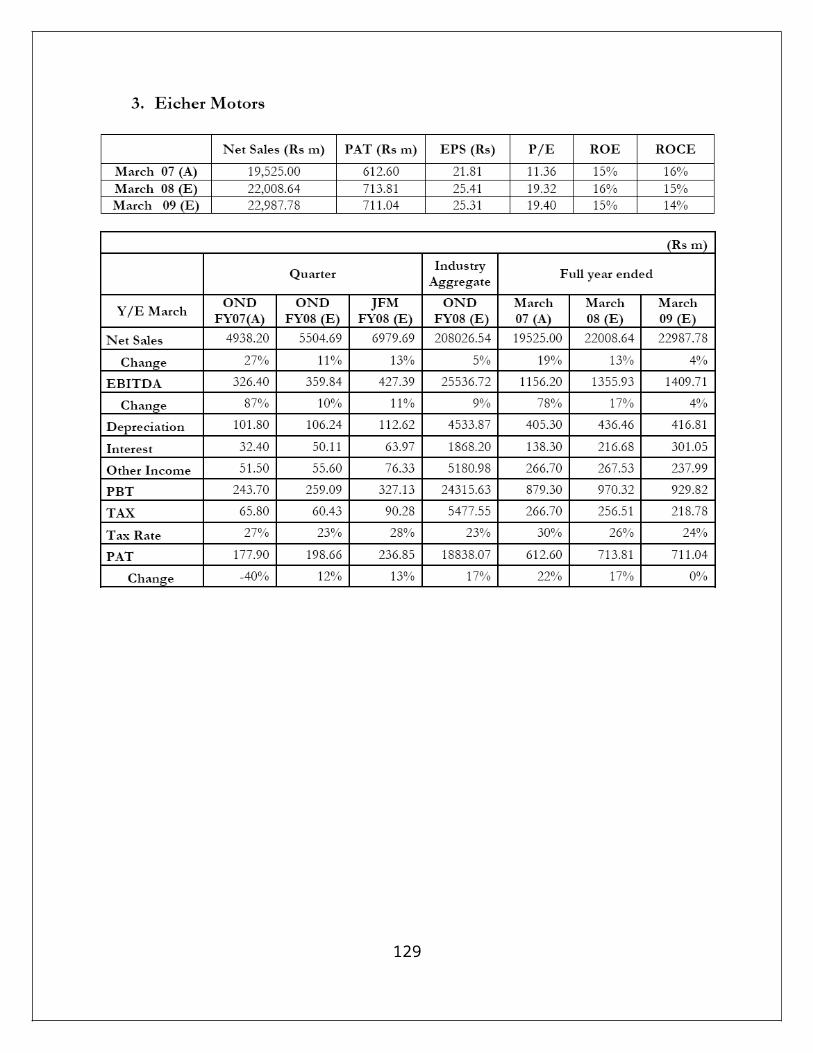
129
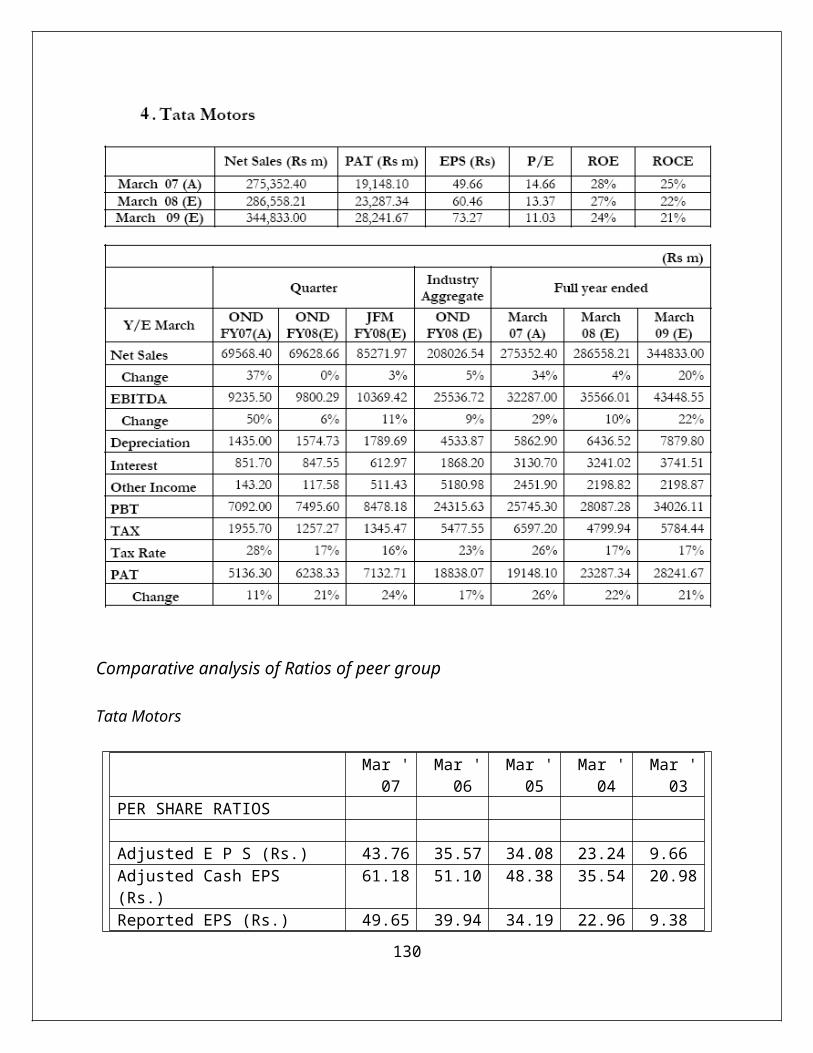
Comparative analysis of Ratios of peer group
Tata Motors
Mar '07
Mar '06
Mar '05
Mar '04
Mar '03
PER SHARE RATIOS Adjusted E P S (Rs.) 43.76 35.57 34.08 23.24 9.66Adjusted Cash EPS (Rs.)
61.18 51.10 48.38 35.54 20.98
Reported EPS (Rs.) 49.65 39.94 34.19 22.96 9.38130
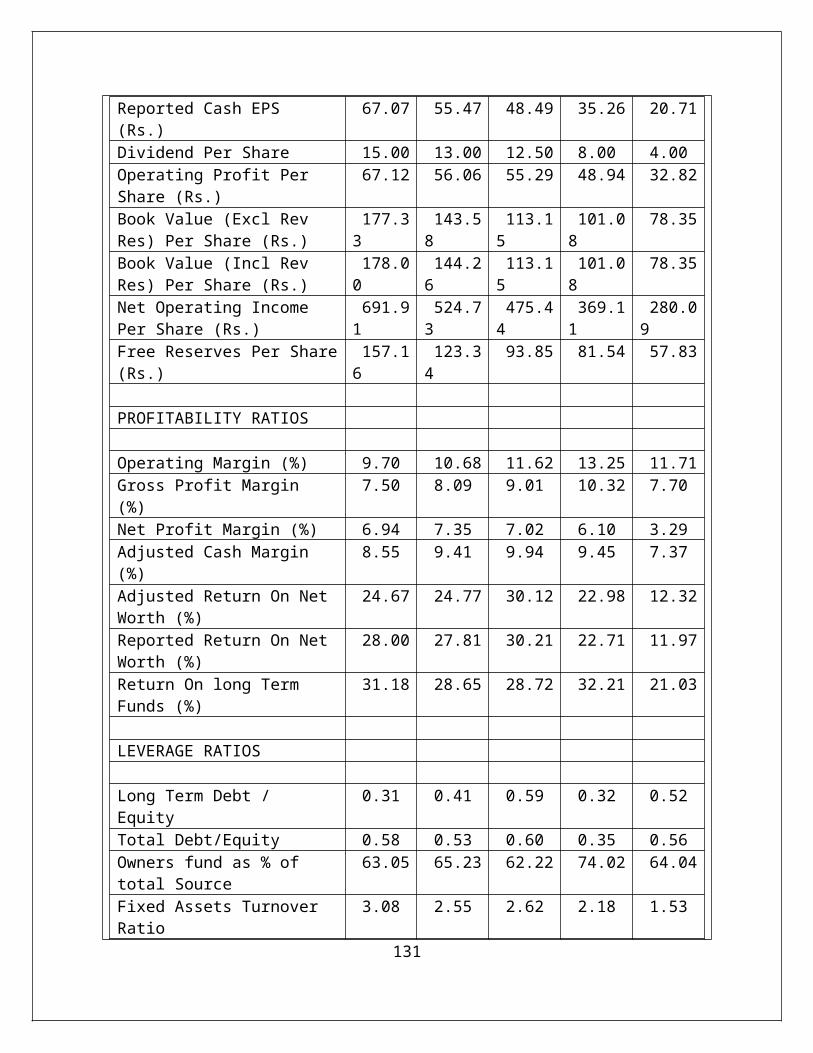
Reported Cash EPS (Rs.)
67.07 55.47 48.49 35.26 20.71
Dividend Per Share 15.00 13.00 12.50 8.00 4.00Operating Profit Per Share (Rs.)
67.12 56.06 55.29 48.94 32.82
Book Value (Excl Rev Res) Per Share (Rs.)
177.33
143.58
113.15
101.08
78.35
Book Value (Incl Rev Res) Per Share (Rs.)
178.00
144.26
113.15
101.08
78.35
Net Operating Income Per Share (Rs.)
691.91
524.73
475.44
369.11
280.09
Free Reserves Per Share(Rs.)
157.16
123.34
93.85 81.54 57.83
PROFITABILITY RATIOS Operating Margin (%) 9.70 10.68 11.62 13.25 11.71Gross Profit Margin (%)
7.50 8.09 9.01 10.32 7.70
Net Profit Margin (%) 6.94 7.35 7.02 6.10 3.29Adjusted Cash Margin (%)
8.55 9.41 9.94 9.45 7.37
Adjusted Return On Net Worth (%)
24.67 24.77 30.12 22.98 12.32
Reported Return On Net Worth (%)
28.00 27.81 30.21 22.71 11.97
Return On long Term Funds (%)
31.18 28.65 28.72 32.21 21.03
LEVERAGE RATIOS Long Term Debt / Equity
0.31 0.41 0.59 0.32 0.52
Total Debt/Equity 0.58 0.53 0.60 0.35 0.56Owners fund as % of total Source
63.05 65.23 62.22 74.02 64.04
Fixed Assets Turnover Ratio
3.08 2.55 2.62 2.18 1.53
131
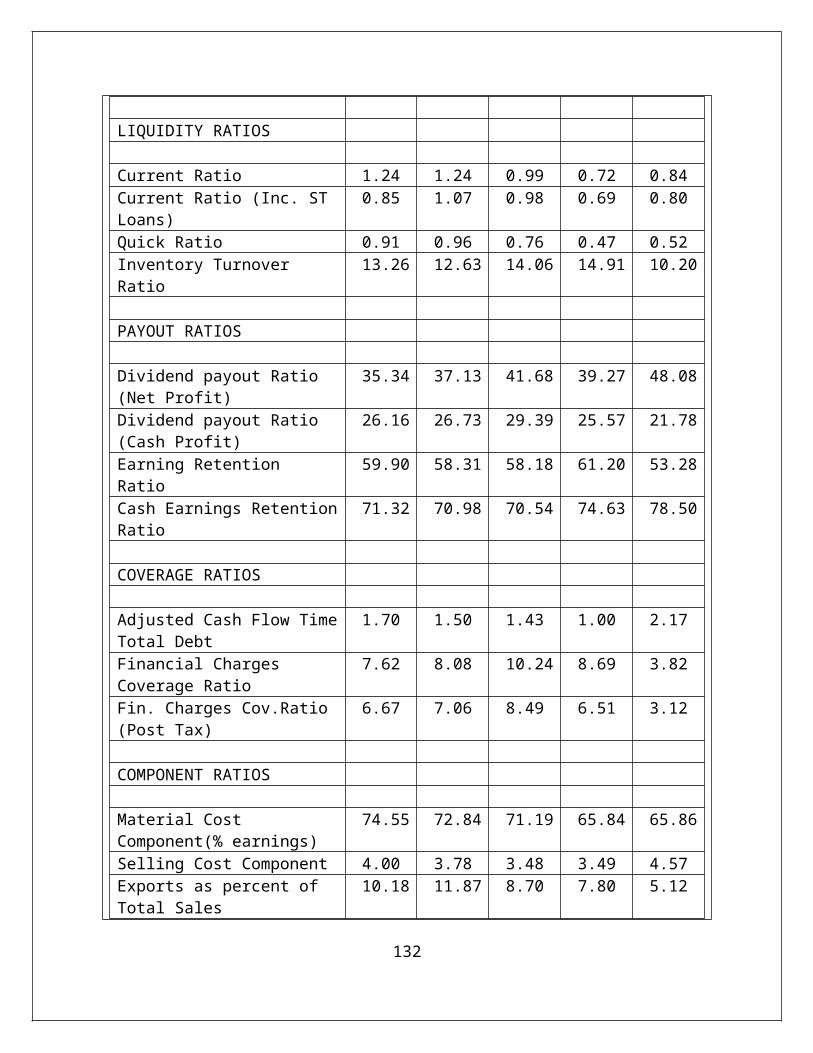
LIQUIDITY RATIOS Current Ratio 1.24 1.24 0.99 0.72 0.84Current Ratio (Inc. ST Loans)
0.85 1.07 0.98 0.69 0.80
Quick Ratio 0.91 0.96 0.76 0.47 0.52Inventory Turnover Ratio
13.26 12.63 14.06 14.91 10.20
PAYOUT RATIOS Dividend payout Ratio (Net Profit)
35.34 37.13 41.68 39.27 48.08
Dividend payout Ratio (Cash Profit)
26.16 26.73 29.39 25.57 21.78
Earning Retention Ratio
59.90 58.31 58.18 61.20 53.28
Cash Earnings RetentionRatio
71.32 70.98 70.54 74.63 78.50
COVERAGE RATIOS Adjusted Cash Flow TimeTotal Debt
1.70 1.50 1.43 1.00 2.17
Financial Charges Coverage Ratio
7.62 8.08 10.24 8.69 3.82
Fin. Charges Cov.Ratio (Post Tax)
6.67 7.06 8.49 6.51 3.12
COMPONENT RATIOS Material Cost Component(% earnings)
74.55 72.84 71.19 65.84 65.86
Selling Cost Component 4.00 3.78 3.48 3.49 4.57Exports as percent of Total Sales
10.18 11.87 8.70 7.80 5.12
132
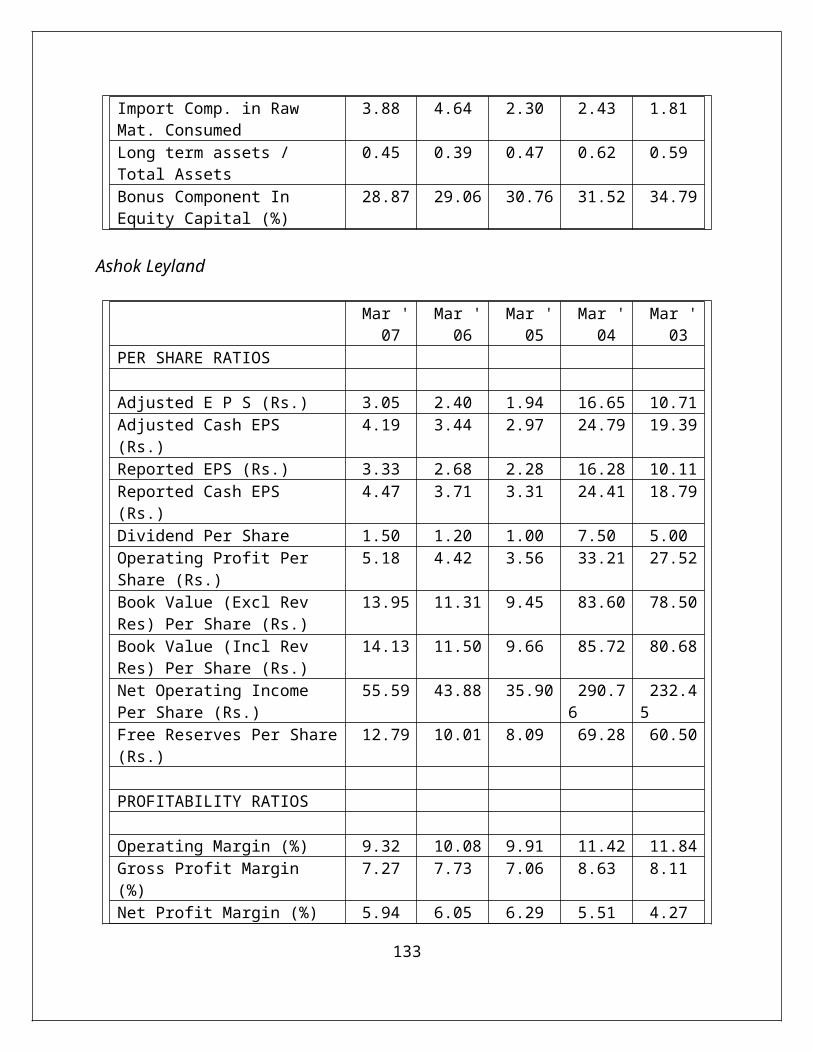
Import Comp. in Raw Mat. Consumed
3.88 4.64 2.30 2.43 1.81
Long term assets / Total Assets
0.45 0.39 0.47 0.62 0.59
Bonus Component In Equity Capital (%)
28.87 29.06 30.76 31.52 34.79
Ashok Leyland
Mar '07
Mar '06
Mar '05
Mar '04
Mar '03
PER SHARE RATIOS Adjusted E P S (Rs.) 3.05 2.40 1.94 16.65 10.71Adjusted Cash EPS (Rs.)
4.19 3.44 2.97 24.79 19.39
Reported EPS (Rs.) 3.33 2.68 2.28 16.28 10.11Reported Cash EPS (Rs.)
4.47 3.71 3.31 24.41 18.79
Dividend Per Share 1.50 1.20 1.00 7.50 5.00Operating Profit Per Share (Rs.)
5.18 4.42 3.56 33.21 27.52
Book Value (Excl Rev Res) Per Share (Rs.)
13.95 11.31 9.45 83.60 78.50
Book Value (Incl Rev Res) Per Share (Rs.)
14.13 11.50 9.66 85.72 80.68
Net Operating Income Per Share (Rs.)
55.59 43.88 35.90 290.76
232.45
Free Reserves Per Share(Rs.)
12.79 10.01 8.09 69.28 60.50
PROFITABILITY RATIOS Operating Margin (%) 9.32 10.08 9.91 11.42 11.84Gross Profit Margin (%)
7.27 7.73 7.06 8.63 8.11
Net Profit Margin (%) 5.94 6.05 6.29 5.51 4.27
133
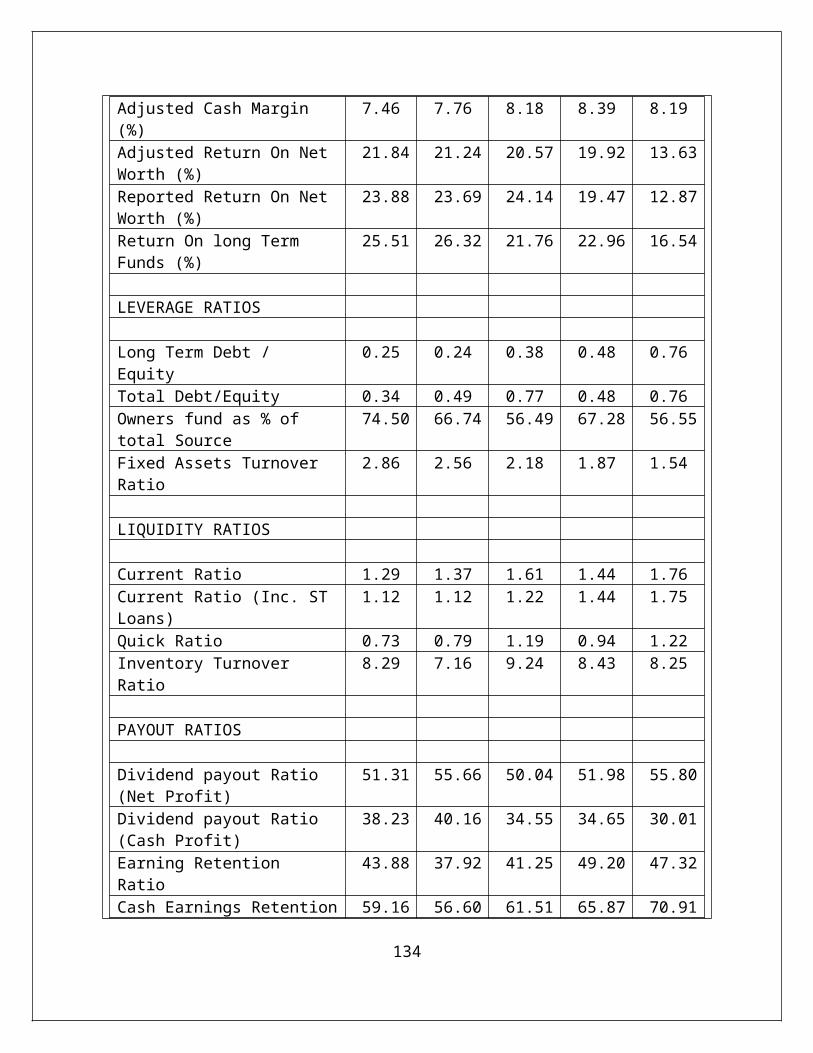
Adjusted Cash Margin (%)
7.46 7.76 8.18 8.39 8.19
Adjusted Return On Net Worth (%)
21.84 21.24 20.57 19.92 13.63
Reported Return On Net Worth (%)
23.88 23.69 24.14 19.47 12.87
Return On long Term Funds (%)
25.51 26.32 21.76 22.96 16.54
LEVERAGE RATIOS Long Term Debt / Equity
0.25 0.24 0.38 0.48 0.76
Total Debt/Equity 0.34 0.49 0.77 0.48 0.76Owners fund as % of total Source
74.50 66.74 56.49 67.28 56.55
Fixed Assets Turnover Ratio
2.86 2.56 2.18 1.87 1.54
LIQUIDITY RATIOS Current Ratio 1.29 1.37 1.61 1.44 1.76Current Ratio (Inc. ST Loans)
1.12 1.12 1.22 1.44 1.75
Quick Ratio 0.73 0.79 1.19 0.94 1.22Inventory Turnover Ratio
8.29 7.16 9.24 8.43 8.25
PAYOUT RATIOS Dividend payout Ratio (Net Profit)
51.31 55.66 50.04 51.98 55.80
Dividend payout Ratio (Cash Profit)
38.23 40.16 34.55 34.65 30.01
Earning Retention Ratio
43.88 37.92 41.25 49.20 47.32
Cash Earnings Retention 59.16 56.60 61.51 65.87 70.91
134
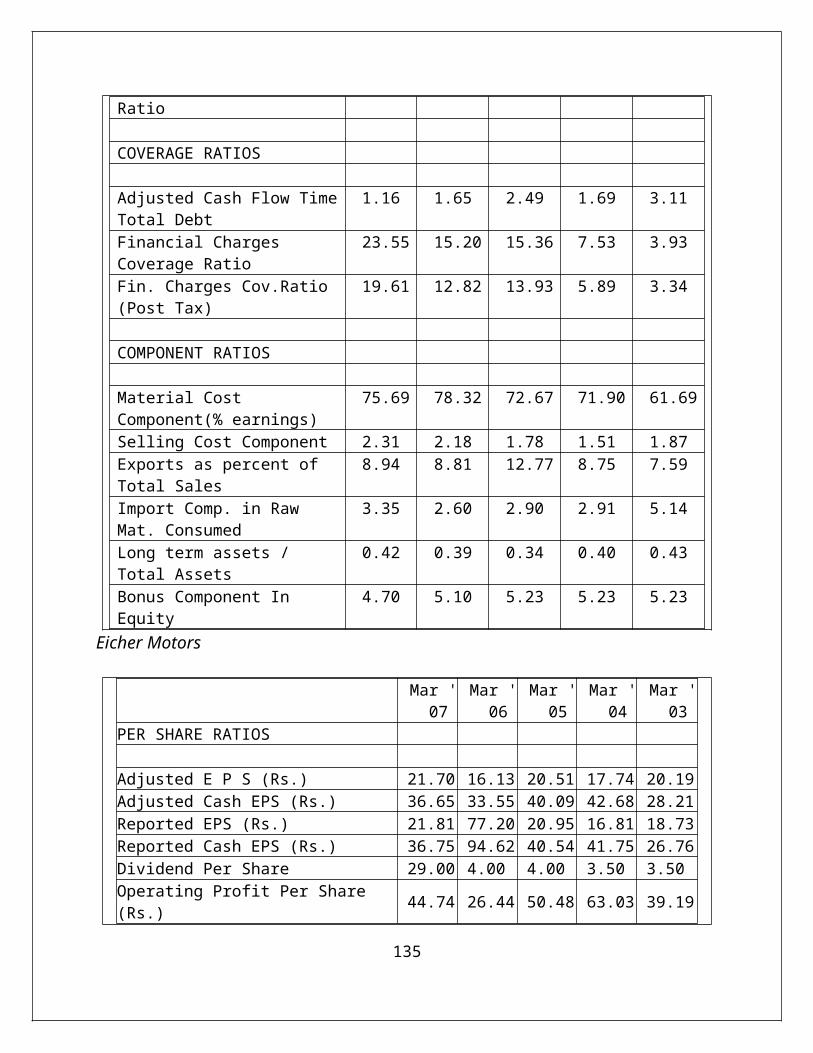
Ratio COVERAGE RATIOS Adjusted Cash Flow TimeTotal Debt
1.16 1.65 2.49 1.69 3.11
Financial Charges Coverage Ratio
23.55 15.20 15.36 7.53 3.93
Fin. Charges Cov.Ratio (Post Tax)
19.61 12.82 13.93 5.89 3.34
COMPONENT RATIOS Material Cost Component(% earnings)
75.69 78.32 72.67 71.90 61.69
Selling Cost Component 2.31 2.18 1.78 1.51 1.87Exports as percent of Total Sales
8.94 8.81 12.77 8.75 7.59
Import Comp. in Raw Mat. Consumed
3.35 2.60 2.90 2.91 5.14
Long term assets / Total Assets
0.42 0.39 0.34 0.40 0.43
Bonus Component In Equity
4.70 5.10 5.23 5.23 5.23
Eicher Motors
Mar '07
Mar '06
Mar '05
Mar '04
Mar '03
PER SHARE RATIOS Adjusted E P S (Rs.) 21.70 16.13 20.51 17.74 20.19Adjusted Cash EPS (Rs.) 36.65 33.55 40.09 42.68 28.21Reported EPS (Rs.) 21.81 77.20 20.95 16.81 18.73Reported Cash EPS (Rs.) 36.75 94.62 40.54 41.75 26.76Dividend Per Share 29.00 4.00 4.00 3.50 3.50Operating Profit Per Share (Rs.) 44.74 26.44 50.48 63.03 39.19
135
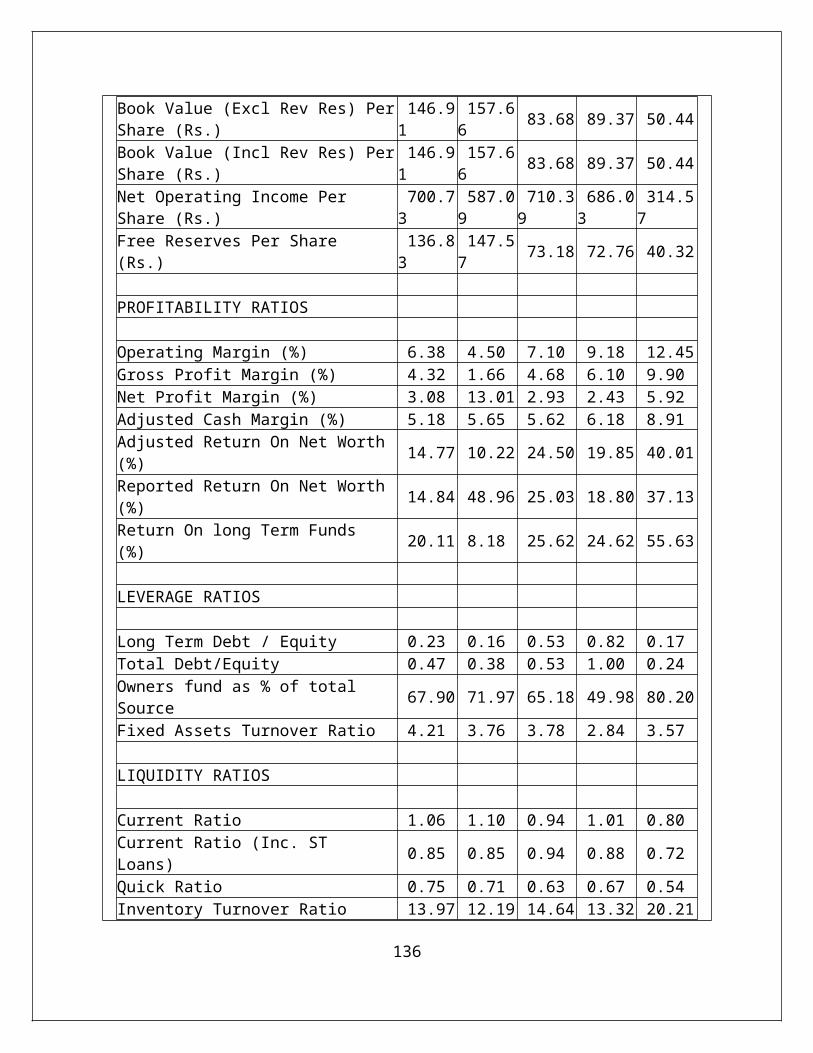
Book Value (Excl Rev Res) PerShare (Rs.)
146.91
157.66 83.68 89.37 50.44
Book Value (Incl Rev Res) PerShare (Rs.)
146.91
157.66 83.68 89.37 50.44
Net Operating Income Per Share (Rs.)
700.73
587.09
710.39
686.03
314.57
Free Reserves Per Share (Rs.)
136.83
147.57 73.18 72.76 40.32
PROFITABILITY RATIOS Operating Margin (%) 6.38 4.50 7.10 9.18 12.45Gross Profit Margin (%) 4.32 1.66 4.68 6.10 9.90Net Profit Margin (%) 3.08 13.01 2.93 2.43 5.92Adjusted Cash Margin (%) 5.18 5.65 5.62 6.18 8.91Adjusted Return On Net Worth (%) 14.77 10.22 24.50 19.85 40.01
Reported Return On Net Worth (%) 14.84 48.96 25.03 18.80 37.13
Return On long Term Funds (%) 20.11 8.18 25.62 24.62 55.63
LEVERAGE RATIOS Long Term Debt / Equity 0.23 0.16 0.53 0.82 0.17Total Debt/Equity 0.47 0.38 0.53 1.00 0.24Owners fund as % of total Source 67.90 71.97 65.18 49.98 80.20
Fixed Assets Turnover Ratio 4.21 3.76 3.78 2.84 3.57 LIQUIDITY RATIOS Current Ratio 1.06 1.10 0.94 1.01 0.80Current Ratio (Inc. ST Loans) 0.85 0.85 0.94 0.88 0.72
Quick Ratio 0.75 0.71 0.63 0.67 0.54Inventory Turnover Ratio 13.97 12.19 14.64 13.32 20.21
136
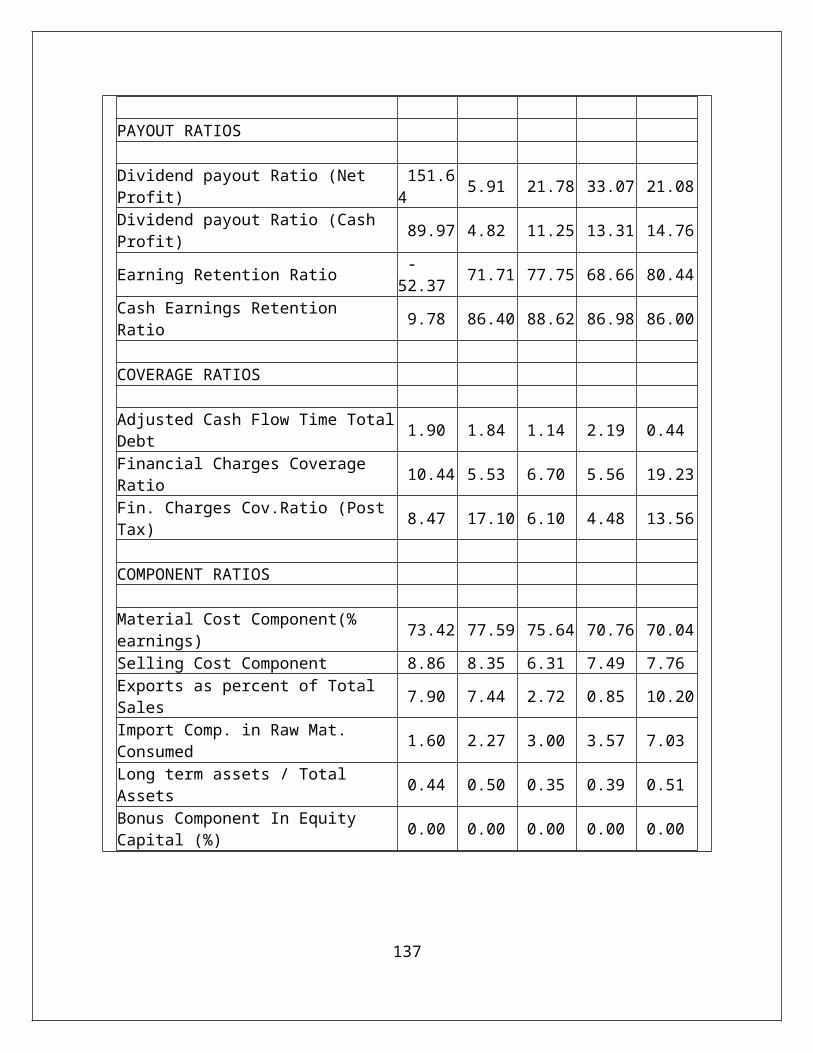
PAYOUT RATIOS Dividend payout Ratio (Net Profit)
151.64 5.91 21.78 33.07 21.08
Dividend payout Ratio (Cash Profit) 89.97 4.82 11.25 13.31 14.76
Earning Retention Ratio -52.37 71.71 77.75 68.66 80.44
Cash Earnings Retention Ratio 9.78 86.40 88.62 86.98 86.00
COVERAGE RATIOS Adjusted Cash Flow Time TotalDebt 1.90 1.84 1.14 2.19 0.44
Financial Charges Coverage Ratio 10.44 5.53 6.70 5.56 19.23
Fin. Charges Cov.Ratio (Post Tax) 8.47 17.10 6.10 4.48 13.56
COMPONENT RATIOS Material Cost Component(% earnings) 73.42 77.59 75.64 70.76 70.04
Selling Cost Component 8.86 8.35 6.31 7.49 7.76Exports as percent of Total Sales 7.90 7.44 2.72 0.85 10.20
Import Comp. in Raw Mat. Consumed 1.60 2.27 3.00 3.57 7.03
Long term assets / Total Assets 0.44 0.50 0.35 0.39 0.51
Bonus Component In Equity Capital (%) 0.00 0.00 0.00 0.00 0.00
137
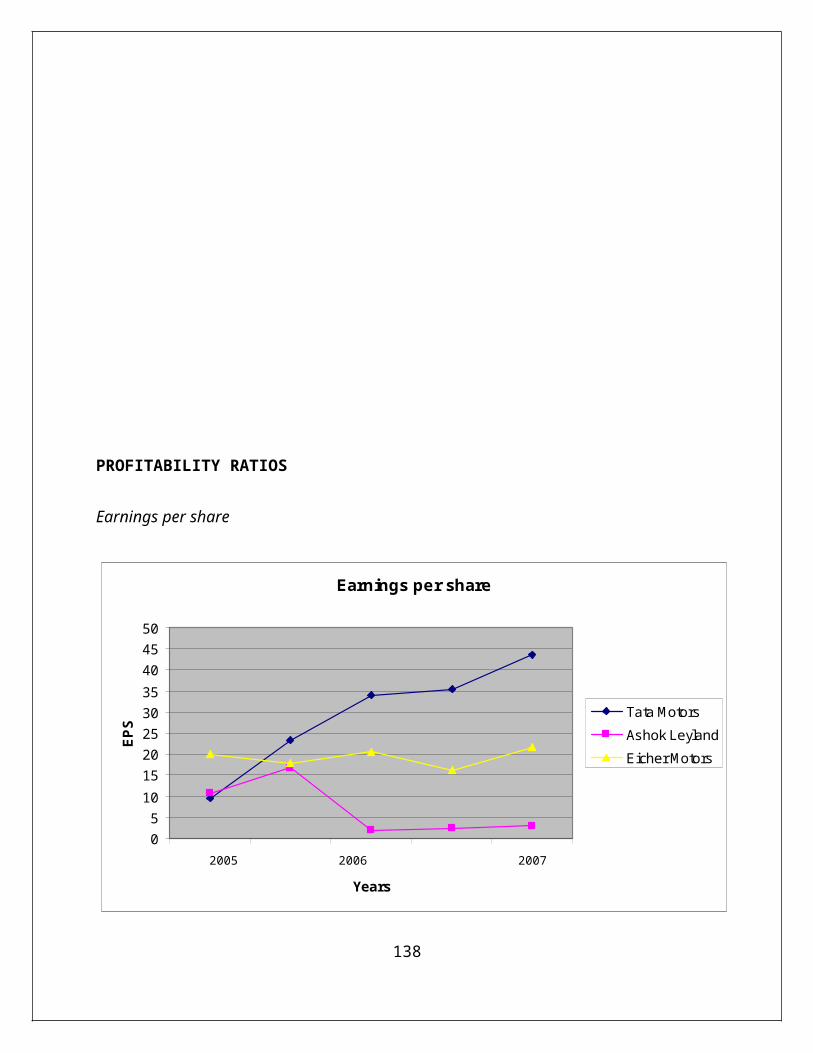
PROFITABILITY RATIOS
Earnings per share
Earnings per share
05101520253035404550
2003 2004 2005 2006 2007Years
EPS
Tata MotorsAshok LeylandEicher Motors
138
2005 2006 2007
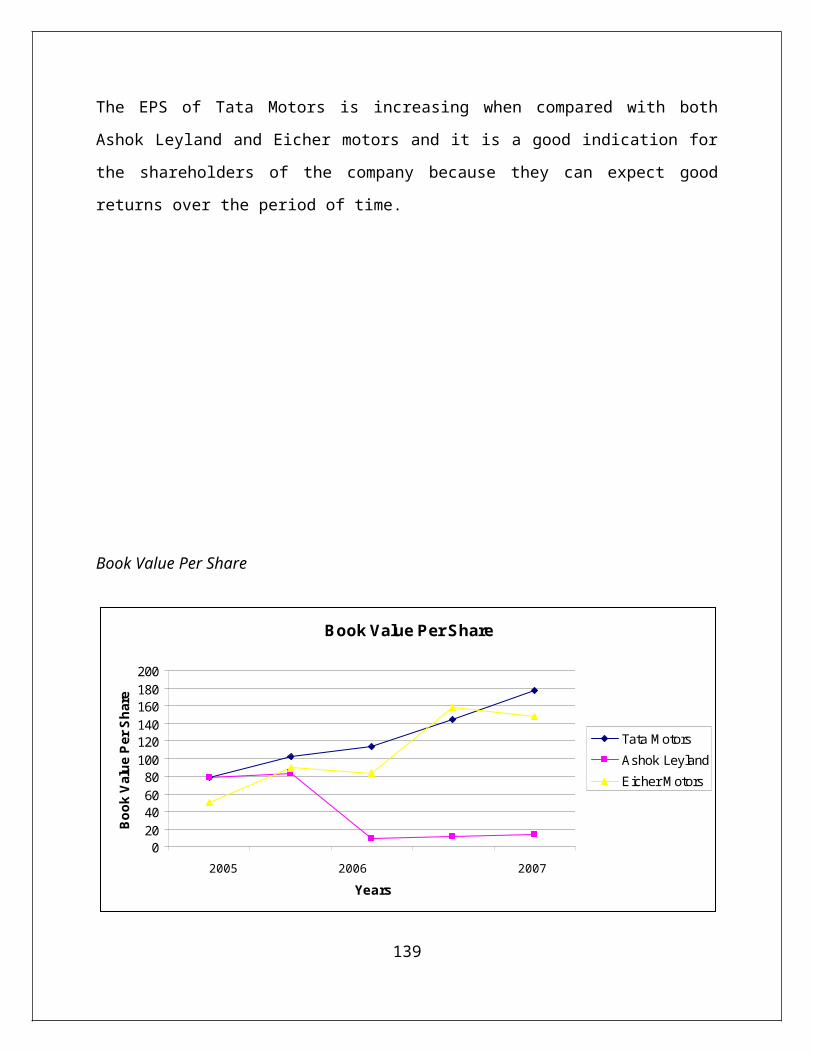
The EPS of Tata Motors is increasing when compared with both
Ashok Leyland and Eicher motors and it is a good indication for
the shareholders of the company because they can expect good
returns over the period of time.
Book Value Per Share
Book Value Per Share
020406080100120140160180200
2003 2004 2005 2006 2007Years
Book Value Per Share
Tata M otorsAshok LeylandEicher M otors
139
2005 2006 2007
The Book Value of Tata Motors is also increasing and this tells
us that the net worth of the company is increasing and it is also
a good sign and it is comparatively better than the other
companies like Ashok Leyland and Eicher motors.
LEVERAGE RATIO
Long Term Debt Equity Ratio
140
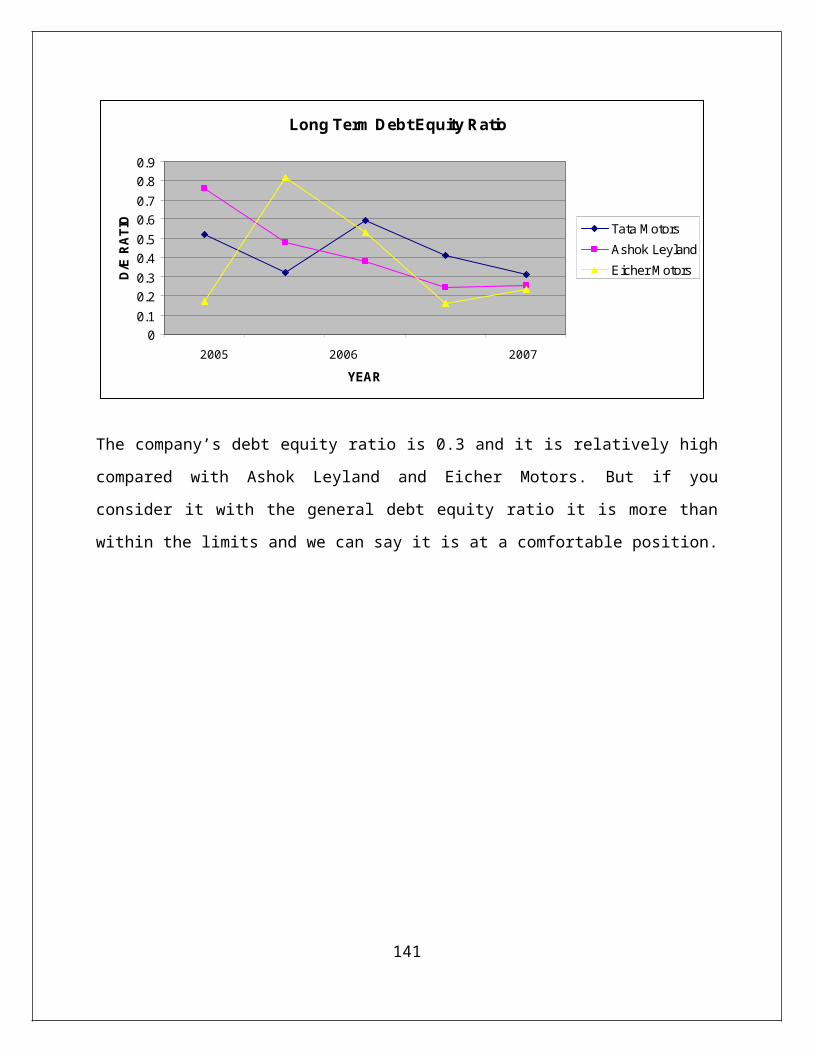
Long Term Debt Equity Ratio
00.10.20.30.40.50.60.70.80.9
2003 2004 2005 2006 2007YEAR
D/E RA
TIO Tata M otors
Ashok LeylandEicher M otors
The company’s debt equity ratio is 0.3 and it is relatively high
compared with Ashok Leyland and Eicher Motors. But if you
consider it with the general debt equity ratio it is more than
within the limits and we can say it is at a comfortable position.
141
2005 2006 2007
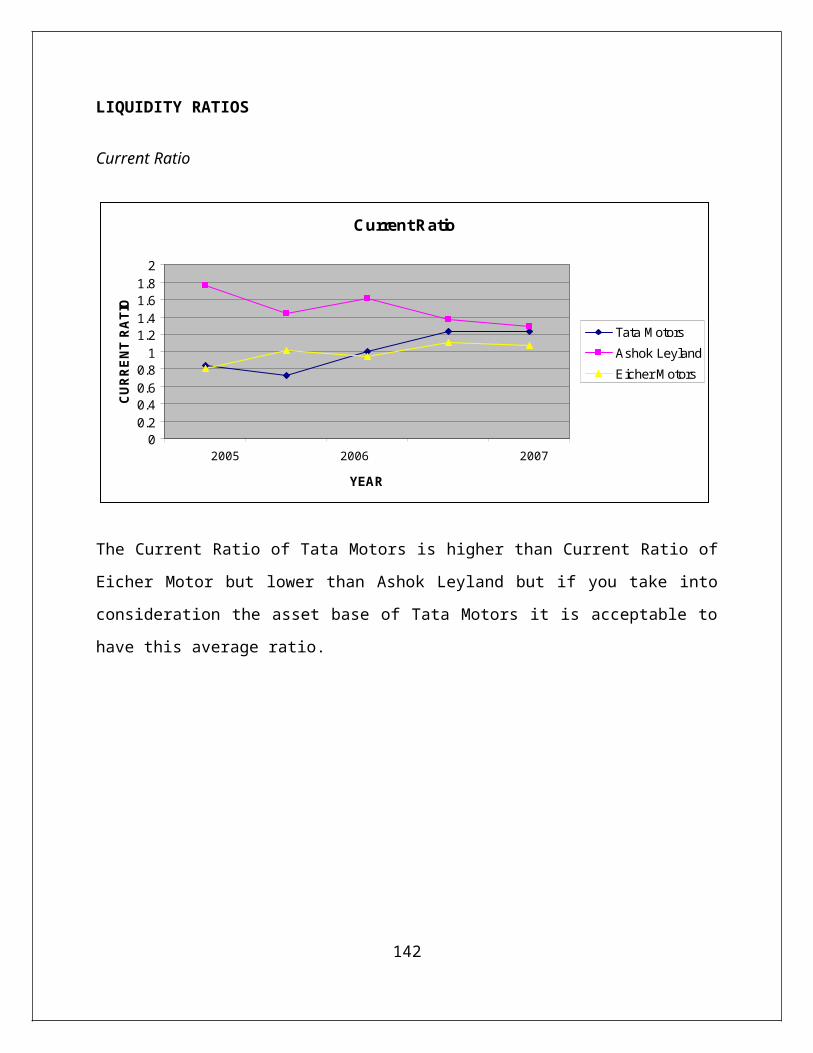
LIQUIDITY RATIOS
Current Ratio
Current Ratio
00.20.40.60.81
1.21.41.61.82
2003 2004 2005 2006 2007YEAR
CURR
ENT RA
TIO
Tata M otorsAshok LeylandEicher M otors
The Current Ratio of Tata Motors is higher than Current Ratio of
Eicher Motor but lower than Ashok Leyland but if you take into
consideration the asset base of Tata Motors it is acceptable to
have this average ratio.
142
2005 2006 2007 2005 2006 2007
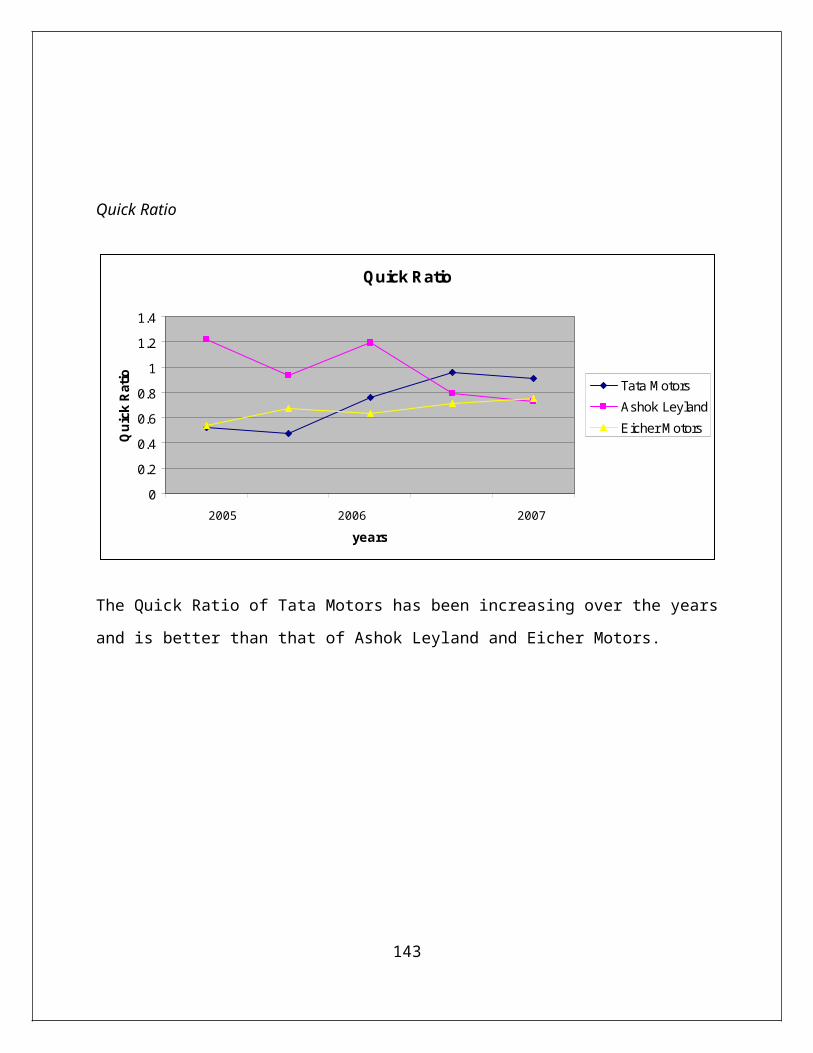
Quick Ratio
Quick Ratio
00.20.40.60.81
1.21.4
2003 2004 2005 2006 2007years
Quick Ra
tio Tata M otorsAshok LeylandEicher M otors
The Quick Ratio of Tata Motors has been increasing over the years
and is better than that of Ashok Leyland and Eicher Motors.
143
2005 2006 2007
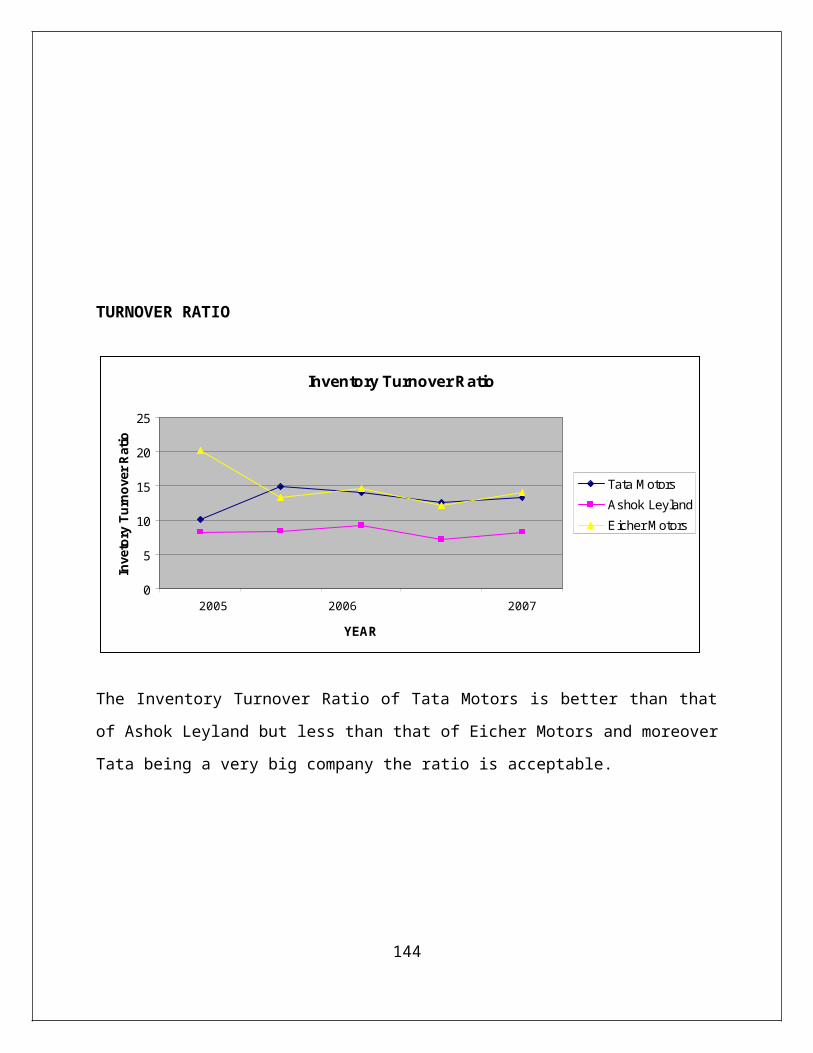
TURNOVER RATIO
Inventory Turnover Ratio
0
5
10
15
20
25
2003 2004 2005 2006 2007YEAR
Invetory Turno
ver R
atio
Tata M otorsAshok LeylandEicher M otors
The Inventory Turnover Ratio of Tata Motors is better than that
of Ashok Leyland but less than that of Eicher Motors and moreover
Tata being a very big company the ratio is acceptable.
144
2005 2006 2007 2005 2006 2007
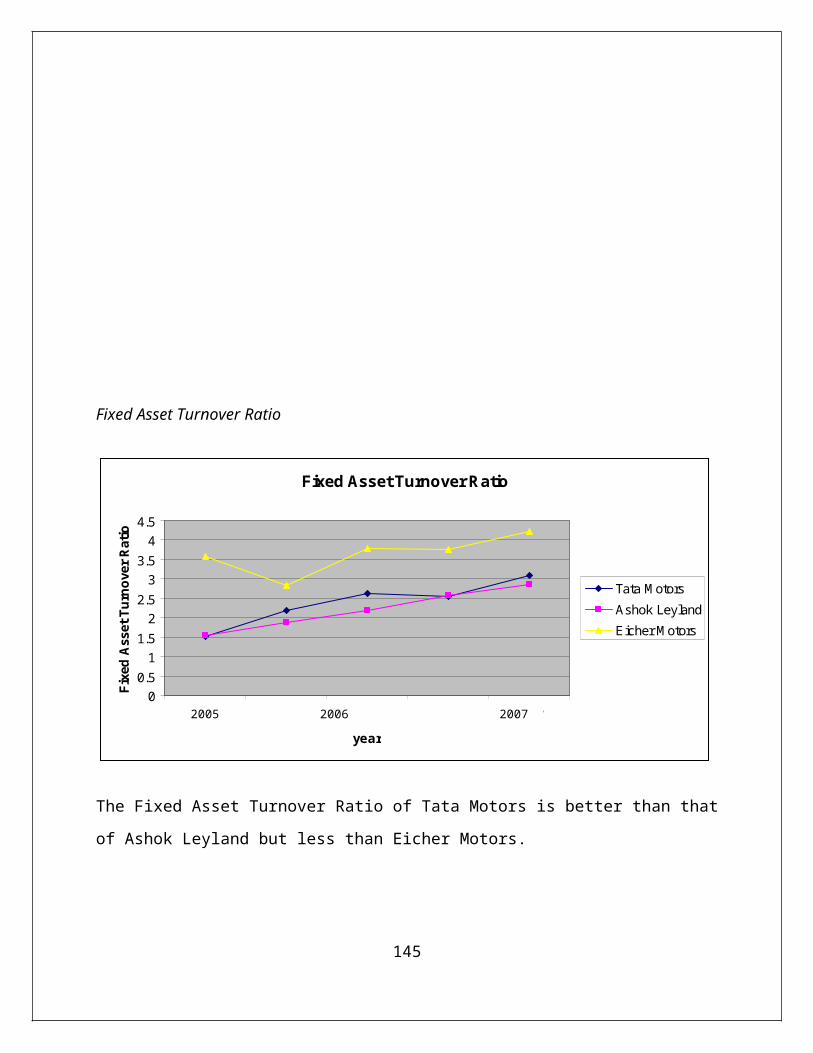
Fixed Asset Turnover Ratio
Fixed Asset Turnover Ratio
00.51
1.52
2.53
3.54
4.5
2003 2004 2005 2006 2007year
Fixed As
set T
urno
ver R
atio
Tata M otorsAshok LeylandEicher M otors
The Fixed Asset Turnover Ratio of Tata Motors is better than that
of Ashok Leyland but less than Eicher Motors.
145
2005 2006 2007
SWOT ANALYSIS OF TATA MOTORS
SWOT analysis of a company is very important in doing its
strategic analysis.
Strengths:
1. Leadership position in M&HCV buses and in growing >35 ton
articulated trucks.
2. The company have overcome production bottlenecks and to a
large extent has achieved satisfactory production levels in
all its plants.
3. The company have adopted six sigma in design and benefits of
that have started flowing in.
146
4. Domain expert groups are formed to understand the customer
needs and to solve their problems.
5. Implementation of customer connects a customer relationship
process including dealer management system and product
lifecycle management process.
6. Company is getting equipped to offer cost effective
solutions.
7. Strong and well qualified management is also one of biggest
strength of the company.
Opportunities:
1. Company has also entered into LCV market which has huge
growth opportunities in future.
2. Company have started receiving some good orders from Indian
army for supplying water browsers & CKD kits.
3. There is huge opportunities for the company in the world
markets and company is targeting it well . Exports which are
currently 8 % of revenues company is planning to increase it
to 10% of revenues.
4. Company is aggressively developing its allied business
because of cyclical nature of commercial vehicle business.
147
Threats:
1. Commercial vehicle business is cyclical in nature and this
could effect company’s growth in future.
2. Ashok Leyland and now Mahindra & Mahindra are bigger and
tougher competitors of the company,
3. Changing governmentt policies like introduction of BS-2
norms in certain states made company to suffer some losses,
4. A concern on increase in price of inputs due to increase in
price of Commodities & due to competitive pressures these
price increases cannot be fully passes on to consumers.
Weakness:
1. Cyclical nature of the commercial vehicles business in one
of the biggest weakness.
2. Business of the Company is not diversified enough.
148
VALUATION OF TATA MOTORS
ASSUMPTIONS
Income Statement:
Sales have been projected by 20% increase every year
Excise Duty has been projected by taking it in percentage of
sales and that comes out to be 13%
Dividend and other income has been projected by taking it in
percentage of net sales and it comes out to be 0.65%
Manufacturing and other expenses are projected by taking it
as percentage of sales and it comes out to be 80%
149
Expenditure translated to other accounts has been taken as
percentage of sales and it comes out to be 20%
Product development expenditure is taken as percentage of
PBDITA and it comes out to be 1.75%
Depreciation is taken as a percentage of Net Block and it
comes out to be 14%
Interest is taken as a percentage of total loans and it
comes out to be 14%
Amortization of miscellaneous expenditures in subsidiaries
is taken as constant at Rs m 5
Tax rate has been taken as 30% of PBT
CHAPTER 6
CONCLUSION AND LIMITATIONS
The sole aim of this project has been to find out the intrinsic
value of Tata Motors as on 1st April 2008. In the study conducted
above it is clear that Indian Economy has a bright future ahead.
I don’t see any setbacks for the Indian Economy which is booming
150
because of rising domestic consumption. If Indian Economy would
continue to grow than auto sector which is closely related with
economy growth would grow and I could say that Tata Motors would
have a bright future ahead because it has huge potential to grow.
What is Intrinsic Value?
It is defined as the perceived actual value of a security, as
opposed to its market price or book value. Investor perception
does matter but perceived value does not come from vacuum. It is
possible to estimate value of a security from its financial
fundamentals and the price should not deviate too long form this
value. The most frequent technique of value estimation is
discounting the free cash flow (FCF) by a risk factor or Cost of
Equity. In this study when I applied free cash flow technique to
Tata Motors I got its intrinsic value to be Rs 686(FCFE).
Using the intrinsic value as benchmark undervalued stocks can be
placed under two broad heads – Value picks and Growth Stories.
Value Picks
Value picks are those stocks that currently trade at a low price
relative to their fundamentals (i.e. dividends, earnings, sales,
etc.). Therefore, stocks that have a relatively high dividend
yield; low price to sales ratio; and/or low PE ratio would tend
to be classified as value stocks. The low valuations that value
151
stocks enjoy are often as a result of some type of bad news (i.e.
poor earnings report, bad press, legal issues, etc.).
Value-stock investors believe that the market always overreacts
to news, either good or bad. When the news is good, the stock
price rises out of proportion to the long-term affect that news
is likely to have on the company’s future performance. By
contrast, when unexpected bad news happens, the share price
typically takes a worse drubbing than the fundamentals dictate.
To be a value investors look out for companies with sound
financial statements after assuring yourself that the problems
are temporary, or manageable. For example, Tata Motors is a
certain value pick at level of around Rs 550 and even at levels
of Rs 600 it is a value pick because according to my model which
is the 1st model in the excel sheets attached the value of the
stock should be around Rs686 and company currently is trading at
P/E & P/Bv ratios which is less than the overall sectoral P/E and
P/Bv ratios. Keep constant watch on such fundamental strong
stocks and look out for lower than average price-to-book or
price-to-earning ratios. In the long-term the scrip should
confirm to its averages. Hold these stocks as their prospects
brighten and they become growth stories. One caution- You may
have to hold the scrip patiently for 2-5 years to unlock its
value.
Growth stories 152
The recent rally in mid-caps relate to this theme. Growth stories
are companies whose earnings are expected to grow at an above
average rate relative to the market. A growth stock usually has a
high P/E ratio and won't pay a dividend as it has large capex &
other expenses. I am not disclosing any such scrip in this
article as it is not what the article is meant for. This
conclusion will drive you to discover such ideas yourself by
inspiring you to get answer to the following questions:
1. Is there indication of market correction in the near term?
Remember patience is the key to finding value picks and growth
stocks may fall sharply in event of any market correction.
2. Has the company demonstrated a consistent history of growth in
revenues?
3. Future - Importantly, examine how fast the company is expected
to grow and how? Look for its order book, existing clients,
technical tie-ups and above-all market acceptance/size for its
products.
4. Price to Sales ratio - It is particularly for companies with
comparatively low price/sales ratio over a period of 2-3 years,
as it shows that the share price is not appreciating with rising
income. However, do satisfy the reasons why a company is trading
at a low multiple. There may be compelling reason to stay away.
5. Price Earnings Growth Ratio (PEG) – Current PE ratio tells
about past. Try to project 3-5 year earnings growth (use
historical CAGR to start with) and then calculate PEG ratio. A
PEG of less than 1 indicates that the firm may be undervalued. In153
the case of Tata Motors the P/E ratio is around 14 times and
earning growth is around 20% which we can see from financial
forecast which is attached in excel sheets this gives PEG ratio
of less than 1 signifying the company is undervalued.
6. Free Cash Flow (FCF) – At the end of the day it’s the free
cash in your hand that matters. Free cash flow is the cash from
operations less capital expenditures and other investments that
are necessary to sustain and grow the business. Prefer companies
generating more free cash.
Exit
Don’t get panicked by intermittent downs. Share prices take
breather in-between wherein few investors get-out and many more
buy-in for a value/ growth story. However, always do periodic
reviews to ascertain in-case there has been a substantial change
in the fundamentals or qualitative characteristics of the
company. A good idea is to set a target return from the share and
sell it off without regretting later in case its price moves up
further. Like in the case of Tata Motors the company’s
fundamental have not changed but company is hit majorly due to
market forces.
My suggestions to the investors are that they can go for Tata
Motors as a value pick because all the company is undervalued.
Company’s average last one year price is Rs 600 ( April 1 ,07-
March 29, 08) and currently as on March 31 the company is trading154
around Levels of Rs 602.30 but according to free cash flow to
firm valuations the company should trade around Rs 686 so there
is still some upside left in the stock of this company. In
conclusion I have attempted to present the intrinsic worth of the
stock; it may be taken as an investment call.
Limitations of the study
1. I have only analyzed the financial statements as per
INDIAN GAAP. For valuation purpose we have ignored
the ADR issues of Tata Motors.
2. I did not get any opportunity to meet the management of
Tata Motors Ltd. which is essential for any analyst to
prepare a research report.
155
3. I didn’t have any sort of access to any of the previous
work or any sort of research report on this company
done by some person or a company.
4. This work is totally based on my opinion about the
company and auto sector and Indian capital markets.
5. The assumptions that are taken are based on my
expectations of the company after
doing good study of the annual report and the sector
reports and they may or may not come true and therefore
there may be some variations when compared with any
other reports
ANNEXURE
Income Statement
Tata Motors Limited 156
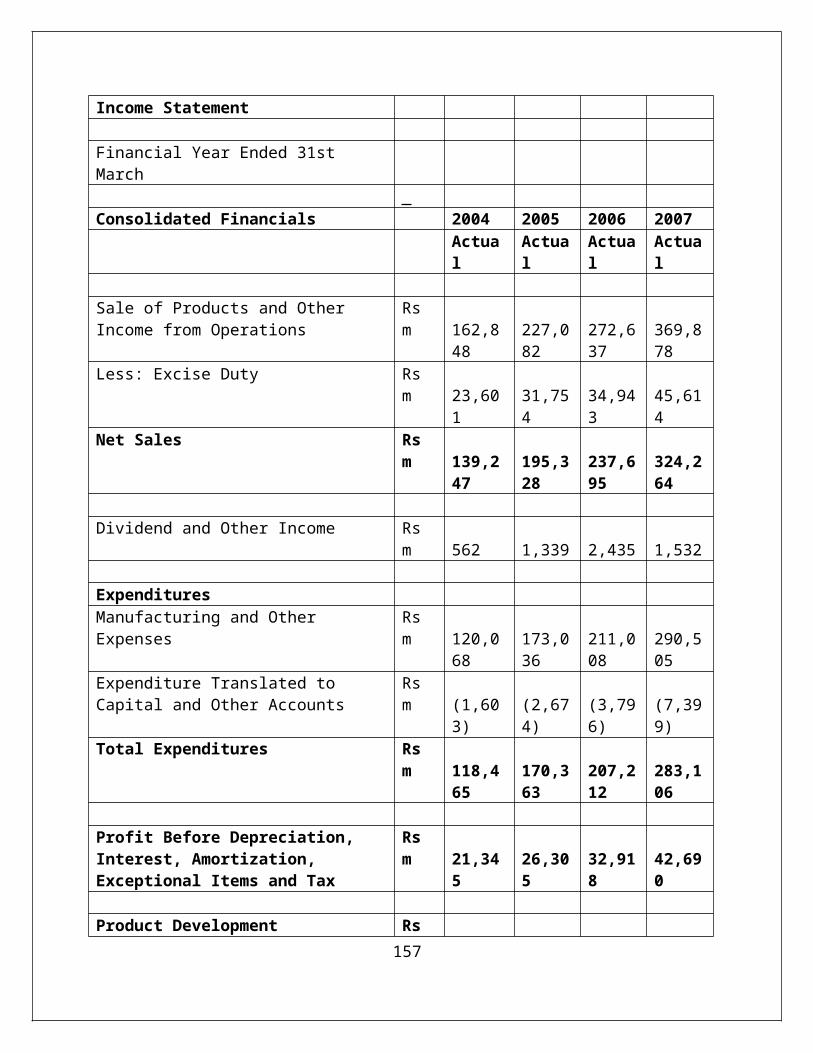
Income Statement Financial Year Ended 31st March
Consolidated Financials 2004 2005 2006 2007 Actua
lActual
Actual
Actual
Sale of Products and Other Income from Operations
Rs m
162,848
227,082
272,637
369,878
Less: Excise Duty Rs m
23,601
31,754
34,943
45,614
Net Sales Rs m
139,247
195,328
237,695
324,264
Dividend and Other Income Rs
m 562
1,339
2,435
1,532
Expenditures Manufacturing and Other Expenses
Rs m
120,068
173,036
211,008
290,505
Expenditure Translated to Capital and Other Accounts
Rs m
(1,603)
(2,674)
(3,796)
(7,399)
Total Expenditures Rs m
118,465
170,363
207,212
283,106
Profit Before Depreciation, Interest, Amortization, Exceptional Items and Tax
Rs m
21,345
26,305
32,918
42,690
Product Development Rs
157
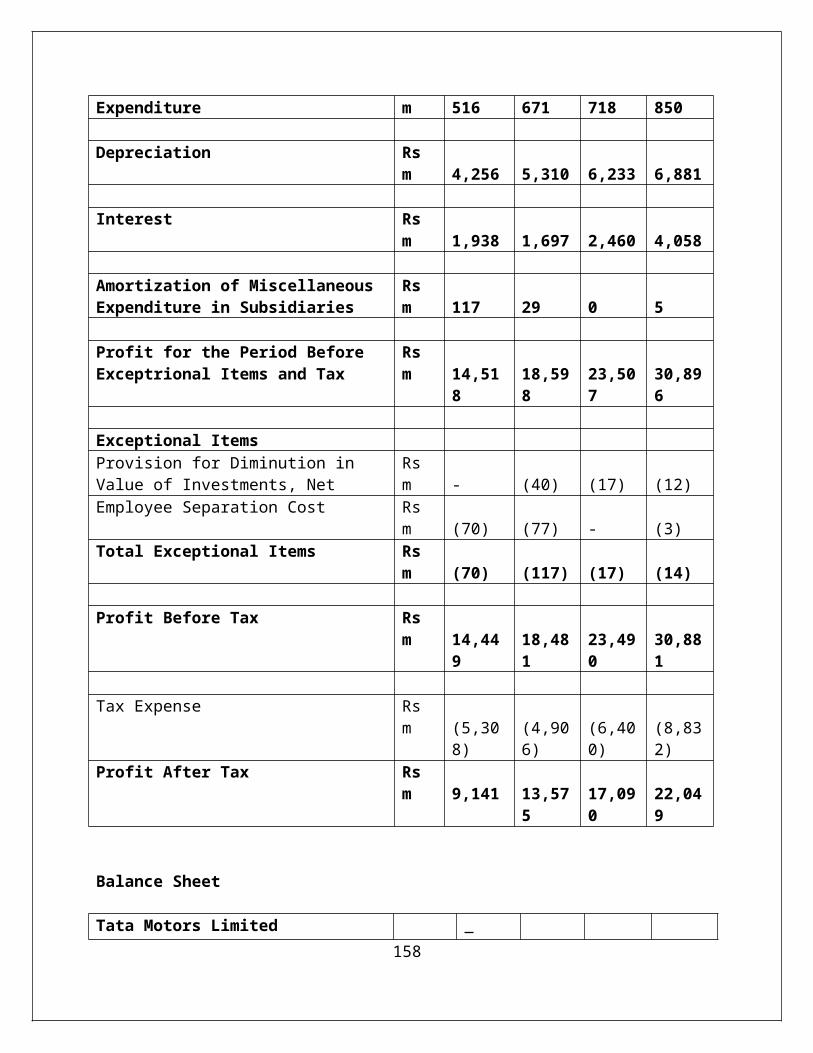
Expenditure m 516 671 718 850 Depreciation Rs
m 4,256
5,310
6,233
6,881
Interest Rs
m 1,938
1,697
2,460
4,058
Amortization of Miscellaneous Expenditure in Subsidiaries
Rs m
117
29
0
5
Profit for the Period Before Exceptrional Items and Tax
Rs m
14,518
18,598
23,507
30,896
Exceptional Items Provision for Diminution in Value of Investments, Net
Rs m
-
(40)
(17)
(12)
Employee Separation Cost Rs m
(70)
(77)
-
(3)
Total Exceptional Items Rs m
(70)
(117)
(17)
(14)
Profit Before Tax Rs
m 14,449
18,481
23,490
30,881
Tax Expense Rs
m (5,308)
(4,906)
(6,400)
(8,832)
Profit After Tax Rs m
9,141
13,575
17,090
22,049
Balance Sheet
Tata Motors Limited 158
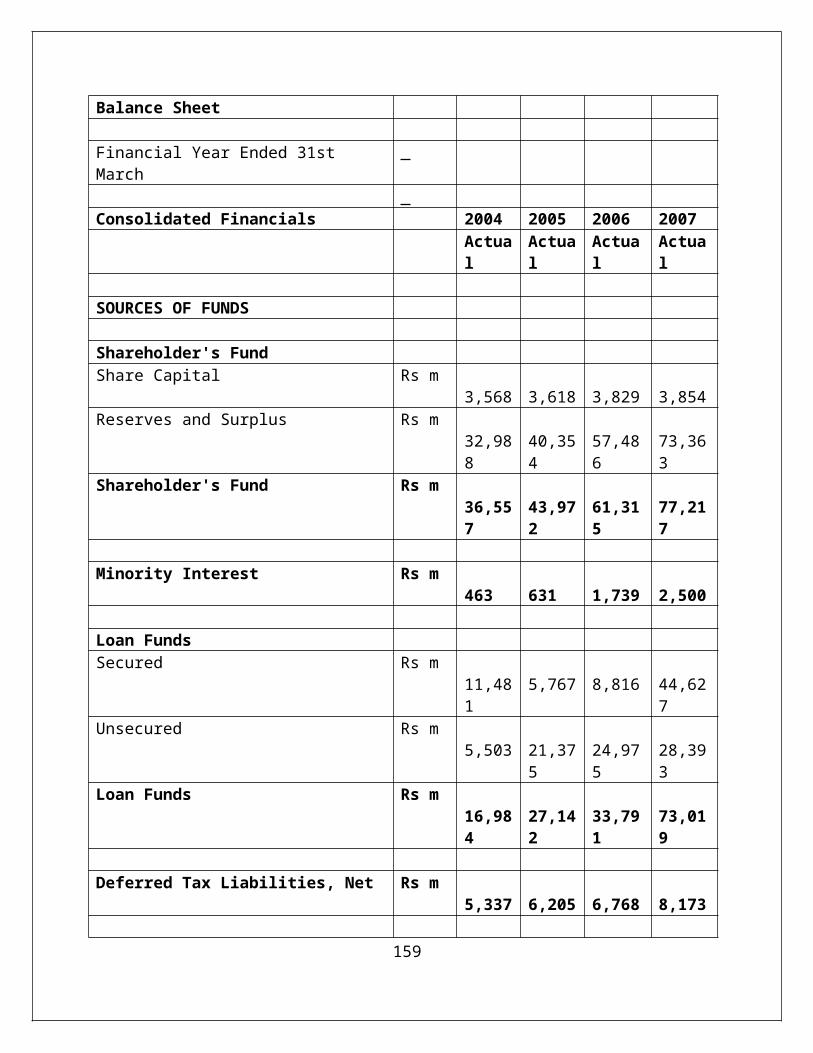
Balance Sheet Financial Year Ended 31st March
Consolidated Financials 2004 2005 2006 2007 Actua
lActual
Actual
Actual
SOURCES OF FUNDS Shareholder's Fund Share Capital Rs m
3,568 3,618
3,829
3,854
Reserves and Surplus Rs m 32,988
40,354
57,486
73,363
Shareholder's Fund Rs m 36,557
43,972
61,315
77,217
Minority Interest Rs m
463 631
1,739
2,500
Loan Funds Secured Rs m
11,481
5,767
8,816
44,627
Unsecured Rs m 5,503
21,375
24,975
28,393
Loan Funds Rs m 16,984
27,142
33,791
73,019
Deferred Tax Liabilities, Net Rs m
5,337 6,205
6,768
8,173
159
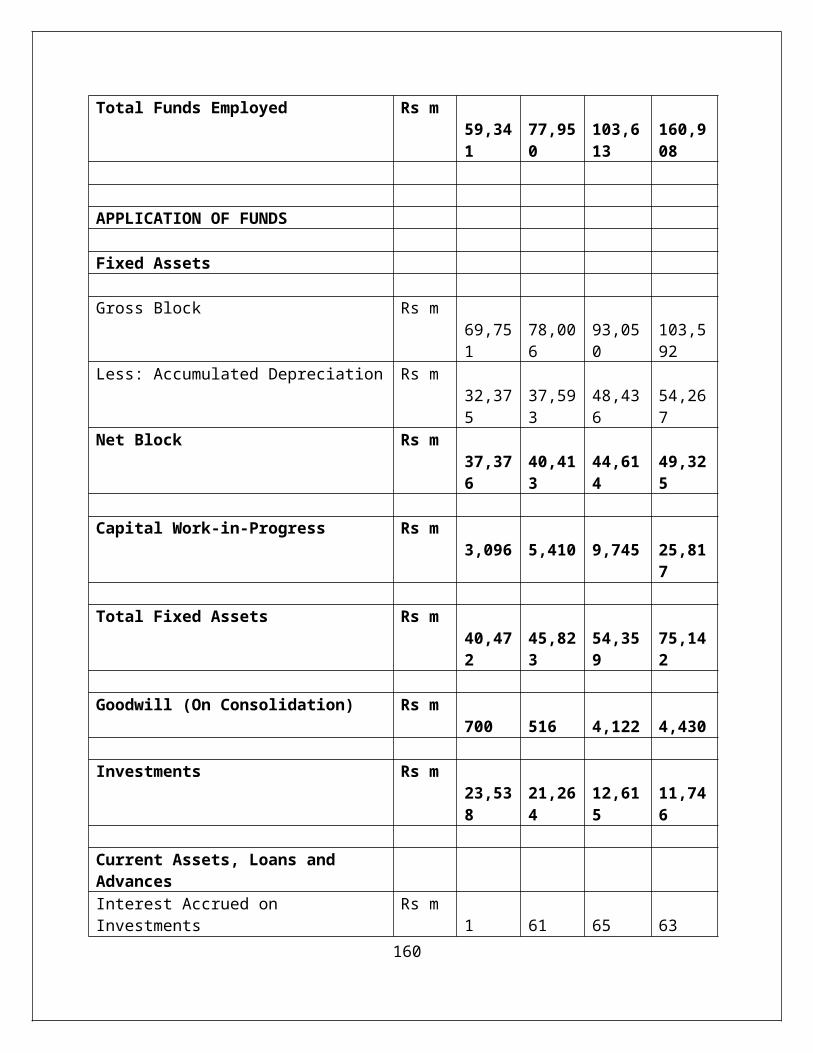
Total Funds Employed Rs m 59,341
77,950
103,613
160,908
APPLICATION OF FUNDS Fixed Assets Gross Block Rs m
69,751
78,006
93,050
103,592
Less: Accumulated Depreciation Rs m 32,375
37,593
48,436
54,267
Net Block Rs m 37,376
40,413
44,614
49,325
Capital Work-in-Progress Rs m
3,096 5,410
9,745
25,817
Total Fixed Assets Rs m
40,472
45,823
54,359
75,142
Goodwill (On Consolidation) Rs m
700 516
4,122
4,430
Investments Rs m
23,538
21,264
12,615
11,746
Current Assets, Loans and Advances
Interest Accrued on Investments
Rs m 1
61
65
63
160
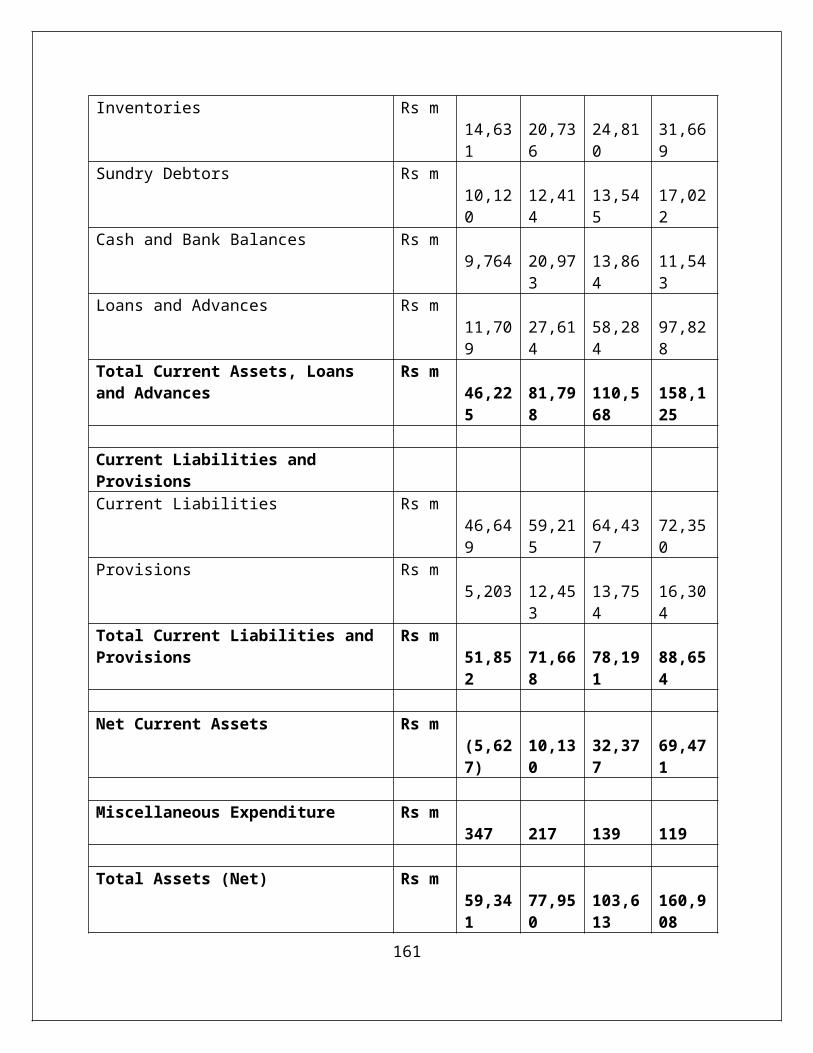
Inventories Rs m 14,631
20,736
24,810
31,669
Sundry Debtors Rs m 10,120
12,414
13,545
17,022
Cash and Bank Balances Rs m 9,764
20,973
13,864
11,543
Loans and Advances Rs m 11,709
27,614
58,284
97,828
Total Current Assets, Loans and Advances
Rs m 46,225
81,798
110,568
158,125
Current Liabilities and Provisions
Current Liabilities Rs m 46,649
59,215
64,437
72,350
Provisions Rs m 5,203
12,453
13,754
16,304
Total Current Liabilities and Provisions
Rs m 51,852
71,668
78,191
88,654
Net Current Assets Rs m
(5,627)
10,130
32,377
69,471
Miscellaneous Expenditure Rs m
347 217
139
119
Total Assets (Net) Rs m
59,341
77,950
103,613
160,908
161
Bibliography
References
Tom Copeland & Tim Koller “ Measuring & Managing the Value of
Companies.”
Palepu , Healy , Bernard “Business Analysis & Valuations using
Financial Statements.”
A Damadoran “ Applied Corporate Finance a user Manual .”162
Kalpan & Norton “ The Strategy Focused Organisation .”
George .M .Norton “ Maximizing Corporate Value .”
A Damodaran “ Investment Valuations.’’
Nelson C Mark “ Macro Economics & Finance: Theory & Empirical
Methods.”
Frank J Fabozzi “Financial Management & Analysis .”
Brealy, Myres , Marcus “ Fundamentals Of Corporate Finance.”
Website Addresses
www.iif.edu
www.tatamotors.com
www.bseindia.com
www.nseindia.com
www.sebi.gov.in
www.equitymaster.com
www.firstglobal.in
www.reuters.com
www.bloomberg.com
www.yahoo.co.in (yahoo finance)
163
![TEKNIK PERENCANAAN [ TEKNIK PERENCANAAN [ TEKNIK PERENCANAAN TATA GUNA LAHAN] [ TEKNIK PERENCANAAN TATA GUNA LAHAN] TATA GUNA LAHAN] TATA GUNA LAHAN](https://img.dokumen.tips/doc/110x75/635f85f44b04ea6b430d235d/teknik-perencanaan-teknik-perencanaan-teknik-perencanaan-tata-guna-lahan-.jpg)


