Embed Size (px)
Citation preview

Annual Report 2021/22 J A G U A R L A N D R O V E R A U T O M O T I V E P L C 1
ANNUAL REPORT 2021/22
J A G U A R L A N D R O V E R A U T O M O T I V E P L C

Annual Report 2021/22 J A G U A R L A N D R O V E R A U T O M O T I V E P L C 3
CONTENTS
S T R AT E G I C R E P O R T
F i s c a l y e a r a t a g l a n c e
C h a i r m a n ’s s t a t e m e n t
C h i e f E x e c u t i v e O f f i c e r ’s s t a t e m e n t
O u r s t r a t e g y
R e f o c u s
O u r b u s i n e s s m o d e l
O u r p r o d u c t a n d i n n o v a t i o n a c h i e v e m e n t s
O u r e n v i r o n m e n t a l a n d s o c i a l g o v e r n a n c e
O p e r a t i n g e n v i r o n m e n t
G l o b a l r e t a i l s a l e s
C h i e f F i n a n c i a l O f f i c e r ’s s t a t e m e n t
O u r a p p r o a c h t o r i s k
I n t r o d u c t i o n t o g o v e r n a n c e
L e a d e r s h i p
E f f e c t i v e n e s s
A c c o u n t a b i l i t y
I n v e s t o r r e l a t i o n s e n g a g e m e n t
A p p r o a c h t o Ta x
5
6
8
1 0
1 4
1 6
1 8
2 0
2 6
2 8
3 0
3 6
4 0
4 4
4 8
5 0
5 2
5 2
F I N A N C I A L S TAT E M E N T S
I n d e p e n d e n t a u d i t o r ’s r e p o r t
C o n s o l i d a t e d i n c o m e s t a t e m e n t
C o n s o l i d a t e d s t a t e m e n t o f c o m p r e h e n s i v e i n c o m e a n d e x p e n s e
C o n s o l i d a t e d b a l a n c e s h e e t
C o n s o l i d a t e d s t a t e m e n t o f c h a n g e s i n e q u i t y
C o n s o l i d a t e d c a s h f l o w s t a t e m e n t
N o t e s ( f o r m i n g p a r t o f t h e c o n s o l i d a t e d f i n a n c i a l s t a t e m e n t s )
P a r e n t c o m p a n y f i n a n c i a l s t a t e m e n t s
5 8
6 8
6 8
6 9
7 0
7 1
7 2
1 4 0
D I R E C T O R S ’ R E P O R T
D i r e c t o r s ’ r e p o r t 5 4
3Annual Report 2021/22 J A G U A R L A N D R O V E R A U T O M O T I V E P L C
Annual Report 2021/22 J A G U A R L A N D R O V E R A U T O M O T I V E P L C 5
FISCAL YEAR AT A GLANCE
R E TA I L S A L E S 1
FY2021/22: 376,381
FY2020/21: 439,588
FY2019/20: 508,659
376,381 UNITS
R E V E N U E 3
FY2021/22: £18.3bn
FY2020/21: £19.7bn
FY2019/20: £23.0bn
£18.3bn
P R O F I T/ ( L O S S ) B E F O R E TA XA N D E X C E P T I O N A L C H A R G E S 1 2
FY2020/21: £0.7bn
FY2021/22: £(0.4)bn
£(0.4)bn
F R E E C A S H F L O W 1
FY2021/22: £(1.2)bn
FY2020/21: £0.2bn
FY2019/20: £(0.8)bn
£(1.2)bn
N E T D E B T 4
FY2021/22: £3.2bn
FY2020/21: £1.9bn
FY2019/20: £2.2bn
£3.2bn
FY2019/20: £(0.4)bn
1 Please see note 3 of the financial statements on page 76 for alternative performance measures. 2 Please see note 4 of the financial statements on page 78 for more information relating to exceptional items. The £43 million of exceptional char-ges in FY22 relates to customer liabilities arising from sanctions imposed against Russia by many countries, preventing the shipment of vehicles and certain parts to the market.3 Please see note 5 of the financial statements on page 80.4 Net debt is defined as total cash and cash equivalents, deposits and investments per the alternative performance measures on page 76 less total interest-bearing loans and borrowings per note 25 on page 104.
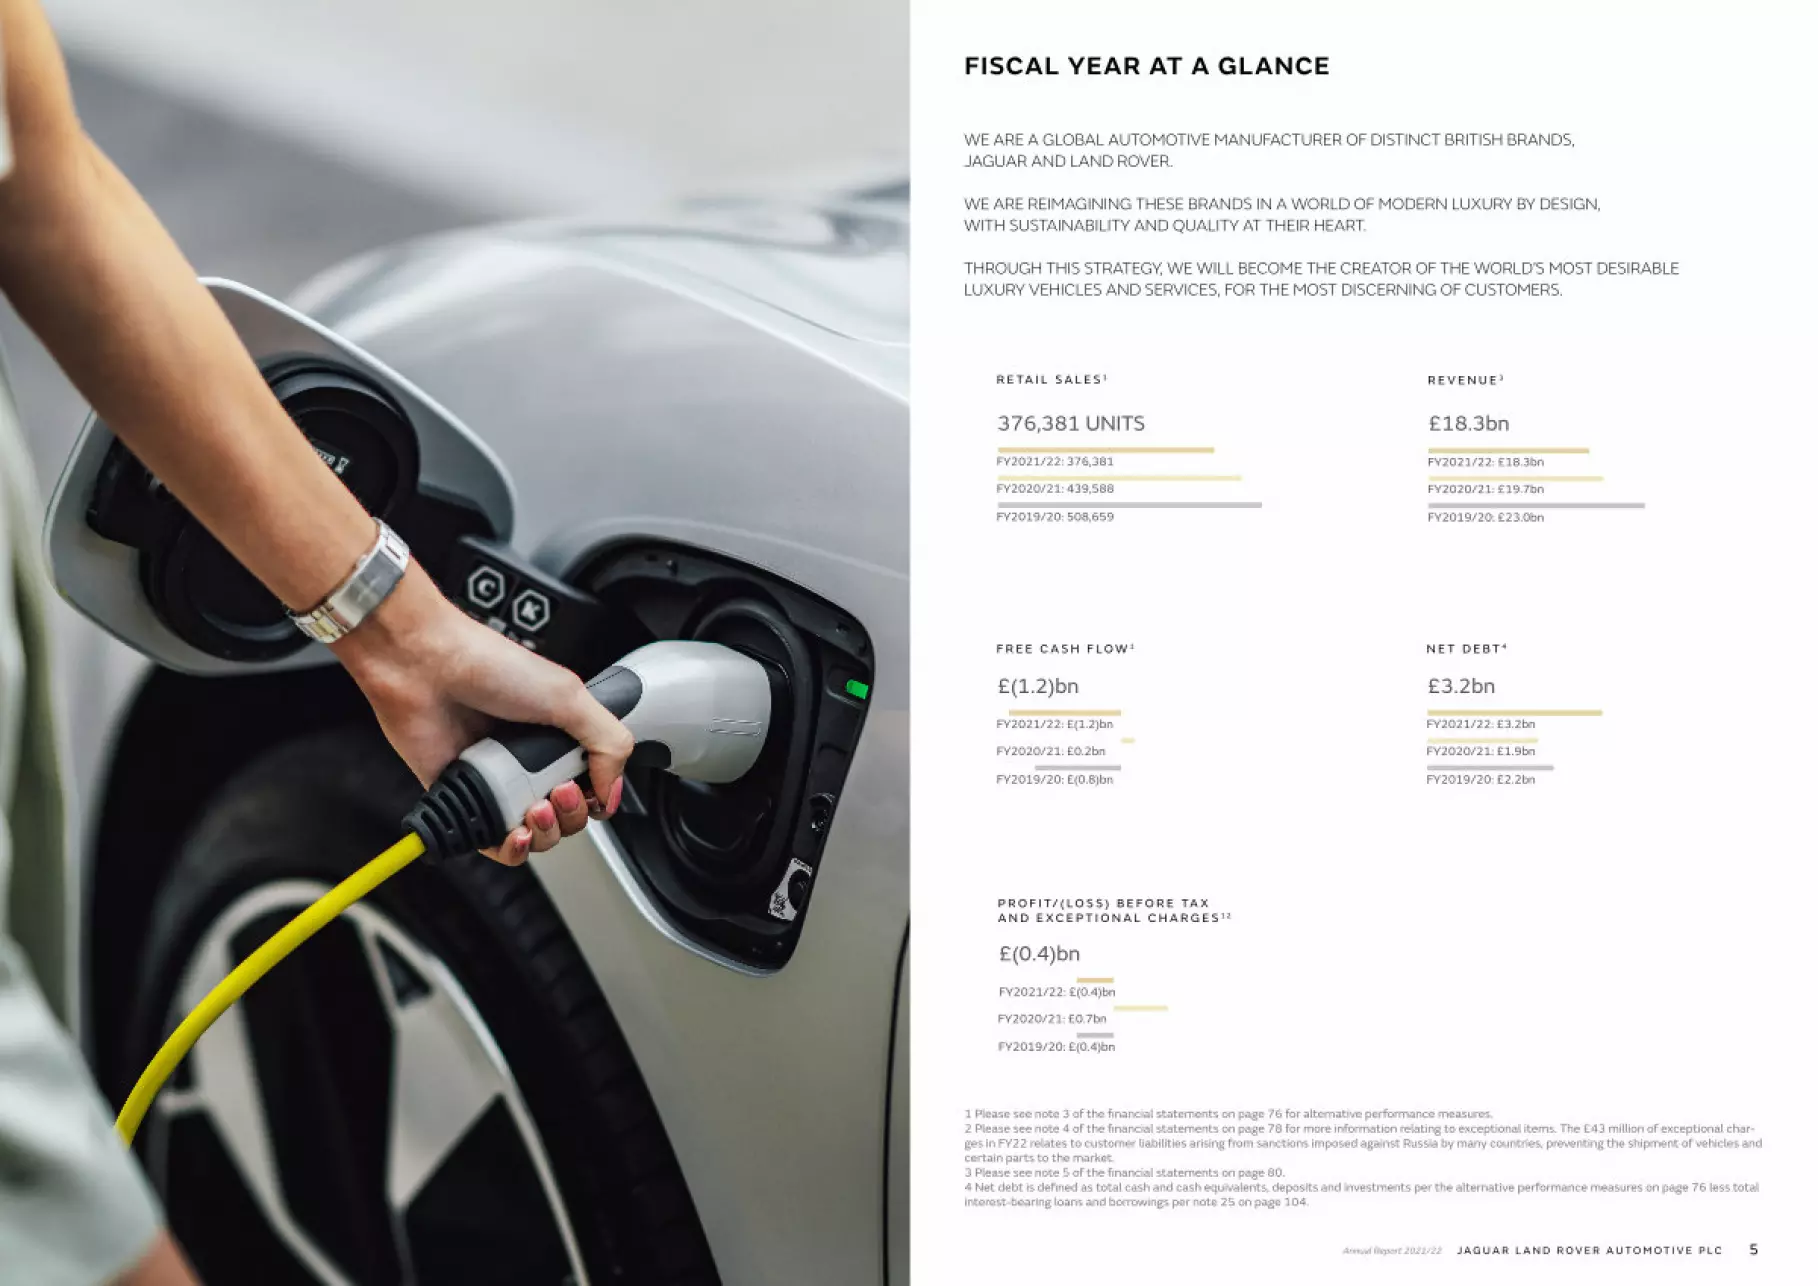
WE ARE A GLOBAL AUTOMOTIVE MANUFACTURER OF DISTINCT BRITISH BRANDS, JAGUAR AND LAND ROVER.
WE ARE REIMAGINING THESE BRANDS IN A WORLD OF MODERN LUXURY BY DESIGN, WITH SUSTAINABILITY AND QUALITY AT THEIR HEART.
THROUGH THIS STRATEGY, WE WILL BECOME THE CREATOR OF THE WORLD’S MOST DESIRABLE LUXURY VEHICLES AND SERVICES, FOR THE MOST DISCERNING OF CUSTOMERS.

Annual Report 2021/22 J A G U A R L A N D R O V E R A U T O M O T I V E P L C 7
Recent history has been relentless with the global pandemic, military conflict, growing inequality, supply chain shortages and more. Decades of experience have been squeezed into two dizzying years. Businesses have had to cope with this unprecedented sequence of events with speed and agility. While these changes have had a serious impact on businesses and communities, they have also accelerated some important trends for the future viz. i) Energy transition – irreversible move to green mobility, ii) Supply Chain transition – rebalancing of supply chains to become resilient, iii) Digital transition – Artificial Intelligence and Machine Learning becoming mainstream and iv) Talent transition – Coming of age of the Talent Cloud – a diverse, inclusive, global talent pool that can be accessed remotely.
In the midst of these changes, Jaguar Land Rover embarked on the Reimagine journey to embrace an electric future and transform into a digitally savvy modern luxury business delivering strong financial results.
During the year, we saw the successful global launch of the award-winning New Range Rover, while customer deliveries of Defender continued across 94 markets, with 107,208 units sold by the end of FY2021/22.
The global shortage of semiconductors had a disproportionately adverse impact on Jaguar Land Rover’s production and sales compared to our competitors. Even though we took various steps
to address the issue, the situation continues to remain challenging. This is a key issue facing Jaguar Land Rover and we are working assiduously to address the same during FY2021/22. This should aid a gradual recovery in performance through the coming year.
The company delivered a resilient performance during the year despite a fall in revenues by reducing their breakeven levels to 320,000 units. While production and sales remained significantly constrained, the business continued to see strong demand for its products, with global retail orders at record levels thanks to strong demand for Defender and New Range Rover.
Revenue fell 7 per cent to £18.3 billion, whilst the company’s EBIT margins fell to negative 0.4 per cent, with lower volumes on working capital in the first half of the financial year resulting in a free cash outflow of £1.2 billion. Retail sales declined 14 per cent for the year.
Recently, the people of Jaguar Land Rover provided timely support to alleviate the humanitarian crisis in the aftermath of the Ukraine/Russia conflict by mobilising vehicles to support the International Federation of Red Cross and Red Crescent refugee programmes; in raising tens of thousands of pounds through individual donations to aid agencies; and in offering direct support to reunite families.
Looking beyond these near-term challenges outlined above, Jaguar Land Rover is in a strong position with a striking portfolio of
attractive premium luxury products, a healthy bank of customer orders, low break-evens and the right strategy to support its unique and renowned British brands in a rapidly changing legislative and commercial landscape. Additionally, Jaguar Land Rover is an important player in the automotive vertical of the Tata Group where we are driving collaboration, knowledge sharing and synergies across our group companies.
I am confident that in the coming years we will be able to realise the full potential of Jaguar Land Rover as it executes its strategy to seize the mega trends described above. I would like to thank all our colleagues and partners for their passion and commitment, as we accelerate, together, towards a successful and peaceful future.
NATARAJAN CHANDRASEKARANCHAIRMANJaguar Land Rover Automotive plc13 June 2022
CHAIRMAN’S STATEMENT
“Jaguar Land Rover is in a strong position with a striking portfolio of attractive premium luxury products, a healthy bank of customer orders, low break-evens and the right strategy to support its unique and renowned British brands in a rapidly changing legislative and commercial landscape.”

Annual Report 2021/22 J A G U A R L A N D R O V E R A U T O M O T I V E P L C 9
Fiscal year 2021/22 has been a year of foundational delivery against our ‘Reimagine’ strategy - our roadmap to accelerate our transformation into a modern luxury business, with its supporting transformation plan, ‘Refocus’. We are ready to do more and go faster.
This progress has been achieved in extraordinary circumstances, with our operations disrupted by the ongoing effects of Covid-19 restrictions as well as the industry-wide global semiconductor supply shortage.
While the situation is gradually improving, and we can build more of the cars our customers are waiting for, the repercussions on our results in FY2021/22 are clear.
We are monitoring the Ukraine/Russia conflict very closely. We have witnessed a rapidly developing humanitarian crisis in Ukraine and its neighbouring countries. Our primary concern remains for the wellbeing of our workforce, as well as those within our extended network. I have been profoundly humbled by the compassionate response of colleagues across our business, both directly helping individual families and supporting the ongoing work of the International Federation of Red Cross and Red Crescent Societies.
Despite the uncertain environment, I have been tremendously encouraged by our achievements of the past 12 months.
We revealed two exceptional new models: New Range Rover and most recently, the New Range Rover Sport. Both embody modern luxury and have been loved by our customers around the world.
By the end of March 2022, we had received more than 45,500 customer orders for the New Range Rover. Alongside sustained, significant demand for the Land Rover Defender, this made a record order book during the year, and of course we expect demand to remain very strong.
And as we work relentlessly on Jaguar’s renaissance as an all-electric modern luxury brand from 2025, I can assure you that we are absolutely on track.
Throughout 2021, we increased our capability as an agile, fully data-driven, digital business with the creation of InDigital, a key pillar of our Refocus transformation programme. Our 250 specialists focusing on analytics, data science, data engineering and automation have already supported initiatives that have delivered a return of over £300 million value to our business this fiscal year.
Refocus also drives our quality transformation to realise benchmark levels of customer satisfaction. We have seen positive impacts across all our key quality metrics, reflected in improving positions for our brands and products in key customer surveys.
New leadership appointments have strengthened our executive team as we push to bring to life more of our vision, sooner.
François Dossa, appointed to the role of Executive Director, Strategy & Sustainability, will build our capabilities in sustainability, new mobility services and digitalisation, creating new opportunities in connectivity and clean mobility, establishing control points on the new value chain and driving our strategy towards technology leadership.
Lennard Hoornik joined as Chief Commercial Officer, to head all our brand and product marketing and go-to-market strategy.
Thomas Müller, our new Executive Director of Product Engineering, brings invaluable insight in agile principles, advanced driver assistance systems and autonomous driving.
Reimagine also sees us collaborating with leaders in their fields. I was delighted to announce a partnership with NVIDIA - the world leader in artificial intelligence, computing, connected car services, and automated and autonomous driving systems. Together, we can accelerate our in-vehicle software strategy, delivering modern luxury experiences and enabling a true leapfrog in automotive technology.
As we transform our business, at pace and amid intense external pressures, I am deeply proud of the resilience, energy and unity of our people.
Thanks to their commitment, as well as to our growing ecosystem both within and beyond the Tata Group, we have the ingredients to reimagine Jaguar Land Rover and realise its unique potential.
THIERRY BOLLORÉCHIEF EXECUTIVE OFFICERJaguar Land Rover Automotive plc13 June 2022
CHIEF EXECUTIVE OFFICER’S STATEMENT
“As we transform our business, at pace and amid intense external pressures, I am deeply proud of the resilience, energy and unity of our people.”

Annual Report 2021/22 J A G U A R L A N D R O V E R A U T O M O T I V E P L C 11
OUR STRATEGYOUR REIMAGINE STRATEGY DRIVES OUR SINGLE AND CLEAR VISION: TO BECOME THE CREATOR OF THE WORLD’S MOST DESIRABLE LUXURY VEHICLES AND SERVICES, FOR THE MOST DISCERNING OF CUSTOMERS.
This roadmap for the future of Jaguar Land Rover puts quality and sustainability at the centre of everything we do, directed by the simplification of our processes and the rapid electrification of our vehicles, while creating unique customer experiences and a positive societal impact.
As we redefine modern luxury, and with the worldwide customer appetite for electric vehicles, we are accelerating our Reimagine transformation into a business that will deliver double-digit EBIT margins within five years and achieve net zero carbon through our entire value chain, including our products, supply chain and operations, by 2039.
MODERN LUXURY
In 2021, we introduced the New Range Rover, as the embodiment of modern luxury, with breath-taking modernity to its exterior and a highly sophisticated, reductive interior with an intuitive approach to relevant technology.
The New Range Rover embodies a philosophy that will be embedded across our products and our customer experiences, acting as a key differentiator for Jaguar and Land Rover, as part of their transformation into modern luxury brands.
At the centre of this is sustainability, in our vehicles and across the value chain, which we will achieve through electrification; decarbonising our supply chain, manufacturing and non-manufacturing operations; closed-loop circularity; and in close attention to the provenance of materials we select.
AN ELECTRIFYING, SUSTAINABLE FUTURE
We believe in the modern luxury of pure-electric propulsion that is near-silent, efficient and sustainable.
The New Range Rover introduces plug-in hybrid electric propulsion with a segment-leading official electric-only range of over 100km.
From 2024, a pure-electric New Range Rover will join the family.
Over the next four years, Land Rover will welcome six all-electric variants across two architectures – our flexible Modular Longitudinal Architecture (MLA) and Electric Modular Architecture (EMA). This will help us to meet unprecedented policy shifts and an exponential rise in customer demand towards electric vehicles across our key markets.
As adoption increases, we expect 60 per cent of global Land Rover sales to be pure-electric by 2030.
As we accelerate Land Rover’s electrification, the renaissance of Jaguar has also been moving at pace.
Over the past 12 months, our Future Jaguar team have determined to develop our own bespoke pure-electric architecture for Jaguar.
Alongside its product transformation, Jaguar is also creating a strong digital culture, efficiently integrating technologies and analytics, to allow the team to design a more rewarding emotional engagement between the brand and the customer.
We are truly excited about the renaissance of Jaguar.
Our ambition to become net zero carbon by 2039 throughout our entire value chain requires a transformation in the way we design, engineer, supply and manufacture our products. To secure our pathway towards this ambition, we have defined and committed to CO2e reduction targets by 2030, which have been validated by the Science Based Targets initiative (SBTi), aligning the business to a 1.5-degree celsius emissions reduction set out by the Paris Agreement.
TRUE DIGITAL LEADER
Connectivity is a key attribute of modern luxury. Through our Reimagine strategy and Refocus programme, we are creating a step-change in connected experiences for customers and accelerating our transformation into a digital leader in the automotive industry.
We will continue to drive forward connectivity in and with our vehicles, based on our truly market-leading capability today.
Through remote diagnostics and software-over-the-air updates, we can already predict, diagnose and update all major vehicle systems.
To date, we have completed more than 3 million updates on customer vehicles and through our Electric Vehicle Architecture, we can monitor nearly 17,000 data points to continually enhance our customer experiences.
For example, in early 2022, we provided 200,000 customer vehicles, fitted with our advanced Pivi Pro infotainment system, an over-the-air upgrade featuring Amazon Alexa voice AI capability and Wireless Apple Car Play.
We believe this ability for owners to add services and experiences to their connected vehicles will create entirely new value for our business.
COLLABORATING FOR A CONNECTED FUTURE
Such a strong platform for connected services also allows us to reimagine new vehicle features. Collaboration and knowledge-sharing with industry leaders in connected services, data and software development is a cornerstone of our strategy.
We have formed a multi-year strategic partnership with NVIDIA, the leader in artificial intelligence and computing, to jointly develop and deliver next-generation automated driving systems, plus AI-enabled services and experiences for our customers.
11Annual Report 2021/22 J A G U A R L A N D R O V E R A U T O M O T I V E P L C

Annual Report 2021/22 J A G U A R L A N D R O V E R A U T O M O T I V E P L C 13
From 2025, new Jaguar and Land Rover vehicles will be built on the NVIDIA DRIVE™ software-defined platform – delivering a wide spectrum of active safety, automated driving and parking systems, as well as AI features inside the vehicle.
Together, we will redefine how our customers connect to, and enjoy their vehicles, throughout their ownership, driving new opportunities and business models for us and our partners.
We will continue to strive for strategic partnerships to drive innovation and sustainability in line with our Reimagine strategy.
REIMAGINING FINANCE FOR CUSTOMERS
Through our transformation programme, Refocus, we are also forging strategic partnerships to enhance our purchase experience.
We have partnered exclusively with BNP Paribas, to broaden competitive automotive financing with new, innovative services across nine European markets.
Our ambition is to provide our retail partner network and our customers with an expanded range of financing solutions and insurance products by early 2023.
REDEFINING OUR PURPOSE
Our company purpose sets why we want and choose to exist: ‘live the exceptional with soul’. Through our Reimagine strategy, we are changing to become the ‘proud creators of modern luxury’, guided by a creator’s code - a set of co-created behaviours: customer love, unity, integrity, growth and impact.
Along the way, the positive impact of sustainability and diversity and inclusion will enable us to better understand and serve our customers, fuel our innovation, and engage and inspire our people.
Together, we are shaping a culture of unity, belonging, inclusion and respect, while implementing progressive policies, benefits and support, and engaging with our people to accelerate our progress.
FOCUSED ON THE FUTURE
With Reimagine, we are transforming our business and our two unique brands, with a value-creation approach; delivering modern luxury experiences, quality and profit.
We will deliver a new benchmark in environmental, societal and community impact for a luxury business, creating the world’s most desirable luxury vehicles, against a canvas of true sustainability.
We are transforming into an agile, fully data-driven, digital company, through our Refocus plan. Our commitment to agile ways of working is streamlining our operations and returning value to our business.
Together, we are realising our goals, steadfast in our ambition to be one of the most profitable luxury manufacturers in the world.

Annual Report 2021/22 J A G U A R L A N D R O V E R A U T O M O T I V E P L C 15
REFOCUSOUR REFOCUS TRANSFORMATION PROGRAMME IS THE ENGINE ROOM POWERING OUR REIMAGINE STRATEGY.
Refocus has created significant change within our business and culture over the past year, improving key quality metrics, laying the foundations of an agile, data-driven, digital business, and delivering over £1.5 billion of value during FY2021/22.
Refocus will drive further profitability in our business, as we aim to realise £2.5 billion of value within three years.
The programme contains five priorities focused on improving our operations and transforming our business. These are: improved customer satisfaction, time to market, workforce experience, CO2e reduction and profitable growth.
These priorities are established in ten separate pillars - six operational pillars and four enabling pillars. During this fiscal year, we added our tenth pillar, Sustainability.
Agile Organisation, Leadership, Capability, Culture
QUALITY
Reduced warranty spend
1
PROGRAMME DELIVERY &
PERFORMANCE
Efficient programme
delivery
2
DELIVEREDCOST PER CAR
Reduction in vehicle cost
3
END-TO-END SUPPLY CHAIN
Faster vehicle delivery times
4
CUSTOMER & MARKET
PERFORMANCE
Increased profitable market share
5
CHINA
Increased profitable market share
6
AGILE ORGANISATION & CULTURE7
Using data & technology to power the transformationDIGITAL8
Sustaining the cost improvementsRESPONSIBLE SPEND9
DRIVING PROFITABLE CHANGE
Our Quality pillar has implemented new processes and governance to improve quality issues and warranty spend, resulting in an improvement to our customer satisfaction, andreducing warranty spend to £608 per vehicle.
In Programme Delivery & Performance, we have trained more than 4,000 of our people in agile ways of working, reducing product delivery times and time to market. An Agile Hub has been established, facilitating team training and coaching, as well as redefining the company purpose in the mindset of modern luxury.
In Delivered Cost Per Car, we have continued to build on the successful cost reduction initiatives of our Ignite programme – now extended to 2025 – achieving £1,600 average per car saving, without compromising quality.
We have also created a new Supply Chain function within our business, focusing on digitisation as well as building resilience and sustainability within our operations. This work has included our semiconductor crisis response.
Together, Customer & Market Performance (Pillar 5), which revolutionises our customer journey, and China (Pillar 6) have contributed over £800 million of value through measures including newly digitised ordering for retailers, renewal services for customers and profit and mix optimisations.
DIGITAL TRANSFORMATION
InDigital was launched in April in 2021 as part of our Refocus plan. In just the past year, it has developed into a digital centre of excellence, at the heart of Refocus, with 250 specialists focusing on analytics, data science, data engineering and intelligent automation.
Through a digital revolution in smart tools and processes we supported initiatives that have delivered over £300 million value to our business in FY2021/22, supporting and providing solutions as diverse as supply chain visibility to mitigate the semiconductor crisis; databased failure mode prediction; new and improved customer offerings and customer journey digitisation; and automation across the business for greater efficiency.
RESPONSIBLE SPEND
Responsible Spend continues from the successful Charge+ programme. We have remodelled our approach to spend and investment, updating our purchasing processes, improving cost and time saving allowing our teams to focus on adding value.
SUSTAINABILITY AT OUR HEART
Through FY2021/22, we brought into Refocus a dedicated Sustainability pillar to execute our environmental sustainability strategy - Regenerate.
Regenerate comprises eight distinct focus areas, redefining the way we design, engineer, manufacture and even sell products and services.
Pillar 10 acts as the operational engine to implement this sustainability transformation through climate and circular actions across the company, powered by the adoption of agile methodology.
The transformation of our business through Sustainability is supported by key executive appointments.
François Dossa was appointed to the role of Executive Director, Strategy & Sustainability, in June 2021 and Rossella Cardone became Director, Sustainability in January 2022.
SUSTAINABILITY10Building a regenerative ecosystem

Annual Report 2021/22 J A G U A R L A N D R O V E R A U T O M O T I V E P L C 17
OUR BUSINESS MODEL
HOW OUR BUSINESS MODEL CREATES VALUE
INPUTS
Rawmaterials
Supplychain
Customerinsights
Skills andpeople
Investment
OUTPUTS
Modern luxury
Sustainable growth
Reduced environmental
impact
Strongercommunities
INNOVATION, DIGITAL AND
TECHNOLOGY
MOBILITYAND OTHER
NEW SERVICES
DESIGN, VEHICLE PROGRAMMES AND
ENGINEERING
CUSTOMER SERVICE NETWORK
STRATEGICSOURCING
SUPPLY CHAIN, LOGISTICS AND
MANUFACTURING OPERATIONS
GLOBAL SALESNETWORK
FINANCIALSERVICESPARTNERS
Our new strategy will evolve our business model, to ensure we redefine Jaguar Land Rover, as a value-led business and realise its potential to generate sustainable, long-term value through operational excellence.
Qualityproducts
Technologicalinnovation
17Annual Report 2021/22 J A G U A R L A N D R O V E R A U T O M O T I V E P L C
Annual Report 2021/22 J A G U A R L A N D R O V E R A U T O M O T I V E P L C 19
OUR PRODUCT AND INNOVATION ACHIEVEMENTSOUR JOURNEY OF TRANSFORMATION HAS SEEN US LAUNCH BREATH-TAKING NEW PRODUCTS AND ANNOUNCE EXCITING STRATEGIC PARTNERSHIPS, WHILE RISING TO MEET THE CHALLENGES OF AN UNCERTAIN GLOBAL ENVIRONMENT.
THE NEW RANGE ROVER – MODERN LUXURY
In October 2021, we revealed the New Range Rover, a vehicle of breath-taking modernity, peerless refinement and unmatched capability.
Launched with a choice of two wheelbases, four, five, or, for the first time, seven seats and a flagship SV range offering an exquisite interpretation of Range Rover luxury and hand-crafted personalisation, New Range Rover is a fully formed family of vehicles, providing more customer choice and scope for personalisation than ever before, with more than 1.6 million different configurations available.
Within six months of its reveal, we had received more than 45,500 advance customer orders for the New Range Rover, and production began earlier this year at our factory in Solihull, UK.
Innovations and technologies that ensure New Range Rover leads by example are protected by 200 new patents filed up to the end of FY2021/22.
SEGMENT-FIRST TECHNOLOGY
Amongst its innovations, our New Range Rover debuted new digital LED lighting technology, with Dynamic Light Projection.
Within each headlight, a core module of 1.3 million individually-variable digital micromirrors breaks the light into tiny pixels, to precisely shadow other road users and maximise the amount of light on the road at all times.
At the rear, New Range Rover’s world-first, hidden-until-lit taillights have been specially developed to meet our modernist design philosophy and use vivid red LEDs in operation, yet form a distinctive Gloss Black graphic at the rear when not in use.
POWERFUL CONNECTIVITY
Collaborating and sharing knowledge with industry leaders in connected services, data and software development is a cornerstone of our Reimagine strategy and we announced key strategic partnerships in this area in FY2021/22.
NVIDIA is the world leader in automated and autonomous driving systems and connected car services. Our new, long-term partnership with NVIDIA will accelerate our in-vehicle software strategy, delivering modern luxury experiences.
Utilising our own world-leading Electric Vehicle Architecture, from 2025 new Jaguar and Land Rover vehicles will be integrated with the NVIDIA DRIVETM Hyperion computing and
sensing platform, powering advanced technology features and connected experiences, able to be automatically refined and upgraded throughout their lifetime, “over the air”.
This year also saw us deliver the integration of Amazon Alexa voice AI into Jaguar and Land Rover vehicles, contained in the latest upgrades to our award-winning Pivi Pro infotainment technology.
The combined abilities of Alexa and Pivi Pro make our vehicles more intelligent than ever, and into powerful connected devices supporting our customers lives.
Our strategic alliance with Amazon Alexa allows natural voice control of in-car media, navigation and phone services, supported by a rich media display, and connection to other Alexa-enabled devices in smart homes.
This upgrade also demonstrated the connected power of Pivi Pro, in being made available to 200,000 existing customers directly through a software-over-the-air update.
As part of our Reimagine strategy, Pivi Pro represents a step-change in connected services capability and will deliver a modern luxury experience for all our customers.
CLEANER CABIN AIR FOR ENHANCED WELLBEING
Cabin air purification research is helping us to reimagine wellbeing for our customers, and to help make a positive societal impact.
Our Cabin Air Purification Pro System, with PM2.5 Filtration, CO2 Management and nanoe™ X air ionisation technology, controls the cabin air quality and significantly reduces odours, bacteria
and allergens, including SARS and Covid-19 viruses.
Enhancing our research in this area, in 2021 we partnered with Google to deliver the first all-electric Google Street View vehicle, with the added ability to record air quality. A Jaguar I-PACE, fitted with Cabin Air Purification Pro and an additional sensor array, measured street-by-street air quality in Dublin, using Street View mapping technology.
It recorded levels of nitrogen dioxide (NO2), carbon dioxide (CO2), and fine particles (PM2.5) and also helped to update Google Maps.
Google’s scientific research partners will also analyse the data and develop maps of street-level air pollution.
ON TRACK SUCCESS
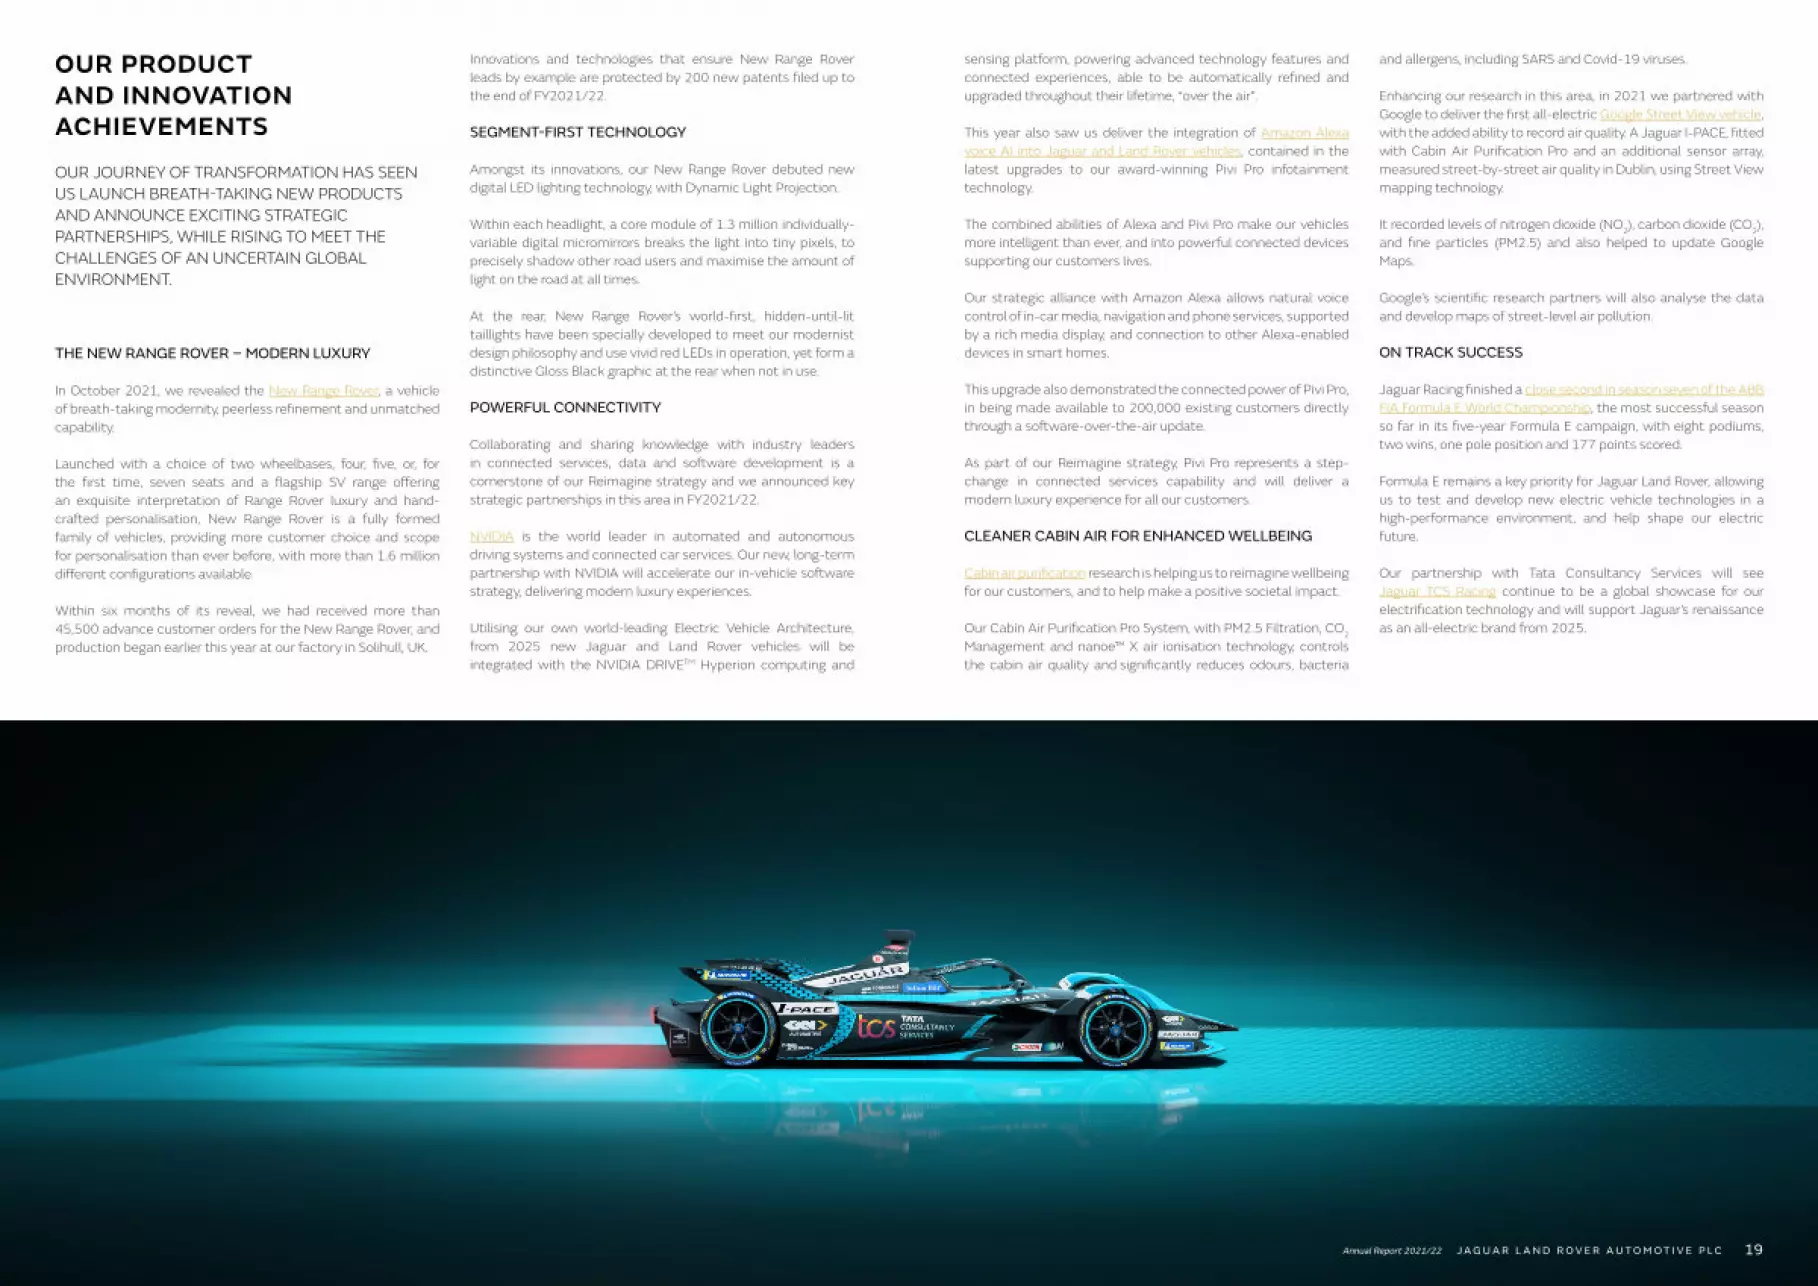
Jaguar Racing finished a close second in season seven of the ABB FIA Formula E World Championship, the most successful season so far in its five-year Formula E campaign, with eight podiums, two wins, one pole position and 177 points scored.
Formula E remains a key priority for Jaguar Land Rover, allowing us to test and develop new electric vehicle technologies in a high-performance environment, and help shape our electric future.
Our partnership with Tata Consultancy Services will see Jaguar TCS Racing continue to be a global showcase for our electrification technology and will support Jaguar’s renaissance as an all-electric brand from 2025.
Annual Report 2021/22 J A G U A R L A N D R O V E R A U T O M O T I V E P L C 19

Annual Report 2021/22 J A G U A R L A N D R O V E R A U T O M O T I V E P L C 21
JAGUAR LAND ROVER EV MIX (wholesales)
FY22 FY26 FY30
ICE/MHEV / HEV
PHEV
BEV
REDUCING OUR ENVIRONMENTAL FOOTPRINT
GLOBAL DATA
O P E R AT I O N A L E N E R G Y C O N S U M P T I O N ( M W h )
FY 2021/22: 1,133,506
FY 2020/21: 1,135,049
FY 2019/20: 1,358,225
O P E R AT I O N A L C A R B O N E M I S S I O N S T O N N E S ( L O C AT I O N B A S E D )
FY20 FY21
157,316
148,753
135,098
121,149
Scope 1 covers direct emissions from owned or controlled sources.
306,069
256,247
O P E R AT I O N A L C A R B O N E M I S S I O N S T O N N E S ( M A R K E T B A S E D )
FY20 FY21 FY22
40,698
148,75326,236
121,149
189,451
147,385
FY 2021/22: 1,658,929
FY 2020/21: 1,336,479
FY 2019/20: 1,720,965
FY 2021/22: 30,008
FY 2020/21: 27,638
FY 2019/20: 37,043
• Energy data includes purchased gas, electricity & steam• Waste data excludes metal and construction waste• Water data includes mains water & borehole consumption• 50% of China Joint Venture data due to financial control• Sites in scope: Solihull, Halewood, Castle Bromwich, Engine Manufacturing Centre, Gaydon, Whitley, Nitra, Brazil, China Joint Venture
(50% data due to financial ownership)• As per the GHG Protocol for Corporate Reporting, a location-based method reflects the average emissions intensity of grids on which
energy consumption occurs (using a grid-average emission factor); a market-based method reflects emissions from electricity that the company has purposefully chosen.
FY20 FY21 FY22
O P E R AT I O N A L W AT E R C O N S U M P T I O N ( m 3 )
O P E R AT I O N A L W A S T E ( To n n e s )
Scope 2 covers indirect emissions from the generation of purchased electricity & steam.
OUR ENVIRONMENTAL AND SOCIAL GOVERNANCE AS AN OFFICIAL PARTNER OF THE COP26 CLIMATE CONFERENCE IN 2021, WE ANNOUNCED NEW SCIENCE-BASED EMISSIONS TARGETS AND RENEWED OUR COMMITMENT TO DELIVER A SUSTAINABILITY-RICH VISION OF MODERN LUXURY. Through our committed environmental and social principles, we continue to stitch all the threads of sustainability – from reducing vehicle emissions to circular economy; from manufacturing processes to supply chain partners – with one team, working globally across the business, the brands and the customer experience.
And through our policies towards our people, we are driving a positive societal impact in our communities across the world.
OUR SUSTAINABILITY STRATEGY
Since COP26, in line with our global Reimagine strategy, we have established a dedicated Sustainability Office to lead the sustainability transformation in Jaguar Land Rover, positioning sustainability at the heart of our Reimagine vision and purpose.
Regenerate, our dedicated sustainability strategy, sets the pathway to our ambition to be carbon net zero by 2039.
The strategy consists of eight distinct focus areas: electrification and battery strategy; Materiality and sustainable products; zero impact manufacturing and operations; responsible supply chain management; customers and new business models; environment in decision-making; digitalisation for sustainability; and employees’ cultural shift for sustainability.
These eight areas will enable us to redefine the way we design, engineer, manufacture and even sell our products and services.
The transition to an electric future is integral to our sustainability strategy. Over the next four years, Land Rover will welcome six all-electric variants, with the first arriving in 2024. In this time, Jaguar will have undergone a complete renaissance, emerging as a pure-electric modern luxury brand from 2025.
Beyond EV transition, our Design and Engineering teams are creating new luxury standards using less impactful materials and
more recycled content, considering vehicle end-of-life from the start.
And we are supporting customers to make sustainable choices towards less impactful products across their entire lifecycle, coupled with an increased focus on extending product life, and increasing repair, reuse and recycling options.
In Manufacturing Operations and Supply Chain, we are leveraging advanced technologies to reduce energy consumption and waste in our plants and offices.
In addition, our Supplier Environmental and Social Requirements web guide sets out our expectations for our supply base. It covers business ethics, environment, human rights and working conditions, health and safety, and responsible supply chain management. We also engage with our supply base to enhance the level of sustainability data we receive, to collaborate on sustainability goals, to share information and give feedback so that we can build on the maturity of our suppliers’ sustainability journeys.
The execution of our Regenerate strategy will enable us to achieve our approved Science Based Target initiative (SBTi) commitments by 2030, and to achieve our net zero carbon objective for 2039.
Between 2020 and 2030, we will reduce emissions by 46 per cent across vehicle manufacturing and logistics, and by 54 per cent per vehicle, from purchased goods, services, and use of products.
Having committed to these targets, we are now underway to build a regenerative ecosystem and a sustainability mindset throughout the business. This will help to ensure coordination across departments and allow us to deliver and report on progress against these new targets going forward.
REDUCING OUR VEHICLE EMISSIONS
We are accelerating the reduction in our tailpipe CO2 emissions. We currently offer electric vehicle technology across our entire Jaguar and Land Rover portfolio, including eight plug-in hybrids (PHEV), 11 mild hybrids (MHEV) and our all-electric Jaguar I-PACE.
By FY2025/26, we forecast that approximately 27 per cent of sales will be pure-electric, rising to above 60 per cent by the end of the decade.
PARAMETER 2019-20 2020-21 2021-22
Energy consumption used to calculate emissions: kWh 1,274,988,136 1,032,109,520 1,017,618,240
Emissions from combustion of gas tCO2e (Scope 1) 135,999 105,102 99,872
Emissions from combustion of fuel, tCO2e, including transport (Scope 1) 10,734 8,770 8,531
Emissions from business travel in rental cars or employee-owned vehicles where company is responsible for purchasing the fuel (Scope 3)
2,640 369 632
Emissions from purchased electricity (Scope 2 location-based) 123,568 96,782 91,264
Total gross CO2e based on above 272,941 211,023 200,299
Intensity ratio: tCO2e/£m 11.87 10.69 10.93
UK STREAMLINED ENERGY AND CARBON REPORTING
10%
87%
3%
10%
63%
27%
30%
60%
FY21117,939118,503
236,442
19,889118,503
138,393
Our data is compiled in accordance with the Greenhouse Gas Protocol for Corporate Accounting and Reporting, SECR CO2e is calculated with a location based approach using UK average grid intensity conversion factors (BEIS 2021). Jaguar Land Rover continues to purchase 100% renewable-backed electricity for all core UK operations.
In the last year, we have continued to focus on reducing non-essential energy use, as well as further improving transparency in usage data and capturing real time consumption information. The resulting data are showcasing our progression made on waste with respect to energy. Changes to air handling units, shutdown process and equipment replacement has significantly contributed to process efficiency ameliorations.
10%

Annual Report 2021/22 J A G U A R L A N D R O V E R A U T O M O T I V E P L C 23
MATERIALITY - REDEFINING MODERN LUXURY
Our customers want to understand how their vehicle is made, what it is made from and the provenance of materials used.
Materiality is our answer to this - an uncompromised vision of innovation in materials, processes and technology that promotes social, environmental and economic values.
Our Materiality strategy ensures materials used in our vehicles are sustainable, traceable, respectful and without compromise, governed by seven guiding principles: Circularity, Health & Wellbeing, Lightweight, Performance, Provenance, Respectful, and Responsible.
We have already pioneered innovative sustainable materials in Jaguar and Land Rover vehicles. Our Kvadrat interior with natural wool blend utilises 53 recycled plastic bottles and is 58 per cent lighter than a leather equivalent.
Ultrafabrics PU, featured in the New Range Rover, is a responsible alternative to leather and represents a progressive approach to luxury materials. It offers all the tactile qualities of leather but is 30 per cent lighter and generates only a quarter of the CO2.
Our Colour and Materials team continue to explore new innovations in Materiality for future products, led by an ethos of ‘aesthetics with ethics’.
HARNESSING BLOCKCHAIN TO TRACE OUR SUPPLY CHAIN
In understanding the provenance of material through our supply chain, we have partnered with blockchain technology firm Circulor, leading UK leather manufacturer Bridge of Weir Leather Company and the University of Nottingham, to prove the use of traceability technology in the leather supply chain.
A combination of GPS data, biometrics and QR codes were used to digitally verify the movement of leather at every step of the process, from farm to our own facilities.
As well as tracking compliance, the secure digital process can assess the carbon footprint of supplied materials and could be deployed to trace a range of commodities. Circulor is already using blockchain to improve the traceability of minerals used for electric vehicle batteries.
This is a key step in our journey to achieving net zero carbon across our supply chain, products and operations by 2039, enabled by leading-edge digital capabilities.
NEW LIFE FOR BATTERIES IN ENERGY STORAGE
We are committed to redeploying and reusing batteries from our electric vehicles and one significant use is in energy storage and demand management.
We have partnered with Pramac to develop a portable zero-
emission energy storage unit powered by second-life Jaguar I-PACE batteries.
The mobile Off Grid Battery Energy Storage System (ESS) supplies zero-emission power where access to the mains supply is limited or unavailable, with a capacity of up to 125kWh – more than enough to power a regular family home for a week.
Reusing vehicle batteries will create new circular economy business models for Jaguar Land Rover in energy storage and beyond.
MAKING A DIFFERENCE THROUGH GLOBAL BRAND PARTNERSHIPS
Through every partnership, we seek to make a positive contribution to people and communities around the world.
The Red Cross
Our partnership with the International Federation of the Red Cross and Red Crescent Societies has endured since 1954. Throughout this time, we have facilitated life-saving work through funding, vehicles and expertise.
Today, we work together helping people in disaster preparedness, from reaching remote communities with vaccination programmes, to helping distribute tarpaulins for protection against monsoon floods.
During the Covid-19 pandemic, we supplied 267 vehicles to the Red Cross, which covered more than 500,000 miles helping people in crisis.
In addition, we have a fleet of vehicles supporting the International Federation of Red Cross Societies in their efforts to provide humanitarian aid to at-risk communities.
We are also a member of Disaster Relief Alliance, making sure that the Red Cross is ready to support people in the immediate aftermath of devastating crises around the world. Its Disaster Fund assisted six major responses, between April and September 2021.
Dream Fund
Cooperating with the China Soong Ching Ling Foundation (CSCLF), our Dream Fund is the first such activity in China’s automotive industry dedicated to helping children and young people achieve their potential.
Over eight years, we have undertaken a host of initiatives to improve education quality for rural children, guided by the principle of “more equal access”. Our Land Rover Never Stop Caring - Journey for Vision Programme has provided comprehensive healthcare and medical equipment in remote regions of China.
Volunteering for Education
Our sustained programme of education volunteering supports our position as the largest investor in automotive research

Annual Report 2021/22 J A G U A R L A N D R O V E R A U T O M O T I V E P L C 25
and development in the UK, by reaching enthusiastic young people with enquiring minds and a commitment to push the boundaries.
Through virtual work experience, school visits and tailored programmes, we enthuse and inspire a future generation of talent, with the aim of overcoming the STEM skills shortage faced by the automotive industry.
This provides our employees with an opportunity to volunteer and share their experiences.
Notwithstanding the Covid-19 restrictions in 2021, 213 employee volunteers, including a core team of apprentices and graduates, provided 881 hours of time to develop the programme, which has so far reached 148 students.
INVESTING IN OUR PEOPLE AND COMMUNITIES
Our people are our greatest asset and that is evidenced by their support to their communities, both individually and through our collective efforts as a company.
Protecting our people
Throughout our response to Covid-19, the health, wellbeing and safety of our people and partners has been our utmost priority and this has continued as colleagues have been returning to offices and workplaces around the world.
As part of our response to the Covid-19 pandemic, we were one of the first businesses and the largest in the UK, to introduce on-site Covid-19 testing.
By April 2022, we had performed 1.68 million temperature tests, 100,000 lateral flow tests, and over 1,000 PCR tests onsite.
In Slovakia, our Nitra facility set up a testing centre for our employees and contractors, providing more than 40,000 tests alone. The Slovakian government acknowledged that Jaguar Land Rover’s mass testing significantly contributed to managing a critical situation and protected the health of our employees, their families and communities.
Beyond testing, we managed a vaccination programme and supplied masks and respirators for our employees. We also created a hub of wellbeing support and information available to all employees throughout the pandemic, including podcasts, resources, and factsheets to help them easily access reliable information at a time of uncertainty. Hybrid working
Hybrid working reflects our agile working principles and in May 2021, as our employees returned to work in line with the scaling back of Covid-19 restrictions, we formally implemented a hybrid working scheme.
With the trust placed in our people, we have utilised technology to develop a comprehensive scheme that empowers employees with the flexibility to manage their working arrangements and location.
As well as enabling greater productivity and efficiency, hybrid working supports wellbeing, by giving employees more control, choice and flexibility over their working day.
We have committed to support our people both in continued on-site Covid-19 testing and a dedicated workspace booking app, to help them get the most from hybrid working arrangements.
Activities within the community
Our team in Nitra, Slovakia established a partnership with Nitra Volunteering Centre in December 2021 and organised a
collection for people in need during December.
Our manufacturing facility in Itatiaia, Rio de Janeiro joined forces with Instituto Toré for a one-year community partnership supporting and implementing two significant social responsibility projects in their local area, aimed at delivering education and skills on conservation and sustainable food production.
In December 2021, employees from Jaguar Land Rover’s UK sites came together to collect for local foodbanks, with the aim of supporting thousands of families who continued to struggle as a result of the Covid-19 pandemic.
The donation drive saw employees across the business support their local charities and communities, with more than 10,000 items such as tinned food and cereals donated to help local families in need, while employees also showed their support by donating just over £2,000 to an online collection fund.
Diversity & Inclusion
At Jaguar Land Rover we are committed to fostering a more diverse, inclusive and unified culture that is representative of our employees, our customers and the society in which we live; a culture where every one of our colleagues can bring their authentic self to work and feel empowered to reach their full potential.
There are tremendous benefits to an environment where everyone feels valued and included. Diversity of thought and experience will be a key driver of our future success as a business: we cannot underestimate the positive impact that diversity and inclusion can have on how we understand our customers, fuel our innovation and, most importantly, engage and inspire our most important asset, our people.
We have identified three strategic pillars to achieve our goal, which will shape our global Diversity and Inclusion activity over
the next five years. How they are implemented around the globe will vary and will be driven by the needs of the countries we operate in.
1. Shape a culture of unity, belonging, inclusion and respect
Educate, communicate and measure inclusive behaviours regularly and systematically, improving the employee experience for all.
2. Implement progressive policies, practices, benefits and support
Review and improve practices and policies to remove barriers, enable inclusion and realise equity.
3. Engage our employees and experts to accelerate progress
Collaborate with our networks, colleagues and experts to create real, positive change.
As part of our strategy, by 2026 we aim to have:
• Globally, at least 30 per cent of all senior leadership positions held by females – we will aim to at least mirror this representation at all levels of our business.
• In the UK, at least 15 per cent of all senior leadership positions held by those from Black, Asian, and minority ethnic backgrounds - we will aim to at least mirror this representation at all levels of our business.
• A score of over 80 per cent in our Inclusion Index, measuring the percentage of people who would recommend Jaguar Land Rover as an inclusive employer.
We will continue to measure progress on a number of other metrics as part of our regular employee surveys.

Annual Report 2021/22 J A G U A R L A N D R O V E R A U T O M O T I V E P L C 27
OPERATING ENVIRONMENT WE HAVE FACED A RANGE OF EXTERNAL CHALLENGES DURING FY2021/22, WHICH HAVE IMPACTED OUR BUSINESS. WHILE THE DISRUPTION FROM THESE EXTERNAL FACTORS LOOKS SET TO CONTINUE INTO FY2022/23, DEMAND FOR OUR PRODUCTS REMAINS STRONG AND WE REMAIN CONFIDENT THAT OUR REIMAGINE STRATEGY WILL POSITION OUR COMPANY FOR FUTURE SUCCESS.
CHALLENGES
Semiconductors & other supply constraints
Supply constraints, particularly semiconductors, restricted our ability to produce as many vehicles as we planned in FY2021/22. These supply chain challenges limited our capacity to build cars in line with customer demand and our wholesale volumes for the year were 294,182, down 15.4 per cent compared to the prior year. The shortage of semiconductors is likely to continue in the coming year with gradual improvement throughout FY2022/23.
In response to these challenges, we focused production on higher margin products and established new processes to closely monitor our supply chain. Looking further ahead, we have engaged in strategic discussions with key component suppliers and chip producers to secure long-term supply agreements for future product programmes, to increase our resilience.
Ukraine / Russia conflict
Our primary focus throughout the unfolding conflict in Ukraine has been the wellbeing of our workforce, as well as those in our extended network. Colleagues based at our Nitra manufacturing facility in Slovakia have provided border transportation and temporary accommodation to the families of our Ukrainian colleagues, as well as helping them integrate into the local community. In addition, we have mobilised a fleet of vehicles to the International Federation of Red Cross and Red Crescent Societies to provide humanitarian aid to at risk communities.
Commercially, sales volumes in the final quarter of FY2021/22 were not materially impacted by the conflict, with Russia and Ukraine historically accounting for less than 2.5 per cent of global sales. While new vehicle sales into Russia have been paused since the end of February, strong demand from customers in other markets can more than offset this volume in the coming year.
The Ukraine conflict has so far only had a limited impact on production volume as a result of active management of our parts supply chain. While we have a relatively small number of parts and commodities that are sourced from the affected countries, it is too early to say how future commodity supply and pricing could be impacted.
Global inflation
Inflationary pressures have been increasing, with aluminium prices rising 61 per cent during the fiscal year, while we also saw high volatility in gas prices across Europe in the fourth quarter. This will impact our business, as some prices we pay our suppliers are directly indexed to market rates, leading to increased material costs which could reduce our profit margin. This increasing inflationary pressure could also flow through
to consumer inflation expectations and drive a response from central banks in the coming year, which could impact the pace of future economic growth.
In the short term, we have a level of protection from immediate commodity price increases through our commodity hedging programme. We also monitor the impact of changes in material costs on our margins and may look to adjust sales prices if we cannot avoid passing cost increases to our consumers.
Covid-19
The ongoing impacts of Covid-19 vary across the world as new waves take hold and the risk of new variants remains a possibility. FY2021/22 saw a continuous easing of restrictions in the UK, however, across the globe responses vary, with China initiating large-scale lockdowns and testing programmes in some regions during the fourth quarter.
Covid-19 poses risks to supply chains and consumer demand where there are large-scale outbreaks or lockdowns. We see these risks generally reducing in the coming year, though our supply chain could be impacted if any of our suppliers were subject to lockdowns.
OPPORTUNITIES
Our strategy
Our Reimagine strategy and Refocus programme have set us on an exceptional journey of transformation. They have laid out a clear vision and pathway to become proud creators of modern luxury.
The strategy section of this report discusses our approach in more detail. These actions to transform our organisation will support us in responding to the external challenges.
Strong demand for great products
FY2021/22 saw the full global roll-out of New Defender and the launch of New Range Rover. Demand for both of these products has led to a record-breaking order book of 168,471 at the end of the year, with Defender making up 24 per cent of the order bank (40,618 orders) and New Range Rover accounting for 27 per cent, (45,584 orders ).
The recent reveal of New Range Rover Sport aims to repeat the success of the previous two product launches, and we have already seen a positive customer response to this exciting new model.
Collaborations & partnerships
Collaborations and partnerships are at the heart of our Reimagine strategy, and there have been some exciting new partnerships announced in FY2021/22.
In February 2022, we announced a new partnership with NVIDIA that will jointly develop AI-powered autonomous driving and connected services for all future vehicles built on NVIDIA DRIVETM. That same month, we became exclusive partners with BNP Paribas for financial services across nine European markets, and revealed the integration of Amazon Alexa on all on all new and existing Jaguar and Land Rover vehicles fitted with its advanced Pivi Pro infotainment system.
We will continue to build on collaborations such as these to deliver modern luxury experiences for our customers.

Annual Report 2021/22 J A G U A R L A N D R O V E R A U T O M O T I V E P L C 29
GLOBAL RETAIL SALES RETAIL SALES1 BY REGION Our retail sales were 376,381 vehicles in FY2021/22, down 63,207 vehicles (14.4 per cent) year-on-year. The decline was primarily the result of the semiconductor supply shortage which impacted production from the second quarter.
Retail sales fell down in all markets year-on-year, including China (down 13.9 per cent), North America (down 17.6 per cent), Europe (down 9.1 per cent), UK (down 23.6 per cent)
and overseas (down 2.8 per cent), as production volumes were limited by the semiconductor supply shortage. As the year progressed, the shortage gradually eased, and the third quarter saw an increase in production volumes compared to the second quarter.
Despite an easing of supply, retail sales in the China region were impacted in the fourth quarter by the reintroduction of Covid-19 restrictions in March 2022.
Total retail sales from our China Joint Venture were 54,035 vehicles for FY2021/22, down by 16.0 per cent from 64,319.
N O R T H A M E R I C A
E U R O P E
U K
C H I N A
O V E R S E A S
FY 2021/22 - 91,305FY 2020/21 - 110,805
(17.6)%
FY 2021/22 - 72,068FY 2020/21 - 79,260
(9.1)%
FY 2021/22 - 53,785FY 2020/21 - 55,322
(2.8)%
FY 2021/22 - 95,785FY 2020/21 - 111,206
(13.9)%
FY 2021/22 - 63,438FY 2020/21 - 82,995
(23.6)%
D E C R E A S E
D E C R E A S E D E C R E A S E D E C R E A S E
D E C R E A S E
(14.4)%J A G U A R L A N D R O V E R T O TA L
D E C R E A S E I N Y E A RFY 2021/22 - 376,381
FY 2020/21 - 439,588
1 Please see note 3 of the financial statements on page 76 for Alternative performance measures. “Jaguar Land Rover retail sales represent vehicle sales made by retailers to end customers and include the retail sale of vehicles produce.
ORDER BANK BY MODEL The order bank for our vehicles reached record highs in FY2021/22, with 168,471 orders at the end of the year. Orders were highest for the New Range Rover (45,584).
RETAIL SALES BY BRAND AND MODEL FAMILY
Our retail sales declined by 14.4 per cent year-on-year in FY2021/22. Jaguar retailed 77,381 vehicles (20.6 per cent of total retails, down 20.8 per cent) and Land Rover retailed 299,000 vehicles (79.4 per cent of total retails, down 12.6 per cent) compared to FY2020/21.
The semiconductor supply shortage impacted sales of every model apart from the New Defender and New Range Rover introduced in October 2021.
Against a backdrop of semiconductor supply issues, we prioritised higher margin products. Our Range Rover family continued to constitute the majority of our retail sales mix with 174,940 vehicles (46.5 per cent mix), followed by the Jaguar family with 77,381 vehicles (20.6 per cent mix); the Discovery family 62,343 vehicles (16.6 per cent mix); and the award-winning Defender, which reached 61,717 retails (16.3 per cent mix ).
RETAIL SALES BY POWERTRAIN
During FY2021/22, we continued to expand electrification across our 13 nameplates, with PHEVs now available on eight models and MHEVs available on 11 models, as well as the all-electric Jaguar I-PACE.
In FY2021/22, electrified vehicles totaled 66 per cent of our retail sales including 3 per cent for the all-electric Jaguar I-PACE, 9 per cent PHEV and 55 per cent MHEV, and we expect the sales of electrified vehicles to continue to increase in FY2022/23 and beyond.
FY 2021/22 - 77,381
FY 2020/21 - 97,669
(20.8)% D E C R E A S E
FY 2021/22 - 62,343
FY 2020/21 - 83,669
(25.5)% D E C R E A S E
BEV FY21 FY224% 3%
PHEV MHEV ICE
4% 8%
43%
55%
49%
34%
Q4
81
46
41
NEW RANGE ROVER DEFENDER OTHER
Q3
87
31
37
Q2
33
92
Q1
29
81
0
50
100
150
200
250
FY 2021/22 - 61,717
FY 2020/21 - 45,244
36.4% I N C R E A S E
FY 2021/22 - 174,940
FY 2020/21 - 213,006
(17.9)% D E C R E A S E
168
155
125
110
Numbers in thousands

Annual Report 2021/22 J A G U A R L A N D R O V E R A U T O M O T I V E P L C 31
In FY2021/22, we continued to see strong customer demand for our products with a record order bank, however, our sales were constrained by the industry-wide shortage of semiconductors.
While full year financial results reflect the restricted sales volumes, the continuing reduction in our breakeven point through revenue and cost management under our Refocus transformation programme enabled us to achieve positive margins and cash flow in the second half of the fiscal year.
In light of the rapidly developing Ukraine/Russia conflict, we have suspended vehicle sales in the region, and, while the full commercial effects are not yet known, we remain primarily concerned with the wellbeing of our people and our wider network.
Our retail sales were 376,381 and wholesales1 (excluding sales from our China joint venture) were 294,182 vehicles, down year-on-year 14.4 per cent and 15.4 per cent respectively as a result of semiconductor supply constraints.
Of those retail sales, 66 per cent were electrified, compared to 51 per cent in FY2020/21.
Our order bank grew through the year to reach 168,471 units as at 31 March 2022 including 45,584 orders for the New Range Rover and 40,618 for Defender.
Revenues for the year were £18.3 billion down 7 per cent year-on-
year, but average revenue per unit increased compared to the prior year reflecting the prioritisation of higher margin products giving us a strong mix, particularly in the Range Rover and Defender families.
Our loss before tax and exceptional items in FY2021/22 was £412 million. Adjusted EBITDA margin1 was 10.3 per cent (2.5 percentage points lower year-on-year) and adjusted EBIT margin1 was (0.4) per cent (down 3 per cent year-on-year), driven by lower wholesales, offset by increased pricing opportunities, lower incentive spending and a favourable mix.
Refocus delivered £1.5 billion of value, of which over £300 million has been supported by our InDigital team, demonstrating our mission to develop our digital capability, to drive efficiency and ultimately underpin the value creation of Refocus.
We continued to invest in future products with a total of £2 billion spent over the past year, reinforcing our commitment to electrification as part of our Reimagine strategy. Free cash flow1 after investment spending was £(1.2) billion for the year as a whole of which £(1.3) billion was the result of working capital changes largely driven by lower production volumes year-over-year.
We continue to maintain strong liquidity with total liquidity of £6.4 billion at the end of the fiscal year comprising total cash and cash equivalents, deposits and investments of £4.4 billion1 and £2.0 billion undrawn revolving credit facility (£1.5 billion after July 2022). We issued around £1.4 billion of new debt in FY2021/22 including £800
million (GBP equivalent) of new bonds in the second quarter and a £625 million, five-year loan backed by a £500 million UK Export Finance guarantee in December 2021. After repaying £556 million of existing debt, we ended the year with total debt of £7.6 billion and a net debt1 position of £3.2 billion.
Looking ahead, we expect the ongoing challenges facing the automotive industry to continue. However, with the order book at record levels and new products to come, expected continuing gradual improvement in semiconductor supply and the ongoing execution of the Reimagine strategy and Refocus programme, we expect to build on the improvements in business performance we have seen in the second half of this year.
ADRIAN MARDELLCHIEF FINANCIAL OFFICERJaguar Land Rover Automotive plc13 June 2022
1Please see note 3 of the financial statements on page 76 for alternative performance measures.
CHIEF FINANCIAL OFFICER’S STATEMENT
“In FY2021/22, we continued to see strong customer demand for our products with a record order bank.”

Annual Report 2021/22 J A G U A R L A N D R O V E R A U T O M O T I V E P L C 33
OUR FINANCIAL PERFORMANCECONSOLIDATED INCOME STATEMENT Our revenue and profitability were lower in FY2021/22 compared to the prior year largely due to the limitations on production volumes caused by the global supply chain semiconductor shortages. Since the low point during Q2, quarterly improvements could be seen in free cash flow1, revenue and profitability, primarily as a result of a favourable mix and further cost efficiencies delivered by the Refocus programme.
REVENUE Revenue was £18.3 billion in FY2021/22, down 7.2 per cent from £19.7 billion in the prior year. Wholesales3, excluding the China joint venture, declined across all key regions, down 15.4 per cent year-on-year to 294,182 units, except in the overseas region where wholesales grew 5 per cent year-on-year. The reduction in revenue was much lower than the decline in wholesales, reflecting the strong favourable sales mix and higher average revenue per vehicle during the year.
ADJUSTED EBITDA1
Adjusted EBITDA was £1.9 billion1 (10.3 per cent margin) in FY2021/22, £635 million lower than the Adjusted EBITDA of £2.5 billion (12.8 per cent margin) in the previous fiscal year. Lower wholesales, material cost pressures due to price inflation and continued reduction in capitalisation rate (reflecting the maturity of engineering) were offset by a more favourable sales mix and lower incentive spending (driven by lower inventory levels and optimisation activity).
ADJUSTED EBIT1
Adjusted EBIT was £(66) million1 with a margin of (0.4) per cent in FY2021/22, £580 million lower compared to the Adjusted EBIT of £514 million1 (2.6 per cent margin) in the prior year. This reflects the lower Adjusted EBITDA impacted by volumes, price inflation and capitalisation rate offset by favourable mix and lower incentive spending.
LOSS BEFORE TAX AND EXCEPTIONAL ITEMS (PBT) PBT excluding exceptional items was £(412) million1 in FY2021/22, £1,074 million than the prior year (profit before tax and exceptional items of £662 million1). This reflects the lower EBIT, adverse exchange and commodities valuations and higher net finance expense as a result of the increase in indebtedness.
LOSS AFTER TAX (PAT) The loss after tax was £822 million in FY2021/22, compared to the loss of £1.1 billion in the prior year. A tax charge of £367 million was recorded in FY2021/22, compared to a £239 million tax charge in FY2020/21.
The prior year profit before tax includes non-recurring exceptional items of £(1.5) billion compared to an exceptional item relating to our business in Russia of £(43) million in FY2021/22.
1Please see note 3 of the financial statements on page 76 for alternative performance measures.
FY 2021/22 / £18.3bn
FY 2020/21 / £19.7bn
FY 2019/20 / £23.0bn
£18.3bn
FY 2021/22 / £1.9bn / (10.3% margin)
FY 2020/21 / £2.5bn / (12.8% margin)
FY 2019/20 / £2.1bn / (8.9% margin)
£1.9bn(10.3% margin)
FY 2021/22 / £(66)m / (0.4% margin)
FY 2020/21 / £514m / (2.6% margin)
FY 2019/20 / £26m / (0.1% margin)
£(66)m(0.4% margin)
FY 2021/22 / £(0.4)bn
FY 2020/21 / £0.6bn
FY 2019/20 / £(0.4)bn
£(0.4)bn
FY 2021/22 / £(0.8)bn
FY 2020/21 / £(1.1)bn
FY 2019/20 / £(0.5)bn
£(0.8)bn
33Annual Report 2021/22 J A G U A R L A N D R O V E R A U T O M O T I V E P L C
Annual Report 2021/22 J A G U A R L A N D R O V E R A U T O M O T I V E P L C 35
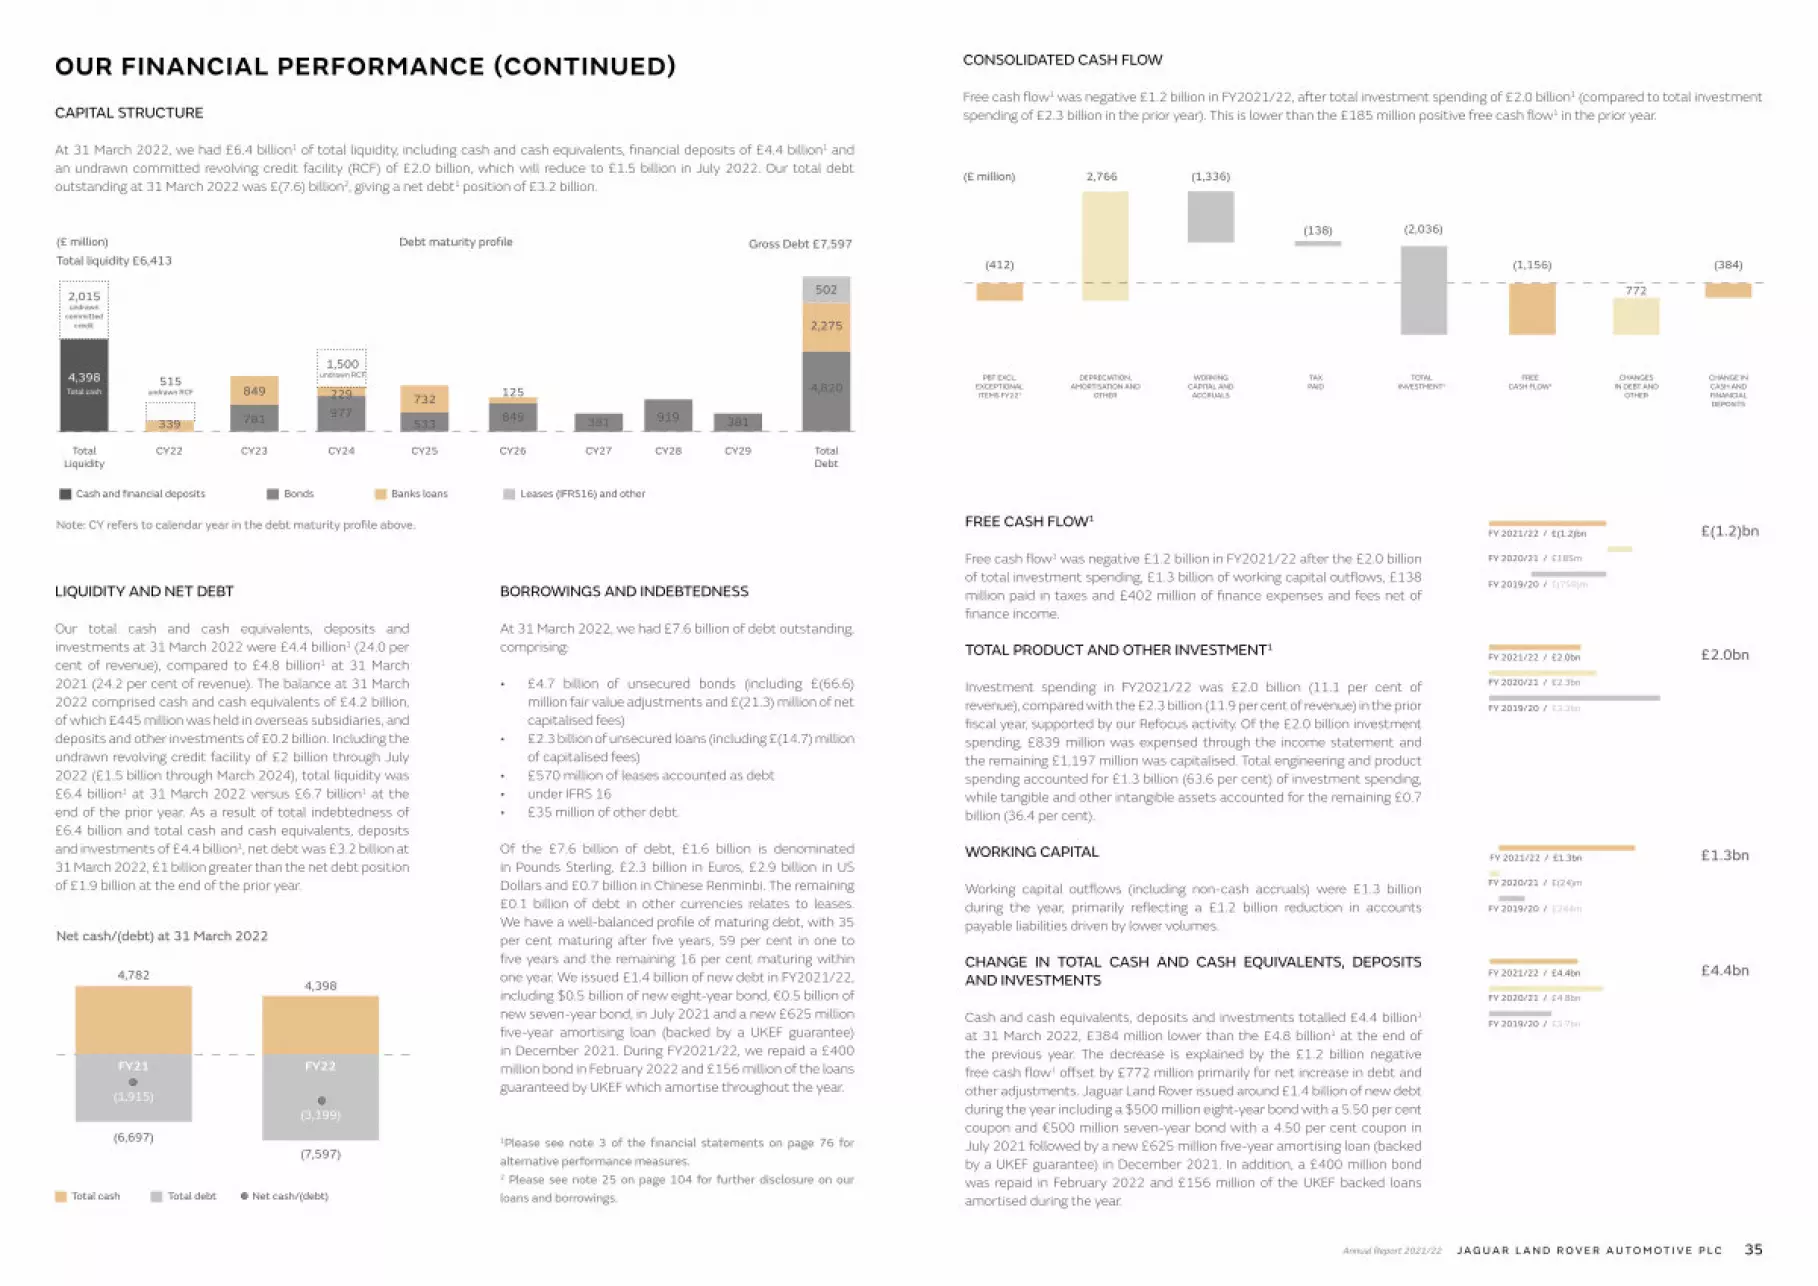
OUR FINANCIAL PERFORMANCE (CONTINUED)CAPITAL STRUCTURE At 31 March 2022, we had £6.4 billion1 of total liquidity, including cash and cash equivalents, financial deposits of £4.4 billion1 and an undrawn committed revolving credit facility (RCF) of £2.0 billion, which will reduce to £1.5 billion in July 2022. Our total debt outstanding at 31 March 2022 was £(7.6) billion2, giving a net debt1 position of £3.2 billion.
LIQUIDITY AND NET DEBT
Our total cash and cash equivalents, deposits and investments at 31 March 2022 were £4.4 billion1 (24.0 per cent of revenue), compared to £4.8 billion1 at 31 March 2021 (24.2 per cent of revenue). The balance at 31 March 2022 comprised cash and cash equivalents of £4.2 billion, of which £445 million was held in overseas subsidiaries, and deposits and other investments of £0.2 billion. Including the undrawn revolving credit facility of £2 billion through July 2022 (£1.5 billion through March 2024), total liquidity was £6.4 billion1 at 31 March 2022 versus £6.7 billion1 at the end of the prior year. As a result of total indebtedness of £6.4 billion and total cash and cash equivalents, deposits and investments of £4.4 billion1, net debt was £3.2 billion at 31 March 2022, £1 billion greater than the net debt position of £1.9 billion at the end of the prior year.
BORROWINGS AND INDEBTEDNESS At 31 March 2022, we had £7.6 billion of debt outstanding, comprising:
• £4.7 billion of unsecured bonds (including £(66.6) million fair value adjustments and £(21.3) million of net capitalised fees)
• £2.3 billion of unsecured loans (including £(14.7) million of capitalised fees)
• £570 million of leases accounted as debt • under IFRS 16 • £35 million of other debt.
Of the £7.6 billion of debt, £1.6 billion is denominated in Pounds Sterling, £2.3 billion in Euros, £2.9 billion in US Dollars and £0.7 billion in Chinese Renminbi. The remaining £0.1 billion of debt in other currencies relates to leases. We have a well-balanced profile of maturing debt, with 35 per cent maturing after five years, 59 per cent in one to five years and the remaining 16 per cent maturing within one year. We issued £1.4 billion of new debt in FY2021/22, including $0.5 billion of new eight-year bond, €0.5 billion of new seven-year bond, in July 2021 and a new £625 million five-year amortising loan (backed by a UKEF guarantee) in December 2021. During FY2021/22, we repaid a £400 million bond in February 2022 and £156 million of the loans guaranteed by UKEF which amortise throughout the year.
1Please see note 3 of the financial statements on page 76 for alternative performance measures.2 Please see note 25 on page 104 for further disclosure on our loans and borrowings.
FREE CASH FLOW1
Free cash flow1 was negative £1.2 billion in FY2021/22 after the £2.0 billion of total investment spending, £1.3 billion of working capital outflows, £138 million paid in taxes and £402 million of finance expenses and fees net of finance income.
TOTAL PRODUCT AND OTHER INVESTMENT1
Investment spending in FY2021/22 was £2.0 billion (11.1 per cent of revenue), compared with the £2.3 billion (11.9 per cent of revenue) in the prior fiscal year, supported by our Refocus activity. Of the £2.0 billion investment spending, £839 million was expensed through the income statement and the remaining £1,197 million was capitalised. Total engineering and product spending accounted for £1.3 billion (63.6 per cent) of investment spending, while tangible and other intangible assets accounted for the remaining £0.7 billion (36.4 per cent).
WORKING CAPITAL
Working capital outflows (including non-cash accruals) were £1.3 billion during the year, primarily reflecting a £1.2 billion reduction in accounts payable liabilities driven by lower volumes.
CHANGE IN TOTAL CASH AND CASH EQUIVALENTS, DEPOSITS AND INVESTMENTS Cash and cash equivalents, deposits and investments totalled £4.4 billion1 at 31 March 2022, £384 million lower than the £4.8 billion1 at the end of the previous year. The decrease is explained by the £1.2 billion negative free cash flow1 offset by £772 million primarily for net increase in debt and other adjustments. Jaguar Land Rover issued around £1.4 billion of new debt during the year including a $500 million eight-year bond with a 5.50 per cent coupon and €500 million seven-year bond with a 4.50 per cent coupon in July 2021 followed by a new £625 million five-year amortising loan (backed by a UKEF guarantee) in December 2021. In addition, a £400 million bond was repaid in February 2022 and £156 million of the UKEF backed loans amortised during the year.
849
Debt maturity profile
Total Liquidity
4,398
CY22 CY23 CY24 CY25 CY26 CY27 CY28
Cash and financial deposits Bonds Banks loans Leases (IFRS16) and other
CY29 Total Debt
502
4,820
381977781 533 919849
Total cash
2,015undrawn
committed credit
Gross Debt £7,597Total liquidity £6,413
229
381
515undrawn RCF
732 125
339
2,275
(£ million)
Note: CY refers to calendar year in the debt maturity profile above.
1,500undrawn RCF
4,782
Net cash/(debt) at 31 March 2022
4,398
Total cash
(6,697)(7,597)
FY21 FY22
(1,915)(3,199)
Total debt Net cash/(debt)
FY 2021/22 / £2.0bn
FY 2020/21 / £2.3bn
FY 2019/20 / £3.3bn
£2.0bn
FY 2021/22 / £1.3bn
FY 2020/21 / £(24)m
FY 2019/20 / £244m
£1.3bn
FY 2021/22 / £(1.2)bn
FY 2020/21 / £185m
FY 2019/20 / £(759)m
£(1.2)bn
FY 2021/22 / £4.4bn
FY 2020/21 / £4.8bn
FY 2019/20 / £3.7bn
£4.4bn
PBT EXCL.EXCEPTIONALITEMS FY221
2,766 (1,336)
772
(138) (2,036)
(384)(412)
DEPRECIATION, AMORTISATION AND
OTHER
WORKINGCAPITAL AND
ACCRUALS
TAXPAID
TOTALINVESTMENT1
FREECASH FLOW1
CHANGESIN DEBT AND
OTHER
CHANGE INCASH ANDFINANCIALDEPOSITS
(£ million)
(1,156)
CONSOLIDATED CASH FLOW Free cash flow1 was negative £1.2 billion in FY2021/22, after total investment spending of £2.0 billion1 (compared to total investment spending of £2.3 billion in the prior year). This is lower than the £185 million positive free cash flow1 in the prior year.

Annual Report 2021/22 J A G U A R L A N D R O V E R A U T O M O T I V E P L C 37
Jaguar Land Rover Automotive plc Board
Audit Committee
Jaguar Land Rover Limited Board of Directors
Risk Management Committee
FIRST LINE OF RISK DEFENCE
Control of risksBusiness operations risk management
SECOND LINE OF RISK DEFENCE
Oversight and confirmation of controlsERM and oversight functions
THIRD LINE OF RISK DEFENCE
Independent controls assuranceinternal audit
OUR ENTERPRISE RISK MANAGEMENT RESPONSIBILITY FRAMEWORK
OUR APPROACH TO RISKOUR APPROACH TO RISK We endeavour to manage and monitor risk factors that could impact our plan for long-term sustainable growth.
DEFINING RISK Risks are uncertain events that could materially impact organisational objectives – both adversely and favourably. We recognise that risk is inherent in all business activities and must be balanced when assessing returns. Successful management of risk is therefore key to accomplishing our strategic objectives. We utilise an Enterprise Risk Management (ERM) framework to identify, assess, manage and continually monitor and report on key risks that could affect our business.
RESPONSIBILITY FOR RISK The Jaguar Land Rover Automotive plc Board is ultimately responsible for the management of risks facing our organisation. However, the wider organisation is responsible for the proactive day-to-day management and control of those risks. The Jaguar Land Rover Limited Board of Directors review key risks to monitor the progress of remediation actions, whilst the Risk Management Committee provides oversight of current and emerging risks at a detailed level that are reviewed against acceptable levels of exposure. Principal risks and exceptions are reported to the Audit Committee regularly to assist in the decision making process and ensure adequate controls are in place to provide sufficient protection to the organisation.
PRINCIPAL RISKS We identify, assess and rate risks against a defined set of criteria, considering probability and potential impact to the business. Our ten principal risks are plotted and ranked in the heat map below:
Low HighIMPACT
PRO
BABI
LITY
Hig
h
High exposure risks that are more likely to materially impact our ability to achieve business objectives
Medium exposure risks that could impact business objectives unless monitored and managed
Low exposure risks that are more unlikely to materialise and impact our business objectives
12
34
567
1098
RANK Principal risk Category
1 Supply chain disruptions Operational
2 Global economic and geopolitical environment Strategic
3 IT systems and security Operational
4 Competitive business efficiency Financial
5 Customer experience delivery Operational
6 Manufacturing operations Operational
7 Brand positioning Strategic
8 Electrification transformation Strategic
9 Environmental regulations and compliance Legal and compliance
10 Human capital Operational
One risk has been introduced into our principal risks:
• Electrification transformation
Mitigating actions are in place (as detailed on pages 38 to 39) to address the formation, delivery and cohesion of our product, business and service-related projects.
One risk has been removed from our principal risks:
• Rapid technology change
Plans and mitigating actions put in place have proved effective in reducing our overall exposure in these areas to within acceptable levels.
CHANGES TO OUR PRINCIPAL RISKS DURING FY2021/22
Semiconductor shortage
Throughout FY2021/22 the automotive industry has been responding to the challenges of the global shortage of semiconductors. This has been driven by a combination of factors including supplier production disruption, increased demand from non-automotive sectors and the long lead times required for suppliers to install additional production capacity in response to demand. The impact of the shortages in the past year has had a significant impact our supply chain and our ability to satisfy customer demand leading to a reduction in our retail volumes compared to FY2020/21.
Looking ahead, we expect gradual improvements in the availability of semiconductors, driven by increases in installed production capacity at suppliers. Demand is expected to remain above supply for some time within automotive and other sectors, so the risk of supply chain disruption is expected to remain high.
Covid-19
The impact of the Covid-19 pandemic on our business reduced in the past year as vaccines were rolled out in many countries, while many businesses found ways to adapt to the new ways of working that had been imposed upon them.
The risk that we will see some level of disruption on our business from Covid-19 remains high as we may continue to see localised lockdown actions imposed by governments around the world, which could disrupt our global supply chain or production facilities.
Economic and geopolitical factors
Inflationary pressures have been increasing with aluminium prices rising 61 per cent during the fiscal year, while we also saw high volatility in gas prices across Europe in the fourth quarter linked to the conflict in Ukraine. This will impact on our business, as some prices we pay our suppliers are directly indexed to market rates leading to increased material costs which could reduce our profit margins. This increasing inflationary pressure could also flow through to consumer inflation expectations and drive a response from central banks in the coming year, which could impact upon the pace of future economic growth.
In the near term, we have has a level of protection from immediate commodity price increase through our commodity hedging programme. We also monitor the impact of changes in material costs on our margins and may look to adjust sales prices if we cannot avoid passing cost increases to our consumers.
Reimagine
Our new Reimagine strategy will redefine our business and our vehicle portfolio, with a value-led approach delivering quality and profit-over-volume. Whilst we are confident that Reimagine will deliver a more profitable and sustainable business, we remain aware of execution risks that such a significant transformation poses to our business.
MAJOR DEVELOPMENTS IMPACTING UPON OUR PRINCIPAL RISKS IN FY2021/22

Annual Report 2021/22 J A G U A R L A N D R O V E R A U T O M O T I V E P L C 39
PRINCIPAL RISKS
FINANCIAL CONSEQUENCES MITIGATIONS/OPPORTUNITIES
4. Competitive business efficiency Delivering on our business and strategic objectives is key to realising our planned future profitability and cash generation through return on our investments. There are risks inherent in the delivery of our planned Reimagine strategy as we make the investments to transition our product portfolio and increase the proportion of electric vehicles in the future. This includes our assumptions around the level of customer demand for our products and delivery of our products at a competitive cost.
If our business is unable to compete effectively on cost we may experience lower than expected returns on our future investments, which may make us unable to deliver on our financial objectives in the future. This may also limit our ability to reduce net debt as planned, reducing our ability to raise new debt and invest further in new products.
We have launched the Refocus programme to support the delivery of our Reimagine vision. This operational transformation programme includes a focus on ensuring timely new product delivery to market and management of the cost base of the business, while also ensuring that we maximise profitability on our sales. We maintain strong liquidity in the business to ensure that we can navigate any funding challenges that may arise in the future.
OPERATIONAL CONSEQUENCES MITIGATIONS/OPPORTUNITIES
1. Supply chain disruptionsOur ability to supply components to our manufacturing operations at the required time is of paramount importance in achieving production schedules and meeting consumer demand. The Covid-19 pandemic continues to have an impact on our global supply base and our supply chain could be severely disrupted as a result of any subsequent external shocks, industry specific and company factors in the future.
Supply chain disruptions, if not managed, could have an adverse effect on our pro-duction volume, revenue and profitability, customer satisfaction and reputation. In addition to the disruption caused by the pandemic, the associated supply con-straints of semiconductors has impacted many industries including automotive. As the transition to electrified vehicles continues, the skills, processes and tech-nologies required to ensure continuity of supply will change, so securing these supply chains is business critical.
An effective supply chain risk management framework enables early, proactive, engagement with our suppliers to identify and mitigate potential disruptions. A key component of our Refocus transformation programme focuses specifically on the resilience of our supply chain and the efficiency of launching our models to market. We continue to maintain and develop strong partnerships with key strategic suppliers, including for electrification to ensure a stable future supply of components.
3. IT system and securityAs technology is increasingly central to our business, safeguarding our information assets, ensuring privacy and reducing human risk are paramount. Like other organisations, we are operating in a perilous cyber climate, making it a constant target for cyber crime. We strive to reduce cyber security risks and continue to deliver great experiences for our customers and value for our shareholders.
Successful cyber-attacks could cause sig-nificant business disruption, affecting our ability to deliver products and services for our customers. In extreme situations this could affect the personal safety of our customers and colleagues. Regulatory and statutory requirements are increas-ing, and failure to meet these obligations, such as privacy and data protection law, could result in enforcement action, fines, reputational and financial damage.
Information risk and cyber security are managed strategically, through a cohesive programme of initiatives, to improve risk and maturity of cyber capabilities. Significant investment is driving measurable improvements in cyber defence and other core security capabilities, such as security ecosystem, supply chain security, risk governance and cultural change.
5. Customer Service deliveryTo deliver a modern luxury customer experience and optimise our sales and service channels, every customer must receive a seamless and consistent hassle-free experience provided on their terms. We must know who our customers are, anticipate their needs and respect their privacy on their terms. Customers must be delighted at every step. Our retailer partners reflect our brand strategy and vision, and must ef-fectively communicate our values, with trained and capable representatives, to continue to successfully appeal to new and existing customers and drive high customer satisfaction and retention.
Inconsistent customer experience impacts the satisfaction and retention of existing customers, and the attraction of new customers. Failure to deliver an exceptional sales and service experience through online and physical retailer channels will lead to a weakening in our competitive positioning, potentially impacting our business and financial performance as a result.
Market demand is monitored daily to optimise vehicle and parts deliveries for our retailers and customers. Online channels have been simplified to enhance the customer experience. Retailer systems and tools have been enhanced, supporting Retailer Sales, Service and Technician representatives to deliver a seamless and consistent hassle-free customer experience, increasing our sales and service customer satisfaction. Furthermore, other digital solutions have continued to evolve, such as our Software Over the Air (SOTA) and Features Over The Air (FOTA) services now in development, to help strengthen the relationship with our retailers and customers.
6. Manufacturing operations Manufacturing operations are at the heart of our value chain, and any losses to scheduled production will have a detrimental effect on both financial performance and customer satisfaction. The Covid-19 pandemic and Brexit have increased our production continuity risk exposure and we continue to closely monitor the supply base and supply chain efficacy and ensure the health and safety and wellbeing of our people and there are ongoing threats to our cyber security.
Any disruptions to our manufacturing operations and losses in vehicle production could results in delays to both retailer and customer deliver, and potential delays or loss of revenue in key regions, including China, through loss of sales.
Manufacturing works closely with the Purchasing and Supply Chain functions to monitor and manage suppliers that pose part supply risks to production. We have embedded new data analytics tools and processes to identify and manage suppliers in high risk regions and apply safety stock where feasible. Having implemented multiple response measures to ensure our sites are Covid-19 safe working environ-ments – a phased de-escalation approach is now being adopted across our sites. A joint approach with Manufacturing Operations, Employee Relations and Human Resources with our LLP provider seeks to improve our supplier and Trade Union relationships to minimise risk of industrial action. There is an ongoing programme of Server Estates protection and pro-posals for the replacement of Legacy IT Systems and Equipment to reduce threats to our Cyber Security.
10. Human capital To be successful, our business requires an engaged workforce, with core capabilities in new and emerging skill areas. The safety, wellbeing and engagement of our employees is paramount and needs to be maintained in the face of a challenging external environment and through the transformation of our organisation.
If we fail to attract, retain, engage and develop a diverse workforce with critical skills and capabilities, our ability to deliver innovative products and services will be constrained and we will be prevented from deploying the agility and speed of delivery that is essential within the dynamic automotive industry.
A key aspect of the Refocus transformation pro-gramme is to develop an agile, capable organisation and culture through changes to ways of working and the introduction of a new business purpose and supporting behaviours. Leveraging our digital capability and solutions through InDigital enables a more efficient, focused and productive workforce. Our Diversity and Inclusion strategy will make the most of the uniting power of our differences and the unique qualities that each of our workforce brings.
STRATEGIC CONSEQUENCES MITIGATIONS/OPPORTUNITIES
2. Global economic and geopolitical environmentWe are exposed to changes in the global economic and geopolitical environment, as well as other external factors including but not limited to trade tensions, protectionism, wars, terrorism, natural disasters, humani-tarian challenges and pandemics that may adversely impact our business.
Our international presence and global sales profile means that our business could be significantly impacted by the external environment, globally or locally. Our global supply chain could also be negatively affected by disruption caused by external factors in the future. As a result, our business could be adversely affected through lower sales in each region.
We continue to closely monitor and risk assess global developments, implementing mitigation plans as necessary and we continue to maintain a balanced sales profile across our key sales regions. Our diverse global customer base gives us the flexibility to react to regional changes in demand by adjusting our sales mix into other markets, while we may adjust product features or content should we face supply challenges in the future.
7. Brand positioning The automotive sector remains competitive with new entrants joining the market, particularly the electric vehicle segment. Under the Reimagine strategy, the business will target growth in our most profitable segments and continue to drive our modern luxury vision for both the Jaguar and Land Rover brands.
Our potential inability to successfully position, maintain and articulate the strength of our brands as well as failing to develop new products and technologies that meet customer preferences, or not being able to sufficiently invest in brand building, could impact demand for our products.
Under the Reimagine strategy, both of our brands continue our modern luxury vision to support our brand position in the market, with Jaguar relaunching as an all-electric brand from 2025 targeting a more premium segment of the market. As part of the Reimagine strategy we are increasing our collaboration and partnerships both within the Tata Group and with external organisations in a number of areas to ensure we can meet our customer expectations.
8. Electrification transformation Our electrification transformation is fundamental to our Reimagine strategy and sustainable future. It is vitally important to ensure that the product, business and service related aspects of our business are cohesive, timely and relevant in the dynamic external environment.
Our potential inability to ensure a robust and effective transition towards electrification, could result in non-compliance with environmental regulations, an uncompetitive product portfolio and a deterioration in financial performance.
Our Reimagine strategy will deliver three platforms, including a pure BEV for the Jaguar brand, a native BEV for EMA and a flex platform for MLA, enabling an acceleration of our electrification transformation and our journey towards net zero carbon emissions target in 2039. Strategic options for our battery requirements, services and software have been evaluated and are in the process of being integrated into delivery plans. We will work with governments, service providers and infrastructure operators to ensure our customers have seamless access to world-class charging solutions.
LEGAL & COMPLIANCE CONSEQUENCES MITIGATIONS
9. Environmental regulations and compliance We are subject to a rapidly evolving regulatory landscape with associated laws, regulations and policies that all impact our facilities and vehicles. The transition away from traditional fossil fuels to renewable energy sources - and the increasing pace of that transition - creates particular compliance challenges, in particular tailpipe emissions for automotive companies and wider compliance requirements for carbon emissions produced during manufacturing and other operations.
We incur additional compliance costs to avoid facing significant civil and regulatory penalties, and our competitors may gain an advantage by adopting new emissions-reducing and fuel-efficient technologies before we do. Furthermore, we may incur significant reputational damage, which could materially impact our brands and sales, if we fail to maintain environmental compliance.
We have committed to approved science-based targets as part of our carbon reduction strategy. This will see us reduce absolute Scope 1 & 2 greenhouse gas (GHG) emissions by 46 per cent by FY30 from a FY20 base year. We also commit to reduce Scope 3 GHG emissions from purchased goods and services and use of sold products by 54 per cent per car by FY30 from a FY20 base year. These targets are consistent with reductions required to keep warming to 1.5°C above preindustrial levels.

Annual Report 2021/22 J A G U A R L A N D R O V E R A U T O M O T I V E P L C 41
INTRODUCTION TO GOVERNANCE STATEMENT OF CORPORATE GOVERNANCE ARRANGEMENT
For the year ended 31 March 2022, under the Companies (Miscellaneous Reporting) Regulations 2018, Jaguar Land Rover Automotive plc (the “Company”) and its subsidiaries (collectively referred to as the “Group”) has continued to apply the Wates Corporate Governance Principles for Large Private Companies (‘Wates Principles’) (published by the Financial Reporting Council (‘FRC’) in December 2019 and are available on the FRC website). The following section summarises how the Group has applied the principles over the past year.
The Group’s website contains further supporting information on the Wates Principles.
The Group remains committed to ensuring effective governance is in place to deliver its core values, as this is the foundation on which it manages and controls its business and provides the platform for sustainable profitability.
SECTION 172 COMPANIES ACT 2006
Wates Principles provides a framework for the Group to not onlydemonstrate how the board of Directors of Jaguar Land Rover Automotive plc (the ‘Board’ / ‘JLR plc Board’) makes decisions for the long term success of the company and its stakeholders (see Principle 6 - Stakeholders, on page 51), but also having regard to how the Board ensures the Group complies with the requirements of Section 172 (1)(a) to (f ) of the Companies Act 2006. Our reporting against the Wates Principles has been included below.
During 2022, the Board Members have welcomed new Directors who collectively are continuing to review, challenge and strive towards changes to implement and demonstrate the Group’s improving engagement with its employees and stakeholders.
SECTION 172 DECISIONS
a) the likely consequences of any decision in the long term
The Board annually approves the five-year plan and monitors its implementation throughout the year.
External factors are also considered such as economic, political and ongoing challenges within the market as a part of the five-year plan to ensure both financial and operating strategy is set at sustaining and achieving the long term success of the Group.
To further enhance and support the long term strategy, the Group entered into a number of debt funding arrangements during the financial year.
See page 35
b) the interests of the company’s employees
At Jaguar Land Rover, we are passionate about our people. They are at the heart of our business. We are committed to fostering a diverse, inclusive culture that is representative of the society in which we live; a culture in which every one of our employees can bring their authentic self to work and reach their full potential.
We aim to as part of a five-year plan:•shape a culture of unity, belonging, inclusion and respect;•implement progressive policies, benefits and support; and•engage our employees to accelerate our progress.
The Directors understand the importance of the Group’s employees to the long-term success of the business. The Group regularly communicates to its employees through presentations, internal group-wide emails and newsletters.
A pulse survey undertaken annually allows employees to formally provide feedback to further support the long term plans of the Group in addition to informal feedback sessions held during the year with various Executive Directors. Learning and development continues to be an important area of support to employees through both training days and e-learning modules. Internal networks to support wellbeing have been created to provide and create communities to discuss and share support on mental health, general wellbeing and advice on the coronavirus outbreak.
We proudly support the growing number of active diversity and inclusion employee-led networks both in the UK and Overseas. These include Pride, REACH, Armed Forces, Gender Equality, Shine, Disability and a number of religious groups.
See page 25
SECTION 172 DECISIONS
c) the need to foster the company’s business relationships with suppliers, customers and others
The Directors understand the importance of the Group’s supply chain in delivering the long-term plans of the Group. The Group’s principal risks and uncertainties set out risks that can impact the long-term success of the Group and how these risks interact with our stakeholders. Our suppliers of production and non-production goods and services play an integral role in our business and help us to operate globally. For example, we have engaged in strategic discussions with key component suppliers and chip producers to secure long-term supply agreements for future product programmes, to increase our resilience. The Group has key objectives and principles which are set out clearly in the Global Supplier Management policy. Ensuring this policy is followed to achieve consistent and best practice in our relationships with our suppliers, in addition to ensuring ethical behaviour, sustainability and health and safety is considered critical to the success of our business relationships.
The Directors monitor the Group’s engagement with their customers through the use of various Customer Experience Insight tools which helps collate feedback from time of vehicle purchase onwards. This process is run internally and enables both the Group and Retailers globally to help improve customer engagement. Other regular customer feedback mechanisms exists through a variety of syndicated surveys to provide and offer external and independent feedback.
The Directors actively seek information on the interaction with stakeholders and employees to ensure that they have sufficient information to reach appropriate conclusions about the risks faced by the Group.
d) the impact of the company’s operations on the community and environment
Further information on the Group’s initiatives and commitment to the environment and society can be found from page 20.
See page 20
e) The desirability of the company maintaining a reputation for high standards of business conduct
At Jaguar Land Rover we are passionate about our people. We are committed to fostering a more diverse, inclusive and unified culture that is representative of our customers and the society in which we live; a culture where every one of our employees can bring their authentic self to work and feel empowered to reach their full potential. We have identified three strategic pillars to achieve our goal, which will shape our global D+I activity over the next five years:
- Shape a culture of unity, belonging, inclusion and respect
- Implement progressive policies, practices, benefits and support
- Engage our employees and experts to accelerate progress Collaborate with our networks,
The Board has also approved the Group’s policies on anti-slavery and human trafficking and anti-bribery and corruption in addition to the gender pay gap report which is issued annually.
All can be found on the Group’s website.
f) The need to act fairly as between members of the company
The Group is owned by Tata Motors Limited (“TML”) and collectively are committed to continuing to build future growth through new models through a roadmap that provides a clear direction for the business and our two brands.
There is close collaboration and knowledge-sharing with Tata Group companies to enhance sustainability and reduce emissions as well as sharing best practice in next-generation technology, data and software development leadership.

Annual Report 2021/22 J A G U A R L A N D R O V E R A U T O M O T I V E P L C 43
WATES PRINCIPLE 1 – PURPOSE AND LEADERSHIP
The board of Directors of Jaguar Land Rover Automotive plc the ‘Board’ rigorously challenges strategy, performance, responsibility and accountability so that every decision made is of the highest quality.
The Board actively ensures through committee meetings and careful consideration of all economic, geopolitical and environmental factors that the appropriate strategy and decisions are made.
The Board has built and strengthened the Group’s strategic vision through the Reimagine strategy and Refocus programme discussed from page 10.
The Board continues to proactively consider the impact to the Business as a response to a variety of factors such as the Covid pandemic, and global shortage of semiconductor computer chips. All factors are considered and discussed carefully whilst considering demand and impact on business plan.
This Corporate Governance Report includes further information about the Board, areas of focus for the Board, and the structure and role of its committees.
Details of individual directors’ attendance of Board meetings in 2022 are shown in the following table:
NAME OF DIRECTOR Maximum no. of Principal Board Meetings director could attend
No. of Principal Board Meetings director attended
Percentage of Principal Board Meetings attended
Chief Executive Officer and Executive Director
Thierry Bolloré 7 7 100%
Non-Executive Director
Natarajan Chandrasekaran (Chairman) 7 7 100%
Pathamadai Balaji 7 7 100%
Nasser Mukhtar Munjee 7 7 100%
Charles Nichols* 1 1 100%
Al-Noor Ramji* 1 1 100%
Andrew Robb 7 7 100%
Hanne Sorensen 7 7 100%
Prof. Sir Ralf Speth(Vice Chairman) 7 7 100%
WATES PRINCIPLE 2 - BOARD COMPOSITION
We continuously evaluate the balance of skills, experience, knowledge and independence of the Group’s directors. The Board comprises a separate Chairman and Chief Executive Officer to ensure that the balance of responsibilities, accountabilities and decision making across the Group are effectively maintained. The size and composition of the Board is considered to be appropriate with all members contributing to a wide variety of experience.
The Board continues to work on creating a more diverse board of directors and recognises this as a challenge in the automotive sector. There are strategies in place which encourage diversity throughout the workplace with opportunities for employees to progress to senior levels. Further there have been two new additions to the board during FY22.
* Appointed 24 January 2022
43Annual Report 2021/22 J A G U A R L A N D R O V E R A U T O M O T I V E P L C

Annual Report 2021/22 J A G U A R L A N D R O V E R A U T O M O T I V E P L C 45
JAGUAR LAND ROVER LIMITED BOARD OF DIRECTORS
T H I E R R Y B O L L O R ÉC H I E F E X E C U T I V E
O F F I C E R
N I G E L B L E N K I N S O PE X E C U T I V E D I R E C T O R ,
C O M PA N Y Q U A L I T Y A N D C U S T O M E R S AT I S FA C T I O N
H A N N O K I R N E RE X E C U T I V E D I R E C T O R , TATA G R O U P S Y N E R G Y
P R O G R A M M E S
A D R I A N M A R D E L LC H I E F F I N A N C I A L
O F F I C E R
Q I N G PA NP R E S I D E N T,
J A G U A R L A N D R O V E R C H I N A
F R A N Ç O I S D O S S AE X E C U T I V E D I R E C T O R ,
S T R AT E G Y & S U S TA I N A B I L I T Y
N I C K C O L L I N SE X E C U T I V E D I R E C T O R ,
V E H I C L E P R O G R A M M E S
P R O F E S S O RG E R R Y M c G O V E R N O B E
C H I E F C R E AT I V E O F F I C E R
T H O M A S M Ü L L E RE X E C U T I V E D I R E C T O R
O F P R O D U C T E N G I N E E R I N G 1
L E N N A R D H O O R N I KC H I E F C O M M E R C I A L
O F F I C E R
D AV E W I L L I A M SE X E C U T I V E D I R E C T O R ,
H U M A N R E S O U R C E S
JAGUAR LAND ROVER AUTOMOTIVE PLC BOARD
T H I E R R Y B O L L O R É
C H I E F E X E C U T I V E O F F I C E R
Appointed September 2020
N ATA R A J A NC H A N D R A S E K A R A N
N O N - E X E C U T I V E D I R E C T O R A N D C H A I R M A N
Appointed February 2017
A N D R E W M . R O B BN O N - E X E C U T I V E I N D E P E N D E N T
D I R E C T O R
Appointed April 2009
H A N N E S O R E N S E NN O N - E X E C U T I V E
D I R E C T O R
Appointed August 2018
PAT H A M A D A I B A L A C H A N D R A N B A L A J I
N O N - E X E C U T I V E D I R E C T O R
Appointed December 2017
N A S S E RM U K H TA R M U N J E E
N O N - E X E C U T I V E I N D E P E N D E N TD I R E C T O R
Appointed February 2012
P R O F S I R R A L F D S P E T H K B E F R E n g F R S
N O N - E X E C U T I V E V I C E C H A I R M A N
Appointed September 2020
LEADERSHIP
H A N N E S O R E N S E NN O N - E X E C U T I V E
D I R E C T O R
S t a r t i n g J u l y 2 0 2 2E X E C U T I V E D I R E C T O R ,
I N D U S T R I A L O P E R AT I O N S
C H A R L E S N I C H O L SN O N - E X E C U T I V E
D I R E C T O R
Appointed January 2022
A L- N O O R R A M J IN O N - E X E C U T I V E
D I R E C T O R
Appointed January 2022
1 Appointed April 2022
A biography for each Executive Director can be found by clicking the pictures below, or by visiting our Group’s website.

Annual Report 2021/22 J A G U A R L A N D R O V E R A U T O M O T I V E P L C 47
WATES PRINCIPLE 3 – DIRECTOR RESPONSIBILITIES
Effective risk management is central to achieving the Group’s strategic objectives and is a core responsibility of the JLR plc Board and its committees. In this section, you will find information about the responsibilities and focus of the JLR plc Board and the Audit, Remuneration and Disclosure Committees. Good governance is achieved through effective committees tackling
core areas of focus on a regular basis. See page 48 for further information.
In this section, you will find information about the induction and development of directors across the Group, as well as the key considerations when measuring the effectiveness of the JLR plc Board and its committees.
AUDIT COMMITTEE
Reviews the integrity of the financial statements, relationship
with the external auditors and effectiveness of internal
financial controls.
For more information see page 48
JLR PLC BOARD
The JLR plc Board provides supervision and guidance to the Group’s management, particularly with respect to corporate
governance, business strategies and growth plans. It also considers the identification of risks and their mitigation
strategies, entry into new businesses, product launches, demand fulfilment and capital expenditure requirements, as
well as the review of business plans and targets.
For more information see page 48
NOMINATIONS & REMUNERATION COMMITTEE
Determines the overall remuneration policy and strategy
to ensure transparency and alignment with the Group’s short
and long-term strategic goals.
For more information see page 50
JAGUAR LAND ROVER LIMITED BOARD OF DIRECTORS
The work of the Board of Directors complements, enhances and supports the work of the JLR plc Board, with the Board of Directors operating under the direction and authority of the Chief Executive Officer to support in the execution of the Group’s strategy, including
evaluating the Group’s performance against budget and forecast.
The Board of Directors is also responsible for overseeing the implementation of appropriate risk assessment processes and controls to identify, manage and mitigate the principal risks to the Group, and in doing so, provide support to the boards of directors of other Group companies.
TOPIC / ACTIVITY ACTIONS PROGRESS
STRATEGY
Review of the business and operating model
Analysed the automotive industry trends and retail outlook and assessed the potential impact on the Group
Reviewed the Group’s performance against its competitors
There has been a focus by the Board to transition through Reimagine to focus on critical areas of the Group’s operational strategy and wider environmental impact.
Decarbonising the supply chain function to ensure a new working approach has led to greater focus on digitisation as well as building resilience and sustainability within the Group’s operations. This work has included our response to the semiconductor crisis.
We continue to launch new and refreshed products, including the launch of the long wheel-base Range Rover Evoque and refreshed long-wheel base Jaguar XFL from the China joint venture, Chery Jaguar Land Rover. The company continues to increase the electrification of its models with 12 of 13 nameplates having an electrified option.
Economic and geopolitical factors have been assessed in detail including the impact of the Ukraine conflict. Inflationary pressures have increased during the financial year through increasing prices of commodities and high volatility in gas prices. The Board recognises the complex inter-relationship of these factors and continues to review and assess them closely.
THE KEY MATTERS CONSIDERED BY THE JLR PLC BOARD DURING FY2021/22 INCLUDED:
TOPIC / ACTIVITY ACTIONS PROGRESS
STRATEGY
Monitoring opportunities for acquisitions and new revenue streams
Supported continued investment to promote sustainable business growth over the long term
Used cash to implement ongoing programmes to support business growth
Reviewed and approved, where appropriate, the business cases for internally developed future business
Reimagine strategy which was introduced during FY2021/22 to achieve net zero carbon emissions by 2039 through electrification of both the Land Rover and Jaguar brands, continues to make progress and has strengthened its structure and capability with a number of new executive appointments on the Board as well as new partnerships such as with NVIDIA to jointly develop and deliver next-generation automated driving systems.
This has further been bolstered by Refocus which further drives quality, financial growth, sustainability and digitalisation.
Discussion of the Group’s capital structure and financial strategy
Considered and approved the Group’s debt funding arrangements
Reviewed a number of opportunities in the fiscal year
The Refocus transformation programme aimed to achieve £1 billion of value in FY2021/22. YTD the Group has achieved £1.5 billion.
Issuance of $500m Senior Notes due July 2029 at a coupon of 5.5 per cent per annum
Issuance of €500m Senior Notes due July 2028 at a coupon of 4.5 per cent per annum
Addition of £80m to existing RCF facility increasing to £2.015bn
Addition of £190m to RCF extension (now £1.5bn)
Addition of new £625m amortising 5-year loan 80 per cent guaranteed by UK Export Finance and syndicated to 12 banks.
RISK MANAGEMENT AND INTERNAL CONTROL
Review the Group’s principal risks and the effectiveness of internal control systems and risk management
Clearly articulated the Group’s approach to risk
Reviewed and updated approach to identify and manage principal risks
Continuing assessment of significant and emerging risks, including geopolitical uncertainty and the impact of Brexit
Agreed Group-level risks and a robust set of mitigating activities, which are regularly monitored
Further developed the Group’s approach to risk
Considered movements in key risks resulting from changes to likelihood or business impact
LEADERSHIP AND PEOPLE
Review composition of the JLR plc Board and its committees
Discussed the composition of the JLR plc Board and its committees, including succession planning
The Board of Management and Senior Director’s Forum is in place and continually monitored
Review the development of people and talent in the Group, including succession planning for senior roles
Ongoing commitment to maintaining a balance of appropriate skills and experi-ence among the Board of Management and associated committees
Due to the strength of succession planning built into the business, recent changes surrounding Board positions has been appropriately addressed
Discuss the results of the employee engagement survey and devise strategic actions arising from it
Conducted a thorough review of Pulse surveys to identify areas for improvement
Encouraged interaction between employees across the Group
Continued focus on engagement and development of employees through offering a wide range of training courses
The Group has recently introduced gender targets to focus attention on increasing representation of females in the business. By 2026, the aim is globally to achieve at least 30 per cent of all senior leadership positions held by females.
GOVERNANCE, STAKEHOLDERS AND SHAREHOLDERS
Review the Group’s purpose, goal, vision and values
Considered sustainability, including the Group’s impact on the community and the environment
Monitored and addressed regular Health and Safety updates
Reviewed developments in corporate governance and considered key legal and regulatory updates
Encourage strong engagement with investors and stakeholders
Actively supported engagement opportunities
Regularly reviewed and acted upon feedback from key stakeholders
Ongoing discussions at all levels of the business with shareholders
Engagement with other stakeholders based on feedback
FINANCIAL PERFORMANCE
Assessment of the Group’s financial performance
Evaluated the Group’s performance against budget and forecast
Reviewed the quarterly and annual results and associated presentations to investors
Reviewed and approved the latest five-year business plan for the Group
Approved the Annual Report
COMPLIANCE COMMITTEE
Provides oversight of Jaguar Land Rover’s management to review and assess its various compliance risks.
Oversees and assesses appropriate-ness of the adequacy, effectiveness and maturity of the many compli-
ance programmes.
OTHER EXAMPLES OF MANAGEMENT COMMITTEES:
• Risk Management Committee• Product Committee• Health and Safety Committee• Security Committee• Unusual Events Committee• Financial Risk and Assurance Committee• Financial Risk Committee
DISCLOSURE COMMITTEE
Supports the Jaguar Land Rover plc Board and Audit Committee in review-
ing and approving the final form of quarterly and annual statements relat-
ing to the performance of the Group.
For more information see page 49

Annual Report 2021/22 J A G U A R L A N D R O V E R A U T O M O T I V E P L C 49
EFFECTIVENESSTHE JAGUAR LAND ROVER AUTOMOTIVE PLC BOARD
The Jaguar Land Rover Automotive PLC Board will continue to consider the core areas described previously, but in particular will focus on:
• Continued development of the Group’s product pipeline through Reimagine and Refocus to provide all nameplates in electric form by end of the decade, thereby seeking to capitalise on segment growth;
•Shortage of semiconductor chips which have during the year constrained sales though strong demand remains for vehicles;
• Ongoing aim to achieve zero carbon emissions across supply chains, products and operations;
- Closer collaboration with the Tata Group to share best practice in next-generation technology, data and software development; and
- To become a more agile business with a simplified manufacturing operation
• Consideration of the evolving economic, political and market conditions;
• Developing people and the workforce of tomorrow; and
• Ongoing review and monitoring of external risk factors, considering their impact on the future of the Group in light of upcoming changes in both the political and economic environment.
HOW WE DIVIDE UP OUR RESPONSBIILITIES
Chairman of the JLR plc Board
Responsible for leading the JLR plc Board, its effectiveness and governance. Also sets the agenda to take full account of the issues and concerns of the directors and ensures effective links between external stakeholders, the JLR plc Board and management.
Non-executive directors
Constructively challenge the Chief Executive Officer and monitor the delivery of the Group’s strategy within the risk and controls environment set by the JLR plc Board.
Chief Executive Officer
Responsible for the day-to-day leadership, management and control of the Group, recommending the Group strategy to the JLR plc Board, and implementing the Group’s strategy and decisions of the JLR plc Board.
INDUCTION, DEVELOPMENT AND SUPPORT
All new directors receive a full, formal and tailored induction upon joining the JLR plc Board. The JLR plc Board calendar is also planned to enable directors to visit the increasing number of Jaguar Land Rover geographic locations. Directors are briefed on a wide range of topics throughout the year.
These topics range from those with particular relevance to the business of the Group, such as global automotive demand, to more general matters such as developments in corporate governance. We recognise that our directors have a range of experience, and so we encourage them to attend external seminars and briefings that will assist them individually.
EVALUATION
The JLR plc Board continuously assesses its effectiveness in the following areas:
• The flow and quality of information to and from the JLR plc Board to ensure effective communication;
• Decision-making process and culture; and
• The outcome and impact of decisions made by the JLR plc Board.
The JLR plc Board and Audit Committee also provide direct feedback to management committees during the year.
COMMITTEES SUPPORTING ACCOUNTABILITY
AUDIT COMMITTEEComposition of the Audit Committee
Andrew Robb, Chairman Nasser Munjee P. B. Balaji Hanne SorensenCharles Nichols (from 18 March 2022)
Role of the Audit Committee
• Monitors the integrity of the financial statements, including the review of significant financial reporting issues and judgements alongside the findings of the external auditor.
• Oversees the relationship with the external auditor, external audit process, nature and scope of the external audit and the appointment, effectiveness, independence and fees of the external auditor.
• Monitors and reviews the effectiveness of Corporate Audit, ensuring coordination with the activities of the external auditor.
• Reviews the effectiveness of the Group’s systems for internal financial control, financial reporting and risk management.
MAIN ACTIVITIES OF THE AUDIT COMMITTEE DURING THE YEAR
Financial reporting
During the year, the Audit Committee met with the external auditor and management as part of the FY2021/22 annual and quarterly reporting approval process a total of five times. The Audit Committee reviewed the draft financial statements and considered a number of supporting papers. This included reviewing information presented by management on significant accounting judgements to ensure all issues raised were properly dealt with; reviewing presentation and disclosure of material to ensure adequacy, clarity and completeness; reviewing the documentation prepared to support the going concern statement given on page 54; and reviewing external audit reports. The key matters considered in the year were: going concern, impairment of long life assets, capitalisation of product development assets, valuation of defined benefit plan obligations, cut off of new vehicle revenue recognition for UK and US components and management override of controls.
Internal controls
The Audit Committee reviewed the effectiveness of financial reporting, internal control over financial reporting and risk management procedures within the Group, with particular regard given to compliance with the provisions of section 404 of the Sarbanes-Oxley Act and other relevant regulations. The reviews also considered any potential material weaknesses or significant deficiencies in the design or operation of the Group’s internal control over financial reporting, which are reasonably likely to adversely affect the Group’s ability to record, process and report financial data, including that of systems controls. The Audit Committee received reports from the external auditor, Business Assurance and Corporate Audit with respect to these matters.
External Audit
The Audit Committee reviewed the significant audit issues affecting the Group with the external auditor and how they have been addressed in the financial statements. The Audit Committee also evaluated the external auditor by reviewing the firm’s independence, its internal quality control procedures and any material issues raised by the most recent quality control or peer review of audit firms. This included the findings of any enquiry or investigation carried out by government or professional bodies with respect to one or more independent audits performed by the external auditor within the last five years.
KPMG, the external auditors, have completed their fifth year in post. Section 139(2) of the Indian Companies Act, 2013, mandates that all listed companies rotate their auditors once the auditor has served as an auditor for a period of 10 or more consecutive years. Under these regulations, the Group will be required to retender the audit by no later than 2027 and the Committee will keep the external auditor tender under review
and act in accordance with any changes in regulations and best practice relating to the tenure of the external auditor.
To help safeguard KPMG’s objectivity, independence and effectiveness, the Group has a non-audit services policy which sets out the circumstances and financial limits within which the external auditor may be permitted to provide certain non-audit services. This policy sets a presumption that KPMG should only be engaged for non-audit services where there is an obvious and compelling reason to do so (for example, their skills and experience or ability to provide the services) and provided such work does not impair their independence or objectivity and has no impact on the audited financial statements. It prohibits KPMG from providing certain services, including legal, valuation, actuarial and internal audit. The Audit Committee approves all non-audit services before they are performed.
Non-audit fees paid to KPMG in the year totalled £1.1 million (2021: £1.2 million), representing 20 per cent of the fees paid for audit and audit-related assurance services.
Corporate Audit
During the year, the Audit Committee reviewed the adequacy of the Corporate Audit function, the Corporate Audit charter, staffing and seniority of the official heading the function, reporting structure, budget, coverage and the frequency of corporate audits, the structure of Corporate Audit and approval of the audit plan.
DISCLOSURE COMMITTEEComposition of the Disclosure Committee:
Chief Financial Officer and his direct reports
Matters considered during the year
• Reviewed and updated the terms of reference of the Disclosure Committee
• Reviewed the audit and control findings from the external auditor
• Reviewed areas of key management judgement and significant transactions, including their presentation and disclosure in both the quarterly and annual financial statements
• Reviewed new disclosures in both the quarterly and annual financial statements for appropriateness
• Considered the impact of new accounting standards on the Group

Annual Report 2021/22 J A G U A R L A N D R O V E R A U T O M O T I V E P L C 51
ACCOUNTABILITYWATES PRINCIPLE 4 - OPPORTUNITY AND RISK
In addition to the matters referred to throughout this report on risk management, please also refer to page 36 which includes a list of all emerging and principal risks including mitigations relevant to the Group.
See pages 37 for assessment and categorisation of principal risks and actions to mitigate.
WATES PRINCIPLE 5 - REMUNERATION
In accordance with Wates Principle 5, the Nominations and Remuneration Committee of Jaguar Land Rover Automotive plc Board ensures that appropriate senior management is recruited to deliver on the Group’s objectives. The Nominations and Remuneration Committee has clearly defined Terms of Reference and is responsible for remuneration strategy, recruitment and long term incentive plans for senior executives.
NOMINATIONS AND REMUNERATION COMMITTEE
Composition of the Nominations and Remuneration Committee:
Andrew Robb, Chairman
Natarajan Chandrasekaran
Hanne Sorensen
In addition to the Committee members, the Chief Executive Officer is invited to attend meetings, except where there is a conflict of interest. The Nominations and Remuneration Committee is supported by the Executive Director, Human Resources and the HR Director, Global Reward & Mobility.
Role of the Nominations and Remuneration Committee
The Nominations and Remuneration Committee (NRC) is responsible for the structure, appointments, removals, succession, performance and compensation of the Jaguar Land Rover Automotive plc Board and the Jaguar Land Rover Management Board.
The Committee’s involvement in all aspects of nominations and remuneration ensures that all decisions in terms of Board appointments are made in a fair, equal and balanced way.
During FY2021/22 the Committee has continued to support the reconfiguration of Jaguar Land Rover Limited’s Executive Board. This saw Jaguar Land Rover announce four departures of previous Board members and make two new appointments during the course of the financial year with further new Board Members to join during 2022.
Remuneration policy
The remuneration policy is designed to attract, retain and motivate executives of the highest quality, encouraging them to deliver exceptional business performance aligned to Jaguar Land Rover’s strategy and the objective of delivering long-term sustainable growth. Its structure and individual remuneration
elements align with the design of the Company’s remuneration policy for the wider organisation. Any decisions the Nominations and Remuneration Committee makes in relation to executive remuneration will be made with clear understanding of the developments to pay and conditions for the wider workforce.
Executive remuneration consists of:
Fixed elements:
• Salary. Designed to recruit and retain individuals with the necessary knowledge, skills and experience to deliver the Group’s strategic objectives. Salary is reviewed annually and benchmarked against comparable roles in appropriate comparator groups.
• Retirement benefits. The Group has a number of defined benefit pension schemes that are closed to new employees. Executives who are members of these schemes will continue to accrue benefits, but most executives now elect to receive a cash allowance in lieu of retirement benefits.
• Other benefits. Executives are eligible to participate in the Group’s management car programme, medical arrangements, and life insurance and disability plans.
Performance-related elements:
• The Global Bonus Plan is an annual bonus plan which focusses on the Company’s key operational priorities. It rewards achievement of short-term financial and operational objectives.
The challenging business environment and semiconductor shortages experienced during the year meant that previously agreed metrics had become irrelevant. In recognition of the shift in the operational context and consequent business priorities for the second half of the financial year, the NRC took the unusual decision to amend some of the bonus metrics for the second half of the year. The financial and retail metrics were replaced by metrics aligned to the key priorities supporting JLR in stabilising the business, setting the Company up for a fast recovery and securing future profits. The customer satisfaction metric remained a bonus scheme metric for the entire financial year. This change in metrics has allowed JLR to keep employees motivated during the challenging year, encouraging employee retention and rewarding employees for the actions delivered to strengthen the Company’s future. • The Strategic Bonus Plan replaced the Company’s previous long-term incentive scheme in the FY2021/22. The previous plan design of setting metrics three years in advance of vesting proved unrealistic and inflexible in the changing market conditions and was not effective in focusing senior leaders on the strategic drivers for long term sustainability and success. The NRC approved the introduction of this new bonus scheme last year, which rewards the progress and transformation necessary to achieve the Company’s strategic targets. The metrics are set annually against a longer-term glidepath which ensures that they can be adjusted to evolving priorities and external conditions whilst also ensuring good governance and accountability for long-term improvements. The plan metrics focus on Financial Health, Brand Health, Digitalisation and Sustainability and reward the collaborative effort and steps senior leadership make towards implementing the Reimagine strategy and delivering results.
EXECUTIVE REMUNERATION 2021/22
There is linkage between Jaguar Land Rover business strategy and the performance related elements of remuneration. The graphics show the change in the Global Bonus metrics for the second half of the financial year.
WATES PRINCIPLE 6 – STAKEHOLDER RELATIONSHIPS AND ENGAGEMENT
The Jaguar Land Rover Automotive plc Board continues to promote accountability and transparency with all stakeholders and shareholders and effectively communicates the Group’s
strategic direction. Brand and reputation including existing and future relationships with shareholders, customers, suppliers, employment interaction and communication with customers and suppliers are set out on page 41. Maintaining strong relationships with shareholder and bond investors is crucial to achieving the Group’s aims.
The overall objective is to deliver executive pay in line with a market median range for target performance, with enhanced reward opportunity to reflect exceptional business performance. Overall remuneration is balanced, with the majority linked to business performance.
BONUS PERFORMANCE
MEASURESSecond Half of
the Year
BONUS PERFORMANCE
MEASURESFirst Half of
the Year
STRATEGIC BONUS PERFORMANCE
MEASURES
Target Executive Remuneration
Maximum Executive
Remuneration
30%
25%
25%
10%
10%
30%
25%
25 %
20 %
Strategic BonusBenefits
Base salary Annual Bonus
Strategic BonusBenefits
Base salary Annual Bonus
5%
18%
35%
42%9%26%
32%
33%
30%
25%
25 %
20 %
Retail Volume
EBIT Margin
Customer Satisfaction
Cash Flow
Sustainability (Tailpipe Emissions)
Brand Health (First Preference)
Financial Health (Net Debt)
Digitalisation (Financial Contribution of Digital Initiatives)
Quality New Range Rover (Future Profit)
Production Volume (Stabilise)
Customer Satisfaction
Variable Profit per Unit (Faster Recovery)
Wholesale Volume New Range Rover(Future Profit)

Annual Report 2021/22 J A G U A R L A N D R O V E R A U T O M O T I V E P L C 53
INVESTOR RELATIONS ENGAGEMENTSOLE SHAREHOLDER
Jaguar Land Rover Automotive plc (and its subsidiaries) is a wholly owned subsidiary of Tata Motors Limited (held through TML Holdings Pte. Ltd. (Singapore)) and a significant majority of the Jaguar Land Rover Automotive plc Board also reside as directors on the board of Tata Motors Limited. Although we operate on a stand-alone, arm’s length basis, we maintain an open and collaborative strategic relationship with Tata Motors Limited and plan to increase our collaboration in numerous areas going forward.
BOND INVESTORS, LOAN AND OTHER CREDIT PROVIDERS
As at 31 March 2022, we had approximately £4.7 billion of listed unsecured bonds outstanding (31 March 2021: £4.3 billion) and £2.3 billion of loans (31 March 2021: £1.8 billion). We maintain regular dialogue with our bond investors and relationship banks (some of whom provide support for loans and other credit facilities) through the quarterly publication of operational and financial results on the Group’s website (www.jaguarlandrover.com) supported by live broadcasts. The investor relations team also attends various credit conferences held throughout the year and our annual capital markets day where investors, banks and other credit providers have the opportunity to meet with Jaguar Land Rover senior management in person to discuss the Company’s strategy and aspirations.
CREDIT RATING AGENCIES
As at 31 March 2022, Jaguar Land Rover Automotive plc had a credit rating of B+ (stable outlook) from S&P and B1 (stable outlook) from Moody’s.
JAGUAR LAND ROVER’S APPROACH TO TAXINTRODUCTION
Jaguar Land Rover’s business is significant and our operations are large and complex. As a result, we operate through multiple companies, with activities, employees and assets located in numerous countries around the world. This, in turn, naturally drives an inherent level of complexity in our tax affairs.
In relation to tax matters, just as for any other area of our business, Jaguar Land Rover always strives to be a good, responsible corporate citizen and we are committed to complying with all applicable tax laws, both in letter and in spirit. We aim to be fair, honest, transparent and ethical in our conduct and for everything we do to stand the test of public scrutiny.
JAGUAR LAND ROVER’S KEY TAX PRINCIPLES
The Jaguar Land Rover Automotive plc Board has formally adopted six key principles in relation to Jaguar Land Rover’s
approach to taxation matters and the conduct of our tax affairs. These principles apply equally to all companies within the Jaguar Land Rover Group, across all areas of our business activity and in all our territories of operation.
JAGUAR LAND ROVER WILL CONDUCT ITS TAX AFFAIRS IN A WAY THAT:
1. Is compliant with all legal and regulatory obligations and which adheres to the principles set out in the Jaguar Land Rover Code of Conduct and Tata Code of Conduct;
2. Is aligned with the Group’s overall business strategy and growth objectives;
3. Proactively seeks to enhance shareholder value and optimise tax cost on a sustainable basis;
4. Is governed, managed and controlled within an appropriate risk management framework;
5. Is appropriately resourced and seeks to maximise operating efficiencies through the suitable use of automation and technology-based solutions; and
6. Maintains good, open, honest and professional working relationships with tax authorities globally and seeks to take a leading role in relation to matters of governmental tax policy relevant to Jaguar Land Rover.
Each principle is commented on further below:
1. Tax compliance
This is considered the most fundamental and important of our six principles. Jaguar Land Rover will always seek to comply with all applicable tax laws, both in terms of the letter and the spirit of the law, and to satisfy its global tax compliance obligations in a timely and accurate manner.
In addition, we adhere to the Jaguar Land Rover Code of Conduct and the Tata Code of Conduct, which set out the high, ethical standards of business behaviour expected from all companies and employees within our Group.
Jaguar Land Rover has zero tolerance to the evasion of tax, including the evasion of tax by third parties associated with our business.
2. Business alignment
Jaguar Land Rover always aligns its tax affairs with the genuine business activities being undertaken by the organisation. We do not engage in any form of tax avoidance or artificial tax structuring and we do not operate or use any offshore tax havens. All Jaguar Land Rover Group subsidiaries are located in countries where the business has significant physical and economic operations (i.e. employees, offices and revenue generating activity).
3. Enhancing shareholder value
As a commercial organisation, Jaguar Land Rover will always seek to effectively manage its tax liabilities, just as for any other business cost. In so doing, we always adhere to relevant tax laws and, in relation to transactions within the Group, we always seek to ensure that these are conducted on an arm’s length basis in accordance with Organisation for Economic Co-operation and Development (OECD) principles.
Where governments or fiscal authorities have introduced particular tax reliefs, credits, incentives or exemptions to encourage specific types of economic activity (for example, investment in research and development), we will always seek to ensure that Jaguar Land Rover claims the appropriate level of benefit for which it qualifies.
4. Governance and risk management
Tax risks arising within the Group are identified, assessed and managed by the central Tax function on an ongoing basis. A detailed tax update is taken to the Jaguar Land Rover Automotive plc Board on an annual basis and tax risks are reported quarterly to the Financial Risk and Assurance Committee. The Jaguar Land Rover Tax Director also meets with the Chief Financial Officer on a biweekly basis to provide updates on all tax matters affecting the Group.
Jaguar Land Rover actively seeks to minimise risk in relation to tax matters. We do this through a variety of processes and controls including, for example, tax risk assessments and health-check exercises for subsidiaries, online monitoring of compliance processes and an active Advance Pricing Agreement programme. 5. Tax resource
Responsibility for the day-to-day management of Jaguar Land Rover’s tax affairs rests with our central Tax function, led by the Jaguar Land Rover Tax Director. The function comprises an appropriate blend of tax professionals with the necessary qualifications, training, skills and experience required to effectively undertake their roles. The Tax function also advises the Jaguar Land Rover Automotive plc Board in relation to setting Group tax strategy and policy.
In addition to the central Tax function, the business also has dedicated tax professionals embedded within the finance teams of key non-UK subsidiaries.
Where appropriate, we look to implement technology-based solutions to streamline processes, drive efficiency and manage risk.
6. Relationships with governments and authorities
In our dealings with tax authorities globally, including HMRC in the UK, we always look to maintain good, open, honest and professional working relationships, to engage proactively in relation to tax matters and to resolve any areas of dispute or differences of opinion as quickly as possible in order to reduce uncertainty and manage risk.
We also actively engage in dialogue with governments, either directly or through appropriate representative bodies, in relation to matters of tax policy which affect our business.
Jaguar Land Rover Automotive plc regards this document and its publication as complying with its duty under Para 19(2), Sch 19, FA16.
APPROVAL OF STRATEGIC REPORTThe Strategic Report on pages 4 to 36 was approved by the Jaguar Land Rover Automotive plc Board and authorised for issue on 13 June 2022 and signed on its behalf by:
THIERRY BOLLORÉCHIEF EXECUTIVE OFFICERJaguar Land Rover Automotive plc13 June 2022

Annual Report 2021/22 J A G U A R L A N D R O V E R A U T O M O T I V E P L C 55
DIRECTOR’S REPORTThe directors present their report and the audited consolidated financial statements of the Group for the year ended 31 March 2022. Jaguar Land Rover Automotive plc is a public limited company incorporated under the laws of England and Wales. The business address of the directors and senior management of the Group is Abbey Road, Whitley, Coventry, CV3 4LF, England, United Kingdom.
Future developments
Future developments impacting the Group are disclosed in the Strategic report from page 10.
Dividends
The Directors proposed no dividend for the year ended 31 March 2022. (For the year ended 31 March 2021 and 2020: £Nil).
Directors
Biographies of the directors currently serving on the JLR plc Board are set out on page 44.
Directors’ indemnities
The Group has made qualifying third-party indemnity provisions for the benefit of its directors during the year; these remain in force at the date of this report.
Material interests in shares
Jaguar Land Rover Automotive plc is a wholly owned subsidiary of Tata Motors Limited, held through TML Holdings Pte. Ltd. (Singapore).
Share capital
Share capital remains unchanged. See note 29 to the consolidated financial statements on page 108 for further details.
Corporate Governance Statement
The Corporate Governance Statement is set out from page 40 and is incorporated by reference into this report.
Branches
The Group has 10 branches that exist and operate outside of the UK, based in China and the United Arab Emirates.
Research and development
The Group is committed to an ongoing programme of expenditure
on research and development activities as disclosed in note 11 to the consolidated financial statements on page 85.
Financial instruments
The disclosures required in relation to the use of financial instruments by the Group and Company, together with details of the Group’s and Company’s treasury policy and management, are set out in note 35 to the consolidated financial statements on pages 119 to 133 and in note 52 on pages 147 to 151 of the parent company financial statements.
Employee information
The average number of employees within the Group is disclosed in note 7 to the consolidated financial statements on page 83. Apart from determining that an individual has the ability to carry out a particular role, the Group does not discriminate in any way. It endeavours to retain employees if they become disabled, making reasonable adjustments to their role and, if necessary, looking for redeployment opportunities within the Group. The Group also ensures that training, career development and promotion opportunities are available to all employees irrespective of gender, race, age or disability.
Employee involvement
Details of how the Group involves its employees are contained in the Strategic report on pages 24 to 25, which are incorporated by reference into this report.
Political involvement and contributions
The Group respects an employee’s right to use their own time and resources to participate as individual citizens in political and governmental activities of their choice. The Group itself operates under legal limitations on its ability to engage in political activities and, even where there are no legal restrictions, the Group does not typically make contributions to political candidates or political parties, or permit campaigning on its property by political candidates (including those who work for the Group) or persons working on their behalf. There have not been any political donations in any of the periods covered by these financial statements.
Going concern
The Group’s business activities, together with the factors likely to affect its future development, performance and position, are set out in the Strategic report. The financial position of the Group, including details of the Group’s liquidity, available financing facilities and the maturity of facilities is described on page 34.
In addition, note 35 to the consolidated financial statements includes the Group’s objectives, policies and processes for managing its exposures to interest rate risk, foreign currency risk, credit risk and liquidity risk; and gives details of the Group’s financial instruments and hedging activities.
The Group has assessed the projected cash flows of the Group for the twelve-month period from the date of authorisation of the financial statements (the ‘going concern assessment period’) and has carried out a reverse stress test against this base case to determine the performance level that would result in a breach of covenants.
The base case takes into account the Group’s expectations of the continued supply chain challenges related to semiconductor shortages, the diminishing impacts of the COVID-19 pandemic and prevailing financial conditions including inflationary pressures. The reverse stress test scenario models the impact of a sustained reduction of wholesale volumes over a twelve-month period.
Within the going concern assessment period there is a £1 billion minimum quarter-end liquidity covenant attached to the Group’s UKEF loans for the entire period and to the RCF facility from July 2022.
Details of the scenarios and assumptions used in the assessment as at 31 March 2022 are set out in note 1 to the consolidated financial statements on page 72.
The Group forecasts sufficient funds to meet its liabilities as they fall due throughout the going concern assessment period, without breaching any relevant covenants nor the need for any mitigating actions, new funding, or drawing on its RCF facility and considers the stress test scenario so remote as to not be plausible. Consequently, the directors consider that adequate resources exist for the Group and parent company to continue operating for the going concern assessment period. Accordingly, the directors continue to adopt the going concern basis in preparing these consolidated and parent company financial statements.
Events after the balance sheet date
Full details of significant events since the balance sheet date are disclosed in note 41 on page 139 to the consolidated financial statements.
Code of Conduct
Directors and employees are required to comply with the Jaguar Land Rover Code of Conduct, which is intended to help them put the Group’s ethical principles into practice. The Code of Conduct clarifies the basic principles and standards they are required to follow and the behaviour expected of them. The Code of Conduct can be found at www.jaguarlandrover.com.
Employees, contract staff, third parties with whom the Group has a business relationship (such as retailers, suppliers and agents), and any member of the public may raise ethical and compliance concerns to the Group’s global helpline or via group.compliance@ jaguarlandrover.com.
Slavery and human trafficking statement
Pursuant to section 54 of the Modern Slavery Act 2015, the Group has published a slavery and human trafficking statement
for the year ended 31 March 2022. The statement sets out the steps that the Group has taken to address the risk of slavery and human trafficking occurring within its own operations and its supply chains. This statement can be found on the corporate website at www.jaguarlandrover.com.
Whistleblowing policy
The Group’s whistleblowing policy encourages employees to report, in confidence and anonymously if preferred, concerns about suspected impropriety or wrongdoing in any matters affecting the business. An independent hotline exists to facilitate this process. Any matters reported are thoroughly investigated and escalated to the Unusual Events Committee.
Diversity policy
Diversity management continues to form a core part of the Group’s business strategy. We rely on the diversity of our employees to form the foundation of a strong and dynamic company. See page 25 for further details.
Greenhouse gas emissions
The Group is committed to reducing greenhouse gas emissions and continues to invest heavily in this activity. See pages 20 to 21 for further details.
STATEMENT OF DIRECTORS’ RESPONSIBILITIES IN RESPECT OF THE ANNUAL REPORT AND THE FINANCIAL STATEMENTS
The directors are responsible for preparing the Annual Report and the Group and parent Company financial statements in accordance with applicable law and regulations.
Company law requires the directors to prepare Group and parent Company financial statements for each financial year. Under that law they are required to prepare the Group financial statements in accordance with UK-adopted international accounting standards and applicable law and they have elected to prepare the parent Company financial statements on the same basis.
Under company law the directors must not approve the financial statements unless they are satisfied that they give a true and fair view of the state of affairs of the Group and parent Company and of the Group’s profit or loss for that period. In preparing each of the Group and parent Company financial statements, the directors are required to:
• select suitable accounting policies and then apply them consistently;
• make judgements and estimates that are reasonable, relevant and reliable;
• state whether they have been prepared in accordance with UK-adopted international accounting standards;
• assess the Group and parent Company’s ability to continue as a going concern, disclosing, as applicable, matters related to going

Annual Report 2021/22 J A G U A R L A N D R O V E R A U T O M O T I V E P L C 57
concern; and
• use the going concern basis of accounting unless they either intend to liquidate the Group or the parent Company or to cease operations, or have no realistic alternative but to do so.
The directors are responsible for keeping adequate accounting records that are sufficient to show and explain the parent Company’s transactions and disclose with reasonable accuracy at any time the financial position of the parent Company and enable them to ensure that its financial statements comply with the Companies Act 2006. They are responsible for such internal control as they determine is necessary to enable the preparation of financial statements that are free from material misstatement, whether due to fraud or error, and have general responsibility for taking such steps as are reasonably open to them to safeguard the assets of the Group and to prevent and detect fraud and other irregularities.
Under applicable law and regulations, the directors are also responsible for preparing a Strategic Report and a Directors’ Report that complies with that law and those regulations.
The directors are responsible for the maintenance and integrity of the corporate and financial information included on the Company’s website. Legislation in the UK governing the preparation and dissemination of financial statements may differ from legislation in other jurisdictions.
Auditor
A resolution to reappoint KPMG LLP as auditor of the Group is to be proposed at the 2022 Tata Motors Limited Annual General Meeting.
Acknowledgement
The directors wish to convey their appreciation to all employees for their continued commitment, effort and contribution in supporting the delivery of the Group’s performance. The directors would also like to extend their thanks to all other key stakeholders for their continued support of the Group and their confidence in its management.
The Annual Report contains a number of links that signpost to complimentary information. This complimentary information does not form part of the Annual Report.
The Annual Report on pages 1 to 153, consisting of the Strategic Report, the Directors Report, and the Financial Statements, was approved by the JLR plc Board and authorised for issue on 13 June 2022 and signed on its behalf by:
THIERRY BOLLORÉCHIEF EXECUTIVE OFFICERJaguar Land Rover Automotive plc13 June 2022
Annual Report 2021/22 J A G U A R L A N D R O V E R A U T O M O T I V E P L C 57

59Annual Report 2021/22 J A G U A R L A N D R O V E R A U T O M O T I V E P L C
1. OUR OPINION IS UNMODIFIED
We have audited the financial statements of Jaguar Land Rover Automotive plc (“the Company”) for the year ended 31 March 2022 which comprise the Consolidated Income Statement, Consolidated Statement of Comprehensive Income and Expense, Consolidated Balance Sheet, Consolidated Statement of Changes in Equity, Consolidated Cash Flow Statement, the parent Company Balance Sheet, the parent Company Statement of Changes in Equity, the parent Company Cash Flow Statement, and the related notes, including the parent Company and Group accounting policies.
In our opinion:
• the financial statements give a true and fair view of the state of the Group’s and of the parent Company’s affairs as at 31 March 2022 and of the Group’s loss for the year then ended;
• the Group financial statements have been properly prepared in accordance with the requirements of UK-adopted international accounting standards;
• the parent Company financial statements have been properly prepared in accordance with UK-adopted international accounting standards and as applied in accordance with the provisions of the Companies Act 2006; and
• the financial statements have been prepared in accordance with the requirements of the Companies Act 2006.
Basis for opinion
We conducted our audit in accordance with International Standards on Auditing (UK) (“ISAs (UK)”) and applicable law. Our responsibilities are described below. We have fulfilled our ethical responsibilities under, and are independent of the Group in accordance with, UK ethical requirements including the FRC Ethical Standard as applied to listed entities. We believe that the audit evidence we have obtained is a sufficient and appropriate basis for our opinion.
2. KEY AUDIT MATTERS: INCLUDING OUR ASSESSMENT OF RISKS OF MATERIAL MISSTATEMENT
Key audit matters are those matters that, in our professional judgement, were of most significance in the audit of the financial statements and include the most significant assessed risks of material misstatement (whether or not due to fraud) identified by us, including those which had the greatest effect on: the overall audit strategy; the allocation of resources in the audit; and directing the efforts of the engagement team. These matters were addressed in the context of our audit of the financial statements as a whole, and in forming our opinion thereon, and we do not provide a separate opinion on these matters. In arriving at our audit opinion above, the key audit matters, in decreasing order of audit significance, were as follows:
INDEPENDENT AUDITOR’S REPORT TO THE MEMBERS OF JAGUAR LAND ROVER AUTOMOTIVE PLC
OVERVIEW
Materiality: Group financial statements as a whole
£80m (2021: £80m)
0.4% of Group Revenue (2021: 0.4% of Group Revenue)
Coverage 80% (2021:82%) of Group revenue
Key audit matters vs 2021
Recurring risks Impairment of property plant and equipment, intangible, and right-of use non-current assets
Going concern
Capitalisation of product engineering costs
Valuation of defined benefit plan obligations
Parent Company key audit matter
Recoverability of parent Company investment in subsidiaries and intra- group debtors
INDEPENDENT AUDITOR’S REPORT
The risk Our response
Impairment of property plant and equipment, intangible, and right-of-use non-current assets
Risk vs 2021
(Carrying value of property plant and equip-ment, intangible, and right-of-use non-current assets£11,687 million; 2021: £12,391 million)
Refer to note 19.
Forecast-based assessment
The Group holds a significant amount of property, plant and equipment, intangible assets and right-of-use assets on its balance sheet and the cash generating unit of which these assets form a part is at risk of being impaired.
In particular, there are execution risks associated with the Group’s transition to Battery Electric Vehicles (‘BEV’) resulting from its previously announced ‘Reimagine’ strategy. In addition, there are other headwinds facing the Group and the industry, including the continuation of semi-conductor and other supply constraints, production constraints, cost inflationary pressures, COVID-related lockdowns and the conflict in Ukraine.
The effect of these matters is that, as part of our risk assessment, we determined that the calculation of the value in use of property, plant and equipment, intangible assets, and right-of-use assets has a high degree of estimation uncertainty, with a potential range of reasonable outcomes greater than our materiality for the financial statements as a whole, and possibly many times that amount. The financial statements note 19 disclose the sensitivities estimated by the Group.
We performed the tests below rather than seeking to rely on any of the Group’s controls because the nature of the balance is such that we would expect to obtain audit evidence primarily through the detailed procedures described. Our procedures included:
• Historical accuracy: Evaluated historical forecasting accuracy of discounted cash flow forecasts, including key assumptions, by comparing them to the actual results.
• Historical comparison: Assessed the appropriateness of the Group’s key assumptions used in the discounted cash flow forecasts by comparing those, where appropriate, to historical trends in terminal value variable profit and terminal value capital expenditure.
• Our industry expertise: Assessed the appropriateness of the Group’s estimated value in use amount by comparing the implied trading multiples to market multiples of comparative companies with the assistance of our valuation specialists.
Assessed and critically challenged the appropriateness of the Group’s assumptions used in the cash flow projections by comparing a key assumption of sales volumes to externally derived data.
Compared the Group’s discount rate and long-
term growth rate to external benchmark data and comparative companies and re-performed the discount rate calculation using the capital asset pricing model with the assistance of our valuation specialists.
• Sensitivity analysis: Performed a sensitivity
analysis on key assumptions, to independently estimate a range for comparison, taking account of the Group’s Reimagine strategy and risks facing the industry.
• Comparing valuations: Assessed the Group’s reconciliation between the estimated market capitalisation of the Group, by reference to the overall market capitalisation of the Tata Motors Limited Group and compared to the estimated recoverable amount of the cash generating unit.
• Impairment reversal: Assessed whether the Group’s estimated value in use was indicative of an impairment reversal.
• Assessing transparency: Assessed the adequacy of the Group’s disclosures in the financial statements and ensured that the disclosure reflects the reasonably possible changes in key assumptions that erode the headroom in the recoverable amount compared to the cash generating unit carrying value to nil.

61Annual Report 2021/22 J A G U A R L A N D R O V E R A U T O M O T I V E P L C
The risk Our response
Capitalisation of product engineering costs
Risk vs 2021
(£457 million; 2021: £769 mi-llion)
Refer to note 19.
Accounting treatment
There is a key judgement in determining whether the nature of the product engineering costs satisfy the criteria for capitalisation to ‘Intangible Assets: Product development in progress’ and when this capitalisation should commence. Given the products with material capitalised project engineering costs during the current period, and the Group’s stage in development cycle more generally in the current period, the risk of satisfaction of IAS 38 capitalisation requirements is less associated with the future economic viability as in previous periods but primarily related to the allocation of directly attributable expenditure.
The financial statements (note 19) disclose that had the value of central overheads not been identified by the Directors as being eligible for capitalisation it would have reduced the amount capitalised by £52 million (2021: £80 million).
Our procedures included:
• Control operation: Tested controls including in relation to the Directors’ assessment as to whether product engineering costs are eligible for capitalisation.
• Personnel interviews: Corroborated judgements made by the Directors around the timing of commencement of capitalisation of product engineering costs through discussions with project level staff.
• Our sector experience: Critically assessed the Directors’ judgements regarding product engineering costs identified by the Directors as being eligible for capitalisation against both the accounting standards and our experience of practical application of these standards in other companies.
• Tests of details: For a sample of product
engineering costs identified by the Directors as being eligible for capitalisation, agreed that their nature was consistent with the description of the account to which those costs were recorded, and the timing of recognition was appropriate.
• Assessing transparency: Assessed the adequacy of the Group’s disclosures in respect of the key judgements made relating to the nature of the costs capitalised and the point at which capitalisation commences.
INDEPENDENT AUDITOR’S REPORT
The risk Our response
Going Concern Risk vs 2021
Refer to note 2
Disclosure quality:
Note 2 of the financial statements explains how the Directors have formed a judgement that it is appropriate to adopt the going concern basis of preparation for the Group and parent Company. That judgement is based on an evaluation of the inherent risks to the Group’s and the parent Company’s business model and how those risks might affect the Group and parent Company’s financial resources or ability to continue operations over the going concern period of assessment (a period of at least a year from the date of approval of the financial statements).
The risks most likely to adversely affect the Group and parent Company’s available financial resources and compliance with covenant thresholds over the going concern period were: the impact of semiconductor shortages on the Group’s supply chain and production capacity; the diminishing impacts of the COVID-19 pandemic and the impact of inflationary pressures on material costs.
Whilst these risks could have adversely affected available financial resources and compliance with covenant thresholds, as explained in note 2 the Directors carried out a reverse stress test which ultimately demonstrated that an implausible downside with sales volumes significantly lower than both the base case and actual experience through COVID-19 and semiconductor shortages was required in order to result in a liquidity level that would breach financing covenants.
The risk for our audit was whether or not those risks were such that they amount to a material uncertainty that may cast significant doubt about the ability to continue as a going concern. Had they been such, then that fact would have been required to be disclosed.
We considered whether these risks could plausibly affect the liquidity or covenant compliance in the going concern period by assessing the degree of downside assumption that, individually and collectively, could result in a liquidity or covenant issue, taking into account the Group’s current and projected cash and facilities (a reverse stress test). Our procedures also included:
• Assessment of management’s process: Evaluated management’s process to produce forecasts, including the assessment of internal and external factors used to determine the risks to the business, and the process management used to complete the reverse stress test.
• Funding assessment: Agreed current Group and parent Company financing facilities available by obtaining relevant facility agreements. Inspected existing and new loan agreements in order to determine covenants attached.
• Key dependency assessment: Evaluated and critically challenged management on whether the key assumptions underpinning the forecast cash flows, which the Directors have used to support the Directors’ going concern basis of preparation and to assess whether the Group can meet its financial commitments as they fall due, were realistic, achievable and consistent with the external environment and other matters identified in the audit. The key assumptions include sales volumes, including the variable profit optimisation strategy, together with material cost inflation in variable profit.
• Historical comparisons: Evaluated the historical cash flow forecasting accuracy of the Group by comparing historical cash flows to actual results reported, as well as assessing the accuracy of key assumptions previously applied.
• Benchmarking assumptions: Assessed the appropriateness of the Group’s key assumptions used in the cash flow forecasts by benchmarking them to externally derived data, with particular focus on forecast sales volumes.
• Sensitivity analysis: Considered sensitivities over the key assumptions underlying the Group’s cash flow forecasts and their impact on the covenant test and the level of available financial resources.
• Our sector experience: We used our industry specialists to critically challenge the key assumptions made by the Directors in their forecast cash flows.
• Assessing transparency: Considered whether the going concern disclosure in note 2 to the financial statements gives a full and accurate description of the Directors’ assessment of going concern, including the identified risks and related sensitivities.

63Annual Report 2021/22 J A G U A R L A N D R O V E R A U T O M O T I V E P L C
The risk Our response
Valuation of defined benefit plan obligations
Risk vs 2021
(£7,522 million; 2021: £8,432 million)
Refer to note 32.
Subjective valuation
Small changes in the key assumptions and estimates, being the discount rate, inflation rate and mortality/life expectancy, used to value the Group’s pension obligation (before deducting scheme assets) would have a significant effect on the amount of the Groups’ net defined benefit plan asset. The risk is that these assumptions are inappropriate resulting in an inappropriate valuation of plan obligations.
The effect of these matters is that, as part of our risk assessment, we determined that valuation of the pension obligation has a high degree of estimation uncertainty, with a potential range of reasonable outcomes greater than our materiality for the financial statements as a whole, and possibly many times that amount. The financial statements (note 32) disclose the sensitivity estimated by the Group.
Our procedures included:
• Control Operation: Tested controls over the assumptions applied in the valuation and inspected the Group’s annual validation of the assumptions used by its actuarial expert.
Tested the Group’s controls operating over
selection and monitoring of its actuarial expert for competence and objectivity.
• Benchmarking assumptions: Challenged, with the support of our own actuarial specialists, the key assumptions applied to the valuation of the liabilities, being the discount rate, inflation rate and mortality/ life expectancy against externally derived data.
• Assessing transparency: Considered the
adequacy of the Group’s disclosures in respect of the sensitivity of the Groups’ net defined benefit plan asset to these assumptions
The risk Our response
Recoverability of parent Company investment in subsidiaries and intra-group debtors
Risk vs 2021
Investment in sub-sidiaries (£1,655 million; 2021:£1,655 million)
Intra-group deb-tors (£7,015 mi-llion; 2021: £6,038 million
Low risk, high value
The carrying amount of the parent Company’s investment in its subsidiary, which acts as an intermediate holding company for the rest of the parent Company’s subsidiaries, represents 19% (2021: 21%) of the parent Company’s assets. The carrying amount of the intra-group debtors balance comprises the remaining 81% (2021: 79%).
Their recoverability is not at a high risk of significant misstatement or subject to significant judgement. However, due to their materiality and in the context of the parent Company financial statements this is considered to be one of the areas that had the greatest effect on our overall parent Company audit.
We performed the tests below rather than seeking to rely on any of the group’s controls because the nature of the balance is such that we would expect to obtain audit evidence primarily through the detailed procedures described. Our procedures included:
• Tests of detail: Compared the carrying amount of the parent Company’s only investment with the subsidiary’s draft balance sheet and assessed 100% of the intra-group debtor balance to identify whether its net assets, being an approximation of its minimum recoverable amount, was in excess of its carrying amount.
• Assessing subsidiary audits: Assessed the work performed as part of the group audit over the subsidiaries’ profits and net assets.
• Comparing valuations: Compared the carrying amount of the investment in the subsidiary to the Group’s estimated market capitalisation of its ultimate parent, adjusted to exclude the liabilities of the parent Company and net assets of companies outside the Group, being an approximation of the recoverable amount of the investment.
3. OUR APPLICATION OF MATERIALITY AND AN OVERVIEW OF THE SCOPE OF OUR AUDIT
Materiality for the Group financial statements as a whole was set at £80 million (2021: £80 million), determined with reference to a benchmark of Group revenue of £18,320 million (2021: £19,731 million) of which it represents 0.4% (2021: 0.4%).
We consider Group revenue to be the most appropriate benchmark, as it provides a more stable measure year on year than Group profit or loss before tax.
Materiality for the parent Company financial statements as a whole was set at £64 million (2021: £36 million), determined with reference to a benchmark of the parent Company total assets of £8,678 million (2021: £7,694 million), of which it represents 0.7% (2021: 0.5%).
In line with our audit methodology, our procedures on individual account balances and disclosures were performed to a lower threshold, performance materiality, so as to reduce to an acceptable level the risk that individually immaterial misstatements in individual account balances add up to a material amount across the financial statements as a whole.
Performance materiality was set at 65% (2021: 65%) of materiality for the financial statements as a whole, which equates to £52 million (2021: £52 million) for the group and £42 million (2021: £23 million) for the parent company. We applied this percentage in our determination of performance materiality based on the level of identified control deficiencies during the prior period.
We agreed to report to the Audit Committee any corrected or uncorrected identified misstatements exceeding £4 million (2021: £4 million) in addition to other identified misstatements that warranted reporting on qualitative grounds.
Of the Group’s 38 (2021: 37) reporting components, we subjected 4 (2021: 4) to full scope audits for group purposes and 4 (2021: 4) to specified risk-focused audit procedures. The latter were not individually financially significant enough to require a full scope audit for group purposes but did present specific individual risks that needed to be addressed. The 4 (2021: 4) components subjected to specified risk-focused audit procedures are as follows:• Revenue - 3 components (2021: 3)• Material & other cost of sales - 3 components (2021: 3)• Property, plant & equipment - 1 component (2021: 1)• Depreciation - 1 component (2021: 1)• Inventories - 3 components (2021: 3)• Cash & cash equivalents - 3 components (2021: 3)• Accounts receivable - 3 components (2021: 3)• Accounts payable - 1 component (2021: 2)
The components within the scope of our work accounted for the percentages illustrated on the following page. The remaining 20% (2021: 18%) of total Group revenue, 15% (2021: 10%) of the total profits and losses that made up Group loss before tax, 15% (2021: 11%) of the total profits and losses that made up Group loss before exceptional items and tax and 16% (2021: 11%) of total Group assets are represented by 30 (2021:29) reporting components, none of which individually represented more than 2% (2021: 4%) of any of total Group revenue, total profits and losses that made up Group loss before tax, total profits and losses that made up Group loss before exceptional items and tax or total Group assets.
For the residual components, we performed analysis at an aggregated Group level to re- examine our assessment that there were no significant risks of material misstatement within these. The Group team instructed component auditors as to the significant areas to be covered, including the relevant risks detailed above and the information to be reported back. The Group team approved the component materialities, which ranged from £6 million to £71 million (2021: £12 million to £65 million), having regard to the mix of size and risk profile of the Group across the components. The work on 5 of the 8 (2021: 5 of the 8) components was performed by component auditors and the rest, including the audit of the parent Company, was performed by the Group team.The Group team visited 1 (2021: 0) component location to assess the audit risk and strategy, as planned visits to the majority of component locations were prevented by movement restrictions relating to the coronavirus pandemic. Video and telephone conference meetings were also held with these component auditors and all others that were not physically visited. At these visits and meetings, the findings reported to the Group team were discussed in more detail, and any further work required by the Group team was then performed by the component auditor. We were able to rely upon the Group’s internal control over financial reporting in several areas of our audit, where our controls testing supported this approach, which enabled us to reduce the scope of our substantive audit work; in the other areas the scope of the audit work performed was fully substantive.
INDEPENDENT AUDITOR’S REPORT
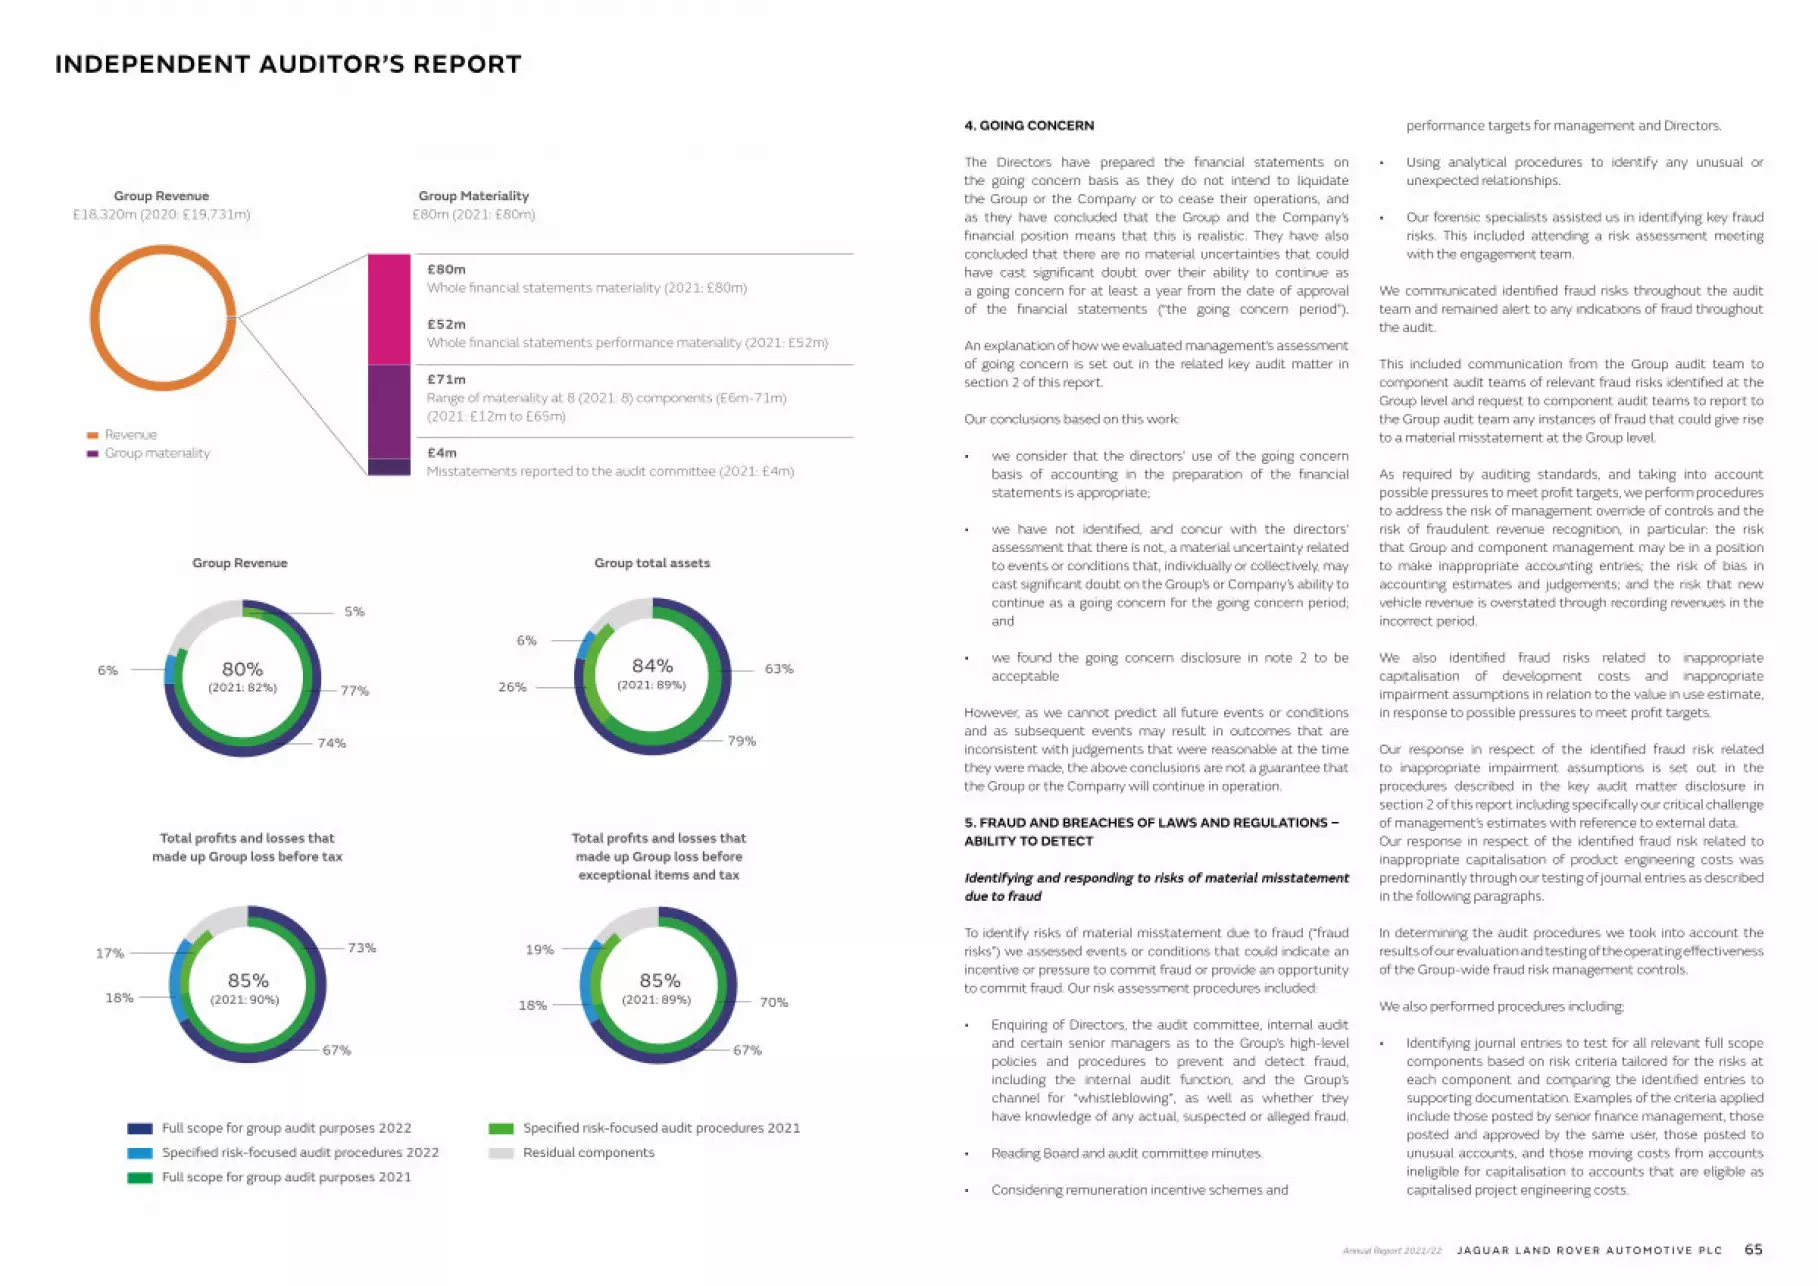
65Annual Report 2021/22 J A G U A R L A N D R O V E R A U T O M O T I V E P L C
67%
18%
67%
18%
79%
6%
Group Revenue£18,320m (2020: £19,731m)
Group Materiality £80m (2021: £80m)
Revenue Group materiality
£80m Whole financial statements materiality (2021: £80m)
£71m Range of materiality at 8 (2021: 8) components (£6m-71m) (2021: £12m to £65m)
£4m Misstatements reported to the audit committee (2021: £4m)
Total profits and losses that made up Group loss before tax
Full scope for group audit purposes 2022
Specified risk-focused audit procedures 2022
Full scope for group audit purposes 2021
Specified risk-focused audit procedures 2021
Residual components
17%
Group total assets
85%(2021: 90%)
4. GOING CONCERN
The Directors have prepared the financial statements on the going concern basis as they do not intend to liquidate the Group or the Company or to cease their operations, and as they have concluded that the Group and the Company’s financial position means that this is realistic. They have also concluded that there are no material uncertainties that could have cast significant doubt over their ability to continue as a going concern for at least a year from the date of approval of the financial statements (“the going concern period”).
An explanation of how we evaluated management’s assessment of going concern is set out in the related key audit matter in section 2 of this report. Our conclusions based on this work:
• we consider that the directors’ use of the going concern basis of accounting in the preparation of the financial statements is appropriate;
• we have not identified, and concur with the directors’ assessment that there is not, a material uncertainty related to events or conditions that, individually or collectively, may cast significant doubt on the Group’s or Company’s ability to continue as a going concern for the going concern period; and
• we found the going concern disclosure in note 2 to be acceptable
However, as we cannot predict all future events or conditions and as subsequent events may result in outcomes that are inconsistent with judgements that were reasonable at the time they were made, the above conclusions are not a guarantee that the Group or the Company will continue in operation.
5. FRAUD AND BREACHES OF LAWS AND REGULATIONS – ABILITY TO DETECT
Identifying and responding to risks of material misstatement due to fraud
To identify risks of material misstatement due to fraud (“fraud risks”) we assessed events or conditions that could indicate an incentive or pressure to commit fraud or provide an opportunity to commit fraud. Our risk assessment procedures included:
• Enquiring of Directors, the audit committee, internal audit and certain senior managers as to the Group’s high-level policies and procedures to prevent and detect fraud, including the internal audit function, and the Group’s channel for “whistleblowing”, as well as whether they have knowledge of any actual, suspected or alleged fraud.
• Reading Board and audit committee minutes.
• Considering remuneration incentive schemes and
performance targets for management and Directors.
• Using analytical procedures to identify any unusual or unexpected relationships.
• Our forensic specialists assisted us in identifying key fraud risks. This included attending a risk assessment meeting with the engagement team.
We communicated identified fraud risks throughout the audit team and remained alert to any indications of fraud throughout the audit.
This included communication from the Group audit team to component audit teams of relevant fraud risks identified at the Group level and request to component audit teams to report to the Group audit team any instances of fraud that could give rise to a material misstatement at the Group level.
As required by auditing standards, and taking into account possible pressures to meet profit targets, we perform procedures to address the risk of management override of controls and the risk of fraudulent revenue recognition, in particular: the risk that Group and component management may be in a position to make inappropriate accounting entries; the risk of bias in accounting estimates and judgements; and the risk that new vehicle revenue is overstated through recording revenues in the incorrect period.
We also identified fraud risks related to inappropriate capitalisation of development costs and inappropriate impairment assumptions in relation to the value in use estimate, in response to possible pressures to meet profit targets.
Our response in respect of the identified fraud risk related to inappropriate impairment assumptions is set out in the procedures described in the key audit matter disclosure in section 2 of this report including specifically our critical challenge of management’s estimates with reference to external data.Our response in respect of the identified fraud risk related to inappropriate capitalisation of product engineering costs was predominantly through our testing of journal entries as described in the following paragraphs.
In determining the audit procedures we took into account the results of our evaluation and testing of the operating effectiveness of the Group-wide fraud risk management controls.
We also performed procedures including:
• Identifying journal entries to test for all relevant full scope components based on risk criteria tailored for the risks at each component and comparing the identified entries to supporting documentation. Examples of the criteria applied include those posted by senior finance management, those posted and approved by the same user, those posted to unusual accounts, and those moving costs from accounts ineligible for capitalisation to accounts that are eligible as capitalised project engineering costs.
£52m Whole financial statements performance materiality (2021: £52m)
Total profits and losses that made up Group loss before exceptional items and tax
70%
19%
85%(2021: 89%)
73%
80%(2021: 82%)
Group Revenue
74%
77%
5%
6% 63%26%
84%(2021: 89%)
INDEPENDENT AUDITOR’S REPORT

67Annual Report 2021/22 J A G U A R L A N D R O V E R A U T O M O T I V E P L C
• Assessing whether the judgements made in making accounting estimates are indicative of a potential bias.
• Assessing when revenue was recognised, particularly focusing on revenue recognised in the days before the year end date, and whether it was recognised in the correct year.
• Critically assessing the Directors’ judgements regarding identified product engineering development costs capitalised in relation to against both the accounting standards and our experience of practical application of these standards in other companies.
Work on the fraud risks was performed by a combination of component auditors and the group audit team.
Identifying and responding to risks of material misstatement due to non-compliance with laws and regulations
We identified areas of laws and regulations that could reasonably be expected to have a material effect on the financial statements from our general commercial and sector experience, and through discussion with the Directors and other management (as required by auditing standards), and from inspection of the Group’s regulatory and legal correspondence and discussed with the Directors and other management the policies and procedures regarding compliance with laws and regulations.
We communicated identified laws and regulations throughout our team and remained alert to any indications of non-compliance throughout the audit. This included communication from the Group audit team to component audit teams of relevant laws and regulations identified at the Group level, and a request for component auditors to report to the group team any instances of non-compliance with laws and regulations that could give rise to a material misstatement at the Group level. The potential effect of these laws and regulations on the financial statements varies considerably. Firstly, the Group is subject to laws and regulations that directly affect the financial statements including financial reporting legislation (including related companies legislation), distributable profits legislation, taxation legislation, and pension legislation and we assessed the extent of compliance with these laws and regulations as part of our procedures on the related financial statement items. Secondly, the Group is subject to many other laws and regulations where the consequences of non-compliance could have a material effect on amounts or disclosures in the financial statements, for instance through the imposition of fines or litigation. We identified the following areas as those most likely to have such an effect: product compliance, environmental, health and safety, data protection laws, bribery and corruption, employment law, and export controls, recognising the nature of the Group’s activities and its legal form. Auditing standards limit the required audit procedures to identify non-compliance
with these laws and regulations to enquiry of the Directors and other management and inspection of regulatory and legal correspondence, if any. Therefore if a breach of operational regulations is not disclosed to us or evident from relevant correspondence, an audit will not detect that breach.
Context of the ability of the audit to detect fraud or breaches of law or regulation
Owing to the inherent limitations of an audit, there is an unavoidable risk that we may not have detected some material misstatements in the financial statements, even though we have properly planned and performed our audit in accordance with auditing standards. For example, the further removed non-compliance with laws and regulations is from the events and transactions reflected in the financial statements, the less likely the inherently limited procedures required by auditing standards would identify it.
In addition, as with any audit, there remained a higher risk of non-detection of fraud, as these may involve collusion, forgery, intentional omissions, misrepresentations, or the override of internal controls. Our audit procedures are designed to detect material misstatement. We are not responsible for preventing non-compliance or fraud and cannot be expected to detect non-compliance with all laws and regulations.
6. WE HAVE NOTHING TO REPORT ON THE OTHER INFORMATION IN THE ANNUAL REPORT
The Directors are responsible for the other information presented in the Annual Report together with the financial statements. Our opinion on the financial statements does not cover the other information and, accordingly, we do not express an audit opinion or, except as explicitly stated below, any form of assurance conclusion thereon. Our responsibility is to read the other information and, in doing so, consider whether, based on our financial statements audit work, the information therein is materially misstated or inconsistent with the financial statements or our audit knowledge. Based solely on that work we have not identified material misstatements in the other information.
Strategic report and directors’ report
Based solely on our work on the other information:
• we have not identified material misstatements in the strategic report and the directors’ report;
• in our opinion the information given in those reports for the financial year is consistent with the financial statements; and
• in our opinion those reports have been prepared in
accordance with the Companies Act 2006.
7. WE HAVE NOTHING TO REPORT ON THE OTHER MATTERS ON WHICH WE ARE REQUIRED TO REPORT BY EXCEPTION
Under the Companies Act 2006, we are required to report to you if, in our opinion:
• adequate accounting records have not been kept by the parent Company, or returns adequate for our audit have not been received from branches not visited by us; or
• the parent Company financial statements are not in agreement with the accounting records and returns; or
• certain disclosures of Directors’ remuneration specified by law are not made; or
• we have not received all the information and explanations we require for our audit.
We have nothing to report in these respects.
8. RESPECTIVE RESPONSIBILITIES
Directors’ responsibilities
As explained more fully in their statement set out on pages 55 and 56, the Directors are responsible for: the preparation of the financial statements including being satisfied that they give a true and fair view; such internal control as they determine is necessary to enable the preparation of financial statements that are free from material misstatement, whether due to fraud or error; assessing the Group and parent Company’s ability to continue as a going concern, disclosing, as applicable, matters related to going concern; and using the going concern basis of accounting unless they either intend to liquidate the Group or the parent Company or to cease operations, or have no realistic alternative but to do so.
Auditor’s responsibilities
Our objectives are to obtain reasonable assurance about whether the financial statements as a whole are free from material misstatement, whether due to fraud or error, and to issue our opinion in an auditor’s report. Reasonable assurance is a high level of assurance, but does not guarantee that an audit conducted in accordance with ISAs (UK) will always detect a material misstatement when it exists. Misstatements can arise from fraud or error and are considered material if, individually or in aggregate, they could reasonably be expected to influence the economic decisions of users taken on the basis of the financial statements.
A fuller description of our responsibilities is provided on the FRC’s website at www.frc.org.uk/auditorsresponsibilities.
9. THE PURPOSE OF OUR AUDIT WORK AND TO WHOM WE OWE OUR RESPONSIBILITIES
This report is made solely to the Company’s members, as a body, in accordance with Chapter 3 of Part 16 of the Companies Act 2006. Our audit work has been undertaken so that we might state to the Company’s members those matters we are required to state to them in an auditor’s report and for no other purpose. To the fullest extent permitted by law, we do not accept or assume responsibility to anyone other than the Company and the Company’s members, as a body, for our audit work, for this report, or for the opinions we have formed.
Simon Haydn-Jones (Senior Statutory Auditor) for and on behalf of KPMG LLP, Statutory Auditor
Chartered Accountants One Snowhill Snow Hill QueenswayBirmingham B4 6GH
13 June 2022
INDEPENDENT AUDITOR’S REPORT

69
FINANCIAL STATEMENTS
Annual Report 2021/22 J A G U A R L A N D R O V E R A U T O M O T I V E P L C
As at 31 March (£ millions) Note 2022 2021 2020
Non-current assetsInvestments in equity accounted investees 15 321 316 362Other non-current investments 16 30 22 37Other financial assets 17 185 341 257Property, plant and equipment 18 6,253 6,461 6,814Intangible assets 19 4,866 5,387 6,278Right-of-use assets 36 568 543 568Pension asset 32 434 - 408Other non-current assets 20 35 32 23Deferred tax assets 14 336 397 523Total non-current assets 13,028 13,499 15,270Current assetsCash and cash equivalents 21 4,223 3,778 2,271Short-term deposits and other investments 175 1,004 1,393Trade receivables 722 863 833Other financial assets 19 394 477 383Inventories 23 2,781 3,022 3,468Other current assets 20 493 448 477Current tax assets 20 80 9Assets classified as held for sale 4 - -Total current assets 8,812 9,672 8,834Total assets 21,840 23,171 24,104Current liabilitiesAccounts payable 24 5,144 6,308 6,499Short-term borrowings 25 1,779 1,206 526Other financial liabilities 26 870 746 1,073Provisions 27 989 1,161 944Other current liabilities 28 674 638 716Current tax liabilities 116 100 100Total current liabilities 9,572 10,159 9,858Non-current liabilitiesLong-term borrowings 25 5,248 4,972 4,817Other financial liabilities 26 871 625 778Provisions 27 1,112 1,188 1,355Retirement benefit obligation 32 25 387 28Other non-current liabilities 28 404 461 533Deferred tax liabilities 14 105 116 179Total non-current liabilities 7,765 7,749 7,690Total liabilities 17,337 17,908 17,548Equity attributable to shareholdersOrdinary shares 29 1,501 1,501 1,501Capital redemption reserve 29 167 167 167Other reserves 30 2,835 3,586 4,880Equity attributable to shareholders 4,503 5,254 6,548Non-controlling interests - 9 8Total equity 4,503 5,263 6,556Total liabilities and equity 21,840 23,171 24,104
The notes on pages 72 to 139 are an integral part of these consolidated financial statements.
These consolidated financial statements were approved by the JLR plc Board and authorised for issue on 13 June 2022.
They were signed on its behalf by:
THIERRY BOLLORÉCHIEF EXECUTIVE OFFICERCOMPANY REGISTERED NUMBER: 06477691
CONSOLIDATED BALANCE SHEETCONSOLIDATED INCOME STATEMENT
Year ended 31 March (£ millions) Note 2022 2021 2020
Revenue 5 18,320 19,731 22,984Material and other cost of sales* 4,6 (11,239) (12,335) (14,684)Employee costs* 4,7 (2,265) (2,141) (2,568)Other expenses* 4,10 (3,701) (3,589) (5,238)Exceptional items 4 (43) (1,523) (29)Other income 9 200 195 174Engineering costs capitalised 11 455 727 1,369Depreciation and amortisation 13 (1,944) (1,976) (1,910)Foreign exchange gain/(loss) and fair value adjustments 13 140 331 (249)Finance income 12 9 11 52Finance expense (net) 12 (369) (251) (209)Share of loss of equity accounted investments 15 (18) (41) (114)Loss before tax (455) (861) (422)Income tax expense 14 (367) (239) (47)Loss for the year (822) (1,100) (469)Attributable to:Owners of the Company (818) (1,101) (471)Non-controlling interests (4) 1 2
*‘Material and other cost of sales’, ‘Employee costs’ and ‘Other expenses’ exclude the exceptional items explained in note 4.
The notes on pages 72 to 139 are an integral part of these consolidated financial statements.
Year ended 31 March (£ millions) Note 2022 2021 2020
Loss for the year (822) (1,100) (469)Items that will not be reclassified subsequently to profit or loss:Remeasurement of net defined benefit obligation 32 707 (751) 983Income tax related to items that will not be reclassified 14 (92) 143 (155) 615 (608) 828Items that may be reclassified subsequently to profit or loss:(Loss)/gain on cash flow hedges (net) (896) 546 304Currency translation differences 24 (41) 21Income tax related to items that may be reclassified 14 205 (103) (57) (667) 402 268Other comprehensive (expense)/income net of tax (52) (206) 1,096Total comprehensive (expense)/income attributable to shareholder (874) (1,306) 627Attributable to:Owners of the Company (870) (1,307) 625
Non-controlling interests (4) 1 2
The notes on pages 72 to 139 are an integral part of these consolidated financial statements.
CONSOLIDATED STATEMENT OF COMPREHENSIVE INCOME AND EXPENSE

71
FINANCIAL STATEMENTS
Annual Report 2021/22 J A G U A R L A N D R O V E R A U T O M O T I V E P L C
The notes on pages 72 to 139 are an integral part of these consolidated financial statements.
Year ended 31 March (£ millions) Note 2022 2021 2020
Cash flows from operating activitiesCash generated from operations 38 572 2,536 2,399
Dividends received 15 - - 67
Income tax paid (138) (210) (152)Net cash generated from operating activities 434 2,326 2,314Cash flows from investing activitiesInvestment in equity accounted investments - (1) (67)
Purchases of other investments (4) (4) (11)Proceeds from sale of other investments - 22 -Investment in other restricted deposits (41) (57) (35)
Redemption of other restricted deposits 39 55 31
Movements in other restricted deposits (2) (2) (4)Investment in short-term deposits and other investments (1,104) (3,169) (4,010)Redemption of short-term deposits and other investments 1,935 3,512 3,659Movements in short-term deposits and other investments 831 343 (351)
Purchases of property, plant and equipment (712) (1,050) (1,281)
Proceeds from sale of property, plant and equipment 7 8 1
Net cash outflow relating to intangible asset expenditure (481) (799) (1,511)
Finance income received 8 14 50
Acquisition of subsidiaries (net of cash acquired) - - (3)
Disposal of subsidiaries (net of cash disposed) (10) - -
Net cash used in investing activities (363) (1,469) (3,177)Cash flows from financing activitiesFinance expenses and fees paid (402) (313) (262)Proceeds from issuance of borrowings 2,095 1,953 1,602Repayment of borrowings (1,347) (749) (939)Payments of lease obligations (71) (79) (72)Net cash generated from financing activities 275 812 329Net increase/(decrease) in cash and cash equivalents 346 1,669 (534)Cash and cash equivalents at beginning of year 21 3,778 2,271 2,747
Effect of foreign exchange on cash and cash equivalents 99 (162) 58
Cash and cash equivalents at end of year 21 4,223 3,778 2,271
CONSOLIDATED CASH FLOW STATEMENTCONSOLIDATED STATEMENT OF CHANGES IN EQUITY
(£ millions) Ordinary shares
Capital redemption
reserveOther
reservesEquity
attributable to shareholder
Non-controlling
interestsTotal
equity
Balance at 1 April 2021 1,501 167 3,586 5,254 9 5,263Loss for the year - - (818) (818) (4) (822)Other comprehensive expense for the year - - (52) (52) - (52)Total comprehensive expense - - (870) (870) (4) (874)Amounts removed from hedge reserve and recognised in inventory - - 147 147 - 147Income tax related to amounts removed from hedge reserve and recognised in inventory - - (28) (28) - (28)Disposal of subsidiaries - - - - (5) (5)Balance at 31 March 2022 1,501 167 2,835 4,503 - 4,503
Balance at 1 April 2020 1,501 167 4,880 6,548 8 6,556(Loss)/profit for the year - - (1,101) (1,101) 1 (1,100)Other comprehensive expense for the year - - (206) (206) - (206)Total comprehensive (expense)/ income - - (1,307) (1,307) 1 (1,306)
Amounts removed from hedge reserve and recognised in inventory - - 16 16 - 16Income tax related to amounts removed from hedge reserve and recognised in inventory - - (3) (3) - (3)Balance at 31 March 2021 1,501 167 3,586 5,254 9 5,263
Balance at 1 April 2019 1,501 167 4,305 5,973 6 5,979Adjustment on initial application of IFRS 16 (net of tax) - - (23) (23) - (23)
Adjusted balance at 1 April 2019 1,501 167 4,282 5,950 6 5,956(Loss)/profit for the year - - (471) (471) 2 (469)Other comprehensive income for the year - - 1,096 1,096 - 1,096
Total comprehensive income - - 625 625 2 627Amounts removed from hedge reserve and recognised in inventory - - (33) (33) - (33)Income tax related to amounts removed from hedge reserve and recognised in inventory - - 6 6 - 6Balance at 31 March 2020 1,501 167 4,880 6,548 8 6,556
The notes on pages 72 to 139 are an integral part of these consolidated financial statements.
73
FINANCIAL STATEMENTS
Annual Report 2021/22 J A G U A R L A N D R O V E R A U T O M O T I V E P L C
The Group has considered the impact of severe but plausible downside scenarios and the expected wholesale volumes under each of these scenarios is much higher than under the reverse stress test.
The Directors, after making appropriate enquiries and taking into consideration the risks and uncertainties facing the Group, consider that the Group and parent company have adequate financial resources to continue in operational existence throughout the Going Concern Assessment Period, meeting their liabilities as they fall due. Accordingly, the Directors continue to adopt the going concern basis in preparing these consolidated and parent company financial statements.
Accounting policies
Accounting policies are included in the relevant notes to theconsolidated financial statements on pages 72 to 139. The accounting policies below are applied throughout the financial statements.
Climate change
In the preparation of these consolidated financial statements, the Group has considered the potential effects of climate change, related regulatory requirements and of the targets set out in the Group’s Strategic Report. Where relevant, these are included within assumptions and estimates used to determine the carrying value of assets and liabilities at 31 March 2022. In particular, the Group has considered the impact on the future cash flows used in the impairment assessment of its cash-generating unit (see note 19); and on its provisions for the costs of compliance with emission regulations (see note 27).
Basis of consolidation
SubsidiariesThe consolidated financial statements include Jaguar Land Rover Automotive plc and its subsidiaries. Subsidiaries are entities controlled by the Company. Control exists when the Company (a) has power over the investee, (b) is exposed or has rights to variable return from its involvement with the investee and (c) has the ability to affect those returns through its power to direct relevant activites of the investee. Relevant activites are those activities that significantly affect an entity’s returns. In assessing control, potential voting rights that currently are exercisable are taken into account, as well as other contractual arrangements that may influence control. Intercompany transactions and balances including unrealised profits are eliminated in full on consolidation.
Joint ventures and associates (equity accounted investments)A joint arrangement is an arrangement of which two or more parties have joint control. Joint control is the contractually agreed sharing of control of an arrangement, which exists only when decisions about the relevant activities require the unanimous consent of the parties sharing control. A joint venture is a joint
arrangement whereby the parties that have joint control of the arrangement have rights to the net assets of the arrangement.
Associates are those entities over which the Group has significant influence. Significant influence is the power to participate in the financial and operating policy decisions of the investee but is not control or joint control of those policies. Significant influence is presumed to exist when the Group holds between 20 and 50 per cent of the voting power of the investee unless it can be clearly demonstrated that this is not the case.
The results, assets and liabilities of joint ventures and associates are incorporated in these financial statements using the equity method of accounting as described in note 15.
Use of estimates and judgements
The preparation of financial statements in conformity with IFRS requires the use of judgements, estimates and assumptions that affect the reported amounts of assets and liabilities at the date of the financial statements and the reported amounts of revenues and expenses during the reporting period. Those that are significant to the Group are discussed separately below.
Judgements
In the process of applying the Group’s accounting policies, management has made the following judgements, which have a significant effect on the amounts recognised in the consolidated financial statements:
Revenue recognition: The Group uses judgement to determine when control of its goods, primarily vehicles and parts, pass to the customer. This is assessed with reference to indicators of control, including the risks and rewards of ownership and legal title with reference to the underlying terms of the customer contract. Refer to note 5 for further information.
Assessment of cash-generating units: The Group has determined that there is one cash-generating unit. This is on the basis that there are no smaller groups of assets that can be identified with certainty that generate specific cash inflows that are independent of the inflows generated by other assets or groups of assets. Refer to note 19 for further information.
Alternative performance measures (APMs) and exceptional items: The Group exercises judgement in determining the adjustments to apply to IFRS measurements in order to derive APMs that provide additional useful information on the underlying trends and in classifying items as exceptional items. Refer to notes 3 and 4 for further information.
Capitalisation of product engineering costs: The Group applies judgement in determining at what point in a vehicle programme’s life cycle the recognition criteria under IAS 38 are satisfied. Refer to note 19 for further information.
Deferred tax asset recognition: The extent to which deferred
NOTES (FORMING PART OF THE CONSOLIDATED FINANCIAL STATEMENTS)
1 Background and operations
Jaguar Land Rover Automotive plc (“the Company”) and its subsidiaries are collectively referred to as “the Group” or “JLR”. The Company is a public limited company incorporated and domiciled in the United Kingdom. The address of its registered office is Abbey Road, Whitley, Coventry, CV3 4LF, England, United Kingdom. The Company is a subsidiary of Tata Motors Limited, India and acts as an intermediate holding company for the Jaguar Land Rover business. The principal activity during the year was the design, development, manufacture and marketing of high-performance luxury saloons, specialist sports cars and four-wheel-drive off-road vehicles.
These consolidated financial statements have been prepared in Pound Sterling (GBP) and rounded to the nearest million GBP (£ million) unless otherwise stated. Results for the year ended and as at 31 March 2020 have been disclosed solely for the information of the users.
2 Accounting information and policies
Statement of compliance
These consolidated and parent company financial statements have been prepared in accordance with UK-adopted international accounting standards.
The Company has taken advantage of section 408 of the Companies Act 2006 and, therefore, the separate financial statements of the Company do not include the income statement or the statement of comprehensive income of the Company on a stand-alone basis.
Basis of preparation
The consolidated financial statements have been prepared on a historical cost basis except for certain financial instruments, which are measured at fair value at the end of each reporting period as explained in the accounting policies in note 35. The balance sheet and accompanying notes as at 31 March 2020 have been disclosed solely for the information of the users.
Going concern
The Financial Statements have been prepared on a going concern basis, which the Directors consider to be appropriate for the reasons set out below.
The Directors have assessed the financial position of the Group as at 31 March 2022, and the projected cash flows of the Group for the twelve-month period from the date of authorisation of the financial statements (the ‘going concern assessment period’).
The Group had available liquidity of £6.4 billion at 31 March 2022, including £4.4 billion of cash and cash equivalents and the Group’s undrawn £2.0 billion revolving credit facility. Within the going concern assessment period there is £1 billion minimum quarter-end liquidity covenant attached to the Group’s UKEF loans for the entire period and to the RCF facility from July 2022, and a reduction in the RCF facility to £1.5 billion from July 2022. Further details of the Group’s available financing facilities and the maturity of facilities is described on page 34.
The Group has assessed its projected cash flows over the going concern assessment period. This base case uses the most recent Board-approved forecasts that include the going concern assessment period; taking into account the Group’s expectations of the continued supply chain challenges related to semiconductor shortages, the diminishing impacts of the COVID-19 pandemic and prevailing financial conditions including the impact of inflationary pressures on material costs. The Group saw a gradual improvement in chip supply during the quarter ended 31 March 2022 leading to improved production and wholesale volumes compared to the previous two quarters. This is expected to continue through the year ending 31 March 2023 although the situation remains uncertain.
The base case assumes an improvement in wholesale volumes in the going concern assessment period compared to the previous twelve months, reflecting gradual improvement in semiconductor supply, and proactive management of semiconductor supplies to maximise production of higher margin products.
The Group has also carried out a reverse stress test against the base case to determine the decline in wholesale volume over a twelve-month period that would result in a liquidity level that breaches financing covenants. The reverse stress test assumes continued supply constraints resulting in demand that exceeds supply over the twelve-month period and assumes optimisation of supply to maximise production of higher margin products.
In order to reach a liquidity level that breaches covenants, it would require a sustained decline in wholesale volumes of more than 60% compared to the base case over a twelve-month period. The reverse stress test reflects the variable profit impact of the wholesale volume decline, and assumes all other assumptions are held in line with the base case. It does not reflect other potential upside measures that could be taken in such a reduced volume scenario; or any new funding.
The Group does not consider this scenario to be plausible given that the stress test volumes are significantly lower than the volumes achieved during both the peak of the COVID-19 pandemic and the worst quarter of semiconductor shortages. The Group has a record order bank as at 31 March 2022 and is confident that it can significantly exceed reverse stress test volumes.

75
FINANCIAL STATEMENTS
Annual Report 2021/22 J A G U A R L A N D R O V E R A U T O M O T I V E P L C
reviewed at each balance sheet date to determine whether there is any indication of a reversal of impairment losses recognised in prior years.
New accounting policy pronouncements
(a) Standards, revisions and amendments to standards and interpretations not significant to the Jaguar Land Rover Group and applied for the first time in the year ending 31 March 2022
The following amendments and interpretations have been adopted by the Group in the year ending 31 March 2022.
• Amendments to IFRS 9 Financial Instruments, IAS 39 Financial Instruments: Recognition and Measurement, IFRS 7 Financial Instruments, IFRS 4 Insurance Contracts and IFRS 16 Leases: Disclosures – Interest rate benchmark reform; and
• Amendments to IFRS 16 Leases – COVID-19 related rent concessions beyond 30 June 2021.
The adoption of these amendments and interpretations has not had a significant impact on the consolidated financial statements.
(b) Standards, revisions and amendments to standards and interpretations not yet effective and not yet adopted by the Group
The following pronouncement, issued by the IASB and endorsed by the UK, is not yet effective and has not yet been adopted by the Group. This amendment is effective for annual report periods beginning on or after 1 January 2022.
• Amendments to IFRS 3 Business Combinations – Reference to the conceptual framework;
• Amendments to IAS 37 Provisions, Contingent Liabilities and Contingent Assets – Onerous contracts – cost of fulfilling a contract;
• Annual improvements to IFRS standards 2018-2020 cycle;
• Amendments to IAS 16 Property, Plant and Equipment – Proceeds before intended use;
• IFRS 17 Insurance Contracts; and
• Amendments to IFRS 17 and IFRS 19 Initial Application of IFRS 17 and IFRS 9 - Comparative Information.
The Group is currently assessing the impact of these pronouncements on the consolidated financial statements.
(c) Standards, revisions and amendments to standards and interpretations not yet endorsed by the UK and not yet adopted by the Group
The following pronouncements, issued by the IASB, have not yet been endorsed by the UK, are not yet effective and have not yet been adopted by the Group.
• Amendments to IAS 1 Presentation of Financial Statements – Classification of liabilities as current or non-current;
• Amendments to IAS 1 Presentation of Financial Statements – disclosure of accounting policies;
• Amendments to IAS 8 Accounting Policies, Changes in Accounting Estimates and Errors – definition of accounting estimates; and
• Amendments to IAS 12 Deferred Tax related to Assets and Liabilities arising from a Single Transaction.
tax assets can be recognised is based on an assessment of the availability of future taxable income against which the deductible temporary differences and tax loss carry-forwards can be utilised. The Group has exercised judgement in determining the jurisdictions in which deferred tax assets have not been fully recognised. This has been done based on forecast profitability and historical results of the companies in which the deferred tax assets arise. Refer to note 14 for further information.
Estimates and assumptions
The areas where assumptions and estimates are significant to the financial statements are as described below. The estimates and associated assumptions are based on historical experience and various other factors that are believed to be reasonable under the circumstances, the results of which form the basis of making the judgements about carrying values of assets and liabilities that are not readily apparent from other sources. Actual results may differ from these estimates. Significant estimates are those that have a significant risk of resulting in a material adjustment to the carrying amounts of assets and liabilities within the next year. Other estimates are those that may affect carrying amounts in the longer term.
Significant estimates
Impairment of intangible and tangible fixed assets: The Group has intangible assets with indefinite lives and therefore tests annually whether intangible and tangible fixed assets have suffered any impairment. Refer to note 19 for further information on the key assumptions and sensitivities used in the testing these assets for impairment.
Retirement benefit obligation: The present value of the post-employment benefit obligations depends on a number of factors and assumptions, including discount rate, inflation and mortality assumptions. Refer to note 32 for details of these assumptions and sensitivities.
Other estimates
Product warranties: refer to note 27 for further information.
Variable marketing expense: refer to note 5 for further information.
Impairment in equity accounted investees: refer to note 15 for further information.
Restructuring: refer to note 27 for further information.
Cost recognition
Costs and expenses are recognised when incurred and are classified according to their nature.
Expenditures are capitalised, where appropriate, in accordance with the policy for internally generated intangible assets and represent employee costs, stores and other manufacturing
supplies, and other expenses incurred for product development undertaken by the Group.
Material and other cost of sales as reported in the consolidated income statement is presented net of the impact of realised foreign exchange relating to derivatives hedging cost exposures.
Foreign currency
The Company has a functional currency of GBP. The presentation currency of the consolidated financial statements is GBP.
Transactions in currencies other than the functional currency of the entity are recorded at the exchange rate prevailing on the date of transaction. Foreign currency denominated monetary assets and liabilities are remeasured into the functional currency at the exchange rate prevailing on the balance sheet date. Exchange differences are recognised in the consolidated income statement as “Foreign exchange gain/(loss) and fair value adjustments”.
For the purposes of presenting consolidated financial statements, the assets and liabilities of the Group’s foreign operations (non-GBP functional currency) are translated at exchange rates prevailing on the balance sheet date. Income and expense items are translated at the average exchange rates for the period. Exchange differences arising, if any, are recognised in other comprehensive income and accumulated in equity.
Impairment
Property, plant and equipment and intangible assetsAt each balance sheet date, the Group assesses whether there is any indication that any property, plant and equipment and intangible assets with finite lives may be impaired. If any such impairment indicator exists, the recoverable amount of an asset is estimated to determine the extent of impairment, if any. Where it is not possible to estimate the recoverable amount of an individual asset, the Group estimates the recoverable amount of the cash generating unit to which the asset belongs.
Intangible assets with indefinite useful lives and intangible assets not yet available for use are tested for impairment annually, or earlier if there is an indication that the asset may be impaired.
Recoverable amount is the higher of fair value less costs of sale and value in use. In assessing value in use, the estimated future cash flows are discounted to their present value using a pre-tax discount rate that reflects current market assessments of the time value of money and the risks specific to the asset (or cash generating unit) for which the estimates of future cash flows have not been adjusted.
If the recoverable amount of an asset (or cash-generating unit) is estimated to be less than its carrying amount, the carrying amount of the asset (or cash-generating unit) is reduced to its recoverable amount. An impairment loss is recognised immediately in the consolidated income statement.
An asset (or cash-generating unit) impaired in prior years is

77
FINANCIAL STATEMENTS
Annual Report 2021/22 J A G U A R L A N D R O V E R A U T O M O T I V E P L C
Adjusted EBIT and Adjusted EBITDA
Year ended 31 March (£ millions) Note 2022 2021 2020Adjusted EBITDA 1,896 2,531 2,050Depreciation and amortisation (1,944) (1,976) (1,910)
Share of loss of equity accounted investments 15 (18) (41) (114)Adjusted EBIT (66) 514 26Foreign exchange gain on derivatives 13 - 14 15Unrealised gain/(loss) on commodities 13 48 137 (78)Foreign exchange (loss)/gain and fair value adjustments on loans 13 (141) 314 (135)Foreign exchange gain/(loss) on economic hedges of loans 13 91 (143) 29Foreign exchange gain/(loss) on balance sheet, cash and deposits revaluation 13 12 64 (50)
Finance income 12 9 11 52
Finance expense (net) 12 (369) (251) (209)Fair value gain/(loss) on equity investments 13 4 2 (43)(Loss)/profit before tax and exceptional items (412) 662 (393)Exceptional items 4 (43) (1,523) (29)Loss before tax (455) (861) (422)
Total cash and cash equivalents, deposits and investments and available liquidity are measures used by the Group to assess liquidity and the availability of funds for future spend and investment.
Exceptional items are defined in note 4.
Reconciliations between these alternative performance measures and statutory reported measures are shown below and on the next page.
Alternative performance measure Definition
Adjusted EBITDA Adjusted EBITDA is defined as profit before: income tax expense; exceptional items; finance expense (net of capitalised interest) and finance income; gains/losses on debt and unrealised derivatives, realised derivatives entered into for the purpose of hedging debt, and equity or debt investments held at fair value; foreign exchange gains/losses on other assets and liabilities, including short-term deposits and cash and cash equivalents; share of profit/loss from equity accounted investments; depreciation and amortisation.
Adjusted EBIT Adjusted EBIT is defined as for adjusted EBITDA but including share of profit/loss from equity accounted investments, depreciation and amortisation.
Profit/(loss) before tax and exceptional items
Profit/(loss) before tax excluding exceptional items.
Free cash flow Net cash generated from operating activities less net cash used in automotive investing activities, excluding investments in consolidated entities and movements in financial investments, and after finance expenses and fees paid. Financial investments are those reported as cash and cash equivalents, short-term deposits and other investments, and equity or debt investments held at fair value.
Total product and other investment Cash used in the purchase of property, plant and equipment, intangible assets, investments in equity accounted investments and other trading investments, acquisition of subsidiaries and expensed research and development costs.
Working capital Changes in assets and liabilities as presented in note 38. This comprises movements in assets and liabilities excluding movements relating to financing or investing cash flows or non-cash items that are not included in adjusted EBIT or adjusted EBITDA.
Total cash and cash equivalents, deposits and investments
Defined as cash and cash equivalents, short-term deposits and other investments, marketable securities and any other items defined as cash and cash equivalents in accordance with IFRS.
Available liquidity Defined as total cash and cash equivalents, deposits and investments plus committed undrawn credit facilities.
Net debt Total cash and cash equivalents, deposits and investments less total interest-bearing loans and borrowings.
Retail sales Jaguar Land Rover retail sales represent vehicle sales made by dealers to end customers and include the sale of vehicles produced by our Chinese joint venture, Chery Jaguar Land Rover Automotive Company Ltd.
Wholesales Wholesales represent vehicle sales made to retailers or other external customers. The Group recognises revenue on wholesales.
The Group uses adjusted EBITDA as an APM to review and measure the underlying profitability of the Group on an ongoing basis for comparability as it recognises that increased capital expenditure year on year will lead to a corresponding increase in depreciation and amortisation expense recognised within the consolidated income statement.
The Group uses adjusted EBIT as an APM to review and measure the underlying profitability of the Group on an ongoing basis as this excludes volatility on unrealised foreign exchange transactions. Due to the significant level of debt and currency derivatives held, unrealised foreign exchange can distort the financial performance of the Group from one period to another.
Free cash flow is considered by the Group to be a key measure in assessing and understanding the total operating performance of the Group and to identify underlying trends.
Total product and other investment is considered by the Group to be a key measure in assessing cash invested in the development of future new models and infrastructure supporting the growth of the Group.
Working capital is considered by the Group to be a key measure in assessing short-term assets and liabilities that are expected to be converted into cash within the next 12-month period.
3 Alternative Performance Measures
In reporting financial information, the Group presents alternative performance measures (“APMs”) that are not defined or specified under the requirements of IFRS. The Group believes that these APMs, which are not considered to be a substitute for or superior to IFRS measures, provide stakeholders with additional helpful information on the performance of the business. The APMs used within this Annual Report are defined below.
Free cash flow
Year ended 31 March (£ millions) 2022 2021 2020Net cash generated from operating activities 434 2,326 2,314
Purchases of property, plant and equipment (712) (1,050) (1,281)
Net cash outflow relating to intangible asset expenditure (481) (799) (1,511)Proceeds from sale of property, plant and equipment 7 8 1Investment in equity accounted investees - (1) (67)Acquisition of subsidiaries (net of cash acquired) - - (3)Disposal of subsidiaries (net of cash disposed) (10) - -Finance expenses and fees paid (402) (313) (262)Finance income received 8 14 50Free cash flow (1,156) 185 (759)
Total product and other investments
Year ended 31 March (£ millions) Note 2022 2021 2020Purchases of property, plant and equipment 712 1,050 1,281Net cash outflow relating to intangible asset expenditure 481 799 1,511Engineering costs expensed 11 839 489 421
Investment in equity accounted investees - 1 67
Purchases of other investments 4 4 11Acquisition of subsidiary (net of cash acquired) - - 3Total product and other investments 2,036 2,343 3,294

79
FINANCIAL STATEMENTS
Annual Report 2021/22 J A G U A R L A N D R O V E R A U T O M O T I V E P L C
Year ended 31 March 2021 (£ millions) Note Other expenses Employee costsMaterial and other cost of
sales
Excluding exceptional items 3,589 2,141 12,335Restructuring costs - asset write-downs 952 - -Restructuring costs - employee and third party obligations 252 116 194Pension past service cost 32 - 9 -Including exceptional items 4,793 2,266 12,529
Year ended 31 March 2020 (£ millions) Other expenses Employee costs
Excluding exceptional items 5,238 2,568Restructuring costs (3) 32Including exceptional items 5,235 2,600
Year ended 31 March 2022 (£ millions) Other expenses Employee costsMaterial and other cost of
salesExcluding exceptional items 3,701 2,265 11,239Restructuring costs - asset write-downs 7 - -Restructuring costs - employee and third party obligations (73) (16) 82Other 43 - -Including exceptional items 3,678 2,249 11,321
Retail and wholesales
Year ended 31 March (units) 2022 2021 2020Retail sales 376,381 439,588 508,659Wholesales 294,182 347,632 475,952
Available liquidity
As at 31 March (£ millions) Note 2022 2021 2020Cash and cash equivalents 4,223 3,778 2,271
Short-term deposits and other investments 175 1,004 1,393
Committed undrawn credit facilities 25 2,015 1,938 1,935Available liquidity 6,413 6,720 5,599
Net debt
As at (£ millions) 2022 2021 2020Cash and cash equivalents 4,223 3,778 2,271Short-term deposits and other investments 175 1,004 1,393Interest-bearing loans and borrowings (7,597) (6,697) (5,884)Net debt (3,199) (1,915) (2,220)
The exceptional items recognised in the year ended 31 March 2021 comprise:
• Asset write-downs of £952 million in relation to models cancelled under the Group’s Reimagine strategy. See notes 18 and 19.
• Restructuring costs of £562 million comprising
• Costs of £534 million resulting from the Group’s Reimagine strategy comprising accruals to settle legal obligations on work performed to date and provisions for redundancies and other third party obligations. See note 27. Included within the restructuring costs is a defined benefit past service cost of £7 million. See note 32.
• Costs of £28 million resulting from a separate redundancy programme during the year. See note 27.
• An update of £9 million to the past service cost recognised due to the requirement to equalise male and female members’ benefits for the inequalities within guaranteed minimum pension (‘GMP’) earned between 17 May 1990 and 5 April 1997 based on new information. See note 32.
The exceptional item recognised in the year ended 31 March 2020 comprises restructuring costs of £29 million relating to a Group restructuring programme that commenced during the year ended 31 March 2019. This included a past service pension cost of £4 million.
The tables below set out the exceptional items (expense/(credit)) recorded in the years ended 31 March 2022, 2021 and 2020 and the impact on the consolidated income statement if these items were not disclosed separately as exceptional items.
As at (£ millions) 2022 2021 2020Cash and cash equivalents 4,223 3,778 2,271Short-term deposits and other investments 175 1,004 1,393Total cash and cash equivalents, deposits and investments 4,398 4,782 3,664
Total cash and cash equivalents, deposits and investments
4 Exceptional items
Exceptional items are disclosed separately in the consolidated income statement and excluded from adjusted EBIT and adjusted EBITDA measures to support the reader’s understanding of the performance of the Group.
The Group considers qualitative and quantitative factors to determine whether a transaction or event is exceptional, including the expected size, nature and frequency of the transaction or event, and any precedent for similar items in previous years.
Items that are considered exceptional may include the following:
• Costs associated with significant restructuring events;
• Impairments or reversals of impairments arising from an impairment assessment of the Group’s cash-generating unit in accordance with IAS 36;
• Defined benefit past service costs or credits arising from scheme amendments; and
• Costs associated with provisions and related reversals arising from a significant one-off event not in the normal course of business.
The exceptional items recognised in the year ended 31 March 2022 comprise:
• £43 million in relation to customer liabilities arising from sanctions imposed against Russia by many countries, preventing the shipment of vehicles and certain parts to the market.
• Updates to the assessment of the impact of the Group’s Reimagine strategy relating to the exceptional items recognised during the year ended 31 March 2021. Included in “Income tax expense” in the consolidated income statement for the year ended 31 March 2022 is £nil in respect of
exceptional items (2021, 2020: credit of £6 million).

81
FINANCIAL STATEMENTS
Annual Report 2021/22 J A G U A R L A N D R O V E R A U T O M O T I V E P L C
Significant revenue areas Nature, timing of satisfaction of performance obligations, and significant payment terms
Sales incentives The costs associated with providing sales support and incentives (variable marketing expense) are considered to be variable components of consideration, thus reducing the amount of revenue recognised by the Group. Under IFRS 15, the Group ensures that variable consideration is recognised to the extent of the amount to which it expects to be entitled.
To meet this principle, the Group constrains its estimate of variable consideration to include amounts only to the extent that it is highly probable that a significant reversal in the amount of cumulative revenue recognised will not occur when the associated uncertainty associated is subsequently resolved.
The Group estimates the expected sales incentive by market and considers uncertainties including competitor pricing, ageing of dealer stock and local market conditions. The constraint on variable consideration is estimated with reference to historical accuracy, current market conditions and a prospective assessment considering relevant geopolitical factors, including global stock positions for both the Group and its third party dealer network reflecting the pipeline of vehicle inventory for sale to end customers.
Variable consideration received for contracts with multiple performance obligations is allocated to all such obligations only when applicable. For example, with the sale of a vehicle, the cost of the incentive provided is allocated entirely to the vehicle as its purpose is to incentivise the sale of the vehicle rather than support any additional obligations.
Scheduled maintenancecontracts
Scheduled maintenance contracts sold with a vehicle provide the end customer with the benefit of bringing their vehicle to a dealership for the routine maintenance required to maintain compliance for warranty purposes.
The majority of plans sold by the Group are complimentary with the vehicle, thus payment is received at the same time as the proceeds from the vehicle sale, at which point the amount is recognised as a contract liability based on the stand-alone selling price, which is measured using a cost-plus approach.
Revenue is recognised over the life of the plan based on the expected performance of the services from the point of a vehicle being retailed to an end customer and aligned to the expected profile of costs to fulfil those services based on historical information.
Telematics Telematics features provide a service to the customer typically aligned to the warranty period of the vehicle, allowing a vehicle to connect and interact with an end customer’s mobile phone.
The Group typically receives payment relating to telematics features at the same time as the proceeds from the vehicle sale, at which point the amount is recognised as a contract liability based on the stand-alone selling price. For optional features, this is measured at the observable option price and for standard-fit features is measured using a cost-plus basis. The stand-alone selling price for telematics subscription renewals is measured at the renewal price offered to the customer.
Revenue is recognised on a straight-line basis over the term of the service from the point of the vehicle being retailed to an end customer in line with the expected costs to fulfil those services.
Warranty considerationsas a service
Vehicles and parts sold by the Group include a standard warranty to guarantee the vehicle complies with agreed-upon specifications for a defined period of time. Where the warranty offering to the end customer exceeds the standard market expectation for similar products, or provides a service in excess of the assurance that the agreed-upon specification is met, the Group considers this to constitute a service to the end customer and therefore a separate performance obligation. Revenue is recognised on a straight-line basis over the contractual period to which the warranty service relates, up to which point it is recognised as a contract liability.
Repurchasearrangements
Some contracts with customers include an option or obligation for the Group to repurchase the product sold (including repurchasing a product originally sold as part of an amended product). Such instances are common in the Group’s arrangements with third-party fleet customers or in contract manufacturing arrangements that the Group is party to.
The Group does not recognise revenue on the original sale, as it retains ultimate control of that product. The related inventory continues to be recognised on the Group’s consolidated balance sheet. The consideration received from the customer is treated as a liability.
Where the contractual repurchase price is less than the original sale price, the transaction is accounted for as a lease and where the contractual repurchase price is more than or equal to the original sale price the transaction is accounted for as a financing arrangement. Revenue recognised under such lease arrangements is outside of the scope of IFRS 15 and instead is recognised in line with IFRS 16 Leases.
Revenue relating to the good or product is recognised only when it is sold by the Group with no repurchase obligation or option attached.
Returns obligations,refunds andsimilarobligations
Vehicle sales do not typically include allowances for returns or refunds, although in some markets there is legislative requirement for Jaguar Land Rover as an automotive manufacturer to repurchase or reacquire a vehicle if quality issues arise that have been remedied a number of times and where the owner no longer wishes to own the vehicle as a result.
Regarding other goods, where rights of return may be prevalent, the Group estimates the level of returns based on the historical data for specific products, adjusted as necessary to estimate returns for new products. Revenue is not recognised for expected returns - instead the Group recognises a refund liability and asset where required.
5 Revenue
Revenue recognition
Revenue comprises the consideration earned by the Group in respect of the output of its ordinary activities. It is measured based on the contract price, which is the consideration specified in the contract with the customer and excludes amounts collected on behalf of third parties, and net of settlement discounts, bonuses, rebates and sales incentives. The Group’s primary customers from the sale of vehicles, parts and accessories are retailers, fleet and corporate customers, and other third-party distributors. The Group recognises revenue when it transfers control of a good or service to a customer, thus evidencing the satisfaction of the associated performance obligation under that contract.
As described in note 37, the Group operates with a single automotive reporting segment, principally generating revenue from the sales of vehicles, parts and accessories.
The sale of vehicles also can include additional services provided to the customer at the point of sale, for which the vehicle and services are accounted for as separate performance obligations, as they are considered separately identifiable. The contract transaction price is allocated among the identified performance obligations based on their stand-alone selling prices. Where the stand-alone selling price is not readily observable, it is estimated using an appropriate alternative approach.
Significant revenue areas Nature, timing of satisfaction of performance obligations, and significant payment terms
Vehicles, parts, and accessories (and other goods)
The Group recognises revenue on the sale of vehicles, parts and accessories at the point of “wholesale”, which is determined by the underlying terms and conditions of the contract with the customer as to when control transfers to them. The principle of control under IFRS 15 considers which party has the ability to direct the use of an asset and to obtain substantially all of the remaining economic benefits.
Determining the transfer of control with regards to the sale of goods is primarily driven by:
• The point at which the risks and rewards of ownership pass to the customer;• The point at which the customer takes physical possession of the good or product;• The point at which the customer accepts the good or product;• The point at which the Group has a present right to payment for the sale of the good or product; and• The point at which legal title to the good or product transfers to the customer.
In the vast majority of cases, the sale of the relevant good is recognised at the point of dispatch (at release to the carrier responsible for transportation to the customer) or the point of delivery to the customer, depending on individual contractual arrangements.
In some instances, revenue may be recognised on a bill-and-hold basis where vehicles, for example, are sold to the customer but are retained in the Group’s possession at a vehicle holding compound on behalf of the customer ahead of being physically transferred to them at a future time. Such arrangements meet the criteria for bill-and-hold arrangements under IFRS 15 to ensure that the customer has obtained the ultimate control of the product when revenue is recognised.
The reason for the bill-and-hold is substantive (as the customer requests JLR to retain possession, usually due to a lack of available space at their own premises), the vehicles are identifiable as separately belonging to the customer (on the basis that each vehicle has a unique Vehicle Identification Number), the vehicle must be ready for physical transfer to the customer (which it is, given that it is fully built and safety-checked off the manufacturing line) and the Group does not have the ability to use the vehicle or direct it elsewhere.
The Group operates with financing partners across the world that provide wholesale financing arrangements to the retail network for vehicle sales, which enables cash settlement to occur immediately (usually within two working days) for purchases from the Group.
For the sale of parts and accessories, the Group typically receives payment in line with the invoice payment terms stipulated and agreed with its customers, which are usually 30 days.

83
FINANCIAL STATEMENTS
Annual Report 2021/22 J A G U A R L A N D R O V E R A U T O M O T I V E P L C
Year ended 31 March (£ millions) 2022 2021 2020
Changes in inventories of finished goods and work-in-progress 279 469 121Purchase of products for sale 1,172 1,029 1,105Raw materials and consumables used 9,654 10,838 13,498Realised purchase hedges 134 (1) (40)Total material and other cost of sales 11,239 12,335 14,684
6 Material and other cost of sales
Revenue that is expected to be recognised within five years related to performance obligations that are unsatisfied (or partially unsatisfied) amounted to £803 million at 31 March 2022 (2021: £827 million, 2020: £896 million).
“Ongoing service obligations” mainly relate to long-term service and maintenance contracts, extended warranties and telematics services. “Liabilities for advances received” primarily relate to consideration received in advance from customers for products not yet wholesaled, at which point the revenue will be recognised. “Ongoing service obligations” and “Liabilities for advances received” are both presented within “Other liabilities” in the consolidated balance sheet.
The Group applies the practical expedient in IFRS 15.121 and does not disclose information about remaining performance obligations that have an original expected duration of one year
or less. This is because revenue resulting from those sales will be recognised in a short-term period. The services included with the vehicle sale are to be recognised as revenues in subsequent years but represent an insignificant portion of expected revenues in comparison.
The movement in contract liabilities relates solely to revenue recognised from balances held at the beginning of the year of £385 million (2021: £364 million, 2020: £392 million) and increases due to cash received for performance obligations unsatisfied at the year end of £361 million (2021: £295 million, 2020: £397 million).
Revenue recognised in the year from performance obligations satisified in the previous year is £13 million (2021: £100 million, 2020: £33 million).
As at 31 March (£ millions) 2022 2021 2020Ongoing service obligations 681 766 846Liabilities for advances received 122 61 50Total contract liabilities 803 827 896
Contract liabilities
7 Employee numbers and costs
Year ended 31 March (£ millions) 2022 2021 2020
Wages and salaries - employee costs 1,626 1,545 1,833Wages and salaries - agency costs 95 73 175Total wages and salaries 1,721 1,618 2,008Social security costs and benefits 312 288 312Pension costs 232 235 248Total employee costs 2,265 2,141 2,568
Employee costs in the year ended 31 March 2022 includes £14 million (2021: £188 million, 2020: £10 million) credit in relation to employees placed on furlough under the UK Coronavirus Job Retention Scheme.
Average employee numbers for the year ended 31 March 2022 Non-agency Agency Total
Manufacturing 17,268 751 18,019Research and development 7,893 394 8,287Other 9,430 295 9,725Total employee numbers 34,591 1,440 36,031
“Revenue – other” includes sales of goods other than vehicles, parts and accessories.
Revenue disaggregation
The following table presents the Group’s revenue, disaggregated by primary geographical market, timing of revenue recognition
and major product categories. All revenue is generated from the Group’s single automotive operating segment.
The Group’s revenues are summarised as follows:
Year ended 31 March (£ millions) 2022 2021 2020Revenue recognised for sales of vehicles, parts and accessories 17,159 18,775 22,436Revenue recognised for services transferred 324 314 306Revenue - other 762 753 807Total revenue from contracts with customers 18,245 19,842 23,549Realised revenue hedges 75 (111) (565)Total revenue 18,320 19,731 22,984
Year ended 31 March 2020 (£ millions) UK US China Rest of Europe
Rest of World
Total Revenue
Revenue recognised for sales of vehicles, parts and accessories 3,875 5,889 3,374 4,745 4,553 22,436Revenue recognised for services transferred 63 91 75 11 66 306Revenue - other 786 4 5 1 11 807Total revenue from contracts with customers 4,724 5,984 3,454 4,757 4,630 23,549Realised revenue hedges - (370) (166) - (29) (565)Total revenue 4,724 5,614 3,288 4,757 4,601 22,984
Year ended 31 March 2021 (£ millions) UK US China Rest of Europe
Rest of World
Total Revenue
Revenue recognised for sales of vehicles, parts and accessories 3,008 4,663 4,546 3,551 3,007 18,775Revenue recognised for services transferred 126 95 5 10 78 314Revenue - other 656 3 85 2 7 753Total revenue from contracts with customers 3,790 4,761 4,636 3,563 3,092 19,842Realised revenue hedges - (97) (75) - 61 (111)Total revenue 3,790 4,664 4,561 3,563 3,153 19,731
Year ended 31 March 2022 (£ millions) UK US China Rest of Europe
Rest of World
Total Revenue
Revenue recognised for sales of vehicles, parts and accessories 2,377 4,104 4,166 3,221 3,291 17,159Revenue recognised for services transferred 108 101 7 24 84 324Revenue - other 679 6 64 3 10 762Total revenue from contracts with customers 3,164 4,211 4,237 3,248 3,385 18,245Realised revenue hedges - 109 (61) - 27 75Total revenue 3,164 4,320 4,176 3,248 3,412 18,320

85
FINANCIAL STATEMENTS
Annual Report 2021/22 J A G U A R L A N D R O V E R A U T O M O T I V E P L C
9 Other income
Government grants are recognised when there is reasonable assurance that the Group will comply with the relevant conditions and the grant will be received.
Government grants are recognised in the consolidated income statement, either on a systematic basis when the Group recognises, as expenses, the related costs that the grants are intended to compensate or immediately, if the costs have already been incurred.
Government grants related to assets are deducted from the
cost of the asset and amortised over the useful life of the asset. Government grants related to income are presented as an offset against the related expenditure, and government grants that are awarded as incentives with no ongoing performance obligations to the Group are recognised as other income in the period in which the grant is received.
Sales tax incentives received from governments are recognised in the consolidated income statement at the reduced tax rate, and revenue is reported net of these sales tax incentives.
Year ended 31 March (£ millions) 2022 2021 2020Grant income 68 81 66Commissions 17 20 14Other 115 94 94Total other income 200 195 174
During the year ended 31 March 2022, £42 million (2021: £40 million, 2020: £12 million) was recognised in “Other income” by a foreign subsidiary as an incentive for continuing trading in that country for the foreseeable future. This includes amounts received as cash in the year and amounts that the subsidiary is
due to receive and for which there are no ongoing financial or operating conditions attached.
Average employee numbers for the year ended 31 March 2020 Non-agency Agency Total
Manufacturing 18,833 1,219 20,052Research and development 7,965 1,411 9,376Other 9,733 626 10,359Total employee numbers 36,531 3,256 39,787
Year ended 31 March (£) 2022 2021 2020
Directors' emoluments 4,001,943 5,509,867 3,459,163(Decrease)/increase of long-term incentive scheme amounts receivable (30,253) 479,444 803,472Post-employment benefits - 1,164,478 349,442
8 Directors’ emoluments
The aggregate of emoluments received in the year and amounts accrued under the bonus schemes of the highest paid director was £3,652,103 (2021: £3,962,991, 2020: £4,099,544), together with a cash allowance in lieu of pension and medical benefits of £nil (2021: £1,164,478, 2020: £349,442). During the year, the value of LTIP awards accrued has increased by £nil (2021: £479,444, 2020: £803,472), which will become payable in future periods.
There were no directors who were members of a defined benefit pension scheme or a defined contribution scheme during the years ended 31 March 2022, 2021 and 2020.
LTIP cash payments received by directors during the year ended 31 March 2022 were £686,000 (2021: £421,000, 2020: £nil).
Average employee numbers for the year ended 31 March 2021 Non-agency Agency Total
Manufacturing 18,231 754 18,985Research and development 8,158 556 8,714Other 9,527 317 9,844Total employee numbers 35,916 1,627 37,543
Year ended 31 March (£ millions) Note 2022 2021 2020
Stores, spare parts and tools 86 88 112Freight cost 485 499 611Works, operations and other costs 1,722 1,714 2,471Repairs 28 23 38Power and fuel 158 72 87Rent, rates and other taxes 37 31 32Insurance 23 19 23Write-down of property, plant and equipment 18 3 - -Write-down of intangible assets 19 9 40 -Product warranty 748 706 1,131Publicity 402 397 733Total other expenses 3,701 3,589 5,238
10 Other expenses
Year ended 31 March (£ millions) 2022 2021 2020
Total engineering costs incurred 1,294 1,216 1,790Engineering costs expensed (839) (489) (421)Engineering costs capitalised 455 727 1,369Interest capitalised in engineering costs capitalised 41 88 105Research and development grants capitalised (39) (46) (48)Total internally developed intangible additions 457 769 1,426
11 Engineering costs capitalised
Engineering costs capitalised of £455 million (2021 : £727 million, 2020: £1,369 million) comprises £236 million (2021: £345 million, 2020: £471 million) included in “Employee costs” and £219 million (2021: £382 million, 2020: £898 million) included in “Other expenses” in the consolidated income statement.
During the year ended 31 March 2022, £73 million (2021: £87 million, 2020: £102 million) was recognised by a UK subsidiary
as a Research and Development Expenditure Credit (“RDEC”) incentive on qualifying expenditure. During the year ended 31 March 2022, £39 million (2021: £46 million, 2020: £47 million) of the RDEC – the proportion relating to capitalised product development expenditure and other intangible assets – has been offset against the cost of the respective assets. The remaining £34 million (2021: £41 million, 2020: £55 million) of the RDEC has been recognised as “Other income”.
Year ended 31 March (£ millions) 2022 2021 2020
Finance income 9 11 52Total finance income 9 11 52Interest expense on lease liabilities (45) (44) (45)Total interest expense on financial liabilities other than lease liabilities measured at amortised cost (365) (296) (250)
Interest income on derivatives designated as a fair value hedge of financial liabilities 7 7 3
Unwind of discount on provisions (10) (16) (31)Interest capitalised 44 98 114Total finance expense (net) (369) (251) (209)
12 Finance income and expense
The capitalisation rate used to calculate borrowing costs eligible for capitalisation was 4.6 per cent (2021: 4.3 per cent, 2020: 4.2 per cent).
During the year ended 31 March 2022 the Group issued no debt at a premium (2021: no debt issued at a premium, 2020: one tranche of debt issued at a premium of £9 million).

87
FINANCIAL STATEMENTS
Annual Report 2021/22 J A G U A R L A N D R O V E R A U T O M O T I V E P L C
Year ended 31 March (£ millions) 2022 2021 2020
Fees payable to the Company's auditor and its associates for the audit of the parent company and consolidated financial statements 0.1 0.1 0.1
Fees payable to the Company's auditor and its associates for other services:
- Audit of the Company's subsidiaries 4.2 4.5 5.6 Total audit fees 4.3 4.6 5.7Audit-related assurance services 0.8 0.8 0.8 Other assurance services 0.3 0.4 0.3 Total non-audit fees 1 .1 1.2 1.1 Total audit and related fees 5.4 5.8 6.8
14 Taxation
Year ended 31 March (£ millions) 2022 2021 2020
Foreign exchange loss/(gain) and fair value adjustments on loans 141 (314) 135 Foreign exchange (gain)/loss on economic hedges of loans (91) 143 (29)Foreign exchange gain on derivatives - (14) (15)Foreign exchange (gain)/loss on balance sheet, cash and deposits revaluation (11) (64) 50 Other foreign exchange (gain)/loss (43) 57 (8)Realised gain on commodities (84) - (5)Unrealised (gain)/loss on commodities (48) (137) 78 Fair value (gain)/loss on equity investments (4) (2) 43 Depreciation of right-of-use assets 87 94 92 Depreciation of property, plant and equipment 863 898 929 Amortisation of intangible assets (excluding internally generated development costs) 76 88 101 Amortisation of internally generated development costs 918 896 788 Expenses related to short-term leases 10 9 13 Expenses related to low-value assets, excluding short-term leases of low-value assets 9 7 7
Charge/(credit) for changes in lease payments arising from COVID-19 rent conces-sions 1 (3) -
(Profit)/loss on disposal of property, plant, equipment and software (1) (1) 20 Exceptional items 43 1,523 29 Auditor remuneration (see below) 5 6 7
13 Loss before tax
Expense/(income) in loss before tax includes the following:
The following table sets out the auditor remuneration for the year (rounded to the nearest £0.1 million):
Income tax expense comprises current and deferred taxes. Income tax expense is recognised in the consolidated income statement, except when related to items that are recognised outside of profit or loss (whether in other comprehensive income or directly in equity) or where related to the initial accounting for a business combination. In the case of a business combination, the tax effect is included in the accounting for the business combination. Current income taxes are determined based on respective taxable income of each taxable entity and tax rules applicable for respective tax jurisdictions.
Deferred tax assets and liabilities are recognised for the future
tax consequences of temporary differences between the carrying values of assets and liabilities and their respective tax bases, and unutilised business loss and depreciation carry-forwards and tax credits. Such deferred tax assets and liabilities are computed separately for each taxable entity and for each taxable jurisdiction. Deferred tax assets are recognised to the extent that it is probable that future taxable income will be available against which the deductible temporary differences, unused tax losses, depreciation carry-forwards and unused tax credits could be utilised. The carrying amount of deferred tax assets is reviewed at each reporting date and reduced to the extent that it is no longer probable that sufficient taxable profits
Year ended 31 March (£ millions) 2022 2021 2020
Current tax expenseCurrent year 226 155 178
Adjustments for prior years (5) 2 3
Current tax expense 221 157 181
Deferred tax expense/(credit)Origination and reversal of temporary differences 149 92 (164)Adjustments for prior years (3) (12) (11)Write-down of deferred tax assets - - (8)
Rate changes - 2 49
Deferred tax expense/(credit) 146 82 (134)Total income tax expense 367 239 47
Amounts recognised in the consolidated income statement:
Deferred tax assets and liabilities are measured based on the tax rates that are expected to apply in the year when the asset is realised or the liability is settled, based on the tax rates and tax laws that have been enacted or substantively enacted by the balance sheet date.
Current and deferred tax assets and liabilities are offset when there is a legally enforceable right to set off current tax assets against current tax liabilities and when they relate to income taxes levied by the same taxation authority and the Group intends to settle its current tax assets and liabilities on a net basis.
The extent to which deferred tax assets can be recognised is based on an assessment of the probability that future taxable income will be available against which the deductible temporary differences and tax loss carry-forwards can be utilised.
Tax provisions are recognised for uncertain tax positions where a risk of an additional tax liability has been identified and it is probable that the Group will be required to settle that tax. Measurement is dependent on management’s expectations of the outcome of decisions by tax authorities in the various tax jurisdictions in which the Group operates. This is assessed on a case-by-case basis using in-house experts, professional firms and previous experience. Where no provision is required the exposure is disclosed as a contingent liability in note 33 unless the likelihood of an outflow of economic benefits is remote.
Judgement is required in assessing the impact of any legal or economic limits or uncertainties in various tax jurisdictions.

89
FINANCIAL STATEMENTS
Annual Report 2021/22 J A G U A R L A N D R O V E R A U T O M O T I V E P L C
Amounts recognised in the consolidated statement of other comprehensive income:
Year ended 31 March (£ millions) 2022 2021 2020
Deferred tax expense/(credit) on actuarial gains/losses on retirement benefits 134 (143) 186
Deferred tax (credit)/expense on change in fair value of cash flow hedges (170) 103 58
Deferred tax credit on rate changes (77) - (32)
(113) (40) 212Total tax expense 254 199 259
Reconciliation of effective tax rate:
Year ended 31 March (£ millions) 2022 2021 2020
Loss for the year (822) (1,100) (469)
Total income tax expense 367 239 47
Loss before tax (455) (861) (422)Income tax credit using the tax rates applicable to individual entities of 4.4% (2021: 15.2%, 2020: 14.0%) (20) (131) (59)
Non-deductible expenses 33 62 28
Unrecognised or written-down deferred tax assets 331 285 9
Changes in tax rates - 2 49
Overseas unremitted earnings 28 23 6
Tax on share of profit of equity accounted investments 3 8 22
Over provided in prior years (8) (10) (8)
Total income tax expense 367 239 47
The net underlying statutory tax rate represents the blended average of the tax rates suffered on profits and losses earned in our various countries of operation. The current position reflects the fact that statutory tax rates applicable in profitable non-UK subsidiaries are higher than the UK tax rate applied to UK losses.
Included within “Unrecognised or written-down deferred tax assets” for the year ended 31 March 2022 is a charge of £331 million as a result of the inability to fully recognise UK deferred tax assets arising in the year. The “Over provided in prior years” credit of £8 million arises as a result of the finalisation of prior year tax submissions with global tax authorities and the conclusion of certain tax risks.
Included within “Non-deductible expenses” for the year ended 31 March 2021 is a charge of £45 million relating to the
accounting write-down of assets not qualifying for tax relief. The charge of £285 million in relation to “Unrecognised or written-down deferred tax assets” arises as a result of the inability to fully recognise UK deferred tax assets arising in the year. The “Over provided in prior years” credit of £10 million arises as a result of the finalisation of prior year tax submissions with global tax authorities.
Included within “Over provided in prior years” for the year ended 31 March 2020 is £7 million credit relating to revisions of prior year estimates of tax positions in various jurisdictions, principally the UK, to bring them into line with the latest estimates and currently filed tax positions. Included within “Changes in tax rates” is a £49 million charge for the impact of the change in the UK Statutory rate from 17 per cent to 19 per cent on deferred tax assets and liabilities.
Impact of Future Rate Changes
The UK Finance Act 2016 was enacted during the year ended 31 March 2017, which included provisions for a reduction in the UK corporation tax rate to 17 per cent with effect from 1 April 2020.
Subsequently a change to the main UK corporation tax rate, announced in the Budget on 11 March 2020, was substantively enacted for IFRS purposes on 17 March 2020. The rate applicable from 1 April 2020 now remains at 19 per cent, rather than the previously enacted reduction to 17 per cent. A further change to the main UK corporation tax rate from 19 to 25 percent with effect from 1 April 2023 was announced in the Budget on 3
March 2021, and was substantively enacted on 24 May 2021.
Accordingly, UK deferred tax has been provided at a rate of 25 per cent on assets (2021, 2020: 19 per cent) and 25 per cent on liabilities (2021, 2020: 19 per cent), recognising the applicable tax rate at the point when the timing difference is expected to reverse.
Deferred tax assets and liabilities
Significant components of deferred tax assets and liabilities for the year ended 31 March 2022 are as follows:
(£ millions) Opening balance
Recognised in profit or
loss
Recognised in other
comprehen-sive income
Reclassified from other
equity reser-ves
Foreign exchange
Closing balance
Deferred tax assetsProperty, plant & equipment 767 321 - - - 1,088Expenses deductible in future periods 260 (43) - - 11 228Derivative financial instruments (24) (28) 205 (28) - 125Retirement benefits 72 20 (92) - - -Unrealised profit in inventory 103 (30) - - - 73Tax loss 65 (46) - - - 19Other 51 (51) - - - -Total deferred tax asset 1,294 143 113 (28) 11 1,533Deferred tax liabilitiesIntangible assets 902 188 - - - 1,090Overseas unremitted earnings 111 (6) - - - 105Compensated absence and retirement benefits - 107 - - - 107
Total deferred tax liability 1,013 289 - - - 1,302Presented as deferred tax asset* 397 336Presented as deferred tax liability* (116) (105)
*For balance sheet presentation purposes, deferred tax assets and deferred tax liabilities are offset to the extent that they relate to the same taxa-tion authority and are expected to be settled on a net basis.
At 31 March 2022, deferred tax assets of £336 million (2021: £397 million, 2020: £523 million) have been recognised in relation to deductible temporary differences, including unused tax losses, on the basis that it is probable that future taxable profits will be available against which those deductible temporary differences can be utilised.
At 31 March 2022 the group had unused tax losses and other temporary differences amounting to £3,746 million (2021: £2,693 million, 2020: £1,660 million) for which no deferred tax asset has been recognised on the basis of forecast profitability of the companies in which the deferred tax assets arise. These tax losses are due to expire as follows:
As at 31 March (£ millions) 2022 2021 2020
No expiry 3,742 2,676 1,645
2027 or later 4 17 15

91
FINANCIAL STATEMENTS
Annual Report 2021/22 J A G U A R L A N D R O V E R A U T O M O T I V E P L C
All deferred tax assets and deferred tax liabilities at 31 March 2022, 2021 and 2020 are presented as non-current.
Significant components of deferred tax assets and liabilities for the year ended 31 March 2021 were as follows:
*For balance sheet presentation purposes, deferred tax assets and deferred tax liabilities are offset to the extent that they relate to the same taxa-tion authority and are expected to be settled on a net basis.
Significant components of deferred tax assets and liabilities for the year ended 31 March 2020 were as follows:
*For balance sheet presentation purposes, deferred tax assets and deferred tax liabilities are offset to the extent that they relate to the same taxa-tion authority and are expected to be settled on a net basis.
(£ millions) Opening balance
Adjustment on initial
application of IFRS 16
Adjusted Opening balance
Recognised in profit or
loss
Recognised in other
comprehen-sive income
Reclassified from other
equity reservesForeign
exchangeClosing balance
Deferred tax assetsProperty, plant & equipment 544 3 547 87 - - 1 635Expenses deductible in future periods
325 - 325 51 - - 1 377
Derivative financial instruments 134 - 134 (14) (56) 6 - 70Retirement benefits 113 - 113 (32) (155) - - (74)Unrealised profit in inventory 120 - 120 6 (1) - - 125Tax loss 78 - 78 141 - - - 219Other 126 - 126 19 - - - 145Total deferred tax asset 1,440 3 1,443 258 (212) 6 2 1,497Deferred tax liabilitiesIntangible assets 928 - 928 115 - - - 1,043Overseas unremitted earnings 101 - 101 9 - - - 110Total deferred tax liability 1,029 - 1,029 124 - - - 1,153Presented as deferred tax asset* 512 523Presented as deferred tax liability*
(101) (179)
(£ millions) Opening balance
Recognised in profit or
loss
Recognised in other
comprehensive income
Reclassified from other
equity reservesForeign
exchangeClosing balance
Deferred tax assetsProperty, plant & equipment 635 132 - - - 767Expenses deductible in future periods 377 (100) - - (17) 260Derivative financial instruments 70 12 (103) (3) - (24)Retirement benefits (74) 3 143 - - 72Unrealised profit in inventory 125 (22) - - - 103Tax loss 219 (153) - - (1) 65Other 145 (94) - - - 51Total deferred tax asset 1,497 (222) 40 (3) (18) 1,294Deferred tax liabilitiesIntangible assets 1,043 (141) - - - 902Overseas unremitted earnings 110 1 - - - 111Total deferred tax liability 1,153 (140) - - - 1,013Presented as deferred tax asset* 523 397Presented as deferred tax liability* (179) (116)
15 Investments in equity accounted investees
An interest in an associate or joint venture is accounted for using the equity method from the date the investee becomes an associate or a joint venture and is recognised initially at cost. The carrying value of investment in associates and joint ventures includes goodwill identified on date of acquisition, net of any accumulated impairment losses. The consolidated financial statements include the Group’s share of profits or losses, other comprehensive income and equity movements of equity accounted investments, from the date that joint control or significant influence commences until the date that joint control or significant influence ceases. When the Group’s share of losses exceeds its interest in an equity accounted investment, the carrying amount of that interest (including any long-term interests in the nature of net investments) is reduced to nil and the recognition of further losses is discontinued except to the extent that the Group has incurred constructive or legal obligations or has made payments on behalf of the investee.
When the Group transacts with a joint venture or associate of the Group, profits and losses are eliminated to the extent of the Group’s interest in its joint venture or associate.
Dividends are recognised when the right to receive payment is established.
Impairment of equity accounted investments
The requirements of IAS 28 Investments in Associates and Joint ventures are applied to determine whether it is necessary to recognise any impairment loss with respect to the Group’s investment in a joint venture or an associate. When necessary, the entire carrying amount of the investment (including goodwill) is tested for impairment in accordance with IAS 36 Impairment of assets as a single asset by comparing its recoverable amount (the higher of value in use and fair value less costs of disposal) with its carrying amount. Any impairment loss recognised forms part of the carrying amount of the investment. Any reversal of that impairment loss is recognised in accordance with IAS 36 to the extent that the recoverable amount of the investment subsequently increases.
(A) Associates
Details of the Group’s associates as at 31 March 2022 are as follows:
Name of investment
Proportion of voting rights
Principal place of business and
country of incorporation
Principal activity Registered office address
Jaguar Cars Finance Limited 49.9% England & Wales Non-trading 280 Bishopsgate, London, EC2M 4RB,
England
Synaptiv Limited 33.3% England & Wales Business and domestic software development
84 Kirkland Avenue, Ilford, Essex, England, IG5 0TN
Driveclubservice Pte. Limited 25.1% Singapore
Holding company and mobility application
owner/licensor
22 Sin Ming Lane, #06-76, Midview City, Singapore 573969
Driveclub Limited 25.8% Hong Kong Vehicle leasing Unit A, 9/F, D2 Place ONE, 9 Cheung Yee Street, Lai Chi Kok, Kowloon, Hong Kong
ARC V Limited 15.0% England & Wales
Manufacture and development of
electrified vehicle technology
The Priory Barn Priory Road, Wolston, Coventry, United Kingdom, CV8 3FX

93
FINANCIAL STATEMENTS
Annual Report 2021/22 J A G U A R L A N D R O V E R A U T O M O T I V E P L C
As at 31 March (£ millions) 2022 2021 2020
Carrying amount of the Group's interests in associates - - -
Except for Driveclub Limited and ARC V Limited, the proportion of voting rights disclosed in the table above is the same as the Group’s interest in the ordinary share capital of each undertaking.
The Group has no material associates as at 31 March 2022.
The aggregate summarised financial information in respect of Group’s immaterial associates that are accounted for using the equity method is set out below.
Year ended 31 March (£ millions) 2022 2021 2020Group’s share of loss and total comprehensive expense in associates - - (2)
(B) Joint ventures
Name of investment
Proportion of voting rights
Principal place of business and
country of incorporation
Principal activity Registered office address
Chery Jaguar Land Rover Automotive Company Ltd.
50.0% ChinaManufacture
and assembly of vehicles
Room 1102, BinjiangInternational Plaza, No
88 Tonggang Road,Changshu Economic and Technical
Development Zone, Suzhou City,Jiangsu Province, China
A reconciliation of the summarised financial information to the carrying amount of the Group’s material joint venture recognised in the consolidated balance sheet is given below:
Chery Jaguar Land Rover Automotive Company Ltd. is a limited liability company whose legal form confirms separation between the parties to the joint arrangement. There is no contractual arrangement or any other facts or circumstances that indicate that the parties to the joint control of the arrangement have rights to the assets or obligations for the liabilities relating to the arrangement. Accordingly, Chery Jaguar Land Rover Automotive Company Ltd. is classified as a joint venture. Chery Jaguar Land Rover Automotive Company Ltd. is not publicly listed.
The joint venture is accounted for using the equity method and is a private company and there are no quoted market prices available for its shares. The following tables sets out the summarised financial information of the Group’s individually material joint venture, Chery Jaguar Land Rover Automotive Company Ltd., after adjusting for material differences in accounting policies:
As at 31 March (£ millions) 2022 2021 2020
Cash and cash equivalents 391 323 278
Current financial liabilities (excluding trade and other payables and provisions) (447) (501) (584)
Non-current financial liabilities (excluding trade and other payables and provisions) (39) (5) (82)
Current assets 629 566 599
Current liabilities (1,380) (1,364) (1,348)
Non-current assets 1,443 1,446 1,570
Non-current liabilities (42) (13) (82)
Net assets of material joint venture 650 635 739
Year ended 31 March (£ millions) 2022 2021 2020
Revenue 1,669 1,820 1,295
Loss for the year (36) (83) (224)
Total comprehensive expense (36) (83) (224)The above total comprehensive expense includes the following:
Depreciation and amortisation (181) (201) (201)
Interest income 5 7 14
Interest expense (net) (17) (20) (25)
Income tax credit 20 31 56
As at 31 March (£ millions) 2022 2021 2020
Net assets of material joint venture 650 635 739
Share of net assets of material joint venture 325 318 370
Other consolidation adjustments (5) (3) (8)
Carrying amount of the Group's material joint venture 320 315 362
As at 31 March 2022, an adjustment of £5 million (2021: £3 million, 2020: £8 million) has been made to derecognise profit that has not yet been realised on goods sold by the Group to Chery Jaguar Land Rover Automotive Company Ltd..
During the year ended 31 March 2022, the Group received a dividend from Chery Jaguar Land Rover Automotive Company
Ltd. of £nil (2021: £nil, 2020: £67 million).
During the year ended 31 March 2022, the Group increased its investment in Chery Jaguar Land Rover Automotive Company Ltd. by £nil (2021: £nil, 2020: £67 million).
Details of the Group’s material joint venture as at 31 March 2022 are as follows:

95
FINANCIAL STATEMENTS
Annual Report 2021/22 J A G U A R L A N D R O V E R A U T O M O T I V E P L C
(C) Summary of carrying amount of the Group’s investment in equity accounted investees
As at 31 March (£ millions) 2022 2021 2020
Carrying amount of material joint venture 320 315 362
Carrying amount of immaterial joint ventures 1 1 -
Carrying amount of immaterial associates - - -
Carrying amount of the Group's interests in equity accounted investees 321 316 362
Year ended 31 March (£ millions) 2022 2021 2020
Share of loss of material joint venture (18) (41) (112)
Share of loss of immaterial joint ventures - - -
Share of loss of immaterial associates - - (2)
Share of loss of equity accounted investees (18) (41) (114)
Year ended 31 March (£ millions) 2022 2021 2020
Currency translation differences – material joint venture 26 (11) 1
Share of other comprehensive income/(expense) of equity accounted investees 26 (11) 1
Name of investment
Proportion of voting rights
Principal place of business and
country of incorporation
Principal activity Registered office address
Jaguar Land Rover Switzerland Ltd 30.0% Switzerland Vehicle sales and
distributionEmil Frey Strasse, 5745 Safenwill
Inchcape JLR Europe Limited 30.0% UK Vehicle distribution 22a St James’s Square, London, United
Kingdom, SW1Y 5LP
Details of the Group’s immaterial joint ventures as at 31 March 2022 are as follows:
As at 31 March (£ millions) 2022 2021 2020Carrying amount of the Group’s interests in immaterial joint ventures 1 1 -
As at 31 March (£ millions) 2022 2021 2020Group’s share of loss and total comprehensive expense of immaterial joint ventures - - -
The summarised financial information in respect of the Group’s immaterial joint ventures accounted for using the equity method is set out below: During the year ended 31 March 2022, the Group invested £4
million (2021: £4 million, 2020: £11 million) in other investments. A fair value gain of £4 million was recognised during the year (2021: gain of £2 million, 2020: loss of £1 million).
The Group has no additional rights or influence over any of these equity investments other than the voting rights attached to the
ordinary share capital, and during the year ended 31 March 2022 no dividends were received (2021, 2020: no dividends).
Disclosure of the valuation techniques applied in calculating the fair value of these other non-equity accounted investments is included in note 35(A).
As at 31 March (£ millions) 2022 2021 2020
Investment in Lyft Inc - - 17
Other investments 30 22 20
Total 30 22 37
As at 31 March (£ millions) 2022 2021 2020
Non-current
Restricted cash 10 8 7
Derivative financial instruments 98 249 142
Warranty reimbursement and other receivables 63 73 102
Other 14 11 6
Total non-current other financial assets 185 341 257
Current
Restricted cash 13 12 12
Derivative financial instruments 185 281 241
Warranty reimbursement and other receivables 72 70 87
Accrued income 39 26 14
Other 85 88 29
Total current other financial assets 394 477 383
17 Other financial assets
Other financial assets pledged as collateral against borrowings are disclosed in note 25.
16 Other non-current investments
The Group’s other investments comprise equity investments of 10 per cent or less of the ordinary share capital of the investee
companies and are designated as fair value through profit and loss financial instruments.

97
FINANCIAL STATEMENTS
Annual Report 2021/22 J A G U A R L A N D R O V E R A U T O M O T I V E P L C
18 Property, plant and equipment
Property, plant and equipment is stated at cost of acquisition or construction less accumulated depreciation and accumulated impairment, if any. Land is not depreciated.
Cost includes purchase price, non-recoverable taxes and duties, labour cost and direct overheads for self-constructed assets and other direct costs incurred up to the date the asset is ready for its intended use.
Interest cost incurred for constructed assets is capitalised up to the date the asset is ready for its intended use, based on borrowings incurred specifically for financing the asset or the weighted average rate of all other borrowings, if no specific borrowings have been incurred for the asset.
Depreciation is charged on a straight-line basis over the estimated useful lives of the assets. Estimated useful lives of the assets are as follows:
The depreciation period for property, plant and equipment with finite useful lives is reviewed at least at each year end. Changes in expected useful lives are treated as changes in accounting estimates.
Assets held under leases are depreciated over their expected useful lives on the same basis as owned assets or, where shorter, the term of the relevant lease. Freehold land is measured at cost and is not depreciated. Residual values are reassessed on an annual basis.
Depreciation is not recorded on assets under construction until construction and installation are complete and the asset is ready
for its intended use. Assets under construction include capital advances. Depreciation is not recorded on heritage assets as the Group considers their residual value to approximate their cost.
An item of property, plant and equipment is derecognised on disposal or when it is withdrawn from use and no future economic benefits are expected from its disposal. Any gain or loss arising from derecognition is included in profit or loss.
An annual review of the carrying value of heritage assets is performed as the assets are held at cost and not depreciated. Any write-down in the carrying value of heritage assets is recognised immediately in the consolidated income statement.
Class of property, plant and equipment Estimated useful life (years)
Buildings 20 to 40
Plant, equipment and leased assets 3 to 30
Vehicles 3 to 10
Computers 3 to 6
Fixtures and fittings 3 to 20
(£ millions) Land and buildings
Plant and equip-
mentVehicles Compu-
tersFixtu-
res and fittings
Leased assets
Heritage vehicles
Under construc-
tionTotal
CostBalance at 1 April 2019 2,261 8,765 9 164 125 32 54 706 12,116Adjustment on initial application of IFRS 16
(9) - - - - (32) - - (41)
Adjusted opening balance 2,252 8,765 9 164 125 - 54 706 12,075Additions - - 8 26 12 - - 1,218 1,264Assets acquired on acqui-sition
1 - - - - - - - 1
Transfers 285 895 - - - - - (1,180) -Disposals - (20) (1) (2) (2) - (1) (11) (37)Foreign currency translation 18 19 - 1 - - - (1) 37Balance at 31 March 2020 2,556 9,659 16 189 135 - 53 732 13,340Additions - - 6 - 2 - - 828 836Transfers 27 606 - - - - - (633) -Disposals (5) (15) (3) (1) (3) - (4) - (31)Impairment - asset write-downs
- - - - - - - (237) (237)
Foreign currency translation (22) (28) - (1) (1) - - 1 (51)Balance at 31 March 2021 2,556 10,222 19 187 133 - 49 691 13,857Additions 1 - - 12 11 - - 657 681Transfers 52 1,057 1 - - - - (1,110) -Disposals (1) (84) (4) (5) (8) - (1) - (103)Impairment - asset write-downs
- - - - - - - (7) (7)
Assets classified as held for sale
(8) - - - - - (2) - (10)
Foreign currency translation - 1 (1) - (2) - - - (2)Balance at 31 March 2022 2,600 11,196 15 194 134 - 46 231 14,416Depreciation and impair-mentBalance at 1 April 2019 287 5,135 5 81 71 14 31 - 5,624Adjustment on initial appli-cation of IFRS 16
- - - - - (14) - - (14)
Adjusted opening balance 287 5,135 5 81 71 - 31 - 5,610Depreciation charge for the year
112 792 2 14 9 - - - 929
Disposals - (14) - (1) (1) - - - (16)Foreign currency translation 2 1 - - - - - - 3Balance at 31 March 2020 401 5,914 7 94 79 - 31 - 6,526Depreciation charge for the year
110 761 4 15 8 - - - 898
Disposals (3) (15) (2) (1) (3) - - - (24)Impairment - asset write-downs
4 2 - - - - - - 6
Foreign currency translation (2) (5) - (2) (1) - - - (10)Balance at 31 March 2021 510 6,657 9 106 83 - 31 - 7,396Depreciation charge for the year
111 728 2 14 8 - - - 863
Disposals (1) (84) (1) (5) (6) - - - (97)Assets classified as held for sale
(6) - - - - - - - (6)
Impairment - asset write-downs
- - - - - - 3 - 3
Foreign currency translation - - - 2 2 - - - 4Balance at 31 March 2022 614 7,301 10 117 87 - 34 - 8,163Net book valueAt 31 March 2020 2,155 3,745 9 95 56 - 22 732 6,814At 31 March 2021 2,046 3,565 10 81 50 - 18 691 6,461At 31 March 2022 1,986 3,895 5 77 47 - 12 231 6,253
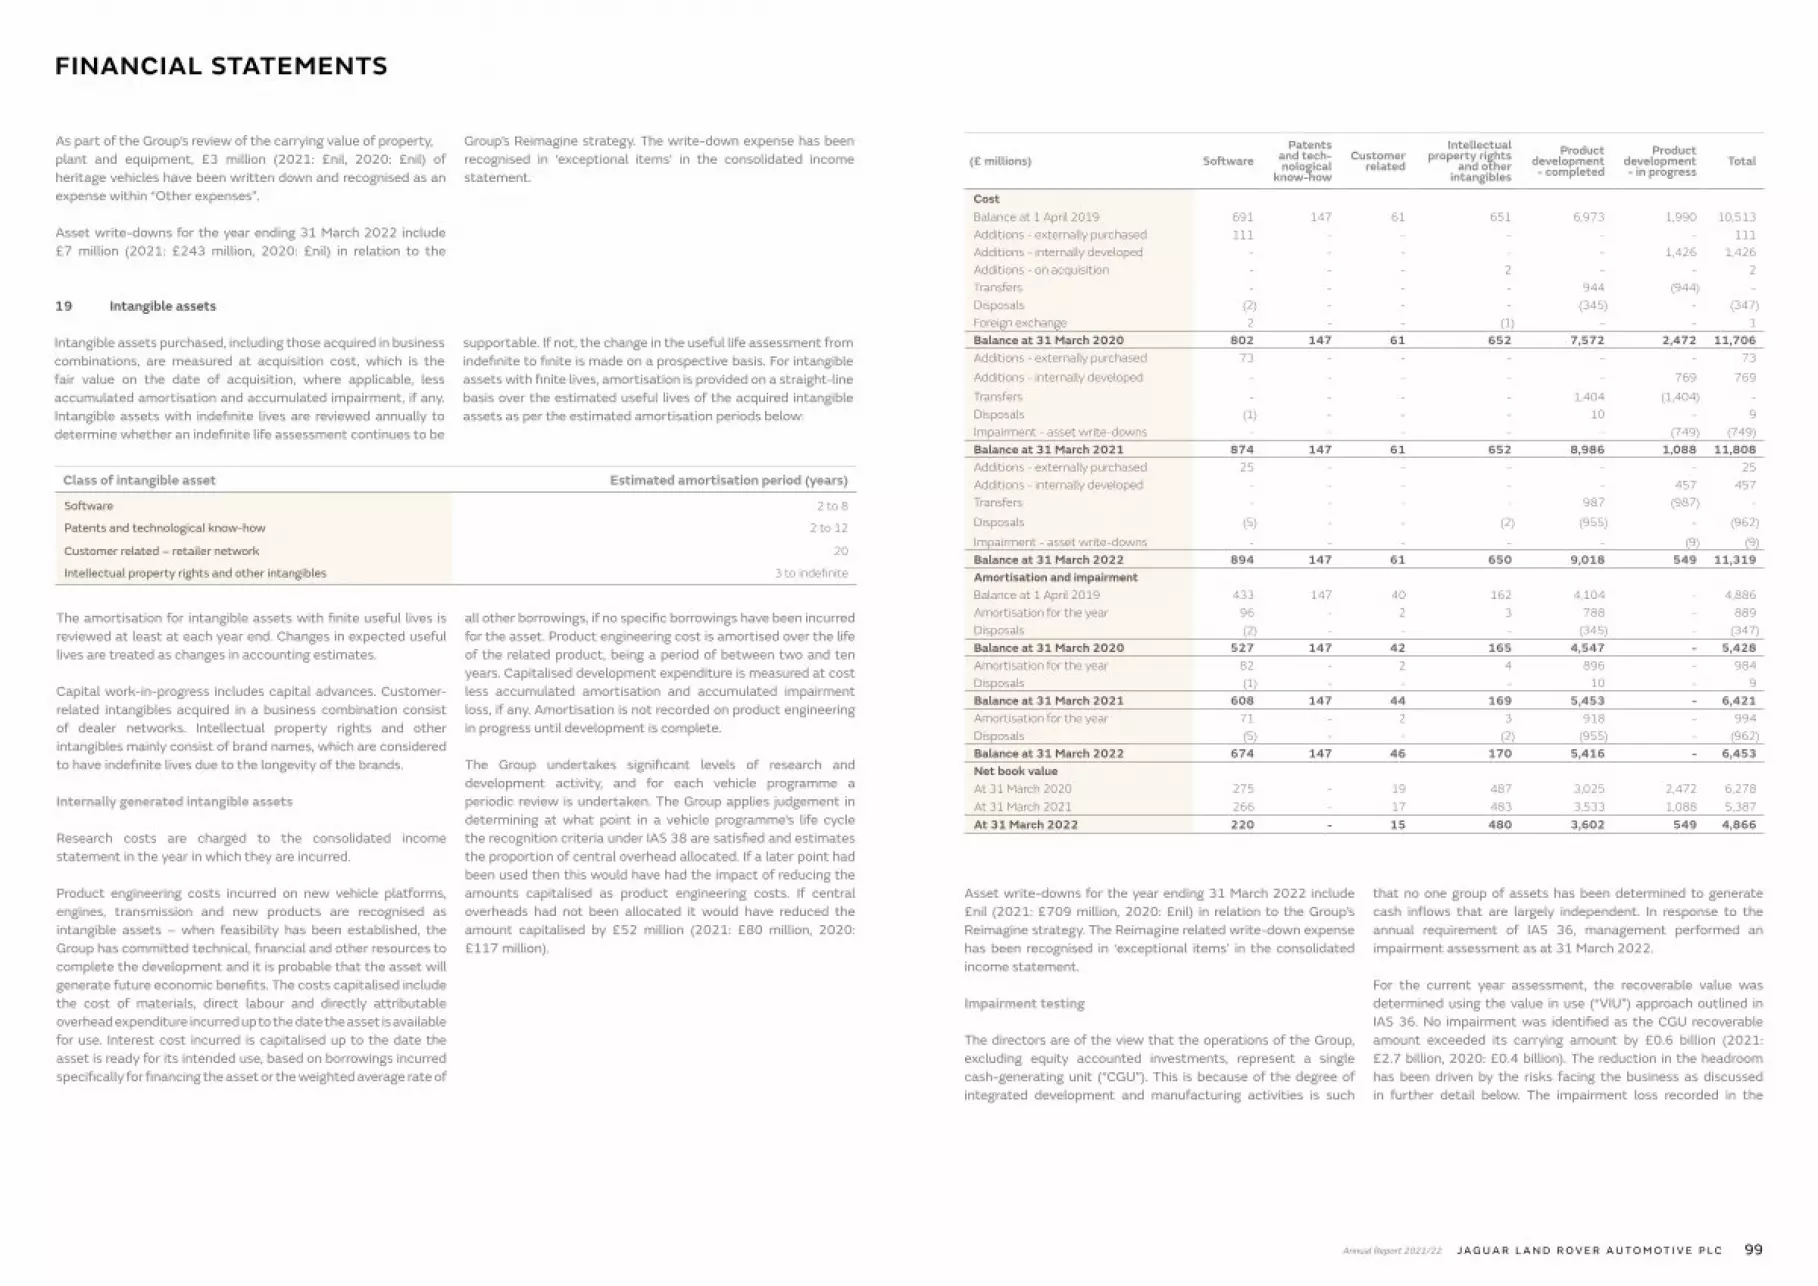
99
FINANCIAL STATEMENTS
Annual Report 2021/22 J A G U A R L A N D R O V E R A U T O M O T I V E P L C
As part of the Group’s review of the carrying value of property,plant and equipment, £3 million (2021: £nil, 2020: £nil) of heritage vehicles have been written down and recognised as an expense within “Other expenses”.
Asset write-downs for the year ending 31 March 2022 include £7 million (2021: £243 million, 2020: £nil) in relation to the
Group’s Reimagine strategy. The write-down expense has been recognised in ‘exceptional items’ in the consolidated income statement.
19 Intangible assets
Intangible assets purchased, including those acquired in business combinations, are measured at acquisition cost, which is the fair value on the date of acquisition, where applicable, less accumulated amortisation and accumulated impairment, if any. Intangible assets with indefinite lives are reviewed annually to determine whether an indefinite life assessment continues to be
supportable. If not, the change in the useful life assessment from indefinite to finite is made on a prospective basis. For intangible assets with finite lives, amortisation is provided on a straight-line basis over the estimated useful lives of the acquired intangible assets as per the estimated amortisation periods below:
Class of intangible asset Estimated amortisation period (years)
Software 2 to 8
Patents and technological know-how 2 to 12
Customer related – retailer network 20
Intellectual property rights and other intangibles 3 to indefinite
The amortisation for intangible assets with finite useful lives is reviewed at least at each year end. Changes in expected useful lives are treated as changes in accounting estimates.
Capital work-in-progress includes capital advances. Customer-related intangibles acquired in a business combination consist of dealer networks. Intellectual property rights and other intangibles mainly consist of brand names, which are considered to have indefinite lives due to the longevity of the brands.
Internally generated intangible assets
Research costs are charged to the consolidated income statement in the year in which they are incurred.
Product engineering costs incurred on new vehicle platforms, engines, transmission and new products are recognised as intangible assets – when feasibility has been established, the Group has committed technical, financial and other resources to complete the development and it is probable that the asset will generate future economic benefits. The costs capitalised include the cost of materials, direct labour and directly attributable overhead expenditure incurred up to the date the asset is available for use. Interest cost incurred is capitalised up to the date the asset is ready for its intended use, based on borrowings incurred specifically for financing the asset or the weighted average rate of
all other borrowings, if no specific borrowings have been incurred for the asset. Product engineering cost is amortised over the life of the related product, being a period of between two and ten years. Capitalised development expenditure is measured at cost less accumulated amortisation and accumulated impairment loss, if any. Amortisation is not recorded on product engineering in progress until development is complete.
The Group undertakes significant levels of research and development activity, and for each vehicle programme a periodic review is undertaken. The Group applies judgement in determining at what point in a vehicle programme’s life cycle the recognition criteria under IAS 38 are satisfied and estimates the proportion of central overhead allocated. If a later point had been used then this would have had the impact of reducing the amounts capitalised as product engineering costs. If central overheads had not been allocated it would have reduced the amount capitalised by £52 million (2021: £80 million, 2020: £117 million).
(£ millions) SoftwarePatents
and tech-nological
know-how
Customerrelated
Intellectual property rights
and other intangibles
Product development - completed
Product development - in progress
Total
CostBalance at 1 April 2019 691 147 61 651 6,973 1,990 10,513Additions - externally purchased 111 - - - - - 111Additions - internally developed - - - - - 1,426 1,426Additions - on acquisition - - - 2 - - 2Transfers - - - - 944 (944) -Disposals (2) - - - (345) - (347)Foreign exchange 2 - - (1) - - 1Balance at 31 March 2020 802 147 61 652 7,572 2,472 11,706Additions - externally purchased 73 - - - - - 73
Additions - internally developed - - - - - 769 769
Transfers - - - - 1,404 (1,404) -Disposals (1) - - - 10 - 9Impairment - asset write-downs - - - - - (749) (749)Balance at 31 March 2021 874 147 61 652 8,986 1,088 11,808Additions - externally purchased 25 - - - - - 25Additions - internally developed - - - - - 457 457Transfers - - - - 987 (987) -
Disposals (5) - - (2) (955) - (962)
Impairment - asset write-downs - - - - - (9) (9)Balance at 31 March 2022 894 147 61 650 9,018 549 11,319Amortisation and impairmentBalance at 1 April 2019 433 147 40 162 4,104 - 4,886Amortisation for the year 96 - 2 3 788 - 889Disposals (2) - - - (345) - (347)Balance at 31 March 2020 527 147 42 165 4,547 - 5,428Amortisation for the year 82 - 2 4 896 - 984Disposals (1) - - - 10 - 9Balance at 31 March 2021 608 147 44 169 5,453 - 6,421Amortisation for the year 71 - 2 3 918 - 994Disposals (5) - - (2) (955) - (962)Balance at 31 March 2022 674 147 46 170 5,416 - 6,453Net book valueAt 31 March 2020 275 - 19 487 3,025 2,472 6,278At 31 March 2021 266 - 17 483 3,533 1,088 5,387At 31 March 2022 220 - 15 480 3,602 549 4,866
Asset write-downs for the year ending 31 March 2022 include £nil (2021: £709 million, 2020: £nil) in relation to the Group’s Reimagine strategy. The Reimagine related write-down expense has been recognised in ‘exceptional items’ in the consolidated income statement.
Impairment testing
The directors are of the view that the operations of the Group, excluding equity accounted investments, represent a single cash-generating unit (“CGU”). This is because of the degree of integrated development and manufacturing activities is such
that no one group of assets has been determined to generate cash inflows that are largely independent. In response to the annual requirement of IAS 36, management performed an impairment assessment as at 31 March 2022.
For the current year assessment, the recoverable value was determined using the value in use (“VIU”) approach outlined in IAS 36. No impairment was identified as the CGU recoverable amount exceeded its carrying amount by £0.6 billion (2021: £2.7 billion, 2020: £0.4 billion). The reduction in the headroom has been driven by the risks facing the business as discussed in further detail below. The impairment loss recorded in the

101
FINANCIAL STATEMENTS
Annual Report 2021/22 J A G U A R L A N D R O V E R A U T O M O T I V E P L C
previous years was not reversed because the underlying reasons for the increased headroom (including the unwind of the discount rate and the impact of depreciation and amortisation of impaired assets) do not support this.
The Group has considered it appropriate to undertake the impairment assessment with reference to the Group approved business plan that was in effect as at the reporting date. The business plan includes a five-year cash flow forecast and contains growth rates that are primarily a function of the Group’s Cycle Plan assumptions, historical performance and management’s expectation of future market developments through to 2026/27.
In forecasting the future cash flows, management have given due consideration to recent performance and variable profit optimisation efforts and have adjusted some of the assumptions in the business plan, in line with the requirements of IAS 36, to take into account possible variations in the amount or timing of future cashflows. In doing so, management has considered other risks, outlined on pages 36 to 39, that impact future cashflows, namely:
• near-term supply challenges related to global chip shortages which has significantly impacted the Group in FY22;
• economical and geopolitical factors increasing inflationary pressures;
• disruption on our business from Covid-19 as we continue to see localised lockdown actions imposed by governments around the world; and
• execution risks associated with our ‘Reimagine’ strategy, with its supporting transformation plan ‘Refocus’, detailed on pages 14 to 15, which includes a dedicated environmental sustainability strategy- ‘Regenerate’.
Climate risk
Consideration of climate risk is inherent in the development our forecast cash flows, principally underpinned by the transition to Battery Electric Vehicles as part of our Reimagine strategy. In executing this strategy, the Group recognises that there are risks that may result in variations to the forecast cash flows, and as such these risks have been taken into account in the execution risk adjustments noted above.
Key assumptions
The directors consider the assumptions that impact the value in use are those to which:
(i) the recoverable amount is most sensitive;
(ii) involve a significant amount of judgement and estimation; and
(iii) drive significant changes to the recoverable amount when flexed under reasonably possible outcomes.
The directors’ approach and key assumptions used to determine the Group’s CGU VIU were as follows:
• Variable profit per unit and volumes – the approach to determining the forecast variable profit per unit and volumnes is based on consideration of historical performance and Group Cycle Plan assumptions, along with the impact of risks on future cashflows discussed above. Due to the importance of product mix to the business’ cash flow and profit optimisation efforts, the directors consider variable profit per unit and volumes to be key assumptions. The variable profit per unit and volumes included in the business plan are largely driven by an updated portfolio as a result of the Reimagine strategy announced in the previous year, which especially results in a change in product portfolio in the outer years of the business plan.
• Terminal value capital expenditure – the 5-year cash flows
timing and amount are based on the latest Cycle Plan. The terminal value has been derived based on the directors best estimate of a maintenance level of capital expenditure which has been derived from depreciation and amortisation expectations and funding requirements in responses to longer-term industry trends, and risks, which are anticipated in the VIU calculation. Due to the significance of terminal value capital expenditure the directors consider this to be a key assumption.
• Discount rate – the approach to determining the discount rate is based on the Capital Asset Pricing Model and a market participant after tax cost of debt. These inputs are based on a typical build up approach. The discount rate is regarded as a key assumption as it is the rate which drives the discounted cashflows used to determine the VIU of the CGU.
The Group used a long-term growth rate of 1.7 per cent (2021, 2020: 1.9 per cent) to extrapolate cash flow projections beyond the period covered by the business plan and a pre-tax discount rate of 13.4 per cent (2021: 13.6 per cent, 2020: 12.5 per cent).
The VIU is sensitive to certain assumptions, such as Sales, General & Administration (“SG&A”) costs, due to the relative total value but involve limited judgement and estimation and significant changes are not considered reasonably possible and therefore are not considered to be key assumptions.
Sensitivity to reasonably possible changes to key assumptions
As a significant portion of the recoverable amount lies in the VIU terminal value, management have focussed disclosures on reasonably possible changes that impact the terminal value.
Given the inherent uncertainty about how risk may arise, and the interaction of volumes and cost management, management consider a net impact on terminal period cash flows to be the best means of indicating the sensitivity of the model to such changes in the terminal period.
Management considers the variable profit and volumes assumptions to be interdependent as movement in one assumption will impact the other. For example, the profit optimisation efforts discussed above will likely result in higher average variable profit per unit with lower volumes whereas a focus on volumes would likely see a reduction in the average variable profit per unit. Consequently, the terminal value variable profit sensitivity below incorporates sensitivity in volumes via the impact on variable profit.
As at 31 March 2022 2021 2020
Pre-tax discount rate 13.4% 13.6% 12.5%
Terminal value variable profit* (%GVR) 24.8% 21.4% 19.7%
Terminal value capital expenditure (%GVR) 10.0% 8.9% 9.1%
The table below shows the amount by which the value assigned to the key assumptions must change for the recoverable amount of the CGU to be equal to its carrying amount:
2022 2021 2020
As at 31 March* Revised as-sumption
% Change in assump-
tionRevised as-
sumption% Change
in assump-tion
Revised as-sumption
% Change in assump-
tion
Pre-tax discount rate 14.6% 8.4% n/a n/a n/a n/a
Terminal value variable profit (%GVR) 24.4% (1.7)% 20.1% (6.3)% 19.5% (0.9)%
Terminal value capital expenditures (%GVR) 10.3% 3.5% 10.2% 15.1% 9.3% 1.9%
The value of key assumptions used to calculate the recoverable amount are as follows:
*Based on forecast variable profit per unit and volumes

103
FINANCIAL STATEMENTS
Annual Report 2021/22 J A G U A R L A N D R O V E R A U T O M O T I V E P L C
As at 31 March (£ millions) 2022 2021 2020
Non-current
Prepaid expenses 24 17 8
Research and development credit 2 4 -
Other 9 11 15
Total non-current other assets 35 32 23
Current
Recoverable VAT 204 200 228
Prepaid expenses 208 120 139
Research and development credit 63 104 85
Other 18 24 25
Total current other assets 493 448 477
20 Other assets
21 Cash and cash equivalents
As at 31 March (£ millions) 2022 2021 2020
Cash and cash equivalents 4,223 3,778 2,271
22 Allowances for trade and other receivables
Year ended 31 March (£ millions) 2022 2021 2020
At beginning of year 7 11 12
Charged during the year 4 6 11
Receivables written off during the year as uncollectable (6) (1) (4)
Unused amounts reversed (1) (9) (8)
At end of year 4 7 11
Trade receivables with a contractual amount of £1 million (2021: £nil, 2020: £2 million) that were written off during the year are still subject to enforcement activity.
Trade receivables pledged as collateral against borrowings are disclosed in note 25.
Cash and cash equivalents comprise cash on hand, demand deposits and highly liquid investments with an original maturity of up to three months that are readily convertible into known amounts of cash and that are subject to an insignificant risk of changes in value.
23 Inventories
As at 31 March (£ millions) 2022 2021 2020
Raw materials and consumables 135 110 104
Work-in-progress 488 371 388
Finished goods 2,129 2,525 2,977
Inventory basis adjustment 29 16 (1)
Total inventories 2,781 3,022 3,468
Inventories of finished goods include £361 million (2021: £406 million, 2020: £466 million) relating to vehicles sold to rental car companies, fleet customers and others with guaranteed repurchase arrangements.
Cost of inventories (comprising the cost of purchased products and the costs of conversion) recognised as an expense during the year amounted to £12,499 million (2021: £13,917 million, 2020: £16,902 million), including material and other cost of
sales, employee costs, depreciation and production overheads recognised within other expenses.
During the year, the Group recorded an inventory write-down expense of £11 million (2021: £16 million, 2020: £28 million). The write-down is included in “Material and other cost of sales”.
Inventories pledged as collateral against borrowings are disclosed in note 25.
24 Accounts payable
As at 31 March (£ millions) 2022 2021 2020
Trade payables 3,616 4,238 3,723
Liabilities to employees 168 171 143
Liabilities for expenses 929 1,392 1,950
Capital creditors 431 507 683
Total accounts payable 5,144 6,308 6,499
Inventories are valued at the lower of cost and net realisable value. Costs of raw materials and consumables are ascertained on a first-in, first-out basis. Costs, including fixed and variable production overheads, are allocated to work-in-progress and finished goods, determined on a full absorption cost basis. Net realisable value is the estimated selling price in the ordinary course of business less estimated cost of completion and selling expenses.
Inventories include vehicles sold subject to repurchase arrangements. These vehicles are carried at cost to the Group and are amortised in changes in stocks and work-in-progress to their residual values (i.e. estimated second-hand sale value) over the term of the arrangement.
Cash and cash equivalents includes £33 million (2021, 2020: £nil) which is not available for use by the wider group.

105
FINANCIAL STATEMENTS
Annual Report 2021/22 J A G U A R L A N D R O V E R A U T O M O T I V E P L C
As at 31 March (£ millions) 2022 2021 2020
Short-term borrowings
Bank loans 599 572 -
Current portion of long-term EURO MTF listed debt 779 399 299
Current portion of long-term loans 401 235 225
Other secured - - 2
Total short-term borrowings 1,779 1,206 526
Long-term borrowings
EURO MTF listed debt 3,953 3,921 3,562
Bank loans 1,260 1,037 1,241
Other unsecured 35 14 14
Total long-term borrowings 5,248 4,972 4,817
Lease obligations 570 519 541
Total debt 7,597 6,697 5,884
25 Interest-bearing loans and borrowings
Euro MTF listed debt
The bonds are listed on the Luxembourg Stock Exchange multilateral trading facility (“EURO MTF”) market. Details of the tranches of the bonds outstanding at 31 March 2022 are as follows:
• $500 million Senior Notes due 2023 at a coupon of 5.625 per cent per annum – issued January 2013
• £400 million Senior Notes due 2023 at a coupon of 3.875 per cent per annum – issued February 2015
• €650 million Senior Notes due 2024 at a coupon of 2.200 per cent per annum – issued January 2017
• $500 million Senior Notes due 2027 at a coupon of 4.500 per cent per annum – issued October 2017
• €500 million Senior Notes due 2026 at a coupon of 4.500 per cent per annum – issued September 2018
• €500 million Senior Notes due 2024 at a coupon of 5.875 per cent per annum – issued November 2019
• €500 million Senior Notes due 2026 at a coupon of 6.875 per cent per annum – issued November 2019
• $700 million Senior Notes due 2025 at a coupon of 7.750 per cent per annum – issued October 2020
• $650 million Senior Notes due 2028 at a coupon of 5.875 per cent per annum – issued December 2020
• $500 million Senior Notes due 2029 at a coupon of 5.500 per cent per annum – issued July 2021
• €500 million Senior Notes due 2028 at a coupon of 4.500 per cent per annum – issued July 2021
Details of the tranches of the bonds repaid in the year ended 31 March 2022 are as follows:
• £400 million Senior Notes due 2022 at a coupon of 5.000 per cent per annum – issued January 2014
Details of the tranches of bonds repaid in the year ended 31 March 2021 are as follows:
• £300 million Senior Notes due 2021 at a coupon of 2.750 per cent per annum – issued January 2017
Details of the tranches of the bonds repaid in the year ended 31 March 2020 as follows:
• $500 million Senior Notes due 2019 at a coupon of 4.250 per cent per annum – issued October 2014
• $500 million Senior Notes due 2020 at a coupon of 3.500 per cent per annum – issued March 2015
Syndicated loanIn October 2018, a $1 billion syndicate loan was issued with a coupon rate of LIBOR + 1.900 per cent per annum, due in the following tranches:
• $199 million due October 2022• $798 million due January 2025
$3 million of this loan was reaid during the year ended 31 March 2022.
The contractual cash flows of interest-bearing debt (excluding leases) are set out on the next page, including estimated interest payments and assuming the debt will be repaid at the maturity date.
Factored receivables facility
During the year ended 31 March 2021, the Group extended its factored receivables facility to a $500 million facility ending March 2023. Under the terms of the facility, the Group de-recognises factored receivables in accordance with IFRS 9 as there are no recourse arrangements.
UK export finance facility
During the year ended 31 March 2020, the Group entered and drew down in full a £625 million five-year amortising loan facility backed by a £500 million guarantee from UK Export Finance. During the year ended 31 March 2022, the Group repaid £125 million (2021: £125 million, 2020: £52 million) of this loan. During the year ended 31 March 2022, the Group entered and drew down in full an additional £625 million five-year amortising loan facility. The group repaid £31 million of this additional facility in the year ended 31 March 2022 (2021, 2020: £nil). These loans include a covenant requiring the Group to maintain a minimum liquidity of £1 billion.
China borrowings
During the year ended 31 March 2021, the Group entered into a 3-year RMB 5 billion syndicated revolving loan facility subject to an annual confirmatory review. The facility is fully drawn at 31 March 2022 and is equivalent to £599 million at 31 March 2022 exchange rates. In addition the Group entered into a parts
factoring facility in China of which £nil is drawn down (2021: £19 million, 2020: £nil).
Undrawn Facilities
As at 31 March 2022, the Group has a fully undrawn revolving credit facility of £2,015 million (2021, 2020: £1,935 million). There is a reduction in the RCF facility to £1,500 million from July 2022. The facility will be available until March 2024 and includes a covenant requiring the Group to maintain a minimum liquidity of £1 billion.
The Group’s fleet buyback facility matured in December 2021 and had £3 million undrawn on this facility as at 31 March 2021 (£nil at 31 March 2020). During the year ended 31 March 2022, the Group repaid the £110 million drawn on this facility.
Collateral pledged against borrowings
Inventory of £nil (2021: £138 million, 2020: £127 million), trade receivables with a carrying amount of £nil (2021: £19 million, 2020: £nil) and other financial assets with a carrying of £13 million (2021: £13 million, 2020: £nil) are pledged as collateral/security against borrowings.
As at 31 March (£ millions) 2022 2021 2020
Due in
1 year or less 2,104 1,492 765
2nd and 3rd years 2,508 1,270 2,039
4th and 5th years 1,899 3,198 2,145
More than 5 years 1,800 1,383 1,441
Total contractual cash flows 8,311 7,343 6,390

107
FINANCIAL STATEMENTS
Annual Report 2021/22 J A G U A R L A N D R O V E R A U T O M O T I V E P L C
As at 31 March (£ millions) 2022 2021 2020
Current
Lease obligations 62 65 73
Interest accrued 95 84 65
Derivative financial instruments 445 238 453
Liability for vehicles sold under a repurchase arrange-ment 267 359 479
Other 1 - 3
Total current other financial liabilities 870 746 1,073
Non-current
Lease obligations 508 454 468
Derivative financial instruments 338 169 310
Other 25 2 -
Total non-current other financial liabilities 871 625 778
26 Other financial liabilities
27 Provisions
A provision is recognised if, as a result of a past event, the Group has a present legal or constructive obligation that can be estimated reliably, and it is probable that an outflow of economic benefits will be required to settle the obligation. When the effect of the time value of money is material, provisions are determined by discounting the expected future cash flows using a pre-tax rate that reflects current market assessments of the time value of money and the risks specific to the liability.
Provisions are held for product warranty, legal and product liabilities, residual risks, environmental liabilities, other employee benefit obligations and restructuring.
As at 31 March (£ millions) 2022 2021 2020
Current
Product warranty 604 643 731
Legal and product liability 252 198 124
Provisions for residual risk 12 24 61
Provision for environmental liability 3 3 6
Other employee benefits obligations - 10 7
Restructuring 118 283 15
Total current provisions 989 1,161 944
Non-current
Product warranty 1,026 1,042 1,155
Legal and product liability 40 71 54
Provision for residual risk 19 42 114
Provision for environmental liability 23 23 17
Other employee benefits obligations 4 10 15
Total non-current provisions 1,112 1,188 1,355
Year ended 31 March 2022 (£ millions)
Product warranty
Legal and product liability
Residual risk
Environmental liability
Other employee benefits obliga-
tionsRestructuring Total
Opening balance 1,685 269 66 26 20 283 2,349Provisions made during the year 745 259 4 3 3 82 1,096Provisions used during the year (719) (134) (1) (1) (14) (220) (1,089)Unused amounts reversed in the year (91) (105) (38) (2) (4) (23) (263)Impact of unwind of discounting 10 - - - - - 10Foreign currency translation - 3 - - (1) (4) (2)Closing balance 1,630 292 31 26 4 118 2,101
Product warranty provision
The Group provides product warranties on all new vehicle sales in respect of manufacturing defects, which become apparent in the stipulated policy period dependent on the market in which the vehicle purchase occurred. The estimated liability for product warranty is recognised when products are sold or when new warranty programmes are initiated.
Provisions are recognised for the costs of repairing manufacturing defects, recall campaigns, customer goodwill (representing the Group’s constructive obligation to its customers when managing those warranty claims) and the Group’s other obligations under the warranty.
Assumptions are made on the type and extent of future warranty claims based on experience of the frequency and extent of vehicle faults and defects historically. The estimates also include assumptions on the amounts of potential repair costs per vehicle and the effects of possible time or mileage limits and are regularly adjusted to reflect new information. The timing of outflows will vary as and when a warranty claim will arise.
The Group’s calculation methodology uses historical data corrected for experience as information becomes available as well as individual campaign assumptions (such as scope, uptake rates and repair costs). This can lead to changes in the carrying value of provisions as assumptions are updated over the life of each warranty; however there are no individual assumptions that can be reasonably expected to move over the next financial year to such a degree that it would result in a material adjustment to the warranty provision.
The discount on the warranty provision is calculated using a risk-free discount rate as the risks specific to the liability, such as inflation, are included in the base calculation.
The Group also has back-to-back contractual arrangements with its suppliers in the event that a vehicle fault is proven to be a supplier’s fault. Estimates are made of the expected reimbursement claims based upon historical levels of recoveries by supplier, adjusted for inflation and applied to the population of vehicles under warranty at the balance sheet date. Supplier reimbursement claims are presented as separate assets within “Other financial assets” in note 17. Supplier recoveries are recognised only when the Group considers there to be virtual certainty over the reimbursement, which also requires historical evidence to support.
The Group notes that changes in the automotive environment regarding the increasing impact of battery electric vehicles presents its own significant challenges, particularly due to the lack of maturity and historical data available at this time to help inform estimates for future warranty claims, as well as any associated recoveries from suppliers due to such claims. The Group offers warranties of up to eight years on batteries in electric vehicles. The related provisions are made with the Group’s best estimate at this time to settle such obligations in the future, but will be required to be continually refined as sufficient, real-world data becomes available.
Legal and product liability provision
A legal and product liability provision is maintained in respect of compliance with regulations and known litigations that impact the Group. The provision primarily relates to motor accident claims, consumer complaints, dealer terminations, employment cases, personal injury claims and compliance with emission regulations. The timing of outflows will vary as and when claims are received and settled, which is not known with certainty.
Depending on the relevant jurisdiction, the Group recognises provisions for non-compliance with legal emissions requirements. The measurement of the provision considers the sales volume in that jurisdiction and the fee or cost per the applicable legislation. The Group aims to mitigate non-compliance risk by purchasing emission credits or participation in emission pools. The associated provision is re-measured to consider any such mitigations. Included within “unused amounts reversed in the year” is £51 million related to the expected costs of compliance with emission regulations, and £42 million related to potential costs associated with the Group’s battery end-of-life obligations.
Residual risk provision
In certain markets, the Group is responsible for the residual risk arising on vehicles sold by retailers under leasing arrangements. The provision is based on the latest available market expectations of future residual value trends. The timing of the outflows will be at the end of the lease arrangements, being typically up to three years.
These assessments were performed with reference to both internal and external market inputs.

109
FINANCIAL STATEMENTS
Annual Report 2021/22 J A G U A R L A N D R O V E R A U T O M O T I V E P L C
Environmental liability provision
This provision relates to various environmental remediation costs such as asbestos removal and land clean-up. The timing of when these costs will be incurred is not known with certainty.
Other employee benefit obligations
This provision relates to the LTIP scheme for certain employees and other amounts payable to employees.
Restructuring provision
The restructuring provision includes amounts for third party obligations arising from Group restructuring programmes. This includes amounts payable to employees following the announcement of the Group’s Reimagine strategy in the year ending 31 March 2021 as well as other Group restructuring
programmes. Amounts are also included in relation to legal and constructive obligations made to third parties in connection with cancellations under the group’s Reimagine strategy.
The estimated liability for restructuring activities is recognised when the Group has reason to believe there is a legal or constructive obligation arising from restructuring actions taken. The amount provided at the reporting date is calculated based on currently available facts and certain estimates for those obligations (see note 4, Exceptional items). These estimates are established using historical experience based on the settlement costs for similar liabilities, with proxies being used where no direct comparison exists.
The amounts and timing of outflows will vary as and when restructuring obligations are progressed with third parties.
As at 31 March (£ millions) 2022 2021 2020
Current
Liabilities for advances received 122 61 50
Ongoing service obligations 286 315 324
VAT 95 122 169
Other taxes payable 161 120 148
Other 10 20 25
Total current other liabilities 674 638 716
Non-current
Ongoing service obligations 395 451 522
Other 9 10 11
Total non-current other liabilities 404 461 533
28 Other liabilities
29 Capital and reserves
As at 31 March (£ millions) 2022 2021 2020
Authorised, called up and fully paid
1,500,642,163 ordinary shares of £1 each 1,501 1,501 1,501
Total ordinary share capital 1,501 1,501 1,501
The capital redemption reserve of £167 million (2021, 2020: £167 million) was created in March 2011 on the cancellation of share capital.
The holders of ordinary shares are entitled to receive dividends as declared from time to time and are entitled to one vote per share at meetings of the Company.
30 Other reserves
The movement of reserves is as follows:
(£ millions) Translation reserve
Hedging reserve
Cost of hedging reserve
Retained earnings
Total other reserves
Balance at 1 April 2021 (357) 136 1 3,806 3,586Loss for the year - - - (818) (818)Remeasurement of defined benefit obligation - - - 707 707(Loss)/gain on effective cash flow hedges - (842) 31 - (811)Income tax related to items recognised in other comprehensive income - 197 (8) (92) 97Cash flow hedges reclassified to profit and loss - (67) (18) - (85)Income tax related to items reclassified to profit or loss - 13 3 - 16Amounts removed from hedge reserve and recognised in inventory - 134 13 - 147Income tax related to amounts removed from hedge reserve and recog-nised in inventory - (25) (3) - (28)Currency translation differences 24 - - - 24Balance at 31 March 2022 (333) (454) 19 3,603 2,835Of which:
Amounts related to continuing hedges n/a (444) 19 n/a (425)Amounts related to discontinued hedges n/a (10) - n/a (10)Balance at 1 April 2020 (316) (286) (33) 5,515 4,880Loss for the year - - - (1,101) (1,101)Remeasurement of defined benefit obligation - - - (751) (751)Gain on effective cash flow hedges - 400 37 - 437Income tax related to items recognised in other comprehensive income - (76) (6) 143 61Cash flow hedges reclassified to profit and loss - 116 (7) - 109Income tax related to items reclassified to profit or loss - (22) 1 - (21)Amounts removed from hedge reserve and recognised in inventory - 5 11 - 16Income tax related to amounts removed from hedge reserve and recog-nised in inventory - (1) (2) - (3)Currency translation differences (41) - - - (41)Balance at 31 March 2021 (357) 136 1 3,806 3,586Of which:
Amounts related to continuing hedges n/a 129 1 n/a 130Amounts related to discontinued hedges n/a 7 - n/a 7Balance at 1 April 2019 (337) (506) (33) 5,181 4,305Adjustment on initial application of IFRS 16 (net of tax) - - - (23) (23)Adjusted balance at 1 April 2019 (337) (506) (33) 5,158 4,282Loss for the year - - - (471) (471)Remeasurement of defined benefit obligation - - - 983 983Loss on effective cash flow hedges - (334) - - (334)Gain/(loss) on effective cash flow hedges of inventory - 82 (7) - 75Income tax related to items recognised in other comprehensive income - 49 1 (155) (105)Cash flow hedges reclassified to profit and loss - 571 (8) - 563Income tax related to items reclassified to profit or loss - (109) 2 - (107)Amounts removed from hedge reserve and recognised in inventory - (48) 15 - (33)Income tax related to amounts removed from hedge reserve and recog-nised in inventory - 9 (3) - 6
Currency translation differences 21 - - - 21Balance at 31 March 2020 (316) (286) (33) 5,515 4,880Of which:
Amounts related to continuing hedges n/a (249) (32) n/a (281)Amounts related to discontinued hedges n/a (37) (1) n/a (38)

111
FINANCIAL STATEMENTS
Annual Report 2021/22 J A G U A R L A N D R O V E R A U T O M O T I V E P L C
31 Dividends
32 Employee benefits
Pension Schemes
The Group operates several defined benefit (‘DB’) pension plans; these include two large and one smaller defined benefit plan in the UK. The UK DB plans are administered by a separate trustee, the assets of the plans are generally held in separate funds selected and overseen by the trustee. These plans were contracted out of the state second pension (S2P) scheme until 5 April 2016. The plans provide benefits for members including a monthly pension after retirement based on salary and service as set out in the rules of each plan.
Contributions to the plans by the Group take into consideration the results of actuarial valuations.
The UK defined benefit plans were closed to new joiners in April 2010. The Group also operates a number of small benefit arrangements worldwide (the liabilities for these amount to around 0.5% of the Group total).
For defined benefit plans, the cost of providing benefits is determined using the projected unit credit method, with actuarial updates being carried out at the end of each reporting period.
Defined benefit costs are split into four categories:
• Current service cost, past service cost and gains and losses on curtailments and settlements;
• Net interest cost;
• Administrative expenses; and
• Remeasurements.
Remeasurement comprising actuarial gains and losses, the effect of the asset ceiling and the return on plan assets (excluding interest) is recognised immediately in the consolidated balance sheet with a charge or credit to the consolidated statement of comprehensive income in the period in which they occur. Remeasurement recorded in the statement of comprehensive income is not recycled.
Past service cost, including curtailment gains and losses, is generally recognised in profit or loss in the period of plan amendment. Net interest is calculated by applying the discount rate at the beginning of the period to the net defined benefit liability, adjusted for expected cashflows during the period. From the year ending 31 March 2020, at the point a past service cost is incurred, re-measurement of the income statement cost is considered and will be re-calculated if there is a material change.
The Group presents these defined benefit costs within “Employee costs” in the consolidated income statement (see note 7).
Separate defined contribution plans are available to all other employees of the Group. Costs in respect of these plans are charged to the consolidated income statement as incurred.
Post-retirement Medicare schemeUnder these unfunded schemes, employees of some subsidiaries receive medical benefits subject to certain limits of amount, periods after retirement and types of benefits, depending on their grade and location at the time of retirement. Employees separated from the Group as part of an early separation scheme, on medical grounds or due to permanent disablement, may also be covered under the scheme. The applicable subsidiaries (and therefore, the Group) account for the liability for the post-retirement medical scheme based on an annual actuarial valuation where appropriate.
Actuarial gains and lossesActuarial gains and losses relating to retirement benefit plans are recognised in the consolidated statement of comprehensive income in the year in which they arise.
During the year ended 31 March 2022 no ordinary share dividends were proposed or paid (2021, 2020: £nil).
Measurement dateThe measurement date of all retirement plans is 31 March.
The trustee of the pension schemes is required by law to act in the interest of the members and of all relevant stakeholders in the schemes and is responsible for the investment policy with regard to the assets of the schemes and all other governance matters. The board of the trustee must be composed of representatives of the Group and scheme participants in accordance with each scheme’s regulations.
Through its defined benefit pension schemes, the Group is exposed to a number of risks, the most significant of which are detailed below.
Asset volatility
The schemes’ liabilities are calculated using a discount rate set with reference to corporate bond yields; if the schemes’ assets underperform against these corporate bonds, this will create or increase a deficit. The defined benefit schemes hold a significant proportion of equity-type assets, which are expected to outperform corporate bonds in the long-term although introduce volatility and risk in the short-term.
The UK schemes hold a substantial level of index-linked gilts and other inflation and interest rate hedging instruments in order to reduce the volatility of assets compared to the liability value, although these will lead to asset value volatility.
As the schemes mature, the Group intends to reduce the level of investment risk by investing more in assets for which expected income is a better match for the expected benefit outgo.
However, the Group believes that due to the long-term nature of the schemes’ liabilities and the strength of the supporting group, a level of continuing equity-type investments is currently an appropriate element of the Group’s long-term strategy to manage the schemes efficiently.
Changes in bond yields
A decrease in corporate bond yields will increase the schemes’
liabilities, although this is expected to be partially offset by an increase in the value of the schemes’ assets, specifically the bond holdings and interest rate hedging instruments.
Inflation risk
Some of the Group’s pension obligations are linked to inflation, and higher inflation will lead to higher liabilities (although, in most cases, caps on the level of inflationary increases are in place to protect the schemes against high inflation). As noted above, the schemes hold a significant proportion of assets in index-linked gilts, together with other inflation hedging instruments and also assets that are more closely correlated with inflation. However, an increase in inflation may still create a deficit or increase an existing deficit to some degree.
Life expectancy
The majority of the schemes’ obligations are to provide benefits for the life of the member, so increases in life expectancy will result in an increase in the schemes’ liabilities. This is particularly significant in the UK defined benefit schemes, where inflationary increases result in higher sensitivity to changes in life expectancy.
The following tables set out the disclosures pertaining to the retirement benefit amounts recognised in the consolidated financial statements prepared in accordance with IAS 19:

113
FINANCIAL STATEMENTS
Annual Report 2021/22 J A G U A R L A N D R O V E R A U T O M O T I V E P L C
Change in present value of defined benefit obligation
Year ended 31 March (£ millions) 2022 2021 2020
Defined benefit obligation at beginning of year 8,432 7,788 8,648
Current service cost 116 131 133
Past service cost - 16 4
Interest expense 176 166 203
Actuarial losses/(gains) arising from:
Changes in demographic assumptions 10 (21) 7
Changes in financial assumptions (705) 869 (526)
Experience adjustments (3) (75) (139)
Exchange differences on foreign schemes - (2) 1
Member contributions 2 1 2
Benefits paid (506) (441) (545)
Defined benefit obligation at end of year 7,522 8,432 7,788
Change in present value of scheme assets
Year ended 31 March (£ millions) 2022 2021 2020
Fair value of schemes' assets at beginning of year 8,045 8,168 7,981
Interest income 170 170 190Remeasurement gain on the return of plan assets, excluding amounts included in interest income 9 22 325
Administrative expenses (27) (22) (16)
Exchange differences on foreign schemes - (1) -
Employer contributions 238 148 231
Member contributions 2 1 2
Benefits paid (506) (441) (545)
Fair value of schemes' assets at end of year 7,931 8,045 8,168
The actual return on the schemes’ assets for the year ended 31 March 2022 was £179 million (2021: £192 million, 2020: £515 million).
Amounts recognised in the consolidated income statement consist of:
Year ended 31 March (£ millions) 2022 2021 2020
Current service cost 116 131 133
Past service cost - 16 4
Administrative expenses 27 22 16
Net interest cost (including onerous obligations) 6 (4) 13
Components of defined benefit cost recognised in the consolidated income statement 149 165 166
Amounts recognised in the consolidated statement of comprehensive income consist of:
Year ended 31 March (£ millions) 2022 2021 2020
Actuarial (losses)/gains arising from:
Changes in demographic assumptions (10) 21 (7)
Changes in financial assumptions 705 (869) 526
Experience adjustments 3 75 139
Remeasurement gain on the return of schemes' assets, excluding amounts included in interest income 9 22 325
Remeasurement gain/(loss) on net defined benefit obligation 707 (751) 983
Amounts recognised in the consolidated balance sheet consist of:
As at 31 March (£ millions) 2022 2021 2020
Present value of unfunded defined benefit obligations (2) (2) (2)
Present value of funded defined benefit obligations (7,520) (8,430) (7,786)
Fair value of schemes' assets 7,931 8,045 8,168
Net retirement benefit obligation 409 (387) 380
Presented as non-current asset 434 - 408
Presented as non-current liability (25) (387) (28)
The most recent valuations of the defined benefit schemes for accounting purposes were carried out at 31 March 2022 by aqualified independent actuary. For the UK schemes this is basedon membership data as at 31 March 2021 for the JPP & LRPSand 5 April 2018 for the smaller JEPP. The present value of thedefined benefit liability, and the related current service cost andpast service cost, were measured using the projected unit creditmethod. The asset valuations are taken from the asset custodian for each scheme together with the balance of the Trustee bank accounts.
In November 2020 the UK government announced that the calculation of RPI would be amended to mirror the calculation
of CPIH from 2030 (following its consultation on RPI Reform). As a result of this and changing market conditions, the gap between RPI and CPI has been updated to reflect RPI reform by having a gap of 1.2% p.a. up to 2030 and no gap thereafter. In addition the inflation risk premium (IRP) has been updated from an IRP of 0.2% p.a. up to 2030 and 0.5% post 2030 to an IRP of 0.3% p.a. up to 2030 and 0.5% post 2030, reflecting market conditions at the 31 March 2022 year end.
The principal assumptions used in accounting for the pension schemes are set out below:
Year ended 31 March 2022 2021 2020
Discount rate 2.8% 2.1% 2.4%
Expected rate of increase in benefit revaluation of covered employees 2.2% 2.1% 2.0%
RPI inflation rate 3.5% 3.1% 2.6%

115
FINANCIAL STATEMENTS
Annual Report 2021/22 J A G U A R L A N D R O V E R A U T O M O T I V E P L C
For the valuation at 31 March 2022, the mortality assumptions used are the Self-Administered Pension Schemes (‘SAPS’) mortality base table, S2PxA tables (“Light” tables for members of the Jaguar Executive Pension Plan).
• For the Jaguar Pension Plan, scaling factors of 101 per cent to 115 per cent have been used for male members and scaling factors of 103 per cent to 118 per cent have been used for female members.
• For the Land Rover Pension Scheme, scaling factors of 105 per cent to 117 per cent have been used for male members and scaling factors of 100 per cent to 116 per cent have been used for female members.
• For the Jaguar Executive Pension Plan, scaling factors of 93 per cent to 97 per cent have been used for male members and scaling factors of 91 per cent to 96 per cent have been used for female members.
For the valuation at 31 March 2021, the mortality assumptions used were the SAPS mortality base table, S2PxA tables (“Light” tables for members of the Jaguar Executive Pension Plan).
• For the Jaguar Pension Plan, scaling factors of 111 per cent to 117 per cent have been used for male members and scaling factors of 101 per cent to 112 per cent have been used for female members.
• For the Land Rover Pension Scheme, scaling factors of 107 per cent to 111 per cent have been used for male members and scaling factors of 101 per cent to 109 per cent have been used for female members.
• For the Jaguar Executive Pension Plan, an average scaling factor of 94 per cent has been used for male members and an average scaling factor of 84 per cent has been used for female members.
For the valuation at 31 March 2020, the mortality assumptions used were the SAPS mortality base table, S2PxA tables (“Light” tables for members of the Jaguar Executive Pension Plan).
• For the Jaguar Pension Plan, scaling factors of 111 per cent to 117 per cent have been used for male members and scaling factors of 101 per cent to 112 per cent have been used for female members.
• For the Land Rover Pension Scheme, scaling factors of 107 per cent to 111 per cent have been used for male members and scaling factors of 101 per cent to 109 per cent have been used for female members.
• For the Jaguar Executive Pension Plan, an average scaling factor of 94 per cent has been used for male members and an average scaling factor of 84 per cent has been used for female members.
For the 2022 year end calculations there is an allowance for future improvements in line with the CMI (2021) projections and an allowance for long-term improvements of 1.25 per cent per annum and a smoothing parameter of 7.5 (2021: CMI (2020) projections with 1.25 per cent per annum improvements and a smoothing parameter of 7.5, 2020: CMI (2019) projections with 1.25 per cent per annum improvements and a smoothing parameter of 7.5).
The assumed life expectancies on retirement at age 65 are:
As at 31 March (years) 2022 2021 2020
Retiring today:
Males 21.6 21.0 21.0
Females 23.8 23.3 23.2
Retiring in 20 years:
Males 23.0 22.4 22.5
Females 25.7 25.2 25.2
A past service cost of £9 million was recognised in the year ended 31 March 2021 following a further High Court ruling, published on 20 November 2020, that provided clarification on the obligations of pension plan trustees to equalise past transfer values allowing for the effect of unequal Guaranteed Minimum Pensions (‘GMP’) between 17 May 1990 and 5 April 1997 (“GMP equalisation”). The Group had previously recognised a past service cost of £17 million in the year ended 31 March 2019, following the High Court ruling in 2018 in respect of GMP equalisation, and has retained this allowance at 31 March 2022 but adjusted for the passage of time and to reflect the estimated impact of changes in market conditions.
A further past service cost of £7 million was also recognised in the year ended 31 March 2021. This reflected benefit improvements for certain members as part of the Group restructuring programme that commenced in the year ended 31 March 2021.
A past service cost of £4 million was recognised in the year ended 31 March 2020. This reflected benefit improvements forcertain members as part of the Group restructuring programmethat commenced in the year ended 31 March 2019.
All past service costs are recognised in ‘exceptional items’ in the consolidated income statement. See Note 4 for furtherinformation.
The sensitivity analysis below is based on a change in an assumption while holding all other assumptions constant. In practice, this is unlikely to occur, and changes in some of the assumptions may be correlated. When calculating the sensitivity of the defined benefit obligation to significant actuarial assumptions, the same method (present value of the defined benefit obligation calculated with the projected unit credit method at the end of the reporting period) has been applied as when calculating the pension liability recognised within the consolidated balance sheet.
The methods and types of assumptions used in preparing the sensitivity analysis did not change compared to previous periods.
Assumption Change in assumption Impact on scheme liabilities Impact on service cost
Discount rate Increase/decrease by 0.25% Decrease/increase by c.£341 million Decrease/increase by £6 million
Inflation rate Increase/decrease by 0.25% Increase/decrease by c.£176 million Increase/decrease by £1 million
Mortality Increase/decrease in life expectancy by 1 year Increase/decrease by c.£267 million Increase/decrease by £3 million

117
FINANCIAL STATEMENTS
Annual Report 2021/22 J A G U A R L A N D R O V E R A U T O M O T I V E P L C
The fair value of schemes’ assets is represented by the following major categories:
As at 31 March (£ millions) 2022 2021 2020
Quoted Unquo-ted Total % Quoted Unquo-
ted* Total % Quo-ted**
Unquo-ted Total %
Equity instrumentsInformation technology - 127 127 2% - 134 135 2% 73 51 124 1%Energy - 18 18 - - 11 11 - 6 4 10 -Manufacturing - 96 96 1% - 75 75 1% 41 29 70 1%Financials - 41 41 1% - 48 48 1% 27 18 45 1%Other - 173 173 2% - 267 267 3% 147 102 249 3% - 455 455 6% - 535 535 7% 294 204 498 6%Debt instrumentsGovernment bonds 1,813 65 1,878 23% 1,625 88 1,712 21% 1,841 103 1,944 24%Corporate bonds (investment grade) 1,149 310 1,459 18% 1,340 243 1,583 20% 1,131 462 1,593 19%Corporate bonds (Non investment grade) - 973 973 12% - 1,061 1,061 13% - 750 750 9% 2,962 1,348 4,310 53% 2,965 1,392 4,357 54% 2,972 1,315 4,287 52%Property fundsUK - 307 307 4% - 304 304 4% - 273 273 3%Other - 240 240 3% - 201 201 3% - 239 239 3% - 547 547 7% - 505 505 7% - 512 512 6%Cash and cash equivalents 75 363 438 6% 74 192 265 3% 51 627 678 8%OtherHedge funds - 506 506 6% - 496 496 6% - 475 475 6%Private markets - 998 998 13% - 824 824 10% - 562 562 7%Alternatives - 462 462 6% - 641 641 8% - 594 594 7% - 1,966 1,966 25% - 1,961 1,961 24% - 1,631 1,631 20%DerivativesForeign exchange contracts - (35) (35) - - 15 15 - - (35) (35) -Interest rate and inflation swaps - 250 250 3% - 361 361 4% - 545 545 7%Equity protection derivatives - - - - - 48 48 1% - 52 52 1%
- 215 215 3% - 424 424 5% - 562 562 8%Total 3,037 4,894 7,931 100% 3,039 5,009 8,048 100% 3,317 4,851 8,168 100%
As at 31 March 2022, the schemes held Gilt Repos. The net value of these transactions is included in the value of government bonds in the table above. The gross value of the funding obligation for the Repo transactions is £1,462 million at 31 March 2022 (2021: £2,057 million, 2020: £2,639 million).
JLR assigns an accounting level (1, 2 or 3) to asset holdings in order to reflect the level of judgement involved in the valuation
of an asset. In assigning the level JLR balances consistency between asset holdings, consistency from year to year and manager/other assessments. JLR designates level 1 to direct holdings of liquid assets where an active market exists.
*The comparative has been restated to reflect reclassification to unquoted for equity instruments.**Restated following a review of the measurement and presentation requirements for unquoted assets.
Custodian accounts where underlying assets are regularly traded or where comparable assets have traded values are designated level 2, for example derivatives (including net value of swaps) and some property holdings. Assets which are not designated as level 1 or 2 are designated as level 3. Level 1 assets are reported as quoted, level 2 and 3 unquoted. Repo obligations are noted separately.
Private Equity holdings have been measured using the most recent valuations, adjusted for cash and currency movements between the last valuation date and 31 March 2022. Given the movements in listed equity markets, the valuation of Private Equity holdings may vary significantly. The value of the Private Equity holdings in the JLR UK Plans included above is £661 million as at 31 March 2022 (2021: £453 million, 2020: £342 million).
Jaguar Land Rover contributes towards the UK defined benefit schemes. The 5 April 2018 statutory funding valuations were completed in December 2018. As a result of these valuations it is intended to eliminate the pension scheme funding deficits over the 10 years to 31 March 2028. JLR has taken legal advice considering the documentation of the UK schemes and the regulatory environment. This confirmed the recoverability of any surplus in the scheme and JLR has based its accounting judgement on this advice.
In line with the schedule of contributions agreed following the 2018 statutory funding valuations, the current ongoing Group contributiation rate for defined benefit accrual is c.21 per cent of pensionable salaries in the UK. The 2021 statutory funding valuations are expected to be completed by 30 June 2022. Deficit contributions are paid in line with the schedule of contributions at a rate of £60 million per year until 31 March 2024 followed by £25 million per year until 31 March 2028.Contributions previously due for April, May and June 2020 have been re-spread over the year ended 31 March 2022. This agreement is reflected in the Schedule of Contributions dated
29 April 2020.
The average duration of the benefit obligations at 31 March 2022 is 17.5 years (2021, 2020: 19.0 years).
The expected net periodic pension cost for the year ended 31 March 2023 is expected to be £113 million. The Group expects to pay £117 million to its defined benefit schemes, in total, for the year ended 31 March 2023 (excluding member contributions through salary sacrifice).
Defined contribution schemes
The Group’s contribution to defined contribution schemes for the year ended 31 March 2022 was £83 million (2021, 2020: £86 million).
33 Commitments and contingencies
In the normal course of business, the Group faces claims and assertions by various parties. The Group assesses such claims and assertions and monitors the legal environment on an ongoing basis, with the assistance of external legal counsel wherever necessary. The Group records a liability for any claims where a potential loss is probable and capable of being estimated and discloses such matters in its financial statements, if material. For potential losses that are considered possible, but not probable, the Group provides disclosure in the consolidated financial statements but does not record a liability unless the loss becomes probable. Such potential losses may be of an uncertain timing and/or amount.
The following is a description of claims and contingencies where a potential loss is possible, but not probable. Management believes that none of the contingencies described below, either individually or in aggregate, would have a material adverse effect on the Group’s financial condition, results of operations or cash flows.
As at 31 March (£ millions) 2022 2021 2020
Litigation and product related matters 25 23 40
Other taxes and duties 75 50 44
Commitments:
• Plant and equipment 735 862 1,217
• Intangible assets 15 16 14
• Other 470 270 376
Pledged as collateral/security against the borrowings and commitments:
• Inventory - 138 127
• Trade receivables - 19 -
• Other financial assets 13 13 -

119
FINANCIAL STATEMENTS
Annual Report 2021/22 J A G U A R L A N D R O V E R A U T O M O T I V E P L C
Litigation and product related matters
The Group is involved in legal proceedings, both as plaintiff and as defendant. There are claims and potential claims against the Group which management has not recognised, as settlement is not considered probable. These claims and potential claims pertain to motor accident claims, consumer complaints, employment and dealership arrangements, replacement of parts of vehicles and/or compensation for deficiency in the services by the Group or its dealers.
The Group has provided for the estimated cost of repair following the passenger safety airbag issue in the United States, China, Canada, Korea, Taiwan, Australia and Japan. The Group recognises that there is a potential risk of further recalls in the future and considers such events on a case-by-case basis as the relevant facts and circumstances materialise, provided it can reliably estimate the amount and timing of any potential future costs associated with this warranty issue.
Other taxes and duties
Contingencies and commitments include tax contingent liabilities which mainly relate to tax audits and tax litigation claims. Commitments
The Group has entered into various contracts with vendors and contractors for the acquisition of plant, equipment and intangible assets; and various civil contracts of a capital nature. Commitments and contingencies also includes other contingent liabilities, the timing of any outflow will vary as and when claims are received and settled, which is not known with certainty.
The remaining financial commitments, in particular the purchase commitments and guarantees, are of a magnitude typical for the industry.
Joint venture
Stipulated within the joint venture agreement for Chery Jaguar Land Rover Automotive Company Ltd., and subsequently amended by a change to the Articles of Association of Chery Jaguar Land Rover Automotive Company Ltd. is a commitment for the Group to contribute a total of CNY 5,000 million of capital. Of this amount, CNY 3,475 million has been contributed as at 31 March 2022. The outstanding commitment of CNY 1,525 million translates to £183 million at the 31 March 2022 exchange rate.
The Group’s share of capital commitments of its joint venture at 31 March 2022 is £16 million (2021: £42 million, 2020: £69 million) and contingent liabilities of its joint venture 31 March 2022 is £nil (2021, 2020: £nil).
34 Capital management
The Group’s objectives when managing capital are to ensure the going concern operation of all subsidiary companies within the Group and to maintain an efficient capital structure to support ongoing and future operations of the Group and to meet shareholder expectations.
The Group issues debt, primarily in the form of bonds, to meet anticipated funding requirements and maintain sufficient liquidity. The Group also maintains certain undrawn committed credit facilities to provide additional liquidity. These borrowings, together with cash generated from operations, are loaned internally or contributed as equity to certain subsidiaries as required. Surplus cash in subsidiaries is pooled (where practicable) and invested to satisfy security, liquidity and yield requirements.
The capital structure and funding requirements are regularly monitored by the JLR plc Board to ensure sufficient liquidity is maintained by the Group. All debt issuance and capital distributions are approved by the JLR plc Board.
As at 31 March (£ millions) 2022 2021 2020
Short-term debt 1,841 1,271 599
Long-term debt 5,756 5,426 5,285
Total debt* 7,597 6,697 5,884
Equity attributable to shareholders 4,503 5,254 6,548
Total capital 12,100 11,951 12,432
*Total debt includes lease obligations of £570 million (2021: £519 million, 2020: £541 million).
35 Financial instruments
This section gives an overview of the significance of financial instruments for the Group and provides additional information on balance sheet items that contain financial instruments.
Recognition and derecognition
A financial instrument is any contract that gives rise to a financial asset of one entity and a financial liability or equity instrument of another entity. Financial instruments are recognised on the balance sheet when the Group becomes a party to the contractual provisions of the instrument.
The Group derecognises a financial asset only when the contractual rights to the cash flows from the asset expire or it transfers the financial asset and substantially all the risks and rewards of ownership of the asset to another entity. If the Group neither transfers nor retains substantially all the risks and rewards of ownership and continues to control the transferred asset, the Group recognises its retained interest in the asset and an associated liability for amounts it may have to pay. If the Group retains substantially all the risks and rewards of ownership of a transferred financial asset, the Group continues to recognise the financial asset and also recognises a collateralised borrowing for the proceeds received. Any gain or loss arising on derecognition is recognised in profit or loss. When a financial instrument is derecognised, the cumulative gain or loss in equity (if any) is transferred to the consolidated income statement.
Financial assets are written off when there is no reasonable expectation of recovery. The Group reviews the facts and circumstances around each asset before making a determination. Financial assets that are written off could still be subject to enforcement activities.
Financial liabilities are derecognised when they are extinguished, that is when the obligation is discharged, cancelled or has expired.
Initial measurement
Initially, a financial instrument is recognised at its fair value. Transaction costs directly attributable to the acquisition or issue of financial instruments are recognised in determining the carrying amount, if it is not classified as at fair value through profit or loss. Transaction costs of financial instruments carried at fair value through profit or loss are expensed in profit or loss.
Subsequently, financial instruments are measured according to the category in which they are classified.
Classification and measurement – financial assets
Classification of financial assets is based on the business model in which the instruments are held as well as the characteristics of their contractual cash flows. The business model is based on management’s intentions and past pattern of transactions. Financial assets with embedded derivatives are considered in their entirety when determining whether their cash flows are solely payment of principal and interest. The Group reclassifies
financial assets when and only when its business model for managing those assets changes.
Financial assets are classified into three categories:
Financial assets at amortised cost are non-derivative financial assets with contractual cash flows that consist solely of payments of principal and interest and which are held with the intention of collecting those contractual cash flows. Subsequently, these are measured at amortised cost using the effective interest method less impairment losses, if any. These include cash and cash equivalents, contract assets and other financial assets.
Financial assets at fair value through other comprehensive income are non-derivative financial assets with contractual cash flows that consist solely of payments of principal and interest and which are held with the intention of collecting those contractual cash flows as well as to sell the financial asset. Subsequently, these are measured at fair value, with unrealised gains or losses being recognised in other comprehensive income apart from any expected credit losses or foreign exchange gains or losses, which are recognised in profit or loss. This category can also include financial assets that are equity instruments which have been irrevocably designated at initial recognition as fair value through other comprehensive income. For these assets, there is no expected credit loss recognised in profit or loss.
Financial assets at fair value through profit or loss are financial assets with contractual cash flows that do not consist solely of payments of principal and interest. This category includes derivatives, embedded derivatives separated from the host contract and investments in certain convertible loan notes. Subsequently, these are measured at fair value, with unrealised gains or losses being recognised in profit or loss, with the exception of derivative instruments designated in a hedging relationship, for which hedge accounting is applied.
Classification and measurement – financial liabilities
Financial liabilities are classified as subsequently measured at amortised cost unless they meet the specific criteria to be recognised at fair value through profit or loss.
Other financial liabilities are measured at amortised cost using the effective interest method.
Financial liabilities at fair value through profit or loss include derivatives and embedded derivatives separated from the host contract as well as financial liabilities held for trading. Subsequent to initial recognition, these are measured at fair value with gains or losses being recognised in profit or loss. Embedded derivatives relating to prepayment options on senior notes are not considered as closely related and are separately accounted unless the exercise price of these options is approximately equal on each exercise date to either the amortised cost of the senior notes or the present value of the lost interest for the remaining term of the senior notes.

121
FINANCIAL STATEMENTS
Annual Report 2021/22 J A G U A R L A N D R O V E R A U T O M O T I V E P L C
Impairment
The Group recognises a loss allowance in profit or loss for expected credit losses on financial assets held at amortised cost or at fair value through other comprehensive income. Expected credit losses are forward looking and are measured in a way that is unbiased and represents a probability-weighted amount, takes into account the time value of money (values are discounted using the applicable effective interest rate) and uses reasonable and supportable information.
Lifetime expected credit losses are calculated for assets that were deemed credit impaired at initial recognition or have subsequently become credit impaired as well as those where credit risk has increased significantly since initial recognition.
The Group adopts the simplified approach to apply lifetime expected credit losses to trade receivables and contract assets. Where credit risk is deemed low at the reporting date or to have not increased significantly, credit losses for the next 12 months are calculated.
Credit risk is determined to have increased significantly when the probability of default increases. Such increases are relative and assessment may include external ratings (where available) or other information such as past due payments. Historic data and forward-looking information are both considered. Objective evidence for a significant increase in credit risk may include where payment is overdue by 90 or more days as well as other information about significant financial difficulties of the borrower.
Equity instruments
An equity instrument is any contract that evidences residual interests in the assets of the Group after deducting all of its liabilities. Equity instruments issued by the Group are recorded at the proceeds received, net of direct issue costs.
Investments in equity instruments are measured at fair value; however, where a quoted market price in an active market is not available, equity instruments are measured at cost (investments in equity instruments that are not held for trading). The Group has not elected to account for these investments at fair value through other comprehensive income.
Determination of fair value
Fair value is the price that would be received to sell an asset or paid to transfer a liability in an orderly transaction between market participants at the measurement date, regardless of whether that price is directly observable or estimated using another valuation technique. The fair value of a financial instrument on initial recognition is normally the transaction price.
In estimating the fair value of an asset or liability, the Group takes into account the characteristics of the asset or liability if market participants would take those characteristics into
account when pricing the asset or liability at the measurement date. Subsequent to initial recognition, the Group determines the fair value of financial instruments that are quoted in active markets using the quoted bid prices (financial assets held) or quoted ask prices (financial liabilities held) and using valuation techniques for other instruments. Valuation techniques include the discounted cash flow method and other valuation models.
Hedge accounting
The Group uses foreign currency forward contracts, foreign currency options and borrowings denominated in foreign currency to hedge its risks associated with foreign currency fluctuations relating to highly probable forecast transactions. The Group designates these foreign currency forward contracts, foreign currency options and borrowings denominated in foreign currency in cash flow hedging relationships.
The Group uses cross-currency interest rate swaps to convert some of its foreign currency denominated fixed-rate borrowings to GBP floating-rate borrowings. Hedge accounting is applied using both fair value and cash flow hedging relationships. The designated risks are foreign currency and interest rate risks.
Derivative contracts are stated at fair value on the consolidated balance sheet at each reporting date.
At inception of the hedge relationship, the Group documents the economic relationship between the hedging instrument and the hedged item, including whether changes in the cash flows of the hedging instrument are expected to offset changes in the cash flows of the hedged item. The Group documents its risk management objective and strategy for undertaking its hedging transactions. The Group designates only the intrinsic value of foreign exchange options in the hedging relationship. The Group designates amounts excluding foreign currency basis spread in the hedging relationship for both foreign exchange forward contracts and cross-currency interest rate swaps. Changes in the fair value of the derivative contracts that are designated and effective as hedges of future cash flows are recognised in the cash flow hedge reserve within other comprehensive income (net of tax), and any ineffective portion is recognised immediately in the consolidated income statement.
Changes in both the time value of foreign exchange options and foreign currency basis spread of foreign exchange forwards and cross-currency interest rate swaps are recognised in other comprehensive income (net of tax) in the cost of hedging reserve to the extent that they relate to the hedged item (the “aligned” value).
Changes in the fair value of contracts that are designated in a fair value hedge are taken to the consolidated income statement. They offset the change in fair value, attributable to the hedged risks, of the borrowings designated as the hedged item.
Hedge accounting is discontinued when the hedging instrument expires or is sold, terminated, exercised or no longer qualifies for hedge accounting. Amounts accumulated in equity are reclassified to the consolidated income statement in the periods in which the forecast transactions affect profit or loss or as an adjustment to a non-financial item (e.g. inventory) when that item is recognised on the balance sheet. These deferred amounts are ultimately recognised in profit or loss as the hedged item affects profit or loss (for example through cost of goods sold).
If the forecast transaction is no longer expected to occur, the net cumulative gain or loss in equity, including deferred costs of hedging, is immediately transferred and recognised in the consolidated income statement.
Interest rate benchmark reform
A reform of major interest rate benchmarks is being undertaken globally, including the replacement of some interbank offered rates (‘IBORs’) with alternative risk-free rates (‘RFR’). The Group has adopted Interest Rate Benchmark Reform (Phase 2) Amendments to IFRS 9, IAS 39, IFRS 7, IFRS 4 and IFRS 16 (effective 1 January 2022). The amendments permit modifications to asset and liability values as a direct consequence of the interest rate benchmark reform, and which are made on an economically equivalent basis (i.e. where the basis for determining contractual cash flows is the same), by only updating the effective interest rate. The amendments also provide relief from specific hedge accounting requirements.
At 31 March 2021, the Group’s hedging relationship exposures were indexed to GBP LIBOR and the Group’s non-hedged relationship exposures were indexed to GBP LIBOR and USD LIBOR. On 31 December 2021, the ICE Benchmark Administration (IBA), the FCA-regulated and authorised administrator of LIBOR, ceased to publish a number of IBOR benchmarks including GBP LIBOR. Most USD LIBORs will cease to be published after June 2023.
During the year ended 31 March 2022, the Group converted its LIBOR exposures to risk-free rates in advance of the cessation date. This conversion included loans and derivatives which have been converted using fallback provisions. A number of derivatives which were converted using fallback provisions have not yet transitioned to RFR due to the timing of reprice dates. Loans held by the Group that reference USD LIBOR will continue to do so until June 2023. The expected impact of financial instruments yet to transition is immaterial for the Group.
As a result of the fallback provision, the Group consider its exposure to interest rate benchmark reform at 31 March 2022 to be minimal. The following table shows the total amounts of exposures to IBOR which have yet to transition and those with appropriate fallback language at 1 April 2021 and at 31 March 2022. The amounts of financial assets and financial liabilities are shown at their carrying amounts and derivatives are shown at their notional amounts:
GBP LIBOR USD LIBOR
As at (£ millions)Total amount of
contracts not yet transitioned
Amount with appropriate fall-
back clauseTotal amount of
contracts not yet transitioned
Amount with appropriate fall-
back clause
31 March 2022
Financial liabilities - carrying valueSyndicated loan - - (753) (753)UKEF facility - - - -
Derivatives - notional amountCross currency interest rate swaps - hed-ged (380) (380) - -
Cross currency interest rate swaps - non hedged (539) (539)
1 April 2021
Financial liabilities - carrying valueSyndicated loan - - (719) -UKEF facility (443) - - -
Derivatives - notional amountCross currency interest rate swaps - hed-ged (825) - - -
Cross currency interest rate swaps - non hedged (539)

123
FINANCIAL STATEMENTS
Annual Report 2021/22 J A G U A R L A N D R O V E R A U T O M O T I V E P L C
(A) Financial assets and liabilities
The following table shows the carrying amount and fair value of each category of financial assets and liabilities as at 31 March 2022:
Fair Value Through Profit and Loss
As at 31 March 2022 (£ millions) Amorti-sed cost
Financial assets
Derivatives other than in hedging rela-
tionship
Derivatives in hedging rela-
tionshipTotal carr-ying value
Total fair value
Cash and cash equivalents 4,223 - - - 4,223 4,223Short-term deposits and other investments 175 - - - 175 175Trade receivables 722 - - - 722 722Investments - 30 - - 30 30Other financial assets - current 209 - 128 57 394 394Other financial assets - non-current 87 - 85 13 185 185Total financial assets 5,416 30 213 70 5,729 5,729Accounts payable 5,144 - - - 5,144 5,144Short-term borrowings 1,779 - - - 1,779 1,778Long-term borrowings* 5,248 - - - 5,248 5,216Other financial liabilities - current 425 - 29 416 870 870Other financial liabilities - non-current 533 - 52 286 871 901Total financial liabilities 13,129 - 81 702 13,912 13,909
* Included in the long-term borrowings shown in other financial liabilities is £801 million that is designated as the hedged item in a fair value hedge relationship. Included within this figure is £(67) million of fair value adjustments as a result of the hedge relationship.
The following table shows the carrying amount and fair value of each category of financial assets and liabilities as at 31 March 2021:
* Included in the long-term borrowings shown in other financial liabilities is £784 million that is designated as the hedged item in a fair value hedge relationship. Included within this figure is £1 million of fair value adjustments as a result of the hedge relationship.
Fair Value Through Profit and Loss
As at 31 March 2021 (£ millions) Amorti-sed cost
Financial assets
Derivatives other than in hedging rela-
tionship
Derivatives in hedging rela-
tionshipTotal carr-ying value
Total fair value
Cash and cash equivalents 3,778 - - - 3,778 3,778Short-term deposits and other investments 1,004 - - - 1,004 1,004Trade receivables 863 - - - 863 863Investments - 22 - - 22 22Other financial assets - current 196 - 73 208 477 477Other financial assets - non-current 92 - 42 207 341 341Total financial assets 5,933 22 115 415 6,485 6,485Accounts payable 6,308 - - - 6,308 6,308Short-term borrowings 1,206 - - - 1,206 1,217Long-term borrowings* 4,972 - - - 4,972 5,136Other financial liabilities - current 508 - 67 171 746 746Other financial liabilities - non-current 456 - 65 104 625 688Total financial liabilities 13,450 - 132 275 13,857 14,095
The following table shows the carrying amount and fair value of each category of financial assets and liabilities as at 31 March 2020:
* Included in the long-term borrowings shown in other financial liabilities is £891 million that is designated as the hedged item in a fair value hedge relationship. Included within this figure is £45 million of fair value adjustments as a result of the hedge relationship.
Offsetting
Certain financial assets and financial liabilities are subject to offsetting where there is currently a legally enforceable right to set off recognised amounts and the Group intends to either settle on a net basis or to realise the asset and settle the liability simultaneously.
Derivative financial assets and financial liabilities are subject to master netting arrangements whereby in the case of insolvency, derivative financial assets and financial liabilities can be settled on a net basis.
Fair Value Through Profit and Loss
As at 31 March 2020 (£ millions) Amorti-sed cost
Financial assets
Derivatives other than in hedging rela-
tionship
Derivatives in hedging rela-
tionshipTotal carr-ying value
Total fair value
Cash and cash equivalents 2,271 - - - 2,271 2,271Short-term deposits and other investments 1,393 - - - 1,393 1,393Trade receivables 833 - - - 833 833Investments - 37 - - 37 37Other financial assets - current 142 - 153 88 383 383Other financial assets - non-current 115 - 9 133 257 257Total financial assets 4,754 37 162 221 5,174 5,174Accounts payable 6,499 - - - 6,499 6,499Short-term borrowings 526 - - - 526 512Long-term borrowings* 4,817 - - - 4,817 3,859Other financial liabilities - current 620 - 204 249 1,073 1,073Other financial liabilities - non-current 468 - 48 262 778 778Total financial liabilities 12,930 - 252 511 13,693 12,721

125
FINANCIAL STATEMENTS
Annual Report 2021/22 J A G U A R L A N D R O V E R A U T O M O T I V E P L C
The following table discloses the amounts that have been offset in arriving at the consolidated balance sheet presentation and the amounts that are available for offset only under certain conditions as at 31 March 2022:
Amounts subject to a master netting arrangement
As at 31 March 2022 (£ millions)Gross
amount recognised
Gross amount of recognised set
off in the balance sheet
Net amount presented in the
balance sheetFinancial
instruments
Cash collateral
(received) / pledged
Net amount after
offsetting
Financial assets
Derivative financial assets 283 - 283 (275) - 8Cash and cash equivalents 4,381 (158) 4,223 - - 4,223 4,664 (158) 4,506 (275) - 4,231Financial liabilitiesDerivative financial liabilities 783 - 783 (275) - 508Short-term borrowings 1,937 (158) 1,779 - - 1,779 2,720 (158) 2,562 (275) - 2,287
The following table discloses the amounts that have been offset in arriving at the consolidated balance sheet presentation and the amounts that are available for offset only under certain conditions as at 31 March 2021:
Amounts subject to a master netting arrangement
As at 31 March 2021 (£ millions)Gross
amount recognised
Gross amount of recognised set
off in the balance sheet
Net amount presented in the
balance sheetFinancial
instruments
Cash collateral
(received) / pledged
Net amount after
offsetting
Financial assetsDerivative financial assets 530 - 530 (362) - 168Cash and cash equivalents 3,995 (217) 3,778 - - 3,778 4,525 (217) 4,308 (362) - 3,946Financial liabilitiesDerivative financial liabilities 407 - 407 (362) - 45Short-term borrowings 1,423 (217) 1,206 - - 1,206 1,830 (217) 1,613 (362) - 1,251
The following table discloses the amounts that have been offset in arriving at the consolidated balance sheet presentation and the amounts that are available for offset only under certain conditions as at 31 March 2020:
Amounts subject to a master netting arrangement
As at 31 March 2020 (£ millions)Gross
amount recognised
Gross amount of recognised set
off in the balance sheet
Net amount presented in the
balance sheetFinancial
instruments
Cash collateral
(received) / pledged
Net amount after
offsetting
Financial assetsDerivative financial assets 383 - 383 (377) - 6Cash and cash equivalents 2,981 (710) 2,271 - - 2,271 3,364 (710) 2,654 (377) - 2,277Financial liabilitiesDerivative financial liabilities 763 - 763 (377) - 386Short-term borrowings 1,236 (710) 526 - - 526 1,999 (710) 1,289 (377) - 912
Fair value hierarchy
Financial instruments held at fair value are required to be measured by reference to the following levels:
• Quoted prices in an active market (Level 1): this level of hierarchy includes financial instruments that are measured by reference to quoted prices (unadjusted) in active markets for identical assets or liabilities;
• Valuation techniques with observable inputs (Level 2): this level of hierarchy includes financial assets and liabilities measured using inputs other than quoted prices included within Level 1 that are observable for the asset or liability, either directly (i.e. as prices) or indirectly (i.e. derived from prices); and
• Valuation techniques with significant unobservable inputs (Level 3): this level of hierarchy includes financial assets and liabilities measured using inputs that are not based on observable market data (unobservable inputs). Fair values are determined in whole or in part using a valuation model based on assumptions that are neither supported by prices from observable current market transactions in the same instrument nor based on available market data.
Recent transaction values
The pricing of recent investment transactions is the main input of valuations performed by the Group. The Group’s policy is to use observable market data where possible for its valuations and, in the absence of portfolio company earnings or revenue to compare, or of relevant comparable businesses’ data, recent transaction prices represent the most reliable observable inputs.
Alternative valuation methodologies
Alternative valuation methodologies are used by the Group for reasons specific to individual assets. At 31 March 2022, the alternative technique used was net asset value, representing 100 per cent of alternatively valued assets.
There has been no change in the valuation techniques adopted in either current or prior financial years as presented. There were no transfers between fair value levels in the years ended 31 March 2022, 2021 and 2020.
The financial instruments that are measured subsequent to initial recognition at fair value are classified as Level 2 fair value measurements, as defined by IFRS 13, being those derived from inputs other than quoted prices that are observable. These valuation techniques maximise the use of observable market data where it is available and rely as little as possible on entity-specific estimates. Fair values of forward derivative financial assets and liabilities are estimated by discounting expected future contractual cash flows using prevailing market interest rate curves from Reuters. Commodity swap contracts are
similarly fair valued by discounting expected future contractual cash flows. Option contracts on foreign currency are entered into on a zero cost collar basis and fair value estimates are calculated from standard Black-Scholes options pricing methodology, using prevailing market interest rates and volatilities. The estimate of fair values for cross-currency swaps is calculated using discounted estimated future cash flows. Estimates of the future floating-rate cash flows are based on quoted swap rates, future prices, interbank borrowing rates (“LIBOR”) and risk free rates (“SONIA”).
Additionally, a credit valuation adjustment/debit value adjustment is taken on derivative financial assets and liabilities and is calculated by discounting the fair value gain or loss on the financial derivative using credit default swap (“CDS”) prices quoted for the counterparty or Jaguar Land Rover respectively. CDS prices are obtained from Reuters.
The long-term borrowings are held at amortised cost. The fair value of the listed debt for disclosure purposes is determined using Level 1 valuation techniques, based on the closing price as at 31 March 2022 on the Luxembourg Stock Exchange multilateral trading facility (“EURO MTF”) market, for unsecured listed bonds. For bank loans, Level 2 valuation techniques are used.
Fair values of cash and cash equivalents, short-term deposits, trade receivables and payables, and other financial assets and liabilities (current and non-current excluding derivatives and lease obligations) are assumed to approximate to cost due to the short-term maturing of the instruments and as the impact of discounting is not significant.
Other investments that are not equity accounted for are recognised at fair value. Where there is an active quoted market, the fair value is determined using Level 1 valuation techniques, based on the closing price at year end. The valuation of such investments as at 31 March 2022 is £nil (2021: £nil, 2020: £17 million). Where there is no active quoted market, the fair values have been determined using Level 3 valuation techniques and the closing valuation as at 31 March 2022 is £30 million (2021: £22 million, 2020: £20 million). The fair value gain recognised in the consolidated income statement for Level 3 investments for the year ended 31 March 2022 is £4 million (2021: gain of £2 million, 2020: loss of £1 million).
Of the financial assets held at 31 March 2022 and classified as Level 3, 96 per cent (2021: 94 per cent, 2020: 93 per cent) were valued using recent transaction values and 4 per cent (2021: 6 per cent, 2020: 7 per cent) were valued using an alternative technique.
Management uses its best judgement in estimating the fair value of its financial instruments. However, there are inherent limitations in any estimation technique. Therefore, for substantially all financial instruments, the fair value estimates presented above are not necessarily indicative of all the amounts

127
FINANCIAL STATEMENTS
Annual Report 2021/22 J A G U A R L A N D R O V E R A U T O M O T I V E P L C
that the Group could have realised in a sales transaction as of the respective dates. The estimated fair value amounts as at 31 March 2022, 2021 and 2020 have been measured as at the respective dates. As such, the fair values of these financial instruments subsequent to the respective reporting dates may be different from the amounts reported at each year end.
(B) Financial risk management
The Group is exposed to foreign currency exchange rate, commodity price, interest rate, liquidity and credit risks. The Group has a risk management framework in place, which monitors all of these risks as discussed below. This framework is approved by the JLR plc Board.
Foreign currency exchange rate risk
The fluctuation in foreign currency exchange rates may have a potential impact on the consolidated income statement, the consolidated statement of comprehensive income, the consolidated balance sheet, the consolidated statement of changes in equity and the consolidated cash flow statement, where any transaction references more than one currency or where assets/liabilities are denominated in a currency other than
the functional currency of the respective consolidated entities.
Considering the countries and economic environment in which the Group operates, its operations are subject to risks arising from fluctuations in exchange rates in those countries. The risks primarily relate to fluctuations in US Dollar, Chinese Yuan and Euro against the functional currency of the Company and its subsidiaries.
Foreign exchange risk on future transactions is mitigated through the use of derivative contracts. The Group is also exposed to fluctuations in exchange rates that impact the valuation of foreign currency denominated assets and liabilities of its National Sales Companies and also foreign currency denominated balances on the Group’s consolidated balance sheet at each reporting period end. In addition to the derivatives designated in hedging relationships as detailed in section (C), the Group enters into foreign currency contracts as economic hedges of recognised foreign currency debt.
The following table sets forth information relating to foreign currency exposure as at 31 March 2022:
As at 31 March 2022 (£ millions) US Dollar Chinese Yuan Euro Others
Financial assets 1,640 393 1,036 420Financial liabilities (3,557) (1,148) (4,220) (279)
Net exposure (liability)/asset (1,917) (755) (3,184) 141A10% appreciation/depreciation of the currency would result in additional gain/(loss):Impact on net income before tax for financial assets 164/(164) 39/(39) 104/(104) n/aImpact on net income before tax for financial liabilities (356)/356 (115)/115 (422)/422 n/aImpact on other comprehensive income for financial assets and liabilities - - - n/a
As at 31 March 2021 (£ millions) US Dollar Chinese Yuan Euro Others
Financial assets 1,726 342 1,118 311Financial liabilities (3,267) (1,192) (4,259) (349)
Net exposure liability (1,541) (850) (3,141) (38)
A 10% appreciation/depreciation of the currency would result in additional gain/(loss):Impact on net income before tax for financial assets 173/(173) 34/(34) 111/(111) n/aImpact on net income before tax for financial liabilities (327)/327 (119)/119 (426)/426 n/aImpact on other comprehensive income for financial assets and liabilities - - - n/a
The following table sets forth information relating to foreign currency exposure as at 31 March 2021:
As at 31 March 2020 (£ millions) US Dollar Chinese Yuan Euro Others
Financial assets 1,785 484 1,205 409Financial liabilities (2,791) (523) (4,312) (412)
Net exposure liability (1,006) (39) (3,107) (3)
A 10% appreciation/depreciation of the currency would result in additional gain/(loss):Impact on net income before tax for financial assets 178/(178) 48/(48) 120/(120) n/aImpact on net income before tax for financial liabilites (279)/279 (52)/52 (431)/431 n/aImpact on other comprehensive income for financial assets and liabilities - - - n/a
The following table sets forth information relating to foreign currency exposure as at 31 March 2020:
Commodity price risk
The Group is exposed to commodity price risk arising from the purchase of certain raw materials such as aluminium, copper, platinum and palladium. This risk is mitigated through the use of derivative contracts and fixed-price contracts with suppliers. The derivative contracts are not hedge accounted and are measured at fair value through profit or loss.
The total fair value gain on commodities of £131 million (2021: gain of £137 million, 2020: loss of £74 million) has been recognised in “Foreign exchange gain/(loss) and fair value adjustments” in the consolidated income statement. The amounts reported do not reflect the purchasing benefits received by the Group (which are included within “Material and other cost of sales”).
A 10 per cent appreciation/depreciation of all commodity prices underlying such contracts would have resulted in a gain/loss of £52 million (2021: £41 million, 2020: £49 million).
Interest rate risk
Interest rate risk is the risk that changes in market interest rates will lead to changes in interest income and expense for the Group.
In addition to issuing long-term fixed-rate bonds, the Group has other facilities in place that are primarily used to finance working capital and are subject to variable interest rates. When undertaking a new debt issuance, the JLR plc Board will consider the fixed/floating interest rate mix of the Group, the outlook for future interest rates and the appetite for certainty of funding costs.
The Group uses cross-currency interest rate swaps to convert
some of its issued debt from foreign currency denominated fixed-rate debt to GBP floating-rate debt. The derivative instruments and the foreign currency fixed-rate debt may be designated in a hedging relationship.
As at 31 March 2022, short-term borrowings of £401 million (2021: £253 million, 2020: £225 million) and long-term borrowings of £1,260 million (2021: £1,037 million, 2020: £1,260 million) were subject to a variable interest rate. An increase/decrease of 100 basis points in interest rates at the balance sheet date would result in an impact of £17 million (2021: £13 million, 2020: £15 million) in the consolidated income statement.
The risk estimates provided assume a parallel shift of 100 basis points in interest rates across all yield curves. This calculation also assumes that the change occurs at the balance sheet date and has been calculated based on risk exposures outstanding as at that date. The year-end balances are not necessarily representative of the average debt outstanding during the year.
Liquidity risk
Liquidity risk is the risk that the Group will not be able to meet its financial obligations as they fall due.
The Group’s policy on liquidity risk is to maintain sufficient liquidity in the form of cash and undrawn borrowing facilities to meet the Group’s operating requirements with an appropriate level of headroom.

129
FINANCIAL STATEMENTS
Annual Report 2021/22 J A G U A R L A N D R O V E R A U T O M O T I V E P L C
The following are the undiscounted contractual maturities of financial liabilities, including estimated interest payments:
As at 31 March 2022 (£ millions) Carrying amount
Contractual cash flows
1 year or less
1 to <2 years
2 to <5 years
5 years and over
Financial liabilitiesAccounts payable 5,144 5,144 5,144 - - -Long-term borrowings and accrued interest 5,315 6,447 246 1,045 3,356 1,800Short-term borrowings and accrued interest 1,793 1,833 1,833 - - -Lease obligations 570 944 103 85 195 561Other financial liabilities 307 325 293 32 - -Derivative financial instruments 783 1,065 510 278 275 2Total contractual maturities 13,912 15,758 8,129 1,440 3,826 2,363
As at 31 March 2021 (£ millions) Carrying amount
Contractual cash flows
1 year or less
1 to <2 years
2 to <5 years
5 years and over
Financial liabilitiesAccounts payable 6,308 6,308 6,308 - - -Long-term borrowings and accrued interest 4,972 6,075 230 1,265 3,198 1,382Short-term borrowings and accrued interest 1,206 1,239 1,239 - - -Lease obligations 519 840 103 85 201 451Other financial liabilities 445 390 383 7 - -Derivative financial instruments 407 461 255 115 91 -Total contractual maturities 13,857 15,313 8,518 1,472 3,490 1,833
As at 31 March 2020 (£ millions) Carrying amount
Contractual cash flows
1 year or less
1 to <2 years
2 to <5 years
5 years and over
Financial liabilitiesAccounts payable 6,499 6,499 6,499 - - -Long-term borrowings and accrued interest 4,817 5,828 218 739 3,430 1,441Short-term borrowings and accrued interest 526 536 536 - - -Finance lease obligations 541 903 112 90 208 493Other financial liabilities 547 513 498 11 4 -Derivative financial instruments 763 894 491 272 131 -Total contractual maturities 13,693 15,173 8,354 1,112 3,773 1,934
Credit risk
Credit risk is the risk of financial loss to the Group if a counterparty to a financial instrument fails to meet its contractual obligation. The majority of the Group’s credit risk pertains to the risk of financial loss arising from counterparty default on cash investments.
The carrying amount of financial assets represents the maximum credit exposure. None of the financial instruments of the Group result in material concentrations of credit risks.
All Group cash is invested according to strict credit criteria and actively monitored by Group Treasury in conjunction with the current market valuation of derivative contracts. To support this, the JLR plc Board has implemented an investment policy that places limits on the maximum cash investment that can be
made with any single counterparty depending on their published external credit rating.
To a lesser extent the Group has an exposure to counterparties on trade receivables and other financial assets. The Group seeks to mitigate credit risk on sales to third parties through the use of payment at the point of delivery, credit limits, credit insurance and letters of credit from banks that meet internal rating criteria.
Financial assets
None of the Group’s cash equivalents, including term deposits with banks, are past due or impaired. Regarding other financial assets that are neither past due nor impaired, there were no indications as at 31 March 2022 (2021 and 2020: no indications) that defaults in payment obligations will occur.
The Group has reviewed trade and other receivables not yet due and not impaired and no material issues have been identified.
Trade receivables past due and impaired are set out below:
Included within trade receivables is £nil (2021: £19 million, 2020: £nil) of receivables that are part of a debt factoring arrangement. These assets do not qualify for de-recognition due to the recourse arrangements in place. The related liability of £nil (2021: £19 million, 2020: £nil) is in short-term borrowings. Both the asset and associated liability are classified as amortised cost.
Off-balance sheet financial arrangements
At 31 March 2022, Jaguar Land Rover Limited (a subsidiary of the Company) had sold £191 million equivalent of trade receivables under its debt factoring facility, which was renewed during the year ended 31 March 2021 to a $500 million facility expiring March 2023.
(C) Derivatives and hedge accounting
The Group’s operations give rise to revenue, raw material purchases and borrowings in currencies other than the Group’s presentation currency of GBP. The Group forecasts these transactions over the medium term and enters into derivative contracts to mitigate the resulting foreign currency exchange risk, interest rate risk and commodity price risk. The Group’s risk management strategy allows for hedge accounting when the derivatives meet the hedge accounting criteria as set out in IFRS
9 as well as the Group’s risk management objectives.
Commodity derivatives are not hedge accounted. Foreign currency forward contracts, foreign currency options and foreign currency denominated borrowings may be designated as hedging instruments in a cash flow hedge relationship against forecast foreign currency transactions to mitigate foreign currency exchange risk associated with those transactions.
In addition, the Group uses cross-currency interest rate swaps to hedge its foreign currency exchange risk associated with recognised borrowings. These instruments may be designated in both cash flow and fair value hedging relationships, or may be economic hedges of debt. The Group also manages foreign exchange risk on recognised borrowings using FX swaps. The Group utilises FX spot & FX swap contracts to manage operational requirements.
The gain/(loss) on the derivatives that are not designated in hedging relationships, whose fair value movements are recognised in ‘Foreign exchange gain/(loss) and fair value adjustments’ in the consolidated income statement, is as follows:
As at 31 March (£ millions)
2022 Gross 2022 impairment
2022 Net carrying
value2021 Gross 2021
impairment2021 Net
carrying value
2020 Gross 2020 impairment
2020 Net carrying
value
Not yet due 640 (2) 638 747 (2) 745 675 (2) 673Overdue <3 months 74 - 74 88 - 88 141 (1) 140Overdue 3-6 months 8 - 8 10 - 10 10 (1) 9Overdue >6 months 4 (2) 2 25 (5) 20 18 (7) 11Total 726 (4) 722 870 (7) 863 844 (11) 833
In all cases the Group uses a hedge ratio of 1:1. The critical terms of the derivative contracts are aligned with those of the hedged item. The Group allows a maximum hedging term of five years for forecast transactions. The Group’s risk management policy allows for decreasing levels of hedging as the forecasting horizon increases.
A 10 per cent depreciation/appreciation in Sterling against the foreign currency underlying contracts within the Group’s
derivative portfolio that are sensitive to changes in foreign exchange rates (including the impact to the fair value adjustment of foreign currency borrowings designated as the hedged item in a fair value hedge relationship) would have resulted in the approximate additional (loss)/gain shown in the table on the following page:
Year ended 31 March (£ millions) 2022 2021 2020
Commodity derivative contracts 131 137 (74)
Foreign currency derivative contracts 72 (77) 27
Interest rate derivative contracts 25 (47) -
Total gain/(loss) 228 13 (47)

131
FINANCIAL STATEMENTS
Annual Report 2021/22 J A G U A R L A N D R O V E R A U T O M O T I V E P L C
The following table sets out the change in the Group’s exposure to interest rate risk as a result of hedge accounted cross-currency interest rate swaps:
Foreign currency receivableaverage interest rate
Reporting currency payableaverage interest rate
Outstanding contracts% % % % % %
2022 2021 2020 2022 2021 2020
Cross currency interest rate swaps< 1 year - - - - - -Between 1-5 years 4.500 - - SONIA + 4.777 - ->5 years 4.500 4.500 4.500 LIBOR + 2.033 LIBOR + 3.235 LIBOR + 3.235
As at 31 March (£ millions) 2022 2021 2020
100 basis points depreciation in interest ratesIn the consolidated income statement (22) (1) (7)
100 basis points appreciation in interest ratesIn the consolidated income statement 21 1 4
The following table shows the impact that would result from interest rate derivatives and any related hedging relationships given an increase/decrease of 100 basis points in interest rates at the balance sheet date:
Cash flow hedges
The Group uses foreign currency options, foreign currency forward contracts and recognised foreign currency borrowings as the hedging instruments in cash flow hedge relationships of hedged sales and purchases. The time value of options and the foreign currency basis spread of foreign exchange forward contracts are excluded from the hedge relationship and are recognised in other comprehensive income as a cost of hedging to the extent they relate to the hedged item (the aligned value). Additionally, the Group uses cross-currency interest rate swaps as the hedging instrument of the foreign exchange risk of recognised foreign currency borrowings.
Changes in the fair value of foreign currency contracts, to the extent determined to be an effective cash flow hedge, are recognised in the consolidated statement of comprehensive income, and the ineffective portion of the fair value change is recognised in the consolidated income statement. There is not generally expected to be significant ineffectiveness from cash flow hedges.
It is anticipated that the hedged sales will take place over the next one to five years, at which time the amount deferred in equity will be reclassified to revenue in the consolidated income statement.
It is anticipated that the hedged purchases will take place over the next one to five years, at which time the amount deferred in equity will be included in the carrying amount of the raw materials. On sale of the finished product, the amount previously deferred in equity and subsequently recognised in inventory will be reclassified to material and other cost of sales in the consolidated income statement.
The foreign currency borrowings designated as the hedged item mature in January 2026 and October 2027, at which time the amount deferred in equity will be reclassified to the consolidated income statement.
As at 31 March (£ millions) 2022 2021 2020
10% depreciation in Sterling against the foreign currency:In other comprehensive income (1,119) (571) (547)In the consolidated income statement 476 299 64
10% appreciation in Sterling against the foreign currency:In other comprehensive income 959 480 554In the consolidated income statement (369) (231) (36)
The table below sets out the timing profile of the hedge accounted derivatives:
As at 31 March Average strike rate Nominal amounts Carrying value assets / (liabilities)
Outstanding contracts2022 2021 2020 2022 2021 2020 2022 2021 2020
£m £m £m £m £m £m
Cash flow hedges of foreign exchange risk on forecast transactionsDerivative instrumentsSell - USD<1 year 0.7604 0.7596 0.7229 2,882 2,833 1,766 5 136 (157)Between 1-5 years 0.7361 0.7654 0.7649 3,734 3,096 5,098 (77) 172 (190)
Sell - Chinese Yuan<1 year 0.1094 0.1098 0.1086 2,819 1,647 1,601 (235) 12 (59)Between 1-5 years 0.1123 0.1088 0.1096 3,521 629 1,189 (126) 11 (20)
Buy - Euro<1 year 0.8875 0.9069 0.9109 2,892 2,695 2,635 (111) (136) 1Between 1-5 years 0.8860 0.9010 0.9101 1,254 1,899 3,384 (5) (81) (17)
Other currencies<1 year 873 1,145 905 (17) 24 55Between 1-5 years 870 846 1,238 (28) 7 39
Total cash flow hedges of foreign exchange risk on forecast transactions 18,845 14,790 17,816 (594) 145 (348)Hedges of foreign exchange risk on recognised debtCross currency interest rate swapsUSD< 1 year - - - - - - - - -Between 1-5 years - - - - - - - - ->5 years 0.7592 0.7592 0.7592 380 380 380 1 7 57
EUR< 1 year - - - - - - - - -Between 1-5 years 0.8912 - - 446 - - (39) - ->5 years - 0.8912 0.8912 - 446 446 - (14) 3
Total cash flow hedges of foreign exchange risk on recognised debt 826 826 826 (38) (7) 60
The line items in the consolidated balance sheet that include the above derivative instruments are “Other financial assets” and “Other financial liabilities”.

133
FINANCIAL STATEMENTS
Annual Report 2021/22 J A G U A R L A N D R O V E R A U T O M O T I V E P L C
The following table sets out the effect of the Group’s cash flow hedges on the financial performance of the Group:
Fair value hedges
The Group uses cross-currency interest rate swaps as the hedging instrument in a fair value hedge of foreign exchange and interest rate risks of foreign currency denominated debt. The derivatives convert foreign currency USD fixed-rate borrowings to GBP floating-rate debt.
Changes in the fair value of foreign currency contracts that are designated in fair value hedging relationships are recognised in the consolidated income statement. Changes in the fair value of the underlying hedged item (long-term borrowings) for the hedged risks are recognised in the same income statement line.
Year ended 31 March (£ millions) 2022 2021 2020
Fair value (loss)/gain of foreign currency derivative contracts recognised in hedging reserves (816) 446 (254)
Fair value loss of foreign currency borrowings recognised in hedging reserves - - (7)
Fair value gain/(loss) of derivatives hedging foreign currency borrowings recognised in hedging reserves 5 (9) 2
(Loss)/gain recognised in other comprehensive income in the year (811) 437 (259)Gain/(loss) reclassified from cash flow hedging reserve and recognised in ‘Revenue’ in the income statement 75 (112) (565)
Gain reclassified from cash flow hedging reserve and recognised in Foreign exchange gain/(loss) and fair value adjustments’ in the income statement on account of forecast transactions no longer expected to occur
10 3 -
Gain reclassified from cost of hedging reserve and recognised in Foreign exchange gain/(loss) and fair value adjustments’ in the income statement on account of forecast transactions no longer expected to occur
- - 2
Gain/(loss) reclassified to profit and loss in the year 85 (109) (563)Net change in the hedged item used for assessing hedge effectiveness (762) 534 172Gain/(loss) on derivatives not hedge accounted, recognised in 'Foreign exchange gain/(loss) and fair value adjustments' in the income statement 72 (77) 27
As at 31 March (£ millions) 2022 2021 2020
Other financial assets - current - - -Other financial assets - non-current 1 7 60Total financial assets 1 7 60Other financial liabilities - current - - -Other financial liabilities - non-current 39 14 -Total financial liabilities 39 14 -
The fair value of the cross-currency interest rate swaps, included in “Derivatives in hedging relationship” in section (A), are as follows:
Year ended 31 March (£ millions) 2022 2021 2020
Net gain/(loss) in the hedged item used for assessing hedge effectiveness, taken to the consolidated income statement in ‘Foreign exchange gain/(loss) and fair value adjustments’ 51 108 (78)Fair value changes in the derivative instruments used in assessing hedge effectiveness, taken to the consolidated income statement in ‘Foreign exchange gain/(loss) and fair value adjustments’ (36) (58) 61Ineffectiveness recognised in the consolidated income statement in ‘Foreign exchange gain/(loss) and fair value adjustments’ 15 50 (17)
The following amounts have been recognised in relation to fair value hedges in the consolidated income statement:
36 Leases
At inception of a contract, the Group assesses whether a contract is, or contains a lease. A contract is, or contains, a lease if the contract conveys the right to control the use of an identified asset for a period of time in exchange for consideration. To assess whether a contract conveys the right to control the use of an identified asset, the Group assesses whether:
• The contract involves the use of an identified asset – this may be specified explicitly or implicitly, and should be physically distinct or represent substantially all of the capacity of a physically distinct asset. If the supplier has a substantive substitution right, then the asset is not identified;
• The Group has the right to substantially all of the economic benefits from the use of the asset throughout the period of use; and
• The Group has the right to direct the use of the asset. The Group has this right when it has the decision making rights that are most relevant to changing how and for what purposes the asset is used. In rare cases where the decision about how and for what purpose the asset is used is predetermined, the Group has the right to direct the use of the asset if either:
• The Group has the right to operate the asset; or
• The Group designed the asset in a way that predetermines how and for what purposes it will be used.
At inception or on reassessment of a contract that contains a lease component, the Group allocates the consideration in the contract to each lease component on the basis of their relative stand-alone prices.

135
FINANCIAL STATEMENTS
Annual Report 2021/22 J A G U A R L A N D R O V E R A U T O M O T I V E P L C
The Group recognises a right-of-use asset and a lease liability at the lease commencement date. The right-of-use asset is initially measured at cost, which comprises of the initial amount of the lease liability adjusted for any lease payments made at or before the commencement date, plus any initial direct costs incurred and an estimate of costs to dismantle and remove the underlying asset or to restore the underlying asset or the site on which it is allocated, less any lease incentives received.
The right-of-use asset is subsequently depreciated using the straight-line method over the shorter of the useful life of the leased asset and the expected lease term. If ownership of the leased asset is automatically transferred at the end of the lease term or the exercise of a purchase option is reflected in the lease payments, the right-of-use asset is amortised on a straight-line basis over the expected useful life of the leased asset.
The lease liability is initially measured at the present value of the lease payments that are not paid at the commencement date, discounted using the interest rate implicit in the lease or, if that rate cannot be readily determined, the Group’s incremental borrowing rate. Generally, the Group uses its incremental borrowing rate as a discount rate. The lease liability is measured at amortised cost using the effective interest method. It is remeasured when there is a change in future lease payments. The Group has elected not to recognise right-of-use assets and lease liabilities for short-term leases that have a lease term of 12 months or less and leases of low value assets. The Group recognises the lease payments associated with these leases as an expense on a straight-line basis over the lease term.
Lease payments include fixed payments, i.e. amounts expected to be payable by the Company under residual value guarantee, the exercise price of purchase options and lease payments in relation to lease extension options, if the Company is reasonably certain to exercise purchase or extension options, and payment of penalties for terminating the lease if the lease term considered reflects that the Company shall exercise a termination option.
The Group applies the practical expedient to not assess whether rent concessions occurring as a direct consequence of the COVID-19 pandemic that meet the following conditions are lease modifications:
• The change in lease payments results in revised consideration that is substantially the same, or less than the consideration for the lease immediately preceding the change;
• Any reduction in lease payments affects only payments originally due on or before 30 June 2022; and
• There no substantive changes to other terms and conditions of the lease.
Changes to lease payments for such leases are accounted for as if they are not lease modifications.
The Group leases a number of buildings, plant and equipment, IT hardware and software assets, certain of which have a renewal and/or purchase options in the normal course of the business. Extension and termination options are included in a number of leases across the Group. These are used to maximise operational flexibility in terms of managing the assets used in the Group’s operation. The majority of extension and termination options held are exercisable only by the Group and not by the respective lessor. The Group assesses at lease commencement whether it is reasonably certain to exercise the extension or termination option. The Group re-assesses whether it is reasonably certain to exercise options if there is a significant event or significant change in circumstances within its control. The Group’s leases mature between 2022 and 2052.
There are no leases with residual value guarantees.
Leases as a lessee
Information about leases for which the Group is a lessee is presented below.
Right-of-use assets
£ millions Land and buildings Computers Plant and
equipment Vehicles Fixtures and fittings Other Total
Balance at 31 March 2022 504 6 41 3 13 1 568Balance at 31 March 2021 475 6 45 3 12 2 543Balance at 31 March 2020 483 7 56 6 13 3 568
Depreciation charge for the year ended 31 March 2022 60 4 17 3 1 2 87
Depreciation charge for the year ended 31 March 2021 63 7 17 5 1 1 94
Depreciation charge for the year ended 31 March 2020 62 8 17 3 1 1 92
Additions to right-of-use assets during the year ended 31 March 2022 was £131 million (2021: £70 million, 2020: £83 million).
The Group has entered into a sale and leaseback transaction in the current year. The transfer of the Group asset did not satisfy the sale requirements of IFRS 15 and, therefore, is still retained on the Group balance sheet. A financial liability was recognised equal to the transfer proceeds of £33 million in accordance with IFRS 9 in borrowings in note 25. The lessee accounting principles described above under IFRS 16 have been applied to the leaseback transaction, with the right of use asset of £94 million recognised in land and buildings.
Lease liabilities
The maturity analysis of the contractual undiscounted cash flows is as follows:
As at 31 March (£ millions) 2022 2021 2020
Less than one year 103 103 112Between one and five years 280 286 298More than five years 561 451 493Total undiscounted lease liabilities 944 840 903
The following amounts are included in the consolidated balance sheet:
As at 31 March (£ millions) 2022 2021 2020
Current lease liabilities 62 65 73Non-current lease liabilities 508 454 468Total lease liabilities 570 519 541
The following amounts are recognised in the consolidated income statement:
Year ended 31 March (£ millions) 2022 2021 2020
Interest expense on lease liabilities 45 44 45Expenses related to short-term leases 10 9 13Expenses related to low-value assets, excluding short-term leases of low-value assets 9 7 7
Expense/(credit) in lease payments arising from COVID-19 rent concessions 1 (3) -
Included in undiscounted lease liability maturities above is £1 million (2021: £15 million, 2020: £nil) in relation to leases committed but not yet commenced at the balance sheet date.

137
FINANCIAL STATEMENTS
Annual Report 2021/22 J A G U A R L A N D R O V E R A U T O M O T I V E P L C
The following amounts are recognised in the consolidated cash flow statement:
Year ended 31 March (£ millions) 2022 2021 2020
Cash payments for the principal portion of lease liabilities (within ‘payments of lease obligations’) 71 79 72
Cash payments for interest expense related to lease liabilities (within ‘finance expenses and fees paid’) 45 44 45
Total cash outflow for leases 116 123 117
Leases as a lessor
The majority of the leases where the Group is a lessor are in relation to vehicles. The Group classifies these as operating leases, because they do not transfer substantially all of the risks and rewards incidental to the ownership of the assets.
The maturity analysis of lease payments, showing the undiscounted lease payments to be received after the reporting date, are as follows:
As at 31 March (£ millions) 2022 2021 2020
Less than one year 4 3 5Between one and five years 3 2 2More than five years 12 11 11Total undiscounted lease payments to be received 19 16 18
37 Segmental reporting
Operating segments are defined as components of the Group about which separate financial information is available that is evaluated regularly by the chief operating decision-maker, or decision-making group, in deciding how to allocate resources and in assessing performance.
The Group operates in the automotive segment. The automotive segment includes all activities relating to design, development,
manufacture and marketing of vehicles including financing thereof, as well as sale of related parts and accessories and services from which the Group derives its revenues. The Group has only one operating segment, so no separate segment report is given.
The geographic spread of sales by customer location and non-current assets is as disclosed below:
(£ millions) UK US Rest of Europe
Rest of World China Total
31 March 2022Revenue 3,164 4,320 3,248 3,412 4,176 18,320Non-current assets 10,311 60 982 203 131 11,687
31 March 2021Revenue 3,790 4,664 3,563 3,153 4,561 19,731Non-current assets 10,932 53 1,047 218 141 12,391
31 March 2020Revenue 4,724 5,614 4,757 4,601 3,288 22,984Non-current assets 12,028 58 1,196 209 169 13,660
38 Notes to the Consolidated Cash Flow Statement
(A) Reconciliation of loss for the year to cash generated from operating activities
Year ended 31 March (£ millions) Note 2022 2021 2020
Loss for the year (822) (1,100) (469)
Adjustments for:
Depreciation and amortisation 1,944 1,976 1,910
Write-down of tangible assets 10 3 - -Write-down of intangible assets 10 9 40 -(Profit)/loss on disposal of assets 13 (1) (1) 20Foreign exchange and fair value loss/(gain) on loans 13 141 (314) 135Income tax expense 14 367 239 47Finance expense (net) 12 369 251 209Finance income 12 (9) (11) (52)Foreign exchange (gain)/loss on economic hedges of loans 13 (91) 143 (29)Foreign exchange gain on derivatives 13 - (14) (15)Foreign exchange loss/(gain) on balance sheet revaluation 89 (272) 122Foreign exchange (gain)/loss on other restricted deposits (2) 1 2Foreign exchange (gain)/loss on short-term deposits (2) 46 (14)Foreign exchange (gain)/loss on cash and cash equivalents (99) 162 (58)Unrealised (gain)/loss on commodities 13 (48) (137) 78(Gain)/loss on matured revenue hedges - (6) 81Share of loss of equity accounted investments 15 18 41 114Fair value (gain)/loss on equity investments 13 (4) (2) 43Exceptional items 4 43 1,523 29Other non-cash adjustments 3 (5) 2
Cash flows from operating activities before changes in assets and liabilities 1,908 2,560 2,155Trade receivables 154 (61) 541 Other financial assets 8 (35) 44 Other current assets (13) 54 112 Inventories 254 459 147 Other non-current assets (433) 397 (420)Accounts payable (1,166) 11 (652)Other current liabilities 27 (53) 49 Other financial liabilities (95) (130) (19)Other non-current liabilities and retirement benefit obligation 287 (477) 355 Provisions (359) (189) 87 Cash generated from operations 572 2,536 2,399

139
FINANCIAL STATEMENTS
Annual Report 2021/22 J A G U A R L A N D R O V E R A U T O M O T I V E P L C
(B) Reconciliation of movements of liabilities to cash flows arising from financing activities
(£ millions) Borrowings Lease obligations
Interest accrued Total
Balance at 1 April 2019 4,480 31 33 4,544Cash flowsProceeds from issue of financing 1,602 - - 1,602Repayment of financing (939) (72) - (1,011)Arrangement fees paid (9) - - (9)Interest paid - (45) (185) (230)Non-cash movementsAdjustment on initial application of IFRS 16 - 499 - 499Issue of new finance leases - 79 - 79Interest accrued - 45 214 259Reclassification of long-term debt - - - -Foreign exchange 148 4 3 155Fee amortisation 10 - - 10Reclassification of long-term debt fees - - - -Long-term borrowings revaluation in hedge reserve 11 - - 11Fair value adjustment on loans 40 - - 40
Balance at 31 March 2020 5,343 541 65 5,949Cash flowsProceeds from issue of financing 1,953 - - 1,953Repayment of financing (749) (79) - (828)Arrangement fees paid (11) - - (11)Interest paid - (44) (249) (293)Non-cash movementsIssue of new leases - 71 - 71Interest accrued - 44 271 315Reclassification of long-term debt - - - -Foreign exchange (323) (14) (3) (340)Fee amortisation 11 - - 11Fair value adjustment on loans (46) - - (46)Balance at 31 March 2021 6,178 519 84 6,781Cash flowsProceeds from issue of financing 2,095 - - 2,095Repayment of financing (1,347) (71) - (1,418)Arrangement fees paid (13) - - (13)Interest paid - (45) (322) (367)Non-cash movementsIssue of new leases - 136 - 136Lease terminations - (27) - (27)Interest accrued - 45 331 376Foreign exchange 169 13 2 184Fee amortisation 11 - - 11Fair value adjustment on loans (66) - - (66)Balance at 31 March 2022 7,027 570 95 7,692
39 Related party transactions
Tata Sons Private Limited is a company with significant influence over the Group’s ultimate parent company Tata Motors Limited. The Group’s related parties therefore include Tata Sons Private Limited, subsidiaries and joint ventures of Tata Sons Private
Limited and subsidiaries, joint ventures and associates of Tata Motors Limited. The Group routinely enters into transactions with its related parties in the ordinary course of business, including transactions for the sale and purchase of products with its joint ventures, and IT and consultancy services received from subsidiaries of Tata Sons Private Limited.
(£ millions) Joint ventures Associates and their subsidiaries
Tata Sons Private Limited, its subsidiaries
and joint ventures
Immediate or ultimate parent and its subsidiaries, joint ventures and associates
31 March 2022Sale of products 263 - 2 26Purchase of goods 39 - - 82Services received - - 152 72Services rendered 97 - - 1Trade and other receivables 30 - - 25Accounts payable - - 16 3031 March 2021Sale of products 284 - 2 15Purchase of goods - - 1 72Services received - 1 123 68Services rendered 111 - - 1Trade and other receivables 48 - 1 32Accounts payable - - 13 4331 March 2020Sale of products 217 - 2 54Purchase of goods - - 1 120Services received - 3 150 91Services rendered 111 - - 1Dividends received 67 - - -Investments in the year 67 6 - -Trade and other receivables 67 - 1 20Accounts payable - - 11 48
Compensation of key management personnel
Year ended 31 March (£ millions) 2022 2021 2020Short-term benefits 20 15 10Post-employment benefits - 2 -Other long-term employee benefits (1) 2 3Compensation for loss of office 5 - 1Total compensation of key management personnel 24 19 14
40 Ultimate parent company and parent company of larger group
The immediate parent undertaking is TML Holdings Pte.Ltd. (Singapore), which is the parent for the smallest group to consolidate these financial statements. The ultimate parent undertaking and controlling party is Tata Motors Limited, India, which is the parent of the largest group to consolidate these financial statements.
Copies of the TML Holdings Pte. Ltd. (Singapore) consolidated financial statements can be obtained from the Company Secretary, TML Holdings Pte. Ltd., 9 Battery Road #15-01 MYP Centre, Singapore 049910.
Copies of the Tata Motors Limited, India consolidated financial statements can be obtained from the Company Secretary, Tata Motors Limited, Bombay House, 24, Homi Mody Street, Mumbai-400001, India.
41 Subsequent events
There have been no material subsequent events between the balance sheet date and the date of signing this report.
Included within ‘finance expenses and fees paid’ in the consolidated cash flow statement is £22 million (2021: £9 million, 2020: £25 million) of cash interest paid relating to other assets and liabilities not included in the reconciliation above.
All transactions with related parties are conducted under normal terms of business and all amounts outstanding are unsecured and will be settled in cash.
Transactions and balances with the Group’s own subsidiaries are eliminated on consolidation.
The table below summarises related party transactions and balances not eliminated in the consolidated financial statements.

141
FINANCIAL STATEMENTS
Annual Report 2021/22 J A G U A R L A N D R O V E R A U T O M O T I V E P L C
PARENT COMPANY FINANCIAL STATEMENTS
PARENT COMPANY BALANCE SHEET
As at 31 March (£ millions) Note 2022 2021 2020
Non-current assetsInvestments 42 1,655 1,655 1,655 Other financial assets 43 5,288 4,964 4,770 Other non-current assets 44 4 - 1
Total non-current assets 6,947 6,619 6,426 Current assetsOther financial assets 43 1,727 1,074 958Other current assets 44 4 1 1 Cash and cash equivalents - - -Total current assets 1,731 1,075 959Total assets 8,678 7,694 7,385Current liabilitiesOther financial liabilities 46 85 82 65 Deferred finance income 6 1 2 Short-term borrowings 47 1,180 524 424 Current tax liabilities 4 5 5 Total current liabilities 1,275 612 496 Non-current liabilitiesLong-term borrowings 47 5,280 4,959 4,759 Deferred finance income 37 33 34 Total non-current liabilities 5,317 4,992 4,793 Total liabilities 6,592 5,604 5,289 Equity attributable to equity holders of the parentOrdinary shares 48 1,501 1,501 1,501 Capital redemption reserve 48 167 167 167 Retained earnings 418 422 428Equity attributable to equity holders of the parent 2,086 2,090 2,096Total liabilities and equity 8,678 7,694 7,385
The Company has elected to take the exemption under section 408 of the Companies Act 2006 from presenting the parent company income statement. The loss for the Company for the year was £4 million (2021: loss of £6 million, 2020: loss of £21 million).
These parent company financial statements were approved by the JLR plc Board and authorised for issue on 13 June 2022.
They were signed on its behalf by:
THIERRY BOLLORÉCHIEF EXECUTIVE OFFICERCOMPANY REGISTERED NUMBER: 06477691
The notes on pages 142 to 153 are an integral part of these financial statements.
(£ millions) Ordinary share capital
Capital redemption
reserve
Retained earnings Total equity
Balance at 1 April 2021 1,501 167 422 2,090Loss for the year - - (4) (4)
Total comprehensive expense - - (4) (4)Dividend - - - -Balance at 31 March 2022 1,501 167 418 2,086
Balance at 1 April 2020 1,501 167 428 2,096Loss for the year - - (6) (6)Total comprehensive expense - - (6) (6)Dividend - - - -Balance at 31 March 2021 1,501 167 422 2,090
Balance at 1 April 2019 1,501 167 449 2,117Loss for the year - - (21) (21)Total comprehensive expense - - (21) (21)Dividend - - - -Balance at 31 March 2020 1,501 167 428 2,096
PARENT COMPANY STATEMENT OF CHANGES IN EQUITY
PARENT COMPANY CASH FLOW STATEMENT
Year ended 31 March (£ millions) 2022 2021 restated* 2020 restated*
Cash flows from operating activities
Loss for the year (4) (6) (21)
Adjustments for:
Income tax expense - - 1
Allowances for other financial assets 3 7 24
Finance income (319) (259) (223)
Finance expense 320 257 222
Cash flows (used in)/generated from operating activities before changes in assets and liabilities - (1) 3
Other financial assets - 3 (5)
Other current liabilities 4 (2) -
Net cash used in operating activities 4 - (2)
Cash flows from investing activities
Finance income received 323 236 198
Loans made to subsidiaries (1,417) (1,034) (1,486)
Repayments of loans by subsidiaries 558 425 826
Dividends received - - -
Net cash used in investing activities (536) (373) (462)
Cash flows from financing activities
Finance expenses and fees paid (327) (236) (196)
Proceeds from issuance of borrowings 1,417 1,034 1,486
Repayment of borrowings (558) (425) (826)
Net cash generated from financing activities 532 373 464
Net change in cash and cash equivalents - - -
Cash and cash equivalents at beginning of year - - -
Cash and cash equivalents at end of year - - -
The notes on pages 142 to 153 are an integral part of these financial statements.
The notes on pages 142 to 153 are an integral part of these financial statements.
*The Company has been presenting cash flows relating to loans to its subsidiaries as “cash flows from operating activities”. The Company has changed the presentation of these cash flows to be “cash flows from investing activities” from the year ended 31 March 2022 as the directors consider this presentation to better reflect the underlying nature of the transactions, and accordingly reclassified the comparative amounts for the prior periods.

143
FINANCIAL STATEMENTS
Annual Report 2021/22 J A G U A R L A N D R O V E R A U T O M O T I V E P L C
NOTES TO THE PARENT COMPANY FINANCIAL STATEMENTS
42 Investments
Investments consist of the following:
As at 31 March (£ millions) 2022 2021 2020
Cost of unquoted equity investments at beginning and end of year 1,655 1,655 1,655
The Company has not made any investments or disposals of investments in the year.
The Company has the following 100 per cent direct interest in the ordinary shares of a subsidiary undertaking:
The shareholding above is recorded at acquisition value in the Company’s accounts. Details of the indirect subsidiary undertakings are as follows:
Subsidiary undertaking Principle place of business and country of incorporation Registered office address
Jaguar Land Rover Holdings Limited England and Wales Abbey Road, Whitley, Coventry, CV3 4LF, England
Name of company Shareholding Principle place of business and country of incorporation
Registered office address
Jaguar Land Rover Limited 100% England and Wales Abbey Road, Whitley, Coventry, CV3 4LF, England
Jaguar Land Rover North America, LLC. 100% USA 100 Jaguar Land Rover Way, Mahwah, NJ 07495, USA
Jaguar Land Rover Deutschland GmbH 100% Germany Campus Kronberg 7, 61476, Kronberg im Taunus,
GermanyJaguar Land Rover Belux N.V. 100% Belgium Generaal Lemanstraat 47,
2018 Antwerpen, BelgiumJaguar Land Rover Austria GmbH 100% Austria Siezenheimer Strasse 39a,
5020 Salzburg, AustriaJaguar Land Rover Italia SpA 100% Italy Via Alessandro Marchetti,
105 - 00148, Roma, ItalyJaguar Land Rover Australia Pty Ltd 100% Australia 189 O’Riordan Street,
Mascot, 2020, NSW, Australia
Jaguar Land Rover Espana SL 100% Spain Torre Picasso, Plaza Pablo Ruiz Picasso, 1 – Planta 42,
28020 Madrid, SpainJaguar Land Rover Nederland BV 100% Holland PO Box 40, Stationsweg
8, 4153 RD Beesd, Netherlands
Jaguar Land Rover Portugal -Veiculos e Pecas, Lda. 100% Portugal Rua. Do Pólo Sul Nº2 - 3ºB-3, Parque das Naçoes,
1990- 273, Lisboa, PortugalJaguar Land Rover (China) Investment Co., Ltd (formerly Jaguar Land Rover Automotive Trading (Shanghai) Co. Ltd)
100% China 11F, No.06 (Building D) The New Bund World Trade
Center (Phase II), Lane 227 Dongyu Road, Pudong New District, Shanghai 200126,
China
Name of company Shareholding Principle place of business and country of incorporation Registered office address
Shanghai Jaguar Land Rover Automotive Service Co. Ltd 100% China 11F, No.06 (Building D) The New Bund World Trade
Center (Phase II), Lane 227 Dongyu Road, Pudong New
District, Shanghai 20012, China
Jaguar Land Rover Japan Limited 100% Japan 3-13 Toranomon 4-chome, Minato-ku, Tokyo, Japan, 45
Jaguar Land Rover Korea Co. Limited 100% Korea 25F West Mirae Asset Center 1 Building 67 Suha-dong, Jung-gu Seoul 100-210,
KoreaJaguar Land Rover Canada ULC 100% Canada 75 Courtneypark Drive West,
Unit 3 Mississauga, ON L5W 0E3,Canada
Jaguar Land Rover France SAS 100% France Z.A. Kleber – Batiment Ellington, 165 Boulevard de
Valmy, 92706 Colombes, Cedex, France
Jaguar e Land Rover Brasil Indústria e Comércio de Veículos LTDA
100% Brazil Avenida Ibirapuera 2.332, Torre I - 10º andar- Moema,
04028-002, São Paulo, SP, Brazil
Jaguar Land Rover Limited Liability Company 100% Russia 28B, Building 2 Mezhdunarodnoe Shosse
141411, Moscow, Russian Federation
Jaguar Land Rover (South Africa) Holdings Limited 100% England and Wales Abbey Road, Whitley, Coventry, CV3 4LF, England
Jaguar Land Rover (South Africa) (Pty) Limited 100% South Africa Simon Vermooten Road, Silverton, Pretoria 0184,
South AfricaJaguar Land Rover India Limited 100% India Nanavati Mahalaya, 3rd
floor, 18, Homi Mody Street, Mumbai, Maharashtra, India
400001Daimler Transport Vehicles Limited (dormant) 100% England and Wales Abbey Road, Whitley,
Coventry, CV3 4LF, EnglandS S Cars Limited (dormant) 100% England and Wales Abbey Road, Whitley,
Coventry, CV3 4LF, EnglandThe Lanchester Motor Company Limited (dormant) 100% England and Wales Abbey Road, Whitley,
Coventry, CV3 4LF, EnglandThe Daimler Motor Company Limited (dormant) 100% England and Wales Abbey Road, Whitley,
Coventry, CV3 4LF, EnglandJaguar Land Rover Pension Trustees Limited (dormant) 100% England and Wales Abbey Road, Whitley,
Coventry, CV3 4LF, EnglandJLR Nominee Company Limited (non-trading) 100% England and Wales Abbey Road, Whitley,
Coventry, CV3 4LF, EnglandJaguar Cars Limited (dormant) 100% England and Wales Abbey Road, Whitley,
Coventry, CV3 4LF, EnglandLand Rover Exports Limited (non-trading) 100% England and Wales Abbey Road, Whitley,
Coventry, CV3 4LF, EnglandLand Rover Ireland Limited (non-trading) 100% Ireland c/o LK Shields Solicitors,
39/40 Upper Mount Street, Dublin 2, Ireland
Jaguar Cars South Africa (Pty) Ltd (dormant) 100% South Africa Simon Vermooten Road, Silverton, Pretoria 0184,
South AfricaJaguar Land Rover Slovakia s.r.o. 100% Slovakia Horné lúky, 4540/1, 949 01
Nitra, SlovakiaJaguar Land Rover Singapore Pte. Ltd 100% Singapore 138 Market Street,
CapitaGreen, Singapore, 048946

145
FINANCIAL STATEMENTS
Annual Report 2021/22 J A G U A R L A N D R O V E R A U T O M O T I V E P L C
Name of company Shareholding Principle place of business and country of incorporation Registered office address
Jaguar Racing Limited 100% England and Wales Abbey Road, Whitley, Coventry, CV3 4LF, England
In-Car Ventures Limited 100% England and Wales Abbey Road, Whitley, Coventry, CV3 4LF, England
InMotion Ventures Limited 100% England and Wales Abbey Road, Whitley, Coventry, CV3 4LF, England
InMotion Ventures 2 Limited 100% England and Wales Abbey Road, Whitley, Coventry, CV3 4LF, England
InMotion Ventures 3 Limited 100% England and Wales Abbey Road, Whitley, Coventry, CV3 4LF, England
Jaguar Land Rover Colombia SAS (dormant) 100% Colombia CL 67735 OFE, 1204 Bogotan Cundinamarka 1 3192 900,
ColombiaJaguar Land Rover México, S.A.P.I. de C.V. 100% Mexico Av. Javier Barros Sierra
No.540 Piso 7 Oficina 703, Col. Santa Fe la Fe Del., Alvaro
Obregón, México, D.F. C.P. 01210
Jaguar Land Rover Servicios México, S.A. de C.V. 100% Mexico Av. Javier Barros Sierra No.540 Piso 7 Oficina 703,
Col. Santa Fe la Fe Del., Alvaro Obregón, México, D.F. C.P.
01210Jaguar Land Rover Taiwan Company LTD 100% Taiwan 12F, No. 40, Sec. 1, Chengde
Road, Datong Dist., Taipei, City 103, Taiwan (R.O.C.)
Jaguar Land Rover Ireland (Services) Limited 100% Ireland C/o LK Shields Solicitors 39/40 Upper Mount Street
Dublin 2 IrelandJaguar Land Rover Classic USA LLC (dormant) 100% USA 251 Little Falls Drive,
Wilmington, Delaware, USAJaguar Land Rover Classic Deutschland GmbH 100% Germany Ringstraße 38, 45219 Essen,
GermanyJaguar Land Rover Hungary KFT 100% Hungary Regus Capital Square, Vaci ut
76, 1133, Budapest, HungaryJaguar Land Rover (Ningbo) Trading Co., Ltd. 100% China Office Building 12, No.1
Meishan Salt, Beilun District, Ningbo, Zhejiang Province,
ChinaJaguar Land Rover Ventures Limited 100% England and Wales Abbey Road, Whitley,
Coventry, CV3 4LF, EnglandBowler Motors Limited 100% England and Wales Abbey Road, Whitley,
Coventry, CV3 4LF, England
Details of the indirect holdings in equity accounted investments are given in note 15 to the consolidated financial statements.
43 Other financial assets
As at 31 March (£ millions) 2022 2021 2020
Non-current
Receivables from subsidiaries 5,288 4,964 4,770
Current
Receivables from subsidiaries 1,727 1,074 958
44 Other assets
As at 31 March (£ millions) 2022 2021 2020
Non-current
Prepaid expenses 4 - 1
Current
Prepaid expenses 4 1 1
45 Deferred tax assets and liabilities
As at 31 March 2022, 2021 and 2020 the Company has recognised no deferred tax assets or liabilities.
46 Other financial liabilities
As at 31 March (£ millions) 2022 2021 2020
Current
Interest accrued 84 79 62
Other 1 3 3
Total current other financial liabilities 85 82 65
47 Interest-bearing loans and borrowings
As at 31 March (£ millions) 2022 2021 2020
EURO MTF listed debt 4,020 3,922 3,518
Bank loans 1,260 1,037 1,241
Long-term borrowings 5,280 4,959 4,759
Current portion of EURO MTF listed debt 779 399 299
Current portion of long-term bank loans 401 125 125
Short-term borrowings 1,180 524 424
£5,288 million (2021: £4,964 million, 2020: £4,770 million) of non-current receivables from subsidiaries and £1,260 million (2021: £599 million, 2020: £487 million) of current receivables from subsidiaries comprise of loans to indirect subsidiaries
under terms matching the external interest-bearing loans and borrowings given in note 47.

147
FINANCIAL STATEMENTS
Annual Report 2021/22 J A G U A R L A N D R O V E R A U T O M O T I V E P L C
Euro MTF listed debt
The bonds are listed on the Luxembourg Stock Exchange multilateral trading facility (“EURO MTF”) market.
Details of the tranches of the bonds outstanding at 31 March 2022 are as follows:
• $500 million Senior Notes due 2023 at a coupon of 5.625 per cent per annum – issued January 2013
• £400 million Senior Notes due 2023 at a coupon of 3.875 per cent per annum – issued February 2015
• €650 million Senior Notes due 2024 at a coupon of 2.200 per cent per annum – issued January 2017
• $500 million Senior Notes due 2027 at a coupon of 4.500 per cent per annum – issued October 2017
• €500 million Senior Notes due 2026 at a coupon of 4.500 per cent per annum – issued September 2018
• €500 million Senior Notes due 2024 at a coupon of 5.875 per cent per annum – issued November 2019
• €500 million Senior Notes due 2026 at a coupon of 6.875 per cent per annum – issued November 2019
• $700 million Senior Notes due 2025 at a coupon of 7.750 per cent per annum – issued October 2020
• $650 million Senior Notes due 2028 at a coupon of 5.875 per cent per annum – issued December 2020
• $500million Senior Notes due 2029 at a coupon of 5.500 per cent per annum – issued July 2021
• €500 million Senior Notes due 2028 at a coupon of 4.500 per cent per annum – issued July 2021
Details of the tranches of the bond repaid in the year ended 31 March 2022 are as follows:
• £400 million Senior Notes due 2022 at a coupon of 5.000 per cent per annum – issued January 2014
Details of the tranches of the bond repaid in the year ended 31 March 2021 are as follows:
• £300 million Senior Notes due 2021 at a coupon of 2.750 per cent per annum – issued January 2017
Details of the tranches of the bond repaid in the year ended 31 March 2020 are as follows:
• $500 million Senior Notes due 2019 at a coupon of 4.250 per cent per annum – issued October 2014
• $500 million Senior Notes due 2020 at a coupon of 3.500 per cent per annum – issued March 2015
Syndicated loan
In October 2018, a $1 billion syndicate loan was issued with a coupon rate of LIBOR + 1.900 per cent per annum, due in the following tranches:
• $199 million due October 2022• $798 million due January 2025
$3 million of this loan was repaid during the year ended 31 March 2022.
UK export finance facility
During the year ended 31 March 2020, the Company entered and drew down in full a £625 million five-year amortising loan facility backed by a £500 million guarantee from UK Export Finance. During the year ended 31 March 2022, the Company repaid £125 million (2021: £125 million, 2020: £52 million) of this loan. During the year ended 31 March 2022, the Company entered and drew down in full an additional £625 million five-year amortising loan facility. The Company repaid £31 million of this additional facility in the year ended 31 March 2022 (2021, 2020: £nil).
The contractual cash flows of interest-bearing debt (excluding leases) are set out below, including estimated interest payments and assuming the debt will be repaid at the maturity date:
As at 31 March (£ millions) 2022 2021 2020
Due in
1 year or less 1,494 798 660
2nd and 3rd years 2,508 2,134 2,035
4th and 5th years 1,899 2,326 2,141
More than 5 years 1,800 1,377 1,435
Total contractual cash flows 7,701 6,635 6,271
48 Capital and reserves
As at 31 March (£ millions) 2022 2021 2020
Authorised, called up and fully paid
1,500,642,163 ordinary shares of £1 each 1,501 1,501 1,501
Total ordinary share capital 1,501 1,501 1,501
The holders of ordinary shares are entitled to receive dividends as declared from time to time and are entitled to one vote per share at meetings of the Company.
The capital redemption reserve of £167 million (2021, 2020: £167 million) was created in March 2011 on the cancellation of share capital.
49 Dividends
50 Commitments and contingencies
The Company had no commitments or contingencies at 31 March 2022, 2021 or 2020.
52 Financial instruments
This section gives an overview of the significance of financial instruments for the Company and provides additional information on balance sheet items that contain financial instruments.
The details of significant accounting policies, including the criteria for recognition, the basis of measurement and the basis on which income and expenses are recognised, in respect of each class of financial asset, financial liability and equity instrument,
are disclosed in note 35 to the consolidated financial statements.
(A) Financial assets and liabilities
The following table shows the carrying amounts and fair value of each category of financial assets and liabilities as at 31 March 2022:
As at 31 March (£ millions) 2022 2021 2020
Long-term debt 5,280 4,959 4,759
Short-term debt 1,180 524 424
Total debt 6,460 5,483 5,183
Equity attributable to shareholder 2,086 2,090 2,096
Total capital 8,546 7,573 7,279
(£ millions)Amortised cost and other
financial liabilitiesTotal carrying value Total fair value
Other financial assets - current 1,727 1,727 1,726
Other financial assets - non-current 5,288 5,288 5,189
Total financial assets 7,015 7,015 6,915
Other financial liabilities - current 85 85 85
Short-term borrowings 1,180 1,180 1,179
Long-term borrowings 5,280 5,280 5,181
Total financial liabilities 6,545 6,545 6,445
51 Capital management
During the year ended 31 March 2022 no ordinary share dividends were proposed or paid (2021, 2020: £nil).

149
FINANCIAL STATEMENTS
Annual Report 2021/22 J A G U A R L A N D R O V E R A U T O M O T I V E P L C
The following table shows the carrying amounts and fair value of each category of financial assets and liabilities as at 31 March 2021:
(£ millions) Amortised cost and other financial liabilities Total carrying value Total fair value
Other financial assets - current 1,074 1,074 1,074
Other financial assets - non-current 4,964 4,964 4,964
Total financial assets 6,038 6,038 6,038
Other financial liabilities - current 82 82 82
Short-term borrowings 524 524 535
Long-term borrowings 4,959 4,959 5,122
Total financial liabilities 5,565 5,565 5,739
The following table shows the carrying amounts and fair value of each category of financial assets and liabilities as at 31 March 2020:
(£ millions) Amortised cost and other financial liabilities Total carrying value Total fair value
Other financial assets - current 958 958 958
Other financial assets - non-current 4,770 4,770 4,770
Total financial assets 5,728 5,728 5,728
Other financial liabilities - current 65 65 65
Short-term borrowings 424 424 408
Long-term borrowings 4,759 4,759 3,846
Total financial liabilities 5,248 5,248 4,319
Fair value hierarchy
Financial instruments held at fair value are required to be measured by reference to the following levels:
• Quoted prices in an active market (Level 1): This level of hierarchy includes financial instruments that are measured by reference to quoted prices (unadjusted) in active markets for identical assets or liabilities;
• Valuation techniques with observable inputs (Level 2): This level of hierarchy includes financial assets and liabilities measured using inputs other than quoted prices included within Level 1 that are observable for the asset or liability, either directly (i.e. as prices) or indirectly (i.e. derived from prices); and • Valuation techniques with significant unobservable inputs (Level 3): This level of hierarchy includes financial assets and liabilities measured using inputs that are not based on observable market data (unobservable inputs). Fair values are determined in whole or in part using a valuation model based on assumptions that are neither supported by prices from observable current market transactions in the same instrument nor based on available market data.
There has been no change in the valuation techniques adopted or any transfers between fair value levels in either current or prior periods as presented.
Fair values of cash and cash equivalents and other financial assets and liabilities are assumed to approximate to cost due to the short-term maturing of the instruments and as the impact of discounting is not significant.
Management uses its best judgement in estimating the fair value of its financial instruments. However, there are inherent limitations in any estimation technique. Therefore, for substantially all financial instruments, the fair value estimates presented above are not necessarily indicative of all the amounts that the Company could have realised in a sales transaction as of respective dates. The estimated fair value amounts as of 31 March 2022, 2021 and 2020 have been measured as of the respective dates. As such, the fair values of these financial instruments subsequent to the respective reporting dates may be different from the amounts reported at each year end.
(B) Financial risk management
The Company is exposed to foreign currency exchange rate, interest rate, liquidity and credit risks. The Company has a risk management framework in place that monitors all of these risks as discussed below. This framework is approved by the JLR plc Board.
(£ millions) US Dollar Euro
Financial assets 2,980 2,282
Financial liabilities (2,974) (2,282)
Net exposure asset 6 -
A 10 per cent appreciation/depreciation of the US Dollar or Euro would result in an increase/decrease in the Company’s net profit before tax and net assets by approximately £1 million and £nil respectively.
The following table sets forth information relating to foreign currency exposure as at 31 March 2021:
(£ millions) US Dollar Euro
Financial assets 2,480 1,861
Financial liabilities (2,477) (1,861)
Net exposure asset 3 -
A 10 per cent appreciation/depreciation of the US Dollar or Euro would result in an increase/decrease in the Company’s net profit before tax and net assets by approximately £nil and £nil respectively.
The following table sets forth information relating to foreign currency exposure as at 31 March 2020:
(£ millions) US Dollar Euro
Financial assets 2,033 2,180
Financial liabilities (2,033) (2,180)
Net exposure asset - -
A 10 per cent appreciation/depreciation of the US Dollar or Euro would result in an increase/decrease in the Company’s net
profit before tax and net assets by approximately £nil and £nil respectively.
Foreign currency exchange rate risk The fluctuation in foreign currency exchange rates may have a potential impact on the balance sheet, statement of changes in equity and cash flow statement where any transaction references more than one currency or where assets or liabilities are denominated in a currency other than the functional currency of the Company.
As at 31 March 2022, 2021 and 2020, there are no designated cash flow hedges.
The Company’s operations are subject to risks arising from fluctuations in exchange rates. The risks primarily relate to fluctuations in US Dollar and Euro against Sterling as the Company has US Dollar and Euro assets and liabilities and a GBP functional currency. The following table sets forth information relating to foreign currency exposure as at 31 March 2022:

151
FINANCIAL STATEMENTS
Annual Report 2021/22 J A G U A R L A N D R O V E R A U T O M O T I V E P L C
Interest rate risk
Interest rate risk is the risk that changes in market interest rates will lead to changes in interest income and expense for the Company.
The Company is presently funded with long-term fixed interest rate borrowings and long-term variable-rate borrowings. The Company is also subject to variable interest rates on certain other debt obligations.
As at 31 March 2022, net financial assets of £465 million (2021: £436 million, 2020: £595 million) were subject to a variable interest rate. An increase/decrease of 100 basis points in interest rates at the balance sheet date would result in an impact of £5 million (2021: £4 million, 2020: £6 million).
The risk estimates provided assume a parallel shift of 100 basis points interest rate across all yield curves. This calculation also
assumes that the change occurs at the balance sheet date and has been calculated based on risk exposures outstanding as at that date. The year-end balances are not necessarily representative of the average debt outstanding during the year.
Liquidity rate risk
Liquidity risk is the risk that the Company will not be able to meet its financial obligations as they fall due.
The Company’s policy on liquidity risk is to ensure that sufficient borrowing facilities are available to fund ongoing operations without the need to carry significant net debt over the medium term. The quantum of committed borrowing facilities available to the Company is reviewed regularly and is designed to exceed forecast peak gross debt levels.
The following are the undiscounted contractual maturities of financial liabilities, including estimated interest payments:
As at 31 March 2022 (£ millions) Carrying amount
Contractual cash flows
1 year or less
1 to <2 years
2 to <5 years
5 years and over
Financial liabilities
Long-term borrowings and accrued interest 5,347 6,447 246 1,045 3,356 1,800
Short-term borrowings and accrued interest 1,188 1,228 1,228 - - -
Other financial liabilities 9 28 22 6 - -
Total contractual maturities 6,545 7,703 1,496 1,051 3,356 1,800
As at 31 March 2021 (£ millions) Carrying amount
Contractual cash flows
1 year or less
1 to <2 years
2 to <5 years
5 years and over
Financial liabilities
Long-term borrowings and accrued interest 4,959 6,054 221 1,263 3,193 1,377
Short-term borrowings and accrued interest 524 557 557 - - -
Other financial liabilities 82 28 22 6 - -
Total contractual maturities 5,565 6,639 800 1,269 3,193 1,377
As at 31 March 2020 (£ millions) Carrying amount
Contractual cash flows
1 year or less
1 to <2 years
2 to <5 years
5 years and over
Financial liabilities
Long-term borrowings and accrued interest 4,759 5,811 215 737 3,424 1,435
Short-term borrowings and accrued interest 424 434 434 - - -
Other financial liabilities 65 34 19 11 4 -
Total contractual maturities 5,248 6,279 668 748 3,428 1,435
Credit risk
Financial instruments that are subject to concentrations of credit risk consist of loans to subsidiaries.
Exposure to credit risk
The carrying amount of financial assets represents the maximum credit exposure.
Financial assets
None of the Company’s cash equivalents or other financial assets, are past due or impaired. Regarding other financial assets that are neither past due nor impaired, there were no indications as at 31 March 2022 (2021, 2020: no indications) that defaults in payment obligations will occur. However, as required under IFRS 9, the Company has assessed other financial assets for expected credit losses.
(£ millions) Short-term borrowings Long-term borrowings
Balance at 1 April 2019 767 3,594
Proceeds from issue of financing - 1,486
Repayment from issue of financing (826) -
Reclassification of long term debt 477 (477)
Foreign exchange 6 155
Arrangement fees paid (1) (8)
Fee amortisation 2 8
Reclassification of long term debt fees (1) 1
Balance at 31 March 2020 424 4,759
Proceeds from issue of financing - 1,034
Repayment from issue of financing (425) -
Reclassification of long term debt 525 (525)
Foreign exchange - (309)
Arrangement fees paid - (11)
Fee amortisation - 11
Balance at 31 March 2021 524 4,959
Proceeds from issue of financing - 1,417
Repayment from issue of financing (557) (1)
Reclassification of long term debt 1,200 (1,200)
Foreign exchange 13 105
Arrangement fees paid - (13)
Fee amortisation - 13
Balance at 31 March 2022 1,180 5,280
These financial assets are loan receivables from subsidiaries and the Company notes that there is no history of default on such arrangements. As there has been no significant increase in credit
risk, the Company has assessed these based on a 12-month expected credit loss. The impairment of the loan receivables due to the requirements under IFRS 9 are set out below:
As at 31 March (£ millions)
2022 Gross
2022 Impairment
2022 Net carrying
value2021 Gross
2021 Impairment
2021 Net carrying
value2020 Gross
2020 Impairment
2020 Net carrying
valueReceivables from subsidiaries - current 1,734 (7) 1,727 1,077 (3) 1,074 960 (2) 958Receivables from subsidiaries - non-current 5,314 (26) 5,288 4,992 (28) 4,964 4,792 (22) 4,770
Total 7,048 (33) 7,015 6,069 (31) 6,038 5,752 (24) 5,728
Movement in allowances for expected credit losses of financial assets
53 Reconciliation of movements of liabilities to cash flows arising from financing activities
Year ended 31 March (£ millions) 2022 2021 2020
At beginning of year 31 24 -
Charged during year 2 7 24
At end of year 33 31 24

153
FINANCIAL STATEMENTS
Annual Report 2021/22 J A G U A R L A N D R O V E R A U T O M O T I V E P L C
54 Related party transactions
Tata Sons Private Limited is a company with significant influence over the Company’s ultimate parent company Tata Motors Limited. The Company’s related parties therefore include Tata Sons Private Limited, subsidiaries and joint ventures of Tata Sons Private Limited and subsidiaries, associates and joint ventures
of Tata Motors Limited. The Company routinely enters into transactions with these related parties in the ordinary course of business.
The following table summarises related party balances:
(£ millions) With subsidiaries With immediate parent
31 March 2022
Loans to subsidiaries of the Company 7,015 -
Loans from subsidiaries of the Company 43
31 March 2021
Loans to subsidiaries of the Company 6,038 -
Loans from subsidiaries of the Company 34
31 March 2020
Loans to subsidiaries of the Company 5,728 -
Loans from subsidiaries of the Company 36
Year ended 31 March (£ millions) 2022 2021 2020
Short-term benefits 5 6 4
Post-employment benefits - 1 -
Other long-term employee benefits - 1 1
Total compensation of key management personnel 5 8 5
Apart from the directors, the Company did not have any employees and had no employee costs in the years ended
31 March 2022, 2021 and 2020. All directors’ costs are fully recharged to Jaguar Land Rover Limited.
Compensation of key management personnel
55 Auditor’s remuneration
Amounts receivable by the Company’s auditor and its associates in respect of services to the Company and its associates, other than the audit of the Company’s financial statements, have not been disclosed as the information is required instead to be disclosed on a consolidated basis in the consolidated financial statements.
56 Ultimate parent company and parent company of the larger group
The immediate parent undertaking is TML Holdings Pte. Ltd. (Singapore), which is the parent for the smallest group to consolidate these financial statements. The ultimate parent undertaking and controlling party is Tata Motors Limited, India, which is the parent of the largest group to consolidate these financial statements.
Copies of the TML Holdings Pte. Ltd. (Singapore) consolidated financial statements can be obtained from the Company Secretary, TML Holdings Pte. Ltd. 9 Battery Road #15-01 MYP Centre, Singapore 049910.
Copies of the Tata Motors Limited, India consolidated financial statements can be obtained from the Company Secretary, Tata Motors Limited, Bombay House, 24, Homi Mody Street, Mumbai-400001, India.
57 Subsequent events
There have been no material subsequent events between the balance sheet date and the date of signing this report.


