Embed Size (px)
Citation preview
EThe 15Initiative
Strengthening the Global Trade System
March 2015
E15 Expert Group onOceans, Fisheries and the Trade System
Think Piece
Tariff Escalation and Preferences in International Fish Production and Trade
Liam Campling

ACKNOWLEDGMENTS
Published by
International Centre for Trade and Sustainable Development (ICTSD)7 Chemin de Balexert, 1219 Geneva, SwitzerlandTel: +41 22 917 8492 – E-mail: [email protected] – Website: www.ictsd.orgPublisher and Chief Executive: Ricardo Meléndez-Ortiz
World Economic Forum91-93 route de la Capite, 1223 Cologny/Geneva, SwitzerlandTel: +41 22 869 1212 – E-mail: [email protected] – Website: www.weforum.orgCo-Publisher and Managing Director: Richard Samans
Acknowledgments
This paper has been produced under the E15Initiative (E15). Implemented jointly by the International Centre for Trade and Sustainable Development (ICTSD) and the World Economic Forum, the E15 convenes world-class experts and institutions to generate strategic analysis and recommendations for government, business and civil society geared towards strengthening the global trade system.
For more information on the E15, please visit www.e15initiative.org
I would like to thank participants at the second workshop of the E15 Expert Group on Oceans, Fisheries and the Trade System where this paper was presented and a wide range of insightful comments and criticisms were made. Due to the confine of space, not all of these were integrated into the final draft. My thanks also to Christophe Bellmann, Rashid Sumaila and Alice Tipping for their thoughtful suggestions on earlier drafts of this report. All errors remain my own.
With the support of
Citation: Campling, Liam. Tariff Escalation and Preferences in International Fish Production and Trade. E15Initiative. Geneva: International Centre for Trade and Sustainable Development (ICTSD) and World Economic Forum, 2015. www.e15initiative.org/
The views expressed in this publication are those of the authors and do not necessarily reflect the views of ICTSD, World Economic Forum, or the funding institutions.
Copyright ©ICTSD and World Economic Forum, 2015. Readers are encouraged to quote this material for educational and non-profit purposes, provided the source is acknowledged. This work is licensed under the Creative Commons Attribution-Non-commercial-No-Derivative Works 3.0 License. To view a copy of this license, visit: http://creativecommons.org/licenses/by-nc-nd/3.0/ or send a letter to Creative Commons, 171 Second Street, Suite 300, San Francisco, California, 94105, USA.ISSN 2313-3805
And ICTSD’s Core and Thematic Donors:

i
This paper reviews recent literature on the effects of tariff liberalization on wild caught fish product production structures, development outcomes, and fish stocks. Using the case of canned tuna, the report shows that tariff regimes clearly influence the location of production and processing activities, thereby shaping the international division of labour. While trade measures clearly have significant implications for developing countries, the report finds that the impact of trade preferences and tariff liberalization cannot be adequately understood without taking into consideration the particular characteristics and circumstances of individual countries. Therefore, one-size-fits-all policy prescriptions based on generalized assumptions about the functioning of the world economy will not provide an adequate policy framework. The author puts forward several recommendations concerning measures that could be taken to help developing countries adapt to changes in competitiveness in the evolving trade environment.
ABSTRACT
Introduction
Tariff Escalation and Tariff Preferences: Perspectives
Pro-liberalizers
Developmentalists
Environmentalists
Alternative perspectives
Tariff Escalation and Tariff Preferences: Status
Overview
Fish Products at the WTO
European Union
United States
Tariff Escalation and Tariff Preferences: Effects
General Effects
Effects on Production Structures: The Case of Canned Tuna
Effects On Economic Development: The Case Of Canned Tuna
Effects on the Environment
Conclusion
References
CONTENTS
1
1
1
2
3
3
4
4
6
7
11
13
13
14
16
18
19
20

ii
ACP Africa, Caribbean and Pacific
AGOA African Growth and Opportunity Act
ATDPA Andean Trade and Development Preferences Act
ATPDEA Andean Trade Promotion and Drug Eradication Act
CAFTA-DR Dominican Republic-Central America-United States Free Trade Agreement Implementation Act
CTC Change in tariff classification
CTPA U.S.-Colombia Trade Promotion Agreement
DfID UK Department of International Development
EBA Everything But Arms
EPA Economic partnership agreement
EU European Union
FAO Food and Agriculture Organization of the United Nations
FTA Free-trade agreement
GSP Generalized system of preferences
HS Harmonized System
ICTSD International Centre for Trade and Sustainable Development
IEPA Interim Economic Partnership Agreement
IUU Illegal, unreported, and unregulated
KORUS United States-Korea Free Trade Agreement
LDC Least-developed country
MFN Most-favoured nation
MSC Marine Stewardship Council
Mt Metric tons
NAFTA North American Free Trade Agreement
NAMA Non-agricultural market access
NGO nongovernmental organizations
NTR Normal trade relations
OECD Organisation for Economic Co-operation and Development
PACP Pacific - African Caribbean Pacific
PNG Papua New Guinea
PTA Preferential trade agreement
RoO Rules of origin
RTA Regional trade agreement
SMEs Small and medium- sized enterprises
SVE small, vulnerable economies
UK United Kingdom
UN United Nations
UNCLOS United Nations Convention on the Law of the Sea
UNEP United Nations Environment Programme
US United States
WTO World Trade Organization
LIST OF ABBREVIATIONS

iii
Table 1. Illustrative fish tariff differentiation in OECD countries by level of processing
Table 2. Simplified EU and US tariff schedules for tuna and tuna products (in % ad valorem unless otherwise specified)
Table 3. EU import tariffs on canned tuna and tuna loins post-NAMA
Table 4. MFN applied tariffs for fish and fish products for selected countries in 2013
Table 5. EU import of canned tuna by major supplying countries in 1,000 mt.
Table 6. EU import of tuna loins by major supplying country in 1,000 mt
Table 7. Tariff phase out by year when zero is reached for procuessed tuna products for selected US FTAs
Table 8. Yearly imports of tuna into the US, in 1,000 mt
Figure 1. The geography of world canned tuna production
Figure 2. Canned tuna production in Spain, Italy, and France, 1976-2007
LIST OF TABLES
AND FIGURES

1
INTRODUCTION
The purpose of this report is to review available evidence on the effects of tariff policy (especially tariff escalation and preferences) on fish product production structures, development outcomes, and fish stocks. The report consists of a qualitative review of available literature produced by international agencies — e.g. the Food and Agriculture Organization of the United Nations (FAO); the Organisation for Economic Co-operation and Development (OECD); and the World Bank — nongovernmental organizations (NGOs) — e.g. Greenpeace and the International Centre for Trade and Sustainable Development (ICTSD); and academics. The empirical focus is on wild caught fish and fish products, both for human and industrial uses (hereon ‘fish’). It does not include aquaculture products, because they have entirely different industrial structures, socio-economic relations, and socioecological effects than wild-caught fish. This is not to suggest an immutable division between the two sectors, because there are important interactions at (and between) the points of production (e.g. wild caught fish processed into fish meal is often used in aquaculture) and consumption (e.g. market competition and product substitutability among wild caught and aquaculture fish).
Despite the existence of a vast literature on fishing industries around the world, very little is known about the effects of fish tariff liberalization (Kurien 2005 is a notable exception). However, a general study of ‘fish’ tariffs would obscure as much as it might reveal because, as Roheim (2004) points out, species and product differentiation is crucial. As such, this report focuses largely on the specific dynamics of the production and international trade of canned tuna. Given the focus of the terms of reference on development, the report focuses on countries (self) categorized as ‘developing’ and on those categorized by the United Nations (UN) Committee for Development Policy as least-developed countries (LDCs).
TARIFF ESCALATION AND
TARIFF PREFERENCES:
PERSPECTIVES
PRO-LIBERALIZERS
Orthodox liberalizers
The standard argument for the liberalization of barriers to trade and investment in fisheries (as with other sectors) is that “the most cost effective producers with a comparative advantage [should] undertake the operation” (Schmidt 2003: 7; see also Heydon 2006). Therefore, rather than see fish populations as a national resource to be extracted by nationals, governments should resist resource nationalism and open extraction to international competition. In many cases, and especially where a developing economy is small and undiversified, the logic of this argument is extended to claim that the only assumed comparative advantage is the generation of rents from fishing licenses; any other interventions adopted by states, such as industrial policies requiring foreign companies to invest locally to qualify for fishing licenses, will only stall or pervert growth (Duncan 2006; Peterson 2006).1
The OECD states that “[r]educing tariff escalation will generate further opportunities for developing countries through their participation in international trade of value-added fish products” and that “[t]he liberalisation of tariffs and reductions in peaks and escalation [will] ensure fair access to markets for processed products” (2010: 68; for similar statements, see WTO 1997; ICTSD 2006; Martini and Lindberg 2013). The assertion that the liberalization of tariffs alone will allow ‘fair’ access is problematic given the layers of other barriers to developing country market access, including the multitude of fisheries subsidies and non-tariff barriers applied by OECD governments and the buying power and private standards of branded firms and big retail.2 As tariffs (and thus tariff preferences) fall in major markets, non-tariff measures — particularly public and private sustainability and food safety standards — are likely to become the main barriers to market access for fish products. Especially for those smaller players — including small and medium-sized enterprises (SMEs) and fiscally squeezed states — that are
For a critical engagement with contemporary conceptions of rent in fisheries, see Campling and Havice (2014c).
As Mbithi (2006b: 150) points out, the proliferation of standards “increase[s] the cost of doing business, which in turn necessitates increased catches, hence encouraging disregard for stock conversation measures.”
1
2

2
less able to spread the costs of investment required to comply with such measures. Dealing with these barriers will be the key to helping preference-receiving countries maintain competitiveness as preference margins fall. While the OECD’s argument on tariff escalation and peaks may be appropriate for some developing countries, the dependence of the Africa, Caribbean and Pacific (ACP) countries and others on preferences for fish products makes it clear that this is not the case for all (see below). Interestingly, faced even with very high tariff peaks, several developing countries successfully penetrate protected markets, as Southeast Asian canned tuna exports to the European Union (EU) and the United States (US) markets make clear. In short, in discussing the benefits of liberalization of fish tariffs to ‘developing country’ producers, it is essential to differentiate among them.
A common response to ACP preference dependence is the argument of the ‘preference pessimists.’ This is the dominant narrative of ACP-EU trade relations in mainstream trade and development policy circles. Assessments from this perspective tend to use highly aggregated data to conclude that Lomé preferences failed to stimulate industrial development in ACP economies (Davenport et al. 1995; Moss and Ravenhill 1987). A commonly cited statistic to support this view is the decline in ACP goods as a proportion of total EU imports from 13.3 percent in 1976 to 3.7 percent in 2000 (Yu and Jensen 2005). In general, ACP economies did not diversify, and their export portfolios remained dominated by unprocessed primary commodities and some low value-added agricultural products. For example, in 1999, only 9 products constituted 57 percent of total ACP exports to the EU, and, of 77 ACP countries, 61 percent of total exports came from only 10 African economies (DG TRADE and DG DEV 2002). From the theoretical perspective of mainstream economics, preferences pervert opportunity costs, constraining the most efficient allocation of resources and actually discourage economies from diversifying, owing to dependence on preferences (Davenport 1992; Davenport et al. 1995). Importantly, the EU itself became a leading political-institutional voice among the preference pessimists, stating that:
trade preferences have neither halted the increasing marginalisation of the ACP region in world trade nor in their trade with the EU. Nor have they overcome the high dependence of the ACP on a few commodities. (DG TRADE and DG DEV 2002: 2)
This may be an accurate generalized description of outcomes, but what is contested by other perspectives is the explanation of their drivers, as illustrated in subsequent sections with particular reference to fish products.
Augmented liberalizers
In an important departure from the norm, the OECD (2003) qualifies the benefits of fish trade liberalization. It emphasizes that the liberalization of fisheries markets
could deepen unsustainable resource extraction where management is ineffective and in areas, such as the high seas, where open access is prevalent. Similarly, Roheim (2004: 76) makes plain that fisheries management is ‘a necessary condition’ and ‘the most important factor in the outcome of liberalization of trade,’ because where stocks are not well managed, ‘liberalization will encourage faster depletion of the stocks.’
This qualified support for liberalization stems from production systems for fish being highly heterogeneous and subject to extensive levels of management, at least compared to other food products (Schmidt 2003). As such, the maximization of welfare heralded by supporters of tariff liberalization must be mitigated by attention to the sustainable use of fisheries, which depends, among other things, on the state of the resource and the ability of those charged with managing the extent and intensity of extraction (or barring it altogether) to do so effectively. In his major study of the effects of fish trade on low-income food-deficit countries, John Kurien correctly noted: “discussions about sustainable trade attain meaning only in the context of commitments to sustainable production and sustainable consumption” (2005: 59).
DEVELOPMENTALISTS
The ‘developmentalist’ argument is that state interventions in the market can positively contribute to the prospects of economic development. They tend to take a historical view of the dynamics of capitalist development and highlight the centrality of tariffs and other forms of protectionism in the industrialization of Western Europe, the US, and parts of East Asia, arguing that ‘policy space’ is necessary for developing countries to diversify and industrialize their economies (e.g. Amsden 1989; Chang 2004; Wade 1990). More specific criticism is re-emerging around the blanket use of comparative advantage as an overarching policy goal in promoting exports from the global South to promote economic development. The theoretical validity of comparative advantage is questioned in relation to the ever-increasing complexity of global value chains in capitalist development (e.g. Milberg and Winkler, 2013), especially in the context of high cost structures in small developing economies when comparative advantage ‘is not enough’ to support local development (Winters and Martins, 2004: 347). There is considerable empirical evidence that without trade preferences and industrial policy economies dependent on fish processing would become non-competitive in international markets (e.g. Campling and Havice, 2007; Ponte et al., 2007; Campling, 2008; Havice and Campling 2013). Arguments challenging the orthodox liberalizers are also taken forward by government officials and advisors, such as Argentina’s (then) Under Secretary for Fisheries who claimed that investment liberalization did not result in fisheries development in his country (Nieto 2006, see also UNEP 2002a) and a prominent advisor to the Pacific Islands

3
Forum Fisheries Agency who pointed out that deregulated investment in resource access is unlikely to have beneficial trade effects for the Pacific island countries (Clark 2006). Further, a United Nations Environment Programme (UNEP) study on Senegal found that with duty-free access to EU markets, local fishers’ switched their efforts to export-orientated species, and this had negative implications for local food security (UNEP 2002b).
In contrast to the preference pessimist position sketched earlier, the developmentalists tend to be ‘preference optimists.’ As opposed to the very general, highly aggregated data used by the pessimists, the ‘optimists’ base analyses on data disaggregated by value of preference, country, and product type and argue that Lomé preferences provided an important competitive advantage during particular historical periods for some countries and some products, as detailed in McQueen et al. (1998). However, exports must receive a ‘significant’ margin of preference of five percent or more over other countries (Davenport et al. 1995: 67),3 but even a five percent margin can be considered commercially ‘trivial’ (McQueen et al. 1998: 40). By the mid-1990s, over 90 percent of total EU imports of manufactures entered duty free under MFN treatment or the Generalized System of Preferences (GSP) regime (Grilli 1993); the largest exceptions were textiles and clothing and processed fish. However, particularly restrictive rules of origin (RoO) were applied to these very sectors, further constraining the economic benefits of preferences (Campling et al. 2007; Naumann 2010; Ravenhill 1985; and Stevens and Weston 1984).
In sum, in order for a tariff preference to have a stimulating effect on the development of export-oriented production, it must provide a commercially significant advantage relative to major competitors; this in turn can only be understood in the historical context of competitive conditions in the world market, and the devil is in the legal detail on whether a preference is workable (e.g. RoO). Nonetheless, an OECD report found that preferences “can to some extent support developing countries’ efforts to move up the value chain and benefit more from trade” (Martini and Lindberg 2013: 6). It is precisely the argument of the preference optimists that frames the formal arguments of the ACP, Africa, and the least-developed country (LDC) and the small, vulnerable economies (SVE) groupings in non-agricultural market access (NAMA) negotiations at the WTO.
ENVIRONMENTALISTS
There is a lack of careful studies on the environmental impact of fish tariff liberalization on stocks. In this context, some argue for caution against the liberalization of fish. For example, a sharp reduction in a tariff peak may incentivize production in areas where fisheries are poorly managed, and liberalization may even result in lower consumer prices sparking new highs of demand vis-à-vis other protein sources (ICTSD 2006: 33). However, while the globalization of
markets for fish may increase demand pressures for trade in fish, does this necessarily increase fish extraction? In other words, is there contemporary evidence to show that the liberalization of a tariff resulted in the absolute expansion of extraction? Or, are we talking instead about a relative change, such as trade diversion where a protected supplier loses out (e.g. local boats being displaced by foreign ones, or a geographical shift in extraction from one fishing area to another)? (A discussion of the limited available evidence on the direct relationship between tariff liberalization and fish stocks is provided in the section on the case of canned tuna.)Greenpeace makes the convincing argument that competition from cheaper imports may encourage a fleet to fish harder on already strained stocks (Allain 2007). Moreover, and contrary to mainstream economic assumptions, boat owners are not always able to shift their capital to other uses. Thus, political pressure can be put on fisheries managers to continue access to maintain employment in socio-economically sensitive regions, as the OECD itself recognizes (2003: 24).
In sum, there is very little doubt that the thrust of the environmentalist argument stands. Management of the resource must be based on the best available science and the precautionary approach where data are less robust. This does not suggest that one form of management is necessarily better than the other (e.g. single species vs. ecosystem, socially top-down vs. bottom-up, or input vs. output controls), but it is to say that in its absence the risk of resource depletion is certainly greater.
ALTERNATIVE PERSPECTIVES
Bene et al. (2010) review the evidence for the benefits and costs of fish trade liberalization in Africa. They find that the debate is highly polarized but with little nuance — as typified by the three perspectives outlined above. They are particularly scathing on the use of insufficiently disaggregated data sets to make generalized claims. As an alternative, Bene et al. argue that analyses of international fish trade and development must engage with local specificities and deploy research methods that are suitable to capture both the local and national level dimensions of the problem. A similar argument is developed in Campling and Havice (2007) on the role of preferential trade for fisheries development in small economies. Havice and Campling (2013) emphasize the specificity of place, the environmental conditions of production and relative state capacity in making full use of trade preferences for fish products; and that — at first sight — the hidden costs of maintaining investment in a factory (e.g. direct and indirect subsidies) may call into question ‘development’ gains. Campling (2014) suggests that the relationship between trade preferences and development cannot be understood simply from the
Corroborated by Manchin (2006) who found that ACP firms did not utilize preferences unless the margin was 4.5 percent more than the MFN rate.
3

4
TARIFF ESCALATION AND
TARIFF PREFERENCES:
STATUS
OVERVIEW
International trade in fish is heavily skewed toward the EU, Japan, and the US (the ‘global triad’). Combined these countries accounted for 64 percent of the value of world seafood trade in 2012, with the EU at 36 percent (including intra-EU trade) and Japan and the US at 14 percent each
(FAO 2014: 50). It is apparent that, despite the emergence of a new ‘middle class’ (especially in parts of East and Southeast Asia) and its impacts of the direction(s) of world trade, the minority global population of residents of the triad remain dominant in terms of consumption of internationally traded fish. Therefore, this report focuses on the tariff regimes of the EU and the US given that Japan’s preference system is less significant in the structuring of global production and trade (Allain 2007; Campling et al. 2007).
Melchior (2006) distinguishes among three tariff rates: 1) bound at the WTO; 2) MFN applied; and 3) ‘actually applied,’ which includes goods traded under preference regimes or free-trade agreements (FTAs). Due to, among other things, the difficulty of measuring the third category using available databases,4 Melchior concludes that “there is no single true measure for the world tariff average for seafood” (2006: 9), not least because, as the OECD (2003) found, there is a lack of transparency on applied tariff rates among many countries.
Tariff peaks
Only five OECD countries have MFN tariff rates at or above 15 percent. Table 1 offers an aggregated picture of these for five OECD countries. The largest number of tariff peaks relative to the number of tariff lines is present in Korea and Mexico. In the EU, 128 of 394 tariff lines are at or larger than 15 percent. The US and the EU peaks on canned tuna are both very high, respectively 35 percent and 24 percent (Table 2). In Korea, a number of products carry a general 20 percent tariff. However, adjustment tariffs in Korea were used on a small number of products, lifting tariff peaks to 80 percent (e.g. frozen croaker) (OECD 2003).
Tariff escalation
Melchior (2006: 20) found that to the extent that there is tariff escalation (the globally aggregated data show mixed results), it is not used exclusively by OECD countries. A more concrete example of tariff escalation is provided in Table 2, which provides tariffs for tuna in the EU, Japan, and the US by Harmonized System (HS) code for unprocessed, semi-processed, and processed tuna. Data are provided for a range of preferential trade agreements (PTAs) and FTAs. Access to preference schemes is conditional on rules of origin (RoO).
TABLE 1:
Illustrative fish tariff differentiation in OECD countries by level of processing
Level of processing EU Japan US Korea Canada
Raw fish 10.3 4.3 0.6 15.3 0.6
Intermediate fish products 4.0 2.0 1.0 33.0 3.0
Processed fish 16.3 9.0 20.0 20.0 2.6
Source: Ahmed (2006)
technical positions of the ‘pessimists’ or the ‘optimists’ and that trade policy formation — including preferences — needs to be understood historically. For example, the very existence of the ACP canned tuna preference (see below) was in the first instance a product of French industrial capital investing in colonial Senegal under the post-War French Union. Combined, these arguments call for sensitivity to complexity and contingency in the dynamics of change.
More research is needed on the existing relationship between fish trade liberalization, industrial policy and job creation, poverty reduction, and food security, as opposed to policy prescriptions based on highly aggregated data and idealized assumptions either of perfectly functioning markets or of the ability of states to ‘direct’ economic outcomes with trade and industrial policy. To understand the effects of tariff escalation and preferences and their actual and potential liberalization, a variety of research methods and sources of evidence are needed. At a minimum, this would require combining quantitative analysis of the longitudinal relationship between fish production and trade and a range of policy mechanisms (e.g. tariffs, regulations, and government investment incentives), with the careful comparative qualitative study of value chains in strategically selected case studies of particular fish products and local social relations and contexts.
Data in WITS only show up for traded goods and thus cannot be used to identify applied tariff escalation where it successfully blocks the import of processed fish.
4

5
TABLE 2:
Simplified EU and US tariff schedules for tuna and tuna products (in % ad valorem unless otherwise specified)5
European Union
Product/ HS Code MFN GSP EBA GSP+ ACP
Fresh-Chilled Tuna/ 0302 0 (under 1604)22 (other uses)
0 (under 1604)18.5 (other uses)
0 0 0
Frozen Tuna/ 0303 0 (under 1604)22 (other uses)
0 (under 1604)18.5 (other uses)
0 0 0
Fresh-Chilled Fish Fillets/ 03048 15 14.5 0 0 0
Frozen Fish Fillets/ 0304 18 14.5 0 0 0
Prepared or preserved tuna (in oil)/ 1604
24 20.5 0 0 0
Prepared or preserved tuna (not in oil)/1604
24 20.5 0 0 0
Tuna in Pouches/ 160410 24 20.5 0 0 0
Tuna Loins for use under 1604/ 1604
24 20.5 0 0 0
United States
Product/ HS Code MFN GSP LDC GSP and AGOA
Caribbean Basin Initiative
Insular Territories6
FAS7 FTAs**
Fresh-Chilled Tuna/ 0302 0 0 0 0 0 0 0
Frozen Tuna/ 0303 0 0 0 0 0 0 0
Fresh-Chilled Fish Fillets/ 03048 0 0 0 0 0 0 0
Frozen Fish Fillets/ 0304 0 to 6 0 0 0 0 0 0 All: 0
Except Korea: 2.4
Prepared or preserved tuna (in oil)/ 1604
35 35 0 0 0 35 All: 0Except: Peru 14; Colombia 24.5;
Korea 29
Prepared or preserved tuna (not in oil)/1604
6 to 12.59 6 to 12.5 0 0 0 0 All: 0Except: Central America 0.1 to
0.4; Panama 0.7 to 1.4; Peru 2.4 to 5;
Colombia 4.2 to 8.7; Korea 4.9 to 10.3
Tuna in Pouches/ 160410 12.5 12.5 0 0 0 0 As above
Tuna Loins for use under 1604/ 1604
1.1¢ /kg or 611
1.1¢ /kg or 6
0 0 0 0 All: 0 Except: Korea 0.7¢ /kg or 4.2
*Expired on 31 July 2013; ** Tariff treatment in 2014 (USTIC 2014a). Notes: The table uses MFN applied tariff rates, but several countries have now replaced this term with different ones, such ‘normal trade relations’ (or NTR, for the US).
Adapted from Campling et al. 2007a. Updated USITC 2014
American Samoa and Puerto Rico.
FAS = freely associated states: the Marshall Islands, the Federated States of Micronesia, the Republic of Palau.
Tuna products are not always specified by species under this HS code. Instead they are assumed to fall under ‘Other.’
Prior to August 2002, tuna in pouches was not separately provided for in the US Harmonized Tariff Schedule (HTS), it is now 1604.14.51/59/91/99. See USITC April 2004: 3.
1.1¢ for tuna loins in bags over 6.8kg each (HS code 1604.14.40). ‘Other’ = 6% (1604.14.50).
US duties for canned tuna in water depend on a quota that limits imports from any single country to no more than 4.8 percent of the total tuna in air tight containers consumed in the previous year. The tariff rate for canned tuna ‘not in oil’ (e.g., in brine or spring water) shifts from 6 percent to 12.5 percent when the tariff quota is full (USITC 2014).
5
6
7
8
10
11
9

6
FISH PRODUCTS AT THE WTO
Uruguay Round
At the scale of the multilateral system, there has been little harmonized movement in tariffs for fish since the conclusion of the Uruguay Round. According to Finger et al. (1996 cited in Melchior 2006: 2) the average bound rate for fish and fish products after the Round was 5.2 percent, and the average MFN applied tariff was 4.4 percent. The OECD (2003: 80-1) put the latter at 4.5 percent for developed countries, compared with the 6.1 percent in place before the Uruguay Round. Despite these reductions, EU MFN tariffs remain high: on imports of unprocessed fish, they are 11.8 percent and 15 percent for semi-processed fish (in percent equivalent ad valorem). MFN tariffs for Canada were 1.4 and 5.6 percent, for Japan 3.2 and 8.1 percent, and for the US 0.1 and 6.5 percent, all unprocessed and semi-processed respectively (Greenaway and Milner 1996: 30-31).
MFN applied tariff averages indicate that in general world fish trade is liberal compared with agriculture, but it is less liberal than trade in manufactured goods (Melchior 2006). However, applied MFN averages mask very high peaks for certain fish tariff lines and the importance of ‘actually applied’ tariffs (e.g. preferences and FTAs). As a result, the majority of this report focuses on particular categories of countries and specific product types (especially canned tuna). For example, while the average tariff level for fish in Canada and the US is about 1 percent (Melchior 2006: 16), for canned tuna there are very high tariff peaks and an important system of trade preferences that contribute to shaping the global geography of canned tuna production (see below).
Doha Round
Fish and fish products are treated as industrial goods at the WTO and are thus grouped under NAMA negotiations. For most ACP countries, the key concern surrounding NAMA was a reduction of the preferential market access they have historically received into their main export markets (‘preference erosion’). In that respect, NAMA will force many developed countries to reduce their bound tariff rates. This will lower the relative value of the preference being received and effectively reduce the competitiveness of ACP exports.
For fish products, a key aspect of a post-Doha trading environment and its impacts on the Cotonou preference can be surmised as follows. The current EU bound rate for canned tuna and tuna loins is 25 percent (only 1 percent more than the current applied MFN rate). If the range of the Swiss Formula coefficient that was under negotiation is applied to this,12 the post-NAMA EU bound tariff for canned tuna and tuna loins will be reduced to between 6.1 and 6.6 percent (see Table 3). In terms of the impact on the competitive advantage available to the ACP under the Cotonou Agreement and subsequent IEPAs, this translates into a reduction of over 70 percent in preference for exporters and an equivalent decline in their relative competitiveness.
While some special treatment was proposed for those products for which the erosion of preferences for ACP exporters would prove overly damaging — including for EU imports of processed skipjack tuna (Annex 2 in JOB(07)/126) — the mechanism currently envisaged would only give an additional two years to spread out the reductions. After these
TABLE 3:
EU import tariffs on canned tuna and tuna loins post-NAMA
Starting duty 25% Starting duty 25% Starting duty 25% Starting duty 25%
Formula coefficient 8 9
Year 1 21.22 22.30 21.32 22.37
Year 2 17.44 19.60 17.64 19.74
Year 3 13.66 16.90 13.96 17.11
Year 4 9.88 14.20 10.28 14.49
Year 5 6.10 11.50 6.60 11.86
Year 6 8.80 9.23
Year 7 6.10 6.60
Final EU tariff rate 6.10 6.10 6.60 6.60
Annual reductions 3.78 2.70 3.68 2.63
% cut overall 76% 74%
Source: Campling et al. 2007b
This is based on a coefficient value of 8 or 9, as proposed in the 17 July 2007 proposed NAMA modalities document (JOB(07)/126) http://www.wto.org/english/tratop_e/markacc_e/markacc_chair_texts07_e.htm. The subsequent NAMA Chair’s text bracketed a coefficient of 8 (TN/MA/W/103, 8 February 2008).
12

7
two extra years, the products will arrive at the same tariff level that they would have if they had adhered to the five-year implementation programme. Table 3 demonstrates that this marginal flexibility would do little to cushion the far-reaching impacts of NAMA on EU canned tuna tariffs.
There was considerable pressure on the EU-ACP system of non-reciprocal trade preferences even at the outset of the Doha Round. At the WTO Ministerial meeting in Doha in 2001, Southeast Asian countries led by Thailand (the world’s largest exporter of canned tuna) opposed a waiver for the continuation of EU-ACP non-reciprocal trade in the preparatory phase of the Cotonou Agreement (2000-2007) before Economic Partnership Agreements (EPAs) were due to be phased-in in 2008. The ‘Cotonou waiver’ was only granted, and the meetings in Doha concluded on the condition that the EU agreed to consult with the Southeast Asian countries on market access for their canned tuna exports in light of discrimination in favour of the ACP. The Southeast Asian countries were not satisfied with EU offers at meetings in 2001 and 2002 and requested WTO mediation in the dispute, which culminated in the allocation in early 2003 of a quota of 25,000 metric tons (mt) of canned tuna at 12 percent duty to Thailand, the Philippines, and Indonesia rather than the MFN duty of 24 percent (the ‘Cotonou compromise’ tariff quota). This is an extremely important point, because EU buyers preferred the price of canned tuna from Thailand at 12 percent duty under the ‘Cotonou compromise quota’ compared to the duty-free ACP product (Campling 2012a). This indicates that the ACP canned tuna industry would collapse, because it could not compete on price if NAMA were concluded using the Swiss formula coefficient detailed in Table 3. The flip side is that other developing countries would benefit, especially those in Southeast Asia that have a track record of high productivity in standardized fish processing.
Finally, it is also worth noting that the eventual conclusion of NAMA negotiations could possibly affect the degree of domestic tariff protection offered to the ACP (and other) tuna industry, as ACP governments would also be obliged to reduce import tariffs on NAMA products. With the lower coefficient currently being proposed for developing countries,13 Papua New Guinea (PNG) for example would potentially have to reduce its tariff for imported canned tuna from 15 percent to 8.8 percent or 20 percent to 10.2 percent (Campling et al. 2007b). This could have significant competitive implications for firms that have strong domestic market elements in their business models.
Fish and fish product sectoral
Parallel to NAMA negotiations, several ‘sectors’ were identified and targeted for more aggressive tariff reduction programmes. These mini-negotiations are known as sectorals. Fish and fish products were highlighted as a ‘sector,’ because they face higher tariffs than many other NAMA products.14
Several WTO members with an interest in fish and fish products worked on negotiating voluntary liberalization of fish and fish products to extend the scope of tariff reductions beyond NAMA outcomes. This proposal was supported by, among others, Canada, Iceland, New Zealand, Norway, Singapore, Thailand, and the US; all of which are major fish catching, processing, and/or trading nations. While most of these players have low average tariffs for fish products, and we would thus expect political support for liberalization, because it would improve the relative international competitiveness of domestic industry, it is interesting that Thailand supported this sectoral despite applying relatively high tariffs (see Table 4). This is because Thailand is a major exporter of fish products (particularly shrimp and canned tuna, see below), and in the domestic struggle between those interests who support protection and those who want enhanced market access, the latter are more powerful (on Thai industry’s aggressive promotion of liberalization, see Campling et al. 2007a). Since sectorals are voluntary, not all members would be required to commit to comprehensive liberalization.
‘Sectoral’ liberalization requires a ‘critical mass approach’; that is, members participating in the sectoral must represent approximately 90 percent of world trade of the product(s) in question. Also, unlike liberalization efforts undertaken using the Swiss formula, sectoral negotiations could eventually move the tariff level to zero. Resistance from major players, including Chinese Taipei, the EU, Japan, and South Korea, indicated that a fish sectoral was unlikely to progress, as the high average and maximum tariffs for fish for these players detailed in Table 4 would indicate. For example, the EU tuna lobby was strongly opposed, noting that the use of the Swiss formula already ignored the “specificities of a particular sector, such as canned tuna and the economic sensitivities of the producing countries” (EUROTHON 2006). Japan linked the ability to set fish tariffs to stock levels and fisheries management regimes, while Korea argued that tariff elimination could increase fishing effort (ICTSD 2006). In sum, there was never a great deal of momentum in the fish sectoral negotiations.
EUROPEAN UNION
The EU is the largest market for seafood in the world. While it is only the fifth largest producer of seafood (5.5 million mt in 2011), it is the world’s leading importer (8.3 million mt) (EUMOFA 2014). Tuna is the highest volume commercial species consumed at 2.68 kg per capita, 2.14 kg of which is canned tuna. The next highest species consumed are cod (1.96 kg); salmon (1.72 kg); and Pollack (1.64 kg). Spain is the largest consumer of processed tuna products, while Italy is
TN/MA/W/103, 8 February 2008 suggested a range of 20 to 25.
Draws from Campling et al. 2007a.
13
14
8
TABLE 4:
MFN applied tariffs for fish and fish products for selected countries in 2013
Country Average Tariff (%) Maximum Tariff (%)
Bangladesh 23.9 25
Brazil 10.3 32
Canada 0.9 11
Chile 6 6
China 10.6 23
Chinese Taipei 18.5 183
Colombia 14.4 15
EU 11.8 26
India 29.9 30
Indonesia 5.9 10
Japan 5.7 15
Korea, Rep. of 16.5 40
Country Average Tariff (%) Maximum Tariff (%)
Mexico 17.6 20
Myanmar 8.6 15
Norway 0.6 299
Pakistan 10.7 20
Peru 0.3 6
Russian Federation 12.3 76
South Africa 6.2 30
Sri Lanka 14.7 30
Thailand 11.4 15
Turkey 34.2 82
US 0.8 35
Vietnam 15.6 35
Source: WTO-ITC-UNCTAD (2014)
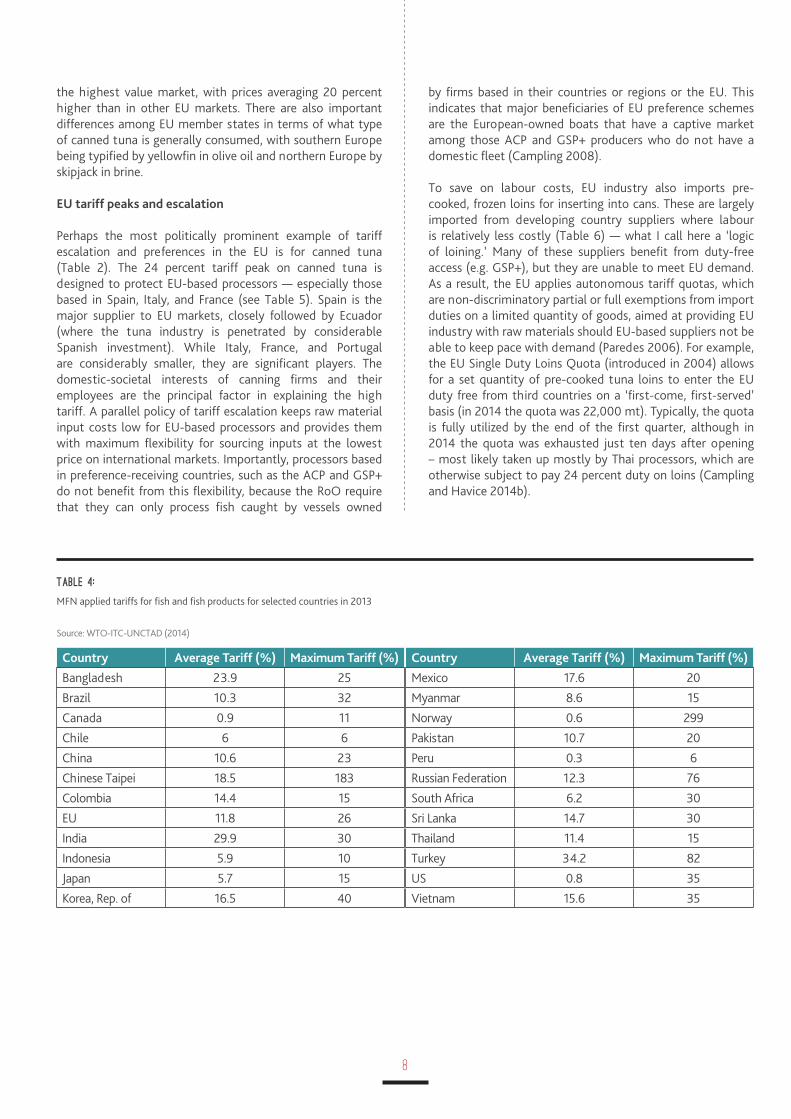
the highest value market, with prices averaging 20 percent higher than in other EU markets. There are also important differences among EU member states in terms of what type of canned tuna is generally consumed, with southern Europe being typified by yellowfin in olive oil and northern Europe by skipjack in brine.
EU tariff peaks and escalation
Perhaps the most politically prominent example of tariff escalation and preferences in the EU is for canned tuna (Table 2). The 24 percent tariff peak on canned tuna is designed to protect EU-based processors — especially those based in Spain, Italy, and France (see Table 5). Spain is the major supplier to EU markets, closely followed by Ecuador (where the tuna industry is penetrated by considerable Spanish investment). While Italy, France, and Portugal are considerably smaller, they are significant players. The domestic-societal interests of canning firms and their employees are the principal factor in explaining the high tariff. A parallel policy of tariff escalation keeps raw material input costs low for EU-based processors and provides them with maximum flexibility for sourcing inputs at the lowest price on international markets. Importantly, processors based in preference-receiving countries, such as the ACP and GSP+ do not benefit from this flexibility, because the RoO require that they can only process fish caught by vessels owned
by firms based in their countries or regions or the EU. This indicates that major beneficiaries of EU preference schemes are the European-owned boats that have a captive market among those ACP and GSP+ producers who do not have a domestic fleet (Campling 2008).
To save on labour costs, EU industry also imports pre-cooked, frozen loins for inserting into cans. These are largely imported from developing country suppliers where labour is relatively less costly (Table 6) — what I call here a ‘logic of loining.’ Many of these suppliers benefit from duty-free access (e.g. GSP+), but they are unable to meet EU demand. As a result, the EU applies autonomous tariff quotas, which are non-discriminatory partial or full exemptions from import duties on a limited quantity of goods, aimed at providing EU industry with raw materials should EU-based suppliers not be able to keep pace with demand (Paredes 2006). For example, the EU Single Duty Loins Quota (introduced in 2004) allows for a set quantity of pre-cooked tuna loins to enter the EU duty free from third countries on a ‘first-come, first-served’ basis (in 2014 the quota was 22,000 mt). Typically, the quota is fully utilized by the end of the first quarter, although in 2014 the quota was exhausted just ten days after opening – most likely taken up mostly by Thai processors, which are otherwise subject to pay 24 percent duty on loins (Campling and Havice 2014b).

9
TABLE 5:
EU import of canned tuna by major supplying countries in 1,000 mt.
TABLE 6:
EU import of tuna loins by major supplying country in 1,000 mt
Country Tariff regime (and % treatment)
2009 2010 2011 2012 2013
Spain EU (0%) 74.6 102.8 97.2 86.1 86.4
Ecuador GSP+ (0%) 63.7 62.2 71.5 73.7 84.1
Thailand GSP (21.5%) 64.4 68.9 76.2 47.4 61.4
Seychelles IEPA (0%) 42.3 41.0 43.5 43.7 51.4
Mauritius IEPA (0%) 35.4 44.2 43.9 46.9 50.5
Côte d'Ivoire IEPA (0%) 31.5 26.3 25.7 34.6 33.5
Philippines GSP (24%) 54.1 45.5 35.7 31.1 29.9
Ghana IEPA (0%) 26.5 27.4 25.9 26.1 21.4
PNG IEPA (0%) 14.6 15.9 15.6 19.6 18.8
Indonesia GSP (21.5%) 11.3 9.2 13.4 14.6 14.0
Vietnam GSP (21.5%) 7.8 7.3 8.5 9.4 13.2
Italy EU (0%) 13.3 13.8 13.9 13.0 11.6
Colombia GSP+ (0%) 12.7 11.4 13.3 12.2 11.5
France EU (0%) 12.2 6.4 5.9 6.5 7.8
Madagascar IEPA (0%) 7.3 6.8 9.7 8.0 7.7
El Salvador GSP+ (0%) 2.2 2.8 3.1 3.1 3.7
Portugal EU (0%) 2.3 2.4 3.9 3.5 3.7
Senegal EBA (0%) 1.7 0.8 0.5 0.1 1.7
Others Misc. 51.2 50.5 56.6 54.6 61.3
Total 529.2 545.7 564.0 534.5 573.5
Country Tariff regime (and % treatment) 2009 2010 2011 2012 2013
Ecuador GSP+ (0%) 43.9 37.2 36.5 34.2 35.8
PNG IEPA (0%) 1.8 2.5 5.6 8.2 9.8
Thailand GSP (21.5%) and loin quota (0%) 16.9 12.2 16.4 7.9 9.1
Mauritius IEPA (0%) 11.7 12.6 11.7 11.7 7.7
El Salvador GSP+ (0%) 13.1 7.6 5.8 6.2 7.3
Guatemala GSP+ (0%) 5.7 8.7 7.2 9.1 7.1
China GSP (21.5%) and loin quota (0%) 4.5 5.4 6.5 4.1 6.8
Indonesia GSP (21.5%) 0.1 0.1 1.4 3.1 4.3
Spain EU (0%) 0.7 0.9 1.7 2.0 4.1
Solomon Islands EBA (0%) 2.2 1.9 4.3 4.5 4.0
Philippines GSP (21.5%) and loin quota (0%) 0.1 0.1 0.1 0.2 3.4
Ghana Market access regulation/ IEPA (0%) 3.4 2.7 2.8 3.2 2.2
Kenya Market access regulation/ IEPA (0%) 3.2 3.7 4.2 4.3 2.0
Others 13.4 14.7 10.5 8.2 10.1
Total 120.7 110.1 114.9 107.0 113.7
Source: Globefish 2014
Source: Globefish 2014

10
EU GSP
The EU GSP regime consists of three pillars:
a) A ‘standard’ GSP scheme, which excludes only a handful of developing countries. For most fish products, tariff treatment under the ‘standard’ GSP used to be equivalent to the MFN tariff, but in January 2006 it was reduced by 3.5 percent across a range of processed fish products (e.g. fillets, canned tuna).
b) the Everything But Arms (EBA) initiative, which since 2001 has provided quota-free, duty-free treatment for all goods (bar arms and munitions) from all countries categorized as LDCs
c) The GSP+ is available to countries that have signed and ratified a set of 27 international conventions both on labour and human rights and on environmental and good governance. On top of this, the country must be categorized as ‘vulnerable’ according to its level of export-oriented economic diversification.
An important weakness of GSP schemes from the perspective of beneficiary countries is that they can be unilaterally reformed or rescinded (see section on the case of canned tuna for more on Ecuador and Maldives graduating from the EU GSP+ scheme).
The GSP+ regime in particular had important effects on industrial tuna production in Latin America. Between 1976 and 2003, the share of GSP Plus countries of world production of canned tuna grew from 3 percent to 9 percent (Oceanic Développement 2005: 114). The GSP+ (and the Drugs Agreement before it) provided the trigger for large-scale investment by Spanish processing firms, investing hundreds of millions of euros in Ecuador, El Salvador, Guatemala, and Venezuela. EUROTHON (the EU Tuna lobby group) estimates that its members alone (i.e. not all EU tuna processing companies are members) have created 35,000 jobs in fishing and processing industries in Latin America (due principally to the incentive of the GSP) (EUROTHON 2006).
EU-ACP relations
The EU administered an extensive preference scheme with the ACP under the Lomé Conventions (1976-1999) and the Cotonou Agreement (2000-8).15 This ended when the Cotonou Waiver secured at the outset of the Doha Round expired in 2008 (see above), which was to be replaced with a series of sub-regional EPAs. ACP exporters were able to access the EU market duty free compared with an MFN tariff of 24 percent (Table 2.).
Export-oriented canned tuna production represents one of the few success stories of industrial ‘upgrading’ in the ACP under Lomé (McQueen and Stevens 1989; Campling 2012a). In aggregate terms, the ACP share of world production of canned tuna grew from 5 percent to 12 percent between
South Africa’s trade relations with the EU were governed by the bilateral Trade, Development and Co-operation Agreement (TDCA), which was signed in 1999. Although together with several other Southern African states, it initialed an IEPA in July 2014, which is set to replace the TDCA.
Territorial seas as defined under United Nations Convention on the Law of the Sea (UNCLOS) (1982), Part II, Section II, Article 3.
15
16
1976 and 2003 (Oceanic Développement et al. 2005), supporting the position that “the Lomé Convention was in a key sense the midwife in the creation of the … ACP canning industry” (Grynberg and White 1998: 68). Drawing upon their analysis of trade data to mid-Lomé IV, Davenport et al. found that fish was the most important non-oil ACP export to the EU and was “one of the most successful cases of processing in the ACP countries” (1995: 20; see also McQueen et al 1998: 48), referring to fish fillets, frozen prawns and shrimp, as well as tuna products. Total direct full-time equivalent employment in EU-centred tuna processing facilities in ACP island states and coastal regions in the mid-2000s (when EPA negotiations were in full swing) totalled over 15,000 workers: Côte d’Ivoire 3,000; Ghana 2,000; Kenya 800; Madagascar 1,300; Mauritius 2,700; PNG 3,000; Senegal 2,400; Seychelles 2,300; and Solomon Islands 1,000 (Campling 2008). The indirect and induced employment produced by the activity of the factories is of course considerable (a multiplier of three is often used here). This is not to claim that the preference was the sole determinant in this process, but that it was an integral aspect of a set of necessary conditions.
Preference-dependent fish processing secures export-oriented employment and considerable socio-economic spin-offs, and it is often based on a resource extracted from national territory. Several ACP states engaged in the negotiation of reciprocal EPAs largely to maintain, previously non-reciprocal, preferential market access for a range of products, including for processed fish (e.g. processed hake from Namibia, Nile Perch fillets from east Africa). For example, continuing duty-free market access for canned tuna was a central reason for entering into an Interim EPA for PNG, and Seychelles, and it was a component of several other preferential items for Fiji, Ghana, Ivory Coast, Madagascar, and Mauritius.
EU preferential RoO for fish
EU RoO for fish are based on ‘wholly obtained’ criteria. Under (Interim) EPAs and the EU’s current GSP regime, the wholly obtained criteria f or fish and fish products are that:
• All fish is automatically wholly obtained when caughtinland and within the territorial seas (12 miles from the coast) of the signatories. The location determines origination.16 This can also include fish caught in a country’s archipelagic waters where the proper international legal procedures have been followed through the UN.17

11
• If caught outside of these locations, origination isdetermined by the ‘nationality’ of the boat (i.e. when caught in exclusive economic zones and in the high seas). Nationality is determined by: a) the boat being flagged and registered by one of the parties to the agreement; and, b) being at least 50 percent owned either by nationals of parties to the agreement or by a company based in one of the parties to the agreement.
The ‘wholly obtained’ approach is the basis of all EU preferential RoO for fishery products in international preferential trade arrangements, including in the Cotonou Partnership Agreement (and the Lomé Conventions before it).
The EU tuna fishing industry maintains that the RoO contributes to off-setting its higher cost structure compared to less heavily regulated competitors, especially in the realm of ‘social and environmental conditions’ (FITAG-Anfaco 2011: 2; Estudios Biologicos 2006). From the perspective of preference-receiving trading partners, such as the ACP group, EU fisheries RoO have long been perceived as a source of contention due to their restrictiveness (Commission for Africa 2005; Davenport et al. 1995; Ravenhill 1985; Stevens and Weston 1984).
UNITED STATES
US tariff peaks and escalation
US tariffs on fish and fish products are generally zero or very low except for products of commercial significance to US interests, such as fish fillets for certain species (6 percent); canned sardines (15-20 percent); canned tuna (6-35 percent); clam products (8.5 percent); ‘fish sticks’ (7.5-10 percent); and processed crab, other crustaceans, molluscs, etc. (7.5-10 percent). These peaks are all for processed products. For raw material (fresh, chilled, or frozen fish), the normal trade relations (NTR) tariff is generally zero, indicating a classic policy of tariff escalation, except for 3 percent on a handful of species such as Alaska pollock, hake, seabass, and tilapia (USITC 2014).
US tariffs on canned tuna and related products require detailed explanation (see Table 2). US duties for canned tuna in water (‘not in oil’, i.e. in brine or spring water) shifts from 6 percent to 12.5 percent when a tariff quota is full. The quota limits imports from any single country to no more than 4.8 percent of the total tuna in air tight containers consumed in the previous year. The US quota for tuna in water at 6 percent is filled extraordinarily quickly. Several Southeast Asian and Latin American producers report that taking advantage of the quota is both costly and risky as product must be stored in bonded warehouses in the US in advance and there is no guarantee that it will qualify for the quota (Campling et al. 2007a; Havice et al. 2014).
Canned tuna in oil has a very high NTR tariff at 35 percent. The US tariff schedule for canned tuna is structured with a high duty on tuna in oil and a lower duty on tuna in water simply because “no one thought that anyone would ever be interested in buying tuna in water!” (US industry representative interview in 2006, cited in Campling et al. 2007a: 2). The rise in health consciousness in the US from the 1980s onwards spurred the increase in consumption of tuna in water rather than in oil. Today, canned tuna in oil is a small market segment: at between 3.5 percent and 4.5 percent of the canned tuna import market by volume in 2011-12 (Havice et al. 2014). Without tariff protection of canned production offered to the two canneries based in the mainland US, these factories are highly unlikely to be able to compete with the costs of production in places such as the Philippines and Thailand.
Tuna loins for reprocessing under 1604 (i.e. to be defrosted and inserted into shelf-stable containers such as cans) are met with a NTR tariff of 6 percent when in bags of 6.8kg of less or 1.1¢ per kilogram when packed in bags of a higher volume (see Table 2). The US market for loins may only exist as long as US trade policy continues to protect domestic canners. (For more on the effect of this US tariff policy on the structure of global production).
US GSP
The US GSP provided for duty-free access to developing country beneficiaries for most manufactured items with the exception, among others, of canned tuna where the NTR rate is applied (see Table 2). An extended GSP scheme for ‘least-developed’ beneficiaries includes canned tuna in oil, in water, tuna loins, canned sardines and fish sticks (USTR 2012).
However, the US GSP was not renewed by the US Congress when it expired on 31 July 2013 (Jones 2014). While supported by the Obama administration, it is not known if Congress will re-extend the GSP scheme. In short, given that the GSP is unilaterally granted, it can also be unilaterally withdrawn.
Other US preference regimes
Insular Territories: US territories, such as American Samoa and Puerto Rico, receive substantial benefits in the US market. Fish processors in American Samoa do not pay any tariffs on the movement of goods to the US mainland, providing that products do not contain more than 70 percent in value of foreign components. The territory receives several additional benefits, including: an exemption by the United
For example, Papua New Guinea obtained a redefinition of its ‘territorial sea’ to incorporate the sea surrounding its entire archipelago. To receive this status under UNCLOS (1982) Part IV, Articles 47-50, a country declares the waters sovereign and submits the claim to the Division of Oceans and Law of the Sea at the UN (a collection house for declarations). If there is no dispute, the declaration becomes law. Before Papua New Guinea’s application, no other state had made use of archipelagic waters in relation to the EU RoO.
17

12
States Bureau of Customs from the Nicholson Act, which prohibits foreign vessels from landing or delivering fish in US ports; varying exemptions on taxes provided by the Federal and American Samoa governments; and the ability to supply US government procurement contracts for public schools, prisons, and the military (Campling and Havice 2007). The territory is, however, subject to federal minimum wage legislation, which is incrementally rising and is expected to meet that of the US mainland by 2027 (GAO 2014; Campling et al 2014a). American Samoa continues to take advantage of these benefits; however, in Puerto Rico the last remaining tuna processing plant was closed in 2012, because it was not commercially competitive.
The Andean Trade Preference Act and Ecuador: Introduced in 1991, the Andean Trade Promotion and Drug Eradication Act (ATPDA) was designed to support countries transition from relative dependence on the production and trade in coca/cocaine. Made available to Bolivia, Colombia, Ecuador, and Peru, the ATPDA provided duty-free access to the US market for almost all products except for canned tuna (among others). It did however provide duty free access for tuna in pouches compared to an NTR rate of 12.5 percent (Campling et al. 2007: 85-87; USTR 2013). This provided a commercially significant competitive advantage to producers in Ecuador, which emerged as the second largest supplier to the US of tuna in pouches after Thailand (Globefish 2014). The ATPDA expired after 31 July 2013 (USITC 2014: 24). It was dissolved because certain beneficiaries — including Colombia and Peru — signed bilateral FTAs with the US. However, Ecuador is yet to conclude long-standing FTA negotiations with the US. To compensate firms dependent upon the ATPA duty free preference for tuna in pouches, since July 2013 the Ecuadorian government is reportedly paying a direct subsidy to cover the tariff loss on these exports. However, this is scheduled to be phased out in mid-2015 and industry does not expect to be able to compete with tuna in pouches from Thailand when entering the US at the same tariff rate (Havice et al. 2014).
Selected US FTAs
The US currently has 14 FTAs in force (USITC 2014). It is beyond the scope of this paper to detail the tariff treatment of fish products under each of these. Instead, three examples are selected because of their actual or potential relevance as suppliers of the fish products identified earlier as having a potentially commercially significant preference compared to NTR treatment (i.e. primarily processed tuna products). They are FTAs involving: Central America, Colombia, and Korea.
The Dominican Republic-Central America-United States Free Trade Agreement Implementation Act (CAFTA-DR) was signed in 2004. It entered into force for the US, El Salvador, Guatemala, Honduras, and Nicaragua during 2006, for the Dominican Republic on 1 March 2007, and for Costa Rica on 1 January 2009 (USITC 2014). CAFTA-DR already provides duty-free or extremely low duty for all processed tuna products entering the US market, subject to RoO. Several of
these countries have a history of producing canned tuna and tuna loins, especially Costa Rica, El Salvador and Guatemala, which together have a combined annual production capacity of 78,000 mt of raw material (Hamilton et al 2011a: 233). They also benefit from duty-free access to the EU under the GSP+ (see above). There are, however, concerns about worker abuses in the Dominican Republic, Guatemala, and Honduras. The labour chapter and other clauses of the FTA are being used by the US in attempts to address these concerns (USITC 2014).
The U.S.-Colombia Trade Promotion Agreement (CTPA) with the US entered into force on 15 May 2012. Previously, Colombia accessed the US market under the Andean Trade Promotion and Drug Eradication Act (ATPDEA, see above). Under the ATPDEA and now the CTPA, Colombia has been exporting tuna loins duty free to the US (Hamilton et al. 2011a; Campling et al. 2007a). However, the trade preference is fairly small as the NTR duty is 1.1 cents per kilogram. Exporters based in Colombia will be able to access the US market duty free by 2021, subject to RoO (see below).
The United States-Korea Free Trade Agreement (KORUS) entered into force on 15 March 2012. For US tariff peaks on fish products, KORUS has one of the highest starting points of all of the US FTAs considered here. This may have been a defensive measure by the US government in KORUS negotiations to protect the US tuna fishing and processing industry, because Korean firms control a large fleet of tuna purse seiners (over 28 vessels) and long liners (about 150 vessels) and Dongwon Industries — the largest canning firm in Korea — owns the principal US canned tuna brand, Star-Kist. Canned tuna production in Korea is largely for domestic consumption (Hamilton et al. 2011a), but there are some exports to the US. This might be explained by the high tariff currently (in 2014) applied to canned tuna in oil (29 percent) and in water (post-quota: 10.3 percent), as detailed in Table 2. With the phase out of these tariffs by 2021 (see Table 7), it is conceivable that Korea will export to the US; although Korea’s relatively high cost structure — especially labour — may act as a competitive disadvantage.
US RoO for fish and fish products
Discrete RoO apply under different US preference regimes and FTAs. The following details a selection of these. For some arrangements, the RoO are spelled out in some detail, while for others only specific provisions are highlighted where they are different from the norm.
US RoO under the GSP
There are two steps for manufactured goods in the US RoO for the GSP (USTR 2009):
1. The article must be the growth, product, or manufacture of the GSP beneficiary. For fish and fish products, ‘origination’ is determined by whether the boat is registered or recorded in and flying the flag of the

13
beneficiary country or a member of a regional association or that of the US. It does not matter where the fish is caught — e.g. the exclusive economic zone (EEZ) of any country or the high seas.
2. The sum of the cost or value of materials produced in the beneficiary country plus the direct costs of processing must equal at least 35 percent of the appraised value of the article at the time of entry into the US.
Imported materials can be counted toward the 35 percent value-added requirement if they are ‘substantially transformed’ into new and different constituent materials, which are then used to produce the eligible article (USTR 2009).19 There are different ways of measuring ‘substantial transformation,’ including the change in tariff heading method (see below).
US RoO under FTAs
The major difference from the GSP RoO is that under several of the FTAs reviewed here20 only a single substantial transformation is necessary to determine origination, e.g. via a change in tariff classification (CTC). For example, under the North American Free Trade Agreement (NAFTA), the ‘change in tariff classification rules’ for fish and fish products are as follows:
• Chapter 3. A change to headings 0301 through 0307from any other chapter.
• Chapter 16. A change to headings 1601 through 1605from any other chapter. (USITC 2014: 35 and 37)
However, other FTAs appear to mirror the two steps of the GSP RoO, i.e. requiring origination and 35 percent local value added (e.g. the US-Morocco FTA).
TABLE 7:
Tariff phase out by year when zero is reached for processed tuna products for selected US FTAs
Product/ HS Code Central America Colombia Korea
Canned tuna (in oil)/ 1604.14.10 2015 2021 2021
Canned tuna (not in oil)/1604.14.22/ 30 2015 2021 2021
Tuna in foil pouches/ 1604.14.2218 NS NS NS
Tuna loins for use under 1604/ 1604.14.40/50 NS NS 2021
NS = not specifiedSource: USITC 2014
Prior to August 2002, tuna in pouches was not separately provided for in the US HTS.
The same RoO apply under the Compact Agreement with the addition that the cost or value of materials produced in the customs territory of the US may be counted toward the 35 percent value-added requirement, but only to a maximum of 15 percent of the appraised value of the imported article (CBP 2006: 66)
The review includes summaries of RoO texts in USITC (2014) for Australia, Central America, Chile, Singapore and South Korea. See also CBP (2013) for a basic side-by-side comparison of RoO and related measures under US FTA and preference schemes.
18
19
20
TARIFF ESCALATION AND
TARIFF PREFERENCES:
EFFECTS
GENERAL EFFECTS
A recent systematic review for the UK Department of International Development (DfID) of existing evidence on the role of fisheries in development was inconclusive both on the relationship between international trade and food security and on the contribution of export-oriented fish trade to national and local economic growth (Arthur et al. 2013). While the review did not include any research on tariff escalation and preferences in particular, it is worth repeating a few elements of the findings, because it speaks to the difficulties of doing careful applied research in the area. The review used strict criteria for the inclusion of research.
Nine qualifying studies bar one on international fish trade and food security considered in the DfID review rested largely on secondary data sets and had no clear methodology. The

14
conclusions were relatively inconsistent, reflecting essentially the lack of tangible evidence and the subsequent unsettled debate on this issue. Some authors claim that international fish trade contributes to improving food security of developing countries through fish export revenues, while others claim that international fish exports threaten food security at the local level (Arthur et al. 2013). However, none of the studies demonstrate any correlation between fish export revenues and imports of food or improvements in food security at national or local levels. Such work will remain challenging without more reliable data on national and intra-regional trade in most of the developing world and the inclusion of a wider group of tropical fish species in international trade classification beyond those of commercial significance to the global North (see discussion in Campling et al. 2008).
Much like the pro-liberalizer position outlined previously, studies included in the DfID review that look at the contribution of export-oriented fish trade to national and local economic growth generally assume that exploiting rising demand in export markets is an unproblematic means of wealth generation (Arthur et al. 2013). This work relies largely on international data sets of fish trade flows and fish-related revenue capture rather than evidence of the effects of these revenues on the national economy of the countries or the livelihoods of their populations. Contrary to this assumption, there is limited evidence that income from fish exports is actually redistributed and whether it is having a specific impact on poverty (e.g. Ponte et al. 2007; Arthur et al. 2010).
Outside of the DfID review, other studies at the local level do highlight, however, that the social relations of fisheries investment and trade are an important factor affecting the nature and distribution of benefits from fisheries and aquaculture (e.g. Platteau and Abraham 1987; Bush and Oosterveer 2007; Havice and Reed 2012). Each of these papers draw on local examples to argue that the wealth generated through trade is not necessarily invested back into the fisheries sector or to the regions from which the fish resources are being grown or extracted.
In light of the problems highlighted in the DfID review of making generalized assumptions based on ‘global’ snap shots, the rest of this section looks at available evidence of the effects of tariff escalation and preferences through concrete cases.
EFFECTS ON PRODUCTION STRUCTURES: THE
CASE OF CANNED TUNA
Tariffs and the global geography of canned tuna production
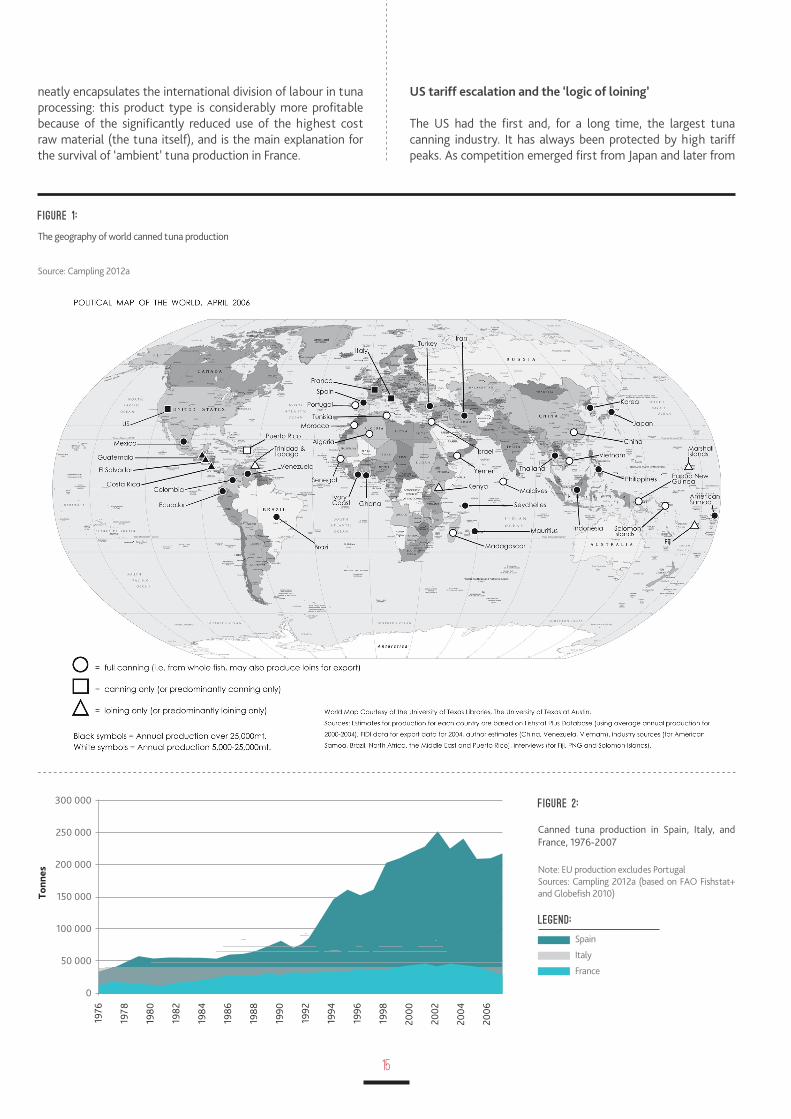
The EU and US tariff regimes play a major role in shaping the structure of global tuna production. Figure 1 provides a
snapshot of the international division of labour of canned tuna production. The figure depicts estimated production capacity of factories across the planet in the mid-2000s based on volume of tuna raw material capacity (i.e. whole fish or equivalent in loins of all canning-grade tuna species), but not necessarily actual output. Larger capacity is depicted with black symbols, while symbols for less significant locations of production are white. The square symbols represent primarily ‘canning only’ locations of production; the triangles represent specialized loining locations; and the circles represent full manufacturing from loining to canning. Canneries in Africa, Latin America, and the Pacific islands tend to focus on the EU market, largely as a direct result of tariff preferences, while those in Southeast Asia supply the US, Japan, and the EU. Canning only locations are all in the global North, and specialized loining takes place only in the South, largely in small developing economies — representing a fragmentation of production, based in large part around tariff policy. It should be emphasized that this aspect of the new international division of labour — the ‘logic of loining’ — is not solely about the search for cheap labour, but also for ready access to tuna fisheries, more lax labour standards and environmental regulations, and, importantly for this report, access to EU and US trade preferences and US fiscal advantages (for American Samoa). Since doing the research that fed into Figure 1, divestment saw Puerto Rico and Trinidad and Tobago stop producing, the Solomon Islands now produces predominantly loins, and China, PNG, and Vietnam now process annually more than 25,000 mt of raw material and would thus be represented by a black symbol.
EU tariff protection and canned tuna production
Spain is the most important producer of canned tuna within the EU, accounting for 59 percent of production in 1998 and 68 percent in 2007. It is also the world’s second largest producer of canned tuna after Thailand, having apparently received a major boost from 1992 onward with the institutionalization of the EU single market (see Figure 2). Given highly competitive conditions in the Spanish market, this indicates the effectiveness of tariff protection combined with the various productivity-enhancing strategies of firms (Campling 2012a). Italy is the second largest producer in the EU (traditionally for domestic consumption) and is in decline, from 24 percent of total EU production in 1998 to 19 percent in 2007. Spain is now the leading supplier to the Italian market. Production in France has remained relatively stable, falling from 12 percent of the EU total in 1998 to 10 percent in 2007.21 Importantly, ready-made tuna salads constituted 70 percent of all domestic production of ‘ambient’ tuna products in France in 2002 (Catarci 2004: 23).22 This aspect
The fourth location of EU production is Portugal, which had a 6 percent share of the EU total in 1998, falling to 4 percent in 2007.
21
In the UK, ‘ambient’ product (‘shelf-stable’ in the US) refers to traditional canned products, as well as tuna in pouches and other so-called value-added tuna products that can be kept in non-refrigerated conditions for long periods (i.e. on the supermarket shelf).
22
15
FIGURE 1:
The geography of world canned tuna production
Source: Campling 2012a
FIGURE 2:
Canned tuna production in Spain, Italy, and France, 1976-2007
Note: EU production excludes PortugalSources: Campling 2012a (based on FAO Fishstat+ and Globefish 2010)
neatly encapsulates the international division of labour in tuna processing: this product type is considerably more profitable because of the significantly reduced use of the highest cost raw material (the tuna itself), and is the main explanation for the survival of ‘ambient’ tuna production in France.
US tariff escalation and the ‘logic of loining’
The US had the first and, for a long time, the largest tuna canning industry. It has always been protected by high tariff peaks. As competition emerged first from Japan and later from
300 000
250 000
200 000
150 000
100 000
50 000
0
19
76
19
78
19
80
19
82
19
84
19
86
19
88
19
90
19
92
19
94
19
96
19
98
20
00
20
02
20
04
20
06
To
nn
es
LEGEND:
Spain
Italy
France
16
SVEs and preference dependence
It is widely recognized that SVEs suffer from competitive disadvantages associated with their scale and geographical isolation. The US, and especially, EU tariff preferences have been instrumental in the development and survival of tuna processing facilities in SVEs in the Indian and Pacific oceans. However, despite some similarities, national experiences are highly differentiated.
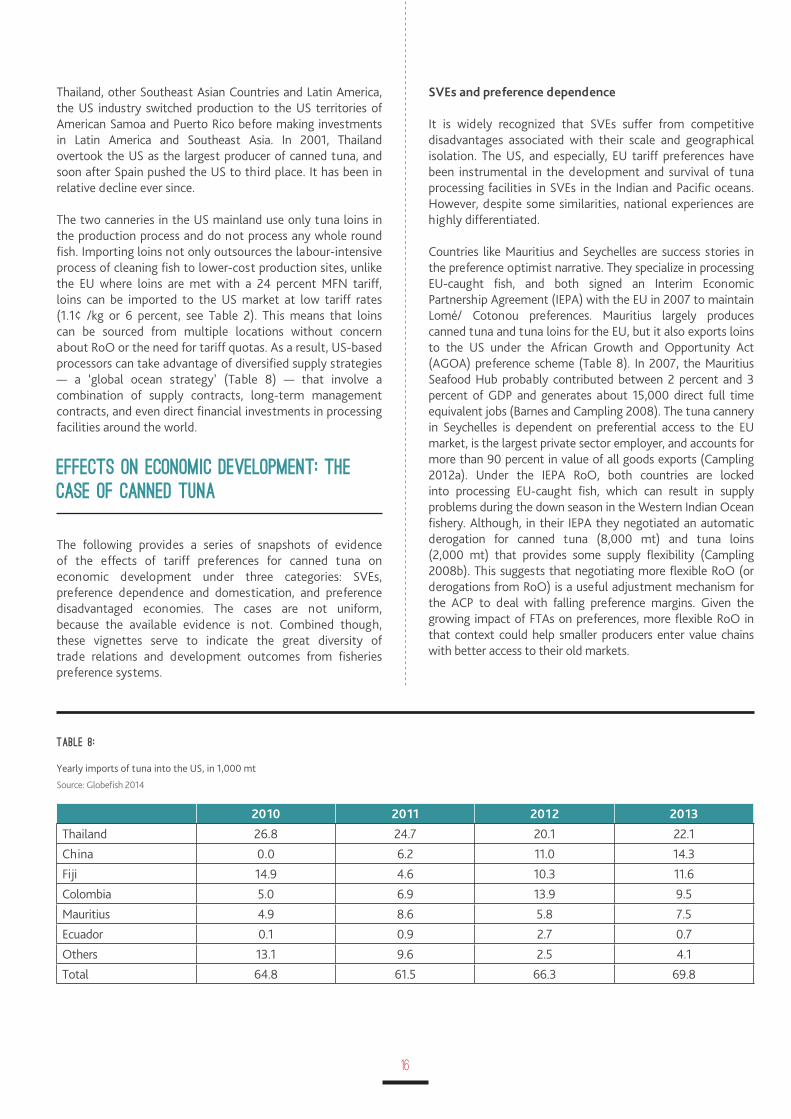
Countries like Mauritius and Seychelles are success stories in the preference optimist narrative. They specialize in processing EU-caught fish, and both signed an Interim Economic Partnership Agreement (IEPA) with the EU in 2007 to maintain Lomé/ Cotonou preferences. Mauritius largely produces canned tuna and tuna loins for the EU, but it also exports loins to the US under the African Growth and Opportunity Act (AGOA) preference scheme (Table 8). In 2007, the Mauritius Seafood Hub probably contributed between 2 percent and 3 percent of GDP and generates about 15,000 direct full time equivalent jobs (Barnes and Campling 2008). The tuna cannery in Seychelles is dependent on preferential access to the EU market, is the largest private sector employer, and accounts for more than 90 percent in value of all goods exports (Campling 2012a). Under the IEPA RoO, both countries are locked into processing EU-caught fish, which can result in supply problems during the down season in the Western Indian Ocean fishery. Although, in their IEPA they negotiated an automatic derogation for canned tuna (8,000 mt) and tuna loins (2,000 mt) that provides some supply flexibility (Campling 2008b). This suggests that negotiating more flexible RoO (or derogations from RoO) is a useful adjustment mechanism for the ACP to deal with falling preference margins. Given the growing impact of FTAs on preferences, more flexible RoO in that context could help smaller producers enter value chains with better access to their old markets.
Thailand, other Southeast Asian Countries and Latin America, the US industry switched production to the US territories of American Samoa and Puerto Rico before making investments in Latin America and Southeast Asia. In 2001, Thailand overtook the US as the largest producer of canned tuna, and soon after Spain pushed the US to third place. It has been in relative decline ever since.
The two canneries in the US mainland use only tuna loins in the production process and do not process any whole round fish. Importing loins not only outsources the labour-intensive process of cleaning fish to lower-cost production sites, unlike the EU where loins are met with a 24 percent MFN tariff, loins can be imported to the US market at low tariff rates (1.1¢ /kg or 6 percent, see Table 2). This means that loins can be sourced from multiple locations without concern about RoO or the need for tariff quotas. As a result, US-based processors can take advantage of diversified supply strategies — a ‘global ocean strategy’ (Table 8) — that involve a combination of supply contracts, long-term management contracts, and even direct financial investments in processing facilities around the world.
EFFECTS ON ECONOMIC DEVELOPMENT: THE
CASE OF CANNED TUNA
The following provides a series of snapshots of evidence of the effects of tariff preferences for canned tuna on economic development under three categories: SVEs, preference dependence and domestication, and preference disadvantaged economies. The cases are not uniform, because the available evidence is not. Combined though, these vignettes serve to indicate the great diversity of trade relations and development outcomes from fisheries preference systems.
TABLE 8:
Yearly imports of tuna into the US, in 1,000 mt
2010 2011 2012 2013
Thailand 26.8 24.7 20.1 22.1
China 0.0 6.2 11.0 14.3
Fiji 14.9 4.6 10.3 11.6
Colombia 5.0 6.9 13.9 9.5
Mauritius 4.9 8.6 5.8 7.5
Ecuador 0.1 0.9 2.7 0.7
Others 13.1 9.6 2.5 4.1
Total 64.8 61.5 66.3 69.8
Source: Globefish 2014

17
GSP+, with the EU accounting for about 60 percent of Ecuador’s total tuna exports (Atuna 2014b; Tables 2.3 and 2.4 above). Tuna exports to the US are comprised almost entirely of pouches (with an MFN tariff of 12.5 percent, Table 2), which were duty free under the Andean Trade and Development Preferences Act (ATDPA).23 Ecuador has a large domestic fishing fleet that meets both EU and US RoO. However, Ecuador graduates from GSP+ status in 2015, because its gross income no longer meets the EU’s reformed ‘vulnerability’ criteria. To counter the threat to export competitiveness, Ecuador signed a Free Trade and Development Agreement with the EU in July 2014, which provides preferential access for fisheries products, including tuna and shrimp (McCoy et al. 2014a)24. Similarly, the ATDPA expired at the end of 2012. Pouch exports only remained at prior levels, because the Ecuadorian government provided domestic industry with a temporary subsidy payment (over two years) that offset the cost of the duty (Havice et al. 2014). This subsidy offers another example of how a country adapted to the loss of trade preferences. Whether or not it is an option that is sustainable is an empirical question (e.g. the direct subsidy to maintain employment may or may not be preferable to the provision of social welfare payments), but it certainly suggests a temporary adjustment measure that could be recognized by the multilateral trade system.
Another example of preference-dependent domestic development is the ‘Namibianization’ policy that attempted to overcome the legacy of racialized ownership from prior South African rule. The Namibian case is concerned mainly with hake and monkfish processed products and canned pilchards, along with small volumes of tuna (FAO 2007). These are predominantly exported duty free to the EU under ACP preferences, a situation that is set to continue with the initialling of an IEPA in July 2014. The policy of localizing ownership of fishing enterprises through discounted resource access fees doubled the employment of Namibeans through the 1990s (Armstrong et al. 2004). It also meant that boats are compliant with EU RoO. However, through a complicated web of preferential shares, proxy ownership and cross ownership, de facto Namibian control over fishing industries remains low, with foreign ownership remaining dominant, consolidated into a handful of large conglomerations (Manning, 2000; Melber 2003).
In contrast, Fiji and the Solomon Islands both found in the late 1990s that they could no longer compete in EU markets for canned tuna even with the Lomé preference and downgraded to solely processing loins: Fiji to the US market using foreign caught fish, and the Solomon Islands to the EU under the EBA using fish caught by its own fleet, albeit with supply problems due to seasonality and exports loins to the US to keep the factory moving (Campling 2012a; Havice et al. 2014). Both are seen as crucial sources of employment in otherwise isolated regions within these two countries, especially for women (Lambeth et al. 2004; Sullivan and Ram-Bidesi 2008).
In the cases of Fiji and Mauritius, the ongoing supply of loins to the US market (which does not apply a tariff of major significance on tuna loins) suggests that there is a degree of cost competitiveness to labour-intensive processing in these two SVEs (Table 8). However, given that US tariff escalation on canned tuna in effect creates the market for pre-cooked frozen loins, the market for loins will exist only as long as EU, Japan, and US trade policy continues to protect their domestic canning sectors.
A good example of the risks associated with reliance on unilateral preferences like the GSP is Maldives. A major beneficiary of the EBA, duty-free access to the EU market supported two canned tuna factories supplied by a huge local small-scale fleet. However, Maldives graduated from LDC status in 2011 and was removed from the EBA in 2014. Without this preference, its exports appear to be less competitive, as evidenced in a 40 percent drop in exports over the first half of 2014 compared with the same period in 2013. Instead, Maldives is exporting more of its Marine Stewardship Council (MSC)-certified fish to Thailand for export-oriented processing to the EU (Atuna 2014a). According to the logic of the pro-liberalizers, this is the most efficient outcome, as comparative costs are minimized. However, given that tuna processing is a large employer of low-skilled labour and the Maldivian economy is yet to substantially diversify beyond tourism, it is unclear where the next round of jobs will come from. It is plausible that the Maldives will emerge as a supplier of specialized intermediate goods (e.g. whole tuna or loins certified by the MSC) to producers with competitive scale economies in processing, such as Thailand.
Preference dependence and domestication
Larger coastal states have tried to leverage the combination of market access opportunities presented by tariff preferences and access to rich fisheries in their EEZs to encourage local and/or foreign investment in onshore tuna processing.
Ecuador is the world’s second largest export-oriented tuna processor and a major example of preference-related fisheries development, much of which is domestically owned (Hamilton et al. 2011a; Globefish 2014). It is dependent on both EU and US trade preferences, particularly the
Ecuadorian producers also export small quantities to the Latin American market, to which they have duty-free access either through bilaterals or the Andean Community FTA, but they are experiencing competition from Asian producers, especially Thailand, which has duty-free access to the Peruvian market (Havice et al. 2014).
Together with Colombia and Peru, Ecuador was originally part of negotiations of the EU-Andean Community Free Trade Agreement, which commenced in 2007. In mid-2009, Ecuador opted to withdraw from negotiations, owing to conflicting concerns related to the agreement itself, as well as a long-running dispute with the EU over banana tariffs. With reforms to the EU’s GSP scheme in 2012 resulting in Ecuador graduating from the GSP+ and losing duty-free access from 31 December 2014, Ecuador utilized a provision in the Andean Agreement that enabled it to recommence negotiations (Havice et al. 2014).
23
24

18
and unregulated (IUU fishing) and comply with GSP+ requirements on labour standards, or whether the domestic fleet can source sufficient volumes of EU RoO-compliant fish (Campling et al. 2014; McCoy 2014b).
A preference disadvantaged case study of quite a different sort is South Korea. Despite being one of the world’s largest tuna fishing nations, the domestic processing sector largely focuses on the national market. For example, a 20 percent tariff on canned tuna helps one Korean company (Dongwon) control 70 percent of the domestic market, with the rest absorbed by local competitors (Park and Roh 2006 Hamilton et al. 2011a). The same firm also owns the number one canned tuna brand in the US. This may explain why the US-Korea FTA has particularly strict RoO for canned tuna. Under NAFTA and the US-Australia FTA, a simple change in tariff classification meets origination, but in the US FTA with Korea there is a very specific rule for canned tuna blocking the CTC method.
EFFECTS ON THE ENVIRONMENT
Most studies that deal with the environmental effects of trade liberalization on fish stocks are focused on fisheries access regimes, especially those of the EU in Africa (e.g. Alder and Sumaila 2004; Kaczynski and Fluharty 2002; Mbithi Mwikya 2006; UNEP 2002b, 2006; Walmsley et al. 2007; Acheampong 1997; European Parliament 2001; Kaczynski and Fluharty 2002; Lankester et al. 2001; Tarte 2002; ACP 2003; Bartels et al. 2007; Earle 2006; Gorez and O’Riordan 2003; Campling et al. 2012). There is very little evidence that identifies a direct effect (positive or negative) of tariff policy on a fish stock or stocks. The impact of liberalization on fish stocks, at least in theory according to the OECD, should depend on the supply response (harvest, processing capacity) to a change in price (tariff reduction). This depends on a whole range of factors, including the state of the affected stocks and how well they are managed. But, there is very little evidence of whether or how the theory applies in reality, and given the heterogeneity of fisheries and country situations the impacts will be very different in different places.
Logically, in the cases of tuna fisheries across the planet, it is extremely unlikely that tariff escalation or preferences have been a principal causal mechanism contributing negatively to the sustainability of the fish populations. This is because in each case the fish species is valuable regardless of the tariff regime and a competing player would replace the incumbent should the tariffs be liberalized.
In more recent years, others have tried to follow the strategy of fisheries domestification, most prominently PNG. Due to a combination of geographical isolation and other costs of doing business, processed tuna exports from PNG are dependent on duty free access to the EU market. In addition to the EU preference, a major explanation for onshore processing investment in PNG is ‘second generation’ fisheries access: by committing to onshore investment, foreign firms are allocated considerably more fishing licenses than necessary to supply that plant, offering long-term strategic resource access (Hamilton et al. 2011b). Nonetheless, the tuna industry provided about 1.2 percent of all formal monetary jobs in PNG in 2008 (Gillett 2009), with a disproportionate impact on women — about 3.3 percent of all formally employed women work in onshore tuna processing jobs (Sullivan and Ram-Bidesi 2008) — and together with net purchases in local businesses generates considerable net income to the economy (Hamilton et al. 2011b). A major constraint on deepening this development process was the EU RoO, which meant that there was “insufficient wholly obtained fish to meet on-land demand [given] the very limited fishing capacity of the Pacific states’ fishing fleet” (PACP-EU IEPA, Protocol II, Article 6.6(a)). As such, the negotiation of ‘global sourcing’ RoO25 in the Pacific ACP IEPA provided a necessary component for increased investment in onshore processing capacity, ostensibly to export fish products to the EU. A study commissioned by the European Parliament (2012) estimates that new investment stemming from the reformed RoO will see PNG’s local benefits from tuna processing grow from USD 21 million in 2012 to USD 70 million by 2018 and employment increase to 20,000. As noted earlier, reform of RoO could be seen as a very important adjustment measure to help countries retain some competitiveness as preferences fall.
Preference disadvantaged economies
Finally, and very briefly, it is worth highlighting some cases that do not benefit from significant trade preferences. The most prominent case in the canned tuna industry is Thailand, which is the world’s largest producer but with only very limited preferential market access. Even if it did benefit from a commercially significant preference,26 Thailand would not be able to benefit, because it imports about 85 percent of its tuna raw material, valued at approximately USD 1 billion; thus, its product would not meet EU RoO (Hamilton et al. 2011a). The country has FTAs only with Australia, New Zealand, and Japan, none of which is among its top three markets for fish products. As a result, depending on market and product type, Thailand pays between 6 percent and 35 percent duty to access its most important markets for canned tuna (Table 2). While it has shown it can clearly compete at these tariff rates, competition will continue to deepen as other countries secure preferential market access. Of particular concern to Thai industry is the Philippines obtaining GSP+ status.27 The Philippines was awarded GSP+ status in December 2014, but critical questions still face its tuna industry, including whether it can address shortcomings identified in national efforts to fight illegal, unreported,
This rule permits Pacific - African Caribbean Pacific (PACP) signatories to the Interim EPA to source fish from any vessel regardless of flag or where caught, provided it has been ‘substantially transformed’ by a PACP-based processing facility. In technical RoO terms, this is a CTS method.
It does qualify for a 3.5 percent advantage over the EU MFN rate under the ‘standard’ GSP (Table 1)
Pers. Communication, Thai Industry Representative, 22 May 2014.
25
26
27

19
An official of the Netherlands’ Ministry of Foreign Affairs stated at an OECD workshop that “Tariff escalation may generally lead to more pressure on the stocks to maintain revenue rather than the other way around” (Genee 2006: 182). There is some evidence that dependence on fish exports is correlated with the over-exploitation of stocks (Roheim 2004), but factors other than tariffs are at play too. As Heydon of the OECD points out “fishers catch what nature and fisheries managers allow” (2006: 119).
It is widely acknowledged that dependence on fish exports for foreign exchange, local employment, and government revenue has accompanied the over-exploitation of fish populations (e.g. Roheim 2004). But, this is not the same as saying that liberalization of import tariffs per se caused over-exploitation. As we have seen, markets may be highly protected (e.g. the EU and US markets for canned tuna) but low cost production is still able to penetrate them despite tariff peaks (e.g. Thailand). Thus, the problem is not necessarily liberalization but a concert of factors, including the state of the affected stocks, fisheries management, domestic development policy, firm strategies, etc.
There is some evidence that tuna production networks produce environmental pollution, with negative implications for coastal fisheries and local food security. This includes reports in Pacific island countries of incidents of inadequate waste water treatment, e.g. where plants ran out of chemicals or faulty plumbing resulted in waste washed ashore (Barclay 2010; Havice and Reed 2012). There has been considerable study of the environmental effects of canned tuna production in PNG in particular, largely owing to Spanish industry complaints about ‘global sourcing’ RoO in the Pacific ACP IEPA. But, even in these highly detailed single case study analyses, it proved difficult to demonstrate a direct correlation between trade policy and negative resource impacts per se (Hamilton et al. 2011b; European Parliament 2012). While there may be problems with fisheries management in general, global sourcing may have reduced pressure on sensitive areas. Previously, PNG obtained a redefinition of its ‘territorial sea’ to incorporate the sea surrounding its entire archipelago to meet prior EU RoO. In principle, global sourcing RoO removed pressure from these waters, although this is complicated by PNG having an exemption from the regional licensing system — the Vessel Day Scheme — for boats in these waters.
CONCLUSION
Most commercial capture fisheries species are at or beyond their sustainable limits. Using the case of canned tuna, this report argued that tariff regimes are about capturing a relative share of the already fragile pie by influencing the location of production by raising or reducing costs vis-à-vis competitors, they are not about expanding the pie to new
limits. This report has argued that the impact of preferences cannot be understood without taking into account the particular characteristics of the beneficiary country. Environmental change; local state policy (e.g. concerning resource access); distant water fleets; multinational firms and other investors; organized labour; civil society and NGOs; and donors can all play a role in shaping the development possibilities associated with commercially viable trade preferences. This makes general recommendations difficult. One thing is clear: there is a need for sensitivity to complexity and contingency in understanding the dynamics of change. As the OECD (2006: 53) points out:
The development of fisheries, including management and trade aspects (policies, institutions and processes), should be conceptualised as a process which can change (positive/ negative) over time and can be influenced by a range of factors (endogenous/ exogenous), leading to different outcomes.
This certainly suggests that one-size-fits-all policy prescriptions based on simplistic assumptions about the functioning of the world economy will not alone suffice as a policy framework. At a minimum, there needs to be more attention to careful differentiation among countries’ interests, recognizing that “trade and development policy may not be coherent for all developing countries concerned”(OECD 2006a: 52).
Arguments both for and against the liberalization of fish tariffs are all too often ideologically driven generalizations and need to be tested against objective evidence to help devise appropriate policy responses or amend existing policies to achieve the overall social objectives in this area. In this context, previously cited perspectives which qualify the benefits of fish liberalization are significant. Ideology aside, the real point here is that new trade arrangements are changing the competitiveness of preference recipients. As this report has shown, tariff preferences and escalation have had an important impact on tuna production and processing activities, shaping the international division of labour. The question is what can be done to counter or ease the adjustment if preference-dependent production becomes non-competitive. Preference erosion is an especially sensitive concern for SVEs, where few alternatives for large-scale private sector employment exist beyond fish processing.
A major change in the late 2000s was the move of the ACP from the non-reciprocal preferences of Lomé/ Cotonou to a network of regional trade agreements (RTAs) in the form of reciprocal EPAs. (A handful of ACP economies categorized as LDCs benefit from the EU’s preferential EBA scheme, most notably the Solomon Islands.) By 2015, non-LDC fish exports from the ACP to the EU no longer utilized non-reciprocal preferences, but they did continue to depend on duty-free market access under EPAs to compete with lower-cost producers, especially in Thailand, which continues to be hit with a 21.5 percent to 24 percent tariff. This was evidenced by EU buyers scrambling for canned tuna from

20
Thailand at 12 percent duty under the ‘Cotonou compromise quota,’ suggesting that the ACP canned tuna industry could not compete on price if Thailand negotiated a reduced tariff under a RTA with the EU. It is not yet known whether the Philippines’s graduation to the GSP+ will divert trade from the ACP and other GSP+ countries, but it is certainly a prospect. In any event, it is clear that significant tariff liberalization by the EU would make canned tuna exports from the ACP and GSP+ non-competitive vis-à-vis relatively lower-cost production in Southeast Asia.
A number of trade-related measures to adapt to this changing environment were suggested in this report. Five are re-iterated here with the earlier caveat in mind on the problem of generalized recommendations in the face of complexity and contingency. The first recommendation extends from this caveat: blanket, one-size fits-all policymaking will not work, especially for fisheries trade. Disaggregation and context are necessary for evidence-based policymaking to take account of species- and country-specific dynamics. Second, there should be no confusion about the positive linkages between good fisheries management and environmental effects. Therefore, given the current lack of evidence on the effects of trade liberalization on fisheries, a first principle in thinking through fisheries trade policy must be the precautionary approach. Third, as the competitive advantage offered by tariff preferences falls in major markets with the growing network of RTAs, public and private standards are likely to become the main market access constraint for fish products from preference-dependent countries. Financial, technical, and institutional support from home governments; donors; and (where appropriate) lead firms, such as big brands and retailers is necessary to spread the costs required to comply with standards, especially for smaller producers. Fourth, evidence from PNG suggests that negotiating more flexible RoO (or derogations from RoO) under preference schemes and RTAs is a useful adjustment mechanism for preference-dependent producers to deal with falling preference margins. Given the growing impact of RTAs on preferences, more flexible RoO could help bolster smaller producers in global value chains. However, given that the distributional impacts of RoO benefit fishing interests from preference-allocating states (e.g. the EU), there will be considerable opposition to greater flexibility. Finally, the experience of Ecuador’s loss of preferential access to the US market with the expiration of the ATDPA shows that unilateral allocations cannot be relied upon. It also shows how one state responded to preference erosion: the public provision of temporary subsidies to the private sector to offset the cost of the US import duty. Adjustment measures such as this could be recognized by the multilateral trade system as legitimate responses to preference erosion.
Acheampong, A. (1997), Coherence Between EU Fisheries Agreements and EU Development Cooperation: The Case of West Africa. ECDPM Working Paper, No. 52, Maastricht: ECPDM
ACP (2003), EU-ACP Fisheries Agreements – Co-operation, Partnership Agreements: Executive brief. Brussels: ACP Secretariat
Ahmed, Mahfuz (2006), Market Access and Trade Liberalisation in Fisheries, ICTSD Natural Resources, International Trade and Sustainable Development Series Issue paper No. 4. Geneva: ICTSD.
Alder, J., & Sumaila, U. R. (2004), “Western Africa: A fish basket of Europe past and present,” Journal of Environment and Development, 13(2): 156–178
Allain, M. (2007), Trading Away Our Oceans: Why trade liberalization of Fisheries must be abandoned, Amsterdam: Greenpeace International
Amsden, A. (1989), Asia’s Next Giant: South Korea and Late Industrialization, Oxford, Oxford University Press
Armstrong, C. W., U. R. Sumaila, A. Erastus and O. Msiska (2004), Benefits and costs of the Namibianisation policy. In U. R. Sumaila, D. Boyer, M. D. Skogen, and S. I. Steinshamn (Eds.), Namibia’s fisheries: Ecological, economic and social aspects. Amsterdam: Eburon.
Arthur, R., C. Béné, W. Leschen and D. Little (2013), Fisheries and aquaculture and their potential roles in development: an assessment of the current evidence, Report commissioned by UK Department for International Development.
Arthur, R.I., Mees, C.C. & Halls, A.S. (2010). Assessing the impacts of fisheries management science: a review of DFID’s Fisheries Management Science Programme. Journal of Development Effectiveness 2(1): 158-172
Atuna (2014a), Will Maldives Canners Survive The EU Tariff Rise? 8 September 2014.
Atuna (2014b), How dependent are Ecuador’s exports on Europe? 14 July.
Barclay, K. (2010), Impacts of tuna industries on coastal communities in Pacific Island countries. Marine Policy, 34: 406–413
Barnes, C. and Campling, L. (2008). The Competitive Position of the Mauritius Seafood Hub, Present and Future Challenges,
REFERENCES
21
Development Options and Scenarios. Report to the Mauritius Board of Investment and Commonwealth Secretariat.
Bartels, L., L. de la Fayette, H. Davies and L. Campling (2007). Policy Coherence for Development and the Effects of EU Fisheries Policies on Development in West Africa, Brussels: European Parliament.
Béné, C., R. Lawton and E. H. Allison (2010), Trade Matters in the Fight Against Poverty: Narratives, Perceptions, and (Lack of) Evidence in the Case of Fish Trade in Africa. World Development, 38 (7): 933–954.
Bostock, T., G. Greenalgh and U. Kleith (2004), Policy Research – Implications of liberalisation of fish trade for developing countries, Chatham: Natural Research Institute.
Bush, S. R. & P. Oosterveer (2007), The missing link: intersecting governance and trade in the space of place and the space of flows. Sociologia Ruralis 47(4): 384-400.
Campling, L. (2008a), Direct and Indirect Preference Erosion and the Competitiveness of the ACP Tuna Processing Sector. In V. Qalo (ed.), Bilateralism and Development: Emerging Trade Patterns. London, Cameroon May.
Campling, L. (2008b) Fisheries Aspects of ACP-EU Interim Economic Partnership Agreements: Trade and Sustainable Development Implications. ICTSD Series on Fisheries, Trade and Sustainable Development – Issue Paper No. 6. Geneva: International Centre for Trade and Sustainable Development.
Campling, L. (2012a). The EU-centred Commodity Chain in Canned Tuna and Upgrading in Seychelles. PhD thesis, School of Oriental and African Studies, University of London.
Campling, L. (2012b). The tuna ‘commodity frontier’: business strategies and environment in the industrial tuna fisheries of the Western Indian Ocean. Journal of Agrarian Change, 12 (2-3), 252-278
Campling, L. (2015). Historicising trade preferences and development: The case of the ACP-EU canned tuna preference. In G. Fridell and K. Ervine, Beyond Free Trade, Basingstoke: Palgrave.
Campling, L. and E. Havice (2007), Industrial development in an island economy: US trade policy and canned tuna production in American Samoa. Island Studies Journal, 2(2): 209-228.
Campling, L. and E. Havice (2014a), New report summarises impacts of American Samoa minimum wage increases as Tri Marine investment moves forward. FFA Trade and Industry News, 7(2): March-April.
Campling, L. and E. Havice (2014b), EU Loins Quota for 2014 exhausted in ten days. FFA Trade and Industry News, 7(1): January-February.
Campling, L. and E. Havice (2014c), The problem of property in industrial fisheries. Journal of Peasant Studies, 41 (5): 707-727
Campling, L., E. Havice and M. McCoy (2014), Can the Philippines meet EU GSP+ labour standards? FFA Trade and Industry News, 7(3): January-February.
Campling, L., E. Havice and P. McCall Howard (2012), The Political Economy and Ecology of Capture Fisheries: Market Dynamics, Resource Access and Relations of Exploitation and Resistance. Journal of Agrarian Change, 12 (2-3): 177-203
Campling, L., E. Havice and D. Primack 2007b, Trade-Related Aspects of Tuna Industry Development in Papua New Guinea. FFA Fisheries Trade Studies National Briefing Paper, Honiara: Pacific Islands’ Forum Fisheries Agency
Campling, L., E. Havice and V. Ram-Bidesi (2007a), Pacific Island Countries, the Global Tuna Industry and the International Trade Regime, Honaira: Pacific Islands Forum Fisheries Agency.
Campling, L. with A. Hamilton and M. Batty (2008), An Assessment of the Potential Benefits to PACP States of a Revision of the Rules of Origin for Fisheries Products of HS Chapters 0304 and 0305. Report Prepared for the Pacific Islands Forum Secretariat;
Catarchi, Camillo (2004), World Tuna Markets. GLOBEFISH Research Programme, Vol. 74, Rome: FAO
CBP 2013, Side-by-Side Comparison of Free Trade Agreements and Selected Preferential Trade Legislation Programs--Non-Textiles, November 19, 2011. US Customs and Border Protection, Department of Homeland Security.
Chang, H-J. (2004), Kicking Away the Ladder: Development Strategy in Historical Perspective, London, Anthem Press
Clark, L. (2006). Perspectives on Fisheries Access Agreements: Developing Country Views. In OECD, Fishing for Coherence: Proceedings of the Workshop on Policy Coherence for Development in Fisheries, Paris: OECD
Commere, P. (2009), Overview of the European tuna market, Paper presented to the 2nd European Tuna Conference, Brussels 27 April 2009
Commission for Africa (2005), Our Common Interest: Report of the Commission for Africa, London: Commission for Africa.
Cunningham, S., A. E. Neiland, M. Arbuckle and T. Bostock (2009), Perspectives: Wealth-based Fisheries Management: Using Fisheries Wealth to Orchestrate Sound Fisheries Policy in Practice. Marine Resource Economics, 24 (3): 271-287

22
Davenport, M. (1992). Africa and the Unimportance of Being Preferred. Journal of Common Market Studies, XXX (7), 233-251
Davenport, M., Hewitt, A., and Koning, A., (1995). Europe’s Preferred Partners? The Lomé Countries in World Trade. London: Overseas Development Institute
DG TRADE and DG DEV (2002), Economic Partnership Agreements – Start of Negotiations: A new approach in the relations between the European Union and the ACP countries. Brussels: Directorate-General for Trade and Directorate-General for Development, European Commission.
Duncan, R. (2006). Troubled Fishing in Pacific Waters. Pacific Economic Bulletin 21 (3): 98–105
Earle, M. (2006), Paying for Unsustainable Fisheries: Where the European Union Spends its Money. In D. M. Lavigne (ed.), Gaining Ground: In Pursuit of Ecological Sustainability, International Fund for Animal Welfare and University of Limerick
Estudios Biologicos (2006), Chapter 6 ‘Evaluación de los costes de explotación de un buque atunero’ (circulated and translated by Béatrice Gorez)
EUMOFA (European Market Observatory for Fisheries and Aquaculture Products) (2014), The EU Fish Market, 2014 Edition, EU-Directorate General for Maritime Affairs and Fisheries, 2014
European Parliament (2012), Application of the System of Derogation to the Rules of Origin of Fisheries Products in Papua New Guinea and Fiji, requested by the Committee on Fisheries, Brussels.
EUROTHON (2006), EUROTHON Position on the WTO Negotiations Regarding the Tariff Preference Erosion in the Tuna Market, May
FAO (2007), FAO Fishery Country Profile – The Republic of Namibia. FID/CP/NAM (March), Rome: FAO
FAO (2014), The State of World Fisheries and Aquaculture: Opportunities and challenges, Rome: FAO
FITAG-ANFACO (2011), Joint Statement of Defence of the Community Prepared and Canned fish and Shellfish Industry Against EU Trade Agreements with Third Countries. Submitted by Juan M. Vieites Baptista de Sousa, Secretart General, ANFACO-CECOPESCA, to Joachim Zeller, DG Trade, European Commission, 1 August 2011.
GAO (2014), American Samoa and the Commonwealth of the Northern Mariana Islands: Economic indicators since minimum wage increases began. Government Accountability Office Report # GAO-14-381. March.
Gillett, R. (2009). Fisheries in the economies of the Pacific Island Countries and Territories. Mandaluyong City, Philippines: Asian Development Bank
Gillett, R. and G. Preston (2012), Feasibility Assessment of Exporting Products of HS Headings 0304/ 0305 to the European Union. Report Prepared for the Pacific Islands Forum Secretariat (February).
Globefish (2014). Commodity Update: Tuna. Food and Agriculture Organization: Rome.
Golub, S. and A. Aly Mbaye (2002). Obstacles and Opportunities for Senegal’s International Competitiveness: Case Studies of the Peanut Oil, Fishing and Textile Industries, Africa Region Working Paper Series No. 37, World Bank
Gorez, B. and B. O’Riordan (2003), The future of European-Union-ACP fisheries relations. In Roman Grynberg (ed.), Fisheries Issues in WTO and ACP-EU Trade Negotiations, London: Commonwealth Secretariat
Grilli, E.R., (1993). The European Community and the Developing Countries. Cambridge: Cambridge University Press.
Hamilton, A., A. Lewis, M.A. McCoy, E. Havice, and L. Campling (2011a), Market and Industry Dynamics in the Global Tuna Supply Chain. Honiara: Pacific Islands Forum Fisheries Agency
Hamilton, A., T. Lewis and L. Campling (2011b), Report on the implementation of the derogation to the standard rules of origin granted to the Pacific ACP States in the framework of the Interim Economic Partnership Agreement. FWC COM 2011 RFS 2011/266449.
Havice, E. and K. Reed (2012), Fishing for development? Tuna resource access and industrial change in Papua New Guinea. Journal of Agrarian Change, 12 (2-3): 413-35
Havice, E. and L. Campling (2013), Articulating upgrading: Island developing states and canned tuna production. Environment and Planning A, 45(11), 2610–2627
Havice, E., L. Campling, M. McCoy and T. Lewis (2014), Pacific Island Countries and United States of America Development-Oriented Trade & Investment Study – Fisheries Component, Suva: Pacific Islands Forum Secretariat.
Heydon, K. (2006), Trade and Fisheries Globalisation: Issues for Developing and Developed Countries. In OECD (ed.), Fishing for Coherence: Proceedings of the Workshop on Policy Coherence for Development in Fisheries, Paris: OECD
Hilmy, H. (2008), Speech of the Minister of Fisheries, Agriculture and Marine Resources to the 10th INFOFISH World Tuna Trade Conference and Exhibition, Bangkok, Thailand, 28–30 May 2008.
23
ICTSD (2006), Fisheries, International Trade and Sustainable Development: Policy Discussion Paper, ICTSD Natural Resources, International Trade and Sustainable Development Series. Geneva: ICTSD
Jones, V. C. (2014), Generalized System of Preferences: Background and Renewal Debate, CRS Report for Congress, Congressional Research Service.
Kaczynski, V. M., & Fluharty, D. L. (2002). European policies in West Africa: Who benefits from fisheries agreements? Marine Policy, 26 (2), 75-93.
Kusumawati, R., S. R. Bush & L. Visser (2013). Can patrons be by-passed? Frictions between local and global regulatory networks over shrimp aquaculture in East Kalimantan. Society and Natural Resources 26(8): 898 - 911.
Kurien, J. (2005), Responsible fish trade and food security. FAO Fisheries Technical Paper 456, Rome: FAO
Lambeth, L., M. Leniston and A. Vunisa (2004), Gender issues in the tuna industry: Pacific Examples – Volume 2, Suva: Pacific Islands Forum Secretariat
Lankester, K., P. Samba Diouf and S. Sané (eds.) (2002), Fisheries Access in West Africa – Proceedings of two workshops held in Senegal and Mauritania, WWF-WARPO, Senegal.
Manchin, M. (2006), Preference Utilisation and Tariff Reduction in EU Imports from ACP Countries. The World Economy, 29(9): 1243-1266.
Manning, P. (2000), Review of the Distributive Aspects of Namibia’s Fisheries Policy, NEPRU Research Report No. 21, Windhoek: Namibian Economic Policy Research Unit.
Martini, R. and C. Lindberg (2013), Fishing for Tomorrow: Managing fisheries for sustainable development. Coherence for Development, 2 (December), Paris: OECD
Mbithi Mwikya, S. (2006a) Fisheries Access Agreements: Trade and Development Issues, ICTSD Natural Resources, International Trade and Sustainable Development Series Issue Paper No. 2, International Centre for Trade and Sustainable Development, Geneva
Mbithi Mwikya, S. (2006b), Trade issues and policy coherence in fisheries: A developing country perspective on sanitary and phyosanitary standards and other non-tariff barriers. In OECD (ed.), Fishing for Coherence: Proceedings of the Workshop on Policy Coherence for Development in Fisheries, Paris: OECD
McCoy, M., E. Havice and L. Campling (2014a), Ecuador concludes a Free Trade Agreement with the EU. FFA Trade and Industry News, 7(4): July-August.
McCoy, M., E. Havice and L. Campling (2014b), Philippines’ EU-GSP+ application outcome remains uncertain. FFA Trade and Industry News, 7(4): July-August.
McQueen, M., and Stevens C., (1989),Trade Preferences and Lomé IV: Non-traditional ACP Exports to the EC. Development Policy Review, 7 (3), 239-260
McQueen, M., Phillips, C., Hallam, D., and Swinbank, A., (1998), ACP-EU Trade and Aid Cooperation: Post-Lomé IV. Commonwealth Economic Paper Series No. 32, London: Commonwealth Secretariat
Melber, H. (2003), Of Big Fish &Small Fry: The Fishing Industry in Namibia. Review of African Political Economy, 30 (95): 142-149
Melchior, A. (2006), Tariffs in World Seafood Trade. FAO Fisheries Circular no. 1016, Rome: FAO.
Milberg, W. and D. Winkler (2013). Outsourcing Economics: Global Value Chains in Capitalist Development, Cambridge University Press.
Moss, J., and Ravenhill, J., (1987). The Evolution of Trade under the Lomé Conventions: The First Ten Years. In: C. Stevens and J.V. van Thermatt eds. Europe and the International Division of Labour. London: Hodder and Stoughton
Naumann, E. (2010), Rules of Origin in EU-ACP Economic Partnership Agreements, Geneva: International Centre for Trade and Sustainable Development
Nieto, G. E. (2006), Chapter 4: Policy coherence: Trade and developing countries. In OECD (ed.), Fishing for Coherence: Proceedings of the Workshop on Policy Coherence for Development in Fisheries, Paris: OECD
NOAA (1981a), The Tuna Fisheries of Cape Verde and Senegal. Marine Fisheries Review, 43(12): 23-25.
NOAA (1981b), The Tuna Fishery of the Ivory Coast. Marine Fisheries Review, 43(10): 23-24.
Oceanic Développement, Poseidon and Megapesca (2005), The European Tuna Sector: Economic Situation, Prospects and Analysis of the Impact of the Liberalisation of Trade, Specific Convention SC 12, Project Fish/ 2003/02, Final Report
Oceanic Développement-Megapesca (2007), Rules of Origin in Preferential Trade Arrangements: New Rules for the Fishery Sector. Draft Final Report—Contrat Cadre FISH/2006/20
OECD (2003), Liberalising Fisheries Markets: Scope and Effects, Paris: OECD
OECD (2006a), Fishing for Coherence: Fisheries and Development Policies, Paris: OECD

24
OECD (2006b), Fishing for Coherence: Proceedings of the Workshop on Policy Coherence for Development in Fisheries, Paris: OECD
OECD (2012), Globalisation in Fisheries and Aquaculture: Opportunities and Challenges, Paris: OECD
Paredes, P. (2006), Tariffs, Preferential Tariff Arrangements and Tariff Escalation: Policy Coherence Issues. In OECD (ed.), Fishing for Coherence: Proceedings of the Workshop on Policy Coherence for Development in Fisheries, Paris: OECD
Park, S. and J. Roh (2006), Republic of Korea Fishery Industry Profile: Post-Harvest Sector, FAO/ GLOBEFISH Research Programme, Vol. 88, Rome: FAO
Petersen, E. (2006), Institutional Economics and Fisheries Management: The Case of Pacific Tuna. Cheltenham, UK: Edward Elgar.
Platteau, J. P. & A. Abraham (1987). An Inquiry into Quasi-Credit Contracts: The Role of Reciprocal Credit and Interlinked Deals in Small-scale Fishing Communities. The Journal of Development Studies 23(4): 461-490.
Ponte, S., J. Raakjær and L. Campling (2007). Swimming Upstream: Market Access for African Fish Exports in the Context of WTO and EU Negotiations and Regulation. Development Policy Review, 25(1): 113-138.
Ravenhill, J., (1985), Collective Clientalism: The Lomé Conventions and North-South Relations. New York: Columbia University Press
Ravenhill, J. (1985), Collective Clientalism: The Lomé Conventions and North-South Relations, New York: Columbia University Press.
Roheim, C. (2004), Trade Liberalization in Fish Products: Impacts on Sustainability of International Markets and Fish Resources, Washington DC: World Bank.
Schmidt, C. (2003), Globalisation, Industry Structure, Market Power and Impact on Trade Opportunities and Challenges for Developed (OECD) Countries. Paper prepared for the FAO Industry and Expert Consultation on International Trade, Rio de Janeiro, Brazil, 3-5 December 2003.
Stevens, C., and Weston A., (1984), Trade Diversification: Has Lomé Helped? In: C. Stevens ed. EEC and the Third World: A Survey 4 – Renegotiating Lomé. London: Hodder and Stoughton
Tarte, S. (2002), The European Union and the Western and Central Pacific Tuna Fishery. Paper prepared for the Thirteenth Europe Pacific Solidarity Seminar, 11-13 October 2002, Strasbourg, France
TN/MA/W/103, WTO Negotiating Group on Market Access Draft Modalities for Non-Agricultural Market Access, 8 February 2008
UNCTAD (2010), Generalized System of Preferences: Handbook on the Scheme of the United States of America, New York and Geneva: UNCTAD.
UNEP (2002a), Integrated Assessment of Trade Liberalization and Trade-related Polices: A country study on the Argentina fisheries sector, New York and Geneva: United Nations Environment Program
UNEP (2002b), Integrated Assessment of Trade Liberalization and Trade-related Polices: A country study on the fisheries sector in Senegal, New York and Geneva: United Nations Environment Program
UNEP (2006), Évaluation de l’impact de la liberalization du commerce: Une edude de cas sur le secteur des pêches de le République Islamique de Mauritanie, New York and Geneva: United Nations Environment Program
USITC (2014), The Harmonized Tariff Schedule of the United States, Annotated for Statistical Reporting Purposes, USITC Publication 4446, Washington, DC: United States International Trade Commission
USTR (2009), U.S. Generalized System of Preferences (GSP) Guidebook, Washington DC: Office of the United States Trade Representative.
USTR (2012), GSP-eligible products for Least Developed Beneficiary Countries. Washington DC: Office of the United States Trade Representative.
USTR (2013), Seventh Report to the Congress on the Operation of the Andean Trade Preference Act as Amended June 20, 2013, Washington DC: Office of the United States Trade Representative.
USTR (2014), Trade Policy Agenda and 2013 Annual Report, Washington DC: Office of the United States Trade Representative.
Wade, R. (1990), Governing the Market: Economic Theory and the Role of Government in East Asian Industrialization, Princeton, New Jersey: Princeton University Press
Walmsley, S.F., Barnes, C.T., Payne, I.A., Howard, C.A. (2007), Comparative Study of the Impact of Fisheries Partnership Agreements – Technical Report, London: MRAG, CRE & NRI.
Winters, L. A. and P. M. G. Martins (2004). When Comparative Advantage is not Enough: Business Costs in Small Remote Economies. World Trade Review, 3(3): 347-383.

25
WTO (1997). Environmental Benefits of Removing Trade Restrictions and Distortions (Note by the Secretariat). WT/CTE/W/67. Geneva: World Trade Organisation
WTO-ITC-UNCTAD 2014, World Tariff Profiles 2014, Geneva: World Trade Organization, International Trade Centre and UNCTAD
Yu, W., and Jensen, T.V., (2005), Tariff Preferences, WTO Negotiations and the LDCs: The Case of the ‘Everything But Arms’ Initiative.’ The World Economy, 28 (3), 375-405

Implemented jointly by ICTSD and the World Economic Forum, the E15Initiative convenes world-class experts and institutions to generate strategic analysis and recommendations for government, business and civil society geared towards strengthening the global trade system.


