Embed Size (px)
Citation preview

ECONOMICS
Real Labour Cost Escalation Forecasts to 2017 – Australia and Victoria
Prepared by BIS Shrapnel for APA Group
OCTOBER • 2012
© BIS Shrapnel Pty Limited October 2012
Note: Although great care has been taken to ensure accuracy and completeness in this project, no legal responsibility can be accepted by BIS Shrapnel Pty Limited for the information and opinions expressed in this report.
All rights reserved.
Job no: E5805
BIS Shrapnel contact: Richard Robinson Associate Director – Economics Kishti Sen Economist BIS Shrapnel Pty Limited Level 8, 99 Walker Street North Sydney, NSW 2060 Australia Tel. +61 (02) 8458 4200 Fax +61 (02) 9959 5795 [email protected] [email protected]
BIS Shrapnel welcomes any feedback concerning the forecasts or methodology used in this report as well as any suggestions
for future improvement.

APA Group Real Labour Cost Escalation Forecasts to 2017, October 2012
© BIS Shrapnel Pty Limited 2012
Contents
SUMMARY ........................................................................................................................ I
1. INTRODUCTION, OUTLINE OF REPORT & DATA SOURCES ..................................... 1
2. MACROECONOMIC OVERVIEW — AUSTRALIA AND VICTORIA ............................... 3
2.1 The Australian economy ........................................................................................................ 3
2.1.1 Outlook for the Australian economy ............................................................................ 3
2.2 The Victorian Economy ........................................................................................................ 10
2.2.1 Outlook for the Victorian Economy ............................................................................ 11
3. OUTLOOK FOR AUSTRALIAN INFLATION AND ALL INDUSTRIES WAGES ........... 13
3.1 Outlook for Australian All Industries Wages ........................................................................ 16
3.2 Outlook for Consumer Price Inflation ................................................................................... 17
3.2.1 Reserve Bank of Australia CPI forecasts .................................................................. 20
4. GAS PIPELINE-RELATED LABOUR COST ESCALATION ......................................... 21
4.1 Key points ............................................................................................................................ 21
4.2 Use of labour force categories and choice of index measure .............................................. 23
4.2.1 Choice of index measure - LPI is an underlying wage inflation measure, while AWOTE measures changes in actual labour costs ................................................... 25
4.3 Key Drivers of Sustained Strong Growth in Underlying Wages Growth (Labour Price Index) in the National Utilities Sector .............................................................................................. 27
4.4 Overall Growth in Labour Costs (AWOTE Growth) ............................................................. 35
4.5 Outlook for utilities wages growth in Victoria ....................................................................... 36
4.6 Competitor Industry Wages Growth ..................................................................................... 38
4.6.1 Construction Wages .................................................................................................. 38
4.6.2 Mining Wages ............................................................................................................ 38
4.6.3 Manufacturing Wages ................................................................................................ 39
5. CONTRACTOR ESCALATION ...................................................................................... 41
5.1 Construction Sector Wages Growth in Victoria .................................................................... 41
APPENDIX A: A NOTE ON DIFFERENT WAGE MEASURES AND BIS SHRAPNEL’S WAGE MODEL ............................................................................................................. A–1
Description of BIS Shrapnel’s wage model .................................................................................. A–2
Some Deficiencies in Econometric Models of Wage Determination for the EGW Sector .......... A–3
APPENDIX B: TERMS OF REFERENCE .................................................................... A–5
APPENDIX C: STATEMENT OF COMPLIANCE WITH EXPERT WITNESS GUIDELINES .............................................................................................................. A–11

Real Labour Cost Escalation Forecasts to 2017, October 2012 APA Group
© BIS Shrapnel Pty Limited 2012
APPENDIX D: CURRICULUM VITAES OF KEY PERSONNEL ................................ A–13
APPENDIX E: LIST OF ABS & OTHER DATA SOURCES ....................................... A–15
Real Labour Cost Escalation Forecasts to 2017, October 2012 APA Group
© BIS Shrapnel Pty Limited 2012
Tables
Table 1: Summary – Forecasts of Labour Cost Escalation ................................................................. iii
Table 2.1: Australia – Key Economic Indicators, Financial Years .......................................................... 9
Table 2.2: Victoria – Key Economic Indicators, Financial Years .......................................................... 12
Table 3.1: Wages Growth, All Industries, Australia, (by Workforce Segmented by Pay Setting Method) ............................................................................................................ 13
Table 3.2: Methods of Setting Pay, Industry, May 2010 Proportion of Full-Time Employees (%) ........ 14
Table 3.3: Wages and Prices – Australia Year Average Growth .......................................................... 19
Table 4.1: Labour Price Index Growth by Industry Sector and by State ............................................... 22
Table 4.2: Australia AWOTE Growth by Industry Sector ...................................................................... 22
Table 4.3: EGW V. EGWWS ................................................................................................................. 23
Table 4.4: Federal Wage Agreements – Collective Agreements by Industry (Average Annualised Wage Increase) .................................................................................................................... 24
Table 4.5: Electricity, Gas, Water and Waste Services Wage Forecasts – Australia ........................... 26
Table 4.6: Average Weekly Ordinary Time Earnings and Labour Price Index Total Australia and Electricity, Gas, Water and Waste Services Sector (Year Average Growth) ....................... 30
Table 4.7: AWOTE Persons by State - Electricity, Gas and Water Supply (Year Average Growth) .... 32
Table 4.8: Electricity, Gas and Water – Victoria and Australia Nominal Wages Growth ...................... 37
Table 4.9: Wages Growth in Competitor Industries – Australia All Industries, EGWWS, Mining, Manufacturing and Construction (Year Average Growth) .................................................... 40
Table 5.1: Construction Wages Growth – Victoria and Australia Nominal Wages ............................... 43

APA Group Real Labour Cost Escalation Forecasts to 2017, October 2012
© BIS Shrapnel Pty Limited 2012
Charts
Chart 2.1: 2012 Stylistic Cycle ................................................................................................................ 4
Chart 2.2: 2017 Stylistic Cycle ................................................................................................................ 4
Chart 3.1: Australia – Wages and Prices .............................................................................................. 15
Chart 3.2: Employment and Unemployment ......................................................................................... 15
Chart 4.1: AWOTE & LPI Total Australia (All Industries) and Electricity, Gas, Water and Waste Services .................................................................................................................... 24
Chart 4.2: Australia – Utilities Employment, Output and Investment .................................................... 29
Chart 4.3: Total Engineering Construction Australia and Victoria ........................................................ 33
Chart 4.4: Utilities Engineering Construction Australia and Victoria .................................................... 33
Chart 4.5: Mining and Heavy Industry Engineering Construction Australia and Victoria ..................... 38
Chart 5.1: Total Construction – Victoria Value of Work Done, Constant 2009/10 Prices ..................... 42

APA Group Real Labour Cost Escalation Forecasts to 2017, October 2012
© BIS Shrapnel Pty Limited 2012 i
SUMMARY
BIS Shrapnel was engaged by APA Group to provide an expert opinion regarding the outlook for labour cost escalation relevant to gas pipelines in Victoria over the six year period from 2012 to 2017. Table 1 presents a summary of the annual escalation (in year average terms) for the relevant escalators in both nominal and real terms. The latter is adjusted for the RBA’s/ Commonwealth Treasury forecasts of CPI inflation which is projected to average 2.5 per cent over APA Group’s next regulatory period (ie from 2013 to 2017 inclusive).
The Australian Energy Regulator (AER) in its recent revenue determinations stated that labour cost forecasts for state Electricity, Gas, Water and Waste Services (EGWWS) industry most reasonably reflects a realistic expectation of labour costs for all internal labour of utility providers. In other words, the AER accepts that the ABS labour price statistics for the Utilities sector reflects both specialised (ie pipeline or network related labour) and general or administrative labour.
While we agree with the AER that wages growth in the state ‘utilities’ sector is the ‘best’ escalator for utility providers’ internal labour, we believe waste services should be excluded from the overall utilities wage growth. The inclusion of the waste services sub-sector (from November 2009) has led to lower wage growth outcomes for the combined EGW and Waste Services sector. Hence, it is not an accurate indicator for the mostly higher skilled (and more highly demanded) occupations in the EGW sector.
Notwithstanding our position, we have reluctantly accepted the AER’s choice of wages growth in the Victorian EGWWS industry as the escalator most relevant for APA Group’s internal labour.
With respect to the choice of escalator (or index measure), BIS Shrapnel considers the labour price index (LPI) to be a measure of underlying wage inflation in the economy or in a specific industry, as the LPI only measures changes in the price of labour, or wage rates, for specific occupations or job classifications, which are then aggregated into a measure of the collective variations in wage rates made to the current occupants of the same set of specific jobs.
The LPI, therefore, reflects pure price changes, but does not measure variations in the quality or quantity of work performed ie it holds labour composition effects as fixed. The LPI also does not reliably measure the changes in total labour costs which a particular enterprise or organisation incurs, because the LPI does not reflect the changes in the skill levels of employees within an enterprise or industry. As skills are acquired, employees will be promoted to a higher grade or job classification, and with this promotion will move onto a higher base pay. So the change in the cost of labour over, say a year, includes increases in the base pay rates (which the LPI measures) and the higher average base pay level. The AWOTE captures both these elements, while the LPI only captures the first element. Basically, promoting employees to a higher occupation does not necessarily show up in the LPI, but the employer’s total wages bill (and average unit labour costs) is higher, as is AWOTE.
AWOTE is a better measure of the change in overall costs per employee, because it takes into account movements of employees to higher grades, changes in compositional effects from entry/exits of higher skilled/lower skilled (ie higher paid/lower paid) workers in an enterprise or industry, and also the payments above base rates of pay, such as bonuses, incentives, penalty rates and other allowances that are a normal part of an employees

Real Labour Cost Escalation Forecasts to 2017, October 2012 APA Group
ii © BIS Shrapnel Pty Limited 2012
earnings over the quarter or year. With regard to the latter, many enterprises in the utilities (and other industry) sectors(s) regularly include bonuses or incentive payments which are linked to a range of objectives, such as up skilling, additional training, productivity targets, safety targets, etc. These ‘extra’ payments — or changes in the quantum of payments — are not included in changes in the LPI, but can make a material difference to an enterprise’s overall labour costs.
Despite the limitations of the LPI, the Australian Energy Regulator in its recent revenue determinations for electricity and gas utilities has preferred the LPI, largely because of the volatility of AWOTE caused by ‘significant’ compositional problems with AWOTE. Although BIS Shrapnel believes AWOTE is a better measure of the change in overall costs per employee, in this report we provide (for comparison purposes) forecasts of both the LPI and AWOTE.
The report provides both AWOTE and LPI escalators for gas pipeline related labour (EGWWS) – who include a range of skilled labour involved in construction, maintenance, design and operation of electricity assets. As around 70 per cent of employees in the EGWWS sector receive their pay increases via collective agreements, which run for around three years, the industrial relations strength of unions in the sector and recent inflation outcomes and inflationary expectations are key influences for wages. EGWWS wages are forecast to strengthen over the three years to 2014/15 as the demand for labour in the EGWWS sector, construction, mining and manufacturing sectors (the latter three sectors compete with EGW for similarly skilled labour) all pick-up as the economy and investment recover solidly.
Overall, BIS Shrapnel expects total wage costs for the Australian Electricity, Gas, Water and Waste Services (EGWWS or ‘Utilities) sector — expressed in Average Weekly Ordinary Time Earnings (AWOTE) — will average 5.4 per cent per annum over the five years from 2013 to 2017 inclusive, 0.5 per cent higher than the national ‘All Industries’ AWOTE average of 4.9 per cent per annum over the same five year period. In terms of underlying wages growth in the ‘utilities’ sector for total Australia — expressed in labour price index (LPI) terms — BIS Shrapnel is forecasting an average of 4.7 per cent per annum (0.7 percentage points higher than the national ‘All Industries’ LPI average of 4 per cent per annum) over the five years from 2013 to 2017 inclusive. The faster wages growth expected in the electricity, gas, water and waste services sector over the next five years is in line with historical movements in the LPI over the past five years.
Utilities wages growth in Victoria is forecast to average 4.8 per cent per annum (in AWOTE terms) over the five years from 2013 to 2017, 0.6 percentage points lower than the national utilities AWOTE average of 5.4 per cent per annum, while Victorian utilities LPI growth is forecast to average 4.3 per cent per annum (0.4 per cent lower than the national utilities average of 4.7 per cent per annum) over the five years from 2013 to 2017 inclusive. The weaker utilities wages growth in Victoria is due to Victoria’s lower exposure to the resources investment boom (compared to Queensland and Western Australia in particular), the comparative weakness of the state’s construction sector (compared to total Australia) and the comparative weaker growth in Victorian utilities-related engineering construction. This means a lower relative demand for similarly-skilled labour from the state’s construction and mining sectors and within the states utilities sector, compared to other states and therefore slower wages growth compared to the national utilities average.
As most contractor labour is assumed to undertake construction or maintenance related projects, they would be classified to the construction sector. Accordingly, the escalator used for contractor labour is Construction sector wages growth. Our research has shown that construction activity (ie work done in the sector) normally has a strong influence on

APA Group Real Labour Cost Escalation Forecasts to 2017, October 2012
© BIS Shrapnel Pty Limited 2012 iii
construction wages. BIS Shrapnel’s forecasts of construction activity by state (which includes residential and non-residential building, plus engineering construction) were used to derive the wages forecasts.
Construction activity was extremely strong for most of the previous decade. The strength of the construction sector fuelled strong growth in Victorian construction wages in the second half of the last decade. However, in 2010, construction sector wages eased in line with a relatively weaker (and peak) in construction activity over 2010/11.
Looking ahead, we believe engineering construction will decline over 2012/13, as work is progressively completed on the desalination plant, major sewerage infrastructure and the current round of pipelines, oil and gas investments. Non-residential building will continue to decline, with the end of stimulus spending causing steep declines in schools construction and, later, health and other social and institutional buildings and more than offsetting a recovery in commercial and industrial building. Dwelling building is also forecast to decline over 2012/13 to 2014/15 with the deficiency of stock predominately eliminated by June 2013. A recovery in overall construction is projected from 2016/17.
Construction wages growth therefore is expected to be weaker over the next five years. We expect construction wages (in AWOTE terms) to average 5 per cent per annum over the 2011/12 to 2019/20 period compared to the 8.0 per cent per annum average achieved in the second half of the previous decade.
Table 1: Summary – Forecasts of Labour Cost Escalation (per cent change, year average, year ended December)
2010 2011 2012 2013 2014 2015 2016 2017 2012-2017 (d)Actuals
NOMINAL PRICE CHANGES1. Internal (Gas Pipeline related) LabourEGWWS AWOTE - Victoria (a) 16.7 7.6 6.6 3.3 5.2 5.5 5.2 5.0 4.8EGWWS LPI - Victoria (a) 3.6 4.0 3.9 3.9 4.4 4.7 4.3 4.3 4.3EGWWS AWOTE - Australia (b) 9.4 5.9 2.6 5.2 5.5 5.7 5.5 5.4 5.4EGWWS LPI - Australia (b) 4.7 3.6 3.7 4.3 4.8 5.0 4.7 4.5 4.7
2. Contractor EscalationConstruction AWOTE - Victoria 5.4 -0.6 3.5 4.1 5.2 5.6 5.2 5.0 5.0Construction LPI - Victoria 4.7 4.4 3.4 3.7 4.4 4.7 4.4 4.2 4.3Construction AWOTE - Australia (b) 6.5 5.0 2.0 5.5 5.5 5.9 5.4 5.4 5.6Construction LPI - Australia (b) 3.4 4.0 4.0 4.1 4.9 5.1 4.6 4.5 4.6
Consumer Price Index (headline) (c) 2.8 3.4 1.7 2.7 2.5 2.5 2.5 2.5 2.5
REAL PRICE CHANGES1. Internal (Gas Pipeline related) LabourEGWWS AWOTE - Victoria (a) 13.9 4.2 4.9 0.6 2.7 3.0 2.7 2.5 2.3EGWWS LPI - Victoria (a) 0.8 0.6 2.2 1.2 1.9 2.2 1.8 1.8 1.8EGWWS AWOTE - Australia (b) 6.5 2.5 0.9 2.5 3.0 3.2 3.0 2.9 2.9EGWWS LPI - Australia (b) 1.8 0.2 2.0 1.6 2.3 2.5 2.2 2.0 2.1
2. Contractor EscalationConstruction AWOTE - Victoria 2.6 -4.0 1.8 1.4 2.7 3.1 2.7 2.5 2.5Construction LPI - Victoria 1.9 1.0 1.7 1.0 1.9 2.2 1.9 1.7 1.7Construction AWOTE - Australia (b) 3.7 1.6 0.3 2.8 3.0 3.4 2.9 2.9 3.0Construction LPI - Australia (b) 0.5 0.6 2.3 1.4 2.4 2.6 2.1 2.0 2.1
(a) Electricity, Gas, Water and Waste Services (EGWWS) Average Weekly Ordinary Time Earnings (AWOTE) and Labour Price Index (LPI) for total hourly rates of pay excluding bonuses for Victoria. The LPI series modelled is identical to the Wage Price Index analysed and forecast in DAE report prepared for the AER dated May 2012.(b) Australian sector wage forecasts provided for comparison(c) Headline CPI forecasts based on Reserve Bank of Australia forecasts to 2014 and then Commonwealth Treasury medium term projections(d) For next regulatory period (ie Average Annual Growth Rate for 2013 to 2017 inclusive)
Forecasts


APA Group Real Labour Cost Escalation Forecasts to 2017, October 2012
© BIS Shrapnel Pty Limited 2012 1
1. INTRODUCTION, OUTLINE OF REPORT & DATA SOURCES
In August 2011, BIS Shrapnel was engaged by APA Group to provide an expert opinion regarding the outlook for labour cost escalators and labour market issues relevant to gas pipelines in Victoria over a 6 year period from 2012 to 2017 inclusive. The labour cost escalators, market outlook, and reports were used by APA Group to estimate their operating and capital expenditure forecasts. These, in turn, were included in APA Group’s revenue proposal to the Australian Energy Regulator (AER) on 31st March 2012.
In October 2012, I Richard Robinson, Associate Director (Economics) at BIS Shrapnel was again engaged by APA Group to update the initial report prepared in March 2012. In keeping with my instructions, I confirm that I have undertaken this engagement having regard to the Guidelines for Expert Witnesses in Proceedings in the Federal Court of Australia and the requisite statement to this effect is included in Appendix C. I have been assisted in the preparation of this report by Kishti Sen, an Economist at BIS Shrapnel and Catherine Birch Research Assistant at BIS Shrapnel. Curriculum vitas of all relevant personnel are attached in Appendix D. Notwithstanding the assistance from the other two economists, the opinions in this report are my own and I take full responsibility for them. A brief description of the material upon which I have relied for the preparation of this report follows. A full list of the ABS data and other information sources used in the preparation of this document and the forecasts contained within can be found in Appendix E.
The Australian Bureau of Statistics (ABS) is the primary data source for the consumer price index, wages, employment, real gross value added and investment (including engineering construction) data, and for a range of other economic variables shown in table 2.1. The most recent wages data is June quarter 2012 and the latest industry employment data is August 2012. The June quarter, 2012 was the latest available data for real gross value added (at the Australian level only), investment and indeed most of the economic variables in table 2.1. The detailed engineering construction data (by state and by category) also have data up to June quarter 2012. The latest data for Gross State Product (GSP) and real gross value added for state industry sectors was 2010/11 (annual data only is available). Other inflation and interest rates data were sourced from the Reserve Bank of Australia. Other data and information concerning enterprise agreements and skills shortages was obtained from the Department of Education, Employment and Workplace Relations (DEEWR).
Forecasts of the economic variables in this report were mostly sourced from BIS Shrapnel reports, including Economic Outlook, Long Term Forecasts: 2012 – 2027, Engineering Construction: 2011/12 to 2025/26 and Long Term Building Work Done Forecasts, plus other unpublished forecasts and from BIS Shrapnel internal research.
The structure of this report is as follows:
The Summary section presents an overview of the outlook for the labour cost escalators and a summary table.
Section 2 provides an overview of the macroeconomic outlook for Australia, including a brief commentary of the logic and key drivers, plus forecasts of key economic variables.
Section 3 discusses BIS Shrapnel’s model of wage determination and provides forecasts of the outlook for national (‘all industries’) wages and CPI inflation, with the Reserve Bank of Australia and Treasury medium-term projections of CPI inflation. The latter is used to deflate the nominal escalators provided in this report.

Real Labour Cost Escalation Forecasts to 2017, October 2012 APA Group
2 © BIS Shrapnel Pty Limited 2012
Section 4 provides an outlook for ‘gas pipeline related labour’ cost escalation, based on forecasts of wages growth for the Electricity, Gas, Water and Waste Services sector for Australia and Victoria. This section also analyses and provides forecasts of wages in industries which compete with the utilities sector for similar types of skilled labour, namely Mining, Construction and Manufacturing.
Section 5 provides forecasts of ‘contractor’ escalation, which is predominately related to labour costs in APA Group’s external construction contracts.
Appendices, which includes a note on different wage measures and a description of BIS Shrapnel’s wage model.

APA Group Real Labour Cost Escalation Forecasts to 2017, October 2012
© BIS Shrapnel Pty Limited 2012 3
2. MACROECONOMIC OVERVIEW — AUSTRALIA AND VICTORIA
2.1 The Australian economy
There was always going to be some slowing in the June quarter following the very strong March quarter. The fact that the June quarter still produced growth of 0.6 per cent1 highlights what a great first half of 2012 the Australian economy had, underpinned by strong mining-related investment and solid growth in household expenditure.
The quarterly growth was reasonably evenly distributed, with dwelling building (-1.7 per cent) 2 the only major expenditure component to detract from domestic demand growth. Household consumption expenditure increased by 0.6 per cent, supported by interest rate reductions and government transfers in the June quarter. Consistent with the retail trade survey, consumption of goods increased 1.4 per cent and household motor vehicle purchases increased by a massive 9.9 per cent. Offsetting this, the services-intensive ‘Other’ category contracted by 0.6 per cent, reflecting an unusual decline in health-related services, following a large increase in the March quarter. Total household consumption expenditure is still up by 4.0 per cent through-the-year.3
Business investment also eked out a small (0.9 per cent, excluding net asset purchases) gain in the quarter, following the extremely large increase in mining-related engineering construction in the March quarter. The June quarter result reflected low, but positive, growth in all of the major business investment components. Public investment increased by an impressive 2.8 per cent as the government brought forward as much investment spending into the 2011/12 fiscal year as it could. Net exports added 0.3 per cent to June quarter GDP growth, with exports increasing by 2.5 per cent and imports increasing by 0.9 per cent. 4
Overall, the Australian economy grew by 3.4 per cent in 2011/12.5
2.1.1 Outlook for the Australian economy
While Australia did not have a financial crisis and avoided a recession, the GFC definitely had an impact on the Australian economy. In the three years immediately following the GFC, GDP growth averaged around 2 per cent, down from just above 3.5 per cent over the preceding seven years. The slower average growth rates reflected declining business and dwelling investment and markedly slower growth in household spending. Providing a significant offset, growth in public sector investment grew very strongly as the Commonwealth Government injected considerable stimulus.
As mentioned, GDP growth for 2011/12 increased to 3.4 per cent, reflecting increased growth in household spending and increased mining-related investment. However, dwelling investment and non-mining business investment has been flat to falling, and public sector investment has fallen sharply as the post-GFC stimulus wound down. Increased demand will gradually induce the next round of dwelling and non-mining business investment, with these industries expected to start advancing in six to twelve months time. Exports will also add to growth over the next few years, driven mainly by increased mining-related exports as the current round of investment projects enter the production phase.
Increased economic activity over 2013 to 2015 will progressively add to inflation pressures, prompting the Reserve Bank to start raising interest rates from late 2013, with interest rates peaking during 2015. This will cause growth in household consumption to slow during 2016, and cause dwelling and business investment to decline. 1 ABS National Accounts 5206.0, June Quarter 2012. 2 ABS National Accounts 5206.0, June Quarter 2012. 3 ABS National Accounts 5206.0, June Quarter 2012. 4 ABS National Accounts 5206.0, June Quarter 2012. 5 ABS National Accounts 5206.0, June Quarter 2012.

Real Labour Cost Escalation Forecasts to 2017, October 2012 APA Group
4 © BIS Shrapnel Pty Limited 2012
Chart 2.1: 2012 Stylistic Cycle
Chart 2.2: 2017 Stylistic Cycle
Government Spending
Household Consumption
Exports Mining Investment
Non‐mining Business
Investment
Residential Investment
Imports
GDP
Government Spending
Mining Investment
Household Consumption
Exports
Residential Investment
Non‐mining Business
Investment
Imports
GDP

APA Group Real Labour Cost Escalation Forecasts to 2017, October 2012
© BIS Shrapnel Pty Limited 2012 5
By 2017, mining-related investment will be starting to ease back slightly from extremely high levels, household spending will once again be ticking along at a good clip, export growth will be solid, underpinned by increased mining output and a recovery in non-mining exports. Dwelling, non-mining business investment and Government expenditure will all be recovering after an extended period of underinvestment.
Despite all of the components of expenditure GDP going through cycles over the next five years, aggregate GDP growth is expected to be remarkably stable, not deviating far from its forecast annual average of 3.3 per cent.6 This reflects that the cycles in the various expenditure components are not expected to be synchronised, but will largely offset each other. Furthermore, imports cycling in line with domestic demand will play an important role in dampening the cycles in GDP.
Household consumption expenditure to grow in line with incomes, supported by population growth
Household consumption expenditure growth slowed sharply in the immediate aftermath of the GFC. This reflected a combination of lagged effects of high interest rates leading into the GFC, slower income growth, increased concern about high household debt and reduced perceived job security. The decline in household consumption expenditure growth was more marked than the decline in real household disposable income, resulting in a sharp increase in the household saving rate to its highest level since the 1980s. This reversed a long-running downward trend, which reflected households borrowing against the value of their home to boost current expenditure.
Over the past couple of years, households appear to have once again become comfortable with their financial position, such that growth in household consumption expenditure has increased to now be in line with growth in real household disposable income. As a result, the household saving rate has largely tracked sideways at a historically high level. However, a growing proportion of this expenditure on goods is flowing overseas due to the high Australian dollar, so domestic retailers’ turnover remains relatively weak. This has meant that activity in Australia has not really benefited much from the increase in household consumption expenditure.
Further growth in household consumption expenditure is expected over the next two years, as increases in disposable incomes are matched by improving consumer confidence. We believe households have built up a considerable savings buffer after several years of high savings ratios, and believe this has created a degree of pent up demand. Improved financial security will see expenditure continue to pick up, and will likely see the saving rate begin a slow retreat from its current high levels. The ongoing growth in household consumption expenditure is expected to translate into increased retail turnover and activity in Australia over the next few years. However, the current high level of the Australian dollar means that there will continue to be further leakage of household spending overseas, such that we expect growth in retail turnover to remain below growth in total household spending for the next few years.
The increased expenditure (and strength in the broader economy) will see the Reserve Bank begin to increase interest rates through 2014/15. This will dampen consumer spending once more, with growth reaching a trough of 2.3 per cent in 2016/17. However, the effect on employment is expected to be mild, and a strong recovery in spending will take place the following year. Overall, household consumption expenditure is forecast to average growth of 3.3 per cent per annum over the five years to 2016/17.
6 BIS Shrapnel, Long Term Forecasts Report, 2012 to 2027.

Real Labour Cost Escalation Forecasts to 2017, October 2012 APA Group
6 © BIS Shrapnel Pty Limited 2012
Over the longer term, population growth is expected to be the primary driver of household expenditure. As such, slowing population growth is expected to see household consumption expenditure growth moderate slightly over the following decade, averaging 3.1 per cent per annum between 2017 and 2022 and slowing further to 2.9 per cent between 2022 and 2027. Although the economy is expected to remain healthy through this period, we do not expect a return to the debt-driven increases in consumption that occurred through the late 1990’s and early 2000’s.
Existing dwelling shortage and ongoing population growth will support residential investment … once the recovery gets underway
While household consumption expenditure growth has recovered post GFC, households have not been willing to undertake the large outlays required to purchase new houses. As a result, dwelling investment has largely tracked sideways for the past decade. A decade of flat dwelling investment at the same time that population growth has been strong has resulted in the emergence of a significant dwelling shortage. This is especially the case in New South Wales, and increasingly so in Western Australia. The shortage is so severe that we expect it to underpin dwelling investment throughout the next decade or so.
In the near term, dismal confidence, excessive caution by households, and difficult funding conditions for developers is leading to declines in dwelling investment from already low levels. However, we expect these negative factors to dissipate gradually, supported by interest rate reductions over the past year. Therefore, we expect dwelling investment to start recovering from the end of this year. We expect that recovery to continue until late 2015, when higher interest rates stifle activity. However, the dwelling shortage is so severe that we expect dwelling building to bounce back quickly, posting solid average growth throughout the rest of the forecast.
The performance of dwelling investment will be important for the performance of the overall economy, with increased dwelling building activity supporting many other industries. The risk is that the recovery is slower coming than we are forecasting. If this does occur, the recovery, when it does come, will likely be larger and longer.
Business investment will be strong over the next five years and be a key driver of growth
Total business has been strong over the past few years, driven by rapid growth in mining-related investment.7 At the same time, however, non-mining business investment has fallen.
With commodity prices still exceptionally high and set to recover over the next two-to-three years, we expect mining-related activity to remain strong throughout the forecast period. This is all but assured over the near term, with the current round of projects locked in for the next few years.
Following a brief rally early in 2012, commodity prices resumed their downward trajectories as markets reacted to weaker demand and continued news of slower global economic growth over the past year. However, we believe that overall world GDP growth and commodity prices have reached their weakest point in this current post-GFC cycle. Global economic growth and commodity prices are expected to pick up from the December quarter 2012 and then gradually rise over the next two-to-three years – of course there are marked differences between the different commodities with regard to the magnitude and timing of price rises. Despite our forecast of a price recovery, many of the commodities are not expected to reach the high points they reached in early-to-mid 2011 (let alone the record peaks of 2007/08).
7 ABS, Private New Capital Expenditure and Expected Expenditure, June Quarter, 2012

APA Group Real Labour Cost Escalation Forecasts to 2017, October 2012
© BIS Shrapnel Pty Limited 2012 7
Even with the recent falls, commodity prices are still exceptionally high, and would have to fall at least as much again to seriously threaten a fall in minerals-related investment within the next two years. With many of the projects locked in or already underway, resource-related investment is expected to continue growing over the next two years.8 Furthermore, we believe that our forecast for commodity prices is sufficiently high to prevent a sudden and sharp drop in resource-related investment in the second half of this decade.
In terms of non-mining business investment, there are three key factors currently holding it back: lack of confidence, lack of demand, and tight funding conditions. Only when one or more of these factors starts to improve will we see a sustained recovery in non-mining business investment. Our forecast is that this will start to occur late this year, supporting a recovery in investment from next year onwards.
The underinvestment in non-mining industries has persisted for so long that capacity pressures will be reached soon after demand picks up. We are already seeing this in some markets. For example, leasing rates in some commercial areas are starting to pick up. These emerging capacity constraints will drive the recovery in non-mining business investment.
We expect higher interest rates to lead to a decline in business investment in 2016, but then expect business investment growth to recover quickly thereafter.
The risk is that non-mining business investment remains weak for longer than forecast over the next couple of years. However, as with dwelling investment, the longer the recovery is delayed, the larger the subsequent surge is likely to be.
Strong business investment will be critical for boosting labour productivity and securing medium-term economic growth. Investment in building and engineering construction – to the extent that the later is not imported – will also generate significant activity and jobs throughout the rest of the economy.
Commonwealth and state government focus on tightening budget deficits will constrain government expenditure
The Commonwealth Government plans to return their budget to balance in the current financial year, and then progressively reduce net debt as a share of GDP. Whether or not they achieve surplus this year or later, the fiscal contraction will subtract around 1 per cent from GDP growth – particularly impacting on domestically-focused industries that remain under pressure from low private sector demand.
The main reason for the Commonwealth Government’s existing deficit is that revenue has fallen sharply as a share of GDP over the past few years, while expenditure has continued to increase. Revenue is expected to increase as a share of GDP over the next few years, reflecting economic recovery and the introduction of the Minerals Resource Rent Tax and the Carbon Tax. However, there are structural changes occurring in both company and the Goods and Services Taxes (GST) that mean Commonwealth Government revenue will not regain its pre-GFC share of the economy.
Across the board spending restraint will be required. One avenue that is being pursued is the scaling back of grants and subsidies to the State Governments. This reflects both lower growth in GST revenue (around a quarter of State Government revenue), and lower growth in other Commonwealth Government grants and subsidies (accounting for another quarter). This is occurring at a time that State Governments’ own revenue sources (stamp duties, payroll taxes etc) are already low. The squeeze on State Government revenue is important because State
8 BIS Shrapnel, Engineering Construction in Australia, 2011/12 – 2025/26 report.

Real Labour Cost Escalation Forecasts to 2017, October 2012 APA Group
8 © BIS Shrapnel Pty Limited 2012
and Local Governments account for around 80 per cent of General Government Investment and two-thirds of General Government spending on goods and services.
The ageing of the population will put added pressure on the fiscal position, particularly from around the turn of the next decade. First, growth in the labour force will gradually drop behind population growth, as a larger share of the population moves into retirement. This will slow growth in the economy and tax receipts unless there are offsetting increases in age-specific participation rates, population growth, and/or productivity growth. Second, despite some policy changes to try and limit the growth, expenditure on healthcare services and superannuation will continue to outstrip growth in the population and the wider economy. Health expenditure growth will also be underpinned by the long-standing tendency for the demand for health services to increase with incomes and for costs to increase as new technologies are developed. While all levels of Government will try to limit spending growth by restricting wage growth, public sector wage growth will likely keep pace with private sector wage growth over the medium term.
Because it is extremely difficult and politically unpalatable to rein in ongoing (or recurrent) expenditure, we expect public investment to bear the brunt of the fiscal restraint. This will deny the domestic economy a much-needed source of demand over the next few years, and result in a significant under-investment in infrastructure, thus undermining medium-term economic growth – as occurred during the 1990s.
Public investment will likely pick up in the second half of this decade as mining royalties increase in Western Australia and Queensland. However, the other states will be very dependent on the Commonwealth Government, who in turn might be forced to find new revenue sources or expand the existing ones.
Australia’s close ties to Asia help buffer us against events in Europe
Europe continues to deteriorate. With high unemployment, sustained sovereign debt, competitive disparities, and contracting industry and output – is it possible the Euro Zone is through the worst of it? We expect the third quarter to show further deterioration in the Euro Zone. However, Euro Zone competitiveness, at the aggregate level, has improved since 2008. Meanwhile, the United States is not bad, but not good either. It is performing below potential. With unemployment remaining high and inflation under control, we expect to see additional monetary easing in coming weeks. Asia too is performing below potential, with a general slowing in the region as weak external demand from the United States and Europe takes its toll. In response, we expect China to do whatever it takes to maintain growth in the comfort zone.
For example, with a slew of recent poor data, Chinese government officials have decided to flex a little more muscle. Over the past few weeks, Chinese provinces have announced a total of $1.3 trillion (US dollars) worth of infrastructure spending plans over the next three years to step up growth. In addition, Chinese premier Wen Jiabao has committed to intensify efforts to boost growth during the second half of 2012. China’s efforts to improve or stabilise growth may also extend beyond its borders. Efforts to continue purchases of European government debt being or encouraging more Chinese investment abroad are likely to gain traction.
We expect the third quarter of 2012 to be the trough for Asia, and China in particular, with further government stimulus and infrastructure spending to pick up domestic growth beginning in the fourth quarter onward. The increased activity in China will have flow on effects to the rest of Asia, picking up growth across the region in general. Overall, we expect China to finish 2012 with 7.8 per cent GDP growth.
The upshot is that, over the next six years, the volumes of exports of goods and services are forecast to increase at an average rate of 6.8 per cent per annum and will be driven by increased capacity from investment coming on-stream, ongoing recovery in the global economy, and robust demand from China and India. Meanwhile, rural exports are likely operating at close to their peak,

APA Group Real Labour Cost Escalation Forecasts to 2017, October 2012
© BIS Shrapnel Pty Limited 2012 9
and will therefore cycle around current levels over the next five years. As world demand picks up over the forecast period, growth of non-commodity manufacturing and services exports (mainly tourism and education) will show moderate growth.
Strengthening consumer and business demand in Australia will see merchandise imports continue to grow, particularly as the Australian dollar remains strong. Overall, import growth is expected to average 6.4 per cent per annum over the next six years.
Table 2.1: Australia – Key Economic Indicators, Financial Years
Main Risks to Growth Outlook
The current debate surrounds commodity prices. In particular, where they will go from here and what impact they will have on the Australian economy. Our forecast is that most commodity prices are probably around their trough, and are likely to bounce back later this year as short-term supply and demand imbalances work themselves out. This risk is that industrial production in China and other key markets does not recover to the extent that we are forecasting, resulting in lower commodity prices than we are forecasting. However, we do not see a lot of scope for commodity prices to hold down at current or even lower levels for any meaningful period of time.
Irrespective of what happens to prices over the next few months, we do not see it having a large impact on our forecast for growth in mining-related investment over the next two years – this work is largely locked in. Rather, it would be our forecast for the second half of this decade that would be most at risk.
2013 2014 2015 2016 2017 2018
Selected Expenditure Categories
Private Investment
– Dwellings -1.5 1.2 3.0 -3.3 0.5 8.4 5.5 -5.1 0.9 8.6
– New Non-Dwelling Construction (+) 12.5 -9.5 7.9 39.0 8.2 4.7 1.9 -3.7 0.5 4.1
– New Non-Dwelling Building (+) -4.4 -14.3 -4.9 13.0 -4.2 8.3 9.8 -1.2 0.6 9.5
– New Engineering Construction (+) 30.3 -5.9 16.5 53.3 13.2 3.5 -0.9 -4.7 0.5 1.9
Total New Private Investment (+) 1.2 -3.0 3.4 14.2 6.5 9.3 5.6 -3.0 2.2 8.0
New Public Investment (+) 2.8 29.0 5.8 -4.9 -6.4 -4.0 5.0 7.7 9.7 4.0
Gross National Expenditure (GNE) 0.3 2.4 3.8 5.5 3.2 4.6 3.9 1.2 3.4 4.9
GDP 1.4 2.3 1.9 3.4 3.1 3.8 3.6 2.9 3.7 4.1
Inflation and Wages
CPI (Yr Avg)- RBA/Treasury forecasts (*) 3.1 2.3 3.1 2.3 2.5 2.5 2.5 2.5 2.5 2.5
Labour Price Index (Yr Avg) 4.1 3.1 3.8 3.6 3.7 4.1 4.3 4.1 3.7 4.1
Average Weekly Earnings (Yr Avg) 5.5 5.6 4.2 4.3 4.0 4.7 5.3 5.1 4.7 5.3
Employment
– Employment Growth (Yr Avg) 1.6 1.4 2.9 0.7 1.0 2.6 2.8 1.1 1.2 2.4
– Unemployment Rate (May) (%) 5.8 5.2 5.0 5.2 5.2 4.7 4.7 5.5 5.3 4.5
Labour Productivity Growth
– Total -0.3 1.0 -1.0 2.7 2.0 1.2 0.8 1.8 2.5 1.7
– Non-farm -0.6 1.0 -1.0 2.7 2.1 1.2 1.0 1.8 2.6 1.7
Exchange Rates
– US$ per A$ (Yr Avg) 0.75 0.88 0.99 1.03 0.99 1.00 1.01 0.95 0.88 0.97
+Expenditure on new assets (or construction work done). Excludes sales (or purchases) of second hand assets.
*Forecasts to December 2014 from RBA, followed by Treasury long-term forecasts
Forecasts
2011 2012Year Ended June
2009 2010

Real Labour Cost Escalation Forecasts to 2017, October 2012 APA Group
10 © BIS Shrapnel Pty Limited 2012
Events in Europe are the other headline grabber at the moment. We expect to continue to hear a lot more bad news out of Europe over the next few years, and that is reflected in our forecasts. There is a non-trivial risk that the European situation deteriorates such that financial markets freeze up like they did in 2008, confidence falls and commodity prices decline. This would have a significant impact. However, as we saw in 2008, the most severe effects tend to be short lived, with the Australian dollar likely to fall in that situation, along with interest rates, and the Reserve Bank has a large toolkit to keep financial markets operating. Furthermore, the Federal Government has a lot of scope to loosen fiscal policy to support growth here in Australia if needed.
Less severe, there is the risk that our forecast recovery in dwelling building does not take hold late this year. If the leading indicators over the next few months do not support this recovery, then we expect the Reserve Bank to be more aggressive in lowering interest rates, which should further underpin the recovery in dwelling building – albeit a few months later than we are forecasting.
2.2 The Victorian Economy
The Victorian economy recovered solidly from the GFC-induced downturn in 2008/09 and generally outperformed most other state economies over 2009/10 and 2010/11.9 However, the state economy lost momentum over 2011/12, and is now slowing sharply as building activity declines, retail spending weakens and as the sustained high Australian dollar impacts on the key Victorian manufacturing, tourism and education sectors.
The key factor underpinning Victoria’s strong performance over the past three years was the overall strength of its construction sector.10 New dwelling building activity picked up quickly between 2008/09 and 2010/11 after interest rates tumbled and the first home owner grants scheme boosted demand. In addition, stronger population growth and the ready availability of reasonably priced residential land facilitated a much faster upswing compared to other states which had a greater undersupply of dwellings, but more expensive (and less available) land.
Public investment ramped up significantly over 2008/09 to 2010/11,11 partly because the Victorian government was able to get the Federal stimulus spending underway quickly and partly because the state government was already proceeding with its own major health, rail, harbour and sewerage projects. However, this is now starting to unwind as major projects are completed or near completion,12 and public investment declined by 9.2 per cent in 2011/12.
Private sector engineering construction also made a healthy contribution, thanks to substantial electricity, pipelines, oil and gas activity, and work on the $1.6 billion Wonthaggi desalination plant. Strong growth in dwellings continued in 2011, although private engineering construction and public investment peaked while plant and equipment investment declined. Partially offsetting these positives was a cumulative 41 per cent decline in private non-residential building over the three years to 2010/11, before increasing 17.7 per cent increase in 2011/12.13
The strength of the construction sector (which spilled over into other sectors) fuelled strong growth in employment, household incomes and spending. Employment growth averaged 2.8 per cent in 2009/10 and accelerated to 3.6 per cent for 2010/11, compared to 1.4 per cent and 2.9 per cent for Australia, but slowed sharply to only 0.3 per cent in 2011/12 (0.7 per cent for Australia). The slowdown in employment was mirrored by weaker retail sales growth of only 1.3 per cent in 2011/12.
9 ABS National Accounts 5206.0, June Quarter 2012. 10 ABS National Accounts 5206.0, June Quarter 2012. 11 ABS National Accounts 5206.0, June Quarter 2012. 12 BIS Shrapnel, Engineering Construction in Australia 2011/12 – 2025/26 report. 13 ABS National Accounts 5206.0, June Quarter 2012.

APA Group Real Labour Cost Escalation Forecasts to 2017, October 2012
© BIS Shrapnel Pty Limited 2012 11
Overall, state final demand (SFD), which is the sum of consumption and investment spending by the household, business and government sectors, slowed to 2.1 per cent in 2011/12, following 3.2 per cent in 2010/11 and 3.8 per cent in 2009/10. Australian domestic demand over the same periods recorded growth of 5.3 per cent, 3.3 per cent and 2.3 per cent respectively.14 Gross state product (GSP) increased 2.5 per cent in 2010/11 (compared to Australian GDP growth of 1.9 per cent), but Victorian GSP is estimated to be have eased to 2.3 per cent for 2011/12. One bright spot over the past year has been the 7.5 per cent growth in merchandise exports.15
2.2.1 Outlook for the Victorian Economy
Victoria is set to underperform against the national average over the short to medium term. Several factors will contribute to this outcome:
A downturn in construction over the next two to three years will drag down overall state growth. We estimate that engineering construction declined over 2011/12 and will fall further in 2012/13, as work is progressively completed on the desalination plant, major sewerage infrastructure and the current round of pipelines, oil and gas investments.16 Public sector building will continue to decline, with the end of stimulus spending causing steep declines in schools construction and, later, health and other social and institutional buildings, which will more than offset a recovery in commercial and industrial building.
Dwelling building is also forecast to decline over 2012/13 to 2015/16 with the current oversupply of dwellings triggering a sharp downturn in 2012/13.17 Despite healthy growth in the underlying demand for dwellings helping to reverse the oversupply to a deficiency by 2013/14, rising interest rates over 2013/14 and into 2014/15 is expected to prevent a recovery taking hold.
The ‘finance and insurance’ and ‘professional scientific and technical services’ industries are also likely to slow over the next year or so. We think some of this may reflect back-office operations, which had been moved to Victoria because it was the most cost-effective location in Australia, now moving offshore.
The A$ is expected to remain around current levels or higher. This means the competitive pressures on the tradeables sectors will continue, with the state’s manufacturing, education and tourism sectors negatively affected. Already, manufacturing industry output has contracted more than the Australian average.
Growth in employment therefore is expected to be muted over the next two years. Growth in SFD and GSP is also forecast to slow further over 2012/13, mainly due initially to the decline in overall construction, while weak employment and local consumer confidence will keep retail spending relatively weak.
Victoria’s indirect exposure to the major mining and investment boom will partially offset the negative factors listed above. In particular, Victoria is expected to benefit indirectly from strengthening Australian domestic demand and private investment. Interstate domestic demand is a key driver of the state economy because of the importance of the wholesale trade, distribution and transport sectors, in part facilitated by the Port of Melbourne being the largest container port by volume.18 Product from these imported cargoes and from Victoria’s manufacturing and mining sectors (gas mainly) are distributed locally and interstate, with Victoria’s finance, insurance and business services sectors also providing services interstate.
14 ABS National Accounts 5206.0, June Quarter 2012. 15 ABS National Accounts 5206.0, June Quarter 2012. 16
BIS Shrapnel, Engineering Construction in Australia 2011/12 – 2025/26 report. 17 BIS Shrapnel, Building in Australia 2012 – 2027 report. 18 Bureau of Transport and Regional Economics, Australia Sea Freight, 2009-10.

Real Labour Cost Escalation Forecasts to 2017, October 2012 APA Group
12 © BIS Shrapnel Pty Limited 2012
Looking further ahead, we expect the state’s positive structural factors (availability of reasonably priced residential land, competitively priced office market and strong finance and business services sectors) to continue to underpin relatively strong population growth, healthy demand for housing, infrastructure and household services which, in turn, will support further business investment and employment. Indeed by 2014/15 we expect private non-residential building, plant and equipment spending and private and public infrastructure construction activity to be increasing. However, the expected domestic demand downturn in 2015/16 will impact on Victoria and stall the recovery in private investment.
Growth is expected to rebound from the domestic downturn in 2015/16, with the expected fall in interest rates to be the initial catalyst. Overall, however, the Victorian economy is forecast to record only modest growth over the next six years to 2017/18, with SFD averaging 3.1 per cent and GSP averaging 2.7 per cent per annum. This is, however, a marked underperformance when compared with Australian domestic demand at 3.6 per cent and GDP growth at 3.5 per cent.
Table 2.2: Victoria – Key Economic Indicators, Financial Years
Year Ended June 2009 2010 2011 2012 2013 2014 2015 2016 2017 2018
VIC
Total Construction Activity(a,b) 7.3 8.3 6.5 0.9 -10.8 -7.6 1.7 0.4 4.6 13.8
State Final Demand 0.8 3.8 3.2 2.1 1.1 2.6 3.7 1.8 3.8 5.5
Gross State Product (GSP)(b) 0.9 2.3 2.5 2.3 1.3 2.1 2.6 2.8 3.4 4.2
Employment Growth 0.9 2.8 3.6 0.3 -0.2 0.9 2.2 1.3 1.3 3.0
AUST
Total Construction Activity(a) 9.0 3.2 5.8 14.8 4.2 3.4 2.7 -2.7 2.0 4.8
Australian Domestic Demand 0.9 2.3 3.3 5.3 3.4 4.5 4.1 1.3 3.3 4.8
Gross Domestic Product (GDP) 1.4 2.3 1.9 3.4 3.1 3.8 3.6 2.9 3.7 4.1
Employment Growth 1.6 1.4 2.9 0.7 1.0 2.6 2.8 1.1 1.2 2.4
(a) Total Construction work done (constant prices), equals sum of new dwellings, building, alterations and additions activity
over $10 000, non-residential building and engineering construction by private and public sectors.
(b) 2012 figures are estimates.
Annual Per Cent Change

APA Group Real Labour Cost Escalation Forecasts to 2017, October 2012
© BIS Shrapnel Pty Limited 2012 13
3. OUTLOOK FOR AUSTRALIAN INFLATION AND ALL INDUSTRIES WAGES
The key determinants of nominal wages growth are consumer price inflation, productivity and the relative tightness of the labour market (ie the demand for labour compared to the supply of labour). Price inflation, in turn, is primarily determined by unit labour costs. Other factors which influence price inflation include the exchange rate, the stage of the business cycle and the level of competition in markets generally.
BIS Shrapnel’s model of wage determination is based on the analysis of past and future (expected) wage movements in three discrete segments of the workforce, based on the three main methods of setting pay and working conditions (see tables 3.1 and 3.2):
Those dependent on awards rely on pay increases given in the annual National Wage case by Fair Work Australia (formerly by the Fair Pay Commission and Australian Industrial Relations Commission). Most of the wage increases in the National wage case over the past decade have been given as flat, fixed amount (ie dollar value) increases, rather than as a proportional increase although the last two increases were given as a percentage increase. At the all industries level, 8.1 per cent of all full-time employees (data excludes those in agriculture, forestry and fishing) have their pay rises determined by this method. In the electricity, gas, water & waste services sector, only 2.7 per cent of workers have their pay set by this method.
Collective agreements negotiated under enterprise bargaining account for 41.9 per cent of all employees, but 67.7 per cent of electricity, gas, water and waste services employees’ wage increases are determined by this method.
The remaining 50 per cent of all industries employees have their pay set by individual arrangements, such as individual contracts or other salary arrangements (including incentive-based schemes), while the proportion for electricity, gas, water and waste services is currently estimated to be around 30 per cent.
Table 3.1: Wages Growth, All Industries, Australia, (by Workforce Segmented by Pay Setting Method)
Forecast AveragesYear Ended June 2010 2011 2012 2013 2014 2015 2016 2017 2018 2002-12 2013-18Proportion of Workforce by Pay setting Method (a)Awards Only 8.1% 8.1% 8.1% 8.1% 8.1% 8.1% 8.1% 8.1% 8.1% 8.1% 8.1%Collective Agreements 41.9% 41.9% 41.9% 41.9% 41.9% 41.9% 41.9% 41.9% 41.9% 41.9% 41.9%Individual Arrangements 50.0% 50.0% 50.0% 50.0% 50.0% 50.0% 50.0% 50.0% 50.0% 50.0% 50.0%
Total 100% 100% 100% 100% 100% 100% 100% 100% 100% 100.0% 100.0%
AWOTEAwards Only 0.7 3.5 3.4 2.9 2.9 3.1 3.4 2.8 3.1 2.6 3.0Collective Agreements 4.1 4.0 4.0 4.0 4.1 4.3 4.2 3.9 4.1 4.0 4.1Individual Arrangements (b) 7.2 4.4 4.7 4.1 5.4 6.3 6.0 5.5 6.4 5.6 5.6
AWOTE (Persons)(c) 5.6 4.2 4.3 4.0 4.7 5.3 5.1 4.7 5.3 4.7 4.9
Labour Price IndexAwards Only 0.7 3.5 3.4 2.9 2.9 3.1 3.4 2.8 3.1 2.6 3.0Collective Agreements 4.1 4.0 4.0 4.0 4.1 4.3 4.2 3.9 4.1 4.0 4.1Individual Arrangements (b) 2.6 3.7 3.4 3.6 4.3 4.5 4.1 3.6 4.3 3.7 4.1
Labour Price Index (Ord. Time) 3.1 3.8 3.6 3.7 4.1 4.3 4.1 3.7 4.1 3.7 4.0
Compositional Effects + Bonuses,etc 2.5 0.4 0.7 0.3 0.6 1.0 1.0 1.1 1.2 1.0 0.9
Source:BIS Shrapnel,ABS,DEEWR
(a) Full-time adult persons(b) Indiv Agreements picks up all the compositional effects and bonuses, incentives,etc plus all the standard errors of LPI and AWOTE estimates by ABS(c) Full-time Adult Persons, excluding overtime
Year Average Per Cent Change

Real Labour Cost Escalation Forecasts to 2017, October 2012 APA Group
14 © BIS Shrapnel Pty Limited 2012
Table 3.2: Methods of Setting Pay, Industry, May 2010 Proportion of Full-Time Employees (%)
The key influences on the different wage determination mechanisms of each discrete segment are described below:
Fair Work Australia (the body responsible for setting minimum wages in Australia) is responsible for establishing and maintaining a safety net of fair minimum wages for employees’ dependant on Awards. This requires maintenance of employees’ cost of living. Hence, in setting minimum wages, Fair Work Australia takes into account the performance and competitiveness of the national economy, including productivity, business competitiveness and viability, inflation and employment growth. Accordingly, increases in the Federal Minimum Wage (on which a range of mostly lower paid awards are also based) granted by the Fair Work Australia each year are usually set in relation to recent increases in the CPI and with regard to the Fair Work Australia’s view of both current and short-term future economic conditions. Fair Work Australia granted a 2.9 per cent ($17.10) increase in minimum wages, effective July 2012. The $17.10 per week increase lifted the Federal Minimum Wage to $606.40 per week.
Increases in collective agreements under enterprise bargaining are influenced by a combination of recent CPI increases, inflationary expectations, the recent profitability of relevant enterprises, current business conditions and the short-term economic outlook, and by the industrial relations ‘strength’ of relevant unions. Because the average duration of agreements now runs for two-to-three years, BIS Shrapnel bases its near-term forecasts on the strength of recent agreements, which have been ‘formalised’ over recent quarters. Thereafter, collective agreements are based on BIS Shrapnel’s macroeconomic forecasts.
Increases in individual agreements are primarily influenced by the strength of the labour market (especially the demand-supply balance of skilled labour), inflationary expectations, the recent profitability of relevant enterprises, current business conditions and the short-term economic outlook.
Industry (ANZSIC 2006) Award Collective Individual All MethodsOnly Agreements Arrangements of Pay Setting
Mining 1.8% 42.1% 56.1% 100.0%Manufacturing 9.1% 29.3% 61.6% 100.0%Electricity, Gas, Water & Waste Water Services 2.7% 67.7% 29.6% 100.0%Construction 6.7% 26.3% 67.0% 100.0%Wholesale trade 7.7% 11.3% 81.0% 100.0%Retail trade 16.6% 20.7% 62.7% 100.0%Accommodation and Food Services 31.7% 23.0% 45.3% 100.0%Transport, Postal and Warehousing 3.9% 55.9% 40.2% 100.0%Information Media and Telecommunications 3.6% 29.0% 67.4% 100.0%Finance and Insurance Services 1.5% 39.9% 58.7% 100.0%Rental, Hiring and Real Estate Services 13.1% 10.4% 76.5% 100.0%Professional, Scientific ans Technical Services 2.2% 11.5% 86.3% 100.0%Administrative and Support Services 15.9% 30.1% 54.1% 100.0%Public Administration and Safety 1.2% 92.5% 6.3% 100.0%Education and Training 2.9% 88.9% 8.1% 100.0%Health Care and Social Assistance 12.3% 66.6% 21.1% 100.0%Arts and Recreation Services 10.4% 40.1% 49.4% 100.0%Other Services 15.7% 11.0% 73.3% 100.0%All Industries 2010 Survey 8.1% 41.9% 50.0% 100.0%
Source: ABS

APA Group Real Labour Cost Escalation Forecasts to 2017, October 2012
© BIS Shrapnel Pty Limited 2012 15
Chart 3.1: Australia – Wages and Prices
Chart 3.2: Employment and Unemployment
88 90 92 94 96 98 00 02 04 06 08 10 12 14 16 18
Annual Per Cent Change
-1
1
2
3
4
6
7
8
9
0
5
Average WeeklyWage Earnings Labour Price
Index
BIS ShrapnelBaseline Inflation
Forecast
Year Ended June Source: BIS Shrapnel, ABS data
88 90 92 94 96 98 00 02 04 06 08 10 12 14 16 18 -4
-2
0
2
4
6
8
10
12
0
50
100
150
200
Employment Growth (LHS)
ABS Job Vacancies ('000) (RHS)
Year Ended June Source: BIS Shrapnel, ABS data
Forecast
ANZ Internet Job Ads / 5000(RHS)
Unemployment Rate(LHS)
Annual Per Cent Change '000's

Real Labour Cost Escalation Forecasts to 2017, October 2012 APA Group
16 © BIS Shrapnel Pty Limited 2012
3.1 Outlook for Australian All Industries Wages
With the unemployment rate holding steady between 5 and 5¼ per cent for the past year, annual wage inflation was also steady in 2011/12. The LPI eased marginally to 3.6 per cent in 2011/12 while the growth in AWOTE was close to the 2010/11 levels at 4.3 per cent.
BIS Shrapnel is forecasting moderate wage inflation over 2012/13 largely due to sluggish employment growth resulting in the unemployment rate tracking sideways for most of this financial year. However, a broadening in employment, profits and investment is expected from mid-to-late 2013 as increased mining investment and incomes and lower interest rates stimulate wider economic activity, lifting confidence and spending and encouraging businesses to switch out of cost-containment mode. The acceleration in profits, rising price inflation through 2013/14 and widening skills shortages — with the unemployment rate pushing below 5 per cent by mid 2014 — will drive up wages growth during 2013/14 and particularly 2014/15. We expect wages growth (in year average terms) to peak at 5.3 per cent for AWOTE and 4.3 per cent for LPI in 2014/15.
This will see the RBA act to constrain economic growth and inflationary pressures during 2014 and 2015 by raising interest rates. As wage and price pressures build, the approach by the RBA will become increasingly aggressive and this will eventually undermine domestic demand. The mining investment boom will be largely unaffected and strong competition for workers will continue to underpin strong employment and wages growth in investment related sectors, but this will be offset by weakening profits and demand for labour elsewhere in the economy over 2015.
The higher interest rates are expected to cause a slowdown in economic and employment growth during 2015, and this will eventually feed through to wages growth in 2016 and 2017, with wages growth in the individual arrangements and award segments slowing first. However, as wages growth is sticky downwards, we do not expect a sudden deceleration in wage inflation. We forecast wages growth to ease to 4.1 per cent in LPI terms in 2015/16 before declining to 3.7 per cent in 2016/17. Meanwhile, AWOTE wages growth is forecast to fall to 5.1 per cent and 4.7 per cent in 2015/16 and 2016/17 respectively.
But with only a small rise expected in the unemployment rate to around 5.7 per cent in 2016 because of the deceleration in ‘working population’ and slower labour force growth, the ongoing tight labour market is expected to see wage pressures rise again in the second half of the decade, once the subsequent recovery resumes.
Indeed, by the middle of this decade, both skilled and general labour shortages will begin to emerge due to demographic factors, ie retirements and less hours worked per person (especially for older workers). Australia will continue to experience sustained labour shortages in the decade to 2022 (and beyond), and these shortages will become more significant as the workforce ages. As Australia’s ‘baby boomers’ generation move into the 65+ age group, the growth of the 15-64 year old component of Australia’s working age population (the overwhelming majority of Australia’s workforce) will begin to slow.
With more people retiring, the supply of labour is expected to increase at a slower rate through the coming decade. This will lead not only to skilled labour shortages, but total labour shortages. Meanwhile, the demand for labour will continue to rise — particularly in periods of strong investment and economic growth. These sustained labour shortages will result in a long term upward bias in wage inflationary pressures.
In summary, for the six years from 2012/13 to 2017/18 inclusive, the annual growth in the ’All Industries’ LPI is forecast to average 4 per cent per annum, while AWOTE growth will average 4.9 per cent per annum.

APA Group Real Labour Cost Escalation Forecasts to 2017, October 2012
© BIS Shrapnel Pty Limited 2012 17
3.2 Outlook for Consumer Price Inflation
Overall inflationary pressures remained contained in the first half of 2012 reflecting a still high Australian dollar, some softening in global oil prices, and weak conditions in the non-mining economy, in particular retailing and housing.
CPI inflation was 0.5 per cent in the June 2012 quarter, to be 1.2 per cent through-the-year — the slowest annual rate since the June 1999 quarter. Annual underlying inflation also weakened further in the June quarter to 2 per cent from 2.2 per cent in the March quarter, providing further evidence of a broad based easing of price pressures in the economy.
Looking ahead, we believe inflationary pressures will remain subdued for the rest of this year. There are, however, some areas of the economy where supply constraints or other institutional factors will conspire to keep certain prices elevated over 2012/13 and beyond.
Recently, large increases in utilities charges (comprising electricity, gas & other household fuels and water & sewerage costs) have had a significant impact on overall inflation. A move towards cost-based pricing, the need to replace and expand infrastructure to meet demand (particularly peak demand loads), and rising input costs has seen utilities inflation move to a higher plane. We believe utilities prices will continue to grow strongly in the near-term as a significant ‘catch-up’ still exists for the below-average price increases and under-investment in infrastructure during much of the 1990s. In fact, regulators in most states have already approved significant price increases for electricity, gas and water services.
Health, education and insurance are expected to maintain their high price growth. In addition, rents and new dwelling purchase costs (the latter related to the cost of building and purchasing new dwellings by owner-occupiers, excluding land costs) are expected to rise through 2012/13.
Rents have been increasing due to a significant deficiency of residential stock, with vacancy rates at near the lowest levels in more than a decade across Australia.19 Dwelling construction in most major capital cities has now fallen to a level where not enough is being built to satisfy underlying demand for dwellings. We believe annual rental inflation will remain elevated over the next two years due to the persistent deficiency of residential stock.
Overall, we expect some pick up in the headline inflation rate in the September quarter due to the carbon price. But with consumer sentiment still weak, annual underlying inflation is likely to remain anchored in the bottom half of the Reserve Bank’s 2 to 3 per cent target range over 2012/13.
Underlying inflation to rise over 2013/14 and 2014/15, before easing in 2015/16
Underlying inflation will rise over 2013/14 and be pushed above 3 per cent over 2014/15. This will be predominantly due to rising non-tradeables inflation, largely as a result of faster growth in wages and the persistence of high rates of inflation in rents, utilities, health, education, child care services and other housing costs. From mid-to-late 2013, employment growth will follow the recovery in demand and output, with accelerating growth in employment over 2014 producing a decline in the unemployment rate. The strengthening in employment growth and the economy generally will result in rising incomes and demand, which, combined with the shrinking of spare capacity, will add to demand inflationary pressures during 2014 and 2015. Wages growth is also expected to pick up over these two years, with continuing weak productivity growth (relative to the long-term historical average) also adding to the rise in unit labour costs and non-tradeables inflation.
19 BIS Shrapnel internal research.

Real Labour Cost Escalation Forecasts to 2017, October 2012 APA Group
18 © BIS Shrapnel Pty Limited 2012
By late 2014, the economy is expected to hit capacity constraints, with the unemployment rate predicted to fall below 4.5 per cent. Inflationary pressures, therefore, will be broad-based, but labour shortages will be the key constraint on the economy. We expect the Reserve Bank to raise interest rates to reduce demand pressures from late 2013 and more aggressively over 2014/15. The efforts of the Reserve Bank are expected to successfully rein in growth in domestic demand from the second half of 2015, but wage and price pressure will be sticky downward, because both wages and, to a lesser extent, price inflation tend to lag growth in demand and output. However, in 2015/16, we expect non-tradeables inflation to ease through the year as the domestic economy and employment soften. However, weaker non-tradeables inflation will be partially offset by higher tradeables inflation, caused mainly by the depreciation of the Australian dollar.
Australian dollar to be stable over the next 2-3 years before depreciating
The Australian dollar is influenced by two key factors: interest rates in Australia compared to overseas (particularly US interest rates) and commodity prices.
Notwithstanding the likelihood for another cut in the cash rate in the last quarter of this year, local interest rates are predicted to rise from late 2013. We also expect the Reserve Bank to take an increasingly aggressive approach to reducing demand inflationary pressures over 2014/15. Meanwhile, a considerable overhang in capacity is keeping inflationary pressures at bay in the United States, but firming demand should see the US Federal Reserve start to lift interest rates by late 2013/early 2014. Rising US interest rates will narrow the interest rates differential between Australia and the United States which will also weigh on the attractiveness of the Australian dollar from 2014. Overall, BIS Shrapnel expects the exchange rate to remain close to US$1.00 over the next two-to-three years. Then, in 2015/16, BIS Shrapnel is forecasting a 5 per cent depreciation in the exchange rate, falling from an average of US$1.00 in 2014/15 to US$0.95 in 2015/16. The A$ is expected to depreciate by a further 8 per cent 2016/17.
The decline in the Australian dollar is expected to be the result of two key factors. Australian interest rates are expected to decline as the domestic economy softens, while at the same time better economic conditions overseas will see United States and European interest rates finally begin to rise, lessening the relative attractiveness of Australian rates. Adding to the weakness of the Australian dollar will be the projected weakening in commodity prices in response to increased supply coming on-stream from the current mining investment boom (both in Australia and overseas).
The end result will see underlying tradeables inflation (ie excluding fuel, fruit and vegetables) increase over 2015/16 and 2016/17 and keep overall inflation in the upper half of the Reserve Bank’s 2–3 per cent target band over this period.
Inflation containment will remain a policy challenge well into the medium term.
Tight labour markets will emerge once again in the medium term to become a chronic problem for inflation. The large pool of unemployed that was a feature of the 1990s has gone. Moreover, skilled labour shortages will remain a problem for the foreseeable future, particularly given anecdotal evidence of a re-emergence of skilled labour shortages so early into the post-GFC recovery. Inflation will act as the main ‘safety valve’ on Australia’s constrained economy.
Whenever the unemployment rate starts to track below 5 per cent there will be the potential for a demand-driven rise in wages growth and inflation. Pressures may moderate from time to time, but it would take another full-blown recession and a sharp fall in employment to really see inflationary pressures become significantly subdued.

APA Group Real Labour Cost Escalation Forecasts to 2017, October 2012
© BIS Shrapnel Pty Limited 2012 19
Table 3.3: Wages and Prices – Australia Year Average Growth
$/week 2011/12=100 2011/12=100 2011/12=100
2000 785.9 64.6 70.7 70.82001 825.1 5.0 66.9 3.6 73.8 4.4 73.8 4.42002 867.1 5.1 69.1 3.2 76.1 3.0 76.1 3.0
2003 913.7 5.4 71.5 3.6 78.2 2.8 78.2 2.82004 948.5 3.8 74.0 3.5 80.0 2.3 80.0 2.32005 998.9 5.3 77.1 4.1 82.1 2.7 82.1 2.72006 1 032.6 3.4 80.2 4.0 85.0 3.5 85.0 3.52007 1 081.8 4.8 83.5 4.1 87.0 2.3 87.0 2.3
2008 1 133.8 4.8 86.9 4.2 90.8 4.4 90.8 4.42009 1 198.6 5.7 90.0 3.5 92.5 1.8 92.5 1.82010 1 257.0 4.9 93.0 3.4 95.1 2.8 95.1 2.82011 1 312.8 4.4 96.5 3.7 98.3 3.4 98.3 3.42012e 1 362.5 3.8 100.0 3.6 100.0 1.7 100.0 1.7
Forecasts 2013 1,424.4 4.5 103.9 3.9 103.0 3.0 102.7 2.72014 1,492.9 4.8 108.3 4.2 106.1 3.1 105.3 2.52015 1,576.4 5.6 112.9 4.3 109.6 3.3 107.9 2.52016 1,649.7 4.7 117.3 3.9 112.7 2.8 110.6 2.52017 1,732.4 5.0 121.8 3.9 115.8 2.7 113.4 2.5
1990-2000 3.8 2.2 2.22000-2010 4.8 3.7 3.0 3.02007-2012 4.7 3.7 2.8 2.82012-2017 4.9 4.0 3.0 2.5
Source: BIS Shrapnel, ABS
(1) Earnings per person for full-time adults. Data is year ended November.(2) RBA Forecasts to December 2014. Beyond December 2014, Commonwealth Treasury's forecasts are used.(3) e.g. CAGR (Compound Annual Growth Rates) for 2012-2017 is CAGR for 2013 to 2017 inclusive (ie next regulatory period).e: Wage inflation for 2012 are estimates.
Compound Annual Growth Rates (3)
All Industries (BIS Shrapnel forecasts)%CH %CH %CH
Headline CPI (2)
%CH
Year Ended December
Average Weekly Labour Price Index CPI Headline Inflation Official
Ordinary Time Earnings(1)

Real Labour Cost Escalation Forecasts to 2017, October 2012 APA Group
20 © BIS Shrapnel Pty Limited 2012
3.2.1 Reserve Bank of Australia CPI forecasts
The Reserve Bank and the Federal Treasury provide the ‘official’ view of CPI forecasts. The RBA’s August 2012 ‘Statement on Monetary Policy’ projects the headline CPI rate at 2.25 per cent in the December quarter 2012, before rising to 3 per cent (mid-point of its forecast range of 2.5 to 3.5 per cent) in the June quarter 2013.20 According to the RBA, headline CPI inflation is then expected to be in the 2 to 3 per cent range through to December quarter 2014 (RBA current forecasts only extend to December 2014).
The Federal Treasury in their Mid-Year Economic and Fiscal Outlook projected CPI inflation at 3 per cent in 2012/13 and 2.25 per cent in 2013/14.21 For the budget forward estimate period (ie 2014/15 and 2015/16), the Federal Treasury forecast CPI inflation at 2.5 per cent. Over the longer term, we have used this same mid-point of the RBA’s inflation target range of 2-3 per cent over the cycle.
20 Reserve Bank of Australia, Statement on Monetary Policy, August, 2012. 21 http://www.budget.gov.au/2012-13/content/myefo/download/01_Part_1.pdf

APA Group Real Labour Cost Escalation Forecasts to 2017, October 2012
© BIS Shrapnel Pty Limited 2012 21
4. GAS PIPELINE-RELATED LABOUR COST ESCALATION
4.1 Key points
BIS Shrapnel expects total wage costs for the Australian Electricity, Gas, Water and Waste Services (EGWWS or ‘Utilities) sector — expressed in Average Weekly Ordinary Time Earnings (AWOTE) — will average 5.4 per cent per annum over the five years from 2013 to 2017 inclusive, 0.5 per cent higher than the national ‘All Industries’ AWOTE average of 4.9 per cent per annum over the same five year period (see table 4.6). In terms of underlying wages growth in the ‘utilities’ sector for total Australia — expressed in labour price index (LPI) terms — BIS Shrapnel is forecasting an average of 4.7 per cent per annum (0.7 percentage points higher than the national ‘All Industries’ LPI average of 4 per cent per annum) over the five years from 2013 to 2017 inclusive (see table 4.6). The faster wages growth expected in the electricity, gas and water sector over the next five years is in line with historical movements in the LPI over the past five years (see table 4.6).
The continued stronger wages growth in the Australian utilities’ sectors is due to:
– Sustained strong demand for skilled labour in the utilities sector, due to continued high levels of capital and maintenance expenditure in the utilities sector, related to major network upgrades and refurbishment and the need for new capacity in the electricity, gas and water sectors to cater for population and economic growth over the long term.
– Heightened competition from the Mining, Construction and (to a lesser extent) Manufacturing sectors for similar skilled labour as those sought in the utilities sector, driven in particular by the resources investment boom, which is expected to ramp up substantially over the next four years and remain at high levels over the following five to ten years.
– Relatively stronger unions continuing to win above average enterprise bargaining agreements in what is an essential services sector. Collective agreements dominate the pay setting in the utilities sector (covering around 70 per cent of employees in the Electricity, Gas, Water and Waste Services sector).
Utilities wages growth in Victoria is forecast to average 4.8 per cent per annum (in AWOTE terms) over the five years from 2013 to 2017, 0.6 percentage points lower than the national utilities AWOTE average of 5.4 per cent per annum, while Victorian utilities LPI growth is forecast to average 4.3 per cent per annum (0.4 per cent lower than the national utilities average of 4.7 per cent per annum) over the five years from 2013 to 2017 inclusive (see table 4.8). The weaker utilities wages growth in Victoria is due to Victoria’s lower exposure to the resources investment boom (compared to Queensland and Western Australia in particular), the comparative weakness of the state’s construction sector (compared to total Australia) and the comparative weaker growth in Victorian utilities-related engineering construction. This means a lower relative demand for similarly-skilled labour from the state’s construction and mining sectors and within the states utilities sector, compared to other states and therefore slower wages growth compared to the national utilities average.

Real Labour Cost Escalation Forecasts to 2017, October 2012 APA Group
22 © BIS Shrapnel Pty Limited 2012
Table 4.1: Labour Price Index Growth by Industry Sector and by State
Table 4.2: Australia AWOTE Growth by Industry Sector
Mar'08 Mar'09
Private 4.2 4.0 2.6 4.0 3.9 3.7 3.8 3.7 3.8 3.7Public 4.0 4.4 4.3 3.6 3.7 3.3 3.2 3.1 3.3 3.9
Industry
Mining 2.4 5.9 5.8 3.4 4.6 4.1 4.1 3.6 4.6 5.2 4.8Manufacturing 8.3 4.3 3.5 2.2 3.9 4.1 3.6 3.8 3.8 3.8 3.5Electricity, Gas, Water and Waste Services 1.3 4.7 4.8 4.6 3.7 3.7 3.6 3.2 3.4 3.7 4.1Construction 8.6 4.5 4.9 2.9 4.4 4.0 3.9 4.0 4.2 4.1 4.1Wholesale Trade 3.5 3.0 4.2 2.1 4.4 4.8 4.4 4.4 4.0 4.8 3.8Retail Trade 10.5 4.8 3.8 2.4 3.3 3.3 3.0 3.0 3.0 2.7 3.4Accommodation and Food Services 6.7 2.4 3.5 1.8 3.3 3.0 3.1 3.8 3.3 3.3 2.8Transport, Postal and Warehousing 4.8 4.2 4.7 3.4 3.6 4.0 3.7 3.4 3.3 3.8 3.9Information Media and Telecommunications 2.0 3.9 2.9 2.0 3.5 3.2 3.8 4.2 3.4 3.5 3.1Finance and Insurance Services 3.7 4.1 4.0 2.9 4.3 4.5 3.8 4.0 4.1 4.1 3.7Rental, Hiring and Real Estate services 1.9 4.2 3.6 2.2 3.0 3.6 3.6 4.0 4.2 3.5 3.4Professional, Scientific and Technical Services 8.1 4.5 5.2 3.0 4.7 4.0 4.2 4.7 4.3 4.6 4.3Administration and Support Services 3.4 4.8 4.0 1.9 3.8 3.7 3.2 3.0 3.3 3.6 3.5Public Administration and Safety 6.1 4.1 4.4 3.9 3.6 3.4 2.8 2.9 3.0 3.6 3.8Education 7.8 3.9 4.6 4.3 3.9 3.8 3.9 3.6 3.5 3.6 4.0Health Care and Social Assistance 11.8 3.4 4.1 3.7 3.3 3.6 3.2 3.0 3.1 2.6 3.5Arts and Recreation Services 1.9 3.3 3.8 3.0 3.1 3.4 3.3 4.2 3.7 3.5 3.4Other Services 3.9 3.8 3.3 2.5 3.0 3.6 4.6 4.4 4.0 3.8 3.2
State/Territory
New South Wales 31.4 3.8 3.8 3.2 3.8 3.7 3.6 3.8 3.5 3.6 3.6Victoria 25.2 3.9 3.9 2.7 3.9 4.1 3.5 3.5 3.4 3.5 3.6Queensland 20.3 4.1 4.2 3.2 3.9 3.9 3.8 3.6 3.6 3.8 3.8South Australia 7.1 4.9 3.9 2.5 3.6 3.3 3.4 3.3 3.4 3.4 3.6Western Australia 11.2 5.9 5.3 3.0 4.1 3.8 4.0 4.0 4.5 4.8 4.4Tasmania 2.0 3.5 4.6 3.6 3.5 3.5 3.9 3.6 3.2 3.2 3.6Northern Territory 1.1 3.7 5.1 3.2 4.1 3.9 3.9 4.3 3.6 3.6 3.8Australian Capital Territory (ACT) 1.8 4.1 4.0 3.4 3.7 3.5 3.0 3.0 3.3 3.9 3.7
Total All(2) 100 4.1 4.2 2.9 3.9 3.8 3.6 3.7 3.6 3.7 3.7(1) Measures changes in the price of labour. Ordinary hourly rates of pay (excludes overtime and bonuses) Source: BIS Shrapnel, ABS data(2) Excludes Agriculture, Forestry and Fishing sector
Sector% of Total
Employment May '12
Annual Per Cent Change Five-Year AverageDec'11 Mar'12 Jun'12
Labour Price Index(1)
Mar'10 Mar'11 Jun'11 Sep'11
Feb '09 Feb'10 Feb'11 May'11 Aug'11 Nov'11 Feb'12 May'12
Mining 2.4 2 272 7.1 7.8 5.9 5.2 4.5 5.2 8.0 7.1 6.9Manufacturing 8.3 1 175 4.0 1.4 3.2 4.1 2.8 4.2 1.9 0.4 2.9Electricity, gas, water and waste services 1.3 1 509 7.4 8.2 9.5 7.2 3.8 3.2 1.7 1.1 5.4Construction 8.6 1 362 9.5 8.7 5.6 3.8 5.4 5.3 1.3 2.2 5.7Wholesale trade 3.5 1 383 6.5 3.8 0.9 9.3 11.9 11.7 12.7 8.9 5.5Retail trade 10.5 969 1.6 5.7 0.7 -1.2 3.1 3.6 2.9 3.2 3.1Accommodation and food services 6.7 956 3.2 3.4 3.5 3.3 5.0 3.5 3.7 2.8 2.8Transport, postal and warehousing 4.8 1 364 3.6 7.8 7.3 6.6 6.1 4.9 7.3 9.7 5.8Information media and telecommunications 2.0 1 586 4.7 5.6 4.2 4.5 4.9 2.2 2.3 2.5 4.4Finance and insurance 3.7 1 592 2.5 6.6 5.3 2.9 2.3 -0.1 2.4 3.5 4.0Rental hiring and real estate services 1.9 1 232 5.6 1.2 -0.1 -1.9 -0.1 0.9 -1.1 1.9 3.1Professional, scientific and technical services 8.1 1 623 5.9 6.1 2.9 3.0 2.8 2.8 7.5 4.2 5.2Administration and support services 3.4 1 182 5.6 7.9 -0.9 -3.5 -2.8 -4.8 -1.1 1.3 3.6Public administration and defence 6.1 1 426 5.6 7.2 4.6 3.9 2.5 2.4 3.6 4.1 5.0Education and training 7.8 1 451 6.6 5.5 4.2 4.4 4.3 4.2 5.2 4.6 4.4Health and social assistance 11.8 1 240 5.0 5.8 2.2 5.8 6.9 4.6 1.1 -1.2 3.4Arts and recreational services 1.9 1 171 6.6 2.7 5.7 5.9 5.5 5.0 3.8 0.0 4.4Other services 3.9 1 081 6.5 0.5 6.4 1.3 1.9 1.1 1.7 6.2 4.3
Total All Industries(2) 100% 1 349 5.6 5.8 3.8 4.4 5.3 4.3 4.4 3.4 4.6
(1) Full Time Adult Ordinary Time earnings for persons Source: BIS Shrapnel, ABS data(2) Excludes Agriculture, Forestry and Fishing sector
Industry Sector% of Total
Employment May '12
Average Weekly Earnings(1)
$ / Week May '12
Annual Per Cent Change Five-Year Average

APA Group Real Labour Cost Escalation Forecasts to 2017, October 2012
© BIS Shrapnel Pty Limited 2012 23
4.2 Use of labour force categories and choice of index measure
The AER in its recent gas and electricity transmission determinations, as well as the AER’s draft decision on the Victorian Transmission System, stated that labour cost forecasts for state Electricity, Gas, Water and Waste Services industry most reasonably reflects a realistic expectation of labour costs for all internal labour of utility providers including gas pipeline owners.22,23,24 In other words, the AER accepts that the ABS labour price statistics for the Utilities sector reflects both specialised (ie network or pipeline related labour) and general or administrative labour.
While we agree with the AER that wages growth in the state ‘utilities’ sector is the ‘best’ escalator for utility providers’ internal labour, we believe waste services should be excluded from the overall utilities wage growth. Put another way, we believe that wages growth in the Electricity, Gas and Water Supply (EGW) sector provides a more accurate measure of APA Group’s (and indeed all other utilities) expected labour costs for the operation and management of their pipelines and networks.
The inclusion of the waste services sub-sector (from November 2009) has led to lower wage growth outcomes for the combined EGW and Waste Services sector. Hence, it is not an accurate indicator for the mostly higher skilled (and more highly demanded) occupations in the EGW sector. Using a comparison of the historical wages and employment data of EGW versus EGW and Waste Services at the national (Australian) level, annual growth in the combined EGWWS sector is 0.1 per cent less on average than the EGW sector over the period from 1998/99 to 2008/09, and 0.6 per cent less on average over the same period for AWOTE — both of which are significant and can make a material difference to an enterprise’s overall labour costs, see table 4.3. The overall wages growth average has also been dragged down by the fact that employment growth in the lower paid waste services sub-sector has outstripped growth in the higher paid EGW sector over the eleven years to November 2008 — 4.8 per cent per annum for waste services compared to 3.8 per cent per annum for EGW.
The inclusion of waste services understates the growth in ‘true’ labour costs for the gas industry, both historically and going forward. Under the National Gas Law, a service provider should be provided with a reasonable opportunity to recover at least its efficient costs in providing pipeline
Table 4.3: EGW V. EGWWS
22 AER Final Decision, Powerlink Transmission Determination 2012/13 to 2016/17 p.60, April 2012. 23 AER Draft Decision, Roma to Brisbane Pipeline, Confidential Appendices p.19, April 2012. 24 AER Draft Decision, APA GasNet Australia (Operations) 2013-17 Part 3 Appendices, pp. 104-5, September 2012
YearEndedJune $/week $/week 2004=100 2009=100 '000 '000
1998 832 7.5 796 6.3 1.2 79 64 64.5 -2.9 78.4 -2.5 -0.51999 867 4.2 827 3.9 0.3 82 3.2 66 3.0 0.2 64.8 0.6 78.9 0.6 -0.1
2000 923 6.4 867 4.8 1.6 85 3.8 68 3.8 0.0 64.2 -0.9 79.5 0.8 -1.72001 982 6.4 918 6.0 0.5 88 3.9 71 3.8 0.2 65.4 1.9 80.5 1.2 0.72002 1 055 7.4 981 6.8 0.6 92 4.2 74 4.2 0.0 67.5 3.1 83.1 3.2 -0.12003 1 085 2.8 1 001 2.1 0.8 96 4.3 77 4.1 0.1 72.8 7.9 89.6 7.8 0.12004 1 156 6.5 1 057 5.5 1.0 100 4.3 80 4.0 0.3 75.3 3.4 91.5 2.1 1.3
2005 1 195 3.4 1 091 3.2 0.2 104 4.4 83 4.3 0.1 76.7 1.9 95.2 4.1 -2.32006 1 214 1.6 1 111 1.9 -0.2 110 5.5 88 5.3 0.2 87.4 14.0 106.0 11.2 2.72007 1 262 4.0 1 152 3.7 0.3 115 5.0 92 4.8 0.1 85.1 -2.6 105.7 -0.3 -2.32008 1 304 3.3 1 183 2.7 0.6 120 4.1 96 4.1 -0.1 89.9 5.6 113.1 7.0 -1.42009 1 389 6.5 1 255 6.1 0.3 126 4.5 100 4.4 0.1 na na 134.8 19.2 na
1998-09 4.8 4.2 0.6 4.3 4.2 0.1 3.8 4.6 -0.3e: estimate Source: BIS Shrapnel, ABS data
EGWLPIEGWWS
AWOTEEGW EGWWS Difference Difference
%CH%CH
Average Growth Rates
%CH%CH %CH %CH %CH %CH %CH
EMPLOYMENTEGW EGWWS Difference

Real Labour Cost Escalation Forecasts to 2017, October 2012 APA Group
24 © BIS Shrapnel Pty Limited 2012
Chart 4.1: AWOTE & LPI Total Australia (All Industries) and Electricity, Gas, Water and Waste Services
Table 4.4: Federal Wage Agreements – Collective Agreements by Industry (Average Annualised Wage Increase)
86 88 90 92 94 96 98 00 02 04 06 08 10 12 14 16 18
1
3
5
7
9
11
0
2
4
6
8
10
Annual Per Cent Change Forecast
Year Ended June Source: BIS Shrapnel, ABS data
AWOTE -All Industries
LPI -All Industries
AWOTE -Electricity, Gas, Water
& Waste Services
LPI -Electricity, Gas, Water
& Waste Services
Selected Industry (ANZSIC 2006)
Electricity, Gas, Water and Waste Services 4.2 4.3 4.2 4.4 4.5 4.7 4.8 4.8 4.4 4.5Agriculture, Forestry and Fishing 3.4 3.3 3.0 3.0 2.9 3.0 3.7 3.7 3.7 3.3
Mining 3.2 3.3 3.6 3.7 4.0 4.3 4.4 4.3 4.2 3.9Manufacturing 4.1 4.1 4.1 4.2 4.3 4.2 4.1 3.9 3.9 4.1Construction 4.1 4.3 4.4 4.9 4.9 4.6 5.3 5.4 4.8 4.7Wholesale Trade 3.8 3.9 4.0 3.7 3.6 3.8 4.1 4.0 3.7 3.8Retail trade 3.2 3.2 3.4 3.5 3.5 3.5 3.6 3.5 3.4 3.4Accommodation and Food Services 2.8 2.8 3.2 3.3 3.4 3.2 3.6 3.9 3.9 3.3Transport , Postal and Warehousing 3.6 3.6 3.7 3.7 3.9 4.0 4.2 4.2 3.9 3.9Information Media and Telecommunications 4.0 4.2 4.1 3.6 3.2 3.3 3.8 3.8 3.4 3.7Financial and Insurance Services 4.1 4.2 4.1 4.1 4.1 3.8 4.0 3.6 3.7 4.0Rental, Hiring and Real Estate Services 3.8 4.1 4.1 3.8 4.8 4.5 3.5 3.7 3.9 4.0Professional, Scientific and Technical Services 3.8 4.1 4.1 3.8 4.0 4.0 4.5 4.3 4.0 4.1Administrative and Support Services 3.8 4.1 4.1 3.8 3.6 3.6 3.8 3.7 3.6 3.8Public Administration and Safety 4.4 4.4 4.3 4.0 4.1 4.2 4.3 3.9 3.7 4.1Health Care and Social Assistance 3.9 4.0 4.1 4.0 4.0 4.0 4.1 4.0 4.0 4.0Education and Training 3.9 4.5 4.7 4.9 4.8 4.9 4.4 4.6 4.6 4.6Arts and Recreation Services 3.7 3.5 3.8 3.5 3.8 4.0 4.1 3.5 3.5 3.7Other Services 4.5 4.4 4.0 4.0 4.1 4.0 3.9 3.7 3.6 4.0
ALL INDUSTRIES 3.8 3.9 4.0 4.1 4.1 4.0 4.2 4.1 4.0 4.0
(1)Current agreements in June of each year. Source: Department of Education, Employment & Workplace Relations (DEEWR)
Collective Agreements
Average 2003-2011
Average Annualised Wage Increase(1)
2003 2004 2005 2006 2007 2008 2009 2010 2011

APA Group Real Labour Cost Escalation Forecasts to 2017, October 2012
© BIS Shrapnel Pty Limited 2012 25
services.25 We believe this requirement is best met by approving labour and other cost escalators pertinent to the electricity and gas utilities, hence should use the wages escalator for EGW services rather than the labour costs growth for the EGWWS industry.
Notwithstanding our position, we have reluctantly accepted the AER’s preference for the wages growth in the EGWWS industry as the escalator most relevant for APA Group’s internal labour.
4.2.1 Choice of index measure - LPI is an underlying wage inflation measure, while AWOTE measures changes in actual labour costs
With respect to the choice of escalator (or index measure), BIS Shrapnel considers the labour price index (LPI) to be a measure of underlying wage inflation in the economy or in a specific industry, as the LPI only measures changes in the price of labour, or wage rates, for specific occupations or job classifications, which are then aggregated into a measure of the collective variations in wage rates made to the current occupants of the same set of specific jobs.
The LPI, therefore, reflects pure price changes, but does not measure variations in the quality or quantity of work performed. The LPI also does not reliably measure the changes in total labour costs which a particular enterprise or organisation incurs, because the LPI does not reflect the changes in the skill levels of employees within an enterprise or industry. As skills are acquired, employees will be promoted to a higher grade or job classification, and with this promotion will move onto a higher base pay. So the change in the cost of labour over, say a year, includes increases in the base pay rates (which the LPI measures) and the higher average base pay level. The Average Weekly Ordinary Time Earnings (AWOTE) captures both these elements, while the LPI only captures the first element. Basically, promoting employees to a higher occupation does not necessarily show up in the LPI, but the employer’s total wages bill (and average unit labour costs) is higher, as is AWOTE. The AWOTE measure also includes bonuses, incentives, penalty rates and other allowances, which are also part of an enterprises total wage bill (a more detailed description of the wage measures can be found in Appendix A).
Another problem with the use of the LPI is that it is only available from the ABS for two states — NSW and Victoria — which is a problem in using it as a labour cost escalator for other states not covered.
In summary, if a wage series is intended to be an ‘actual’ or real labour cost escalator then the AWOTE series should be used. This view is also supported by Professor Borland and Professor Mangan in their recent independent submissions to the AER.26
Despite the limitations of the LPI, the AER has preferentially used the LPI as the escalator for labour costs in recent decisions,27 largely because of the volatility of AWOTE caused by perceived ‘significant’ compositional problems with AWOTE, although we would argue the bonuses, incentives etc. also add markedly to volatility through the cycle.
While BIS Shrapnel considers that AWOTE is a superior measure for labour costs in the circumstances, LPI forecasts are also provided for APA Group’s internal (ie pipeline related) and external labour. The latter related to labour costs in APA Group’s external construction contracts.
In the next part of this section, we will consider the key drivers of the sustained strong growth in underlying wages growth (ie the LPI measure) in the national utilities sector, and draw
25 National Gas Law section 24(2)(a) 26 See, Professor Mangan, Labour Cost Report: report undertaken for Powerlink Pty Ltd regarding labour cost escalators in the Australian Energy Regulator’s Powerlink Draft Decision, January 2012; and Professor Borland, labour cost escalation report for Envestra Ltd, 2011. 27 For example, see AER Final Decision, Powerlink’s Revenue Proposal 2012/13 to 2016/17.

Real Labour Cost Escalation Forecasts to 2017, October 2012 APA Group
26 © BIS Shrapnel Pty Limited 2012
Tab
le 4
.5:
Ele
ctri
city
, Gas
, Wat
er a
nd
Was
te S
ervi
ces
Wag
e F
ore
cast
s –
Au
stra
lia
Fo
reca
stA
ve
rag
es
Yea
r E
nded
Jun
e20
0220
0320
0420
0520
0620
0720
0820
0920
1020
1120
1220
1320
1420
1520
1620
1720
1820
02-1
220
13-2
0P
rop
ort
ion
of
Wo
rkfo
rce
by
Pay
se
ttin
g M
eth
od
(a)
Aw
ards
Onl
y2.
7%2.
7%2.
7%2.
7%2.
7%2.
7%2.
7%2.
7%2.
7%2.
7%2.
7%2.
7%2.
7%2.
7%2.
7%2.
7%2.
7%2.
7%2.
7%C
olle
ctiv
e A
gree
men
ts
67.7
%67
.7%
67.7
%67
.7%
67.7
%67
.7%
67.7
%67
.7%
67.7
%67
.7%
67.7
%67
.7%
67.7
%67
.7%
67.7
%67
.7%
67.7
%67
.7%
67.7
%In
divi
dual
Arr
ange
men
ts29
.6%
29.6
%29
.6%
29.6
%29
.6%
29.6
%29
.6%
29.6
%29
.6%
29.6
%29
.6%
29.6
%29
.6%
29.6
%29
.6%
29.6
%29
.6%
29.6
%29
.6%
Tot
al10
0%10
0%10
0%10
0%10
0%10
0%10
0%10
0%10
0%10
0%10
0%10
0%10
0%10
0%10
0%10
0%10
0%10
0.0%
100.
0%
AW
OT
E
Aw
ards
Onl
y 1.
92.
62.
42.
62.
32.
71.
92.
40.
73.
23.
42.
92.
93.
13.
42.
83.
12.
43.
0C
olle
ctiv
e A
gree
men
ts
3.9
4.2
4.3
4.2
4.4
4.5
4.7
4.8
4.8
4.4
4.2
4.4
4.7
4.8
4.7
4.5
4.6
4.4
4.6
Indi
vidu
al A
rran
gem
ents
(b)
17.9
-6.5
11.2
-1.6
-12.
61.
0-2
.110
.014
.018
.7-0
.64.
65.
97.
87.
16.
87.
34.
56.
6
AW
OT
E (
Pe
rso
ns)
(c)
6.8
2.1
5.5
3.2
1.9
3.7
2.7
6.1
7.6
9.1
2.5
4.4
5.1
5.8
5.5
5.3
5.6
4.6
5.3
Lab
ou
r P
rice
Ind
ex
Aw
ards
Onl
y 1.
92.
62.
42.
62.
32.
71.
92.
40.
73.
23.
42.
92.
93.
13.
42.
83.
12.
43.
0C
olle
ctiv
e A
gree
men
ts
3.9
4.2
4.3
4.2
4.4
4.5
4.7
4.8
4.8
4.4
4.2
4.4
4.7
4.8
4.7
4.5
4.6
4.4
4.6
Indi
vidu
al A
rran
gem
ents
(b)
5.5
3.7
3.3
4.7
10.2
6.3
3.5
4.3
3.7
3.7
1.9
3.1
4.4
5.8
5.7
4.1
5.0
4.6
4.7
Lab
ou
r P
rice
Ind
ex
(Ord
. Tim
e)
4.2
4.1
4.1
4.3
5.2
4.8
4.2
4.5
4.3
4.2
3.5
4.0
4.6
5.0
5.0
4.3
4.7
4.3
4.6
Com
posi
tiona
l Effe
cts
+ B
onus
es,e
tc2.
6-2
.01.
5-1
.0-3
.4-1
.1-1
.51.
63.
24.
9-1
.00.
50.
50.
80.
61.
00.
90.
30.
7
(a)
Ful
l-tim
e A
dult
Per
sons
Sou
rce:
BIS
Shr
apne
l, A
BS
, DE
EW
R(b
) B
ecau
se o
f rel
ativ
ely
smal
l wor
kfor
ce (
and
ther
efor
e sm
all s
ampl
e si
ze)
in E
GW
WS
, Ind
iv A
gree
men
ts p
icks
up
all t
he s
tand
ard
erro
rs o
f LP
I and
AW
OT
E e
stim
ates
by
AB
S(c
) F
ull-t
ime
Adu
lt P
erso
ns, e
xclu
ding
ove
rtim
e
Ye
ar A
vera
ge P
er
Ce
nt C
hang
e

APA Group Real Labour Cost Escalation Forecasts to 2017, October 2012
© BIS Shrapnel Pty Limited 2012 27
comparisons with the all industries average and (in section 4.6) with competitor industries competing with the utilities sector for labour with similar skills (ie Mining, Construction and Manufacturing sectors). The key drivers will essentially boost utilities wages growth measured in both LPI and AWOTE terms, but we will consider the quantum of the combined up skilling effects, compositional effects, bonuses, incentives, etc over the cycle separately in section 4.3.
4.3 Key Drivers of Sustained Strong Growth in Underlying Wages Growth (Labour Price Index) in the National Utilities Sector
Wages growth in the electricity, gas and water sector is invariably higher than the total Australian national (all industry) average. The labour price index growth has consistently been above the national average since the index’s inception in 1997 (although it was the same as the national average in 2007/08) and averaged 0.8 per cent higher over the decade to 2010 (see table 4.6). While growth in average weekly ordinary time earnings (AWOTE) of the electricity, gas and water sector has displayed considerably more volatility (mainly related to compositional effects) over the past two decades, AWOTE growth in the sector has also usually been higher than the national average over the past two decades (see tables 4.2 and 4.6).
Utilities wages growth will remain well above ‘all industries’ average
The electricity, gas, water sector is a largely capital intensive industry whose employees have higher skill, productivity and commensurately higher wage levels than most other sectors. With many of the particular skills relevant to the electricity, gas, water sector expected to remain in relatively high demand, wage increases are expected to remain higher in this industry than the national average over the next six years, although we expect wage increases in the Utilities sector to converge towards the national ‘all industries’ average in the second half of the decade.
In addition, the overall national average tends to be dragged down by the lower wage and lower skilled sectors such as the Retail Trade, Wholesale Trade, Accommodation, Cafés and Restaurants, and, in some periods, also Manufacturing and Construction (see tables 4.1 and 4.2). These sectors tend to be highly cyclical, with weaker employment suffered during downturns impacting on wages growth in particular. The EGW sector is not impacted in the same way due to its obligation to provide essential services and thus retain skilled labour.
Demand for skilled labour — and therefore wages growth — to remain strong within the utilities sector, due to sustained high levels of utilities investment
Employment growth in the utilities sector over the past decade (2001/02 to 2011/12 inclusive) averaged 6.7 per cent per annum, the second fastest growth among the 18 main industry sectors behind the Mining sector (11.2 per cent per annum), with Construction employment growth third at 3.9 per cent per annum.
This strong growth in utilities employment since 2002 has been associated with a pick-up in infrastructure and maintenance work as well as an ongoing reversal in the sharp losses in employment seen through the 1990s. Privatisation and rationalisation were the drivers of the job cuts in the 1990s, but in some cases the desire to be streamlined left only a ‘skeleton’ crew in-house for routine operations and emergency disruptions, while capital and maintenance works (both minor and major) tended to be contracted out. Capital expenditure in the utilities sector during the 1990s was also relatively low, and this may also have contributed to weaker employment.
The emergence of skilled labour shortages across many industry sectors over the 2000s encouraged utilities businesses to boost their in-house response capabilities, while increasing competition has shifted the business focus towards customer service in order to enhance product differentiation with an accompanying increase in employment not directly related to the

Real Labour Cost Escalation Forecasts to 2017, October 2012 APA Group
28 © BIS Shrapnel Pty Limited 2012
provision of electricity, gas, and water services. The entrance of new players in the sector (such as new businesses related to renewable energy provision, new private electricity and gas businesses, etc.) has also exacerbated this situation as it has increased demand for all occupations within this sector.
The strong growth in employment growth in the Utilities, Mining and Construction sectors, and the associated sustained strong demand for skilled labour, contributed to above average wages growth in all three sectors. At the same time, the overall labour market tightened considerably during the 2000s, with the unemployment rate falling from around 7 per cent in 2001 to 5 per cent by 2005, and to 4.0 per cent in early 2008. This saw skilled labour shortages worsen and employers in these sectors bid up wages (see table 4.9).
The global financial crisis and associated slowing in the economy over 2008/09 subsequently reduced labour demand and wage pressures, but the unemployment rate only rose to a peak of 5.9 per cent in mid 2009 and has now fallen back to around 5 per cent. With the next phase of the resources investment boom now ramping up and utilities across Australia in the midst of a major investment phase itself, skilled labour shortages are already emerging. Job vacancies in the Utilities, Mining and Construction sectors have risen sharply since 2009 back toward (or above) the tight 2007/08 levels.
With the economy recovering, employment growth outpacing population and labour force growth and the unemployment rate now around 5 per cent and expected to fall below 4.5 per cent within two and half years, we expect to again witness the re-emergence of skilled labour shortages and competition for scarce labour from 2012/13, particularly from the construction and the mining sectors, which will push up wage demands in the utilities sector.
We expect wages growth in the electricity, gas and water sector to remain above the national average over the medium term, given the relatively high levels of job vacancies in the sector and the current levels of skills shortages being reported. Increased demand for labour will continue in the sector over the next six years at least.
We believe investment in the sector, particularly engineering construction, has been the key driver of employment growth in the sector over the past decade. Chart 4.2 illustrates this relationship, and shows employment has a stronger relationship with utilities engineering construction rather than utilities output. We expect employment growth to remain high for the utilities sector. Our forecast is for utilities investment to be higher (relative to history) over the next six years (see chart 4.2).
Electricity, gas and water utilities in virtually every state across Australia have embarked on major network refurbishment, extension and augmentation programs. This is due to the need to replace ageing infrastructure to maintain supply capability and to ensure reliability of the network, especially during peak periods. The latter is typically more maintenance type of work and is generally more labour intensive. Given the recent trend towards consolidating work in-house (rather than out-sourcing), we expect the need for regular maintenance work will continue to boost overall employment in the Utilities sector.
Added to this is our expectation that a number of peak, intermediate and base load power stations will be built over the next decade (with gas fuelled generation expected to dominate), along with new renewable generation facilities, while local reticulation construction will continue to be driven by new housing and industrial and commercial demand.
We expect further growth in electricity, gas and water services employment over the next six to seven years, although the rate of growth is forecast to be slower than in recent years. Partly underpinning this outlook for further employment growth is the relatively higher related infrastructure construction expected to occur over the next few years. Submissions to the AER

APA Group Real Labour Cost Escalation Forecasts to 2017, October 2012
© BIS Shrapnel Pty Limited 2012 29
and to other state based equivalents (such as the Victorian Essential Services Commission) from a number of utilities in each state have consistently reported that they expect to increase employment over the next five to six years.28
Chart 4.2: Australia – Utilities Employment, Output and Investment
More importantly, electricity, gas and water services supplies are essential services where reliability of supply is paramount. Accordingly, this requires adequate skilled labour to maintain reliability of supply, which points to the need to offer high wages to attract and retain skilled labour in this sector.
Powerful unions in utilities sector will also keep wages growth elevated
The key elements of the utilities wage forecast are set out in table 4.5. Table 4.5 shows that collective bargaining dominates the pay setting arrangements in the utilities sector, while the relative absence of workers relying on (often) low-increase awards (set in the National Wage Case) means the overall average for total utilities wages will invariably be higher than the all industries average. Table 4.3 shows that the utilities sector has consistently had higher wage increase under collective agreements than the all industries average. Over the past five years, the outcomes from collective agreements have been 0.5 per cent higher, on average, than the all industries average. We expect this trend to continue over the next six years, with the all industries average to also continue to be dragged down by the retail and hospitality industries.
28 See Powerlink Queensland Revenue Proposal 2013 – 2017 submitted to the AER, May 2010, p.90. Ergon Energy Regulatory Proposal 2011 – 2015 submitted to the AER, July 2009, p.49 and SP AusNet, Electricity Transmission Revised Revenue Proposal 2009 –2014 submitted to the AER, October 2007 p.138.
90 92 94 96 98 00 02 04 06 08 10 12 14 16 18 50
70
150
200
300
100
Index 2000 = 100 Forecast
Utilities EngineeringConstruction
Employment
Output (GVA)
Productivity
Year Ended June Source: BIS Shrapnel, ABS data

Real Labour Cost Escalation Forecasts to 2017, October 2012 APA Group
30 © BIS Shrapnel Pty Limited 2012
Table 4.6: Average Weekly Ordinary Time Earnings and Labour Price Index Total Australia and Electricity, Gas, Water and Waste Services Sector
(Year Average Growth)
$ $ Index Index
1991 567.9 5.4
1992 587.3 3.4
1993 599.5 2.11994 620.2 3.5
1995 650.7 4.91996 676.0 3.9 730.9 7.21997 701.9 3.8 767.5 5.0
1998 730.3 4.1 818.7 6.71999 750.4 2.8 837.2 2.32000 785.9 4.7 895.8 7.0 64.6 3.0 60.6 3.92001 825.1 5.0 954.4 6.5 66.9 3.6 63.0 3.92002 867.1 5.1 985.9 3.3 69.1 3.2 65.6 4.2
2003 913.7 5.4 1,031.6 4.6 71.5 3.6 68.2 4.02004 948.5 3.8 1,073.8 4.1 74.0 3.5 71.1 4.32005 998.9 5.3 1,105.3 2.9 77.1 4.1 74.2 4.42006 1,032.6 3.4 1,126.0 1.9 80.2 4.0 78.6 5.92007 1,081.8 4.8 1,171.2 4.0 83.5 4.1 81.9 4.1
2008 1,133.8 4.8 1,212.8 3.5 86.9 4.2 85.3 4.22009 1,198.6 5.7 1,294.5 6.7 90.0 3.5 89.0 4.32010 1,257.0 4.9 1,415.9 9.4 93.0 3.4 93.1 4.72011 1,312.8 4.4 1,499.3 5.9 96.5 3.7 96.4 3.62012e 1,362.5 3.8 1,537.9 2.6 100.0 3.6 100.0 3.7
Forecasts
2013 1,424.4 4.5 1,617.8 5.2 103.9 3.9 104.3 4.32014 1,492.9 4.8 1,706.1 5.5 108.3 4.2 109.3 4.82015 1,576.4 5.6 1,803.2 5.7 112.9 4.3 114.8 5.02016 1,649.7 4.7 1,902.9 5.5 117.3 3.9 120.2 4.72017 1 732.4 5.0 2,005.2 5.4 121.8 3.9 125.6 4.5
1990-2000 3.82000-2010 4.8 4.7 3.7 4.42007-2012 4.7 5.6 3.7 4.12012-2017 4.9 5.4 4.0 4.7
Source: BIS Shrapnel, ABS(1) Earnings per person for full-time adults. Data is year ended November (available only mid month of quarter).(2) Total hourly rates of pay excluding bonuses.e: estimate
Year Ended December
Average Weekly Ordinary Time Earnings (1) Labour Price Index (2)
All Industries%CH%CH
Electricity, Gas, Water and Waste Services
Electricity, Gas, Water and Waste Services
%CH %CH
Compound Annual Growth Rates
All Industries

APA Group Real Labour Cost Escalation Forecasts to 2017, October 2012
© BIS Shrapnel Pty Limited 2012 31
The analysis in table 4.5 also shows that pay outcomes in the individual arrangements segment of the utilities sector is also usually higher than the all industries average, although – as explained in Appendix A – some incentives and compositional effects emanating from the collective agreements may be ending up in the individual arrangements segment calculated in the LPI in table 4.5.
Increases in collective agreements under enterprise bargaining are influenced by a combination of recent CPI increases, inflationary expectations, the recent profitability of relevant enterprises, current business conditions and the short-term economic outlook, and by the industrial relations ‘strength’ of relevant unions. Because the average duration of agreements runs for two-to-three years, BIS Shrapnel bases its near-term forecasts of Enterprise Bargaining Agreement (EBA) wages on the strength of recent agreements, which have been ‘formalised’ or ‘lodged’ (ie an agreement has been ‘reached’ or ‘approved’) over recent quarters.
Data from the Department of Education, Employment and Workplace Relations quarterly report, Trends in Federal Enterprise Bargaining, shows that average outcomes of agreements accelerated through 2008/09, with the year average of the ‘formalised’ agreements rising to 5 per cent in 2008/09, compared to 4.8 per cent in 2007/08. While growth in formalised agreements slowed to an average of 4.1 per cent in 2010/11, wage increases under collective agreements picked up in the second half of 2011 to an average of 4.6 per cent.
We note that the DEEWR report for March quarter 2012 had an average increase of 3.7 per cent for the EGWWS sector. This figure is an aberration and is not an indicator for any general slowdown in wage increases under collective agreements. The March quarter result was dragged down by the relatively low (3.6 per cent) wage negotiated by Queensland utility providers. Because this agreement covered about 9,500 employees (80 per cent of all employees covered by agreements lodged in the quarter), the overall increase for the EGW sector was pushed down by the Queensland outcome. Not surprisingly, the low March quarter result was reversed in the June 2012 quarter when the average wage increase in collective agreements lodged in the quarter was 5.1 per cent.
We expect wages to pick up during 2012/13 given the tightness in the labour market and particularly given the recent high enterprise agreement outcomes in the construction sector. This will influence negotiations in the EGWWS sector.
With economic conditions expected to improve, we expect some pick up in the pace of formalised agreements over the near term toward 4.5 per cent per annum. Subsequently, wages growth in the collective agreements component will rise by around 5 per cent over the 2013/14 and 2014/15 before easing over 2015/16 and 2016/17 following the slowing in economic growth.
Despite the relative weakness of the economy over 2008/09 and 2009/10, wages remained elevated in the utilities sector due to the comparative strength of demand for skilled labour, and particularly because of the strength of unions in what is an essential service sector. The industrial relations reality is that there are powerful utilities unions such as the Communications, Electrical and Plumbing Union (CEPU) and Australian Services Union (ASU), which have a history of achieving high wage outcomes for the sector. Other unions active in the sector include the Australian Workers Union (AWU).
BIS Shrapnel analysis shows collective agreements in the EGW sector have been on average around 1.5 per cent higher than CPI inflation over the decade to 2010 (excluding the effects of GST introduction in 2000/01). In the five years to 2010 when the labour market was very tight, collective agreements were on average 1.7 per cent above the CPI. Given the strength of unions in the sector and a tighter labour market over the next six years (and possibly beyond) than for most of the 2000s, collective agreements are forecast to remain around 1.8 per cent above the CPI in the forecast period.

Real Labour Cost Escalation Forecasts to 2017, October 2012 APA Group
32 © BIS Shrapnel Pty Limited 2012
Tab
le 4
.7:
AW
OT
E P
erso
ns
by
Sta
te -
Ele
ctri
city
, Gas
an
d W
ater
Su
pp
ly
(Yea
r A
vera
ge
Gro
wth
)
$A
%C
h$
A%
Ch
$A
%C
h$
A%
Ch
$A
%C
h$
A%
Ch
$A
%C
h$
A%
Ch
$A
%C
h19
8645
6.6
6.3
454.
97.
046
6.6
7.2
426.
68.
244
0.8
6.7
431.
65.
850
2.6
8.6
434.
43.
545
2.3
6.9
1987
471.
83.
347
9.3
5.4
486.
04.
144
3.9
4.1
441.
10.
144
7.2
3.6
504.
30.
343
3.8
-0.1
469.
73.
819
8850
3.4
6.7
503.
65.
151
3.1
5.6
472.
76.
548
4.9
9.9
480.
77.
550
9.1
1.0
467.
87.
849
9.1
6.3
1989
530.
15.
355
6.0
10.4
545.
16.
249
9.7
5.7
523.
68.
049
7.6
3.5
575.
313
.052
0.8
11.3
535.
27.
219
9056
1.7
6.0
610.
39.
855
9.5
2.6
539.
27.
955
2.8
5.6
531.
96.
960
8.2
5.7
571.
19.
757
2.9
7.0
1991
595.
66.
064
0.3
4.9
572.
82.
456
7.0
5.2
585.
65.
955
3.8
4.1
623.
42.
557
3.1
0.4
600.
44.
819
9262
7.9
5.4
674.
05.
359
4.1
3.7
583.
73.
060
6.2
3.5
591.
36.
865
1.8
4.6
590.
83.
162
9.9
4.9
1993
651.
13.
771
2.1
5.6
605.
21.
959
8.8
2.6
618.
02.
062
8.9
6.4
662.
91.
761
2.0
3.6
652.
23.
519
9466
7.1
2.5
721.
11.
363
3.9
4.7
634.
35.
964
6.3
4.6
683.
78.
768
6.4
3.5
624.
62.
167
1.3
2.9
1995
699.
24.
872
2.4
0.2
667.
05.
264
6.5
1.9
701.
38.
570
3.4
2.9
700.
92.
167
6.8
8.4
695.
03.
519
9676
8.7
9.9
785.
78.
872
5.9
8.8
685.
56.
075
1.4
7.1
710.
31.
071
6.3
2.2
722.
16.
775
2.5
8.3
1997
799.
64.
083
1.6
5.9
773.
46.
576
7.7
12.0
800.
76.
675
2.2
5.9
749.
54.
678
8.8
9.2
796.
45.
819
9888
7.0
10.9
893.
97.
579
1.4
2.3
800.
44.
386
6.8
8.3
839.
411
.678
9.4
5.3
855.
58.
585
8.0
7.7
1999
892.
20.
692
1.2
3.1
843.
36.
682
7.1
3.3
902.
84.
188
0.6
4.9
1021
.929
.591
3.3
6.8
883.
73.
020
0097
2.9
9.0
1016
.510
.390
5.5
7.4
890.
07.
695
4.4
5.7
947.
97.
691
9.7
-10.
095
0.2
4.0
955.
28.
120
0110
52.4
8.2
1087
.37.
097
2.4
7.4
932.
34.
710
34.0
8.3
1008
.06.
397
8.0
6.3
1039
.29.
410
27.4
7.6
2002
1097
.64.
311
32.2
4.1
968.
4-0
.498
1.2
5.2
1100
.86.
510
46.9
3.9
1006
.22.
910
46.4
0.7
1063
.23.
520
0311
37.2
3.6
1149
.71.
510
89.7
12.5
1071
.79.
211
37.6
3.3
1122
.07.
210
04.7
-0.1
1133
.68.
311
21.1
5.4
2004
1212
.76.
611
42.4
-0.6
1229
.412
.810
68.6
-0.3
1187
.54.
411
54.8
2.9
1024
.82.
012
03.5
6.2
1180
.25.
320
0512
02.6
-0.8
1210
.35.
912
44.3
1.2
1073
.20.
412
45.1
4.8
1221
.75.
811
16.6
9.0
1164
.9-3
.212
05.3
2.1
2006
1257
.74.
612
07.7
-0.2
1213
.3-2
.511
19.8
4.3
1346
.28.
112
83.6
5.1
1234
.310
.512
12.1
4.0
1234
.52.
420
0713
19.8
4.9
1245
.53.
112
39.7
2.2
1185
.05.
814
35.0
6.6
1285
.30.
113
26.4
7.5
1317
.28.
712
84.9
4.1
2008
1366
.23.
512
71.6
2.1
1303
.75.
212
29.6
3.8
1541
.57.
413
11.4
2.0
1361
.22.
613
93.8
5.8
1342
.84.
520
09n.
p14
14.2
11.2
n.p
n.p
n.p.
n.p
n.p.
n.p.
1430
.26.
320
10n.
p16
71.2
18.2
n.p
n.p
n.p.
n.p.
n.p.
n.p.
1566
.89.
820
11n.
p17
98.1
7.6
n.p
n.p
n.p.
n.p.
n.p.
n.p.
1668
.26.
520
12n.
p19
23.9
7.0
n.p
n.p
n.p.
n.p.
n.p.
n.p.
1718
.53.
0F
orec
ast
2013
1997
.03.
818
07.7
5.2
2014
2110
.95.
719
16.2
6.0
2015
2237
.56.
020
35.0
6.2
2016
2365
.15.
721
57.1
6.0
2017
2492
.85.
422
82.2
5.8
1985
-200
85.
24.
94.
95.
15.
95.
24.
85.
45.
219
90-2
000
5.6
5.2
4.9
5.1
5.6
5.9
4.2
5.2
5.2
2000
-200
84.
32.
84.
74.
16.
24.
15.
04.
94.
420
12-2
017
5.3
5.8
n.p
.: N
ot p
ublis
hed
Sou
rce:
BIS
Shr
apne
l, A
BS
AU
ST
RA
LIA
WA
Yea
r A
vgY
ear
Avg
Yea
r A
vgY
ear
Avg
VIC
QL
DS
AN
SW
Yea
r A
vgY
ear
Avg
Yea
r A
vgY
ear
Avg
For
ecas
ts fo
r V
icto
ria a
nd A
ustr
alia
as
wel
l as
for
2009
- 2
012
are
base
d on
the
EG
WW
S s
ecto
r w
ages
plu
s hi
stor
ical
rel
atio
nshi
p be
twee
n th
e E
GW
and
EG
WW
S w
ages
at
the
natio
nal l
evel
.
Yea
r E
nded
N
ovem
ber
Co
mp
ou
nd
An
nu
al
Ave
rag
e G
row
th R
ate
s
TA
SN
TA
CT
Yea
r A
vg

APA Group Real Labour Cost Escalation Forecasts to 2017, October 2012
© BIS Shrapnel Pty Limited 2012 33
Chart 4.3: Total Engineering Construction Australia and Victoria
Chart 4.4: Utilities Engineering Construction Australia and Victoria
90 92 94 96 98 00 02 04 06 08 10 12 14 16 18 50
70
150
200
300
400
100
Index 2000 = 100 Forecast
AUS EngineeringConstruction
Year Ended June Source: BIS Shrapnel, ABS data
VIC EngineeringConstruction
90 92 94 96 98 00 02 04 06 08 10 12 14 16 18 40
50
70
150
200
300
100
Index 2000 = 100 Forecast
AUS UtilitiesEngineering Construction
Year Ended June Source: BIS Shrapnel, ABS data
VIC UtilitiesEngineeringConstruction

Real Labour Cost Escalation Forecasts to 2017, October 2012 APA Group
34 © BIS Shrapnel Pty Limited 2012
Increases in individual agreements (or non-EBA wages) are primarily influenced by the strength of the labour market (especially the demand-supply balance of skilled labour), inflationary expectations, the recent profitability of relevant enterprises (which influences bonuses and incentives, etc.), current business conditions and the short-term economic outlook.
Although the recent downturn saw some easing in overall skilled labour shortages for some professions relevant to the utilities sector, the DEEWR “Skills in Demand Lists” and Clarius Index still revealed ongoing shortages of key professionals and tradespersons in the utilities sector (see section 4.4). These shortages are expected to continue over the medium-to-long term given the large capital works and maintenance programs planned by utility providers in most states.
With economic conditions improving and skilled labour demand recovering, we expect higher wages growth in the segment to come through, as employers bid up wages for skilled labour in scarce supply. Businesses will find they must ‘meet the market’ on remuneration in order to attract and retain staff and we expect wages under individual arrangements to accelerate rapidly from 2012/13.
Two other factors which will act to push up wages growth attributable to the individual arrangements segment (ie the compositional effects) include the up skilling of the workforce and, later in the period, the ageing of the workforce. Apprentices, trainees and numbers of new staff have increased markedly over recent years, across the electricity, gas and water sector generally. Given slower growth in employment numbers over the next decade, it is likely that there will be overall up skilling of the existing workforce, which will see a commensurate movement by much of the workforce into higher grades (ie on higher pay), although the ‘base’ movement — the nominal increase in EBA’s — will not reflect this, so this upgrading will end up as compositional increases in the individual arrangements segment. A related aspect is ageing profile, which will particularly affect the ‘professionals’ on non-EBA’s, who tend to be older and more experienced.
Indeed, the strengthening of non-EBA wages from 2012/13 and the compositional effects from the overall up skilling is expected to result in much stronger growth in individual arrangements over this decade, compared to the last ten years. All the compositional effects from the up skilling of the workforce will fall into the individual arrangements wage setting residual. This is because the electricity, gas and water sector has a relatively small workforce and the individual arrangements segment picks up the standard errors of LPI and AWOTE estimates by the ABS.
Increased competition from Mining and Construction for similarly skilled workers to push up utilities wages
After pausing briefly in 2009/10 due to the global financial crisis, mining-related investment increased significantly in 2010/11 and this next phase is now ramping up and will see a substantial increase over the next four years before easing over the second half of this decade, but remaining at very high levels.29 Mining sector investment is dominated by investment in ‘buildings and structures’, with new capital expenditure in this category (for total Australia) measuring $37.2 billion in 2010/11 compared to almost $10 billion for ‘equipment, plant and machinery.’ Mining investment in buildings and structures is, in turn, dominated by engineering construction and BIS Shrapnel’s forecasts of ‘Mining and Heavy Industry’ engineering construction for total Australia are predicting a near doubling of Mining and Heavy Industry engineering construction by 2014/15 from 2009/10 levels (see chart 4.5). Similar increases are also predicted for associated infrastructure, including railways, harbours, other transport infrastructure, energy (electricity and gas, including pipelines) and water.
29 BIS Shrapnel, Engineering Construction in Australia 2011/12 – 2025/26.

APA Group Real Labour Cost Escalation Forecasts to 2017, October 2012
© BIS Shrapnel Pty Limited 2012 35
This huge increase in engineering construction activity will be undertaken by both internal Mining sector labour and by outsourced contracts to the construction sector. Employment of skilled labour in these two sectors will need to increase significantly, with the increased demand for skilled labour — where there are already shortages emerging — expected to push up wages in these sectors as they compete for a limited supply of skilled workers.
The Utilities sector will need to also push up utilities wages growth in order to retain (and increase) workers, whose skills will be in strong demand from the Mining and Construction sectors.
4.4 Overall Growth in Labour Costs (AWOTE Growth)
The labour price index reflects movements in the underlying price of labour and as a result does not fully capture movements in total labour costs per employee. As we pointed out in section 4.2, average weekly ordinary time earnings (AWOTE) is a better measure of the change in overall costs per employee, because it takes into account movements of employees to higher grades, changes in compositional effects from entry/exits of higher skilled/lower skilled (ie higher paid/lower paid) workers in an enterprise or industry, and also the payments above base rates of pay, such as bonuses, incentives, penalty rates and other allowances that are a normal part of an employees earnings over the quarter or year.
With regard to the latter, many enterprises in the utilities (and other industry) sectors(s) regularly include bonuses or incentive payments which are linked to a range of objectives, such as up skilling, additional training, productivity targets, safety targets, etc. These ‘extra’ payments — or changes in the quantum of payments — are not included in changes in the LPI, but can make a material difference to an enterprise’s overall labour costs.
In table 4.5, the bottom line shows the calculation for the collective up skilling effects, compositional effects, bonuses, incentives, other allowances, etc. – which is simply growth in AWOTE minus the growth in the LPI. Given its volatility over the past decade, it makes more sense to take a longer term view of changes and use a period average to assess the overall up skilling effects, compositional effects, bonuses, incentives and other allowances. Over the past decade, these effects have added 0.3 per cent on average in total labour costs growth (AWOTE) compared to LPI growth over the period.
Over the forecast period, we expect the collective up skilling effects, compositional effects, bonuses and incentives etc. to add 0.7 per cent on average to the AWOTE wage measure (compared to LPI growth) over the six years from 2012/13 to 2017/18 inclusive (see table 4.5), with those effects appearing to boost wages growth numbers in the individual arrangements segment. The 0.7 per cent average is close to the ‘all industries’ national average, where we have assumed the collective up skilling, incentives etc. to add around one per cent per annum on average (see tables 3.3 and 4.5) to underlying wages inflation (ie the LPI).
We have included year-to-year movements for AWOTE in the electricity, gas, water and waste services sector over the six years to 2017/18, which are presented in table 4.5. We have made an indicative allowance in AWOTE movements for compositional changes of employment within the sector through the cycle. A detailed analysis of the future structure of occupations within the sector would be required to accurately model compositional effects each year, but detailed information on the employment plans of all the utilities in Australia would be required. Such an analysis is outside the scope of this study. However, given our forecasts of Australian employment in the utilities sector is for relatively stable employment growth over the period from 2012/13 to 2019/20, we do not expect any large positive or negative compositional effects in any one year.

Real Labour Cost Escalation Forecasts to 2017, October 2012 APA Group
36 © BIS Shrapnel Pty Limited 2012
4.5 Outlook for utilities wages growth in Victoria
Stronger growth in overall employment in Victoria over the past two years (see table 2.2), combined with comparatively stronger growth in Victoria’s construction sector over the past three years, has seen the emergence of skilled labour shortages in Victoria. Indeed, across Australia, skilled labour shortages in certain professions and trades are being widely reported. The ‘Skills Shortage’ lists released in June 2012 by the Department of Education, Employment and Workplace Relations shows that all states are currently experiencing shortages of skilled labour for engineers, other professionals and tradespeople who are in high demand by the electricity, gas and water sector — and who are also keenly sought in the mining, construction and manufacturing sectors. In Victoria, the DEEWR shows shortages and recruitment difficulties are being reported for:
electrical engineers, electrical engineering draftspersons and technicians
civil engineers, civil engineering draftspersons and technicians
mechanical engineers
surveyors and construction estimators
Other surveys also indicate that skills shortages are already beginning to emerge in a number of professions. The ‘Clarius Skills Index’ — a quarterly index compiled by the Clarius Group (an employment services provider) and KPMG Economics Group — reported an extreme shortage of engineering professionals in the June 2012 quarter.
The existence of skilled labour shortages in professions and trades sought by the utilities and competitor sectors means wages growth is set to pick up in the utilities sector across Australia, including Victoria. Table 4.7 reveals that AWOTE growth in the utilities sectors across Australia over the past 25 years has been fairly uniform, with the states grouped around the Australian average of 5.2 per cent per annum and within 0.4 per cent of the national average,
We expect this uniformity to continue over the next six years. Base wages rate outcomes are likely to be similar across the states, particularly in the unionised collective bargaining segment as the outcomes in different state utilities are usually published (or are reported to unions in different states). The main differences in the forecast wages growth in each state’s utilities sector will then be due to the strength of demand for local utilities and competitor industries’ labour, with states with stronger labour demand realising higher wages growth, particularly in the individual arrangements segment and in terms of higher bonuses and incentives. Nevertheless, the utilities sector in Victoria will still need to offer competitive wages (in a national context) to prevent their existing and potential (desired) workers being poached by interstate utilities, mining and construction sectors.
Over the past decade, AWOTE growth in Victoria’s utilities sector has averaged 5.2 per cent per annum similar to the Australian utilities AWOTE growth (see table 4.7). From 2013 to 2017 inclusive, Victoria’s AWOTE growth is forecast to average 4.8 per cent per annum (0.6 percentage points slower than the national utilities average of 5.4 per cent per annum), see table 4.7. Victoria’s utilities LPI growth is forecast to average 4.3 per cent per annum (0.4 percentage points lower than the national utilities average of 4.7 per cent per annum) over the five years from 2013 to 2017 inclusive.

APA Group Real Labour Cost Escalation Forecasts to 2017, October 2012
© BIS Shrapnel Pty Limited 2012 37
Table 4.8: Electricity, Gas and Water – Victoria and Australia Nominal Wages Growth
The weaker utilities wages growth in Victoria is due to:
The state’s lower exposure to the resources investment boom, compared to Queensland and Western Australia in particular. A number of huge mining investments in those states (and the Northern Territory) will also add significantly to demand for labour with engineering skills throughout Australia, and this will influence electricity-network labour costs in Victoria, acting to push up wages growth in that skill area despite comparatively lower local demand for labour.
Relatively weaker growth in utilities engineering construction, compared to the rest of Australia. Chart 4.4 shows indices for utilities engineering construction in Victoria and total Australia – where utilities engineering construction is the sum of engineering construction activity (work done in constant prices) for the categories ‘ water storage and supply’, ‘sewerage and drainage’, ‘electricity generation, transmission and supply’, and ‘pipelines’ (the latter is mainly gas or oil pipelines).
$ A% CH Index A% CH $ A% CH Index A% CH
2000 895.8 8.1 60.6 3.82001 954.4 6.5 63.0 3.92002 985.9 3.3 65.6 4.2
2003 1,031.6 4.6 68.2 4.02004 1,073.8 4.1 71.1 4.32005 1,105.3 2.9 74.2 4.42006 1,126.0 1.9 78.6 5.92007 1,171.2 4.0 81.9 4.1
2008 1,212.8 3.5 85.3 4.22009 1,168.6 101.4 1,294.5 6.7 89.0 4.32010 1,364.1 16.7 105.1 3.6 1,415.9 9.4 93.1 4.72011 1,467.7 7.6 110.8 4.0 1,499.3 5.9 96.4 3.62012e 1,564.5 6.6 115.5 3.9 1,537.9 2.6 100.0 3.7
Forecasts 2013 1,615.4 3.3 120.1 3.9 1,617.8 5.2 104.3 4.32014 1,698.8 5.2 125.3 4.4 1,706.1 5.5 109.3 4.82015 1,792.0 5.5 131.2 4.7 1,803.2 5.7 114.8 5.02016 1,885.7 5.2 136.9 4.3 1,902.9 5.5 120.2 4.72017 1,979.5 5.0 142.8 4.3 2,005.2 5.4 125.6 4.5
2002-2012 4.5 4.32007-2012 5.6 4.12012-2017 4.8 4.3 5.4 4.7(1) Earnings of persons. Data is year ended November. Source: BIS Shrapnel, ABS
LPI AWOTE (1) LPI
Long Term Averages
Victoria- Nominal
e: estimate
Australia- NominalYear
Ended November
AWOTE (1)

Real Labour Cost Escalation Forecasts to 2017, October 2012 APA Group
38 © BIS Shrapnel Pty Limited 2012
Chart 4.4 also shows that utility engineering construction in Victoria is likely to step down over the forecast period with the fall in 2012/13 due mainly to the completion of the $1.6 billion Wonthaggi desalination plant and major sewerage works which pushed up utility engineering construction over the three years to 2010/11. Nevertheless, average levels over the next six years will still be well above historical levels.
The comparative weakness of Victoria’s overall construction sector over the next three years means there will be less pressure coming from the state’s construction sector, although the projected bounce back in overall construction in 2015/16 and 2016/17 will see the re-emergence of wage pressures from the construction sector at that time. Section 5 has a detailed discussion of prospects for Victoria’s construction sector and wages outlook.
Chart 4.5: Mining and Heavy Industry Engineering Construction Australia and Victoria
4.6 Competitor Industry Wages Growth
This section analyses and forecasts underlying wages (LPI) growth in the industries that compete with the utilities sector for similarly skilled labour.
4.6.1 Construction Wages
The forecasts and rationale for Australian and Victorian construction sector wages growth is set out in section 5. The forecasts are also shown in table 5.1.
4.6.2 Mining Wages
The mining investment boom over the second half of the 2000s resulted in rapid employment growth in the mining sector, strong demand for labour — particularly skilled labour — and an escalation in wages growth. Rapidly rising commodity prices and high profits also fuelled the escalation in mining wages. Over the 2007/08 to 2011/12 period, mining sector wages growth in
90 92 94 96 98 00 02 04 06 08 10 12 14 16 18 50
70
150
200
300
400
500
700
1500
2000
100
1000
Index 2000 = 100 Forecast
AUS Mining and Heavy Industry
Engineering Construction
Year Ended June Source: BIS Shrapnel, ABS data
VIC Mining and Heavy Industry
Engineering Construction

APA Group Real Labour Cost Escalation Forecasts to 2017, October 2012
© BIS Shrapnel Pty Limited 2012 39
AWOTE terms averaged 7.1 per cent per annum and 4.9 per cent per annum in LPI terms, at the Australian level.
Wages growth in the mining sector in LPI terms slowed sharply in 2009/10 in a lagged response to the downturn in resource exports and output in 2008/09 and delays to the commencement of new investment projects caused by the global financial crisis. Meanwhile, mining AWOTE growth in 2009/10 remained high (7.2 per cent) due to compositional effects — the cut backs in mining employment impacted disproportionately on lower paid workers, boosting the overall average wage. Employment growth has since bounced back and mining LPI growth picked-up to 4.4 per cent in 2011/12. AWOTE growth, meanwhile, eased to 6.2 per cent. Beyond 2011/12, both AWOTE and LPI growth is forecast to grow solidly over the next three years before easing — but still exhibiting relatively high growth (compared to ‘all industries’ Australian average) in the second half of this decade.
Driving the high wages growth this decade will be strong demand for labour, and particularly skilled labour, as a result of the mining investment boom projected to occur over the forecast period. Projections for continued strong economic growth in China and India — with their long term programs of industrialisation and urbanisation, which are metals and energy intensive — plus ongoing growth throughout other parts of Asia and, by mid-decade, a sustained recovery in the US and European economies, will all combine to underpin healthy demand for minerals and energy. Commodity prices are still exceptionally high levels and further price rises are forecast over the next two-to-three years. Prices over the next eight years are expected to be well above historical averages, both in real and nominal terms.
The strong outlook has locked-in another round of mining related projects over the next five years. The capital intensive nature of mining means not only that labour costs are usually a low proportion of total costs, but that the mining sector has a requirement for more highly skilled labour. Relatively high prices also mean that the mining sector can afford to offer higher wages.
Overall, mining sector wages in LPI terms are forecast to average 5.4 per cent per annum over the five years from 2012/13 to 2016/17 inclusive at the Australian level (see table 4.9), higher than the electricity, gas, water and waste services sector, adding to pressure for higher wages in the utilities sector across Australia.
4.6.3 Manufacturing Wages
Growth in manufacturing has lagged the growth in all industries wages over the last decade, both in AWOTE and LPI terms, at the Australian level. Employment and output growth have been weak overall, with the manufacturing sector one of the sectors hardest hit by the global financial crisis.
Future prospects for the manufacturing sector will be shaped by three factors: the outlook for export markets which in turn is directly correlated with the prospects for the global economy; the strength of domestic demand for goods, in particular the performance of the construction sector; and the level of the A$.
The key drivers of growth are expected to be the resumption of the upswing in domestic dwelling construction, supplying inputs to the booming mining sector, a higher plane of privately funded engineering construction and the continued recovery in business investment at home and overseas. In turn, this will boost demand for construction materials, housing fit-out goods, machinery and equipment as well as releasing a considerable amount of pent-up demand for consumer and capital goods. However, higher interest rates over 2014/15 are expected to affect dwelling building and consumer demand, and cause manufacturing output growth to slow in 2014/15 and 2015/16, before picking up from 2016/17. The major negative for Manufacturing

Real Labour Cost Escalation Forecasts to 2017, October 2012 APA Group
40 © BIS Shrapnel Pty Limited 2012
will be the very high A$ (averaging close to US$1 over the next five years) which will impact heavily on competitiveness and lead to a further ‘hollowing out’ of industry.
Overall, manufacturing sector wages growth in LPI terms is forecast to average 4.0 per cent per annum over the five years from 2012/13 to 2016/17 inclusive at the Australian level (see table 4.9). The slower wage growth compared to the All Industries average is in line with historical trends over the past decade. Note that wages growth in the overall manufacturing sector does not weaken significantly, despite further declines in manufacturing employment over the next few years, because most of the employment losses are expected to be in the lower wage segments of manufacturing such as Textiles, Leather, Clothing and Footwear Manufacturing; Furniture and Other Manufacturing; Wood Products Manufacturing; and Printing. Average wages per employee in the first two subdivisions are around two-thirds of the overall manufacturing average, while average wages in the latter two subdivisions are 85 per cent and 83 per cent of the overall manufacturing average respectively.30
Table 4.9: Wages Growth in Competitor Industries – Australia All Industries, EGWWS, Mining, Manufacturing and Construction
(Year Average Growth)
30 ABS (catalogue number 8155.0)
$ $ Index Index Index2000 64.7 60.6 61.3 60.2 65.72001 66.9 3.5 62.9 3.8 63.8 4.1 62.1 3.1 67.9 3.22002 69.1 3.3 65.6 4.2 65.9 3.3 64.2 3.5 70.1 3.3
2003 71.5 3.5 68.2 4.1 68.1 3.3 66.5 3.6 72.7 3.72004 74.1 3.6 71.0 4.1 70.6 3.7 68.5 2.9 75.0 3.22005 76.9 3.7 74.0 4.3 74.3 5.2 71.3 4.1 77.8 3.82006 80.0 4.1 77.9 5.2 77.9 4.9 74.9 5.0 81.0 4.02007 83.2 3.9 81.6 4.8 81.7 4.9 79.3 6.0 83.9 3.7
2008 86.6 4.1 85.0 4.2 85.5 4.7 83.9 5.8 87.7 4.52009 90.2 4.1 88.9 4.5 89.5 4.7 88.7 5.7 90.8 3.52010 92.9 3.1 92.8 4.3 92.4 3.3 91.9 3.6 92.9 2.32011 96.5 3.8 96.6 4.2 96.1 4.0 95.8 4.3 96.4 3.72012 100.0 3.6 100.0 3.5 100.0 4.1 100.0 4.4 100.0 3.8
Forecasts 2013 103.7 3.7 104.0 4.0 103.6 3.6 104.9 4.9 103.8 3.82014 107.9 4.1 108.7 4.6 108.4 4.6 110.5 5.4 108.1 4.12015 112.6 4.3 114.2 5.0 114.0 5.2 116.9 5.7 112.6 4.22016 117.2 4.1 119.9 5.0 119.5 4.9 123.5 5.6 116.9 3.82017 121.5 3.7 125.1 4.3 124.7 4.4 129.9 5.2 121.4 3.8
2000-2010 3.7 4.3 4.2 4.3 3.52007-2012 3.8 4.1 4.1 4.7 3.62012-2017 4.0 4.6 4.5 5.4 4.0
Source: BIS Shrapnel, ABS
%CH %CH %CH %CH %CH
Long Term Averages
All Industries Water and Waste Services Construction Mining Manufacturing
Year Ended June
Labour Price Index Electricity, Gas,

APA Group Real Labour Cost Escalation Forecasts to 2017, October 2012
© BIS Shrapnel Pty Limited 2012 41
5. CONTRACTOR ESCALATION
This section provides forecasts of APA Group’s external labour escalation, which is predominantly related to the labour costs in APA Group’s external construction contracts.
As contractor labour is assumed to undertake construction or maintenance related projects, they would be classified to the construction sector. Accordingly, the escalator used for contractor labour is Construction sector wages growth both in LPI and AWOTE terms.
Our research has shown that construction activity (ie work done in the sector) normally has a strong influence on construction wages. BIS Shrapnel’s forecasts of construction activity by state (which includes residential and non-residential building, plus engineering construction) were used to derive the wage forecasts.
5.1 Construction Sector Wages Growth in Victoria
Much like the other states and territories, wages growth in the Victorian construction sector tracks growth in total construction activity, although changes in wages tend to lag construction (in work done terms) by around one to two years.
Construction activity was extremely strong for most of the previous decade.31 In fact over the past three years, the overall strength of Victoria’s construction sector underpinned the strength of the state economy.32 New dwelling building activity picked up quickly between 2008/09 and 2010/11 after interest rates tumbled and the first home owner grants (FHOG) scheme boosted demand. In addition, stronger population growth and the ready availability of reasonably priced residential land facilitated a much faster upswing compared to other states, which incidentally has a greater undersupply of dwellings.33
In addition, public construction ramped up significantly over 2008/09 to 2010/11, partly because the Victorian government was able to get the Federal stimulus spending underway quickly and partly because the state government was already proceeding with its own major health, rail, harbour and sewerage projects. Private sector engineering construction also made a healthy contribution, thanks to substantial electricity, pipelines, oil and gas activity, and work on the $1.6 billion Wonthaggi desalination plant.34
The strength of the construction sector fuelled strong growth in Victorian construction wages in the second half of the last decade (see table 5.1). However, in 2010, construction sector wages eased in line with a relatively weaker (and peak) in construction activity over 2010/11.
Looking ahead, we believe engineering construction will decline over 2012/13, as work is progressively completed on the desalination plant, major sewerage infrastructure and the current round of pipelines, oil and gas investments.35 Non-residential building will continue to decline, with the end of stimulus spending causing steep declines in schools construction and, later, health and other social and institutional buildings and more than offsetting a recovery in commercial and industrial building.36 Dwelling building is also forecast to decline over 2012/13 to 2014/15 with the deficiency of stock predominately eliminated by June 2013.37 Despite healthy growth in the underlying demand for dwellings, rising interest rates over 2013/14 and into 2014/15 will help trigger the downturn. A recovery in overall construction is projected from 2016/17 (see chart 5.1).
31 ABS, National Accounts 5206.0, June Quarter 2012. 32 ABS, National Accounts 5206.0, June Quarter 2012. 33 BIS Shrapnel, Residential Property Prospects, 2012-2015. 34 BIS Shrapnel, Engineering Construction in Australia, 2010/11-2024/25 Report. 35 BIS Shrapnel, Engineering Construction in Australia, 2011/12-2025/26 Report. 36 BIS Shrapnel, Building in Australia 2012-2026 Report. 37 BIS Shrapnel Residential Property Prospects, 2012-2015.

Real Labour Cost Escalation Forecasts to 2017, October 2012 APA Group
42 © BIS Shrapnel Pty Limited 2012
Chart 5.1: Total Construction – Victoria Value of Work Done, Constant 2009/10 Prices
Construction wages growth therefore is expected to be weaker over the next five years. We expect construction wages (in AWOTE terms) to average 5 per cent per annum over the 2013 to 2017 period compared to the 8.0 per cent per annum average achieved in the second half of the previous decade (see table 5.1).
82 84 86 88 90 92 94 96 98 00 02 04 06 08 10 12 14 16 18
$ Billion
2
3
4
5
6
8
20
30
40
10
Forecast
Total Construction
Dwellings
Non-dwellingBuildings
EngineeringConstruction
Year Ended June Source: BIS Shrapnel, ABS data

APA Group Real Labour Cost Escalation Forecasts to 2017, October 2012
© BIS Shrapnel Pty Limited 2012 43
Table 5.1: Construction Wages Growth – Victoria and Australia Nominal Wages
$ A% CH Index A% CH $ A% CH Index A% CH
2000 659.4 735.3 70.92001 669.9 1.6 72.3 741.9 0.9 73.5 3.72002 723.1 7.9 75.0 3.8 790.3 6.5 75.9 3.3
2003 796.2 10.1 77.6 3.4 859.6 8.8 78.5 3.42004 824.4 3.5 81.5 5.0 894.7 4.1 82.2 4.82005 880.1 6.8 85.2 4.6 941.2 5.2 86.2 4.82006 872.9 -0.8 89.9 5.4 957.2 1.7 91.0 5.62007 969.4 11.1 93.3 3.9 1,041.2 8.8 94.9 4.3
2008 1,073.7 10.8 97.6 4.5 1,111.9 6.8 99.2 4.52009 1,208.9 12.6 102.9 5.4 1,205.1 8.4 103.2 4.12010 1,274.2 5.4 107.8 4.7 1,283.8 6.5 106.7 3.42011 1,266.6 -0.6 112.5 4.4 1,348.2 5.0 111.0 4.02012 1,311.6 3.5 116.3 3.4 1,374.9 2.0 115.4 4.0
Forecasts 2013 1,365.2 4.1 120.5 3.7 1,450.8 5.5 120.1 4.12014 1,435.5 5.2 125.8 4.4 1,531.3 5.5 126.0 4.92015 1,515.9 5.6 131.8 4.7 1,621.2 5.9 132.4 5.12016 1,594.0 5.2 137.6 4.4 1,709.4 5.4 138.5 4.62017 1,673.6 5.0 143.3 4.2 1,801.5 5.4 144.8 4.5
2002-2012 6.9 4.9 6.4 4.62007-2012 6.2 4.5 5.7 4.02012-2017 5.0 4.3 5.6 4.6
(1) Earnings of persons. Data is year ended November. Source: BIS Shrapnel, ABS
Victoria - Nominal Australia - Nominal
Year Ended December
AWOTE (1) LPI AWOTE (1) LPI
Long Term Averages

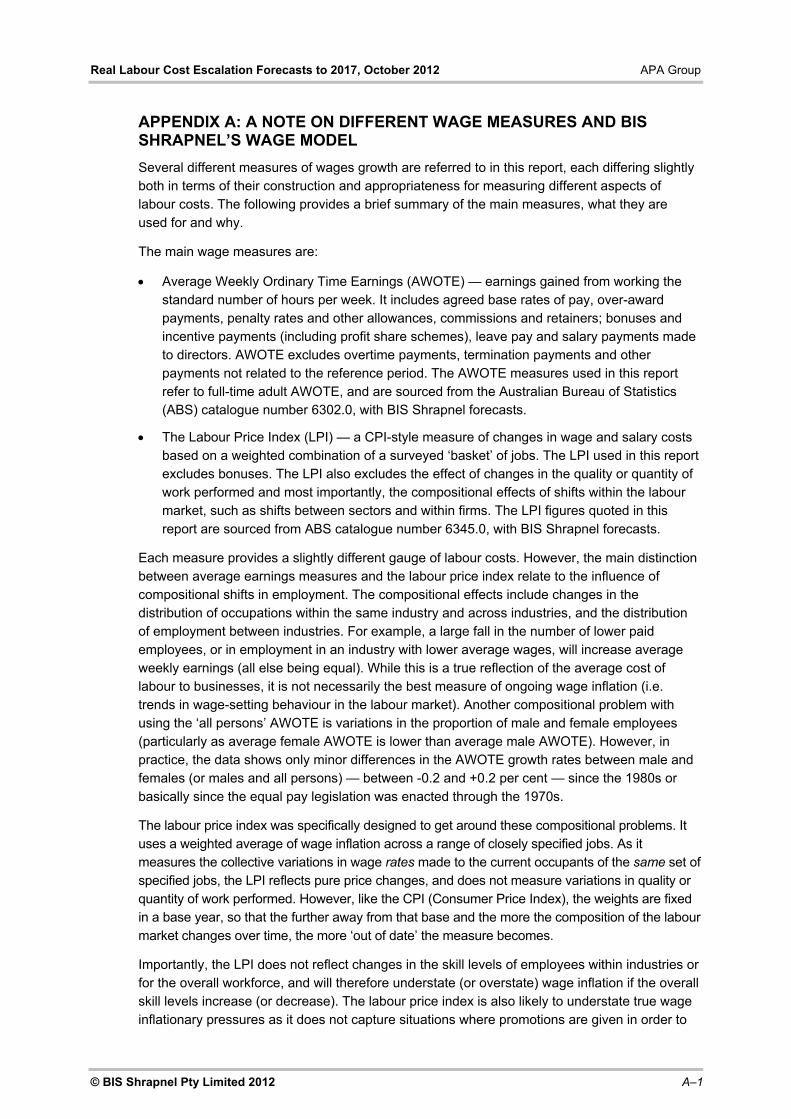
Real Labour Cost Escalation Forecasts to 2017, October 2012 APA Group
© BIS Shrapnel Pty Limited 2012 A–1
APPENDIX A: A NOTE ON DIFFERENT WAGE MEASURES AND BIS SHRAPNEL’S WAGE MODEL
Several different measures of wages growth are referred to in this report, each differing slightly both in terms of their construction and appropriateness for measuring different aspects of labour costs. The following provides a brief summary of the main measures, what they are used for and why.
The main wage measures are:
Average Weekly Ordinary Time Earnings (AWOTE) — earnings gained from working the standard number of hours per week. It includes agreed base rates of pay, over-award payments, penalty rates and other allowances, commissions and retainers; bonuses and incentive payments (including profit share schemes), leave pay and salary payments made to directors. AWOTE excludes overtime payments, termination payments and other payments not related to the reference period. The AWOTE measures used in this report refer to full-time adult AWOTE, and are sourced from the Australian Bureau of Statistics (ABS) catalogue number 6302.0, with BIS Shrapnel forecasts.
The Labour Price Index (LPI) — a CPI-style measure of changes in wage and salary costs based on a weighted combination of a surveyed ‘basket’ of jobs. The LPI used in this report excludes bonuses. The LPI also excludes the effect of changes in the quality or quantity of work performed and most importantly, the compositional effects of shifts within the labour market, such as shifts between sectors and within firms. The LPI figures quoted in this report are sourced from ABS catalogue number 6345.0, with BIS Shrapnel forecasts.
Each measure provides a slightly different gauge of labour costs. However, the main distinction between average earnings measures and the labour price index relate to the influence of compositional shifts in employment. The compositional effects include changes in the distribution of occupations within the same industry and across industries, and the distribution of employment between industries. For example, a large fall in the number of lower paid employees, or in employment in an industry with lower average wages, will increase average weekly earnings (all else being equal). While this is a true reflection of the average cost of labour to businesses, it is not necessarily the best measure of ongoing wage inflation (i.e. trends in wage-setting behaviour in the labour market). Another compositional problem with using the ‘all persons’ AWOTE is variations in the proportion of male and female employees (particularly as average female AWOTE is lower than average male AWOTE). However, in practice, the data shows only minor differences in the AWOTE growth rates between male and females (or males and all persons) — between -0.2 and +0.2 per cent — since the 1980s or basically since the equal pay legislation was enacted through the 1970s.
The labour price index was specifically designed to get around these compositional problems. It uses a weighted average of wage inflation across a range of closely specified jobs. As it measures the collective variations in wage rates made to the current occupants of the same set of specified jobs, the LPI reflects pure price changes, and does not measure variations in quality or quantity of work performed. However, like the CPI (Consumer Price Index), the weights are fixed in a base year, so that the further away from that base and the more the composition of the labour market changes over time, the more ‘out of date’ the measure becomes.
Importantly, the LPI does not reflect changes in the skill levels of employees within industries or for the overall workforce, and will therefore understate (or overstate) wage inflation if the overall skill levels increase (or decrease). The labour price index is also likely to understate true wage inflationary pressures as it does not capture situations where promotions are given in order to

Real Labour Cost Escalation Forecasts to 2017, October 2012 APA Group
A–2 © BIS Shrapnel Pty Limited 2012
achieve a higher salary for a given individual, often to retain them in a tight labour market. Average weekly earnings would be boosted by employers promoting employees (with an associated wage increase), but promoting employees to a higher occupation category would not necessarily show up in the labour price index. However, the employer’s total wages bill (and unit labour costs) would be higher.
For this reason, BIS Shrapnel prefers using AWOTE as the measure that best reflects the increase in wage cost changes (or unit labour costs, net of productivity increases) for business and the public sector across the economy. On the other hand, labour price index can be used as a measure of underlying wage inflation in the economy.
Description of BIS Shrapnel’s wage model
BIS Shrapnel’s wage model (for both AWOTE and LPI) is based on the analysis of past and future (expected) wage movements in three discrete segments of the workforce, based on the three main methods of setting pay and working conditions (see Tables 3.1 and 3.2):
Those dependent on awards rely on pay increases given in the annual National Wage case by Fair Work Australia (formerly by the Fair Pay Commission and the Australian Industrial Relations Commission). Most of the wage increases in the National wage case over the past decade have been given as flat, fixed amount (i.e. dollar value) increases, rather than as a proportional increase. At the all industries level, 15.2% of all employees (data excludes those in agriculture, forestry and fishing) have their pay rises determined by this method. In the electricity, gas and water sector, only 0.9% of workers have their pay set by this method.
Collective agreements negotiated under enterprise bargaining account for 43.4% of all employees, but 84.4% of electricity, gas and water employees’ wage increases are determined by this method.
The remaining 41.4% of all industries employees have their pay set by individual arrangements, such as individual contracts or other salary arrangements (including incentive-based schemes), while the proportion for electricity, gas and water is 14.7%.
Future movements of forecasts of wage inflation are based on the key influences on the different wage determination mechanisms of each discrete segment ie:
increases in the Federal Minimum Wage (on which a range of mostly lower paid awards are also based) granted by Fair Work Australia (and by the Fair Pay Commission and the AIRC previously) each year are usually set in relation to recent increases in the CPI and with regard to the wage-setting body’s view of both current and short-term future economic conditions. For instance, the $21.66 increase granted by the Fair Pay Commission in its decision in mid-2008 (effective October 2008) amounted to a 4.1 per cent increase for those on the Federal Minimum Wage of $522/week. This reflected the marked acceleration in the CPI in the first half of 2008 (to 4.2 per cent in the March quarter and to 4.5 per cent in the June quarter). It also reflected the strong economic conditions apparent around mid-2008 (the unemployment rate was just over 4 per cent). Conversely, the Fair Pay Commission gave no increase in its July 2009 decision, citing as its reasons, the deterioration of economic conditions and what we believe is a spurious link between minimum wage increases and higher unemployment.
increases in collective agreements under enterprise bargaining are influenced by a combination of recent CPI increases, inflationary expectations, the recent profitability of relevant enterprises, current business conditions and the short-term economic outlook, and by the industrial relations ‘strength’ of relevant unions. Because the average duration of

APA Group Real Labour Cost Escalation Forecasts to 2017, October 2012
© BIS Shrapnel Pty Limited 2012 A–3
agreements now runs for two-to-three years, BIS Shrapnel bases its near-term forecasts on the strength of recent agreements, which have been ‘formalised’ over recent quarters. Thereafter, collective agreements are based on BIS Shrapnel’s macroeconomic forecasts.
increases in individual agreements are primarily influenced by the strength of the labour market (especially the demand-supply balance of skilled labour), inflationary expectations, the recent profitability of relevant enterprises, current business conditions and the short-term economic outlook.
Note in table 3.1, wage increases under ‘individual arrangements’ are calculated by deduction. Data from DEEWR (Department of Education, Employment and Workforce Relations) are used for wage increases under collective agreements..
The limitation of this methodology is that because individual arrangements are calculated as a residual, all of the compositional effects in terms of AWOTE (ie from more or less lower-paid workers being employed in the relevant year) plus all (or most) of the bonuses and incentives from those under award or collective agreements end up in the individual arrangements residual, which distorts the pay increases in this segment. However, the methodology works well for the LPI, particularly at the all industries level, although some compositional problems occur at the sectoral level, particularly for sectors with a relatively small employment base (such as electricity, gas and water supply).
Some Deficiencies in Econometric Models of Wage Determination for the EGW Sector
We believe that BIS Shrapnel’s institution-based wage model for the EGW sector better approximates the underlying (actual) data generating process than a straight application of an econometric model. As a result, we strongly believe our model of wage determination for the EGW or utilities sector is superior to methodology utilising purely econometric regression techniques, in particular linear regression models to forecast wages. This opinion is based on a number of factors, some of which are described below:
the evolution of the wage determination system from the 1980s and particularly during the 1990s in the utilities sector means that econometric equations struggle with the changes in the relative importance of different factors influencing wages growth that have occurred over the past two-to-three decades. As such, we believe that an econometric equation would struggle to properly model the present complexity of the wage determination processes in this sector.
BIS Shrapnel’s model of wage determination does take account of the present complexity of the wage determination process, both at the national (all industries) level and at the industry sector level. Our methodology and explanation of the macroeconomic influences are, we believe, clear and transparent. We use small sector mathematical models to derive forecasts for discrete segments, rather than an over-riding, overall macroeconomic model.
BIS Shrapnel believes the use of univariate or multi-equation time series econometric modelling is not the best method for forecasting wages growth in the utilities sector. This is because many regression equations include lagged dependent variables, and econometric models that include lagged dependant variables tend to miss turning points in the cycle, often producing results we know to be spurious. Indeed, the models performed no better (or worse) than a combination of a large range of ‘mini’ sectoral models and our expertise and knowledge of key influences.


Real Labour Cost Escalation Forecasts to 2017, October 2012 APA Group
© BIS Shrapnel Pty Limited 2012 A–5
APPENDIX B: TERMS OF REFERENCE

Real Labour Cost Escalation Forecasts to 2020, September 2012 APA Group
A–6 © BIS Shrapnel Pty Limited 2012

APA Group Real Labour Cost Escalation Forecasts to 2020, September 2012
© BIS Shrapnel Pty Limited 2012 A–7

Real Labour Cost Escalation Forecasts to 2020, September 2012 APA Group
A–8 © BIS Shrapnel Pty Limited 2012
APA Group Real Labour Cost Escalation Forecasts to 2020, September 2012
© BIS Shrapnel Pty Limited 2012 A–9


APA Group Real Labour Cost Escalation Forecasts to 2017, October 2012
© BIS Shrapnel Pty Limited 2012 A–11
APPENDIX C: STATEMENT OF COMPLIANCE WITH EXPERT WITNESS GUIDELINES
I have read the Guidelines for Expert Witnesses in Proceedings of the Federal Court of Australia and confirm that I have made all inquiries that I believe are desirable and appropriate and that no matters of significance that I regard as relevant have, to my knowledge, been withheld from the Court.

APA Group Real Labour Cost Escalation Forecasts to 2017, October 2012
© BIS Shrapnel Pty Limited 2012 A–13
APPENDIX D: CURRICULUM VITAES OF KEY PERSONNEL
Richard Robinson, B.Comm (Hons), Senior Economist Associate Director - Economics
Richard Robinson has been employed with BIS Shrapnel since 1986.
Richard is the company's principal economic forecaster, being largely responsible for the short term economic forecasts presented at BIS Shrapnel's half yearly conferences in March and September. He contributes forecasts and analysis to the regular subscription services, Economic Outlook and Long Term Forecasts.
Richard regularly analyses and forecasts resources investment and civil engineering construction activity, and production of manufactures, consumer goods and commodities. In this work, he has developed considerable industry expertise in the construction, manufacturing, agriculture, services, commodity and resources sectors of the Australian and state economies.
Richard has also been involved in a wide range of consultancy and private client projects including formulating end-use sector demand models for forecasting product demand, project evaluation studies, cost-benefit analysis, assessments of individual property markets and analysing the consistency of escalators in contracts. Some other projects have included analysing and forecasting freight tonnages; a study of the repair and maintenance market; the preparation of economic arguments for the National Wage Case for a private industry group; regular analysis and detailed short and long term forecasts of economic variables in a number of overseas countries; and contributing discussion papers to CEDA (Committee for Economic Development of Australia).
Kishti Sen, B.A., M.Ec. (Hons), Ph.D. Economist
Kishti works across both the Economics and Infrastructure and Mining units. He has prepared numerous cost escalation reports for electricity, gas & water utilities, mining companies and railway operators across Australia. Kishti has also undertaken analysis of inflation and wage trends at the state level for reports required in state wage cases, and provided a discussion of state economic trends.
Kishti holds a PhD in Economics from the University of Sydney and Bachelors Degree in Economics and Mathematics from Massey University. Kishti has special interest in cost escalation studies, benefit-cost assessment and econometric modelling.
Catherine Birch, B.Com Research Assistant
Catherine joined BIS Shrapnel after graduating from Deakin University with high distinction. She works across both the Economics and the Infrastructure and Mining divisions. Catherine regularly contributes to the monthly Economic Outlook and has also contributed to the Mining and Heavy Industry Construction in Australia and Maintenance in Australia reports.


APA Group Real Labour Cost Escalation Forecasts to 2017, October 2012
© BIS Shrapnel Pty Limited 2012 A–15
APPENDIX E: LIST OF ABS & OTHER DATA SOURCES
The ABS data and other information sources used in the preparation of this document and the forecasts contained within are listed below. Separate files containing this information will be attached.
ABS Data
Australian Industry 81550_2009-10.pdf AWE 63020_May 2012.pdf BOP 5302.0 June 2012.pdf BA 87520_Jun 2012.pdf CAPEX 56250_June 2012.pdf CPI 64010_June 2012.pdf ECA 87620_Jun 2012.pdf EEAH 63060_May 2010.pdf Labour Force 62020_May 2012.pdf LPI 63450_June 2012.pdf Labour Force 6291.0.55.003 May 2012.pdf National Accounts 52060_June 2012.pdf State National Accounts 52200_2010-11.pdf Internation Trade in goods and Services 5368.0_July 2012.pdf
AER/DAE Documents
Draft Decision – Powerlink Revenue Proposal.pdf Final Decision – Powerlink Revenue Proposal.pdf Draft Decision – Roma to Brisbane Pipeline.pdf ActewAGL’s Regulatory Proposal.pdf Envestra Draft Decision –Qld.pdf Ergon Energy’s Regulatory Proposal 2010-15.pdf Powerlink Revenue Proposal.pdf Envestra Final Decision.pdf BIS Shrapnel Documents – Strictly Confidential
BIA Report – 2012-2027.pdf RPP 2012-2015 Report.pdf ECA 2011/12-2025/26 Report.pdf EO Bulletin Sepetmber 2012.pdf LTF 2012-2027 Report.pdf
Other Documents
Clarius Skills Index June 2012 Quarter.pdf DEEWR Skills Shortage List_Australia June 2012.pdf DEEWR Skills Shortage List_Victoria June 2012.pdf DEEWR TrendsM12.pdf RBA August 2012 Statement on Monetary Policy.pdf BITRE – Sea Freight 2010-11.pdf


