Embed Size (px)
Citation preview
International Journal of
Molecular Sciences
Article
Supplementation with Lactiplantibacillus plantarum IMC 510Modifies Microbiota Composition and Prevents Body WeightGain Induced by Cafeteria Diet in Rats
Maria Vittoria Micioni Di Bonaventura 1,† , Maria Magdalena Coman 2,†, Daniele Tomassoni 3 ,Emanuela Micioni Di Bonaventura 1 , Luca Botticelli 1 , Maria Gabriella Gabrielli 3, Gian Maria Rossolini 4,5,Vincenzo Di Pilato 6 , Cinzia Cecchini 2, Amedeo Amedei 4 , Stefania Silvi 3,*,‡ , Maria Cristina Verdenelli 2,‡
and Carlo Cifani 1,‡
�����������������
Citation: Micioni Di Bonaventura,
M.V.; Coman, M.M.; Tomassoni, D.;
Micioni Di Bonaventura, E.; Botticelli,
L.; Gabrielli, M.G.; Rossolini, G.M.; Di
Pilato, V.; Cecchini, C.; Amedei, A.;
et al. Supplementation with
Lactiplantibacillus plantarum IMC 510
Modifies Microbiota Composition
and Prevents Body Weight Gain
Induced by Cafeteria Diet in Rats. Int.
J. Mol. Sci. 2021, 22, 11171. https://
doi.org/10.3390/ijms222011171
Academic Editor: Giuseppe Esposito
Received: 30 August 2021
Accepted: 12 October 2021
Published: 16 October 2021
Publisher’s Note: MDPI stays neutral
with regard to jurisdictional claims in
published maps and institutional affil-
iations.
Copyright: © 2021 by the authors.
Licensee MDPI, Basel, Switzerland.
This article is an open access article
distributed under the terms and
conditions of the Creative Commons
Attribution (CC BY) license (https://
creativecommons.org/licenses/by/
4.0/).
1 Pharmacology Unit, School of Pharmacy, University of Camerino, 62032 Camerino, Italy;[email protected] (M.V.M.D.B.); [email protected] (E.M.D.B.);[email protected] (L.B.); [email protected] (C.C.)
2 Synbiotec S.r.l., Spin-off of UNICAM, Via Gentile III Da Varano, 62032 Camerino, Italy;[email protected] (M.M.C.); [email protected] (C.C.); [email protected] (M.C.V.)
3 School of Biosciences and Veterinary Medicine, University of Camerino, 62032 Camerino, Italy;[email protected] (D.T.); [email protected] (M.G.G.)
4 Department of Experimental and Clinical Medicine, University of Florence, 50134 Florence, Italy;[email protected] (G.M.R.); [email protected] (A.A.)
5 Microbiology and Virology Unit, Florence Careggi University Hospital, 50134 Florence, Italy6 Department of Surgical Sciences and Integrated Diagnostics, University of Genoa, 16132 Genova, Italy;
[email protected]* Correspondence: [email protected]† These authors contributed equally to this work.‡ Equally senior authors.
Abstract: Changes in functionality and composition of gut microbiota (GM) have been associated andmay contribute to the development and maintenance of obesity and related diseases. The aim of ourstudy was to investigate for the first time the impact of Lactiplantibacillus (L.) plantarum IMC 510 in arat model of diet-induced obesity, specifically in the cafeteria (CAF) diet. This diet provides a strongmotivation to voluntary overeat, due to the palatability and variety of selected energy-dense foods.The oral administration for 84 days of this probiotic strain, added to the CAF diet, decreased foodintake and body weight gain. Accordingly, it ameliorated body mass index, liver and white adiposetissue weight, hepatic lipid accumulation, adipocyte size, serum parameters, including glycemia andlow-density lipoprotein levels, in CAF fed rats, potentially through leptin control. In this scenario,L. plantarum IMC 510 showed also beneficial effects on GM, limiting the microbial imbalance estab-lished by long exposure to CAF diet and preserving the proportion of different bacterial taxa. Furtherresearch is necessary to better elucidate the relationship between GM and overweight and then themechanism of action by which L. plantarum IMC 510 modifies weight. However, these promisingresults prompt a clear advantage of probiotic supplementation and identify a new potential probioticas a novel and safe therapeutic approach in obesity prevention and management.
Keywords: microbiota; 16S; obesity; cafeteria (CAF) diet; Lactiplantibacillus (L.) plantarum IMC 510;leptin; body weight; food intake
1. Introduction
Obesity is a pandemic chronic disease associated with different co-morbidities, in-cluding diabetes, cardiovascular diseases, dyslipidemia and cancer [1], that is constantlyexpanding due to the westernization of diet and lifestyle [2,3]. A recent systematic study [4]indicated that obesity prevalence was doubled since 1980 in more than 70 countries, withapproximately 107 million children and 603 million adults obese in 2015. According to the
Int. J. Mol. Sci. 2021, 22, 11171. https://doi.org/10.3390/ijms222011171 https://www.mdpi.com/journal/ijms
Int. J. Mol. Sci. 2021, 22, 11171 2 of 24
World Health Organization (WHO), obese subjects are those with a body mass index (BMI)higher or equal to the value 30 [5].
Obesity and related metabolic disturbances are related to changes of appetite modu-lators, including leptin [6], that might contribute to the dysregulation of food intake and,consequently, fat accumulation and energy homeostasis [7–11], resulting from the imbal-ance between excessive caloric intake compared to energy expenditure. In addition, otherconditions may contribute to body weight gain, including genetic, epigenetic, metabolic,behavioral, environmental and cultural influences, as summarized in different reviews(i.e., [12–16]). Several promising approaches have been proposed for obesity treatment [17]:pharmacotherapy [18], bariatric surgery [19] and lifestyle modifications [20], but unfor-tunately limited weight loss was observed in the majority of the patients, particularly inchildren [21]. Thus, the etiology, the development and the management of obesity are reallycomplex and multifactorial. Currently, an increasing interest has been reserved to the gutmicrobiota (GM), primarily on how its alterations could be involved in the vulnerabilityof this widespread disease [22,23] and the possibility of using probiotics as a potentialtherapeutic tool for weight control [24,25]. Many studies reported the successful use ofprobiotics, like Lactobacillus, Bifidobacterium and Akkermansia, to mitigate several metabolicdisorders such as overweight, obesity, type 2 diabetes, hypertension and hypercholes-terolemia [26–28]. To date, gut microorganisms showed the ability to decrease body weight,leptin levels, abdominal and epididymal fat volume, to down-regulate lipogenic genes andeven to counteract Enterobacter-induced obesity (Enterobacter cloacae B29) and further, torestore the beneficial proportion of different bacterial taxa [29–34]. Interestingly, Ley andcollaborators observed alterations in the distal intestinal microbiota of genetically obesemice compared to lean and wild-type siblings, presenting a major epididymal fat-pad massto total body mass, with a specific significant increase in Firmicutes and a 50% reduction inBacteroidetes [35]. As in humans, the two most detected bacterial phyla in rodents are theFirmicutes and the Bacteroidetes, characterized by a high ratio of Bacteroidetes to Firmicutesin normal-weight animals, while the opposite condition is found after obesity develop-ment [30,35,36]. However, the GM is densely populated by numerous microorganisms andits composition might be affected by several factors [37,38]. A comparison between obeseand control subjects, regarding the abundance of Lactobacillus species, revealed higherlevels of Lactobacillus paracasei and Lactobacillus plantarum in the latters, while Lactobacillusreuteri was highly represented in the obese subjects [39]. Overall, these findings highlightthe pivotal role that several microorganisms may have in shaping gut homeostasis andhow dietary intake can influence the composition of the microbiota.
For instance, the consumption of highly caloric and nutritionally poor foods has notonly an impact on GM but also on leptin resistance [40,41]. This leads to a long-termloss of bacterial functions and mediates epigenetic changes in metabolic activities dueto the Western diet, characterized by ultra-processed palatable caloric dense foods andsucrose-containing soft drinks [42–45].
Altogether, this knowledge prompts the research to better explore benefits for thehealth of the host, especially focusing on various species and strains of Lactobacilli.
The aim of our study was to investigate, for the first time, the effect of 12-weeksupplementation with the Lactiplantibacillus (L.) plantarum IMC 510 in rats fed with cafeteria(CAF) diet compared to rats fed with standard food (CHOW diet). To address this issue,the composition of the GM was determined and compared to other factors, in order toevaluate how the CAF diet, with or without oral supplementation of the probiotic, affectsbody weight, food intake, leptin level, adipose tissue, liver and blood parameters.
This strong diet-induced obesity was chosen for its ability to promote weight gain [46,47]and the greater dysbiosis in rodents [48], providing ad libitum energy-dense human foods,similar to Western dietary habits [47,49]. The variety of food items includes appetible andcalorically fat items that progressively lead to a higher motivation to overconsume them, andconsequently facilitate an obesity state.
Int. J. Mol. Sci. 2021, 22, 11171 3 of 24
The strain L. plantarum IMC 510 has been isolated and characterized for its probioticproperties by Synbiotec Srl (Camerino, Italy) [50–52].
2. Results2.1. Effects of L. plantarum IMC 510-Dietary Supplementation on Body Weight andFeeding Consumption
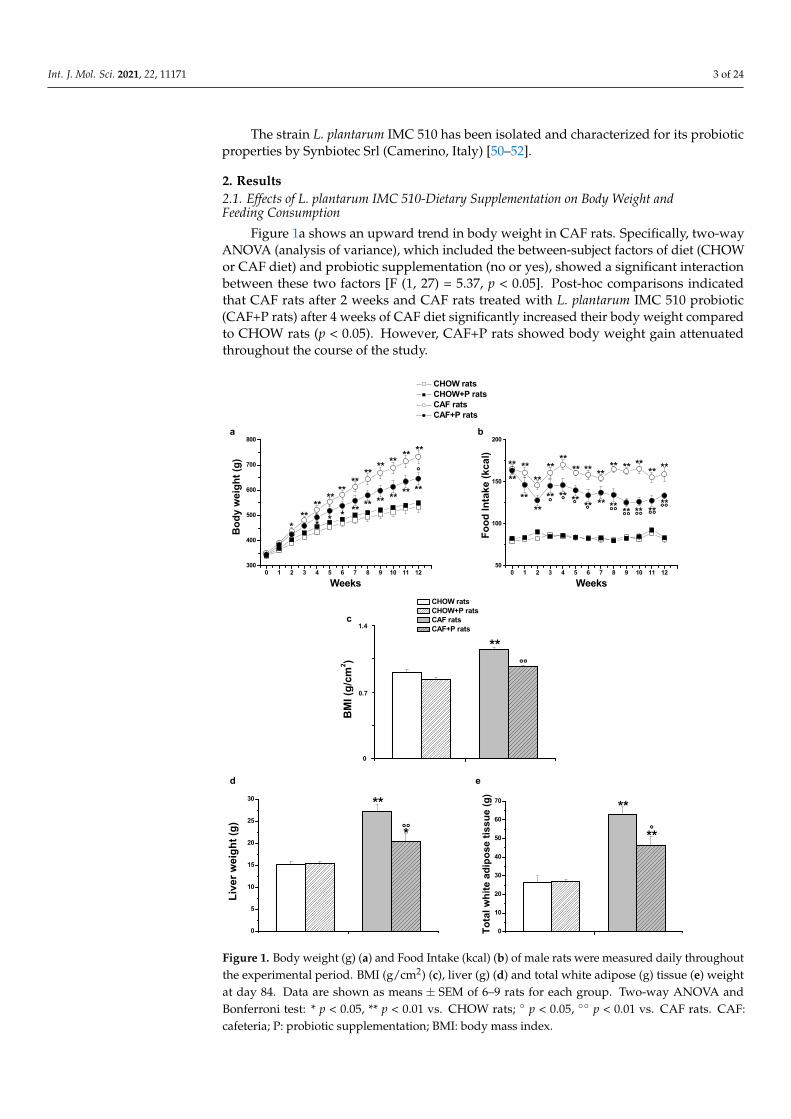
Figure 1a shows an upward trend in body weight in CAF rats. Specifically, two-wayANOVA (analysis of variance), which included the between-subject factors of diet (CHOWor CAF diet) and probiotic supplementation (no or yes), showed a significant interactionbetween these two factors [F (1, 27) = 5.37, p < 0.05]. Post-hoc comparisons indicatedthat CAF rats after 2 weeks and CAF rats treated with L. plantarum IMC 510 probiotic(CAF+P rats) after 4 weeks of CAF diet significantly increased their body weight comparedto CHOW rats (p < 0.05). However, CAF+P rats showed body weight gain attenuatedthroughout the course of the study.
Int. J. Mol. Sci. 2021, 22, x FOR PEER REVIEW 4 of 24
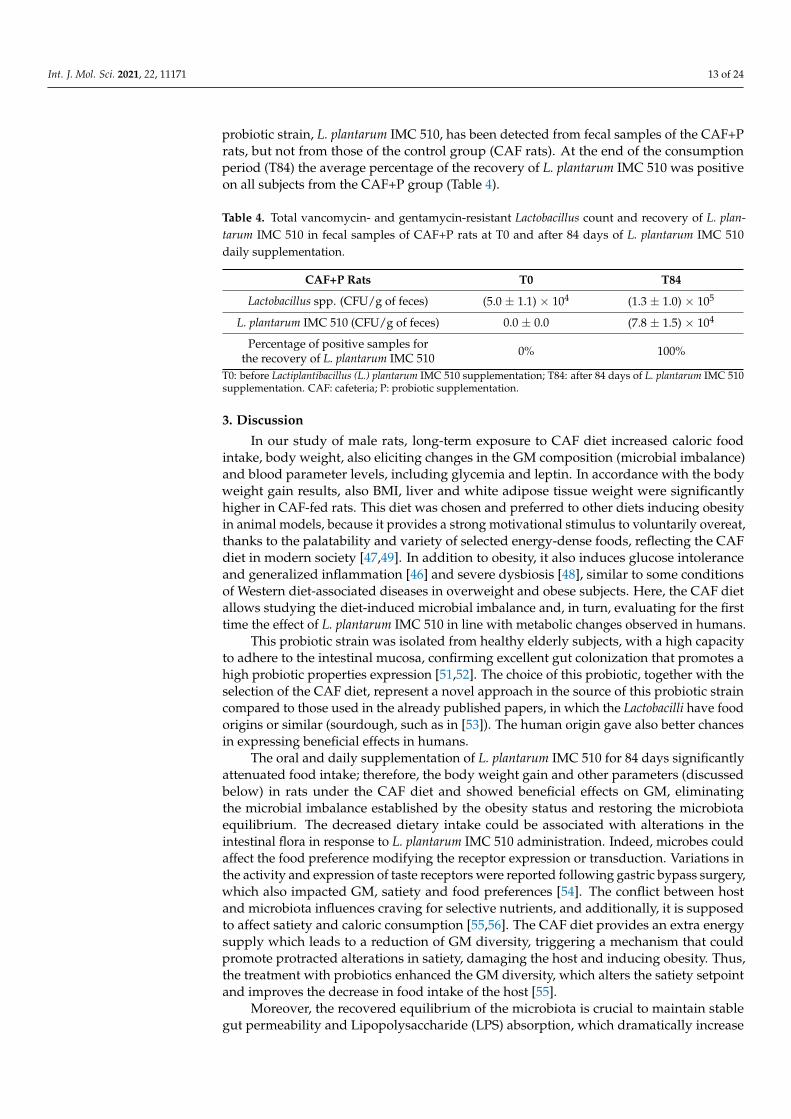
Figure 1. Body weight (g) (a) and Food Intake (kcal) (b) of male rats were measured daily throughout the experimental period. BMI (g/cm2) (c), liver (g) (d) and total white adipose (g) tissue (e) weight at day 84. Data are shown as means ± SEM of 6–9 rats for each group. Two-way ANOVA and Bonferroni test: * p < 0.05, ** p < 0.01 vs. CHOW rats; ° p < 0.05, °° p < 0.01 vs. CAF rats. CAF: cafeteria; P: probiotic supplementation; BMI: body mass index.
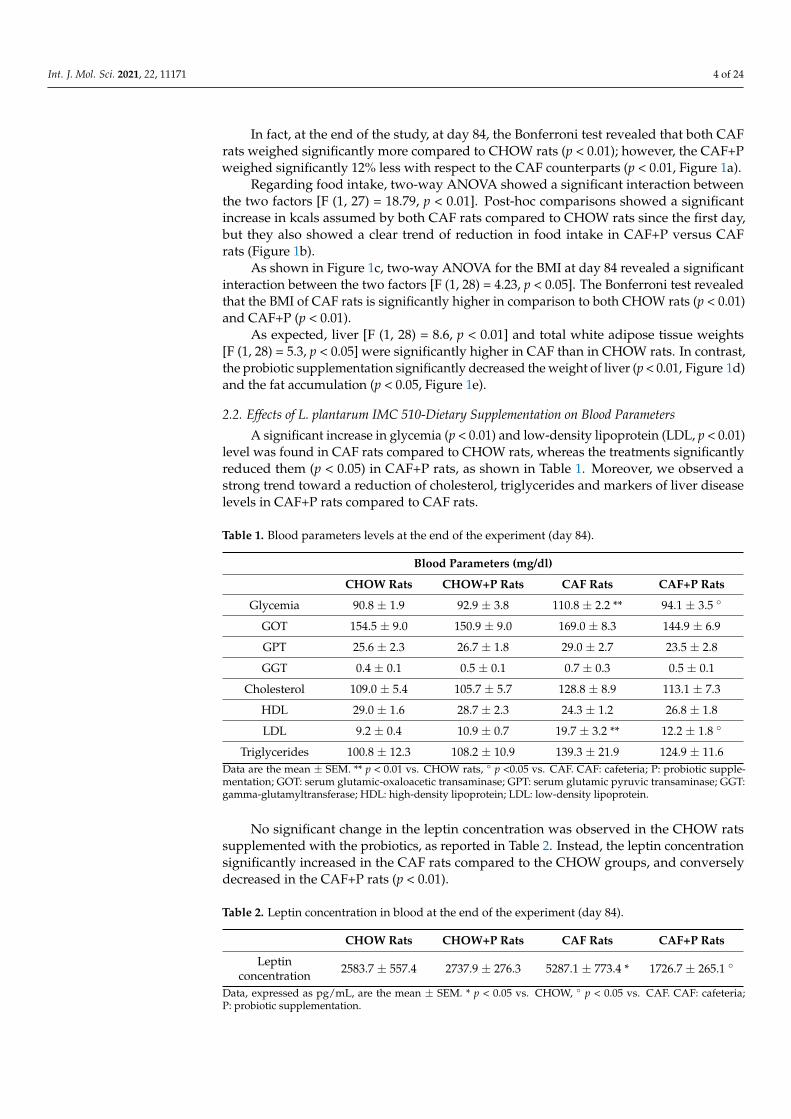
2.2. Effects of L. plantarum IMC 510-Dietary Supplementation on Blood Parameters A significant increase in glycemia (p < 0.01) and low-density lipoprotein (LDL, p <
0.01) level was found in CAF rats compared to CHOW rats, whereas the treatments significantly reduced them (p < 0.05) in CAF+P rats, as shown in Table 1. Moreover, we observed a strong trend toward a reduction of cholesterol, triglycerides and markers of liver disease levels in CAF+P rats compared to CAF rats.
Table 1. Blood parameters levels at the end of the experiment (day 84).
Blood Parameters (mg/dl) CHOW Rats CHOW+P Rats CAF Rats CAF+P Rats
c
b
10,0
0,7
1,4
°°**
BM
I (g/
cm2 )
CHOW rats CHOW+P rats CAF rats CAF+P rats
0 1 2 3 4 5 6 7 8 9 10 11 1250
100
150
200
********************
****
**
°°°°°°°°° °°°°
********
Food
Inta
ke (k
cal)
****** **
****
******
Weeks
°
0 1 2 3 4 5 6 7 8 9 10 11 12300
400
500
600
700
800
*********** * **
*
****** **
****
****
**
**
Weeks
B
ody
wei
ght (
g)
*
°
a
CHOW rats CHOW+P rats CAF rats CAF+P rats
d e
10
5
10
15
20
25
30
*°°**
Live
r wei
ght (
g)
10
10
20
30
40
50
60
70
**°**
Tota
l whi
te a
dipo
se ti
ssue
(g)
0.7
0
1.4
Figure 1. Body weight (g) (a) and Food Intake (kcal) (b) of male rats were measured daily throughoutthe experimental period. BMI (g/cm2) (c), liver (g) (d) and total white adipose (g) tissue (e) weightat day 84. Data are shown as means ± SEM of 6–9 rats for each group. Two-way ANOVA andBonferroni test: * p < 0.05, ** p < 0.01 vs. CHOW rats; ◦ p < 0.05, ◦◦ p < 0.01 vs. CAF rats. CAF:cafeteria; P: probiotic supplementation; BMI: body mass index.
Int. J. Mol. Sci. 2021, 22, 11171 4 of 24
In fact, at the end of the study, at day 84, the Bonferroni test revealed that both CAFrats weighed significantly more compared to CHOW rats (p < 0.01); however, the CAF+Pweighed significantly 12% less with respect to the CAF counterparts (p < 0.01, Figure 1a).
Regarding food intake, two-way ANOVA showed a significant interaction betweenthe two factors [F (1, 27) = 18.79, p < 0.01]. Post-hoc comparisons showed a significantincrease in kcals assumed by both CAF rats compared to CHOW rats since the first day,but they also showed a clear trend of reduction in food intake in CAF+P versus CAFrats (Figure 1b).
As shown in Figure 1c, two-way ANOVA for the BMI at day 84 revealed a significantinteraction between the two factors [F (1, 28) = 4.23, p < 0.05]. The Bonferroni test revealedthat the BMI of CAF rats is significantly higher in comparison to both CHOW rats (p < 0.01)and CAF+P (p < 0.01).
As expected, liver [F (1, 28) = 8.6, p < 0.01] and total white adipose tissue weights[F (1, 28) = 5.3, p < 0.05] were significantly higher in CAF than in CHOW rats. In contrast,the probiotic supplementation significantly decreased the weight of liver (p < 0.01, Figure 1d)and the fat accumulation (p < 0.05, Figure 1e).
2.2. Effects of L. plantarum IMC 510-Dietary Supplementation on Blood Parameters
A significant increase in glycemia (p < 0.01) and low-density lipoprotein (LDL, p < 0.01)level was found in CAF rats compared to CHOW rats, whereas the treatments significantlyreduced them (p < 0.05) in CAF+P rats, as shown in Table 1. Moreover, we observed astrong trend toward a reduction of cholesterol, triglycerides and markers of liver diseaselevels in CAF+P rats compared to CAF rats.
Table 1. Blood parameters levels at the end of the experiment (day 84).
Blood Parameters (mg/dl)
CHOW Rats CHOW+P Rats CAF Rats CAF+P Rats
Glycemia 90.8 ± 1.9 92.9 ± 3.8 110.8 ± 2.2 ** 94.1 ± 3.5 ◦
GOT 154.5 ± 9.0 150.9 ± 9.0 169.0 ± 8.3 144.9 ± 6.9
GPT 25.6 ± 2.3 26.7 ± 1.8 29.0 ± 2.7 23.5 ± 2.8
GGT 0.4 ± 0.1 0.5 ± 0.1 0.7 ± 0.3 0.5 ± 0.1
Cholesterol 109.0 ± 5.4 105.7 ± 5.7 128.8 ± 8.9 113.1 ± 7.3
HDL 29.0 ± 1.6 28.7 ± 2.3 24.3 ± 1.2 26.8 ± 1.8
LDL 9.2 ± 0.4 10.9 ± 0.7 19.7 ± 3.2 ** 12.2 ± 1.8 ◦
Triglycerides 100.8 ± 12.3 108.2 ± 10.9 139.3 ± 21.9 124.9 ± 11.6Data are the mean ± SEM. ** p < 0.01 vs. CHOW rats, ◦ p <0.05 vs. CAF. CAF: cafeteria; P: probiotic supple-mentation; GOT: serum glutamic-oxaloacetic transaminase; GPT: serum glutamic pyruvic transaminase; GGT:gamma-glutamyltransferase; HDL: high-density lipoprotein; LDL: low-density lipoprotein.
No significant change in the leptin concentration was observed in the CHOW ratssupplemented with the probiotics, as reported in Table 2. Instead, the leptin concentrationsignificantly increased in the CAF rats compared to the CHOW groups, and converselydecreased in the CAF+P rats (p < 0.01).
Table 2. Leptin concentration in blood at the end of the experiment (day 84).
CHOW Rats CHOW+P Rats CAF Rats CAF+P Rats
Leptinconcentration 2583.7 ± 557.4 2737.9 ± 276.3 5287.1 ± 773.4 * 1726.7 ± 265.1 ◦
Data, expressed as pg/mL, are the mean ± SEM. * p < 0.05 vs. CHOW, ◦ p < 0.05 vs. CAF. CAF: cafeteria;P: probiotic supplementation.
Int. J. Mol. Sci. 2021, 22, 11171 5 of 24
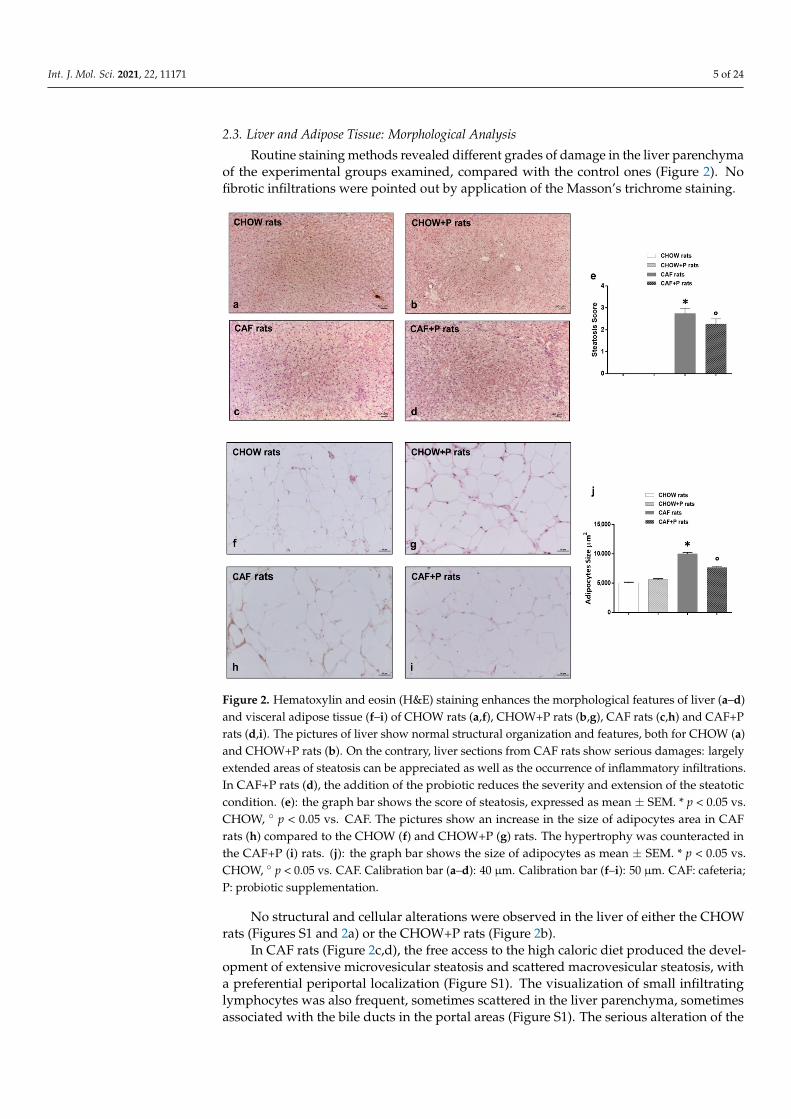
2.3. Liver and Adipose Tissue: Morphological Analysis
Routine staining methods revealed different grades of damage in the liver parenchymaof the experimental groups examined, compared with the control ones (Figure 2). Nofibrotic infiltrations were pointed out by application of the Masson’s trichrome staining.
Int. J. Mol. Sci. 2021, 22, x FOR PEER REVIEW 6 of 24
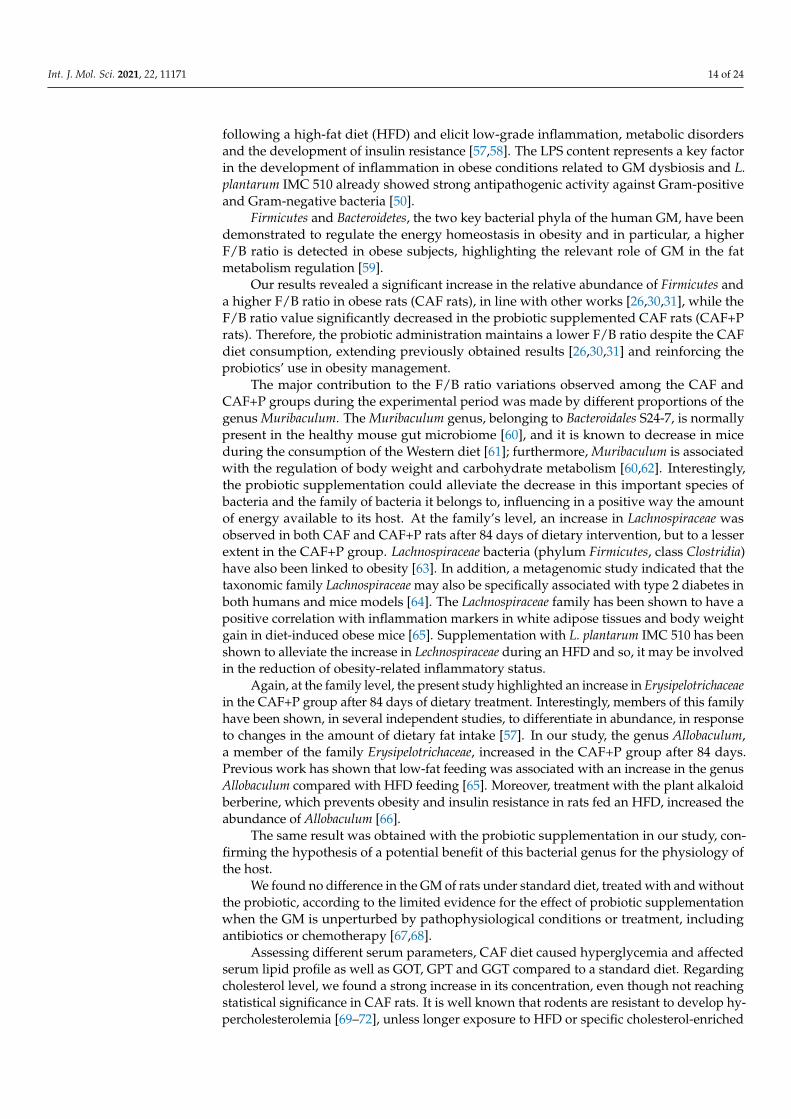
Figure 2. Hematoxylin and eosin (H&E) staining enhances the morphological features of liver (a–d) and visceral adipose tissue (f–i) of CHOW rats (a,f), CHOW+P rats (b,g), CAF rats (c,h) and CAF+P rats (d,i). The pictures of liver show normal structural organization and features, both for CHOW (a) and CHOW+P rats (b). On the contrary, liver sections from CAF rats show serious damages: largely extended areas of steatosis can be appreciated as well as the occurrence of inflammatory infiltrations. In CAF+P rats (d), the addition of the probiotic reduces the severity and extension of the steatotic condition. (e): the graph bar shows the score of steatosis, expressed as mean ± SEM. * p < 0.05 vs. CHOW, ° p < 0.05 vs. CAF. The pictures show an increase in the size of adipocytes area in CAF rats (h) compared to the CHOW (f) and CHOW+P (g) rats. The hypertrophy was counteracted in the CAF+P (i) rats. (j): the graph bar shows the size of adipocytes as mean ± SEM. * p < 0.05 vs. CHOW, ° p < 0.05 vs. CAF. Calibration bar (a–d): 40 µm. Calibration bar (f–i): 50 µm. CAF: cafeteria; P: probiotic supplementation.
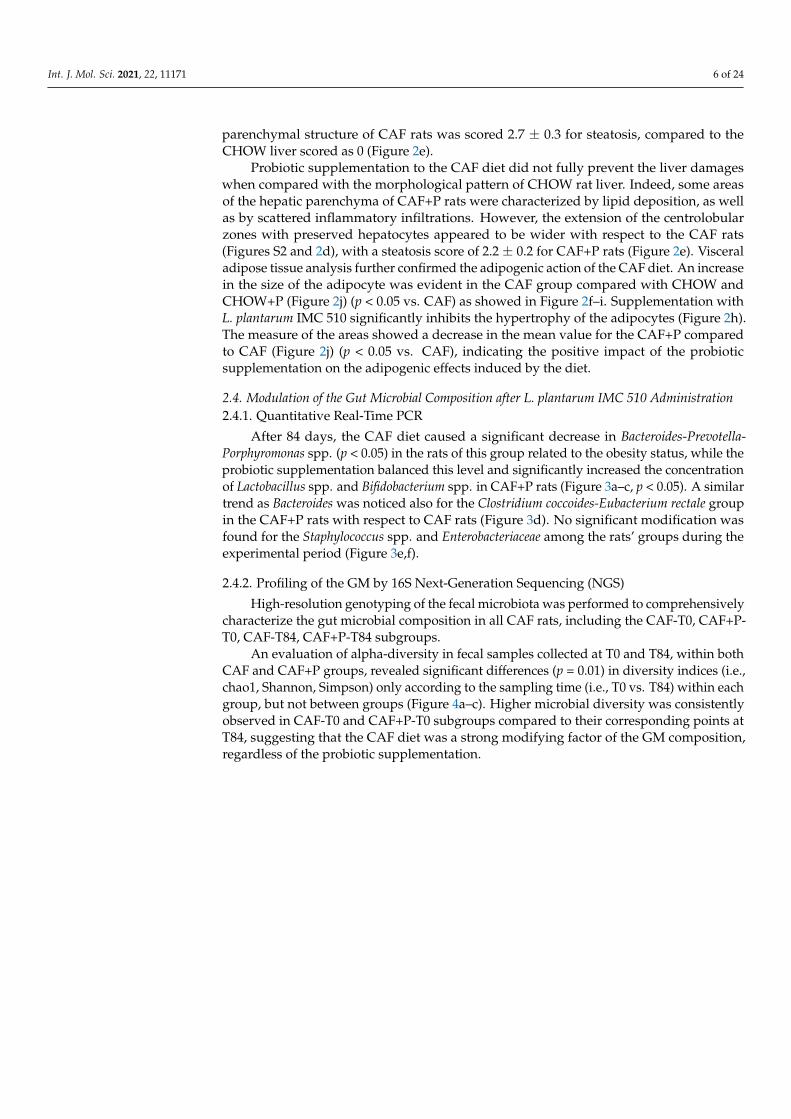
2.4. Modulation of the Gut Microbial Composition after L. plantarum IMC 510 Administration 2.4.1. Quantitative Real-Time PCR
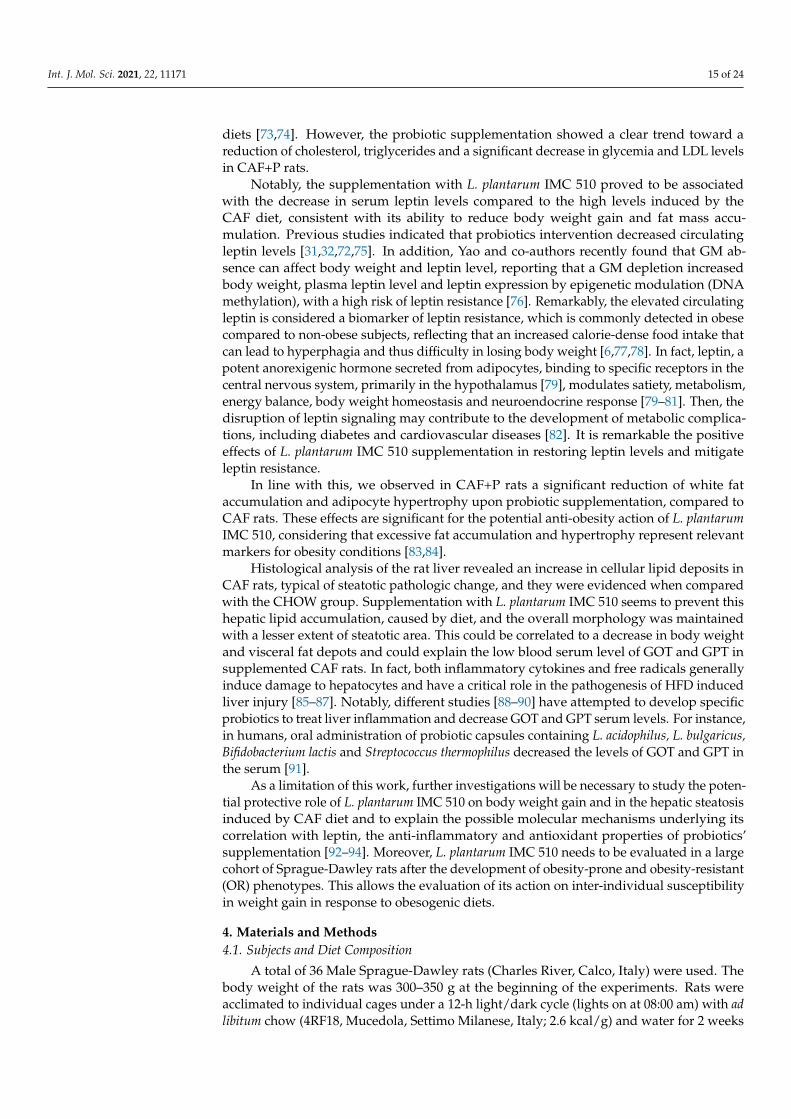
After 84 days, the CAF diet caused a significant decrease in Bacteroides-Prevotella-Porphyromonas spp. (p < 0.05) in the rats of this group related to the obesity status, while the probiotic supplementation balanced this level and significantly increased the concentration of Lactobacillus spp. and Bifidobacterium spp. in CAF+P rats (Figure 3a–c, p < 0.05). A similar trend as Bacteroides was noticed also for the Clostridium coccoides-Eubacterium rectale group in the CAF+P rats with respect to CAF rats (Figure 3d). No significant modification was found for the Staphylococcus spp. and Enterobacteriaceae among the rats’ groups during the experimental period (Figure 3e,f).
Figure 2. Hematoxylin and eosin (H&E) staining enhances the morphological features of liver (a–d)and visceral adipose tissue (f–i) of CHOW rats (a,f), CHOW+P rats (b,g), CAF rats (c,h) and CAF+Prats (d,i). The pictures of liver show normal structural organization and features, both for CHOW (a)and CHOW+P rats (b). On the contrary, liver sections from CAF rats show serious damages: largelyextended areas of steatosis can be appreciated as well as the occurrence of inflammatory infiltrations.In CAF+P rats (d), the addition of the probiotic reduces the severity and extension of the steatoticcondition. (e): the graph bar shows the score of steatosis, expressed as mean ± SEM. * p < 0.05 vs.CHOW, ◦ p < 0.05 vs. CAF. The pictures show an increase in the size of adipocytes area in CAFrats (h) compared to the CHOW (f) and CHOW+P (g) rats. The hypertrophy was counteracted inthe CAF+P (i) rats. (j): the graph bar shows the size of adipocytes as mean ± SEM. * p < 0.05 vs.CHOW, ◦ p < 0.05 vs. CAF. Calibration bar (a–d): 40 µm. Calibration bar (f–i): 50 µm. CAF: cafeteria;P: probiotic supplementation.
No structural and cellular alterations were observed in the liver of either the CHOWrats (Figures S1 and 2a) or the CHOW+P rats (Figure 2b).
In CAF rats (Figure 2c,d), the free access to the high caloric diet produced the devel-opment of extensive microvesicular steatosis and scattered macrovesicular steatosis, witha preferential periportal localization (Figure S1). The visualization of small infiltratinglymphocytes was also frequent, sometimes scattered in the liver parenchyma, sometimesassociated with the bile ducts in the portal areas (Figure S1). The serious alteration of the
Int. J. Mol. Sci. 2021, 22, 11171 6 of 24
parenchymal structure of CAF rats was scored 2.7 ± 0.3 for steatosis, compared to theCHOW liver scored as 0 (Figure 2e).
Probiotic supplementation to the CAF diet did not fully prevent the liver damageswhen compared with the morphological pattern of CHOW rat liver. Indeed, some areasof the hepatic parenchyma of CAF+P rats were characterized by lipid deposition, as wellas by scattered inflammatory infiltrations. However, the extension of the centrolobularzones with preserved hepatocytes appeared to be wider with respect to the CAF rats(Figures S2 and 2d), with a steatosis score of 2.2 ± 0.2 for CAF+P rats (Figure 2e). Visceraladipose tissue analysis further confirmed the adipogenic action of the CAF diet. An increasein the size of the adipocyte was evident in the CAF group compared with CHOW andCHOW+P (Figure 2j) (p < 0.05 vs. CAF) as showed in Figure 2f–i. Supplementation withL. plantarum IMC 510 significantly inhibits the hypertrophy of the adipocytes (Figure 2h).The measure of the areas showed a decrease in the mean value for the CAF+P comparedto CAF (Figure 2j) (p < 0.05 vs. CAF), indicating the positive impact of the probioticsupplementation on the adipogenic effects induced by the diet.
2.4. Modulation of the Gut Microbial Composition after L. plantarum IMC 510 Administration2.4.1. Quantitative Real-Time PCR
After 84 days, the CAF diet caused a significant decrease in Bacteroides-Prevotella-Porphyromonas spp. (p < 0.05) in the rats of this group related to the obesity status, while theprobiotic supplementation balanced this level and significantly increased the concentrationof Lactobacillus spp. and Bifidobacterium spp. in CAF+P rats (Figure 3a–c, p < 0.05). A similartrend as Bacteroides was noticed also for the Clostridium coccoides-Eubacterium rectale groupin the CAF+P rats with respect to CAF rats (Figure 3d). No significant modification wasfound for the Staphylococcus spp. and Enterobacteriaceae among the rats’ groups during theexperimental period (Figure 3e,f).
2.4.2. Profiling of the GM by 16S Next-Generation Sequencing (NGS)
High-resolution genotyping of the fecal microbiota was performed to comprehensivelycharacterize the gut microbial composition in all CAF rats, including the CAF-T0, CAF+P-T0, CAF-T84, CAF+P-T84 subgroups.
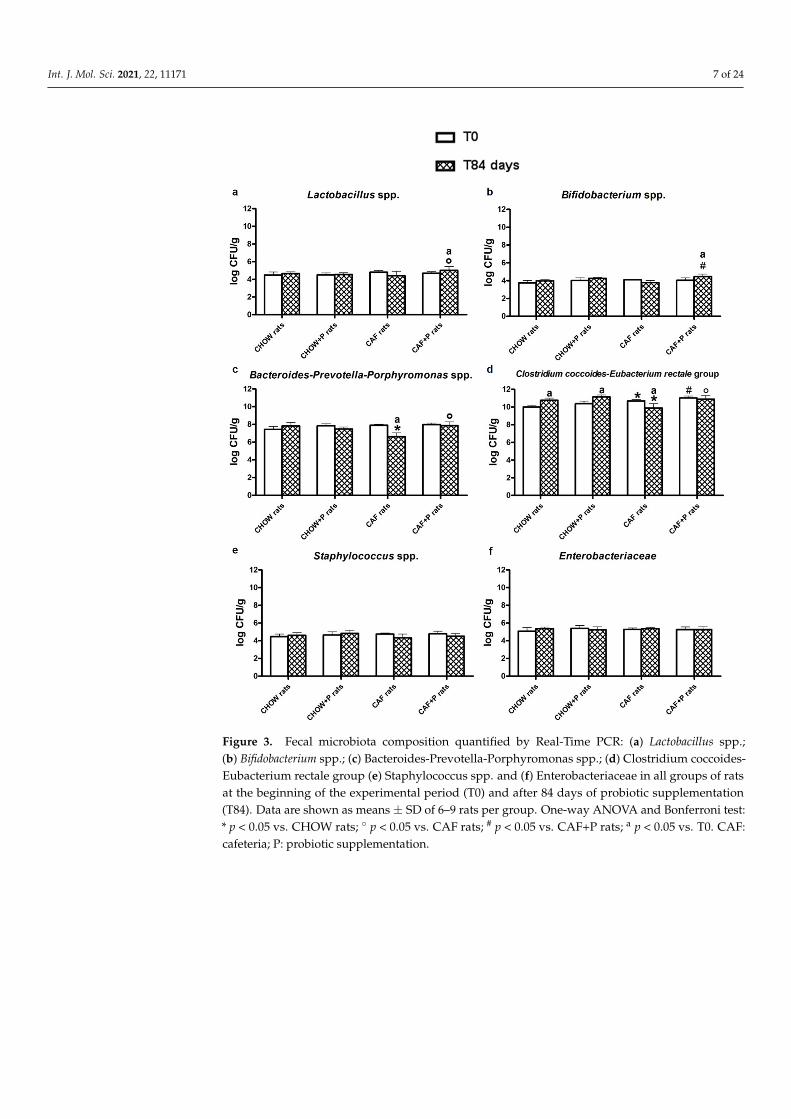
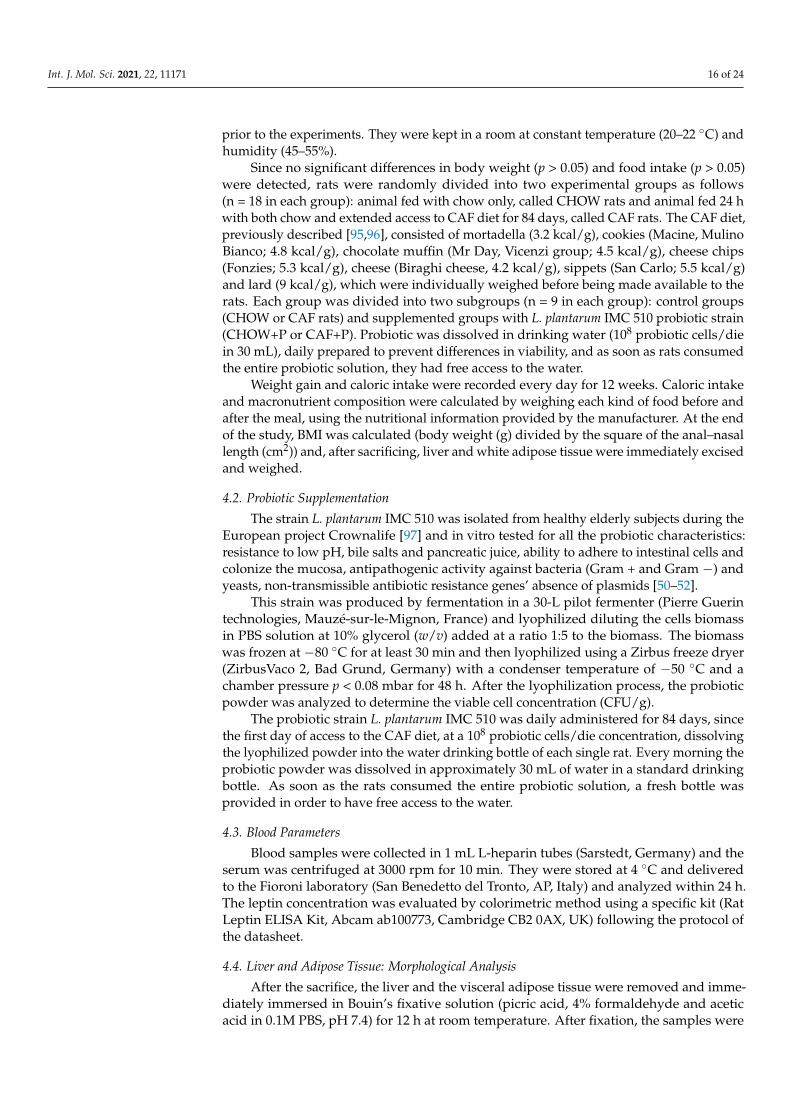
An evaluation of alpha-diversity in fecal samples collected at T0 and T84, within bothCAF and CAF+P groups, revealed significant differences (p = 0.01) in diversity indices (i.e.,chao1, Shannon, Simpson) only according to the sampling time (i.e., T0 vs. T84) within eachgroup, but not between groups (Figure 4a–c). Higher microbial diversity was consistentlyobserved in CAF-T0 and CAF+P-T0 subgroups compared to their corresponding points atT84, suggesting that the CAF diet was a strong modifying factor of the GM composition,regardless of the probiotic supplementation.
Int. J. Mol. Sci. 2021, 22, 11171 7 of 24Int. J. Mol. Sci. 2021, 22, x FOR PEER REVIEW 7 of 24
Figure 3. Fecal microbiota composition quantified by Real-Time PCR: (a) Lactobacillus spp.; (b) Bifidobacterium spp.; (c) Bacteroides-Prevotella-Porphyromonas spp.; (d) Clostridium coccoides-Eubacterium rectale group (e) Staphylococcus spp. and (f) Enterobacteriaceae in all groups of rats at the beginning of the experimental period (T0) and after 84 days of probiotic supplementation (T84). Data are shown as means ± SD of 6–9 rats per group. One-way ANOVA and Bonferroni test: * p < 0.05 vs. CHOW rats; ° p < 0.05 vs. CAF rats; # p < 0.05 vs. CAF+P rats; a p < 0.05 vs. T0. CAF: cafeteria; P: probiotic supplementation.
2.4.2. Profiling of the GM by 16S Next-Generation Sequencing (NGS) High-resolution genotyping of the fecal microbiota was performed to
comprehensively characterize the gut microbial composition in all CAF rats, including the CAF-T0, CAF+P-T0, CAF-T84, CAF+P-T84 subgroups.
An evaluation of alpha-diversity in fecal samples collected at T0 and T84, within both CAF and CAF+P groups, revealed significant differences (p = 0.01) in diversity indices (i.e., chao1, Shannon, Simpson) only according to the sampling time (i.e., T0 vs. T84) within each group, but not between groups (Figure 4a–c). Higher microbial diversity was consistently observed in CAF-T0 and CAF+P-T0 subgroups compared to their
Figure 3. Fecal microbiota composition quantified by Real-Time PCR: (a) Lactobacillus spp.;(b) Bifidobacterium spp.; (c) Bacteroides-Prevotella-Porphyromonas spp.; (d) Clostridium coccoides-Eubacterium rectale group (e) Staphylococcus spp. and (f) Enterobacteriaceae in all groups of ratsat the beginning of the experimental period (T0) and after 84 days of probiotic supplementation(T84). Data are shown as means ± SD of 6–9 rats per group. One-way ANOVA and Bonferroni test:* p < 0.05 vs. CHOW rats; ◦ p < 0.05 vs. CAF rats; # p < 0.05 vs. CAF+P rats; a p < 0.05 vs. T0. CAF:cafeteria; P: probiotic supplementation.
Int. J. Mol. Sci. 2021, 22, 11171 8 of 24
Int. J. Mol. Sci. 2021, 22, x FOR PEER REVIEW 8 of 24
corresponding points at T84, suggesting that the CAF diet was a strong modifying factor of the GM composition, regardless of the probiotic supplementation.
Figure 4. Comparison of alpha-diversity indices (a) Chao1, (b) Shannon and (c) Simpson in fecal samples collected at T0 and T84, within both CAF and CAF+P groups. Data are shown as means ± SD of 6–8 rats per group. p < 0.05 means significant differences in diversity indices (T84 vs. T0). CAF: cafeteria; P: probiotic supplementation.
Consistently, evaluation of beta-diversity through Principal Coordinates Analysis (PCoA) using different metrics (i.e., Bray-Curtis, weighted and unweighted UniFrac) showed that samples from the CAF-T84 and CAF+P-T84 groups were uniformly distributed within a single cluster, indicating no substantial differences in the microbiota structure of these samples and clustered away from the corresponding control groups, CAF-T0 and CAF+P-T0 (Figure 5a–c). As before, significant differences (PERMANOVA, p = 0.03) in beta-diversity metrics were observed only within each subgroup of CAF and CAF+P (i.e., CAF-T0 vs. CAF-T84 and CAF+P-T0 vs. CAF+P-T84).
Figure 4. Comparison of alpha-diversity indices (a) Chao1, (b) Shannon and (c) Simpson in fecalsamples collected at T0 and T84, within both CAF and CAF+P groups. Data are shown as means ± SDof 6–8 rats per group. p < 0.05 means significant differences in diversity indices (T84 vs. T0). CAF:cafeteria; P: probiotic supplementation.
Consistently, evaluation of beta-diversity through Principal Coordinates Analysis(PCoA) using different metrics (i.e., Bray-Curtis, weighted and unweighted UniFrac)showed that samples from the CAF-T84 and CAF+P-T84 groups were uniformly distributedwithin a single cluster, indicating no substantial differences in the microbiota structure ofthese samples and clustered away from the corresponding control groups, CAF-T0 andCAF+P-T0 (Figure 5a–c). As before, significant differences (PERMANOVA, p = 0.03) inbeta-diversity metrics were observed only within each subgroup of CAF and CAF+P (i.e.,CAF-T0 vs. CAF-T84 and CAF+P-T0 vs. CAF+P-T84).
Int. J. Mol. Sci. 2021, 22, 11171 9 of 24Int. J. Mol. Sci. 2021, 22, x FOR PEER REVIEW 9 of 24
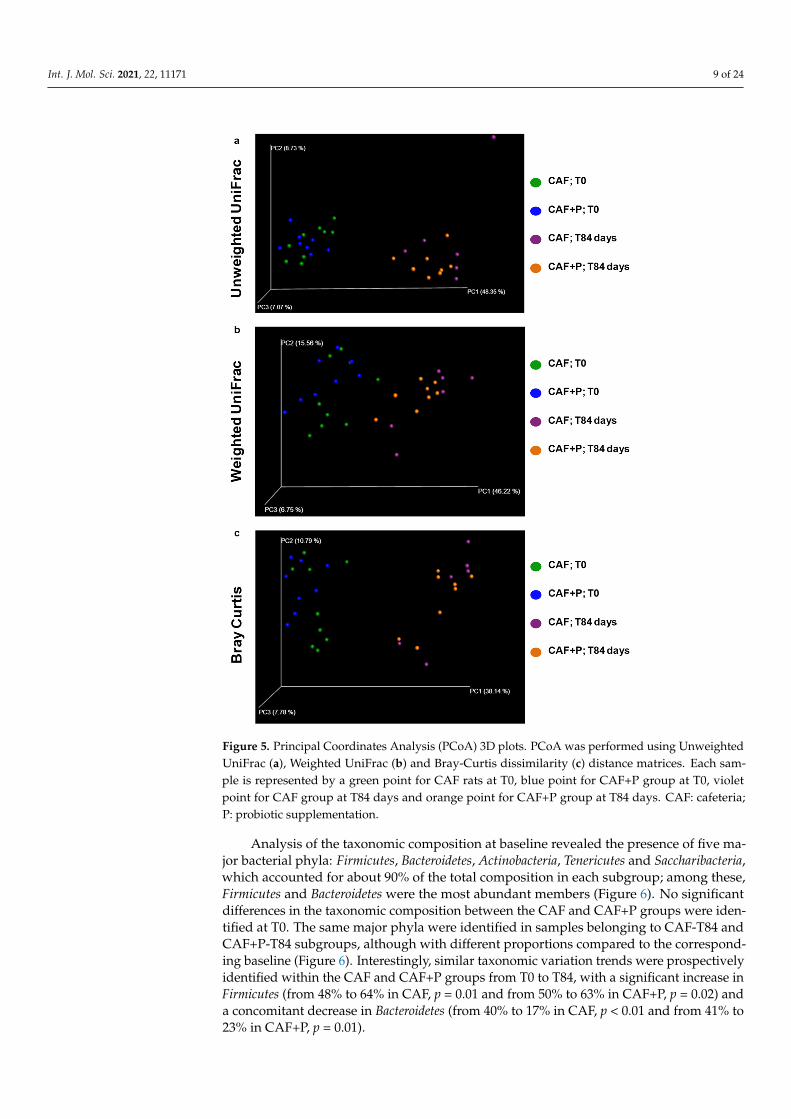
Figure 5. Principal Coordinates Analysis (PCoA) 3D plots. PCoA was performed using Unweighted UniFrac (a), Weighted UniFrac (b) and Bray-Curtis dissimilarity (c) distance matrices. Each sample is represented by a green point for CAF rats at T0, blue point for CAF+P group at T0, violet point for CAF group at T84 days and orange point for CAF+P group at T84 days. CAF: cafeteria; P: probiotic supplementation.
Analysis of the taxonomic composition at baseline revealed the presence of five major bacterial phyla: Firmicutes, Bacteroidetes, Actinobacteria, Tenericutes and Saccharibacteria, which accounted for about 90% of the total composition in each subgroup; among these, Firmicutes and Bacteroidetes were the most abundant members (Figure 6). No significant differences in the taxonomic composition between the CAF and CAF+P groups were identified at T0. The same major phyla were identified in samples belonging to CAF-T84 and CAF+P-T84 subgroups, although with different proportions compared to the corresponding baseline (Figure 6). Interestingly, similar taxonomic variation trends were prospectively identified within the CAF and CAF+P groups from T0 to T84, with a significant increase in Firmicutes (from 48% to 64% in CAF, p = 0.01 and from 50% to 63% in CAF+P, p = 0.02) and a concomitant decrease in Bacteroidetes (from 40% to 17% in CAF, p < 0.01 and from 41% to 23% in CAF+P, p = 0.01).
Figure 5. Principal Coordinates Analysis (PCoA) 3D plots. PCoA was performed using UnweightedUniFrac (a), Weighted UniFrac (b) and Bray-Curtis dissimilarity (c) distance matrices. Each sam-ple is represented by a green point for CAF rats at T0, blue point for CAF+P group at T0, violetpoint for CAF group at T84 days and orange point for CAF+P group at T84 days. CAF: cafeteria;P: probiotic supplementation.
Analysis of the taxonomic composition at baseline revealed the presence of five ma-jor bacterial phyla: Firmicutes, Bacteroidetes, Actinobacteria, Tenericutes and Saccharibacteria,which accounted for about 90% of the total composition in each subgroup; among these,Firmicutes and Bacteroidetes were the most abundant members (Figure 6). No significantdifferences in the taxonomic composition between the CAF and CAF+P groups were iden-tified at T0. The same major phyla were identified in samples belonging to CAF-T84 andCAF+P-T84 subgroups, although with different proportions compared to the correspond-ing baseline (Figure 6). Interestingly, similar taxonomic variation trends were prospectivelyidentified within the CAF and CAF+P groups from T0 to T84, with a significant increase inFirmicutes (from 48% to 64% in CAF, p = 0.01 and from 50% to 63% in CAF+P, p = 0.02) anda concomitant decrease in Bacteroidetes (from 40% to 17% in CAF, p < 0.01 and from 41% to23% in CAF+P, p = 0.01).
Int. J. Mol. Sci. 2021, 22, 11171 10 of 24
1
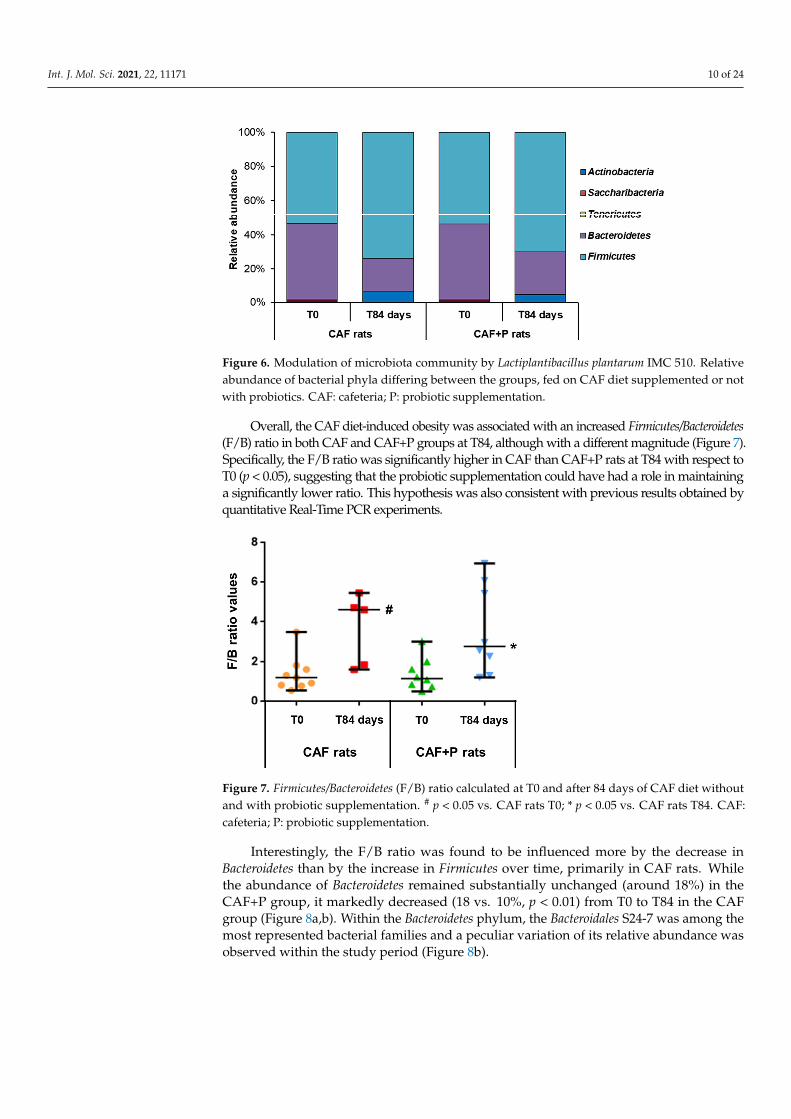
Figure 6. Modulation of microbiota community by Lactiplantibacillus plantarum IMC 510. Relativeabundance of bacterial phyla differing between the groups, fed on CAF diet supplemented or notwith probiotics. CAF: cafeteria; P: probiotic supplementation.
Overall, the CAF diet-induced obesity was associated with an increased Firmicutes/Bacteroidetes(F/B) ratio in both CAF and CAF+P groups at T84, although with a different magnitude (Figure 7).Specifically, the F/B ratio was significantly higher in CAF than CAF+P rats at T84 with respect toT0 (p < 0.05), suggesting that the probiotic supplementation could have had a role in maintaininga significantly lower ratio. This hypothesis was also consistent with previous results obtained byquantitative Real-Time PCR experiments.
2
Figure 7. Firmicutes/Bacteroidetes (F/B) ratio calculated at T0 and after 84 days of CAF diet withoutand with probiotic supplementation. # p < 0.05 vs. CAF rats T0; * p < 0.05 vs. CAF rats T84. CAF:cafeteria; P: probiotic supplementation.
Interestingly, the F/B ratio was found to be influenced more by the decrease inBacteroidetes than by the increase in Firmicutes over time, primarily in CAF rats. Whilethe abundance of Bacteroidetes remained substantially unchanged (around 18%) in theCAF+P group, it markedly decreased (18 vs. 10%, p < 0.01) from T0 to T84 in the CAFgroup (Figure 8a,b). Within the Bacteroidetes phylum, the Bacteroidales S24-7 was among themost represented bacterial families and a peculiar variation of its relative abundance wasobserved within the study period (Figure 8b).
Int. J. Mol. Sci. 2021, 22, 11171 11 of 24
3
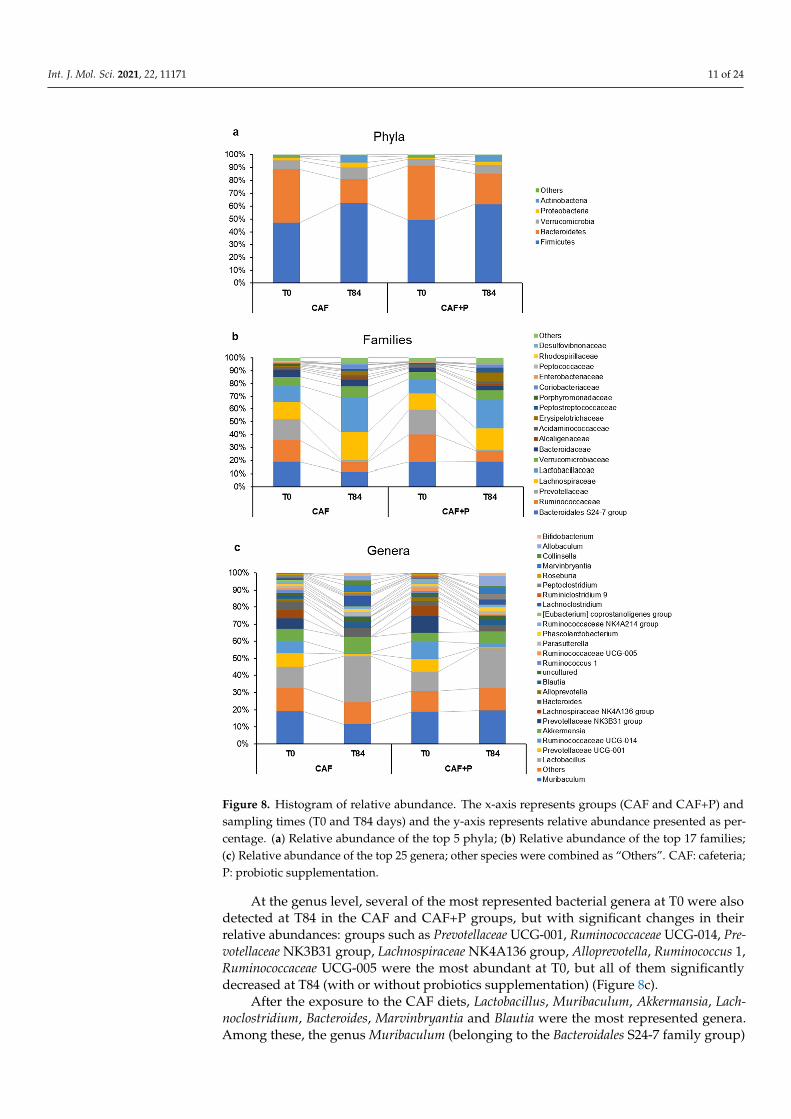
Figure 8. Histogram of relative abundance. The x-axis represents groups (CAF and CAF+P) andsampling times (T0 and T84 days) and the y-axis represents relative abundance presented as per-centage. (a) Relative abundance of the top 5 phyla; (b) Relative abundance of the top 17 families;(c) Relative abundance of the top 25 genera; other species were combined as “Others”. CAF: cafeteria;P: probiotic supplementation.
At the genus level, several of the most represented bacterial genera at T0 were alsodetected at T84 in the CAF and CAF+P groups, but with significant changes in theirrelative abundances: groups such as Prevotellaceae UCG-001, Ruminococcaceae UCG-014, Pre-votellaceae NK3B31 group, Lachnospiraceae NK4A136 group, Alloprevotella, Ruminococcus 1,Ruminococcaceae UCG-005 were the most abundant at T0, but all of them significantlydecreased at T84 (with or without probiotics supplementation) (Figure 8c).
After the exposure to the CAF diets, Lactobacillus, Muribaculum, Akkermansia, Lach-noclostridium, Bacteroides, Marvinbryantia and Blautia were the most represented genera.Among these, the genus Muribaculum (belonging to the Bacteroidales S24-7 family group)
Int. J. Mol. Sci. 2021, 22, 11171 12 of 24
was highly represented in all subgroups except CAF-T84, the most abundant genus, andstrongly influenced the F/B variations observed among the CAF and CAF+P groups duringthe study period (Figure 8c).
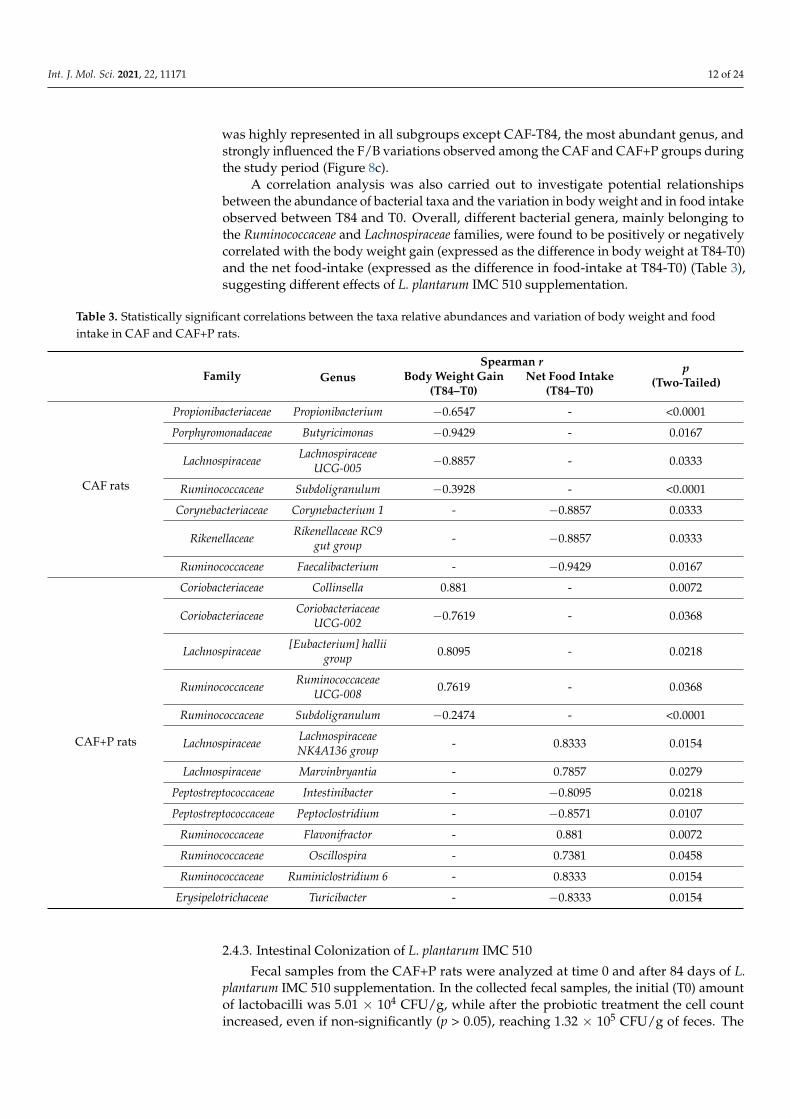
A correlation analysis was also carried out to investigate potential relationshipsbetween the abundance of bacterial taxa and the variation in body weight and in food intakeobserved between T84 and T0. Overall, different bacterial genera, mainly belonging tothe Ruminococcaceae and Lachnospiraceae families, were found to be positively or negativelycorrelated with the body weight gain (expressed as the difference in body weight at T84-T0)and the net food-intake (expressed as the difference in food-intake at T84-T0) (Table 3),suggesting different effects of L. plantarum IMC 510 supplementation.
Table 3. Statistically significant correlations between the taxa relative abundances and variation of body weight and foodintake in CAF and CAF+P rats.
Family GenusSpearman r p
(Two-Tailed)Body Weight Gain(T84–T0)
Net Food Intake(T84–T0)
CAF rats
Propionibacteriaceae Propionibacterium −0.6547 - <0.0001
Porphyromonadaceae Butyricimonas −0.9429 - 0.0167
Lachnospiraceae LachnospiraceaeUCG-005 −0.8857 - 0.0333
Ruminococcaceae Subdoligranulum −0.3928 - <0.0001
Corynebacteriaceae Corynebacterium 1 - −0.8857 0.0333
Rikenellaceae Rikenellaceae RC9gut group - −0.8857 0.0333
Ruminococcaceae Faecalibacterium - −0.9429 0.0167
CAF+P rats
Coriobacteriaceae Collinsella 0.881 - 0.0072
Coriobacteriaceae CoriobacteriaceaeUCG-002 −0.7619 - 0.0368
Lachnospiraceae [Eubacterium] halliigroup 0.8095 - 0.0218
Ruminococcaceae RuminococcaceaeUCG-008 0.7619 - 0.0368
Ruminococcaceae Subdoligranulum −0.2474 - <0.0001
Lachnospiraceae LachnospiraceaeNK4A136 group - 0.8333 0.0154
Lachnospiraceae Marvinbryantia - 0.7857 0.0279
Peptostreptococcaceae Intestinibacter - −0.8095 0.0218
Peptostreptococcaceae Peptoclostridium - −0.8571 0.0107
Ruminococcaceae Flavonifractor - 0.881 0.0072
Ruminococcaceae Oscillospira - 0.7381 0.0458
Ruminococcaceae Ruminiclostridium 6 - 0.8333 0.0154
Erysipelotrichaceae Turicibacter - −0.8333 0.0154
2.4.3. Intestinal Colonization of L. plantarum IMC 510
Fecal samples from the CAF+P rats were analyzed at time 0 and after 84 days of L.plantarum IMC 510 supplementation. In the collected fecal samples, the initial (T0) amountof lactobacilli was 5.01 × 10⁴ CFU/g, while after the probiotic treatment the cell countincreased, even if non-significantly (p > 0.05), reaching 1.32 × 10⁵ CFU/g of feces. The
Int. J. Mol. Sci. 2021, 22, 11171 13 of 24
probiotic strain, L. plantarum IMC 510, has been detected from fecal samples of the CAF+Prats, but not from those of the control group (CAF rats). At the end of the consumptionperiod (T84) the average percentage of the recovery of L. plantarum IMC 510 was positiveon all subjects from the CAF+P group (Table 4).
Table 4. Total vancomycin- and gentamycin-resistant Lactobacillus count and recovery of L. plan-tarum IMC 510 in fecal samples of CAF+P rats at T0 and after 84 days of L. plantarum IMC 510daily supplementation.
CAF+P Rats T0 T84
Lactobacillus spp. (CFU/g of feces) (5.0 ± 1.1) × 104 (1.3 ± 1.0) × 105
L. plantarum IMC 510 (CFU/g of feces) 0.0 ± 0.0 (7.8 ± 1.5) × 104
Percentage of positive samples forthe recovery of L. plantarum IMC 510 0% 100%
T0: before Lactiplantibacillus (L.) plantarum IMC 510 supplementation; T84: after 84 days of L. plantarum IMC 510supplementation. CAF: cafeteria; P: probiotic supplementation.
3. Discussion
In our study of male rats, long-term exposure to CAF diet increased caloric foodintake, body weight, also eliciting changes in the GM composition (microbial imbalance)and blood parameter levels, including glycemia and leptin. In accordance with the bodyweight gain results, also BMI, liver and white adipose tissue weight were significantlyhigher in CAF-fed rats. This diet was chosen and preferred to other diets inducing obesityin animal models, because it provides a strong motivational stimulus to voluntarily overeat,thanks to the palatability and variety of selected energy-dense foods, reflecting the CAFdiet in modern society [47,49]. In addition to obesity, it also induces glucose intoleranceand generalized inflammation [46] and severe dysbiosis [48], similar to some conditionsof Western diet-associated diseases in overweight and obese subjects. Here, the CAF dietallows studying the diet-induced microbial imbalance and, in turn, evaluating for the firsttime the effect of L. plantarum IMC 510 in line with metabolic changes observed in humans.
This probiotic strain was isolated from healthy elderly subjects, with a high capacityto adhere to the intestinal mucosa, confirming excellent gut colonization that promotes ahigh probiotic properties expression [51,52]. The choice of this probiotic, together with theselection of the CAF diet, represent a novel approach in the source of this probiotic straincompared to those used in the already published papers, in which the Lactobacilli have foodorigins or similar (sourdough, such as in [53]). The human origin gave also better chancesin expressing beneficial effects in humans.
The oral and daily supplementation of L. plantarum IMC 510 for 84 days significantlyattenuated food intake; therefore, the body weight gain and other parameters (discussedbelow) in rats under the CAF diet and showed beneficial effects on GM, eliminatingthe microbial imbalance established by the obesity status and restoring the microbiotaequilibrium. The decreased dietary intake could be associated with alterations in theintestinal flora in response to L. plantarum IMC 510 administration. Indeed, microbes couldaffect the food preference modifying the receptor expression or transduction. Variations inthe activity and expression of taste receptors were reported following gastric bypass surgery,which also impacted GM, satiety and food preferences [54]. The conflict between hostand microbiota influences craving for selective nutrients, and additionally, it is supposedto affect satiety and caloric consumption [55,56]. The CAF diet provides an extra energysupply which leads to a reduction of GM diversity, triggering a mechanism that couldpromote protracted alterations in satiety, damaging the host and inducing obesity. Thus,the treatment with probiotics enhanced the GM diversity, which alters the satiety setpointand improves the decrease in food intake of the host [55].
Moreover, the recovered equilibrium of the microbiota is crucial to maintain stablegut permeability and Lipopolysaccharide (LPS) absorption, which dramatically increase
Int. J. Mol. Sci. 2021, 22, 11171 14 of 24
following a high-fat diet (HFD) and elicit low-grade inflammation, metabolic disordersand the development of insulin resistance [57,58]. The LPS content represents a key factorin the development of inflammation in obese conditions related to GM dysbiosis and L.plantarum IMC 510 already showed strong antipathogenic activity against Gram-positiveand Gram-negative bacteria [50].
Firmicutes and Bacteroidetes, the two key bacterial phyla of the human GM, have beendemonstrated to regulate the energy homeostasis in obesity and in particular, a higherF/B ratio is detected in obese subjects, highlighting the relevant role of GM in the fatmetabolism regulation [59].
Our results revealed a significant increase in the relative abundance of Firmicutes anda higher F/B ratio in obese rats (CAF rats), in line with other works [26,30,31], while theF/B ratio value significantly decreased in the probiotic supplemented CAF rats (CAF+Prats). Therefore, the probiotic administration maintains a lower F/B ratio despite the CAFdiet consumption, extending previously obtained results [26,30,31] and reinforcing theprobiotics’ use in obesity management.
The major contribution to the F/B ratio variations observed among the CAF andCAF+P groups during the experimental period was made by different proportions of thegenus Muribaculum. The Muribaculum genus, belonging to Bacteroidales S24-7, is normallypresent in the healthy mouse gut microbiome [60], and it is known to decrease in miceduring the consumption of the Western diet [61]; furthermore, Muribaculum is associatedwith the regulation of body weight and carbohydrate metabolism [60,62]. Interestingly,the probiotic supplementation could alleviate the decrease in this important species ofbacteria and the family of bacteria it belongs to, influencing in a positive way the amountof energy available to its host. At the family’s level, an increase in Lachnospiraceae wasobserved in both CAF and CAF+P rats after 84 days of dietary intervention, but to a lesserextent in the CAF+P group. Lachnospiraceae bacteria (phylum Firmicutes, class Clostridia)have also been linked to obesity [63]. In addition, a metagenomic study indicated that thetaxonomic family Lachnospiraceae may also be specifically associated with type 2 diabetes inboth humans and mice models [64]. The Lachnospiraceae family has been shown to have apositive correlation with inflammation markers in white adipose tissues and body weightgain in diet-induced obese mice [65]. Supplementation with L. plantarum IMC 510 has beenshown to alleviate the increase in Lechnospiraceae during an HFD and so, it may be involvedin the reduction of obesity-related inflammatory status.
Again, at the family level, the present study highlighted an increase in Erysipelotrichaceaein the CAF+P group after 84 days of dietary treatment. Interestingly, members of this familyhave been shown, in several independent studies, to differentiate in abundance, in responseto changes in the amount of dietary fat intake [57]. In our study, the genus Allobaculum,a member of the family Erysipelotrichaceae, increased in the CAF+P group after 84 days.Previous work has shown that low-fat feeding was associated with an increase in the genusAllobaculum compared with HFD feeding [65]. Moreover, treatment with the plant alkaloidberberine, which prevents obesity and insulin resistance in rats fed an HFD, increased theabundance of Allobaculum [66].
The same result was obtained with the probiotic supplementation in our study, con-firming the hypothesis of a potential benefit of this bacterial genus for the physiology ofthe host.
We found no difference in the GM of rats under standard diet, treated with and withoutthe probiotic, according to the limited evidence for the effect of probiotic supplementationwhen the GM is unperturbed by pathophysiological conditions or treatment, includingantibiotics or chemotherapy [67,68].
Assessing different serum parameters, CAF diet caused hyperglycemia and affectedserum lipid profile as well as GOT, GPT and GGT compared to a standard diet. Regardingcholesterol level, we found a strong increase in its concentration, even though not reachingstatistical significance in CAF rats. It is well known that rodents are resistant to develop hy-percholesterolemia [69–72], unless longer exposure to HFD or specific cholesterol-enriched
Int. J. Mol. Sci. 2021, 22, 11171 15 of 24
diets [73,74]. However, the probiotic supplementation showed a clear trend toward areduction of cholesterol, triglycerides and a significant decrease in glycemia and LDL levelsin CAF+P rats.
Notably, the supplementation with L. plantarum IMC 510 proved to be associatedwith the decrease in serum leptin levels compared to the high levels induced by theCAF diet, consistent with its ability to reduce body weight gain and fat mass accu-mulation. Previous studies indicated that probiotics intervention decreased circulatingleptin levels [31,32,72,75]. In addition, Yao and co-authors recently found that GM ab-sence can affect body weight and leptin level, reporting that a GM depletion increasedbody weight, plasma leptin level and leptin expression by epigenetic modulation (DNAmethylation), with a high risk of leptin resistance [76]. Remarkably, the elevated circulatingleptin is considered a biomarker of leptin resistance, which is commonly detected in obesecompared to non-obese subjects, reflecting that an increased calorie-dense food intake thatcan lead to hyperphagia and thus difficulty in losing body weight [6,77,78]. In fact, leptin, apotent anorexigenic hormone secreted from adipocytes, binding to specific receptors in thecentral nervous system, primarily in the hypothalamus [79], modulates satiety, metabolism,energy balance, body weight homeostasis and neuroendocrine response [79–81]. Then, thedisruption of leptin signaling may contribute to the development of metabolic complica-tions, including diabetes and cardiovascular diseases [82]. It is remarkable the positiveeffects of L. plantarum IMC 510 supplementation in restoring leptin levels and mitigateleptin resistance.
In line with this, we observed in CAF+P rats a significant reduction of white fataccumulation and adipocyte hypertrophy upon probiotic supplementation, compared toCAF rats. These effects are significant for the potential anti-obesity action of L. plantarumIMC 510, considering that excessive fat accumulation and hypertrophy represent relevantmarkers for obesity conditions [83,84].
Histological analysis of the rat liver revealed an increase in cellular lipid deposits inCAF rats, typical of steatotic pathologic change, and they were evidenced when comparedwith the CHOW group. Supplementation with L. plantarum IMC 510 seems to prevent thishepatic lipid accumulation, caused by diet, and the overall morphology was maintainedwith a lesser extent of steatotic area. This could be correlated to a decrease in body weightand visceral fat depots and could explain the low blood serum level of GOT and GPT insupplemented CAF rats. In fact, both inflammatory cytokines and free radicals generallyinduce damage to hepatocytes and have a critical role in the pathogenesis of HFD inducedliver injury [85–87]. Notably, different studies [88–90] have attempted to develop specificprobiotics to treat liver inflammation and decrease GOT and GPT serum levels. For instance,in humans, oral administration of probiotic capsules containing L. acidophilus, L. bulgaricus,Bifidobacterium lactis and Streptococcus thermophilus decreased the levels of GOT and GPT inthe serum [91].
As a limitation of this work, further investigations will be necessary to study the poten-tial protective role of L. plantarum IMC 510 on body weight gain and in the hepatic steatosisinduced by CAF diet and to explain the possible molecular mechanisms underlying itscorrelation with leptin, the anti-inflammatory and antioxidant properties of probiotics’supplementation [92–94]. Moreover, L. plantarum IMC 510 needs to be evaluated in a largecohort of Sprague-Dawley rats after the development of obesity-prone and obesity-resistant(OR) phenotypes. This allows the evaluation of its action on inter-individual susceptibilityin weight gain in response to obesogenic diets.
4. Materials and Methods4.1. Subjects and Diet Composition
A total of 36 Male Sprague-Dawley rats (Charles River, Calco, Italy) were used. Thebody weight of the rats was 300–350 g at the beginning of the experiments. Rats wereacclimated to individual cages under a 12-h light/dark cycle (lights on at 08:00 am) with adlibitum chow (4RF18, Mucedola, Settimo Milanese, Italy; 2.6 kcal/g) and water for 2 weeks
Int. J. Mol. Sci. 2021, 22, 11171 16 of 24
prior to the experiments. They were kept in a room at constant temperature (20–22 ◦C) andhumidity (45–55%).
Since no significant differences in body weight (p > 0.05) and food intake (p > 0.05)were detected, rats were randomly divided into two experimental groups as follows(n = 18 in each group): animal fed with chow only, called CHOW rats and animal fed 24 hwith both chow and extended access to CAF diet for 84 days, called CAF rats. The CAF diet,previously described [95,96], consisted of mortadella (3.2 kcal/g), cookies (Macine, MulinoBianco; 4.8 kcal/g), chocolate muffin (Mr Day, Vicenzi group; 4.5 kcal/g), cheese chips(Fonzies; 5.3 kcal/g), cheese (Biraghi cheese, 4.2 kcal/g), sippets (San Carlo; 5.5 kcal/g)and lard (9 kcal/g), which were individually weighed before being made available to therats. Each group was divided into two subgroups (n = 9 in each group): control groups(CHOW or CAF rats) and supplemented groups with L. plantarum IMC 510 probiotic strain(CHOW+P or CAF+P). Probiotic was dissolved in drinking water (108 probiotic cells/diein 30 mL), daily prepared to prevent differences in viability, and as soon as rats consumedthe entire probiotic solution, they had free access to the water.
Weight gain and caloric intake were recorded every day for 12 weeks. Caloric intakeand macronutrient composition were calculated by weighing each kind of food before andafter the meal, using the nutritional information provided by the manufacturer. At the endof the study, BMI was calculated (body weight (g) divided by the square of the anal–nasallength (cm2)) and, after sacrificing, liver and white adipose tissue were immediately excisedand weighed.
4.2. Probiotic Supplementation
The strain L. plantarum IMC 510 was isolated from healthy elderly subjects during theEuropean project Crownalife [97] and in vitro tested for all the probiotic characteristics:resistance to low pH, bile salts and pancreatic juice, ability to adhere to intestinal cells andcolonize the mucosa, antipathogenic activity against bacteria (Gram + and Gram −) andyeasts, non-transmissible antibiotic resistance genes’ absence of plasmids [50–52].
This strain was produced by fermentation in a 30-L pilot fermenter (Pierre Guerintechnologies, Mauzé-sur-le-Mignon, France) and lyophilized diluting the cells biomassin PBS solution at 10% glycerol (w/v) added at a ratio 1:5 to the biomass. The biomasswas frozen at −80 ◦C for at least 30 min and then lyophilized using a Zirbus freeze dryer(ZirbusVaco 2, Bad Grund, Germany) with a condenser temperature of −50 ◦C and achamber pressure p < 0.08 mbar for 48 h. After the lyophilization process, the probioticpowder was analyzed to determine the viable cell concentration (CFU/g).
The probiotic strain L. plantarum IMC 510 was daily administered for 84 days, sincethe first day of access to the CAF diet, at a 108 probiotic cells/die concentration, dissolvingthe lyophilized powder into the water drinking bottle of each single rat. Every morning theprobiotic powder was dissolved in approximately 30 mL of water in a standard drinkingbottle. As soon as the rats consumed the entire probiotic solution, a fresh bottle wasprovided in order to have free access to the water.
4.3. Blood Parameters
Blood samples were collected in 1 mL L-heparin tubes (Sarstedt, Germany) and theserum was centrifuged at 3000 rpm for 10 min. They were stored at 4 ◦C and deliveredto the Fioroni laboratory (San Benedetto del Tronto, AP, Italy) and analyzed within 24 h.The leptin concentration was evaluated by colorimetric method using a specific kit (RatLeptin ELISA Kit, Abcam ab100773, Cambridge CB2 0AX, UK) following the protocol ofthe datasheet.
4.4. Liver and Adipose Tissue: Morphological Analysis
After the sacrifice, the liver and the visceral adipose tissue were removed and imme-diately immersed in Bouin’s fixative solution (picric acid, 4% formaldehyde and aceticacid in 0.1M PBS, pH 7.4) for 12 h at room temperature. After fixation, the samples were
Int. J. Mol. Sci. 2021, 22, 11171 17 of 24
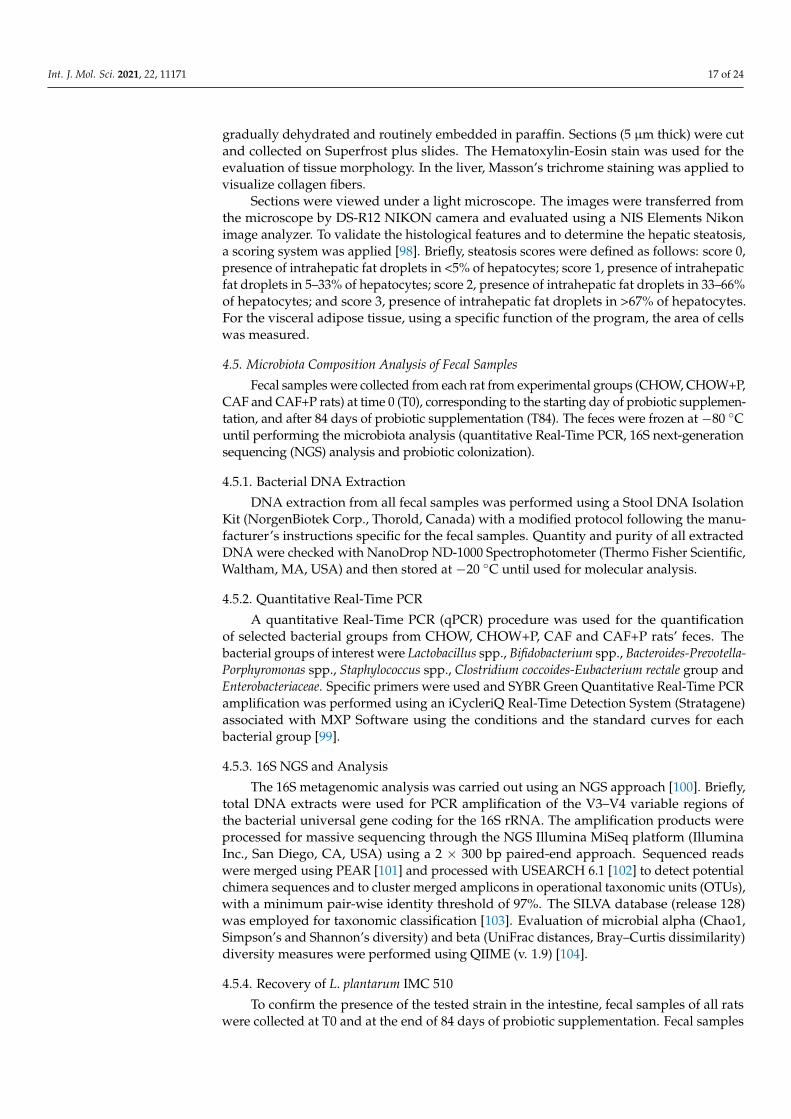
gradually dehydrated and routinely embedded in paraffin. Sections (5 µm thick) were cutand collected on Superfrost plus slides. The Hematoxylin-Eosin stain was used for theevaluation of tissue morphology. In the liver, Masson’s trichrome staining was applied tovisualize collagen fibers.
Sections were viewed under a light microscope. The images were transferred fromthe microscope by DS-R12 NIKON camera and evaluated using a NIS Elements Nikonimage analyzer. To validate the histological features and to determine the hepatic steatosis,a scoring system was applied [98]. Briefly, steatosis scores were defined as follows: score 0,presence of intrahepatic fat droplets in <5% of hepatocytes; score 1, presence of intrahepaticfat droplets in 5–33% of hepatocytes; score 2, presence of intrahepatic fat droplets in 33–66%of hepatocytes; and score 3, presence of intrahepatic fat droplets in >67% of hepatocytes.For the visceral adipose tissue, using a specific function of the program, the area of cellswas measured.
4.5. Microbiota Composition Analysis of Fecal Samples
Fecal samples were collected from each rat from experimental groups (CHOW, CHOW+P,CAF and CAF+P rats) at time 0 (T0), corresponding to the starting day of probiotic supplemen-tation, and after 84 days of probiotic supplementation (T84). The feces were frozen at −80 ◦Cuntil performing the microbiota analysis (quantitative Real-Time PCR, 16S next-generationsequencing (NGS) analysis and probiotic colonization).
4.5.1. Bacterial DNA Extraction
DNA extraction from all fecal samples was performed using a Stool DNA IsolationKit (NorgenBiotek Corp., Thorold, Canada) with a modified protocol following the manu-facturer’s instructions specific for the fecal samples. Quantity and purity of all extractedDNA were checked with NanoDrop ND-1000 Spectrophotometer (Thermo Fisher Scientific,Waltham, MA, USA) and then stored at −20 ◦C until used for molecular analysis.
4.5.2. Quantitative Real-Time PCR
A quantitative Real-Time PCR (qPCR) procedure was used for the quantificationof selected bacterial groups from CHOW, CHOW+P, CAF and CAF+P rats’ feces. Thebacterial groups of interest were Lactobacillus spp., Bifidobacterium spp., Bacteroides-Prevotella-Porphyromonas spp., Staphylococcus spp., Clostridium coccoides-Eubacterium rectale group andEnterobacteriaceae. Specific primers were used and SYBR Green Quantitative Real-Time PCRamplification was performed using an iCycleriQ Real-Time Detection System (Stratagene)associated with MXP Software using the conditions and the standard curves for eachbacterial group [99].
4.5.3. 16S NGS and Analysis
The 16S metagenomic analysis was carried out using an NGS approach [100]. Briefly,total DNA extracts were used for PCR amplification of the V3–V4 variable regions ofthe bacterial universal gene coding for the 16S rRNA. The amplification products wereprocessed for massive sequencing through the NGS Illumina MiSeq platform (IlluminaInc., San Diego, CA, USA) using a 2 × 300 bp paired-end approach. Sequenced readswere merged using PEAR [101] and processed with USEARCH 6.1 [102] to detect potentialchimera sequences and to cluster merged amplicons in operational taxonomic units (OTUs),with a minimum pair-wise identity threshold of 97%. The SILVA database (release 128)was employed for taxonomic classification [103]. Evaluation of microbial alpha (Chao1,Simpson’s and Shannon’s diversity) and beta (UniFrac distances, Bray–Curtis dissimilarity)diversity measures were performed using QIIME (v. 1.9) [104].
4.5.4. Recovery of L. plantarum IMC 510
To confirm the presence of the tested strain in the intestine, fecal samples of all ratswere collected at T0 and at the end of 84 days of probiotic supplementation. Fecal samples
Int. J. Mol. Sci. 2021, 22, 11171 18 of 24
were analyzed by enumeration of vancomycin and gentamicin-resistant lactobacilli ontomodified-MRS agar by a 10-fold serial dilution method [52].
After aerobic incubation at 37 ◦C for 48–72 h, ten to twenty percent of the total coloniesper sample randomly selected from countable agar plates were isolated and checkedfor purity. DNA extracted from the selected colonies using a modified benzyl chloridemethod [105] was analyzed by the RAPD technique [52].
4.6. Statistical Analysis
In the experiment, rats were allocated to experimental groups using a simple random-ization approach; prior to allocation, potential differences in body weight and food intakewere assessed.
In vivo and ex vivo results were presented as mean ± SEM. The results were expressedas mean ± standard deviation.
In vivo data were analyzed by two-way ANOVA (Systat Software 10.0, San Jose, CA,USA) for repeated measures, when necessary, which included the between-subject factors ofdiet (CHOW or CAF diet) and probiotic supplementation (no or yes). We used post-hoc teststo follow up on significant interaction or main effects (p < 0.05) from the factorial ANOVAs.
To avoid misinterpretation of the effect of the probiotic, rats that were resistant toincreasing body weight [106–109] and thus developing the obese phenotype [110–112]were excluded from the experiment. As described above, the probiotic supplementationstarted on the first day of access to the CAF diet, and thus the phenotype was not yet clearlyexpressed. However, the early adaptations to a fat diet are crucial for obesity developmentor resistance and the first week of exposure is highly predictive of weight gain over thesubsequent weeks [113,114]. For this reason, at the end of the first week of the CAF dietad libitum, 4 rats (3 CAF and 1 CAF+P rats) were excluded from the study. They werepotentially susceptible to develop obesity resistance, showing a weight gain significantlylower (g: OR-CAF rats 22.7 ± 1.2; OR-CAF+P rat 23.0) compared to the other rats underCAF diet (p < 0.05, g: CAF rats 40.2 ± 4.7; CAF+P rats 39.4 ± 3.5) and similarly to thecontrol CHOW groups (g: CHOW rats 23.1 ± 2.0; CHOW+P rats 27.7 ± 2.8).
For ex vivo data, significant differences between mean values were determined byBonferroni multiple comparison test after One-way ANOVA using GraphPad PRISM® 5.1(GraphPad Software, CA, USA).
For 16S NGS, data were assessed for normality with the Shapiro–Wilk test usingGraphPad Prism 6, and proper statistical analyses were performed by dedicated scriptsimplemented in QIIME, using: (i) the Kruskal–Wallis test to evaluate potential differ-ences in the relative abundance of bacterial taxa on pairwise or multiple comparisonsand to evaluate differences in alpha-diversity indices (i.e., Chao1, Simpson, Shannon);(ii) the permutational ANOVA (PERMANOVA) to test significance (999 permutations)between samples’ clusters generated by the PCoA, using different beta-diversity metrics(i.e., UniFrac, Bray–Curtis). Spearman correlation coefficients between relative abundancesof microbial taxa and levels of body weight gain and food intake were computed usingGraphPad Prism 6. Statistical significance was defined with a p-value less than 0.05.
5. Conclusions
Our data extend the investigation of the manipulation of GM that might represent apotential target for obesity management, evaluating the effects of a novel and specific pro-biotic strain in rats consuming Western-style foods, similar to the human diet. In fact, manyfindings revealed that certain probiotic strains could counteract overweight [22–25,33,59],while others produced mild effects or even lead to weight gain [57,115–117]. In the currentstudy, for the first time, L. plantarum IMC 510 was tested, for 84 days, in male rats underthe CAF diet. The probiotic preserved the major bacterial phyla in GM composition in theCAF+P group, compared to their CAF rats counterpart without supplementation. More-over, L. plantarum IMC 510 was able to decrease the amount of food intake, weight gainedand, consequently, relative beneficial effects were demonstrated by serological, biochemical
Int. J. Mol. Sci. 2021, 22, 11171 19 of 24
and histological analyses, potentially through leptin control. Even though further researchis needed to further elucidate this mechanism, our findings support the positive hypoth-esis that specific probiotic strains, such as L. plantarum IMC 510, can be considered as apromising therapeutic option to counteract and potentially prevent overweight, obesityand related comorbidities.
Supplementary Materials: Available online at https://www.mdpi.com/article/10.3390/ijms222011171/s1.
Author Contributions: Conceptualization, M.V.M.D.B., M.M.C., C.C. (Cinzia Cecchini), S.S., M.C.V.and C.C. (Carlo Cifani); methodology, M.V.M.D.B., M.M.C., D.T., E.M.D.B., L.B., M.G.G., G.M.R.,V.D.P., C.C. (Cinzia Cecchini), A.A., S.S., M.C.V. and C.C. (Carlo Cifani); formal analysis, M.V.M.D.B.,M.M.C., D.T., E.M.D.B., L.B., M.G.G., G.M.R., V.D.P., C.C. (Cinzia Cecchini), A.A., S.S., M.C.V.and C.C. (Carlo Cifani); investigation, M.V.M.D.B., M.M.C., D.T., E.M.D.B., L.B., M.G.G., G.M.R.,V.D.P., C.C. (Cinzia Cecchini), A.A., S.S., M.C.V. and C.C. (Carlo Cifani); data curation, M.V.M.D.B.,M.M.C., D.T., E.M.D.B., L.B., M.G.G., G.M.R., V.D.P., C.C. (Cinzia Cecchini), A.A., S.S., M.C.V. andC.C. (Carlo Cifani); writing—original draft preparation, M.V.M.D.B., M.M.C.; writing—review andediting, M.V.M.D.B., M.M.C., D.T., E.M.D.B., L.B., M.G.G., G.M.R., V.D.P., C.C. (Cinzia Cecchini),A.A., S.S., M.C.V. and C.C. (Carlo Cifani); visualization, M.V.M.D.B., M.M.C., D.T., E.M.D.B., L.B.,M.G.G., G.M.R., V.D.P., C.C. (Cinzia Cecchini), A.A., S.S., M.C.V. and C.C. (Carlo Cifani); supervision,M.V.M.D.B., M.M.C., S.S., M.C.V. and C.C. (Carlo Cifani); project administration, S.S., M.C.V. andC.C. (Carlo Cifani); funding acquisition, S.S., M.C.V. and C.C. (Carlo Cifani). All authors have readand agreed to the published version of the manuscript.
Funding: This work was supported by the Italian Ministry of Education, University and Researchgrant (PRIN2012 prot. #2012JTX3KL) to CC.
Institutional Review Board Statement: All procedures were conducted in accordance with the Insti-tutional Guidelines and were complied with the Italian Ministry of Health (protocol no. 1610/2013)and associated guidelines from the European Communities Council Directive. The protocol wasapproved by the Ethics Committee of the University of Camerino (no. 7/2012, 6 June 2012).
Informed Consent Statement: Not applicable for studies not involving humans.
Data Availability Statement: The data presented in this study are available on request from thecorresponding author.
Acknowledgments: “L’Oreal Italia per le Donne e la Scienza” which covered the post-doctoralfellowship of Maria Vittoria Micioni Di Bonaventura.
Conflicts of Interest: The authors declare no conflict of interest.
References1. Schetz, M.; De Jong, A.; Deane, A.M.; Druml, W.; Hemelaar, P.; Pelosi, P.; Pickkers, P.; Reintam-Blaser, A.; Roberts, J.; Sakr, Y.; et al.
Obesity in the critically ill: A narrative review. Intensive Care Med. 2019, 45, 757–769. [CrossRef]2. Cordain, L.; Eaton, S.B.; Sebastian, A.; Mann, N.; Lindeberg, S.; Watkins, B.A.; O’Keefe, J.H.; Brand-Miller, J. Origins and evolution
of the Western diet: Health implications for the 21st century. Am. J. Clin. Nutr. 2005, 81, 341–354. [CrossRef]3. Kopp, W. How Western Diet And Lifestyle Drive The Pandemic Of Obesity And Civilization Diseases. Diabetes Metab. Syndr.
Obes. Targets Ther. 2019, 12, 2221–2236. [CrossRef]4. Chooi, Y.C.; Ding, C.; Magkos, F. The epidemiology of obesity. Metab. Clin. Exp. 2019, 92, 6–10. [CrossRef]5. World Health Organization; Office of Library and Health Literature. Services Styles for Bibliographic Citations: Guidelines for
WHO-Produced Bibliographies; World Health Organization: Geneva, Switzerland, 1988.6. Izquierdo, A.G.; Crujeiras, A.B.; Casanueva, F.F.; Carreira, M.C. Leptin, Obesity, and Leptin Resistance: Where Are We 25 Years
Later? Nutrients 2019, 11, 2704. [CrossRef]7. Bliss, E.S.; Whiteside, E. The Gut-Brain Axis, the Human Gut Microbiota and Their Integration in the Development of Obesity.
Front. Physiol. 2018, 9, 900. [CrossRef] [PubMed]8. Crowley, V.E. Overview of human obesity and central mechanisms regulating energy homeostasis. Ann. Clin. Biochem. 2008, 45,
245–255. [CrossRef] [PubMed]9. D’Addario, C.; Micioni Di Bonaventura, M.V.; Pucci, M.; Romano, A.; Gaetani, S.; Ciccocioppo, R.; Cifani, C.; Maccarrone, M.
Endocannabinoid signaling and food addiction. Neurosci. Biobehav. Rev. 2014, 47, 203–224. [CrossRef] [PubMed]10. Micioni Di Bonaventura, E.; Botticelli, L.; Tomassoni, D.; Tayebati, S.K.; Micioni Di Bonaventura, M.V.; Cifani, C. The Melanocortin
System behind the Dysfunctional Eating Behaviors. Nutrients 2020, 12, 3502. [CrossRef]
Int. J. Mol. Sci. 2021, 22, 11171 20 of 24
11. Suarez, A.N.; Liu, C.M.; Cortella, A.M.; Noble, E.E.; Kanoski, S.E. Ghrelin and Orexin Interact to Increase Meal Size Through aDescending Hippocampus to Hindbrain Signaling Pathway. Biol. Psychiatry 2020, 87, 1001–1011. [CrossRef]
12. Baqai, N.; Wilding, J.P.H. Pathophysiology and aetiology of obesity. Medicine 2015, 43, 73–76. [CrossRef]13. Botticelli, L.; Micioni Di Bonaventura, E.; Del Bello, F.; Giorgioni, G.; Piergentili, A.; Romano, A.; Quaglia, W.; Cifani, C.; Micioni
Di Bonaventura, M.V. Underlying Susceptibility to Eating Disorders and Drug Abuse: Genetic and Pharmacological Aspects ofDopamine D4 Receptors. Nutrients 2020, 12, 2288. [CrossRef]
14. Dhurandhar, E.J.; Keith, S.W. The aetiology of obesity beyond eating more and exercising less. Best Pract. Res. Clin. Gastroenterol.2014, 28, 533–544. [CrossRef]
15. Oussaada, S.M.; van Galen, K.A.; Cooiman, M.I.; Kleinendorst, L.; Hazebroek, E.J.; van Haelst, M.M.; Ter Horst, K.W.; Serlie, M.J.The pathogenesis of obesity. Metab. Clin. Exp. 2019, 92, 26–36. [CrossRef]
16. Micioni Di Bonaventura, E.; Botticelli, L.; Del Bello, F.; Giorgioni, G.; Piergentili, A.; Quaglia, W.; Cifani, C.; Micioni DiBonaventura, M.V. Assessing the role of ghrelin and the enzyme ghrelin O-acyltransferase (GOAT) system in food reward, foodmotivation, and binge eating behavior. Pharmacol. Res. 2021, 172, 105847. [CrossRef] [PubMed]
17. Heymsfield, S.B.; Wadden, T.A. Mechanisms, Pathophysiology, and Management of Obesity. N. Engl. J. Med. 2017, 376,254–266. [CrossRef]
18. Gadde, K.M.; Martin, C.K.; Berthoud, H.R.; Heymsfield, S.B. Obesity: Pathophysiology and Management. J. Am. Coll. Cardiol.2018, 71, 69–84. [CrossRef]
19. Brode, C.S.; Mitchell, J.E. Problematic Eating Behaviors and Eating Disorders Associated with Bariatric Surgery. Psychiatr. Clin. N.Am. 2019, 42, 287–297. [CrossRef]
20. Kushner, R.F. Weight Loss Strategies for Treatment of Obesity: Lifestyle Management and Pharmacotherapy. Prog. Cardiovasc. Dis.2018, 61, 246–252. [CrossRef] [PubMed]
21. Grandone, A.; Di Sessa, A.; Umano, G.R.; Toraldo, R.; Miraglia Del Giudice, E. New treatment modalities for obesity. Best Pract.Res. Clin. Endocrinol. Metab. 2018, 32, 535–549. [CrossRef] [PubMed]
22. Cornejo-Pareja, I.; Munoz-Garach, A.; Clemente-Postigo, M.; Tinahones, F.J. Importance of gut microbiota in obesity. Eur. J. Clin.Nutr. 2019, 72, 26–37. [CrossRef]
23. Gomes, A.C.; Hoffmann, C.; Mota, J.F. The human gut microbiota: Metabolism and perspective in obesity. Gut Microbes 2018, 9,308–325. [CrossRef]
24. Cerdo, T.; Garcia-Santos, J.A.; Bermúdez, M.G.; Campoy, C. The Role of Probiotics and Prebiotics in the Prevention and Treatmentof Obesity. Nutrients 2019, 11, 635. [CrossRef]
25. Mazloom, K.; Siddiqi, I.; Covasa, M. Probiotics: How Effective Are They in the Fight against Obesity? Nutrients 2019, 11,258. [CrossRef]
26. Li, X.; Huang, Y.; Song, L.; Xiao, Y.; Lu, S.; Xu, J.; Li, J.; Ren, Z. Lactobacillus plantarum prevents obesity via modulation of gutmicrobiota and metabolites in high-fat feeding mice. J. Funct. Foods 2020, 73, 104103. [CrossRef]
27. Cai, H.; Wen, Z.; Li, X.; Meng, K.; Yang, P. Lactobacillus plantarum FRT10 alleviated high-fat diet-induced obesity in micethrough regulating the PPARalpha signal pathway and gut microbiota. Appl. Microbiol. Biotechnol. 2020, 104, 5959–5972.[CrossRef] [PubMed]
28. Hussain, A.; Kwon, M.H.; Kim, H.K.; Lee, H.S.; Cho, J.S.; Lee, Y.I. Anti-Obesity Effect of Lactobacillus plantarum LB818 IsAssociated with Regulation of Gut Microbiota in High-Fat Diet-Fed Obese Mice. J. Med. Food 2020, 23, 750–759. [CrossRef]
29. Chen, D.; Yang, Z.; Chen, X.; Huang, Y.; Yin, B.; Guo, F.; Zhao, H.; Zhao, T.; Qu, H.; Huang, J.; et al. The effect of Lactobacillusrhamnosus hsryfm 1301 on the intestinal microbiota of a hyperlipidemic rat model. BMC Complementary Altern. Med. 2014, 14,386. [CrossRef] [PubMed]
30. Cheng, Y.C.; Liu, J.R. Effect of Lactobacillus rhamnosus GG on Energy Metabolism, Leptin Resistance, and Gut Microbiota inMice with Diet-Induced Obesity. Nutrients 2020, 12, 2557. [CrossRef] [PubMed]
31. Choi, W.J.; Dong, H.J.; Jeong, H.U.; Jung, H.H.; Kim, Y.H.; Kim, T.H. Antiobesity Effects of Lactobacillus plantarum LMT1-48 Accompanied by Inhibition of Enterobacter cloacae in the Intestine of Diet-Induced Obese Mice. J. Med. Food 2019, 22,560–566. [CrossRef]
32. Choi, W.J.; Dong, H.J.; Jeong, H.U.; Ryu, D.W.; Song, S.M.; Kim, Y.R.; Jung, H.H.; Kim, T.H.; Kim, Y.H. Lactobacillus plantarumLMT1-48 exerts anti-obesity effect in high-fat diet-induced obese mice by regulating expression of lipogenic genes. Sci. Rep. 2020,10, 869. [CrossRef]
33. Drissi, F.; Raoult, D.; Merhej, V. Metabolic role of lactobacilli in weight modification in humans and animals. Microb. Pathog. 2017,106, 182–194. [CrossRef]
34. Ranji, P.; Agah, S.; Heydari, Z.; Rahmati-Yamchi, M.; Mohammad Alizadeh, A. Effects of Lactobacillus acidophilus andBifidobacterium bifidum probiotics on the serum biochemical parameters, and the vitamin D and leptin receptor genes on micecolon cancer. Iran. J. Basic Med Sci. 2019, 22, 631–636. [CrossRef] [PubMed]
35. Ley, R.E.; Backhed, F.; Turnbaugh, P.; Lozupone, C.A.; Knight, R.D.; Gordon, J.I. Obesity alters gut microbial ecology. Proc. Natl.Acad. Sci. USA 2005, 102, 11070–11075. [CrossRef] [PubMed]
36. Turnbaugh, P.J.; Backhed, F.; Fulton, L.; Gordon, J.I. Diet-induced obesity is linked to marked but reversible alterations in themouse distal gut microbiome. Cell Host Microbe 2008, 3, 213–223. [CrossRef] [PubMed]
Int. J. Mol. Sci. 2021, 22, 11171 21 of 24
37. David, L.A.; Maurice, C.F.; Carmody, R.N.; Gootenberg, D.B.; Button, J.E.; Wolfe, B.E.; Ling, A.V.; Devlin, A.S.; Varma, Y.; Fischbach,M.A.; et al. Diet rapidly and reproducibly alters the human gut microbiome. Nature 2014, 505, 559–563. [CrossRef] [PubMed]
38. Qin, J.; Li, R.; Raes, J.; Arumugam, M.; Burgdorf, K.S.; Manichanh, C.; Nielsen, T.; Pons, N.; Levenez, F.; Yamada, T.; et al. Ahuman gut microbial gene catalogue established by metagenomic sequencing. Nature 2010, 464, 59–65. [CrossRef]
39. Million, M.; Maraninchi, M.; Henry, M.; Armougom, F.; Richet, H.; Carrieri, P.; Valero, R.; Raccah, D.; Vialettes, B.; Raoult, D.Obesity-associated gut microbiota is enriched in Lactobacillus reuteri and depleted in Bifidobacterium animalis and Methanobre-vibacter smithii. Int. J. Obes. 2012, 36, 817–825. [CrossRef]
40. de Lartigue, G.; Barbier de la Serre, C.; Espero, E.; Lee, J.; Raybould, H.E. Diet-induced obesity leads to the development of leptinresistance in vagal afferent neurons. Am. J. Physiol. Endocrinol. Metab. 2011, 301, E187–E195. [CrossRef]
41. Fam, B.C.; Morris, M.J.; Hansen, M.J.; Kebede, M.; Andrikopoulos, S.; Proietto, J.; Thorburn, A.W. Modulation of central leptinsensitivity and energy balance in a rat model of diet-induced obesity. Diabetes Obes. Metab. 2007, 9, 840–852. [CrossRef]
42. Jumpertz, R.; Le, D.S.; Turnbaugh, P.J.; Trinidad, C.; Bogardus, C.; Gordon, J.I.; Krakoff, J. Energy-balance studies revealassociations between gut microbes, caloric load, and nutrient absorption in humans. Am. J. Clin. Nutr. 2011, 94, 58–65. [CrossRef]
43. Krautkramer, K.A.; Kreznar, J.H.; Romano, K.A.; Vivas, E.I.; Barrett-Wilt, G.A.; Rabaglia, M.E.; Keller, M.P.; Attie, A.D.; Rey, F.E.;Denu, J.M. Diet-Microbiota Interactions Mediate Global Epigenetic Programming in Multiple Host Tissues. Mol. Cell 2016, 64,982–992. [CrossRef] [PubMed]
44. Thaiss, C.A.; Itav, S.; Rothschild, D.; Meijer, M.T.; Levy, M.; Moresi, C.; Dohnalova, L.; Braverman, S.; Rozin, S.; Malitsky, S.; et al.Persistent microbiome alterations modulate the rate of post-dieting weight regain. Nature 2016, 540, 544–551. [CrossRef]
45. Zinocker, M.K.; Lindseth, I.A. The Western Diet-Microbiome-Host Interaction and Its Role in Metabolic Disease. Nutrients 2018,10, 365. [CrossRef] [PubMed]
46. Sampey, B.P.; Vanhoose, A.M.; Winfield, H.M.; Freemerman, A.J.; Muehlbauer, M.J.; Fueger, P.T.; Newgard, C.B.; Makowski, L.Cafeteria diet is a robust model of human metabolic syndrome with liver and adipose inflammation: Comparison to high-fat diet.Obesity 2011, 19, 1109–1117. [CrossRef] [PubMed]
47. Shafat, A.; Murray, B.; Rumsey, D. Energy density in cafeteria diet induced hyperphagia in the rat. Appetite 2009, 52, 34–38.[CrossRef] [PubMed]
48. Bortolin, R.C.; Vargas, A.R.; Gasparotto, J.; Chaves, P.R.; Schnorr, C.E.; Martinello, K.B.; Silveira, A.K.; Rabelo, T.K.; Gelain, D.P.;Moreira, J.C.F. A new animal diet based on human Western diet is a robust diet-induced obesity model: Comparison to high-fatand cafeteria diets in term of metabolic and gut microbiota disruption. Int. J. Obes. 2018, 42, 525–534. [CrossRef] [PubMed]
49. Leigh, S.J.; Kendig, M.D.; Morris, M.J. Palatable Western-style Cafeteria Diet as a Reliable Method for Modeling Diet-inducedObesity in Rodents. J. Vis. Exp. JoVE 2019, 153, e60262. [CrossRef]
50. Coman, M.M.; Verdenelli, M.C.; Cecchini, C.; Silvi, S.; Orpianesi, C.; Boyko, N.; Cresci, A. In vitro evaluation of antimicrobialactivity of Lactobacillus rhamnosus IMC 501®, Lactobacillus paracasei IMC 502® and SYNBIO® against pathogens. J. Appl.Microbiol. 2014, 117, 518–527. [CrossRef]
51. Coman, M.M.; Cresci, A. Probiotics and prebiotics for human health: Innovations and new trends. In Edizioni Accademiche Italianetrademark of OmniScriptum; GmbH & Co. KG: Saarbrucken, Deutschland/Germany, 2014.
52. Verdenelli, M.C.; Ghelfi, F.; Silvi, S.; Orpianesi, C.; Cecchini, C.; Cresci, A. Probiotic properties of Lactobacillus rhamnosus andLactobacillus paracasei isolated from human faeces. Eur. J. Nutr. 2009, 48, 355–363. [CrossRef]
53. Liu, T.; Li, Y.; Zhao, M.; Mo, Q.; Feng, F. Weight-Reducing Effect of Lactobacillus plantarum ZJUFT17 Isolated from SourdoughEcosystem. Nutrients 2020, 12, 977. [CrossRef]
54. Miras, A.D.; le Roux, C.W. Mechanisms underlying weight loss after bariatric surgery. Nat. Rev. Gastroenterol. Hepatol. 2013, 10,575–584. [CrossRef]
55. Yatsunenko, T.; Rey, F.E.; Manary, M.J.; Trehan, I.; Dominguez-Bello, M.G.; Contreras, M.; Magris, M.; Hidalgo, G.;Baldassano, R.N.; Anokhin, A.P.; et al. Human gut microbiome viewed across age and geography. Nature 2012, 486,222–227. [CrossRef] [PubMed]
56. Alcock, J.; Maley, C.C.; Aktipis, C.A. Is eating behavior manipulated by the gastrointestinal microbiota? Evolutionary pressuresand potential mechanisms. BioEssays News Rev. Mol. Cell. Dev. Biol. 2014, 36, 940–949. [CrossRef] [PubMed]
57. Cani, P.D.; Bibiloni, R.; Knauf, C.; Waget, A.; Neyrinck, A.M.; Delzenne, N.M.; Burcelin, R. Changes in gut microbiota controlmetabolic endotoxemia-induced inflammation in high-fat diet-induced obesity and diabetes in mice. Diabetes 2008, 57, 1470–1481.[CrossRef] [PubMed]
58. Frazier, T.H.; DiBaise, J.K.; McClain, C.J. Gut microbiota, intestinal permeability, obesity-induced inflammation, and liver injury. J.Parenter. Enter. Nutr. 2011, 35, 14S–20S. [CrossRef] [PubMed]
59. Magne, F.; Gotteland, M.; Gauthier, L.; Zazueta, A.; Pesoa, S.; Navarrete, P.; Balamurugan, R. The Firmicutes/Bacteroidetes Ratio:A Relevant Marker of Gut Dysbiosis in Obese Patients? Nutrients 2020, 12, 1474. [CrossRef]
60. Chung, Y.W.; Gwak, H.J.; Moon, S.; Rho, M.; Ryu, J.H. Functional dynamics of bacterial species in the mouse gut microbiomerevealed by metagenomic and metatranscriptomic analyses. PLoS ONE 2020, 15, e0227886. [CrossRef]
61. McNamara, M.P.; Singleton, J.M.; Cadney, M.D.; Ruegger, P.M.; Borneman, J.; Garland, T. Early-life effects of juvenile Westerndiet and exercise on adult gut microbiome composition in mice. J. Exp. Biol. 2021, 224, jeb239699. [CrossRef] [PubMed]
62. Do, M.H.; Lee, H.B.; Lee, E.; Park, H.Y. The Effects of Gelatinized Wheat Starch and High Salt Diet on Gut Microbiota andMetabolic Disorder. Nutrients 2020, 12, 301. [CrossRef]
Int. J. Mol. Sci. 2021, 22, 11171 22 of 24
63. Zeng, H.; Ishaq, S.L.; Zhao, F.Q.; Wright, A.G. Colonic inflammation accompanies an increase of beta-catenin signaling andLachnospiraceae/Streptococcaceae bacteria in the hind gut of high-fat diet-fed mice. J. Nutr. Biochem. 2016, 35, 30–36. [CrossRef]
64. Kameyama, K.; Itoh, K. Intestinal colonization by a Lachnospiraceae bacterium contributes to the development of diabetes inobese mice. Microbes Environ. 2014, 29, 427–430. [CrossRef]
65. Ravussin, Y.; Koren, O.; Spor, A.; LeDuc, C.; Gutman, R.; Stombaugh, J.; Knight, R.; Ley, R.E.; Leibel, R.L. Responses of gutmicrobiota to diet composition and weight loss in lean and obese mice. Obesity 2012, 20, 738–747. [CrossRef]
66. Zhang, X.; Zhao, Y.; Zhang, M.; Pang, X.; Xu, J.; Kang, C.; Li, M.; Zhang, C.; Zhang, Z.; Zhang, Y.; et al. Structural changes of gutmicrobiota during berberine-mediated prevention of obesity and insulin resistance in high-fat diet-fed rats. PLoS ONE 2012, 7,e42529. [CrossRef]
67. McFarland, L.V. Use of probiotics to correct dysbiosis of normal microbiota following disease or disruptive events: A systematicreview. BMJ Open 2014, 4, e005047. [CrossRef] [PubMed]
68. Kristensen, N.B.; Bryrup, T.; Allin, K.H.; Nielsen, T.; Hansen, T.H.; Pedersen, O. Alterations in fecal microbiota compositionby probiotic supplementation in healthy adults: A systematic review of randomized controlled trials. Genome Med. 2016, 8,52. [CrossRef]
69. Micioni Di Bonaventura, M.V.; Martinelli, I.; Moruzzi, M.; Micioni Di Bonaventura, E.; Giusepponi, M.E.; Polidori, C.; Lupidi, G.;Tayebati, S.K.; Amenta, F.; Cifani, C.; et al. Brain alterations in high fat diet induced obesity: Effects of tart cherry seeds and juice.Nutrients 2020, 12, 623. [CrossRef] [PubMed]
70. O’Neal, R.M.; Still, W.J. Pathogenesis of atherosclerosis. Fed. Proc. 1962, 21, 12–14. [PubMed]71. Sasaki, S.; Yoneda, Y.; Fujita, H.; Uchida, A.; Takenaka, K.; Takesako, T.; Itoh, H.; Nakata, T.; Takeda, K.; Nakagawa, M.
Association of blood pressure variability with induction of atherosclerosis in cholesterol-fed rats. Am. J. Hypertens. 1994, 7,453–459. [CrossRef] [PubMed]
72. Andreadou, I.; Schulz, R.; Badimon, L.; Adameova, A.; Kleinbongard, P.; Lecour, S.; Nikolaou, P.E.; Falcao-Pires, I.; Vilahur, G.;Woudberg, N.; et al. Hyperlipidaemia and cardioprotection: Animal models for translational studies. Br. J. Pharmacol. 2020, 177,5287–5311. [CrossRef] [PubMed]
73. Genangeli, M.; Heijens, A.M.M.; Rustichelli, A.; Schuit, N.D.; Micioni Di Bonaventura, M.V.; Cifani, C.; Vittori, S.; Siegel, T.P.;Heeren, R.M.A. MALDI-Mass Spectrometry Imaging to Investigate Lipid and Bile Acid Modifications Caused by Lentil ExtractUsed as a Potential Hypocholesterolemic Treatment. J. Am. Soc. Mass Spectrom. 2019, 30, 2041–2050. [CrossRef]
74. Micioni Di Bonaventura, M.V.; Cecchini, C.; Vila-Donat, P.; Caprioli, G.; Cifani, C.; Coman, M.M.; Cresci, A.; Fiorini, D.; Ricciutelli,M.; Silvi, S.; et al. Evaluation of the hypocholesterolemic effect and prebiotic activity of a lentil (Lens culinaris Medik) extract.Mol. Nutr. Food Res. 2017, 61, 1700403. [CrossRef] [PubMed]
75. Jeung, W.H.; Nam, W.; Kim, H.J.; Kim, J.Y.; Nam, B.; Jang, S.S.; Lee, J.L.; Sim, J.H.; Park, S.D. Oral Administration of Lactobacilluscurvatus HY7601 and Lactobacillus plantarum KY1032 with Cinnamomi Ramulus Extract Reduces Diet-Induced Obesity andModulates Gut Microbiota. Prev. Nutr. Food Sci. 2019, 24, 136–143. [CrossRef] [PubMed]
76. Yao, H.; Fan, C.; Fan, X.; Lu, Y.; Wang, Y.; Wang, R.; Tang, T.; Qi, K. Effects of gut microbiota on leptin expression and body weightare lessened by high-fat diet in mice. Br. J. Nutr. 2020, 124, 396–406. [CrossRef] [PubMed]
77. Liu, J.; Yang, X.; Yu, S.; Zheng, R. The Leptin Resistance. Adv. Exp. Med. Biol. 2018, 1090, 145–163. [CrossRef]78. Pan, W.W.; Myers, M.G., Jr. Leptin and the maintenance of elevated body weight. Nat. Rev. Neurosci. 2018, 19, 95–
105. [CrossRef] [PubMed]79. van Swieten, M.M.; Pandit, R.; Adan, R.A.; van der Plasse, G. The neuroanatomical function of leptin in the hypothalamus. J.
Chem. Neuroanat. 2014, 61, 207–220. [CrossRef] [PubMed]80. Triantafyllou, G.A.; Paschou, S.A.; Mantzoros, C.S. Leptin and Hormones: Energy Homeostasis. Endocrinol. Metab. Clin. North
Am. 2016, 45, 633–645. [CrossRef]81. Zhang, Y.; Chua, S., Jr. Leptin Function and Regulation. Compr. Physiol. 2017, 8, 351–369. [CrossRef]82. Barazzoni, R.; Gortan Cappellari, G.; Ragni, M.; Nisoli, E. Insulin resistance in obesity: An overview of fundamental alterations.
Eat. Weight Disord. EWD 2018, 23, 149–157. [CrossRef]83. Caputo, T.; Gilardi, F.; Desvergne, B. From chronic overnutrition to metaflammation and insulin resistance: Adipose tissue and
liver contributions. FEBS Lett. 2017, 591, 3061–3088. [CrossRef] [PubMed]84. Rosen, E.D.; Spiegelman, B.M. What we talk about when we talk about fat. Cell 2014, 156, 20–44. [CrossRef] [PubMed]85. Martinelli, I.; Micioni Di Bonaventura, M.V.; Moruzzi, M.; Amantini, C.; Maggi, F.; Gabrielli, M.G.; Fruganti, A.; Marchegiani, A.;
Dini, F.; Marini, C.; et al. Effects of Prunus cerasus L. Seeds and Juice on Liver Steatosis in an Animal Model of Diet-InducedObesity. Nutrients 2020, 12, 1308. [CrossRef]
86. Peng, Y.; Rideout, D.; Rakita, S.; Lee, J.; Murr, M. Diet-induced obesity associated with steatosis, oxidative stress, and inflammationin liver. Surg. Obes. Relat. Dis. Off. J. Am. Soc. Bariatr. Surg. 2012, 8, 73–81. [CrossRef]
87. Tariq, Z.; Green, C.J.; Hodson, L. Are oxidative stress mechanisms the common denominator in the progression from hepaticsteatosis towards non-alcoholic steatohepatitis (NASH)? Liver Int. Off. J. Int. Assoc. Study Liver 2014, 34, e180–e190. [CrossRef]
88. Meroni, M.; Longo, M.; Dongiovanni, P. The Role of Probiotics in Nonalcoholic Fatty Liver Disease: A New Insight intoTherapeutic Strategies. Nutrients 2019, 11, 2642. [CrossRef]
89. Al-Muzafar, H.M.; Amin, K.A. Probiotic mixture improves fatty liver disease by virtue of its action on lipid profiles, leptin, andinflammatory biomarkers. BMC Complementary Altern. Med. 2017, 17, 43. [CrossRef] [PubMed]
Int. J. Mol. Sci. 2021, 22, 11171 23 of 24
90. Saltzman, E.T.; Palacios, T.; Thomsen, M.; Vitetta, L. Intestinal Microbiome Shifts, Dysbiosis, Inflammation, and Non-alcoholicFatty Liver Disease. Front. Microbiol. 2018, 9, 61. [CrossRef]
91. Pereg, D.; Kotliroff, A.; Gadoth, N.; Hadary, R.; Lishner, M.; Kitay-Cohen, Y. Probiotics for patients with compensated livercirrhosis: A double-blind placebo-controlled study. Nutrition 2011, 27, 177–181. [CrossRef]
92. Gomes, A.C.; Bueno, A.A.; de Souza, R.G.; Mota, J.F. Gut microbiota, probiotics and diabetes. Nutr. J. 2014, 13, 60. [CrossRef]93. Kim, K.A.; Gu, W.; Lee, I.A.; Joh, E.H.; Kim, D.H. High fat diet-induced gut microbiota exacerbates inflammation and obesity in
mice via the TLR4 signaling pathway. PLoS ONE 2012, 7, e47713. [CrossRef]94. Roy, P.; Tomassoni, D.; Traini, E.; Martinelli, I.; Micioni Di Bonaventura, M.V.; Cifani, C.; Amenta, F.; Tayebati, S.K. Natural
Antioxidant Application on Fat Accumulation: Preclinical Evidence. Antioxidants 2021, 10, 858. [CrossRef]95. Cifani, C.; Avagliano, C.; Micioni Di Bonaventura, E.; Giusepponi, M.E.; De Caro, C.; Cristiano, C.; La Rana, G.; Botticelli, L.;
Romano, A.; Calignano, A.; et al. Modulation of Pain Sensitivity by Chronic Consumption of Highly Palatable Food Followed byAbstinence: Emerging Role of Fatty Acid Amide Hydrolase. Front. Pharmacol. 2020, 11, 266. [CrossRef]
96. Giudetti, A.M.; Micioni Di Bonaventura, M.V.; Ferramosca, A.; Longo, S.; Micioni Di Bonaventura, E.; Friuli, M.; Romano, A.;Gaetani, S.; Cifani, C. Brief daily access to cafeteria-style diet impairs hepatic metabolism even in the absence of excessive bodyweight gain in rats. FASEB J. Off. Publ. Fed. Am. Soc. Exp. Biol. 2020, 34, 9358–9371. [CrossRef]
97. Silvi, S.; Verdenelli, M.; Orpianesi, C.; Cresci, A. EU project Crownalife: Functional foods, gut microflora and healthy ageing:Isolation and identification of Lactobacillus and Bifidobacterium strains from faecal samples of elderly subjects for a possibleprobiotic use in functional foods. J. Food Eng. 2003, 56, 195–200. [CrossRef]
98. Kleiner, D.E.; Brunt, E.M.; Van Natta, M.; Behling, C.; Contos, M.J.; Cummings, O.W.; Ferrell, L.D.; Liu, Y.C.; Torbenson, M.S.;Unalp-Arida, A.; et al. Design and validation of a histological scoring system for nonalcoholic fatty liver disease. Hepatology 2005,41, 1313–1321. [CrossRef] [PubMed]
99. Nasuti, C.; Coman, M.M.; Olek, R.A.; Fiorini, D.; Verdenelli, M.C.; Cecchini, C.; Silvi, S.; Fedeli, D.; Gabbianelli, R. Changes onfecal microbiota in rats exposed to permethrin during postnatal development. Environ. Sci. Pollut. Res. Int. 2016, 23, 10930–10937.[CrossRef] [PubMed]
100. Russo, E.; Bacci, G.; Chiellini, C.; Fagorzi, C.; Niccolai, E.; Taddei, A.; Ricci, F.; Ringressi, M.N.; Borrelli, R.; Melli, F.; et al.Preliminary Comparison of Oral and Intestinal Human Microbiota in Patients with Colorectal Cancer: A Pilot Study. Front.Microbiol. 2017, 8, 2699. [CrossRef] [PubMed]
101. Zhang, J.; Kobert, K.; Flouri, T.; Stamatakis, A. PEAR: A fast and accurate Illumina Paired-End reAd mergeR. Bioinformatics 2014,30, 614–620. [CrossRef]
102. Edgar, R.C. Search and clustering orders of magnitude faster than BLAST. Bioinformatics 2010, 26, 2460–2461. [CrossRef]103. Quast, C.; Pruesse, E.; Yilmaz, P.; Gerken, J.; Schweer, T.; Yarza, P.; Peplies, J.; Glockner, F.O. The SILVA ribosomal RNA gene
database project: Improved data processing and web-based tools. Nucleic Acids Res. 2013, 41, D590–D596. [CrossRef]104. Caporaso, J.G.; Kuczynski, J.; Stombaugh, J.; Bittinger, K.; Bushman, F.D.; Costello, E.K.; Fierer, N.; Pena, A.G.; Goodrich, J.K.;
Gordon, J.I.; et al. QIIME allows analysis of high-throughput community sequencing data. Nat. Methods 2010, 7,335–336. [CrossRef]
105. Zhu, H.; Qu, F.; Zhu, L.H. Isolation of genomic DNAs from plants, fungi and bacteria using benzyl chloride. Nucleic Acids Res.1993, 21, 5279–5280. [CrossRef]
106. Cifani, C.; Micioni Di Bonaventura, M.V.; Pucci, M.; Giusepponi, M.E.; Romano, A.; Di Francesco, A.; Maccarrone, M.; D’Addario,C. Regulation of hypothalamic neuropeptides gene expression in diet induced obesity resistant rats: Possible targets for obesityprediction? Front. Neurosci. 2015, 9, 187. [CrossRef] [PubMed]
107. Cocci, P.; Moruzzi, M.; Martinelli, I.; Maggi, F.; Micioni Di Bonaventura, M.V.; Cifani, C.; Mosconi, G.; Tayebati, S.K.; Damiano, S.;Lupidi, G.; et al. Tart cherry (Prunus cerasus L.) dietary supplement modulates visceral adipose tissue CB1 mRNA levels along withother adipogenesis-related genes in rat models of diet-induced obesity. Eur. J. Nutr. 2021, 60, 2695–2707. [CrossRef] [PubMed]
108. Giusepponi, M.E.; Kern, M.; Chakaroun, R.; Wohland, T.; Kovacs, P.; Dietrich, A.; Schon, M.R.; Krohn, K.; Pucci, M.; Polidori, C.;et al. Gene expression profiling in adipose tissue of Sprague Dawley rats identifies olfactory receptor 984 as a potential obesitytreatment target. Biochem. Biophys. Res. Commun. 2018, 505, 801–806. [CrossRef]
109. Pucci, M.; Micioni Di Bonaventura, M.V.; Vezzoli, V.; Zaplatic, E.; Massimini, M.; Mai, S.; Sartorio, A.; Scacchi, M.; Persani, L.;Maccarrone, M.; et al. Preclinical and Clinical Evidence for a Distinct Regulation of Mu Opioid and Type 1 Cannabinoid ReceptorGenes Expression in Obesity. Front. Genet. 2019, 10, 523. [CrossRef] [PubMed]
110. Chang, S.; Graham, B.; Yakubu, F.; Lin, D.; Peters, J.C.; Hill, J.O. Metabolic differences between obesity-prone and obesity-resistantrats. Am. J. Physiol. 1990, 259, R1103–R1110. [CrossRef]
111. Levin, B.E.; Dunn-Meynell, A.A.; Balkan, B.; Keesey, R.E. Selective breeding for diet-induced obesity and resistance in Sprague-Dawley rats. Am. J. Physiol. 1997, 273, R725–R730. [CrossRef] [PubMed]
112. Levin, B.E.; Hogan, S.; Sullivan, A.C. Initiation and perpetuation of obesity and obesity resistance in rats. Am. J. Physiol. 1989, 256,R766–R771. [CrossRef]
113. Giles, E.D.; Jackman, M.R.; MacLean, P.S. Modeling Diet-Induced Obesity with Obesity-Prone Rats: Implications for Studies inFemales. Front. Nutr. 2016, 3, 50. [CrossRef]
114. Pagliassotti, M.J.; Knobel, S.M.; Shahrokhi, K.A.; Manzo, A.M.; Hill, J.O. Time course of adaptation to a high-fat diet inobesity-resistant and obesity-prone rats. Am. J. Physiol. 1994, 267, R659–R664. [CrossRef] [PubMed]

Int. J. Mol. Sci. 2021, 22, 11171 24 of 24
115. Arora, T.; Anastasovska, J.; Gibson, G.; Tuohy, K.; Sharma, R.K.; Bell, J.; Frost, G. Effect of Lactobacillus acidophilus NCDC 13supplementation on the progression of obesity in diet-induced obese mice. Br. J. Nutr. 2012, 108, 1382–1389. [CrossRef] [PubMed]
116. Furet, J.P.; Kong, L.C.; Tap, J.; Poitou, C.; Basdevant, A.; Bouillot, J.L.; Mariat, D.; Corthier, G.; Dore, J.; Henegar, C.; et al.Differential adaptation of human gut microbiota to bariatric surgery-induced weight loss: Links with metabolic and low-gradeinflammation markers. Diabetes 2010, 59, 3049–3057. [CrossRef] [PubMed]
117. Su, X.; Kong, Y.; Peng, D.Q. New insights into apolipoprotein A5 in controlling lipoprotein metabolism in obesity and themetabolic syndrome patients. Lipids Health Dis. 2018, 17, 174. [CrossRef] [PubMed]


