Embed Size (px)
Citation preview
SUPPLEMENTAL RESULTS
H2O
Wt Primers
RMB Primers
A
C
536 bp
384 bp
RMB/+
RMB/R
MB
+/+
H2O RMB/+
RMB/R
MB
+/+
3 4 5 61 2
(1)
loxP
7
BamH1 BamH115.6 Kb
3’ probe5’ probe
4 5 6 7
BamH1
I T p D neor
CRE
BamH112.4 Kb
loxP
(3)
3 4 5 61 2 7
BamH15.8 Kb
5’ probeloxP
BamH1
I T p D neor
CREloxP
B
12.4 kb15.6 kb 15.6 kb
5.8 kb
3' 5'Probes
Supplemental Figure 1 Generation and screening of RMB mice.(A) Strategy used to generate RMB knock-in mice. (1) Partial restrictionmap of the wild-type Ms4a2 gene coding for the Fc RI chain. Exons are depicted as grey boxes. The 5’ and 3’ single-copy probes used to verify proper homologous recombination events by Southern blot analysis after BamH1 digestion are shown. (2) Targeting vector used for the introduction of an IRES-tdTomato-2A-hDTR cassette in the 3’ untranslated region of the Ms4a2 gene. This cassette is flanked at its 3’ end by an auto-deletingloxP-Cre-NeoR-loxP cassette. TK: thymidine kinase expression cassette abutted onto the 3’ end of the right homology arm. I: IRES, T: tdTomato, p: peptide 2A, D: hDTR. (3) Structure of the targeted allele followinghomologous recombination and prior to Cre-mediated self-excision of the neoR cassette. (4) Structure of thetargeted allele after auto-deletion of the Cre-NeoR cassette in male gametes. (B) Southern blot analysis ofrecombinant ES clones. ES cell DNA was digested with BamH1 and hybridized to the 5' and 3' probes shownin (A). (C) Genotyping of tail DNA from wild-type and from heterozygous and homozygous RMB mice for the targeted Ms4a2 allele using a mix of the three primers specified in the Methods section.
TK (2)3’ probe
(4)
3 4 5 61 2 7
loxP
I T p D
A B
C D
E
FcεRI
% o
f m
ax
B6
RMB
0 100 200 300 400 500 600
0.0
0.2
0.4
0.6
0.8
1.0
1.2B6
RMB
Time (s)
2mM Ca2+
DNP
HSA
Iono
td-Tomato
CD
11
7
CD
11
7
B6 RMB
td-Tomato
F
RMB
B630
20
10
0
0 0.1 1 10 50 100
% o
f d
eg
ran
ula
tio
n
30
20
10
0
% o
f d
eg
ran
ula
tio
n
0 10 20 30 40 50 60
0 5 10 15 0 5 10 15
B6 RMB
50
37
(kDa)
50
37
RMB
B6
IB:
p-ERK
IB:
ERK
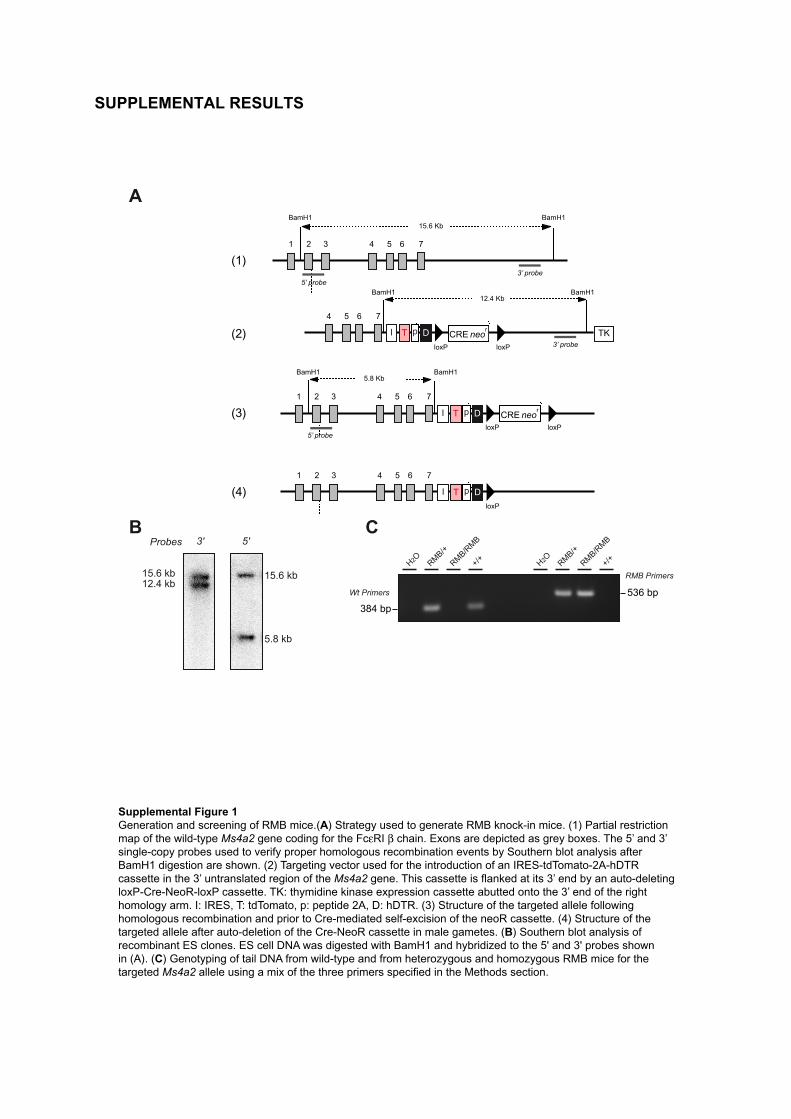
Supplemental Figure 2Wild-type and RMB mast cells are functionally equivalent. (A) CD117 and td-Tomato labeling of BMMCs from RMB
and B6 mice. Granules were stained with toluidine blue. (B) Fc RI expression in BMMCs from RMB and B6 mice.
(C) Kinetics of ERK phosphorylation in BMMCs from RMB and B6 mice after Fc RI stimulation. (D) Fc RI-induced
calcium mobilization in BMMCs from RMB mice (open circles) and B6 mice (gray circles). Ionomycin (Iono) was
used to generate the maximum response. (E and F) DNP-HSA dose response and kinetics of degranulation at
10 ng/ml DNP-HSA of RMB (black bars and black circles) and of B6 (gray bars and gray circles) BMMCs
pre-incubated overnight with anti-DNP IgE. Data represent mean ± SEM.
B6
RMB
Time (s)DNP-HSA (ng/ml)
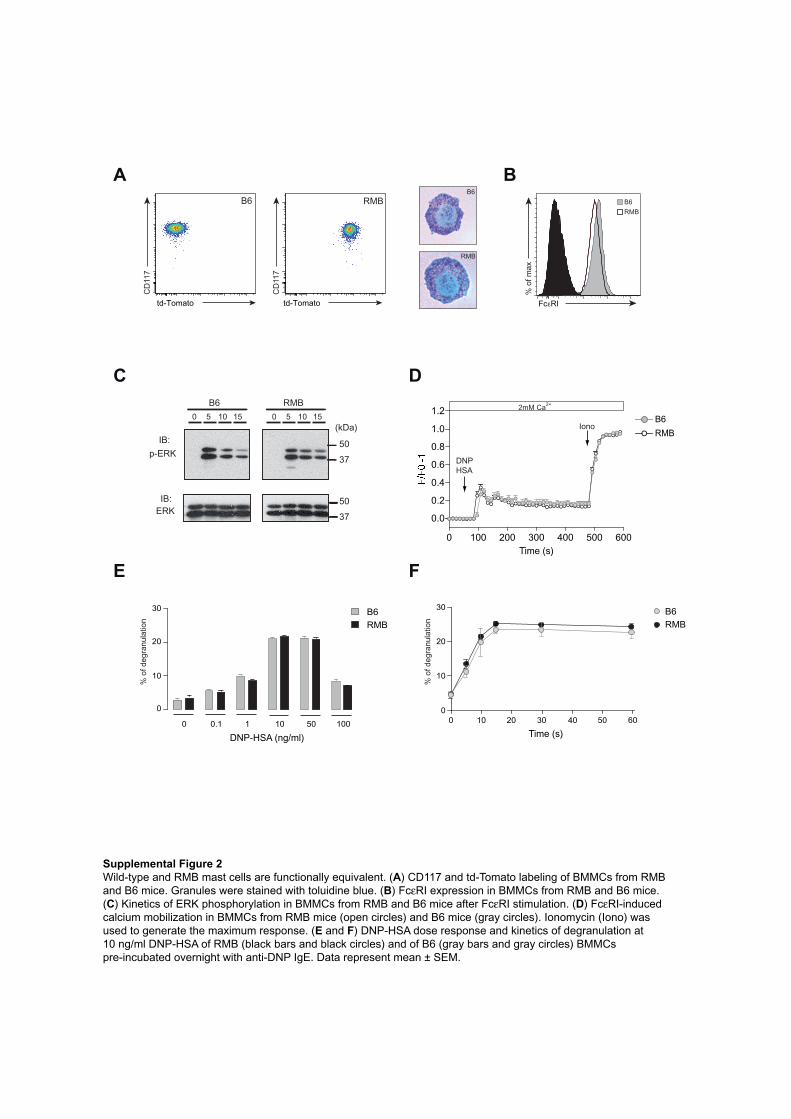
Supplemental Figure 3FACS characterization of mast cells and basophils from RMB mice. (A) td-Tomato fluorescence ofthe total mast cell population (Fc RI+CD117+) recovered from the peritoneal cavity of RMB mice. (B) td-Tomato fluorescence of blood basophils (Fc RI+CD49b+) from RMB mice.
A
B
Fcε
RI
td-TomatoCD117%
of m
ax
- DT
Fcε
RI
CD49b td-Tomato
% o
f max
- DT
A
B
Hem
oglo
bin
(g/d
l)
456789
10111213141516
WshHb<12
WshHb>12
B6 WshAnemic
WshNon anemic
B63
4
5
6
7
8
9
10
11
12
Red
blo
od c
ells
(10
6 /ul)
20
25
30
35
40
45
50
55
WshAnemic
WshNon anemic
B6
Hem
atoc
rit (
%)
0
10
20
30
40
WshAnemic
WshNon anemic
B6
Whi
te b
lood
cel
ls (
103 /u
l)
0
1
2
3
4
5
Mon
ocyt
es (
103 /u
l)
WshAnemic
WshNon anemic
B60
2
4
6
8
10
12
WshAnemic
WshNon anemic
B6
Neu
trop
hils
(10
3 /ul)
C
Wsh
Ane
mic
Wsh
Non
ane
mic
Wsh
Ane
mic
Wsh
Non
ane
mic
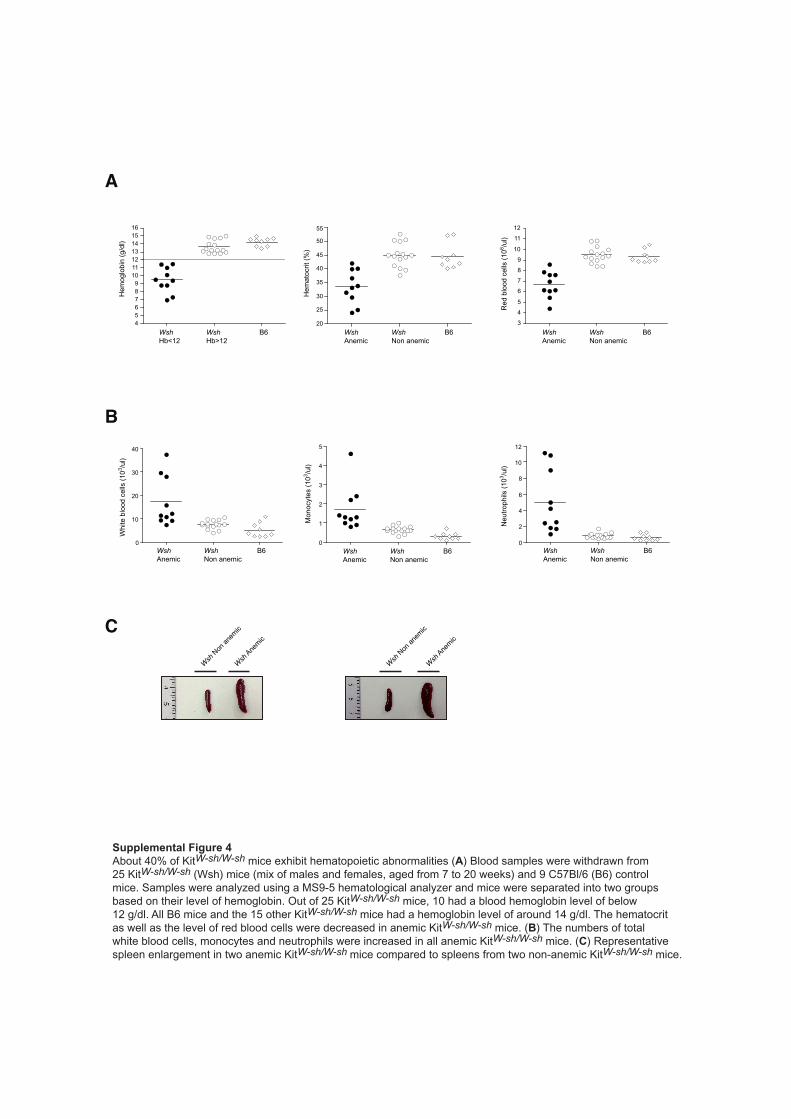
Supplemental Figure 4About 40% of KitW-sh/W-sh mice exhibit hematopoietic abnormalities (A) Blood samples were withdrawn from 25 KitW-sh/W-sh (Wsh) mice (mix of males and females, aged from 7 to 20 weeks) and 9 C57Bl/6 (B6) control mice. Samples were analyzed using a MS9-5 hematological analyzer and mice were separated into two groupsbased on their level of hemoglobin. Out of 25 KitW-sh/W-sh mice, 10 had a blood hemoglobin level of below 12 g/dl. All B6 mice and the 15 other KitW-sh/W-sh mice had a hemoglobin level of around 14 g/dl. The hematocritas well as the level of red blood cells were decreased in anemic KitW-sh/W-sh mice. (B) The numbers of total white blood cells, monocytes and neutrophils were increased in all anemic KitW-sh/W-sh mice. (C) Representativespleen enlargement in two anemic KitW-sh/W-sh mice compared to spleens from two non-anemic KitW-sh/W-sh mice.
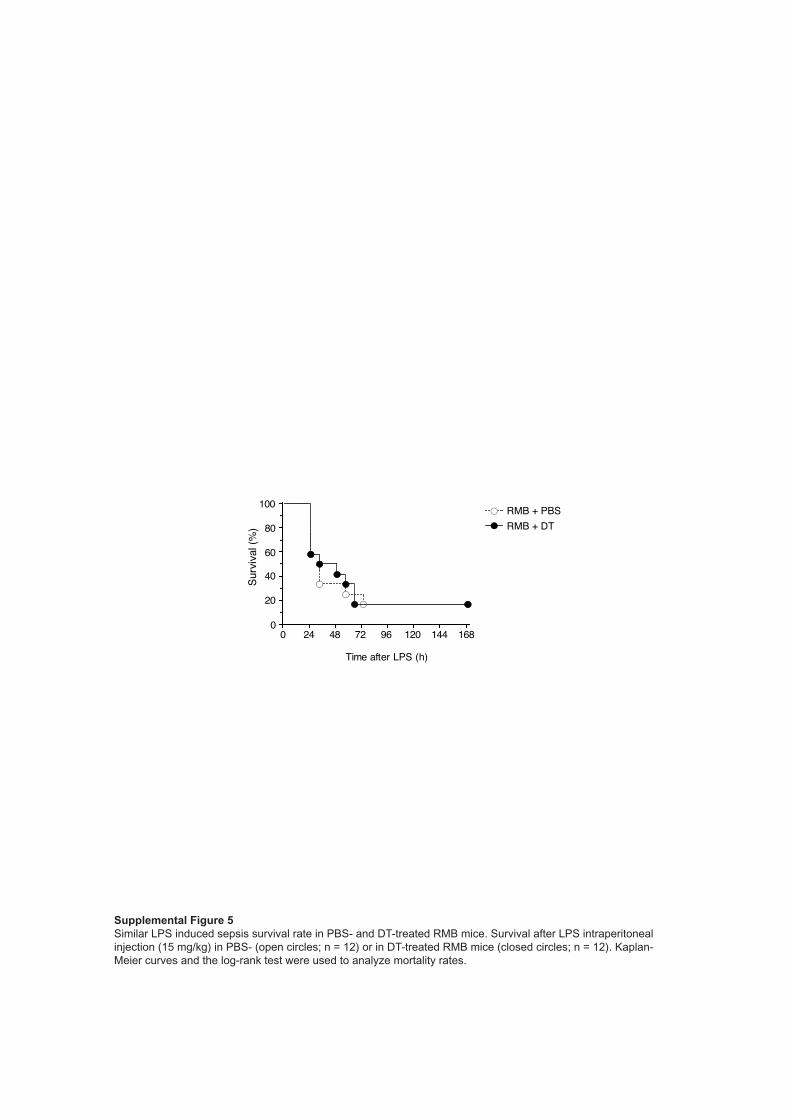
Supplemental Figure 5Similar LPS induced sepsis survival rate in PBS- and DT-treated RMB mice. Survival after LPS intraperitonealinjection (15 mg/kg) in PBS- (open circles; n = 12) or in DT-treated RMB mice (closed circles; n = 12). Kaplan-Meier curves and the log-rank test were used to analyze mortality rates.
Surv
ival
(%)
Time after LPS (h)
0
20
40
60
80
100
0 24 48 72 96 120 144 168
RMB + PBSRMB + DT
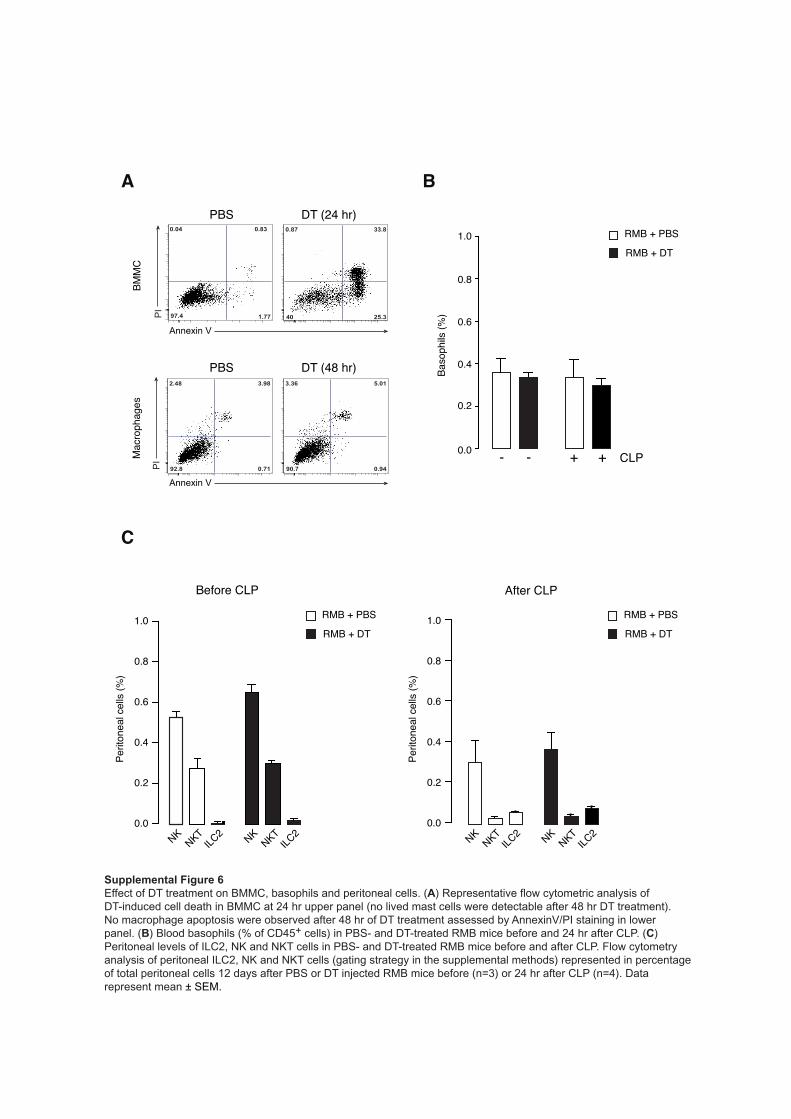
Supplemental Figure 6Effect of DT treatment on BMMC, basophils and peritoneal cells. (A) Representative flow cytometric analysis of DT-induced cell death in BMMC at 24 hr upper panel (no lived mast cells were detectable after 48 hr DT treatment). No macrophage apoptosis were observed after 48 hr of DT treatment assessed by AnnexinV/PI staining in lower panel. (B) Blood basophils (% of CD45+ cells) in PBS- and DT-treated RMB mice before and 24 hr after CLP. (C)Peritoneal levels of ILC2, NK and NKT cells in PBS- and DT-treated RMB mice before and after CLP. Flow cytometryanalysis of peritoneal ILC2, NK and NKT cells (gating strategy in the supplemental methods) represented in percentageof total peritoneal cells 12 days after PBS or DT injected RMB mice before (n=3) or 24 hr after CLP (n=4). Data represent mean ± SEM.
0.0
0.2
0.4
0.6
0.8
1.0
Perit
onea
l cel
ls (%
)
NKILC
2NKT
Before CLP
NKILC
2NKT
RMB + PBS
RMB + DT
0.0
0.2
0.4
0.6
0.8
1.0
Perit
onea
l cel
ls (%
)
After CLP
NKILC
2NKT NK
ILC2
NKT
RMB + PBS
RMB + DT
A
C
PBS0.87 33.8
25.340
0.04 0.83
1.7797.4
PI
Annexin V
DT (24 hr)
PBS DT (48 hr)
PI
Annexin V
Mac
roph
ages
BMM
C
3.36 5.01
0.9490.7
2.48 3.98
0.7192.8
B
0.0
0.2
0.4
0.6
0.8
1.0
CLP
RMB + PBS
RMB + DT
Baso
phils
(%)
- - + +
PBS DT0
0.2
0.4
0.6
0.8
1
1.2
Ph
ag
ocyto
sis
in
de
x
PBS DT
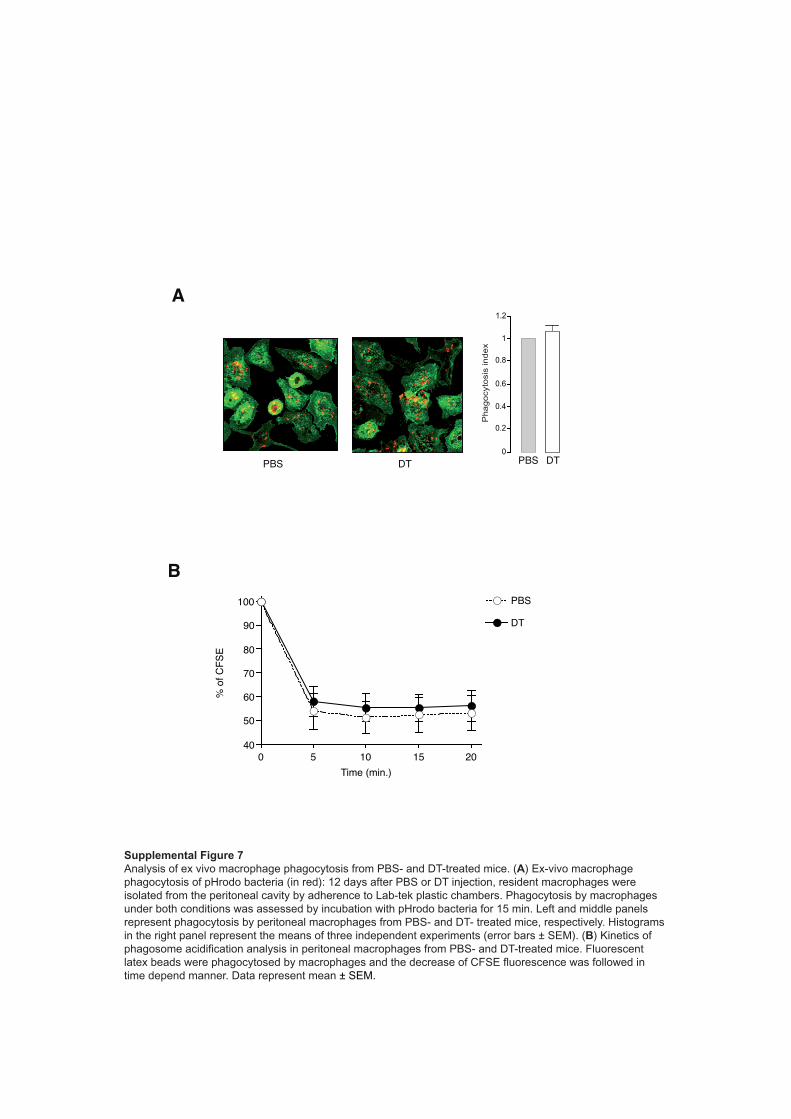
Supplemental Figure 7Analysis of ex vivo macrophage phagocytosis from PBS- and DT-treated mice. (A) Ex-vivo macrophage
phagocytosis of pHrodo bacteria (in red): 12 days after PBS or DT injection, resident macrophages were
isolated from the peritoneal cavity by adherence to Lab-tek plastic chambers. Phagocytosis by macrophages
under both conditions was assessed by incubation with pHrodo bacteria for 15 min. Left and middle panels
represent phagocytosis by peritoneal macrophages from PBS- and DT- treated mice, respectively. Histograms
in the right panel represent the means of three independent experiments (error bars ± SEM). (B) Kinetics of
phagosome acidification analysis in peritoneal macrophages from PBS- and DT-treated mice. Fluorescent
latex beads were phagocytosed by macrophages and the decrease of CFSE fluorescence was followed in
time depend manner. Data represent mean ± SEM.
0 5 10 15 2040
50
60
70
80
90
100 PBS
DT
Time (min.)
A
B
% o
f CFS
E
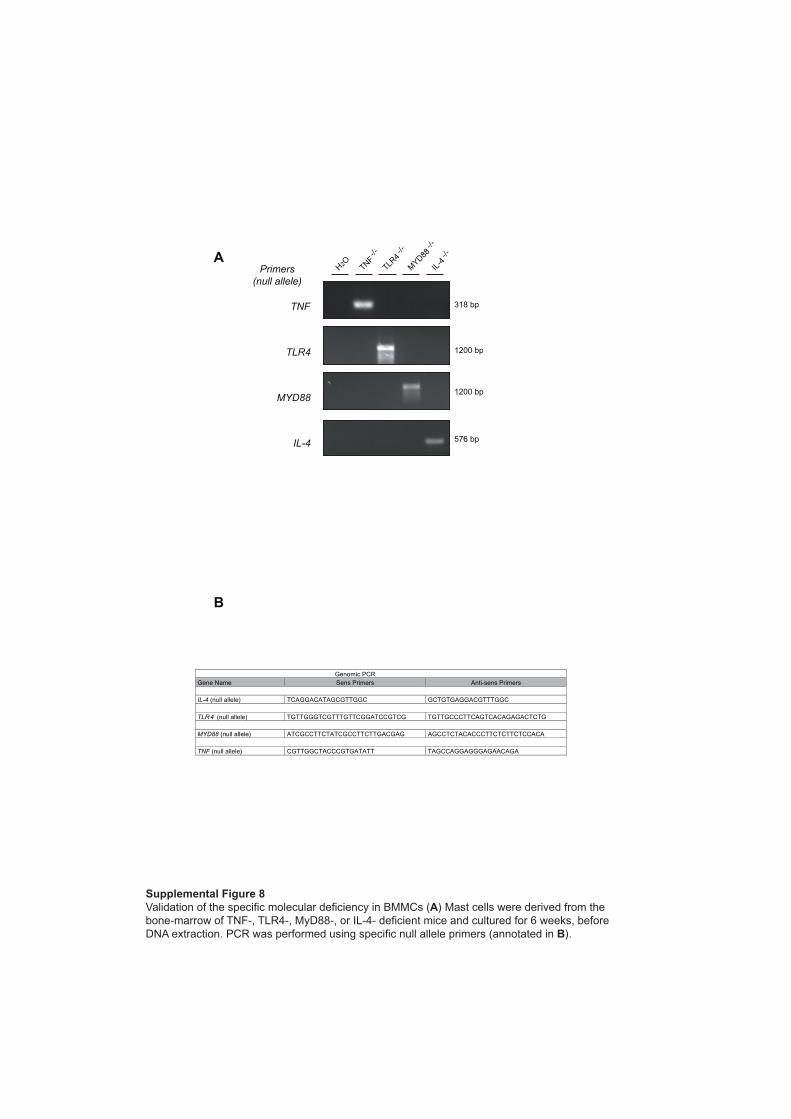
H2O TNFTLR
4M
YD88
IL-4
-/- -/--/-
-/-
TNF
TLR4
MYD88
IL-4
318 bp
1200 bp
1200 bp
576 bp
Genomic PCR Gene Name Sens Primers Anti-sens Primers
IL-4 (null allele) TCAGGACATAGCGTTGGC GCTGTGAGGACGTTTGGC TLR4 (null allele) TGTTGGGTCGTTTGTTCGGATCCGTCG TGTTGCCCTTCAGTCACAGAGACTCTG MYD88 (null allele) ATCGCCTTCTATCGCCTTCTTGACGAG AGCCTCTACACCCTTCTCTTCTCCACA TNF (null allele) CGTTGGCTACCCGTGATATT TAGCCAGGAGGGAGAACAGA
Primers(null allele)
Supplemental Figure 8Validation of the specific molecular deficiency in BMMCs (A) Mast cells were derived from thebone-marrow of TNF-, TLR4-, MyD88-, or IL-4- deficient mice and cultured for 6 weeks, beforeDNA extraction. PCR was performed using specific null allele primers (annotated in B).
A
B
0
1
2
3
4
5
% o
f Mas
t cel
ls
DT-RM
B+BM
MC B
6
PBS-B6
PBS-RM
B
DT-RM
B+BM
MC R
MB
DT-RM
B+BM
MC B
6
PBS-B6
PBS-RM
B
DT-RM
B+BM
MC R
MB
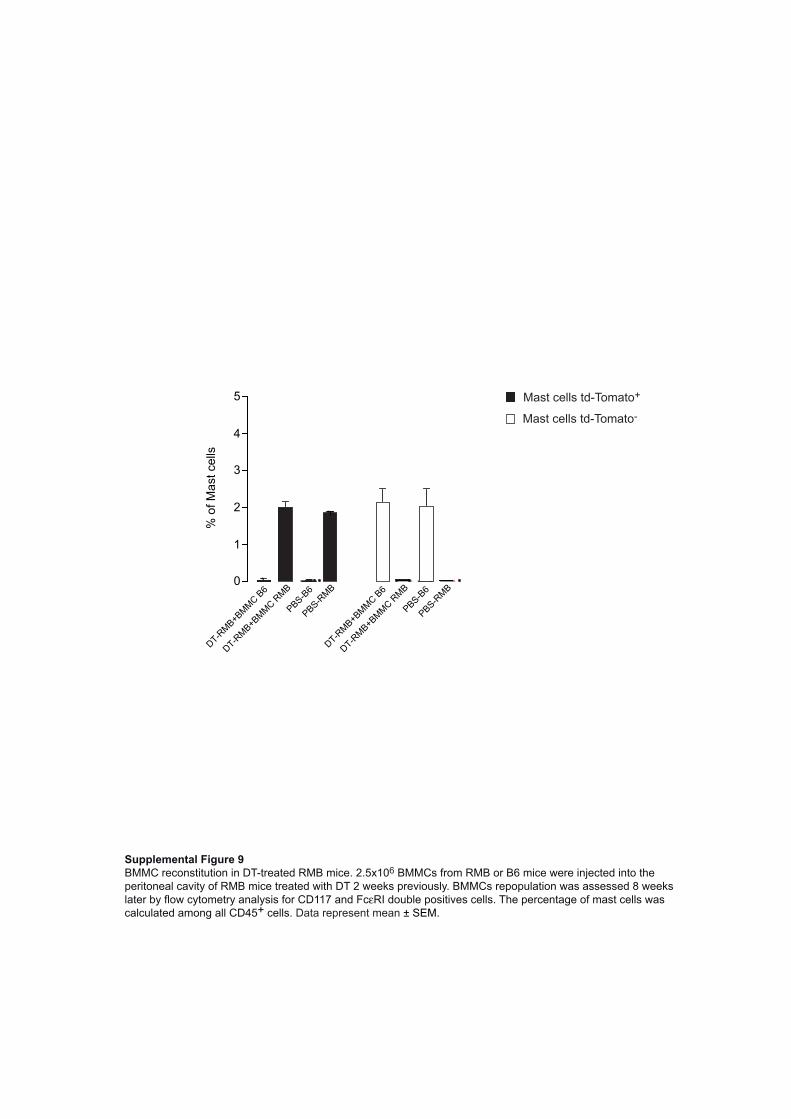
Mast cells td-Tomato+
Mast cells td-Tomato-
Supplemental Figure 9BMMC reconstitution in DT-treated RMB mice. 2.5x10⁶ BMMCs from RMB or B6 mice were injected into theperitoneal cavity of RMB mice treated with DT 2 weeks previously. BMMCs repopulation was assessed 8 weekslater by flow cytometry analysis for CD117 and Fc RI double positives cells. The percentage of mast cells wascalculated among all CD45+ cells. Data represent mean ± SEM.
SUPPLEMENTAL METHODS Construction and identification of the RMB mice. RMB targeting vector. A 8 kb genomic fragment encompassing exons 4 to 7 of the
Ms4a2 gene was isolated from a BAC clone of C57BL/6J origin (clone n° RP23-
359014; http://www.lifesciences.sourcebioscience). Using ET recombination, an
IRES-tdTomato-2A-hDTR-loxP-Cre-neoRloxP cassette was introduced in the 3’
untranslated region of the Ms4a2gene, 14 bp downstream of the stop codon. Finally,
the targeting construct was abutted to a thymidine kinase expression cassette and
linearized with Fse1.
Isolation of recombinant embryonic stem (ES) cell clones. JM8.F6 C57BL/6N ES
cells were electroporated with the linearized RMB targeting vector. After selection in
G418 and gancyclovir, ES cell clones were screened for proper homologous
recombination by Southern blot. When tested on BamHI-digested genomic DNA, the
5’ single-copy probe used to identify proper recombination events hybridized to a
15.6 kb wild-type fragment and to a 5.8 kb recombinant fragment. When tested on
BamHI-digested genomic DNA, the 3’ single-copy probe used to identify proper
recombination events hybridized to a 15.6 kb wild-type fragment and to a 12.4 kb
recombinant fragment. A neomycin-specific probe was used to ensure that
adventitious non-homologous recombination events had not occurred in the selected
ES clones.
Production of knock-in mice. Properly recombined ES cells were injected into FVB
blastocysts. Germline transmission led to the self-excision of the loxP-Cre-NeoR-loxP
cassette in male germinal cells. RMB mice were identified by PCR of tail DNA.
Briefly, tails were digested overnight with proteinase K (100 µg/ml) at 56°C. DNA was
precipitated by isopropanol, washed in ethanol and resuspended in TER buffer (Tris-
HCl 10 mM, EDTA 1 mM, RNase H 20 µg/ml). PCR were performed using a mixture
of the three following primers: sense WT primer: 5’-
CAGGTCCCAGATGATCGTCTTTATGAA-3, sense RMB: 5’-
CCCAGTGGAAAATCGCTTATATACC-3’, and anti-sense WT/RMB: 5’-
CAATAAAGCCAACTTATTCCTTGATGAC-3’. After an initial cycle at 95°C for 5
minutes, cycle conditions (35 cycles) were 94°C for 45 sec, 60°C for 45 sec and 72°C
for 45 sec. Finally the reaction was incubated at 72°C for 5 minutes. This trio of
primers amplified a 370 bp band in the case of the WT allele and a 536 bp band in
the case of the RMB allele.
Ca2+ measurement. Ca2+ mobilization was acquired with fluorometric imaging system (Till-photonics), as
previously described (Barbet et al., 2008). BMMC were FCS starved and sensitized
overnight with DNP-IgE. BMMC were incubated on polylysine pretreated in glass-
bottom dishes (MatTek) for 45 min at room temperature to be adherent. BMMC were
loaded for 15 min at 37°C and then 15 min at room temperature with pluronic acid
and 1 µg/ml Fura 2-AM (both from Invitrogen) in BMMC medium. The cells were then
washed with Ringer’s solution (in mM: 145 NaCl, 5.4 KCl, 2 CaCl2, 1 MgCl2, 10
glucose, 10 HEPES, and 0.1% BSA, pH adjusted to 7.5). Ca2+ influx was triggered by
adding DNP-HSA (to IgE-sensitized cells). Individual fluorescence values were then
analyzed with Origin software to normalize the fluorescence with the first value
according to the equation (F/F0)-1, where 'F' is the fluorescence at specific time point
and 'F0' is the fluorescence at time 0. The area under the curve was calculated for
each cell.
Western-blot on total lysates. BMMC (2 x 10⁶) were FCS starved and sensitized overnight with anti-DNP IgE before
activation for 10 or 30 min with 10 ng/ml DNP-HSA. BMMC were lysed in 100 µl of
lysis buffer (62,5 mM Tris-HCl, pH 6.8, 2% SDS, 10% glycerol, 50 mM DTT) and 20
µl of sample were resolved by 10% SDS-PAGE. After being transferred onto
nitrocellulose membrane and blocking in 4% BSA. Membranes were incubated with
rabbit anti-phospho ERK (Cell signaling, 1:5,000 dilution) or anti-ERK2 antibody
(Santa Cruz, 1:2,000) overnight at 4°C. Donkey anti-rabbit HRP (1:10.000, GE
healthcare, Buckinghamshire, UK) was used as a secondary antibody for 1 h at room
temperature and labeled bands were detected using ECL western blotting detection
system (GE healthcare).
IL-4 secretion assay IL-4 released from peritoneal mast cells was detected using a Miltenyi Biotech Mouse
IL-4 secretion assay. Peritoneal cells were recovered by flushing the peritoneal cavity
of B6 mice with ice-cold PBS. Cells were counted and dispensed at 2 x 10⁶ cells per
condition in cold medium (RPMI-1640, 10% FCS). Peritoneal cells were incubated
with the mouse anti-IL-4 catch reagent for 20 minutes on ice. After a wash step, cells
were resuspended in 600 µl of warm medium, alone or supplemented with
stimulating agents (live E. coli K12 or PMA 2nM/ionomycin 400nM) and incubated at
37°C for 15 min. IL-4 secretion was stopped on ice and washing twice in cold buffer
(PBS, 0.5% BSA, 2mM EDTA), and cells incubated with the Mouse IL-4 Detection
antibody for 10 minutes on ice. An additional labeling step with a rat anti-mouse
CD117 was performed to gate mast cells.
Mast cell degranulation
BMMC were plated at 0.5 × 10⁶ cells in 96-well polypropylene plate in BMMC
medium in the absence of SCF and incubated overnight with anti-DNP-IgE.
Additional anti-DNP-IgE was added the next morning for 2 h. Cells were then washed
and stimulated with various concentrations of DNP-HSA for the indicated times in
Tyrode's buffer (10 mM HEPES, pH 7.4, 130 mMNaCl, 5 mMKCl, 1.4 mM CaCl2, 1
mM MgCl2, 5.6 mM glucose, and 0.1% bovine serum albumin (BSA)) and the
released β-hexosaminidase was measured directly in supernatants.
Passive systemic anaphylaxis 12 days before experiments, mice were injected twice with either with DT or PBS i.p.
An IPTT-300 (Plexx) temperature probe was implanted subcutaneously into the neck
of the mouse on Day 10. Mice were sensitized with 20 µg of mouse anti-DNP IgE
(H1-ε-26) i.v., 24 h before an i.v. challenge with 1 mg DNP-HSA. Body temperature
changes were monitored using a DAS-7007S wireless reader (Plexx) every 10
minutes for 100 minutes.
Flow cytometry Cells were stained with fluorochrome-conjugated monoclonal antibodies NK1.1
(PK136) (Becton Dickinson), NKp46 (29A1.4), CD90.2 (53-2.1), CD127 (A7R34),
Sca-1 (D7), CD25 (PC61.5) (ebioscience), T1/ST2 (Dj8) (MD products). Among tdT-
cells, gating strategy was the following: NK (CD19-CD3-NKp46+NK1.1+), NKT (CD19-
CD3+NK1.1+), ILC2 (CD19-CD3-βTCR-NK1.1-CD90.2+CD127+CD25+Sca1+T1/ST2+).
LPS induced sepsis model 12 days after PBS or DT injection, 15 mg/kg of LPS (0111:B4 ; Chondrex) was ip
injected. Mouse survival was monitored every 8 h for the first 3 days and then every
12 h until Day 7.
Apoptosis 12 days after PBS or DT injection, peritoneal macrophages were cultured by
adherence overnight in RPMI 1% FCS. The next day, cells are washed and adherent
cell were cultured in RPMI 10% FCS with PBS or DT (1 µg) for 48 h. Macrophages
were stained with FITC Annexin V and PI according to the manufacturer (BD FITC
Annexin V apoptosis detection kit I). Briefly, after 2 washes in PBS, cells were
resuspended in binding buffer and incubated for 15 min at room temperature in the
dark with Annexin V and PI. 400 µl of binding buffer were added and cells were
immediately analyzed on LSR Fortessa.
Phagosome acidification assay
3 µm amino latex beads from a 2.5 % aqueous suspension (polysciences) were
incubated in 400 µl of sodium hydrogen carbonate 0.1 M buffered at pH 8.5 with 50
µl of a 50 mg/ml CFSE and 50 µl of a 1 mg/ml FluoProbes 647 (Interchim) for 2 h at
room temperature with continuous rotation in the dark. Beads were then washed
twice in 0.1 M glycine-PBS pH 7.2 buffer once in PBS and resuspended in 1 ml
serum free RPMI 20 mM HEPES. Peritoneal macrophages in warm serum-free
HEPES RPMI were mixed with 50 µl of resuspended bead, immediately centrifuged
for 30 sec at 1000 rpm and incubated for 10 min at 37°C for the pulse phase. Cells
were washed 3 times with cold PBS and resuspended in warm RPMI 10% FCS. Cells
were incubated at 37°C for kinetics. 50 µl of cells were taken out for each time point,
and mixed in 500 µl of cold PBS to stop the reaction and immediately analyzed on a
LSR Fortessa.