Embed Size (px)
Citation preview

Nanoscale
PAPER
Cite this: Nanoscale, 2015, 7, 8782
Received 4th February 2015,Accepted 8th April 2015
DOI: 10.1039/c5nr00823a
www.rsc.org/nanoscale
Superior plasmon absorption in iron-dopedgold nanoparticles†
Vincenzo Amendola,*a Rosalba Saija,b Onofrio M. Maragòc and Maria Antonia Iatìc
Although the excitation of localized surface plasmons is associated with enhanced scattering and absorption
of incoming photons, only the latter is relevant for the efficient conversion of light into heat. Here we show
that the absorption cross section of gold nanoparticles is sensibly increased when iron is included in the
lattice as a substitutional dopant, i.e. in a gold–iron nanoalloy. Such an increase is size and shape dependent,
with the best performance observed in nanoshells where a 90–190% improvement is found in a size range
that is crucial for practical applications. Our findings are unexpected according to the common belief and
previous experimental observations that alloys of Au with transition metals show a depressed plasmonic
response. These results are promising for the design of efficient plasmonic converters of light into heat and
pave the way to more in-depth investigations of the plasmonic properties in noble metal nanoalloys.
Introduction
Multiple scientific and technological applications rely onlocalized surface plasmon resonances (LSPRs), which occurswhen free electrons in nanoparticles (NPs) are collectivelyexcited by electromagnetic radiation.1 The highest valuesknown in nature for the extinction cross section (σExt) arefound in noble metal NPs.2 Photons exciting plasmons areeither absorbed or scattered, and the probability of the twoevents is determined, respectively, by the NP absorption (σAbs)and scattering (σSca) cross sections, whose sum gives theσExt.
3,4 Since different properties are associated with scatteringand absorption, σAbs and σSca are the relevant quantities forreal applications of plasmonic NPs.5–7 Light scattering is anelastic process consisting in the modification of photon propa-gation direction,3 therefore NPs with a large σSca are preferen-tially exploited for biolabelling and sensing up to singleparticle sensitivity,8 as well as for nanolensing and enhance-ment of nonlinear optical properties in nearby objects,9–13
such as plasmonic enhanced near-field absorption in solarcells,14 surface enhanced Raman scattering15–17 or plasmonicenhanced third harmonic generation.18
Instead, light absorption consists in the transfer of photonenergy to the plasmonic nanostructure, where it is rapidly con-verted to heat.7 Therefore, NPs with a large σAbs are suitable forphotothermal processes such as photothermal therapy,6,19,20
drug release,21,22 photoacoustic imaging8,23 photothermalcontrast imaging,24,25 photothermal-induced resonanceimaging,26 photothermal polymerization,27 plasmonic pattern-ing28,29 and light induced vapour generation.30–32 Another con-sequence of photon absorption is the alteration of theequilibrium electron Fermi distribution in the metal NPs,33–35
which allows charge injection in the conduction band ofnearby semiconductors33,36 and it is exploited for plasmon-enhanced catalysis37,38 and photocurrent generation.39,40
Since the σAbs and σSca of noble metal NPs grow with,respectively, the 3rd and 6th power of particle size,3,6 there is asize threshold at which scattering equals absorption.5,6 Thisthreshold depends on the shape, structure, and compositionof NPs,6,41 and for noble metal NPs it falls approximately at60–100 nm.6,42,43 Consequently, absorption for unit mass ismaximized by reducing the particle size,42,43 although in thisway the absolute capacity of light-to-heat conversion in thesingle NP is dramatically diminished.5,6,42,44 Alternatively, onecan choose the shape and structure to maximize the absorp-tion cross section.5,6,20 For instance, at equal volumes, Aunanorods (NRs) have larger σAbs than Au nanoshells (NSs) com-posed of a silica core coated with a gold layer.5,6
In addition to the size and structure, the composition ofmetal NPs is another degree of freedom to maximize theplasmon absorption.9 This controls the complex permittivity,ε, on which σAbs and σSca ultimately depends.1,3 Indeed, com-position has been seldom considered as a parameter fortuning the plasmonic response of noble metal NPs,9,45–49 and
†Electronic supplementary information (ESI) available: Definition ofσ[400–1200 nm] and σ(800 nm), spectral dependence of σAbs, experimental AuFeoptical constants. See DOI: 10.1039/c5nr00823a
aDepartment of Chemical Sciences, University of Padova, via Marzolo 1, I-35131
Padova, Italy. E-mail: [email protected] di Fisica e di Scienze della Terra, Università di Messina, v.le F. Stagno
D’Alcontres 31, I-98166 Messina, ItalycCNR-IPCF, Istituto per i Processi Chimico-Fisici, v.le F. Stagno D’Alcontres 37,
I-98158 Messina, Italy
8782 | Nanoscale, 2015, 7, 8782–8792 This journal is © The Royal Society of Chemistry 2015

there is a relatively low number of metal plasmonic nano-particles composed of elements different from Au or Ag, suchas Pt,50 Pd,51 Ga52 or Al.53 This is often motivated by thegeneral assumption that other metals cannot perform betterthan pure Au and Ag nanostructures, either in terms of plas-monic response, ease of synthesis, physical–chemical stabilityor biocompatibility.2,45
However, recent interest in magneto-plasmonics48,54–56 andplasmon enhanced catalysis57,58 led beyond the well known Auand Ag nanostructures, to the synthesis of plasmonic nano-alloys, such as Au–Fe,48,54 Au–Pt58 and Au–Pd57 compounds. Inthese nanosystems, the plasmonic performance stronglydepends on the alloy composition and stoichiometry. In fact,alloying induces the modification of the band structure of theoriginal metals, e.g., by changing the optical gap, moving theFermi energy and introducing new interband transitions.45 Ingeneral, these alloys exhibit σExt and local field enhancementinferior to pure noble metals with identical size andshape,48,54,57,58 which explains the modest number of studies inwhich these systems are used purely for plasmonic applications.
Here, we show that the alloy NPs composed of a noblemetal (Au) doped with 5–15 atomic% (at%) of a transitionmetal (Fe) have superior absorption cross section to the pureAu counterparts. We started from the experimentally measuredoptical constants of Au–Fe alloys,59 in which iron is present asa substitutional dopant in the face centered cubic lattice ofgold, to calculate by analytical (Mie theory) and numerical(Discrete Dipole Approximation) methods the dependence ofplasmon cross sections on the size and shape of nano-structures. The augmented plasmon absorption in iron-dopedAu nanoalloys is prevalently observed in the red and near infra-red (NIR) frequencies, which actually is the working windowfor most photothermal applications.5,8 In general, these
results suggest that the scarcely investigated field of plasmonicnanoalloys can be a source of new, yet unforeseen solutionsfor the improvement of plasmonic performance.
ResultsIron-doped gold nanoshells
As a benchmark material for photothermal applications, wefirst considered Au NSs.60 In synthetic Au NSs, the scatteringcannot be minimized simply by reducing the size of the wholenanostructure, due to experimental difficulties in the controlof the thickness of the metal layer.5,60 In fact, to obtain aplasmon resonance peaked in the red or NIR, as required inmost biological applications of NSs,8,60 the gold layer must besmall compared to the silica core, and ordinary syntheticapproaches usually do not allow a thickness below ca. 10 nm,unless porous hollow nanostructures such as Au nanocages arepreferred.61 As a consequence, the literature usually reports theuse of NSs with a size above 100 nm,19,21,31,32,62,63 whoseheating performance is severely limited by the large scatteringcontribution.5,6,64 Increasing the σAbs by acting only on the com-position of the metal layer, while maintaining unaltered NSshape and size, would be the preferential strategy to improvethe photothermal features of these nanomaterials.6,60,63 Besides,recent studies evidenced that multiple scattering in NSs isuseful to concentrate light absorption in very small volumes.65
Therefore, by means of Mie theory, we calculated the depen-dence of σExt, σAbs and σSca on the composition of Fe-doped Aualloys, considering a NS with a SiO2 core of radius 60 nm anda 16 nm thick metal shell (60, 16), inspired by those oftendescribed in the literature for photothermal applications(Fig. 1).60,63,66 In order to quantitatively compare the plasmo-
Fig. 1 Mie theory calculations of a (60, 16) NS in water versus iron doping. (a) σExt [400–1200 nm], σAbs [400–1200 nm] and σSca [400–1200 nm]. (b)σExt (800 nm), σAbs (800 nm) and σSca (800 nm). (c–f ) Spectral dependence of σExt (c), σAbs (d), σSca (e) and σAbs/σSca (f ).
Nanoscale Paper
This journal is © The Royal Society of Chemistry 2015 Nanoscale, 2015, 7, 8782–8792 | 8783

nic performance as a function of iron doping, in Fig. 1a weshow the integrated extinction, absorption and scattering crosssections in the 400–1200 nm spectral range (σExt[400–1200 nm], σAbs [400–1200 nm] and σSca [400–1200 nm],respectively, see also Fig. S1 in the ESI†), which is the intervalwhere LSPR of NSs is typically observed.60 The plot of σExt[400–1200 nm] has a maximum for 100 at% Au, whereasextinction decreases with increasing Fe content, as expectedfrom the literature.48,54 However, by looking at the two contri-butions to σExt originating from absorption and scattering, wefound that σSca and σAbs have two opposite trends. The σScasteeply decreases with the Fe content, reaching a plateau at40% of the pure Au value when iron exceeds 25 at%. Instead,the plot of σAbs shows a remarkable maximum correspondingto 182% of its initial value in proximity to 15 at% of iron, andit is always larger than that in the pure Au NS. A similar trendis observed in the plot of the σExt, σAbs and σSca values calcu-lated at 800 nm (Fig. 1b), which is the wavelength frequentlyexploited for in vivo photothermal applications.8,60 In thiscase, the maximum of σAbs (800 nm) is close to 10 at% of iron,where an increase of the 190% of the value in pure Au NS isobserved. The spectral profiles of σExt, σAbs and σSca are com-pared in Fig. 1c–e, showing that the plasmon resonance broad-ens for increasing Fe doping, in agreement with the recentlyobserved plasmon damping in spherical Au–Fe alloy NPs withdifferent compositions.48,54 Interestingly, from the σAbs/σScaratio reported in Fig. 1f, one can see that the absorption mark-edly dominates over scattering in doped Au NSs when thewavelength is longer than 600 nm, whereas below this wave-length the trend is inverted and the absorption over the scat-tering ratio is larger in pure Au NSs.
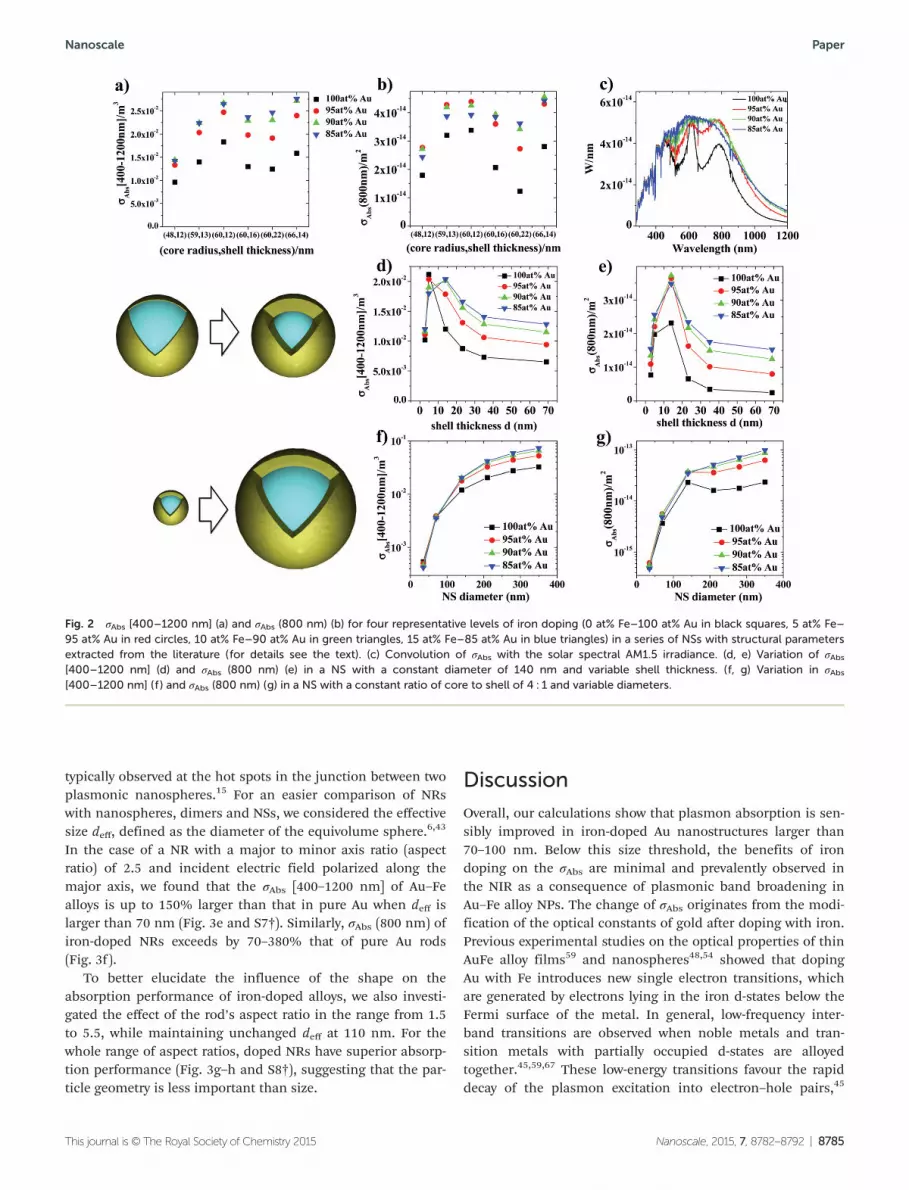
In order to confirm the generality of our finding, we calcu-lated the integrated σAbs [400–1200 nm] and the σAbs (800 nm)for a series of NSs with structural parameters extracted fromthe literature19,21,31,32,60,62,63,66 (Fig. 2a–b and S2 in the ESI†),focusing on four representative levels of iron doping (0, 5, 10and 15 at% Fe). We found that the calculated plasmon absorp-tion is systematically larger in the doped Au nanostructures,with an improvement reaching a remarkable +190% in the (60,22) NSs. Such an increase of σAbs can prove useful to minimizedamage of healthy tissues in photothermal therapy,60 as wellas to increase the minimum detectable amount of NSs inphotothermal imaging techniques.63 In general, such animprovement would allow the reduction of the dose of nano-materials administered for theragnostic purposes, which isimportant for the minimization of side effects related to longterm accumulation of the nanodrugs.60,63
Since (60, 12) NSs have also been applied to vapourgeneration by conversion of sunlight into heat,30–32 the moreappropriate parameter to evaluate the photothermalperformance for such a specific application is the convolutionof the solar spectral irradiance at air mass 1.5 (AM1.5) withσAbs.
30–32 In this case (see Fig. 2c), a remarkable improvementof 40% in the light-to-heat conversion is predicted inthe 280–1200 nm wavelength range by doping the Au shellwith 10 at% of Fe.
In Fig. 2d–g we further investigated the effect of Fe dopingas a function of the structural parameters of NSs, such as thesize and shell thickness (see also Fig. S3–S4†). When the shellthickness exceeds 10 nm, the σAbs [400–1200 nm] and the σAbs(800 nm) of doped shells surmount by more than 50% thoseof pure Au NSs for increasing shell thickness and a fixed dia-meter of 140 nm (Fig. 2d–e and S3†). As stated before, this isequivalent to the smallest thickness found in the literature.60
Interestingly, when σAbs [400–1200 nm] is plotted versus NS dia-meter (Fig. 2f), while maintaining the ratio of core-to-shellthickness at 4 : 1 unaltered, we observe that iron-doped NSshave superior absorption only when the size exceeds thethreshold value of 100 nm. A different behaviour is observedfor the value of σAbs at 800 nm (Fig. 2e), which is larger in Fe-doped NSs in the whole range of diameters considered, withan increase of +50% already for a size of 70 nm. Indeed, thespectral profiles of σAbs (Fig. S4 in the ESI†) show increasingbandwidth for increasing Fe-doping, which is the main reasonfor the superior σAbs (800 nm) of doped NSs with the sizebelow 100 nm, but only above this threshold the σAbs of alloyNSs becomes larger than pure Au NSs in the whole red-NIRspectral range.
Role of shape: spheres, dimers, and nanorods
The effect of iron-doping was investigated further by consider-ing other shapes exploited for photothermal applications,such as compact spheres, sphere dimers and nanorods (Fig. 3and S5–S8 in the ESI†). In the case of compact spheres, theplot of σAbs [400–1200 nm] versus size for the four represen-tative levels of iron-doping reported in Fig. 3a shows that Au–Fe NPs absorb 100% more than Au NPs when particles arebigger than 100 nm. The σAbs (800 nm) of the alloy is largerthan that in Au NPs in the whole range of size considered(Fig. 3b), although this is again related to the plasmonbandwidth in doped particles with a diameter below 70 nm(see Fig. S5 in the ESI†). Instead, the σAbs of alloysbecomes superior in the whole spectral range only for sizesexceeding 70 nm.
Surprisingly, the beneficial effect of iron doping onplasmon absorption is less conspicuous in a dimer of spheresseparated by a 1 nm gap (Fig. 3c–d). The plot of σAbs[400–1200 nm] versus sphere’s diameter shows a maximumincrement of +30% for 140 nm alloys, with only a slight incre-ment when the iron-doped nanospheres exceed 70 nm (Fig. 3cand S6a†). The trend of σAbs (800 nm) reflects that of mono-mers (Fig. 3d), with the best absorption increment (+80%)observed in Au–Fe dimers larger than 100 nm, whereas thebehaviour at lower size is dominated by the dependenceof plasmon bandwidth on iron-doping (see Fig. S6b–h inthe ESI†).
The case of NRs with hemispherical caps can help obtain-ing more insights about the difference between isolated andcoupled nanospheres (Fig. 3e–h and S7–S8†). In fact, NRs haveelongated shape and plasmon resonances in the red and NIR,6
similarly to sphere’s dimers. At the same time, isolated NRsare not subjected to the enormous local field enhancement
Paper Nanoscale
8784 | Nanoscale, 2015, 7, 8782–8792 This journal is © The Royal Society of Chemistry 2015
typically observed at the hot spots in the junction between twoplasmonic nanospheres.15 For an easier comparison of NRswith nanospheres, dimers and NSs, we considered the effectivesize deff, defined as the diameter of the equivolume sphere.6,43
In the case of a NR with a major to minor axis ratio (aspectratio) of 2.5 and incident electric field polarized along themajor axis, we found that the σAbs [400–1200 nm] of Au–Fealloys is up to 150% larger than that in pure Au when deff islarger than 70 nm (Fig. 3e and S7†). Similarly, σAbs (800 nm) ofiron-doped NRs exceeds by 70–380% that of pure Au rods(Fig. 3f).
To better elucidate the influence of the shape on theabsorption performance of iron-doped alloys, we also investi-gated the effect of the rod’s aspect ratio in the range from 1.5to 5.5, while maintaining unchanged deff at 110 nm. For thewhole range of aspect ratios, doped NRs have superior absorp-tion performance (Fig. 3g–h and S8†), suggesting that the par-ticle geometry is less important than size.
Discussion
Overall, our calculations show that plasmon absorption is sen-sibly improved in iron-doped Au nanostructures larger than70–100 nm. Below this size threshold, the benefits of irondoping on the σAbs are minimal and prevalently observed inthe NIR as a consequence of plasmonic band broadening inAu–Fe alloy NPs. The change of σAbs originates from the modi-fication of the optical constants of gold after doping with iron.Previous experimental studies on the optical properties of thinAuFe alloy films59 and nanospheres48,54 showed that dopingAu with Fe introduces new single electron transitions, whichare generated by electrons lying in the iron d-states below theFermi surface of the metal. In general, low-frequency inter-band transitions are observed when noble metals and tran-sition metals with partially occupied d-states are alloyedtogether.45,59,67 These low-energy transitions favour the rapiddecay of the plasmon excitation into electron–hole pairs,45
Fig. 2 σAbs [400–1200 nm] (a) and σAbs (800 nm) (b) for four representative levels of iron doping (0 at% Fe–100 at% Au in black squares, 5 at% Fe–95 at% Au in red circles, 10 at% Fe–90 at% Au in green triangles, 15 at% Fe–85 at% Au in blue triangles) in a series of NSs with structural parametersextracted from the literature (for details see the text). (c) Convolution of σAbs with the solar spectral AM1.5 irradiance. (d, e) Variation of σAbs[400–1200 nm] (d) and σAbs (800 nm) (e) in a NS with a constant diameter of 140 nm and variable shell thickness. (f, g) Variation in σAbs[400–1200 nm] (f ) and σAbs (800 nm) (g) in a NS with a constant ratio of core to shell of 4 : 1 and variable diameters.
Nanoscale Paper
This journal is © The Royal Society of Chemistry 2015 Nanoscale, 2015, 7, 8782–8792 | 8785

thus being the main cause for plasmon band broadening inAu–Fe alloys.48,54 This effect increases with the concentrationof the transition metal in the alloy.48,59 Moreover, Fe has a
smaller atomic number than Au, meaning that the overall elec-tronic structure of the alloy is different compared to pureAu.45,59,68 For these reasons, iron doping modifies the band
Fig. 3 (a, b) σAbs [400–1200 nm] (a) and σAbs (800 nm) (b) in nanospheres with different sizes. (c, d) σAbs [400–1200 nm] (c) and σAbs (800 nm) (d) ina dimer of nanospheres with different sizes and an interparticle gap of 1 nm. (e, f ) σAbs [400–1200 nm] (e) and σAbs (800 nm) (f ) in NRs with theaspect ratio of 2.5 and different effective sizes. (g, h) σAbs [400–1200 nm] (g) and σAbs (800 nm) (h) in NRs with variable aspect ratios and a constanteffective size of 110 nm.
Paper Nanoscale
8786 | Nanoscale, 2015, 7, 8782–8792 This journal is © The Royal Society of Chemistry 2015

structure of the metal and the resulting optical permittivity, inparticular by decreasing its real component (ε′) and increasingits imaginary part (ε″) in comparison with pure Au (seeFig. 4a–b).
The effect of iron-doping on the plasmonic absorption ofAu nanostructures can be explained by considering thedependence of σAbs for a generic NP at the photonfrequency ω:43,69,70
σAbsðωÞ ¼ k
ε0 E0j j2 ε′′ðNP
ENPj j2dVNP ð1Þ
where E0 is the electric field of the incident light, measured inthe medium surrounding the NP of volume VNP, ε0 is thevacuum dielectric permittivity and ENP is the electric field ofthe electromagnetic radiation inside the NP. On the one hand,σAbs(ω) is proportional to the lossy part of the optical constantε″, which is augmented by iron doping (see Fig. 4b). On theother hand, σAbs(ω) is proportional to the square of the electricfield ENP inside the NP, which is maximized when the qualityfactor Q of the plasmon resonance is maximum.69,70 FollowingBlaber,70 the plasmonic performance of metals with differentcompositions can be compared, independent of the particlegeometry, assuming that Q = −ε′/ε″. In Fig. 4c we report Q forthe same four representative Au–Fe compositions of Fig. 2–3,and we clearly found that Q is largest in pure Au. This is inagreement with the fact that highest σExt is systematicallyobtained for Au NPs rather than Au–Fe alloys (see, e.g., Fig. 1).Therefore, iron doping has the two opposite effects of increas-ing ε″ and decreasing ENP, and the Au–Fe alloys have superiorσAbs only when the ε″ contribution prevails over |ENP|
2 in eqn(1). It is important to point out that, in addition to compo-sition, ENP depends also on the particle shape, size and assem-bly,70 and it is not uniform throughout the NP volume.45,71 Inparticular, the value of ENP in proximity to small gaps inassemblies of nanoparticles is several orders of magnitudelarger than that in isolated nanoparticles.69,70 Indeed, the gapsbetween NPs are also called hot spots because of such strongelectromagnetic field enhancement,15 and this is the region
where the conversion of light into heat is maximum.69,71 Inorder to further investigate this point, we calculated, using themultipole field expansion,4,72,73 the internal electric field andmapped |ENP|
2 in spheres (Fig. 5a), nanoshells (Fig. 5b) andsphere dimers (Fig. 5b) at the wavelength where plasmonabsorption is maximum. In particular, we compared the twoopposite cases of pure Au and Au(85)Fe(15) NPs and we con-sidered two distinct sizes corresponding to the spheres withdiameters of 35 nm and 140 nm, i.e. below and above thethreshold for the amplification of plasmon absorption in irondoped NPs. The results confirm that |ENP|
2 is always larger inpure Au NPs than in the Fe–Au alloy, although the difference ismore evident for 35 nm NPs and for dimers of nanospheres.Besides, one must observe that the maximum of absorbancered shifts for increasing NPs’ size, moving to the region whereε″ of the alloy is larger and can compensate the loss in the|ENP|
2 term. These two trends explain why the superiorplasmon absorption is observed in isolated NPs with the sizeabove ∼70 nm such as NSs, nanospheres and NRs, rather thanin a dimer of spheres or NPs with the size below ∼70 nm,where ENP is the dominant contribution.15 We expect thistrend to be general for all the shapes where the local fieldenhancement is remarkable, such as in all the coupled nano-structures and particles with sharp tips, corners or edges.
For what concerns the role played by the type of dopant inthe Au alloy, a quantitative comparison with other transitionelements would be possible by using the experimentallymeasured optical constants of each compound, as done forthe AuFe system in a range of compositions.48,54,59 However,these data are available only for a limited number of Au alloyscontaining other noble metals such as Ag, Cu, Pt or Pd,74 forwhich no absorption enhancement has been observed in thepast.9,45 In all the other cases, the synthesis of the alloy andthe ellipsometric investigation of the optical constants as afunction of the composition would be necessary to foresee theplasmonic properties. In fact, as shown in Fig. S10 of the ESI,†the extrapolation of optical constants of alloys from that ofpure metals in the absence of an experimental checkpoint isunreliable. However, we know from the literature that the elec-
Fig. 4 Real (a) and imaginary (b) parts of the optical constant for four representative levels of iron doping (0 at% Fe–100 at% Au in black, 5 at% Fe–95 at% Au in red, 10 at% Fe–90 at% Au in green, 15 at% Fe–85 at% Au in blue). (c) The plasmonic quality factor Q for the same four compositions.
Nanoscale Paper
This journal is © The Royal Society of Chemistry 2015 Nanoscale, 2015, 7, 8782–8792 | 8787

trons lying in the d-states of Fe dopants below the Fermi levelplay a major role in the modification of the AuFe alloy bandstructure, by enabling low-frequency interband transitions.59,67
On the basis of similar observations on the band structure ofother Au alloys,45,75 we expect that an increased plasmonabsorption may also be possible by doping Au with other tran-sition metals with partially filled d-orbitals such as, forinstance, Cr, Co and, to a lower extent, Ni. In the case of tran-sition metals such as Pd or Pt, whose d-orbitals are almost(Pd) or completely (Pt) occupied, no such a modification of theAu band structure has been observed in the red or NIR.76–79
Conversely, an increased absorbance in the UV-visible rangedue to single-electron transitions from d-states in Pt and Pdand a simultaneous damping of plasmon absorption havebeen reported.45,57,58,76–79 This can be explained with thedecrease of the real part (ε′) of the optical constant of the alloycontaining Pd or Pt, and a modest increase of its imaginarypart (ε″) at visible frequencies, compared to pure Au.45,80 Ingeneral, this suggests that elements with the occupied d-statesare not suitable for the increase of plasmon absorption in Aualloys.
Conclusion
In summary, we showed that iron-doped Au nanostructureswith the size above 70–100 nm have superior absorption crosssection than the pure Au counterparts. In particular, a remark-
able increase of 90–190% is predicted in NSs and nanospherescommonly exploited for photothermal applications. The effectis explained with the modification of the band structure ofgold after doping with iron, with consequent increase of thelossy part of the optical constant. These results in generalsuggest that the band structure of noble metals can be engin-eered by doping with the appropriate combination of tran-sition metals to obtain the optimized plasmonic properties. Atthe moment, the optical constants of noble metal alloys con-taining one or more transition metals are in large partunknown, therefore the real potential of doping for theimprovement of plasmonic performance is unexplored, andother transition metals, amongst those miscible with Au,could perform better than iron. Overall, this study fostersinterest in the scarcely investigated field of noble metalnanoalloys, which can be a source of new unforeseen solutionsfor the improvement of plasmonic performance.
MethodsMie theory for compact spheres
The extinction, scattering and absorption cross-sections ofspherical nanoparticles (σExt, σSca and σAbs) were calculatedusing the Mie model for compact spheres:1,3
σExt ¼ 2π
k2
��� ���X1L¼1
2Lþ 1ð ÞRe aL þ bL½ � ðm1Þ
Fig. 5 Map of the internal electric field |E|2 in nanostructures of different shapes (a: nanospheres; b: nanoshells; c: dimer of nanospheres), compo-sition (pure Au or Au(85)Fe(15)), and diameter (35 nm or 140 nm). Calculations are performed for incident monochromatic radiation at the wave-length where the maximum absorption occurs (as indicated in the figure). The incident electric field of the electromagnetic radiation is parallel tothe plane of the map. Due to the symmetry of the dimer of nanospheres, only the left side particle is shown.
Paper Nanoscale
8788 | Nanoscale, 2015, 7, 8782–8792 This journal is © The Royal Society of Chemistry 2015

σSca ¼ 2π
k2
��� ���X1L¼1
2Lþ 1ð Þ aLj j2 þ bLj j2� � ðm2Þ
σAbs ¼ σExt � σSca ðm3Þ
aL ¼ m�ψL mxð Þ�ψL′ xð Þ � ψL′ mxð Þ�ψL xð Þm�ψL mxð Þ�ηL′ xð Þ � ψL′ mxð Þ�ηL xð Þ ðm4Þ
bL ¼ ψL mxð Þ�ψL′ xð Þ �mψL′ mxð Þ�ψL xð ÞψL mxð Þ�ηL′ xð Þ �mψL′ mxð Þ�ηL xð Þ ðm5Þ
m ¼ n Rð Þnm
ðm6Þ
x ¼ jk̄jR; ðm7Þwhere R is the sphere radius, k is the incident photon wavevector in the host matrix with the refractive index nm, ΨL andηL are the spherical Riccati–Bessel functions, and n(R) is thecomplex refractive index of the sphere. In all calculations, thehighest multipolar order (L) considered was 3 and nm = 1.334(water matrix).
Mie theory for core–shell spheres
The extinction, scattering and absorption cross-sections of NSswere calculated using the generalization of the Mie model formultilayered spheres:1
σExt ¼ 2πkh2�� ��X
1
L¼1
2Lþ 1ð ÞRe aL þ bL½ � ðm8Þ
σSca ¼ 2πkh2�� ��X
1
L¼1
2Lþ 1ð Þ aLj j2þ bLj j2� � ðm9Þ
σAbs ¼ σExt � σSca ðm10Þ
ms ¼ nsþ1
nsðm17Þ
xs ¼ jk̄sjRs ðm18Þwhere χ(x) is one of the spherical Riccati–Bessel functions, khis the wavenumber of the incident photons calculated in thehost matrix, and s is the layer number, ranging from 1 (thecore) to r + 1 (the surrounding matrix with the refractive indexnm), with r being the total number of layers (1 in the Au NScase). In all calculations, the highest multipolar order (L) con-sidered was 3 and ns+1 = nm = 1.334 (water matrix).
Maps of internal fields
The maps of the internal electric field intensity, |ENP|2, in
nanospheres, nanoshells, and dimers of nanospheres areobtained through the solutions of the same boundary con-dition equations defining the Mie expansion coefficients. Forthe case of dimers, we used the addition theorem for vectorspherical harmonics72 that enables the solution of the scatter-ing problem also for clusters of any size, shape, and compo-sition and the retrieval of the relevant amplitudes for scatteredand internal fields.4,73
Discrete-dipole approximation method
Calculations of the extinction cross sections of nanospheredimers and NRs were performed by the DDA method.81 InDDA, the structure of interest, usually called “target”, is com-posed of a cubic array of N polarizable points (i.e. N cubicdipoles). The polarization Pj induced on each dipole j of posi-tion rj and polarizability pj is given by81
Pj ¼ pjELoc rj� � ðm19Þ
aL ¼mr �ψL mrxrð Þ� ψL′ xrð Þ þ Tr
L χL′ xrð Þ� �� ψL′ mrxrð Þ� ψL xrð Þ þ TrL χL xrð Þ� �
mr �ηL mrxrð Þ� ψL′ xrð Þ þ TrL χL′ xrð Þ½ � � ηL′ mrxrð Þ� ψL xrð Þ þ Tr
L χL xrð Þ½ � ðm11Þ
bL ¼ψL mrxrð Þ� ψL′ xrð Þ þ SrL χL′ xrð Þ� ��mr �ψL′ mrxrð Þ� ψL xrð Þ þ SrL χL xrð Þ� �ηL mrxrð Þ� ψL′ xrð Þ þ SrL χL′ xrð Þ½ � �mr �ηL′ mrxrð Þ� ψL xrð Þ þ SrL χL xrð Þ½ � ðm12Þ
TsL ¼ �ms �ψL msxsð Þ� ψL′ xsð Þ þ Ts�1
L χL′ xsð Þ� �� ψL′ msxsð Þ� ψL xsð Þ þ Ts�1L χL xsð Þ� �
ms �χL msxsð Þ� ψL′ xsð Þ þ Ts�1L χL′ xsð Þ½ � � χL′ msxsð Þ� ψL xsð Þ þ Ts�1
L χL xsð Þ½ � ðm13Þ
T1L ¼ �m1 �ψL m1x1ð Þ�ψL′ x1ð Þ � ψL′ m1x1ð Þ�ψL x1ð Þ
m1 �χL m1x1ð Þ�ψL′ x1ð Þ � χL′ m1x1ð Þ�ψL x1ð Þ ðm14Þ
SsL ¼ �ψL msxsð Þ� ψL′ xsð Þ þ Ss�1L χL′ xsð Þ� ��ms �ψL′ msxsð Þ� ψL xsð Þ þ Ss�1
L χL xsð Þ� �χL msxsð Þ� ψL′ xsð Þ þ Ss�1
L χL′ xsð Þ½ � �ms �χL′ msxsð Þ� ψL xsð Þ þ Ss�1L χL xsð Þ½ � ðm15Þ
S1L ¼ �ψL m1x1ð Þ�ψL′ x1ð Þ �m1 �ψL′ m1x1ð Þ�ψL x1ð ÞχL m1x1ð Þ�ψL′ x1ð Þ �m1 �χL′ m1x1ð Þ�ψL x1ð Þ ðm16Þ
Nanoscale Paper
This journal is © The Royal Society of Chemistry 2015 Nanoscale, 2015, 7, 8782–8792 | 8789

where ELoc is the electric field originated by the incident radi-ation, which includes the contribution of all other dipoles:81
ELoc rj� � ¼ E0 exp ik�rj þ iωt
� ��Xl=j
AjlPl ðm20Þ
where Ajl is the interaction matrix. The full expression of AjlPl
is:81
AjlPl ¼exp ikrjl� �rjl3
� k2rjl � rjl � Pl� � þ 1� ikrij
� �rjl2
rjl2Pl � 3rjl rjl �Pl� �� �� �
ðm21ÞAn important part of DDA is the use of an appropriate
expression for pi.81,82 The most applied expression was develo-
ped by Draine and Goodman82 as a correction of the Clausius–Mossotti polarizability by a series expansion of kd and εm,where d is the interdipole spacing. This expression was usedfor our calculations, performed by the software DDSCAT 7.1.More than 105 dipoles were used for each target, as required toreduce computational errors well below 10%.41,81,82 A matrixwith the refractive index of 1.334 was used in all cases.
Optical constants
The experimental optical constants of Au, Au84Fe16 andAu73Fe27 were taken from the literature (ref. 59 and 74) and arereported in Fig. S8.† For all the other values, we used thelinear averaging of the optical constants of the two alloys withthe closest composition, according to a successful protocolpreviously published and validated by comparison withexperiments.41,48,54,83
The optical constants were corrected for size effects,1,41,84
as reported previously.41,48,54,84 We adopted a size correcteddielectric constant to account for the intrinsic size effect,which is important when the mean free path of conductionelectrons becomes comparable to the particle size l along thedirection of polarization promoted by the electromagneticfield. In the assumption that only the free electron behaviouris affected by the size of nanoparticles, ε(ω, l) can be expressedin the following way:1,41,84
ε ω; lð Þ ¼ ε1 ωð Þ þ ωP2 1
ω2 þ Γ12 �1
ω2 þ Γ lð Þ2 !" #
þ iωP
2
ω
Γ lð Þω2 þ Γ lð Þ2 �
Γ1ω2 þ Γ12
!" #ðm22Þ
where ε∞(ω) is the dielectric function of a bulk metal at the fre-quency ω, Γ(l) is the l-dependent free electron relaxation fre-quency and Γ∞ is the bulk metal value. Γ(l) is expressedaccording to a size equation:1,41,84
Γ lð Þ ¼ Γ1 þ AvFl
ðm23Þ
where vF is the electron’s Fermi velocity and A is an empiricalparameter set equal to 1 in all cases. Eqn (m23) suggests that
the damping frequency of NPs with an anistropic shapedepends on particle orientation, because l is different for plas-monic oscillations along different directions.1,41,84 However,what is really important for the right determination of Γ is theratio A/l and not the value of l. Moreover, the charge distri-bution of plasmon modes in a nanoparticle does not necess-arily coincide with the particle size l along the direction ofpolarization because, for instance, multipolar modes can alsobe excited in anisotropic particles.1 Hence, the simplest choicefor present calculations consists in assuming that l is equal tothe effective radius of the particle deff:
l ¼ deff ¼ ð3VNP=4πÞ1=3 ðm24Þwhere VNP is the particle volume. A similar approximation canalso be found in previous studies of other authors.6,44,85,86
Only in the case of NSs, for the size correction we consideredthe thickness of the metal shell as the parameter l.83
Acknowledgements
Financial support from the University of Padova (PRAT no.CPDA114097/11 and Progetto Strategico STPD11RYPT_001),MIUR (PRIN MULTINANOITA no. 2010JMAZML_001) and “Pro-gramma Operativo Nazionale Ricerca e Competitività”2007–2013, project PAC02L3 00087 SOCIAL-NANO is gratefullyacknowledged.
References
1 U. Kreibig and M. Vollmer, Optical Properties of Metal Clus-ters, Springer, Berlin, 1995.
2 G. V. Naik, V. M. Shalaev and A. Boltasseva, Adv. Mater.,2013, 25, 3264–3294.
3 C. F. Bohren and D. R. Huffman, Absorption and scatteringof light by small particles, Wiley-Interscience, New York,1983.
4 F. Borghese, P. Denti and R. Saija, Scattering from modelnonspherical particles: theory and applications to environ-mental physics, Springer, 2007.
5 J. R. Cole, N. A. Mirin, M. W. Knight, G. P. Goodrich andN. J. Halas, J. Phys. Chem. C, 2009, 113, 12090–12094.
6 P. K. Jain, K. S. Lee, I. H. El-Sayed and M. A. El-Sayed,J. Phys. Chem. B, 2006, 110, 7238–7248.
7 H. H. Richardson, M. T. Carlson, P. J. Tandler,P. Hernandez and A. O. Govorov, Nano Lett., 2009, 9, 1139–1146.
8 P. K. Jain, X. Huang, I. H. El-Sayed and M. A. El-Sayed, Acc.Chem. Res., 2008, 41, 1578–1586.
9 M. B. Cortie and A. M. McDonagh, Chem. Rev., 2011, 111,3713–3735.
10 Z. Fang and X. Zhu, Adv. Mater., 2013, 25, 3840–3856.11 C. Forestiere, A. J. Pasquale, A. Capretti, G. Miano,
A. Tamburrino, S. Y. Lee, B. M. Reinhard and L. Dal Negro,Nano Lett., 2012, 12, 2037–2044.
Paper Nanoscale
8790 | Nanoscale, 2015, 7, 8782–8792 This journal is © The Royal Society of Chemistry 2015

12 M. Lester and D. C. Skigin, J. Opt., 2011, 13, 035105.13 V. Robbiano, M. Giordano, C. Martella, F. D. Stasio,
D. Chiappe, F. B. de Mongeot and D. Comoretto, Adv. Opt.Mater., 2013, 1, 389–396.
14 N. Lagos, M. Sigalas and E. Lidorikis, Appl. Phys. Lett.,2011, 99, 063304.
15 V. Amendola and M. Meneghetti, Adv. Funct. Mater., 2012,22, 353–360.
16 C. D’Andrea, J. Bochterle, A. Toma, C. Huck, F. Neubrech,E. Messina, B. Fazio, O. M. Marago, E. Di Fabrizio,M. Lamy de La Chapelle, P. G. Gicciardi and A. Pucci, ACSNano, 2013, 7, 3522–3531.
17 E. Messina, E. Cavallaro, A. Cacciola, R. Saija, F. Borghese,P. Denti, B. Fazio, C. D’Andrea, P. Gucciardi, M. Iati,M. Meneghetti, G. Compagnini, V. Amendola andO. M. Marago, J. Phys. Chem. C, 2011, 115, 5115–5122.
18 B. Metzger, M. Hentschel, T. Schumacher, M. Lippitz,X. Ye, C. B. Murray, B. Knabe, K. Buse and H. Giessen,Nano Lett., 2014, 14, 2867–2872.
19 A. M. Gobin, M. H. Lee, N. J. Halas, W. D. James,R. A. Drezek and J. L. West, Nano Lett., 2007, 7, 1929–1934.
20 Y. Wang, K. C. Black, H. Luehmann, W. Li, Y. Zhang,X. Cai, D. Wan, S. Liu, M. Li and P. Kim, ACS Nano, 2013, 7,2068–2077.
21 R. Huschka, A. Barhoumi, Q. Liu, J. A. Roth, L. Ji andN. J. Halas, ACS Nano, 2012, 6, 7681–7691.
22 J. Huang, K. S. Jackson and C. J. Murphy, Nano Lett., 2012,12, 2982–2987.
23 S. Mallidi, T. Larson, J. Aaron, K. Sokolov andS. Emelianov, Opt. Express, 2007, 15, 6583–6588.
24 D. Boyer, P. Tamarat, A. Maali, B. Lounis and M. Orrit,Science, 2002, 297, 1160–1163.
25 C. Leduc, J. Jung, R. R. Carney, F. Stellacci and B. Lounis,ACS Nano, 2011, 5, 2587–2592.
26 B. Lahiri, G. Holland, V. Aksyuk and A. Centrone, NanoLett., 2013, 13, 3218–3224.
27 K. Ueno, S. Juodkazis, T. Shibuya, Y. Yokota, V. Mizeikis,K. Sasaki and H. Misawa, J. Am. Chem. Soc., 2008, 130,6928–6929.
28 L. Cao, D. N. Barsic, A. R. Guichard and M. L. Brongersma,Nano Lett., 2007, 7, 3523–3527.
29 A. Urban, M. Fedoruk, M. Horton, J. Radler, F. Stefani andJ. Feldmann, Nano Lett., 2009, 9, 2903–2908.
30 Z. Fang, Y. Zhen, O. Neumann, A. Polman, G. de Abajo,F. Javier, P. Nordlander and N. J. Halas, Nano Lett., 2013,13, 1736–1742.
31 O. Neumann, A. S. Urban, J. Day, S. Lal, P. Nordlander andN. J. Halas, ACS Nano, 2012, 7, 42–49.
32 O. Neumann, C. Feronti, A. D. Neumann, A. Dong,K. Schell, B. Lu, E. Kim, M. Quinn, S. Thompson, N. Grady,P. Nordlander, M. Oden and N. J. Halas, Proc. Natl. Acad.Sci. U. S. A., 2013, 110, 11677–11681.
33 Z. Fang, Y. Wang, Z. Liu, A. Schlather, P. M. Ajayan,F. H. Koppens, P. Nordlander and N. J. Halas, Acs Nano,2012, 6, 10222–10228.
34 I. Thomann, B. A. Pinaud, Z. Chen, B. M. Clemens,T. F. Jaramillo and M. L. Brongersma, Nano Lett., 2011, 11,3440–3446.
35 M. L. Brongersma, N. J. Halas and P. Nordlander, Nat.Nanotechnol., 2015, 10, 25–34.
36 M. W. Knight, H. Sobhani, P. Nordlander and N. J. Halas,Science, 2011, 332, 702–704.
37 S. Mukherjee, F. Libisch, N. Large, O. Neumann,L. V. Brown, J. Cheng, J. B. Lassiter, E. A. Carter,P. Nordlander and N. J. Halas, Nano Lett., 2012, 13, 240–247.
38 M. Salmistraro, A. Schwartzberg, W. Bao, L. E. Depero,A. Weber-Bargioni, S. Cabrini and I. Alessandri, Small,2013, 9, 3301–3307.
39 T. Echtermeyer, L. Britnell, P. Jasnos, A. Lombardo,R. Gorbachev, A. Grigorenko, A. Geim, A. Ferrari andK. Novoselov, Nat. Commun., 2011, 2, 458.
40 Z. Fang, Z. Liu, Y. Wang, P. M. Ajayan, P. Nordlander andN. J. Halas, Nano Lett., 2012, 12, 3808–3813.
41 V. Amendola, O. M. Bakr and F. Stellacci, Plasmonics, 2010,5, 85–97.
42 K. Jiang, D. A. Smith and A. O. Pinchuk, J. Phys. Chem. C,2013, 117, 27073–27080.
43 G. Baffou, R. Quidant and C. Girard, Appl. Phys. Lett., 2009,94, 153109.
44 K. Park, S. Biswas, S. Kanel, D. Nepal and R. A. Vaia,J. Phys. Chem. C, 2014, 118, 5918–5926.
45 M. G. Blaber, M. D. Arnold and M. J. Ford, J. Phys.:Condens. Matter, 2010, 22, 143201.
46 P. K. Jain, K. Manthiram, J. H. Engel, S. L. White,J. A. Faucheaux and A. P. Alivisatos, Angew. Chem., Int. Ed.,2013, 52, 13671–13675.
47 E. Messina, L. D’Urso, E. Fazio, C. Satriano, M. Donato,C. D’Andrea, O. Maragò, P. Gucciardi, G. Compagnini andF. Neri, J. Quant. Spectrosc. Radiat. Transfer, 2012, 113,2490–2498.
48 V. Amendola, S. Scaramuzza, S. Agnoli, S. Polizzi andM. Meneghetti, Nanoscale, 2014, 6, 1423–1433.
49 R. Ferrando, J. Jellinek and R. L. Johnston, Chem. Rev.,2008, 108, 845–910.
50 J. Xiao, S. Fan, F. Wang, L. Sun, X. Zheng and C. Yan, Nano-scale, 2014, 6, 4345–4351.
51 L. Nie, M. Chen, X. Sun, P. Rong, N. Zheng and X. Chen,Nanoscale, 2014, 6, 1271–1276.
52 Y. Yang, J. M. Callahan, T. Kim, A. S. Brown andH. O. Everitt, Nano Lett., 2013, 13, 2837–2841.
53 M. W. Knight, L. Liu, Y. Wang, L. Brown, S. Mukherjee,N. S. King, H. O. Everitt, P. Nordlander and N. J. Halas,Nano Lett., 2012, 12, 6000–6004.
54 V. Amendola, M. Meneghetti, O. M. Bakr, P. Riello,S. Polizzi, D. H. Anjum, S. Fiameni, P. Arosio, T. Orlando,C. de Julian Fernandez, F. Pineider, C. Sangregorio andA. Lascialfari, Nanoscale, 2013, 5, 5611–5619.
55 L. Bogani, L. Cavigli, C. de Julián Fernández, P. Mazzoldi,G. Mattei, M. Gurioli, M. Dressel and D. Gatteschi, Adv.Mater., 2010, 22, 4054–4058.
Nanoscale Paper
This journal is © The Royal Society of Chemistry 2015 Nanoscale, 2015, 7, 8782–8792 | 8791

56 G. Armelles, A. Cebollada, A. Garcia-Martin andM. U. Gonzalez, Adv. Opt. Mater., 2013, 1, 2–2.
57 S. Sarina, H. Zhu, E. Jaatinen, Q. Xiao, H. Liu, J. Jia,C. Chen and J. Zhao, J. Am. Chem. Soc., 2013, 135, 5793–5801.
58 J. Suntivich, Z. Xu, C. E. Carlton, J. Kim, B. Han, S. W. Lee,N. Bonnet, N. Marzari, L. F. Allard, H. A. Gasteiger,K. Hamad-Schifferli and Y. Shao-Horn, J. Am. Chem. Soc.,2013, 135, 7985–7991.
59 Y. Lee, Y. Kudryavtsev, V. Nemoshkalenko, R. Gontarz andJ. Rhee, Phys. Rev. B: Condens. Matter, 2003, 67, 104424.
60 S. Lal, S. E. Clare and N. J. Halas, Acc. Chem. Res., 2008, 41,1842–1851.
61 Y. Xia, W. Li, C. M. Cobley, J. Chen, X. Xia, Q. Zhang,M. Yang, E. C. Cho and P. K. Brown, Acc. Chem. Res., 2011,44, 914–924.
62 M. Choi, R. Bardhan, K. J. Stanton-Maxey, S. Badve,H. Nakshatri, K. M. Stantz, N. Cao, N. J. Halas andS. E. Clare, Cancer Nanotechnol., 2012, 3, 47–54.
63 D. C. Adler, S. Huang, R. Huber and J. G. Fujimoto, Opt.Express, 2008, 16, 4376–4393.
64 N. Harris, M. J. Ford, P. Mulvaney and M. B. Cortie, GoldBull., 2008, 41, 5–14.
65 N. J. Hogan, A. S. Urban, C. Ayala-Orozco, A. Pimpinelli,P. Nordlander and N. J. Halas, Nano Lett., 2014, 14, 4640–4645.
66 R. Huschka, J. Zuloaga, M. W. Knight, L. V. Brown,P. Nordlander and N. J. Halas, J. Am. Chem. Soc., 2011, 133,12247–12255.
67 D. Beaglehole and T. J. Hendrickson, Phys. Rev. Lett., 1969,22, 133–136.
68 J. Muñoz, M. Lucas, L. Mauger, I. Halevy, J. Horwath,S. Semiatin, Y. Xiao, P. Chow, M. Stone and D. Abernathy,Phys. Rev. B: Condens. Matter, 2013, 87, 014301.
69 S. Bruzzone and M. Malvaldi, J. Phys. Chem. C, 2009, 113,15805–15810.
70 M. D. Arnold and M. G. Blaber, Opt. Express, 2009, 17,3835–3847.
71 G. Baffou, R. Quidant, G. de Abajo and F. Javier, ACS Nano,2010, 4, 709–716.
72 F. Borghese, P. Denti, G. Toscano and O. I. Sindoni,J. Math. Phys., 1980, 21, 2754–2755.
73 F. Borghese, P. Denti, R. Saija, G. Toscano andO. I. Sindoni, Aerosp. Sci. Technol., 1984, 3, 227–235.
74 E. D. Palik, Handbook of Optical Constants of Solids,Academic Press, 1985.
75 H. Höchst, P. Steiner and S. Hüfner, Z. Phys. B: Condens.Matter, 1980, 38, 201–209.
76 A. A. Wronkowska and A. Wronkowski, Vacuum, 1995, 46,469–471.
77 B. Schmidt and D. W. Lynch, Phys. Rev. B: Condens. Matter,1971, 3, 4015.
78 H. Koike, S. Yamaguchi and T. Hanyu, J. Phys. Soc. Jpn,1976, 40, 219–225.
79 A. Benhabib, L. Chahed and A. Tadjeddine, Thin SolidFilms, 1991, 202, 11–19.
80 M. Blaber, M. Arnold, N. Harris, M. Ford and M. Cortie,Phys. Rev. B: Condens. Matter, 2007, 394, 184–187.
81 P. J. Flatau and B. Draine, J. Opt. Soc. Am. A, 1994, 11,1491.
82 J. Goodman, B. T. Draine and P. J. Flatau, Opt. Lett., 1991,16, 1198–1200.
83 S. Bruzzone, M. Malvaldi, G. Arrighini and C. Guidotti,J. Phys. Chem. B, 2006, 110, 11050–11054.
84 V. Amendola and M. Meneghetti, J. Phys. Chem. C, 2009,113, 4277–4285.
85 C. Noguez, J. Phys. Chem. C, 2007, 111, 3806–3819.86 C. Noguez, Opt. Mater., 2005, 27, 1204–1211.
Paper Nanoscale
8792 | Nanoscale, 2015, 7, 8782–8792 This journal is © The Royal Society of Chemistry 2015


