Embed Size (px)
Citation preview
Sunk costs and competitivenessof European banks after deregulation
Vittoria Cerasi Universita' degli Studi di Milano and FMG, London School of Economics
Barbara Chizzolini
Universita' Bocconi, Milano
Marc Ivaldi GREMAQ-EHESS and Institut D’Economie Industrielle, Toulouse
April 1998
Abstract This paper investigates the determinants of the structure of the banking industry by fitting amonopolistic competition model to a sample of banks drawn from nine EEC countries over1989-1993. In the theoretical model, banks decide strategically both entry and the branchingsize of their network. The estimation then measures the branching costs and an upper boundfor the entry costs. It also assesses how these costs evolve over time and to what extentvarious European directives, aiming at deregulating the banking industry, influence them. JEL classification: G21; L13; L59
Keywords: Banking; Market structure and oligopoly; Deregulation
Corresponding author: Vittoria Cerasi - Dipartimento di Economia e Politica Aziendale - ViaConservatorio, 7 - 20122 Milano - Italy. E-mail: [email protected]
Acknowledgments: We would like to thank Bruno Biais, Giovanni Ferri, Jean-Charles Rochet,John Sutton and Jean Tirole for helpful comments and seminar participants at InternationalConference in Game Theory and Applications in Milan, EEA’97 in Toulouse, ASSET inLisbon, Bank of England, IDEI and Ecole de Gestion in Toulouse, CIDE in Bologna. Wethank Andrea Balzarini and Elena Carletti for extremely valuable research assistance. Financialsupport from Ricerca di base and Centro Baffi, Universita’ Bocconi (Milan), and InstitutD’Economie Industrielle, University of Toulouse, is gratefully acknowledged. This paper ispart of the TMR research project “The Industrial Organisation of Banking and FinancialMarkets in Europe" (IOBFME).

1
1. Introduction
Since the eighties, the European banking industries, before heavily regulated, have
experienced a phase of deregulation. On the one hand, at the country level, regulators have left
more and more market forces to determine the structure of the market. Today, in almost all
EEC countries, banks are free to compete for their clients. On the other hand, at the EEC level,
each country has committed to remove barriers across financial markets, in order to move
towards a complete integration of markets, both on the demand and the supply side. These two
aspects have important implications for entry and competition in the banking industry, as they
imply that, since the process of deregulation has started, the structure of the banking industry
may be better explained by the strategic interactions of banks than by the effect of regulation.
The European banking industry provides an interesting challenge for a test of a model of
monopolistic banking competition. First, the set of regulations does not fully explain the
evolution of the industry structure; second, the changes in the institutional setting allow us to
test the impact of regulation on the conduct of banks and on the structure of the banking
industry.
The process of deregulation has strong implications for competition among banks and for
bank decision to enter or exit markets. By deregulation, in fact, we mean the changes in rules,
implemented at national level, which, having received their input mainly by EEC directives,
influence either the conduct or the structure of banking markets. In particular, on the one hand,
in these years almost all EEC members have implemented policies oriented to increase
competition among banks, by lifting controls on interest rates or fighting more fiercely cartels
among the largest banks. The effect was an increase in the abili ty to compete on interest rates
by the overall banking system. On the other hand, policies towards larger integration of
financial markets have been pursued on the demand side, by lifting capital controls at the
country level, and on the supply side, by reducing the cost of entry into new banking markets.
These policies may have affected the decision of entering and opening of new branches across
countries and indirectly the amount of competition that banks envisage to face in the future.
An important objective of deregulation is to increase the degree of competitiveness in the
banking industry in order to reduce the price of financial services for customers in this industry.

2
However, as already pointed out by some papers,1 deregulation has increased the degree of
concentration in the European banking industries, as a result of a consolidation process, mainly
inside borders, that has occurred in the past years. This may limit the expected benefits of
deregulation on allocative efficiency, if monopoly power of each bank has not decreased.
Furthermore, interest rate deregulation, by increasing the toughness of price competition
may have reduced the incentives to set larger branching network. This may have occurred for
two reasons.2 First, as profits shrink as a result of tougher interest rate competition, banks may
find less profitable to maintain larger branching networks. Second, because interest rate
competition has for long time been impeded, branching networks have been the only way to
capture new clients, giving rise to overinvestment in branches.
The aim of this paper is to measure the degree of competitiveness acquired by the banking
industry as a result of deregulation and to evaluate the costs of entry and branching for each
banking system. More specifically, we estimate entry and branching costs, building our
econometric analysis on a model of monopolistic competition, where banks compete for
deposits both on interest rates and branching networks.
The main result of this paper is that, after deregulation, the degree of competition in interest
rates in the EEC banking industries has risen and that the average size of branching networks
has decreased. Our econometric analysis helps in understanding the impact of deregulation on
the average branching size of banks. While, from a glance at the data, the trend of the average
branching size for all countries of our sample seems increasing, we show that deregulation has
negatively affected the likelihood of opening new branches.
Furthermore we find that, when evaluating the impact of deregulation on competitiveness
and sunk costs, it is hard to identify in the set of EEC directives the origin of changes in the
industry structure, even though considering the actual implementation date in each country.
First of all, the degree of competitiveness of each single banking industry is very sensitive to
country specific factors. Moreover, in all European banking industries, there is a trend towards
tougher price competition and smaller branching networks, which can not be attributed to the
actual implementation of each specific EEC directive. We propose to interpret this result as
1 See Gual and Neven (1992), Economic Research Europe (ERE) Summary Report (1996) and Cerasi(1996) for evidence that the degree of concentration in the European banking industry has increasedsince the process of deregulation has started.2 See for example Neven (1989) and Cerasi (1995) for implications of deregulation on the size of thebranching networks.
3
evidence that legislative changes at the country level are less effective than those at the
community level, at least for what concerns the shape of the banking industry.
Finally, our findings show that capital flow liberalization has induced banks to close down
branches, while increasing average branching costs. Our explanation is that, due to the larger
integration of markets, banks envisage a greater future competition, and anticipate this effect
by closing down branches.
One appealing feature of our analysis is that we do not need accounting data, thus avoiding
the problem of comparing accounting data taken from different banking systems. The reason is
that, by using a two stage game to describe banking competition, we are able to build our
estimation on a reduced form for bank profits, that is based on measures of the size of the
market and on the number of branches for each single bank, but without activity volumes and
interest rates. Furthermore, our econometric test is derived from a theoretical model. This
allows us, first of all, to interpret our results on a stronger ground than other empirical
analysis, and secondly, to derive some restrictions on the type of economic models that better
describe bank competitive behavior in the retail segment.
Our paper fits into the empirical li terature on the European banking industry. There is a
growing empirical li terature on several aspects of the structure of this industry, connected to
the changes in regulation at the EEC level. Chiappori, Perez-Castrill o and Verdier (1995)
provide empirical evidence on the impact of deregulation on the banking industry. Although
their empirical evidence rests on a model of spatial competition,3 they test its implications on a
reduced form, while we follow a structural approach. Molyneux, Lloyd-Willi ams and Thornton
(1994) and Neven and Roller (1995) estimate the degree of competitiveness of the European
banking industry by using aggregate data, whereas we deal with disaggregate data at the bank
level. Finally, few papers study the determinants of bank branching behavior, as for example
Cabral and Majure (1993) and Barros (1995). They focus on the case of Portugal, while we are
primarily interested in finding the underlying behavior of banks across countries.
The next section ill ustrates the object of our analysis, namely the retail banking industry, the
deregulation process as it is captured in the analysis and the way the sample was obtained.
Then the theoretical model and the test of the model is presented in section 3, while section 4
is devoted to the econometric specification and the empirical analysis. Finally, section 5
concludes the paper.

4
2. The European retail banking industry
In the banking industry, as in many other industries, there are two relevant segments: the
retail and the wholesale market.4 In the retail segment, banks mainly collect deposits and lend
funds to households and firms. In the wholesale segment, banks may in addition supply a large
variety of financial services, as for example underwriting of new issues, intermediation of
different financial activities, etc. In the two segments, banks differ also with respect to their
size. In particular, large banks do tend to operate in the wholesale segment, where it is unlikely
to find small banks. Here we focus on the retail market where the vast majority of banks
operate, irrespective of their size, and where it is easier to model strategic interactions among
banks.
Banks, in the retail market, compete for clients by topping their rival interest rates and by
locating their branches closer to their clients. In other words, banks can exploit the fact that
their clients have preferences over locations, in order to mitigate interest rate competition and
earn some market power by enlarging their branching network. The decision to open branches
depends on the effect that opening new branches has on its own clientele and on rivals'
response to it. Opening new branches, on one hand, augments the demand for services to the
bank (expansive effect), but, on the other hand, it may cause a relocation of clients either from
branches of rivals, or from preexistent branches of the same bank (competitive effect).
Disregarding costs, the benefits of opening new branches depend very much on the relative
strength of the expansive effect and the competitive effect. In a market where the competitive
effect prevails, it is likely that banks will open few branches. However, opening new branches,
independently of the size of their operations, has also a fixed cost, as for example the cost of
hiring personnel, the cost of renting or buying facili ties in that particular region, etc. A tougher
price competition in the region reduces the expected profits of the new branch and therefore,
the abili ty to recover the fixed costs. Then the bank will li kely decide not to open new
branches. In several countries, the abili ty to compete in interest rates has in fact been for long
time impeded, in particular for small institutions, and the size of branching networks has
3 On models of spatial competition for the banking industry, see also de Palma and Uctum (1992).4 Bröker (1989) and Kaufman (1992) provide detailed pictures of structures and relevant strategicissues of the European banking industry.
5
become an important strategic variable for banks. It is now believed that, in many countries,
banks own too many branches and that tougher competition in interest rates will reduce the
average size of networks.
These issues are particularly relevant for the European retail banking industry, given that
financial markets integration is far from being achieved and that banking industries are still very
different from one country to the other.
2.1 Deregulation in the European banking systems
The European banking systems differ mainly for historical reasons. For example, the degree
of competition or the onset of the deregulation process varies across countries. According to
Gual and Neven (1992), Germany is one of the speediest in deregulating conduct, while
Portugal is the slowest. Since not all these differences are captured by the institutional changes
during the years analyzed in our sample, we let the degree of competition to be different from
one country to the other in the empirical analysis below.
In the eighties, the institutional framework in which banks were operating has changed
drastically, as a consequence of the deregulation process that has affected both banking
competition and the structure of markets, through the relaxation of entry barriers within and
across markets. A description of the legal framework in which banks operate is out of the
scope of this paper.5 However, to evaluate the impact of the changes on the conduct and
structure of the banking industry, it is crucial to understand how these changes are captured in
the analysis.
Typically banking regulation is regrouped under three different categories, according to
their objective: structural, conduct and prudential regulation. For instance, a regulation that
affects the degree of competition is considered to be conduct regulation, while for example,
controls on entrance of foreign banks or limitations to branching are part of structural
regulations. Moreover, prudential regulation, whose main objective is to protect depositors or,
in general, financial markets from the consequences of bank failures, has an impact on the
structure of the banking industry through capital requirements. Regardless of its main
objective, any type of regulation will have an impact on either conduct or market structure of
the banking industry. Our objective is to pin down the changes in banking regulation on the
5 See Gual and Neven (1992) and ERE Summary Report (1996) for extremely helpful and completeguides on banking regulatory environment.
6
degree of competition, on the decision to open or close branches and finally on the decision to
enter the market. Therefore, we consider changes in legislation that could directly affect
conduct, branching and entry in the European retail banking industry.6
2.2 Our sample
Our sample consists of annual data on banks in nine EEC countries, namely Belgium,
Denmark, France, Germany, Greece, Italy, Netherlands, Portugal and Spain. The economic
unit on which we focus is the single bank and not its single branch, because strategic decisions
about entry and size of branching network are taken at the bank level. Therefore, banks that
have been operating for at least two years between 1989 and 1993 in the nine countries are
retained from the IBCA database. Since the relevant market is the retail banking market, only
commercial banks are selected, with the exceptions of very few merchant banks (approximately
20 of more than 650 sampled banks) that collect customer deposits as indicator of their
presence in the retail segment.
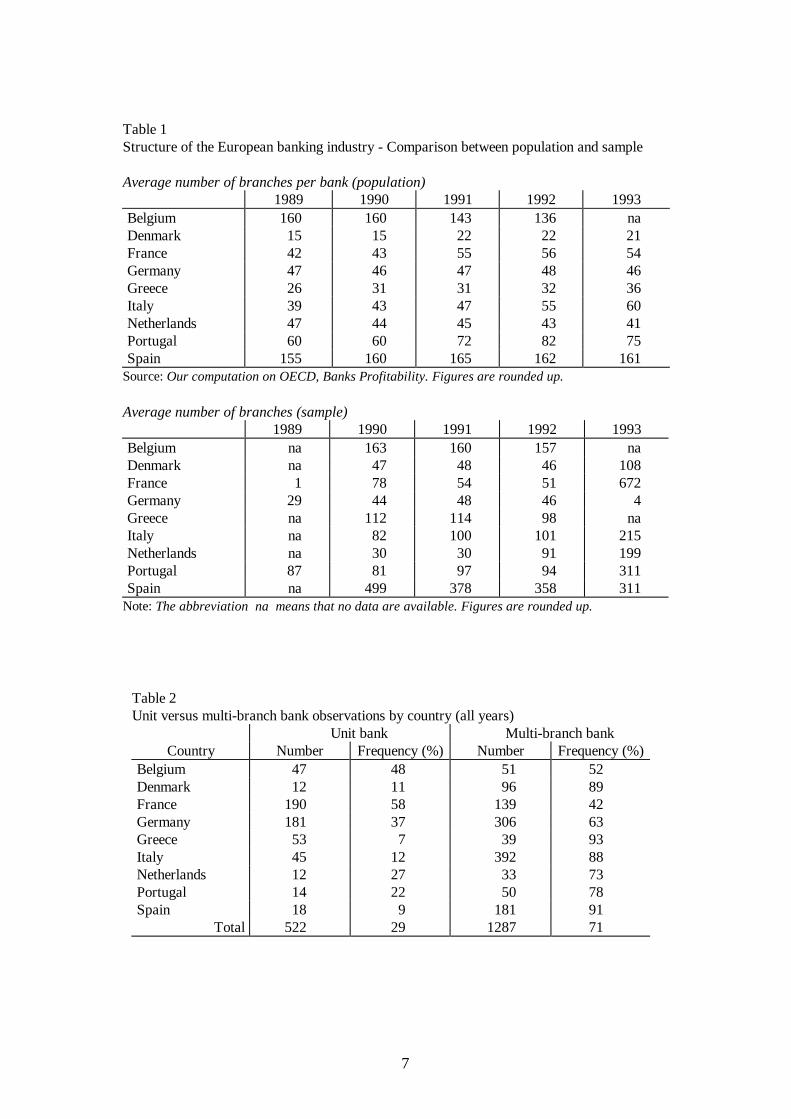
Our sample contains between fifteen and fifty percent of the total population of banks by
country. It is representative of the overall banking system in each country as it mimics fairly
well i ts structure according to the average branching size in years 1990-1992. (See Table 1.)
The average number of branches in the sample is comparable to the OECD figures for
Belgium, Germany, and France, while, for the other countries, larger banks are slightly over
sampled. However, because of missing data on the years at the extremes of the sample, we
were not able to construct such a representative sample for the years 1989 and 1993.
Very few banks in the sample entered new markets between 1989 and 1993. Entry in the
industry would happen either when a new bank is created in a country, or when a previously
existing bank starts operating in another country, by opening branches or by acquiring local
banks. In this sense, entry and exit did not occur except for a very few banks that have been
discarded because incomplete or imprecise data for what concerns the number of branches.
(See in the Appendix for our data sources.) Thus, entry or exit from the sample is random and
only due to the data collection process. In other terms, data attrition, relatively to the years
1989 and 1993, is exogenous.
6 Later, in section 4, we describe the specific changes in legislation accounted for in the empiricalanalysis.
7
Table 1Structure of the European banking industry - Comparison between population and sample
Average number of branches per bank (population) 1989 1990 1991 1992 1993Belgium 160 160 143 136 naDenmark 15 15 22 22 21France 42 43 55 56 54Germany 47 46 47 48 46Greece 26 31 31 32 36Italy 39 43 47 55 60Netherlands 47 44 45 43 41Portugal 60 60 72 82 75Spain 155 160 165 162 161
Source: Our computation on OECD, Banks Profitabilit y. Figures are rounded up.
Average number of branches (sample) 1989 1990 1991 1992 1993Belgium na 163 160 157 naDenmark na 47 48 46 108France 1 78 54 51 672Germany 29 44 48 46 4Greece na 112 114 98 naItaly na 82 100 101 215Netherlands na 30 30 91 199Portugal 87 81 97 94 311Spain na 499 378 358 311
Note: The abbreviation na means that no data are available. Figures are rounded up.
Table 2Unit versus multi-branch bank observations by country (all years)
Unit bank Multi-branch bankCountry Number Frequency (%) Number Frequency (%)
Belgium 47 48 51 52Denmark 12 11 96 89France 190 58 139 42Germany 181 37 306 63Greece 53 7 39 93Italy 45 12 392 88Netherlands 12 27 33 73Portugal 14 22 50 78Spain 18 9 181 91
Total 522 29 1287 71

8
Moreover, to our knowledge, only eight banks of our sample have been involved in mergers
over the period. This does not mean necessarily that there have been so few mergers during
these years. Actually, in recent years, there has been a wave of mergers and acquisitions,
although mainly inside borders, that has led to a consolidation of banking industries.7 However,
on one hand, this information is not available to us and on the other hand, this phenomenon has
occurred in the last years of the sample. To sum up, in principle one should be cautious as
cross-borders mergers might affect the results when evaluating entry costs.
A large proportion of banks (namely 522 over 1809 observations) has only one branch,
presumably the headquarters of the bank. (See Table 2) Although these unit banks are more
likely to operate in the wholesale segment where branches do not give any competitive edge on
rivals, we consider them to be present also in the retail segment whenever collecting retail
customer deposits. Indeed, the choice of being a unit bank is a signal of higher branching costs
compared to other banks that concentrate their operations in the retail segment.
3. A model and a test of the industry structure
In the retail segment, banking competition involves two dimensions, interest rates and
network of branches. For what concerns interest rate, note that to get a loan from a bank, an
account is needed first. Therefore, competition for deposits is crucial to capture clients and
branching gives an edge over competitors. Hence, competition in the retail banking industry is
a two-stage game where banks decide whether to enter the industry together with the size of
their networks, taking into account that, in a latter stage, profits are determined by competition
on interest rates. We skip the analysis of interest rate competition8, and focus instead on the
entry and branching decisions.
3.1 The model
The decision to open branches results from a cost-benefits trade-off. On one hand, opening
new branches attracts new clients in the market (expansive effect). On the other hand, a new
7 See Gual and Neven (1992) and ERE Summary Report (1996) for detailed figures on the number ofcross-borders vs. inside borders mergers and acquisitions in the last years.8 See Cerasi (1995) for a model where banks compete both in branching and interest rates, that deliversa profit function with the same properties as the one in this paper.

9
branch steals business to old branches (competitive effect), attracting clients either from
competitors or from preexistent branches of the same bank. Not taking costs into account, the
benefits of opening new branches result from the balance between expansive and competitive
effect. This intuition is translated by imposing that, given the outcome of the interest rate
competition, overall bank profits increase in the number of branches of the bank, but at a
slower pace, as the size of the branching network increases. Further, the benefits of opening a
new branch in a market crowded by competitors must be smaller. In other words, overall bank
profits must decrease with the number of branches of other competitors.
Denote by � �S k Ni i� the overall profits of bank i, assuming that it is a concave function in
the number of branches of the bank, ki and a decreasing function of the number of branches of
rivals N i� . This profit function is a reduced form of the profits of the second stage of the
game, as it implies equili brium in the interest rate competition game.
A convenient specification for the overall bank profits is given by
� �N
Sk
Nk
SkNk
ci
ii
ci
ii � �
�S , (1)
where S is the size of the market, N the overall number of branches in the market, i.e.
¦ i
ikN , while c is a non-negative parameter that measures the elasticity of profits to
branching.9 The special feature of this form is that each bank profits are proportional to its
share of branches in the industry and moreover, that the impact of branching on profits can be
measured by the parameter c.
This form is general enough as it allows testing both for the nature of competition in
branching and for the degree of toughness of interest rates competition. On one hand, for low
values of c, branching competition can be represented by a model of spatial competition,
where, at a given market size, the only way to capture new clients is by stealing clients to other
branches, while for larger values of c, the expansive effect becomes important and branching
competition may be better captured with other models of monopolistic competition10. On the
other hand, low values of c imply that profits are less sensitive to changes in branching and this
9 From the profit function in equation (1), one could see that the elasticity of profits to its own brancheski converges to c as N goes to infinity.
10
may be due to tougher price competition. As a matter of fact, tougher competition in interest
rates reduces profits in the second stage as well as marginal benefits of a new branch.
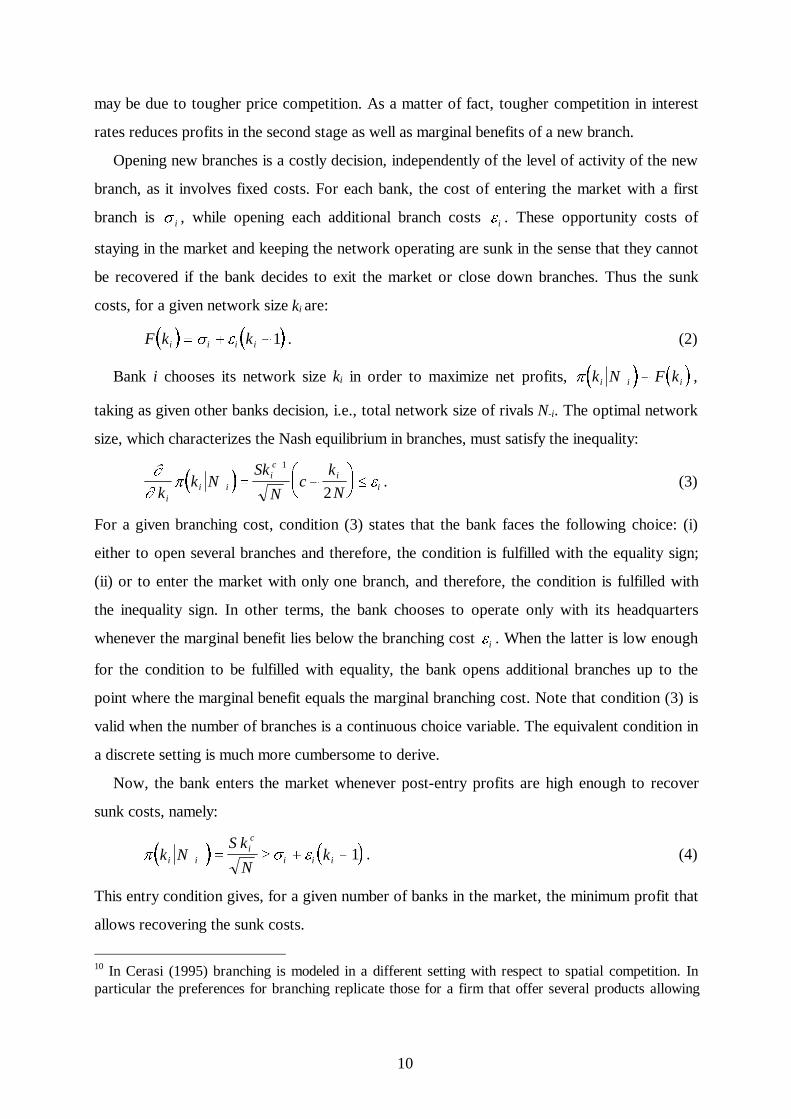
Opening new branches is a costly decision, independently of the level of activity of the new
branch, as it involves fixed costs. For each bank, the cost of entering the market with a first
branch is V i , while opening each additional branch costs H i . These opportunity costs of
staying in the market and keeping the network operating are sunk in the sense that they cannot
be recovered if the bank decides to exit the market or close down branches. Thus the sunk
costs, for a given network size ki are:
� � � �F k ki i i i � �V H 1 . (2)
Bank i chooses its network size ki in order to maximize net profits, � � � �S k N F ki i i� � ,
taking as given other banks decision, i.e., total network size of rivals N-i. The optimal network
size, which characterizes the Nash equili brium in branches, must satisfy the inequality:
� �ww S H
kk N
Sk
Nc
k
Nii i
ic
ii�
� �§
©̈·¹̧ d
1
2. (3)
For a given branching cost, condition (3) states that the bank faces the following choice: (i)
either to open several branches and therefore, the condition is fulfill ed with the equality sign;
(ii) or to enter the market with only one branch, and therefore, the condition is fulfill ed with
the inequality sign. In other terms, the bank chooses to operate only with its headquarters
whenever the marginal benefit lies below the branching cost H i . When the latter is low enough
for the condition to be fulfill ed with equality, the bank opens additional branches up to the
point where the marginal benefit equals the marginal branching cost. Note that condition (3) is
valid when the number of branches is a continuous choice variable. The equivalent condition in
a discrete setting is much more cumbersome to derive.
Now, the bank enters the market whenever post-entry profits are high enough to recover
sunk costs, namely:
� � � �S V Hk NSk
Nki i
ic
i i i� t � � 1 . (4)
This entry condition gives, for a given number of banks in the market, the minimum profit that
allows recovering the sunk costs.
10 In Cerasi (1995) branching is modeled in a different setting with respect to spatial competition. Inparticular the preferences for branching replicate those for a firm that offer several products allowing

11
Note that condition (3) and (4) are based on the reduced form of profits of the second
stage. Therefore, they do not depend upon interest rates and volumes. The reduced form will
be directly estimated in the econometric model
3.2 The industry structure
Assume that, in each period t, bank i is in equili brium. That is, at the beginning of each
period, the bank is given a new set of costs � �H Vit it, and decides whether to stay in the market
and with how many branches. In other words, in each period, for a bank, that is still present in
the market, both conditions, (3) and (4), should hold. In particular, the equili brium number of
branches at time t for bank i, kit , defined as the number of branches in the previous period
ki t, �1 plus the change in the number of branches from one period to the other, namely 'kit ,
must satisfy
Sk
Nc
k k
Nt it
c
t
i t it
tit
��� �§
©̈·¹̧ d
11
2, ' H , (3’)
The non-negative profit condition can be written as:
� �S k
Nkt it
c
t
it it it� � tH V1 . (4’)
Define
¸̧¹·
¨̈©§ �{ �
�
t
ti
t
citit
itN
kc
N
kSA
21,
1
. (5)
Considering only multi-branch banks at time t, i.e., kit ! 1, for which condition (3’) is fulfill ed
with the equality sign, one can distinguish between two different cases. Either
A kit it itt � tH ' 0, (6a)
or
A kit it it� � �H ' 0. (6b)
In other terms, when a bank is in the market with more than one branch and has opened
(closed) branches since the previous period, it implies that the branching cost is lower (higher)
than the quantity in the LHS of inequality (6a) ((6b), respectively).
for a larger benefit of opening new branches than in a model of spatial competition.
12
The model allows distinguishing between unit and multi-branch banks. For unit banks,
condition (3’) holds as a strict inequality. In addition, 'kit 0 by definition, as a unit bank
owns only one branch for at least two successive periods. Therefore, unit banks satisfy
condition (6b).
Summing up, the equili brium condition allows us to allocate bank i into one of two classes,
according to whether it is a multi-branch bank that has not shrunk, i.e., when'kit t 0 and
kit !1, and thus Ait itt H , or whether it is a multi-branch bank that has shrunk, i.e., when
'kit � 0 and kit !1, or it is a unit bank, and therefore Ait it� H . Hence, define two sets
E t1 =^ i such that 'kit t 0 and kit ! 1 ,̀ (7a)
and
E t2 =^ i such that 'kit � 0 and kit ! 1, or kit 1 ,̀ (7b)
with E Et t1 2� � and E E Et t t1 2� and Et is the set of banks that are in the market at
time t.
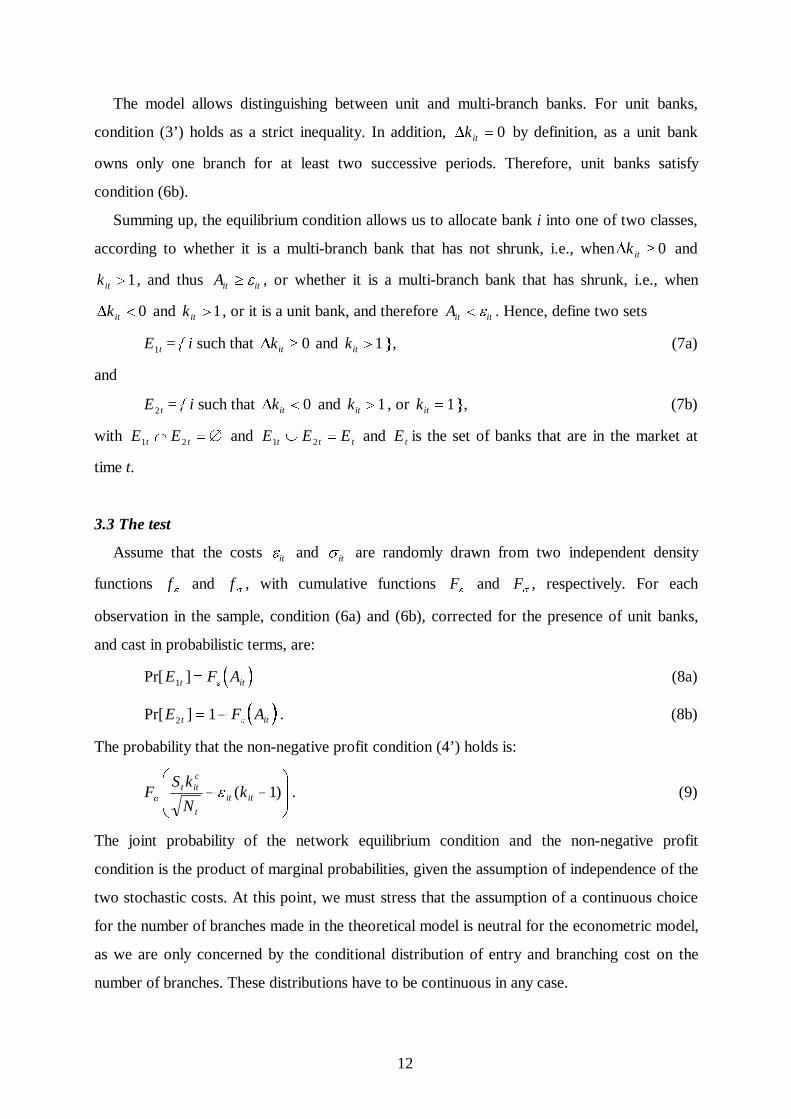
3.3 The test
Assume that the costs Hit and V it are randomly drawn from two independent density
functions f H and fV , with cumulative functions FH and FV , respectively. For each
observation in the sample, condition (6a) and (6b), corrected for the presence of unit banks,
and cast in probabili stic terms, are:
� �Pr[ ]E F At it1 H (8a)
� �Pr[ ]E F At it2 1 � H . (8b)
The probabili ty that the non-negative profit condition (4’) holds is:
¸̧¹·
¨̈©§ �� )1( itit
t
citt k
N
kSF HV . (9)
The joint probabili ty of the network equili brium condition and the non-negative profit
condition is the product of marginal probabili ties, given the assumption of independence of the
two stochastic costs. At this point, we must stress that the assumption of a continuous choice
for the number of branches made in the theoretical model is neutral for the econometric model,
as we are only concerned by the conditional distribution of entry and branching cost on the
number of branches. These distributions have to be continuous in any case.
13
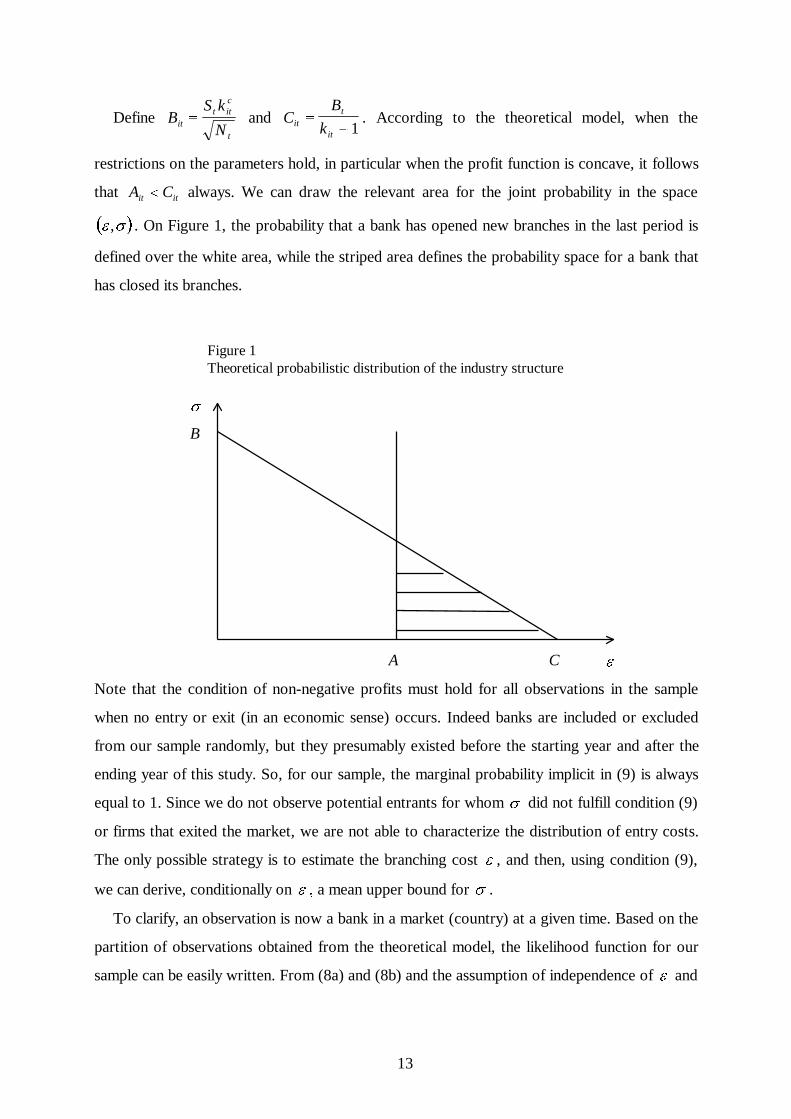
Define BS k
Nitt it
c
t
{ and CB
kitt
it
{ � 1. According to the theoretical model, when the
restrictions on the parameters hold, in particular when the profit function is concave, it follows
that A Cit it� always. We can draw the relevant area for the joint probabili ty in the space
� �H V, . On Figure 1, the probabili ty that a bank has opened new branches in the last period is
defined over the white area, while the striped area defines the probabili ty space for a bank that
has closed its branches.
Figure 1Theoretical probabili stic distribution of the industry structure
Note that the condition of non-negative profits must hold for all observations in the sample
when no entry or exit (in an economic sense) occurs. Indeed banks are included or excluded
from our sample randomly, but they presumably existed before the starting year and after the
ending year of this study. So, for our sample, the marginal probabili ty implicit in (9) is always
equal to 1. Since we do not observe potential entrants for whom V did not fulfill condition (9)
or firms that exited the market, we are not able to characterize the distribution of entry costs.
The only possible strategy is to estimate the branching cost H , and then, using condition (9),
we can derive, conditionally on H � a mean upper bound for V .
To clarify, an observation is now a bank in a market (country) at a given time. Based on the
partition of observations obtained from the theoretical model, the likelihood function for our
sample can be easily written. From (8a) and (8b) and the assumption of independence of H and
V
H A
B
C
14
V both through time, across banks and across countries, conditionally on bank and market
specific variables, the likelihood function is:
� �ln ln ( ) ln ( )L F A F Ai E
ijti E
ijtj
J
t
T
jt jt
� �®°°̄
½¾°¿°� �
¦ ¦¦¦1 2
111
H H (10)
where the subscripts stand for bank i, market (country) j, time t.
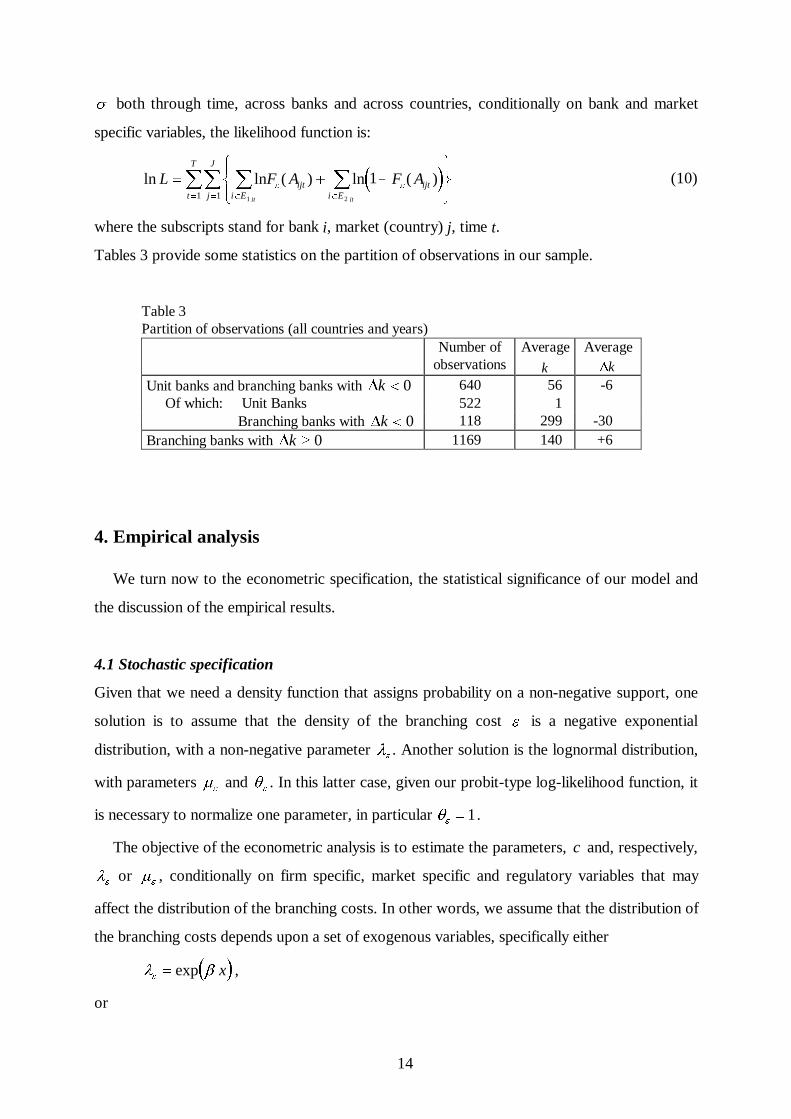
Tables 3 provide some statistics on the partition of observations in our sample.
Table 3Partition of observations (all countries and years)
Number ofobservations
Average
k
Average'k
Unit banks and branching banks with 'k � 0 640 56 -6Of which: Unit Banks 522 1 Branching banks with 'k � 0 118 299 -30
Branching banks with 'k t 0 1169 140 +6
4. Empirical analysis
We turn now to the econometric specification, the statistical significance of our model and
the discussion of the empirical results.
4.1 Stochastic specification
Given that we need a density function that assigns probabili ty on a non-negative support, one
solution is to assume that the density of the branching cost H is a negative exponential
distribution, with a non-negative parameter OH . Another solution is the lognormal distribution,
with parameters PH and TH . In this latter case, given our probit-type log-likelihood function, it
is necessary to normalize one parameter, in particular TH 1.
The objective of the econometric analysis is to estimate the parameters, c and, respectively,
OH or PH , conditionally on firm specific, market specific and regulatory variables that may
affect the distribution of the branching costs. In other words, we assume that the distribution of
the branching costs depends upon a set of exogenous variables, specifically either
� �O EH exp x ,
or
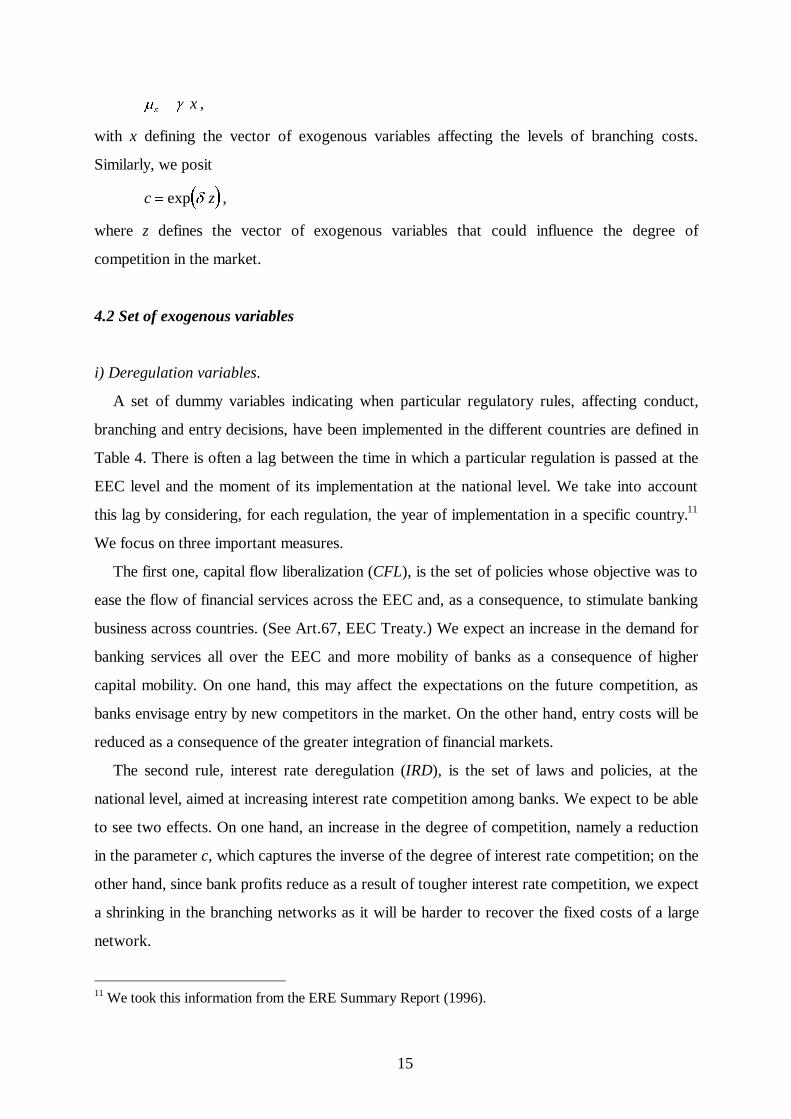
15
P JH x ,
with x defining the vector of exogenous variables affecting the levels of branching costs.
Similarly, we posit
� �c z exp G ,
where z defines the vector of exogenous variables that could influence the degree of
competition in the market.
4.2 Set of exogenous variables
i) Deregulation variables.
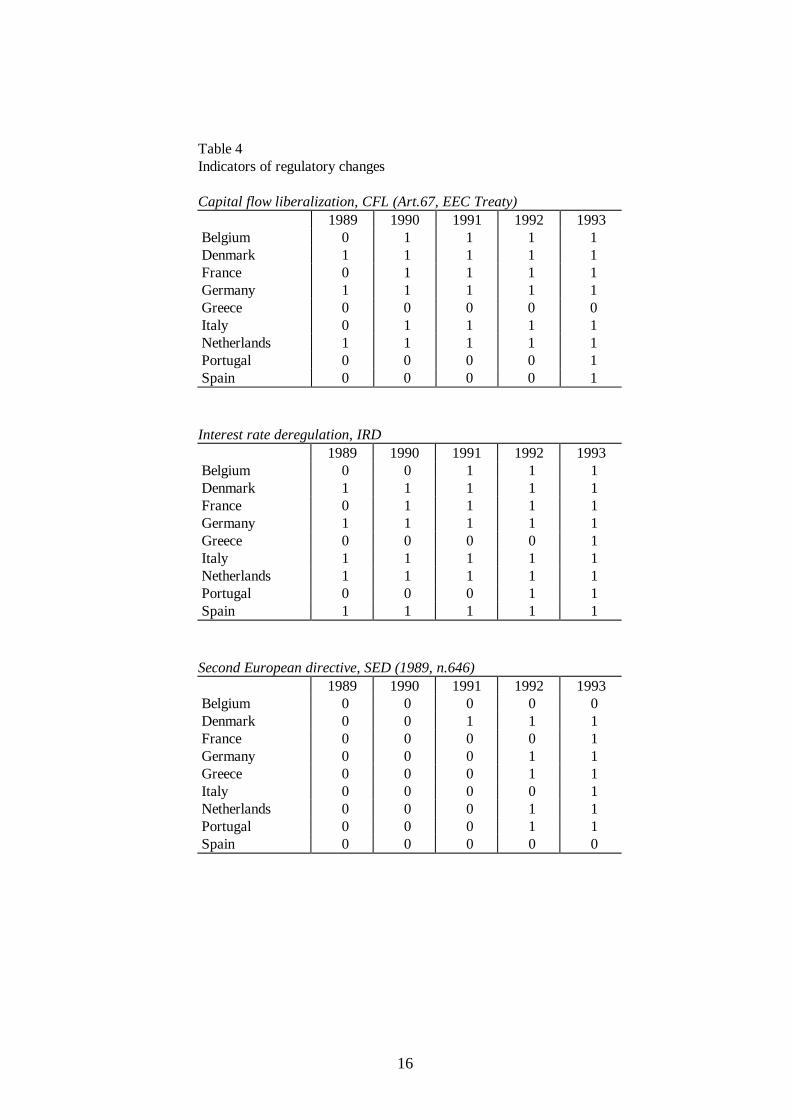
A set of dummy variables indicating when particular regulatory rules, affecting conduct,
branching and entry decisions, have been implemented in the different countries are defined in
Table 4. There is often a lag between the time in which a particular regulation is passed at the
EEC level and the moment of its implementation at the national level. We take into account
this lag by considering, for each regulation, the year of implementation in a specific country.11
We focus on three important measures.
The first one, capital flow liberalization (CFL), is the set of policies whose objective was to
ease the flow of financial services across the EEC and, as a consequence, to stimulate banking
business across countries. (See Art.67, EEC Treaty.) We expect an increase in the demand for
banking services all over the EEC and more mobili ty of banks as a consequence of higher
capital mobili ty. On one hand, this may affect the expectations on the future competition, as
banks envisage entry by new competitors in the market. On the other hand, entry costs will be
reduced as a consequence of the greater integration of financial markets.
The second rule, interest rate deregulation (IRD), is the set of laws and policies, at the
national level, aimed at increasing interest rate competition among banks. We expect to be able
to see two effects. On one hand, an increase in the degree of competition, namely a reduction
in the parameter c, which captures the inverse of the degree of interest rate competition; on the
other hand, since bank profits reduce as a result of tougher interest rate competition, we expect
a shrinking in the branching networks as it will be harder to recover the fixed costs of a large
network.
11 We took this information from the ERE Summary Report (1996).
16
Table 4Indicators of regulatory changes
Capital flow liberalization, CFL (Art.67, EEC Treaty) 1989 1990 1991 1992 1993Belgium 0 1 1 1 1Denmark 1 1 1 1 1France 0 1 1 1 1Germany 1 1 1 1 1Greece 0 0 0 0 0Italy 0 1 1 1 1Netherlands 1 1 1 1 1Portugal 0 0 0 0 1Spain 0 0 0 0 1
Interest rate deregulation, IRD 1989 1990 1991 1992 1993Belgium 0 0 1 1 1Denmark 1 1 1 1 1France 0 1 1 1 1Germany 1 1 1 1 1Greece 0 0 0 0 1Italy 1 1 1 1 1Netherlands 1 1 1 1 1Portugal 0 0 0 1 1Spain 1 1 1 1 1
Second European directive, SED (1989, n.646) 1989 1990 1991 1992 1993Belgium 0 0 0 0 0Denmark 0 0 1 1 1France 0 0 0 0 1Germany 0 0 0 1 1Greece 0 0 0 1 1Italy 0 0 0 0 1Netherlands 0 0 0 1 1Portugal 0 0 0 1 1Spain 0 0 0 0 0

17
Finally, the third dummy refers to the second European directive 1989/n.646 (SED). This
directive has introduced the principle of single license for banks, which must facili tate entrance
by foreign banks across EEC markets. Furthermore this directive has shifted the capital
requirement for a bank that enters a new market from each single branch to the bank level, and
thus we expect to see a reduction in the cost of opening new branches across countries.
ii ) Inputs costs.
Costs may affect the choice of opening a new branch, for example the cost of labor and the
interest rate on real capital, as they represent the fixed factors in operating a branch. On the
one hand, the labor cost is an important component of fixed costs in branching, as personnel is
needed to run a branch and must be paid independently of the level of activity of that particular
branch. More specifically, the unit labor cost in a particular region (country) must affect the
decision as to whether to open a new branch in that region. Therefore, we look at the way in
which the real wage in the banking sector (Wage) affects the average cost of branching,
expecting a positive relationship.
On the other hand, opening a branch involves renting or buying facili ties in a particular
location, i.e., an investment in fixed capital. We consider this effect by taking the real interest
rates (Rirate) as a proxy for the cost of investing in fixed capital. The average cost of
branching should increase if the opportunity cost of investing in fixed capital increases.
Unfortunately this proxy may pin down also other effects, as for example the costs of interbank
funds, and therefore the results should be carefully interpreted. If the real interest rate were to
capture the cost of funds in the interbank market, we should expect a negative relationship
with the cost of branching, as a rise in the interbank rate increases the convenience of
collecting funds through branches.
iii ) Market and network variables.
It remains to measure the market size, S, the network size, k, and the overall size of networks,
N. For each country, total deposits are used as a proxy for S, while N is the total number of
branches. Then, for each bank included in the sample, we have a measure of the number of
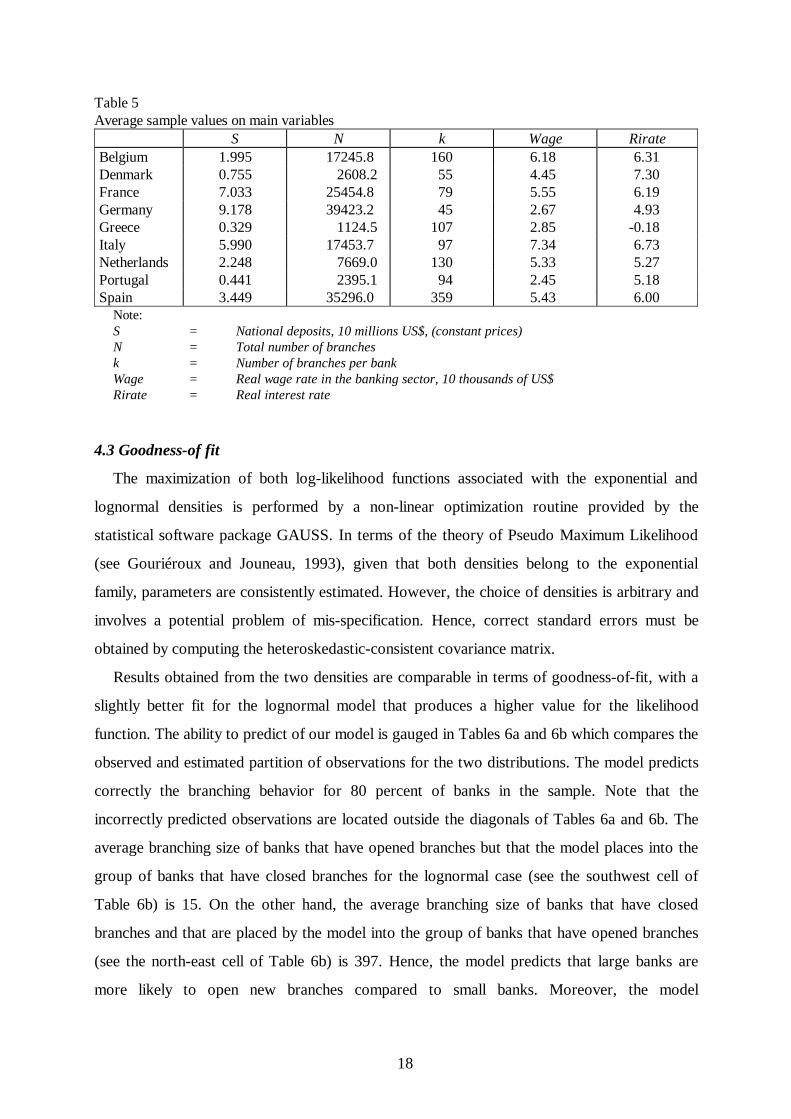
branches, k. Table 5 provides the average values for the exogenous variables included in the
econometric model.
18
Table 5Average sample values on main variables
S N k Wage RirateBelgium 1.995 17245.8 160 6.18 6.31Denmark 0.755 2608.2 55 4.45 7.30France 7.033 25454.8 79 5.55 6.19Germany 9.178 39423.2 45 2.67 4.93Greece 0.329 1124.5 107 2.85 -0.18Italy 5.990 17453.7 97 7.34 6.73Netherlands 2.248 7669.0 130 5.33 5.27Portugal 0.441 2395.1 94 2.45 5.18Spain 3.449 35296.0 359 5.43 6.00
Note: S = National deposits, 10 milli ons US$, (constant prices) N = Total number of branches k = Number of branches per bank Wage = Real wage rate in the banking sector, 10 thousands of US$ Rirate = Real interest rate
4.3 Goodness-of fit
The maximization of both log-likelihood functions associated with the exponential and
lognormal densities is performed by a non-linear optimization routine provided by the
statistical software package GAUSS. In terms of the theory of Pseudo Maximum Likelihood
(see Gouriéroux and Jouneau, 1993), given that both densities belong to the exponential
family, parameters are consistently estimated. However, the choice of densities is arbitrary and
involves a potential problem of mis-specification. Hence, correct standard errors must be
obtained by computing the heteroskedastic-consistent covariance matrix.
Results obtained from the two densities are comparable in terms of goodness-of-fit, with a
slightly better fit for the lognormal model that produces a higher value for the likelihood
function. The abili ty to predict of our model is gauged in Tables 6a and 6b which compares the
observed and estimated partition of observations for the two distributions. The model predicts
correctly the branching behavior for 80 percent of banks in the sample. Note that the
incorrectly predicted observations are located outside the diagonals of Tables 6a and 6b. The
average branching size of banks that have opened branches but that the model places into the
group of banks that have closed branches for the lognormal case (see the southwest cell of
Table 6b) is 15. On the other hand, the average branching size of banks that have closed
branches and that are placed by the model into the group of banks that have opened branches
(see the north-east cell of Table 6b) is 397. Hence, the model predicts that large banks are
more likely to open new branches compared to small banks. Moreover, the model
19
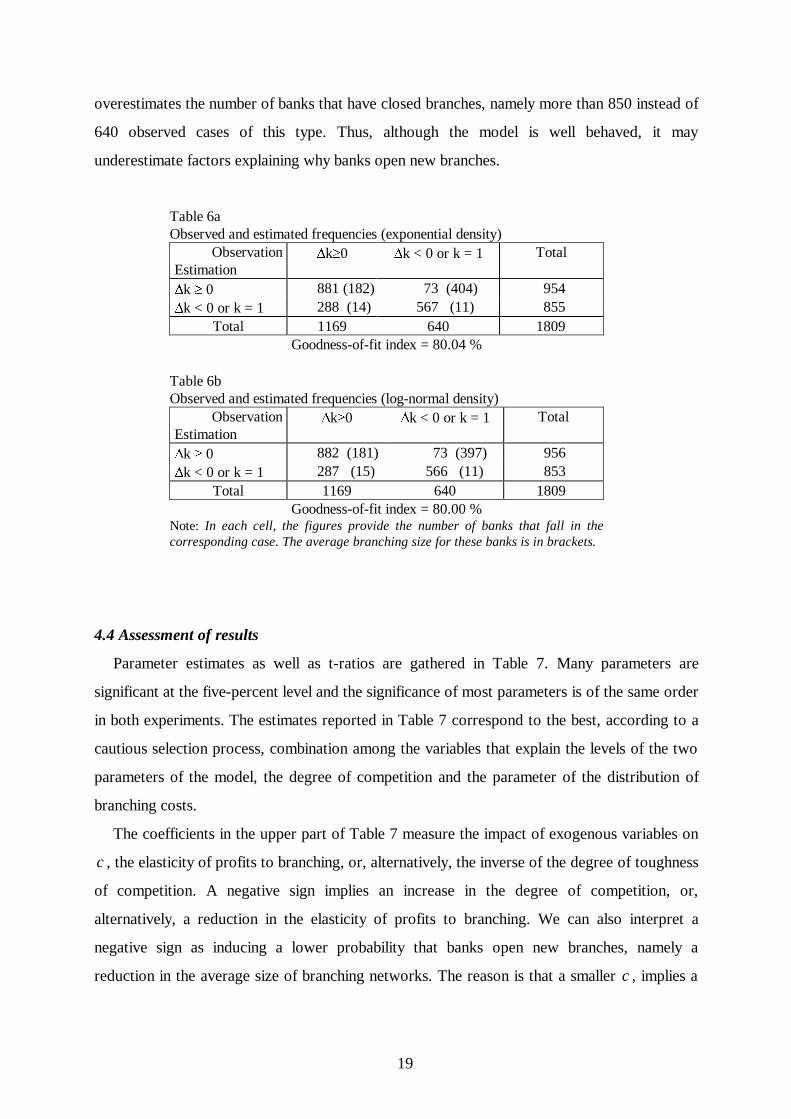
overestimates the number of banks that have closed branches, namely more than 850 instead of
640 observed cases of this type. Thus, although the model is well behaved, it may
underestimate factors explaining why banks open new branches.
Table 6aObserved and estimated frequencies (exponential density)
ObservationEstimation
'kt0 'k < 0 or k = 1 Total
'k t 0 881 (182) 73 (404) 954'k < 0 or k = 1 288 (14) 567 (11) 855
Total 1169 640 1809Goodness-of-f it index = 80.04 %
Table 6bObserved and estimated frequencies (log-normal density)
ObservationEstimation
'kt0 'k < 0 or k = 1 Total
'k t 0 882 (181) 73 (397) 956'k < 0 or k = 1 287 (15) 566 (11) 853
Total 1169 640 1809Goodness-of-f it index = 80.00 %
Note: In each cell , the figures provide the number of banks that fall i n thecorresponding case. The average branching size for these banks is in brackets.
4.4 Assessment of results
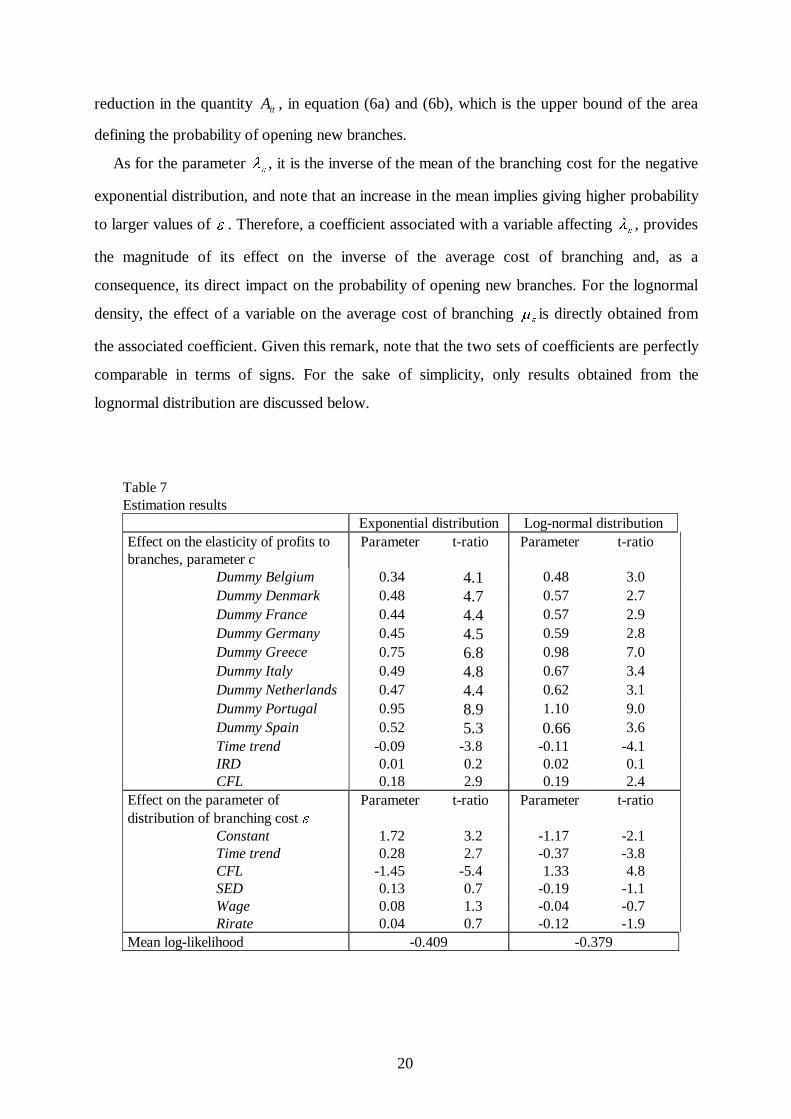
Parameter estimates as well as t-ratios are gathered in Table 7. Many parameters are
significant at the five-percent level and the significance of most parameters is of the same order
in both experiments. The estimates reported in Table 7 correspond to the best, according to a
cautious selection process, combination among the variables that explain the levels of the two
parameters of the model, the degree of competition and the parameter of the distribution of
branching costs.
The coefficients in the upper part of Table 7 measure the impact of exogenous variables on
c , the elasticity of profits to branching, or, alternatively, the inverse of the degree of toughness
of competition. A negative sign implies an increase in the degree of competition, or,
alternatively, a reduction in the elasticity of profits to branching. We can also interpret a
negative sign as inducing a lower probabili ty that banks open new branches, namely a
reduction in the average size of branching networks. The reason is that a smaller c , implies a
20
reduction in the quantity Ait , in equation (6a) and (6b), which is the upper bound of the area
defining the probabili ty of opening new branches.
As for the parameter OH , it is the inverse of the mean of the branching cost for the negative
exponential distribution, and note that an increase in the mean implies giving higher probabili ty
to larger values of H . Therefore, a coefficient associated with a variable affecting OH , provides
the magnitude of its effect on the inverse of the average cost of branching and, as a
consequence, its direct impact on the probabili ty of opening new branches. For the lognormal
density, the effect of a variable on the average cost of branching PH is directly obtained from
the associated coefficient. Given this remark, note that the two sets of coefficients are perfectly
comparable in terms of signs. For the sake of simplicity, only results obtained from the
lognormal distribution are discussed below.
Table 7Estimation results Exponential distribution Log-normal distributionEffect on the elasticity of profits tobranches, parameter c
Parameter t-ratio Parameter t-ratio
Dummy Belgium 0.34 4.1 0.48 3.0Dummy Denmark 0.48 4.7 0.57 2.7Dummy France 0.44 4.4 0.57 2.9Dummy Germany 0.45 4.5 0.59 2.8Dummy Greece 0.75 6.8 0.98 7.0Dummy Italy 0.49 4.8 0.67 3.4Dummy Netherlands 0.47 4.4 0.62 3.1Dummy Portugal 0.95 8.9 1.10 9.0Dummy Spain 0.52 5.3 0.66 3.6Time trend -0.09 -3.8 -0.11 -4.1IRD 0.01 0.2 0.02 0.1CFL 0.18 2.9 0.19 2.4
Effect on the parameter ofdistribution of branching cost H
Parameter t-ratio Parameter t-ratio
Constant 1.72 3.2 -1.17 -2.1Time trend 0.28 2.7 -0.37 -3.8CFL -1.45 -5.4 1.33 4.8SED 0.13 0.7 -0.19 -1.1Wage 0.08 1.3 -0.04 -0.7Rirate 0.04 0.7 -0.12 -1.9
Mean log-likelihood -0.409 -0.379

21
First of all, the country dummies are highly significant. Thus, the starting conditions of price
competition in the various countries were different before 1989 and must be taken into
consideration. Alternative specifications in which the country dummies were in OH (or in PH )
rather than in c did not provide a better model in terms of likelihood ratio. So, country
specificities are more effective in capturing differences in competitive framework than in the
average branching costs.
Note that the time trend for the parameter c is negative, so that competition becomes
fiercer, as time goes. Note that this implies that the efficient size of branching networks
decreases and it cannot be seen directly from descriptive statistics since the average number of
branches per bank would indicate a positive trend. (See Table 1.)
The effect of increasing toughness of interest rate competition does not seem to be induced
directly by the changes in regulatory rules. Indeed, the coefficient of interest rate deregulation
(dummy IRD) is not significant, while capital flow liberalization (dummy CFL) has a positive
sign. On one hand, the time trend probably captures the effect of changes in regulation at the
country level more than at the European level. On the other hand, capital flow liberalization
has certainly increased the potential size of the market and hence, expected profits and
marginal benefits of branching for banks, as we will discuss below.
Consider now the determinants of average values of branching costs. Again, the sign of the
time trend indicates that costs have decreased over time and therefore the average branching
size of banks tends to be smaller. Note that this effect cannot be seen directly from descriptive
statistics since the average number of branches per bank would indicate a positive trend. (See
Table 1) Further, the coefficient for the real wage (Wage) has a sign opposite to what it is
expected. In fact, given that a wage rate is not available at the bank level and that we consider
here the real wage for the whole banking industry in each country, this variable plays the role
of a trend.12 Here again, the effects of changes in the regulatory environment are disappointing.
First, the dummy indicating the effectiveness of the second European directive (SED) has the
expected sign but is not significant. Second, capital flow liberalization (dummy CFL) has a
counterintuitive effect on branching costs. However, this liberalization could have forced banks
to increase their network size in order to be present in new markets. Finally, the coefficient of
the real interest rate (Rirate) is not significant and negative, which may indicate that the real
12 Indeed, in estimation (not reported) where the time trend is removed, nothing changes except that thereal wage coeff icient becomes significant and keeps its sign.

22
interest rate on public bonds is more than a proxy for the cost of fixed capital, the opportunity
cost of raising funds through branches.
For what concerns the impact of deregulation on the structure of the banking industry, our
results are can be summarized in what follows. On one hand, interest rate deregulation and the
second European directive did not have a significant effect. It may be that these new rules have
not had a direct effect, although have induced a new context of competition in each country
which is captured by the significant effect of trends introduced in the econometric model.
On the other hand, capital flow liberalization has played a strong role by increasing average
branching costs. One possible explanation is that banks, in response to this new rule, have
envisaged a greater future competition due to the larger integration of markets and rise in
demand for banking services, and therefore, anticipated this effect by closing down branches.
If, however, there is an asymmetry between closing and opening branches, in the sense that
banks are slower in closing their existent branches rather than in opening new branches, they
will tend to keep branches open, even if they operate at a level below efficiency. The average
cost of existent branches rises as a consequence of this asymmetry. A complementary
explanation is that our sample is representing mainly banks that have not directly benefited
from the process of integration. By not opening new branches in foreign markets, they are not
exploiting the benefit of deregulation. On the contrary, they pay the costs of deregulation by
having to face fiercer future competition in their domestic markets.
4.5 Costs and competitiveness across countries
We discuss now the implications of our results for the degree of competition, for the choice
of branching in the different countries and for the impact of deregulation on the banking
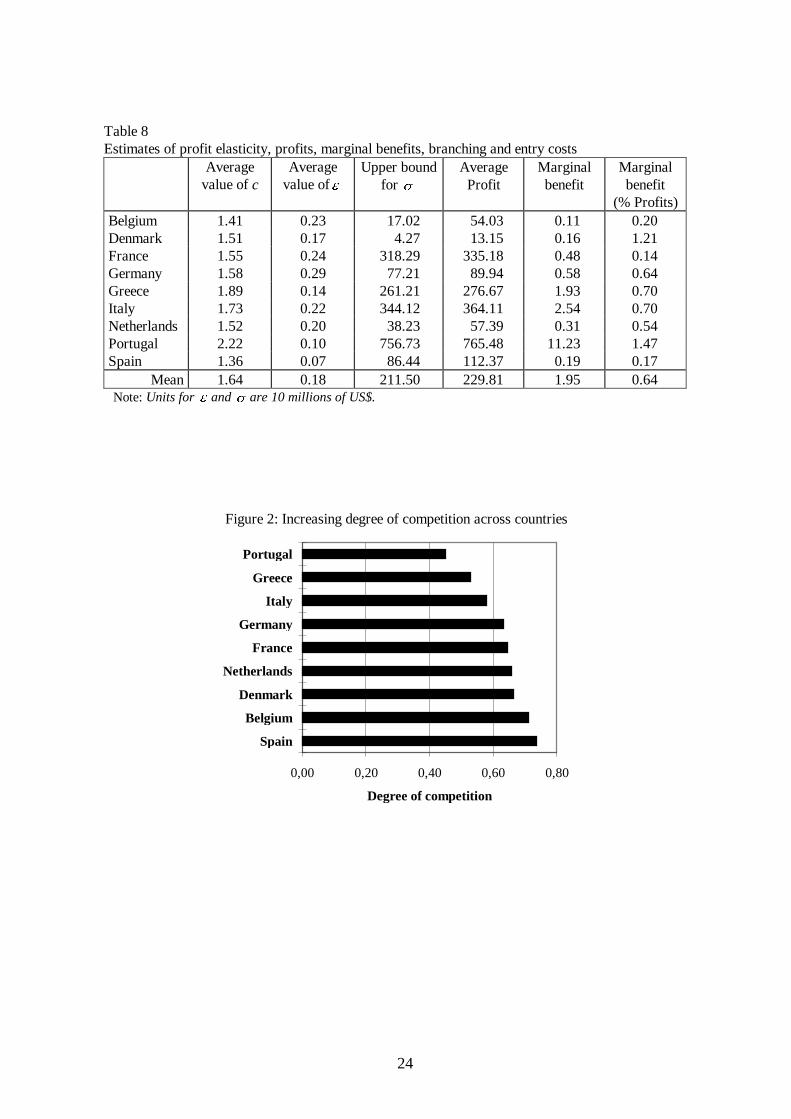
industry. Together with the values of c , figures on profits, marginal benefits of branching,
estimated branching costs and upper bounds for entry costs by country are shown in Table 8.
While the absolute values of these estimated variables may not be entirely realistic, the ordering
of the countries in terms of degree of competition and branching behavior they imply is
informative and close to observed facts.
Concerning the strategic interactions among banks in the retail banking industry, note that
the average estimated value for the parameter c is 1.64. So the expansive effect of branching is
quite important and thus, we would overestimate the competitive effect in choosing a pure
model of spatial competition to analyze the branching decision. A model of monopolistic

23
competition turns out to be a better modeling choice at least for our sample. In addition, a
value of c larger than one indicates that the response of profits to branching is considerable and
thus, that branching still gives banks in the retail segment an edge over competitors. This is
also confirmed by the fact that, on average, the estimated average marginal benefit of opening
an additional branch is 0.64 percent of the overall profits of a bank.
Countries can be ordered according to the degree of competition from the estimated
average values of c . Figure 2 shows that Portugal is still behind all other countries for the low
level of price competition, with a value of c larger than 2. Germany, France and the
Netherlands have almost similar competitive conditions.
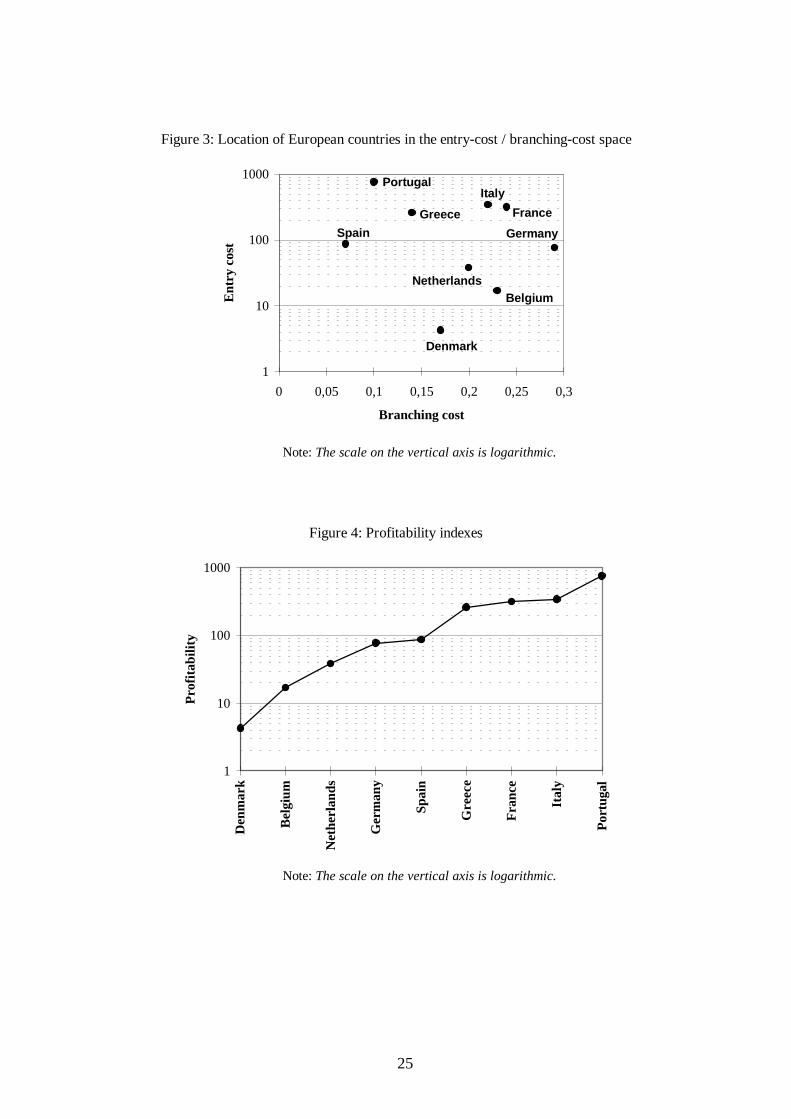
The estimated average branching costs are quite different across countries. (See Figure 3)
Greece, Portugal and Spain have relatively low costs of branching, indicating that there may
still be scope for increasing the network of branches in these countries, whereas for the others
and specially Germany the opposite is true, with Denmark in the middle.
Finally, consider the estimated values for the upper bound of entry costs in the different
countries. First, there is a clear cut between southern and northern countries, between high and
low entry cost countries. (See Figure 3.) Second, although these upper bounds should not be
taken literally, they do represent the average estimated profitabili ty of the banking industry.
Our ranking (see Figure 4) is fairly comparable to one provided in a confidential appendix of
the ERE Summary report (1996) based on average returns on assets.
24
Table 8Estimates of profit elasticity, profits, marginal benefits, branching and entry costs
Averagevalue of c
Averagevalue of H
Upper boundfor V
AverageProfit
Marginalbenefit
Marginalbenefit
(% Profits)Belgium 1.41 0.23 17.02 54.03 0.11 0.20Denmark 1.51 0.17 4.27 13.15 0.16 1.21France 1.55 0.24 318.29 335.18 0.48 0.14Germany 1.58 0.29 77.21 89.94 0.58 0.64Greece 1.89 0.14 261.21 276.67 1.93 0.70Italy 1.73 0.22 344.12 364.11 2.54 0.70Netherlands 1.52 0.20 38.23 57.39 0.31 0.54Portugal 2.22 0.10 756.73 765.48 11.23 1.47Spain 1.36 0.07 86.44 112.37 0.19 0.17
Mean 1.64 0.18 211.50 229.81 1.95 0.64 Note: Units for H and V are 10 milli ons of US$.
Figure 2: Increasing degree of competition across countries
0,00 0,20 0,40 0,60 0,80
Spain
Belgium
Denmark
Netherlands
France
Germany
Italy
Greece
Portugal
Degree of competition
25
Figure 3: Location of European countries in the entry-cost / branching-cost space
Netherlands
France
Portugal
Belgium
Denmark
Spain
Greece
Italy
Germany
1
10
100
1000
0 0,05 0,1 0,15 0,2 0,25 0,3
Branching cost
Ent
ry c
ost
Note: The scale on the vertical axis is logarithmic.
Figure 4: Profitabili ty indexes
1
10
100
1000
Den
mar
k
Bel
gium
Net
herl
ands
Ger
man
y
Spai
n
Gre
ece
Fra
nce
Ital
y
Por
tuga
l
Pro
fita
bilit
y
Note: The scale on the vertical axis is logarithmic.
26
5. Conclusion
The main feature of our simple econometric analysis is to treat branching and entry costs as
latent variables. Based on this idea, a model of monopolistic competition, fitted on
microeconomics data, provides a fair approximation of the conduct of European banks. The
analysis also produces a series of useful measures like the degree of competition, the level of
economic profits and marginal benefits of opening branches.
Two results are noticeable from the previous discussion. First, deregulation has certainly
increased the degree of competition within the European retail banking industry. However, it is
hard to identify the actual impact of rules passed at the European level, that is, how these rules
have effectively changed the working of the market, while idiosyncrasies in the deregulation
process at the country level play a prominent role. Second, there are differences between the
south and the north of Europe. Northern banks face lower entry costs but higher branching
costs, while the reverse is true for the south. Further, profitabili ty is higher while
competitiveness is lower in the south, than in the north. In other terms, whenever entry costs
are low, competition is tougher and profitabili ty is low.
Provided that data are available on mergers and acquisitions, on entry to and exit from the
industry, the level rather than an upper bound of entry costs could be estimated. Together with
a more dynamic setting, we might be able to improve our results in this line of investigation.
These tasks are part of our research agenda.

27
Appendix
Sources of data
IBCA database: Name of operating banks in each year. The Bankers Almanac, several years: Number of branches for each single bank, k. OECD, Bank Profitabilit y, last issue: Total number of branches for each country (overall banking industry), N, Labor costs in the banking sector, Wage.13
IFS Yearbook, several years: Total deposits (demand and time deposits) for each country, S, Real interest rates, Rirate. ERE Summary Report: Dummy for implementation of interest rate deregulation, IRD, Dummy for implementation of capital control li fting, CFL, Dummy for implementation of Second EEC Directive, SED.
13 Since for Germany the OECD data was not available, we used a wider definition, i.e., unit labor costsin financial services, taken from another statistical source.
28
References
Barros, P.P., 1995, Post-entry expansion in banking: The case of Portugal, InternationalJournal of Industrial Organization, 13, 593-611.
Bröker, G., 1989, Competition in Banking (OECD, Paris).
Cabral, L. and R. Majure, 1993, A model of branching with an application to PortugueseBanking, Working Paper WP 5-93 (Banco du Portugal, Lisbon).
Cerasi, V., 1995, A model of retail banking competition, mimeo (London School ofEconomics).
Cerasi, V., 1996, An empirical analysis of banking concentration, Quaderni del Centro Baffi,January No105 (Bocconi University, Milano).
Chiappori, P.A., D. Perez-Castrill o and T. Verdier, 1995, Spatial competition in the bankingsystem: Localization, cross subsidies and the regulation of deposit rates, EuropeanEconomic Review, 39, 889-918.
De Palma, A. and M. Uctum, 1992, Financial intermediation under financial integration andderegulation, NER 19 (Banque de France, Paris).
Economic Research Europe Ltd., 1996, A study of the effectiveness and impact of InternalMarket Integration on the banking and credit sector: A Summary Report.
Gouriéroux, C. and F. Jouneau, 1993, Pseudo Likelihood Methods, in: G.S. Maddala, C.R.Rao and H.Vinod, eds., Handbook of statistics (North-Holland, Amsterdam), 335-362.
Gual, J. and D. Neven, 1992, Deregulation of the European Banking Industry (1980-1991),CEPR Discussion Papers, No 703 (CEPR, London).
Kaufman, G., ed., 1992, Banking Structures in Major Countries (Kluwer Academic Publishers,Boston).
Molyneux, P., D.M. Lloyd-Willi ams and J. Thornton, 1994, Competitive conditions inEuropean Banking, Journal of Banking and Finance, 18, 445-459.
Neven, D., 1989, Structural adjustment in European retail banking. Some views from industrialorganization, CEPR Discussion Papers, No 311 (CEPR, London).
Neven, D. and L.H. Roller, 1995, Competition in the European Banking Industry: AnAggregate Structural Model of Competition, mimeo (Wissenschaftszentrum Berlin).