Embed Size (px)
Citation preview
www.elsevier.com/locate/cogbrainres
Cognitive Brain Research 19 (2004) 259–268
Research report
Sub-second ‘‘temporal attention’’ modulates alpha rhythms.
A high-resolution EEG study
Claudio Babilonia,b,c,*, Carlo Miniussib, Fabio Babilonia, Filippo Carduccia,b,c,Febo Cincottia, Claudio Del Percioa, Giulia Sirelloa, Claudia Fracassib,
Anna C. Nobred, Paolo Maria Rossinib,c,e
aDipartimento di Fisiologia Umana e Farmacologia, Universita La Sapienza, Rome, Italyb IRCCS S Giovanni di Dio Fatebenefratelli, Brescia, Italy
cAFaR.-Dip. di Neuroscienze, S. Giovanni Calibita, Fatebenefratelli Isola Tiberina, Rome, ItalydDepartment of Experimental Psychology, University of Oxford, Oxford, UK
eNeurologia, Universita Campus Biomedico, Rome, Italy
Accepted 2 December 2003
Abstract
In the present high-resolution electroencephalographic (EEG) study, event-related desynchronization/synchronization (ERD/ERS) of alpha
rhythms was computed during an S1–S2 paradigm, in which a visual cue (S1) predicted a SHORT (600 ms) or LONG (1400 ms) foreperiod,
preceding a visual go stimulus (S2) triggering right or left finger movement. Could orienting attention to a selective point in time influence the
alpha rhythms as a function of the SHORT vs. LONG foreperiod? Stronger selective attentional modulations were predicted for the SHORT
than LONG condition. EEG data from 54 channels were ‘‘depurated’’ from phase-locked visual evoked potentials and spatially enhanced by
surface Laplacian estimation (i.e., final data analysis was conducted on 16 subjects having a sufficient number of artifact-free EEG single
trials). Low-band alpha rhythms (about 6–10 Hz) were supposed to be related to anticipatory attentional processes, whereas high-band alpha
rhythms (10–12 Hz) would indicate task-specific visuo-motor processes.
Compared to the LONG condition (foreperiod), the SHORTcondition induced a quicker and stronger ERS at low-band alpha rhythm (about
6–8 Hz) over midline and bilateral prefrontal, sensorimotor, and posterior parietal areas. In contrast, the concomitant high-band alpha (about
10–12 Hz) ERD/ERS showed no significant difference between the two conditions. In conclusion, temporal attention for a sub-second delay
(800 ms) did modulate low-band alpha rhythm over large regions of both cortical hemispheres.
D 2004 Elsevier B.V. All rights reserved.
Theme: Neural basis of behavior
Topic: Cognition
Keywords: Temporal attention; S1–S2 paradigm; Electroencephalography (EEG); Alpha brain rhythms; Event-related desynchronization/synchronization
(ERD/ERS); Human brain
1. Introduction 44,48]. Typically, they used S1–S2 paradigms in which a
‘‘Temporal attention’’ can be defined as a process aimed at
allocating brain resources on the predicted onset of an
incoming event. Previous studies on temporal aspects have
mainly concerned subjective time estimation [10,29,32,
0926-6410/$ - see front matter D 2004 Elsevier B.V. All rights reserved.
doi:10.1016/j.cogbrainres.2003.12.010
* Corresponding author. Sezione di EEG ad Alta Risoluzione,
Dipartimento di Fisiologia Umana e Farmacologia, Universita degli Studi
di Roma ‘‘La Sapienza’’, P.le Aldo Moro 5 00185 Rome, Italy. Tel.: +39-
06-49910989; fax: +39-06-49910917.
E-mail address: [email protected] (C. Babiloni).
warning stimulus (S1) provided information on the duration
of the time interval (foreperiod) preceding an imperative
stimulus (S2) triggering a motor response. It has been shown
that reaction time improves as a function of the temporal
certainty of the warning and imperative stimuli [10–12,48],
possibly due to an increase of alertness/vigilance [33,42].
Cortical regions involved in tasks where estimation of
time where requested showed involvement of prefrontal,
posterior parietal, supplementary motor, and temporal corti-
ces [14,15,18,28,34,36], which are also engaged by ‘‘spatial
attention’’ tasks [31,47,49]. With respect to the ‘‘spatial
C. Babiloni et al. / Cognitive Brain260
attention’’, the ‘‘temporal attention’’ tasks could induce a
stronger activation of left hemisphere [13], skilled for serial
processes.
In a recent S1–S2 study [35], event-related potentials
(ERPs) have modeled the spatiotemporal evolution of the
cortical activation during ‘‘temporal attention’’ towards
incoming events. A warning cue stimulus (S1) predicted
with 80% of validity an imperative stimulus (S2) after 600
or 1400 ms. The results have shown that the reaction time
was faster when the visual cues correctly predicted the S1–
S2 interval, thus suggesting a key role of the ‘‘temporal
attention’’ on the performance. Furthermore, slow negative
potentials (contingent negative variation, CNV) increased
between S1 and S2 stimuli and were faster in shape when
the S1 stimulus predicted a short (600 ms) rather than long
(1400 ms) foreperiod. This was explained as a faster
increase of the attentional resources with the short compared
to long foreperiod. However, it should be remarked that
CNV could not disentangle attentional respect to concom-
itant task-specific visuomotor processes. Theoretically, this
could be do by the analysis of event-related desynchroniza-
tion/synchronization (ERD/ERS) of ‘‘idling’’ electroenceph-
alographic (EEG) alpha rhythms (6–12 Hz). The alpha ERD
(i.e., percentage reduction in power) is proportional to the
cortical information processing, whereas the ERS reflects
the ‘‘recovery’’ of the neuronal activity after that processing
[40]. Noteworthy, the low-band alpha ERD (about 6–10
Hz) would reveal unspecific ‘‘alertness’’ and/or ‘‘expectan-
cy’’ ([25], Klimesch et al. 1996). In parallel, the concom-
itant high-band alpha ERD (about 10–12 Hz) would depend
on task-specific sensory, motor, and/or semantic processes
[22,24].
Here, EEG data of the mentioned study [35] were re-
analyzed in terms of the ERD/ERS of the alpha sub-bands,
which are differently sensitive to concomitant attentional
(low-band alpha) and task-specific visuo-motor (high-band
alpha) processes. Could temporal attention modulate the
alpha rhythms as a function of short vs. long foreperiod (i.e.,
just difference of 800 ms)? Throughout the foreperiod,
stronger selective attentional modulation were expected
for the short than long condition.
2. Methods
Full details on the experimental procedures were previ-
ously reported [35]. In the following, we just summarized
them.
2.1. Subjects
Experiments were performed in 21 healthy, right-
handed (Edinburgh Inventory) adult volunteers (age range
18–38 years, 14 females), who gave their informed
written consent. Visual acuity was normal or corrected to
normal.
2.2. Experimental task
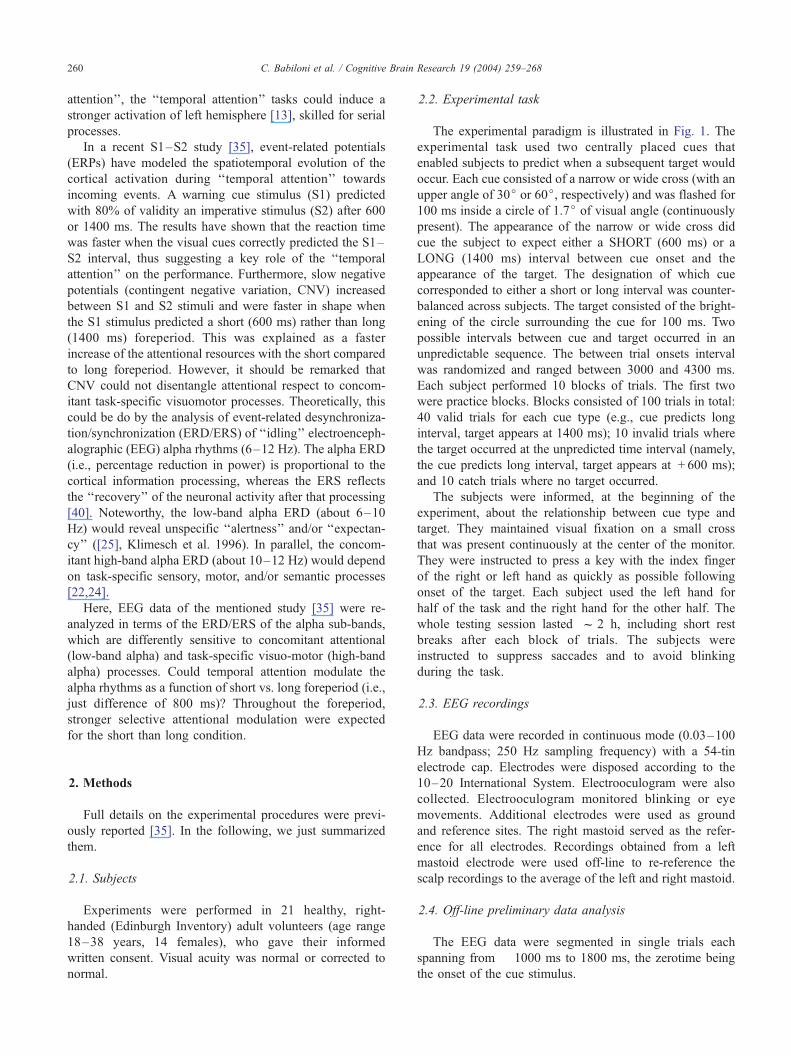
The experimental paradigm is illustrated in Fig. 1. The
experimental task used two centrally placed cues that
enabled subjects to predict when a subsequent target would
occur. Each cue consisted of a narrow or wide cross (with an
upper angle of 30j or 60j, respectively) and was flashed for
100 ms inside a circle of 1.7j of visual angle (continuously
present). The appearance of the narrow or wide cross did
cue the subject to expect either a SHORT (600 ms) or a
LONG (1400 ms) interval between cue onset and the
appearance of the target. The designation of which cue
corresponded to either a short or long interval was counter-
balanced across subjects. The target consisted of the bright-
ening of the circle surrounding the cue for 100 ms. Two
possible intervals between cue and target occurred in an
unpredictable sequence. The between trial onsets interval
was randomized and ranged between 3000 and 4300 ms.
Each subject performed 10 blocks of trials. The first two
were practice blocks. Blocks consisted of 100 trials in total:
40 valid trials for each cue type (e.g., cue predicts long
interval, target appears at 1400 ms); 10 invalid trials where
the target occurred at the unpredicted time interval (namely,
the cue predicts long interval, target appears at + 600 ms);
and 10 catch trials where no target occurred.
The subjects were informed, at the beginning of the
experiment, about the relationship between cue type and
target. They maintained visual fixation on a small cross
that was present continuously at the center of the monitor.
They were instructed to press a key with the index finger
of the right or left hand as quickly as possible following
onset of the target. Each subject used the left hand for
half of the task and the right hand for the other half. The
whole testing session lasted f 2 h, including short rest
breaks after each block of trials. The subjects were
instructed to suppress saccades and to avoid blinking
during the task.
2.3. EEG recordings
EEG data were recorded in continuous mode (0.03–100
Hz bandpass; 250 Hz sampling frequency) with a 54-tin
electrode cap. Electrodes were disposed according to the
10–20 International System. Electrooculogram were also
collected. Electrooculogram monitored blinking or eye
movements. Additional electrodes were used as ground
and reference sites. The right mastoid served as the refer-
ence for all electrodes. Recordings obtained from a left
mastoid electrode were used off-line to re-reference the
scalp recordings to the average of the left and right mastoid.
2.4. Off-line preliminary data analysis
The EEG data were segmented in single trials each
spanning from � 1000 ms to 1800 ms, the zerotime being
the onset of the cue stimulus.
Research 19 (2004) 259–268
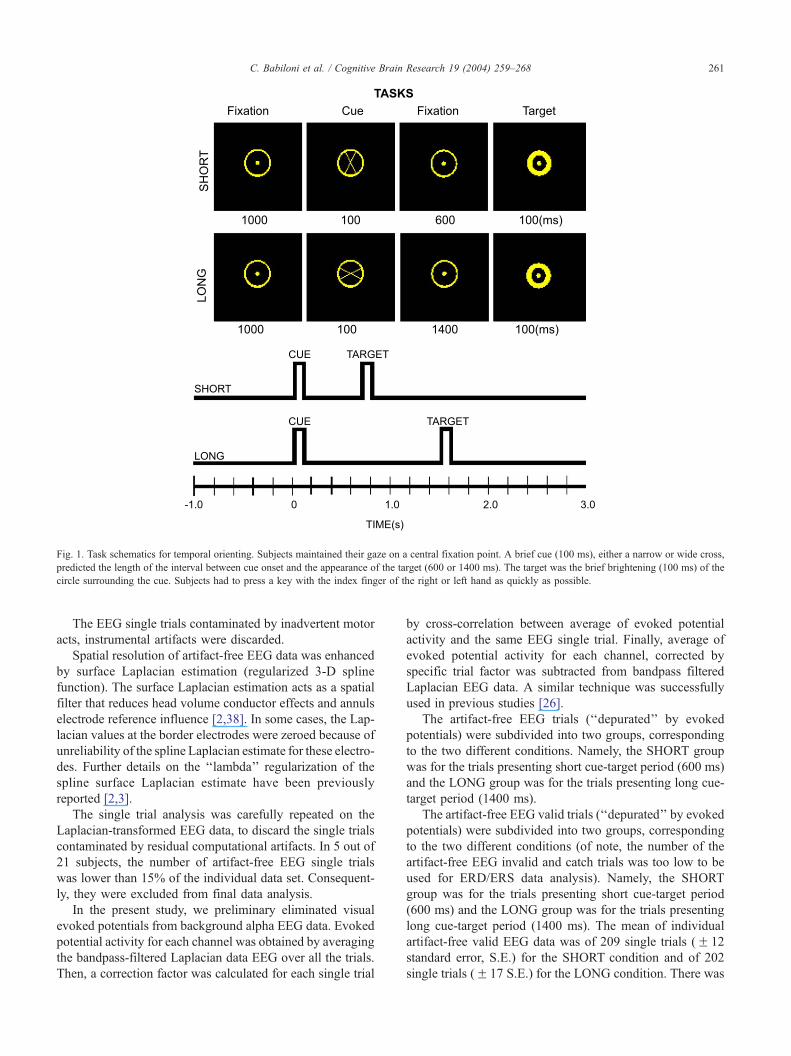
Fig. 1. Task schematics for temporal orienting. Subjects maintained their gaze on a central fixation point. A brief cue (100 ms), either a narrow or wide cross,
predicted the length of the interval between cue onset and the appearance of the target (600 or 1400 ms). The target was the brief brightening (100 ms) of the
circle surrounding the cue. Subjects had to press a key with the index finger of the right or left hand as quickly as possible.
C. Babiloni et al. / Cognitive Brain Research 19 (2004) 259–268 261
The EEG single trials contaminated by inadvertent motor
acts, instrumental artifacts were discarded.
Spatial resolution of artifact-free EEG data was enhanced
by surface Laplacian estimation (regularized 3-D spline
function). The surface Laplacian estimation acts as a spatial
filter that reduces head volume conductor effects and annuls
electrode reference influence [2,38]. In some cases, the Lap-
lacian values at the border electrodes were zeroed because of
unreliability of the spline Laplacian estimate for these electro-
des. Further details on the ‘‘lambda’’ regularization of the
spline surface Laplacian estimate have been previously
reported [2,3].
The single trial analysis was carefully repeated on the
Laplacian-transformed EEG data, to discard the single trials
contaminated by residual computational artifacts. In 5 out of
21 subjects, the number of artifact-free EEG single trials
was lower than 15% of the individual data set. Consequent-
ly, they were excluded from final data analysis.
In the present study, we preliminary eliminated visual
evoked potentials from background alpha EEG data. Evoked
potential activity for each channel was obtained by averaging
the bandpass-filtered Laplacian data EEG over all the trials.
Then, a correction factor was calculated for each single trial
by cross-correlation between average of evoked potential
activity and the same EEG single trial. Finally, average of
evoked potential activity for each channel, corrected by
specific trial factor was subtracted from bandpass filtered
Laplacian EEG data. A similar technique was successfully
used in previous studies [26].
The artifact-free EEG trials (‘‘depurated’’ by evoked
potentials) were subdivided into two groups, corresponding
to the two different conditions. Namely, the SHORT group
was for the trials presenting short cue-target period (600 ms)
and the LONG group was for the trials presenting long cue-
target period (1400 ms).
The artifact-free EEG valid trials (‘‘depurated’’ by evoked
potentials) were subdivided into two groups, corresponding
to the two different conditions (of note, the number of the
artifact-free EEG invalid and catch trials was too low to be
used for ERD/ERS data analysis). Namely, the SHORT
group was for the trials presenting short cue-target period
(600 ms) and the LONG group was for the trials presenting
long cue-target period (1400 ms). The mean of individual
artifact-free valid EEG data was of 209 single trials (F 12
standard error, S.E.) for the SHORT condition and of 202
single trials (F 17 S.E.) for the LONG condition. There was
Table 1
IAF peak for each subject
Subject no. IAF
1 10
2 10
3 10
4 10
5 10
6 10
7 10
8 8
9 10
10 8
11 10
12 8
13 8
14 8
15 10
16 10
Mean 9.3
S.E. F 0.2
The IAF was defined as the frequency showing the higher power density in
the 6–12 Hz spectrum. The IAF was the same for the SHORT and LONG
condition in all subjects.
C. Babiloni et al. / Cognitive Brain Research 19 (2004) 259–268262
no inter-condition statistical difference of the selected single
trials as computed by a repeated measures ANOVA analysis
(F(1,15) = 2.7154; MSe = 134; p>0.12).
2.5. Determination of peak of individual alpha frequency
(IAF)
The power spectrum analysis was based on a standard
FFT approach using Welch technique and Hanning window-
ing function. For the determination of the individual alpha
sub-bands, an anchor frequency was selected according to
literature guidelines; the anchor frequency was the so-called
IAF peak [21,23,25]. Practically, the IAF was defined as the
frequency showing the higher power density in the 6–12 Hz
spectrum. With reference to the IAF (Fig. 2), the frequency
bands of interest were as follows: alpha 1 as IAF-4 Hz to
IAF-2 Hz, alpha 2 as IAF-2 Hz to IAF and alpha 3 as IAF to
IAF + 2 Hz. Table 1 reports the IAF for each subjects (i.e., in
all subjects the IAF was the same for both SHORT and
LONG condition). As a result, the mean (F S.E.) peak of
the IAF was 9.3 Hz (F 0.2).
2.6. ERD/ERS computation
The ERD/ERS data were computed for alpha 1, alpha 2
and alpha 3 bands, based on the individual determination of
the IAF. EEG time series were bandpassed (Bartlett func-
tion), squared, averaged across 120-ms periods (to 8 sam-
ples/s), and averaged across all single trials. The ERD/ERS
Fig. 2. Typical frequency spectrum computed from EEG data. Frequency
bands of interest were alpha 1, alpha 2 and alpha 3, which were computed
according to a well-known procedure based on the detection of IAF peak on
such a spectrum (see Methods for further explanations).
was defined as a percentage decrease/increase of instant
power density at the ‘‘event’’ compared to a ‘‘pre-event’’
baseline (from � 500 ms to the zerotime; zerotime being
onset of cue). Procedural details on ERD/ERS computation
have been previously reported [39,41].
Individual ERD/ERS data sets were then interpolated by
a spline function [1], in order to obtain ERD/ERS data sets
at theoretical 54 electrode sites of augmented 10–20 sys-
tem. These electrodes were disposed over a 3-D ‘‘quasi-
realistic’’ head model (i.e., approximating each ‘‘realistic’’
individual head model). The template model was con-
structed based on the magnetic resonance data of 152
subjects, digitized at Brain Imaging Center of the Montreal
Neurological Institute (SPM96).
2.7. Measurement of ERD/ERS latency and amplitude
For the alpha 1, alpha 2 and alpha 3 band, three fixed
latencies T1, T2 and T3, respectively, at 200, 400 and 600
ms with respect to the zerotime, were computed. For the
topographic mapping, the amplitude of ERD/ERS peaks
(T1, T2, T3) was automatically measured for each experi-
mental condition at each of the 54 electrodes. Across-
subject means were then performed using these individual
measured potential distributions.
2.8. Statistical analysis for SHORT and LONG conditions
Statistical comparisons for the SHORT and LONG con-
ditions were performed by ANOVA analysis for repeated
measures. Mauchley’s test evaluated the sphericity assump-
tion. Correction of the degrees of freedom was made by
Greenhouse–Geisser procedure. Duncan test was used for
post hoc comparisons ( p < 0.05).
C. Babiloni et al. / Cognitive Brain Research 19 (2004) 259–268 263
The statistical analysis was performed at selected EEG
electrodes representing cortical regions of interest (ROIs)
for visuomotor transformations and attentional processes,
i.e., prefrontal left (FL or F3 site), prefrontal right (FR or F4
site), central left (CL or C3 site), central right (CR or C4
site), posterior parietal left (PL or P3 site), and posterior
parietal right (PR or P4 site). In addition, selected electrodes
overlying cortical midline (Fz, Cz, and Pz sites) were
considered for the evaluation of cortical activity of atten-
tional cingulated areas.
A first ANOVA analysis was designed for the study of
hemispherical representation of the temporal attention in-
cluded the following factors (levels): Condition (SHORT,
LONG), Band (alpha 1, alpha 2, alpha 3), Region of interest
(F3, F4, C3, C4, P3, P4), and Time (T1, T2, T3). The
prediction was for a statistical interaction including the
Factor Condition and Band, indicating quicker attentional
(low-band alpha 1 and/or alpha 2) effects for the SHORT
than LONG condition.
A second ANOVA analysis was designed for the study of
midline representation of the temporal attention included the
following Factors (levels): Condition (SHORT, LONG),
Band (alpha 1, alpha 2, alpha 3), Region of interest (Fz,
Cz, Pz sites), and Time (T1, T2, T3). The prediction was the
same as for the previous ANOVA design.
3. Results
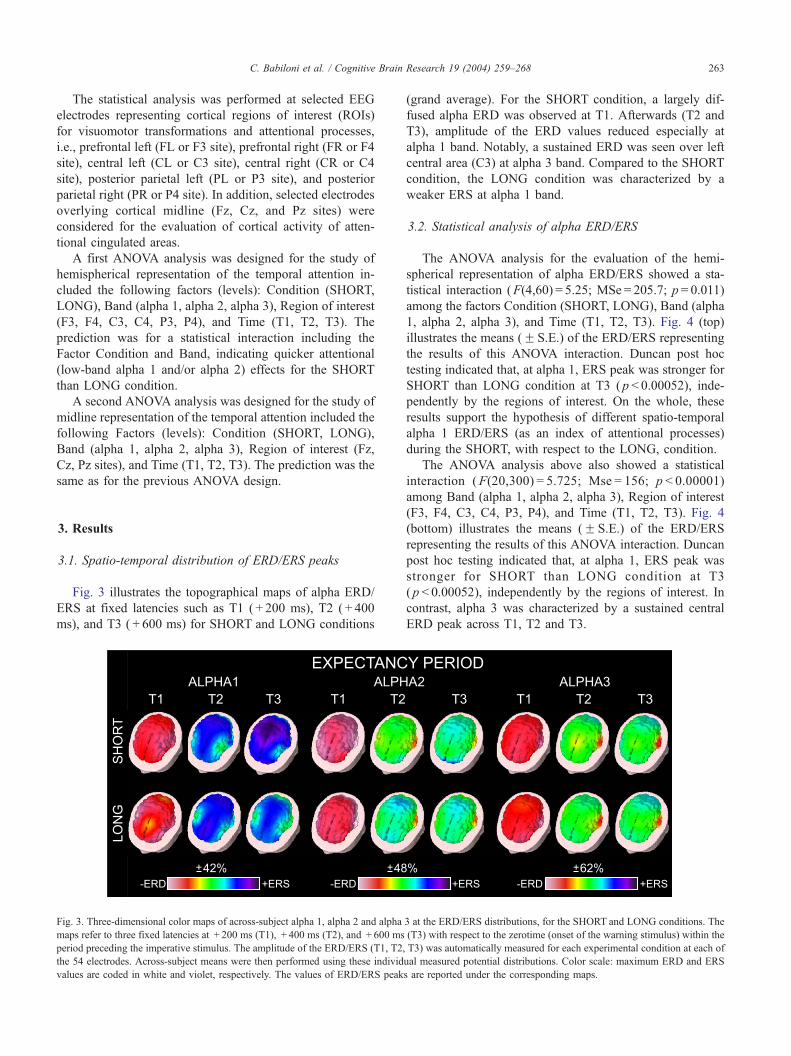
3.1. Spatio-temporal distribution of ERD/ERS peaks
Fig. 3 illustrates the topographical maps of alpha ERD/
ERS at fixed latencies such as T1 ( + 200 ms), T2 ( + 400
ms), and T3 ( + 600 ms) for SHORT and LONG conditions
Fig. 3. Three-dimensional color maps of across-subject alpha 1, alpha 2 and alpha
maps refer to three fixed latencies at + 200 ms (T1), + 400 ms (T2), and + 600 ms
period preceding the imperative stimulus. The amplitude of the ERD/ERS (T1, T2,
the 54 electrodes. Across-subject means were then performed using these individ
values are coded in white and violet, respectively. The values of ERD/ERS peak
(grand average). For the SHORT condition, a largely dif-
fused alpha ERD was observed at T1. Afterwards (T2 and
T3), amplitude of the ERD values reduced especially at
alpha 1 band. Notably, a sustained ERD was seen over left
central area (C3) at alpha 3 band. Compared to the SHORT
condition, the LONG condition was characterized by a
weaker ERS at alpha 1 band.
3.2. Statistical analysis of alpha ERD/ERS
The ANOVA analysis for the evaluation of the hemi-
spherical representation of alpha ERD/ERS showed a sta-
tistical interaction (F(4,60) = 5.25; MSe = 205.7; p = 0.011)
among the factors Condition (SHORT, LONG), Band (alpha
1, alpha 2, alpha 3), and Time (T1, T2, T3). Fig. 4 (top)
illustrates the means (F S.E.) of the ERD/ERS representing
the results of this ANOVA interaction. Duncan post hoc
testing indicated that, at alpha 1, ERS peak was stronger for
SHORT than LONG condition at T3 ( p < 0.00052), inde-
pendently by the regions of interest. On the whole, these
results support the hypothesis of different spatio-temporal
alpha 1 ERD/ERS (as an index of attentional processes)
during the SHORT, with respect to the LONG, condition.
The ANOVA analysis above also showed a statistical
interaction (F(20,300) = 5.725; Mse = 156; p < 0.00001)
among Band (alpha 1, alpha 2, alpha 3), Region of interest
(F3, F4, C3, C4, P3, P4), and Time (T1, T2, T3). Fig. 4
(bottom) illustrates the means (F S.E.) of the ERD/ERS
representing the results of this ANOVA interaction. Duncan
post hoc testing indicated that, at alpha 1, ERS peak was
stronger for SHORT than LONG condition at T3
( p < 0.00052), independently by the regions of interest. In
contrast, alpha 3 was characterized by a sustained central
ERD peak across T1, T2 and T3.
3 at the ERD/ERS distributions, for the SHORT and LONG conditions. The
(T3) with respect to the zerotime (onset of the warning stimulus) within the
T3) was automatically measured for each experimental condition at each of
ual measured potential distributions. Color scale: maximum ERD and ERS
s are reported under the corresponding maps.

Fig. 4. Across subject means (F S.E.) of the ERD/ERS amplitudes as provided by the ANOVA design. In particular, these means refer to a statistical interaction
among the factors Condition (SHORT, LONG), Band (alpha 1, alpha 2, alpha 3), and Time (T1, T2, T3) (top figure side), and to a statistical interaction among
the factors Band (alpha 1, alpha 2, alpha 3), Region of interest (FL, FR, CL, CR, PL, PR), and Time (T1, T2, T3) (bottom figure side). Legend: FL, F3 site
(10–20 International System); FR, F4 site; CL, C3 site; CR, C4 site; PL, P3 site; PR, P4 site.
C. Babiloni et al. / Cognitive Brain Research 19 (2004) 259–268264
The ANOVA analysis for the evaluation of the midline
alpha ERD/ERS showed a statistical interaction (F(4,60) =
3.73; MSe = 155.9; p = 0.0089) among the factors Condition
(SHORT, LONG), Band (alpha 1, alpha 2, alpha 3), and Time
(T1, T2, T3). Fig. 5 illustrates the means (F S.E.) of the
ERD/ERS representing the results of this ANOVA interac-
tion. Duncan post hoc testing provided results similar to those
of first ANOVA analysis.
3.3. Control analyses
The interesting evidence of a stronger alpha 1 ERS at
+ 600 after the warning stimulus for the SHORT than
LONG conditions raised the issue of a comparison of the
alpha 1 ERD/ERS at corresponding instants with respect to
the go (target) stimulus. Therefore, the alpha 1 ERS was
compared at 100 ms before the go (target) stimulus, namely
+ 600 and + 1400 ms after the warning stimulus for the
SHORT and LONG conditions, respectively. The ANOVA
Fig. 5. Across subject means (F S.E.) of the ERD/ERS amplitudes as provided by t
among the factors Condition (SHORT, LONG), Band (alpha 1, alpha 2, alpha 3)
analysis included the factors Condition (SHORT, LONG)
and Region of interest (F3, Fz, F4, C3, Cz, C4, P3, Pz, P4).
There was no statistical effect, indicating that the amplitude
of the alpha 1 ERS was similar over the whole scalp before
the go (target) stimulus.
The above results raised the issue of the effects of the
motor preparation processes on the lateralization of the
alpha ERD. To address this issue, the alpha ERD/ERS for
the right and left finger movements were compared. For the
SHORT condition, the mean of the RIGHT and LEFT single
trials was 106 (F 6 S.E.) and 103 (F 8 S.E.), respectively.
Analogously, the mean of the RIGHT and LEFT single trials
for the LONG condition was 102 (F 6 S.E.) and 100 (F 6
S.E.), respectively. Of note, there was no statistical differ-
ence (ANOVA; p>0.4) in the number of the selected single
trials.
The ANOVA analysis for the alpha 1, alpha 2 and alpha 3
ERD/ERS included the factors Condition (SHORT, LONG),
Side of movement (RIGHT and LEFT), Region of interest
he ANOVA design. In particular, these means refer to a statistical interaction
, and Time (T1, T2, T3).
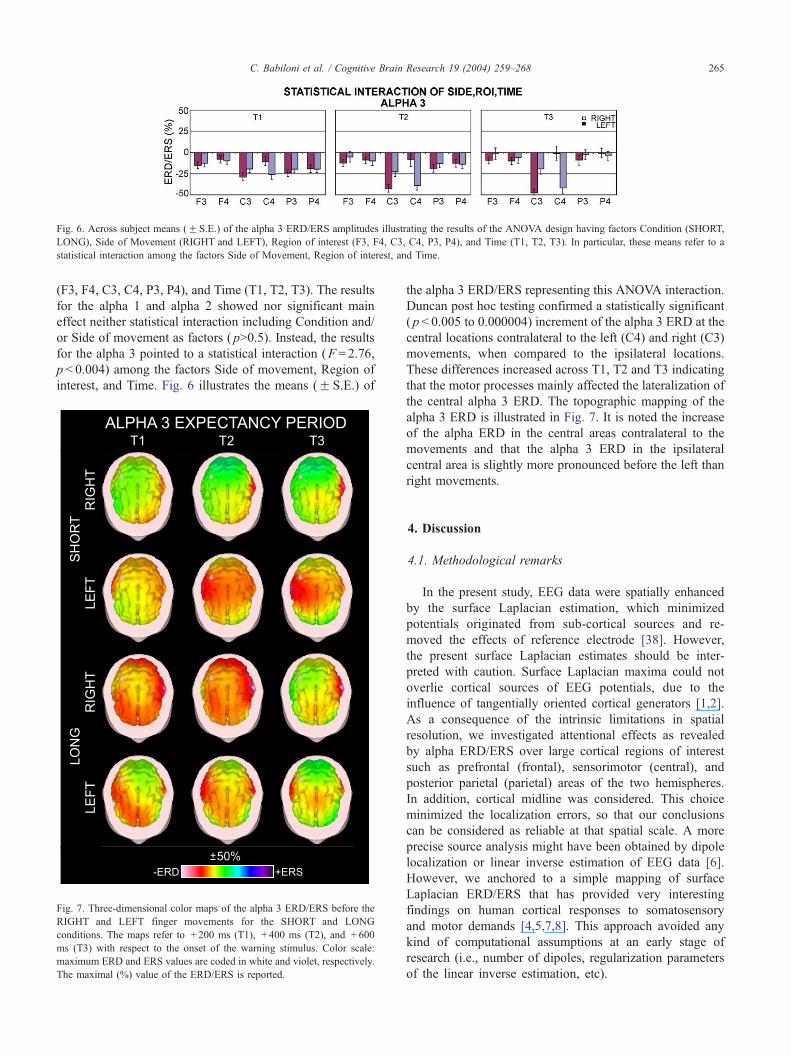
Fig. 6. Across subject means (F S.E.) of the alpha 3 ERD/ERS amplitudes illustrating the results of the ANOVA design having factors Condition (SHORT,
LONG), Side of Movement (RIGHT and LEFT), Region of interest (F3, F4, C3, C4, P3, P4), and Time (T1, T2, T3). In particular, these means refer to a
statistical interaction among the factors Side of Movement, Region of interest, and Time.
C. Babiloni et al. / Cognitive Brain Research 19 (2004) 259–268 265
(F3, F4, C3, C4, P3, P4), and Time (T1, T2, T3). The results
for the alpha 1 and alpha 2 showed nor significant main
effect neither statistical interaction including Condition and/
or Side of movement as factors ( p>0.5). Instead, the results
for the alpha 3 pointed to a statistical interaction (F = 2.76,
p < 0.004) among the factors Side of movement, Region of
interest, and Time. Fig. 6 illustrates the means (F S.E.) of
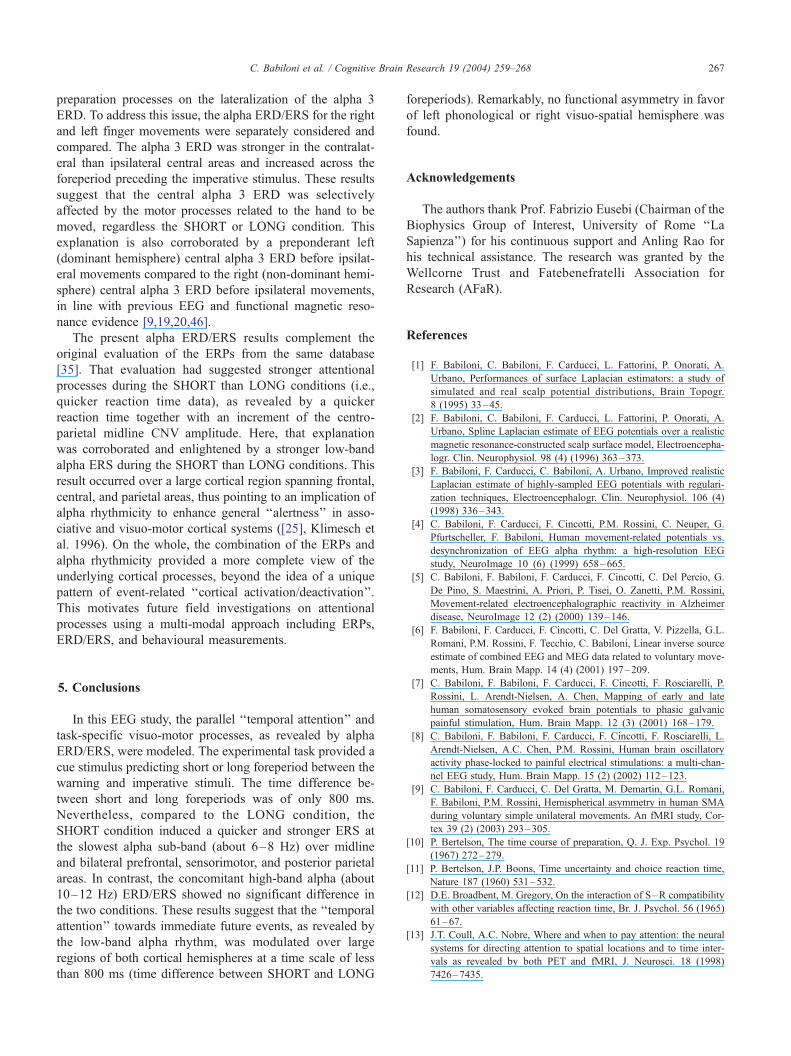
Fig. 7. Three-dimensional color maps of the alpha 3 ERD/ERS before the
RIGHT and LEFT finger movements for the SHORT and LONG
conditions. The maps refer to + 200 ms (T1), + 400 ms (T2), and + 600
ms (T3) with respect to the onset of the warning stimulus. Color scale:
maximum ERD and ERS values are coded in white and violet, respectively.
The maximal (%) value of the ERD/ERS is reported.
the alpha 3 ERD/ERS representing this ANOVA interaction.
Duncan post hoc testing confirmed a statistically significant
( p < 0.005 to 0.000004) increment of the alpha 3 ERD at the
central locations contralateral to the left (C4) and right (C3)
movements, when compared to the ipsilateral locations.
These differences increased across T1, T2 and T3 indicating
that the motor processes mainly affected the lateralization of
the central alpha 3 ERD. The topographic mapping of the
alpha 3 ERD is illustrated in Fig. 7. It is noted the increase
of the alpha ERD in the central areas contralateral to the
movements and that the alpha 3 ERD in the ipsilateral
central area is slightly more pronounced before the left than
right movements.
4. Discussion
4.1. Methodological remarks
In the present study, EEG data were spatially enhanced
by the surface Laplacian estimation, which minimized
potentials originated from sub-cortical sources and re-
moved the effects of reference electrode [38]. However,
the present surface Laplacian estimates should be inter-
preted with caution. Surface Laplacian maxima could not
overlie cortical sources of EEG potentials, due to the
influence of tangentially oriented cortical generators [1,2].
As a consequence of the intrinsic limitations in spatial
resolution, we investigated attentional effects as revealed
by alpha ERD/ERS over large cortical regions of interest
such as prefrontal (frontal), sensorimotor (central), and
posterior parietal (parietal) areas of the two hemispheres.
In addition, cortical midline was considered. This choice
minimized the localization errors, so that our conclusions
can be considered as reliable at that spatial scale. A more
precise source analysis might have been obtained by dipole
localization or linear inverse estimation of EEG data [6].
However, we anchored to a simple mapping of surface
Laplacian ERD/ERS that has provided very interesting
findings on human cortical responses to somatosensory
and motor demands [4,5,7,8]. This approach avoided any
kind of computational assumptions at an early stage of
research (i.e., number of dipoles, regularization parameters
of the linear inverse estimation, etc).

C. Babiloni et al. / Cognitive Brain Research 19 (2004) 259–268266
Here, the determination of the individual alpha sub-bands
followed the influential guidelines by Klimesch’s group
[21,23,25]. That approach has provided a body of evidence
that the analysis of individual EEG frequency bands can
disclose invaluable information on brain rhythmicity be-
yond standard definition of alpha at 8–12 Hz [23,27,37]. In
particular, Klimesch’s group has demonstrated that, with
respect to the standard frequency bands, the individual
frequency bands were able to disentangle the different
behaviour of theta and alpha bands during cognitive
demands, namely the theta ERS coupled with the alpha
ERD [21,23].
4.2. Rapid changes (i.e., Within 600 ms) of ‘‘temporal
attention’’ as revealed by low-band alpha ERD/ERS
In the present study, the amplitude of low-band alpha
ERD (alpha 1) peaked with comparable values during
SHORT and LONG foreperiod (i.e., between S1 and S2
stimuli). On the contrary, the following ERS values were
greater in magnitude during the SHORT compared to LONG
foreperiod. As expected, modulation of attention during a
temporal intervals was faster and stronger with the SHORT
than with the LONG condition, as a consequence of the fact
that the go stimulus (S2) was expected earlier, indicating a
specific ability to optimize performance relatively to the
type of information available (i.e., time). Remarkably, the
effect was band-specific, namely it was observed at alpha 1
but not alpha 2 and 3. These results agree with previous
evidence of a time modulation of alpha 1 ERD/ERS as a
function of the foreperiod length [23].
From a physiological point of view, the present alpha 1
ERS might be considered as a ‘‘recovery’’ of the neuronal
activity after the warning stimulus and once the expected
target time is very close to be delivered [40]. However, it
should be made clear that it is not possible here to explain
the alpha recovery in terms of active inhibition or removal
of excitatory drive associated with GABA-ergic and gluta-
mate-ergic processes, respectively. This issue should be
addressed by future studies combining EEG data with those
of paired transcranial magnetic stimulations according to a
previous fruitful methodological approach [16,17,30,43,45].
The alpha 1 ERS raised two issues. Was the alpha 1 ERS
before the go (target) stimulus affected by motor preparation
and was it stronger for the SHORT than LONG conditions?
To address these issues, the alpha 1 ERS was compared at
100 ms before the go (target) stimulus, namely + 600 ms
and + 1400 ms after the warning stimulus for the SHORT
and LONG conditions, respectively. The results showed no
statistical difference at any scalp site of interest. They
corroborated the idea that alpha 1 ERS reflected ‘‘temporal
attentional’’ rather than motor processes, given that no alpha
1 ERD was observed before the go (target stimulus) and no
effect was specific for the central electrodes overlying the
sensorimotor areas. On the other hand, the results indicated
that, in the two conditions, the ‘‘temporal attention’’ was
equally engaged before the go (target) stimulus. On the
whole, the present results suggest that the ‘‘temporal atten-
tion’’ was modulated before in the SHORT than LONG
conditions, but its absolute magnitude was similar before the
go (target) stimulus.
In the present study, the modulation of low-band alpha
ERD/ERS during the foreperiod was distributed over a large
neural network including prefrontal, premotor/primary sen-
sorimotor, and posterior parietal cortical areas of both
hemispheres as well as frontoparietal midline. Such a large
distribution of the low-band alpha ERD/ERS is compatible
with the attentional processes impinging upon wide visual,
sensorimotor, and associative cortical areas. This is a further
evidence that the low-band alpha ERD presents the wide-
spread spatial features typical of the neural correlates of
‘‘alertness’’ processes [23]. Notably, the modulation of
attention over time in the present experimental conditions
did not prevail on the left hemisphere as expected based on
its abilities for sequential information processing.
For both SHORT and LONG conditions, the task-specific
visuomotor processes as revealed by alpha 3 ERD were
prolonged over premotor/primary sensorimotor areas during
the late phase of the foreperiod. The effects were located
over the hand sensorimotor cortex, which prepared the
motor response before the go stimulus. The lack of differ-
ences between the SHORT and LONG conditions was
reasonably due to the similar length of the foreperiod
periods, namely 600 ms for SHORT condition and 1400
ms for the LONG condition. A difference of only 800 ms
could not dissociate the preparation of the movement in the
two conditions as revealed by high-band alpha ERD/ERS, in
contrast to what revealed by low-band alpha ERD/ERS. The
use of a longer foreperiod (i.e., cue-target) interval might
have dissociated the task-specific visuomotor processes
associated with the movement preparation. However, the
use of a third condition with a longer foreperiod interval
would have lengthened the whole experimental session in
excess. A long experimental session could have increased
the level of fatigue and distraction, thus contaminating the
experimental results. On the other hand, an increase of the
interval would have give enough time to the subject to
reorient his attention congruently to the information build
during invalid cues, while we wanted to stress difference
between expectations and the ability do direct attention at
precise time points at different intervals, as well as the
ability to direct attention in a punctuate mode congruent to
the information given by the cue even during very short time
intervals. Nevertheless, in this very task ‘‘temporal orient-
ing’’ was probably tuned at motor response level as request
by instructions. Any task is strictly relate to the nature of the
information available, and in this case the low number of
variable for a correct response was univocally related to a
specific motor requirement at a time point and not to a
visual perception level.
A prolonged and strong alpha 3 ERD over bilateral
central areas raised the issue of the effects of the motor
C. Babiloni et al. / Cognitive Brain Research 19 (2004) 259–268 267
preparation processes on the lateralization of the alpha 3
ERD. To address this issue, the alpha ERD/ERS for the right
and left finger movements were separately considered and
compared. The alpha 3 ERD was stronger in the contralat-
eral than ipsilateral central areas and increased across the
foreperiod preceding the imperative stimulus. These results
suggest that the central alpha 3 ERD was selectively
affected by the motor processes related to the hand to be
moved, regardless the SHORT or LONG condition. This
explanation is also corroborated by a preponderant left
(dominant hemisphere) central alpha 3 ERD before ipsilat-
eral movements compared to the right (non-dominant hemi-
sphere) central alpha 3 ERD before ipsilateral movements,
in line with previous EEG and functional magnetic reso-
nance evidence [9,19,20,46].
The present alpha ERD/ERS results complement the
original evaluation of the ERPs from the same database
[35]. That evaluation had suggested stronger attentional
processes during the SHORT than LONG conditions (i.e.,
quicker reaction time data), as revealed by a quicker
reaction time together with an increment of the centro-
parietal midline CNV amplitude. Here, that explanation
was corroborated and enlightened by a stronger low-band
alpha ERS during the SHORT than LONG conditions. This
result occurred over a large cortical region spanning frontal,
central, and parietal areas, thus pointing to an implication of
alpha rhythmicity to enhance general ‘‘alertness’’ in asso-
ciative and visuo-motor cortical systems ([25], Klimesch et
al. 1996). On the whole, the combination of the ERPs and
alpha rhythmicity provided a more complete view of the
underlying cortical processes, beyond the idea of a unique
pattern of event-related ‘‘cortical activation/deactivation’’.
This motivates future field investigations on attentional
processes using a multi-modal approach including ERPs,
ERD/ERS, and behavioural measurements.
5. Conclusions
In this EEG study, the parallel ‘‘temporal attention’’ and
task-specific visuo-motor processes, as revealed by alpha
ERD/ERS, were modeled. The experimental task provided a
cue stimulus predicting short or long foreperiod between the
warning and imperative stimuli. The time difference be-
tween short and long foreperiods was of only 800 ms.
Nevertheless, compared to the LONG condition, the
SHORT condition induced a quicker and stronger ERS at
the slowest alpha sub-band (about 6–8 Hz) over midline
and bilateral prefrontal, sensorimotor, and posterior parietal
areas. In contrast, the concomitant high-band alpha (about
10–12 Hz) ERD/ERS showed no significant difference in
the two conditions. These results suggest that the ‘‘temporal
attention’’ towards immediate future events, as revealed by
the low-band alpha rhythm, was modulated over large
regions of both cortical hemispheres at a time scale of less
than 800 ms (time difference between SHORT and LONG
foreperiods). Remarkably, no functional asymmetry in favor
of left phonological or right visuo-spatial hemisphere was
found.
Acknowledgements
The authors thank Prof. Fabrizio Eusebi (Chairman of the
Biophysics Group of Interest, University of Rome ‘‘La
Sapienza’’) for his continuous support and Anling Rao for
his technical assistance. The research was granted by the
Wellcorne Trust and Fatebenefratelli Association for
Research (AFaR).
References
[1] F. Babiloni, C. Babiloni, F. Carducci, L. Fattorini, P. Onorati, A.
Urbano, Performances of surface Laplacian estimators: a study of
simulated and real scalp potential distributions, Brain Topogr.
8 (1995) 33–45.
[2] F. Babiloni, C. Babiloni, F. Carducci, L. Fattorini, P. Onorati, A.
Urbano, Spline Laplacian estimate of EEG potentials over a realistic
magnetic resonance-constructed scalp surface model, Electroencepha-
logr. Clin. Neurophysiol. 98 (4) (1996) 363–373.
[3] F. Babiloni, F. Carducci, C. Babiloni, A. Urbano, Improved realistic
Laplacian estimate of highly-sampled EEG potentials with regulari-
zation techniques, Electroencephalogr. Clin. Neurophysiol. 106 (4)
(1998) 336–343.
[4] C. Babiloni, F. Carducci, F. Cincotti, P.M. Rossini, C. Neuper, G.
Pfurtscheller, F. Babiloni, Human movement-related potentials vs.
desynchronization of EEG alpha rhythm: a high-resolution EEG
study, NeuroImage 10 (6) (1999) 658–665.
[5] C. Babiloni, F. Babiloni, F. Carducci, F. Cincotti, C. Del Percio, G.
De Pino, S. Maestrini, A. Priori, P. Tisei, O. Zanetti, P.M. Rossini,
Movement-related electroencephalographic reactivity in Alzheimer
disease, NeuroImage 12 (2) (2000) 139–146.
[6] F. Babiloni, F. Carducci, F. Cincotti, C. Del Gratta, V. Pizzella, G.L.
Romani, P.M. Rossini, F. Tecchio, C. Babiloni, Linear inverse source
estimate of combined EEG and MEG data related to voluntary move-
ments, Hum. Brain Mapp. 14 (4) (2001) 197–209.
[7] C. Babiloni, F. Babiloni, F. Carducci, F. Cincotti, F. Rosciarelli, P.
Rossini, L. Arendt-Nielsen, A. Chen, Mapping of early and late
human somatosensory evoked brain potentials to phasic galvanic
painful stimulation, Hum. Brain Mapp. 12 (3) (2001) 168–179.
[8] C. Babiloni, F. Babiloni, F. Carducci, F. Cincotti, F. Rosciarelli, L.
Arendt-Nielsen, A.C. Chen, P.M. Rossini, Human brain oscillatory
activity phase-locked to painful electrical stimulations: a multi-chan-
nel EEG study, Hum. Brain Mapp. 15 (2) (2002) 112–123.
[9] C. Babiloni, F. Carducci, C. Del Gratta, M. Demartin, G.L. Romani,
F. Babiloni, P.M. Rossini, Hemispherical asymmetry in human SMA
during voluntary simple unilateral movements. An fMRI study, Cor-
tex 39 (2) (2003) 293–305.
[10] P. Bertelson, The time course of preparation, Q. J. Exp. Psychol. 19
(1967) 272–279.
[11] P. Bertelson, J.P. Boons, Time uncertainty and choice reaction time,
Nature 187 (1960) 531–532.
[12] D.E. Broadbent, M. Gregory, On the interaction of S–R compatibility
with other variables affecting reaction time, Br. J. Psychol. 56 (1965)
61–67.
[13] J.T. Coull, A.C. Nobre, Where and when to pay attention: the neural
systems for directing attention to spatial locations and to time inter-
vals as revealed by both PET and fMRI, J. Neurosci. 18 (1998)
7426–7435.
C. Babiloni et al. / Cognitive Brain Research 19 (2004) 259–268268
[14] P.S. Goldman, A. Lodge, L.R. Hammer, J. Semmes, M. Mishkin,
Critical flicker frequency after unilateral temporal lobectomy in
man, Neuropsychologia 6 (1968) 355–363.
[15] D.L. Harrington, K.Y. Haaland, R.T. Knight, Cortical networks un-
derlying mechanisms of time perception, J. Neurosci. 18 (1998)
1085–1095.
[16] F. Hummel, F. Andres, E. Altenmuller, J. Dichgans, C. Gerloff, In-
hibitory control of acquired motor programmes in the human brain,
Brain 125 (Pt. 2) (2002) 404–420.
[17] F. Hummel, R. Kirsammer, C. Gerloff, Ipsilateral cortical activation
during finger sequences of increasing complexity: representation of
movement difficulty or memory load? Clin. Neurophysiol. 114 (4)
(2003) 605–613.
[18] M. Jueptner, L. Flerich, C. Weiller, S.P. Mueller, H.C. Diener, The
human cerebellum and temporal information processing—results
from a PET experiment, NeuroReport 7 (1996) 2761–2765.
[19] S.G. Kim, J. Ashe, A.P. Georgopoulos, H. Merkle, J.M. Ellermann,
R.S. Menon, S. Ogawa, K. Ugurbil, Functional imaging of human
motor cortex at high magnetic field, J. Neurophysiol. 69 (1993) 297–
302.
[20] S. Kim, J. Ashe, K. Hendrich, J. Ellermann, H. Merkle, K. Ugurbil, A.
Georgopulos, Functional magnetic resonance imaging of motor cor-
tex: hemispherical asymmetry and handedness, Science 261 (1993)
615–617.
[21] W. Klimesch, Memory processes, brain oscillations and EEG syn-
chronization, Int. J. Psychophysiol. 24 (1–2) (1996) 61–100.
[22] W. Klimesch, Brain oscillations and human memory: EEG corre-
lates in the upper alpha and theta band, Neurosci. Lett. 238 (1–2)
(1997 Nov. 28) 9–12.
[23] W. Klimesch, EEG alpha and theta oscillations reflect cognitive
and memory performance: a review and analysis, Brain Res. Rev.
29 (2–3) (1999) 169–195.
[24] W. Klimesch, H. Schimke, J. Schwaiger, Episodic and semantic mem-
ory: an analysis in the EEG theta and alpha band, Electroencephalogr.
Clin. Neurophysiol. 91 (6) (1994) 428–441.
[25] W. Klimesch, M. Doppelmayr, H. Russegger, T. Pachinger, J.
Schwaiger, Induced alpha band power changes in the human EEG and
attention, Neurosci. Lett. 244 (2) (1998) 73–76.
[26] W. Klimesch, M. Doppelmayr, J. Schwaiger, T. Winkler, W. Gruber,
Theta oscillations and the ERP old/new effect: independent phenom-
ena? Brain Res. Cogn. Brain Res. 111 (2000) 781–793.
[27] V. Kopruner, G. Pfurtscheller, L.M. Auer, Quantitative EEG in nor-
mals and in patients with cerebral ischemia, Prog. Brain Res. 62
(1984) 29–50.
[28] F. Lacruz, J. Artieda, M.A. Pastor, J.A. Obeso, The anatomical basis
of somaesthetic temporal discrimination in humans, J. Neurol. Neuro-
surg. Psychiatry 54 (1991) 1077–1081.
[29] M. Ladanyi, B. Dubrovsky, CNV and time estimation, Int. J. Neuro-
sci. 26 (1985) 253–257.
[30] L. Leocani, C. Toro, P. Zhuang, C. Gerloff, M. Hallett, Event-related
desynchronization in reaction time paradigms: a comparison with
event-related potentials and corticospinal excitability, Clin. Neuro-
physiol. 112 (2001) 923–930.
[31] Y.J. Luo, P.M. Greenwood, R. Parasuraman, Dynamics of the spatial
scale of visual attention revealed by brain event-related potentials,
Brain Res. Cogn. Brain Res. 12 (3) (2001) 371–381.
[32] F. Macar, N. Vitton, CNV and reaction time task in man: effects of
inter-stimulus interval contingencies, Neuropsychologia 18 (1980)
585–590.
[33] J.F. Mackworth, Vigilance and Attention: A Signal Detection Ap-
proach, Penguin, Harmondsworth, UK, 1970.
[34] J.A. Mangels, R.B. Ivry, N. Shimizu, Dissociable contributions of the
prefrontal and neocerebellar cortex to time perception, Brain. Res.
Cogn. Brain Res. 7 (1998) 15–39.
[35] C. Miniussi, E.L. Wilding, J.T. Coull, A.C. Nobre, Orienting at-
tention in time. Modulation of brain potentials, Brain 122 (1999)
1507–1518.
[36] P. Nichelli, K. Clark, C. Hollnagel, J. Grafman, Duration process-
ing after frontal lobe lesions, Ann. N.Y. Acad. Sci. 769 (1995)
183–190.
[37] E. Niedermayer, The normal EEG in waking adult, in: E. Niedermayer,
F. Lopez da Silva (Eds.), Electroencephalography: Basic Principles,
Clinical Application and Related Fields, Williams and Wilkins, Balti-
more, 1993, pp. 131–152.
[38] P. Nunez, Neocortical Dynamics and Human EEG Rhythms, Oxford
Univ. Press, New York, 1995.
[39] G. Pfurtscheller, A. Aranibar, Evaluation of event-related desynch-
ronization (ERD) preceding and following voluntary self-paced
movement, Electroencephalogr. Clin. Neurophysiol. 46 (1979)
138–146.
[40] G. Pfurtscheller, F. Lopez da Silva, Event-related EEG/MEG synchro-
nization and desynchronization: basic principles, Clin. Neurophysiol.
110 (1999) 1842–1857.
[41] G. Pfurtscheller, C. Neuper, D. Flotzinger, M. Pregenzer, EEG-
based discrimination between imagination of right and left hand
movement, Electroencephalogr. Clin. Neurophysiol. 103 (6) (1997)
642–651.
[42] M.I. Posner, S.J. Boies, Components of attention, Psychol. Rev. 78
(1971) 391–408.
[43] C. Rau, C. Plewnia, F. Hummel, C. Gerloff, Event-related desynch-
ronization and excitability of the ipsilateral motor cortex during sim-
ple self-paced finger movements, Clin. Neurophysiol. 114 (10) (2003)
1819–1826.
[44] D.S. Ruchkin, M.G. McCalley, E.M. Glaser, Event related potentials
and time estimation, Psychophysiology 14 (1977) 451–455.
[45] A. Sailer, J. Dichgans, C. Gerloff, The influence of normal aging on
the cortical processing of a simple motor task, Neurology 55 (7)
(2000) 979–985.
[46] A. Urbano, C. Babiloni, P. Onorati, F. Carducci, A. Ambrosini, L.
Fattorini, F. Babiloni, Responses of human primary sensorimotor
and supplementary motor areas to internally triggered unilateral and
simultaneous bilateral one-digit movements. A high-resolution EEG
study, Eur. J. Neurosci. 10 (2) (1998) 765–770.
[47] M.G. Woldorff, M. Liotti, M. Seabolt, L. Busse, J.L. Lancaster, P.T.
Fox, The temporal dynamics of the effects in occipital cortex of
visual – spatial selective attention, Brain Res. Cogn. Brain Res. 15
(1) (2002) 1–15.
[48] H. Woodrow, The measurement of attention, Psychol. Monogr. 17
(76) (1914) 1–158.
[49] S. Yamaguchi, H. Tsuchiya, S. Kobayashi, Electroencephalographic
activity associated with shifts of visuospatial attention, Brain 117
(Pt. 3) (1994) 553–562.


