Embed Size (px)
Citation preview
RHYTHMS, SLEEP AND HOMEOSTASIS
A thesis submitted to the University of Manchester for the degree of
Doctor of Philosophy (PhD)
in the Faculty of Biology, Medicine and Health
2019
REBECCA C NORTHEAST
SCHOOL OF MEDICAL SCIENCES/
Division of Diabetes, Endocrinology and Gastroenterology
RHYTHMS, SLEEP AND HOMEOSTASIS
2
List of Contents
Abbreviations .............................................................................................................. 10
Abstract ....................................................................................................................... 15
Declaration .................................................................................................................. 16
Copyright Statement ................................................................................................... 16
Acknowledgements ..................................................................................................... 17
Chapter 1: Background Literature ................................................................................ 18
1.1 Circadian Rhythms .................................................................................................... 18
1.1.1 Introduction ....................................................................................................... 18
1.1.2 Molecular clockwork .......................................................................................... 19
1.1.3 The master pacemaker ...................................................................................... 21
1.1.4 The SCN networks .............................................................................................. 22
1.1.5 SCN outputs ....................................................................................................... 24
1.1.6 Circadian entrainment and behaviour ............................................................... 26
1.1.7 Extra-SCN oscillators .......................................................................................... 27
1.1.8 Non-neuronal cells and circadian timekeeping .................................................. 30
1.1.9 Circadian rhythms and health ............................................................................ 31
1.2 Sleep .......................................................................................................................... 32
1.2.1 Introduction ....................................................................................................... 32
1.2.2 Electroencephalogram ....................................................................................... 33
1.2.3 Sleep homeostasis ............................................................................................. 34
1.2.4 Circadian regulation of sleep ............................................................................. 35
1.2.5 Neuroanatomy of sleep ..................................................................................... 37
1.3 Food Entrainment ..................................................................................................... 39
1.3.1 Food anticipatory activity .................................................................................. 39
1.3.2 The food entrainable oscillator .......................................................................... 40
1.3.3. Neuroanatomical location ................................................................................ 41
REBECCA NORTHEAST 3
1.3.4 Clock gene involvement ..................................................................................... 41
1.3.5 Food anticipation and energy balance ............................................................... 42
1.4 The Lamina Terminalis .............................................................................................. 43
1.4.1 Introduction to the circumventricular organs .................................................... 43
1.4.2 The subfornical organ ........................................................................................ 45
1.4.3 The organum vasculosum laminae terminalis ................................................... 46
1.4.6 The choroid plexus ............................................................................................. 47
1.4.5 The SFO and OVLT in the central control of water balance ............................... 47
1.5 The Dorsal Vagal Complex ........................................................................................ 50
1.5.1 The area postrema ............................................................................................. 50
1.5.2 The nucleus of the solitary tract ........................................................................ 52
1.5.3 The dorsal motor nucleus of the vagus nerve .................................................... 52
1.5.4 The role of the DVC in metabolism and energy homeostasis ............................ 53
1.5.9 Circadian rhythms in cardiovascular physiology ................................................ 56
1.6 Concluding Remarks .................................................................................................. 58
1.7 Aims and Objectives .................................................................................................. 59
1.8 Alternative Format .................................................................................................... 60
1.8.1 Chapter 2 ........................................................................................................... 60
1.8.2 Chapter 3 ........................................................................................................... 61
1.8.3 Chapter 4 ........................................................................................................... 62
Chapter 2: Sleep Homeostasis During Daytime Food Entrainment in Mice ................... 63
2.1 Abstract ..................................................................................................................... 64
2.1.1 Statement of significance .................................................................................. 64
2.2 Introduction .............................................................................................................. 65
2.3 Materials and Methods ............................................................................................. 67
2.3.1 Animals and recording conditions ..................................................................... 67
2.3.2 Surgical procedure and experimental design .................................................... 67
2.3.3 Restricted feeding paradigm .............................................................................. 68
2.3.4 Sleep deprivation ............................................................................................... 70
RHYTHMS, SLEEP AND HOMEOSTASIS
4
2.3.5 Statistics ............................................................................................................. 70
2.3.6 Signal processing ................................................................................................ 70
2.3.7 Scoring of vigilance states .................................................................................. 71
2.4 Results ....................................................................................................................... 72
2.4.1 Entrainment to scheduled feeding .................................................................... 72
2.4.2 The initial response to scheduled feeding ......................................................... 77
2.4.3 Restricted feeding versus timed sleep deprivation ............................................ 79
2.5 Discussion .................................................................................................................. 81
2.6 Supplemental Material ............................................................................................. 85
2.7 References ................................................................................................................. 88
Chapter 3: Time for a Drink? Novel Oscillator Properties in the Thirst Centres of the
Brain ............................................................................................................................ 92
3.1 Abstract ..................................................................................................................... 93
3.1.1 Statement of significance .................................................................................. 93
3.2 Introduction .............................................................................................................. 94
3.3 Materials and Methods ............................................................................................. 96
3.3.1 Animals .............................................................................................................. 96
3.3.2 Bioluminescence imaging .................................................................................. 96
3.3.3 Quantitative Real-Time PCR ............................................................................... 98
3.4 Results ....................................................................................................................... 99
3.4.1 The SFO and OVLT exhibit robust oscillations in PER2::LUC .............................. 99
3.4.2 In vivo rhythmic gene transcript expression in the SFO ................................... 101
3.4.3 Forskolin treatment re-synchronises individual cellular oscillations and
generates long lasting whole tissue rhythms in the SFO and OVLT .......................... 103
3.4.4 Tetrodotoxin treatment abolishes single cell oscillator synchrony ................. 105
3.4.5 SFO oscillations are not synchronised longitudinally ....................................... 107
3.5 Discussion ................................................................................................................ 109
3.6 Supplemental Material ........................................................................................... 114

REBECCA NORTHEAST 5
3.7 References ............................................................................................................... 118
Chapter 4: Keeping Time in the Brainstem ................................................................. 122
4.1 Abstract ................................................................................................................... 123
4.1.2 Significance statement ..................................................................................... 123
4.2 Introduction ............................................................................................................ 124
4.3 Materials and Methods ........................................................................................... 126
4.3.1 Animals ............................................................................................................ 126
4.3.2 Bioluminescence imaging ................................................................................ 126
4.3.3 Quantitative Real-Time PCR ............................................................................. 128
4.3.4 Immunohistochemistry .................................................................................... 129
4.3.5 Multi-electrode array recordings ..................................................................... 130
4.3.5.1 Tissue preparation ........................................................................................ 130
4.4 Results ..................................................................................................................... 133
4.4.1 Brainstem nuclei exhibit robust oscillations of PER2::LUC .............................. 133
4.4.2 Cyclic Clock Gene Expression in vivo ................................................................ 135
4.4.3 Forskolin treatment re-synchronises individual cellular rhythms and transiently
synchronises phase in the three oscillators .............................................................. 137
4.4.4 Daily variation in brainstem neuronal activity in vitro ..................................... 139
4.4.5 Day-Night Alterations in Responsiveness to Metabolic and Circadian Signals 141
4.4.6 Temporal variation in receptor transcript expression in vivo .......................... 144
4.4.7 Daily Variation in AP/NTS glial barrier permeability ........................................ 145
4.5 Discussion ................................................................................................................ 148
4.6 Supplemental Material ........................................................................................... 153
4.6 References ............................................................................................................... 157
Chapter 5: General Discussion ................................................................................... 161
5.1 Rhythms Influencing Sleep and Homeostasis .......................................................... 161
5.1.1 Overview .......................................................................................................... 161
5.1.3 The sCVOs in immune regulation and energy balance .................................... 163

RHYTHMS, SLEEP AND HOMEOSTASIS
6
5.1.4 A network of localised circadian homeostatic control ..................................... 164
5.1.4 The AP/NTS diffusion barrier is under circadian control .................................. 166
5.1.5 Local clocks and aging ...................................................................................... 167
5.2 Future Directions and Limitations ........................................................................... 168
5.2.1 Investigating sleep drive and energy balance .................................................. 168
5.2.2 Localised circadian control in extra-SCN oscillators ......................................... 169
5.2.3 Identification of oscillator neuron type in the NTS .......................................... 170
5.2.4 Temporal barrier control ................................................................................. 171
5.2.5 Limitations ....................................................................................................... 171
References ..................................................................................................................... 173
Word Count: 62,625 words
REBECCA NORTHEAST 7
List of Figures
Chapter 1
Figure 1.1 The mammalian TTFL. ........................................................................................ 20
Figure 1.2 SCN anatomy and outputs. ................................................................................ 24
Figure 1.3 Extra-SCN oscillators. ......................................................................................... 30
Figure 1.4 The two-process model of sleep regulation. ..................................................... 33
Figure 1.5 SCN influence in the sleep-wake cycle. .............................................................. 38
Figure 1.6 Different restricted feeding paradigms and activity measures. ......................... 40
Figure 1.7 Anatomy of the OVLT and SFO. .......................................................................... 45
Figure 1.8 Thirst homeostasis central pathways. ............................................................... 50
Figure 1.9 Dorsal vagal complex anatomy. ......................................................................... 51
Figure 1.10 DVC regulation of energy balance. .................................................................. 56
Chapter 2
Figure 2.1 Experimental design and baseline measurements. ........................................... 69
Figure 2.2 Progression and characteristics of food entrainment. ....................................... 74
Figure 2.3 Slow wave energy homeostasis during food entrainment. ............................... 76
Figure 2.4 Adapting to the restricted feeding paradigm. ................................................... 78
Figure 2.5 Sleep deprivation challenge. .............................................................................. 80
Supplemental Figure 2.1 Simultaneous recording of body temperature and brain activity
during torpor in an individual C57BL/6J mouse. ................................................................. 85
Supplemental Figure 2.2 Slopes of cumulative curves for restricted feeding versus
baseline. .............................................................................................................................. 86
Supplemental Figure 2.3 Slopes of cumulative curves for the initial days of restricted
feeding. ............................................................................................................................... 87
RHYTHMS, SLEEP AND HOMEOSTASIS
8
Chapter 3
Figure 3.1 Circadian rhythms in the SFO and OVLT. .......................................................... 100
Figure 3.2 In vivo gene expression of genes showing temporal variation in the SFO. ...... 102
Figure 3.3 The long-term effects of forskolin treatment on PER2::LUC expression. ......... 104
Figure 3.4 Tetrodotoxin treatment decreases single cell synchrony. ................................ 107
Figure 3.5 Sagittal imaging reveals longitudinal desynchrony in the SFO. ........................ 108
Figure 3.6 Per1 in the SFO peaks at with drinking activity onset. ..................................... 112
Supplemental Figure 3.1 Single cell properties of the SFO and OVLT versus the SCN. ..... 114
Supplemental Figure 3.2 Single cell oscillations during TTx treatment. ........................... 115
Supplemental Figure 3.3 Single cell traces from sagittal SFO recordings. ........................ 116
Chapter 4
Figure 4.1 The AP and NTS display rhythms in PER2::LUC bioluminescence. ................... 134
Figure 4.2 The AP and NTS display rhythms in PER2::LUC bioluminescence. ................... 137
Figure 4.3 Forskolin restores rhythmicity and transiently phase-aligns brainstem
oscillators. ......................................................................................................................... 138
Figure 4.4 AP and NTS neurons exhibit robust 24h and day-night variation in electrical
activity. ............................................................................................................................. 140
Figure 4.5 Day-night variation in responsiveness of NTS neurons to metabolic factors. 144
Figure 4.6 Circadian variation in receptor gene expression in the NTS. ........................... 145
Figure 4.7 Increased permeability to Evans Blue dye in the NTS at early night. ............... 147
Supplemental Figure 4.1 Coronal sections of the mouse brainstem tissue to be used for
laser-capturing for qPCR experiments. ............................................................................. 153
Supplemental Figure 4.2 Absence of PER2:LUC signal in the rostral and caudal NTS. ...... 154
Supplemental Figure 4.3 Responsiveness of AP neurons to metabolic factors during the day
and night. .......................................................................................................................... 155
Supplemental Figure 4.4 Evans Blue (EB) is contained in the vascular organ of the lamina
terminals (OVLT) and subfornical organ (SFO) in the day and night. ................................ 156
REBECCA NORTHEAST 9
Chapter 5
Figure 5.1 The evolutionary drive and the “two process model”. .................................... 162
Figure 5.2 Local clock homeostatic networks. .................................................................. 166
List of Tables Supplemental Table 3.1 .................................................................................................... 117
RHYTHMS, SLEEP AND HOMEOSTASIS
10
Abbreviations
3V Third ventricle
4thVep Fourth ventricle ependyma
5-HT Serotonin
AAV Adreno-associated virus
ACC Anterior cingulate cortex
ACSF Artificial cerebral spinal fluid
AgRP Agouti-related peptide
AMY Amygdala
AP Area postrema
Arc Arcuate nucleus
ATII Angiotensin II
AVP Arginine vasopressin
BAT Brown adipose tissue
BBB Blood brain barrier
BNST Bed nucleus of the stria terminalis
BSL Baseline
CB Cerebellum
CC Central canal
CCK Cholecystokinin
ChP Choroid plexus
CP Capillary plexus
Cry Cryptochrome
CSF Cerebrospinal fluid
CSF Cerebrospinal fluid
CSKδ Casein kinase δ
CSKε Casein kinase ε
CT Circadian time
CVO Circumventricular organs
CZ Central zone
Dbp D-box binding protein (DBP),
REBECCA NORTHEAST 11
DD Constant dark
DMH Dorsomedial hypothalamus
DMV Dorsal motor nucleus of the vagus nerve
DVC Dorsal vagal complex
EB Evans Blue dye
ECF Extra-cellular fluid
EEG Electroencephalogram
EGR1/3 Early growth response factor 1/3
EMG Electromyogram
EPO Erythropoietin
FAA Food anticipatory activity
FEO Food entrainable oscillator
FSK Forskolin
GABA Gamma-aminobutyric acid
GFAP Glial fibrillary acid protein
GHSR Growth hormone secretagogue receptor
GLP-1 Glucagon-like 1 peptide
Glu Glutamate
GLUT2 Glucose transporter type 2
GRP Gastrin-releasing peptide
GSK3β Glycogen synthase kinase 3β
h Hour
HBSS Hanks balanced salt solution
HLF Hepatic leukemia factor
HPC Hippocampus
IC Insular cortex
IGL Intergeniculate leaflet
ir Immunoreactivity
LD Light dark
LDT Laterodorsal tegmental
LH Lateral hypothalamus
RHYTHMS, SLEEP AND HOMEOSTASIS
12
LHb Lateral habenula
luc Luciferase
LZ Lateral zone
MBH Medial basal hypothalamus
ME Median eminence
MHb Medial habenula
min Minutes
MnPO Median preoptic nucleus
MUA Multi-unit activity
NAc Nucleus accumbens
NFIL3 Nuclear factor, interleukin-3 regulated
NO Nitric oxide
NPY Neuropeptide-Y
NREM Non-rapid eye movement sleep
NTS Nucleus tractus soltarius
OB Olfactory bulb
OC Optic chiasm
OS Outer shell
OVLT Organum vasculosum laminae terminalis
OXA Orexin A
PAS Period-Arnt-Single-minded
PBN Parabrachial nucleus
PBS Phosphate buffered saline
Per Period
PER2::LUC PERIOD2::LUCIFERASE
PK2 Prokineticin 2
POMC Pro-opiomelanocortin
PPARα Peroxisome proliferator-activated receptor α
PPT Pedunculopontine
PRF1 Perforin 1
PVN Paraventricular nucleus
REBECCA NORTHEAST 13
REM Rapid eye movement sleep
RF Restricted feeding
RHT Retinohypothalamic tract
RM Repeated measures
ROI Region of interest
RRE REV response elements
rRPA Rostral raphe pallidus
RT Room temperature
SCN Suprachiasmatic nuclei
SCNx SCN lesion
sCVO Sensory circumventricular organ
SD Standard deviation
SDP Sleep deprivation
SEM Standard error of the mean
SFO Subfornical organ
SFR Spontaneous firing rate
sMUA Spontaneous multi-unit activity
SON Supraoptic nucleus
SPVz Subparaventricular zone
SWA Slow-wave activity
SWE Slow-wave energy
THAL Thalamus
TTFL Transcriptional translational feedback loop
TTx Tetrodotoxin
VC Ventromedial core
VHC Ventral hippocampal commissure
VIP Vasoactive intestinal polypeptide
VLM Ventrolateral medulla
VLPO Ventrolateral preoptic area
VMH Ventral medial hypothalamus
vSPVz Ventral subparaventricular zone

RHYTHMS, SLEEP AND HOMEOSTASIS
14
ZO-1 Zona occludens-1
ZT Zeitgeber time
REBECCA NORTHEAST 15
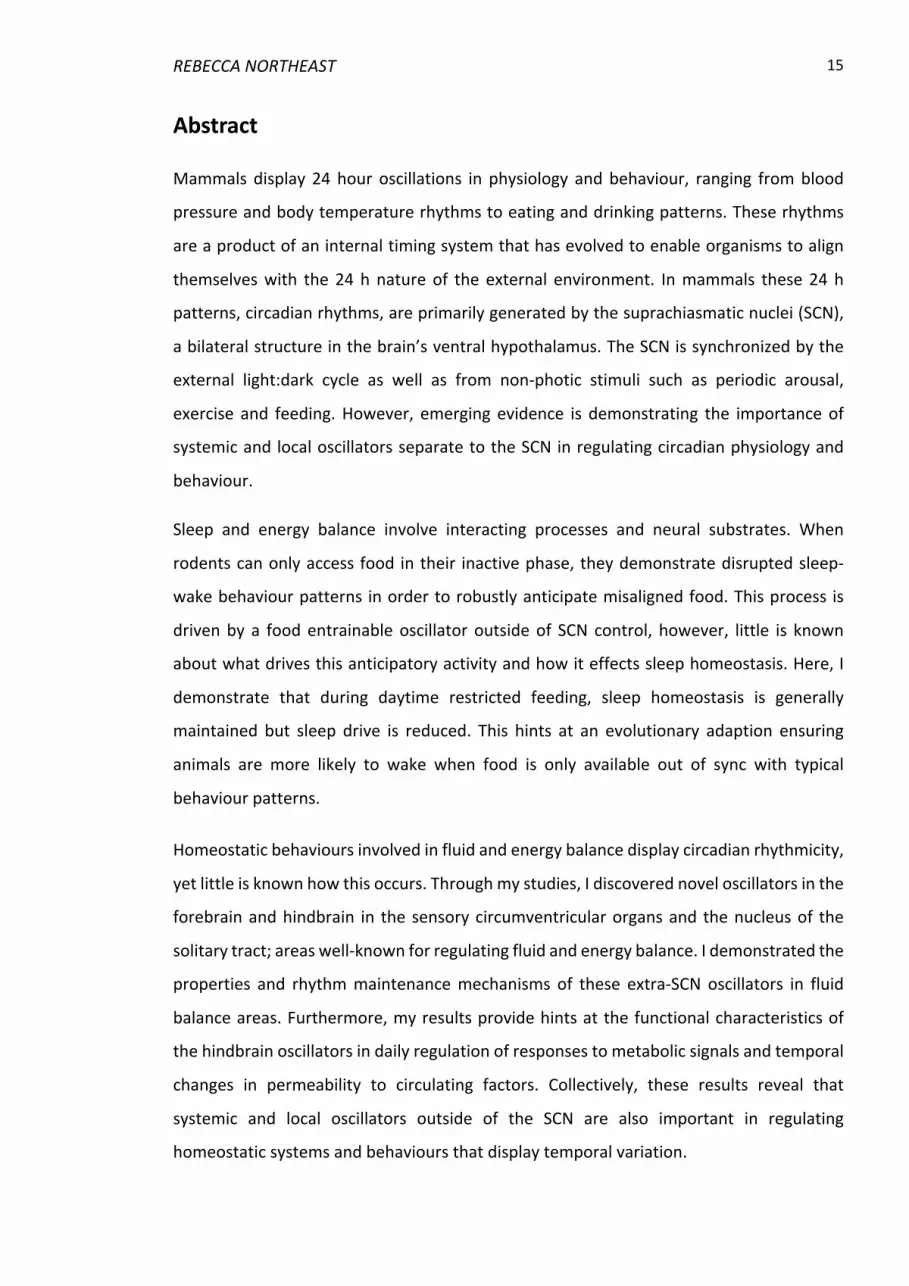
Abstract Mammals display 24 hour oscillations in physiology and behaviour, ranging from blood
pressure and body temperature rhythms to eating and drinking patterns. These rhythms
are a product of an internal timing system that has evolved to enable organisms to align
themselves with the 24 h nature of the external environment. In mammals these 24 h
patterns, circadian rhythms, are primarily generated by the suprachiasmatic nuclei (SCN),
a bilateral structure in the brain’s ventral hypothalamus. The SCN is synchronized by the
external light:dark cycle as well as from non-photic stimuli such as periodic arousal,
exercise and feeding. However, emerging evidence is demonstrating the importance of
systemic and local oscillators separate to the SCN in regulating circadian physiology and
behaviour.
Sleep and energy balance involve interacting processes and neural substrates. When
rodents can only access food in their inactive phase, they demonstrate disrupted sleep-
wake behaviour patterns in order to robustly anticipate misaligned food. This process is
driven by a food entrainable oscillator outside of SCN control, however, little is known
about what drives this anticipatory activity and how it effects sleep homeostasis. Here, I
demonstrate that during daytime restricted feeding, sleep homeostasis is generally
maintained but sleep drive is reduced. This hints at an evolutionary adaption ensuring
animals are more likely to wake when food is only available out of sync with typical
behaviour patterns.
Homeostatic behaviours involved in fluid and energy balance display circadian rhythmicity,
yet little is known how this occurs. Through my studies, I discovered novel oscillators in the
forebrain and hindbrain in the sensory circumventricular organs and the nucleus of the
solitary tract; areas well-known for regulating fluid and energy balance. I demonstrated the
properties and rhythm maintenance mechanisms of these extra-SCN oscillators in fluid
balance areas. Furthermore, my results provide hints at the functional characteristics of
the hindbrain oscillators in daily regulation of responses to metabolic signals and temporal
changes in permeability to circulating factors. Collectively, these results reveal that
systemic and local oscillators outside of the SCN are also important in regulating
homeostatic systems and behaviours that display temporal variation.

RHYTHMS, SLEEP AND HOMEOSTASIS
16
Declaration No portion of the work referred to in the thesis has been submitted in support of an
application for another degree or qualification of this or any other university or other
institute of learning.
Copyright Statement i. The author of this thesis (including any appendices and/or schedules to this thesis)
owns certain copyright or related rights in it (the “Copyright”) and s/he has given
The University of Manchester certain rights to use such Copyright, including for
administrative purposes.
ii. Copies of this thesis, either in full or in extracts and whether in hard or electronic
copy, may be made only in accordance with the Copyright, Designs and Patents
Act 1988 (as amended) and regulations issued under it or, where appropriate, in
accordance with licensing agreements which the University has from time to time.
This page must form part of any such copies made.
iii. The ownership of certain Copyright, patents, designs, trademarks and other
intellectual property (the “Intellectual Property”) and any reproductions of
copyright works in the thesis, for example graphs and tables (“Reproductions”),
which may be described in this thesis, may not be owned by the author and may
be owned by third parties. Such Intellectual Property and Reproductions cannot
and must not be made available for use without the prior written permission of
the owner(s) of the relevant Intellectual Property and/or Reproductions.
iv. Further information on the conditions under which disclosure, publication and
commercialisation of this thesis, the Copyright and any Intellectual Property
and/or Reproductions described in it may take place is available in the University
IP Policy (see http://documents.manchester.ac.uk/DocuInfo.aspx?DocID=2442 0),
in any relevant Thesis restriction declarations deposited in the University Library,
The University Library’s regulations (see
http://www.library.manchester.ac.uk/about/regulations/) and in The University’s
policy on Presentation of Theses.

REBECCA NORTHEAST 17
Acknowledgements
To start with, I would like to thank the people who made the work for this thesis possible.
I honestly cannot believe how lucky I have been to have interact with such incredible
people and how much they have influenced me both as a scientist and a person. Firstly, I
would like to thank Alun for teaching me everything I know in the lab. But mainly I want to
thank you for your incredibly positive and calm disposition and unfailing willingness to help,
and of course your dahl recipes! Secondly, I have to thank Lukasz. Who would have thought
that in just six months we could achieve so much together in the lab, become best friends
and then go to California for SfN and desert road trips. Thirdly, I need to thank the
wonderfully brilliant Vlad. I am so grateful for how you and your lab welcomed me to
Oxford, and for how much you taught me in just 2 months. I am so glad that all our hard
work paid off in these results. And last (but by no means least!) I must thank Hugh. Thank
you for giving me the flexibility to follow up my ideas and for putting up with my terrible
jokes. I have had an incredible experience during my PhD and I really count myself lucky to
have been in your lab, despite the huge changes that occurred over the past three and a
half years. Through your guidance I have achieved more in this PhD then I ever thought
possible.
I have been incredibly fortunate to have the support of a wonderful group of friends, far
too many to name you all but I hope you all know who you are. However, I have to
specifically thank Cat and Jackie, I don’t think a PhD is ever easy, but your unwavering
friendship has meant the world to me and this would have been far harder without you. Of
course, I have to thank my incredible parents as well. You have supported me the whole
way through my academic career and helped through three degrees. You both work so
hard and strive to be the best at whatever you do and I am so lucky if even a small part of
that has rubbed off on me. Thank you to my sister, for being my adventure and training
buddy outside to keep a good work-life (exercise!) balance.
Finally, I would like to acknowledge and thank the MRC and UoM Alumni scholarship for
funding my studentship.
RHYTHMS, SLEEP AND HOMEOSTASIS
18
Chapter 1: Background Literature
1.1 Circadian Rhythms
1.1.1 Introduction
Predictable light to dark cycles in our environment arise from the rotation of the earth
about its axis. Almost all organisms have evolved clock-like internal timekeeping systems
in order to predict and adapt to the nature of these periodic changes. Wherever these
phenomena appear over 24 hour (h) cycles, they are termed circadian rhythms, from the
Latin “circa” (about) and “dian” (day).
Circadian rhythms occur in every cell, tissue and whole-body system ranging from single
celled organisms such as the fungus Neurospora, to nucleus-lacking red blood cells, to
mammals (O’Neill & Reddy, 2011; Baker et al., 2012). These internal biological rhythms
need to be kept in sync with their environment and thus can be entrained by recurring
external factors often referred to as zeitgebers (German for “time-giver”). A vast array of
zeitgebers have been discovered to help entrain these circadian systems. In mammals the
primary zeitgeber is light, however there are many other non-photic zeitgebers including
food availability, physical exercise and arousal which need to be integrated by the whole
system for sufficient entrainment.
Diurnal species, such as humans, require heightened cognition and arousal during the
daytime, therefore neural mechanisms regulating these are upregulated accordingly. In
contrast, activation of sleep-dependent pathways occurs specifically at night. Conversely,
nocturnal species require the opposite phasing of these mechanisms, highlighting the
diverse role of biological clocks across organisms. It is therefore a strong evolutionary
advantage to have a robust circadian system in order to compartmentalise behaviours and
physiological functions within the correct time frame for each individual. Indeed, disruption
of the central circadian system can have far reaching consequences. As shown in mice and
humans, circadian misalignment can lead to a multitude of metabolic, neurological and
systemic diseases (Roenneberg & Merrow, 2016). The focus of experimental research into
circadian rhythms has been to elucidate the molecular and physiological mechanisms

REBECCA NORTHEAST 19
governing these rhythmic outputs and how they impact on disease, with the ultimate aim
of developing new therapies to entrain or alter our biological timing system.
1.1.2 Molecular clockwork
The 2017 Nobel Prize in Physiology or Medicine was awarded to J. Hall, M. Rosbash and M.
Young for their work involving the discoveries of the molecular machinery behind the
generation of circadian rhythms. This award highlights the achievement of discovering the
genes behind the regulation of such complex behaviours and their importance in the
healthy regulation of cellular processes to whole animal physiology.
Circadian rhythms are underpinned by a constant cycle of self-sustained transcriptional-
translational feedback loops (TTFLs) composed of forward and negative arms of multiple
transcription factors and subsequent protein interactions which take roughly 24 h to
complete. BMAL1 and CLOCK are basic helix-loop-helix transcription factors that form the
positive arm of the clock, dimerising in the cytoplasm through interaction at Period-Arnt-
Single-minded (PAS) domains before translocating to the nucleus (Bunger et al., 2000;
Gekakis et al., 1998). Once in the nucleus they bind to E-box enhancer sequences upstream
of a set of rhythmic genes that encode the repressor proteins period (PER1/2/3) and
cryptochrome (CRY1/2) and activate their transcription (Bae et al., 2001; Yoo et al., 2004).
This occurs during the day in mice leading to the build-up of cytoplasmic Per and Cry
proteins in the late afternoon (Lee et al., 2001), after which they dimerise and translocate
back to the nucleus to inhibit the activity of CLOCK-BMAL1, thus repressing their own
transcription (Griffin et al., 1999; Sato et al., 2006). The stability and temporal precision of
PER and CRY is enhanced by phosphorylation from casein kinase ε and δ (CSKε/δ) proteins
and Glycogen synthase kinase 3β (GSK3β) which target these proteins for degradation by
ubiquitin dependent pathways (Busino et al., 2007; Reischl et al., 2007).

RHYTHMS, SLEEP AND HOMEOSTASIS
20
Figure 1.1 The mammalian TTFL. BMAL1 and CLOCK (or NPAS2) drive the transpiration of Per1/2 and Cry1/2 at E-box elements in the primary loop, and Rev-erbα/β and Dbp of the accessory loops. Per1/2 and Cry1/2 dimerise in the cytoplasm and feedback to repress their own transcription. Rev-erbα/β represses while Rorα/β activates transcription of Bmal1 and Nfil3 in a rhythmic manner at RRE binding sites. These transcribed proteins go on to rhythmically transcribe or repress clock-controlled genes (CCGs) that contain E-Box, D-box or RRE binding elements in their promoters. Figure adapted from Takahashi, 2017.

REBECCA NORTHEAST 21
A secondary negative arm of the TTFL is driven by CLOCK-BMAL1 activating Rorα, Rev-erbα
and Rev-erbβ (encoded by Nr1d1 and Nr1d2 respectively) which act to inhibit the
transcription of Bmal1 through binding at REV response elements (RREs) (Preitner et al.,
2002). This leads to an anti-phasic relationship between Per and Rev-erbα/β transcript
rhythms. Furthermore, there is a third transcriptional loop driven by CLOCK-BMAL1
involving factors including D-box binding protein (Dbp), hepatic leukemia factor (HLF) and
thyrotroph embryonic factor (TEF). These proteins interact at D-box binding sites with the
repressor nuclear factor, interleukin-3 regulated (Nfil3) which is in turn driven by the REV-
ERB loop (Gachon et al., 2004). Taken together, these interlocking factors create highly
regulated cycles of protein transcription and degradation, acting on initial downstream
target genes containing E-box and RRE sequences enabling cells to temporally coordinate
their activities (Sato et al., 2006; Cho et al., 2012). The TTFL is summarised in Figure 1.1.
The clock genes integral to the TTFL are designed with a great deal of redundancy; single
knock-outs of one gene do not fully disrupt circadian behaviours as their function is taken
over by paralog genes compensating within the SCN network (Liu et al., 2007). For example,
Per1 and Per2 have partial compensation between themselves, as a double knockout
mouse of these genes is immediately arrhythmic compared to either single Per1 or Per2
knockout which become arrhythmic over time (Bae et al., 2001). Likewise, NPAS2, a
paralogue for CLOCK, is sufficient to drive peripheral and central rhythms in CLOCK deficient
mice (DeBruyne et al., 2006; Landgraf, Wang, et al., 2016). The only gene knockout which
eliminates clock function in the SCN and peripheral tissues, is Bmal1; the knockout mice for
which demonstrate a complete lack of behavioural and molecular rhythms along with poor
metabolic control (McDearmon et al., 2006).
1.1.3 The master pacemaker
In the mammalian brain, the coordination of 24 h rhythms is conferred by a principal
internal clock that resides in the hypothalamus termed the suprachiasmatic nuclei (SCN).
The primary location of the SCN was discovered in the early 1970’s when two groups
simultaneously published discovered the importance of the suprachiasmatic nuclei (SCN)
located in the hypothalamus, which appeared fundamentally important for controlling
hormonal and other physiological rhythms (Moore & Eichler, 1972; Stephan & Zucker,
RHYTHMS, SLEEP AND HOMEOSTASIS
22
1972). Ablation of the SCN in hamsters resulted in a complete loss of rhythmical activity
which could be restored through the transplantation of donor SCN explants, producing
rhythms which matched the period length of the mutant donor (Ralph et al., 1990). The
SCN received its status as a master pacemaker through its ability to synchronise other
central and peripheral oscillators, as well as maintain a robust rhythm in the absence of all
other external stimuli (Reppert & Weaver, 2002).
1.1.4 The SCN networks
The SCN is composed of a dense collection of cells forming two nuclei located immediately
dorsal to the optic chiasm, either side of the third ventricle (Abrahamson & Moore, 2001).
Each nuclei is composed of roughly 42,000 neurons per nucleus in humans (Hofman et al.,
1996) and 10,500 in mice (Abrahamson & Moore, 2001). The structure of the SCN is
simplistically considered as a ‘core’ and ‘shell’ model; the ventrolateral core is
deconstructed from the dorsomedial shell as the core receives direct retinal innervation
and they contain phenotypically different cell types (Card & Moore, 1984; Tanaka et al.,
1997). The majority of early SCN anatomy studies were performed in rats and hamsters,
however in mice, this core and shell region is less well defined (Miller et al., 1996). The
murine SCN retains much of the delineation in neuropeptide expressing cells, but direct
retinal information is conveyed to the whole of the structure (Fernandez et al., 2016). The
typically retinorecipient neuropeptides are found in the “core” and are primarily vasoactive
intestinal polypeptide (VIP) and gastrin-releasing peptide (GRP). The most abundant are
vasopressin (AVP) expressing cells, primarily found in the “shell” region (Abrahamson &
Moore, 2001) (Fig 1.2).
The majority of cells in the SCN display individual oscillations in firing rate and gene
expression (Belle et al., 2009; Webb et al., 2009). These cell-autonomous rhythms are weak
in individual culture, yet whole SCN cultures can maintain rhythms with incredible precision
(Patton et al., 2016). Thus, what must make the SCN such a powerful oscillator is the robust
synchrony of these oscillating neurons. The majority of neurons in the SCN are GABAergic,
but also co-express neuropeptides (Moore & Speh, 1993), and GABA can resynchronise and
phase shift SCN clock cells (Liu & Reppert, 2000; Evans et al., 2013), highlighting the role of
GABAergic transmission in SCN cellular synchrony. VIP is considered to be pivotal for
REBECCA NORTHEAST 23
maintaining synchrony within the SCN, being able to phase shift SCN directed behaviour in
vivo (Piggins et al., 1995), and mice lacking VIP or its receptor, VPAC2, display highly
disrupted circadian behaviour and abnormal responses to light (Colwell et al., 2003; Cutler
et al., 2003; Hughes & Piggins, 2008). A sophisticated set of experiments demonstrated
that paracrine VIP signalling from a wild-type graft SCN separated by semi-permeable
membrane was sufficient to restore cellular synchrony and amplitude in SCN explants from
VIP deficient host mice (Maywood et al., 2011). This effect was predominantly down to VIP
signalling but was also augmented by the other SCN neuropeptides AVP and GRP, indicating
that the paracrine signalling helps determine circuit level pacemaking (Maywood et al.,
2011).
Intercellular electrical signalling is required for maintenance of SCN neuronal synchrony as
treatment with the sodium channel inhibitor tetrodotoxin (TTx) decreases the amplitude
and abolishes phase-coupling between individually oscillating SCN neurons (Yamaguchi et
al., 2003; Schmal et al., 2018). PER2 peaks at the start of the circadian night, whilst neuronal
calcium signalling and electrical activity peak in the middle of the subjective day, driving
Per1 and Per2 transcription enabling temporal phasing of these different processes
(Brancaccio et al., 2013). Furthermore, advances in clock gene reporters and imaging
technologies revealed the SCN to exhibit spatiotemporal waves of clock gene expression
and electrical activity (Brancaccio et al., 2013; Enoki et al., 2017). This wave of PER2 stars
in the ventral core of the SCN and spreads to the shell lasting roughly 3 h, a phenomenon
that becomes more pronounced during long day LD cycles (Evans et al., 2013). It is not yet
known why the SCN demonstrates this spatiotemporal wave, perhaps to denote a
patterning to specific efferent pathways allowing a more precise temporal output signal.
RHYTHMS, SLEEP AND HOMEOSTASIS
24
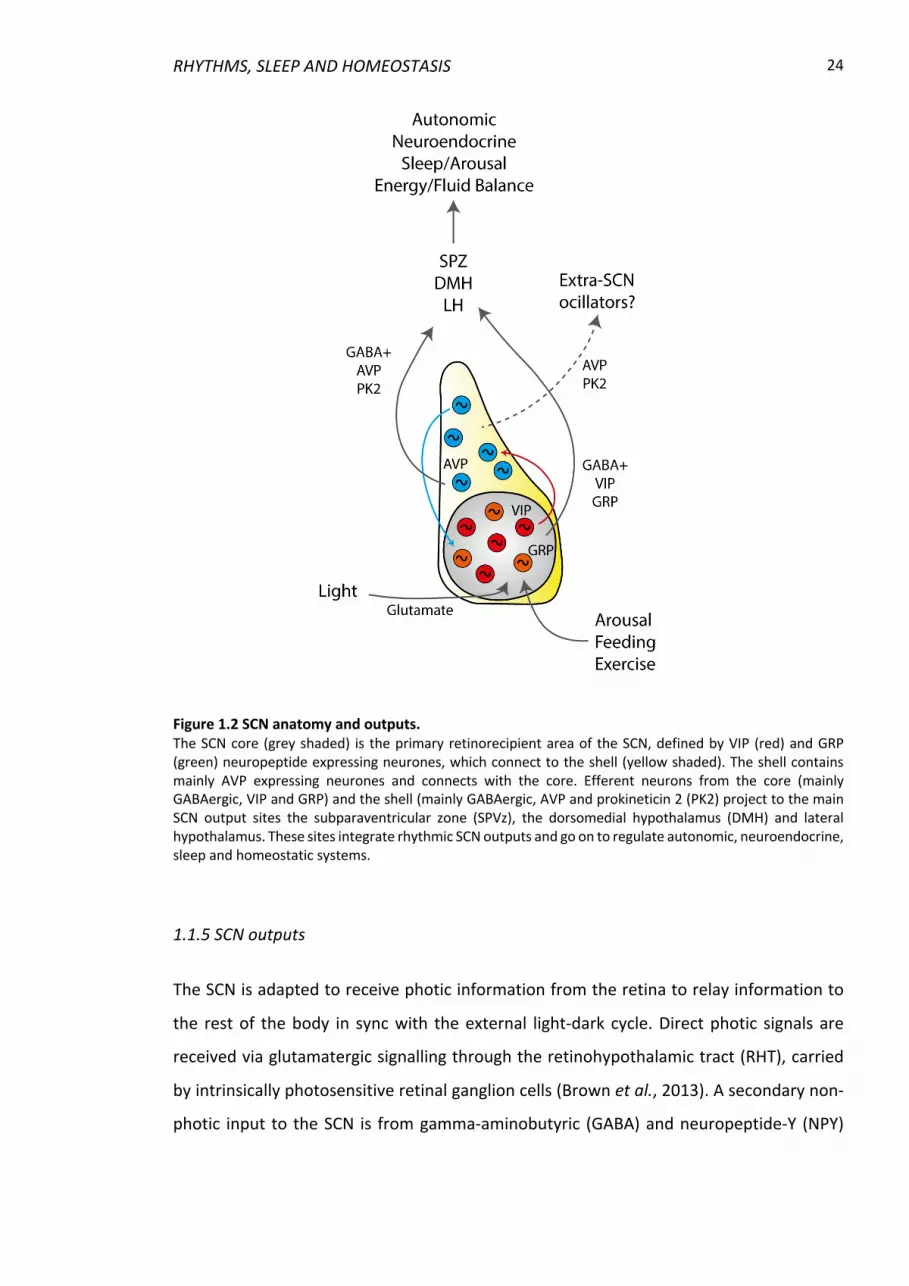
Figure 1.2 SCN anatomy and outputs. The SCN core (grey shaded) is the primary retinorecipient area of the SCN, defined by VIP (red) and GRP (green) neuropeptide expressing neurones, which connect to the shell (yellow shaded). The shell contains mainly AVP expressing neurones and connects with the core. Efferent neurons from the core (mainly GABAergic, VIP and GRP) and the shell (mainly GABAergic, AVP and prokineticin 2 (PK2) project to the main SCN output sites the subparaventricular zone (SPVz), the dorsomedial hypothalamus (DMH) and lateral hypothalamus. These sites integrate rhythmic SCN outputs and go on to regulate autonomic, neuroendocrine, sleep and homeostatic systems.
1.1.5 SCN outputs
The SCN is adapted to receive photic information from the retina to relay information to
the rest of the body in sync with the external light-dark cycle. Direct photic signals are
received via glutamatergic signalling through the retinohypothalamic tract (RHT), carried
by intrinsically photosensitive retinal ganglion cells (Brown et al., 2013). A secondary non-
photic input to the SCN is from gamma-aminobutyric (GABA) and neuropeptide-Y (NPY)

REBECCA NORTHEAST 25
containing neurons projecting from the intergeniculate leaflet (IGL) and serotonin (5-HT)
projections from the dorsal raphe nucleus (Edelstein & Amir, 1999; Morin et al., 2006).
A key output of the SCN for driving daily physiological rhythms is its spontaneous firing rate
(SFR), with increased firing rate occurring during the middle of the day as demonstrated in
vivo and in vitro (Belle et al., 2009; Houben et al., 2014). Daytime elevation in firing rate
occurs regardless of diurnal or nocturnality (Houben et al., 2009; Sato & Kawamura, 1984),
indicating that the behavioural outputs determining these states is regulated downstream
of the SCN. The firing rate is modulated by glutamatergic signals from the retina
depolarising the retinorecipient core neurons in the SCN which then propagate the signal
to the shell (Ebling, 1996). Specific manipulation of peak firing rate resets the phase of the
molecular clock demonstrating how the SFR mediates the phase of electrical rhythms in
correspondence to external light (Jones et al., 2015).
The most dense SCN efferent connections are to the adjacent subparaventricular zone
(SPVz), and other hypothalamic structures including the paraventricular nucleus (PVN), the
medial preoptic area, the dorsomedial hypothalamus (DMH) and the lateral hypothalamic
area (Watts et al., 1987; Saper, Lu, et al., 2005) (Fig 1.2). The SCN projects rostrally to the
preoptic area (including the organum vasculosum laminae terminalis (OVLT)), the lateral
septum, the subfornical organ (SFO) and the bed nucleus of the stria terminalis
(Abrahamson & Moore, 2001; Deurveilher et al., 2002) and caudally to the lateral
geniculate nucleus and nucleus of the solitary tract (NTS) (Kriegsfeld et al., 2004; Buijs et
al., 2014).
As well as efferent neuronal connections, the SCN is thought to convey phase through a
number of neurochemicals, including AVP, VIP and prokineticin 2 (PK2) (Fig 1.2). The AVP
receptor is present in many SCN output sites and pronounced daily rhythms are observed
in the synthesis of AVP in the SCN as well as circadian rhythms of AVP concentration in the
cerebral spinal fluid (Uhl & Reppert, 1986; Reppert et al., 1987; Kalsbeek et al., 2010). PK2
is a protein that induces smooth muscle contractions in the periphery (Li et al., 2001) but
also has been shown to be rhythmically produced in the SCN. The phase of this synthesis
rhythm is phase shifted by light pulses and microinjection of PK2 into the brain directly
affects locomotor activity in vivo (Cheng et al., 2002), indicating direct circadian effects.
RHYTHMS, SLEEP AND HOMEOSTASIS
26
PK2 receptor expression is dense in many known SCN efferent areas (Cheng et al., 2002,
2006). Therefore, through a potential combination of neuronal, peptidergic and volume
transmission, the SCN is able to impart time of day information to the rest of the brain in
order to mediate its effects on physiology and behaviour.
1.1.6 Circadian entrainment and behaviour
Mammals display 24 h rhythms in physiology and behaviour. These rhythms are primarily
driven by the SCN, however their outputs also feedback and influence SCN activity resulting
in continuous feedback loops of regulation. As described above, the phase of the SCN is set
by the external light dark (LD) cycle, which then goes on to set the phase of SCN output
processes ensuring the whole system remains in phase with the external environment.
Most mammals display an endogenous free-running clock period (Tau) that deviates
slightly from 24 h. Humans have a slightly long Tau of 24.3 (Czeisler et al., 1999), while mice
display a shorter Tau of around 23.6 h (Daan & Pittendrigh, 1976). As such, entrainment
through photic and non-photic zeitgebers are necessary for resetting of the endogenous
clock to exactly 24 h. For nocturnal rodents housed in constant darkness (DD),
administration of brief pulses of light (5-10 minutes) during the early part of their subjective
night delays the onset of subsequent activity rhythms the next day, and conversely, a light
pulse given in the latter half of their subjective night subsequently advances activity the
next day. In comparison, light exposure in the middle of the subjective day induces no such
phase shifts. Experiments such as these enable the generation of phase response curves,
therefore one can study the phase shifting effects of a certain zeitgeber in otherwise
constant conditions (Daan & Pittendrigh, 1976; Schwartz & Zimmerman, 1990). It is worth
noting that some behaviour can be mistaken for entrainment to light but is actually a
phenomenon called negative masking. Negative masking is light inducing direct
suppression of locomotor activity, hiding the natural rhythm of the animal (Mrosovsky,
1999). For example, Cry1/2 double knockout mice are completely arrhythmic in DD yet
confine all their activity to the dark cycle in LD, thus their locomotor activity is masked by
light (Okamura et al., 1999). Likewise VPAC2, knockout mice (Vipr2-/-) are masked by light,
shown by their by significantly advanced metabolic and feeding rhythms in LD and through
disrupted wheel-running behaviour in DD (Bechtold et al., 2008; Hughes & Piggins, 2008).
REBECCA NORTHEAST 27
Non-photic zeitgebers are also able to entrain the circadian clock; the most prominent of
which are feeding, locomotor activity and arousal. In contrast to photic stimuli, non-photic
zeitgebers induce a phase response curve with opposite phasing, i.e. exercise towards the
end of the subjective day advances the clock whereas exercise during the subjective night
has no effect (Edgar & Dement, 1991; Marchant & Mistlberger, 1996). Feeding availability
also has marked effects on circadian behaviour. In nocturnal rodents, restricting food
access to the middle of day alters SCN control of daily activity allowing the development of
anticipatory activity, thought to be controlled be a separate oscillator from the SCN.
Animals thus become separately entrained to both light and food (Mistlberger & Antle,
2011), to be discussed further in “1.3 Food entrainment”. Locomotor activity and feeding
are two of the main circadian outputs, while also being strong non-photic zeitgebers,
highlighting the output/input feedback nature of the circadian clock at a behavioural level.
1.1.7 Extra-SCN oscillators
Centrally, it is not just the SCN that contains autonomous clocks, many other brain regions
contain groups of cells capable of oscillating and generating circadian rhythms (Guilding &
Piggins, 2007). The generation of transgenic animals models with fluorescent or luciferase
reporters of core clock gene promotor activity has enabled easier study of these extra-SCN
oscillators through long-term confocal microscopy or real-time bioluminescence
monitoring of primary tissue explants (Yamazaki et al., 2000; Yoo et al., 2004). A
comprehensive study by Abe et al. looked at oscillations in a range of brain areas from the
Per1-luciferase (Per1-luc) rat and found 14 different areas to be rhythmic with at least one
oscillation in culture from 27 different brain regions, with the most robust structures being
the olfactory bulb (OB), the pituitary and the arcuate nucleus (Arc) (Abe et al., 2002). Since
then, there has been a multitude of studies investigating these extra-SCN oscillations using
a variety of techniques to assess circadian variation in bioluminescence, in vivo gene
expression, multi-unit activity (MUA) and whole-cell patch clamp recordings.
In mice, the two most well-known and arguably best studied independent oscillators
outside of the SCN are the OB and the retina. The OB shows strong autonomous rhythms
in bioluminescence (Miller et al., 2014), c-fos (Granados-Fuentes et al., 2006) and
demonstrates phase matched MUA and Per1 mRNA in vivo expression (Granados-Fuentes
RHYTHMS, SLEEP AND HOMEOSTASIS
28
et al., 2004). Furthermore, the OB displays in vivo rhythms in animals with SCN lesions
(Abraham et al., 2005), thus providing convincing evidence of an independent circadian
timer in this area. Circadian rhythms in the retina have been demonstrated in
photoreceptors from lower vertebrates (Acuña-Castroviejo et al., 2014) to mammals
(Dkhissi-Benyahya et al., 2013). The retinal clock has been shown to control rod-cone
coupling with much increased coupling at night (Ribelayga et al., 2008), and disrupting the
molecular clock in mice results in ocular diseases and abnormalities (Yang et al., 2016). An
independent retinal clock is therefore clearly important for gating responses to LD signals
and for the overall health in that area.
Rhythms in gene expression have been demonstrated in the prefrontal cortex of humans
(Chen et al., 2016) and animal models (Chun et al., 2015), with a phase shift in gene
expression between diurnal and nocturnal species highlighting local roles for such
behaviours. The orbitofrontal cortex in humans displays rhythms in clock controlled genes
and other transcripts involved in neuronal excitability (Chen et al., 2016). These studies
provide evidence for circadian control of cortical excitability, potentially playing an
important role in balancing homeostatic sleep pressure with circadian-driven arousal (to
be discussed in depth later in “1.2.4 Circadian regulation of sleep”).
As discussed, the SCN provides direct neuronal connections (primarily GABA, AVP and VIP-
ergic) to the PVN. Clock gene mRNA oscillations in the rat PVN peak in antiphase with those
of the SCN (Girotti et al., 2009; Chun et al., 2015). Interestingly, PVN clock gene phasing in
the diurnal grass rat, Arvicanthus niloticus, are in line with that of the SCN, unless they are
given access to a running wheel after which they become nocturnal and their PVN clock
genes shift to become in antiphase with no phase change observed in the SCN clock genes
(Martin-Fairey et al., 2015). This indicates a role for the local PVN clock in dictating diurnal
versus nocturnal activity rhythms as opposed to the SCN.
The medial basal hypothalamus (MHB) is an area implicated in metabolism and energy
balance and is composed of the Arc, ventromedial hypothalamus (VMH) and the DMH. All
of these MBH structures exhibit a degree of circadian rhythmicity in clock gene expression
and MUA (Guilding et al., 2009; Orozco-Solis et al., 2016; Parekh et al., 2018). The Arc is
the strongest oscillator in this region, with Per1/2 mRNA expression peaking early night in
REBECCA NORTHEAST 29
nocturnal animals, yet interestingly this rhythmicity is lost in animals with food access
limited to the light phase (Wang et al., 2017). Many of the behavioural and physiological
outputs of the Arc, such as regulating feeding behaviour, demonstrate circadian rhythms.
Thus, it is possible that local clocks in these areas are in-part responsible for the temporal
control of functional outputs.
The lateral habenula (LHb) is an important structure located in the epithalamus noted for
its role in many neural processes including depression, addiction and sleep (Bianco &
Wilson, 2009). Moderate circadian rhythms in clock gene expression, electrical activity and
bioluminescence in the LHb have been extensively reported (Baño-Otálora and Piggins,
2017). The LHb receives input from both the SCN and the retina, thus its possession of an
autonomous clock might act as an important gating mechanism in the extended circadian
system.
Two structures of note for thesis have also been reported to contain autonomous
clockwork, the OVLT and the NTS. The OVLT is primarily involved in fluid balance and has
been previously been reported to display modest rhythms in Per1 and Per2
bioluminescence (Abe et al., 2002; Abraham et al., 2005; Myung et al., 2018) and in vivo
Per3 mRNA rhythms (Takumi et al., 1998). The NTS is a hindbrain structure involved in
visceral reflexes and energy balance (Grill & Hayes, 2012). Clock gene rhythms in mRNA
were reported for this area showing altered phasing and amplitude in obese and
hypertensive rats (Herichová et al., 2007; Kaneko et al., 2009), indicating that molecular
rhythms in the NTS are responsive to disease states in its regulatory processes. In addition
to the areas already mentioned, there are many other brain areas, including the
hippocampus and the cerebellum, which also display circadian rhythmicity (Paul et al.,
2019). Extra-SCN oscillators are summarised in Figure 1.3.
Behavioural manipulations have been shown to alter the phase in culture of certain extra-
SCN oscillators. For example, scheduling the daily availability of food availability or food
deprivation itself alter the phase of median eminence/pars tuberalis, the hippocampus and
the olfactory bulb, but not that of the SCN (Guilding et al., 2009; Loh et al., 2015; Pavlovski
et al., 2018). Additionally, in the nucleus accumbens (NAc), an area involved in reward
processing, rhythms are less prevalent or damped in NAc cultures from animals resilient to

RHYTHMS, SLEEP AND HOMEOSTASIS
30
a learned helplessness protocol (Landgraf, Long, et al., 2016). This hints at separate role for
these oscillators in preferentially aligning their phase to different zeitgebers or affecting
oscillations through altered behaviour.
Figure 1.3 Extra-SCN oscillators. Sagittal section of a rodent brain displaying a summary of the best known extra-SCN oscillators. Red filled ovals represent areas considered to be master oscillators. Blue filled ovals represent oscillatory areas to have displayed endogenous rhythmicity (i.e. rhythmic in culture when separated from the SCN). Blue lined ovals represent areas which displayed rhythms intact with the SCN (i.e. by in vivo mRNA or in vivo MUA). Dashed lines represent non-neuronal areas. AMY=amygdala, ARC=arcuate nucleus, BNST=bed nucleus of the stria terminalis, CB=cerebellum, ChP=choroid plexus, DMH=dorsomedial hypothalamus, HPC=rostral hippocampus, LC=locus coeruleus, LH=lateral hypothalamus, LHb=lateral habenula, ME=median eminence, MHb=medial habenula, NAc=nucleus accumbens, NTS=nucleus of the solitary tract, OB=olfactory bulb, OVLT=organum vasculosum lamina terminalis, PVN=paraventricular nucleus, SCN=suprachiasmatic nuclei, SPZ=subparaventricular zone, VLPO=ventrolateral preoptic area.
1.1.8 Non-neuronal cells and circadian timekeeping
In addition to a dense population of neurons, the SCN is contains a population of astrocytes
and their role in circadian timekeeping has led to a string of publication detailing their
relationship with the SCN and rhythmic behaviour. Conditional deletion of Bmal1 in
astrocytes impacts wheel-running behaviour, and using genetic alterations to shorten the
period of the TTFL specifically in SCN astrocytes also shortened the period of in vivo
circadian rhythms (Barca-Mayo et al., 2017; Tso et al., 2017). Originally, it was thought that
the astrocyte molecular rhythms were “slaves” to resetting by the SCN (Prolo et al., 2005;
Barca-Mayo et al., 2017). However, Brancaccio et al. demonstrated that the re-introduction
of Cry1 into only the SCN astrocytes of Cry1/2 knockout mice rescued rhythms in

REBECCA NORTHEAST 31
bioluminescence and behaviour, indicating that the molecular clock in astrocytes alone is
sufficient to drive circadian rhythms (Brancaccio et al., 2019).
The choroid plexus (ChP) is a specialised monolayer of ependymal and epithelial cells found
lining the ventricles of the brain, primarily involved in the production of cerebral spinal fluid
(Brinker et al., 2014). Bioluminescence imaging revealed the ChP to have strong and
persistent oscillations ex vivo, which when co-cultured with the SCN, restored its typically
long period observed in culture to that matching the behavioural period of the animal
(Myung et al., 2018). These results provide further evidence of the roles in non-neuronal
cells as an integral component of the central circadian system.
1.1.9 Circadian rhythms and health
Maintaining phase alignment with the external environment is crucial for the optimal
health and well-being of an individual. This was first demonstrated by epidemiology studies
showing increased levels of cancer, metabolic disease and gastrointestinal disorders in shift
workers (Tynes et al., 1996; Knutsson, 2003). Subsequently, it has been discovered that
forced wakefulness outside your natural chronotype (i.e. waking up earlier on work days
than you would naturally on free days), termed social jet lag, is associated with metabolic
disease. The higher the degree of this social jetlag, the higher the risk of obesity and disease
promoting behaviours such as nicotine addiction (Wittmann et al., 2006; Roenneberg et
al., 2012). It is important to note that it can be hard to dissociate circadian misalignment
from the effects of sleep deprivation. Sleep deprivation can cause multiple health
problems, and so circadian misalignment and sleep deprivation could be considered to
have overlapping pathological mechanisms (Roenneberg & Merrow, 2016). For example,
acute sleep deprivation impairs glucose tolerance, while prolonged sleep disruption results
in increased risk for obesity (Nedeltcheva & Scheer, 2014) Furthermore, diseases ranging
from Alzheimer’s disease to bipolar disorder report sleep and circadian disruption as one
of the main presenting symptoms (Bradley et al., 2017; Saeed & Abbott, 2017). Thus, there
is clear interaction between the circadian and sleep systems in the progression of these
diseases.
RHYTHMS, SLEEP AND HOMEOSTASIS
32
One way in which circadian disruption can cause disease is proposed to arise from phase
misalignment whereby peripheral oscillators are separated from the SCN. For example, the
clock in the liver preferentially aligns its phase to meal times (Damiola et al., 2000), and
therefore one way by which to ensure robust circadian health could be through regular
meal timing. Indeed, one landmark study showed that mice fed a high fat diet did not gain
weight when food was only available during their active (dark) phase as well as showing
improved metabolic characteristics such as increased insulin sensitivity (Hatori et al., 2012).
This research has been translated into clinical metabolic disease studies with similar effects
on improved clinical outcomes even without weight loss (Sutton et al., 2018), highlighting
the potential impact of interventions aligning with the circadian system.
1.2 Sleep
1.2.1 Introduction
The majority of organisms exhibit some form of sleep like behaviour, spanning a wide range
of vertebrate and invertebrate species. Up until the early 20th century, sleep was
considered to be a consequence of low level activity in the brain and of little value to overall
physiology (Scammell et al., 2017). Yet perspectives have shifted rapidly, with a huge body
research revealing sleep to be a heavily regulated and complex process involving many
neurotransmitters and neural pathways, creating an altered brain state from waking that
has many roles and benefits. Among many other functions, sleep has been shown to
consolidate memories, enhance cognition and regulate mood and appetite (for review see
During & Kawai 2017). In 1982, Borbely proposed a “two process model” of sleep
regulation, whereby the homeostatic process (S) increases as a function of time spent
awake and the circadian process (C) is determined by the timing of sleep and wakefulness
(Fig 1.4) (Borbély, 1982; Borbély et al., 2016)
There is an immensely vast body of sleep research investigating many aspects from
neuroanatomy of sleep networks, synaptic mechanisms and global cortical regulation of
behaviour. This section will focus primarily on the current understanding of sleep
homeostasis and the circadian control of sleep.

REBECCA NORTHEAST 33
Figure 1.4 The two-process model of sleep regulation. Diagrammatic representation of the two-process model of sleep regulation over two days. Process S accumulates with the time spent awake, while process C remains constant with peak SCN activity in the middle of the day. Peak sleep pressure is considered to be at the greatest distance from process S to process C. Simulated sleep deprivation (red line) increases sleep pressure in an exponential manner with no change in process C. White boxes represent wake, black filled boxes represent sleep. Adapted from Borbély (1982) and Deboer (2018). .
1.2.2 Electroencephalogram
The gold standard approach for measuring sleep in mammals is the electroencephalogram
(EEG) and the electromyogram (EMG). Using these recordings, it is possible to classify brain
activity into three different states; wake, non-rapid eye movement sleep (NREM) and rapid
eye movement sleep (REM). Furthermore, EEG recordings allows power spectral analysis
which enables the in-depth investigation of cortical activity based on its frequency range.
Delta rhythms (frequency range 0.5-4 Hz) are commonly referred to as slow-wave activity
(SWA) and are most prominent during NREM sleep, associated with memory consolidation
and cognitive performance (Marshall et al., 2011; Ngo et al., 2013). SWA is also used as a
measure of preceding wake history for sleep homeostasis. Theta rhythms (4-9 Hz) are
evident predominantly during REM sleep and also can be observed during wake. They are
thought to be regulated by the hippocampus and have roles in episodic memory formation
and synaptic plasticity (Vertes, 2005). Theta power also increases as a result of active wake
and following sleep deprivation (Vyazovskiy & Tobler, 2005; Vassalli & Franken, 2017), and

RHYTHMS, SLEEP AND HOMEOSTASIS
34
is viewed as a hallmark of wake propensity (Borbély et al., 2016). Alpha rhythms (9-15 Hz)
are associated with quiet wakefulness and originate from thalamo-cortical networks
modulated by brainstem cholinergic input (Başar, 2012). Beta rhythms (15-30 Hz) are a key
hallmark of quiet waking but are also present during heightened states of alertness (Engel
& Fries, 2010). Gamma rhythms (30-120 Hz) are typically seen as low amplitude rhythms in
the EEG, associated with quiet wakefulness but are also enhanced with theta rhythms
during active wake (Buzsáki & Wang, 2012).
1.2.3 Sleep homeostasis
Unsurprisingly, staying awake for prolonged periods of time leads to considerable changes
in cortical network activity which must be offset by subsequent sleep or will lead to the
cognitive deficits associated with sleep deprivation (Van Dongen et al., 2011; Bellesi et al.,
2016). The drive to sleep can be conceptually described within the concept of homeostatic
regulation (Borbély et al., 2016). Many animal species have been shown to display sleep
homeostasis, suggesting that it is a fundamental phenomenon required for essential
functions (Allada & Siegel, 2008). As such, ‘Process S’ is thought to operate like an
hourglass timer, increasing sleep drive as a function of time spent awake (Fig 1.4). It is
possible to assess the level of sleep-wake history through EEG delta power in NREM sleep,
also referred to as SWA. SWA increases in proportion to the time spent awake and
decreases exponentially during subsequent sleep (Tobler & Borbély, 1986; Vyazovskiy et
al., 2007; Guillaumin et al., 2018). In addition to SWA, EEG theta power has been proposed
to serve as a marker for sleep homeostasis from studies demonstrating that theta power
increases during enforced and active wakefulness and could predict the rise of SWA in
subsequent sleep periods (Finelli et al., 2000; Vyazovskiy & Tobler, 2005; Vassalli &
Franken, 2017).
In addition to global sleep homeostasis, it has been shown that homeostasis can also occur
at a “local” level whereby discrete cortical regions display SWA even though the animal is
still awake (Vyazovskiy, Olcese, et al., 2011; Einstein et al., 2017). One study by Fischer and
colleagues revealed a cortical and neuronal downstate occurring during wheel running in
mice, and that the faster the animals wheel-ran, the further this decrease in neuronal
activity (Fisher et al., 2016). Furthermore, localised brain regions that display higher activity
REBECCA NORTHEAST 35
during wake, demonstrated increased SWA during subsequent sleep (Ferrarelli et al., 2007;
Vyazovskiy, Cirelli, et al., 2011), highlighting the local control of sleep networks in the brain.
Sleep homeostasis is a fundamental process and appears to be robust to external
perturbations. Chronic sleep fragmentation induced robust sleep homeostatic mechanisms
in mice (Olini et al., 2017), and computational models for process S dynamics were resilient
to extrinsic factors (such as the introduction of complex wheels) in predicting real-world
interactions (Guillaumin et al., 2018). Furthermore, a 5-day chronic sleep restriction
protocol in rats demonstrated an immediate loss of SWA during recovery sleep, which was
then compensated for the following day, thus indicating intact sleep homeostasis
(Leemburg et al., 2010). Aging is related to cognitive decline as well as associated changes
in sleep-wake architecture and sleep characteristics (Morrison & Baxter, 2012; Panagiotou
et al., 2017). Despite this, sleep homeostasis at the cortical and neuronal level appears to
be robust in aging animals following sleep deprivation (McKillop et al., 2018). There are
some cases where homeostasis is not preserved, for example one group showed that a
paradigm of chronic social stress in mice caused a decrease in SWA following deprivation,
providing indications of why stress can lead to sleep disturbances (Olini et al., 2017).
One candidate for the role of a chemical mediator in sleep homeostasis is adenosine.
Adenosine increases in the basal forebrain following sleep deprivation and subsequently
declines during recovery sleep (Porkka-Heiskanen et al., 2000; Kalinchuk et al., 2011).
Further evidence for the role of adenosine is the wake promoting action of caffeine acting
as an antagonist at the adenosine A2 receptors (Huang et al., 2005), thus highlighting a
critical function for adenosine in the regulation of sleep homeostasis. Nitric oxide (NO) is
also thought to be involved in the local regulation of sleep homeostasis, demonstrated by
neuronal nitric oxide synthase knockout mice displaying reduced SWA following sleep
deprivation (Morairty et al., 2013) and that infusions of NO synthase inhibitors abolished
NREM recovery sleep following sleep deprivation (Kalinchuk et al., 2006).
1.2.4 Circadian regulation of sleep
As previously discussed, when left in constant conditions organisms from flies to humans
display strong endogenous wake-sleep rhythms that maintain a relatively constant period
RHYTHMS, SLEEP AND HOMEOSTASIS
36
at roughly 24 h, highlighting the interaction between sleep and circadian rhythm processes.
The circadian regulation of sleep, ‘Process C’, is simplistically the determination of sleep
propensity across a 24h day regardless of the amount of prior wakefulness (Fig 1.4). Studies
in humans subjected to a forced desynchrony protocol of a 28 h rest-activity cycle,
demonstrated that the consolidated sleep only occurred when in phase with body
temperature but that SWA did not change with circadian modulation (Dijk & Czeisler, 1994,
1995). Evidence for the role of the SCN in the control of circadian timing of sleep comes
from initial SCN lesion (SCNx) studies where robust 24 h rhythms of wake and sleep were
flattened and the animals displayed high levels of vigilance state transitioning between
NREM, REM and sleep with limited consolidated episodes (Eastman et al., 1984;
Mistlberger et al., 1987). SCNx studies in rats demonstrated that sleep homeostasis
appeared to be intact with total sleep time remaining unchanged and SWA increasing as
expected with previous wake duration (Eastman et al., 1984; Mistlberger et al., 1987). In
contrast, studies of SCNx in squirrel monkeys (Edgar et al., 1993) and mice (Easton et al.,
2004) showed these animals to have an increased total sleep time over 24 h, indicating that
the SCN might display some control over the sleep homeostat through alterations in the
balance of its output signal.
Many studies have been carried out using clock gene mutant mice in an attempt to dissect
the role that the molecular clock plays in the regulation of sleep. An investigation by Wisor
and colleagues on the Cry1-/-Cry2-/-double knockout mice revealed these mice to spend
increased time in NREM, with longer consolidated episodes of NREM as well as an increase
in SWA during baseline recordings and sleep deprivation. This result was surprising as
increased time spent asleep should lower sleep pressure, yet these mice accrue higher
levels of sleep pressure during wake in comparison to wild-types, indicating that the
absence of Cry proteins leads to altered sleep homeostasis (Wisor et al., 2002). In contrast,
Per1-/-Per2-/- double knockout mice demonstrated no change in total sleep amount under
LD and DD conditions, with also no alterations in SWA following sleep deprivation (Kopp et
al., 2002; Shiromani et al., 2004). Bmal1-/- knockout mice, displayed an increase in total
sleep time with highly fragmented sleep patterning and an increased SWA during baseline
conditions, but displayed a reduction in SWA following sleep deprivation (Laposky et al.,
2005), thus highlighting a strong role for Bmal1 in sleep homeostasis. Clock mutant mice

REBECCA NORTHEAST 37
also have a sleep phenotype, with total sleep amount reduced and NREM sleep bout
duration shortened both in LD and DD, but as with the Cry1-/-Cry2-/- double knockout mice,
no change in SWA was observed following sleep deprivation (Naylor et al., 2000). Mice
deficient in the forebrain dominant analogue of Clock, NPAS2, have increased wake time
during the dark period with changes in EEG delta activity and display a reduction in the
amount of recovery sleep following sleep deprivation in male mice (Franken et al., 2006).
Therefore, the molecular clock is in part required for intact sleep homoeostasis.
Interestingly however, Per1 and Per2 mRNA was increased in the cortex following sleep
deprivation in mice (Wisor et al., 2008), and Per2 expression was increased in the forebrain
in correlation with the amount of time spent awake with a proportional decrease in Dbp
(Franken et al., 2007). Thus, Per2 expression in the cortex increased with sleep need.
Conversely, Per2 expression in the SCN is not affected by previous sleep-wake history or
sleep deprivation (Masubuchi et al., 2000; Curie et al., 2015). The mechanism behind this
change in clock gene expression in the cortex following sleep deprivation is thought to be
due to Per2 transcription by NPAS2 (a CLOCK homologue which is more prevalent in the
cortex then in the SCN (Zhou et al., 1997)), as Npas2-/- knockout mice do not display an
increase in Per2 in the cortex following sleep deprivation (Franken et al., 2006), thus NPAS2
over CLOCK appears necessary in mediating Per2 transcription to align with the sleep-wake
distribution in the forebrain.
1.2.5 Neuroanatomy of sleep
Several discrete neuronal populations are thought to regulate arousal and the wake-
associated cortical desynchrony. Ascending pathways from the rostral pons to the
thalamus via the forebrain mediate arousal and can be separated into two routes. The first
branch initiates in acetylcholine producing cells in the pedunculopontine (PPT) and
laterodorsal tegmental (LDT) nuclei, providing excitatory projections to the thalamus
where they play a critical role in gating thalamocortical transmission (Hallanger et al., 1987;
Saper et al., 2001). This pathway is most active during wakefulness and REM sleep
indicating high levels of cortical activation during these states (Levey et al., 1987; Strecker
et al., 2000). The second branch initiates from monoaminergic regions in the caudal
hypothalamus and the upper brainstem including the dopaminergic ventral periaqueductal
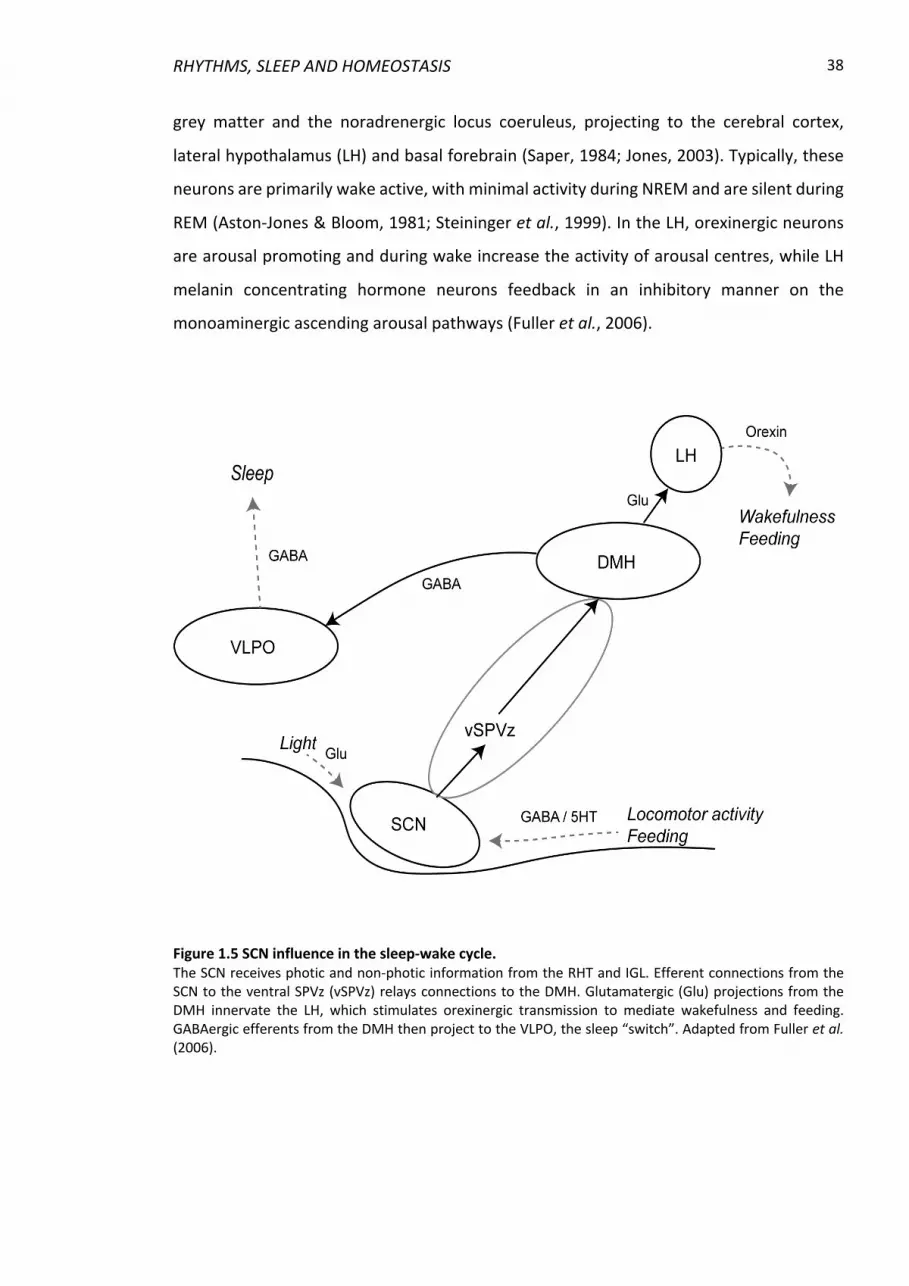
RHYTHMS, SLEEP AND HOMEOSTASIS
38
grey matter and the noradrenergic locus coeruleus, projecting to the cerebral cortex,
lateral hypothalamus (LH) and basal forebrain (Saper, 1984; Jones, 2003). Typically, these
neurons are primarily wake active, with minimal activity during NREM and are silent during
REM (Aston-Jones & Bloom, 1981; Steininger et al., 1999). In the LH, orexinergic neurons
are arousal promoting and during wake increase the activity of arousal centres, while LH
melanin concentrating hormone neurons feedback in an inhibitory manner on the
monoaminergic ascending arousal pathways (Fuller et al., 2006).
Figure 1.5 SCN influence in the sleep-wake cycle. The SCN receives photic and non-photic information from the RHT and IGL. Efferent connections from the SCN to the ventral SPVz (vSPVz) relays connections to the DMH. Glutamatergic (Glu) projections from the DMH innervate the LH, which stimulates orexinergic transmission to mediate wakefulness and feeding. GABAergic efferents from the DMH then project to the VLPO, the sleep “switch”. Adapted from Fuller et al. (2006).

REBECCA NORTHEAST 39
The ventrolateral preoptic nucleus (VLPO), characterised by a dense cluster of GABAergic
neurones and a more diffuse extended area, is considered to be the “switch” for wake to
sleep states, inhibiting the aforementioned arousal circuits during sleep (Sherin et al., 1996;
Szymusiak et al., 1998). The extended area primarily contains outputs to the locus
coeruleus and the dorsal raphe nucleus which are involved in regulating REM sleep,
whereas the cluster region outputs to histaminergic neurones which are thought to help
the transition between arousal and NREM sleep (Lu et al., 2002; Ko et al., 2003). The
circadian influence in this system arises from the SCN relaying information to the DMH via
the SPVz, which contains GABAergic neurons projecting to the VLPO and glutamatergic
neurons projecting to the LH, thus influencing sleep and wake (Saper, Scammell, et al.,
2005). The SCN receives external cues such as photic information, locomotor activity and
feeding and then integrates them in order to promote arousal or sleep (Fig 1.5).
1.3 Food Entrainment
1.3.1 Food anticipatory activity
In addition to photic entrainment through LD cycles and non-photic entrainment through
exercise and arousal, there is one other primary entrainment stimulus that has a major
impact on circadian behaviour; food. Moreover, the ability to predict the timing of food
availability is paramount for survival and is a clear trait that has evolved in many species.
In 1921 it was observed that when only fed once a day, rats exhibit increased locomotor
activity prior to mealtime (Richter, 1922). In nocturnal rodents when food availability is
restricted to their inactive phase, these animals become active several hours before meal-
time; a phenomenon referred to as food anticipatory activity (FAA) (Stephan, 1997). As well
as locomotor activity, FAA can be observed in anticipatory increases in body temperature
rhythms, cortisol and in learnt behaviours such as lever pressing (Boulos et al., 1980;
Honma et al., 1984; Nelson & Halberg, 1986). One important observation is that exposure
of a running-wheel enhances the appearance of FAA, proposed to be due to increased
recruitment of reward pathways (Figure 1.6) (Flôres et al., 2016).
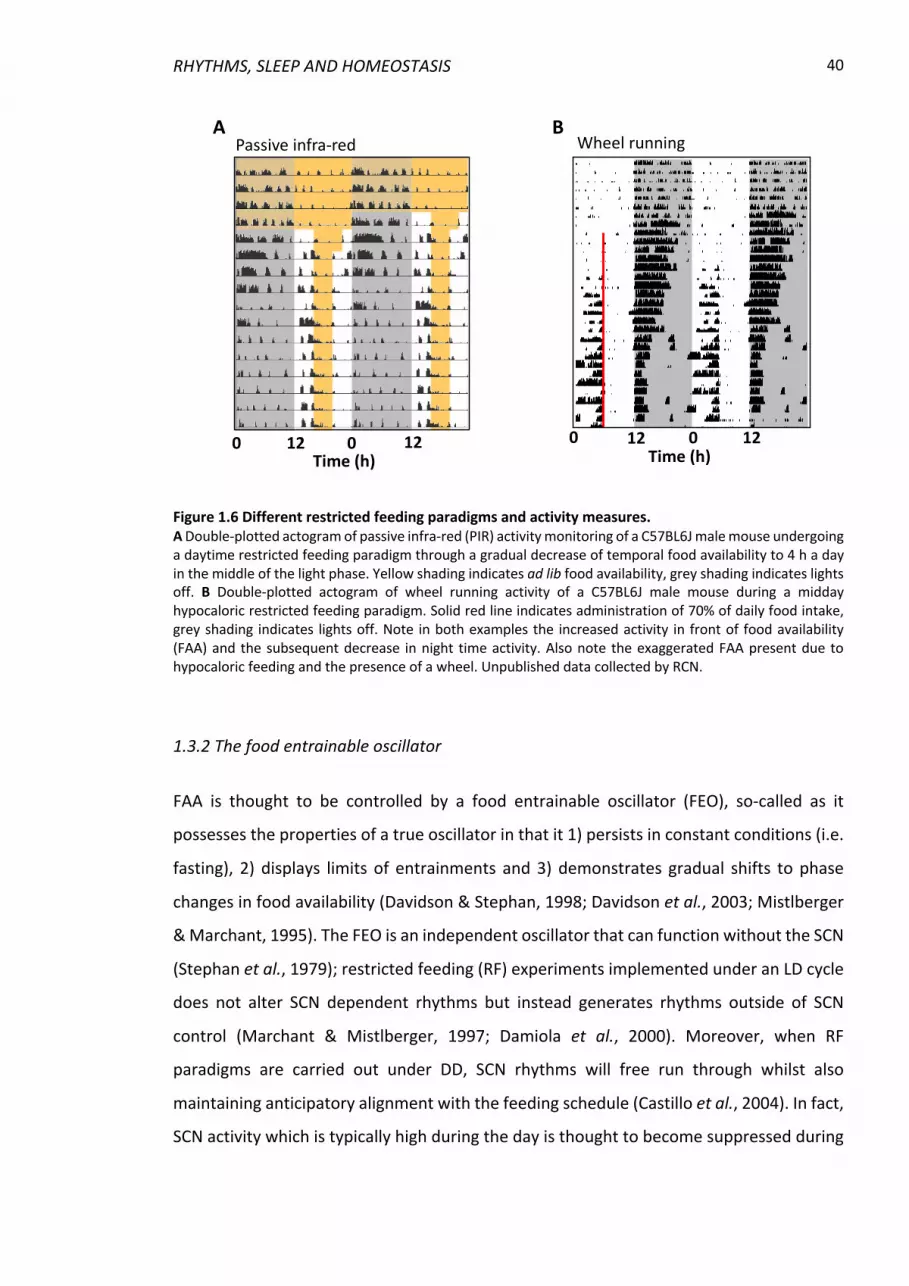
RHYTHMS, SLEEP AND HOMEOSTASIS
40
Figure 1.6 Different restricted feeding paradigms and activity measures. A Double-plotted actogram of passive infra-red (PIR) activity monitoring of a C57BL6J male mouse undergoing a daytime restricted feeding paradigm through a gradual decrease of temporal food availability to 4 h a day in the middle of the light phase. Yellow shading indicates ad lib food availability, grey shading indicates lights off. B Double-plotted actogram of wheel running activity of a C57BL6J male mouse during a midday hypocaloric restricted feeding paradigm. Solid red line indicates administration of 70% of daily food intake, grey shading indicates lights off. Note in both examples the increased activity in front of food availability (FAA) and the subsequent decrease in night time activity. Also note the exaggerated FAA present due to hypocaloric feeding and the presence of a wheel. Unpublished data collected by RCN.
1.3.2 The food entrainable oscillator
FAA is thought to be controlled by a food entrainable oscillator (FEO), so-called as it
possesses the properties of a true oscillator in that it 1) persists in constant conditions (i.e.
fasting), 2) displays limits of entrainments and 3) demonstrates gradual shifts to phase
changes in food availability (Davidson & Stephan, 1998; Davidson et al., 2003; Mistlberger
& Marchant, 1995). The FEO is an independent oscillator that can function without the SCN
(Stephan et al., 1979); restricted feeding (RF) experiments implemented under an LD cycle
does not alter SCN dependent rhythms but instead generates rhythms outside of SCN
control (Marchant & Mistlberger, 1997; Damiola et al., 2000). Moreover, when RF
paradigms are carried out under DD, SCN rhythms will free run through whilst also
maintaining anticipatory alignment with the feeding schedule (Castillo et al., 2004). In fact,
SCN activity which is typically high during the day is thought to become suppressed during
0 12 0 12Time (h)
T I M E O F D A Y
1 9 7 1 9 77
W T 3 . 1
D A T E
2 0 1 5
6 / 2 9
7 / 3
7 / 8
7 / 1 3
7 / 1 8
7 / 2 3
7 / 2 8
8 / 2
8 / 7
8 / 1 2
8 / 1 7
8 / 2 2
4 . 6 2 1 8 . 7 2 3 4 . 6 2 4 5 . 4 0
0 12 0 12Time (h)
A BPassive infra-red Wheel running
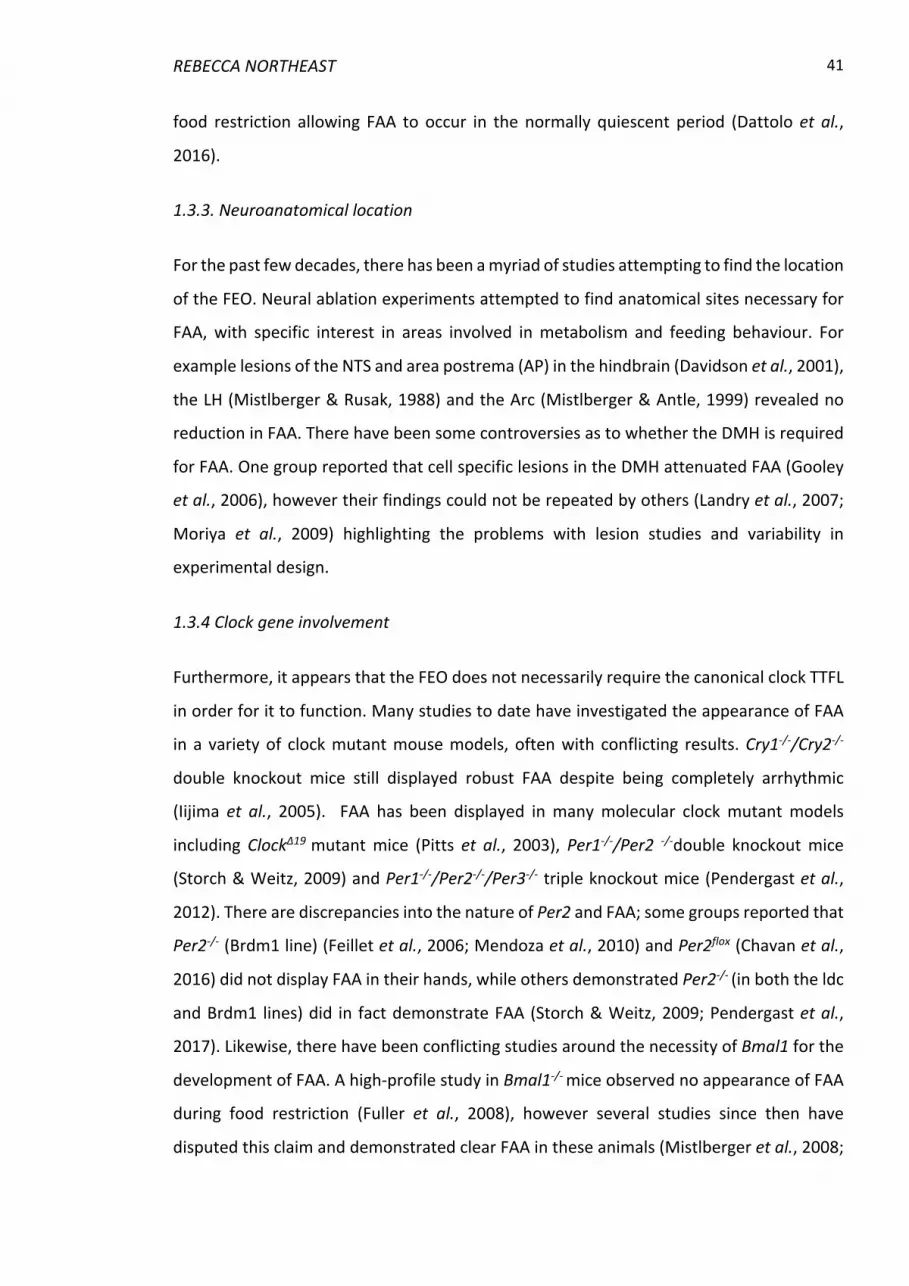
REBECCA NORTHEAST 41
food restriction allowing FAA to occur in the normally quiescent period (Dattolo et al.,
2016).
1.3.3. Neuroanatomical location
For the past few decades, there has been a myriad of studies attempting to find the location
of the FEO. Neural ablation experiments attempted to find anatomical sites necessary for
FAA, with specific interest in areas involved in metabolism and feeding behaviour. For
example lesions of the NTS and area postrema (AP) in the hindbrain (Davidson et al., 2001),
the LH (Mistlberger & Rusak, 1988) and the Arc (Mistlberger & Antle, 1999) revealed no
reduction in FAA. There have been some controversies as to whether the DMH is required
for FAA. One group reported that cell specific lesions in the DMH attenuated FAA (Gooley
et al., 2006), however their findings could not be repeated by others (Landry et al., 2007;
Moriya et al., 2009) highlighting the problems with lesion studies and variability in
experimental design.
1.3.4 Clock gene involvement
Furthermore, it appears that the FEO does not necessarily require the canonical clock TTFL
in order for it to function. Many studies to date have investigated the appearance of FAA
in a variety of clock mutant mouse models, often with conflicting results. Cry1-/-/Cry2-/-
double knockout mice still displayed robust FAA despite being completely arrhythmic
(Iijima et al., 2005). FAA has been displayed in many molecular clock mutant models
including ClockΔ19 mutant mice (Pitts et al., 2003), Per1-/-/Per2 -/-double knockout mice
(Storch & Weitz, 2009) and Per1-/-/Per2-/-/Per3-/- triple knockout mice (Pendergast et al.,
2012). There are discrepancies into the nature of Per2 and FAA; some groups reported that
Per2-/- (Brdm1 line) (Feillet et al., 2006; Mendoza et al., 2010) and Per2flox (Chavan et al.,
2016) did not display FAA in their hands, while others demonstrated Per2-/- (in both the ldc
and Brdm1 lines) did in fact demonstrate FAA (Storch & Weitz, 2009; Pendergast et al.,
2017). Likewise, there have been conflicting studies around the necessity of Bmal1 for the
development of FAA. A high-profile study in Bmal1-/- mice observed no appearance of FAA
during food restriction (Fuller et al., 2008), however several studies since then have
disputed this claim and demonstrated clear FAA in these animals (Mistlberger et al., 2008;
RHYTHMS, SLEEP AND HOMEOSTASIS
42
Storch & Weitz, 2009; Takasu et al., 2012). One possibility for the lack of FAA in the original
study is potentially due to these mice having poor overall health and the fact that there
was no gradual introduction of food availability which could result in the animals being too
unwell to demonstrate FAA.
There is some evidence for the necessity of the molecular in the development of FAA.
Delezie et al. (2016) demonstrated that global and nervous system specific Rev-erbα-/-
knockout mice had attenuated total FAA, while Npas2-/- knockout mice showed a significant
delay in the development of FAA (Dudley et al., 2003). However, altogether the vast
majority of studies demonstrate that the FEO operates outside the canonical clock TTFL.
1.3.5 Food anticipation and energy balance
When food availability is limited to the rest phase, rodents preferentially align the phase of
their peripheral oscillators in organs such as the stomach, liver and pancreas to that of meal
times, while the SCN phase remains to that of the LD cycle (Damiola et al., 2000; Stokkan
et al., 2001; Schibler et al., 2003). The mechanism behind the separation of these
peripheral rhythms from the SCN has been investigated by Chambon and colleagues. They
showed that during daytime restricted feeding, peroxisome proliferator-activated receptor
α (PPARα) and glucagon receptors are activated by hyperinsulinemia leading to aberrant
expression of Per1 and Per2 and resulting in an untimely repression of Bmal1. This then
gives rise to a 12-hour shift in the phase of the peripheral clocks (Mukherji, Kobiita, &
Chambon, 2015). As the SCN does not contain these metabolic sensing receptors, it is
insensitive to the phase shifting effects of restricted feeding thus creating a misalignment
between the SCN and peripheral clock rhythms. The same group also showed that long
term RF during the inactive phase initiates many metabolic syndrome-like phenotypes in
mice such as insulin insensitivity and hypercholesterolemia (Mukherji, Kobiita, Damara, et
al., 2015). This highlights one possible mechanistic pathway of how shift-work and a
misaligned feeding schedule leads to metabolic syndrome in humans; a phenomenon
which has previously been poorly understood.
An interesting observation by Chavan et al. showed that the loss of Per2 in the liver, not in
the brain, was responsible for attenuated FAA, and that this could be rescued through the
REBECCA NORTHEAST 43
peripheral injection of ketone bodies (Chavan et al., 2016). This indicates a role for
peripheral metabolic signals interacting with the clock for generation of FAA, although their
results must be interpreted with caution due to findings from others demonstrating Per2
is not required for FAA as previously discussed. Additionally, there has been interest in the
role of metabolic hormones and receptors with leptin deficient mice (ob/ob-/-) (Ribeiro et
al., 2011), melanocortin receptor knockout mice (Mc4r-/-) (Sutton et al., 2008) and melanin-
concentrating hormone receptor knockout mice (Mchr1-/-) (Zhou et al., 2005) all displaying
normal FAA. Some studies demonstrated that ghrelin receptor knockout mice (Ghsr-/-) had
attenuated FAA (Blum et al., 2009; LeSauter et al., 2009) whereas mice lacking the
precursor for ghrelin, preproghrelin (Szentirmai et al., 2010) and mice that lacked the
ghrelin ligand (-/-) (Gunapala et al., 2011) displayed normal FAA. This indicates that ghrelin
signalling has a potential role in modulating the expression of FAA.
Overall, FAA is a robust behavioural phenomenon enabling animals to seek food when
limited to outside of typical feeding times. The current consensus is that the FEO is a true
circadian oscillator, outside of SCN control, made up of a complex network of neural and
peripheral metabolic signals.
1.4 The Lamina Terminalis
1.4.1 Introduction to the circumventricular organs
There are three sensory circumventricular organs (CVOs) in the brain: the subfornical organ
(SFO) and the organum vasculosum lamimae terminalis (otherwise referred to as the
vascular organ of the lamina terminalis; OVLT) are positioned along the wall of the third
ventricle, while the area postrema (AP) is adjacent to the fourth ventricle (Oldfield &
McKinley, 2015). The SFO and OVLT, together with the intermediary median preoptic
nucleus, make up the lamina terminalis and are involved in the central control of water
balance and drinking behaviours. The AP is located in the hindbrain and plays a role in
cardiovascular functions and visceral reflexes, processes which will be discussed later in
this section.
RHYTHMS, SLEEP AND HOMEOSTASIS
44
CVOs are highly vascularised midline structures with specialised vascular arrangements and
morphology with fenestrated endothelial cells due to a lack of tight junction complexes
(Duvernoy & Risold, 2007; Morita & Miyata, 2012). As such, one of the main characteristics
of CVOs is their lack of a blood brain barrier (BBB), and this allows bidirectional movement
of circulating substances. Consequently, CVOs are often referred to as the “windows of the
brain” due to their capacity to sense and interact with blood borne molecules (Gross et al.,
1987). The ventricular surfaces of these structures contain specialised ependymal cells of
elongated and columnar appearance (as opposed to the regular cuboidal shape on the rest
of the ventricular surface), with a high density of tight junctions between the adjacent
ependymal cells (Morita & Miyata, 2012). These specialised ependymal cells also display
tanycyte-like properties due to their possession of long processes that reach the
fenestrated capillary network (Fig 1.7) (Langlet et al., 2013). Circulatory injected marker
molecules such as Evans blue dye or horseradish peroxidase are therefore contained within
these CVOs, meaning that the BBB function of the capillary endothelium has been
transferred to the ependyma (Krisch et al., 1978; Langlet et al., 2013). The ‘sensory’ CVOs
are so called due to the presence of nerve cell bodies, while the ‘secretory’ CVOs; the pineal
gland, subcommissural organ and median eminence, possess similar features to the
sensory CVOs but are lacking in nerve cell bodies. Of note, the median eminence and area
postrema contain fewer endothelial tight junctions than the other CVOs, allowing greater
bidirectional movement of polar molecules from their interstitium (McKinley et al., 2003).
The choroid plexus is also considered a secretory CVO and will be covered in more depth
later in this section.

REBECCA NORTHEAST 45
Figure 1.7 Anatomy of the OVLT and SFO. The OVLT and SFO are located at either end of the lamina terminalis. The OVLT sits dorsal to the optic chiasm (OC), with specialised tannycyte-like cells surrounding the third ventricle (3V) with processes extending to the fenestrated capillaries in the capillary plexus (CP). Surrounding the CP is the lateral zone (LZ) characterised by extensive glial fibrillary acid protein (GFAP) positive astrocytes and capillaries with endothelial tight junction proteins. The SFO sits in the 3V, below the ventral hippocampal commissure (VHC). The SFO contains a ventromedial core (VC) with fenestrated capillaries, the lining to the third ventricle is composed of tanycyte-like cells with processes to the fenestrated capillaries. The outer shell (OS) is composed of GFAP positive astrocytes and capillaries with endothelial tight junction proteins. The ChP is continuous with the ependymal layer of the SFO. White ovals represent capillaries, orange and blue lines indicate the presence of tight-junction proteins claudin-1, occludin, and zona occludens (ZO)-1.
1.4.2 The subfornical organ
The subfornical organ is located ventral to the hippocampal commissure on the anterior
wall of the third ventricle and its ventral stalk connects the MnPO as part of the lamina
terminalis. Here, the lateral and third ventricle choroid plexuses converge, and the choroid
epithelium becomes continuous with the SFO ependyma (Pócsai & Kálmán, 2015). The
vascular supply comes from branches of the subfornical artery and creates an extensive
network of capillaries containing fenestrated and non-fenestrated endothelial cells, leading
RHYTHMS, SLEEP AND HOMEOSTASIS
46
to a large peri-vascular space for the bidirectional movement of molecules (Duvernoy &
Risold, 2007; Morita & Miyata, 2012). Broadly speaking, the SFO can be divided into two
components, the ventromedial core and an outer shell (Fig 1.7). The shell contains the
majority of the efferent fibres of the SFO, whereas the core neurons project mainly to the
BNST (McKinley et al., 2003). The subfornical organ is highly populated with perivascular
glia, which play an important role in maintaining the glio-vascular-neuronal coupling that
is integral to the function of the SFO (Pócsai & Kálmán, 2015). In particular, astrocyte
endfeet form a matrix of processes which overlay the surface of the capillary endothelium
to form a vital complex of the BBB (Kacem et al., 1998), these glia are important in
maintaining the barrier between the SFO and the rest of the hippocampal commissure
(Morita et al., 2016; Pócsai & Kálmán, 2015).
The majority of the afferent connections to the SFO originate from the MnPO (Saper &
Levisohn, 1983) and the OVLT (Lind et al., 1982); and key players in the central role of water
homeostasis along with the SFO. Many other brain areas also display afferent connections
to the SFO, of note two key areas involved in metabolic regulation, the mediobasal
hypothalamus (Lind et al., 1982) and the NTS (Kawano & Masuko, 2001), also project to the
SFO.
There are three main efferent neuronal pathways from the SFO, connecting to the MnPO,
OVLT and the supraoptic nucleus (SON) (Miselis et al., 1979). In addition and of note, the
SFO has been found to project to the PVN and the SCN (Kawano & Masuko, 2010; Swanson
& Lind, 1986). The magnocellular neurones of the PVN and SON are the main sites of AVP
secretion release into the blood via the anterior pituitary gland, a vital process in the
maintenance of blood pressure and water homeostasis (Miselis, 1981).
1.4.3 The organum vasculosum laminae terminalis
The OVLT is located on the ventral part of the anterior wall of the third ventricle,
immediately dorsal to the optic chiasm. The MnPO and the diagonal band of Broca are
adjacent to its lateral edges, with the MnPO also located immediately dorsal. The OVLT
forms the ventral pole of the lamina terminals, in continuum with the MnPO and then
ending at the dorsal pole with the SFO (Oldfield & McKinley, 2015). The SFO and OVLT
REBECCA NORTHEAST 47
originate from the same neural tube during development, therefore these two structures
share similar properties and features (Kiecker, 2018). The most prominent feature of the
OVLT is a rich vascular plexus descending from the preoptic artery that compartmentalises
the OVLT into an internal zone, the capillary plexus, and a lateral zone (Fig 1.7). As per the
SFO, the OVLT contains many glial cells, neurons and capillary loops surrounded by
perivascular spaces which extend to the ependyma (Prager-Khoutorsky & Bourque, 2015).
The ventricle surface and boundaries of the OVLT are lined by specialised tanycyte-like
ependymal cells which contain many tight junctions and act as the BBB (Langlet et al.,
2013).
The OVLT receives neuronal connections from the SFO and the MnPO within the lamina
terminalis (Saper & Levisohn, 1983), as well as AVP fibres from the SCN (Buijs, 1978).
Additionally, there are reciprocal efferent connections to the SFO and OVLT within then
lamina terminalis (Gu & Simerly, 1997) and also direct neuronal connections from the OVLT
to SON and PVN magnocellular neurons as part of the AVP secretion pathway in response
to changes in osmolality (McKinley et al., 2004).
1.4.6 The choroid plexus
The choroid plexus (ChP) is a non-neuronal secretory tissue responsible for the production
of cerebrospinal fluid (CSF) in the brain. The ChP is a located in each ventricle of the brain
and its development and integrity is essential to the maintenance of the central nervous
system (Lehtinen et al., 2013). As per other secretory CVOs, the ChP is a highly vascularised
tissue filled with fenestrated capillaries, surrounded by a monolayer of cuboidal epithelial
cells with extensive tight junctions, thus forming the blood-CSF barrier (Lun et al., 2015).
During sleep, the ChP increases production of flow rate of CSF and metabolite clearance is
massively enhanced, providing a vital restorative process in healthy brain function (Xie et
al., 2013).
1.4.5 The SFO and OVLT in the central control of water balance
The SFO and OVLT play key roles in the central control of osmotic homeostasis. Thirst is
perceived by the anterior cingulate cortex (ACC) and the insular cortex (IC) in the forebrain
whenever there is an increase in extra-cellular fluid (ECF) sodium concentration or
RHYTHMS, SLEEP AND HOMEOSTASIS
48
osmolality or a change in ECF volume that requires water intake to restore balance
(Gizowski & Bourque, 2017). The unique position of the SFO and OVLT lacking a BBB enables
them to detect circulating signals that correspond to alterations in water balance
(Zimmerman et al., 2017) and then signal to the ACC and IC via thalamic relay neurons to
promote thirst (Fig 1.8) (Hollis et al., 2008). Neurons in the SFO and OVLT express sodium
concentration sensitive cation channels which mediate alterations in excitability
(Watanabe et al., 2000; Amin et al., 2005; Miller & Loewy, 2013) with the SFO being the
main region in the brain for the control of salt intake behaviour (Hiyama et al., 2004). Glial
cells in the SFO and OVLT contain the Nax sodium sensing channel, and increased levels of
sodium activate metabolic pathways in the glial cells to produce more lactate which
subsequently activates neurons (Shimizu et al., 2007; Nomura et al., 2019).
In terms of osmotic thirst determined by ECF osmolality, lesions studies identified the OVLT
and MnPO (Buggy & Jonhson, 1977; Mangiapane et al., 1983) but not the SFO (Kucharczyk
et al., 1976) in the lamina terminalis as a crucial site for the stimulation of thirst following
a hyperosmotic stimulus, despite neurons in the SFO demonstrating intrinsic
osmosensitivity (Anderson et al., 2000) and increased c-fos expression in response to
systemic hypertonicity (Hollis et al., 2008). This indicates that the SFO is involved in osmotic
thirst but, unlike the OVLT, it is not essential for its induction. Furthermore, an fMRI study
in humans demonstrated that systemic hypertonicity activated the ventral lamina
terminalis and the other previously identified thirst networks, the medial thalamus
projecting to the ACC and IC (Farrell et al., 2011).
Thirst can also be induced by hypovolaemia, which is most likely to occur through
haemorrhage or chronic water restriction leading to a decrease in ECF volume (Russell et
al., 1975; Morgan et al., 2004). Baroreceptors and volume receptors found in the peripheral
vasculature walls play well defined mechanisms in the detection of changes in blood
pressure and blood volume, leading to compensatory mechanisms to induce or suppress
thirst as needed (Stocker et al., 2002; Stricker & Sved, 2002). This link from vascular
detection of blood volume alteration to the neural thirst circuitry is unknown, but it is
thought to involve neurones in the NTS, parabrachial nucleus (PBN) and the ventrolateral
medulla (VLM) as they receive afferent inputs from peripheral pressure receptors and then
project axons to the MnPO and medial thalamus (Badoer et al., 1992; Thunhorst et al.,
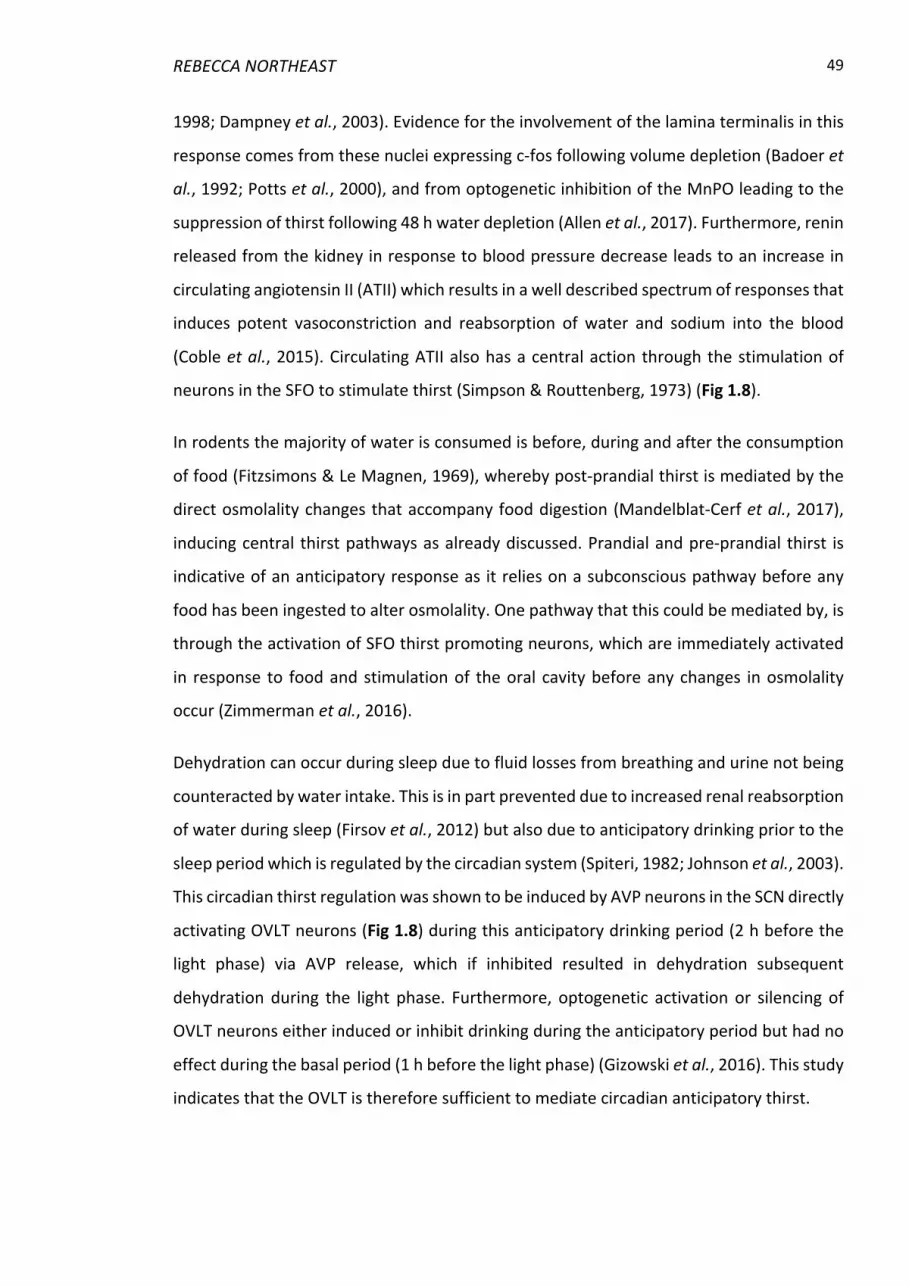
REBECCA NORTHEAST 49
1998; Dampney et al., 2003). Evidence for the involvement of the lamina terminalis in this
response comes from these nuclei expressing c-fos following volume depletion (Badoer et
al., 1992; Potts et al., 2000), and from optogenetic inhibition of the MnPO leading to the
suppression of thirst following 48 h water depletion (Allen et al., 2017). Furthermore, renin
released from the kidney in response to blood pressure decrease leads to an increase in
circulating angiotensin II (ATII) which results in a well described spectrum of responses that
induces potent vasoconstriction and reabsorption of water and sodium into the blood
(Coble et al., 2015). Circulating ATII also has a central action through the stimulation of
neurons in the SFO to stimulate thirst (Simpson & Routtenberg, 1973) (Fig 1.8).
In rodents the majority of water is consumed is before, during and after the consumption
of food (Fitzsimons & Le Magnen, 1969), whereby post-prandial thirst is mediated by the
direct osmolality changes that accompany food digestion (Mandelblat-Cerf et al., 2017),
inducing central thirst pathways as already discussed. Prandial and pre-prandial thirst is
indicative of an anticipatory response as it relies on a subconscious pathway before any
food has been ingested to alter osmolality. One pathway that this could be mediated by, is
through the activation of SFO thirst promoting neurons, which are immediately activated
in response to food and stimulation of the oral cavity before any changes in osmolality
occur (Zimmerman et al., 2016).
Dehydration can occur during sleep due to fluid losses from breathing and urine not being
counteracted by water intake. This is in part prevented due to increased renal reabsorption
of water during sleep (Firsov et al., 2012) but also due to anticipatory drinking prior to the
sleep period which is regulated by the circadian system (Spiteri, 1982; Johnson et al., 2003).
This circadian thirst regulation was shown to be induced by AVP neurons in the SCN directly
activating OVLT neurons (Fig 1.8) during this anticipatory drinking period (2 h before the
light phase) via AVP release, which if inhibited resulted in dehydration subsequent
dehydration during the light phase. Furthermore, optogenetic activation or silencing of
OVLT neurons either induced or inhibit drinking during the anticipatory period but had no
effect during the basal period (1 h before the light phase) (Gizowski et al., 2016). This study
indicates that the OVLT is therefore sufficient to mediate circadian anticipatory thirst.
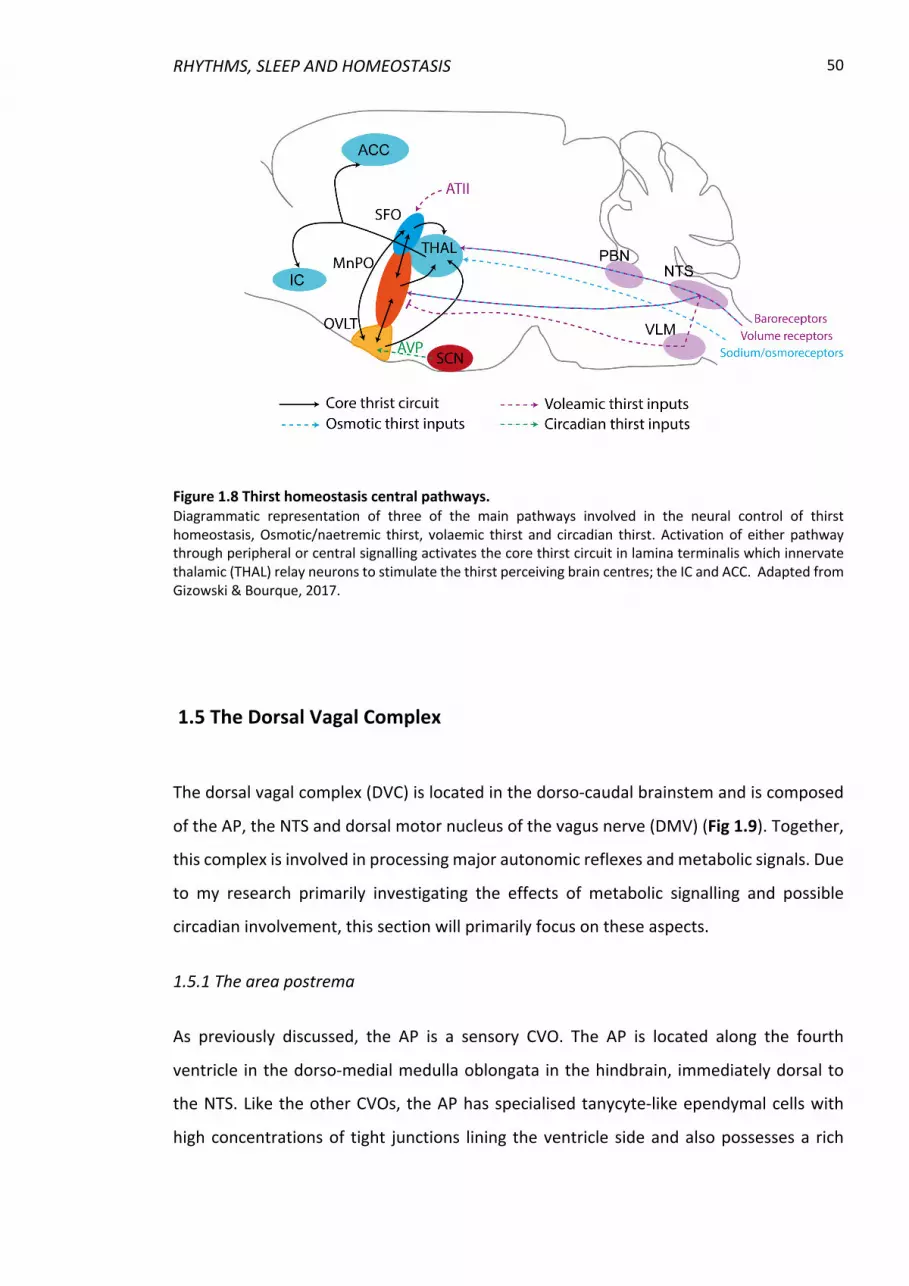
RHYTHMS, SLEEP AND HOMEOSTASIS
50
Figure 1.8 Thirst homeostasis central pathways. Diagrammatic representation of three of the main pathways involved in the neural control of thirst homeostasis, Osmotic/naetremic thirst, volaemic thirst and circadian thirst. Activation of either pathway through peripheral or central signalling activates the core thirst circuit in lamina terminalis which innervate thalamic (THAL) relay neurons to stimulate the thirst perceiving brain centres; the IC and ACC. Adapted from Gizowski & Bourque, 2017.
1.5 The Dorsal Vagal Complex
The dorsal vagal complex (DVC) is located in the dorso-caudal brainstem and is composed
of the AP, the NTS and dorsal motor nucleus of the vagus nerve (DMV) (Fig 1.9). Together,
this complex is involved in processing major autonomic reflexes and metabolic signals. Due
to my research primarily investigating the effects of metabolic signalling and possible
circadian involvement, this section will primarily focus on these aspects.
1.5.1 The area postrema
As previously discussed, the AP is a sensory CVO. The AP is located along the fourth
ventricle in the dorso-medial medulla oblongata in the hindbrain, immediately dorsal to
the NTS. Like the other CVOs, the AP has specialised tanycyte-like ependymal cells with
high concentrations of tight junctions lining the ventricle side and also possesses a rich
REBECCA NORTHEAST 51
vasculature with fenestrated capillaries. A specialised diffusion barrier exists between the
AP and the NTS, characterised by high density immunoreactivity of glial fibrillary acid
protein (GFAP; a marker for astrocytes and tanycytes), zona occludens-1 (Z01) and Claudin-
5 (tight junction proteins), helps regulate the entry of blood borne molecules into the brain
(Fig 1.9) (Wang et al., 2008; Morita & Miyata, 2012; Langlet et al., 2013)
The main afferent input to the AP originates from the PVN and the DMH (Larsen et al.,
1991). The majority of the efferent neurons from the AP connect to the NTS, and are
primarily Ad2 adrenergic and NA2 noradrenergic neurons (Cunningham et al., 1994). The
other main efferent neuronal population projects to the lateral parabrachial nucleus
(Herbert et al., 1990), an area responsible for relaying viscerosensory information (Aicher
et al., 2013).
Figure 1.9 Dorsal vagal complex anatomy. Diagram of a coronal view of the medial DVC, located in the brainstem. The AP is made up of the perivascular zone, the highly vascularised central zones (CZ) and the lateral zone (LZ). The LZ is continuous with the glial border between the AP and NTS containing primarily claudin-5 and ZO-1 tight junction proteins. The medial NTS is represented here NTS surrounding the AP and dorsal to the DMV and central canal (CC).
RHYTHMS, SLEEP AND HOMEOSTASIS
52
1.5.2 The nucleus of the solitary tract
The NTS is considered the main integratory site for receiving sensory information from the
viscera, and thus plays vital roles in many cardiovascular, respiratory and digestive reflexes
and process. In addition, the NTS contains a heterogonous population of neurones
expressing a wide range of peptides, such as somatostatin and glucagon-like 1 peptide
(GLP-1), which play key roles in the maintenance of energy balance (Larsen et al., 1997).
The NTS is composed of multiple nuclei, through which runs the solitary tract containing
fibres of the vagus nerve, the glossopharyngeal nerve and the facial nerve which carry a
variety of mechanical, chemical and osmotic information to the NTS. The differing regions
of the NTS can roughly be attributed to their function whereby the rostral NTS primarily
receives information regarding gustatory processing, the dorsomedial portion is involved
in cardiovascular control, while respiratory afferents are found mid-ventrally and the
caudal part is primarily involved in digestive processes (Andresen & Kunze, 1994). The
information received from the visceral afferent signals along with information from
circulating hormones is processed by integration with other brainstem areas, primarily the
DMV, AP and PBN, as well as some limbic and hypothalamic areas (primarily the PVN) and
the intermediolateral cell column of the spinal cord. These areas are able to reciprocally
interact with the NTS and modulate the its own input in control the of specific actions
associated with these signals (Travagli & Anselmi, 2016). The BBB lacking AP lies
immediately dorsal to the medial NTS and provides information about circulating factors
such as leptin (Fig 1.9) (Oldfield & McKinley, 2015). Efferent NTS neurons projecting to the
DMV are primarily involved in gastric emptying reflexes, while projections to the caudal
ventrolateral medulla mediate baroreceptor neurocircuits and projections to the
hypothalamus are involved in the central regulation of energy homeostasis (Browning &
Travagli, 2014).
1.5.3 The dorsal motor nucleus of the vagus nerve
The DMV is a cranial nerve nucleus for the vagus nerve, located ventral to the fourth
ventricle, the efferent fibres for which form synaptic contacts with the vagus nerve and

REBECCA NORTHEAST 53
regulate gastric motility and respiratory functions (Fig 1.9). In humans, the DMV subnuclei
and neurons can be differentiated based on their cytoarchitecture however in rats and
mice DMV neurons tend to be differentiated based on where they project (Huang et al.,
1993; Gao et al., 2009). Synaptic neurons from the NTS to the DMV regulate vasovagal
reflexes of which GABAergic transmission is the most critical in regulating vagal tone
(Sivarao et al., 1998). DMV neurons are also activated by circulating neurons such as GLP-
1 and cholecystokinin (CCK), as well as input from synaptic projections from the AP and
PVN (Travagli & Anselmi, 2016).
1.5.4 The role of the DVC in metabolism and energy homeostasis
In addition to mediating visceral reflexes, the DVC is a major hub for energy balance
control, with the NTS arguably receiving the greatest number of neuronal and circulatory
signals regarding energy status. The NTS receives information regarding energy status and
feeding via three pathways; vagal nerve afferents following mechanical distortion in the
gastrointestinal (GI) tract after ingestion, circulatory endocrine signals from peripheral
organs and nutrient sensing of circulatory signals such as glucose (Fig 1.10) (Grill & Hayes,
2012).
Following ingestion, satiety is induced via vagal sensory mechanoreceptors in the stomach
detecting stretch, however the primary mechanism is through serotonin (5-HT) secretion
from gastric endochromaffin cells exciting peripheral dendritic terminals of vagal afferents
in the stomach (Hayes et al., 2004; Mazda et al., 2004). Furthermore, a cocktail of satiety
signals is released from the intestines including CCK, GLP-1, 5-HT and neuropeptide YY
(PYY). Typically, these signals are not released into circulation in quantities large enough to
reach the brain, therefore are communicated to the NTS in a paracrine manner via vagal
afferent neurons on the nodose ganglia (Fig 1.10) (Chaudhri et al., 2006; Hayes et al., 2010).
Chemical blockade or surgical lesions of the vagus failed to induce inhibitory food intake
following peripheral administration of CCK and GLP-1 (Mazda et al., 2004; Kanoski et al.,
2011).
Leptin is a satiety factor produced predominantly in white adipose tissue, and its
production is increased in proportion to the size of adipocytes and adipose depots

RHYTHMS, SLEEP AND HOMEOSTASIS
54
(Frederich et al., 1995). Leptin signalling in the NTS is widely considered necessary for its
well-known effects on energy balance. Fourth intracerebroventricular injections of leptin
reduced food intake (Grill et al., 2002) and leptin acting at the NTS is also implicated in
thermogenic control through brown adipose tissue activation (Skibicka & Grill, 2009; Zhang
et al., 2011). Furthermore, the NTS is able to integrate multiple signals to potentiate satiety,
for example, leptin in the NTS amplifies the satiety induced by vagal gastric distention
signals (Huo et al., 2007). Amylin is a polypeptide satiety hormone co-synthesised and
secreted with insulin from pancreatic β cells, and primarily exerts its effects of reducing
meal size by direct action at the AP (Lutz, 2013). In addition, amylin interacts with other
metabolic signals to alter their response, for example addition of amylin sensitises neuronal
activation in the AP by leptin (Smith et al., 2016), however the precise actions of leptin
activating AP neurons are still unknown (Kanoski et al., 2012).
Circulating ghrelin, an orexigenic gastric secreted peptide, also has actions on the NTS
through its receptor the growth hormone secretagogue receptor (GHSR) (Cornejo et al.,
2018). Direct application of ghrelin to the DVC increased food intake (Faulconbridge et al.,
2003). Additionally, ghrelin inhibits the activation effects of visceral afferents in
catecholaminergic neurons in the NTS (Cui et al., 2011). Thus, as satiety signals such as
gastric distention (Willing & Berthoud, 1997) increase afferent vagal signals to the NTS, the
inhibitory action of ghrelin on these signals is one pathway for which it could stimulate food
intake.
Neurons in the DVC have been shown to be responsive to glucose deprivation (Balfour et
al., 2006). Hindbrain neurons in the NTS and DMV express glucose transporter type 2
(GLUT2), a marker for central glucose sensing neurons (Arluison et al., 2004). Likewise,
astrocytes in these hindbrain areas also express GLUT2 thus potentially playing a role in
glial-neuronal activation during glucose sensing (Marty et al., 2005). Furthermore, the
catecholaminergic population of neurons in the NTS are glucose sensitive (Roberts et al.,
2017) and the projections of these neurons include the PVN and other brainstem nuclei
(Balcita-Pedicino & Rinaman, 2007), thus they could contribute to altered feeding
behaviours in correspondence with blood glucose levels.
REBECCA NORTHEAST 55
As previously discussed, CCK effects on reducing appetite are primarily though afferent
vagal input to the NTS. CCK is also produced in the brain, including the NTS (Herbert &
Saper, 1990; Garfield et al., 2012) however, little is known regarding the function of this
source. CCK-expressing neurons in the NTS neurons are primarily located in the mid extent
of the NTS in conjunction with the AP, and specific activation of these neurons consistently
reduced food intake (D’Agostino et al., 2016). Furthermore, it appears that CCK NTS
neurons control appetite through direct connections with the hypothalamic PVN and the
PBN in the brainstem (D’Agostino et al., 2016; Roman et al., 2017). These data indicate that
the direct action CCK on NTS neurons plays an important but poorly understood role in
energy balance.
Pro-opiomelanocortin (POMC) neurons (well established mediators of satiety in energy
homeostasis) in the NTS are activated by CCK in conjunction with vagal input (Appleyard et
al., 2005) and direct activation of POMC NTS neurons inhibits feeding (Zhan et al., 2013).
POMC neurons NTS primarily receive inputs from hindbrain and brainstem regions whilst
Arc POMC neurons receive inputs from the hypothalamus, however both receive inputs
from the PVN and central amygdala suggesting similar coordination by these upstream
regulators (Wang et al., 2015; Zhan, 2018). NTS POMC neuron activity appears to modulate
Arc energy balance circuitry as direct antagonism of these NTS POMC neurons reduces
leptin induced feeding inhibition (Zheng et al., 2010).
Orexin is a neuropeptide produced in the LH that has well known roles in arousal and
energy balance. Roughly one quarter of orexinergic fibres project to the hindbrain,
including the NTS, and these fibres are in close proximity to medial NTS neurons which are
activated following gastric distention (Ciriello et al., 2003). Direct stimulation of LH neurons
leads to feeding behaviour in fed rats (Zheng et al., 2005), and one study demonstrated
that LH stimulation inhibited medial NTS neurons and that this stimulation could attenuate
the excitation induced by gastric distention in NTS neurons (Jiang et al., 2003).

RHYTHMS, SLEEP AND HOMEOSTASIS
56
Figure 1.10 DVC regulation of energy balance. Simplistic diagram of brainstem circuits in energy balance. Vagal afferents sense gut hormones and mechanical distention activate connections with the nodose ganglia to the NTS, the NTS then relays these signals to PVN circuits to mediate satiety. Orexin efferents from the LH the NTS inhibits satiety signalling from the NTS to mediate food intake. Circulating signals act on the DVC to induce satiety (leptin, amylin, glucose) or inhibit satiety (ghrelin) signalling circuits to mediate feeding. POMC neurons from the NTS interact with leptin signalling in the ARC to modulate satiety signalling.
1.5.9 Circadian rhythms in cardiovascular physiology
The DVC plays a vital role in the autonomic regulation of cardiovascular processes including
the baroreflex and cardiac tone. As this thesis is investigating the circadian regulation of

REBECCA NORTHEAST 57
homeostatic process, in particular those controlled by the DVC, I will now briefly discuss
some of what we know about the circadian influence on cardiovascular physiology.
Cardiovascular physiology displays prominent circadian variation, however the exact
mechanism(s) behind these are unresolved. In humans, blood pressure dips at night before
undergoing a steep increase in the morning, with a characteristic peak in the afternoon
(Millar-Craig et al., 1978). This lack of a blood pressure “dip” has been related to increased
risk of chronic kidney disease and adverse cardiovascular events (Fagard et al., 2009;
Hermida et al., 2010). In fact, it has been observed for a while that the incidence of
myocardial infarction is highest in the early day (Muller et al., 1985), suggesting a circadian
involvement in cardiovascular pathology.
In mice, various clock gene knockout models show significant variation in blood pressure,
highlighting the role of the molecular clock in the generation of healthy blood pressure
rhythms (Curtis et al., 2007; Sei et al., 2008; Xie et al., 2015). Clock gene mutant mice also
display disrupted circadian variation in heart rate, proposed to be related alterations in the
sympathoadrenal system (Curtis et al., 2007). Furthermore, circadian disruption protocols
have significant effects on heart rate rhythms and cardiac function (West et al., 2017) and
mice with disrupted SCN signalling (Vipr2-/- mice) display flattened rhythms in blood
pressure and heart rate (Sheward et al., 2010), implying that coherent SCN output is
required for the maintenance of these physiological rhythms. Rodents with SCN lesions
show a dampening in blood pressure circadian rhythms (Janssen et al., 1994) and blunted
heart rate daily rhythms (Scheer et al., 2001). In addition, following treatment with
metaraminol, an α1-adrenergic receptor antagonist, SCNx animals show heightened
changes in blood pressure indicating that the SCN is involved in gating the acute response
to blood pressure challenges. These authors also demonstrated a significant reduction in
SCN neuronal activation following peripheral metaraminol administration in NTS lesioned
animals, hinting that the NTS is relaying blood pressure information to the SCN (Buijs et al.,
2014).
RHYTHMS, SLEEP AND HOMEOSTASIS
58
1.6 Concluding Remarks
As demonstrated in this literature review, the circadian system has many overlapping
regulatory roles in homeostatic processes, from sleep regulation, to fluid balance and
metabolism. There are still many unanswerable questions as to how these processes are
regulated in a circadian manner, with current understanding primarily pointing towards
SCN involvement. However, in the following chapters, I provide evidence for how
autonomous circadian clocks and interactions outside of direct SCN control might play a
role in the regulation of certain homeostatic systems.
REBECCA NORTHEAST 59
1.7 Aims and Objectives
The overall aim of my PhD was to make a significant contribution to the understanding of
circadian regulation and its interactions with homeostatic systems. The common thread
throughout this thesis is how processes separate from the SCN might impart temporal
information and regulation to key homeostatic systems. Daytime food restriction (Chapter
2) generates anticipatory behaviour outside of SCN control to enable arousal during
quiescent periods in order to seek food. This results in changes in the temporal partitioning
of rest-activity rhythms, with unknown effects on homeostatic and circadian sleep
regulation. Drinking behaviour and fluid balance exhibits clear circadian variation (Chapter
3), as does energy balance and cardiovascular regulation (Chapter 4) yet the exact
mechanisms behind this temporal control are unknown. My research aims to address the
following questions and provide the foundation for future investigations to further this
understanding.
• How does entrainment to daytime restricted feeding alter sleep-wake patterning
and does this impact on sleep homeostasis? (Chapter 2)
• What changes are observed in sleep homeostasis and sleep architecture during
natural arousal for food in comparison to forced wakefulness? (Chapter 2)
• Do brain areas involved in fluid balance demonstrate evidence of endogenous
clockwork? (Chapter 3)
• How do these oscillators compare to the master clock, and how might their rhythms
be maintained? (Chapter 3)
• What evidence is there for endogenous oscillations in the brainstem? What are the
properties of these rhythms and how do they interact with each other? (Chapter
4?)
• How might the brainstem clock contribute to circadian variation in metabolism?
(Chapter 4)
• What evidence is there for the role of non-neuronal cells in localised circadian
regulation in the brainstem? (Chapter 4)

RHYTHMS, SLEEP AND HOMEOSTASIS
60
1.8 Alternative Format
This thesis is presented in the alternative format in compliance with the rules and
regulations of the University of Manchester. The following results are presented in
manuscript format, in the style suitable for the chosen journals for submission. However,
some elements have been reformatted to ensure continuity and additions have been made
in places where more detail was required. Below are the details of each manuscript, journal
of submission and the contribution of each author to the work.
1.8.1 Chapter 2
Title: Sleep homeostasis during daytime food entrainment in mice
Authors: Rebecca C. Northeast1,2, Yige Huang1, Laura E. McKillop1, David A. Bechtold2,
Stuart N. Peirson3, Hugh D. Piggins2,4, Vladyslav V. Vyazovskiy1,3
Affiliations:
1Department of Physiology, Anatomy and Genetics, University of Oxford, Parks Road,
Oxford, OX1 3PT, United Kingdom. 2Faculty of Biology, Medicine, and Health, AV Hill Building, University of Manchester,
Oxford Road, Manchester, United Kingdom M13 9PT, United Kingdom. 3Sleep and Circadian Neuroscience Institute, Oxford Molecular Pathology Institute, Sir
William Dunn School of Pathology, South Parks Road, Oxford, OX1 3RE, United Kingdom 4Current address: School of Physiology, Pharmacology and Neuroscience, Biomedical
Sciences Building, University of Bristol, Bristol, BS8 1TD, United Kingdom.
Journal of submission: Manuscript submitted to SLEEP in February 2019. Currently the
manuscript is back with the authors for minor revisions.
Author contributions: This work was performed at the University of Oxford as part of an
external research placement funded by the MRC during the course of my PhD. The
experiments were designed by me, Vladyslav Vyazovskiy and Hugh Piggins with expert
advice from Stuart Peirson and David Bechtold. I performed the majority of the EEG
implantation surgeries under the instruction and guidance of Laura McKillop who

REBECCA NORTHEAST 61
implanted one animal herself. The data acquisition, animal behavior, sleep scoring and data
analysis were all carried out by me, with excellent tuition and guidance from VV. Yige Huang
assisted in animal behavior and technical set up. VV and I wrote the manuscript together
with comments and advice from all the authors.
1.8.2 Chapter 3
Title: Time for a drink? Novel oscillator properties in the thirst centres of the brain
Authors: Rebecca. C. Northeast1, Lukasz Chrobok1,2*, Alun T. L. Hughes1,3*, Cheryl Petit1,
Hugh D. Piggins1,4
Affiliations:
1. Faculty of Biology, Medicine, and Health, AV Hill Building, University of Manchester,
Oxford Road, Manchester, M13 9PT, United Kingdom
2. Current address: Department of Neurophysiology and Chronobiology, Institute of
Zoology and Biomedical Research, Jagiellonian University in Krakow, Poland;
Gronostajowa Street 9, 30-387 Krakow, Poland
3. Current address: School of Natural Sciences and Psychology, Liverpool John Moores
University, Liverpool, United Kingdom
4. Current address: School of Physiology, Pharmacology and Neuroscience, Biomedical
Sciences Building, University of Bristol, Bristol, BS8 1TD, United Kingdom
* Authors contributed equally
Journal of submission: Manuscript to be submitted to FASEBJ in April 2019
Author contributions: The experiments in this manuscript were designed by me, Alun
Hughes and Hugh Piggins. Alun Hughes instructed me in the bioluminescence recordings
and analysis. I performed the vast majority of experiments and data analysis, with
assistance in bioluminescence set up from AH and Lukasz Chrobok. LC also assisted me with
bioluminescence data analysis. Cheryl Petit provided expert advice and assistance for the
qPCR experiments. The manuscript was written by me with comments and edits from all
the authors.
RHYTHMS, SLEEP AND HOMEOSTASIS
62
1.8.3 Chapter 4
Title: Keeping time in hindbrain
Authors: Rebecca C. Northeast1*, Lukasz Chrobok1, 2*, Peter Cunningham1, Cheryl Petit1,
Hugh D. Piggins1,3
Affiliations
1. Faculty of Biology, Medicine, and Health, AV Hill Building, University of Manchester,
Oxford Road, Manchester, M13 9PT, United Kingdom
2. Current address: Department of Neurophysiology and Chronobiology, Institute of
Zoology and Biomedical Research, Jagiellonian University in Krakow, Poland;
Gronostajowa Street 9, 30-387 Krakow, Poland
3. Current address: School of Physiology, Pharmacology and Neuroscience, Biomedical
Sciences Building, University of Bristol, Bristol, BS8 1TD, United Kingdom
* Authors contributed equally
Journal of submission: Manuscript submitted to PNAS in April 2019
Author contributions: The work in this manuscript was done in conjunction with Lukasz
Chrobok. Experiments were designed by me, LC and Hugh Piggins. I performed the majority
of the bioluminescence experiments. LC and I performed the bioluminescence analysis.
qPCR experiments and analysis were performed primarily by me with assistance from LC
with technical advice and assistance from Peter Cunningham and Cheryl Petit. The
permeability studies and analysis were performed together by me and LC. LC performed
the multi-electrode array recordings and analysis, with assistance from me. The manuscript
was written by me, LC and HDP.

REBECCA NORTHEAST 63
Chapter 2: Sleep Homeostasis During Daytime Food Entrainment
in Mice
Rebecca C. Northeast1,2, Yige Huang1, Laura E. McKillop1, David A. Bechtold2, Stuart N.
Peirson3, Hugh D. Piggins2,4, Vladyslav V. Vyazovskiy1,3
1. Department of Physiology, Anatomy and Genetics, University of Oxford, Parks Road,
Oxford, OX1 3PT, United Kingdom.
2. Faculty of Biology, Medicine, and Health, AV Hill Building, University of Manchester,
Oxford Road, Manchester, United Kingdom M13 9PT, United Kingdom.
3. Sleep and Circadian Neuroscience Institute, Oxford Molecular Pathology Institute, Sir
William Dunn School of Pathology, South Parks Road, Oxford, OX1 3RE, United Kingdom
4. Current address: School of Physiology, Pharmacology and Neuroscience, Biomedical
Sciences Building, University of Bristol, Bristol, BS8 1TD, United Kingdom
Corresponding Authors:
Vladyslav V. Vyazovskiy; Department of Physiology, Anatomy and Genetics, University of
Oxford, Parks Road, Oxford, OX1 3PT, United Kingdom. Email:
Hugh D. Piggins; School of Physiology, Pharmacology and Neuroscience, Biomedical
Sciences Building, University of Bristol, Bristol, BS8 1TD, United Kingdom. Email:
Keywords: sleep homeostasis, food entrainment, food anticipatory activity, sleep
deprivation, slow-wave energy, circadian rhythms, behaviour, electroencephalography
RHYTHMS, SLEEP AND HOMEOSTASIS
64
2.1 Abstract
24 h rhythms of physiology and behaviour are driven by the environment and an internal
endogenous timing system. Daily restricted feeding (RF) in nocturnal rodents during their
inactive phase initiates food anticipatory activity (FAA) and a reorganisation of the typical
24 h sleep-wake structure. Here, we investigate the effects of daytime feeding, where food
access was restricted to 4 h during the light period ZT4-8 (zeitgeber time; ZT0 is lights on),
on sleep-wake architecture and sleep homeostasis in mice. Following 10 days of RF, mice
were returned to ad libitum feeding. To mimic the spontaneous wakefulness associated
with FAA and daytime feeding, mice were then sleep deprived between ZT3-6. While the
amount of wake increased during FAA and subsequent feeding, total wake time over 24 h
remained stable as the loss of sleep in the light phase was compensated by an increase in
sleep in the dark phase. Interestingly, sleep which followed spontaneous wake episodes
during the dark period and the extended period of wake associated with FAA, exhibited
lower levels of slow-wave activity (SWA) when compared to baseline or after sleep
deprivation, despite a similar duration of waking. This suggests an evolutionary mechanism
of reducing sleep drive during negative energy balance to enable greater arousal for food
seeking behaviours. However, the total amount of sleep and SWA accumulated during the
24 h was similar between baseline and RF. In summary, our study suggests that despite
substantial changes in the daily distribution and quality of wake induced by RF, sleep
homeostasis is maintained.
2.1.1 Statement of significance
Nocturnal rodents are able to robustly anticipate daytime meals, resulting in gross
disruption of typical sleep-wake patterns. It is currently unknown how changes in sleep, in
particular sleep drive, are affected during this process of food anticipation and whether or
not the characteristics of wake have changed. We performed chronic recordings of cortical
activity during a typical daytime restricted feeding paradigm in mice to investigate how
sleep homeostasis and sleep/wake characteristics are affected by food anticipation.
Unexpectedly, we found that sleep homeostasis was maintained and that sleep drive
appeared to be reduced during restricted feeding, suggesting an evolutionary flexibility in
sleep control allowing animals to more readily wake and seek food.

REBECCA NORTHEAST 65
2.2 Introduction
Daily patterns in behavioural and physiological state emerge through the actions of an
intrinsic circadian timekeeping system and its synchronisation to recurrent environmental
signals or zeitgebers (Hastings et al., 2018). Variation in environmental light is the dominant
zeitgeber where photic information is conveyed from the eye, via the retinohypothalamic
tract (RHT), to the master circadian pacemaker in the brain’s suprachiasmatic nuclei (SCN)
(Lucas et al., 2012). Photic input evokes glutamate release from RHT terminals which
entrains the molecular clock contained within individual SCN cells, thereby synchronising
this master oscillator to the external world. Rhythmic electrical and neurochemical output
of the SCN imparts time of day information throughout the brain and body, driving day-
night/circadian variation in body temperature, hypothalamic-pituitary-adrenal axis, as well
as behavioural and neural states (Pilorz et al., 2018).
Two key processes heavily influenced by the SCN are the onset of sleep and patterns of
food intake (Deboer, 2018; Pilorz et al., 2018). For nocturnal animals, this partitions rest
and infrequent feeding activity to the day, while waking and frequent feeding are mostly
confined to the night. In addition, both food intake and sleep are subject to strong
homeostatic control that ensure appropriate amounts of daily feeding, wake duration and
sleep intensity. Moreover, SCN control on sleep-wake and feeding cycles can be over-
ridden by restricting daily food availability to the light phase of the day such as during
typical restricted feeding (RF) paradigms (Mistlberger, 2011). In rodents, this activates
arousal centres to trigger wakefulness and food-seeking behaviour, which can be readily
measured as an increase in locomotor activity and body temperature preceding expected
meal time, termed food anticipatory activity (FAA) (Webb et al., 2014). This emergence of
FAA is highly conserved. Many anatomical, functional and genetic ablation studies have
attempted to disrupt FAA with limited success, highlighting the evolutionary importance
and dominance of food seeking behaviours over other behavioural rhythms. However, it is
still unclear if and how homeostatic regulation of sleep is influenced by RF and FAA.
Traditionally, the need for sleep is viewed as building up progressively during wakefulness
and diminishing during subsequent sleep (Borbély et al., 2016). Electrophysiologically,
sleep-wake history is reflected in the levels of electroencephalogram (EEG) slow-wave
RHYTHMS, SLEEP AND HOMEOSTASIS
66
activity (SWA; 0.5-4Hz), which increases as a function of preceding wake duration and
decreases during ensuing sleep, and as such is widely used as an objective measure of sleep
homeostasis (Borbély, 1982; Franken et al., 2001). Waking is typically assumed to be a
homogenous process, which is associated with a continuous increase of sleep pressure
largely irrespective of ongoing behaviour or activities (Vyazovskiy, Walton, et al., 2017;
Guillaumin et al., 2018). However, this view is likely too simplistic. For example, waking
induced by FAA (a strongly motivated seeking behaviour) may be qualitatively different to
typical spontaneous and exploratory waking, particularly with respect to brain activity and
accumulation of sleep pressure. Brain activity during awake states is largely regulated by
ascending activating influences from specific subcortical wake-promoting areas and
ongoing behaviour (Jones, 2005; Brown et al., 2012). This is reflected in the wake EEG which
consists of faster oscillations, and which is distinguished from sleep by the absence of slow
waves (~0.5-4 Hz). Importantly, the same neuromodulatory systems are crucially involved
in locomotion and other active behaviours (Wu et al., 1999; Mileykovskiy et al., 2005;
Constantinople & Bruno, 2011; Polack et al., 2013), and arousal-promoting
neuromodulators are implicated in motivated behaviours, such as foraging (Willie et al.,
2001; Arrigoni et al., 2018; Eban-Rothschild et al., 2018). Therefore, we hypothesize that
the nature of wake behaviour and the underlying drive for staying awake, such as FAA
versus spontaneous exploration, will influence brain activity during wakefulness and the
characteristics of subsequent sleep.
Here, we investigated the influence of timed food restriction on the amount, distribution
and quality of waking and sleep in mice. To investigate the effects of food restriction on
waking and sleep, as well as sleep regulatory mechanisms, we recorded EEGs from two
cortical derivations. Specifically, we assessed how and whether waking associated with FAA
differs from exploratory wakefulness with respect to EEG spectral power, as well as its
effects on subsequent sleep.
REBECCA NORTHEAST 67
2.3 Materials and Methods
2.3.1 Animals and recording conditions
Male C57BL/6J mice (Envigo, n=7) aged 10-12 weeks underwent EEG and electromyogram
(EMG) recordings. For the duration of the experiment mice were housed individually in
custom-made clear plexiglass cages (20.3 x 32 x 35 cm) on a 12:12 h light-dark (12:12 LD)
cycle. Cages were housed in ventilated and sound-attenuated Faraday chambers (Campden
Instruments, Loughborough, UK, with two cages per chamber). An LED lamp illuminated
each chamber at approximately 200 lux during the light phase of and 0 lux during the dark
phase of the 12:12 LD cycle. Room temperature and relative humidity were maintained at
22 ± 1°C and 60 ± 10%, respectively. Water was available ad libitum throughout the study.
All procedures were performed in accordance with the United Kingdom Animals (Scientific
Procedures) Act of 1986 and the University of Oxford Policy on the Use of Animals in
Scientific Research (PPL 70/7483). All experiments were approved by the University of
Oxford Animal Welfare and Ethical Review Board.
2.3.2 Surgical procedure and experimental design
Custom-made EEG and EMG headmounts were implanted during cranial surgery. Each
headmount was composed of three stainless steel screw electrodes and two stainless steel
wires (shaft diameter 0.86 mm, InterFocus Ltd, Cambridge, UK), soldered before
implantation to an 8-pin surface mount connector (8415-SM, Pinnacle Technology Inc,
Kansas, USA). Surgical procedures were carried out under isoflurane anaesthesia (5% for
induction, 1.5 – 2.5% for maintenance) using aseptic surgical techniques. Animals were
head-fixed using a stereotaxic frame (David Kopf Instruments, California, USA) throughout
the procedure, and Viscotears liquid gel (Alcon Laboratories Limited, Hemel Hempstead,
UK) was applied at regular intervals to protect the eyes. Along the midline of the head, an
incision was made using a scalpel to reveal the skull, which was then cleaned with 3%
hydrogen peroxide and saline. For EEG screw implantation, the skull was drilled using a
high-speed drill (carbon burr drill bits, 0.7 mm, InterFocus Ltd) after which two of the
headmount screws were implanted epidurally over the frontal (motor area, M1,
anteroposterior (AP) +2 mm, mediolateral (ML) 2 mm) and occipital (visual area, V1, AP -
RHYTHMS, SLEEP AND HOMEOSTASIS
68
3.5-4 mm, ML +2.5 mm) cortical regions (Fig 2.1A). To act as a reference, an additional
screw was implanted over the cerebellum, and for stability of the head implant an anchor
screw was attached to the skull contralaterally to the frontal screw. Two stainless steel
wires were inserted either side of the nuchal (back neck) muscle to record EMG. All screws
and the headmount wires were secured in place using dental cement (Associated Dental
Products Ltd, Swindon, UK). Overall, this recording configuration provided two EEG
derivations [frontal (Fro) vs. cerebellum and occipital (Occ) vs. cerebellum] and one EMG
derivation. Throughout the surgery and immediate recovery period animals were
administered saline and maintained on thermal support. Analgesics were administered
preoperatively (Metacam 1-2 mg/kg, meloxicam, Boehringer Ingelheim Ltd, Bracknell, UK).
A minimum two-week recovery period was permitted prior to cabling the animals for
recording. Four days of habituation to the recording cables was allowed before recordings
were used in analyses.
2.3.3 Restricted feeding paradigm
A standard restricted feeding (RF) paradigm was used (Mistlberger, 2011). After obtaining
a stable baseline 24 h recording with food provided ad libitum (defined from here as
baseline condition, BSL), food was removed at ZT12 (zeitgeber time; ZT0 = lights on, ZT12
= lights off), and provided for 6 h at ZT4-10 the next day, and then during a 4 h interval at
ZT4-8 for the following 10 days (Fig 2.1B). This paradigm enabled a gradual introduction to
the food restriction window, as similarly seen in previous studies and is considered the
standard for testing food entrainment (Dudley et al., 2003; Flôres et al., 2016; Pendergast
& Yamazaki, 2018). Food was administered in custom made wired cages through insertion
at the back of the housing unit, with a removable plexiglass cover designed to be easily
inserted to block access to food with minimal disturbance to the animals. Animals were
weighed daily at the end of the feeding session (Fig 2.1C). At the end of RF paradigm, food
was provided ad libitum and the animals were recorded further for an additional four days,
including the day with sleep deprivation (Fig 2.1B) (see section 2.3.4 Sleep deprivation).
Torpor bouts can be observed in mice undergoing food restriction (Mitchell et al., 2015),
however we wanted to exclude torpor bouts from our studies due to their atypical
influence on EEG characteristics (Vyazovskiy, Palchykova, et al., 2017). As such, one
representative day of food entrainment was selected from days 7-10 of the RF protocol for
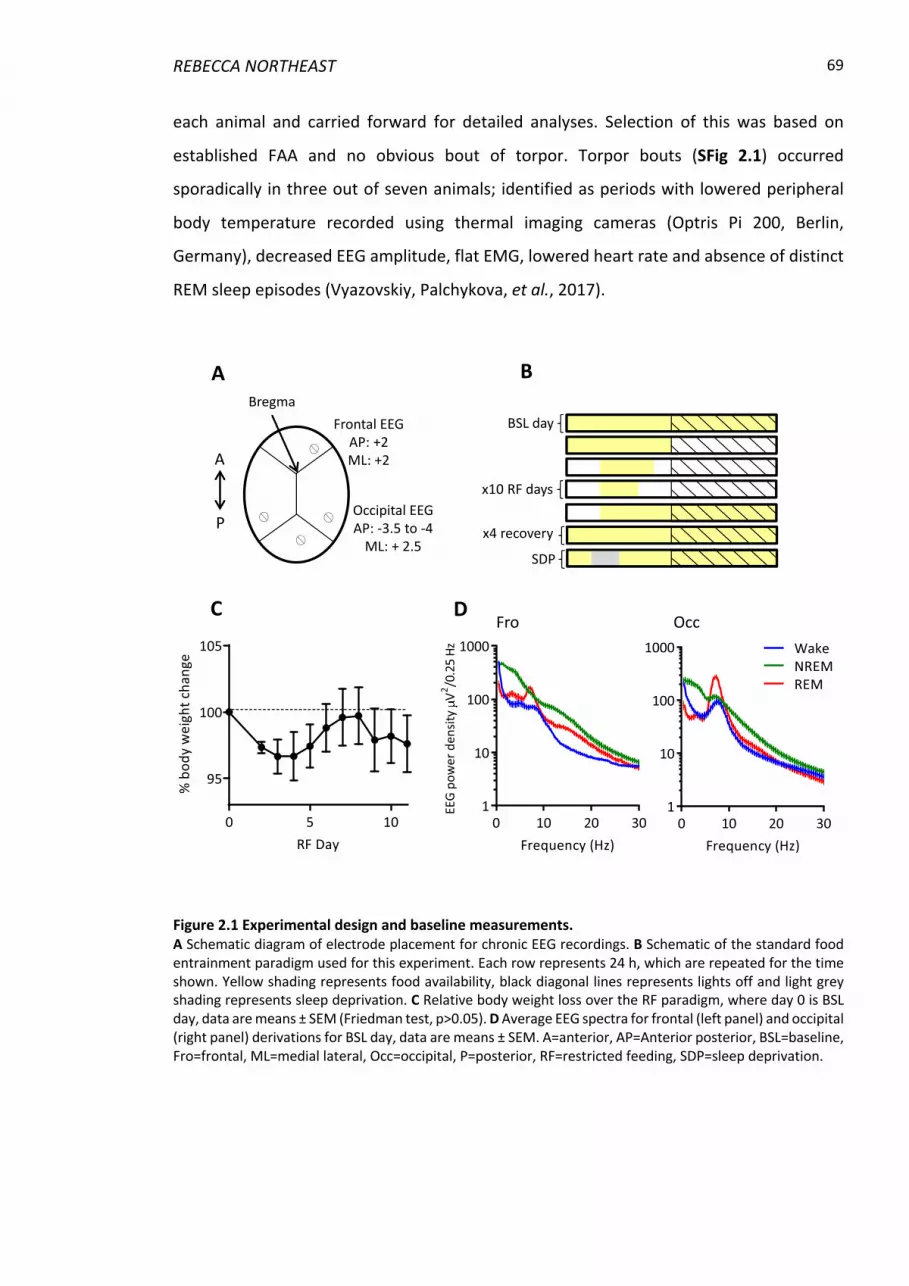
REBECCA NORTHEAST 69
each animal and carried forward for detailed analyses. Selection of this was based on
established FAA and no obvious bout of torpor. Torpor bouts (SFig 2.1) occurred
sporadically in three out of seven animals; identified as periods with lowered peripheral
body temperature recorded using thermal imaging cameras (Optris Pi 200, Berlin,
Germany), decreased EEG amplitude, flat EMG, lowered heart rate and absence of distinct
REM sleep episodes (Vyazovskiy, Palchykova, et al., 2017).
Figure 2.1 Experimental design and baseline measurements. A Schematic diagram of electrode placement for chronic EEG recordings. B Schematic of the standard food entrainment paradigm used for this experiment. Each row represents 24 h, which are repeated for the time shown. Yellow shading represents food availability, black diagonal lines represents lights off and light grey shading represents sleep deprivation. C Relative body weight loss over the RF paradigm, where day 0 is BSL day, data are means ± SEM (Friedman test, p>0.05). D Average EEG spectra for frontal (left panel) and occipital (right panel) derivations for BSL day, data are means ± SEM. A=anterior, AP=Anterior posterior, BSL=baseline, Fro=frontal, ML=medial lateral, Occ=occipital, P=posterior, RF=restricted feeding, SDP=sleep deprivation.
x10 RF days
x4 recovery
BSL day
A
P
BregmaFrontal EEG
AP: +2ML: +2
Occipital EEGAP: -3.5 to -4
ML: + 2.5
B
DFro Occ
A
SDP
C
2
0 5 10
95
100
105
RF Day
% b
ody
wei
ght c
hang
e
RHYTHMS, SLEEP AND HOMEOSTASIS
70
2.3.4 Sleep deprivation
To investigate whether extended waking associated with FAA differs from active
exploratory waking, all animals were sleep deprived with ad libitum access to food for 3 h
between ZT3-ZT6 to mimic the duration of spontaneous waking during RF.
Polysomnographic recordings were performed continuously, and the animals were under
constant visual observation. SDP was performed in the animal’s home cage, where they
were regularly provided with various objects, which elicited exploratory behaviour, to
mimic the naturalistic conditions of wakefulness in an ethologically relevant manner
(Tobler & Borbély, 1986; Palchykova et al., 2006; Vyazovskiy et al., 2008). The objects
included nesting and bedding material, wooden blocks, small rubber balls, plastic, metallic,
wooden, or paper boxes and tubes of different shape and colour. Subsequently, the
animals were left undisturbed for the rest of the 24 h period and analysed as the recovery
period.
2.3.5 Statistics
Statistical analyses were performed with GraphPad Prism version 7. Data were tested for
normality using the Sharpiro-Wilk test, otherwise the appropriate non-parametric test was
used. Statistically significant effects of restricted on hourly vigilance states across 24 h were
detected by repeated measures (RM) two-way ANOVA. Cumulative curves were tested for
significance through comparison of day vs night slope % and total 24 h accumulation was
compared with paired t-test or RM one-way ANOVA. Since EEG spectral power values are
not normally distributed, the statistical comparisons were performed on log-transformed
data (Vyazovskiy et al., 2002). Error bars represent standard error of the mean (SEM).
2.3.6 Signal processing
Data acquisition was performed using the Multi-channel Neurophysiology Recording
System (TDT, Alachua FL, USA) as previously (Fisher et al., 2016; Guillaumin et al., 2018;
McKillop et al., 2018). EEG and EMG data were collected at a sampling rate of 256.9 Hz
(filtered between 0.1 – 100 Hz), amplified (PZ5 NeuroDigitizer pre-amplifier, TDT Alachua
FL, USA) and stored locally. Data were resampled offline at a sampling rate of 256 Hz. Signal
conversion was performed using custom-written MatLab (The MathWorks Inc, Natick,

REBECCA NORTHEAST 71
Massachusetts, USA) scripts and was then transformed into European Data Format (EDF)
using Neurotraces software. For each 24 h recording, EEG power spectra were computed
by a Fast Fourier Transform (FFT) routine for 4-s epochs, with a 0.25 Hz resolution
(SleepSign Kissei Comtec Co, Nagano, Japan).
2.3.7 Scoring of vigilance states
Scoring of vigilance states occurred offline by visual inspection of consecutive 4-s epochs
(SleepSign, Kissei Comtec Co, Nagano, Japan). Two EEGs (frontal and occipital) and EMG
were simultaneously displayed to aid scoring. Vigilance states were classified as wake (low
voltage, high frequency irregular EEG pattern, dominated by theta-activity (6-9 Hz) and
with phasic or high-level EMG activity), non-rapid eye movement sleep (NREM; a signal of
a high amplitude and low frequency denoting slow waves, typically lower level EMG
activity), or rapid eye movement sleep (REM; low voltage, higher frequency EEG with theta-
dominant activity in the occipital derivation, accompanied by a low level of EMG activity).
Some epochs were contaminated with artefacts (16.8 ± 3.8 % SEM of all recordings, 99.4 ±
0.3 % of which were during wake) due to movements such as chewing and were removed
from subsequent spectral analysis. The onset of individual NREM sleep episodes was
defined by the first occurrence of slow waves (0.5 - 4 Hz) in at least one of the two EEG
channels, accompanied by the absence of phasic EMG activity recorded from the nuchal
muscle. For sleep episode analyses, we included NREM sleep episodes, which were at least
1 min long. For wake episode analyses, we included consolidated periods of waking lasting
at least 10 min.
RHYTHMS, SLEEP AND HOMEOSTASIS
72
2.4 Results
2.4.1 Entrainment to scheduled feeding
Analysis of EEG spectra recorded during waking, NREM sleep and REM sleep (Fig. 1D)
revealed a distribution of spectral power across frequencies in the frontal and occipital
derivations that is characteristic for mice (Guillaumin et al., 2018). During ad libitum
feeding baseline conditions (BSL), all animals showed the typical 24 h LD distribution of
vigilance states (Fig 2.2A, top panel), with wakefulness predominantly occurring during the
dark phase and sleep mostly occurring during the light phase (day: 25.1 ± 0.01 % of time
spent awake; night: 66.7 ± 0.01 % of time spent awake). After habituation and the
establishment of stable baseline EEG recordings, a standard RF paradigm was introduced,
whereby daily food availability was restricted to 4 h during the middle of the light phase
(Zeitgeber time; ZT4-8) (Fig 2.2A, bottom panel) for 10 consecutive days. To evaluate how
animals adapted to this temporal perturbation in food availability, the amount of waking
in the 2 h preceding the presentation of food was quantified over 10 successive days of RF
to encompass the period where animals typically showed FAA. Wake time in this 2 h
increased over the 10 days, indicating that animals adapted and displayed robust FAA,
particularly after 7+ days of this limited food availability (Fig 2.2B).
We next compared vigilance state parameters across a 24 h cycle in which the mice
exhibited robust FAA (from RF day 7-10; see 2.3.3 Restricted feeding paradigm) with the
BSL day immediately prior to the start of RF. The amount of wake significantly increased
before food presentation and during subsequent feeding in RF, with a corresponding
reduction of both NREM and REM sleep (Fig 2.2C). Notably, while waking was increased
and sleep decreased by RF during the light phase, this was reversed during the latter half
of the dark period (~ZT16-24). Accordingly, there were clear differences in the rate of
vigilance state accumulation over the 24 h, yet despite this temporal reorganisation during
RF, total time spent in wake, NREM and REM remained the same over the 24h cycle (BSL
vs RF; wake 661.4 ± 7.11 vs 685.7 ± 36.15 min p=0.51, NREM 622.8 ± 7.29 vs 622.9 ± 26.00
min p=0.98, REM 110.1 ± 5.98 vs 93.5 ± 10.51 min p=0.27) (Fig 2.2D). Specifically, wake
time during RF increased at a faster rate during the lights-on phase but was significantly
slower during the lights-off phase compared to BSL (SFig 2.2A; slope analysis of the

REBECCA NORTHEAST 73
cumulative curves). The opposite was apparent for NREM and REM sleep (SFig 2.2B,C) with
a reduced rate in accumulation during the day and an increased rate during the night.
Taken together, these data suggest that despite gross reorganisation of the daily pattern
of sleep and waking, the amount of vigilance states over 24 h is maintained after >7 days
of exposure to temporally restricted food availability.
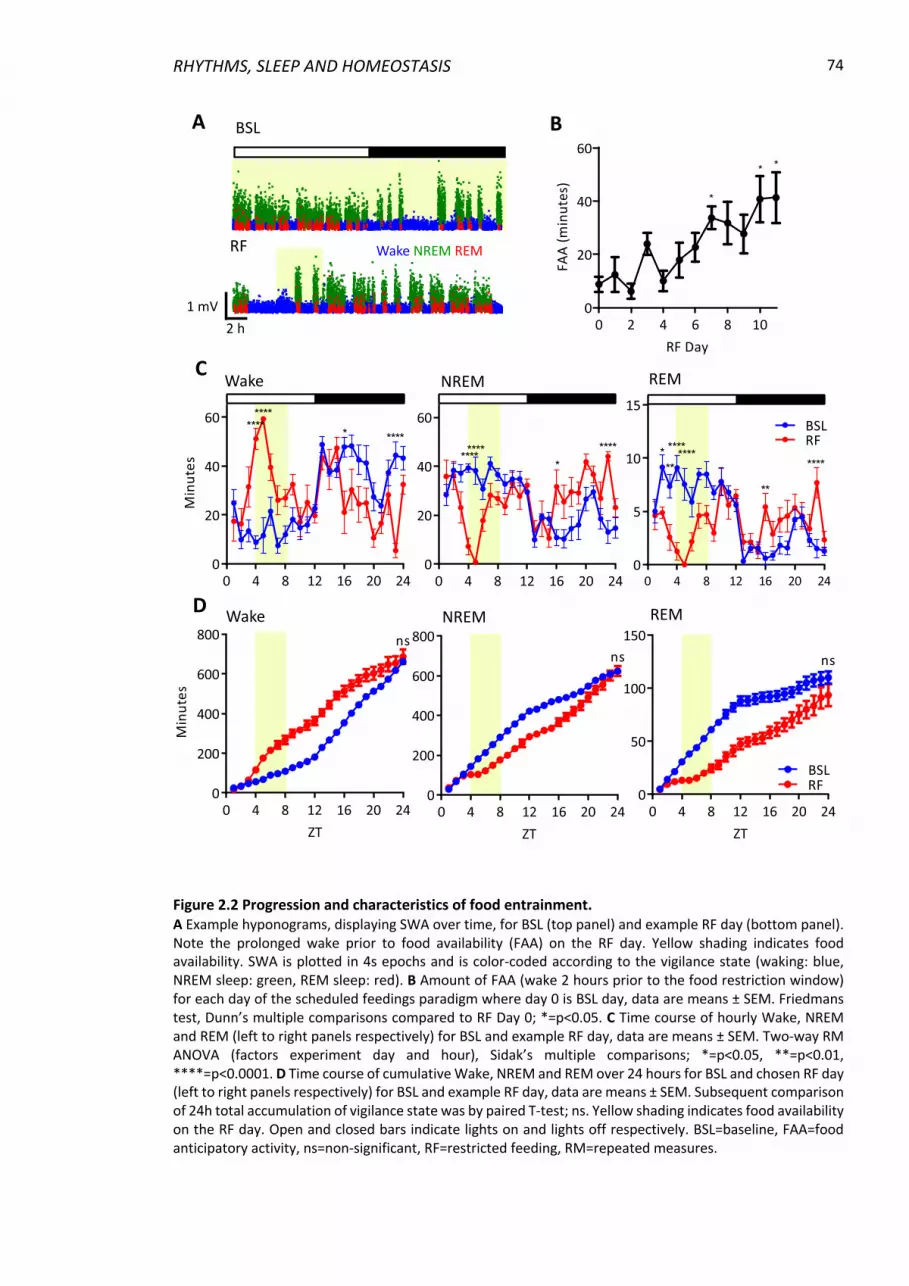
RHYTHMS, SLEEP AND HOMEOSTASIS
74
Figure 2.2 Progression and characteristics of food entrainment. A Example hyponograms, displaying SWA over time, for BSL (top panel) and example RF day (bottom panel). Note the prolonged wake prior to food availability (FAA) on the RF day. Yellow shading indicates food availability. SWA is plotted in 4s epochs and is color-coded according to the vigilance state (waking: blue, NREM sleep: green, REM sleep: red). B Amount of FAA (wake 2 hours prior to the food restriction window) for each day of the scheduled feedings paradigm where day 0 is BSL day, data are means ± SEM. Friedmans test, Dunn’s multiple comparisons compared to RF Day 0; *=p<0.05. C Time course of hourly Wake, NREM and REM (left to right panels respectively) for BSL and example RF day, data are means ± SEM. Two-way RM ANOVA (factors experiment day and hour), Sidak’s multiple comparisons; *=p<0.05, **=p<0.01, ****=p<0.0001. D Time course of cumulative Wake, NREM and REM over 24 hours for BSL and chosen RF day (left to right panels respectively) for BSL and example RF day, data are means ± SEM. Subsequent comparison of 24h total accumulation of vigilance state was by paired T-test; ns. Yellow shading indicates food availability on the RF day. Open and closed bars indicate lights on and lights off respectively. BSL=baseline, FAA=food anticipatory activity, ns=non-significant, RF=restricted feeding, RM=repeated measures.
*
**
0 2 4 6 8 100
20
40
60
RF Day
FAA
(min
utes
)
BSLA
RF
NREMWake REMC
1 mV2 h
Wake NREM REM
B
D NREMWake REM
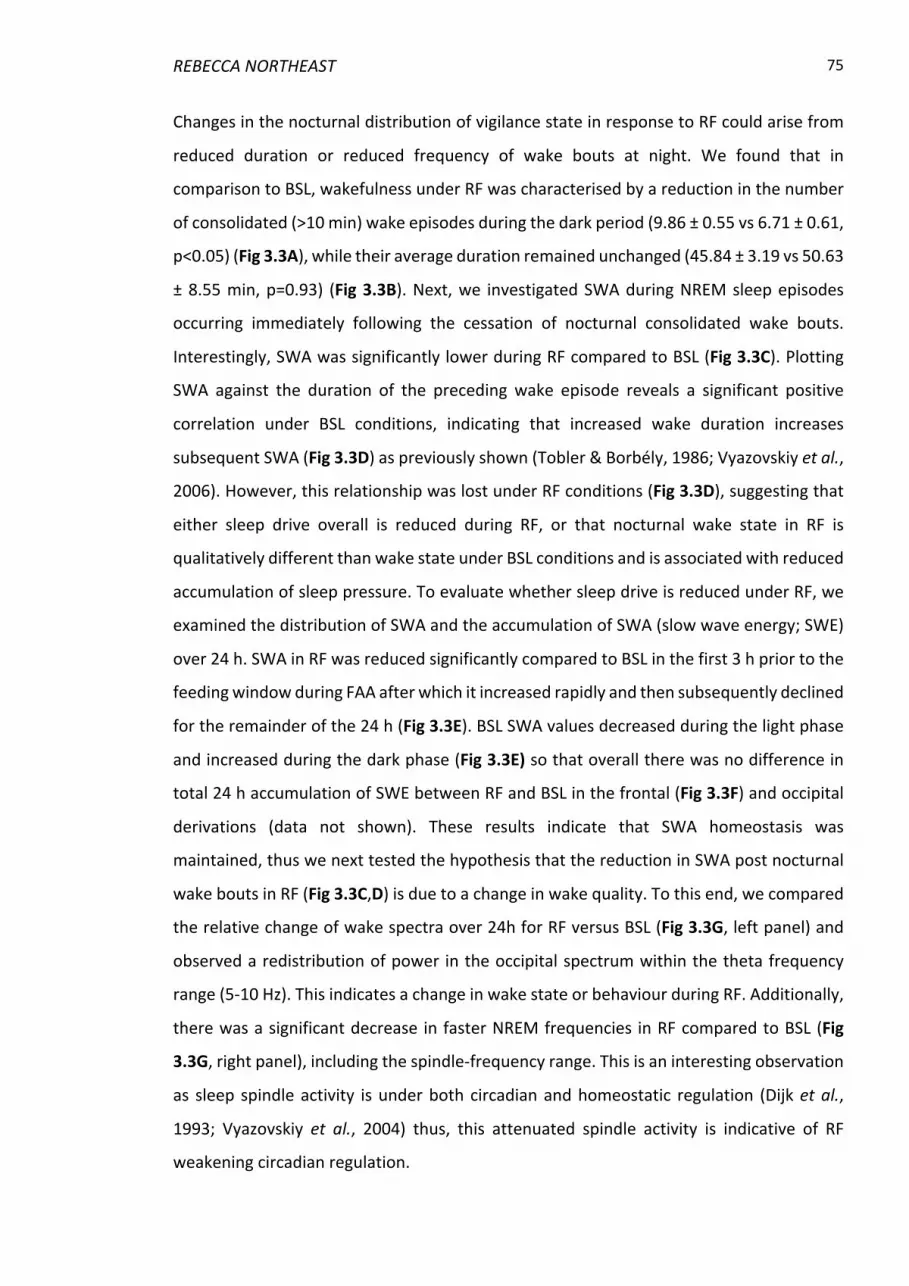
REBECCA NORTHEAST 75
Changes in the nocturnal distribution of vigilance state in response to RF could arise from
reduced duration or reduced frequency of wake bouts at night. We found that in
comparison to BSL, wakefulness under RF was characterised by a reduction in the number
of consolidated (>10 min) wake episodes during the dark period (9.86 ± 0.55 vs 6.71 ± 0.61,
p<0.05) (Fig 3.3A), while their average duration remained unchanged (45.84 ± 3.19 vs 50.63
± 8.55 min, p=0.93) (Fig 3.3B). Next, we investigated SWA during NREM sleep episodes
occurring immediately following the cessation of nocturnal consolidated wake bouts.
Interestingly, SWA was significantly lower during RF compared to BSL (Fig 3.3C). Plotting
SWA against the duration of the preceding wake episode reveals a significant positive
correlation under BSL conditions, indicating that increased wake duration increases
subsequent SWA (Fig 3.3D) as previously shown (Tobler & Borbély, 1986; Vyazovskiy et al.,
2006). However, this relationship was lost under RF conditions (Fig 3.3D), suggesting that
either sleep drive overall is reduced during RF, or that nocturnal wake state in RF is
qualitatively different than wake state under BSL conditions and is associated with reduced
accumulation of sleep pressure. To evaluate whether sleep drive is reduced under RF, we
examined the distribution of SWA and the accumulation of SWA (slow wave energy; SWE)
over 24 h. SWA in RF was reduced significantly compared to BSL in the first 3 h prior to the
feeding window during FAA after which it increased rapidly and then subsequently declined
for the remainder of the 24 h (Fig 3.3E). BSL SWA values decreased during the light phase
and increased during the dark phase (Fig 3.3E) so that overall there was no difference in
total 24 h accumulation of SWE between RF and BSL in the frontal (Fig 3.3F) and occipital
derivations (data not shown). These results indicate that SWA homeostasis was
maintained, thus we next tested the hypothesis that the reduction in SWA post nocturnal
wake bouts in RF (Fig 3.3C,D) is due to a change in wake quality. To this end, we compared
the relative change of wake spectra over 24h for RF versus BSL (Fig 3.3G, left panel) and
observed a redistribution of power in the occipital spectrum within the theta frequency
range (5-10 Hz). This indicates a change in wake state or behaviour during RF. Additionally,
there was a significant decrease in faster NREM frequencies in RF compared to BSL (Fig
3.3G, right panel), including the spindle-frequency range. This is an interesting observation
as sleep spindle activity is under both circadian and homeostatic regulation (Dijk et al.,
1993; Vyazovskiy et al., 2004) thus, this attenuated spindle activity is indicative of RF
weakening circadian regulation.
RHYTHMS, SLEEP AND HOMEOSTASIS
76
Figure 2.3 Slow wave energy homeostasis during food entrainment. A The number of wake episodes (>10 minutes) during the dark period (ZT12-ZT24) in BSL and RF conditions, (paired t-test, *=p<0.05) and (B) the length of these wake episodes (Wilcoxon signed rank, ns). C SWA of sleep episodes in the frontal derivation following prolonged wake episodes during the dark period (>10 minutes; paired t-test, *=p<0.05) and (D) SWA plotted against previous individual wake episode length for BSL and RF (linear regression analysis; p<0.0001 and p=0.75 respectively). E Time course of hourly SWA in the frontal derivation during BSL and RF, data are means ± SEM. Two-way RM ANOVA (factors experiment day and hour), Sidak’s multiple comparisons; *=p<0.05, **=p<0.01, ***=p<0.001, ****=p<0.0001. F Time course of slow wave energy (SWE) during BSL and RF in the frontal derivation, data are means ± SEM. Subsequent comparison of 24h total accumulation of vigilance state was by paired t-test; ns. G EEG power spectra for RF as percentage of BSL for wake (left panel) and NREM (right panel), data are means ± SEM. Two-way ANOVA (factors experiment day and frequency), Sidak’s multiple comparisons; solid black line= p<0.05 for frontal vs BSL, solid grey line=p<0.05 for occipital vs BSL. Open and closed bars indicate lights on and lights off respectively. Yellow shading indicates food availability on the RF day. All error bars represent ± SEM. BSL=baseline, Fro=frontal, Occ=occipital, ns=non-significant, RF=restricted feeding, RM=repeated measures, SWA=slow wave activity, SWE=slow wave energy, ZT=zeitgeber time.
NREMWake
A B C
E F
D
G
REBECCA NORTHEAST 77
2.4.2 The initial response to scheduled feeding
As demonstrated above, homeostatic regulation of sleep was fully established during
stable food entrainment; however, this was not the case during the initial days of the RF
paradigm. Specifically, during the first day of RF (Day 1 RF), food was removed at ZT12 (Fig
2.4A, left panel), and although the rate of NREM increase during the light period
accumulated at the same rate as that seen under BSL conditions, it dropped to a lower rate
during the dark period (SFig 2.3A). This pattern was sustained on Day 3 RF, the first day
food was available for 4h (Fig 2.4A, right panel), where the nocturnal rate of NREM
accumulation significantly decreased during the night (Fig 2.4B & SFig 2.3A). Despite these
changes in the nocturnal rate of accumulation, the amount of NREM over 24h was not
significantly different for Day 1 or Day 3 RF (BSL vs Day 1 RF vs Day 3 RF; 622.8 ± 7.29 vs
586.1 ± 14.17 vs 595.3 ± 18.42 min, p=0.19) (Fig 2.4B). However, when accumulation of
SWE over 24h was examined, a decrease in the rate of accumulation during the night (Fig
2.4C & SFig 2.3B) and an overall decrease in total SWE was revealed for both Day 1 and Day
3 RF (Fig 2.4C). Thus, during the initial adaptation to temporally limited food availability
animals exhibit a change of rate in NREM accumulation but no overall change in the total
amount of NREM. Moreover, nocturnal sleep drive appears to be suppressed during the
initial days of scheduled feeding. Specifically, although the number of nocturnal wake
episodes are reduced compared to BSL by Day 3 RF (BSL vs Day 1 RF vs Day 3 RF; 9.86 ±
1.46 vs 8.14 ± 0.51 vs 4.83 ± 0.46, BSL vs Day 3 RF p<0.01) (Fig 2.4D), these wake episodes
are significantly longer (BSL vs Day 1 RF vs Day 3 RF; 45.84 ± 3.19 vs 62.85 ± 7.93 vs 100.8
± 12.39 min, BSL vs Day 3 RF p<0.01) (Fig 2.4E; evident in the example hypnogram, Fig 2.4A
right panel). Taken together these data indicate that SWE and nocturnal waking episodes
during the first few days of the RF paradigm do not exhibit robust homeostatic control and
that sleep drive can be in part overridden by metabolic pressure induced by RF.

RHYTHMS, SLEEP AND HOMEOSTASIS
78
Figure 2.4 Adapting to the restricted feeding paradigm. A Example hyponograms, displaying slow wave activity over time, for Day 1 RF (left panel) where food is removed at ZT12 and Day 3 RF (right panel) the first day where food is available for 4h ZT4-ZT8. Note the prolonged wakefulness in the dark period in Day 3 RF vs Day 1 RF. Yellow shading indicates food availability. SWA is plotted in 4 s epochs and is color-coded according to the vigilance state (waking: blue, NREM sleep: green, REM sleep: red). B Time course of cumulative NREM and (C) time course of frontal derivation SWE hourly over 24h for BSL, Day 1 RF and Day 3 RF, data are means ± SEM. Subsequent comparison of 24 h total accumulation of vigilance state was by RM one-way ANOVA, Dunnett’s multiple comparison test, *=p<0.05 BSL VS Day 1 RF, ##=p<0.01 BSL vs Day 3 RF. D Number of consolidated wake episodes during the dark period (>10 mins) and (E) the length of these episodes for BSL, Day 1 RF and Day 3 RF. RM one-way ANOVA, Dunnett’s multiple comparison test, **=p<0.01. All error bars represent ± SEM. BSL=baseline, ns=non-significant, RF=restricted feeding, RM=repeated measures, SWA=slow wave activity, SWE=slow wave energy, ZT=zeitgeber time.
Day 1 RF Day 3 RF
Wake NREM REM
A
B C
D E
1 mV
2 h
REBECCA NORTHEAST 79
2.4.3 Restricted feeding versus timed sleep deprivation
To address whether the build-up of sleep pressure after FAA is qualitatively different to
more active exploratory waking, we next performed sleep deprivation in ad libitum fed
mice mimicking the same time of day animals spent in prolonged wakefulness during FAA
and subsequent eating (Fig 5.5A). Importantly, the total amount of consolidated
wakefulness was not significantly different during food anticipation (RF day) versus sleep
deprivation (SDP) day (RF vs SDP; 182.7 vs 193.4 min, p=0.59) (Fig 5.5B), and the total daily
amount of waking and the hourly distribution of wake was also not significantly different
between the two days (Fig 5.5C). Despite this however, qualitative differences in this
prolonged wake state were apparent; the theta peak in the occipital EEG spectra was
reduced in amplitude and displaced to lower frequencies during the RF day compared to
SDP day (Fig 5.5D). Higher theta activity is typically associated with active and/or
exploratory wakefulness (Vyazovskiy et al., 2006; Fisher et al., 2016), which is related to a
faster increase in sleep pressure (Huber et al., 2007; Vassalli & Franken, 2017). Consistent
with this, in the frontal derivation we observed a higher rebound of sleep SWA during the
1st hour of sleep following enforced SDP as compared to spontaneous sleep measured after
a similar duration of waking associated with FAA (Fig 5.5E). Similarly, the rate of SWE
increase in the 5-6h following sleep perturbation (i.e. daytime SDP or FAA/feeding) and the
total amount of SWE over 24 h were higher during SDP day when compared to RF condition
(Fig 5.5F). These results indicate an adaptive response during entrainment to RF resulting
in a lower build-up of sleep pressure despite being continuously awake for the same
amount of time.
Thus, our study highlights the extensive reorganisation of the 24 h distribution of
wakefulness and sleep, as well as sleep and wake quality caused by timed restricted
feeding. Furthermore, our data indicate that wake associated with FAA differs from active
waking in animals fed ad libitum and may be associated with a slower build-up of sleep
pressure. Nevertheless, our findings suggest that despite the substantial changes in wake
and sleep distribution induced by RF, overall sleep homeostasis is maintained.

RHYTHMS, SLEEP AND HOMEOSTASIS
80
Figure 2.5 Sleep deprivation challenge. A Representative hypnograms for the first 8 hours of the RF day (top panel) and SDP day (bottom panel). SWA is plotted in 4 s epochs and is color-coded according to the vigilance state (waking: blue, NREM sleep: green, REM sleep: red). B Amount of consolidated wake from 2h before meal time or during SDP until the first prolonged sleep episode (paired t-test; ns). C Time course of hourly wake for RF day and SDP day. Two-way RM ANOVA (factors experiment day and hour), ns. D Average EEG spectra for the prolonged wake episodes during SDP or RF in the occipital derivation. Two-way RM ANOVA (factors day and frequency), Sidak’s multiple comparisons; solid black line = p<0.05. E EEG power spectra for NREM in the first hour post RF or SDP prolonged wakefulness as percentage of BSL in the frontal derivation. Two-way ANOVA (factors day and frequency), Sidak’s multiple comparisons; solid black line=p<0.05 for RF vs SDP comparison. F Time course of cumulative SWE during the RF day and SDP for the frontal derivation. Data are mean ± SEM, Subsequent comparison of 24h total accumulation of vigilance state was by paired t-test, **p<0.01. Light grey shading indicates the sleep deprivation period on the SDP day. Yellow shading indicates food availability on the RF day. Open and closed bars indicate lights on and lights off respectively. BSL=baseline, RF=restricted feeding, RM=repeated measures, ns=non-significant, SDP=sleep deprivation.
RF
1 mV
2 h
SDP
2
A
D E
B
F
C
REBECCA NORTHEAST 81
2.5 Discussion
Sleep timing is regulated in a circadian manner, and sleep deprivation impacts the
expression of core clock genes in the cortex (Mongrain et al., 2011; Curie et al., 2013;
Franken, 2013), suggesting an existence of a bi-directional interaction between sleep
regulatory systems and canonical clock mechanisms. Restricting food availability to the
light phase leads to anticipation of food through wakefulness and arousal, even in the
absence of the SCN, yet the neurophysiological substrates of this phenomenon remain
obscure (Pendergast & Yamazaki, 2018). One of the most profound effects of FAA is the
behavioural reorganisation and consequent changes in the timing of sleep and wakefulness
(Mieda et al., 2004; Szentirmai et al., 2010; Castro-Faúndez et al., 2016). This implies that
the regulatory mechanisms governing wake-sleep control are strongly influenced by
metabolic need and/or food entrainment specifically, and that such a reorganisation of
sleep may be an integral part of the development of FAA. In this study, we demonstrated
a profound effect of RF on the amount and distribution of EEG and EMG defined
sleep/wake cycles in mice. Initially, during day 1 and day 3 of RF, sleep was decreased in
the dark phase with the length of wake episodes also increased, as similarly reported by
others (Mieda et al., 2004; Szentirmai et al., 2010; Castro-Faúndez et al., 2016).
Furthermore, we found that despite these gross changes in sleep wake distribution, there
was no overall change in the total amount of sleep and wake vigilance states over 24 h,
which is supported by other studies using mice (Mieda et al., 2004; Szentirmai et al., 2010).
We found that RF not only affected the distribution of sleep and wake across 24 h, but also
wake and sleep quality, as manifested in region-specific changes of the EEG spectra.
Specifically, wake EEG spectra under RF showed signs of decreased arousal, associated with
reduced rebound SWA during subsequent sleep. Nevertheless, a striking observation was
that sleep homeostasis remained intact whereby the overall daily amount of wake and
sleep, as well as the total daily amount of SWA were maintained. Homeostatic regulation
of sleep and wake during RF was not an immediate phenomenon as this took time to
develop, appearing in parallel with FAA, suggesting that entrainment to food may require
robust homeostatic control of sleep or vice versa.
RHYTHMS, SLEEP AND HOMEOSTASIS
82
Previous studies showed that anatomical or functional ablation of the SCN in rodents does
not have a marked effect on the total amount of sleep and wake or the homeostatic
response to sleep loss (Mistlberger et al., 1983; Tobler et al., 1983; Easton et al., 2004). All
knock-out mouse models, in which specific core clock genes were deleted, still sleep, yet
with a range of effects on sleep dynamics and sleep homeostasis (reviewed in Deboer,
2018). Additionally, the need for a functional molecular clock in the manifestation of FAA
is proving difficult to unravel as some clock genes such as such as Cry1/Cry2 alter the
appearance of FAA (Takasu et al., 2012) and others such as Rev-erba (Delezie et al., 2016)
are required for true FAA development (reviewed in Pendergast & Yamazaki, 2018). As the
neural substrates activated by RF are unclear, their relationship with sleep regulation
remains to be determined; however, our results of preserved sleep homeostasis during
FAA suggest the possibility of an interaction between the mechanisms responsible for the
development of both these phenomena. This hypothesis remains to be tested directly, for
example, by investigating whether increasing sleep pressure attenuates FAA. On the other
hand, it is possible that the interaction between food entrainment and sleep homeostasis
occurs at the level of specific sleep-wake promoting nuclei, which monitor and integrate
the energy status of the organism and sleep need (Kosse & Burdakov, 2014; Kosse et al.,
2015). It is clear that peripheral metabolic signals related to feeding/fasting state
contribute to the expression of FAA (Chavan et al., 2016) and to the phase entrainment of
peripheral clocks to daytime feeding regimens (Mukherji et al., 2015). Peripheral metabolic
signals also have a potential role in modulating sleep homeostasis (Chikahisa et al., 2008,
2014), and may therefore represent a coordinating signal for the reorganisation of sleep
cycles and sleep homeostasis during RF.
The homeostatic regulation of sleep is reflected in a progressive increase in sleep pressure
during waking which decreases within the sleep state (Borbély, 1982). The best
characterised physiological indicator of sleep-wake history is the level of cortical SWA,
which is high in early sleep and after sleep deprivation but decreases progressively to reach
low levels in late sleep (Franken et al., 2001). We also demonstrated that SWA was reduced
immediately following prolonged wakefulness from FAA in comparison to matched sleep
deprivation in ad libitum fed animals. This may be due to differences in the waking
behaviours during the food restriction and sleep deprivation conditions, in which sleep

REBECCA NORTHEAST 83
deprivation may involve more exploratory behaviours. This is supported by previous
evidence which showed the specific context of waking behaviours to influence subsequent
sleep characteristics (Fisher et al., 2016; Vassalli & Franken, 2017). Additionally, RF and SDP
has been shown to alter clock genes in the cortex (Wakamatsu et al., 2001; Franken et al.,
2007; Wisor et al., 2008). This indicates a role for the circadian clock in integrating feeding
with cortical arousal allowing animals to interact with their environment. We surmise that
reduced SWA after night time wake episodes during RF (relative to BSL) is related to an
elevated activity of arousal-promoting regions, such as the orexigenic system, which is
activated by food restriction (Mieda et al., 2004). SCN activity can be attenuated during RF
(Dattolo et al., 2016), therefore it is likely that this weakened circadian drive allows the
emergence of altered sleep/wake patterning. FAA is a highly conserved evolutionary
mechanism, enabling survival through behavioural flexibility in arousal, thus facilitating
adaption to changes in food availability. Therefore, we propose that this apparent decrease
in sleep drive during food entrainment is part of an evolutionary survival mechanism,
enabling animals to more readily wake and anticipate food availability.
We observed that not only NREM sleep SWA, but also faster frequencies, notably including
the spindle-frequency range, were reduced during RF. This finding is interesting, as existing
evidence in both humans and rodents suggests that sleep spindles undergo both circadian
and homeostatic regulation (Dijk et al., 1993; Vyazovskiy et al., 2004). This observation
therefore indicates that RF is associated with a weakened circadian drive, which results in
an attenuation of spindle activity. A reduction of spindle activity may also be expected if
the preceding wake state is qualitatively different in the RF condition. Consistent with this
possibility, we observed a left-ward shift of the theta peak and a drop of spectral power in
higher theta-frequencies during wake over 24 h. Theta-activity is viewed as a hallmark of a
highly active awake state in rodents (O’Keefe & Recce, 1993; Buzsáki, 2002), and may also
reflect preceding sleep-wake history, both in animals and humans (Finelli et al., 2000;
Vyazovskiy & Tobler, 2005; Vassalli & Franken, 2017). The possibility remains that the
slowing of theta-peak during RF not only reflects a reduced amount of nocturnal
exploratory waking, but also mild hypothermia (Deboer, 2002), which can be expected in
conditions of food restriction (Szentirmai et al., 2010). However, earlier studies showing a
lack of relationship between cortical temperature and SWA after SDP (Franken et al., 1991)
RHYTHMS, SLEEP AND HOMEOSTASIS
84
and our findings that the effects of RF on the EEG was not uniform across the brain but
differed between cortical regions speak against this possibility.
In summary, here we show that food restriction had a profound impact on the daily sleep-
wake architecture, as well as wake and sleep quality. However, despite the substantial
changes in the daily distribution and quality of wake and sleep induced by RF, sleep
homeostasis during stable food entrainment was generally maintained. While sleep
amount and regulation are believed to have a strong genetic component, the role of
ecological factors is becoming increasingly recognised. We propose that the reorganisation
of sleep timing and acute sleep characteristics around mistimed food availability highlights
a wider system of homeostatic control, responsible for the regulation and coordination
between vital biological needs, including feeding and sleep, and the interaction of the
organism with the environment.

REBECCA NORTHEAST 85
2.6 Supplemental Material
Supplemental Figure 2.1 Simultaneous recording of body temperature and brain activity during torpor in an individual C57BL/6J mouse. A A photograph of the thermal imaging camera. B Representative thermal image of a mouse acquired with the camera. C Representative traces of the EEG recorded from the frontal cortex, and EMG during NREM sleep (top) and torpor (bottom). Note a reduced EEG amplitude and low heart rate during torpor. D Peripheral body temperature trace acquired by the thermal imaging camera and EEG slow-wave activity (0.5-4Hz, SWA) during the 12 h dark period with an episode of fasting-induced torpor in an individual mouse. SWA is plotted in 4s epochs and is color-coded according to the vigilance state (waking: blue, NREM sleep: green, REM sleep: red). The curve at the top is corresponding to body temperature. Note the decrease in body temperature during the episode of torpor. EMG=electromyogram, SWA=slow wave activity.
24
28
32
WakeNREMREM
Temp oC
2 h
SWA 1mV2
1 s100µV
NREM sleep
torpor
EEG
EMG
A C D
B
torpor
24
28
32
WakeNREMREM
Temp oC
2 h
SWA 1mV2
1 s100µV
NREM sleep
torpor
EEG
EMG
A C D
B
torpor
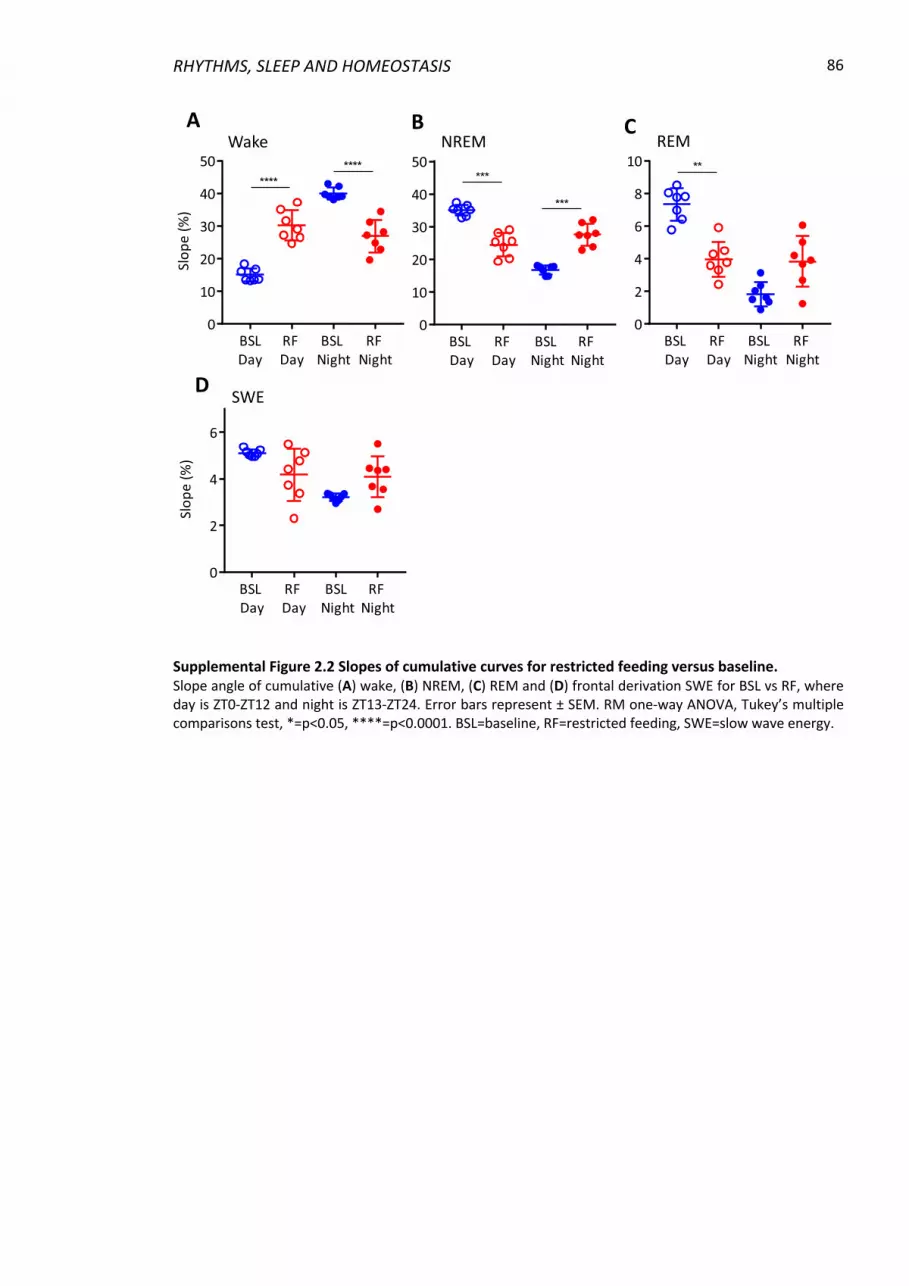
RHYTHMS, SLEEP AND HOMEOSTASIS
86
Supplemental Figure 2.2 Slopes of cumulative curves for restricted feeding versus baseline. Slope angle of cumulative (A) wake, (B) NREM, (C) REM and (D) frontal derivation SWE for BSL vs RF, where day is ZT0-ZT12 and night is ZT13-ZT24. Error bars represent ± SEM. RM one-way ANOVA, Tukey’s multiple comparisons test, *=p<0.05, ****=p<0.0001. BSL=baseline, RF=restricted feeding, SWE=slow wave energy.
NREMWake REMA B C
SWED
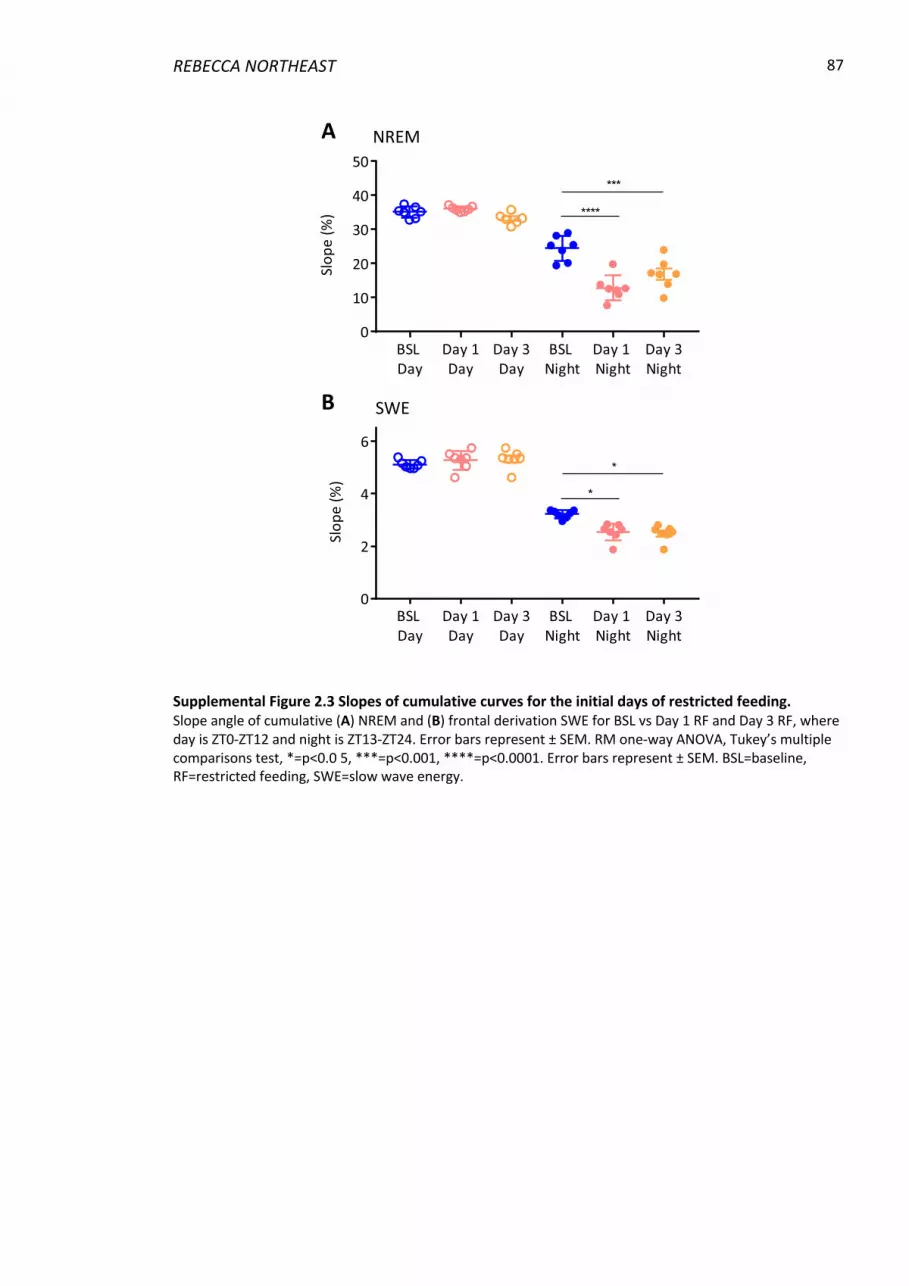
REBECCA NORTHEAST 87
Supplemental Figure 2.3 Slopes of cumulative curves for the initial days of restricted feeding. Slope angle of cumulative (A) NREM and (B) frontal derivation SWE for BSL vs Day 1 RF and Day 3 RF, where day is ZT0-ZT12 and night is ZT13-ZT24. Error bars represent ± SEM. RM one-way ANOVA, Tukey’s multiple comparisons test, *=p<0.0 5, ***=p<0.001, ****=p<0.0001. Error bars represent ± SEM. BSL=baseline, RF=restricted feeding, SWE=slow wave energy.
NREMA
SWEB
RHYTHMS, SLEEP AND HOMEOSTASIS
88
2.7 References Arrigoni, E., Chee, M.J.S., & Fuller, P.M. (2018) To eat or to sleep: That is a lateral
hypothalamic question. Neuropharmacology,. 2018.11.07 [in press]. Borbély, A.A. (1982) A two process model of sleep regulation. Hum. Neurobiol., 1, 195–
204. Borbély, A.A., Daan, S., Wirz-Justice, A., & Deboer, T. (2016) The two-process model of
sleep regulation: a reappraisal. J. Sleep Res., 25, 131–143. Brown, R.E., Basheer, R., McKenna, J.T., Strecker, R.E., & McCarley, R.W. (2012) Control of
sleep and wakefulness. Physiol. Rev., 92, 1087–1187. Buzsáki, G. (2002) Theta Oscillations in the Hippocampus. Neuron, 33, 325–340. Castro-Faúndez, J., Díaz, J., & Ocampo-Garcés, A. (2016) Temporal Organization of the
Sleep-Wake Cycle under Food Entrainment in the Rat. Sleep, 39, 1451–1465. Chavan, R., Feillet, C., Costa, S.S.F., Delorme, J.E., Okabe, T., Ripperger, J.A., & Albrecht, U.
(2016) Liver-derived ketone bodies are necessary for food anticipation. Nat. Commun., 7, 10580.
Chikahisa, S., Shimizu, N., Shiuchi, T., & Séi, H. (2014) Ketone body metabolism and sleep homeostasis in mice. Neuropharmacology, 79, 399–404.
Chikahisa, S., Tominaga, K., Kawai, T., Kitaoka, K., Oishi, K., Ishida, N., Rokutan, K., & Séi, H. (2008) Bezafibrate, a Peroxisome Proliferator-Activated Receptors Agonist, Decreases Body Temperature and Enhances Electroencephalogram Delta-Oscillation during Sleep in Mice. Endocrinology, 149, 5262–5271.
Constantinople, C.M. & Bruno, R.M. (2011) Effects and mechanisms of wakefulness on local cortical networks. Neuron, 69, 1061–1068.
Curie, T., Mongrain, V., Dorsaz, S., Mang, G.M., Emmenegger, Y., & Franken, P. (2013) Homeostatic and Circadian Contribution to EEG and Molecular State Variables of Sleep Regulation. Sleep, 36, 311–323.
Dattolo, T., Coomans, C.P., van Diepen, H.C., Patton, D.F., Power, S., Antle, M.C., Meijer, J.H., & Mistlberger, R.E. (2016) Neural activity in the suprachiasmatic circadian clock of nocturnal mice anticipating a daytime meal. Neuroscience, 315, 91–103.
Deboer, T. (2002) Electroencephalogram theta frequency changes in parallel with euthermic brain temperature. Brain Res., 930, 212–215.
Deboer, T. (2018) Sleep homeostasis and the circadian clock: Do the circadian pacemaker and the sleep homeostat influence each other’s functioning? Neurobiol. Sleep Circadian Rhythm., 5, 68–77.
Delezie, J., Dumont, S., Sandu, C., Reibel, S., Pevet, P., & Challet, E. (2016) Rev-erbα in the brain is essential for circadian food entrainment. Sci. Rep., 6, 29386.
Dijk, D.J., Hayes, B., & Czeisler, C.A. (1993) Dynamics of electroencephalographic sleep spindles and slow wave activity in men: effect of sleep deprivation. Brain Res., 626, 190–199.
Dudley, C.A., Erbel-Sieler, C., Estill, S.J., Reick, M., Franken, P., Pitts, S., & McKnight, S.L. (2003) Altered patterns of sleep and behavioral adaptability in NPAS2-deficient mice. Science, 301, 379–383.
Easton, A., Meerlo, P., Bergmann, B., & Turek, F.W. (2004) The suprachiasmatic nucleus regulates sleep timing and amount in mice. Sleep, 27, 1307–1318.
Eban-Rothschild, A., Appelbaum, L., & de Lecea, L. (2018) Neuronal Mechanisms for Sleep/Wake Regulation and Modulatory Drive. Neuropsychopharmacology, 43, 937–
REBECCA NORTHEAST 89
952. Finelli, L.A., Baumann, H., Borbély, A.A., & Achermann, P. (2000) Dual
electroencephalogram markers of human sleep homeostasis: correlation between theta activity in waking and slow-wave activity in sleep. Neuroscience, 101, 523–529.
Fisher, S.P., Cui, N., McKillop, L.E., Gemignani, J., Bannerman, D.M., Oliver, P.L., Peirson, S.N., & Vyazovskiy, V. V. (2016) Stereotypic wheel running decreases cortical activity in mice. Nat. Commun., 7, 13138.
Flôres, D.E.F.L., Bettilyon, C.N., Jia, L., & Yamazaki, S. (2016) The Running Wheel Enhances Food Anticipatory Activity: An Exploratory Study. Front. Behav. Neurosci., 10, 143.
Franken, P. (2013) A role for clock genes in sleep homeostasis. Curr. Opin. Neurobiol., 23, 864–872.
Franken, P., Chollet, D., & Tafti, M. (2001) The homeostatic regulation of sleep need is under genetic control. J. Neurosci., 21, 2610–2621.
Franken, P., Dijk, D.J., Tobler, I., & Borbely, A.A. (1991) Sleep deprivation in rats: effects on EEG power spectra, vigilance states, and cortical temperature. Am. J. Physiol. Integr. Comp. Physiol., 261, R198–R208.
Franken, P., Thomason, R., Heller, H.C., & O’Hara, B.F. (2007) A non-circadian role for clock-genes in sleep homeostasis:a strain comparison. BMC Neurosci., 8, 87.
Guillaumin, M.C.C., McKillop, L.E., Cui, N., Fisher, S.P., Foster, R.G., de Vos, M., Peirson, S.N., Achermann, P., & Vyazovskiy, V. V (2018) Cortical region-specific sleep homeostasis in mice: effects of time of day and waking experience. Sleep, 41.
Hastings, M.H., Maywood, E.S., & Brancaccio, M. (2018) Generation of circadian rhythms in the suprachiasmatic nucleus. Nat. Rev. Neurosci., 19, 453–469.
Huber, R., Tononi, G., & Cirelli, C. (2007) Exploratory behavior, cortical BDNF expression, and sleep homeostasis. Sleep, 30, 129–139.
Jones, B.E. (2005) From waking to sleeping: neuronal and chemical substrates. Trends Pharmacol. Sci., 26, 578–586.
Kosse, C. & Burdakov, D. (2014) A unifying computational framework for stability and flexibility of arousal. Front. Syst. Neurosci., 8, 192.
Kosse, C., Gonzalez, A., & Burdakov, D. (2015) Predictive models of glucose control: roles for glucose-sensing neurones. Acta Physiol., 213, 7–18.
Li, Z., Wang, Y., Sun, K.K., Wang, K., Sun, Z.S., Zhao, M., & Wang, J. (2015) Sex-related difference in food-anticipatory activity of mice. Horm. Behav., 70, 38–46.
Lucas, R.J., Lall, G.S., Allen, A.E., & Brown, T.M. (2012) How rod, cone, and melanopsin photoreceptors come together to enlighten the mammalian circadian clock. In Progress in Brain Research. pp. 1–18.
McKillop, L.E., Fisher, S.P., Cui, N., Peirson, S.N., Foster, R.G., Wafford, K.A., & Vyazovskiy, V. V (2018) Effects of Aging on Cortical Neural Dynamics and Local Sleep Homeostasis in Mice. J. Neurosci., 38, 3911–3928.
Mieda, M., Williams, S.C., Sinton, C.M., Richardson, J.A., Sakurai, T., & Yanagisawa, M. (2004) Orexin neurons function in an efferent pathway of a food-entrainable circadian oscillator in eliciting food-anticipatory activity and wakefulness. J. Neurosci., 24, 10493–10501.
Mileykovskiy, B.Y., Kiyashchenko, L.I., & Siegel, J.M. (2005) Behavioral Correlates of Activity in Identified Hypocretin/Orexin Neurons. Neuron, 46, 787–798.
Mistlberger, R.E. (2011) Neurobiology of food anticipatory circadian rhythms. Physiol. Behav., 104, 535–545.
RHYTHMS, SLEEP AND HOMEOSTASIS
90
Mistlberger, R.E., Bergmann, B.M., Waldenar, W., & Rechtschaffen, A. (1983) Recovery Sleep Following Sleep Deprivation in Intact and Suprachiasmatic Nuclei-Lesioned Rats. Sleep, 6, 217–233.
Mitchell, S.E., Delville, C., Konstantopedos, P., Derous, D., Green, C.L., Chen, L., Han, J.-D.J., Wang, Y., Promislow, D.E.L., Douglas, A., Lusseau, D., & Speakman, J.R. (2015) The effects of graded levels of calorie restriction: III. Impact of short term calorie and protein restriction on mean daily body temperature and torpor use in the C57BL/6 mouse. Oncotarget, 6, 18314–18337.
Mongrain, V., La Spada, F., Curie, T., & Franken, P. (2011) Sleep Loss Reduces the DNA-Binding of BMAL1, CLOCK, and NPAS2 to Specific Clock Genes in the Mouse Cerebral Cortex. PLoS One, 6, e26622.
Mukherji, A., Kobiita, A., & Chambon, P. (2015) Shifting the feeding of mice to the rest phase creates metabolic alterations, which, on their own, shift the peripheral circadian clocks by 12 hours. Proc. Natl. Acad. Sci., 112, E6683-6690.
O’Keefe, J. & Recce, M.L. (1993) Phase relationship between hippocampal place units and the EEG theta rhythm. Hippocampus, 3, 317–330.
Palchykova, S., Winsky-Sommerer, R., Meerlo, P., Dürr, R., & Tobler, I. (2006) Sleep deprivation impairs object recognition in mice. Neurobiol. Learn. Mem., 85, 263–271.
Pendergast, J.S. & Yamazaki, S. (2018) The Mysterious Food-Entrainable Oscillator: Insights from Mutant and Engineered Mouse Models. J. Biol. Rhythms, 33, 458–474.
Pilorz, V., Helfrich-Förster, C., & Oster, H. (2018) The role of the circadian clock system in physiology. Pflügers Arch. - Eur. J. Physiol., 470, 227–239.
Polack, P.-O., Friedman, J., & Golshani, P. (2013) Cellular mechanisms of brain state–dependent gain modulation in visual cortex. Nat. Neurosci., 16, 1331–1339.
Szentirmai, É., Kapás, L., Sun, Y., Smith, R.G., & Krueger, J.M. (2010) Restricted feeding-induced sleep, activity, and body temperature changes in normal and preproghrelin-deficient mice. Am. J. Physiol. - Regul. Integr. Comp. Physiol., 298.
Takasu, N.N., Kurosawa, G., Tokuda, I.T., Mochizuki, A., Todo, T., & Nakamura, W. (2012) Circadian Regulation of Food-Anticipatory Activity in Molecular Clock–Deficient Mice. PLoS One, 7, e48892.
Tobler, I. & Borbély, A.A. (1986) Sleep EEG in the rat as a function of prior waking. Electroencephalogr. Clin. Neurophysiol., 64, 74–76.
Tobler, I., Borbély, A.A., & Groos, G. (1983) The effect of sleep deprivation on sleep in rats with suprachiasmatic lesions. Neurosci. Lett., 42, 49–54.
Vassalli, A. & Franken, P. (2017) Hypocretin (orexin) is critical in sustaining theta/gamma-rich waking behaviors that drive sleep need. Proc. Natl. Acad. Sci., 114, E5464–E5473.
Vyazovskiy, V. V., Ruijgrok, G., Deboer, T., & Tobler, I. (2006) Running Wheel Accessibility Affects the Regional Electroencephalogram during Sleep in Mice. Cereb. Cortex, 16, 328–336.
Vyazovskiy, V. V. & Tobler, I. (2005) Theta activity in the waking EEG is a marker of sleep propensity in the rat. Brain Res., 1050, 64–71.
Vyazovskiy, V. V, Achermann, P., Borbély, A.A., & Tobler, I. (2004) The dynamics of spindles and EEG slow-wave activity in NREM sleep in mice. Arch. Ital. Biol., 142, 511–523.
Vyazovskiy, V. V, Cirelli, C., Tononi, G., & Tobler, I. (2008) Cortical metabolic rates as measured by 2-deoxyglucose-uptake are increased after waking and decreased after
REBECCA NORTHEAST 91
sleep in mice. Brain Res. Bull., 75, 591–597. Vyazovskiy, V. V, Deboer, T., Rudy, B., Lau, D., Borbély, A.A., & Tobler, I. (2002) Sleep EEG
in mice that are deficient in the potassium channel subunit K.v.3.2. Brain Res., 947, 204–211.
Vyazovskiy, V. V, Palchykova, S., Achermann, P., Tobler, I., & Deboer, T. (2017) Different Effects of Sleep Deprivation and Torpor on EEG Slow-Wave Characteristics in Djungarian Hamsters. Cereb. Cortex, 27, 950–961.
Vyazovskiy, V. V, Walton, M.E., Peirson, S.N., & Bannerman, D.M. (2017) Sleep homeostasis, habits and habituation. Curr. Opin. Neurobiol., 44, 202–211.
Wakamatsu, H., Yoshinobu, Y., Aida, R., Moriya, T., Akiyama, M., & Shibata, S. (2001) Restricted-feeding-induced anticipatory activity rhythm is associated with a phase-shift of the expression of mPer1 and mPer2 mRNA in the cerebral cortex and hippocampus but not in the suprachiasmatic nucleus of mice. Eur. J. Neurosci., 13, 1190–1196.
Webb, I.C., Antle, M.C., & Mistlberger, R.E. (2014) Regulation of circadian rhythms in mammals by behavioral arousal. Behav. Neurosci., 128, 304–325.
Willie, J.T., Chemelli, R.M., Sinton, C.M., & Yanagisawa, M. (2001) To Eat or to Sleep? Orexin in the Regulation of Feeding and Wakefulness. Annu. Rev. Neurosci., 24, 429–458.
Wisor, J.P., Pasumarthi, R.K., Gerashchenko, D., Thompson, C.L., Pathak, S., Sancar, A., Franken, P., Lein, E.S., & Kilduff, T.S. (2008) Sleep Deprivation Effects on Circadian Clock Gene Expression in the Cerebral Cortex Parallel Electroencephalographic Differences among Mouse Strains. J. Neurosci., 28, 7193–7201.
Wu, M.F., Gulyani, S.A., Yau, E., Mignot, E., Phan, B., & Siegel, J.M. (1999) Locus coeruleus neurons: cessation of activity during cataplexy. Neuroscience, 91, 1389–1399.
RHYTHMS, SLEEP AND HOMEOSTASIS
92
Chapter 3: Time for a Drink? Novel Oscillator Properties in the
Thirst Centres of the Brain
Rebecca C. Northeast1, Lukasz Chrobok1,2*, Alun T. L. Hughes1,3*, Cheryl Petit1, Hugh D.
Piggins1,4
1. Faculty of Biology, Medicine, and Health, AV Hill Building, University of Manchester,
Oxford Road, Manchester, M13 9PT, United Kingdom
2. Current address: Department of Neurophysiology and Chronobiology, Institute of
Zoology and Biomedical Research, Jagiellonian University in Krakow, Poland;
Gronostajowa Street 9, 30-387 Krakow, Poland
3. Current address: School of Natural Sciences and Psychology, Liverpool John Moores
University, Liverpool, United Kingdom
4. Current address: School of Physiology, Pharmacology and Neuroscience, Biomedical
Sciences Building, University of Bristol, Bristol, BS8 1TD, United Kingdom
* Authors contributed equally
Corresponding author: Hugh D. Piggins; School of Physiology, Pharmacology, and
Neuroscience, Faculty of Life Sciences, University of Bristol Bristol BS8 1TD, UK;
Keywords: circadian clock, fluid homeostasis, organum vasculosum lamina terminalis,
PER2::LUC, subfornical organ

REBECCA NORTHEAST 93
3.1 Abstract
Drinking behaviour and osmotic regulatory mechanisms exhibit clear 24 h variation which
is necessary for maintaining homeostatic osmolality. In mammals, the master clock in the
brain’s suprachiasmatic nuclei (SCN) has long been held as the main driver circadian
rhythms in physiology and behaviour. However, rhythmic clock gene expression in other
brain sites raises the possibility of local circadian control of neural activity and function.
The subfornical organ (SFO) and the organum vasculosum laminae terminalis (OVLT) are
two sensory circumventricular organs (sCVOs) that play key roles in the central control of
thirst and water homeostasis, but the extent to which they are subject to intrinsic circadian
control remains undefined. Using a combination of ex vivo bioluminescence and in vivo
gene expression, we report for the first time that the SFO contains an unexpectedly robust
autonomous clock of core and non-core clock gene expression, with unusual
spatiotemporal characteristics of clock gene bioluminescence. Further, putative single cell
oscillators in the SFO and OVLT are strongly rhythmic and require action potential
dependent communication to maintain synchrony. Our results reveal that these thirst-
controlling sCVOs possess intrinsic circadian clocks and raise the possibility local
timekeeping in daily regulation of drinking behaviour.
3.1.1 Statement of significance
In mammals, drinking behaviour demonstrates clear 24 h variation. There are specific areas
in the brain that are important in coordinating drinking behaviour in response to peripheral
fluid balance signals. We demonstrate for the first time a key fluid balance brain area to
have endogenous oscillatory properties. Using bioimaging and molecular techniques we
characterise such oscillatory properties and provide hints at how rhythms are generated in
these thirst regulating brain areas, demonstrating that they are similar to those of the
master oscillator. Our findings reveal important implications into a new avenue of
regulatory properties in these key homeostatic brain areas.
RHYTHMS, SLEEP AND HOMEOSTASIS
94
3.2 Introduction Robust daily rhythms of physiology and behaviour are crucial for optimal health and
wellbeing (Masri & Sassone-Corsi, 2018; Shan et al., 2018; Wefers et al., 2018). In
mammals, these 24 h rhythms are driven by a master clock in the suprachiasmatic nuclei
(SCN), a highly cell dense region in the hypothalamus that receives direct retinal input
thereby enabling SCN entrainment to the external light-dark cycle (Reppert & Weaver,
2002; Lucas et al., 2012). Individual SCN neurons rhythmically express core clock genes and
display daily rhythms in neuronal activity (Belle et al., 2009). These single cell oscillators
thus require intercellular signalling to ensure robust rhythmic output of neuronal and
neuropeptide signals to convey circadian information to the rest of the brain (Hastings et
al., 2018).
Brain areas outside of the SCN, such as the olfactory bulb, mediobasal hypothalamus and
the lateral habenula, also express rhythms in circadian clock genes, and these molecular
oscillations are thought to help regulate the specific functions of those areas (Guilding &
Piggins, 2007; Guilding et al., 2009, 2010; Miller et al., 2014; Sakhi et al., 2014; Pavlovski et
al., 2018). The generation of clock gene reporter constructs, in particular the
PERIOD2::LUCIFERASE (PER2::LUC) mouse, has enabled the real-time visualisation of clock
gene oscillations ex vivo to study tissue-level spatiotemporal dynamics, as well as the
behaviour of single cell oscillators and their interactions (Yoo et al., 2004; Yan et al., 2007).
Importantly, visualisation of bioluminescence signals allows the investigation of potential
timekeeping in smaller brain areas than would otherwise be undetectable using non-image
based luminometry.
Similar to many homeostatic processes, drinking behaviour demonstrates clear circadian
variation (Spiteri, 1982). Two key brain areas known for their roles in the central control of
thirst homeostasis are the subfornical organ (SFO) and the organum vasculosum laminar
terminalis (OVLT) (Miselis et al., 1979; Ramsay et al., 1983; Zimmerman et al., 2017). These
are sensory circumventricular organs (sCVOs); midline structures along the third ventricle
characterised by their lack of a blood-brain barrier and extensive vascularisation (McKinley
et al., 2003). The SFO and OVLT respond to circulating fluid balance signals and plasma
hypertonicity to drive thirst-related neural pathways resulting in altered drinking behaviour
REBECCA NORTHEAST 95
(Gizowski & Bourque, 2017; Zimmerman et al., 2016). The SCN has direct neural
connections with both the SFO and OVLT (Abrahamson & Moore, 2001a), and vasopressin
neurons of the SCN drive a period of anticipatory thirst through excitation of OVLT neurons
(Gizowski et al., 2016). Despite these clear observations of circadian variation in drinking
behaviour, there are currently no reports of endogenous circadian activity in the SFO, while
circadian oscillations in the OVLT oscillations are not extensively defined (Abe et al., 2002;
Abraham et al., 2005; Myung et al., 2018)
Here, we used a combination of ex vivo PER2::LUC bioluminescence imaging and in vivo
gene expression to comprehensively assess circadian rhythmicity of the SFO and OVLT. We
provide the first description of a highly robust circadian clock in the SFO, evaluating its
single cell oscillator properties in comparison to those of the OVLT and the SCN. Using
pharmacological and mechanical manipulations we reveal unique characteristics to the
maintenance of these rhythms. In addition, a comprehensive screening of circadian related
gene expression in the SFO revealed robust in vivo molecular rhythms. Conclusively, our
results show the SFO and OVLT to possess intrinsic timekeeping capabilities at whole tissue
and individual cellular level.
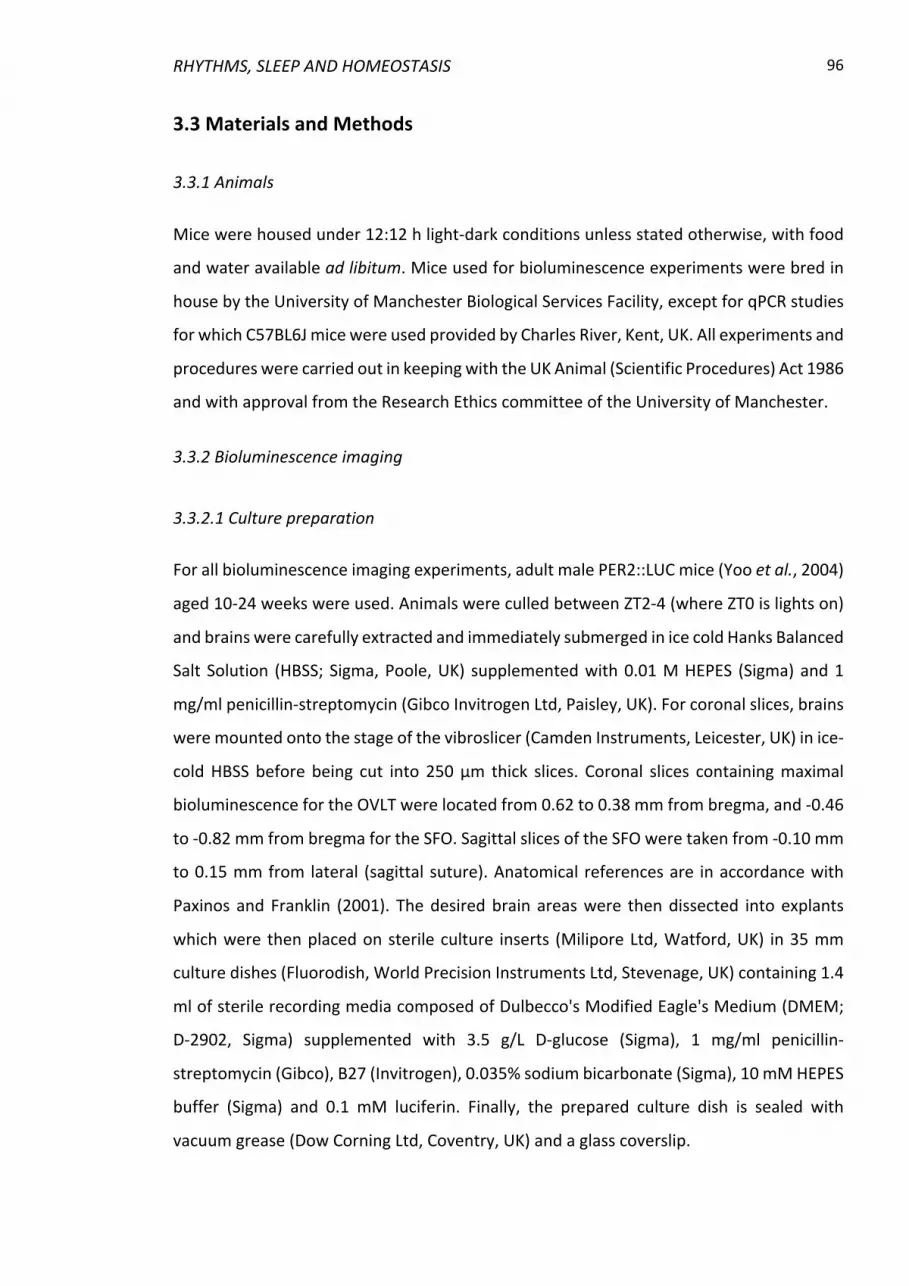
RHYTHMS, SLEEP AND HOMEOSTASIS
96
3.3 Materials and Methods
3.3.1 Animals
Mice were housed under 12:12 h light-dark conditions unless stated otherwise, with food
and water available ad libitum. Mice used for bioluminescence experiments were bred in
house by the University of Manchester Biological Services Facility, except for qPCR studies
for which C57BL6J mice were used provided by Charles River, Kent, UK. All experiments and
procedures were carried out in keeping with the UK Animal (Scientific Procedures) Act 1986
and with approval from the Research Ethics committee of the University of Manchester.
3.3.2 Bioluminescence imaging
3.3.2.1 Culture preparation
For all bioluminescence imaging experiments, adult male PER2::LUC mice (Yoo et al., 2004)
aged 10-24 weeks were used. Animals were culled between ZT2-4 (where ZT0 is lights on)
and brains were carefully extracted and immediately submerged in ice cold Hanks Balanced
Salt Solution (HBSS; Sigma, Poole, UK) supplemented with 0.01 M HEPES (Sigma) and 1
mg/ml penicillin-streptomycin (Gibco Invitrogen Ltd, Paisley, UK). For coronal slices, brains
were mounted onto the stage of the vibroslicer (Camden Instruments, Leicester, UK) in ice-
cold HBSS before being cut into 250 µm thick slices. Coronal slices containing maximal
bioluminescence for the OVLT were located from 0.62 to 0.38 mm from bregma, and -0.46
to -0.82 mm from bregma for the SFO. Sagittal slices of the SFO were taken from -0.10 mm
to 0.15 mm from lateral (sagittal suture). Anatomical references are in accordance with
Paxinos and Franklin (2001). The desired brain areas were then dissected into explants
which were then placed on sterile culture inserts (Milipore Ltd, Watford, UK) in 35 mm
culture dishes (Fluorodish, World Precision Instruments Ltd, Stevenage, UK) containing 1.4
ml of sterile recording media composed of Dulbecco's Modified Eagle's Medium (DMEM;
D-2902, Sigma) supplemented with 3.5 g/L D-glucose (Sigma), 1 mg/ml penicillin-
streptomycin (Gibco), B27 (Invitrogen), 0.035% sodium bicarbonate (Sigma), 10 mM HEPES
buffer (Sigma) and 0.1 mM luciferin. Finally, the prepared culture dish is sealed with
vacuum grease (Dow Corning Ltd, Coventry, UK) and a glass coverslip.
REBECCA NORTHEAST 97
3.3.2.2 Forskolin and tetrodotoxin treatments
Forskolin (10 µM; Sigma) treatments were performed as fresh media changes on day 5 or
day 7 of the recordings at CT6. Tetrodoxin (TTx; Tocris, Bristol, UK) experiments were
performed with 0.5 µM TTx in the media for the duration of the recordings.
3.3.2.3 Data acquisition and analysis
Cultures prepared as above were immediately transferred to the heated stage (37 °C) of
the bioluminescent imaging system Luminoview LV200 (Olympus, Japan) fitted with a
cooled Hamamatsu ImageEM C9100-13 EM-CCD camera and a 20 x 0.4 NA Plan Apo
objective (Olympus). Darkness was maintained throughout the recordings, gain was kept
consistent within the structures and exposure time was 60 minutes for all recordings.
Images were analysed in ImageJ, using a region of interest selection tool to outline putative
single cells or whole brain areas for measuring relative bioluminescence over time. Raw
data were subject to a 3 h running average smooth and the first 12 h of all recordings were
excluded prior to analysis. Peaks and troughs of individual bioluminescence traces were
determined manually. At least three peak to peak and two peak to trough measurements
were used to calculate period and amplitude respectively. Damping rate was determined
as relative to the amplitude of the peak on day 2 for baseline or day 0 of forskolin
treatment. Rayleigh plots of peak phase and their corresponding r values were created
using El Temps (University of Barcelona, Spain).
3.3.2.4 Statistics
All statistical analyses were performed using Prism 7 (GraphPad Software, USA). To
compare single cell oscillation periods and the standard deviation of these periods, t-test,
paired t-test or one-way ANOVA followed by Tukey’s multiple comparisons were used
where appropriate. To assess differences in Rayleigh values and relative amplitude, two-
way repeated measures (RM) ANOVA followed by Sidak’s multiple comparison test was
used. To assess desynchronisation or relative damping rates, linear regression model was
used. Data are presented as mean ± SEM.
RHYTHMS, SLEEP AND HOMEOSTASIS
98
3.3.3 Quantitative Real-Time PCR
3.3.3.1 Tissue preparation and RNA extraction
10 week old male C57BL6J mice (n=19) were culled at four time points across the circadian
cycle: CT0, CT6, CT12, CT18 (n=4-5) after being placed in constant darkness for 36-48 h.
Brains were removed and flash frozen in dry ice. 20 µm sections containing the SFO were
cut onto PEN-membrane slides (Leica Biosystems, Germany) using a cryostat (Leica
CM3050 S). For laser-capture microdissection (LCM), sections were stained with 1% cresyl
violet (Sigma) in 70% ethanol before regions of interest were extracted on a laser-capture
microscope system (Leica DM6000 B) and stored in lysis buffer (Promega). Immediately
following, the dissected tissue underwent RNA extraction using the ReliaPrep RNA Tissue
Miniprep System (Promega, USA), performed according to the manufacturer’s instructions.
Reverse-transcription was performed using the High-Capacity RNA-to-cDNA Kit (Applied
Biosystems, USA).
3.3.3.2 RT2 Profiler PCR Array
cDNA from above was amplified using the RT2 PreAMP Pathway Primer Mix and the RT2
PreAMP PCR Mastermix (category number: PBM-153Z, Qiagen, UK) in accordance with the
manufacturers protocol. The resulting product was then loaded onto a RT2 Profiler PCR
Array (category number: PAMM-153Z), a PCR plate preloaded with qPCR primers of genes
related to circadian rhythms (Supplemental Table 1.). Thermal cycling and data collection
were performed using an Applied Biosystems 7900HT Fast Real-Time PCR thermocycler.
3.3.3.3 Data and statistical analysis
Data analysis was performed in accordance with the manufacturer’s guidelines using the
ΔΔCT method, whereby GAPDH was used as the housekeeping gene with CT0 values used
as the relative target gene expression. Due to non-Gaussian distribution of values in most
groups, the Kruskal-Wallis test was used to assess temporal variation in gene expression.
All data are shown as means for each time point ± SEM.

REBECCA NORTHEAST 99
3.4 Results
3.4.1 The SFO and OVLT exhibit robust oscillations in PER2::LUC
The SFO and OVLT are two small, midline brain sCVOs implicated in drinking homeostasis
and behaviour. Previous studies have reported weak bioluminescence rhythms in the OVLT
(Abe et al., 2002; Myung et al., 2018) while currently there is no evidence of circadian
rhythmicity in the SFO. Using sensitive imaging systems, we were able to visualise for the
first time PER2::LUC bioluminescence in coronal brain slices containing the SFO (Fig 3.1Aa)
or the OVLT (Fig 3.1Ab). Moreover, it was possible to track bioluminescence in oscillating
putative single cells, thereby enabling the study of their integral rhythmic properties within
the culture explant. Examination of single cell traces from 6 day recordings in the SFO (Fig
3.1Ba) and OVLT (Fig 3.1Bb) revealed that within each structure, individual cells exhibited
robust oscillations which maintained relatively high amplitude and synchrony for at least
4-5 days. These single cells oscillators visibly desynchronised as shown through Rayleigh
vector (r) analyses at a similar rate in both structures (SFO; r slope = -0.15 ± 0.006, OVLT; r
slope = -0.12 ± 0.018, p=0.32) (Fig 3.1C). Surprisingly, whole area bioluminescence in the
SFO was significantly less damped in relative amplitude by day 4 compared to the OVLT
(p<0.01) (Fig 3.1D), indicating that SFO oscillators are better able to maintain their
amplitude over time. The mean periods of the single cell oscillators were similar in both
structures (SFO 23.31 ± 0.25 h, OVLT 23.58 ± 0.30 h; p=0.51) (Fig 3.1E) as was the variability
of these cellular periods (Fig 3.1F).
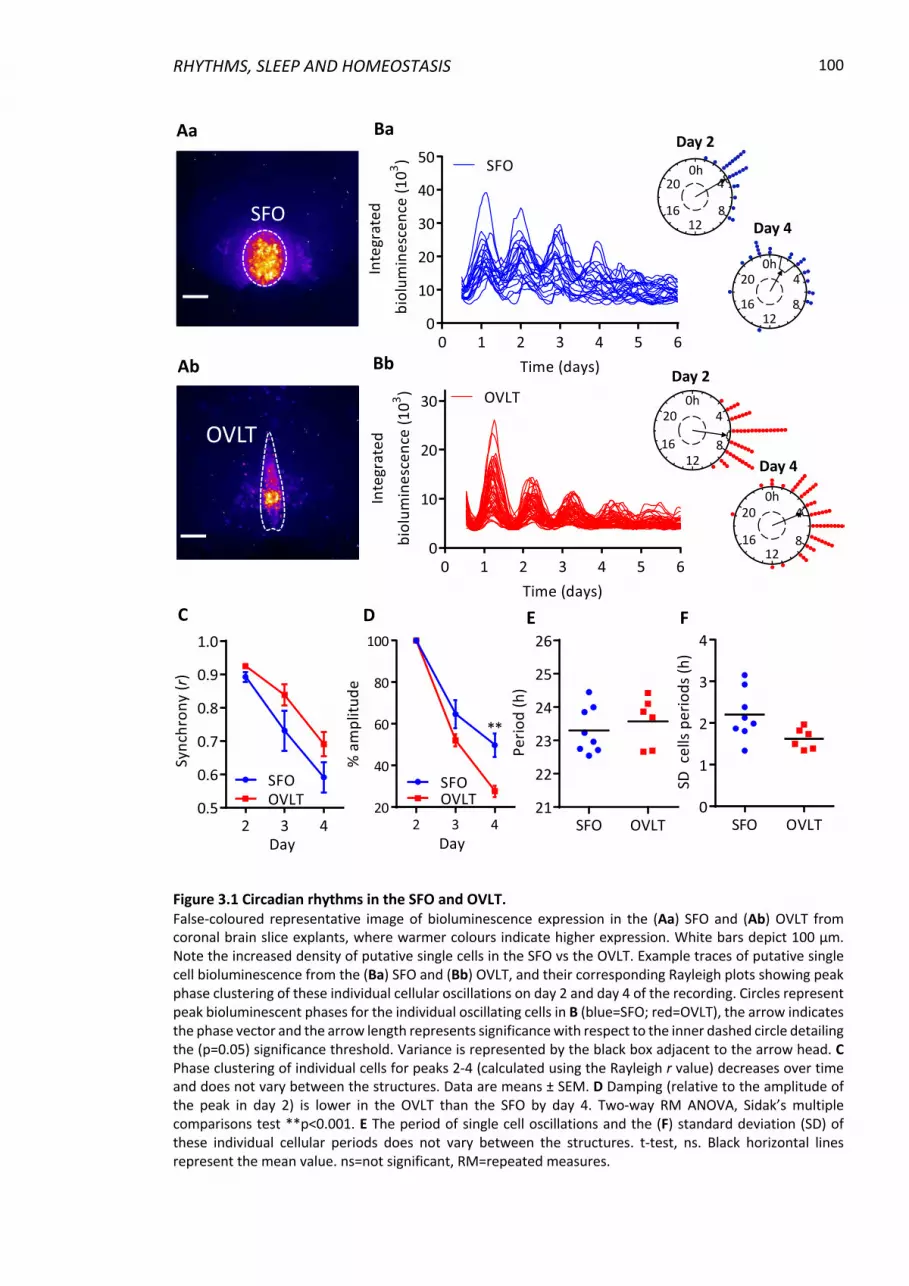
RHYTHMS, SLEEP AND HOMEOSTASIS
100
Figure 3.1 Circadian rhythms in the SFO and OVLT. False-coloured representative image of bioluminescence expression in the (Aa) SFO and (Ab) OVLT from coronal brain slice explants, where warmer colours indicate higher expression. White bars depict 100 µm. Note the increased density of putative single cells in the SFO vs the OVLT. Example traces of putative single cell bioluminescence from the (Ba) SFO and (Bb) OVLT, and their corresponding Rayleigh plots showing peak phase clustering of these individual cellular oscillations on day 2 and day 4 of the recording. Circles represent peak bioluminescent phases for the individual oscillating cells in B (blue=SFO; red=OVLT), the arrow indicates the phase vector and the arrow length represents significance with respect to the inner dashed circle detailing the (p=0.05) significance threshold. Variance is represented by the black box adjacent to the arrow head. C Phase clustering of individual cells for peaks 2-4 (calculated using the Rayleigh r value) decreases over time and does not vary between the structures. Data are means ± SEM. D Damping (relative to the amplitude of the peak in day 2) is lower in the OVLT than the SFO by day 4. Two-way RM ANOVA, Sidak’s multiple comparisons test **p<0.001. E The period of single cell oscillations and the (F) standard deviation (SD) of these individual cellular periods does not vary between the structures. t-test, ns. Black horizontal lines represent the mean value. ns=not significant, RM=repeated measures.
SFO
Perio
d (h
)
SFO OVLT21
22
23
24
25
26
Day 4
Day 2
0h4
812
16
20
0h4
812
16
20
OVLT0h
4
812
16
20
0h4
812
16
20
Day 2
Day 4
Aa
Ab Bb
Ba
C D E F

REBECCA NORTHEAST 101
In addition, we performed baseline bioluminescence imaging recordings of coronal SCN
explants to compare single cell oscillatory properties in the brain’s master clock with those
of the SFO and OVLT. We observed that the OVLT and SFO became more desynchronised
over time in comparison to the SCN (SCN vs OVLT, day 3 p<0.001 day and 4 p<0.0001; SCN
vs SFO, day 4 p<0.001) (SFig 3.1A). Interestingly, the SFO damped at similar rate to the SCN,
while the OVLT which was significantly more damped than the SCN by day 3 and 4 (SCN vs
OVLT, day 3 p<0.05 and day 4 p<0.001) (SFig 3.1B). Initially, all three structures peak at
similar times (CT; SCN 8.21 ± 0.46, SFO 6.88 ± 0.79, OVLT 8.28 ± 0.50 h, p=0.84) (SFig 3.1C)
and the periods of individual oscillatory cells in the SFO and OVLT did not differ from those
of the SCN (SCN 23.31 ± 0.25h, SFO 23.58 ± 0.30h, OVLT 23.64 ± 0.14h, p=0.62) (SFig 3.1D).
However, the periods of these individual cells in SFO and OVLT were much more variable
than those of the SCN (SCN vs SFO p<0.0001, SCN vs OVLT p<0.01) (SFig 3.1E).
3.4.2 In vivo rhythmic gene transcript expression in the SFO
The above investigations indicate that, ex vivo, explants of SFO and OVLT exhibit circadian
oscillations in clock gene expression. To investigate whether circadian clock gene
expression in an exemplar sCVO varied over 24h in vivo, we placed mice in constant dark
and sampled the SFO every 6 h across the circadian cycle, starting at CT0 (STable 3.1).
Subsequently we used a pre-loaded qPCR plate with genes related to circadian rhythms
and determined if and how these genes changed in their expression in the SFO over the
circadian cycle. We discovered that 8 out of 16 circadian clock gene transcripts involved in
the transcriptional-translational feedback loop (TTFL; Takahashi, 2017) showed significant
variation over time. These were Arntl (Bmal1; p<0.01), Dbp (DBP, D-box binding protein;
p<0.001), Per1 (PER1; p<0.05), Per2 (PER2; p<0.001), Nfil3 (NFIL3, nuclear factor
interleukin-3 regulated; p<0.01), Nr1d1 (Rev-erbα; p<0.001), Nr1d2 (Rev-erbβ; p<0.05),
and Npas2 (NPAS2; p<0.05) (Fig 3.2). Dbp, Nr1d1, Nr1d2, Per1 and Per2 were in antiphase
with Arntl, Nfil3 and Npas2. The other transcripts from the circadian screen that
demonstrated significant temporal variation included three circadian regulated
transcription factors Egr1 (EGR1, early growth response 1; p<0.01), Egr3 (EGR3; p<0.01)
and Epo (EPO, erythropoietin; p<0.05), and three commonly circadian regulated genes Htr7
(5-HT7, 5-hydroxytryptamine receptor 7; p<0.05), Prf1 (PRF1, perforin 1; p<0.01) and
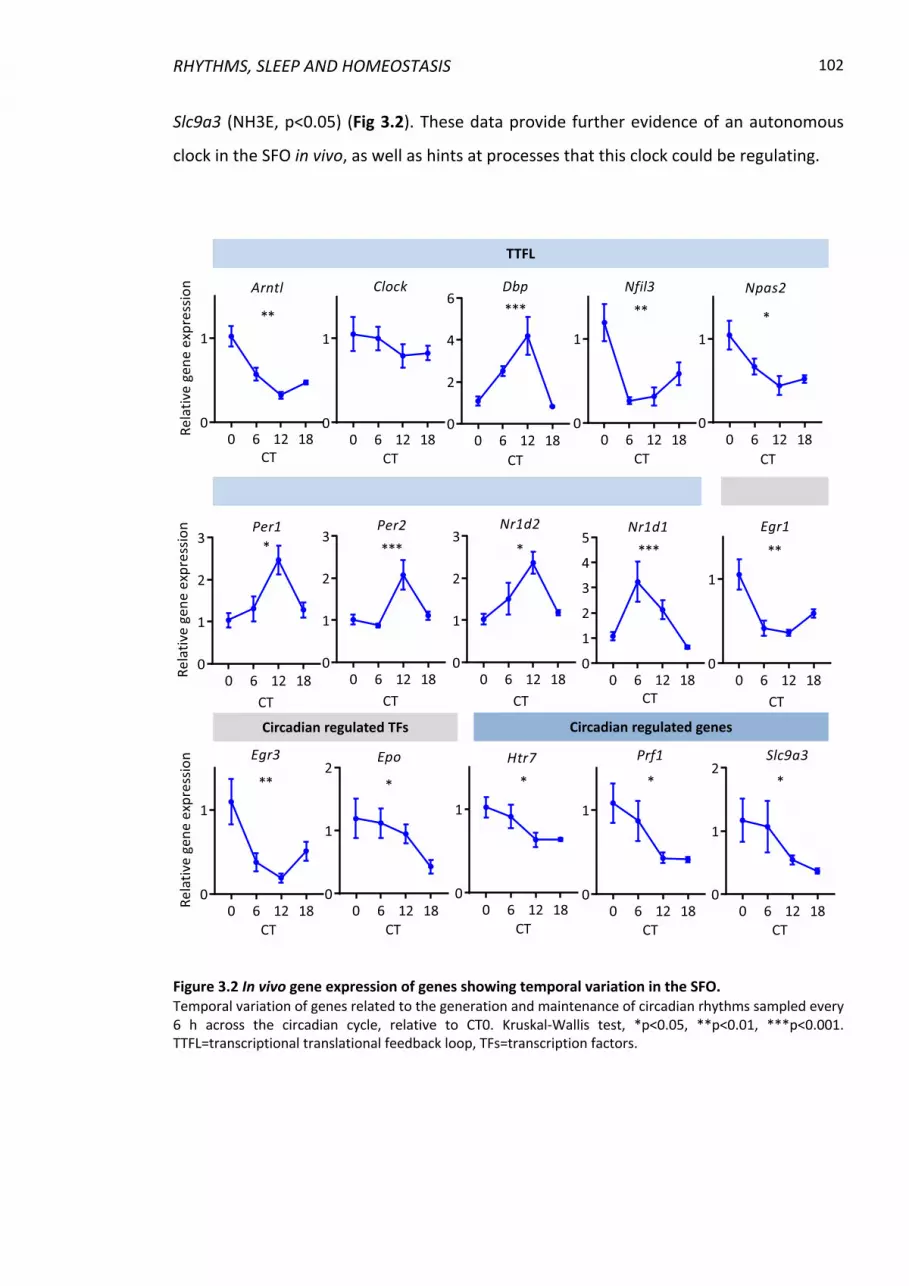
RHYTHMS, SLEEP AND HOMEOSTASIS
102
Slc9a3 (NH3E, p<0.05) (Fig 3.2). These data provide further evidence of an autonomous
clock in the SFO in vivo, as well as hints at processes that this clock could be regulating.
Figure 3.2 In vivo gene expression of genes showing temporal variation in the SFO. Temporal variation of genes related to the generation and maintenance of circadian rhythms sampled every 6 h across the circadian cycle, relative to CT0. Kruskal-Wallis test, *p<0.05, **p<0.01, ***p<0.001. TTFL=transcriptional translational feedback loop, TFs=transcription factors.
Circadian regulated genes
TTFL
Circadian regulated TFs
REBECCA NORTHEAST 103
3.4.3 Forskolin treatment re-synchronises individual cellular oscillations and generates long
lasting whole tissue rhythms in the SFO and OVLT
The adenylate cyclase activator forskolin resets and resynchronizes cellular and whole
tissue rhythms of bioluminescence in the SCN and many extra-SCN areas (Guilding et al.,
2010). To assess if sCVO rhythms are similarly reset, forskolin (10 µM) was applied to SFO
and OVLT explants whose PER2::LUC rhythms had visibly damped following 7 days in
culture. As expected, treatment with forskolin induced high amplitude oscillations which
subsequently decreased in relative amplitude but remained clearly rhythmic for over 14
days post-treatment (n=5 SFO, n=4 OVLT) (Fig 3.3A). Similarly, individual cells whose
rhythms had become damped and desynchronised were strongly resynchronised by
forskolin, remaining rhythmic for up to 6 days post forskolin treatment, after which peaks
and troughs from individual cells became difficult to reliably distinguish (Fig 3.3B).
Synchrony was high amongst these single cell oscillators immediately after forskolin
treatment which subsequently decreased over time (Fig 3.3C). No significant difference
was observed in the rate of desynchrony between the SFO and OVLT (SFO; r slope = -0.06
± 0.014, OVLT; r slope = -0.10 ± 0.002, p=0.067) with the SFO trending to decrease at a
slower rate. Relative bioluminescence damping did not vary over 9 days following forskolin
treatment (Fig 3.3D). In the SFO and OVLT, the average periods of single cell oscillations
were similar pre- versus post- forskolin (SFO; 23.38 ± 0.80 h vs 23.28 ± 0.39 h, OVLT; 23.66
± 0.74 h vs 23.25 ± 0.67 h) (Fig 3.3E). The variability of the single cell oscillator periods was
trending to decrease for the SFO following forskolin treatment (SD; pre- 2.22 ± 0.78 vs post-
forskolin 1.16 ± 1.16, p=0.06) (Fig 3.3Fa), but not in the OVLT (SD; pre- 1.72 ± 0.27 vs post-
forskolin 1.48 ± 0.27, p=0.78) (Fig 3.3Fb).

RHYTHMS, SLEEP AND HOMEOSTASIS
104
Figure 3.3 The long-term effects of forskolin treatment on PER2::LUC expression. Whole area bioluminescence rhythms before and after forskolin treatment for the (Aa) SFO and (Ab) OVLT, demonstrating long lasting synchrony and clear oscillations up to 14 days post-forskolin treatment. Individual cellular rhythms revived and synchronised post-forskolin treatment in the (Ba) SFO and (Bb) OVLT. C Phase clustering of individual cells post-forskolin treatment, the synchrony did not vary between the structures. D Damping relative to the first peak after forskolin treatment (day 0) showed no change between the structures. E The mean period of single cell oscillations did not change pre- and post-forskolin treatment, nor did the (F) variability of these individual oscillator periods. Paired T-test, ns. Duration of forskolin treatment is denoted by the filled grey bar. FSK=forskolin.
Aa Ab
Ba Bb
C D
Ea EbFa Fb
REBECCA NORTHEAST 105
3.4.4 Tetrodotoxin treatment abolishes single cell oscillator synchrony
Tetrodotoxin (TTx) is a voltage-gated sodium channel inhibitor and thus prevents action
potential dependent communication between neurons. Treatment with TTx in SCN cultures
reduces the amplitude of PER2 oscillation and synchrony among single SCN neurons
(Yamaguchi et al., 2003). To assess whether circadian PER2::LUC oscillations in the SFO and
OVLT also require sodium channel-dependent action potential mechanisms, we cultured
coronal explants of the SFO and OVLT in the presence of 0.5 µM TTx. In comparison to
baseline conditions, TTx visibly damped whole area bioluminescence rhythms in both the
SFO and OVLT (Fig 3.4A). In TTx, individual cells of both structures sustained rhythmicity
(Fig 3.4B and SFig 3.2) but lacked synchrony. TTx treatment caused a significant decrease
in amplitude compared to control recordings in both the SFO (p<0.05) and OVLT (p<0.01)
in whole area bioluminescence rhythms (Fig 3.4C). SFO TTx single cell oscillations were
significantly less synchronised on days 2 and 3 (day 2 and 3; p<0.05) compared to controls
with was no change by day 4 (p=0.25) (Fig 3.4Da). Additionally, in the SFO there was no
significant difference for the TTx treated versus control in the mean cellular periods (SFO;
23.31 ± 0.25 h vs 22.49 ± 0.30 h, p=0.074) (Fig 3.4Ea) or the variability of these periods
(p=0.19) (Fig 3.4Fa). In comparison, the OVLT r values were significantly desynchronised by
TTx treatment for days 2, 3 and 4 (all days; p<0.0001) versus control recordings (Fig 3.4Db).
As with the SFO, TTx did not alter the mean periods of the single cell oscillators in the OVLT
(OVLT; 23.58 ± 0.74 h vs 23.24 ± 0.43 h; p=0.53) (Fig 3.4Eb), however there was a significant
increase in the variability of these cellular periods (p<0.001) (Fig 3.4Fb). This indicates that
the individual cellular oscillations in the OVLT are more reliant on action potential
dependent neuronal communication than SFO cells.
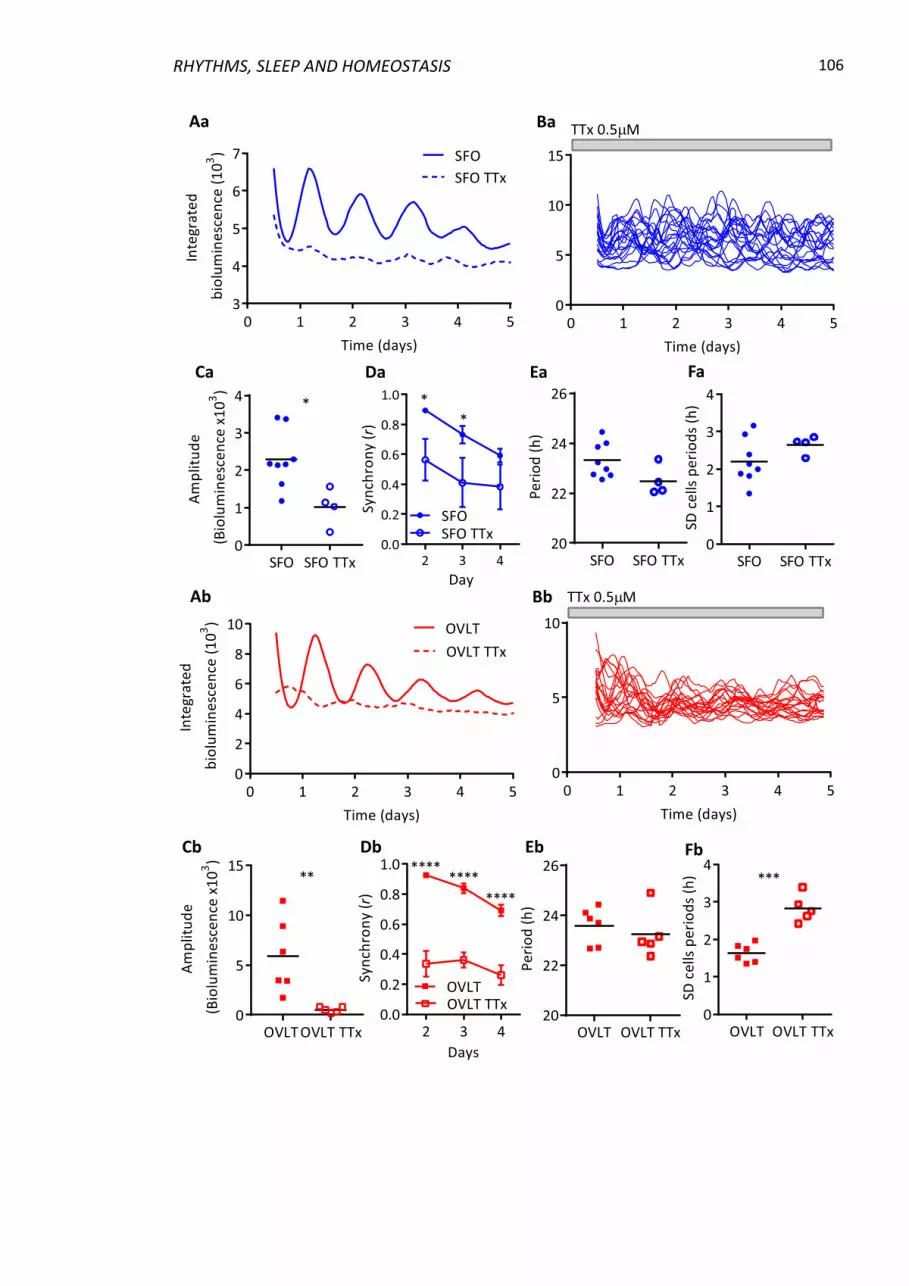
RHYTHMS, SLEEP AND HOMEOSTASIS
106
Perio
d (h
)
OVLT OVLT TTx20
22
24
26
Aa
Ab
Ba
Bb
Ca
Cb
Da
Db
Ea
Eb
Fa
Fb

REBECCA NORTHEAST 107
Figure 3.4 Tetrodotoxin treatment decreases single cell synchrony. Representative mean traces of individually oscillating single cells during baseline and recordings in the presence of TTx for the (Aa) SFO and (Ab) OVLT and their corresponding individual cell traces (Ba; SFO, Bb; OVLT) during the TTx recordings. Note that individual cells are still oscillating, just not in synchrony with one another. Whole area bioluminescence amplitude is significantly decreased for baseline vs TTx treatment in the (Ca) SFO (T-test *p<0.05) and the (Cb) OVLT (Mann-Whitney test **p<0.01). TTx treatment decreases the synchrony of individually oscillating cells during days 2 and 3 of the recording in the (Da) SFO and (Db) days 2-4 in in the OVLT. Two-way RM ANOVA, Sidak’s multiple comparisons test *p<0.05, ****p<0.0001. Data are means ± SEM. The mean period of the single cell oscillations is not affected by TTx treatment in the (Ea) SFO and (Eb) OVLT, with the (F) variability of these cellular periods being greater in the (Fb) OVLT. Unpaired T-test, ***p<0.001. Duration of TTx treatment is denoted by the filled grey bar. Black horizontal lines represent the mean value. RM=repeated measures. TTx=tetrodotoxin.
3.4.5 SFO oscillations are not synchronised longitudinally
The SCN exhibits different clock gene distribution when imaged on different anatomical
planes (Riddle et al., 2017). To determine if the SFO also shows spatiotemporal differences
in clock gene expression, we made sagittal brain sections and imaged bioluminescent
signals of the SFO (Fig 3.5A) and the immediately posterior third ventricle choroid plexus
(ChP; a robust and independently rhythmic structure as shown by Myung et al. (2018)). On
the sagittal plane, bioluminescent cells could be visualised and tracked in the SFO (Fig 3.5B
and SFig 3.3), however in comparison to recordings made on the coronal plane, these
individual cellular oscillations were much less synchronised from the outset (day 2 and 3;
p<0.0001, day 4; p<0.01) (Fig 3.5C). While the mean periods of the single cell oscillators did
not vary between coronal and sagittal SFO explants (23.32 ± 0.25 vs 22.3 ± 0.75 h, p=0.13)
(Fig 3.5D), their variability was increased on the sagittal plane (SD; 2.21 ± 0.21 vs 3.85 ±
0.67, p<0.05) (Fig 3.5E).
Additionally, imaging of the sagittal SFO revealed that it did not maintain a stable phase
relationship with the strongly rhythmic ChP (Fig 3.5F). Initially, PER2::LUC expression in the
sagittal SFO peaks 4-5 h before that of the ChP (CT; 11.25 ± 1.10 h vs 16.00 ± 1.30 h, p<0.05)
(Fig 3.5G), and since the sagittal SFO has a significantly longer period than that of the ChP
(24.3 ± 1.16 h vs 22.67 ± 0.72 h, p<0.05) (Fig 3.5H), their rhythms drift further out of phase.
These data reveal spatiotemporal variation in timekeeping across the SFO and indicate that
severing coronal anatomical connections within the SFO compromises synchrony between
individual cell oscillations.
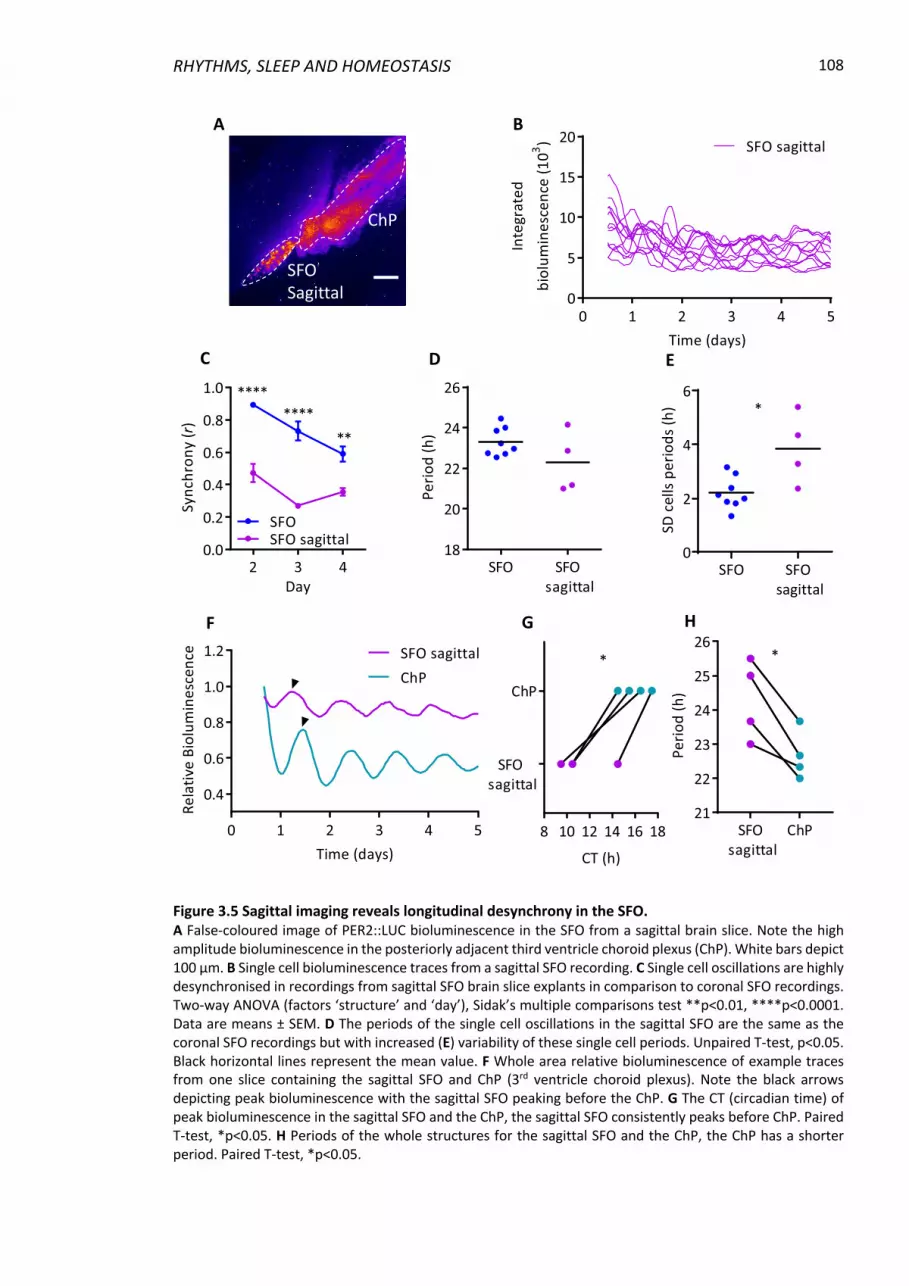
RHYTHMS, SLEEP AND HOMEOSTASIS
108
Figure 3.5 Sagittal imaging reveals longitudinal desynchrony in the SFO. A False-coloured image of PER2::LUC bioluminescence in the SFO from a sagittal brain slice. Note the high amplitude bioluminescence in the posteriorly adjacent third ventricle choroid plexus (ChP). White bars depict 100 µm. B Single cell bioluminescence traces from a sagittal SFO recording. C Single cell oscillations are highly desynchronised in recordings from sagittal SFO brain slice explants in comparison to coronal SFO recordings. Two-way ANOVA (factors ‘structure’ and ‘day’), Sidak’s multiple comparisons test **p<0.01, ****p<0.0001. Data are means ± SEM. D The periods of the single cell oscillations in the sagittal SFO are the same as the coronal SFO recordings but with increased (E) variability of these single cell periods. Unpaired T-test, p<0.05. Black horizontal lines represent the mean value. F Whole area relative bioluminescence of example traces from one slice containing the sagittal SFO and ChP (3rd ventricle choroid plexus). Note the black arrows depicting peak bioluminescence with the sagittal SFO peaking before the ChP. G The CT (circadian time) of peak bioluminescence in the sagittal SFO and the ChP, the sagittal SFO consistently peaks before ChP. Paired T-test, *p<0.05. H Periods of the whole structures for the sagittal SFO and the ChP, the ChP has a shorter period. Paired T-test, *p<0.05.
SD c
ells
perio
ds (h
)
SFO SFO sagittal
0
2
4
6*
SFOSagittal
ChP
A B
C D
F G H
E

REBECCA NORTHEAST 109
3.5 Discussion
Our study provides evidence of robust circadian rhythmicity at both the whole area and
single cell level in the SFO and OVLT, sCVOs implicated in central water homeostasis.
Notably, we reveal for the first time the SFO to exhibit intrinsic timekeeping ex vivo, with
core and non-core clock gene expression in this structure varying over the circadian cycle
in vivo. Circadian rhythms in the SFO and OVLT are exceptionally sustained in culture,
lasting up to 21 days when resynchronised with forskolin. Moreover, the rhythms in these
sCVOs require action potential dependent communication to facilitate cellular synchrony.
These properties of SFO single cell oscillators depend on anatomical connections as
sectioning on the sagittal plane compromises their ability to maintain synchrony and
lengthens their period.
Circadian rhythms in the OVLT have previously been demonstrated in clock gene
bioluminescence (Abe et al., 2002; Abraham et al., 2005; Myung et al., 2018) and in vivo
Per3 (Takumi et al., 1998). We elaborate further on these rhythms in our study and
demonstrate for the first time individual cell bioluminescence oscillations in the OVLT,
which become desynchronised and reduced in amplitude over time contributing to the
damping of whole area rhythms. To date, no studies have demonstrated circadian
rhythmicity in the SFO, despite evidence of its responsiveness to SCN output signals such
as prokineticin 2 and vasopressin (Smith & Ferguson, 1997; Washburn et al., 1999; Cottrell
et al., 2004). The characteristics of individual cellular oscillations in the SFO were similar to
those of the OVLT, and also to other extra-SCN oscillators (Guilding et al., 2009, 2010). In
comparison to the SCN, single cell oscillators in the SFO were less synchronised and
displayed greater variability in their individual cellular periods, yet the time of peak phase
and average period of these structures did not differ. Clock gene rhythms in extra-SCN brain
areas are often less robust than those of the master pacemaker (Guilding & Piggins, 2007;
Paul et al., 2019), thus it is surprising that the whole SFO oscillations were similar in relative
amplitude over the first 4 days to the SCN, and higher than that of the OVLT. It is not clear
why rhythms in the SFO are robust, but since this structure is enriched in non-neuronal glia
cells (Langlet et al., 2013; Pócsai & Kálmán, 2015) and because astrocytes are important for
circadian timekeeping in the SCN (Brancaccio et al., 2017, 2019; Tso et al., 2017) this
RHYTHMS, SLEEP AND HOMEOSTASIS
110
network of non-neuronal cells may imbue the SFO with enhanced capability of self-
sustained oscillations.
Indeed, in vivo, we also show marked temporal variation in clock gene transcripts and other
circadian regulated genes in the SFO. The core clock genes Per1, Per2, Nr1d1 (Rev-erbα)
and Nr1d2 (Rev-erbβ) displayed temporal variation peaking in antiphase with Arntl (Bmal1),
as expected (Takahashi, 2017). Interestingly, Npas2, a homologue of Clock (Gekakis et al.,
1998), displayed significant variation over time with the absence of such variation seen in
Clock, suggesting that Npas2 is more dominant in the molecular clock in the SFO, which is
also the case in the forebrain (Reick et al., 2001). The accessory core clock gene Dbp and
its repressor Nfil3 also displayed temporal variation in antiphase to each other, as seen in
other tissues (Mitsui et al., 2001). Additionally, the transcription factors Egr1 and Egr3
displayed temporal variation. Egr1 regulates genes such as Tnf-α and is involved in
regulating the hepatic TTFL (Yao et al., 1997; Tao et al., 2015) and both Egr1 and Egr3
expression are induced by light in the rodent SCN (Morris et al., 1998; Guido et al., 1999).
This indicates that the molecular clock in the SFO contains functional accessory loops. In
addition to mediating fluid balance, the SFO plays a role in immune function through the
detection of circulating cytokines (Ferguson, 2014), and therefore temporal variation in the
expression of the immune-regulatory genes Prf1 and Nfil3 in the SFO is potentially of
functional importance. Further insight into the regulatory role of the SFO clock is hinted at
through temporal variation seen in 5-HT7R (Htr7) and NHE (Slc9a3). The SFO is reciprocally
connected with serotonergic neurons from the dorsal raphe nucleus (Swanson & Lind,
1986) and serotonin has been implicated in sodium appetite regulation (Rouah-Rosilio et
al., 1994; Lima et al., 2004), for which the SFO is a key driver. NHE is a sodium hydrogen
exchanger whose expression is rhythmic in the kidney (Nishinaga et al., 2009), therefore it
is intriguing that both these structures involved in water homeostasis display temporal
regulation of this gene.
PER2 bioluminescence peak oscillations in the SFO were in phase with the SCN, however
Per2 in vivo peaked a few hours following the reported Per2 peak in the SCN (Bunger et al.,
2000). Further, the SFO in vivo peak of Per2 was delayed relative to the peak in PER2::LUC
ex vivo, thus indicating that phasing of clock gene expression varies from the in vivo to ex
vivo setting. Alternatively, this suggests a degree of resetting of the SFO clock by the culture
REBECCA NORTHEAST 111
procedure as well as errors in the estimated of peak clock gene expression arising from the
limited temporal resolution from the in vivo sampling.
Forskolin reactivates and synchronises damped rhythms in the SFO and OVLT to produce
further oscillations for an unprecedented 21 days in culture. Studies of other extra-SCN
oscillators have yet to demonstrate such long-term rhythms either spontaneously or
following forskolin treatment (Abe et al., 2002; Guilding et al., 2009, 2010; Landgraf et al.,
2016) This highlights the strikingly robust oscillatory properties of the SFO and OVLT and
raises the possibility that they can function as autonomous circadian oscillators. Further,
since TTx damped their bioluminescent rhythms, this indicates that similarly to the SCN
(Yamaguchi et al., 2003; Sujino et al., 2018), intercellular synchrony in the SFO and OVLT is
dependent on action potential communication. This is in contrast to some extra-SCN
oscillators, such as those in the mediobasal hypothalamus and lateral habenula, which still
display individual cell and whole area rhythms in the presence of TTx (Guilding et al., 2009,
2010). The lack of damping displayed in those studies might be attributable to the fact that
they desynchronise more rapidly during baseline, making their dependency on action
potential communication harder to determine. Alternatively, their rhythms are possibly
generated through action potential independent mechanisms. Therefore, the SFO and
OVLT display strong rhythmicity and rhythm maintenance properties that are similar to the
SCN.
The SCN displays differential levels of clock gene expression across its rostro-caudal axis
suggesting spatiotemporal variation in timekeeping function and capability (Riddle et al.,
2017). Here we also find anatomical variation in timekeeping within the SFO. When
sectioned on the sagittal plane, SFO cells are less able to maintain synchrony than when
this structure is sectioned coronally. This indicates that anatomical connections within the
coronal plane are necessary for intercellular communication and synchrony but are
presumably not present on the sagittal plane. Further, the clear phase difference in the
third ventricle ChP and sagittal SFO raises intriguing questions about their physiological
relationship and the role of these autonomous clocks. One possibility for this change in
phase relationship is the differing roles of these areas. The ChP produces cerebral spinal
fluid, which is increased during the behaviourally quiescent phase and is an important
contributor to the brain metabolite clearing process during sleep (Xie et al., 2013; Myung

RHYTHMS, SLEEP AND HOMEOSTASIS
112
et al., 2018). In contrast, the SFO is involved in regulating thirst behaviour, a process which
occurs during the active phase (Zimmerman et al., 2017). Therefore in mice, the SFO clock
peaking late in the day and the ChP clock peaking late in the night could be preparing these
structures for their primary functions.
Vasopressin neurons of the SCN directly innervate the OVLT to orchestrate the circadian
regulation of late night anticipatory thirst which functions to preventing dehydration
during the subsequent rest phase (Gizowski et al., 2016). An endogenous clock in the OVLT
could allow the structure to anticipate rhythmic input from the SCN, enabling energy
conservation during periods where certain mechanisms are in less demand. The SFO also
receives input from SCN vasopressin neurons (Abrahamson & Moore, 2001) and has
reciprocal connections with the OVLT that are necessary for the central control of thirst
behaviour (Miselis et al., 1979; Miselis, 1981; Gizowski & Bourque, 2017) as well as the SCN
(Swanson & Lind, 1986). This raises possibility that the SFO participates in anticipatory
thirst and that its efferent signals feedback to the SCN as part of the circadian regulation of
water homeostasis. In vivo Per1 and Per2 rhythms in the SFO peak at lights-off, coincident
with the onset of drinking activity in mice (Fig 3.6). This is potentially indicative of the SFO
anticipating the coming increase of drinking associated signals or even driving this
nocturnal drinking activity
.
Figure 3.6 Per1 in the SFO peaks at with drinking activity onset. Schematic of relative in vivo gene expression of Per1 in the SFO, overlaid with a 5 day average 24 h drinking profile of a WT C57BL6J male mouse. Grey shading represents lights off.

REBECCA NORTHEAST 113
In conclusion, our study characterises robust rhythms in the SFO and OVLT with stronger
circadian properties than previously reported extra-SCN oscillators, displaying
characteristics similar to the master clock. For the first time we report the SFO to have
intrinsic oscillatory properties in whole area and single cells, with unique spatiotemporal
patterning of clock gene expression. Our results highlight strong local clocks in thirst
regulating areas which may play a role in the circadian regulation of drinking behaviour.
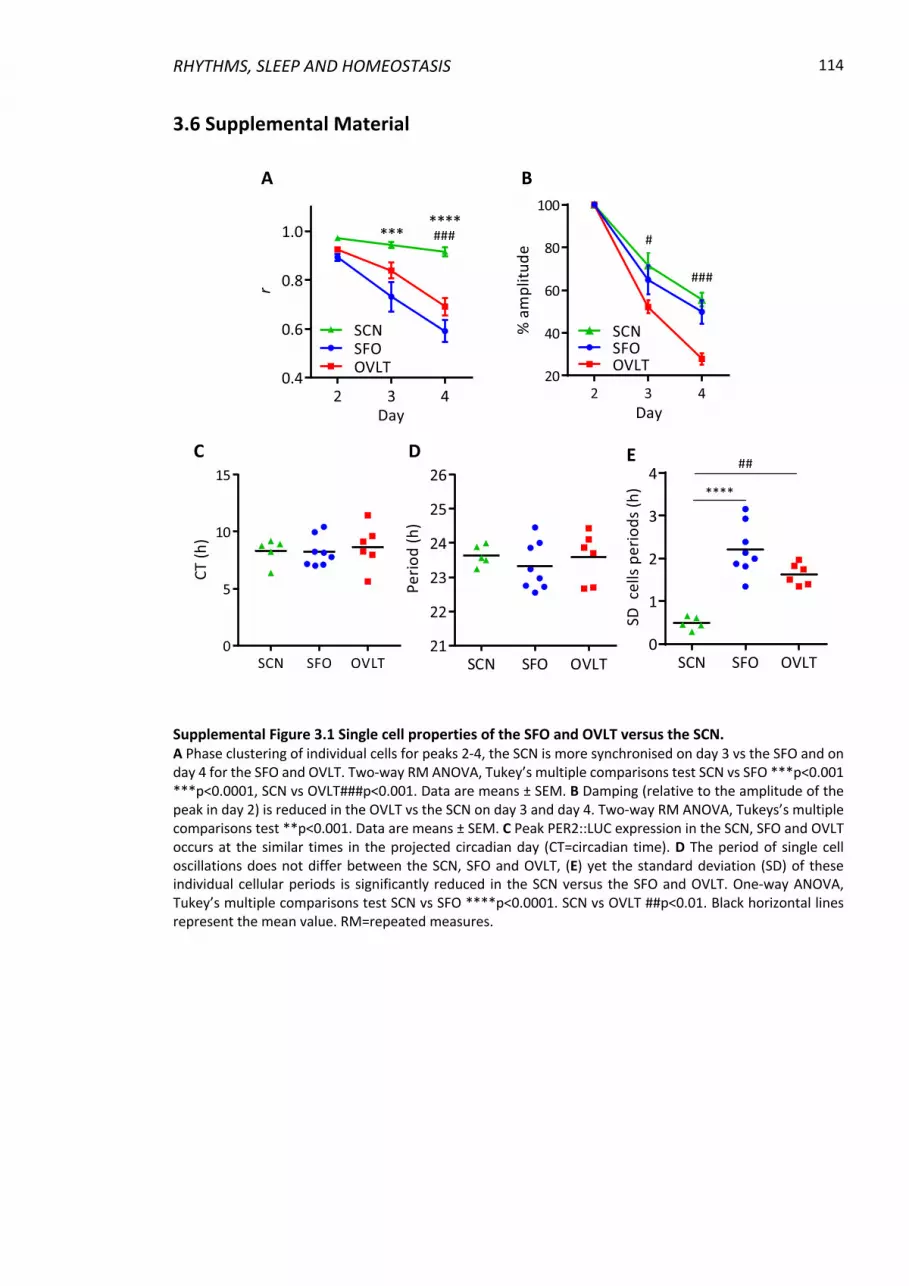
RHYTHMS, SLEEP AND HOMEOSTASIS
114
3.6 Supplemental Material
Supplemental Figure 3.1 Single cell properties of the SFO and OVLT versus the SCN. A Phase clustering of individual cells for peaks 2-4, the SCN is more synchronised on day 3 vs the SFO and on day 4 for the SFO and OVLT. Two-way RM ANOVA, Tukey’s multiple comparisons test SCN vs SFO ***p<0.001 ***p<0.0001, SCN vs OVLT###p<0.001. Data are means ± SEM. B Damping (relative to the amplitude of the peak in day 2) is reduced in the OVLT vs the SCN on day 3 and day 4. Two-way RM ANOVA, Tukeys’s multiple comparisons test **p<0.001. Data are means ± SEM. C Peak PER2::LUC expression in the SCN, SFO and OVLT occurs at the similar times in the projected circadian day (CT=circadian time). D The period of single cell oscillations does not differ between the SCN, SFO and OVLT, (E) yet the standard deviation (SD) of these individual cellular periods is significantly reduced in the SCN versus the SFO and OVLT. One-way ANOVA, Tukey’s multiple comparisons test SCN vs SFO ****p<0.0001. SCN vs OVLT ##p<0.01. Black horizontal lines represent the mean value. RM=repeated measures.
##
****
SD c
ells
per
iods
(h)
SCN SFO OVLT0
1
2
3
4
A B
C D E
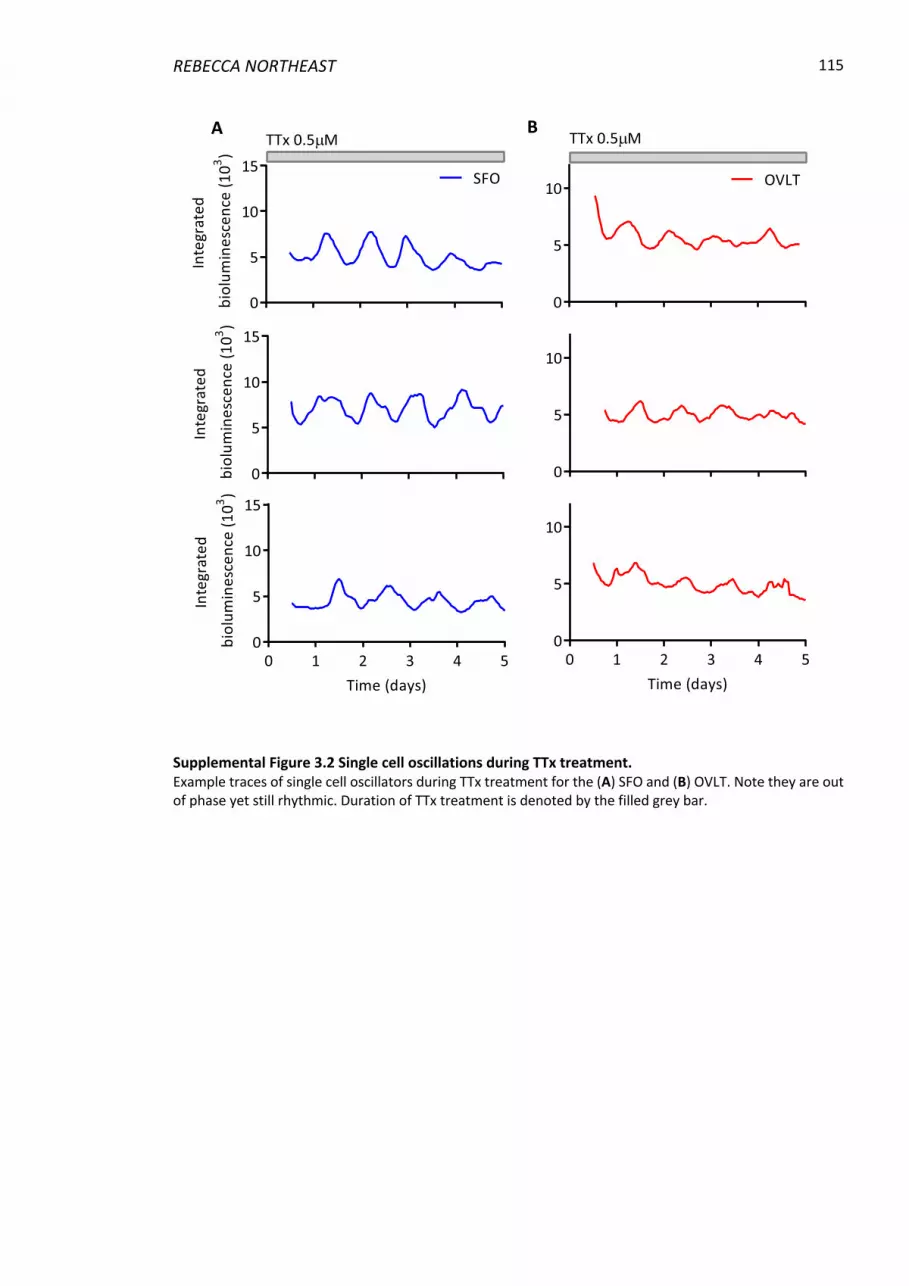
REBECCA NORTHEAST 115
Supplemental Figure 3.2 Single cell oscillations during TTx treatment. Example traces of single cell oscillators during TTx treatment for the (A) SFO and (B) OVLT. Note they are out of phase yet still rhythmic. Duration of TTx treatment is denoted by the filled grey bar.
A B
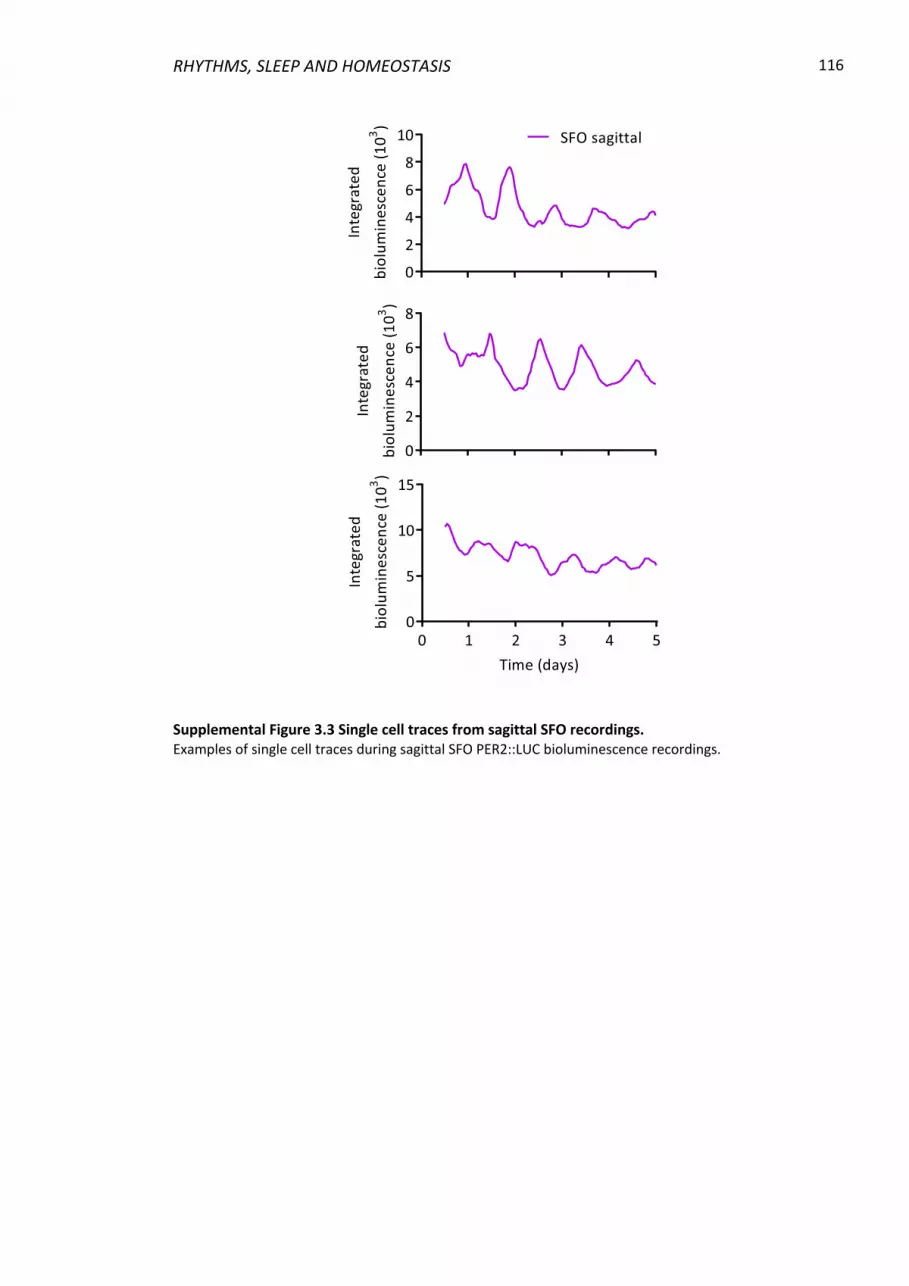
RHYTHMS, SLEEP AND HOMEOSTASIS
116
Supplemental Figure 3.3 Single cell traces from sagittal SFO recordings. Examples of single cell traces during sagittal SFO PER2::LUC bioluminescence recordings.
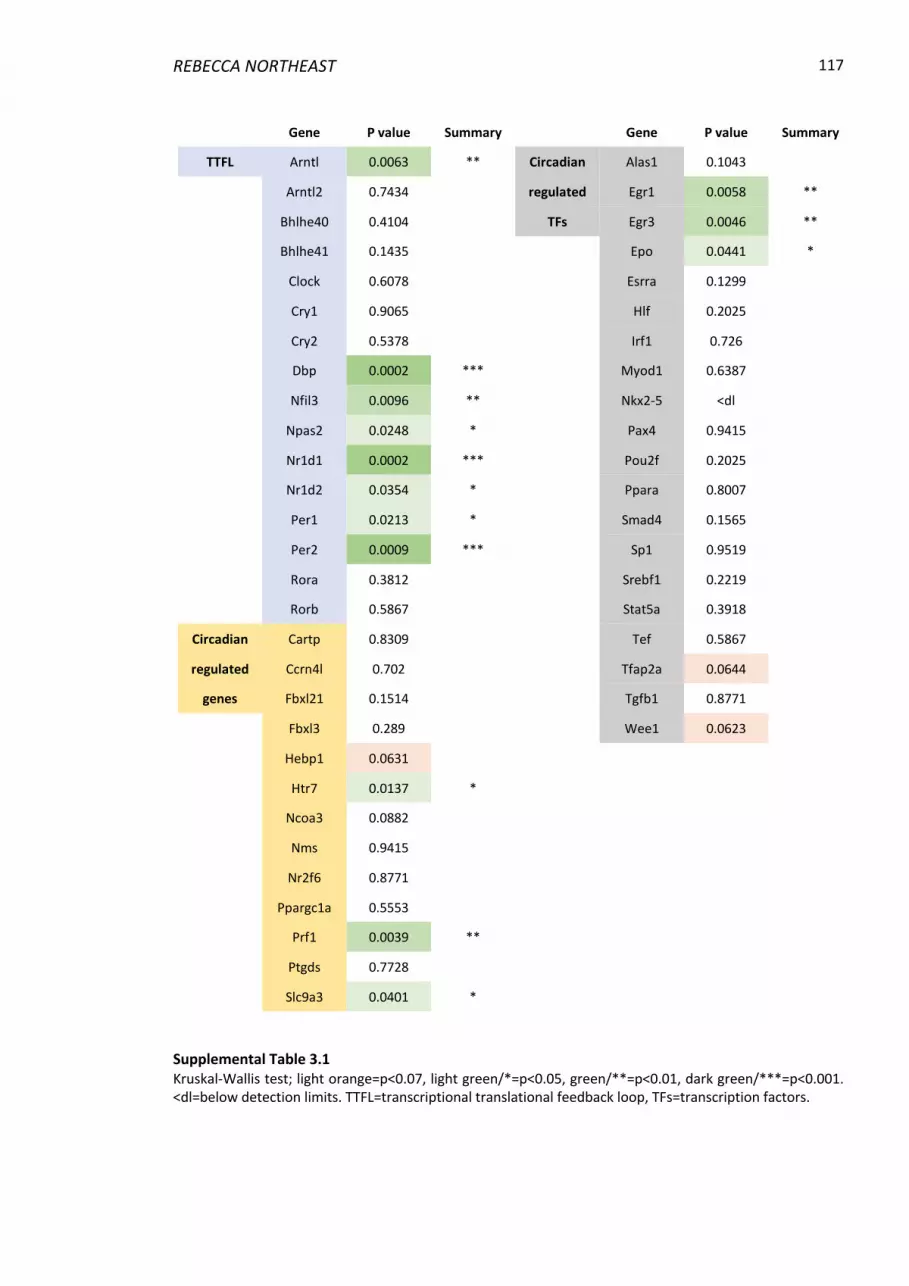
REBECCA NORTHEAST 117
Supplemental Table 3.1 Kruskal-Wallis test; light orange=p<0.07, light green/*=p<0.05, green/**=p<0.01, dark green/***=p<0.001. <dl=below detection limits. TTFL=transcriptional translational feedback loop, TFs=transcription factors.
Gene P value Summary Gene P value Summary
TTFL Arntl 0.0063 ** Circadian Alas1 0.1043
Arntl2 0.7434 regulated Egr1 0.0058 **
Bhlhe40 0.4104 TFs Egr3 0.0046 **
Bhlhe41 0.1435 Epo 0.0441 *
Clock 0.6078 Esrra 0.1299
Cry1 0.9065 Hlf 0.2025
Cry2 0.5378 Irf1 0.726
Dbp 0.0002 *** Myod1 0.6387
Nfil3 0.0096 ** Nkx2-5 <dl
Npas2 0.0248 * Pax4 0.9415
Nr1d1 0.0002 *** Pou2f 0.2025
Nr1d2 0.0354 * Ppara 0.8007
Per1 0.0213 * Smad4 0.1565
Per2 0.0009 *** Sp1 0.9519
Rora 0.3812 Srebf1 0.2219
Rorb 0.5867 Stat5a 0.3918
Circadian Cartp 0.8309 Tef 0.5867
regulated Ccrn4l 0.702 Tfap2a 0.0644
genes Fbxl21 0.1514 Tgfb1 0.8771
Fbxl3 0.289 Wee1 0.0623
Hebp1 0.0631
Htr7 0.0137 *
Ncoa3 0.0882
Nms 0.9415
Nr2f6 0.8771
Ppargc1a 0.5553
Prf1 0.0039 **
Ptgds 0.7728
Slc9a3 0.0401 *
RHYTHMS, SLEEP AND HOMEOSTASIS
118
3.7 References Abe, M., Herzog, E.D., Yamazaki, S., Straume, M., Tei, H., Sakaki, Y., Menaker, M., & Block,
G.D. (2002) Circadian rhythms in isolated brain regions. J. Neurosci., 22, 350–356. Abraham, U., Prior, J.L., Granados-Fuentes, D., Piwnica-Worms, D.R., & Herzog, E.D.
(2005) Independent Circadian Oscillations of Period1 in Specific Brain Areas In Vivo and In Vitro. J. Neurosci., 25, 8620–8626.
Abrahamson, E.E. & Moore, R.Y. (2001) Suprachiasmatic nucleus in the mouse: retinal innervation, intrinsic organization and efferent projections. Brain Res., 916, 172–191.
Belle, M.D.C., Diekman, C.O., Forger, D.B., & Piggins, H.D. (2009) Daily electrical silencing in the mammalian circadian clock. Science, 326, 281–284.
Brancaccio, M., Edwards, M.D., Patton, A.P., Smyllie, N.J., Chesham, J.E., Maywood, E.S., & Hastings, M.H. (2019) Cell-autonomous clock of astrocytes drives circadian behavior in mammals. Science, 363, 187–192.
Brancaccio, M., Patton, A.P., Chesham, J.E., Maywood, E.S., & Hastings, M.H. (2017) Astrocytes Control Circadian Timekeeping in the Suprachiasmatic Nucleus via Glutamatergic Signaling. Neuron, 93, 1420–1435.e5.
Bunger, M.K., Wilsbacher, L.D., Moran, S.M., Clendenin, C., Radcliffe, L.A., Hogenesch, J.B., Simon, M.C., Takahashi, J.S., & Bradfield, C.A. (2000) Mop3 is an essential component of the master circadian pacemaker in mammals. Cell, 103, 1009–1017.
Cottrell, G.T., Zhou, Q.-Y., & Ferguson, A. V. (2004) Prokineticin 2 Modulates the Excitability of Subfornical Organ Neurons. J. Neurosci., 24.
Ferguson, A. V (2014) Circumventricular Organs: Integrators of Circulating Signals Controlling Hydration, Energy Balance, and Immune Function, Neurobiology of Body Fluid Homeostasis: Transduction and Integration. CRC Press/Taylor & Francis.
Gekakis, N., Staknis, D., Nguyen, H.B., Davis, F.C., Wilsbacher, L.D., King, D.P., Takahashi, J.S., & Weitz, C.J. (1998) Role of the CLOCK protein in the mammalian circadian mechanism. Science, 280, 1564–1569.
Gizowski, C. & Bourque, C.W. (2017) The neural basis of homeostatic and anticipatory thirst. Nat. Rev. Nephrol., 14, 11–25.
Gizowski, C., Zaelzer, C., & Bourque, C.W. (2016) Clock-driven vasopressin neurotransmission mediates anticipatory thirst prior to sleep. Nature, 537, 685–688.
Guido, M.E., de Guido, L.B., Goguen, D., Robertson, H.A., & Rusak, B. (1999) Daily Rhythm of Spontaneous Immediate-Early Gene Expression in the Rat Suprachiasmatic Nucleus. J. Biol. Rhythms, 14, 275–280.
Guilding, C., Hughes, A.T.L., Brown, T.M., Namvar, S., & Piggins, H.D. (2009) A riot of rhythms: neuronal and glial circadian oscillators in the mediobasal hypothalamus. Mol. Brain, 2, 28.
Guilding, C., Hughes, A.T.L., & Piggins, H.D. (2010) Circadian oscillators in the epithalamus. Neuroscience, 169, 1630–1639.
Guilding, C. & Piggins, H.D. (2007) Challenging the omnipotence of the suprachiasmatic timekeeper: are circadian oscillators present throughout the mammalian brain? Eur. J. Neurosci., 25, 3195–3216.
Hastings, M.H., Maywood, E.S., & Brancaccio, M. (2018) Generation of circadian rhythms in the suprachiasmatic nucleus. Nat. Rev. Neurosci., 19, 453–469.
Landgraf, D., Long, J.E., & Welsh, D.K. (2016) Depression-like behaviour in mice is associated with disrupted circadian rhythms in nucleus accumbens
REBECCA NORTHEAST 119
and periaqueductal grey. Eur. J. Neurosci., 43, 1309–1320. Langlet, F., Mullier, A., Bouret, S.G., Prevot, V., & Dehouck, B. (2013) Tanycyte-like cells
form a blood-cerebrospinal fluid barrier in the circumventricular organs of the mouse brain. J. Comp. Neurol., 521, 3389–3405.
Lima, H.R.C., Cavalcante-Lima, H.R., Cedraz-Mercez, P.L., Costa-E-Sousa, R.H., Olivares, E.L., Badauê-Passos, D., Medeiros, M.A., Côrtes, W.S., & Reis, L.C. (2004) Brain serotonin depletion enhances the sodium appetite induced by sodium depletion or beta-adrenergic stimulation. An. Acad. Bras. Cienc., 76, 85–92.
Lucas, R.J., Lall, G.S., Allen, A.E., & Brown, T.M. (2012) How rod, cone, and melanopsin photoreceptors come together to enlighten the mammalian circadian clock. In Progress in Brain Research. pp. 1–18.
Masri, S. & Sassone-Corsi, P. (2018) The emerging link between cancer, metabolism, and circadian rhythms. Nat. Med., 24, 1795–1803.
McKinley, M.J., McAllen, R.M., Davern, P., Giles, M.E., Penschow, J., Sunn, N., Uschakov, A., & Oldfield, B.J. (2003) The sensory circumventricular organs of the mammalian brain. Adv. Anat. Embryol. Cell Biol., 172, III–XII, 1-122, back cover.
Miller, J. -e. K., Granados-Fuentes, D., Wang, T., Marpegan, L., Holy, T.E., & Herzog, E.D. (2014) Vasoactive Intestinal Polypeptide Mediates Circadian Rhythms in Mammalian Olfactory Bulb and Olfaction. J. Neurosci., 34, 6040–6046.
Miselis, R.R. (1981) The efferent projections of the subfornical organ of the rat: A circumventricular organ within a neural network subserving water balance. Brain Res., 230, 1–23.
Miselis, R.R., Shapiro, R.E., & Hand, P.J. (1979) Subfornical organ efferents to neural systems for control of body water. Science, 205, 1022–1025.
Mitsui, S., Yamaguchi, S., Matsuo, T., Ishida, Y., & Okamura, H. (2001) Antagonistic role of E4BP4 and PAR proteins in the circadian oscillatory mechanism. Genes Dev., 15, 995–1006.
Morris, M.E., Viswanathan, N., Kuhlman, S., Davis, F.C., & Weitz, C.J. (1998) A Screen for Genes Induced in the Suprachiasmatic Nucleus by Light. Science (80-. )., 279, 1544–1547.
Myung, J., Schmal, C., Hong, S., Tsukizawa, Y., Rose, P., Zhang, Y., Holtzman, M.J., De Schutter, E., Herzel, H., Bordyugov, G., & Takumi, T. (2018) The choroid plexus is an important circadian clock component. Nat. Commun., 9, 1062.
Myung, J., Wu, D., Simonneaux, V., & Lane, T.J. (2018) Strong Circadian Rhythms in the Choroid Plexus: Implications for Sleep-Independent Brain Metabolite Clearance. J. Exp. Neurosci., 12, 1179069518783762.
Nishinaga, H., Komatsu, R., Doi, M., Fustin, J.-M., Yamada, H., Okura, R., Yamaguchi, Y., Matsuo, M., Emoto, N., & Okamura, H. (2009) Circadian expression of the Na+/H+ exchanger NHE3 in the mouse renal medulla. Biomed. Res., 30, 87–93.
Paul, J.R., Davis, J.A., Goode, L.K., Becker, B.K., Fusilier, A., Meador-Woodruff, A., & Gamble, K.L. (2019) Circadian regulation of membrane physiology in neural oscillators throughout the brain. Eur. J. Neurosci.,.
Pavlovski, I., Evans, J.A., & Mistlberger, R.E. (2018) Feeding Time Entrains the Olfactory Bulb Circadian Clock in Anosmic PER2::LUC Mice. Neuroscience, 393, 175–184.
Paxinos, G. & Franklin, K.B.J. (2001) Mouse Brain in Stereotaxic Coordinates, Academic Press.
Pócsai, K. & Kálmán, M. (2015) Glial and perivascular structures in the subfornical organ:

RHYTHMS, SLEEP AND HOMEOSTASIS
120
distinguishing the shell and core. J. Histochem. Cytochem., 63, 367–383. Ramsay, D.J., Thrasher, T.N., & Keil, L.C. (1983) The Organum Vasculosum Laminae
Terminalis: A Critical Area for Osmoreception. In Progress in Brain Research. pp. 91–98.
Reick, M., Garcia, J.A., Dudley, C., & McKnight, S.L. (2001) NPAS2: an analog of clock operative in the mammalian forebrain. Science, 293, 506–509.
Reppert, S.M. & Weaver, D.R. (2002) Coordination of circadian timing in mammals. Nature, 418, 935–941.
Riddle, M., Mezias, E., Foley, D., LeSauter, J., & Silver, R. (2017) Differential localization of PER1 and PER2 in the brain master circadian clock. Eur. J. Neurosci., 45, 1357–1367.
Rouah-Rosilio, M., Orosco, M., & Nicolaidis, S. (1994) Serotoninergic modulation of sodium appetite in the rat. Physiol. Behav., 55, 811–816.
Sakhi, K., Belle, M.D.C., Gossan, N., Delagrange, P., & Piggins, H.D. (2014) Daily variation in the electrophysiological activity of mouse medial habenula neurones. J. Physiol., 592, 587–603.
Shan, Z., Li, Y., Zong, G., Guo, Y., Li, J., Manson, J.E., Hu, F.B., Willett, W.C., Schernhammer, E.S., & Bhupathiraju, S.N. (2018) Rotating night shift work and adherence to unhealthy lifestyle in predicting risk of type 2 diabetes: results from two large US cohorts of female nurses. BMJ, 363, k4641.
Smith, P.M. & Ferguson, A. V. (1997) Vasopressin Acts in the Subfornical Organ to Decrease Blood Pressure. Neuroendocrinology, 66, 130–135.
Spiteri, N.J. (1982) Circadian patterning of feeding, drinking and activity during diurnal food access in rats. Physiol. Behav., 28, 139–147.
Sujino, M., Asakawa, T., Nagano, M., Koinuma, S., Masumoto, K.-H., & Shigeyoshi, Y. (2018) CLOCKΔ19 mutation modifies the manner of synchrony among oscillation neurons in the suprachiasmatic nucleus. Sci. Rep., 8, 854.
Swanson, L.W. & Lind, R.W. (1986) Neural projections subserving the initiation of a specific motivated behavior in the rat: new projections from the subfornical organ. Brain Res., 379, 399–403.
Takahashi, J.S. (2017) Transcriptional architecture of the mammalian circadian clock. Nat. Rev. Genet., 18, 164–179.
Takumi, T., Taguchi, K., Miyake, S., Sakakida, Y., Takashima, N., Matsubara, C., Maebayashi, Y., Okumura, K., Takekida, S., Yamamoto, S., Yagita, K., Yan, L., Young, M.W., & Okamura, H. (1998) A light-independent oscillatory gene mPer3 in mouse SCN and OVLT. EMBO J., 17, 4753–4759.
Tao, W., Wu, J., Zhang, Q., Lai, S.-S., Jiang, S., Jiang, C., Xu, Y., Xue, B., Du, J., & Li, C.-J. (2015) EGR1 regulates hepatic clock gene amplitude by activating Per1 transcription. Sci. Rep., 5, 15212.
Tso, C.F., Simon, T., Greenlaw, A.C., Puri, T., Mieda, M., & Herzog, E.D. (2017) Astrocytes Regulate Daily Rhythms in the Suprachiasmatic Nucleus and Behavior. Curr. Biol., 27, 1055–1061.
Washburn, D.L.S., Beedle, A.M., & Ferguson, A.V. (1999) Inhibition of subfornical organ neuronal potassium channels by vasopressin. Neuroscience, 93, 349–359.
Wefers, J., van Moorsel, D., Hansen, J., Connell, N.J., Havekes, B., Hoeks, J., van Marken Lichtenbelt, W.D., Duez, H., Phielix, E., Kalsbeek, A., Boekschoten, M. V., Hooiveld, G.J., Hesselink, M.K.C., Kersten, S., Staels, B., Scheer, F.A.J.L., & Schrauwen, P. (2018) Circadian misalignment induces fatty acid metabolism gene profiles and

REBECCA NORTHEAST 121
compromises insulin sensitivity in human skeletal muscle. Proc. Natl. Acad. Sci., 115, 7789–7794.
Xie, L., Kang, H., Xu, Q., Chen, M.J., Liao, Y., Thiyagarajan, M., O’Donnell, J., Christensen, D.J., Nicholson, C., Iliff, J.J., Takano, T., Deane, R., & Nedergaard, M. (2013) Sleep Drives Metabolite Clearance from the Adult Brain. Science (80-. )., 342, 373–377.
Yamaguchi, S., Isejima, H., Matsuo, T., Okura, R., Yagita, K., Kobayashi, M., & Okamura, H. (2003) Synchronization of cellular clocks in the suprachiasmatic nucleus. Science, 302, 1408–1412.
Yan, L., Karatsoreos, I., Lesauter, J., Welsh, D.K., Kay, S., Foley, D., & Silver, R. (2007) Exploring spatiotemporal organization of SCN circuits. Cold Spring Harb. Symp. Quant. Biol., 72, 527–541.
Yao, J., Mackman, N., Edgington, T.S., & Fan, S.T. (1997) Lipopolysaccharide induction of the tumor necrosis factor-alpha promoter in human monocytic cells. Regulation by Egr-1, c-Jun, and NF-kappaB transcription factors. J. Biol. Chem., 272, 17795–17801.
Yoo, S.-H., Yamazaki, S., Lowrey, P.L., Shimomura, K., Ko, C.H., Buhr, E.D., Siepka, S.M., Hong, H.-K., Oh, W.J., Yoo, O.J., Menaker, M., & Takahashi, J.S. (2004) PERIOD2::LUCIFERASE real-time reporting of circadian dynamics reveals persistent circadian oscillations in mouse peripheral tissues. Proc. Natl. Acad. Sci. U. S. A., 101, 5339–5346.
Zimmerman, C.A., Leib, D.E., & Knight, Z.A. (2017) Neural circuits underlying thirst and fluid homeostasis. Nat. Rev. Neurosci., 18, 459–469.
Zimmerman, C.A., Lin, Y.-C., Leib, D.E., Guo, L., Huey, E.L., Daly, G.E., Chen, Y., & Knight, Z.A. (2016) Thirst neurons anticipate the homeostatic consequences of eating and drinking. Nature, 537, 680–684.

RHYTHMS, SLEEP AND HOMEOSTASIS
122
Chapter 4: Keeping Time in the Brainstem Rebecca C. Northeast1 *, Lukasz Chrobok1, 2*, Peter Cunningham1, Cheryl Petit1, Hugh D.
Piggins1,3
1. Faculty of Biology, Medicine, and Health, AV Hill Building, University of Manchester,
Oxford Road, Manchester, M13 9PT, United Kingdom
2. Current address: Department of Neurophysiology and Chronobiology, Institute of
Zoology and Biomedical Research, Jagiellonian University in Krakow, Poland;
Gronostajowa Street 9, 30-387 Krakow, Poland
3. Current address: School of Natural Sciences and Psychology, Liverpool John Moores
University, Liverpool, United Kingdom
4. Current address: School of Physiology, Pharmacology and Neuroscience, Biomedical
Sciences Building, University of Bristol, Bristol, BS8 1TD, United Kingdom
* Authors contributed equally
Corresponding author: Hugh D. Piggins; School of Physiology, Pharmacology, and
Neuroscience, Faculty of Life Sciences, University of Bristol Bristol BS8 1TD, UK;
Keywords: area postrema, brainstem, circadian clock, Evans Blue, multi-electrode array,
nucleus of the solitary tract, PER2::LUC

REBECCA NORTHEAST 123
4.1 Abstract
The area postrema (AP) and nucleus of the solitary tract (NTS) are brainstem nuclei
regulating cardiovascular and metabolic functions; physiological processes which exhibit
clear circadian variation. By convention, the brain’s suprachiasmatic nuclei (SCN) are
viewed as the major driver of these circadian rhythms, but circadian clock gene expression
occurs in other brain sites, raising the possibility that circadian control can be devolved to
local clocks. In this study, we use a range of molecular, electrophysiological, and
histochemical approaches to investigate the intrinsic circadian timekeeping properties of
these hindbrain centres. Here, we show that the AP/NTS express autonomous 24 h rhythms
in ex vivo clock protein bioluminescence with clear spatiotemporal variation of PER2
expression. Additionally, robust 24 h variation in clock gene expression in vivo and neuronal
firing ex vivo were observed. These structures exhibited enhanced nocturnal neuronal
responsiveness to metabolic cues coincident with 24 h cycling in gene expression of their
receptors. Moreover, this study provides evidence for increased nocturnal penetration of
blood borne molecules to the NTS, coinciding with the downregulation of tight junction
protein gene expression in the AP/NTS glial border. Altogether, our findings reveal these
hindbrain structures to exhibit autonomous circadian oscillations potentially contributing
to daily regulation of ingestive and metabolic processes.
4.1.2 Significance statement
Mammals display natural daily variation in physiological processes including food intake
and subsequent production of metabolic signals. Both hypothalamic and hindbrain areas
are key regulators for processing these cues. Using a range of bioimaging,
electrophysiological and molecular techniques, here we show that two brainstem
structures implicated in homeostatic regulation possess their own robust endogenous
circadian clocks. These brainstem circadian oscillators contribute to day-night variation in
neuronal excitability and influence neural response to feeding signals as well as the
permeability of blood borne molecules into the brain through the temporal control of
barrier protein gene expression. Our findings could have important implications for the role
of the hindbrain clock in regulating metabolism and blood brain barrier permeability.
RHYTHMS, SLEEP AND HOMEOSTASIS
124
4.2 Introduction
Key parameters of energy balance and cardiovascular physiology vary rhythmically over 24
h (Asher & Sassone-Corsi, 2015; Baschieri & Cortelli, 2019; Reinke & Asher, 2019), but it is
unclear how the body’s intrinsic circadian timing system contributes to such daily variation.
Conventionally, the suprachiasmatic nuclei (SCN) are schematized as the main circadian
clock (Guilding & Piggins, 2007). Cells of the SCN contain an intracellular molecular
feedback loop, of which the Period (Per1-2) and Cryptochrome (Cry1-2) genes are important
components (Takahashi et al., 2018). The transcription and translation of these genes
drives a 24 h cycle of protein accumulation and degradation leading to daily variation in
SCN neuronal action potential discharge (Brown & Piggins, 2007; Colwell, 2011), thereby
enabling synchronisation among clock cells. Through timed synaptic and/or paracrine
release of neurochemicals such as arginine vasopressin (AVP) and prokineticin 2 (PK2), the
SCN then orchestrates circadian variation in the brain and corresponding physiological
outputs (Hastings et al., 2018). However, accumulating evidence challenges this uniclock
model (Guilding & Piggins, 2007; Albrecht, 2012). Using SCN-less tissue explants from
rodents bearing bioluminescence reporters of the molecular clock, such as PER2::LUC mice
(Yoo et al., 2004), highly autonomous or semi-autonomous rhythms of clock gene
expression were observed in extra-SCN brain sites and tissues (Abe et al., 2002). This raises
the possibility that daily control in physiology and behaviour is in part locally attributed to
such structures.
To date, autonomous and semi-autonomous oscillators have been described
predominantly in forebrain structures such as the olfactory bulb (Granados-Fuentes et al.,
2004), choroid plexus (Myung et al., 2018) and mediobasal hypothalamic nuclei (Guilding
et al., 2009). In this study, we explore the endogenous clock properties of caudal hindbrain
structures; the area postrema (AP) and nucleus of the solitary tract (NTS). These brainstem
nuclei are implicated in the regulation of ingestive activities and autonomic control of the
heart and vasculature, but it is unclear whether they are capable of intrinsic circadian
timekeeping. The AP is a sensory circumventricular organ, lacking a blood brain barrier
(BBB), while the NTS, located immediately subjacent to the AP, acts as a key relay structure
for metabolic signals of peripheral and central origin (Fan et al., 2004; Zhan et al., 2013).

REBECCA NORTHEAST 125
The NTS contains the first central neurons involved in processing vagal and humoral
metabolic signals after ingestion (Grill & Hayes, 2009). Furthermore, a specialised diffusion
barrier exists between the AP and NTS, composed of vimentin- and glial fibrillary acidic
protein (GFAP)-positive glial cells connected by tight junction proteins (primarily claudin-5
and zona occludens-1), which prevent the entry of blood borne substances into the brain
parenchyma (Wang et al., 2008; Maolood & Meister, 2009; Morita & Miyata, 2012; Langlet
et al., 2013). Together, the AP and NTS form a complex that acts a powerful gateway for
processing and regulating homeostatic signals through the brainstem.
Here, we reveal the surprisingly robust properties and dynamics of the single cell and whole
area molecular circadian rhythms in the AP and NTS, using PER2::LUC bioluminescence
imaging. Short- and long-term recordings of spontaneous multi-unit activity (MUA) in the
AP/NTS complex show clear circadian rhythms in electrical activity, peaking late in the day.
Further, in the NTS we observe overt day-night variation in the MUA response to metabolic
signals accompanied by 24 h variation in the gene expression of receptors for some of these
metabolic cues. Intriguingly, we found a robust nocturnal increase in permeability of the
glial barrier between the AP and NTS to intravascular administration of Evans Blue dye that
was coincident with the nadir in gene expression of tight junction proteins. These findings
reveal the AP/NTS to possess an endogenous clock, regulating responses to peripheral
metabolic signals as well as circadian control of permeability to blood borne molecules in
the brain.

RHYTHMS, SLEEP AND HOMEOSTASIS
126
4.3 Materials and Methods
4.3.1 Animals
All mice were kept under standard lighting conditions of 12:12 h light - dark (LD) cycles,
unless stated otherwise, with ad libitum availability of food and water. C57BL6J mice were
provided by Charles River, Kent UK, all other genotypes (details below) were bred in house
by the University of Manchester Biological Services Facility. All procedures and experiments
were carried out with approval by the Research Ethics committee of the University of
Manchester and in keeping with the UK Animal (Scientific Procedures) Act 1986.
Experimental procedures were designed to minimise the number of animals used. For any
procedures carried out during the dark phase or constant darkness (DD), night vision
goggles were used to prevent animal exposure to light.
4.3.2 Bioluminescence imaging
4.3.2.1 Tissue preparation and data acquisition
Adult male mPer2Luc knock-in (PER2::LUC) mice (Yoo et al., 2004) between the ages of 10
-20 weeks old were used for all bioluminescent imaging experiments. 250 µm thick coronal
brain slices -7.20 mm to -7.26 mm from bregma (Paxinos & Franklin, 2001) were cut in ice
cold Hank’s Balanced Salt Solution (HBSS; Sigma, Germany) supplemented with 1 mg/ml
penicillin-streptomycin (Gibco Invitrogen Ltd, UK) and 0.01 M HEPES (Sigma) using a
vibroslicer (Camden Instruments, UK). The AP/NTS complex was dissected using a scalpel
and prepared for culture. The explant tissue was then transferred to 30 mm Millicell cell
culture inserts (Merck, Germany) in glass-coverslip sealed Fluorodish culture dishes (World
Precision Instruments Ltd., USA) with sterile culture medium (Dulbecco’s Modified Eagle’s
Medium; DMEM, Sigma) supplemented with 0.1 mM luciferin (Promega, USA), B27 (Gibco
Invitrogen Ltd, USA), 1 mg/ml penicillin-streptomycin (Gibco Invitrogen Ltd), 10 mM HEPES
(Sigma) and 3.5 g/L D-glucose (Sigma). Images were taken using the Olympus Luminoview
LV200 (Olympus, Japan) fitted with a cooled Hamamatsu ImageEM C900-13 EM-CCD
camera and a 20 x 0.4 NA Plan Apo objective (Olympus, Japan) on a heated stage kept at

REBECCA NORTHEAST 127
37 °C. Exposure time was 60 minutes and gain was kept constant throughout. 10 µM
forskolin (Sigma) treatments were performed as a fresh media change.
4.3.2.2 Image analysis
Images were primarily analysed in ImageJ, using a region of interest (ROI) tool to select
putative single cells or whole brain areas (AP, NTS, and 4th ventricle ependymal cells) for
assessing relative bioluminescence over time. The first 12 h of all recordings were excluded
and raw data were subject to a 3 h running average smooth before further analysis. Peaks
and troughs of individual bioluminescence traces of whole structures and putative single
cells were determined manually. An average of three peak to peak measurements were
used to measure period. Damping rate was determined as relative to the amplitude of the
peak on day 2. The OriginPro 9.1 (OriginLab, USA) software was used to create a
spatiotemporal amplitude heatmap for the whole AP/NTS complex. Rayleigh plots of peak
phase and subsequent r values were created using El Temps (University of Barcelona,
Spain).
4.3.2.3 Statistics
Statistical analyses were performed using Prism 7 (GraphPad Software, USA). To compare
periods, standard deviation of periods (SD period) and time of peaks, paired t-test and
repeated measures (RM) one-way ANOVA followed by Tukey’s multiple comparison were
used. To assess the differences in values measured in the 3-4 subsequent days (times of
peaks, SD of single cell lags, Rayleigh r), RM two-way ANOVA followed by Sidak’s multiple
comparison test was used. The interaction in RM two-way ANOVA was used to compare
the shape of frequency histograms of single cell lags to the whole structure peak. Linear
regression model was used to measure the desynchronisation rates. All data are presented
as mean ± standard error of mean (SEM).

RHYTHMS, SLEEP AND HOMEOSTASIS
128
4.3.3 Quantitative Real-Time PCR
4.3.3.1 Tissue preparation
19 male C57BL6J mice, aged 10 weeks old, were placed into constant darkness for 36-48 h
before being culled at four time points across the circadian cycle: CT0, CT6, CT12, CT18
(n=4-5). Brains were excised and flash frozen in dry ice before being stored at -80 °C for up
to 4 weeks. 20 µm sections were cut using a cryostat (Leica CM3050 S), onto PEN-
membrane slides (Leica Biosystems, Germany) and then stored at -80 °C for up to two
weeks. For laser-capture microdissection, slides were first defrosted and then stained with
1% cresyl violet (Sigma) in 70% ethanol before regions of interest were extracted using
laser-capture microscope (LCM) system (Leica DM6000 B) and stored in lysis buffer
(Promega) prior to RNA extraction (see below). LCM performed on the cresyl violet-stained
tissue enabled precise extraction of the desired areas (i.e. those which demonstrated the
strongest bioluminescent signal measured in the PER2::LUC mice) such that for the AP
samples we collected the AP with the surrounding glial border and for the NTS samples,
the bilateral medial NTS adjacent to the AP, excluding the DMV was collected. (SFig 4.1).
4.3.3.2 RNA extraction and RT-qPCR
The dissected tissue was then immediately processed for RNA extraction using the
ReliaPrep RNA Tissue Miniprep System (Promega, USA) and subsequently stored at -80 °C.
Reverse-transcription was performed using the High-Capacity RNA-to-cDNA Kit (Applied
Biosystems, USA) after which quantitative RT-PCR was performed using Power SYBR Green
Master Mix and measured using a StepOnePlus Real Time PCR system (Life Technologies,
USA). Transcripts were amplified by QuantiTect primer assay (Qiagen, Germany) for all
genes (Avpr1, Cckbr, Cldn5, Ghsr, Hcrtr1, Hcrtr2, Lepr, Prokr2, Tbp <housekeeping gene>
and Tjp1) except the following primers for Per2 (5’ to 3’: forward
GCCTTCAGACTCATGATGACAGA, reverse TTTGTGTGCCTCAGCTTTGG) and Bmal1 (5’ to 3’:
forward CCAAGAAAGTATGGACACAGACAAA, reverse GCATTCTTGATCCTTCCTTGGT).

REBECCA NORTHEAST 129
4.3.3.3 Data analysis and statistics
The ΔΔCT method was used for data analysis with Tbp as the house keeping gene and CT0
values for relative target gene expression. Data were tested for normality using the
Shapiro-Wilk normality test and one-way ANOVA or Kruskal-Wallis test was performed
using Prism 7 (GraphPad Software) for statistical analysis accordingly. Data are presented
as mean ± SEM.
4.3.4 Immunohistochemistry
4.3.4.1 Tissue preparation
20 male C57BL6J mice, aged 10 weeks old, 11 of which were placed in constant darkness
(DD) for 36-48 h prior to cull. 4 groups of mice were subjected to transcardial perfusions:
n=5 at ZT1, n=4 at ZT13, n=5 at CT1 and n=6 at CT13. Darkness was ensured during
procedures on mice at CT1, CT13 and ZT13 using infra-red night vision goggles (Cobra, UK).
After terminal injection of pentobarbital (80 mg/kg), transcardial perfusions were
performed with ice-cold 0.1 M phosphate-buffered saline (PBS) (flow rate: 7 ml/min,
volume: 35 ml) followed by a cocktail of 1% Evans Blue dye (EB, Sigma) and 4% PFA in PBS
(flow rate: 7 ml/min, volume: 50 ml). Brains were subsequently excised and immersed in
4% PFA in PBS to post-fix overnight in 4 °C, after which they were immersed in 30% w/v
sucrose solution for 2-3 days. The fixed brain tissue was mounted on a freezing sledge
microtome (Bright Instruments, UK) and cut into 35 µm thick coronal slices.
4.3.4.2 Immunohistochemical staining
The desired brain sections were initially washed free-floating in PBS. Next, brain tissue was
permeabilised with 0.1% Triton X100 (Sigma) for 20 minutes at room temperature (RT),
following further washing in PBS. Slices were then blocked in 5% normal donkey serum
(NDS; Sigma) and 0.05% Triton X100 at RT for 30 minutes. Following, slices were incubated
for 48 h at 4 °C in a PBS solution containing 0.05% Triton X100, 0.5% NDS and the primary
antibodies; mouse anti-GFAP (1:400; Sigma, CAT# G6171) and chicken anti-vimentin
(1:4000; Abcam CAT# ab24525). After the primary incubation, slices were washed in PBS
and incubated for 24 h at 4 °C in a PBS solution of secondary antibodies; donkey anti-mouse
RHYTHMS, SLEEP AND HOMEOSTASIS
130
Cy3 (1:800, Jackson ImmunoResearch, CAT# 715-165-150) and donkey anti-chicken Alexa
488 (1:800, Jackson ImmunoResearch, CAT# 703-545-155). The secondary sera were
washed off in PBS and slices were mounted on gelatine-coated glass slides using
VectaShield medium with DAPI (Vector Laboratories, USA). Slices were scanned on the
confocal microscope (Leica SP5 upright) under the 20x magnifying objective. Z-stacks were
collected with 3 µm steps and analysed as maximal intensity projections. Florescence
emitted by EB was detected at 650 nm.
4.3.4.3 Data collection, analysis and statistics
Per mouse, 3 brainstem sections (caudal AP, middle AP, rostral AP), 1 middle SFO and 1
middle OVLT section were imaged on the confocal microscope (Leica SP5 upright) under
the 20x objective. Z-stacks were collected with 3 µm steps. Further analysis was performed
in ImageJ. As no EB signal was observed outside the SFO or OVLT in any of the experimental
groups (SFig 4.5), detailed image analysis was performed for the brainstem sections only.
Maximal intensity projections were created for each stack to analyse the intensity of EB-
derived signal in the NTS. ROI were anatomically distinguished using vimentin-immuno
reactivity (ir) to delineate the border between the AP and NTS. GFAP-ir was used to
establish ventral border of the DMV and the lateral border of the NTS. Subsequently, the
NTS (whole) was divided into two ROIs: medial and lateral, by halving the ventral and dorsal
border of the NTS with the linear vector (Fig. 5A). The intensity of each ROI (mean grey
value) was normalised by the background value, collected with a 40 x 40 pixel oval at the
area ventral to DMV (which lacked EB staining).
The intensity values for 3 ROIs were compared between corresponding slices in ZT/CT1 vs
ZT/CT13, using unpaired t-tests or Mann-Whitney tests in Prism 7 (GraphPad). Data were
presented as mean ± SEM.
4.3.5 Multi-electrode array recordings
4.3.5.1 Tissue preparation
In total, 27 adult C57BL6J mice were culled at ZT0 (for long-term and acute early day
recordings) or ZT11 (for acute late day recordings). The brain was carefully excised and
REBECCA NORTHEAST 131
immersed in the pre-oxygenated with carbogen (95% oxygen, 5% CO2), ice-cold incubation
artificial cerebrospinal fluid (ACSF) composed of (in mM): NaCl 95, KCl 1.8, KH2PO4 1.2, CaCl2
0.5, MgSO4 7, NaHCO3 26, glucose 15, sucrose 50 and Phenol Red 0.005 mg/l. The brainstem
was then separated and sliced using a vibroslicer (Camden Instruments) into 250 µm (for
acute set up) or 300 µm thick (for long-term recordings) coronal slices (at the
corresponding stereotactic coordinates to those prepared from PER2::LUC mice). Slices
were then incubated in cold ACSF perfused with carbogen. After 30 minutes, slices were
transferred to the oxygenated pre-incubation chamber filled with recording ACSF warmed
up to 32 °C, composed of (in mM): NaCl 127, KCl 1.8, KH2PO4 1.2, CaCl2 2.4, MgSO4 1.3,
NaHCO3 26, glucose 5, sucrose 10 and Phenol Red 0.005 mg/l.
4.3.5.2 Recording and data acquisition
Slices containing the AP/NTS complex were then transferred to the recording wells (at
projected ZT 1 for the early day and long-term recordings, or ZT 13 for early night
recordings) of the MEA2100-System (Multichannel Systems GmbH, Germany) and placed
onto the 6 x 10 perforated multi-electrode arrays (MEAs; 60pMEA100/30iR-Ti,
Multichannel Systems). Slices were perfused with fresh recording ACSF, preheated to 32 °C
with a perfusion cannula (Multichannel Systems) throughout the whole experiment. The
tissue was allowed to settle for 1 h following set up before starting recording. For long term
recordings lasting more than 24 h, suction was set to minimum and ACSF was enriched with
1% Penicillin-Streptomycin (Sigma) to maximise the survival of the tissue. In order to verify
the tissue condition after over 24 h of recording, 100 µM NMDA (Tocris Bioscience, UK) was
applied to provide evidence of tissue responsiveness. After short-term recordings, 1 µM
tetrodotoxin (TTx; Tocris) was applied to verify that the registered signal comprised of TTx-
sensitive action potentials and to assess the signal-to-noise ratio.
The raw signal was sampled at 25 kHz and acquired using MC Rack 4.6.2 Software
(Multichannel Systems). For spike detection, MC DataTool 2.6.15 (Mutlichannel Systems)
and MC Rack were used. Data were first high pass filtered in forward and reverse directions
(300 Hz) after which, spikes were classified as the signal exceeding the threshold of -17.5
µV (twice as high as determined to be a noise level after TTx application). Spontaneous
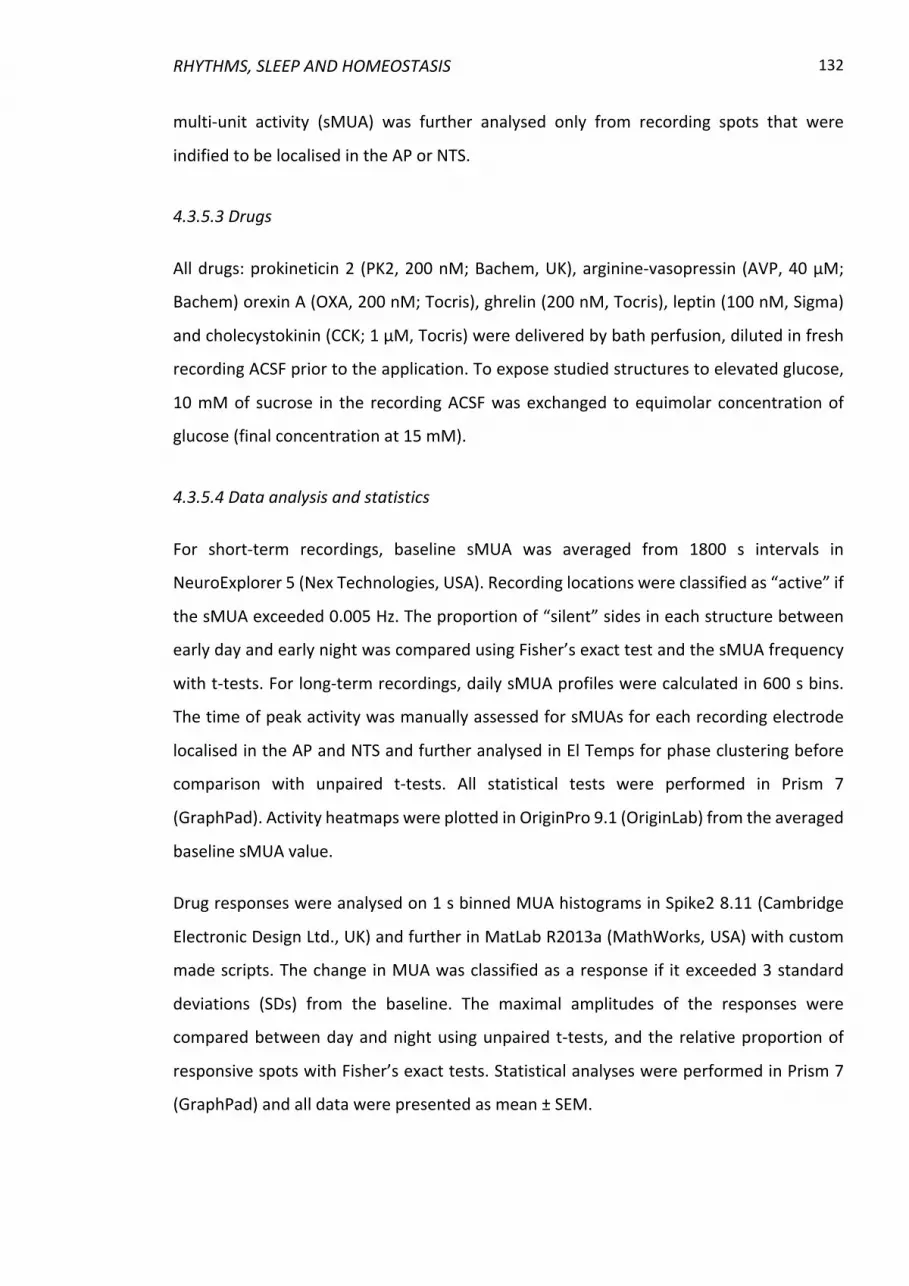
RHYTHMS, SLEEP AND HOMEOSTASIS
132
multi-unit activity (sMUA) was further analysed only from recording spots that were
indified to be localised in the AP or NTS.
4.3.5.3 Drugs
All drugs: prokineticin 2 (PK2, 200 nM; Bachem, UK), arginine-vasopressin (AVP, 40 µM;
Bachem) orexin A (OXA, 200 nM; Tocris), ghrelin (200 nM, Tocris), leptin (100 nM, Sigma)
and cholecystokinin (CCK; 1 µM, Tocris) were delivered by bath perfusion, diluted in fresh
recording ACSF prior to the application. To expose studied structures to elevated glucose,
10 mM of sucrose in the recording ACSF was exchanged to equimolar concentration of
glucose (final concentration at 15 mM).
4.3.5.4 Data analysis and statistics
For short-term recordings, baseline sMUA was averaged from 1800 s intervals in
NeuroExplorer 5 (Nex Technologies, USA). Recording locations were classified as “active” if
the sMUA exceeded 0.005 Hz. The proportion of “silent” sides in each structure between
early day and early night was compared using Fisher’s exact test and the sMUA frequency
with t-tests. For long-term recordings, daily sMUA profiles were calculated in 600 s bins.
The time of peak activity was manually assessed for sMUAs for each recording electrode
localised in the AP and NTS and further analysed in El Temps for phase clustering before
comparison with unpaired t-tests. All statistical tests were performed in Prism 7
(GraphPad). Activity heatmaps were plotted in OriginPro 9.1 (OriginLab) from the averaged
baseline sMUA value.
Drug responses were analysed on 1 s binned MUA histograms in Spike2 8.11 (Cambridge
Electronic Design Ltd., UK) and further in MatLab R2013a (MathWorks, USA) with custom
made scripts. The change in MUA was classified as a response if it exceeded 3 standard
deviations (SDs) from the baseline. The maximal amplitudes of the responses were
compared between day and night using unpaired t-tests, and the relative proportion of
responsive spots with Fisher’s exact tests. Statistical analyses were performed in Prism 7
(GraphPad) and all data were presented as mean ± SEM.

REBECCA NORTHEAST 133
4.4 Results
4.4.1 Brainstem nuclei exhibit robust oscillations of PER2::LUC
Previous studies in the intact rodent indicate daily variation in clock gene expression in the
NTS (Kaneko et al., 2009), but it is unclear whether such patterns of gene activity arise
endogenously or are driven by exogenous signals. Therefore, we cultured coronal
brainstem slices containing the dorsal vagal complex that do not contain SCN and imaged
PER2::LUC expression over 7 days. Bioluminescence rhythms were evident in the AP (n=8),
NTS (n=8) and in the ependymal cell layer lining the 4th ventricle (4thVep; n=5) (Fig 4.1) and
were typically sustained for 5-6 days in culture (Fig 4.2A). Additionally, PER2::LUC
expression was transient in the dorsal motor nucleus of the vagus (DMV; detected for only
one day in culture) and undetectable in NTS explants rostral or caudal to the AP (SFig 4.2).
The AP, NTS and 4thVep were found to be three independent oscillators, each with a distinct
spatiotemporal sequence of PER2::LUC expression. Crosscorrelation analysis revealed that
the peak of the AP bioluminescence proceeds the NTS by ~2 h (p<0.0001), followed by the
4thVep after a further ~8 h (p<0.001), such that it is almost in antiphase with the AP (Fig
4.2B,C). The period of these bioluminescence rhythms were similar in the AP and NTS
(~24.7 h and ~24.3 h respectively), yet significantly shorter in the 4thVep (~22.9 h;
compared with AP, p<0.05) (Fig 4.2D). All three brainstem oscillators damped in relative
amplitude at a similar rate (Fig 4.2E).
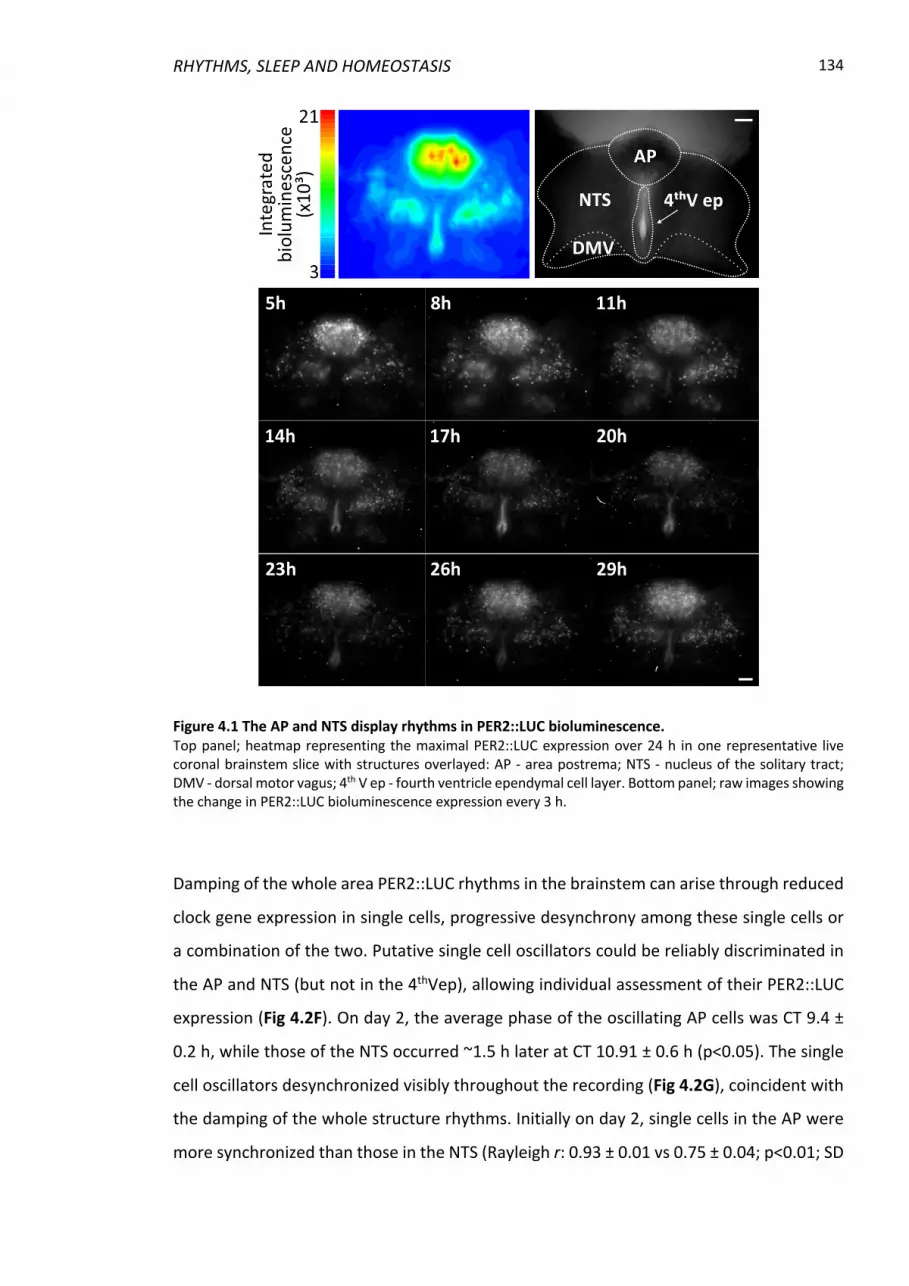
RHYTHMS, SLEEP AND HOMEOSTASIS
134
Figure 4.1 The AP and NTS display rhythms in PER2::LUC bioluminescence. Top panel; heatmap representing the maximal PER2::LUC expression over 24 h in one representative live coronal brainstem slice with structures overlayed: AP - area postrema; NTS - nucleus of the solitary tract; DMV - dorsal motor vagus; 4th V ep - fourth ventricle ependymal cell layer. Bottom panel; raw images showing the change in PER2::LUC bioluminescence expression every 3 h.
Damping of the whole area PER2::LUC rhythms in the brainstem can arise through reduced
clock gene expression in single cells, progressive desynchrony among these single cells or
a combination of the two. Putative single cell oscillators could be reliably discriminated in
the AP and NTS (but not in the 4thVep), allowing individual assessment of their PER2::LUC
expression (Fig 4.2F). On day 2, the average phase of the oscillating AP cells was CT 9.4 ±
0.2 h, while those of the NTS occurred ~1.5 h later at CT 10.91 ± 0.6 h (p<0.05). The single
cell oscillators desynchronized visibly throughout the recording (Fig 4.2G), coincident with
the damping of the whole structure rhythms. Initially on day 2, single cells in the AP were
more synchronized than those in the NTS (Rayleigh r: 0.93 ± 0.01 vs 0.75 ± 0.04; p<0.01; SD

REBECCA NORTHEAST 135
lag: 1.5 ± 0.01 h vs 3.11 ± 0.3 h, p<0.0001), but the desynchronization of cells in both
structures progressed at a similar rate (R slope: -0.17 ± 0.03 vs -0.16 ± 0.03). By day 5, cells
in both structures were highly desynchronized, but significantly more so in the NTS
(Rayleigh r: 0.44 ± 0.07 vs 0.3 ± 0.05; p>0.05; SD lag: 5.16 ± 0.4 h vs 7.02 ± 0.4 h, p<0.0001)
(Fig 4.2H). This observation was strengthened by the different distribution of phase
differences between structures (Fig 4.2I). The average periods of the individual oscillating
AP cells were longer than those in the NTS (24.8 ± 0.3 h vs 24.19 ± 0.4 h; p<0.05), but also
these individual cellular periods were less variable in the NTS (SD period single cells: 1.89 ±
0.1 h vs 2.49 ± 0.2 h), which potentially accounts for the lower synchrony in the NTS (Fig
4.2J).
4.4.2 Cyclic Clock Gene Expression in vivo
Since clock gene expression is not widely reported in the brainstem (18, 19), we next
assessed the in vivo Per2 and Bmal1 transcript expression in the AP and NTS sampled at 6
h intervals over the circadian cycle, beginning at the onset of the circadian day (CT0). Both
Per2 and Bmal1 expression in the AP and NTS varied significantly over these time points
(AP: p<0.01 and p<0.0001; NTS: p<0.01 and p<0.05). In the NTS, the nadir in Per2 occurred
around CT6 and the maximal level at CT18, while the highest expression of Bmal1 occurred
at CT0 and the lowest at CT18. In the AP, the maximal expression of Per2 was present at
CT12 and the lowest at CT0 with Bmal1 expression oppositely phased. Thus, in the mouse
NTS and AP, molecular clock components vary in expression at 4 time points over 24 h in
vivo, and consistent with PER2::LUC rhythms ex vivo, Per2 expression the AP is phase
advanced with respect to that of the NTS (Fig 4.2K).
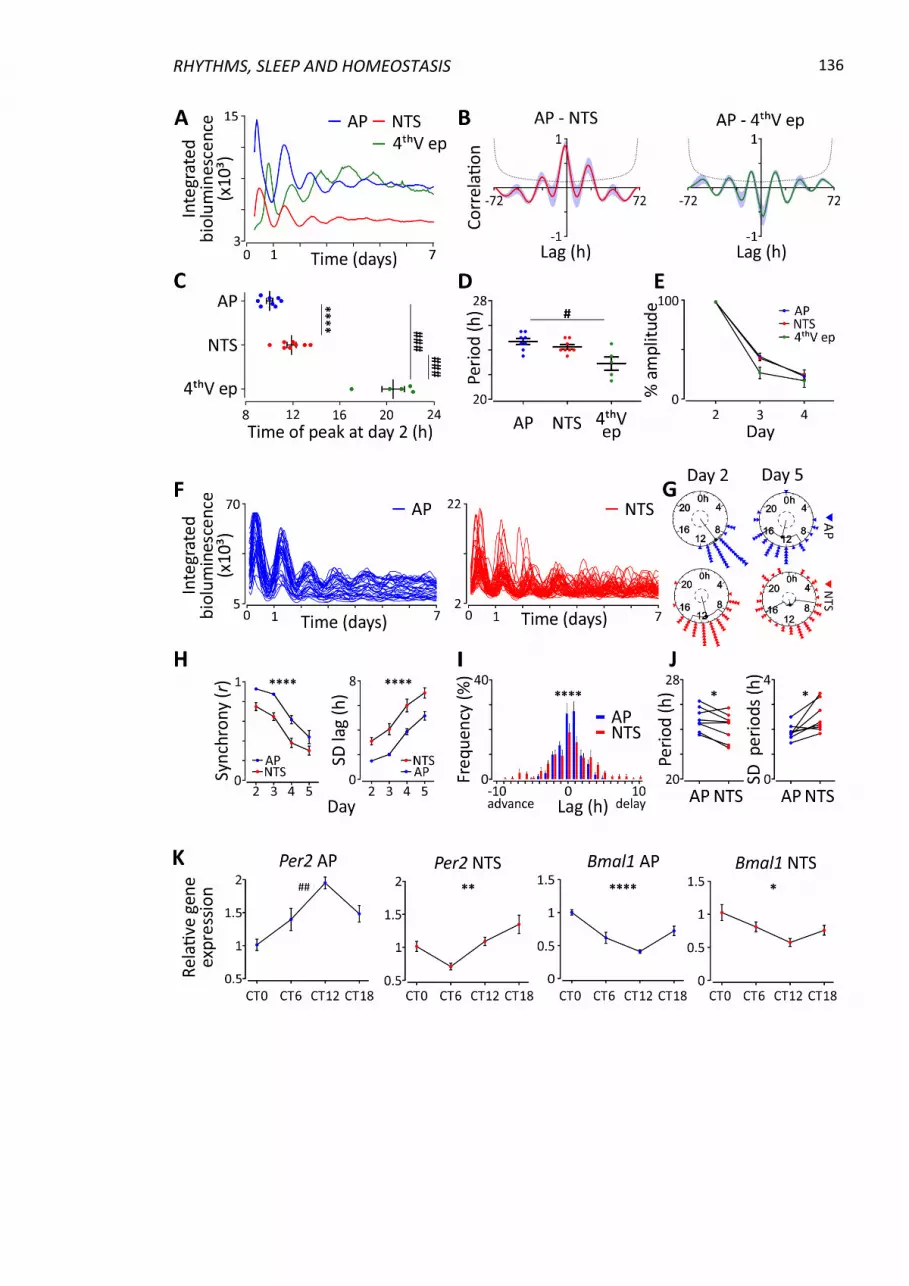
RHYTHMS, SLEEP AND HOMEOSTASIS
136
##

REBECCA NORTHEAST 137
Figure 4.2 The AP and NTS display rhythms in PER2::LUC bioluminescence. A Example traces of PER2::LUC expression over 7 days in culture at the whole tissue level in the AP, NTS and 4th V ep from one brainstem slice. B Cross-correlograms showing the ~2 h lag of the NTS to the AP (left panel; n=8) and close to antiphasic relationship of the 4th V ep to the AP (right panel; n=5) over 72 h. C Scatterplot demonstrating the differing times of peak PER2::LUC bioluminescence (AP vs NTS ****p<0.0001, n=8, T-test; 4th V ep vs AP and NTS ###p<0.001, n=5, Tukey’s test) and (D) the whole structure periods of the brainstem centres (#p<0.05, n=5, Tukey’s test). E Relative damping rate to the amplitude of the peak on day 2 does not vary between the brainstem structures. F Putative single cell oscillator traces of PER2::LUC over 7 days in culture. G Rayleigh plots depicting phase clustering around CT 8.5 in AP and CT 11 in NTS at day 2, and subsequent desynchronisation of single cell oscillators at day 5 in the example traces shown in F. Triangles represent peak bioluminescent phases for individual cells, the arrow indicates the phase vector and its length represents significance with respected to the inner dotted circle of the p=0.05 significance threshold. Variance (SEM) is represented by the black box around arrow heads. H Rayleigh r value of individual cells for peaks 2-5 (left panel) and the SD of individual cell lags relative to the phase of the main structure for peaks 2-5 (right panel) for n=8 cultures. (****p<0.0001, Two-way ANOVA RM). I Frequency histogram of single cell lags relative to the phase of the whole structure (****p<0.0001, Two-way ANOVA Interaction). (J) NTS single cell oscillators are characterised by a shorter but more variable period than those in the AP (SD period; *p<0.05, n=8, T-test). (K) In vivo core clock gene expression of Per2 and Bmal1 in the AP and NTS relative to CT0. (*p<0.05, **p<0.01, ****p<0.0001, One-way ANOVA and ##p<0.01 Kruskal-Wallis test). All data are mean ± SEM. White bars depict 100 µm.
4.4.3 Forskolin treatment re-synchronises individual cellular rhythms and transiently
synchronises phase in the three oscillators
As forskolin can re-activate PER2::LUC rhythms in hypothalamic explants (Guilding et al.,
2009) we subsequently treated brainstem cultures with 10 µM forskolin to re-initiate the
AP, NTS, and 4thVep oscillations. Properties of these rhythms were restored to pre-
damping values and oscillations were sustained for the next 7 to 14 days. Forskolin
application transiently synchronised the three oscillators so that, for the first time, the
4thVep was in phase with that of the AP and NTS. However, by 5 days post forskolin
treatment the initial spatiotemporal sequence seen during baseline (AP leading the NTS,
followed much later by the 4thVep) had resumed (Fig 4.3A). Furthermore, treatment with
forskolin re-initiated synchronous single cell rhythms in both structures (Fig 4.3B,C). These
findings indicate that damping of whole tissue rhythms in the AP and NTS is attributable to
both damping and desynchronisation of single cell oscillations.

RHYTHMS, SLEEP AND HOMEOSTASIS
138
Figure 4.3 Forskolin restores rhythmicity and transiently phase-aligns brainstem oscillators. A Crosscorrelograms (as described in Fig 4.2) showing the representative phase relationship for the NTS vs AP (red) and the 4thV ep vs AP (green) for baseline (left panels), days 1-2 (middle panels) and days 5-7 (right panels) post 10 μM forskolin treatment. B Bioluminescence traces for whole brain area rhythms for 7 days before and after 10 μM forskolin treatment, with the dotted lines representing the time at which the corresponding cross-correlograms in A were taken. C Single cell traces of PER2::LUC over 14 days with 10 μM forskolin treatment at day 7. D Rayleigh plots (as described in Fig 4.2) depicting phase clustering for the single cell bioluminescence traces in C for baseline day 2 and 5, and day 1 after 10 μM forskolin treatment.
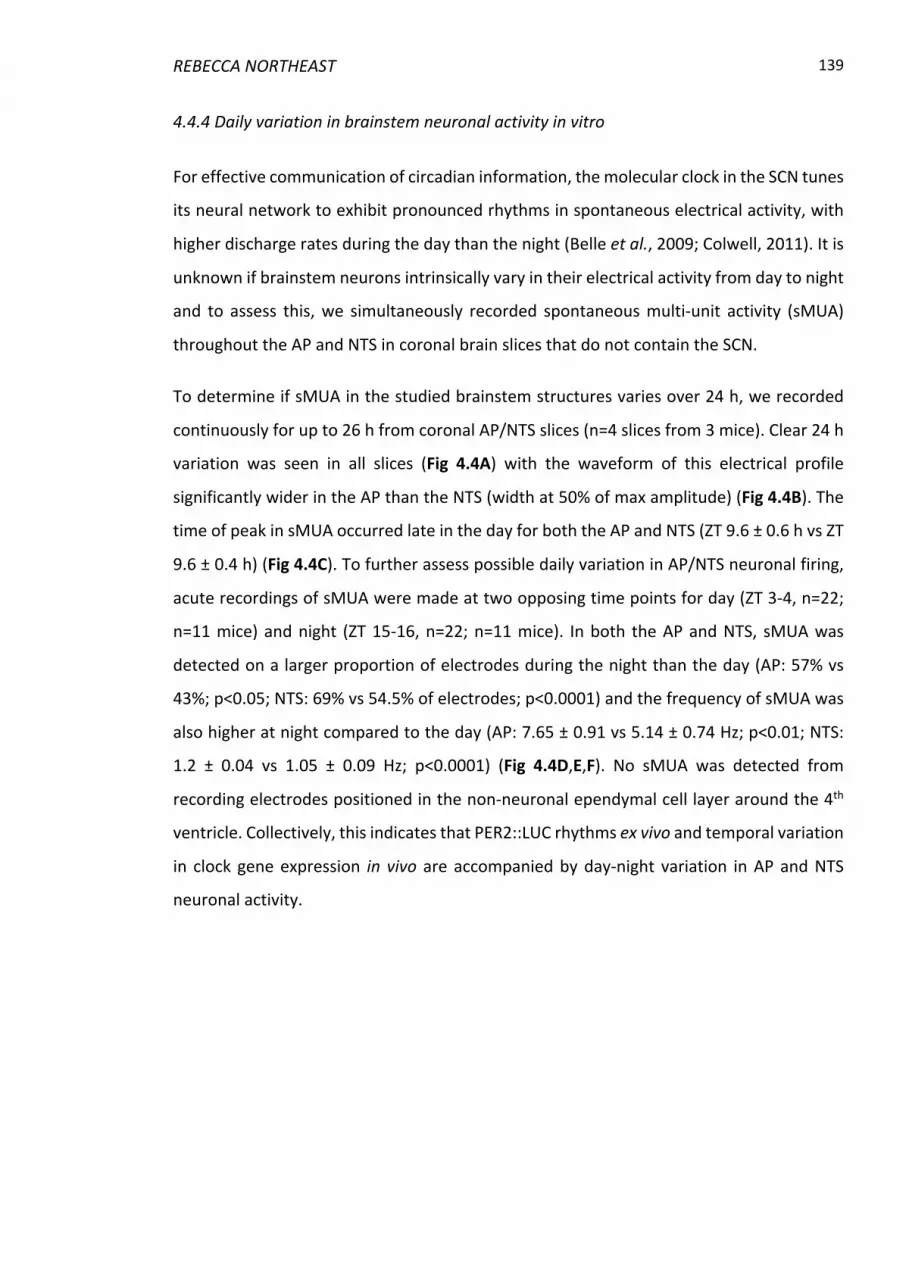
REBECCA NORTHEAST 139
4.4.4 Daily variation in brainstem neuronal activity in vitro
For effective communication of circadian information, the molecular clock in the SCN tunes
its neural network to exhibit pronounced rhythms in spontaneous electrical activity, with
higher discharge rates during the day than the night (Belle et al., 2009; Colwell, 2011). It is
unknown if brainstem neurons intrinsically vary in their electrical activity from day to night
and to assess this, we simultaneously recorded spontaneous multi-unit activity (sMUA)
throughout the AP and NTS in coronal brain slices that do not contain the SCN.
To determine if sMUA in the studied brainstem structures varies over 24 h, we recorded
continuously for up to 26 h from coronal AP/NTS slices (n=4 slices from 3 mice). Clear 24 h
variation was seen in all slices (Fig 4.4A) with the waveform of this electrical profile
significantly wider in the AP than the NTS (width at 50% of max amplitude) (Fig 4.4B). The
time of peak in sMUA occurred late in the day for both the AP and NTS (ZT 9.6 ± 0.6 h vs ZT
9.6 ± 0.4 h) (Fig 4.4C). To further assess possible daily variation in AP/NTS neuronal firing,
acute recordings of sMUA were made at two opposing time points for day (ZT 3-4, n=22;
n=11 mice) and night (ZT 15-16, n=22; n=11 mice). In both the AP and NTS, sMUA was
detected on a larger proportion of electrodes during the night than the day (AP: 57% vs
43%; p<0.05; NTS: 69% vs 54.5% of electrodes; p<0.0001) and the frequency of sMUA was
also higher at night compared to the day (AP: 7.65 ± 0.91 vs 5.14 ± 0.74 Hz; p<0.01; NTS:
1.2 ± 0.04 vs 1.05 ± 0.09 Hz; p<0.0001) (Fig 4.4D,E,F). No sMUA was detected from
recording electrodes positioned in the non-neuronal ependymal cell layer around the 4th
ventricle. Collectively, this indicates that PER2::LUC rhythms ex vivo and temporal variation
in clock gene expression in vivo are accompanied by day-night variation in AP and NTS
neuronal activity.

RHYTHMS, SLEEP AND HOMEOSTASIS
140
Figure 4.4 AP and NTS neurons exhibit robust 24h and day-night variation in electrical activity. A Example long-term recording profiles of spontaneous multi-unit activity (sMUA; bin = 600s) in the AP (in blue) and NTS (in red) showing the peak of electrical activity at late projected day / early night. Grey boxes depict the projected dark phase. All recordings were started at ZT2. B The width of the 24h sMUA profiles for individual recording sites (n=4 slices from 3 mice) in the AP and NTS taken at 50% of the peak amplitude (****p<0.0001, T-test). C The projected ZT of the peak of sMUA of each electrode in the AP and NTS with an average of ~ZT9.5 for both structures (ns, T-test). D Mirror heatmaps coding the levels of sMUA in the AP/NTS complex at projected early day (above; ZT3-4) and early night (below; ZT15-16) obtained from short-term recordings. E Scatterplot showing the sMUA from single recording electrodes localised in the AP (in blue; n=192) and NTS (in red; n=842); sMUA significantly elevated early night in both structures (**p<0.01, ****p<0.0001, t-test). F sMUA was detected at greater proportion of electrodes in the AP and NTS during the projected night (active locations; blue for AP and red for NTS) (*p<0.05, ****p<0.0001, Fisher’s test). ns=not significant.

REBECCA NORTHEAST 141
4.4.5 Day-Night Alterations in Responsiveness to Metabolic and Circadian Signals
In the SCN, the molecular circadian clock shapes daily variation in SCN neuronal responses
to neurohormonal signals (Belle & Piggins, 2017). To address this, we compared the day
and night responsiveness of AP and NTS neurons to a range of neurochemicals.
The AP and NTS can sense blood borne chemicals as well as neural signals that convey key
information on energy balance. This includes factors that reduce and/or terminate
ingestive behaviours such as raised concentrations of blood glucose, the adipocyte
hormone leptin, and the gastrointestinal hormone, cholecystokinin (CCK) (Fan et al., 2004;
Hisadome et al., 2014; Roberts et al., 2017). To gain insight into the potential influences of
circadian timekeeping in the AP/NTS, we next compared how those anorectic signals may
alter MUA in these areas during the day and night (projected ZT4-6 and ZT16-18
respectively). We found that CCK evoked activations in firing activity from the majority of
NTS electrodes (day 69%; night 78%) and found that the amplitude of these activations was
significantly increased at night (Δ2.9 ± 0.3 vs Δ3.71 ± 0.4 Hz, p<0.05) (Fig 4.5). In the AP,
CCK also evoked excitations with a trend to an increased proportion of activated electrodes
at night (25% vs 57%; p=0.059) (SFig 4.3). In both the NTS and AP, leptin induced activations
from only a small proportion of electrodes during the day (NTS 15%; AP 20%) and night
(NTS 13%; AP 26%), with no obvious time of day differences in the amplitude of evoked
responses. Exposure to elevated glucose elicited activations in the NTS and AP MUA from
~20% of recording sites during day and night, with the amplitude of response significantly
increased at night in the NTS (Δ1.5 ± 0.3 vs Δ2.5 ± 0.4 Hz; p<0.05) (Fig 4.5), but not in the
AP (SFig 4.3). This indicates increased nocturnal responsiveness of NTS and AP neurons to
CCK, with NTS neurons also exhibiting heightened responses to elevated glucose at night.
Neurons in the AP and NTS are also responsive to chemical cues that promote arousal and
consummatory behaviour, including the hypothalamic neuropeptide orexin A (OXA) and
the gastrointestinal hormone ghrelin (Yang, 2002; Yang et al., 2003; Cabral et al., 2017;
Cornejo et al., 2018). Ghrelin application elicited mostly activations in the NTS and AP MUA,
both day and night, with the amplitude of the response increased at night in the NTS (Δ1.3
± 0.3 vs Δ2.5 ± 0.4 Hz; p<0.05) (Fig 4.5), but not in the AP (p=0.948) (SFig 4.3). OXA enhanced
MUA in ~70% of NTS recording sites, both day and night, with an increased amplitude in
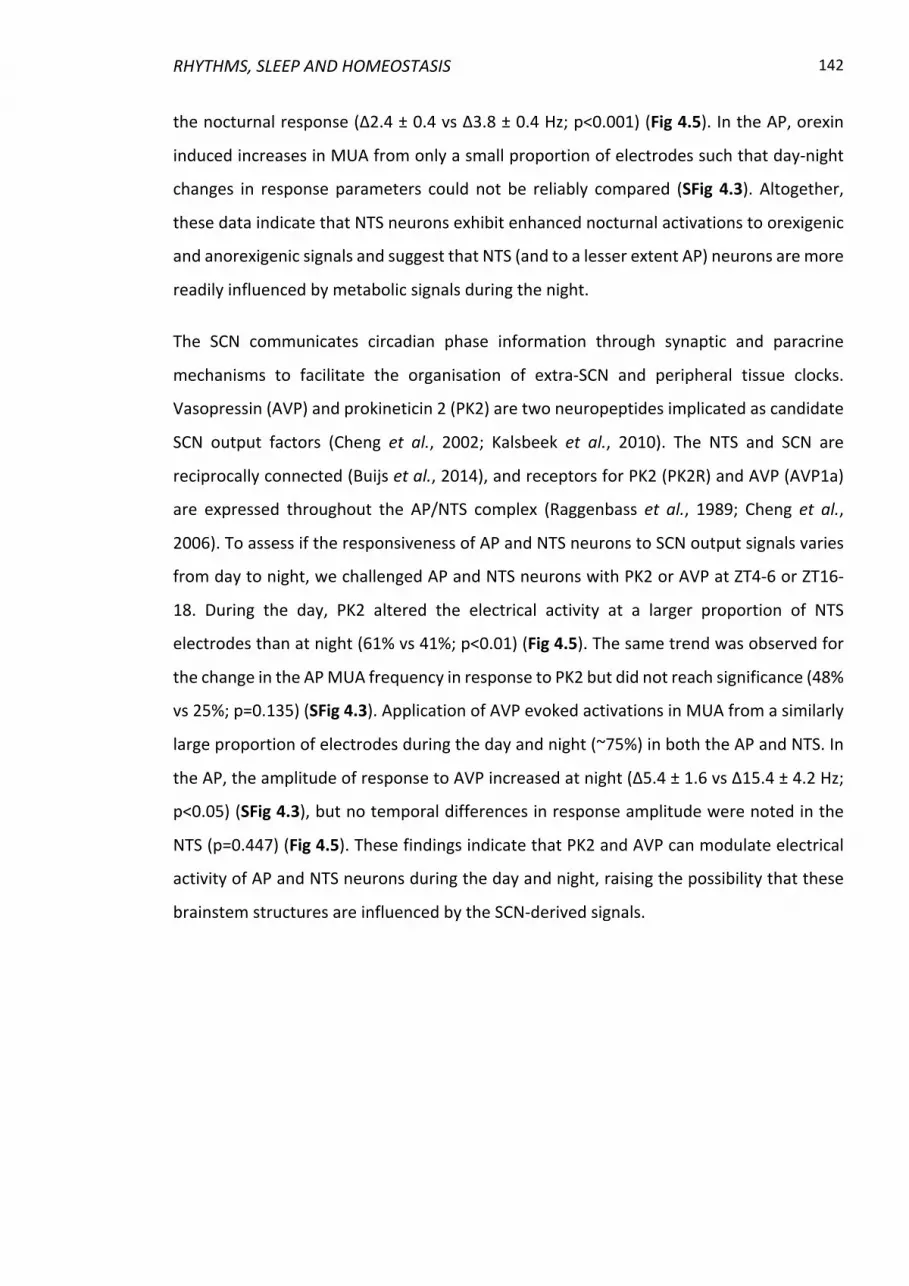
RHYTHMS, SLEEP AND HOMEOSTASIS
142
the nocturnal response (Δ2.4 ± 0.4 vs Δ3.8 ± 0.4 Hz; p<0.001) (Fig 4.5). In the AP, orexin
induced increases in MUA from only a small proportion of electrodes such that day-night
changes in response parameters could not be reliably compared (SFig 4.3). Altogether,
these data indicate that NTS neurons exhibit enhanced nocturnal activations to orexigenic
and anorexigenic signals and suggest that NTS (and to a lesser extent AP) neurons are more
readily influenced by metabolic signals during the night.
The SCN communicates circadian phase information through synaptic and paracrine
mechanisms to facilitate the organisation of extra-SCN and peripheral tissue clocks.
Vasopressin (AVP) and prokineticin 2 (PK2) are two neuropeptides implicated as candidate
SCN output factors (Cheng et al., 2002; Kalsbeek et al., 2010). The NTS and SCN are
reciprocally connected (Buijs et al., 2014), and receptors for PK2 (PK2R) and AVP (AVP1a)
are expressed throughout the AP/NTS complex (Raggenbass et al., 1989; Cheng et al.,
2006). To assess if the responsiveness of AP and NTS neurons to SCN output signals varies
from day to night, we challenged AP and NTS neurons with PK2 or AVP at ZT4-6 or ZT16-
18. During the day, PK2 altered the electrical activity at a larger proportion of NTS
electrodes than at night (61% vs 41%; p<0.01) (Fig 4.5). The same trend was observed for
the change in the AP MUA frequency in response to PK2 but did not reach significance (48%
vs 25%; p=0.135) (SFig 4.3). Application of AVP evoked activations in MUA from a similarly
large proportion of electrodes during the day and night (~75%) in both the AP and NTS. In
the AP, the amplitude of response to AVP increased at night (Δ5.4 ± 1.6 vs Δ15.4 ± 4.2 Hz;
p<0.05) (SFig 4.3), but no temporal differences in response amplitude were noted in the
NTS (p=0.447) (Fig 4.5). These findings indicate that PK2 and AVP can modulate electrical
activity of AP and NTS neurons during the day and night, raising the possibility that these
brainstem structures are influenced by the SCN-derived signals.
REBECCA NORTHEAST 143
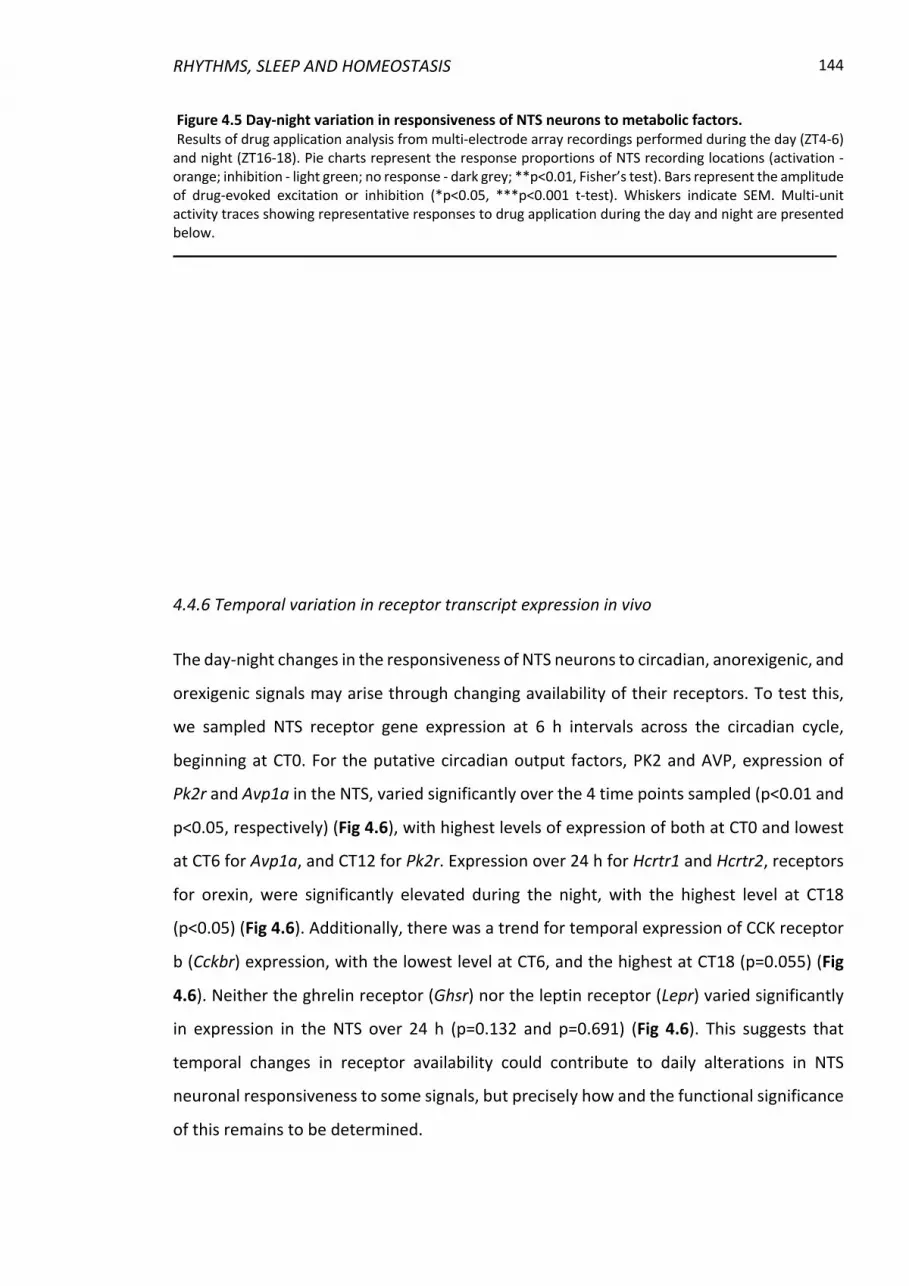
RHYTHMS, SLEEP AND HOMEOSTASIS
144
Figure 4.5 Day-night variation in responsiveness of NTS neurons to metabolic factors. Results of drug application analysis from multi-electrode array recordings performed during the day (ZT4-6) and night (ZT16-18). Pie charts represent the response proportions of NTS recording locations (activation - orange; inhibition - light green; no response - dark grey; **p<0.01, Fisher’s test). Bars represent the amplitude of drug-evoked excitation or inhibition (*p<0.05, ***p<0.001 t-test). Whiskers indicate SEM. Multi-unit activity traces showing representative responses to drug application during the day and night are presented below.
4.4.6 Temporal variation in receptor transcript expression in vivo
The day-night changes in the responsiveness of NTS neurons to circadian, anorexigenic, and
orexigenic signals may arise through changing availability of their receptors. To test this,
we sampled NTS receptor gene expression at 6 h intervals across the circadian cycle,
beginning at CT0. For the putative circadian output factors, PK2 and AVP, expression of
Pk2r and Avp1a in the NTS, varied significantly over the 4 time points sampled (p<0.01 and
p<0.05, respectively) (Fig 4.6), with highest levels of expression of both at CT0 and lowest
at CT6 for Avp1a, and CT12 for Pk2r. Expression over 24 h for Hcrtr1 and Hcrtr2, receptors
for orexin, were significantly elevated during the night, with the highest level at CT18
(p<0.05) (Fig 4.6). Additionally, there was a trend for temporal expression of CCK receptor
b (Cckbr) expression, with the lowest level at CT6, and the highest at CT18 (p=0.055) (Fig
4.6). Neither the ghrelin receptor (Ghsr) nor the leptin receptor (Lepr) varied significantly
in expression in the NTS over 24 h (p=0.132 and p=0.691) (Fig 4.6). This suggests that
temporal changes in receptor availability could contribute to daily alterations in NTS
neuronal responsiveness to some signals, but precisely how and the functional significance
of this remains to be determined.
REBECCA NORTHEAST 145
Figure 4.6 Circadian variation in receptor gene expression in the NTS. Gene expression relative to CT 0 in metabolic receptors in the NTS collected at CT 0, 6, 12 and 18. Significant temporal variation was seen for the orexin receptors (Hcrtr1 and Hcrtr2), the AVP receptor (Avpr1) and the PK2 receptor (Prokr2). *p<0.05, **p<0.01, One-way ANOVAs. Data are presented as mean ± SEM.
4.4.7 Daily Variation in AP/NTS glial barrier permeability
The border between the AP and NTS is delineated by prominent vimentin- and GFAP-
positive immunostaining (Fig 4.7A) and contains tight junctions that function to regulate
the diffusion of substances from the AP to the NTS parenchyma. Together these form a
highly specialised and unique barrier for this circumventricular organ (Gunzel & Yu, 2013;
Haseloff et al., 2015). To assess whether the AP/NTS glial barrier displayed any temporal
variation in functionality, we perfused mice with Evans Blue (EB) dye at early day or early
night time points under LD and DD conditions (ZT1/CT1 and ZT13/CT13 respectively).
During the early day, EB dye was mostly confined to the AP with minimal presence in the
subjacent and adjacent NTS. However, the early night perfusions revealed EB dye to be
present throughout the AP as well as the medial and, to a lesser extent, the lateral aspects
of the NTS (Fig 4.7B). This increase in EB permeability was observed across the rostro-
caudal axis of the AP/NTS complex, coinciding with the nocturnal decrease in Tjp1 and Cdn5
expression. Significant temporal variation in EB staining was seen under both LD and DD
conditions, indicating the endogenous circadian regulation of the permeability of the AP-
NTS border (Fig 4.7C).
RHYTHMS, SLEEP AND HOMEOSTASIS
146
Since our microdissected AP samples contained the AP/NTS glial border (SFig 4.1), and
because the tight junction components have been observed to be under circadian control
(Yamato et al., 2010; Oh-oka et al., 2014), we assessed temporal expression of genes coding
for the tight junction components zona occludens-1 (Tjp1) and claudin-5 (Cdn5). Expression
of Tjp1 (p<0.01) and Cdn5 (p<0.05) varied over the circadian cycle, with the lowest
expression in both transcripts occurring around the onset of circadian night (CT12) (Fig
4.7D), coinciding with the increase in permeability to EB.
Examination of the other sensory CVOs, the subfornical organ (SFO) and vascular organ of
lamina terminalis (OVLT) (SFig 4.4) indicated that EB dye was contained within these CVOs
at both early day and early night timepoints. This suggests that the nocturnal increase in
permeability to EB is unique to the AP/NTS complex. Taken together, our results suggest a
role for the circadian clock in regulating tight junction protein expression to allow for daily
changes in permeability to blood borne molecules.

REBECCA NORTHEAST 147
Figure 4.7 Increased permeability to Evans Blue dye in the NTS at early night. A Representative images of the rostral-caudal AP/NTS complex showing the merge (top row) of anti-vimentin and anti-GFAP staining for identification of the AP/NTS border along with annotations of the ROIs of the NTS for analysis (L- lateral, M – medial). B Evans Blue dye (EB) fluorescence imaging with added annotation of the AP/NTS border at ZT 1 vs ZT 13, shows the containment of staining at ZT 1, and ZT 13; note the increased penetration of EB into the adjacent NTS at ZT 13. C Intensity of EB staining in the whole, medial and lateral areas of the NTS for each rostral-caudal sample slice during LD (top row) and DD (bottom row) (*p<0.05, **p<0.01, ***p<0.001, ****p<0.0001, t-tests or #p<0.05 Mann-Whitney tests). D Relative gene expression of the tight junction proteins Claudin-5 (Cldn-5) and Zona occludens-1 (Tjp-1) in the AP with the glial border over 24h, relative to CT0, (Kruskal-Wallis test *p<0.05). White bars depict 100 µm. Data are shown as mean ± SEM.
# #
#

RHYTHMS, SLEEP AND HOMEOSTASIS
148
4.5 Discussion
Here, we provide compelling evidence from ex vivo studies that the AP and NTS contain
intrinsic circadian clocks that can drive daily variation in neuronal firing rate and day-night
alterations in responsiveness to peripheral and central metabolic cues. Further, under
constant dark conditions in vivo, we find that expression of circadian clock and tight
junction genes in these structures varies over 24 h, with increased permeability to blood
borne signals during the early night when expression of Per2 is high and that of Tjp1 and
Cldn5 low. Daily variation in genes coding for metabolic ligand receptors as well as putative
SCN output signals was also observed in vivo for these structures. Therefore, our findings
reveal circadian change in molecular, cellular, and electrophysiological activities within the
brainstem and implicate intrinsic circadian timekeeping as a source of this temporal
modulation.
Previous studies have shown that an obese state alters clock gene expression in the rodent
NTS (Herichová et al., 2007; Kaneko et al., 2009). In our study, we confirm the daily
variation of Per2 and Bmal1 expression in the NTS as well as in the AP. Real-time ex vivo
bioluminescent imaging of the hindbrain in PER2::LUC mice, revealed the presence of three
independent hindbrain oscillators; the AP, NTS and 4thVep. We found that the oscillatory
properties of the AP were more robust than those for the NTS, presumably due to the
increased synchronisation observed in the single cell oscillators. Initially, PER2::LUC
oscillations in all three hindbrain centres were sustained for up to 5-6 days and were
reinstated by forskolin to oscillate for up to a further two weeks in culture. Interestingly,
similar to findings in the SCN (Yamaguchi et al., 2003; Yan et al., 2007; Doi et al., 2011), our
study demonstrated a spatiotemporal wave in Per2 expression across the hindbrain
centres, originating and peaking first in the AP, with peak PER2 lagging by ~2 h in the NTS.
In contrast, PER2 in the 4thVep peaked in near antiphase to the AP, with a consistently
shorter period. Both the shorter period and antiphasic relationship of ependymal
oscillation in Per2 expression to neuronal rhythms have been observed with the choroid
plexus in particular (Myung et al., 2018) and in other central regions (Guilding et al., 2009).
Similar to SCN explants, the period of PER2 oscillations in cultured AP and NTS explants is
longer than 24 h and thus does not match with the typical mouse endogenous locomotor

REBECCA NORTHEAST 149
rhythm (~23.6 h) (Daan & Pittendrigh, 1976). Interestingly, SCN periodicity may be
shortened by choroid plexus derived diffusible factors to resemble that of whole animal
behaviour (Myung et al., 2018). Therefore, with the proximity of the fourth ventricle,
oscillating ependyma and choroid plexus may modulate the properties of the AP and NTS
circadian oscillation in vivo.
In addition, the circadian properties of the AP/NTS complex are potentially modulated or
entrained by the SCN. Anatomically, one study has shown the caudal NTS (but not the AP)
and SCN to have sparse reciprocal direct connections (Buijs et al., 2014). It is also likely that
the proximity of these structures to the ventricular system provides an additional conduit
for SCN-derived diffusible factors such as prokineticin 2 (PK2) or vasopressin (AVP) to
transmit circadian phase to the AP/NTS (Earnest & Sladek, 1986; Cheng et al., 2002, 2006;
Kalsbeek et al., 2010). Our MUA results demonstrate that the AP and NTS neurons are
responsive to AVP and PK2 during the day and night. Further, in the NTS we found a robust
rhythm in PK2 receptor expression with the nadir at early night, which is in-phase with the
PK2 mRNA rhythm in the SCN (Cheng et al., 2002). This reduction in PK2 receptor gene
expression at night is concordant with our observations of reduced nocturnal
responsiveness of NTS MUA to PK2. In contrast, while AVP receptor expression varied over
24 h in the NTS in a similar temporal pattern to that of AVP synthesis in the SCN (Kalsbeek
et al., 2010), there was no day to night change in the MUA response of AVP application in
the NTS. This was not the case for the AP as larger amplitude responses to AVP were
recorded during the night. Taken together, our results present the intriguing possibility that
these brainstem rhythms could be partly regulated by the SCN in a synaptic and/or
paracrine manner. It is however also possible that both AVP and PK2 originating from other
brain sites and peripheral tissues can act as anorexigenic agents in the NTS (Meyer et al.,
1989; Langhans et al., 1991; Beale et al., 2013).
In addition to the rhythmic expression of clock core genes, SCN timekeeping activity is
manifested by the 24 h variation in neuronal membrane excitability resulting in a higher
firing rate of clock cells during the subjective day (Belle et al., 2009). These rhythmic
changes in the electrical activity are necessary to communicate circadian phase among
single cell oscillators, as well as externally (Colwell, 2011). Such neuronal rhythms are
present in other putative extra-SCN oscillators such as the lateral habenula, the olfactory
RHYTHMS, SLEEP AND HOMEOSTASIS
150
bulb, and some hypothalamic centres (Zhao & Rusak, 2005; Guilding & Piggins, 2007; Sakhi
et al., 2014). Our study is the first to show robust rhythms of electrical activity in the AP
and NTS ex vivo. Long-term recordings of sMUA showed firing rate peaking late in the day
in for both structures, with no obvious spatiotemporal difference corresponding to our
observed ~2 h delay in peak PER2::LUC expression. In keeping with the PER2::LUC
oscillations, the rhythm in firing rate was more synchronised between recording sites in the
AP than in NTS, further supporting the interpretation that the AP contains a better coupled
oscillator. However, temporal profiles of the firing rate were narrower in the NTS,
suggesting that NTS oscillators are more precise in timekeeping, displaying elevated
electrical activity for a shorter time. It is also possible that the relatively quick rise in the
NTS firing rate stems from antecedent broad temporal activation of the AP, despite peaking
at the same circadian time. Shorter-term recordings from mice culled at early day or early
night confirmed that early night neuronal activity is higher than that at early day in both
structures. Our results are in keeping with a study that reports an antiphasic relationship
in electrical activity between the highly GABAergic SCN and lateral habenula (Sakhi et al.,
2014), another extra-SCN oscillator. We hypothesise that the late day/early night high
activity of brainstem neurons anticipates the behavioural active phase and thus contributes
to the animals’ preparedness for the circadian night.
The NTS functions as a brainstem hub and processes a plethora of metabolic state
information (Grill & Hayes, 2012). Here we find that responses to both anorexigenic and
orexigenic factors were elevated during the night. Anorexigenic CCK evoked larger
responses during the dark phase, concordant with elevated nocturnal expression of CCK
receptor b. Similarly, a rise in glucose concentration that mimics its postprandial elevation
in vivo elicited an increased excitatory response in NTS neurons during the projected night.
Orexigenic ghrelin and OXA were also more efficient in exciting NTS neurons during the
projected night phase, concordant with the highest expression of the orexin receptor 1 and
orexin receptor 2. Changes in electrical responsiveness to metabolic signals may stem
purely from the general elevation in excitability during the night. However, this does not
account for the absence in obvious temporal change in the responsiveness to other
substances tested such as leptin or vasopressin in the NTS. Another mechanism could be
24 h variation in receptor gene expression, providing functional receptors available at
REBECCA NORTHEAST 151
different times across the circadian cycle. This could account for day-night change in
responsiveness to some but not all factors assessed. Overall, our findings are in keeping
with a previous study showing that responses to neurochemicals are shaped in a circadian
manner (Belle & Piggins, 2017).
Although neurons are considered to be the major cellular oscillators of the master clock,
non-neuronal astrocytes express all core clock genes and their depletion impacts both
molecular and behavioural rhythms (Barca-Mayo et al., 2017; Brancaccio et al., 2017).
Other non-neuronal tissues such as the choroid plexus (Myung et al., 2018) and ventricular
ependymal layers (Guilding et al., 2009) (also shown in our study) exhibit robust circadian
oscillation in clock gene expression. Here, we show that PER2::LUC cells were densely
distributed in the AP and along its glial border. Emerging evidence from invertebrates
(Zhang et al., 2018) and vertebrates (Shimba et al., 2017) implicates circadian processes in
regulating daily variation in the permeability of the blood-brain barrier as well as tissue
barriers in the cornea (Wiechmann et al., 2014), kidney (Yamato et al., 2010) and large
intestine (Oh-oka et al., 2014). Such changes can be accompanied by daily variation in
components of tight junctions (Yamato et al., 2010; Oh-oka et al., 2014), gap junctions
(Zhang et al., 2018), and functionality of pericytes (Shimba et al., 2017). Our findings of 24
h variation in the expression of ZO-1 and claudin-5, along with increased nocturnal
permeability of the AP/NTS border to EB, are concordant with the view that the function
of biological barriers are subject to circadian regulation. EB has a molecular weight of 961
Da (Kaya & Ahishali, 2011), therefore we can assume that the AP/NTS border is directly
permeable to small circulatory molecules of a similar size. This could arise through direct
actions of molecular clock proteins on the promotor regions of tight junction genes (Burek
& Förster, 2009; Oh-oka et al., 2014). In other studies conducted during the early day, EB
was confined to the AP only and was not detected in the brain parenchyma (Morita &
Miyata, 2012; Langlet et al., 2013). The increased night-time permeability at the AP/NTS
border is anatomically selective as it was not detected at forebrain circumventricular organ
sites (SFO and OVLT) and suggests that there is greater passage of blood-borne signals into
the brainstem at night. This could enhance brainstem monitoring of the internal milieu as
well as increasing the influence of peripheral physiology on central homeostatic
mechanisms. Since NTS neurons recorded in vitro also exhibited elevated nocturnal

RHYTHMS, SLEEP AND HOMEOSTASIS
152
responsiveness to ghrelin and OXA, this strongly suggests that peripheral and central
orexigenic signals more readily influence the brainstem during the active phase.
In conclusion, we show for the first time a multi-oscillatory brainstem centre with three
independent circadian oscillators of both neuronal and non-neuronal/ependymal nature,
composed of the AP, NTS and 4thVep. Not only do the AP and NTS express robust
endogenous oscillations in core clock gene expression, but they also exhibit overt circadian
variation in neuronal firing. We also found evidence of the clock regulating higher nocturnal
responsiveness to metabolic factors and greater permeability of blood borne signals to the
brain parenchyma at night. Thus, circadian mechanisms exert an unexpectedly prominent
influence on molecular and cellular activity in homeostatic centres of the hindbrain.
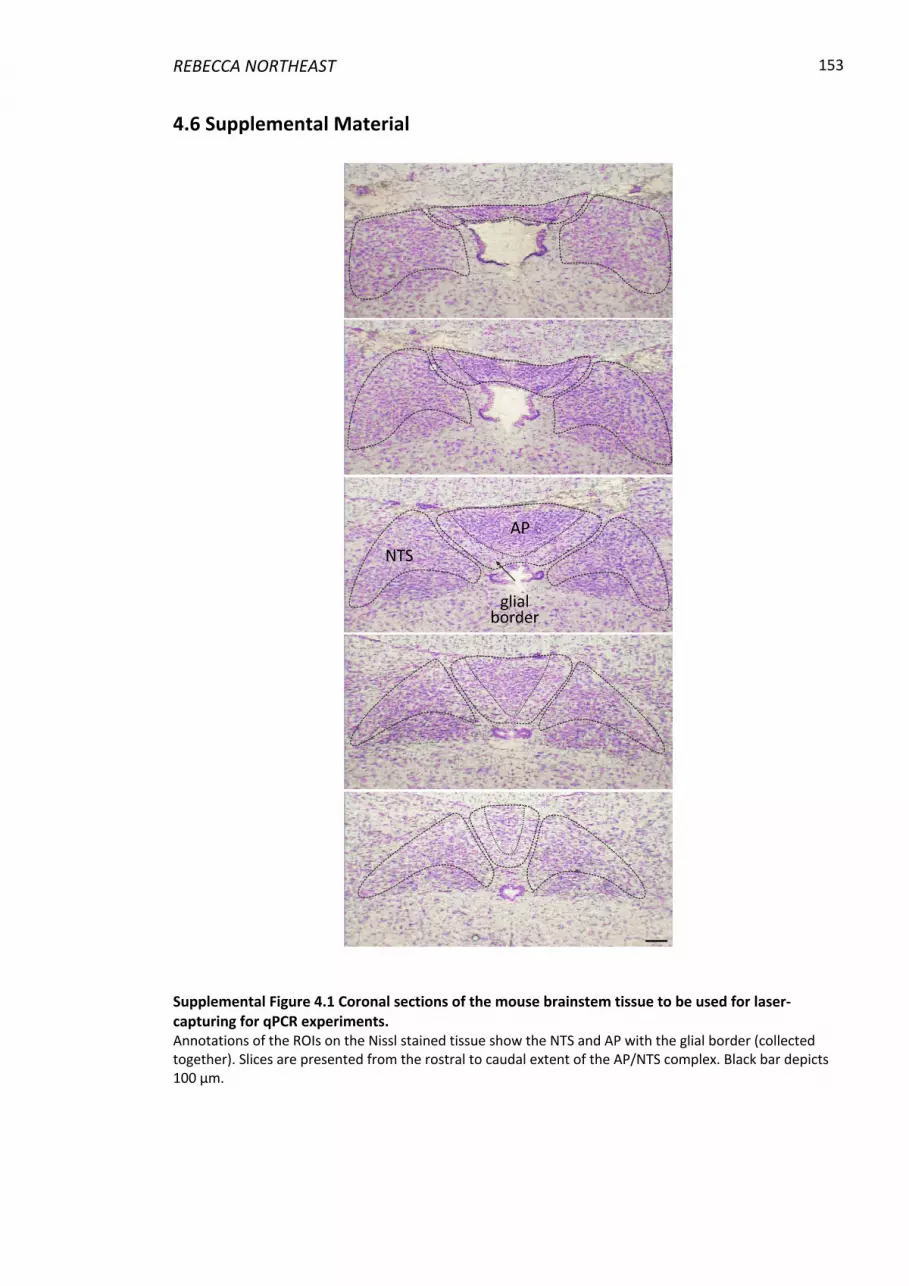
REBECCA NORTHEAST 153
4.6 Supplemental Material
Supplemental Figure 4.1 Coronal sections of the mouse brainstem tissue to be used for laser-capturing for qPCR experiments. Annotations of the ROIs on the Nissl stained tissue show the NTS and AP with the glial border (collected together). Slices are presented from the rostral to caudal extent of the AP/NTS complex. Black bar depicts 100 µm.
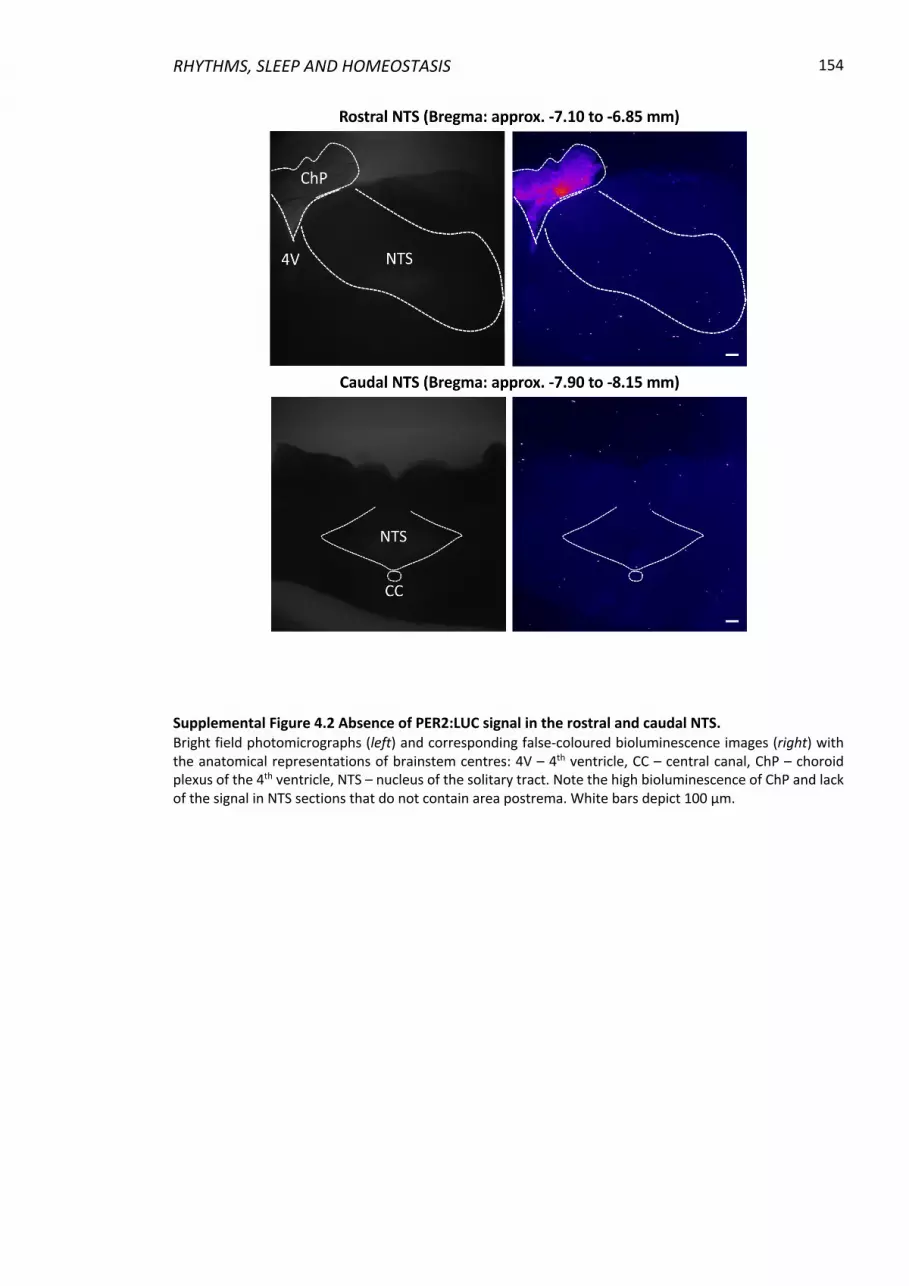
RHYTHMS, SLEEP AND HOMEOSTASIS
154
Supplemental Figure 4.2 Absence of PER2:LUC signal in the rostral and caudal NTS. Bright field photomicrographs (left) and corresponding false-coloured bioluminescence images (right) with the anatomical representations of brainstem centres: 4V – 4th ventricle, CC – central canal, ChP – choroid plexus of the 4th ventricle, NTS – nucleus of the solitary tract. Note the high bioluminescence of ChP and lack of the signal in NTS sections that do not contain area postrema. White bars depict 100 µm.
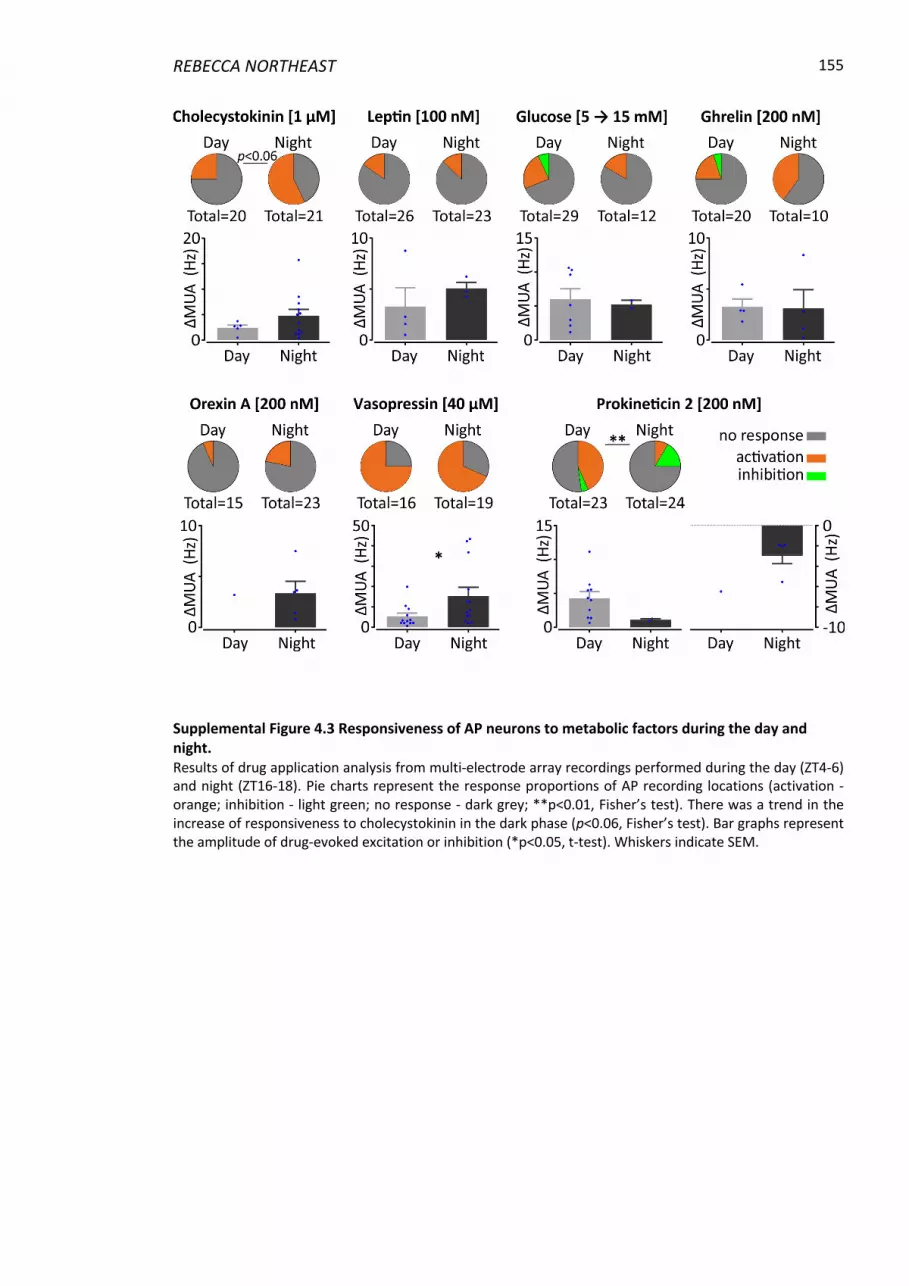
REBECCA NORTHEAST 155
Supplemental Figure 4.3 Responsiveness of AP neurons to metabolic factors during the day and night. Results of drug application analysis from multi-electrode array recordings performed during the day (ZT4-6) and night (ZT16-18). Pie charts represent the response proportions of AP recording locations (activation - orange; inhibition - light green; no response - dark grey; **p<0.01, Fisher’s test). There was a trend in the increase of responsiveness to cholecystokinin in the dark phase (p<0.06, Fisher’s test). Bar graphs represent the amplitude of drug-evoked excitation or inhibition (*p<0.05, t-test). Whiskers indicate SEM.

RHYTHMS, SLEEP AND HOMEOSTASIS
156
Supplemental Figure 4.4 Evans Blue (EB) is contained in the vascular organ of the lamina terminals (OVLT) and subfornical organ (SFO) in the day and night. Glial markers for circumventricular organs (GFAP - red, vimentin - green) were used to define anatomical borders of the OVLT and SFO for the assessment of EB staining (cyan). Note the lack of EB penetration into brain parenchyma at either time point. White bars depict 100 µm.
REBECCA NORTHEAST 157
4.6 References Abe, M., Herzog, E.D., Yamazaki, S., Straume, M., Tei, H., Sakaki, Y., Menaker, M., & Block,
G.D. (2002) Circadian rhythms in isolated brain regions. J. Neurosci., 22, 350–356. Albrecht, U. (2012) Timing to Perfection: The Biology of Central and Peripheral Circadian
Clocks. Neuron, 74, 246–260. Asher, G. & Sassone-Corsi, P. (2015) Time for food: The intimate interplay between
nutrition, metabolism, and the circadian clock. Cell, 161, 84–92. Barca-Mayo, O., Pons-Espinal, M., Follert, P., Armirotti, A., Berdondini, L., & De Pietri
Tonelli, D. (2017) Astrocyte deletion of Bmal1 alters daily locomotor activity and cognitive functions via GABA signalling. Nat. Commun., 8, 14336.
Baschieri, F. & Cortelli, P. (2019) Circadian rhythms of cardiovascular autonomic function: Physiology and clinical implications in neurodegenerative diseases. Auton. Neurosci. Basic Clin., 217, 91–101.
Beale, K.E.L., Gardiner, J. V., Bewick, G.A., Hostomska, K., Patel, N.A., Hussain, S.S., Jayasena, C.N., Ebling, F.J.P., Jethwa, P.H., Prosser, H.M., Lattanzi, R., Negri, L., Ghatei, M.A., Bloom, S.R., & Dhillo, W.S. (2013) Peripheral administration of prokineticin 2 potently reduces food intake and body weight in mice via the brainstem. Br. J. Pharmacol., 168, 403–410.
Belle, M.D.C., Diekman, C.O., Forger, D.B., & Piggins, H.D. (2009) Daily electrical silencing in the mammalian circadian clock. Science, 326, 281–284.
Belle, M.D.C. & Piggins, H.D. (2017) Circadian regulation of mouse suprachiasmatic nuclei neuronal states shapes responses to orexin. Eur. J. Neurosci., 45, 723–732.
Brancaccio, M., Patton, A.P., Chesham, J.E., Maywood, E.S., & Hastings, M.H. (2017) Astrocytes Control Circadian Timekeeping in the Suprachiasmatic Nucleus via Glutamatergic Signaling. Neuron, 93, 1420–1435.e5.
Brown, T.M. & Piggins, H.D. (2007) Electrophysiology of the suprachiasmatic circadian clock. Prog. Neurobiol., 82, 229–255.
Buijs, F.N., Cazarez, F., Basualdo, M.C., Scheer, F.A.J.L., Perusquía, M., Centurion, D., & Buijs, R.M. (2014) The suprachiasmatic nucleus is part of a neural feedback circuit adapting blood pressure response. Neuroscience, 266, 197–207.
Burek, M. & Förster, C.Y. (2009) Cloning and characterization of the murine claudin-5 promoter. Mol. Cell. Endocrinol., 298, 19–24.
Cabral, A., Cornejo, M.P., Fernandez, G., De Francesco, P.N., Garcia-Romero, G., Uriarte, M., Zigman, J.M., Portiansky, E., Reynaldo, M., & Perello, M. (2017) Circulating ghrelin acts on GABA neurons of the area postrema and mediates gastric emptying in male mice. Endocrinology, 158, 1436–1449.
Cheng, M.Y., Bullock, C.M., Li, C., Lee, A.G., Bermak, J.C., Belluzzi, J., Weaver, D.R., Leslie, F.M., & Zhou, Q.-Y. (2002) Prokineticin 2 transmits the behavioural circadian rhythm of the suprachiasmatic nucleus. Nature, 417, 405–410.
Cheng, M.Y., Leslie, F.M., & Zhou, Q.-Y. (2006) Expression of prokineticins and their receptors in the adult mouse brain. J. Comp. Neurol., 498, 796–809.
Colwell, C.S. (2011) Linking neural activity and molecular oscillations in the SCN. Nat. Rev. Neurosci., 12, 553–569.
Cornejo, M.P., De Francesco, P.N., García Romero, G., Portiansky, E.L., Zigman, J.M., Reynaldo, M., & Perello, M. (2018) Ghrelin receptor signaling targets segregated clusters of neurons within the nucleus of the solitary tract. Brain Struct. Funct., 223,
RHYTHMS, SLEEP AND HOMEOSTASIS
158
3133–3147. Daan, S. & Pittendrigh, C.S. (1976) A Functional analysis of circadian pacemakers in
nocturnal rodents - II. The variability of phase response curves. J. Comp. Physiol. A, 106, 291–331.
Doi, M., Ishida, A., Miyake, A., Sato, M., Komatsu, R., Yamazaki, F., Kimura, I., Tsuchiya, S., Kori, H., Seo, K., Yamaguchi, Y., Matsuo, M., Fustin, J.-M., Tanaka, R., Santo, Y., Yamada, H., Takahashi, Y., Araki, M., Nakao, K., Aizawa, S., Kobayashi, M., Obrietan, K., Tsujimoto, G., & Okamura, H. (2011) Circadian regulation of intracellular G-protein signalling mediates intercellular synchrony and rhythmicity in the suprachiasmatic nucleus. Nat. Commun., 2, 327.
Earnest, D.J. & Sladek, C.D. (1986) Circadian rhythms of vasopressin release from individual rat suprachiasmatic explants in vitro. Brain Res., 382, 129–133.
Fan, W., Ellacott, K.L.J., Halatchev, I.G., Takahashi, K., Yu, P., & Cone, R.D. (2004) Cholecystokinin-mediated suppression of feeding involves the brainstem melanocortin system. Nat. Neurosci., 7, 335–336.
Granados-Fuentes, D., Saxena, M.T., Prolo, L.M., Aton, S.J., & Herzog, E.D. (2004) Olfactory bulb neurons express functional, entrainable circadian rhythms. Eur. J. Neurosci., 19, 898–906.
Grill, H.J. & Hayes, M.R. (2009) The nucleus tractus solitarius: a portal for visceral afferent signal processing, energy status assessment and integration of their combined effects on food intake. Int. J. Obes., 33, S11–S15.
Grill, H.J. & Hayes, M.R. (2012) Hindbrain neurons as an essential hub in the neuroanatomically distributed control of energy balance. Cell Metab., 16, 296–309.
Guilding, C., Hughes, A.T.L., Brown, T.M., Namvar, S., & Piggins, H.D. (2009) A riot of rhythms: neuronal and glial circadian oscillators in the mediobasal hypothalamus. Mol. Brain, 2, 28.
Guilding, C. & Piggins, H.D. (2007) Challenging the omnipotence of the suprachiasmatic timekeeper: are circadian oscillators present throughout the mammalian brain? Eur. J. Neurosci., 25, 3195–3216.
Gunzel, D. & Yu, A.S.L. (2013) Claudins and the Modulation of Tight Junction Permeability. Physiol. Rev., 93, 525–569.
Haseloff, R.F., Dithmer, S., Winkler, L., Wolburg, H., & Blasig, I.E. (2015) Transmembrane proteins of the tight junctions at the blood-brain barrier: Structural and functional aspects. Semin. Cell Dev. Biol., 38, 16–25.
Hastings, M.H., Maywood, E.S., & Brancaccio, M. (2018) Generation of circadian rhythms in the suprachiasmatic nucleus. Nat. Rev. Neurosci., 19, 453–469.
Herichová, I., Mravec, B., Stebelová, K., Križanová, O., Jurkovičová, D., Kvetňanský, R., & Zeman, M. (2007) Rhythmic clock gene expression in heart, kidney and some brain nuclei involved in blood pressure control in hypertensive TGR(mREN-2)27 rats. Mol. Cell. Biochem., 296, 25–34.
Hisadome, K., Reimann, F., Gribble, F.M., & Trapp, S. (2014) Leptin Directly Depolarizes Preproglucagon Neurons in the Nucleus Tractus Solitarius Electrical Properties of Glucagon-Like Peptide 1 Neurons. Diabetes, 59, 1890–1898.
Kalsbeek, A., Fliers, E., Hofman, M.A., Swaab, D.F., & Buijs, R.M. (2010) Vasopressin and the Output of the Hypothalamic Biological Clock. J. Neuroendocrinol., 22, 362–372.
Kaneko, K., Yamada, T., Tsukita, S., Takahashi, K., Ishigaki, Y., Oka, Y., & Katagiri, H. (2009) Obesity alters circadian expressions of molecular clock genes in the brainstem. Brain
REBECCA NORTHEAST 159
Res., 1263, 58–68. Kaya, M. & Ahishali, B. (2011) Assessment of Permeability in Barrier Type of Endothelium
in Brain Using Tracers: Evans Blue, Sodium Fluorescein, and Horseradish Peroxidase. Humana Press, pp. 369–382.
Langhans, W., Delprete, E., & Scharrer, E. (1991) Mechanisms of vasopressin’s anorectic effect. Physiol. Behav., 49, 169–176.
Langlet, F., Mullier, A., Bouret, S.G., Prevot, V., & Dehouck, B. (2013) Tanycyte-like cells form a blood-cerebrospinal fluid barrier in the circumventricular organs of the mouse brain. J. Comp. Neurol., 521, 3389–3405.
Maolood, N. & Meister, B. (2009) Protein components of the blood–brain barrier (BBB) in the brainstem area postrema–nucleus tractus solitarius region. J. Chem. Neuroanat., 37, 182–195.
Meyer, A.H., Langhans, W., & Scharrer, E. (1989) Vasopressin Reduces Food Intake in Goats. Q. J. Exp. Physiol., 74, 465–473.
Morita, S. & Miyata, S. (2012) Different vascular permeability between the sensory and secretory circumventricular organs of adult mouse brain. Cell Tissue Res., 349, 589–603.
Myung, J., Schmal, C., Hong, S., Tsukizawa, Y., Rose, P., Zhang, Y., Holtzman, M.J., De Schutter, E., Herzel, H., Bordyugov, G., & Takumi, T. (2018) The choroid plexus is an important circadian clock component. Nat. Commun., 9, 1062.
Oh-oka, K., Kono, H., Ishimaru, K., Miyake, K., Kubota, T., Ogawa, H., Okumura, K., Shibata, S., & Nakao, A. (2014) Expressions of tight junction proteins occludin and claudin-1 Are under the circadian control in the mouse large intestine: Implications in intestinal permeability and susceptibility to colitis. PLoS One, 9, 1–10.
Paxinos, G. & Franklin, K.B.J. (2001) Mouse Brain in Stereotaxic Coordinates, Academic Press.
Raggenbass, M., Tribollet, E., Dubois-Dauphin, M., & Dreifuss, J.J. (1989) Vasopressin receptors of the vasopressor (V1) type in the nucleus of the solitary tract of the rat mediate direct neuronal excitation. J Neurosci, 9, 3929–3936.
Reinke, H. & Asher, G. (2019) Crosstalk between metabolism and circadian clocks. Nat. Rev. Mol. Cell Biol., 20, 227–241.
Roberts, B.L., Zhu, M., Zhao, H., Dillon, C., & Appleyard, S.M. (2017) High glucose increases action potential firing of catecholamine neurons in the nucleus of the solitary tract by increasing spontaneous glutamate inputs. Am. J. Physiol. - Regul. Integr. Comp. Physiol., 313, R229–R239.
Sakhi, K., Wegner, S., Belle, M.D.C., Howarth, M., Delagrange, P., Brown, T.M., & Piggins, H.D. (2014) Intrinsic and extrinsic cues regulate the daily profile of mouse lateral habenula neuronal activity. J. Physiol., 592, 5025–5045.
Shimba, S., Hinoi, E., Yoneda, Y., Yamada, D., Ikeno, S., Nakazato, R., Takarada, T., Kawabe, K., & Mieda, M. (2017) Disruption of Bmal1 Impairs Blood–Brain Barrier Integrity via Pericyte Dysfunction. J. Neurosci., 37, 10052–10062.
Takahashi, M., Tahara, Y., Tsubosaka, M., Fukazawa, M., Ozaki, M., Iwakami, T., Nakaoka, T., & Shibata, S. (2018) Chronotype and social jetlag influence human circadian clock gene expression. Sci. Rep., 8, 1–10.
Wang, Q.-P., Guan, J.-L., Pan, W., Kastin, A.J., & Shioda, S. (2008) A Diffusion Barrier Between the Area Postrema and Nucleus Tractus Solitarius. Neurochem. Res., 33, 2035–2043.
RHYTHMS, SLEEP AND HOMEOSTASIS
160
Wiechmann, A.F., Ceresa, B.P., & Howard, E.W. (2014) Diurnal Variation of Tight Junction Integrity Associates Inversely with Matrix Metalloproteinase Expression in Xenopus laevis Corneal Epithelium: Implications for Circadian Regulation of Homeostatic Surface Cell Desquamation. PLoS One, 9, e113810.
Yamaguchi, S., Isejima, H., Matsuo, T., Okura, R., Yagita, K., Kobayashi, M., & Okamura, H. (2003) Synchronization of cellular clocks in the suprachiasmatic nucleus. Science, 302, 1408–1412.
Yamato, M., Ito, T., Iwatani, H., Yamato, M., Imai, E., & Rakugi, H. (2010) E-cadherin and claudin-4 expression has circadian rhythm in adult rat kidney. J. Nephrol., 23, 102–210.
Yan, L., Karatsoreos, I., LeSauter, J., Welsh, D.K., Kay, S., Foley, D., & Silver, R. (2007) Exploring Spatiotemporal Organization of SCN Circuits. Cold Spring Harb. Symp. Quant. Biol., 72, 527–541.
Yang, B. (2002) Orexin-A Depolarizes Nucleus Tractus Solitarius Neurons Through Effects on Nonselective Cationic and K+ Conductances. J. Neurophysiol., 89, 2167–2175.
Yang, B., Samson, W.K., & Ferguson, A. V (2003) Excitatory Effects of Orexin-A on Nucleus Tractus Solitarius Neurons Are Mediated by Phospholipase C and Protein Kinase C. J. Neurosci., 23, 6215–6222.
Yoo, S.-H., Yamazaki, S., Lowrey, P.L., Shimomura, K., Ko, C.H., Buhr, E.D., Siepka, S.M., Hong, H.-K., Oh, W.J., Yoo, O.J., Menaker, M., & Takahashi, J.S. (2004) PERIOD2::LUCIFERASE real-time reporting of circadian dynamics reveals persistent circadian oscillations in mouse peripheral tissues. Proc. Natl. Acad. Sci. U. S. A., 101, 5339–5346.
Zhan, C., Zhou, J., Feng, Q., Zhang, J., Lin, S., Bao, J., Wu, P., & Luo, M. (2013) Acute and Long-Term Suppression of Feeding Behavior by POMC Neurons in the Brainstem and Hypothalamus, Respectively. J. Neurosci., 33, 3624–3632.
Zhang, S.L., Yue, Z., Arnold, D.M., Artiushin, G., & Sehgal, A. (2018) A Circadian Clock in the Blood-Brain Barrier Regulates Xenobiotic Efflux. Cell, 173, 130–139.e10.
Zhao, H. & Rusak, B. (2005) Circadian firing-rate rhythms and light responses of rat habenular nucleus neurons in vivo and in vitro. Neuroscience, 132, 519–528.
REBECCA NORTHEAST 161
Chapter 5: General Discussion
5.1 Rhythms Influencing Sleep and Homeostasis
5.1.1 Overview
Organisms have evolved an internal circadian system in order to align themselves with the
24 h nature of the external environment, enabling anticipation of predictive resources and
energy conservation at the appropriate times. In addition, we have evolved a robust
homeostatic network for a myriad of processes that tightly maintains our physiological
systems around a certain set point, despite constant external challenges. In this thesis I set
out to determine the extent of the neural circadian system outside of the master clock and
its potential impact on three vital homeostatic processes; sleep, fluid and energy balance.
In Chapter 2, I discovered that misaligned feeding maintains total sleep homeostasis in
mice, despite gross reorganisation of their daily sleep-wake patterning. Furthermore, I
demonstrated that sleep drive is lowered during RF, shedding light on a potential
evolutionary mechanism in behavioural flexibility which allows animals to more readily
wake when food availability is out of sync with typical activity. In Chapter 3, I discovered a
previously unknown oscillator present in a brain area primarily involved in fluid
homeostasis, the SFO. I then went on to characterise the circadian properties of this
oscillator and that of the OVLT, its sister in the central control of fluid balance. My results
illustrate that these oscillators are highly robust and display characteristics more similar to
those of the SCN than many other previously studied extra-SCN oscillators. In Chapter 4, I
demonstrated the oscillatory properties in two hindbrain areas that play key roles in the
maintenance of energy balance. I also went one step further and revealed hints at the
potential functionality of these clocks, showing day night changes in responsiveness to
metabolic signals and changes in the availability of their receptors. Furthermore, I also
highlighted a potential role for glial cell involvement in regulating day-night changes in
barrier permeability.
In this section I will discuss further interpretations and implications of my research, in
addition to possible avenues for future investigations in light of my findings.

RHYTHMS, SLEEP AND HOMEOSTASIS
162
5.1.2 Sleep homeostasis and evolutionary adaptions
The finding that sleep drive is reduced during daytime food restriction (Chapter 2) leads to
intriguing hypotheses about the advantages of such a phenomenon. In Drosophila
melanogaster, one group of researchers discovered that when male flies were allowed to
interact with females or exposed to female pheromones, this resulted in prolonged sleep
deprivation after which there was no subsequent rebound recovery sleep, as seen during
standard sleep deprivation (Beckwith et al., 2017). This demonstrates that sleep
homeostasis was lost with a reduction in sleep drive, raising questions into where Borbely’s
two-process model fits into this paradigm. Is it that as well as a process S and process C,
there is a third process driven by evolutionary pressures (process E) such as the
requirement to mate and to feed, that can override the original two (Fig 5.1)? My data from
the initial days of food restriction demonstrating increased wake and decreased slow-wave
energy, along with the model of fruit flies reducing sleep in order to mate, could be used
in the future as paradigms to investigate such evolutionary pressures and their effects on
sleep regulation.
Figure 5.1 The evolutionary drive and the “two process model”. A reimagining of the original two process model to accommodate a different types of wakefulness driving be evolutionary pressures “Process E”, where homeostatic sleep accumulation is reduced during periods requiring behavioural flexibility in arousal.

REBECCA NORTHEAST 163
Similarly to nocturnal rodents, Drosophila also display reduced total sleep during a 24 h
fast which is then compensated for by an increased amount of sleep the following
recovery day when fed ad lib (Keene et al., 2010; Thimgan et al., 2010; Regalado et al.,
2017). Interestingly, prolonged wake during starvation in Drosophila does not show a
rebound in sleep amount when compared to sleep deprivation for a similar length of time
(Thimgan et al., 2010). This is a similar observation to the observation of Chapter 2 that
SWA is reduced following prolonged wake due to FAA versus matched sleep deprivation.
Moreover, sleep in C. elegans is crucial during periods of starvation where development is
arrested to aid survival (Wu et al., 2018). In blind Mexican cavefish, Astyanax mexicanus,
which have evolved to dramatically reduce sleep proposed to increase time for foraging
behaviour (Elipot et al., 2013), prolonged starvation paradoxically induces sleep in these
animals perhaps to preserve energy when food is scarce (Jaggard et al., 2017). Together
these studies suggest that the mechanisms for maintaining arousal to seek food may be
conserved across species and highlight an important evolutionary role for sleep in
regulating metabolic challenges across taxa.
5.1.3 The sCVOs in immune regulation and energy balance
So far, the focus of discussion on the sCVOs has been primarily on their roles in fluid
balance. However, due to their unique nature of exposure to circulating substances, the
sCVOs provide an access point for the brain in monitoring many substances including
immune response factors such as circulating cytokines and endotoxins. All sCVOs contain
receptors for interleukin-1β (IL-1β) and toll-like receptor (TLR4) (Cunningham et al., 1992;
Laflamme & Rivest, 2002), and immune insult challenges through injection of IL-1β and
lipopolysaccharide (LPS) induced c-fos expression in one or more of these areas (Hare et
al., 1995; Elmquist et al., 1996). In light of my data from Chapter 3 revealing the SFO to
contain temporally distributed genes involved in the immune response regulation, Nfil3
and Prf1, there could indeed be a role for the local clock in sCVOs in regulating their
responses in to circulating immune factors.
The AP has well described roles in energy balance due to the action of circulating hormones
like amylin and leptin inducing anorectic behavioural responses (Liberini et al., 2016; Smith
et al., 2016). In addition, the SFO has been a focal point for discussion in the role of energy
balance due to the presence of receptors for metabolic hormones and its efferent
RHYTHMS, SLEEP AND HOMEOSTASIS
164
projections to brain areas involved in feeding control, however its roles in such processes
are not well described (McKinley et al., 2019). The SFO expresses the ghrelin receptor,
GHSR, with in vitro recordings from SFO neurons demonstrating that they are robustly
activated by ghrelin application (Pulman et al., 2006). As well as the AP, the SFO also
contains receptors for amylin (Sexton et al., 1994) and peripheral administration of this
peptide at dark onset induced c-fos activation in the SFO and the AP (Barth et al., 2004). As
shown in Chapters 3 and 4, Per2 expression is highest in the SFO and AP at dark onset, thus
local clocks could be gating sCVO responses to metabolic substances such as amylin.
Further work is required to determine the physiological significance of these receptors in
the SFO and their influence on feeding behaviour. It is definitely an avenue worth
considering since this thesis presents strong evidence that the AP and SFO contain local
clocks which are conceivably involved in gating responses to circulating metabolic factors.
5.1.4 A network of localised circadian homeostatic control
In my thesis I have focussed separately on specific brain areas and their interactions, mainly
the lamina terminalis and the dorsal vagal complex. However, these two areas along with
the hypothalamus, an area also containing localised clockwork (Guilding et al., 2009;
Orozco-Solis et al., 2016), are involved in a network of complex interactions in regulating
homeostatic processes. This hints at a role for localised clock interactions in modulating
the circadian output of these networked systems.
The SFO plays well known roles in sodium appetite in mammals (Nation et al., 2016; Ch’ng
& Lawrence, 2018), a crucial mediator in fluid balance. Recent evidence has highlighted a
small subset of aldosterone sensing neurons in the NTS, whereby aldosterone and ATII act
synergy on these neurons to drive sodium appetite (Jarvie & Palmiter, 2017; Resch et al.,
2017). Interestingly, these aldosterone sensing neurons are anatomically localised to
where we observed the most intense signal of PER2::LUC bioluminescence in the NTS in
Chapter 4, strongly indicating that these neurons are part of the oscillatory population.
Furthermore, both aldosterone sensing neurons in the NTS and thirst driving neurons in
the SFO in response to ATII both project to the BNST (Matsuda et al., 2016; Jarvie &
Palmiter, 2017), identifying the BNST as a likely point of convergence in the neural control
REBECCA NORTHEAST 165
of salt appetite. In light of my findings, it is possible that local oscillations in these areas
play important roles in this network mediated homeostatic mechanism (Fig 5.2).
Mediating the baroreflex is a key role of the DVC. Additionally, the SFO has also been
implicated in baroreflex control through direct action of ATII exciting SFO efferents to PVN
neurons which then project to the DVC cardiovascular regulatory sites (Bains & Ferguson,
1995; Tanaka et al., 1995) (Fig 5.2). The AP also plays a key role in the baroreflex through
the opposing actions of ATII and AVP, as ATII weakens this reflex while AVP enhances it
(Cox et al., 1990; Xue et al., 2003). Blood pressure displays clear circadian regulation
(Millar-Craig et al., 1978), therefore further investigations will be able to elude to the
potential role of local clocks in these baroreflex mediatory areas. As with many
physiological systems, blood pressure control displays a great deal of redundancy,
therefore the removal of the clock in only one of these areas will more than likely not affect
overall circadian control on blood pressure. Perhaps when viewed as a network, removing
local clocks from all involved extra-SCN oscillators might reveal their overall contribution
to this mechanism.
The NTS has also been implicated in the control of brown adipose tissue (BAT)
thermogenesis, a phenomenon integral to homeostatic thermoregulation and energy
balance (Cao et al., 2004). Typically, BAT is induced through thermosensory information
being relayed to the rostral raphe pallidus (rRPA) via the MnPO and the DMH (Morrison et
al., 2012). A separate pathway via vagal activation of second order neurons in the NTS
results in inhibition of BAT through GABAergic signalling to the rRPA (Madden et al., 2017)
(Fig 5.2). Thus, the NTS is implicated in a homeostatic response in opposite action to that
of the MnPO and DMH, areas also displaying local circadian rhythmicity (Guilding et al.,
2009; Moreno et al., 2014). With body temperature displaying clear circadian variation,
localised temporal control in these areas could be a contributing factor to these
temperature rhythms.
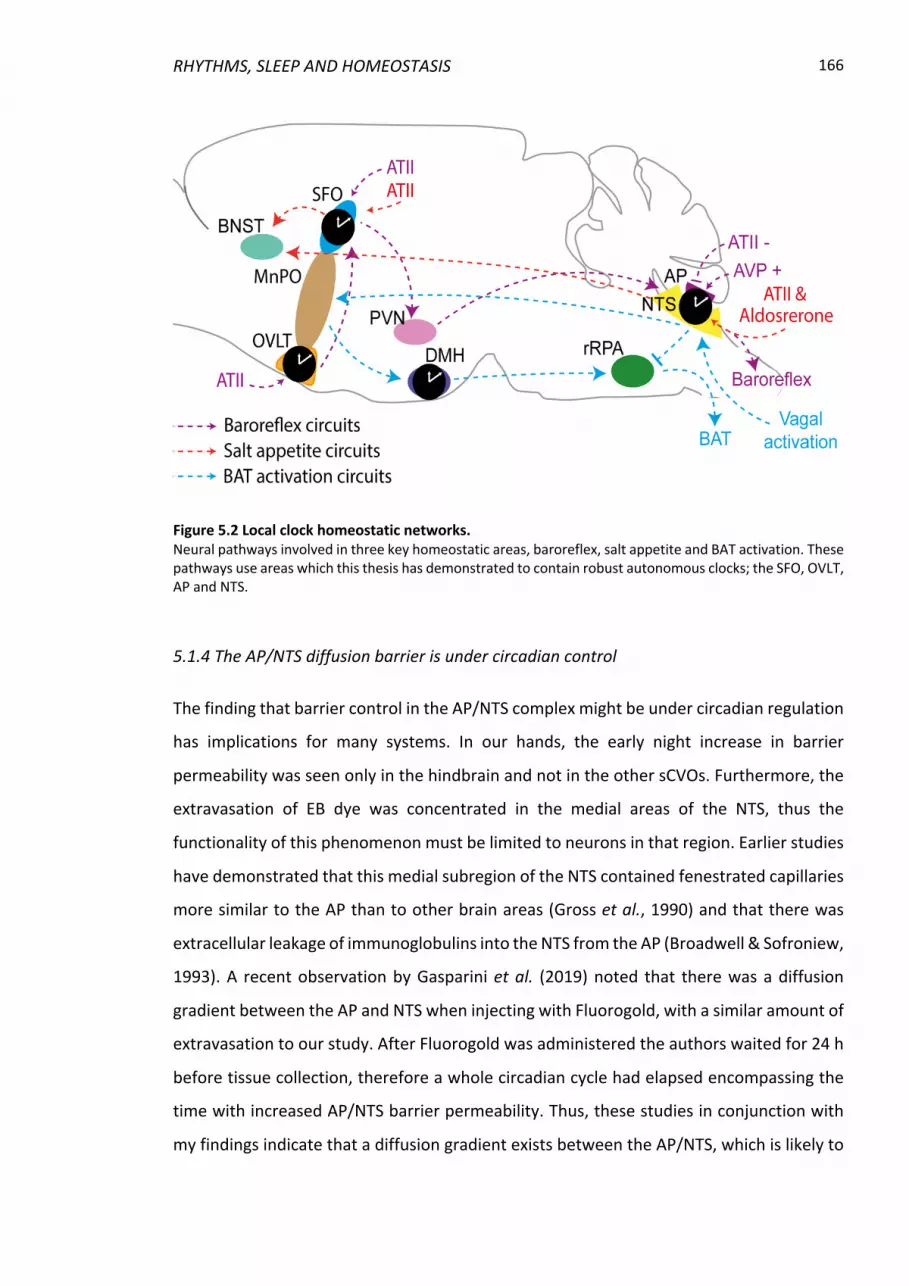
RHYTHMS, SLEEP AND HOMEOSTASIS
166
Figure 5.2 Local clock homeostatic networks. Neural pathways involved in three key homeostatic areas, baroreflex, salt appetite and BAT activation. These pathways use areas which this thesis has demonstrated to contain robust autonomous clocks; the SFO, OVLT, AP and NTS.
5.1.4 The AP/NTS diffusion barrier is under circadian control
The finding that barrier control in the AP/NTS complex might be under circadian regulation
has implications for many systems. In our hands, the early night increase in barrier
permeability was seen only in the hindbrain and not in the other sCVOs. Furthermore, the
extravasation of EB dye was concentrated in the medial areas of the NTS, thus the
functionality of this phenomenon must be limited to neurons in that region. Earlier studies
have demonstrated that this medial subregion of the NTS contained fenestrated capillaries
more similar to the AP than to other brain areas (Gross et al., 1990) and that there was
extracellular leakage of immunoglobulins into the NTS from the AP (Broadwell & Sofroniew,
1993). A recent observation by Gasparini et al. (2019) noted that there was a diffusion
gradient between the AP and NTS when injecting with Fluorogold, with a similar amount of
extravasation to our study. After Fluorogold was administered the authors waited for 24 h
before tissue collection, therefore a whole circadian cycle had elapsed encompassing the
time with increased AP/NTS barrier permeability. Thus, these studies in conjunction with
my findings indicate that a diffusion gradient exists between the AP/NTS, which is likely to
REBECCA NORTHEAST 167
be under circadian control. Knowledge of this time of day change in barrier permeability
could be therapeutically in useful in cases such as leptin resistance, whereby increased
circulating levels of leptin due to obesity become saturated in BBB transport and contribute
to the effects of leptin resistance (Gruzdeva et al., 2019). Therefore, timed delivery of
substances aimed at controlling energy balance including augmenting satiety signals acting
via the NTS could be an avenue for future treatment.
In general, disrupted BBB permeability is observed during certain CNS pathologies such as
stroke or Alzheimer’s disease and is not associated with healthy states (Sweeney et al.,
2019). Other studies have also demonstrated evidence of circadian control over BBB
systems. One such study demonstrated in Drosophila that BBB permeability was higher at
night, and that this was regulated by the molecular clock in glial cells controlling temporal
tight junction expression (Zhang et al., 2018). The molecular clock has also been implicated
in the control of astrocyte function, where nestin lineage Bmal1 knockdown increased BBB
permeability, due to an age dependent loss of pericyte integrity with nestin observed to be
present in pericytes (Nakazato et al., 2017). Bmal1 in astrocytes has also been
demonstrated in controlling astrocyte activation (Lananna et al., 2018). Thus, the molecular
clockwork in astrocytes is likely to be controlling temporal changes in the AP/NTS glial
barrier permeability, through regulation of tight junction protein availability and/or
through morphological changes.
5.1.5 Local clocks and aging
Many neurological disorders are associated with aging. Age-related decline in circadian
rhythmicity has been demonstrated in many systems and is implicated in pathologies such
as Alzheimer’s disease (Van Erum et al., 2018). A common observation among the aging
population is a lack of hunger and thirst, often leading to severe dehydration (Begg, 2017).
Aging dampens MUA oscillations in the SCN in middle aged mice (Nakamura et al., 2011),
and molecular rhythms of clock genes in the hippocampus were lost in aging hamsters
(Duncan et al., 2013). In addition, Bonaconsa et al. (2014) demonstrated a lack of rhythms
in clock genes in the SCN and peripheral tissues and unpublished work from our group
demonstrates PER2::LUC rhythms are damped in the MBH in aged mice. This indicates that
other extra-SCN oscillators such as the SFO and OVLT could be damped with age, and
RHYTHMS, SLEEP AND HOMEOSTASIS
168
perhaps it is the lack of rhythms in areas crucial for the perception of thirst that could be
contributing to age-related problems associated with fluid balance.
5.2 Future Directions and Limitations
5.2.1 Investigating sleep drive and energy balance
As eluded to by my research in Chapter 2, daytime restricted feeding reduces sleep drive
but maintains overall vigilance state homeostasis. There is clearly an interaction between
the development of stable food entrainment, shown through the appearance of FAA, and
sleep homeostatic mechanisms. It is therefore of major interest to the sleep and circadian
fields to further elucidate the extent of the interaction of the drive to sleep versus the need
to seek food and try to establish where they overlap or override each other in regulating
behaviour. One possible experimental outline to investigate this would be to perform
increasing amounts of sleep deprivation after food entrainment has been established,
ensuring 1 h prior to meal time is left undisturbed to observe when sleep drive overrides
the FAA. In this case, sleep homeostasis might be lost and instead reveal allostatic
compensation (Kim et al., 2007), whereby sleep is not regained in proportion to
accumulated sleep debt but instead total sleep amount could be reduced to maintain
arousal and food seeking behaviour.
During classic food entrainment experiments determining the FEO as a true oscillator,
animals were allowed to recover with ad lib food for 5-7 days before then being fasted for
48 h, whereby food anticipation should occur at the time in phase with the previous feeding
zeitgeber (Mistlberger, 2011). One way to elucidate the role of reduced sleep drive with
FAA would be to perform a 48 h fast in naïve animals, allow recovery and then undergo a
classic restricted feeding paradigm. Following recovery from this, a further 48 h fast should
be performed to observe the re-emergence of FAA. Acute fasting increases activity
(Gallardo et al., 2014) and decreases total sleep (Mieda et al., 2004) in mice, therefore it
would be interesting to observe and compare the sleep homeostatic responses during the
above experiment. One hypothesis would be that SWA compensation is increased in the

REBECCA NORTHEAST 169
naïve fasted vs RF conditions, but is perhaps reduced during the post-RF fast, engaging the
compensatory mechanisms that occurred during RF.
In addition to chronic EEG recordings, the ability to simultaneously record local field
potentials (LFPs) from individual neurons provides an extra information regarding the
neural processes relating to the regulation of sleep homeostasis (Fisher et al., 2016;
McKillop et al., 2018). Repeating the RF paradigm with LFP cortical recordings could reveal
interesting insights at the level of cortical neuronal control during adaption and subsequent
entrainment to daytime food restriction. This would enable the discovery of potential
regulatory areas that demonstrate up or down states during FAA, leading to a better
understanding of what drives this phenomenon.
5.2.2 Localised circadian control in extra-SCN oscillators
Vasopressin neuronal connections from the SCN to the OVLT play a role in the generation
of circadian drinking rhythms (Gizowski et al., 2016). However, my discoveries of
endogenous clocks in the SFO and OVLT in Chapter 3 raise the intriguing possibility into the
local control of rhythmic drinking behaviour by sCVOs. By using cre/lox technology and
localised injections targeting the SFO and OVLT, it is possible to knockdown the local
molecular clock in these areas (e.g. Bmal1-flox and adeno-associated virus-cre injections).
Removing the clock in the SFO and OVLT individually, as well as together, would enable the
assessment of the individual and collaborative roles of localised circadian control.
Observations of drinking rhythms over 24 h would determine their role in the circadian
patterning of drinking behaviour, and to observe whether the anticipatory period of
drinking is attenuated when one or both of these local clocks are removed. Furthermore,
performing water or sodium depletion challenges at different times of day might provide
information on the role of the clock in the response to acute thirst driving challenges.
As well as fluid homeostasis, the SFO has also been demonstrated to be responsive to
metabolic and immune signals, highlighting its potential role in a myriad of other process
(Ferguson, 2014). So far, my research into the contribution of the clock in the SFO has been
hypothesis directed through specific investigation into known circadian regulated genes
and core clock gene involvement. It would therefore be prudent to investigate the SFO

RHYTHMS, SLEEP AND HOMEOSTASIS
170
from a “bottom up” perspective using in vivo RNA sequencing of the SFO at multiple time
points across the circadian cycle in attempt to elucidate which processes the local clock is
controlling. Experiments such as these have been performed to good effect in other local
clocks (e.g. the mammary gland (Yang et al., 2017)) enabling the discovery of tissue specific
process that are under circadian control.
5.2.3 Identification of oscillator neuron type in the NTS
The NTS is a contains a heterogenous population expressing a wide variety of
neuropeptides and neuromodulators (Rinaman, 2010; Garfield et al., 2012). As we only
observed bioluminescence in a specific area of the NTS in Chapter 4, it would be of great
interest to identify which neuronal populations are oscillating and, of perhaps even greater
interest, to locate where in the brain these neurons project to. This would help elucidate
which pathways and processes the local NTS is clock is controlling, however implementing
these aims would be complex. Using cre/lox technology it would be possible to locally
remove the clock in (for example) NPY or GLP-1 expressing neurons. Following, a battery
of metabolic profiling and behavioural tests should be performed in order to observe any
effects of clock control, such as 24 h glucose sampling and behavioural response to fasting
e.g. meal size. These should be followed by ex vivo assessment of rhythms using MUA or
PER2::LUC bioluminescent recordings. If successful, the identified oscillatory population
(for example medial NTS NPY neurons) could be used as targets for efferent projection
tracing utilising synaptophysin viral tracing techniques, as successfully demonstrated by
Jarvie and Palmiter (2017) to identify the projections of NTS aldosterone neurons.
It was recently demonstrated using a combination of fluorescent reporters and single cell
transcriptome profiling that agouti-related peptide (AgRP) neurones in the Arc
(comprehensively studied for their role in energy balance) displayed morning/evening
differences in the transcription of pathways involved in neuropeptide signalling and
metabolism. These authors also demonstrated that leptin induced transcriptional
responses are mediated by clocks in these AgRP neurons (Cedernaes et al., 2019). A similar
approach could be used in the NTS to assess exactly which metabolic pathways are under
temporal control in previously identified oscillatory neuron populations.

REBECCA NORTHEAST 171
5.2.4 Temporal barrier control
The observation that there is a time of day permeability change to blood borne molecules
in the AP glial barrier necessitates further experiments in order to determine mechanism
and in vivo functionality. Firstly, more investigations into the extent of this permeability
must be carried out to gain a better understanding of which molecules are passing through.
In Chapter 4 I demonstrated changes in barrier permeability through perfusion of EB,
possessing a molecular weight of 961 Da. The next step would be to intravenously
administer a bolus of EB (binds albumin at 69,000 Da) and horseradish peroxidase (40,000
Da) (Kaya & Ahishali, 2011) before tissue collection at early day and early night timepoints
and observe the extent to which these are permeable at the AP/NTS border in comparison
to my previous results.
Determining the role of the astrocyte clock could be achieved through using the Aldh1L1-
Cre (an astrocyte specific marker) and locally injecting an AAV with short guide RNAs
against BMAL1, as successfully demonstrated in the SCN by (Tso et al., 2017). Time of day
barrier permeability tests should then be implemented to assess whether it is the local
astrocyte clock regulating the temporal changes in permeability. Further implications of
functional significance of the barrier clock could be achieved through time of day
intravenous administration of leptin or CCK with subsequent monitoring of food intake.
5.2.5 Limitations
As with all scientific research, there were some limitations in my methods and experimental
design which I shall now briefly discuss here.
In Chapter 2, one limitation of our study was that we did not weigh the daily amount of
food eaten; this was due to the nature of the cage set up and the desire to minimise
disturbance of the mice during the light period so that any observed changes in wake state
could be attributed to changes in food availability. As previously described, bouts of torpor
were observed sporadically, thus one representative day of RF in which no torpor bouts
were observed was chosen for subsequent analysis. Additionally, we only performed
recordings in male mice and as there are some sex differences in food anticipation (Li et
al., 2015), we cannot necessarily generalise these results to female mice.

RHYTHMS, SLEEP AND HOMEOSTASIS
172
In Chapter 3, only the SFO and not the OVLT was screened for in vivo circadian regulated
gene expression. This was due to difficulty in the precise dissection of the OVLT for which
the anatomical boundaries and landmarks are less clear than for the SFO. Further, since the
bioluminescence signal from the OVLT was limited to a specific area, we were uncertain as
to whether we could limit our laser-captured and dissected of OVLT to the area displaying
the more robust PER2::LUC signal. A further limitation of our studies in Chapters 3 and 4
was slightly coarse temporal (every 6h) sampling for the qPCR experiments. This makes it
difficult to precisely delineate the peak and trough of expression and increasing the
temporal resolution would have addressed this. As described above, we used males only
for these studies of novel extra-SCN oscillators and inclusion of a cohort of female mice
would have been an appropriate addition. However, due to the long-term nature of these
experiments and time constraints on equipment usage, it was not feasible to include
female mice in these studies. Along a similar line of reasoning and to maintain consistency,
the time of cull/culture procedure was kept constant throughout and as such, we are not
able to conclusively say that these extra-SCN oscillators were not reset by the culture
procedure as is the case with other extra-SCN oscillators (Guilding et al., 2009; Ono et al.,
2015).
In Chapter 4, the sampling of the acute MUA recordings were performed 12 h apart (at ZT3-
4 and ZT15-16) which is not quite in-line with the highest and lowest sMUA values displayed
during our 24 h recordings (~ZT9-10 peak activity). These recording windows were selected
in order to best mimic the times of day when some metabolic signals are predictably at
their lowest and highest in vivo across the circadian cycle, i.e. before and after the majority
of food consumption at the start of the active phase (Acosta-Rodriguez et al., 2017).
Moreover, our selected sampling times were designed to ensure that mice were not culled
during the dark phase, which can potentially reset the phasing of brain slice electrical
activity (unpublished data from Belle et al.). One further limitation in Chapter 4 was
performing EB permeability studies at only two opposing timepoints, and thus we might
have missed the peak time of increased permeability. However, as these times were chosen
in accordance with the nadir of tight junction protein expression it is unlikely that peak
permeability is far from what we have shown.
REBECCA NORTHEAST 173
References Abe, M., Herzog, E.D., Yamazaki, S., Straume, M., Tei, H., Sakaki, Y., Menaker, M., & Block,
G.D. (2002) Circadian rhythms in isolated brain regions. J. Neurosci., 22, 350–356. Abraham, U., Prior, J.L., Granados-Fuentes, D., Piwnica-Worms, D.R., & Herzog, E.D.
(2005) Independent Circadian Oscillations of Period1 in Specific Brain Areas In Vivo and In Vitro. J. Neurosci., 25, 8620–8626.
Abrahamson, E.E. & Moore, R.Y. (2001) Suprachiasmatic nucleus in the mouse: retinal innervation, intrinsic organization and efferent projections. Brain Res., 916, 172–191.
Acuña-Castroviejo, D., Escames, G., Venegas, C., Díaz-Casado, M.E., Lima-Cabello, E., López, L.C., Rosales-Corral, S., Tan, D.-X., & Reiter, R.J. (2014) Extrapineal melatonin: sources, regulation, and potential functions. Cell. Mol. Life Sci., 71, 2997–3025.
Aicher, S.A., Hermes, S.M., & Hegarty, D.M. (2013) Corneal afferents differentially target thalamic- and parabrachial-projecting neurons in spinal trigeminal nucleus caudalis. Neuroscience, 232, 182–193.
Allada, R. & Siegel, J.M. (2008) Unearthing the phylogenetic roots of sleep. Curr. Biol., 18, R670–R679.
Allen, W.E., DeNardo, L.A., Chen, M.Z., Liu, C.D., Loh, K.M., Fenno, L.E., Ramakrishnan, C., Deisseroth, K., & Luo, L. (2017) Thirst-associated preoptic neurons encode an aversive motivational drive. Science (80-. )., 357, 1149–1155.
Amin, M.S., Wang, H.-W., Reza, E., Whitman, S.C., Tuana, B.S., & Leenen, F.H.H. (2005) Distribution of epithelial sodium channels and mineralocorticoid receptors in cardiovascular regulatory centers in rat brain. Am. J. Physiol. Integr. Comp. Physiol., 289, R1787–R1797.
Anderson, J.W., Washburn, D.L., & Ferguson, A. V (2000) Intrinsic osmosensitivity of subfornical organ neurons. Neuroscience, 100, 539–547.
Andresen, M.C. & Kunze, D.L. (1994) Nucleus Tractus Solitarius—Gateway to Neural Circulatory Control. Annu. Rev. Physiol., 56, 93–116.
Appleyard, S.M., Bailey, T.W., Doyle, M.W., Jin, Y.-H., Smart, J.L., Low, M.J., & Andresen, M.C. (2005) Proopiomelanocortin neurons in nucleus tractus solitarius are activated by visceral afferents: regulation by cholecystokinin and opioids. J. Neurosci., 25, 3578–3585.
Arluison, M., Quignon, M., Nguyen, P., Thorens, B., Leloup, C., & Penicaud, L. (2004) Distribution and anatomical localization of the glucose transporter 2 (GLUT2) in the adult rat brain—an immunohistochemical study. J. Chem. Neuroanat., 28, 117–136.
Arrigoni, E., Chee, M.J.S., & Fuller, P.M. (2018) To eat or to sleep: That is a lateral hypothalamic question. Neuropharmacology, DOI 2018.11.07 [in press].
Asher, G. & Sassone-Corsi, P. (2015) Time for food: The intimate interplay between nutrition, metabolism, and the circadian clock. Cell, 161, 84–92.
Aston-Jones, G. & Bloom, F.E. (1981) Activity of norepinephrine-containing locus coeruleus neurons in behaving rats anticipates fluctuations in the sleep-waking cycle. J. Neurosci., 1, 876–886.
Badoer, E., McKinley, M.J., Oldfield, B.J., & McAllen, R.M. (1992) Distribution of hypothalamic, medullary and lamina terminalis neurons expressing Fos after hemorrhage in conscious rats. Brain Res., 582, 323–328.
Bae, K., Jin, X., Maywood, E.S., Hastings, M.H., Reppert, S.M., & Weaver, D.R. (2001) Differential functions of mPer1, mPer2, and mPer3 in the SCN circadian clock.
RHYTHMS, SLEEP AND HOMEOSTASIS
174
Neuron, 30, 525–536. Bains, J.S. & Ferguson, A. V. (1995) Paraventricular nucleus neurons projecting to the
spinal cord receive excitatory input from the subfornical organ. Am. J. Physiol. Integr. Comp. Physiol., 268, R625–R633.
Baker, C.L., Loros, J.J., & Dunlap, J.C. (2012) The circadian clock of Neurospora crassa. FEMS Microbiol. Rev., 36, 95–110.
Balcita-Pedicino, J.J. & Rinaman, L. (2007) Noradrenergic axon terminals contact gastric preautonomic neurons in the paraventricular nucleus of the hypothalamus in rats. J. Comp. Neurol., 501, 608–618.
Balfour, R.H., Hansen, A.M.K., & Trapp, S. (2006) Neuronal responses to transient hypoglycaemia in the dorsal vagal complex of the rat brainstem. J. Physiol., 570, 469–484.
Baño-Otálora, B. & Piggins, H.D. (2017) Contributions of the lateral habenula to circadian timekeeping. Pharmacol. Biochem. Behav., 162, 46–54.
Barca-Mayo, O., Pons-Espinal, M., Follert, P., Armirotti, A., Berdondini, L., & De Pietri Tonelli, D. (2017) Astrocyte deletion of Bmal1 alters daily locomotor activity and cognitive functions via GABA signalling. Nat. Commun., 8, 14336.
Barth, S.W., Riediger, T., Lutz, T.A., & Rechkemmer, G. (2004) Peripheral amylin activates circumventricular organs expressing calcitonin receptor a/b subtypes and receptor-activity modifying proteins in the rat. Brain Res., 997, 97–102.
Başar, E. (2012) A review of alpha activity in integrative brain function: Fundamental physiology, sensory coding, cognition and pathology. Int. J. Psychophysiol., 86, 1–24.
Baschieri, F. & Cortelli, P. (2019) Circadian rhythms of cardiovascular autonomic function: Physiology and clinical implications in neurodegenerative diseases. Auton. Neurosci. Basic Clin., 217, 91–101.
Bechtold, D.A., Brown, T.M., Luckman, S.M., & Piggins, H.D. (2008) Metabolic rhythm abnormalities in mice lacking VIP-VPAC2 signaling. Am. J. Physiol. Regul. Integr. Comp. Physiol., 294, R344-51.
Beckwith, E.J., Geissmann, Q., French, A.S., & Gilestro, G.F. (2017) Regulation of sleep homeostasis by sexual arousal. Elife, 6.
Begg, D.P. (2017) Disturbances of thirst and fluid balance associated with aging. Physiol. Behav., 178, 28–34.
Belle, M.D.C., Diekman, C.O., Forger, D.B., & Piggins, H.D. (2009) Daily electrical silencing in the mammalian circadian clock. Science, 326, 281–284.
Bellesi, M., Tononi, G., Cirelli, C., & Serra, P.A. (2016) Region-Specific Dissociation between Cortical Noradrenaline Levels and the Sleep/Wake Cycle. Sleep, 39, 143–154.
Bianco, I.H. & Wilson, S.W. (2009) The habenular nuclei: a conserved asymmetric relay station in the vertebrate brain. Philos. Trans. R. Soc. B Biol. Sci., 364, 1005–1020.
Blum, I.D., Patterson, Z., Khazall, R., Lamont, E.W., Sleeman, M.W., Horvath, T.L., & Abizaid, A. (2009) Reduced anticipatory locomotor responses to scheduled meals in ghrelin receptor deficient mice. Neuroscience, 164, 351–359.
Bonaconsa, M., Malpeli, G., Montaruli, A., Carandente, F., Grassi-Zucconi, G., & Bentivoglio, M. (2014) Differential modulation of clock gene expression in the suprachiasmatic nucleus, liver and heart of aged mice. Exp. Gerontol., 55, 70–79.
Borbély, A.A. (1982) A two process model of sleep regulation. Hum. Neurobiol., 1, 195–204.

REBECCA NORTHEAST 175
Borbély, A.A., Daan, S., Wirz-Justice, A., & Deboer, T. (2016) The two-process model of sleep regulation: a reappraisal. J. Sleep Res., 25, 131–143.
Boulos, Z., Rosenwasser, A.M., & Terman, M. (1980) Feeding schedules and the circadian organization of behavior in the rat. Behav. Brain Res., 1, 39–65.
Bradley, A.J., Webb-Mitchell, R., Hazu, A., Slater, N., Middleton, B., Gallagher, P., McAllister-Williams, H., & Anderson, K.N. (2017) Sleep and circadian rhythm disturbance in bipolar disorder. Psychol. Med., 47, 1678–1689.
Brancaccio, M., Edwards, M.D., Patton, A.P., Smyllie, N.J., Chesham, J.E., Maywood, E.S., & Hastings, M.H. (2019) Cell-autonomous clock of astrocytes drives circadian behavior in mammals. Science (80-. )., 363, 187–192.
Brancaccio, M., Maywood, E.S., Chesham, J.E., Loudon, A.S.I., & Hastings, M.H. (2013) A Gq-Ca2+ Axis Controls Circuit-Level Encoding of Circadian Time in the Suprachiasmatic Nucleus. Neuron, 78, 714–728.
Broadwell, R.D. & Sofroniew, M. V. (1993) Serum Proteins Bypass the Blood-Brain Fluid Barriers for Extracellular Entry to the Central Nervous System. Exp. Neurol., 120, 245–263.
Brinker, T., Stopa, E., Morrison, J., & Klinge, P. (2014) A new look at cerebrospinal fluid circulation. Fluids Barriers CNS, 11, 10.
Brown, R.E., Basheer, R., McKenna, J.T., Strecker, R.E., & McCarley, R.W. (2012) Control of sleep and wakefulness. Physiol. Rev., 92, 1087–1187.
Brown, T.M., Allen, A.E., al-Enezi, J., Wynne, J., Schlangen, L., Hommes, V., & Lucas, R.J. (2013) The melanopic sensitivity function accounts for melanopsin-driven responses in mice under diverse lighting conditions. PLoS One, 8, e53583.
Brown, T.M. & Piggins, H.D. (2007) Electrophysiology of the suprachiasmatic circadian clock. Prog. Neurobiol., 82, 229–255.
Browning, K.N. & Travagli, R.A. (2014) Central Nervous System Control of Gastrointestinal Motility and Secretion and Modulation of Gastrointestinal Functions. In Comprehensive Physiology. John Wiley & Sons, Inc., Hoboken, NJ, USA, pp. 1339–1368.
Buggy, J. & Jonhson, A.K. (1977) Preoptic-hypothalamic periventricular lesions: thirst deficits and hypernatremia. Am. J. Physiol. Integr. Comp. Physiol., 233, R44–R52.
Buijs, F.N., Cazarez, F., Basualdo, M.C., Scheer, F.A.J.L., Perusquía, M., Centurion, D., & Buijs, R.M. (2014) The suprachiasmatic nucleus is part of a neural feedback circuit adapting blood pressure response. Neuroscience, 266, 197–207.
Buijs, R.M. (1978) Intra- and extrahypothalamic vasopressin and oxytocin pathways in the rat. Pathways to the limbic system, medulla oblongata and spinal cord. Cell Tissue Res., 192, 423–435.
Bunger, M.K., Wilsbacher, L.D., Moran, S.M., Clendenin, C., Radcliffe, L.A., Hogenesch, J.B., Simon, M.C., Takahashi, J.S., & Bradfield, C.A. (2000) Mop3 is an essential component of the master circadian pacemaker in mammals. Cell, 103, 1009–1017.
Burek, M. & Förster, C.Y. (2009) Cloning and characterization of the murine claudin-5 promoter. Mol. Cell. Endocrinol., 298, 19–24.
Busino, L., Bassermann, F., Maiolica, A., Lee, C., Nolan, P.M., Godinho, S.I.H., Draetta, G.F., & Pagano, M. (2007) SCFFbxl3 controls the oscillation of the circadian clock by directing the degradation of cryptochrome proteins. Science, 316, 900–904.
Buzsáki, G. (2002) Theta Oscillations in the Hippocampus. Neuron, 33, 325–340. Buzsáki, G. & Wang, X.-J. (2012) Mechanisms of Gamma Oscillations. Annu. Rev.
RHYTHMS, SLEEP AND HOMEOSTASIS
176
Neurosci., 35, 203–225. Cabral, A., Cornejo, M.P., Fernandez, G., De Francesco, P.N., Garcia-Romero, G., Uriarte,
M., Zigman, J.M., Portiansky, E., Reynaldo, M., & Perello, M. (2017) Circulating ghrelin acts on GABA neurons of the area postrema and mediates gastric emptying in male mice. Endocrinology, 158, 1436–1449.
Cao, W.-H., Fan, W., & Morrison, S.. (2004) Medullary pathways mediating specific sympathetic responses to activation of dorsomedial hypothalamus. Neuroscience, 126, 229–240.
Card, J.P. & Moore, R.Y. (1984) The suprachiasmatic nucleus of the golden hamster: immunohistochemical analysis of cell and fiber distribution. Neuroscience, 13, 415–431.
Castillo, M.R., Hochstetler, K.J., Tavernier, R.J., Greene, D.M., & Bult-Ito, A. (2004) Entrainment of the master circadian clock by scheduled feeding. Am. J. Physiol. Regul. Integr. Comp. Physiol., 287, R551-5.
Castro-Faúndez, J., Díaz, J., & Ocampo-Garcés, A. (2016) Temporal Organization of the Sleep-Wake Cycle under Food Entrainment in the Rat. Sleep, 39, 1451–1465.
Cedernaes, J., Huang, W., Ramsey, K.M., Waldeck, N., Cheng, L., Marcheva, B., Omura, C., Kobayashi, Y., Peek, C.B., Levine, D.C., Dhir, R., Awatramani, R., Bradfield, C.A., Wang, X.A., Takahashi, J.S., Mokadem, M., Ahima, R.S., & Bass, J. (2019) Transcriptional Basis for Rhythmic Control of Hunger and Metabolism within the AgRP Neuron. Cell Metab.,.
Ch’ng, S.S. & Lawrence, A.J. (2018) The subfornical organ in sodium appetite: Recent insights. Neuropharmacology,.
Chaudhri, O., Small, C., & Bloom, S. (2006) Gastrointestinal hormones regulating appetite. Philos. Trans. R. Soc. B Biol. Sci., 361, 1187–1209.
Chavan, R., Feillet, C., Costa, S.S.F., Delorme, J.E., Okabe, T., Ripperger, J.A., & Albrecht, U. (2016) Liver-derived ketone bodies are necessary for food anticipation. Nat. Commun., 7, 10580.
Chen, C.-Y., Logan, R.W., Ma, T., Lewis, D.A., Tseng, G.C., Sibille, E., & McClung, C.A. (2016) Effects of aging on circadian patterns of gene expression in the human prefrontal cortex. Proc. Natl. Acad. Sci., 113, 206–211.
Cheng, M.Y., Bullock, C.M., Li, C., Lee, A.G., Bermak, J.C., Belluzzi, J., Weaver, D.R., Leslie, F.M., & Zhou, Q.-Y. (2002) Prokineticin 2 transmits the behavioural circadian rhythm of the suprachiasmatic nucleus. Nature, 417, 405–410.
Cheng, M.Y., Leslie, F.M., & Zhou, Q.-Y. (2006) Expression of prokineticins and their receptors in the adult mouse brain. J. Comp. Neurol., 498, 796–809.
Chikahisa, S., Shimizu, N., Shiuchi, T., & Séi, H. (2014) Ketone body metabolism and sleep homeostasis in mice. Neuropharmacology, 79, 399–404.
Chikahisa, S., Tominaga, K., Kawai, T., Kitaoka, K., Oishi, K., Ishida, N., Rokutan, K., & Séi, H. (2008) Bezafibrate, a Peroxisome Proliferator-Activated Receptors Agonist, Decreases Body Temperature and Enhances Electroencephalogram Delta-Oscillation during Sleep in Mice. Endocrinology, 149, 5262–5271.
Constantinople, C.M. & Bruno, R.M. (2011) Effects and mechanisms of wakefulness on local cortical networks. Neuron, 69, 1061–1068.
Cho, H., Zhao, X., Hatori, M., Yu, R.T., Barish, G.D., Lam, M.T., Chong, L.-W., DiTacchio, L., Atkins, A.R., Glass, C.K., Liddle, C., Auwerx, J., Downes, M., Panda, S., & Evans, R.M. (2012) Regulation of circadian behaviour and metabolism by REV-ERB-α and REV-

REBECCA NORTHEAST 177
ERB-β. Nature, 485, 123–127. Chun, L.E., Woodruff, E.R., Morton, S., Hinds, L.R., & Spencer, R.L. (2015) Variations in
Phase and Amplitude of Rhythmic Clock Gene Expression across Prefrontal Cortex, Hippocampus, Amygdala, and Hypothalamic Paraventricular and Suprachiasmatic Nuclei of Male and Female Rats. J. Biol. Rhythms, 30, 417–436.
Ciriello, J., McMurray, J.C., Babic, T., & de Oliveira, C.V.R. (2003) Collateral axonal projections from hypothalamic hypocretin neurons to cardiovascular sites in nucleus ambiguus and nucleus tractus solitarius. Brain Res., 991, 133–141.
Coble, J.P., Grobe, J.L., Johnson, A.K., & Sigmund, C.D. (2015) Mechanisms of brain renin angiotensin system-induced drinking and blood pressure: importance of the subfornical organ. Am. J. Physiol. Regul. Integr. Comp. Physiol., 308, R238-49.
Colwell, C.S. (2011) Linking neural activity and molecular oscillations in the SCN. Nat. Rev. Neurosci., 12, 553–569.
Colwell, C.S., Michel, S., Itri, J., Rodriguez, W., Tam, J., Lelievre, V., Hu, Z., Liu, X., & Waschek, J.A. (2003) Disrupted circadian rhythms in VIP- and PHI-deficient mice. Am. J. Physiol. Regul. Integr. Comp. Physiol., 285, R939-49.
Cornejo, M.P., De Francesco, P.N., García Romero, G., Portiansky, E.L., Zigman, J.M., Reynaldo, M., & Perello, M. (2018) Ghrelin receptor signaling targets segregated clusters of neurons within the nucleus of the solitary tract. Brain Struct. Funct., 223, 3133–3147.
Cottrell, G.T., Zhou, Q.-Y., & Ferguson, A. V. (2004) Prokineticin 2 Modulates the Excitability of Subfornical Organ Neurons. J. Neurosci., 24.
Cox, B.F., Hay, M., & Bishop, V.S. (1990) Neurons in area postrema mediate vasopressin-induced enhancement of the baroreflex. Am. J. Physiol. Circ. Physiol., 258, H1943–H1946.
Cui, R.J., Li, X., & Appleyard, S.M. (2011) Ghrelin inhibits visceral afferent activation of catecholamine neurons in the solitary tract nucleus. J. Neurosci., 31, 3484–3492.
Cunningham, E.T., Miselis, R.R., & Sawchenko, P.E. (1994) The relationship of efferent projections from the area postrema to vagal motor and brain stem catecholamine-containing cell groups: an axonal transport and immunohistochemical study in the rat. Neuroscience, 58, 635–648.
Cunningham, E.T., Wada, E., Carter, D.B., Tracey, D.E., Battey, J.F., & De Souza, E.B. (1992) In situ histochemical localization of type I interleukin-1 receptor messenger RNA in the central nervous system, pituitary, and adrenal gland of the mouse. J. Neurosci., 12, 1101–1114.
Curie, T., Maret, S., Emmenegger, Y., & Franken, P. (2015) In Vivo Imaging of the Central and Peripheral Effects of Sleep Deprivation and Suprachiasmatic Nuclei Lesion on PERIOD-2 Protein in Mice. Sleep, 38, 1381–1394.
Curie, T., Mongrain, V., Dorsaz, S., Mang, G.M., Emmenegger, Y., & Franken, P. (2013) Homeostatic and Circadian Contribution to EEG and Molecular State Variables of Sleep Regulation. Sleep, 36, 311–323.
Curtis, A.M., Cheng, Y., Kapoor, S., Reilly, D., Price, T.S., & Fitzgerald, G.A. (2007) Circadian variation of blood pressure and the vascular response to asynchronous stress. Proc. Natl. Acad. Sci. U. S. A., 104, 3450–3455.
Curtis, A.M., Cheng, Y., Kapoor, S., Reilly, D., Price, T.S., & FitzGerald, G.A. (2007) Circadian variation of blood pressure and the vascular response to asynchronous stress. Proc. Natl. Acad. Sci., 104, 3450–3455.

RHYTHMS, SLEEP AND HOMEOSTASIS
178
Cutler, D.J., Haraura, M., Reed, H.E., Shen, S., Sheward, W.J., Morrison, C.F., Marston, H.M., Harmar, A.J., & Piggins, H.D. (2003) The mouse VPAC2 receptor confers suprachiasmatic nuclei cellular rhythmicity and responsiveness to vasoactive intestinal polypeptide in vitro. Eur. J. Neurosci., 17, 197–204.
Czeisler, C.A., Duffy, J.F., Shanahan, T.L., Brown, E.N., Mitchell, J.F., Rimmer, D.W., Ronda, J.M., Silva, E.J., Allan, J.S., Emens, J.S., Dijk, D.J., & Kronauer, R.E. (1999) Stability, precision, and near-24-hour period of the human circadian pacemaker. Science, 284, 2177–2181.
D’Agostino, G., Lyons, D.J., Cristiano, C., Burke, L.K., Madara, J.C., Campbell, J.N., Garcia, A.P., Land, B.B., Lowell, B.B., Dileone, R.J., & Heisler, L.K. (2016) Appetite controlled by a cholecystokinin nucleus of the solitary tract to hypothalamus neurocircuit. Elife, 5.
Daan, S. & Pittendrigh, C.S. (1976) A Functional analysis of circadian pacemakers in nocturnal rodents. J. Comp. Physiol. ? A, 106, 253–266.
Damiola, F., Le Minh, N., Preitner, N., Kornmann, B., Fleury-Olela, F., & Schibler, U. (2000) Restricted feeding uncouples circadian oscillators in peripheral tissues from the central pacemaker in the suprachiasmatic nucleus. Genes Dev., 14, 2950–2961.
Dampney, R.A.L., Polson, J.W., Potts, P.D., Hirooka, Y., & Horiuchi, J. (2003) Functional organization of brain pathways subserving the baroreceptor reflex: studies in conscious animals using immediate early gene expression. Cell. Mol. Neurobiol., 23, 597–616.
Dattolo, T., Coomans, C.P., van Diepen, H.C., Patton, D.F., Power, S., Antle, M.C., Meijer, J.H., & Mistlberger, R.E. (2016) Neural activity in the suprachiasmatic circadian clock of nocturnal mice anticipating a daytime meal. Neuroscience, 315, 91–103.
Davidson, A.J., Aragona, B.J., Houpt, T.A., & Stephan, F.K. (2001) Persistence of meal-entrained circadian rhythms following area postrema lesions in the rat. Physiol. Behav., 74, 349–354.
Davidson, A.J., Poole, A.S., Yamazaki, S., & Menaker, M. (2003) Is the food-entrainable circadian oscillator in the digestive system? Genes. Brain. Behav., 2, 32–39.
Davidson, A.J. & Stephan, F.K. (1998) Circadian food anticipation persists in capsaicin deafferented rats. J. Biol. Rhythms, 13, 422–429.
Deboer, T. (2002) Electroencephalogram theta frequency changes in parallel with euthermic brain temperature. Brain Res., 930, 212–215.
Deboer, T. (2018) Sleep homeostasis and the circadian clock: Do the circadian pacemaker and the sleep homeostat influence each other’s functioning? Neurobiol. Sleep Circadian Rhythm., 5, 68–77.
DeBruyne, J.P., Noton, E., Lambert, C.M., Maywood, E.S., Weaver, D.R., & Reppert, S.M. (2006) A Clock Shock: Mouse CLOCK Is Not Required for Circadian Oscillator Function. Neuron, 50, 465–477.
Delezie, J., Dumont, S., Sandu, C., Reibel, S., Pevet, P., & Challet, E. (2016) Rev-erbα in the brain is essential for circadian food entrainment. Sci. Rep., 6, 29386.
Deurveilher, S., Burns, J., & Semba, K. (2002) Indirect projections from the suprachiasmatic nucleus to the ventrolateral preoptic nucleus: a dual tract-tracing study in rat. Eur. J. Neurosci., 16, 1195–1213.
Dijk, D.J. & Czeisler, C.A. (1994) Paradoxical timing of the circadian rhythm of sleep propensity serves to consolidate sleep and wakefulness in humans. Neurosci. Lett., 166, 63–68.

REBECCA NORTHEAST 179
Dijk, D.J. & Czeisler, C.A. (1995) Contribution of the circadian pacemaker and the sleep homeostat to sleep propensity, sleep structure, electroencephalographic slow waves, and sleep spindle activity in humans. J. Neurosci., 15, 3526–3538.
Dijk, D.J., Hayes, B., & Czeisler, C.A. (1993) Dynamics of electroencephalographic sleep spindles and slow wave activity in men: effect of sleep deprivation. Brain Res., 626, 190–199.
Dkhissi-Benyahya, O., Coutanson, C., Knoblauch, K., Lahouaoui, H., Leviel, V., Rey, C., Bennis, M., & Cooper, H.M. (2013) The absence of melanopsin alters retinal clock function and dopamine regulation by light. Cell. Mol. Life Sci., 70, 3435–3447.
Doi, M., Ishida, A., Miyake, A., Sato, M., Komatsu, R., Yamazaki, F., Kimura, I., Tsuchiya, S., Kori, H., Seo, K., Yamaguchi, Y., Matsuo, M., Fustin, J.-M., Tanaka, R., Santo, Y., Yamada, H., Takahashi, Y., Araki, M., Nakao, K., Aizawa, S., Kobayashi, M., Obrietan, K., Tsujimoto, G., & Okamura, H. (2011) Circadian regulation of intracellular G-protein signalling mediates intercellular synchrony and rhythmicity in the suprachiasmatic nucleus. Nat. Commun., 2, 327.
Dudley, C.A., Erbel-Sieler, C., Estill, S.J., Reick, M., Franken, P., Pitts, S., & McKnight, S.L. (2003) Altered patterns of sleep and behavioral adaptability in NPAS2-deficient mice. Science, 301, 379–383.
During, E.H. & Kawai, M. (2017) Chapter 3 - The Functions of Sleep and the Effects of Sleep Deprivation. Sleep Neurol. Dis., 55–72.
Duncan, M.J., Prochot, J.R., Cook, D.H., Tyler Smith, J., & Franklin, K.M. (2013) Influence of aging on Bmal1 and Per2 expression in extra-SCN oscillators in hamster brain. Brain Res., 1491, 44–53.
Duvernoy, H.M. & Risold, P.-Y. (2007) The circumventricular organs: An atlas of comparative anatomy and vascularization. Brain Res. Rev., 56, 119–147.
Earnest, D.J. & Sladek, C.D. (1986) Circadian rhythms of vasopressin release from individual rat suprachiasmatic explants in vitro. Brain Res., 382, 129–133.
Eastman, C.I., Mistlberger, R.E., & Rechtschaffen, A. (1984) Suprachiasmatic nuclei lesions eliminate circadian temperature and sleep rhythms in the rat. Physiol. Behav., 32, 357–368.
Easton, A., Meerlo, P., Bergmann, B., & Turek, F.W. (2004) The suprachiasmatic nucleus regulates sleep timing and amount in mice. Sleep, 27, 1307–1318.
Eban-Rothschild, A., Appelbaum, L., & de Lecea, L. (2018) Neuronal Mechanisms for Sleep/Wake Regulation and Modulatory Drive. Neuropsychopharmacology, 43, 937–952.
Ebling, F.J. (1996) The role of glutamate in the photic regulation of the suprachiasmatic nucleus. Prog. Neurobiol., 50, 109–132.
Edelstein, K. & Amir, S. (1999) The role of the intergeniculate leaflet in entrainment of circadian rhythms to a skeleton photoperiod. J. Neurosci., 19, 372–380.
Edgar, D.M. & Dement, W.C. (1991) Regularly scheduled voluntary exercise synchronizes the mouse circadian clock. Am. J. Physiol., 261, R928-33.
Edgar, D.M., Dement, W.C., & Fuller, C.A. (1993) Effect of SCN lesions on sleep in squirrel monkeys: evidence for opponent processes in sleep-wake regulation. J. Neurosci., 13, 1065–1079.
Einstein, M.C., Polack, P.-O., Tran, D.T., & Golshani, P. (2017) Visually Evoked 3–5 Hz Membrane Potential Oscillations Reduce the Responsiveness of Visual Cortex Neurons in Awake Behaving Mice. J. Neurosci., 37, 5084–5098.
RHYTHMS, SLEEP AND HOMEOSTASIS
180
Elipot, Y., Hinaux, H., Callebert, J., & Rétaux, S. (2013) Evolutionary Shift from Fighting to Foraging in Blind Cavefish through Changes in the Serotonin Network. Curr. Biol., 23, 1–10.
Elmquist, J.K., Scammell, T.E., Jacobson, C.D., & Saper, C.B. (1996) Distribution of fos-like immunoreactivity in the rat brain following intravenous lipopolysaccharide administration. J. Comp. Neurol., 371, 85–103.
Engel, A.K. & Fries, P. (2010) Beta-band oscillations—signalling the status quo? Curr. Opin. Neurobiol., 20, 156–165.
Enoki, R., Oda, Y., Mieda, M., Ono, D., Honma, S., & Honma, K.-I. (2017) Synchronous circadian voltage rhythms with asynchronous calcium rhythms in the suprachiasmatic nucleus. Proc. Natl. Acad. Sci. U. S. A., 201616815.
Evans, J.A., Leise, T.L., Castanon-Cervantes, O., & Davidson, A.J. (2013) Dynamic Interactions Mediated by Nonredundant Signaling Mechanisms Couple Circadian Clock Neurons. Neuron, 80, 973–983.
Fagard, R.H., Thijs, L., Staessen, J.A., Clement, D.L., De Buyzere, M.L., & De Bacquer, D.A. (2009) Night–day blood pressure ratio and dipping pattern as predictors of death and cardiovascular events in hypertension. J. Hum. Hypertens., 23, 645–653.
Farrell, M.J., Bowala, T.K., Gavrilescu, M., Phillips, P.A., McKinley, M.J., McAllen, R.M., Denton, D.A., & Egan, G.F. (2011) Cortical activation and lamina terminalis functional connectivity during thirst and drinking in humans. Am. J. Physiol. Integr. Comp. Physiol., 301, R623–R631.
Fan, W., Ellacott, K.L.J., Halatchev, I.G., Takahashi, K., Yu, P., & Cone, R.D. (2004) Cholecystokinin-mediated suppression of feeding involves the brainstem melanocortin system. Nat. Neurosci., 7, 335–336.
Faulconbridge, L.F., Cummings, D.E., Kaplan, J.M., & Grill, H.J. (2003) Hyperphagic effects of brainstem ghrelin administration. Diabetes, 52, 2260–2265.
Feillet, C.A., Ripperger, J.A., Magnone, M.C., Dulloo, A., Albrecht, U., & Challet, E. (2006) Lack of food anticipation in Per2 mutant mice. Curr. Biol., 16, 2016–2022.
Ferguson, A. V (2014) Circumventricular Organs: Integrators of Circulating Signals Controlling Hydration, Energy Balance, and Immune Function, Neurobiology of Body Fluid Homeostasis: Transduction and Integration. CRC Press/Taylor & Francis.
Fernandez, D.C., Chang, Y.-T., Hattar, S., & Chen, S.-K. (2016) Architecture of retinal projections to the central circadian pacemaker. Proc. Natl. Acad. Sci. U. S. A., 113, 6047–6052.
Ferrarelli, F., Huber, R., Peterson, M.J., Massimini, M., Murphy, M., Riedner, B.A., Watson, A., Bria, P., & Tononi, G. (2007) Reduced sleep spindle activity in schizophrenia patients. Am. J. Psychiatry, 164, 483–492.
Finelli, L.A., Baumann, H., Borbély, A.A., & Achermann, P. (2000) Dual electroencephalogram markers of human sleep homeostasis: correlation between theta activity in waking and slow-wave activity in sleep. Neuroscience, 101, 523–529.
Firsov, D., Tokonami, N., & Bonny, O. (2012) Role of the renal circadian timing system in maintaining water and electrolytes homeostasis. Mol. Cell. Endocrinol., 349, 51–55.
Fisher, S.P., Cui, N., McKillop, L.E., Gemignani, J., Bannerman, D.M., Oliver, P.L., Peirson, S.N., & Vyazovskiy, V. V. (2016) Stereotypic wheel running decreases cortical activity in mice. Nat. Commun., 7, 13138.
Fitzsimons, T.J. & Le Magnen, J. (1969) Eating as a regulatory control of drinking in the rat. J. Comp. Physiol. Psychol., 67, 273–283.

REBECCA NORTHEAST 181
Flôres, D.E.F.L., Bettilyon, C.N., Jia, L., & Yamazaki, S. (2016) The Running Wheel Enhances Food Anticipatory Activity: An Exploratory Study. Front. Behav. Neurosci., 10, 143.
Franken, P. (2013) A role for clock genes in sleep homeostasis. Curr. Opin. Neurobiol., 23, 864–872.
Franken, P., Chollet, D., & Tafti, M. (2001) The homeostatic regulation of sleep need is under genetic control. J. Neurosci., 21, 2610–2621.
Franken, P., Dijk, D.J., Tobler, I., & Borbely, A.A. (1991) Sleep deprivation in rats: effects on EEG power spectra, vigilance states, and cortical temperature. Am. J. Physiol. Integr. Comp. Physiol., 261, R198–R208.
Franken, P., Dudley, C.A., Estill, S.J., Barakat, M., Thomason, R., O’Hara, B.F., & McKnight, S.L. (2006) NPAS2 as a transcriptional regulator of non-rapid eye movement sleep: Genotype and sex interactions. Proc. Natl. Acad. Sci., 103, 7118–7123.
Franken, P., Thomason, R., Heller, H.C., & O’Hara, B.F. (2007) A non-circadian role for clock-genes in sleep homeostasis:a strain comparison. BMC Neurosci., 8, 87.
Frederich, R.C., Hamann, A., Anderson, S., Löllmann, B., Lowell, B.B., & Flier, J.S. (1995) Leptin levels reflect body lipid content in mice: evidence for diet-induced resistance to leptin action. Nat. Med., 1, 1311–1314.
Fuller, P.M., Gooley, J.J., & Saper, C.B. (2006) Neurobiology of the Sleep-Wake Cycle: Sleep Architecture, Circadian Regulation, and Regulatory Feedback. J. Biol. Rhythms, 21, 482–493.
Fuller, P.M., Lu, J., & Saper, C.B. (2008) Differential Rescue of Light- and Food-Entrainable Circadian Rhythms. Science (80-. )., 320, 1074–1077.
Gachon, F., Fonjallaz, P., Damiola, F., Gos, P., Kodama, T., Zakany, J., Duboule, D., Petit, B., Tafti, M., & Schibler, U. (2004) The loss of circadian PAR bZip transcription factors results in epilepsy. Genes Dev., 18, 1397–1412.
Gallardo, C.M., Hsu, C.T., Gunapala, K.M., Parfyonov, M., Chang, C.H., Mistlberger, R.E., & Steele, A.D. (2014) Behavioral and Neural Correlates of Acute and Scheduled Hunger in C57BL/6 Mice. PLoS One, 9, e95990.
Gao, H., Glatzer, N.R., Williams, K.W., Derbenev, A. V., Liu, D., & Smith, B.N. (2009) Morphological and electrophysiological features of motor neurons and putative interneurons in the dorsal vagal complex of rats and mice. Brain Res., 1291, 40–52.
Garfield, A.S., Patterson, C., Skora, S., Gribble, F.M., Reimann, F., Evans, M.L., Myers, M.G., & Heisler, L.K. (2012) Neurochemical Characterization of Body Weight-Regulating Leptin Receptor Neurons in the Nucleus of the Solitary Tract. Endocrinology, 153, 4600–4607.
Gasparini, S., Resch, J.M., Narayan, S. V., Peltekian, L., Iverson, G.N., Karthik, S., & Geerling, J.C. (2019) Aldosterone-sensitive HSD2 neurons in mice. Brain Struct. Funct., 224, 387–417.
Gekakis, N., Staknis, D., Nguyen, H.B., Davis, F.C., Wilsbacher, L.D., King, D.P., Takahashi, J.S., & Weitz, C.J. (1998) Role of the CLOCK protein in the mammalian circadian mechanism. Science, 280, 1564–1569.
Girotti, M., Weinberg, M.S., & Spencer, R.L. (2009) Diurnal expression of functional and clock-related genes throughout the rat HPA axis: system-wide shifts in response to a restricted feeding schedule. Am. J. Physiol. Metab., 296, E888–E897.
Gizowski, C. & Bourque, C.W. (2017) The neural basis of homeostatic and anticipatory thirst. Nat. Rev. Nephrol., 14, 11–25.
Gizowski, C., Zaelzer, C., & Bourque, C.W. (2016) Clock-driven vasopressin
RHYTHMS, SLEEP AND HOMEOSTASIS
182
neurotransmission mediates anticipatory thirst prior to sleep. Nature, 537, 685–688. Gooley, J.J., Schomer, A., & Saper, C.B. (2006) The dorsomedial hypothalamic nucleus is
critical for the expression of food-entrainable circadian rhythms. Nat. Neurosci., 9, 398–407.
Granados-Fuentes, D., Saxena, M.T., Prolo, L.M., Aton, S.J., & Herzog, E.D. (2004) Olfactory bulb neurons express functional, entrainable circadian rhythms. Eur. J. Neurosci., 19, 898–906.
Granados-Fuentes, D., Tseng, A., & Herzog, E.D. (2006) A Circadian Clock in the Olfactory Bulb Controls Olfactory Responsivity. J. Neurosci., 26, 12219–12225.
Griffin, E.A., Staknis, D., & Weitz, C.J. (1999) Light-independent role of CRY1 and CRY2 in the mammalian circadian clock. Science, 286, 768–771.
Grill, H.J. & Hayes, M.R. (2009) The nucleus tractus solitarius: a portal for visceral afferent signal processing, energy status assessment and integration of their combined effects on food intake. Int. J. Obes., 33, S11–S15.
Grill, H.J. & Hayes, M.R. (2012) Hindbrain neurons as an essential hub in the neuroanatomically distributed control of energy balance. Cell Metab., 16, 296–309.
Grill, H.J., Schwartz, M.W., Kaplan, J.M., Foxhall, J.S., Breininger, J., & Baskin, D.G. (2002) Evidence That the Caudal Brainstem Is a Target for the Inhibitory Effect of Leptin on Food Intake. Endocrinology, 143, 239–246.
Gross, P.M., Wall, K.M., Pang, J.J., Shaver, S.W., & Wainman, D.S. (1990) Microvascular specializations promoting rapid interstitial solute dispersion in nucleus tractus solitarius. Am. J. Physiol., 259, R1131-8.
Gross, P.M., Weindl, A., & Knigge, K.M. (1987) Peering through the Windows of the Brain. J. Cereb. Blood Flow Metab., 7, 663–672.
Gruzdeva, O., Borodkina, D., Uchasova, E., Dyleva, Y., & Barbarash, O. (2019) Leptin resistance: underlying mechanisms and diagnosis. Diabetes. Metab. Syndr. Obes., 12, 191–198.
Gu, G.B. & Simerly, R.B. (1997) Projections of the sexually dimorphic anteroventral periventricular nucleus in the female rat. J. Comp. Neurol., 384, 142–164.
Guido, M.E., de Guido, L.B., Goguen, D., Robertson, H.A., & Rusak, B. (1999) Daily Rhythm of Spontaneous Immediate-Early Gene Expression in the Rat Suprachiasmatic Nucleus. J. Biol. Rhythms, 14, 275–280.
Guilding, C., Hughes, A.T.L., Brown, T.M., Namvar, S., & Piggins, H.D. (2009) A riot of rhythms: neuronal and glial circadian oscillators in the mediobasal hypothalamus. Mol. Brain, 2, 28.
Guilding, C., Hughes, A.T.L., & Piggins, H.D. (2010) Circadian oscillators in the epithalamus. Neuroscience, 169, 1630–1639.
Guilding, C. & Piggins, H.D. (2007) Challenging the omnipotence of the suprachiasmatic timekeeper: are circadian oscillators present throughout the mammalian brain? Eur. J. Neurosci., 25, 3195–3216.
Guillaumin, M.C.C., McKillop, L.E., Cui, N., Fisher, S.P., Foster, R.G., de Vos, M., Peirson, S.N., Achermann, P., & Vyazovskiy, V. V (2018) Cortical region-specific sleep homeostasis in mice: effects of time of day and waking experience. Sleep, 41.
Gunapala, K.M., Gallardo, C.M., Hsu, C.T., & Steele, A.D. (2011) Single Gene Deletions of Orexin, Leptin, Neuropeptide Y, and Ghrelin Do Not Appreciably Alter Food Anticipatory Activity in Mice. PLoS One, 6, e18377.
Gunzel, D. & Yu, A.S.L. (2013) Claudins and the Modulation of Tight Junction Permeability.
REBECCA NORTHEAST 183
Physiol. Rev., 93, 525–569. Hallanger, A.E., Levey, A.I., Lee, H.J., Rye, D.B., & Wainer, B.H. (1987) The origins of
cholinergic and other subcortical afferents to the thalamus in the rat. J. Comp. Neurol., 262, 105–124.
Hare, A.S., Clarke, G., & Tolchard, S. (1995) Bacterial Lipopolysaccharide-Induced Changes in FOS Protein Expression in the Rat Brain: Correlation with Thermoregulatory Changes and Plasma Corticosterone. J. Neuroendocrinol., 7, 791–799.
Haseloff, R.F., Dithmer, S., Winkler, L., Wolburg, H., & Blasig, I.E. (2015) Transmembrane proteins of the tight junctions at the blood-brain barrier: Structural and functional aspects. Semin. Cell Dev. Biol., 38, 16–25.
Hastings, M.H., Maywood, E.S., & Brancaccio, M. (2018) Generation of circadian rhythms in the suprachiasmatic nucleus. Nat. Rev. Neurosci., 19, 453–469.
Hatori, M., Vollmers, C., Zarrinpar, A., DiTacchio, L., Bushong, E.A., Gill, S., Leblanc, M., Chaix, A., Joens, M., Fitzpatrick, J.A.J., Ellisman, M.H., & Panda, S. (2012) Time-restricted feeding without reducing caloric intake prevents metabolic diseases in mice fed a high-fat diet. Cell Metab., 15, 848–860.
Hayes, M.R., De Jonghe, B.C., & Kanoski, S.E. (2010) Role of the glucagon-like-peptide-1 receptor in the control of energy balance. Physiol. Behav., 100, 503–510.
Hayes, M.R., Moore, R.L., Shah, S.M., & Covasa, M. (2004) 5-HT 3 receptors participate in CCK-induced suppression of food intake by delaying gastric emptying. Am. J. Physiol. Integr. Comp. Physiol., 287, R817–R823.
Herbert, H., Moga, M.M., & Saper, C.B. (1990) Connections of the parabrachial nucleus with the nucleus of the solitary tract and the medullary reticular formation in the rat. J. Comp. Neurol., 293, 540–580.
Herbert, H. & Saper, C.B. (1990) Cholecystokinin-, galanin-, and corticotropin-releasing factor-like immunoreactive projections from the nucleus of the solitary tract to the parabrachial nucleus in the rat. J. Comp. Neurol., 293, 581–598.
Herichová, I., Mravec, B., Stebelová, K., Križanová, O., Jurkovičová, D., Kvetňanský, R., & Zeman, M. (2007) Rhythmic clock gene expression in heart, kidney and some brain nuclei involved in blood pressure control in hypertensive TGR(mREN-2)27 rats. Mol. Cell. Biochem., 296, 25–34.
Hermida, R.C., Ayala, D.E., Mojón, A., & Fernández, J.R. (2010) INFLUENCE OF CIRCADIAN TIME OF HYPERTENSION TREATMENT ON CARDIOVASCULAR RISK: RESULTS OF THE MAPEC STUDY. Chronobiol. Int., 27, 1629–1651.
Hisadome, K., Reimann, F., Gribble, F.M., & Trapp, S. (2014) Leptin Directly Depolarizes Preproglucagon Neurons in the Nucleus Tractus Solitarius Electrical Properties of Glucagon-Like Peptide 1 Neurons. Diabetes, 59, 1890–1898.
Hiyama, T.Y., Watanabe, E., Okado, H., & Noda, M. (2004) The subfornical organ is the primary locus of sodium-level sensing by Na(x) sodium channels for the control of salt-intake behavior. J. Neurosci., 24, 9276–9281.
Hofman, M.A., Zhou, J.-N., & Swaab, D.F. (1996) Suprachiasmatic nucleus of the human brain: An immunocytochemical and morphometric analysis. Anat. Rec., 244, 552–562.
Hollis, J.H., McKinley, M.J., D’Souza, M., Kampe, J., & Oldfield, B.J. (2008) The trajectory of sensory pathways from the lamina terminalis to the insular and cingulate cortex: a neuroanatomical framework for the generation of thirst. Am. J. Physiol. Integr. Comp. Physiol., 294, R1390–R1401.
RHYTHMS, SLEEP AND HOMEOSTASIS
184
Honma, K.I., Honma, S., & Hiroshige, T. (1984) Feeding-associated corticosterone peak in rats under various feeding cycles. Am. J. Physiol. Integr. Comp. Physiol., 246, R721–R726.
Houben, T., Coomans, C.P., & Meijer, J.H. (2014) Regulation of Circadian and Acute Activity Levels by the Murine Suprachiasmatic Nuclei. PLoS One, 9, e110172.
Houben, T., Deboer, T., van Oosterhout, F., & Meijer, J.H. (2009) Correlation with Behavioral Activity and Rest Implies Circadian Regulation by SCN Neuronal Activity Levels. J. Biol. Rhythms, 24, 477–487.
Huang, X.-F., Törk, I., & Paxinos, G. (1993) Dorsal motor nucleus of the vagus nerve: A cyto- and chemoarchitectonic study in the human. J. Comp. Neurol., 330, 158–182.
Huang, Z.-L., Qu, W.-M., Eguchi, N., Chen, J.-F., Schwarzschild, M.A., Fredholm, B.B., Urade, Y., & Hayaishi, O. (2005) Adenosine A2A, but not A1, receptors mediate the arousal effect of caffeine. Nat. Neurosci., 8, 858–859.
Huber, R., Tononi, G., & Cirelli, C. (2007) Exploratory behavior, cortical BDNF expression, and sleep homeostasis. Sleep, 30, 129–139.
Hughes, A.T.L. & Piggins, H.D. (2008) Behavioral responses of Vipr2-/- mice to light. J. Biol. Rhythms, 23, 211–219.
Huo, L., Maeng, L., Bjørbæk, C., & Grill, H.J. (2007) Leptin and the Control of Food Intake: Neurons in the Nucleus of the Solitary Tract Are Activated by Both Gastric Distension and Leptin. Endocrinology, 148, 2189–2197.
Iijima, M., Yamaguchi, S., van der Horst, G.T.J., Bonnefont, X., Okamura, H., & Shibata, S. (2005) Altered food-anticipatory activity rhythm in Cryptochrome-deficient mice. Neurosci. Res., 52, 166–173.
Jaggard, J., Robinson, B.G., Stahl, B.A., Oh, I., Masek, P., Yoshizawa, M., & Keene, A.C. (2017) The lateral line confers evolutionarily derived sleep loss in the Mexican cavefish. J. Exp. Biol., 220, 284–293.
Janssen, B.J.A., Tyssen, C.M., Duindam, H., & Rietveld, W.J. (1994) Suprachiasmatic lesions eliminate 24-h blood pressure variability in rats. Physiol. Behav., 55, 307–311.
Jarvie, B.C. & Palmiter, R.D. (2017) HSD2 neurons in the hindbrain drive sodium appetite. Nat. Neurosci., 20, 167–169.
Jiang, C., Fogel, R., & Zhang, X. (2003) Lateral hypothalamus modulates gut-sensitive neurons in the dorsal vagal complex. Brain Res., 980, 31–47.
Johnson, R.F., Beltz, T.G., Thunhorst, R.L., & Johnson, A.K. (2003) Investigations on the physiological controls of water and saline intake in C57BL/6 mice. Am. J. Physiol. Integr. Comp. Physiol., 285, R394–R403.
Jones, B.E. (2003) Arousal systems. Front. Biosci., 8, s438-51. Jones, B.E. (2005) From waking to sleeping: neuronal and chemical substrates. Trends
Pharmacol. Sci., 26, 578–586. Jones, J.R., Tackenberg, M.C., & McMahon, D.G. (2015) Manipulating circadian clock
neuron firing rate resets molecular circadian rhythms and behavior. Nat. Neurosci., 18, 373–375.
Kacem, K., Lacombe, P., Seylaz, J., & Bonvento, G. (1998) Structural organization of the perivascular astrocyte endfeet and their relationship with the endothelial glucose transporter: a confocal microscopy study. Glia, 23, 1–10.
Kalinchuk, A. V., Lu, Y., Stenberg, D., Rosenberg, P.A., & Porkka-Heiskanen, T. (2006) Nitric oxide production in the basal forebrain is required for recovery sleep. J. Neurochem., 99, 483–498.

REBECCA NORTHEAST 185
Kalinchuk, A. V, McCarley, R.W., Porkka-Heiskanen, T., & Basheer, R. (2011) The time course of adenosine, nitric oxide (NO) and inducible NO synthase changes in the brain with sleep loss and their role in the non-rapid eye movement sleep homeostatic cascade. J. Neurochem., 116, 260–272.
Kalsbeek, A., Fliers, E., Hofman, M.A., Swaab, D.F., & Buijs, R.M. (2010) Vasopressin and the Output of the Hypothalamic Biological Clock. J. Neuroendocrinol., 22, 362–372.
Kaneko, K., Yamada, T., Tsukita, S., Takahashi, K., Ishigaki, Y., Oka, Y., & Katagiri, H. (2009) Obesity alters circadian expressions of molecular clock genes in the brainstem. Brain Res., 1263, 58–68.
Kanoski, S.E., Fortin, S.M., Arnold, M., Grill, H.J., & Hayes, M.R. (2011) Peripheral and Central GLP-1 Receptor Populations Mediate the Anorectic Effects of Peripherally Administered GLP-1 Receptor Agonists, Liraglutide and Exendin-4. Endocrinology, 152, 3103–3112.
Kanoski, S.E., Zhao, S., Guarnieri, D.J., DiLeone, R.J., Yan, J., De Jonghe, B.C., Bence, K.K., Hayes, M.R., & Grill, H.J. (2012) Endogenous leptin receptor signaling in the medial nucleus tractus solitarius affects meal size and potentiates intestinal satiation signals. Am. J. Physiol. Metab., 303, E496–E503.
Kawano, H. & Masuko, S. (2001) Tyrosine hydroxylase-immunoreactive projections from the caudal ventrolateral medulla to the subfornical organ in the rat. Brain Res., 903, 154–161.
Kawano, H. & Masuko, S. (2010) Region-specific projections from the subfornical organ to the paraventricular hypothalamic nucleus in the rat. Neuroscience, 169, 1227–1234.
Kaya, M. & Ahishali, B. (2011) Assessment of Permeability in Barrier Type of Endothelium in Brain Using Tracers: Evans Blue, Sodium Fluorescein, and Horseradish Peroxidase. Humana Press, pp. 369–382.
Kiecker, C. (2018) The origins of the circumventricular organs. J. Anat., 232, 540–553. Kim, Y., Laposky, A.D., Bergmann, B.M., & Turek, F.W. (2007) Repeated sleep restriction in
rats leads to homeostatic and allostatic responses during recovery sleep. Proc. Natl. Acad. Sci. U. S. A., 104, 10697–10702.
Knutsson, A. (2003) Health disorders of shift workers. Occup. Med. (Chic. Ill)., 53, 103–108.
Ko, E.M., Estabrooke, I. V, McCarthy, M., & Scammell, T.E. (2003) Wake-related activity of tuberomammillary neurons in rats. Brain Res., 992, 220–226.
Kopp, C., Albrecht, U., Zheng, B., & Tobler, I. (2002) Homeostatic sleep regulation is preserved in mPer1 and mPer2 mutant mice. Eur. J. Neurosci., 16, 1099–1106.
Kosse, C. & Burdakov, D. (2014) A unifying computational framework for stability and flexibility of arousal. Front. Syst. Neurosci., 8, 192.
Kosse, C., Gonzalez, A., & Burdakov, D. (2015) Predictive models of glucose control: roles for glucose-sensing neurones. Acta Physiol., 213, 7–18.
Kriegsfeld, L.J., Leak, R.K., Yackulic, C.B., LeSauter, J., & Silver, R. (2004) Organization of suprachiasmatic nucleus projections in Syrian hamsters (Mesocricetus auratus): An anterograde and retrograde analysis. J. Comp. Neurol., 468, 361–379.
Krisch, B., Leonhardt, H., & Buchheim, W. (1978) The functional and structural border between the CSF- and blood-milieu in the circumventricular organs (organum vasculosum laminae terminalis, subfornical organ, area postrema) of the rat. Cell Tissue Res., 195, 485–497.
Kucharczyk, J., Assaf, S.Y., & Mogenson, G.J. (1976) Differential effects of brain lesions on

RHYTHMS, SLEEP AND HOMEOSTASIS
186
thirst induced by the administration of angiotensin-II to the preoptic region, subfornical organ and anterior third ventricle. Brain Res., 108, 327–337.
Laflamme, N. & Rivest, S. (2002) Toll-like receptor 4: the missing link of the cerebral innate immune response triggered by circulating gram-negative bacterial cell wall components. FASEB J., 15, 155–163.
Lananna, B. V, Nadarajah, C.J., Izumo, M., Cedeño, M.R., Xiong, D.D., Dimitry, J., Tso, C.F., McKee, C.A., Griffin, P., Sheehan, P.W., Haspel, J.A., Barres, B.A., Liddelow, S.A., Takahashi, J.S., Karatsoreos, I.N., & Musiek, E.S. (2018) Cell-Autonomous Regulation of Astrocyte Activation by the Circadian Clock Protein BMAL1. Cell Rep., 25, 1–9.e5.
Landgraf, D., Long, J.E., & Welsh, D.K. (2016) Depression-like behaviour in mice is associated with disrupted circadian rhythms in nucleus accumbens and periaqueductal grey. Eur. J. Neurosci., 43, 1309–1320.
Landgraf, D., Wang, L.L., Diemer, T., & Welsh, D.K. (2016) NPAS2 Compensates for Loss of CLOCK in Peripheral Circadian Oscillators. PLOS Genet., 12, e1005882.
Landry, G.J., Yamakawa, G.R., Webb, I.C., Mear, R.J., & Mistlberger, R.E. (2007) The Dorsomedial Hypothalamic Nucleus Is Not Necessary for the Expression of Circadian Food-Anticipatory Activity in Rats. J. Biol. Rhythms, 22, 467–478.
Langhans, W., Delprete, E., & Scharrer, E. (1991) Mechanisms of vasopressin’s anorectic effect. Physiol. Behav., 49, 169–176.
Langlet, F., Mullier, A., Bouret, S.G., Prevot, V., & Dehouck, B. (2013) Tanycyte-like cells form a blood-cerebrospinal fluid barrier in the circumventricular organs of the mouse brain. J. Comp. Neurol., 521, 3389–3405.
Laposky, A., Easton, A., Dugovic, C., Walisser, J., Bradfield, C., & Turek, F. (2005) Deletion of the mammalian circadian clock gene BMAL1/Mop3 alters baseline sleep architecture and the response to sleep deprivation. Sleep, 28, 395–409.
Larsen, P.J., Møller, M., & Mikkelsen, J.D. (1991) Efferent projections from the periventricular and medial parvicellular subnuclei of the hypothalamic paraventricular nucleus to circumventricular organs of the rat: A Phaseolus vulgaris -leucoagglutinin (PHA-L) tracing study. J. Comp. Neurol., 306, 462–479.
Larsen, P.J., Tang-Christensen, M., Holst, J.J., & Orskov, C. (1997) Distribution of glucagon-like peptide-1 and other preproglucagon-derived peptides in the rat hypothalamus and brainstem. Neuroscience, 77, 257–270.
Lee, C., Etchegaray, J.P., Cagampang, F.R., Loudon, A.S., & Reppert, S.M. (2001) Posttranslational mechanisms regulate the mammalian circadian clock. Cell, 107, 855–867.
Leemburg, S., Vyazovskiy, V. V, Olcese, U., Bassetti, C.L., Tononi, G., & Cirelli, C. (2010) Sleep homeostasis in the rat is preserved during chronic sleep restriction. Proc. Natl. Acad. Sci. U. S. A., 107, 15939–15944.
Lehtinen, M.K., Bjornsson, C.S., Dymecki, S.M., Gilbertson, R.J., Holtzman, D.M., & Monuki, E.S. (2013) The Choroid Plexus and Cerebrospinal Fluid: Emerging Roles in Development, Disease, and Therapy. J. Neurosci., 33, 17553–17559.
LeSauter, J., Hoque, N., Weintraub, M., Pfaff, D.W., & Silver, R. (2009) Stomach ghrelin-secreting cells as food-entrainable circadian clocks. Proc. Natl. Acad. Sci., 106, 13582–13587.
Levey, A.I., Hallanger, A.E., & Wainer, B.H. (1987) Cholinergic nucleus basalis neurons may influence the cortex via the thalamus. Neurosci. Lett., 74, 7–13.
Li, M., Bullock, C.M., Knauer, D.J., Ehlert, F.J., & Zhou, Q.Y. (2001) Identification of two

REBECCA NORTHEAST 187
prokineticin cDNAs: recombinant proteins potently contract gastrointestinal smooth muscle. Mol. Pharmacol., 59, 692–698.
Li, Z., Wang, Y., Sun, K.K., Wang, K., Sun, Z.S., Zhao, M., & Wang, J. (2015) Sex-related difference in food-anticipatory activity of mice. Horm. Behav., 70, 38–46.
Liberini, C.G., Borner, T., Boyle, C.N., & Lutz, T.A. (2016) The satiating hormone amylin enhances neurogenesis in the area postrema of adult rats. Mol. Metab., 5, 834–843.
Lima, H.R.C., Cavalcante-Lima, H.R., Cedraz-Mercez, P.L., Costa-E-Sousa, R.H., Olivares, E.L., Badauê-Passos, D., Medeiros, M.A., Côrtes, W.S., & Reis, L.C. (2004) Brain serotonin depletion enhances the sodium appetite induced by sodium depletion or beta-adrenergic stimulation. An. Acad. Bras. Cienc., 76, 85–92.
Lind, R.W., van Hoesen, G.W., & Johnson, A.K. (1982) An HRP study of the connections of the subfornical organ of the rat. J. Comp. Neurol., 210, 265–277.
Liu, A.C., Welsh, D.K., Ko, C.H., Tran, H.G., Zhang, E.E., Priest, A.A., Buhr, E.D., Singer, O., Meeker, K., Verma, I.M., Doyle, F.J., Takahashi, J.S., & Kay, S.A. (2007) Intercellular coupling confers robustness against mutations in the SCN circadian clock network. Cell, 129, 605–616.
Liu, C. & Reppert, S.M. (2000) GABA Synchronizes Clock Cells within the Suprachiasmatic Circadian Clock. Neuron, 25, 123–128.
Loh, D.H., Jami, S.A., Flores, R.E., Truong, D., Ghiani, C.A., O’Dell, T.J., & Colwell, C.S. (2015) Misaligned feeding impairs memories. Elife, 4, e09460.
Lucas, R.J., Lall, G.S., Allen, A.E., & Brown, T.M. (2012) How rod, cone, and melanopsin photoreceptors come together to enlighten the mammalian circadian clock. In Progress in Brain Research. pp. 1–18.
Lun, M.P., Monuki, E.S., & Lehtinen, M.K. (2015) Development and functions of the choroid plexus-cerebrospinal fluid system. Nat. Rev. Neurosci., 16, 445–457.
Lutz, T.A. (2013) The interaction of amylin with other hormones in the control of eating. Diabetes, Obes. Metab., 15, 99–111.
Madden, C.J., Santos da Conceicao, E.P., & Morrison, S.F. (2017) Vagal afferent activation decreases brown adipose tissue (BAT) sympathetic nerve activity and BAT thermogenesis. Temperature, 4, 89–96.
Mandelblat-Cerf, Y., Kim, A., Burgess, C.R., Subramanian, S., Tannous, B.A., Lowell, B.B., & Andermann, M.L. (2017) Bidirectional Anticipation of Future Osmotic Challenges by Vasopressin Neurons. Neuron, 1, 57-65.
Mangiapane, M.L., Thrasher, T.N., Keil, L.C., Simpson, J.B., & Ganong, W.F. (1983) Deficits in Drinking and Vasopressin Secretion after Lesions of the Nucleus medianus. Neuroendocrinology, 37, 73–77.
Marchant, E.G. & Mistlberger, R.E. (1996) Entrainment and phase shifting of circadian rhythms in mice by forced treadmill running. Physiol. Behav., 60, 657–663.
Marchant, E.G. & Mistlberger, R.E. (1997) Anticipation and entrainment to feeding time in intact and SCN-ablated C57BL/6j mice. Brain Res., 765, 273–282.
Marshall, L., Kirov, R., Brade, J., Mölle, M., & Born, J. (2011) Transcranial Electrical Currents to Probe EEG Brain Rhythms and Memory Consolidation during Sleep in Humans. PLoS One, 6, e16905.
Martin-Fairey, C.A., Ramanathan, C., Stowie, A., Walaszczyk, E., Smale, L., & Nunez, A.A. (2015) Plastic oscillators and fixed rhythms: Changes in the phase of clock-gene rhythms in the PVN are not reflected in the phase of the melatonin rhythm of grass rats. Neuroscience, 288, 178–186.

RHYTHMS, SLEEP AND HOMEOSTASIS
188
Marty, N., Dallaporta, M., Foretz, M., Emery, M., Tarussio, D., Bady, I., Binnert, C., Beermann, F., & Thorens, B. (2005) Regulation of glucagon secretion by glucose transporter type 2 (glut2) and astrocyte-dependent glucose sensors. J. Clin. Invest., 115, 3545–3553.
Masri, S. & Sassone-Corsi, P. (2018) The emerging link between cancer, metabolism, and circadian rhythms. Nat. Med., 24, 1795–1803.
Masubuchi, S., Honma, S., Abe, H., Ishizaki, K., Namihira, M., Ikeda, M., & Honma, K. (2000) Clock genes outside the suprachiasmatic nucleus involved in manifestation of locomotor activity rhythm in rats. Eur. J. Neurosci., 12, 4206–4214.
Matsuda, T., Hiyama, T.Y., Niimura, F., Matsusaka, T., Fukamizu, A., Kobayashi, K., Kobayashi, K., & Noda, M. (2016) Distinct neural mechanisms for the control of thirst and salt appetite in the subfornical organ. Nat. Neurosci., 20, 230–241.
Maywood, E.S., Chesham, J.E., O’Brien, J.A., & Hastings, M.H. (2011) A diversity of paracrine signals sustains molecular circadian cycling in suprachiasmatic nucleus circuits. Proc. Natl. Acad. Sci. U. S. A., 108, 14306–14311.
Mazda, T., Yamamoto, H., Fujimura, M., & Fujimiya, M. (2004) Gastric distension-induced release of 5-HT stimulates c- fos expression in specific brain nuclei via 5-HT3 receptors in conscious rats. Am. J. Physiol. Liver Physiol., 287, G228–G235.
McDearmon, E.L., Patel, K.N., Ko, C.H., Walisser, J.A., Schook, A.C., Chong, J.L., Wilsbacher, L.D., Song, E.J., Hong, H.-K., Bradfield, C.A., & Takahashi, J.S. (2006) Dissecting the functions of the mammalian clock protein BMAL1 by tissue-specific rescue in mice. Science, 314, 1304–1308.
McKillop, L.E., Fisher, S.P., Cui, N., Peirson, S.N., Foster, R.G., Wafford, K.A., & Vyazovskiy, V. V (2018) Effects of Aging on Cortical Neural Dynamics and Local Sleep Homeostasis in Mice. J. Neurosci., 38, 3911–3928.
McKinley, M.J., Denton, D.A., Ryan, P.J., Yao, S.T., Stefanidis, A., & Oldfield, B.J. (2019) From sensory circumventricular organs to cerebral cortex: neural pathways controlling thirst and hunger. J. Neuroendocrinol., e12689.
McKinley, M.J., Mathai, M.L., McAllen, R.M., McClear, R.C., Miselis, R.R., Pennington, G.L., Vivas, L., Wade, J.D., & Oldfield, B.J. (2004) Vasopressin Secretion: Osmotic and Hormonal Regulation by the Lamina Terminalis. J. Neuroendocrinol., 16, 340–347.
McKinley, M.J., McAllen, R.M., Davern, P., Giles, M.E., Penschow, J., Sunn, N., Uschakov, A., & Oldfield, B.J. (2003) The sensory circumventricular organs of the mammalian brain. Adv. Anat. Embryol. Cell Biol., 172, III–XII, 1-122, back cover.
Mendoza, J., Albrecht, U., & Challet, E. (2010) Behavioural food anticipation in clock genes deficient mice: confirming old phenotypes, describing new phenotypes. Genes, Brain Behav., 9, 467–477.
Mieda, M., Williams, S.C., Sinton, C.M., Richardson, J.A., Sakurai, T., & Yanagisawa, M. (2004) Orexin neurons function in an efferent pathway of a food-entrainable circadian oscillator in eliciting food-anticipatory activity and wakefulness. J. Neurosci., 24, 10493–10501.
Mileykovskiy, B.Y., Kiyashchenko, L.I., & Siegel, J.M. (2005) Behavioral Correlates of Activity in Identified Hypocretin/Orexin Neurons. Neuron, 46, 787–798.
Millar-Craig, M.W., Bishop, C.N., & Raftery, E.B. (1978) Circadian variation of blood-pressure. Lancet (London, England), 1, 795–797.
Miller, J. -e. K., Granados-Fuentes, D., Wang, T., Marpegan, L., Holy, T.E., & Herzog, E.D. (2014) Vasoactive Intestinal Polypeptide Mediates Circadian Rhythms in Mammalian
REBECCA NORTHEAST 189
Olfactory Bulb and Olfaction. J. Neurosci., 34, 6040–6046. Miller, J.D., Morin, L.P., Schwartz, W.J., & Moore, R.Y. (1996) New insights into the
mammalian circadian clock. Sleep, 19, 641–667. Miller, R.L. & Loewy, A.D. (2013) ENaC γ-expressing astrocytes in the circumventricular
organs, white matter, and ventral medullary surface: Sites for Na+ regulation by glial cells. J. Chem. Neuroanat., 53, 72–80.
Miselis, R.R. (1981) The efferent projections of the subfornical organ of the rat: A circumventricular organ within a neural network subserving water balance. Brain Res., 230, 1–23.
Miselis, R.R., Shapiro, R.E., & Hand, P.J. (1979) Subfornical organ efferents to neural systems for control of body water. Science, 205, 1022–1025.
Mistlberger, R.E. (2011) Neurobiology of food anticipatory circadian rhythms. Physiol. Behav., 104, 535–545.
Mistlberger, R.E. & Antle, M.C. (1999) Neonatal monosodium glutamate alters circadian organization of feeding, food anticipatory activity and photic masking in the rat. Brain Res., 842, 73–83.
Mistlberger, R.E. & Antle, M.C. (2011) Entrainment of circadian clocks in mammals by arousal and food. Essays Biochem., 49, 119–136.
Mistlberger, R.E., Bergmann, B.M., & Rechtschaffen, A. (1987) Relationships among wake episode lengths, contiguous sleep episode lengths, and electroencephalographic delta waves in rats with suprachiasmatic nuclei lesions. Sleep, 10, 12–24.
Mistlberger, R.E., Bergmann, B.M., Waldenar, W., & Rechtschaffen, A. (1983) Recovery Sleep Following Sleep Deprivation in Intact and Suprachiasmatic Nuclei-Lesioned Rats. Sleep, 6, 217–233.
Mistlberger, R.E. & Marchant, E.G. (1995) Computational and entrainment models of circadian food-anticipatory activity: evidence from non-24-hr feeding schedules. Behav. Neurosci., 109, 790–798.
Mistlberger, R.E. & Rusak, B. (1988) Food-Anticipatory Circadian Rhythms in Rats with Paraventricular and Lateral Hypothalamic Ablations. J. Biol. Rhythms, 3, 277–291.
Mistlberger, R.E., Yamazaki, S., Pendergast, J.S., Landry, G.J., Takumi, T., & Nakamura, W. (2008) Differential Rescue of Light- and Food-Entrainable Circadian Rhythms. Science (80-. )., 320, 1074–1077.
Mitchell, S.E., Delville, C., Konstantopedos, P., Derous, D., Green, C.L., Chen, L., Han, J.-D.J., Wang, Y., Promislow, D.E.L., Douglas, A., Lusseau, D., & Speakman, J.R. (2015) The effects of graded levels of calorie restriction: III. Impact of short term calorie and protein restriction on mean daily body temperature and torpor use in the C57BL/6 mouse. Oncotarget, 6, 18314–18337.
Mitsui, S., Yamaguchi, S., Matsuo, T., Ishida, Y., & Okamura, H. (2001) Antagonistic role of E4BP4 and PAR proteins in the circadian oscillatory mechanism. Genes Dev., 15, 995–1006.
Mongrain, V., La Spada, F., Curie, T., & Franken, P. (2011) Sleep Loss Reduces the DNA-Binding of BMAL1, CLOCK, and NPAS2 to Specific Clock Genes in the Mouse Cerebral Cortex. PLoS One, 6, e26622.
Moore, R.Y. & Speh, J.C. (1993) GABA is the principal neurotransmitter of the circadian system. Neurosci. Lett., 150, 112–116.
Morairty, S.R., Dittrich, L., Pasumarthi, R.K., Valladao, D., Heiss, J.E., Gerashchenko, D., & Kilduff, T.S. (2013) A role for cortical nNOS/NK1 neurons in coupling homeostatic

RHYTHMS, SLEEP AND HOMEOSTASIS
190
sleep drive to EEG slow wave activity. Proc. Natl. Acad. Sci. U. S. A., 110, 20272–20277.
Moreno, M.L., Meza, E., Ortega, A., & Caba, M. (2014) The median preoptic nucleus exhibits circadian regulation and is involved in food anticipatory activity in rabbit pups. Chronobiol. Int., 31, 515–522.
Morgan, R.M., Patterson, M.J., & Nimmo, M.A. (2004) Acute effects of dehydration on sweat composition in men during prolonged exercise in the heat. Acta Physiol. Scand., 182, 37–43.
Morin, L.P., Shivers, K.-Y., Blanchard, J.H., & Muscat, L. (2006) Complex organization of mouse and rat suprachiasmatic nucleus. Neuroscience, 137, 1285–1297.
Morita, S., Furube, E., Mannari, T., Okuda, H., Tatsumi, K., Wanaka, A., & Miyata, S. (2016) Heterogeneous vascular permeability and alternative diffusion barrier in sensory circumventricular organs of adult mouse brain. Cell Tissue Res., 363, 497–511.
Morita, S. & Miyata, S. (2012) Different vascular permeability between the sensory and secretory circumventricular organs of adult mouse brain. Cell Tissue Res., 349, 589–603.
Moriya, T., Aida, R., Kudo, T., Akiyama, M., Doi, M., Hayasaka, N., Nakahata, N., Mistlberger, R., Okamura, H., & Shibata, S. (2009) The dorsomedial hypothalamic nucleus is not necessary for food-anticipatory circadian rhythms of behavior, temperature or clock gene expression in mice. Eur. J. Neurosci., 29, 1447–1460.
Morris, M.E., Viswanathan, N., Kuhlman, S., Davis, F.C., & Weitz, C.J. (1998) A Screen for Genes Induced in the Suprachiasmatic Nucleus by Light. Science (80-. )., 279, 1544–1547.
Morrison, J.H. & Baxter, M.G. (2012) The ageing cortical synapse: hallmarks and implications for cognitive decline. Nat. Rev. Neurosci., 13, 240–250.
Morrison, S.F., Madden, C.J., & Tupone, D. (2012) Central control of brown adipose tissue thermogenesis. Front. Endocrinol. (Lausanne)., 3.
Mrosovsky, N. (1999) Masking: History, Definitions, and Measurement. Chronobiol. Int., 16, 415–429.
Mukherji, A., Kobiita, A., & Chambon, P. (2015) Shifting the feeding of mice to the rest phase creates metabolic alterations, which, on their own, shift the peripheral circadian clocks by 12 hours. Proc. Natl. Acad. Sci., 112, E6683-6690.
Mukherji, A., Kobiita, A., Damara, M., Misra, N., Meziane, H., Champy, M.-F., & Chambon, P. (2015) Shifting eating to the circadian rest phase misaligns the peripheral clocks with the master SCN clock and leads to a metabolic syndrome. Proc. Natl. Acad. Sci., 112, E6691-6698.
Muller, J.E., Stone, P.H., Turi, Z.G., Rutherford, J.D., Czeisler, C.A., Parker, C., Poole, W.K., Passamani, E., Roberts, R., Robertson, T., Sobel, B.E., Willerson, J.T., & Braunwald, E. (1985) Circadian Variation in the Frequency of Onset of Acute Myocardial Infarction. N. Engl. J. Med., 313, 1315–1322.
Myung, J., Schmal, C., Hong, S., Tsukizawa, Y., Rose, P., Zhang, Y., Holtzman, M.J., De Schutter, E., Herzel, H., Bordyugov, G., & Takumi, T. (2018) The choroid plexus is an important circadian clock component. Nat. Commun., 9, 1062.
Myung, J., Wu, D., Simonneaux, V., & Lane, T.J. (2018) Strong Circadian Rhythms in the Choroid Plexus: Implications for Sleep-Independent Brain Metabolite Clearance. J. Exp. Neurosci., 12, 1179069518783762.
Nakamura, T.J., Nakamura, W., Yamazaki, S., Kudo, T., Cutler, T., Colwell, C.S., & Block,

REBECCA NORTHEAST 191
G.D. (2011) Age-related decline in circadian output. J. Neurosci., 31, 10201–10205. Nakazato, R., Kawabe, K., Yamada, D., Ikeno, S., Mieda, M., Shimba, S., Hinoi, E., Yoneda,
Y., & Takarada, T. (2017) Disruption of Bmal1 Impairs Blood-Brain Barrier Integrity via Pericyte Dysfunction. J. Neurosci., 37, 10052–10062.
Nation, H.L., Nicoleau, M., Kinsman, B.J., Browning, K.N., & Stocker, S.D. (2016) DREADD-induced activation of subfornical organ neurons stimulates thirst and salt appetite. J. Neurophysiol., 115, 3123–3129.
Naylor, E., Bergmann, B.M., Krauski, K., Zee, P.C., Takahashi, J.S., Vitaterna, M.H., & Turek, F.W. (2000) The circadian clock mutation alters sleep homeostasis in the mouse. J. Neurosci., 20, 8138–8143.
Nedeltcheva, A. V. & Scheer, F.A.J.L. (2014) Metabolic effects of sleep disruption, links to obesity and diabetes. Curr. Opin. Endocrinol. Diabetes Obes., 21, 293–298.
Nelson, W. & Halberg, F. (1986) Schedule-shifts, circadian rhythms and lifespan of freely-feeding and meal-fed mice. Physiol. Behav., 38, 781–788.
Nishinaga, H., Komatsu, R., Doi, M., Fustin, J.-M., Yamada, H., Okura, R., Yamaguchi, Y., Matsuo, M., Emoto, N., & Okamura, H. (2009) Circadian expression of the Na+/H+ exchanger NHE3 in the mouse renal medulla. Biomed. Res., 30, 87–93.
Ngo, H.-V.V., Martinetz, T., Born, J., & Mölle, M. (2013) Auditory Closed-Loop Stimulation of the Sleep Slow Oscillation Enhances Memory. Neuron, 78, 545–553.
Nomura, K., Hiyama, T.Y., Sakuta, H., Matsuda, T., Lin, C.-H., Kobayashi, K., Kobayashi, K., Kuwaki, T., Takahashi, K., Matsui, S., & Noda, M. (2019) [Na+] Increases in Body Fluids Sensed by Central Nax Induce Sympathetically Mediated Blood Pressure Elevations via H+-Dependent Activation of ASIC1a. Neuron, 101, 60–75.e6.
O’Keefe, J. & Recce, M.L. (1993) Phase relationship between hippocampal place units and the EEG theta rhythm. Hippocampus, 3, 317–330.
O’Neill, J.S. & Reddy, A.B. (2011) Circadian clocks in human red blood cells. Nature, 469, 498–503.
Oh-oka, K., Kono, H., Ishimaru, K., Miyake, K., Kubota, T., Ogawa, H., Okumura, K., Shibata, S., & Nakao, A. (2014) Expressions of tight junction proteins occludin and claudin-1 Are under the circadian control in the mouse large intestine: Implications in intestinal permeability and susceptibility to colitis. PLoS One, 9, 1–10.
Okamura, H., Miyake, S., Sumi, Y., Yamaguchi, S., Yasui, A., Muijtjens, M., Hoeijmakers, J.H., & van der Horst, G.T. (1999) Photic induction of mPer1 and mPer2 in cry-deficient mice lacking a biological clock. Science, 286, 2531–2534.
Oldfield, B.J. & McKinley, M.J. (2015) Chapter 15 – Circumventricular Organs. In The Rat Nervous System. pp. 315–333.
Olini, N., Rothfuchs, I., Azzinnari, D., Pryce, C.R., Kurth, S., & Huber, R. (2017) Chronic social stress leads to altered sleep homeostasis in mice. Behav. Brain Res., 327, 167–173.
Orozco-Solis, R., Aguilar-Arnal, L., Murakami, M., Peruquetti, R., Ramadori, G., Coppari, R., & Sassone-Corsi, P. (2016) The Circadian Clock in the Ventromedial Hypothalamus Controls Cyclic Energy Expenditure. Cell Metab., 23, 467–478.
Palchykova, S., Winsky-Sommerer, R., Meerlo, P., Dürr, R., & Tobler, I. (2006) Sleep deprivation impairs object recognition in mice. Neurobiol. Learn. Mem., 85, 263–271.
Panagiotou, M., Vyazovskiy, V. V, Meijer, J.H., & Deboer, T. (2017) Differences in electroencephalographic non-rapid-eye movement sleep slow-wave characteristics between young and old mice. Sci. Rep., 7, 43656.
RHYTHMS, SLEEP AND HOMEOSTASIS
192
Parekh, P.K., Becker-Krail, D., Sundaravelu, P., Ishigaki, S., Okado, H., Sobue, G., Huang, Y., & McClung, C.A. (2018) Altered GluA1 (Gria1) Function and Accumbal Synaptic Plasticity in the ClockΔ19 Model of Bipolar Mania. Biol. Psychiatry, 84, 817–826.
Patton, A.P., Chesham, J.E., & Hastings, M.H. (2016) Combined Pharmacological and Genetic Manipulations Unlock Unprecedented Temporal Elasticity and Reveal Phase-Specific Modulation of the Molecular Circadian Clock of the Mouse Suprachiasmatic Nucleus. J. Neurosci., 36, 9326–9341.
Paul, J.R., Davis, J.A., Goode, L.K., Becker, B.K., Fusilier, A., Meador-Woodruff, A., & Gamble, K.L. (2019) Circadian regulation of membrane physiology in neural oscillators throughout the brain. Eur. J. Neurosci.,.
Pavlovski, I., Evans, J.A., & Mistlberger, R.E. (2018) Feeding Time Entrains the Olfactory Bulb Circadian Clock in Anosmic PER2::LUC Mice. Neuroscience, 393, 175–184.
Paxinos, G. & Franklin, K.B.J. (2001) Mouse Brain in Stereotaxic Coordinates, Academic Press.
Pendergast, J.S., Oda, G.A., Niswender, K.D., & Yamazaki, S. (2012) Period determination in the food-entrainable and methamphetamine-sensitive circadian oscillator(s). Proc. Natl. Acad. Sci., 109, 14218–14223.
Pendergast, J.S., Wendroth, R.H., Stenner, R.C., Keil, C.D., & Yamazaki, S. (2017) mPeriod2 Brdm1 and other single Period mutant mice have normal food anticipatory activity. Sci. Rep., 7, 15510.
Pendergast, J.S. & Yamazaki, S. (2018) The Mysterious Food-Entrainable Oscillator: Insights from Mutant and Engineered Mouse Models. J. Biol. Rhythms, 33, 458–474.
Piggins, H.D., Antle, M.C., & Rusak, B. (1995) Neuropeptides phase shift the mammalian circadian pacemaker. J. Neurosci., 15, 5612–5622.
Pilorz, V., Helfrich-Förster, C., & Oster, H. (2018) The role of the circadian clock system in physiology. Pflügers Arch. - Eur. J. Physiol., 470, 227–239.
Pitts, S., Perone, E., & Silver, R. (2003) Food-entrained circadian rhythms are sustained in arrhythmic Clk/Clk mutant mice. Am. J. Physiol. Regul. Integr. Comp. Physiol., 285, R57-67.
Pócsai, K. & Kálmán, M. (2015) Glial and perivascular structures in the subfornical organ: distinguishing the shell and core. J. Histochem. Cytochem., 63, 367–383.
Polack, P.-O., Friedman, J., & Golshani, P. (2013) Cellular mechanisms of brain state–dependent gain modulation in visual cortex. Nat. Neurosci., 16, 1331–1339.
Porkka-Heiskanen, T., Strecker, R.E., & McCarley, R.W. (2000) Brain site-specificity of extracellular adenosine concentration changes during sleep deprivation and spontaneous sleep: an in vivo microdialysis study. Neuroscience, 99, 507–517.
Potts, P.D., Ludbrook, J., Gillman-Gaspari, T.A., Horiuchi, J., & Dampney, R.A. (2000) Activation of brain neurons following central hypervolaemia and hypovolaemia: contribution of baroreceptor and non-baroreceptor inputs. Neuroscience, 95, 499–511.
Prager-Khoutorsky, M. & Bourque, C.W. (2015) Anatomical organization of the rat organum vasculosum laminae terminalis. Am. J. Physiol. Integr. Comp. Physiol., 309, R324–R337.
Preitner, N., Damiola, F., Lopez-Molina, L., Zakany, J., Duboule, D., Albrecht, U., & Schibler, U. (2002) The orphan nuclear receptor REV-ERBalpha controls circadian transcription within the positive limb of the mammalian circadian oscillator. Cell, 110, 251–260.

REBECCA NORTHEAST 193
Prolo, L.M., Takahashi, J.S., & Herzog, E.D. (2005) Circadian rhythm generation and entrainment in astrocytes. J. Neurosci., 25, 404–408.
Pulman, K.J., Fry, W.M., Cottrell, G.T., & Ferguson, A. V. (2006) The Subfornical Organ: A Central Target for Circulating Feeding Signals. J. Neurosci., 26.
Raggenbass, M., Tribollet, E., Dubois-Dauphin, M., & Dreifuss, J.J. (1989) Vasopressin receptors of the vasopressor (V1) type in the nucleus of the solitary tract of the rat mediate direct neuronal excitation. J Neurosci, 9, 3929–3936.
Ralph, M.R., Foster, R.G., Davis, F.C., & Menaker, M. (1990) Transplanted suprachiasmatic nucleus determines circadian period. Science, 247, 975–978.
Ramsay, D.J., Thrasher, T.N., & Keil, L.C. (1983) The Organum Vasculosum Laminae Terminalis: A Critical Area for Osmoreception. In Progress in Brain Research. pp. 91–98.
Regalado, J.M., Cortez, M.B., Grubbs, J., Link, J.A., van der Linden, A., & Zhang, Y. (2017) Increased food intake after starvation enhances sleep in Drosophila melanogaster. J. Genet. Genomics, 44, 319–326.
Reick, M., Garcia, J.A., Dudley, C., & McKnight, S.L. (2001) NPAS2: an analog of clock operative in the mammalian forebrain. Science, 293, 506–509.
Reinke, H. & Asher, G. (2019) Crosstalk between metabolism and circadian clocks. Nat. Rev. Mol. Cell Biol., 20, 227–241.
Reischl, S., Vanselow, K., Westermark, P.O., Thierfelder, N., Maier, B., Herzel, H., & Kramer, A. (2007) Beta-TrCP1-mediated degradation of PERIOD2 is essential for circadian dynamics. J. Biol. Rhythms, 22, 375–386.
Reppert, S.M., Schwartz, W.J., & Uhl, G.R. (1987) Arginine vasopressin: a novel peptide rhythm in cerebrospinal fluid. Trends Neurosci., 10, 76–80.
Reppert, S.M. & Weaver, D.R. (2002) Coordination of circadian timing in mammals. Nature, 418, 935–941.
Resch, J.M., Fenselau, H., Madara, J.C., Wu, C., Campbell, J.N., Lyubetskaya, A., Dawes, B.A., Tsai, L.T., Li, M.M., Livneh, Y., Ke, Q., Kang, P.M., Fejes-Tóth, G., Náray-Fejes-Tóth, A., Geerling, J.C., & Lowell, B.B. (2017) Aldosterone-Sensing Neurons in the NTS Exhibit State-Dependent Pacemaker Activity and Drive Sodium Appetite via Synergy with Angiotensin II Signaling. Neuron, 96, 190–206.e7.
Ribeiro, A.C., Ceccarini, G., Dupré, C., Friedman, J.M., Pfaff, D.W., & Mark, A.L. (2011) Contrasting Effects of Leptin on Food Anticipatory and Total Locomotor Activity. PLoS One, 6, e23364.
Ribelayga, C., Cao, Y., & Mangel, S.C. (2008) The Circadian Clock in the Retina Controls Rod-Cone Coupling. Neuron, 59, 790–801.
Richter, C.P. (1922) A Behavioristic Study of the Activity of the Rat. Comp. Psych. Monographs, 2, 56
Riddle, M., Mezias, E., Foley, D., LeSauter, J., & Silver, R. (2017) Differential localization of PER1 and PER2 in the brain master circadian clock. Eur. J. Neurosci., 45, 1357–1367.
Rinaman, L. (2010) Ascending projections from the caudal visceral nucleus of the solitary tract to brain regions involved in food intake and energy expenditure. Brain Res., 1350, 18–34.
Roberts, B.L., Zhu, M., Zhao, H., Dillon, C., & Appleyard, S.M. (2017) High glucose increases action potential firing of catecholamine neurons in the nucleus of the solitary tract by increasing spontaneous glutamate inputs. Am. J. Physiol. Regul. Integr. Comp. Physiol., 313, R229–R239.

RHYTHMS, SLEEP AND HOMEOSTASIS
194
Roenneberg, T., Allebrandt, K.V., Merrow, M., & Vetter, C. (2012) Social Jetlag and Obesity. Curr. Biol., 22, 939–943.
Roenneberg, T. & Merrow, M. (2016) The Circadian Clock and Human Health. Curr. Biol., 26, R432-43.
Roman, C.W., Sloat, S.R., & Palmiter, R.D. (2017) A tale of two circuits: CCKNTS neuron stimulation controls appetite and induces opposing motivational states by projections to distinct brain regions. Neuroscience, 358, 316–324.
Rouah-Rosilio, M., Orosco, M., & Nicolaidis, S. (1994) Serotoninergic modulation of sodium appetite in the rat. Physiol. Behav., 55, 811–816.
Russell, P.J., Abdelaal, A.E., & Mogenson, G.J. (1975) Graded levels of hemorrhage, thirst and angiotensin II in the rat. Physiol. Behav., 15, 117–119.
Saeed, Y. & Abbott, S.M.. (2017) Circadian Disruption Associated with Alzheimer’s Disease. Curr. Neurol. Neurosci. Rep., 17, 29.
Sakhi, K., Belle, M.D.C., Gossan, N., Delagrange, P., & Piggins, H.D. (2014) Daily variation in the electrophysiological activity of mouse medial habenula neurones. J. Physiol., 592, 587–603.
Saper, C.B. (1984) Organization of cerebral cortical afferent systems in the rat. II. Magnocellular basal nucleus. J. Comp. Neurol., 222, 313–342.
Saper, C.B., Chou, T.C., & Scammell, T.E. (2001) The sleep switch: hypothalamic control of sleep and wakefulness. Trends Neurosci., 24, 726–731.
Saper, C.B. & Levisohn, D. (1983) Afferent connections of the median preoptic nucleus in the rat: anatomical evidence for a cardiovascular integrative mechanism in the anteroventral third ventricular (AV3V) region. Brain Res., 288, 21–31.
Saper, C.B., Lu, J., Chou, T.C., & Gooley, J. (2005) The hypothalamic integrator for circadian rhythms. Trends Neurosci., 28, 152–157.
Saper, C.B., Scammell, T.E., & Lu, J. (2005) Hypothalamic regulation of sleep and circadian rhythms. Nature, 437, 1257–1263.
Sato, T. & Kawamura, H. (1984) Circadian rhythms in multiple unit activity inside and outside the suprachiasmatic nucleus in the diurnal chipmunk (Eutamias sibiricus). Neurosci. Res., 1, 45–52.
Sato, T.K., Yamada, R.G., Ukai, H., Baggs, J.E., Miraglia, L.J., Kobayashi, T.J., Welsh, D.K., Kay, S.A., Ueda, H.R., & Hogenesch, J.B. (2006) Feedback repression is required for mammalian circadian clock function. Nat. Genet., 38, 312–319.
Scammell, T.E., Arrigoni, E., & Lipton, J.O. (2017) Neural Circuitry of Wakefulness and Sleep. Neuron, 93, 747–765.
Scheer, F.A.J.L., Ter Horst, G.J., van der Vliet, J., & Buijs, R.M. (2001) Physiological and anatomic evidence for regulation of the heart by suprachiasmatic nucleus in rats. Am. J. Physiol. Circ. Physiol., 280, H1391–H1399.
Schibler, U., Ripperger, J., & Brown, S.A. (2003) Peripheral circadian oscillators in mammals: time and food. J. Biol. Rhythms, 18, 250–260.
Schmal, C., Herzog, E.D., & Herzel, H. (2018) Measuring Relative Coupling Strength in Circadian Systems. J. Biol. Rhythms, 33, 84–98.
Schwartz, W.J. & Zimmerman, P. (1990) Circadian timekeeping in BALB/c and C57BL/6 inbred mouse strains. J. Neurosci., 10, 3685–3694.
Sei, H., Oishi, K., Chikahisa, S., Kitaoka, K., Takeda, E., & Ishida, N. (2008) Diurnal Amplitudes of Arterial Pressure and Heart Rate Are Dampened in Clock Mutant Mice and Adrenalectomized Mice. Endocrinology, 149, 3576–3580.

REBECCA NORTHEAST 195
Sexton, P.M., Paxinos, G., Kenney, M.A., Wookey, P.J., & Beaumont, K. (1994) In vitro autoradiographic localization of amylin binding sites in rat brain. Neuroscience, 62, 553–567.
Shan, Z., Li, Y., Zong, G., Guo, Y., Li, J., Manson, J.E., Hu, F.B., Willett, W.C., Schernhammer, E.S., & Bhupathiraju, S.N. (2018) Rotating night shift work and adherence to unhealthy lifestyle in predicting risk of type 2 diabetes: results from two large US cohorts of female nurses. BMJ, 363, k4641.
Sherin, J.E., Shiromani, P.J., McCarley, R.W., & Saper, C.B. (1996) Activation of ventrolateral preoptic neurons during sleep. Science, 271, 216–219.
Sheward, W.J., Naylor, E., Knowles-Barley, S., Armstrong, J.D., Brooker, G.A., Seckl, J.R., Turek, F.W., Holmes, M.C., Zee, P.C., & Harmar, A.J. (2010) Circadian control of mouse heart rate and blood pressure by the suprachiasmatic nuclei: behavioral effects are more significant than direct outputs. PLoS One, 5, e9783.
Shimba, S., Hinoi, E., Yoneda, Y., Yamada, D., Ikeno, S., Nakazato, R., Takarada, T., Kawabe, K., & Mieda, M. (2017) Disruption of Bmal1 Impairs Blood–Brain Barrier Integrity via Pericyte Dysfunction. J. Neurosci., 37, 10052–10062.
Shimizu, H., Watanabe, E., Hiyama, T.Y., Nagakura, A., Fujikawa, A., Okado, H., Yanagawa, Y., Obata, K., & Noda, M. (2007) Glial Nax Channels Control Lactate Signaling to Neurons for Brain [Na+] Sensing. Neuron, 54, 59–72.
Shiromani, P.J., Xu, M., Winston, E.M., Shiromani, S.N., Gerashchenko, D., & Weaver, D.R. (2004) Sleep rhythmicity and homeostasis in mice with targeted disruption of mPeriod genes. Am. J. Physiol. Integr. Comp. Physiol., 287, R47–R57.
Simpson, J.B. & Routtenberg, A. (1973) Subfornical organ: site of drinking elicitation by angiotensin II. Science, 181, 1172–1175.
Sivarao, D. V, Krowicki, Z.K., & Hornby, P.J. (1998) Role of GABAA receptors in rat hindbrain nuclei controlling gastric motor function. Neurogastroenterol. Motil., 10, 305–313.
Skibicka, K.P. & Grill, H.J. (2009) Hindbrain Leptin Stimulation Induces Anorexia and Hyperthermia Mediated by Hindbrain Melanocortin Receptors. Endocrinology, 150, 1705–1711.
Smith, P.M., Brzezinska, P., Hubert, F., Mimee, A., Maurice, D.H., & Ferguson, A. V. (2016) Leptin influences the excitability of area postrema neurons. Am. J. Physiol. Integr. Comp. Physiol., 310, R440–R448.
Smith, P.M. & Ferguson, A. V. (1997) Vasopressin Acts in the Subfornical Organ to Decrease Blood Pressure. Neuroendocrinology, 66, 130–135.
Spiteri, N.J. (1982) Circadian patterning of feeding, drinking and activity during diurnal food access in rats. Physiol. Behav., 28, 139–147.
Steininger, T.L., Alam, M.N., Gong, H., Szymusiak, R., & McGinty, D. (1999) Sleep–waking discharge of neurons in the posterior lateral hypothalamus of the albino rat. Brain Res., 840, 138–147.
Stephan, F.K. (1997) Calories affect zeitgeber properties of the feeding entrained circadian oscillator. Physiol. Behav., 62, 995–1002.
Stephan, F.K., Swann, J.M., & Sisk, C.L. (1979) Anticipation of 24-hr feeding schedules in rats with lesions of the suprachiasmatic nucleus. Behav. Neural Biol., 25, 346–363.
Stephan, F.K. & Zucker, I. (1972) Circadian rhythms in drinking behavior and locomotor activity of rats are eliminated by hypothalamic lesions. Proc. Natl. Acad. Sci. U. S. A., 69, 1583–1586.

RHYTHMS, SLEEP AND HOMEOSTASIS
196
Stocker, S.D., Stricker, E.M., & Sved, A.F. (2002) Arterial baroreceptors mediate the inhibitory effect of acute increases in arterial blood pressure on thirst. Am. J. Physiol. Integr. Comp. Physiol., 282, R1718–R1729.
Stokkan, K.A., Yamazaki, S., Tei, H., Sakaki, Y., & Menaker, M. (2001) Entrainment of the circadian clock in the liver by feeding. Science, 291, 490–493.
Storch, K.-F. & Weitz, C.J. (2009) Daily rhythms of food-anticipatory behavioral activity do not require the known circadian clock. Proc. Natl. Acad. Sci. U. S. A., 106, 6808–6813.
Strecker, R.E., Morairty, S., Thakkar, M.M., Porkka-Heiskanen, T., Basheer, R., Dauphin, L.J., Rainnie, D.G., Portas, C.M., Greene, R.W., & McCarley, R.W. (2000) Adenosinergic modulation of basal forebrain and preoptic/anterior hypothalamic neuronal activity in the control of behavioral state. Behav. Brain Res., 115, 183–204.
Stricker, E.M. & Sved, A.F. (2002) Controls of vasopressin secretion and thirst: similarities and dissimilarities in signals. Physiol. Behav., 77, 731–736.
Sujino, M., Asakawa, T., Nagano, M., Koinuma, S., Masumoto, K.-H., & Shigeyoshi, Y. (2018) CLOCKΔ19 mutation modifies the manner of synchrony among oscillation neurons in the suprachiasmatic nucleus. Sci. Rep., 8, 854.
Sutton, E.F., Beyl, R., Early, K.S., Cefalu, W.T., Ravussin, E., & Peterson, C.M. (2018) Early Time-Restricted Feeding Improves Insulin Sensitivity, Blood Pressure, and Oxidative Stress Even without Weight Loss in Men with Prediabetes. Cell Metab., 27, 1212–1221.e3.
Sutton, G.M., Perez-Tilve, D., Nogueiras, R., Fang, J., Kim, J.K., Cone, R.D., Gimble, J.M., Tschop, M.H., & Butler, A.A. (2008) The Melanocortin-3 Receptor Is Required for Entrainment to Meal Intake. J. Neurosci., 28, 12946–12955.
Swanson, L.W. & Lind, R.W. (1986) Neural projections subserving the initiation of a specific motivated behavior in the rat: new projections from the subfornical organ. Brain Res., 379, 399–403.
Sweeney, M.D., Zhao, Z., Montagne, A., Nelson, A.R., & Zlokovic, B. V. (2019) Blood-Brain Barrier: From Physiology to Disease and Back. Physiol. Rev., 99, 21–78.
Szentirmai, É., Kapás, L., Sun, Y., Smith, R.G., & Krueger, J.M. (2010) Restricted feeding-induced sleep, activity, and body temperature changes in normal and preproghrelin-deficient mice. Am. J. Physiol. Integr. Comp. Physiol., 298, R467–R477.
Szymusiak, R., Alam, N., Steininger, T.L., & McGinty, D. (1998) Sleep–waking discharge patterns of ventrolateral preoptic/anterior hypothalamic neurons in rats. Brain Res., 803, 178–188.
Takahashi, J.S. (2017) Transcriptional architecture of the mammalian circadian clock. Nat. Rev. Genet., 18, 164–179.
Takasu, N.N., Kurosawa, G., Tokuda, I.T., Mochizuki, A., Todo, T., & Nakamura, W. (2012) Circadian Regulation of Food-Anticipatory Activity in Molecular Clock–Deficient Mice. PLoS One, 7, e48892.
Takumi, T., Taguchi, K., Miyake, S., Sakakida, Y., Takashima, N., Matsubara, C., Maebayashi, Y., Okumura, K., Takekida, S., Yamamoto, S., Yagita, K., Yan, L., Young, M.W., & Okamura, H. (1998) A light-independent oscillatory gene mPer3 in mouse SCN and OVLT. EMBO J., 17, 4753–4759.
Tanaka, J., Yamamuro, Y., Saito, H., Matsuda, M., & Nomura, M. (1995) Differences in Electrophysiological Properties of Angiotensinergic Pathways from the Subfornical Organ to the Median Preoptic Nucleus between Normotensive Wistar-Kyoto and Spontaneously Hypertensive Rats. Exp. Neurol., 134, 192–198.

REBECCA NORTHEAST 197
Tanaka, M., Hayashi, S., Tamada, Y., Ikeda, T., Hisa, Y., Takamatsu, T., & Ibata, Y. (1997) Direct retinal projections to GRP neurons in the suprachiasmatic nucleus of the rat. Neuroreport, 8, 2187–2191.
Tao, W., Wu, J., Zhang, Q., Lai, S.-S., Jiang, S., Jiang, C., Xu, Y., Xue, B., Du, J., & Li, C.-J. (2015) EGR1 regulates hepatic clock gene amplitude by activating Per1 transcription. Sci. Rep., 5, 15212.
Thunhorst, R.L., Xu, Z., Cicha, M.Z., Zardetto-Smith, A.M., & Johnson, A.K. (1998) Fos expression in rat brain during depletion-induced thirst and salt appetite. Am. J. Physiol., 274, R1807-14.
Tobler, I. & Borbély, A.A. (1986) Sleep EEG in the rat as a function of prior waking. Electroencephalogr. Clin. Neurophysiol., 64, 74–76.
Tobler, I., Borbély, A.A., & Groos, G. (1983) The effect of sleep deprivation on sleep in rats with suprachiasmatic lesions. Neurosci. Lett., 42, 49–54.
Travagli, R.A. & Anselmi, L. (2016) Vagal neurocircuitry and its influence on gastric motility. Nat. Rev. Gastroenterol. Hepatol., 13, 389–401.
Tso, C.F., Simon, T., Greenlaw, A.C., Puri, T., Mieda, M., & Herzog, E.D. (2017) Astrocytes Regulate Daily Rhythms in the Suprachiasmatic Nucleus and Behavior. Curr. Biol., 27, 1055–1061.
Tynes, T., Hannevik, M., Andersen, A., Vistnes, A.I., & Haldorsen, T. (1996) Incidence of breast cancer in Norwegian female radio and telegraph operators. Cancer Causes Control, 7, 197–204.
Uhl, G.R. & Reppert, S.M. (1986) Suprachiasmatic nucleus vasopressin messenger RNA: circadian variation in normal and Brattleboro rats. Science, 232, 390–393.
Van Dongen, H.P.A., Belenky, G., & Krueger, J.M. (2011) A local, bottom-up perspective on sleep deprivation and neurobehavioral performance. Curr. Top. Med. Chem., 11, 2414–2422.
Van Erum, J., Van Dam, D., & De Deyn, P.P. (2018) Sleep and Alzheimer’s disease: A pivotal role for the suprachiasmatic nucleus. Sleep Med. Rev., 40, 17–27.
Vassalli, A. & Franken, P. (2017) Hypocretin (orexin) is critical in sustaining theta/gamma-rich waking behaviors that drive sleep need. Proc. Natl. Acad. Sci., 114, E5464–E5473.
Vertes, R.P. (2005) Hippocampal theta rhythm: A tag for short-term memory. Hippocampus, 15, 923–935.
Vyazovskiy, V. V., Cirelli, C., & Tononi, G. (2011) Electrophysiological correlates of sleep homeostasis in freely behaving rats. In Progress in Brain Research. pp. 17–38.
Vyazovskiy, V. V., Olcese, U., Hanlon, E.C., Nir, Y., Cirelli, C., & Tononi, G. (2011) Local sleep in awake rats. Nature, 472, 443–447.
Vyazovskiy, V. V. & Tobler, I. (2005) Theta activity in the waking EEG is a marker of sleep propensity in the rat. Brain Res., 1050, 64–71.
Vyazovskiy, V.V., Achermann, P., & Tobler, I. (2007) Sleep homeostasis in the rat in the light and dark period. Brain Res. Bull., 74, 37–44.
Vyazovskiy, V. V, Cirelli, C., Tononi, G., & Tobler, I. (2008) Cortical metabolic rates as measured by 2-deoxyglucose-uptake are increased after waking and decreased after sleep in mice. Brain Res. Bull., 75, 591–597.
Vyazovskiy, V. V, Deboer, T., Rudy, B., Lau, D., Borbély, A.A., & Tobler, I. (2002) Sleep EEG in mice that are deficient in the potassium channel subunit K.v.3.2. Brain Res., 947, 204–211.
RHYTHMS, SLEEP AND HOMEOSTASIS
198
Vyazovskiy, V. V, Palchykova, S., Achermann, P., Tobler, I., & Deboer, T. (2017) Different Effects of Sleep Deprivation and Torpor on EEG Slow-Wave Characteristics in Djungarian Hamsters. Cereb. Cortex, 27, 950–961.
Vyazovskiy, V. V, Walton, M.E., Peirson, S.N., & Bannerman, D.M. (2017) Sleep homeostasis, habits and habituation. Curr. Opin. Neurobiol., 44, 202–211.
Wakamatsu, H., Yoshinobu, Y., Aida, R., Moriya, T., Akiyama, M., & Shibata, S. (2001) Restricted-feeding-induced anticipatory activity rhythm is associated with a phase-shift of the expression of mPer1 and mPer2 mRNA in the cerebral cortex and hippocampus but not in the suprachiasmatic nucleus of mice. Eur. J. Neurosci., 13, 1190–1196.
Wang, D., He, X., Zhao, Z., Feng, Q., Lin, R., Sun, Y., Ding, T., Xu, F., Luo, M., & Zhan, C. (2015) Whole-brain mapping of the direct inputs and axonal projections of POMC and AgRP neurons. Front. Neuroanat., 9, 40.
Wang, D., Opperhuizen, A.-L., Reznick, J., Turner, N., Su, Y., Cooney, G.J., & Kalsbeek, A. (2017) Effects of feeding time on daily rhythms of neuropeptide and clock gene expression in the rat hypothalamus. Brain Res., 1671, 93–101.
Wang, Q.-P., Guan, J.-L., Pan, W., Kastin, A.J., & Shioda, S. (2008) A Diffusion Barrier Between the Area Postrema and Nucleus Tractus Solitarius. Neurochem. Res., 33, 2035–2043.
Washburn, D.L.S., Beedle, A.M., & Ferguson, A.V. (1999) Inhibition of subfornical organ neuronal potassium channels by vasopressin. Neuroscience, 93, 349–359.
Watanabe, E., Fujikawa, A., Matsunaga, H., Yasoshima, Y., Sako, N., Yamamoto, T., Saegusa, C., & Noda, M. (2000) Nav2/NaG channel is involved in control of salt-intake behavior in the CNS. J. Neurosci., 20, 7743–7751.
Watts, A.G., Swanson, L.W., & Sanchez-Watts, G. (1987) Efferent projections of the suprachiasmatic nucleus: I. Studies using anterograde transport ofPhaseolus vulgaris leucoagglutinin in the rat. J. Comp. Neurol., 258, 204–229.
Webb, A.B., Angelo, N., Huettner, J.E., & Herzog, E.D. (2009) Intrinsic, nondeterministic circadian rhythm generation in identified mammalian neurons. Proc. Natl. Acad. Sci., 106, 16493–16498.
Webb, I.C., Antle, M.C., & Mistlberger, R.E. (2014) Regulation of circadian rhythms in mammals by behavioral arousal. Behav. Neurosci., 128, 304–325.
Wefers, J., van Moorsel, D., Hansen, J., Connell, N.J., Havekes, B., Hoeks, J., van Marken Lichtenbelt, W.D., Duez, H., Phielix, E., Kalsbeek, A., Boekschoten, M. V., Hooiveld, G.J., Hesselink, M.K.C., Kersten, S., Staels, B., Scheer, F.A.J.L., & Schrauwen, P. (2018) Circadian misalignment induces fatty acid metabolism gene profiles and compromises insulin sensitivity in human skeletal muscle. Proc. Natl. Acad. Sci., 115, 7789–7794.
West, A.C., Smith, L., Ray, D.W., Loudon, A.S.I., Brown, T.M., & Bechtold, D.A. (2017) Misalignment with the external light environment drives metabolic and cardiac dysfunction. Nat. Commun., 8, 417.
Wiechmann, A.F., Ceresa, B.P., & Howard, E.W. (2014) Diurnal Variation of Tight Junction Integrity Associates Inversely with Matrix Metalloproteinase Expression in Xenopus laevis Corneal Epithelium: Implications for Circadian Regulation of Homeostatic Surface Cell Desquamation. PLoS One, 9, e113810.
Willing, A.E. & Berthoud, H.R. (1997) Gastric distension-induced c-fos expression in catecholaminergic neurons of rat dorsal vagal complex. Am. J. Physiol. Integr. Comp.

REBECCA NORTHEAST 199
Physiol., 272, R59–R67. Willie, J.T., Chemelli, R.M., Sinton, C.M., & Yanagisawa, M. (2001) To Eat or to Sleep?
Orexin in the Regulation of Feeding and Wakefulness. Annu. Rev. Neurosci., 24, 429–458.
Wisor, J.P., O’Hara, B.F., Terao, A., Selby, C.P., Kilduff, T.S., Sancar, A., Edgar, D.M., & Franken, P. (2002) A role for cryptochromes in sleep regulation. BMC Neurosci., 3, 20.
Wisor, J.P., Pasumarthi, R.K., Gerashchenko, D., Thompson, C.L., Pathak, S., Sancar, A., Franken, P., Lein, E.S., & Kilduff, T.S. (2008) Sleep Deprivation Effects on Circadian Clock Gene Expression in the Cerebral Cortex Parallel Electroencephalographic Differences among Mouse Strains. J. Neurosci., 28, 7193–7201.
Wittmann, M., Dinich, J., Merrow, M., & Roenneberg, T. (2006) Social Jetlag: Misalignment of Biological and Social Time. Chronobiol. Int., 23, 497–509.
Wu, M.F., Gulyani, S.A., Yau, E., Mignot, E., Phan, B., & Siegel, J.M. (1999) Locus coeruleus neurons: cessation of activity during cataplexy. Neuroscience, 91, 1389–1399.
Wu, Y., Masurat, F., Preis, J., & Bringmann, H. (2018) Sleep Counteracts Aging Phenotypes to Survive Starvation-Induced Developmental Arrest in C. elegans. Curr. Biol., 28, 3610–3624.e8.
Xie, L., Kang, H., Xu, Q., Chen, M.J., Liao, Y., Thiyagarajan, M., O’Donnell, J., Christensen, D.J., Nicholson, C., Iliff, J.J., Takano, T., Deane, R., & Nedergaard, M. (2013) Sleep Drives Metabolite Clearance from the Adult Brain. Science (80-. )., 342, 373–377.
Xie, Z., Su, W., Liu, S., Zhao, G., Esser, K., Schroder, E.A., Lefta, M., Stauss, H.M., Guo, Z., & Gong, M.C. (2015) Smooth-muscle BMAL1 participates in blood pressure circadian rhythm regulation. J. Clin. Invest., 125, 324–336.
Xue, B., Gole, H., Pamidimukkala, J., & Hay, M. (2003) Role of the area postrema in angiotensin II modulation of baroreflex control of heart rate in conscious mice. Am. J. Physiol. Circ. Physiol., 284, H1003–H1007.
Yamaguchi, S., Isejima, H., Matsuo, T., Okura, R., Yagita, K., Kobayashi, M., & Okamura, H. (2003) Synchronization of cellular clocks in the suprachiasmatic nucleus. Science, 302, 1408–1412.
Yamato, M., Ito, T., Iwatani, H., Yamato, M., Imai, E., & Rakugi, H. (2010) E-cadherin and claudin-4 expression has circadian rhythm in adult rat kidney. J. Nephrol., 23, 102–210.
Yamazaki, S., Numano, R., Abe, M., Hida, A., Takahashi, R., Ueda, M., Block, G.D., Sakaki, Y., Menaker, M., & Tei, H. (2000) Resetting central and peripheral circadian oscillators in transgenic rats. Science, 288, 682–685.
Yan, L., Karatsoreos, I., Lesauter, J., Welsh, D.K., Kay, S., Foley, D., & Silver, R. (2007) Exploring spatiotemporal organization of SCN circuits. Cold Spring Harb. Symp. Quant. Biol., 72, 527–541.
Yang, B. (2002) Orexin-A Depolarizes Nucleus Tractus Solitarius Neurons Through Effects on Nonselective Cationic and K+ Conductances. J. Neurophysiol., 89, 2167–2175.
Yang, B., Samson, W.K., & Ferguson, A. V (2003) Excitatory Effects of Orexin-A on Nucleus Tractus Solitarius Neurons Are Mediated by Phospholipase C and Protein Kinase C. J. Neurosci., 23, 6215–6222.
Yang, G., Chen, L., Grant, G.R., Paschos, G., Song, W.-L., Musiek, E.S., Lee, V., McLoughlin, S.C., Grosser, T., Cotsarelis, G., & FitzGerald, G.A. (2016) Timing of expression of the core clock gene Bmal1 influences its effects on aging and survival. Sci. Transl. Med.,

RHYTHMS, SLEEP AND HOMEOSTASIS
200
8, 324ra16-324ra16. Yang, N., Williams, J., Pekovic-Vaughan, V., Wang, P., Olabi, S., McConnell, J., Gossan, N.,
Hughes, A., Cheung, J., Streuli, C.H. & Meng, Q.-J.(2017) Cellular mechano-environment regulates the mammary circadian clock. Nat. Commun., 8, 14287.
Yoo, S.-H., Yamazaki, S., Lowrey, P.L., Shimomura, K., Ko, C.H., Buhr, E.D., Siepka, S.M., Hong, H.-K., Oh, W.J., Yoo, O.J., Menaker, M., & Takahashi, J.S. (2004) PERIOD2::LUCIFERASE real-time reporting of circadian dynamics reveals persistent circadian oscillations in mouse peripheral tissues. Proc. Natl. Acad. Sci. U. S. A., 101, 5339–5346.
Zhan, C. (2018) POMC Neurons: Feeding, Energy Metabolism, and Beyond. Springer, Singapore, pp. 17–29.
Zhan, C., Zhou, J., Feng, Q., Zhang, J., Lin, S., Bao, J., Wu, P., & Luo, M. (2013) Acute and Long-Term Suppression of Feeding Behavior by POMC Neurons in the Brainstem and Hypothalamus, Respectively. J. Neurosci., 33, 3624–3632.
Zhang, S.L., Yue, Z., Arnold, D.M., Artiushin, G., & Sehgal, A. (2018) A Circadian Clock in the Blood-Brain Barrier Regulates Xenobiotic Efflux. Cell, 173, 130–139.e10.
Zhang, Y., Kerman, I.A., Laque, A., Nguyen, P., Faouzi, M., Louis, G.W., Jones, J.C., Rhodes, C., & Munzberg, H. (2011) Leptin-Receptor-Expressing Neurons in the Dorsomedial Hypothalamus and Median Preoptic Area Regulate Sympathetic Brown Adipose Tissue Circuits. J. Neurosci., 31, 1873–1884.
Zhao, H. & Rusak, B. (2005) Circadian firing-rate rhythms and light responses of rat habenular nucleus neurons in vivo and in vitro. Neuroscience, 132, 519–528.
Zheng, H., Patterson, L.M., & Berthoud, H.-R. (2005) Orexin-A projections to the caudal medulla and orexin-induced c-Fos expression, food intake, and autonomic function. J. Comp. Neurol., 485, 127–142.
Zheng, H., Patterson, L.M., Rhodes, C.J., Louis, G.W., Skibicka, K.P., Grill, H.J., Myers, M.G., Berthoud, H.-R., & Berthoud, H.-R. (2010) A potential role for hypothalamomedullary POMC projections in leptin-induced suppression of food intake. Am. J. Physiol. Regul. Integr. Comp. Physiol., 298, R720-8.
Zhou, D., Shen, Z., Strack, A.M., Marsh, D.J., & Shearman, L.P. (2005) Enhanced running wheel activity of both Mch1r- and Pmch-deficient mice. Regul. Pept., 124, 53–63.
Zhou, Y.D., Barnard, M., Tian, H., Li, X., Ring, H.Z., Francke, U., Shelton, J., Richardson, J., Russell, D.W., & McKnight, S.L. (1997) Molecular characterization of two mammalian bHLH-PAS domain proteins selectively expressed in the central nervous system. Proc. Natl. Acad. Sci. U. S. A., 94, 713–718.
Zimmerman, C.A., Leib, D.E., & Knight, Z.A. (2017) Neural circuits underlying thirst and fluid homeostasis. Nat. Rev. Neurosci., 18, 459–469.
Zimmerman, C.A., Lin, Y.-C., Leib, D.E., Guo, L., Huey, E.L., Daly, G.E., Chen, Y., & Knight, Z.A. (2016) Thirst neurons anticipate the homeostatic consequences of eating and drinking. Nature, 537, 680–684.


