Embed Size (px)
Citation preview

A study of soil to geotextile filtration behaviourin conjunction with Berea sand in South Africa
March 2014
Supervisor: Dr M. De Wet
Department of Civil Engineering
Thesis presented in partial fulfilment of the requirements for the degree
Master of Science in Engineering in the Faculty of Engineering at
Stellenbosch University
Justin Sidney November
A study of soil to geotextile filtration behaviourin conjunction with Berea sand in South Africa
April 2014
Supervisor: Dr M. De Wet
Department of Civil Engineering
Thesis presented in partial fulfilment of the requirements for the degree
Master of Science in Engineering in the Faculty of Engineering at
Stellenbosch University
Justin Sidney November
A study of soil to geotextile filtration behaviourin conjunction with Berea sand in South Africa
March 2014
Supervisor: Dr M. De Wet
Department of Civil Engineering
Thesis presented in partial fulfilment of the requirements for the degree
Master of Science in Engineering in the Faculty of Engineering at
Stellenbosch University
Justin Sidney November

ii
DECLARATION
By submitting this dissertation electronically, I declare that the entirety of the work contained
therein is my own, original work, that I am the owner of the copyright thereof (unless to the
extent explicitly otherwise stated) that reproduction and publication thereof by Stellenbosch
University will not infringe any third party rights and that I have not previously in its entirety or
in part submitted it for obtaining any qualification.
Justin Sidney November.
March 2014
Copyright © 2014 Stellenbosch University
All rights reserved
Stellenbosch University http://scholar.sun.ac.za

iii
ABSTRACT
Geotextiles perform a number of functions in various applications in civil engineering
practise. It is often cost effective and more environmentally friendly versus conventional
construction methods. One of the main functions of a geotextile is filtration whereby the
geotextile is expected to hold back the soil particles and simultaneously has to allow
sufficient water to pass through it. Soils are all different and can be problematic when it
comes to designing geotextile filters. One such problematic soil is encountered in KwaZulu-
Natal, situated along the east coast of South Africa. The Berea sand is problematic as it can
highly variable in its engineering properties over a small area.
Geotextiles are becoming more and more common practice in South Africa and little is
known about the filtration performance of commercially available geotextiles in conjunction
with Berea sand. Local guidelines that are available are out of date and do not provide
enough information to assist design engineers in decision making. Many international
guidelines are available and it is difficult to choose which one is best suited to Berea sands.
This primary objective of this study is to investigate the filtration performance of four variants
of commercially available geotextiles and three variants of Berea sand. The applicability of
some of the international filter design criteria will also be assessed. The soil to geotextile
compatibility testing was carried out as per ASTM D5101 (2006) - Standard Test Method for
Measuring the Soil-Geotextile System Clogging Potential by the Gradient Ratio. In total 12
permutations were executed. The results showed that only 5 test permutations met the
gradient ratio and permeability criteria. The test results also conclude that the permeability is
just as important as the gradient ratio. Thick geotextiles should be considered when used as
filters in Berea sands. The available international geotextile filter design criteria were
assessed and all showed poor correlation between laboratory results and suggested criteria.
Designing geotextile filters in conjunction with Berea reds is challenging and it is
recommended that design engineers perform laboratory performance testing in conjunction
with their designs
.
Stellenbosch University http://scholar.sun.ac.za

iv
OPSOMMING
Geotekstiele verrig vir 'n aantal funksies in verskeie programme in die siviele
ingenieurswese praktyk. Dit is dikwels meer koste-effektief en omgewingsvriendelik, teenoor
konvensionele konstruksie metodes. Een van die belangrikste funksies van 'n geotekstiel is
filtrasie, waardeur van die geotekstiel verwag word om van die grond terug te hou, en
gelyktydig genoeg water daardeur te laat vloei. Grond verskil en dit kan problematies wees
wanneer dit kom by die ontwerp van geotekstiel filters. Een so ‘n problematiese grond kom
voor in KwaZulu-Natal, geleë langs die ooskus van Suid-Afrika. (Die) Berea sand is
problematies, want dit verander geweldig baie ten opsigte van ingenieurseienskappe oor 'n
redelike klein area. Gebruik van geotekstiele word al hoe meer ‘n algemene praktyk in Suid-
Afrika, terwyl min bekend is oor die filtrasie prestasie van kommersieel beskikbare
geotekstiele in samewerking met Berea sand.
Plaaslike riglyne wat beskikbaar is, is verouderd en onvoldoende inligting is beskikbaar aan
ontwerpingenieurs vir besluitneming . Baie internasionale riglyne is beskikbaar en dit is
moeilik om te besluit watter een die beste van toepassing is vir Berea sand. Die doel van
hierdie studie is om die filtrasie prestasie van vier modelle van kommersieël beskikbare
geotekstiele en voorbeelde van drie soorte Berea sand te ondersoek. Die toepaslikheid van
'n paar van die internasionale filter ontwerp kriteria sal ook beoordeel word. Die toetsing van
grondverenigbaarheid met geotekstiel is uitgevoer soos aangedui in ASTM D5101 (2006 ) –
Standaard Toets Metode vir die meet van die grond-Geotekstiel verstopping potensiëel deur
die gradient verhouding. In totaal is 12 permutasies uitgevoer. Die resultate het getoon dat
slegs 5 toetspermutasies beide gradiënt verhouding en permeabiliteit kriteria bevredig het.
Dikker geotekstiele word ook aanbeveel vir gebruik as filters in Berea sand. Van die toets
resultate kan ook afgelei word dat die permeabiliteit net so belangrik soos die gradiënt
verhouding is. Beskikbare internasionalegeotekstiel filter ontwerp kriteria is nagegaan en al
die metodes het swak korrelasie tussen laboratorium resultate en die voorgestelde kriteria
getoon.
Om geotekstiel filters in samewerking met Berea Reds te ontwerp is 'n uitdaging en dit word
aanbeveel dat ontwerpingenieurs laboratorium prestasietoetsing in samewerking met hul
ontwerpe uitvoer.
Stellenbosch University http://scholar.sun.ac.za

v
ACKNOWLEDGEMENTS
It would not have been possible to complete this thesis without the support of others. I
therefore would like to express thanks and gratitude to the following people and institutions:
1. Mr. Prakash Julal and Mr. Moses Pillay of Geolaboratory for assisting with the
testing.
2. My supervisor, Dr Marius de Wet, for his patience and guidance throughout this
study.
3. Kaymac (Pty) Ltd t/a Kaytech, for their financial assistance during this study, as well
as for providing access to library resources.
4. Messrs SOILCO (Pty) Ltd for their assistance with soil sampling and testing.
5. My parents, who made all this possible.
6. My wife, Chereé, for her love and support during this study.
Stellenbosch University http://scholar.sun.ac.za

vi
TABLE OF CONTENTS
DECLARATION.........................................................................................................ii
ABSTRACT ..............................................................................................................iii
OPSOMMING ...........................................................................................................iv
ACKNOWLEDGEMENTS..........................................................................................v
LIST OF FIGURES ..................................................................................................xii
LIST OF TABLES...................................................................................................xvi
LIST OF SYMBOLS................................................................................................xix
LIST OF ABBREVIATIONS....................................................................................xxi
Chapter 1 - Introduction ..........................................................................................1
1.1 General ..........................................................................................................1
1.2 Scope of Study ...............................................................................................3
1.3 Dissertation Structure .....................................................................................3
1.4 Aims and Objectives.......................................................................................4
Chapter 2 – Review of Geotextiles and Filtration Theory......................................5
2.1 Introduction ....................................................................................................5
2.2 Geotextiles .....................................................................................................5
2.3 Polymers ........................................................................................................6
2.4 Manufacturing techniques...............................................................................6
2.5 History ............................................................................................................8
2.6 Characteristics of woven and nonwoven geotextiles.......................................9
2.6.1 Thickness .....................................................................................................10
2.6.2 Elongation ....................................................................................................11
2.7 Geotextiles as filtration fabrics.....................................................................11
2.7.1 Roadside subsurface drain ...........................................................................12
2.7.2 Drainage in railway construction ................................................................13
Stellenbosch University http://scholar.sun.ac.za

vii
2.7.3 Drainage of embankment dams....................................................................14
2.7.4 Gabion structures .........................................................................................15
2.7.5 Sports field drainage.....................................................................................15
2.7.6 Drainage in tailings dams .............................................................................16
2.8 Geotextile filtration mechanisms...................................................................16
2.8.1 Geotextile to soil contact ............................................................................16
2.8.2 Particles in suspension................................................................................18
2.8.3 Soil particles migration under cyclic loads ....................................................19
2.10 Further developments for geotextile filters ....................................................19
2.11 Permeability criterion ....................................................................................20
2.11.1 Pore pressure requirement .......................................................................20
2.11.2 The flow rate requirement ..........................................................................22
2.11.3 Comparison of the two requirements (Giroud 2010):..................................23
2.12 Retention criterion ........................................................................................25
2.12.1 Retention modes........................................................................................26
2.12.2 Size of soil skeletal particles ......................................................................29
2.12.3 Maximum allowable geotextile filter opening size.......................................30
2.13 Porosity Criterion..........................................................................................32
2.14 Thickness criterion........................................................................................33
2.15 Modes of failure............................................................................................35
2.15.1 Base soil failure .........................................................................................35
2.15.2 Physical Clogging ......................................................................................37
2.15.3 Biological clogging due to permeating fluid.............................................38
2.15.4 Stress levels ..............................................................................................39
2.15.5 Type of contact ..........................................................................................40
2.16 Long term durability of geotextiles ................................................................40
2.16.1 Mechanical degradation.............................................................................41
2.16.2 Microbiological degradation .......................................................................41
Stellenbosch University http://scholar.sun.ac.za

viii
2.16.3 Chemical degradation ................................................................................41
2.16.4 Environmental degradation ........................................................................42
2.17 Tests on exhumed samples..........................................................................43
2.18 Installation considerations ............................................................................44
2.19 Evaluation of drainage severity.....................................................................44
2.20 International geotextile filter design criteria...................................................45
2.21 Regional geotextile filter design criteria ........................................................46
2.21.1 Dutch practice (after N.W.M. John, 1989): .................................................46
2.21.2 German Practice (after NWM John, 1989): ...............................................47
2.21.3 American Practice (after N.W.M. John, 1989): ...........................................47
2.21.3 French Practice (after N.W.M. John, 1989): ...............................................48
2.21.4 English Practice (N.W.M. John, 1989):.......................................................49
2.22 AASHTO M288 geotextile criteria .................................................................52
2.23 South African design guidelines ...................................................................53
2.25 Conclusion ...................................................................................................55
Chapter 3 - Method.................................................................................................57
3.1 Introduction ..................................................................................................57
3.2 Research design ..........................................................................................57
3.3 Testing facilities............................................................................................57
3.4 Test material engineering properties ............................................................59
3.4.1 Geotextile properties ....................................................................................59
3.4.2 Soil properties............................................................................................62
3.5 Test description ............................................................................................64
3.6 Test setup and preparation...........................................................................64
3.7 Testing .........................................................................................................69
3.8 Interpretation of the gradient ratio.................................................................71
3.9 Permeability..................................................................................................72
3.10 Constrictions.................................................................................................72
Stellenbosch University http://scholar.sun.ac.za

ix
3.11 Desktop computer analysis...........................................................................73
3.12 Microscope Imaging .....................................................................................74
3.13 Limitations ....................................................................................................75
3.13.1 Applied vertical stress.............................................................................75
3.13.2 Hydraulic gradient......................................................................................75
3.13.3 Algae and iron oxide suppressants.........................................................75
3.13.4 Soil samples ..............................................................................................75
3.14 Conclusion ...................................................................................................75
Chapter 4 - Test Results ........................................................................................77
4.1 Introduction ..................................................................................................77
4.2 Non-plastic sand vs. NW-N-CF-PET geotextile: Test No. 1 ..........................79
4.3 Non-plastic sand vs. NW-N-SF-PP geotextile: Test No. 2.............................81
4.4 Non- plastic sand vs. with NW-HB-CF-PP geotextile: Test No. 3 ..................84
4.5 Non-plastic sand vs. with W-SLF-PP geotextile: Test No. 4..........................87
4.6 Sand with plasticity index of 7 vs. NW-N-CF-PET geotextile: Test No. 5 ......90
4.7 Sand with plasticity index of 7 vs. NW-N-SF-PP geotextile: Test No. 6........94
4.8 Sand with plasticity index of 7 vs. with NW-HB-CF-PP geotextile: Test no. 797
4.9 Sand with plasticity index of 7 vs. with W-SLF-PP geotextile: Test No. 8....101
4.10 Non plastic sand (2) vs. with NW-N-CF-PET geotextile: Test No. 9 ............105
4.11 Non plastic sand (2) vs. with NW-N-SF-PP geotextile: Test No. 10 ............108
4.12 Non plastic sand (2) vs. with NW-HB-CF-PP geotextile: Test No. 11..........111
4.13 Non plastic sand (2) vs. with W-SLF-PP geotextile: Test No. 12.................114
4.16 Micro electroscopic images ........................................................................117
4.17 Computer spreadsheet ...............................................................................125
4.17.1 Trapezoidal Tear......................................................................................126
4.17.2 CBR.........................................................................................................126
4.17.3 Dart test ...................................................................................................126
4.17.4 Tensile strength .......................................................................................127
Stellenbosch University http://scholar.sun.ac.za

x
4.17.5 Permeability .............................................................................................127
4.17.6 Pore size..................................................................................................127
4.18 Conclusion .................................................................................................128
Chapter 5 - Analysis.............................................................................................129
5.1 Introduction ................................................................................................129
5.2 Soil internal stability and co-efficient of uniformity.......................................129
5.3 Number of constrictions.............................................................................130
5.4 System permeability vs. soil to geotextile permeability ...............................130
5.4.1 Tests 1-4..................................................................................................131
5.4.2 Tests 5 – 8 .................................................................................................132
5.4.3 Tests 9 – 12................................................................................................133
5.5 Summary of gradient ratios vs. time ...........................................................133
5.5.1 Test numbers 1 - 4 .....................................................................................133
5.5.2 Tests numbers 5 – 8...................................................................................137
5.5.3 Test numbers 9-12 .....................................................................................141
5.6 Evaluation of geotextile filter design criteria................................................143
5.6.1 SABS 1200.................................................................................................143
5.6.2 COLTO: 1988.............................................................................................144
5.6.3 AASHTO M288...........................................................................................144
5.6.4 Dutch practice ............................................................................................147
5.6.5 German practice.........................................................................................149
5.6.6 American practice.......................................................................................151
5.6.7 French practice...........................................................................................154
5.6.8 Luettich et al. design chart..........................................................................157
5.8 Computer program .....................................................................................160
5.7 Fine soil fraction analysis............................................................................161
5.8 Discussion of results...................................................................................163
5.8.1 Geotextiles .................................................................................................163
Stellenbosch University http://scholar.sun.ac.za

xi
5.8.2 Soil to geotextile interaction........................................................................163
5.8.2 Failure mechanisms ...................................................................................164
5.8.3 Soil properties ............................................................................................164
5.8.4 Regional filter criteria..................................................................................164
5.8.5 Computer results ........................................................................................165
6 Conclusions and Recommendations..........................................................166
6.1 Introduction ................................................................................................166
6.2 Filter design criteria ....................................................................................167
6.3 Recommendations for further studies .........................................................167
REFERENCES ......................................................................................................168
APPENDIX A – Soil grading analysis..................................................................172
APPENDIX B – Calculated soil parameters ........................................................174
Stellenbosch University http://scholar.sun.ac.za
xii
LIST OF FIGURES
FIGURE 2.1: A) NONWOVEN NEEDLE PUNCHED............................................................................
B) WOVEN SLIT FILM GEOTEXTILE ............................................................................
....................................................................................... 7
FIGURE 2.2: 100 X MAGNIFICATION OF NONWOVEN (KAYTECH) .................................................. 7
FIGURE 2.3: 100 X MAGNIFICATION OF WOVEN GEOTEXTILE (KAYTECH)...................................... 8
FIGURE 2.4: NATURAL FILTER FORMATION WITHOUT GEOTEXTILE (KAYTECH).............................. 9
FIGURE 2.5: SOIL TO GEOTEXTILE SYSTEM FOR NONWOVEN GEOTEXTILE (KAYTECH) .................. 9
FIGURE 2.6: SOIL TO GEOTEXTILE SYSTEM FOR WOVEN GEOTEXTILES (KAYTECH)..................... 10
FIGURE 2.7 GEOTEXTILE ACTS AS A FILTER IN SUBSURFACE DRAINAGE APPLICATION ALONGSIDE A
ROAD (KAYTECH) ........................................................................................................... 13
FIGURE 2.8: GEOTEXTILE AS A FILTER MEDIUM UNDER AND NEXT TO RAILWAY .......................... 13
FIGURE 2.9: GEOTEXTILE FILTER UNDER UPSTREAM RIP RAP, IN ADJACENT CHIMNEY-AND
DOWNSTREAM DRAINS FOR EARTH FILL DAM (KAYTECH) ................................................... 14
FIGURE 2.10: GEOTEXTILE FILTER UNDER RIP RAP SCOUR PROTECTION (KAYTECH).................. 14
FIGURE 2.11: GEOTEXTILE AS A FILTER BEHIND GABION AND GABION MATTRESSES (KAYTECH).. 15
FIGURE 2.12: GEOTEXTILE PERFORMING AS A FILTER UNDER SPORTS FIELD DRAINAGE (KAYTECH)
.................................................................................................................................... 15
FIGURE 2.13: GEOTEXTILE USED AS A FILTER MEDIUM BELOW THE TOE DRAIN OF TAILINGS DAM
(KAYTECH) .................................................................................................................... 16
FIGURE 2.14: UPSTREAM SOIL PARTICLES FORMING VAULTS OR ARCHES OVER GEOTEXTILE
OPENINGS (AFTER MCGOWN 1985) ................................................................................ 18
FIGURE 2.15: PRESSURE DIAGRAM SHOWING PORE WATER PRESSURE WITH DEPTH AND NO
GEOTEXTILE PRESENT (GIROUD 2010) ............................................................................ 20
FIGURE 2.16: INITIAL BUILD-UP OF EXCESS PORE WATER PRESSURE WHERE GEOTEXTILE IS
PRESENT (GIROUD, 2010) .............................................................................................. 21
FIGURE 2.17: EQUILIBRIUM FLOW CONDITIONS WITH GEOTEXTILE PRESENT (GIROUD, 2010) ..... 21
FIGURE 2.18 SHAPE CURVES OF STABLE AND UNSTABLE GRADINGS (KENNEY AND LAU, 1984) .. 28
FIGURE 2.19: EQUILIBRIUM SOIL CONDITIONS FOLLOWING FORMATION OF A SOIL FILTER (LAWSON,
1982) ........................................................................................................................... 29
FIGURE 2.20: SCHEMATIC REPRESENTATION OF SOIL WITH CU EQUAL TO OR LESS THAN 3
(GIROUD, 2010) ............................................................................................................ 29
FIGURE 2.21: SCHEMATIC REPRESENTATION OF SOIL WITH A CO-EFFICIENT OF UNIFORMITY ABOVE
3 .................................................................................................................................. 30
Stellenbosch University http://scholar.sun.ac.za

xiii
FIGURE 2.22: SCHEMATIC REPRESENTATION OF A LOOSE SOIL BY A CUBIC ARRANGEMENT
(GIROUD, 2010) ............................................................................................................ 30
FIGURE 2.23: SCHEMATIC REPRESENTATION OF A DENSE SOIL BY A HEXAGONAL ARRANGEMENT
(GIROUD, 2010) ............................................................................................................ 31
FIGURE 2.24: SOIL PARTICLES PASSING THROUGH A CONSTRICTION (KENNY AND LAU 1985)..... 34
FIGURE 2.25: SCHEMATIC CROSS SECTION OF A NONWOVEN GEOTEXTILE (KENNY AND LAU, 1985)
.................................................................................................................................... 34
FIGURE 2.26: ZONE OF THE GRAPH WITH MORE THAN 25 CONSTRICTIONS (KENNY AND LAU, 1985)
.................................................................................................................................... 35
FIGURE 2.27: CAKED LAYERS OF FINE PARTICLES BLIND A NONWOVEN GEOTEXTILE (MCGOWN,
1982) ........................................................................................................................... 36
FIGURE 2.28: CAKE FORMING ON A NONWOVEN GEOTEXTILE ALSO KNOWN AS BLINDING
(KAYTECH) .................................................................................................................... 36
FIGURE 2.29: SOIL PARTICLES BLOCKING AND REDUCING THE PORE OPENINGS OF A WOVEN
GEOTEXTILE .................................................................................................................. 36
FIGURE 2.30: WOVEN GEOTEXTILE SHOWING OPENINGS BEING BLOCKED BY SOIL PARTICLES
(COURTESY: KAYTECH).................................................................................................. 37
FIGURE 2.31: GEOTEXTILE CLOGGING (HOARE, 1982) ............................................................ 37
FIGURE 2.32: FERRIC OXIDE (BIOLOGICAL) CLOGGING OF A NONWOVEN GEOTEXTILE ................ 38
FIGURE 3.1: LTGRT APPARATUS: ASTM D5101-01 ............................................................... 58
FIGURE 3.2: LONG TERM GRADIENT RATIO TEST APPARATUS (GEOLABORATORY, DURBAN) ....... 59
FIGURE 3.3 GRADING ANALYSIS OF BEREA SANDS .................................................................. 63
FIGURE 3.4: BEREA SOIL SAMPLE WITH CANDIDATE GEOTEXTILES CUT INTO DISCS (AUTHOR) .... 65
FIGURE 3.5: STEEL SUPPORT SCREEN SITUATED IN BASE PIECE (AUTHOR) ............................... 65
FIGURE 3.6: GEOTEXTILE SPECIMEN PLACED ON TOP OF STEEL SCREEN ON BASE (AUTHOR) ..... 66
FIGURE 3.7: PERMEAMETER READY TO RECEIVE SOIL SAMPLE AND TOP COVER ........................ 67
FIGURE 3.8: LTGRT FLOW DIAGRAM...................................................................................... 68
FIGURE 3.9 TYPICAL TESTING AT GEOLABORATORY ................................................................ 69
FIGURE 3.10: VALUES FOR CALCULATING GRADIENT RATIOS (ASTM D5101)............................ 71
FIGURE 3.11: FLOW CHART FOR COMPUTER SPREADSHEET (KAYTECH).................................... 73
FIGURE 3.12: SOIL ZONE CLASSIFICATION (LUETTICH ET AL. 1992) .......................................... 74
FIGURE: 4.1: REFERENCE DIAGRAM ILLUSTRATING STANDPIPE NUMBERS ON THE LTGRT TEST
APPARATUS ................................................................................................................... 78
FIGURE 4.2: PERMEABILITY VS. TIME OF ENTIRE SYSTEM: TEST NO. 1 ....................................... 80
FIGURE 4.3: PERMEABILITY ANALYSES BETWEEN STANDPIPES 4-5; 5-6 AND 6-7: TEST NO. 1 ..... 80
Stellenbosch University http://scholar.sun.ac.za

xiv
FIGURE 4.4: GRADIENT RATIO VS. TIME: TEST NO. 1 ................................................................ 81
FIGURE 4.5 PERMEABILITY VS. TIME OF ENTIRE SYSTEM: TEST NO. 2........................................ 83
FIGURE 4.6 PERMEABILITY VS. TIME ACROSS STANDPIPES 4-5; 5-6 AND 6-7: TEST NO. 2........... 83
FIGURE 4.7 GRADIENT RATIOS VS. TIME: TEST NO. 2 .............................................................. 84
FIGURE 4.8: PERMEABILITY VS. TIME OF ENTIRE SYSTEM: TEST NO. 3....................................... 86
FIGURE 4.9: PERMEABILITY VS. TIME ACROSS STANDPIPES 4-5; 5-6 AND 6-7: TEST NO. 3 .......... 86
FIGURE 4.10: GRADIENT RATIO VS. TIME: TEST NO. 3 .............................................................. 87
FIGURE 4.11: PERMEABILITY VS. TIME OF ENTIRE SYSTEM: TEST NO. 4..................................... 89
FIGURE 4.12: PERMEABILITY VS. TIME ACROSS STANDPIPES 4-5; 5-6 AND 6-7: TEST NO. 4 ........ 89
FIGURE 4.13: GRADIENT RATIO VS. TIME: TEST NO. 4 .............................................................. 90
FIGURE 4.14: PERMEABILITY VS. TIME OF ENTIRE SYSTEM: TEST NO. 5..................................... 92
FIGURE 4.15: PERMEABILITY VS. TIME ACROSS STANDPIPES 4-5; 5-6 AND 6-7: TEST NO. 5 ........ 93
FIGURE 4.16: GRADIENT RATIO VS. TIME: TEST NO. 5 .............................................................. 93
FIGURE 4.17: PERMEABILITY VS. TIME OF ENTIRE SYSTEM: TEST NO. 6..................................... 96
FIGURE 4.18: PERMEABILITY VS. TIME ACROSS STANDPIPES 4-5; 5-6 AND 6-7: TEST NO. 6 ........ 96
FIGURE 4.19: GRADIENT RATIO VS. TIME: TEST NO. 6 .............................................................. 97
FIGURE 4.20: PERMEABILITY VS. TIME OF ENTIRE SYSTEM: TEST NO. 7................................... 100
FIGURE 4.21: PERMEABILITY VS. TIME ACROSS STANDPIPES 4-5; 5-6 AND 6-7: TEST NO. 7 ...... 100
FIGURE 4.22: GRADIENT RATIO VS. TIME: TEST NO. 7 ............................................................ 101
FIGURE 4.23: PERMEABILITY VS. TIME OF ENTIRE SYSTEM: TEST NO. 8................................... 104
FIGURE 4.24: PERMEABILITY VS. TIME ACROSS STANDPIPES 4-5; 5-6 AND 6-7: TEST NO. 8 ...... 104
FIGURE 4.25: GRADIENT RATIO VS. TIME: TEST NO. 8 ............................................................ 105
FIGURE 4.26: PERMEABILITY VS. TIME OF ENTIRE SYSTEM: TEST NO. 9................................... 107
FIGURE 4.27: PERMEABILITY VS. TIME ACROSS STANDPIPES 4-5; 5-6 AND 6-7: TEST NO. 9 ...... 107
FIGURE 4.28: GRADIENT RATIO VS. TIME: TEST NO. 9 ............................................................ 108
FIGURE 4.29: PERMEABILITY VS. TIME OF ENTIRE SYSTEM: TEST NO. 10................................. 110
FIGURE 4.30: PERMEABILITY VS. TIME ACROSS STANDPIPES 4-5; 5-6 AND 6-7: TEST NO. 10 .... 110
FIGURE 4.31: GRADIENT RATIO VS. TIME: TEST NO. 10 .......................................................... 111
FIGURE 4.32: PERMEABILITY VS. TIME OF ENTIRE SYSTEM: TEST NO. 11................................. 113
FIGURE 4.33: PERMEABILITY VS. TIME ACROSS STANDPIPES 4-5; 5-6 AND 6-7: TEST NO. 11 .... 113
FIGURE 4.34: GRADIENT RATIO VS. TIME: TEST NO 11 ........................................................... 114
FIGURE 4.35: PERMEABILITY VS. TIME OF ENTIRE SYSTEM: TEST NO. 12................................. 116
FIGURE 4.36: PERMEABILITY VS. TIME ACROSS STANDPIPES 4-5; 5-6 AND 6-7: TEST NO. 12 .... 116
FIGURE 4.37: GRADIENT RATIO VS. TIME: TEST NO 12 ........................................................... 117
FIGURE 4.38: ELECTRO MICROSCOPIC IMAGES OF THE GEOTEXTILES BEFORE TESTS: ............. 118
Stellenbosch University http://scholar.sun.ac.za

xv
FIGURE 4.39: POST-TEST PHOTOGRAPHIC IMAGES OF GEOTEXTILES: TESTS 1-4 ..................... 119
FIGURE 4.40: POST-TEST MICROSCOPIC IMAGES OF GEOTEXTILES AT 100 X MAGNIFICATION:
TESTS 1-4 ................................................................................................................... 120
FIGURE 4.41: POST-TEST PHOTOGRAPHIC IMAGES OF GEOTEXTILES: TESTS 5-8 ..................... 121
FIGURE 4.42: POST-TEST MICROSCOPIC IMAGES OF GEOTEXTILES AT 100X MAGNIFICATION:
TESTS 5-8 ................................................................................................................... 122
FIGURE 4.43: POST-TEST PHOTOGRAPHIC IMAGES OF GEOTEXTILES: TESTS 9-12 ................... 123
FIGURE 4.44: POST-TEST MICROSCOPIC IMAGES OF GEOTEXTILES AT 100X MAGNIFICATION:
TESTS 9-12 ................................................................................................................. 124
FIGURE 4.45: INPUT PARAMETERS FOR COMPUTER SPREADSHEET......................................... 125
FIGURE 5.1: GEOTEXTILE FILTER DESIGN CHART (AFTER LUETTICH ET AL. 1992) .................... 157
FIGURE 5.2: FLOWCHART FOR COMPUTER SPREADSHEET (KAYTECH) .................................... 160
Stellenbosch University http://scholar.sun.ac.za

xvi
LIST OF TABLES
TABLE 1.1: THESIS FORMAT..................................................................................................... 3
TABLE 2.1: HYDRAULIC GRADIENT AS MEASURED WITHIN THE SOIL (GIROUD, 2010) .................. 22
TABLE 2.2 REVIEW OF MAIN PERMEABILITY CRITERIA IN UNIDIRECTIONAL FLOW CONDITIONS
(MORACI, 2008) ............................................................................................................ 23
TABLE 2.3 CHEMICAL AND THERMAL STABILITY OF SYNTHETIC FIBERS USED IN THE MANUFACTURE
OF GEOTEXTILES (.......................................................................................................... 42
TABLE 2.4: GUIDELINES FOR EVALUATING THE CRITICAL NATURE OR SEVERITY OF A DRAINAGE
APPLICATION ................................................................................................................. 45
TABLE 2.4: RETENTION CRITERIA BASED ON PREVIOUS RESEARCH........................................... 46
TABLE 2.5: GERMAN PRACTICE IN TERMS OF GEOTEXTILE FILTER CRITERIA (NWM JOHN, 1989) 47
TABLE 2.6: AMERICAN PRACTICE IN TERMS OF GEOTEXTILE FILTER CRITERIA (NWM JOHN, 1989)
.................................................................................................................................... 47
TABLE 2.7: FRENCH PRACTICE IN TERMS OF GEOTEXTILE FILTER CRITERIA (NWM JOHN, 1989). 48
TABLE 2.8: ENGLISH PRACTICE IN TERMS OF GEOTEXTILE FILTER CRITERIA (NWM JOHN, 1989) 49
TABLE 2.9: GEOTEXTILE FILTER CRITERIA UNDER UNI-DIRECTIONAL FLOW CONDITIONS ............. 50
TABLE 2.10: SURVIVABILITY STRENGTH REQUIREMENTS .......................................................... 51
TABLE 2.11: GEOTEXTILE STRENGTH REQUIREMENTS ............................................................. 53
TABLE 2.12: SUBSURFACE DRAINAGE GEOTEXTILE REQUIREMENT ........................................... 53
TABLE 2.14: GEOTEXTILE CLASSIFICATION FOR DRAINAGE AND FILTRATION .............................. 55
(COLTO, 1988) ................................................................................................................... 55
TABLE 3.1: GEOTEXTILE SPECIFICATIONS AS ON MANUFACTURER’S DATA SHEETS..................... 61
TABLE 3.2 SUMMARY OF PARAMETERS OF BEREA SANDS ........................................................ 63
TABLE 3.3: DX OF ALL THE SOIL SAMPLES ................................................................................ 63
TABLE 3.3: GENERIC GEOTEXTILE FILTER SPECIFICATION (KAYTECH) ....................................... 74
TABLE 4.1: SUMMARY OF SOIL TO GEOTEXTILE TESTS PERFORMED .......................................... 77
TABLE 4.2: SOIL TO GEOTEXTILE PERMEABILITY AND STANDPIPE READINGS VS. TIME FOR TEST NO.
1 .................................................................................................................................. 79
TABLE 4.3: SUMMARY OF SOIL TO GEOTEXTILE PERMEABILITY AND STANDPIPE READINGS VS. TIME:
TEST NO. 2.................................................................................................................... 82
TABLE 4.4: SUMMARY OF SOIL TO GEOTEXTILE PERMEABILITY AND STANDPIPE READINGS VS.
TIME: TEST NO. 3 ........................................................................................................... 85
TABLE: 4.5 SUMMARY OF SOIL TO GEOTEXTILE PERMEABILITY AND STANDPIPE READINGS VS. TIME:
TEST NO. 4.................................................................................................................... 88
Stellenbosch University http://scholar.sun.ac.za

xvii
TABLE: 4.6 SUMMARY OF SOIL TO GEOTEXTILE PERMEABILITY AND STANDPIPE READINGS VS. TIME:
TEST............................................................................................................................. 91
TABLE: 4.7 SUMMARY OF SOIL TO GEOTEXTILE PERMEABILITY AND STANDPIPE READINGS VS. TIME:
TEST NO. 6.................................................................................................................... 94
TABLE: 4.8 SUMMARY OF SOIL TO GEOTEXTILE PERMEABILITY AND STANDPIPE READINGS VS. TIME:
TEST NO. 7.................................................................................................................... 98
TABLE 4.9: SOIL TO GEOTEXTILE PERMEABILITY AND STANDPIPE READINGS VS. TIME: TEST NO. 8
.................................................................................................................................. 102
TABLE 4.10: SOIL TO GEOTEXTILE PERMEABILITY AND STANDPIPE READINGS VS. TIME: TEST NO. 9
.................................................................................................................................. 106
TABLE 4.11: SOIL TO GEOTEXTILE PERMEABILITY AND STANDPIPE READINGS VS. TIME: TEST NO.
10 .............................................................................................................................. 109
TABLE 4.12: SOIL TO GEOTEXTILE PERMEABILITY AND STANDPIPE READINGS VS. TIME: TEST NO.
11 .............................................................................................................................. 112
TABLE 4.13: SOIL TO GEOTEXTILE PERMEABILITY AND STANDPIPE READINGS VS. TIME: TEST NO.
12 .............................................................................................................................. 115
TABLE 4.14: OUTPUT WITH RECOMMENDED GEOTEXTILE SPECIFICATIONS .............................. 126
TABLE 4.15: SUMMARY OF GEOTEXTILE TO SOIL PERFORMANCE ............................................ 127
TABLE 5.1: INHERENT STABILITY OF SOIL .............................................................................. 129
TABLE 5.2: NUMBER OF CONSTRICTIONS (NS) FOR THE CANDIDATE GEOTEXTILES................... 130
TABLE 5.3: SOIL TO GEOTEXTILE PERMEABILITY VS. SAND PERMEABILITY WITH GRADIENT RATIOS
AT END OF TESTS ......................................................................................................... 131
TABLE 5.4: GEOTEXTILE PERMEABILITY VS. SAND PERMEABILITY WITH GRADIENT RATIOS AT END
OF TESTS .................................................................................................................... 132
TABLE 5.5: GEOTEXTILE PERMEABILITY VS. SAND PERMEABILITY WITH GRADIENT RATIOS AT END
OF TESTS .................................................................................................................... 133
TABLE 5.6: SUMMARY OF GRADIENT RATIOS VS. TIME: TEST NOS. 1-4..................................... 134
TABLE 5.7: SUMMARY OF GRADIENT RATIOS VS. TIME: TEST NOS. 5-8..................................... 138
TABLE 5.8: SUMMARY OF GRADIENT RATIOS VS. TIME: TEST NOS. 9-12................................... 142
TABLE 5.9: GEOTEXTILE STRENGTH REQUIREMENTS (AASHTO M288).................................. 144
TABLE 5.10: SUBSURFACE DRAINAGE GEOTEXTILE REQUIREMENT (AASHTO M288) .............. 145
TABLE 5.11: SOIL SAMPLE 1: AASHTO GEOTEXTILE SPECIFICATION REQUIREMENTS VS. TESTED
GEOTEXTILES .............................................................................................................. 145
TABLE 5.12: SOIL SAMPLES 2 AND 3: AASHTO GEOTEXTILE SPECIFICATION REQUIREMENTS VS.
TESTED GEOTEXTILES .................................................................................................. 146
Stellenbosch University http://scholar.sun.ac.za

xviii
TABLE 5.13: GEOTEXTILE PORE OPENING VS. DUTCH CRITERIA FOR SOIL SAMPLE 1 ................ 147
TABLE 5.14: GEOTEXTILE PORE OPENING VS. DUTCH CRITERIA FOR SOIL SAMPLE 2 ................ 147
TABLE 5.15: GEOTEXTILE PORE OPENING VS. DUTCH CRITERIA FOR SOIL SAMPLE 3 ................ 148
TABLE 5.16: SUMMARY OF DUTCH FILTER CRITERIA AND GEOTEXTILE PERFORMANCE ............. 148
TABLE 5.17: GEOTEXTILE PORE OPENING VS. GERMAN CRITERIA FOR SOIL SAMPLE 1 ............. 150
TABLE 5.18: GEOTEXTILE PORE OPENING VS. GERMAN CRITERIA FOR SOIL SAMPLE 2 ............. 150
TABLE 5.19: GEOTEXTILE PORE OPENING VS. GERMAN CRITERIA FOR SOIL SAMPLE 3 ............. 150
TABLE 5.20: SUMMARY OF GERMAN FILTER CRITERIA AND GEOTEXTILE PERFORMANCE .......... 151
TABLE 5.21: GEOTEXTILE PORE OPENING VS. AMERICAN CRITERIA FOR SOIL SAMPLE 1........... 152
TABLE 5.22: GEOTEXTILE PORE OPENING VS. AMERICAN CRITERIA FOR SOIL SAMPLE 2........... 152
TABLE 5.23: GEOTEXTILE PORE OPENING VS. AMERICAN CRITERIA FOR SOIL SAMPLE 3........... 153
TABLE 5.24: SUMMARY OF AMERICAN FILTER CRITERIA AND GEOTEXTILE PERFORMANCE ........ 153
TABLE 5.25: GEOTEXTILE PORE OPENING VS. FRENCH CRITERIA FOR SOIL SAMPLE 1 .............. 154
TABLE 5.26: GEOTEXTILE PORE OPENING VS. FRENCH CRITERIA FOR SOIL SAMPLE 2 .............. 155
TABLE 5.27: GEOTEXTILE PORE OPENING VS. FRENCH CRITERIA FOR SOIL SAMPLE ................. 155
TABLE 5.26: SUMMARY OF FRENCH FILTER CRITERIA AND GEOTEXTILE PERFORMANCE ........... 156
TABLE 5.27: GEOTEXTILE PORE OPENING VS. LEUTTICH ET AL. CRITERIA FOR SOIL SAMPLE 1 .. 158
TABLE 5.28: GEOTEXTILE PORE OPENING VS. LEUTTICH ET AL. CRITERIA FOR SOIL SAMPLE 2 .. 159
TABLE 5.29: GEOTEXTILE PORE OPENING VS. LEUTTICH ET AL. CRITERIA FOR SOIL SAMPLE 3 .. 159
TABLE 5.30: GEOTEXTILE PORE OPENING VS. COMPUTER SPREADSHEET OUTPUT FOR ALL SOILS
.................................................................................................................................. 160
TABLE 5.31: SUMMARY OF COMPUTER OUTPUT FILTER CRITERIA AND GEOTEXTILE PERFORMANCE
.................................................................................................................................. 161
TABLE 5.32: FINE SOIL FRACTION LODGED WITHIN AND PASSING GEOTEXTILE ......................... 162
Stellenbosch University http://scholar.sun.ac.za
xix
LIST OF SYMBOLS
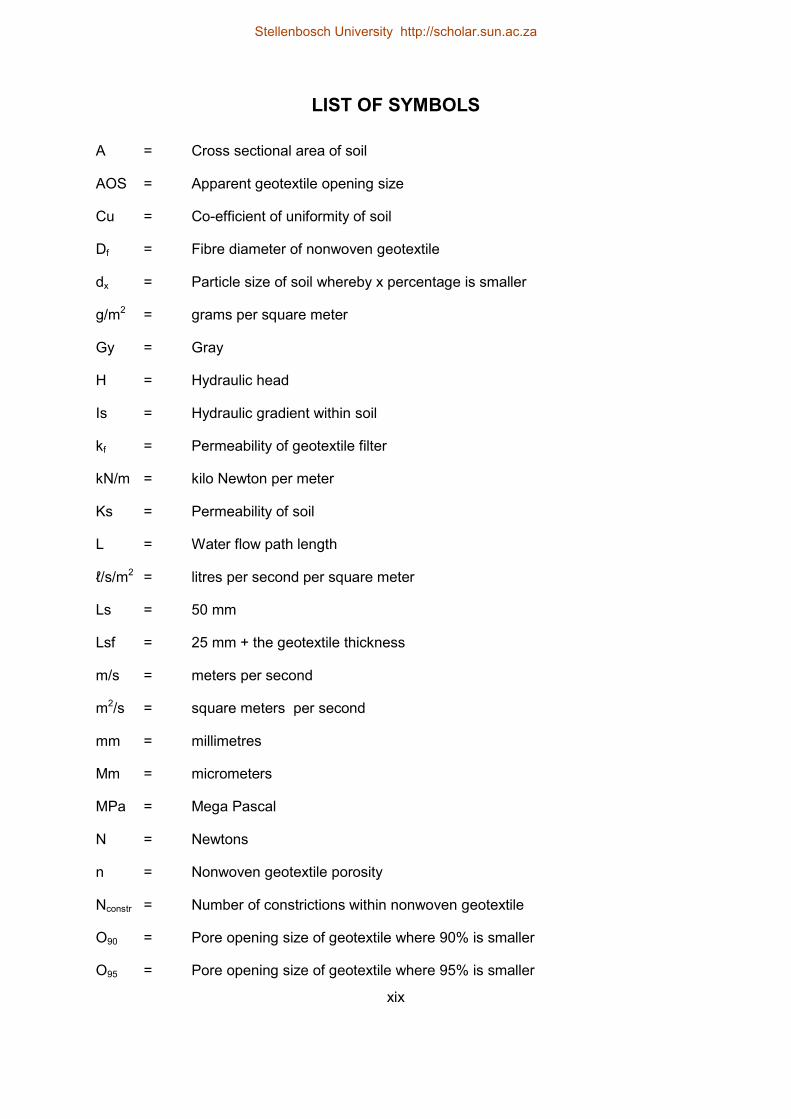
A = Cross sectional area of soil
AOS = Apparent geotextile opening size
Cu = Co-efficient of uniformity of soil
Df = Fibre diameter of nonwoven geotextile
dx = Particle size of soil whereby x percentage is smaller
g/m2 = grams per square meter
Gy = Gray
H = Hydraulic head
Is = Hydraulic gradient within soil
kf = Permeability of geotextile filter
kN/m = kilo Newton per meter
Ks = Permeability of soil
L = Water flow path length
ℓ/s/m2 = litres per second per square meter
Ls = 50 mm
Lsf = 25 mm + the geotextile thickness
m/s = meters per second
m2/s = square meters per second
mm = millimetres
Μm = micrometers
MPa = Mega Pascal
N = Newtons
n = Nonwoven geotextile porosity
Nconstr = Number of constrictions within nonwoven geotextile
O90 = Pore opening size of geotextile where 90% is smaller
O95 = Pore opening size of geotextile where 95% is smaller
Stellenbosch University http://scholar.sun.ac.za

xx
OF = Largest geotextile pore opening size
Q = Quantity of water
s-1 = Seconds to the negative power of one
Sn = the standpipe reading in cm for the standpipe numbered n
ρf = fibre density of nonwoven geotextile
ΔH = change in water head
ΔL = change in water flow path length
µGT = Nonwoven geotextile mass
Stellenbosch University http://scholar.sun.ac.za

xxi
LIST OF ABBREVIATIONS
AASHTO American Association of State Highway and Transportation Officials
AOS Apparent opening size
ASTM American Society for Testing and Materials
COLTO Committee of Land Transport Officials
Cu Co-efficient of uniformity of soil
GR Gradient ratio
ISO International Organization for Standardization
K5-6 Permeability across standpipes 5 and 6
K6-7 Permeability across standpipes 6 and 7
LTGRT Long term gradient ratio test
NP Non plastic
Ns Number of constrictions in geotextile
NW-N-CF-PET Nonwoven needlepunched continuous filament polyester geotextile
NW-N-SF-PP Nonwoven needlepunched staple fibre polypropylene geotextile
NW-N-HB-PP Nonwoven needlepunched continuous filament heat bonded polypropylenegeotextile
PI Plasticity index
POA Percentage open area
RD Relative density
SABS South African bureau of standards
SANS South African national standards
TMH1 Technical methods for highways
W-SLF-PP Woven slit film polypropylene geotextile
Stellenbosch University http://scholar.sun.ac.za

Chapter 1 - Introduction
1.1 GENERAL
A geosynthetic is defined as a planar, polymeric (synthetic or natural) material, used in
contact with soil or rock and/or any other geotechnical material in civil engineering
applications (International Geosynthetic Society).
According to historical records, it is believed that the first applications of geotextiles were
woven industrial fabrics used in 1950s. The Netherlands used fibre mats as separation and
filtration adjuncts in sea defence structures just after the 1953 floods. Another one of the
earliest documented cases was a sea revetment structure built in Florida (USA) in 1958,
where a woven geotextile was used as a filter beneath pre-cast concrete blocks. The first
nonwoven geotextile was developed in 1968 by the Rhone Poulenc company in France. It
was comparatively thick needle-punched polyester, which was used as upstream and
downstream chimney filters during the construction of a dam in France in 1970.
In reality, the use of geotextiles dates back to ancient Mesopotamia, where papyrus mats
were used for soil reinforcement and to promote soil consolidation. In South Africa,
geotextiles have been introduced and successfully used since the 1960s. Ever since, there
has been a rapid growth towards the use of geotextiles for the reasons outlined below:
They are manufactured in a quality controlled environment, usually according to
International Standards Organisation (ISO) standards.
Geotextiles are usually easy and quick to install.
Geotextiles can be manufactured from recycled materials, which reduces carbon
footprint.
The use of geotextiles reduces the dependency on natural raw materials, which are
becoming scarce and expensive.
The use of geotextiles can replace difficult designs using soil or other construction
materials.
Geotextiles often offer considerable cost savings versus natural materials.
The technical database on their testing and design is reasonably established.
This has been the case because methods for constructing natural filters are tedious, time
consuming and often the availability of suitable natural materials has become scarce. If
Stellenbosch University http://scholar.sun.ac.za

2
adequately designed, specified and installed, geotextiles can provide a cost effective
solution for drainage and filtration in civil and environmental engineering works.
Designing with and specifying geotextiles by function has become specialised and this
research will focus only on the filtration characteristics of the soil to geotextile behaviour
systems within the Berea Red sands of the KwaZulu-Natal Coastal region. Often design
engineers neglect the importance of inducing proper specifications. As a result the system
could potentially fail. The behavioural mechanism of soil to geotextile flow compatibility is not
always well understood. Where geotextiles are to perform as filters they must be adequately
permeable and also have the ability to optimally retain soil particles. A third factor is also
involved; a long term soil-to-geotextile flow compatibility that will not excessively clog the
fabric during the lifetime of the system. Internationally, extensive research is continually
being carried out on soil-to-geotextile filtration theory. This has formed a good basis for
further local studies.
With regard to filtration theory, the most common failure mechanisms of a geotextile filter are
blinding, blocking and clogging. These failure mechanisms and possible causes thereof will
be discussed later.
It is therefore important to know and identify potentially problematic soils during the early
planning stages of a project to eliminate or reduce the probability of failure occurring in the
soil to geotextile filtration system. One such potentially problematic soil is the coastal sand
also known as Berea sand which is, as previously mentioned, typically found along the
KwaZulu-Natal (KZN) coastline, stretching northward into Mozambique.
Berea sand is Aeolian of origin. It has high variability in terms of its plasticity index which can
be found to be non plastic to a plasticity index of approximately 12 percent. The sand has a
relatively low grading modulus and has a soil classification of between G6 – G10 according
to TRH 14 (1985). The Berea sand is also considered as highly erodible. The sand’s colour
varies between light yellow to orange and light brown to dark red.
Understanding the geotextile to soil behaviour with sand from the Berea formation will
enhance the probability of better geotextile design and selection of filtration media for this
region.
Stellenbosch University http://scholar.sun.ac.za

3
1.2 SCOPE OF STUDY
The area of study focused on soil-geotextile filtration and the current state of the art literature
available to support the study. An evaluation was done of four commercially available
geotextiles in conjunction with samples of three different types of Berea sand. The selection
of the sand samples was based on the variability of their plasticity indices and their
coefficients of uniformity. The study also focused on the pre and post permeability of the
geotextiles subjected to these soils. Further outcomes of the study ascertained whether the
co-efficients of uniformity of the soils and tensile strengths of the geotextiles had any
significant impact on the soil to geotextile filtration system.
Soil to geotextile filtration tests were carried out using ASTM 5433. This test method is
described in Chapter 3.
1.3 DISSERTATION STRUCTURE
The format of the thesis follows the chronological order illustrated in Table 1.1 below:
Table 1.1: Thesis format
CHAPTER 1: INTRODUCTION
CHAPTER 2: LITERATURE REVIEW
CHAPTER 3: METHOD
CHAPTER 4: RESULTS
CHAPTER 5: ANALYSIS
CHAPTER 6: CONCLUSIONS AND RECOMMENDATIONS
Chapter 2 investigates the development of geotextiles, wherein filtration theory and various
filter criteria will be discussed. Chapter 3 describes the research materials and their
engineering properties. The research methodology and background of the computer model
are discussed in Chapter 4. The analysis, results and findings of the laboratory testing are
discussed in Chapter 5. Various international geotextile design criteria were also
investigated, and compared to the laboratory tests as well as to the computerised predictive
model results. Chapter 6 concludes this thesis with the conclusions drawn from the research
and recommendations for further study.
Stellenbosch University http://scholar.sun.ac.za

4
1.4 AIMS AND OBJECTIVES
There was currently no South African code of practice that adequately addressed geotextiles
in filtration applications. However, a filter design guideline did exist and was available from a
few South African geosynthetics manufacturers (Kaytech and Fibretex SA). There was
therefore a need for bridging the gap in order to understand the mechanism and behaviour
of soil to geotextile filtration systems. This is critical in the design process, where insufficient
knowledge could lead to potential failures and loss of life, which could be encountered on
projects e.g. dams, harbours, jetties, breakwaters and retaining structures, to name a few.
This research was not aimed at replacing existing guidelines, but at augmenting these
existing guidelines as needed for locally practising engineers. This would assist in making
sound engineering decisions when it came to specifying geotextiles as filters in Berea sands.
The aim of this research was to further evaluate:
The difference in behaviour as a filter of four variants of geotextiles in typical problem
soil, such as Berea sand.
The clogging potential of these geotextiles in conjunction with Berea sand.
The influence that the co-efficient of uniformity (Cu) has on the soil to geotextile
filtration system.
The effect of geotextile fabric.
Stellenbosch University http://scholar.sun.ac.za

5
Chapter 2 – Review of Geotextiles and Filtration Theory
2.1 INTRODUCTION
This chapter will discuss the different types of geotextile, their polymer makeup and
manufacturing techniques, as well as soil-to-geotextile filter mechanisms and criteria. It is
important to have a good understanding of how soil filtration theory relates to geotextiles, as
many theories are common to both, but there are also differences. Furthermore, this chapter
highlights the theories and criteria given in past research and also how these relate to
natural soil and geotextile filters for present day consideration.
2.2 GEOTEXTILES
Geosynthetics comprise eight main categories, as follows:
1. Geotextiles
2. Geogrids
3. Geonets
4. Geomembranes
5. Geosynthetic Clay Liners
6. Geopipes
7. Geofoam
8. Geocomposites
Information is freely available on all the above geosynthetics. For the purpose of this thesis,
only geotextiles will be discussed. Geotextiles form one of the two largest groups of
geosynthetics, the other being geomembranes. (Koerner, R.M., 2005)
Geotextiles are, in reality, textiles but consist of synthetic fibres, rather than natural ones.
This helps in the sense that synthetic fibres will probably better withstand the design life of
any proposed structure. These synthetic fibres are made into flexible, porous fabrics, either
by standard weaving machinery or by being matted together in a random, nonwoven
manner. Some fabrics are also knitted. The major point is that geotextiles are porous to
liquids, both perpendicular to their manufactured planes, as well as within their thickness.
Not all geotextiles are able to allow liquids to permeate along their plane, as they are
relatively thin as, for example, a flat woven geotextile. This will be explained in more detail in
the later part of this chapter. A geotextile has numerous end uses, but performs at least one
of four functions: filtration, drainage, separation and reinforcement.
Stellenbosch University http://scholar.sun.ac.za

6
2.3 POLYMERS
The following polymers are most commonly used in the manufacture of geosynthetics
(Koerner, 2005):
High Density Polyethylene (HDPE) – developed in 1941
Linear Low Density Polyethylene (LLDPE) – developed in 1956
Polypropylene (PP) – developed in 1957
Polyvinyl Chloride (PVC) – developed in 1927
Polyester (PET) – developed in 1950
Polyamide (nylon) – developed in 1938
Expanded polystyrene (EPS) – developed in 1950
Chlorosulphonated polyethylene (CSPE) – developed in 1965
Thermoset polymers such as ethylene propylene diene terpolymer (EPDM) –
developed in 1960
Geotextiles are made of the following polymers (Koerner, 2005):
Polypropylene (92%)
Polyester (5%)
Polyethylene (2%)
Polyamide (nylon) (1%)
2.4 MANUFACTURING TECHNIQUES
Geotextiles are manufactured in different ways. Hence they are classified differently. The
most common ones are briefly outlined below:
Wovens: there are two basic types of woven geotextiles: slit-films, which are made by
weaving the flat strands that have been created by first slitting a plastic sheet;
and monofilaments, which incorporate round strands that are extruded.
Non-wovens: these are flexible geotextiles which are manufactured by bonding together
fibre mats which comprise layered, disarranged, spun fibres or filaments. The
bonding may be achieved either mechanically (needle-punching), by
adhesion (glueing) or by cohesion (melting).
Stellenbosch University http://scholar.sun.ac.za

7
Composites: these are multi-layered geotextiles comprising different layers of differing
structure which are bonded together over their entire surface. The individual
components may be woven, non-woven or other specially constructed
geosynthetics. The individual layers may be bonded together by needle-
punching, welding, sewing, glueing or a combination of these methods.
a b
Figure 2.1: a) Nonwoven needle punched b) Woven slit film geotextile
Figure 2.2: 100 x magnification of nonwoven (Kaytech)
Stellenbosch University http://scholar.sun.ac.za

8
Figure 2.3: 100 x magnification of woven geotextile (Kaytech)
2.5 HISTORY
Geotextiles, as they are known and used today, are intended to be an alternative to natural,
granular filters. Barret (1960) describes work originating in the 1950s using geotextiles
behind precast concrete seawalls, under concrete erosion control blocks, beneath large
stone rip rap, and in other erosion control situations. Dunham and Barret (1974) point out
that when sand and gravel filters were installed to hold fine soils in place under erosion
protection structures, scour and erosion sometimes undermined these protective structures,
but woven plastic filter cloths have been used successfully. Barret was known as the ’ather
of filter fabrics’. During 1957 and 1976 he also pioneered the use of filter fabrics in other
applications such as French drains, scour protection around bridge piers, fabric wrapped
around pipe, and the fabric encapsulated sand core breakwater. The need for both adequate
permeability and soil retention, along with adequate fabric strength and proper elongation,
set the tone for geotextile use in filtration applications. Agershou (1961) also describes the
earlier use of geotextiles in a similar way.
Acceptance of geotextiles for civil engineering projects was at first slow as their use
represented a relatively new concept. Over the years geotextiles have proven their good
performance and their uses rapidly increased, as various suppliers started entering the
market with a variety of geotextiles having various different properties.
Stellenbosch University http://scholar.sun.ac.za

9
2.6 CHARACTERISTICS OF WOVEN AND NONWOVEN GEOTEXTILES
Figure 2.4: Natural filter formation without geotextile (Kaytech)
In Figure 2.4 above it can be seen that the filtration mechanism for a natural filter is formed
when the bigger soil particles (D85) hold back smaller soil particles (D15), which in turn hold
back even smaller particles. This illustrates a typical natural ‘Terzaghi’ type filter, where:
D85 = particle size of the soil when 85% is smaller
D15 = particle size of the soil when 15% is smaller
Figure 2.5: Soil to geotextile system for nonwoven geotextile (Kaytech)
Water flow path
Soil particles
Nonwoven
geotextile
Soil to geotextile interface
Stellenbosch University http://scholar.sun.ac.za

10
When a nonwoven geotextile is to perform as a filter, as illustrated in Figure 2.5, there is
some close interaction between the fibres of the geotextile and the soil. This is important for
the promotion of a reverse filter, as will be discussed later in this chapter.
Figure 2.6 illustrates the soil geotextile interaction for a woven geotextile. This system does
not support a reverse filter very well, as will be discussed later in this chapter.
Figure 2.6: Soil to geotextile system for woven geotextiles (Kaytech)
2.6.1 Thickness
Woven geotextiles most often consist of a flat weave and often, by way of structure, are not
considered three dimensional; they are usually less than 1 mm thick (Table 3.1). Thickness
is an important parameter when in plane drainage is to be considered. In plane drainage is
the ability of a geotextile to allow water to flow in the plane of the geotextile. In general,
woven geotextiles do not exhibit good in-plane drainage characteristics.
This is important when a geotextile is used as a vertical drainage dissipater behind retaining
structures. In other words, there is great dependency on the geotextile to drain water along
its plane.
Nonwoven geotextiles, on the other hand, have thickness. According to standard laboratory
testing, a typical commercially available nonwoven geotextile exhibits thickness ranging from
approximately 1 mm to 10 mm under an exerted pressure of 2 kPa (Giroud 2010).
Woven geotextile
Stellenbosch University http://scholar.sun.ac.za

11
2.6.2 Elongation
Woven geotextiles do not exhibit high elongation characteristics and this characteristic lends
itself to spanning across voids in the soil when under strain. Typically, woven geotextiles
would strain approximately 10% to 20% before rupture. When a geotextile spans across a
void where it is expected to perform as a filter, fine soil particles in suspension are deposited
upstream, adjacent to the geotextile filter. This is due to the fact that water velocities are
reduced by intersecting these voids and hence the depositing of the soil particles. This
phenomenon can lead to the geotextile becoming blinded or blocked. This reduces the
filtration characteristics of the system and could lead to possible failure of the structure.
2.7 GEOTEXTILES AS FILTRATION FABRICS
In simplistic terms, a filter must retain the soil and allow the water to pass through. These
two requirements are contradictory if strictly formulated. If it were required for all soil
particles to be retained, an impervious screen would be needed, in which case water would
not be able to flow through it. Conversely, if it were required that the flow of the water was
not to be impeded then the openings of the filter would be too large and no soil particles
would be retained.
It is therefore important that there should be a balance between the two criteria. A good filter
has openings both large and small enough. It needs openings large enough to let water flow
freely but it should have openings small enough so that the soil skeleton, which gives the
structure stability, is not disturbed as a result of a loss of fine particles. So to evaluate these
two criteria, a filtration theory must be established (Giroud, 2010). This leads the researcher
to say that a complete theory would be difficult to formulate, due to two reasons as outlined
below (Giroud, 2010):
i) phenomena such as:
two phase flow and capillarity
chemical and electrical interactions between filter and particles,
erosion
variation of the mechanical behaviour of soil as a function of water content
and pore water pressures.
Stellenbosch University http://scholar.sun.ac.za

12
ii) parameters such as :
geometrical conditions (shape of the soil mass, location of the fluid, flow
direction which may vary) and
mechanical conditions (gravity, stresses)
properties of materials such as the fluid (composition, density and viscosity),
the soil particles (shape, dimension, mechanical properties such as friction
and cohesion, permeability)
constituents of the filter (shape, dimensions, distribution, density and
chemical nature of solid fibres of the filter, void distribution of filter)
filter (continuity, permeability, mechanical properties such as compressibility).
At the present time, there is still a way to go before having a complete theory dealing with
the above phenomena and parameters. A simple approach is used for granular filters as well
as for geotextiles, which consists of two criteria, the permeability criterion and the retention
criterion. Soil filtration with geotextiles is neither better nor worse understood than soil
filtration with granular filters. Giroud (2010) proposed that criteria for geotextiles are probably
as valid as the classical criteria used for granular filters.
One of the most common applications of a geotextile is as a filter (Koerner, 2005). A
geotextile filter is often used in subsurface drainage applications (Figure 2.8). The purpose
of a subsurface drain is to have a draw down effect on the water phreatic surface in order to
increase the bearing capacity and performance of soils. In this application, the geotextile is
expected to hold the sand particles behind, as well as to let enough water flow
perpendicularly through the plane of the geotextile.
2.7.1 Roadside subsurface drain
In Figure 2.7, the geotextile acts as a filter between the in-situ soil and the drainage stone.
The geotextile will stop fine soil particles from migrating into the stone drain and eventually
causing failure of the subsoil drain.
Stellenbosch University http://scholar.sun.ac.za

13
Figure 2.7 Geotextile acts as a filter in subsurface drainage application alongside aroad (Kaytech)
2.7.2 Drainage in railway construction
In Figure 2.8, the geotextile acts as a filter below railway ballast and in the side subsoil
drains. Effective drainage is critical, as subsidence due to moisture and cyclic loads can be
catastrophic for rail superstructure.
Figure 2.8: Geotextile as a filter medium under and next to railway (Kaytech)
Stellenbosch University http://scholar.sun.ac.za

14
2.7.3 Drainage of embankment dams
Geotextiles are also often used as filters during dam wall construction. In Figure 2.9 below,
the geotextile acts as a filter under the rock rip rap that is adjacent to the clay core of the
dam. The geotextile filter is intended to prevent the washing out of fines and thus causing
rock settlement on the upstream side of the dam wall. Secondly, geotextile also acts as a
filter adjacent to the clay core on both the upstream and downstream side. These filters are
critical as they maintain the integrity of the clay core, as well as prevent the building up of
excess pore water pressure adjacent to the clay core. Thirdly, the geotextiles act as a filter
between the in-situ and imported fill for the subsoil drainage blanket adjacent to the
downstream side of the clay core, as well as under the downstream fill embankment. Finally,
the geotextile would act as a filter around the toe collector drain, which often forms part of
the blanket drain. Also refer to Figure 2.10 below, where the rock rip rap embankments of a
dam are underlain with a geotextile filter.
Figure 2.9: geotextile filter under upstream rip rap, in adjacent chimney-anddownstream drains for earth fill dam (Kaytech)
Figure 2.10: Geotextile filter under rip rap scour protection (Kaytech)
Stellenbosch University http://scholar.sun.ac.za

15
2.7.4 Gabion structures
A gabion structure should always have a geotextile filter incorporated on its upstream side,
as in Figure 2.11. The voids in a gabion structure are often big and will easily let soil behind
it pipe through the structure. A geotextile filter will prevent the piping of the soil from behind
the gabion structure and allows the gabion to effectively perform its retaining function.
Figure 2.11: Geotextile as a filter behind gabion and gabion mattresses (Kaytech)
2.7.5 Sports field drainage
In this application the geotextile acts as a filter between the imported stone drainage medium
and the in-situ soil. The drainage system can form a herringbone system under the field or a
blanket drain. The latter is recommended, although more expensive, because of the greater
quantity of stone and geotextile that is used (Figure 2.12). The herringbone system is
justified on cost, and also where it is accepted that a pool of standing water on the sports
field will not be catastrophic, for example on a school sports field.
Figure 2.12: Geotextile performing as a filter under sports field drainage (Kaytech)
Stellenbosch University http://scholar.sun.ac.za

16
2.7.6 Drainage in tailings dams
Figure 2.13 shows that thick nonwoven geotextiles are often used a filter between the in-situ
and imported tailings materials. Because of the fine nature of tailings, it is critical to
dimension the filter correctly to prevent potential clogging of the geotextile filter and
subsequent failure of the drain.
Figure 2.13: Geotextile used as a filter medium below the toe drain of tailings dam(Kaytech)
2.8 GEOTEXTILE FILTRATION MECHANISMS
2.8.1 Geotextile to soil contact
When geotextiles are used in earth structures to restrain soil migration and to retain particles
in water three distinct filtration mechanisms are prevalent: first, the geotextile itself, which is
in contact with the soil; secondly, particles in suspension and, thirdly, the migration of soil
particles under cyclic loading.
The drainage of a saturated soil is usually achieved by constructing a trench and
subsequently lining the trench with a geotextile. A stone drainage medium, in conjunction
with a perforated pipe, is installed and the entire system is enveloped with the geotextile.
The entire system is buried where it performs its drainage function.
Stellenbosch University http://scholar.sun.ac.za

17
The water flow rate within the soil can be estimated using Darcy’s law:
Q = k (ΔH / ΔL) A
where:
Q = water flow rate in m3/s
k = soil permeability in m/s
A = soil cross sectional flow area in m2
H = hydrostatic head in m
L = water flow path length in m
The permeability and pore size distribution of geotextiles are selected to restrain particle
migration while allowing the water to percolate through. These properties are a function of
the structure of the geotextile and must remain constant throughout the service life of the
system.
The long term performance of geotextile filters can be affected by soil conditions, the design
of the system, installation procedures and hydraulic conditions. It is therefore important to
understand that the successful performance of a geotextile filter includes it encouraging the
formation of a natural upstream filter. This usually occurs by either one or a combination of
the following two mechanisms:
2.8.1.1 Self-filtration
Under hydraulic gradient, soil particles will migrate towards the drain. The particles with
smaller diameter than the geotextile pore opening size and located adjacent to the geotextile
lining the drainage trench will be carried into the geotextile by the flowing water. These
particles will either be flushed into the drainage pipe system or will remain trapped
permanently between the fibres. As the finer particles are removed from the soil, the coarser
soil fraction will migrate towards the geotextile where it will be stopped. This is assuming that
the coarser fraction is larger than the pore opening size of the geotextile. These larger
particles will, in turn, stop finer particles from migration, which will in turn stop even smaller
particles. As a result, coarse particles will form a layer at the geotextile interface and the soil
migration will be stopped. This phenomenon is favoured in well graded soils (Rollin and
Lombard, 1988).
Stellenbosch University http://scholar.sun.ac.za

18
2.8.1.2 Vault network formation
In soils that are not well graded, the geotextile can be properly selected to favour vault
formation (Figure 2.14). Particles adjacent to the geotextile can rearrange themselves as
they migrate toward the filter interface to form vaults. This is believed to be as a result of the
electrical and adsorption forces between the organic lubricant or anti-static agent on the
geotextile fibres and soil particles and also between the soil particles themselves. Upon
formation of this vault network, the geotextile will stop particles with a smaller particle size
than that of the geotextile, from migrating through it (Rollin & Lombard, 1988). This is
favourable, as no further piping of finer soil through the geotextile can occur.
Figure 2.14: Upstream soil particles forming vaults or arches over geotextile openings(after McGown 1985)
2.8.2 Particles in suspension
Besides subsurface drainage applications, geotextiles are also frequently used as filters in
silt fences, sea barriers, tailings storage facilities and other places. Geotextiles are in these
instances used to protect rivers and lakes from being contaminated by silt.
If care is not taken during installation, fine soil particles may be carried in by the run of water
and settle on top of, or adjacent to, the geotextile filter. A soil particle carried in suspension
will remain so if its velocity is higher than that of the gravitational forces acting on it. Clay and
silt particles will remain in suspension if their velocity is greater than 0.01 m/s. These
particles reach the geotextile interface at relatively high velocity. In this instance the filtration
mechanism reacts totally differently than in the case previously mentioned, as the formation
of an impervious layer on the upstream side of the geotextile is highly probable (Rollin &
Lombard, 1988). This phenomenon is known as blinding or blocking, in the cases of
nonwoven and woven geotextiles respectively.
Stellenbosch University http://scholar.sun.ac.za

19
Under relatively high flow rates, particles will block the pores of the geotextile and slowly
start building up an impervious layer on the adjacent upstream side of the geotextile. Over
time the geotextile filter will inevitably stop functioning and will need replacement. In these
cases the filter behaves similarly to the way it would in industrial filtration. In this instance,
geotextile filter selection should be based on the life expectancy of the structure or system
(Rollin & Lombard, 1988).
2.8.3 Soil particles migration under cyclic loads
In applications such as railways and access roads, cyclic loads are exerted onto the
geotextile due to the passage of heavy trains and vehicles. Under these conditions, smaller
particles tend to migrate towards the geotextile due to the pumping effect on them. This
effect is a function of the soil type, particle distribution, soil water content, and the amplitude
and frequency of the applied load. For silty and silty clay soils, the geotextile must be able to
stop the flow of slurry, consisting of the in-situ water and the soil that will flow as a result of
cyclic loading (Rollin & Lombard, 1988).
2.10 FURTHER DEVELOPMENTS FOR GEOTEXTILE FILTERS
Earlier work was undertaken by Giroud (1982 and 1986) to develop the basic criteria for
geotextile filters. These criteria are also applicable to granular filters. The classical
Terzaghi’s criteria in terms of permeability and retention for granular filters are expressed by
the following equations:
d15F ≥ 4 or 5d15S (1)
d15F ≤ 4 or 5d85S (2)where:
d15F = d15 of the filter where 15% of the particle size are equal or smaller
d15S = d15 of the soil where 15% of the particle size are equal or smaller
d85S = d85 of the soil where 85% of the particles size are equal or smaller
Terzaghi (1922) and Bertram (1940) identified the d85 of the soil as a suitable parameter in
their filter criteria, and this has been universally adopted. Lund (1949) and Soares (1980)
carried out tests on soils using a series of sieves, each sieve acting as a single filter. They
confirmed an abrupt loss of fines if the sieve sizes were bigger than d85 of the base soil.
Therefore the d85 is a good parameter to use against the excessive loss of fines.
Stellenbosch University http://scholar.sun.ac.za

20
Equation 1 means that the d15 of the filter must not be too small, which is the permeability
criterion. Equation 2 means the d15 of the filter must not be too large, which relates to the
retention criteria. So Terzaghi’s filter criteria comprise a permeability criterion and a retention
criterion. However, for geotextile filters, two additional criteria are needed (Giroud, 2010).
Since there is an abundance of geotextiles that are commercially available, it is possible that
some geotextiles may not perform adequately as filters. These are those which are very thin
and those with very few openings. Hence criteria needed to be developed to avoid the use of
these types of geotextiles as filters, especially in critical applications. These two extra criteria
for ensuring sufficient number of openings and sufficient thickness were called the porosity
and thickness criteria (Giroud, 2010).
Terzaghi’s criteria for granular filters are applicable only to cohensionless soils. This thesis
was limited to the Berea sands, where plasticity ranged between non-plastic and a plasticity
index of 7.
2.11 PERMEABILITY CRITERION
The presence of a filter disturbs the flow of the water in the soil upstream of the filter. The
selected filter must offer as little disturbance as possible, as it can affect the flow rate and
the pore pressure. Therefore the permeability criterion must consider pore pressure
requirement and flow rate requirement (Giroud, 2010).
2.11.1 Pore pressure requirement
Figure 2.15: Pressure diagram showing pore water pressure with depth and nogeotextile present (Giroud 2010)
Stellenbosch University http://scholar.sun.ac.za

21
In Figure 2.15, there is an increase of pore pressure with depth. From the soil-to-water
interface, to a depth z, the pressure decreases. This is the case where the permeability of
the soil (ks) is sufficiently high not to allow the build-up of excess pore water pressure at the
water to soil interface. Note that in the above case the soil at depth (z) forms part of the free
draining boundary.
Figure 2.16: Initial build-up of excess pore water pressure where geotextile is present(Giroud, 2010)
When incorporating a geotextile, there initially is a build-up of pore water pressure between
the soil to geotextile filter interfaces at the start of water flow through the system as shown in
Figure 2.16. The excess pore water pressure is a function of the geotextile filter’s
permeability.
Figure 2.17: Equilibrium flow conditions with geotextile present (Giroud, 2010)
Stellenbosch University http://scholar.sun.ac.za

22
After some time, if the geotextile filter’s permeability is sufficiently higher than that of the
adjacent soil, the excess pore water pressure will be reduced to zero at the soil to geotextile
interface (Figure 2.17), where:
Kf = permeability of geotextile filter
Ks = permeability of adjacent soil
Is = hydraulic gradient within soil
Table 2.1: Hydraulic gradient as measured within the soil (Giroud, 2010)
Table 2.1 illustrates the typical hydraulic gradients present in soil drainage and filtration
systems, depending on the application. This thesis evaluates the soil to geotextile filtration
characteristics at hydraulic gradients of ≤1, which are commonly encountered in roadside
dewatering trenches and edge drains.
2.11.2 The flow rate requirement
When a geotextile filter is introduced into a soil system, the flow rate of water is impeded and
reduced, no matter how permeable the geotextile is. Calculations done with Darcy’s equation
show that the reduction in flow rate is less than 10% of the flow rate without a filter, barring
the following conditions are met (Moraci 2008):
kF ≥ kS for filter thickness 1 to 10 mm (for geotextile filters only)
Stellenbosch University http://scholar.sun.ac.za

23
Similarly,
kF ≥ 25 kS for filter thickness 250 mm to 2500 mm (for granular filters only).
2.11.3 Comparison of the two requirements (Giroud 2010):
For geotextile filters: kF ≥ max (is.ks , ks) (3)
Similarly,
For soil filters: kF ≥ max (is.ks , 25 ks) (4)
In the case of geotextile filters, the flow rate requirement (kF ≥ kS) may be more or less
stringent, depending on the adjacent soil’s hydraulic gradient, is. In the case of granular
filters, the flow rate requirement (kF ≥ 25 kS) is generally more stringent than the pore
pressure requirement (kF ≥ is.ks), because the hydraulic gradient, is, is generally less than 25
(Giroud, 2010).
Author Permeability criterion
Schober & Teindl (1979) / Heerten (1981) Kg >ks
Giroud (1982) Ks >0.1ks
Loudiere (1982) Kg>102ks
Gourc (1982) Kg>0.32ks
Table 2.2 Review of main permeability criteria in unidirectional flow conditions(Moraci, 2008)
The trend in various different design criteria is to design the geotextile filter so that the long
term permeability of the filter is at least one order of magnitude higher than the permeability
of the base soil (Table 2.2).
The permeability criterion in terms of pore pressure requirements is generally verified for the
geotextile filters, owing to their high permeability and limited thickness (Palmeira and Fannin,
2002).
Stellenbosch University http://scholar.sun.ac.za

24
Therefore, to satisfy the permeability criteria, the presence of a filter should not increase the
pore water pressure at the soil geotextile interface. The flow rate was analysed between two
soil layers, first with and then without a geotextile filter between the layers. If the flow rates
differ less than 10%, then the geotextile filter is deemed to be satisfactory (Fannin, 2010).
The long term permeability of the geotextile filter must be at least one order of magnitude
higher than the permeability of the base soil (Fannin, 2010).
Furthermore, fluid flow through soils finer than course gravel is believed to be laminar
(Mitchell and Soga, 2005). Equations have been developed to relate the hydraulic
conductivity to the properties of the soil and permeating fluid.
Poiseuille’s law for flow through a round capillary tube gives the average flow velocity Vave
according to:
where µ = viscosity of permeating fluid
γp = unit weight of permeating fluid
R = tube radius
For a circular tube flowing full, Poiseuille’s equation becomes:
where a = the cross-sectional area of the tube.
For other shapes of cross-section, an equation of the same form will hold, differing only in
the value of a shape coefficient Cs, yielding:
Stellenbosch University http://scholar.sun.ac.za

25
For a bundle of parallel tubes of constant but irregular cross section contributing to a total
cross sectional area A (solids plus voids), for which S0 is the wetted surface area per unit
volume of soil particles, then:
By analogy with Darcy’s law:
for the case of full saturation (S = 1) and denoting Cs by (1/k0T2),
where:
k0 = pore shape factor
T = tortuosity factor, the previous equation becomes:
The expression relates absolute or intrinsic permeability (K) to the fabric of the porous
medium (void ratio, pore shape, and tortuosity), and is commonly termed the Kozeny-
Carman equation. It explains the dependency of permeability on void ratio in uniformly
graded sands and some silt (Mitchell and Soga, 2005).
The Kozeny-Carman equation also implies that the permeability of a soil is governed by the
finer particles within the soil matrix, rather than the larger particles (Fannin et al., 2006).
2.12 RETENTION CRITERION
The retention criterion is arguably the most important function of the filtration function
(Giroud 1996). Soil retention does not require that the migration of all soil particles is
prevented (Watson and John, 1999; Moraci, 1992). Soil retention only requires that the soil
Stellenbosch University http://scholar.sun.ac.za

26
behind the geotextile filter remain stable. It is therefore important that the retention modes
are understood, as described below.
2.12.1 Retention modes
Three types of soil retention mode (Fry, 2007) can be considered for filter applications:
2.12.1.1 Total retention
This retention mode is typically used on the downstream side of clay zones, as in earth dam
construction, where the clay core should be kept intact by not losing too many fine particles
due to internal erosion, piping, dispersion or cracking of the clay. These filters become
progressively clogged, but in this case clogging is not detrimental because these filters are
part of a system whose function is to retain water (Fry, 2007).
2.12.1.2 Optimum retention
These are typical filters used around structures such as drainage trenches and blankets in a
variety of applications as outlined previously in the chapter. These filters should function for
the design life of the structure and should remain permeable. Their function is to retain the
soil as a whole, but not necessarily all the particles. This form of retention should exhibit a
good balance between permeability and soil retention (Fry, 2007).
2.12.1.3 Partial retention
These filters are used in embankment protection systems where the geotextile is exposed to
turbulent, intermittent and multi-directional flow. Such geotextile filters should remain
unclogged to prevent instability in the case of rapid drawdown.
This thesis is exclusively devoted to filters providing optimum retention. These filters are
assumed to be subject to non-turbulent flow in one direction and they are intended to
function permanently. Total and partial retention are not considered.
Lafleur (1999) has proposed an approach that takes into account the rearrangement of
particles within the interface zone. It is based on the retention ratio (RR) as follows:
RR = Filtration Opening Size of the geotextile (FOS) / Indicative Size of the retained soil (dI),
where the FOS value is the O95 value obtained from hydrodynamic sieving and dI is
determined from the shape of the grading curve of the base (Lafleur et al., 1989)
Stellenbosch University http://scholar.sun.ac.za

27
The O95 value, typical of nonwoven geotextiles, is the opening size of which 95% of the
openings are smaller.
Giroud (2010) shows that retention criteria depend on soil density and the soil particle size
distribution curve which describes the coefficient of uniformity (Cu).
Cu = d60 / d10
While granular filters benefit to a certain degree from their thickness, geotextile filters on the
other hand are thin, and the retention criterion must therefore take into account the internal
stability of the soil (Moraci, 2002).
Internally stable soils have particles of a certain size that form a continuous skeleton. The
successful performance of any soil to geotextile filtration system is the ability of the system
to form an upstream reverse natural filter (Giroud, 2010).
The potential for grading instability increases as the width of the grading increases and the
severity of seepage and vibration increases. Grading instability is described as the inability
of the larger particles of a soil to hold back its smaller particles whilst water is flowing
through it. This can usually be identified by studying and analysing the soil’s particle size
distribution curve. One might tend to think that grading instability would occur only in gap
graded soils. Kenney and Lau (1984) and Scheurenberg (1986) have done experiments to
prove that even well graded soils can prove to be unstable.
Earlier studies dating back to the 1930s were done on suffusion, which is the transportation
of small particles from a soil. Research by de Mello (1975) and Sherard (1979) suggested
that the potential of a material for ’elf-filtering’ might be evaluated by estimating whether or
not the soil’s coarse fraction could act as a filter to retain the fine fraction.
Kenney and Lau (1985) did further studies on the influence on the shape of the grading
curve on the internal stability of filter materials.
A series of permeability tests was conducted using material with Cu ranging from 3 to 35 and
particle sizes from 0.1 to 100 mm. The samples were vibrated to create flow conditions more
severe than they would encounter in practice. Specimens were compacted to 80% relative
density. By comparing normalised grading curves, a boundary line can be defined to
separate stable from unstable gradings (Figure 2.18)
Stellenbosch University http://scholar.sun.ac.za

28
Sherard and Dunningan (1986) reviewed the findings above and found the results
conservative, because the flow conditions do not represent flows experienced in real
practice. Wolski (1987) suggested that a simple criterion of Cu < 20 may be used to define a
stable grading. Widely graded filters are excluded, where the risk of becoming unstable is
higher.
Figure 2.18 Shape curves of stable and unstable gradings (Kenney and Lau, 1984)
where:
D = soil particle grain size, D4 = 4 times soil particle size,
WG = widely graded (Cu > 3), NG = Narrowly graded (Cu < 3)
In an ideal situation, water flows together with suspended soil particles via a preferential flow
path and under a certain hydraulic head towards the geotextile filter. The water will pass
through perpendicular to the plane of the geotextile. Some of the finer suspended soil
particles will pass through the geotextile and some will become lodged within the fibrous
structure of the geotextile, assuming it is a nonwoven geotextile. Some particles will be
blocked up against the upstream side of the geotextile, where the particle size is slightly
bigger than the adjacent pore opening size of the geotextile.
Stellenbosch University http://scholar.sun.ac.za

29
Figure 2.19: Equilibrium soil conditions following formation of a soil filter (Lawson,1982)
After a time, as the system stabilizes, only bigger particles will be positioned immediately
adjacent to the upstream side of the geotextile. These bigger particles will in turn hold back
the smaller particles, which will in turn hold back even smaller particles (Figure 2.19). In this
way, a stable reverse filter is formed, and under steady state flow conditions.
It should be noted that geotextiles for filtration functions do not perform as true filter fabric.
They function for an indefinitely long time without becoming blinded or clogged. True filters
have limited functionality as they would eventually become blinded or clogged by continually
accumulated particles. Geotextiles function properly by restraining the soil and keeping it
from being moved by water. Actually, the soil body being restrained by the fabric holds the
soil into place (Giroud, 2010).
2.12.2 Size of soil skeletal particles
Internal stability depends on the co-efficient of uniformity (Cu). Soils that exhibit a co-efficient
of uniformity of approximately 3 or less prove that particles are tightly packed together and
the soil is considered internally stable (Figure 2.20). The closer the Cu of the soil is to 1, the
more uniformly graded the soil is. In this case there is no need for the soil to hold back any
finer particles, which therefore makes the soil inherently stable.
Figure 2.20: Schematic representation of soil with Cu equal to or less than 3(Giroud, 2010)
Stellenbosch University http://scholar.sun.ac.za

30
If soils have co-efficient of uniformity of more than 3, it means that the coarsest particles are
generally not in contact with the each other and are floating in the fine soil matrix, as seen in
Figure 2.21, below. It also means that the coarsest particles do not have the ability to hold
back the fine soil fraction and do not form a continuous skeleton that would entrap other
particles.
Figure 2.21: Schematic representation of soil with a co-efficient of uniformity above 3(Giroud, 2010).
Therefore as seen above, it is critical to know what the adjacent soil characteristics are, in
order to help predict the soil’s ability to form of a natural upstream reverse filter.
2.12.3 Maximum allowable geotextile filter opening size
The maximum opening size of a filter to retain a soil skeleton of a certain size depends on
the soil density. If the soil is in a loose state, all particles will pass through the filter if its
opening size is larger than the particle size, as illustrated in Figure 2.22 below.
(a) cubic arrangement on a filter with openings as large as soil particles;(b) most of the particles pass through the geotextile filter
Figure 2.22: Schematic representation of a loose soil by a cubic arrangement (Giroud,
2010)
Stellenbosch University http://scholar.sun.ac.za

31
If the soil is in a dense state, particles do not pass through the filter if the opening size is as
large as the soil particle size (Figure 2.23). The internal stability therefore does not only
depend on its co-efficient of uniformity but also its density (Giroud, 2010).
(a) hexagonal arrangement on a filter with openings as large as particles;(b) formation of a stable bridge after one particle has passed through the filter
Figure 2.23: Schematic representation of a dense soil by a hexagonal arrangement(Giroud, 2010)
Mathematical analysis (not presented in this thesis) leads to the following equations
representing the retention criterion (Giroud, 2010):
For Cu ≤ 3:
OF ≤ (Cu)0.3d85 for a loose soil (5)
OF ≤ 1.5(Cu)0.3d85s for a medium dense soil (6)
OF≤2(Cu)0.3d85s for a dense soil (7)
For Cu ≥3:
OF ≤ 9d85s / (Cu)1.7 for a loose soil (8)
OF≤13.5d85s / (Cu)1.7 for a medium dense soil (9)
OF ≤ 18d85s / (Cu)1.7 for a dense soil (10)
where:
OF = largest single opening size of geotextile filter
Cu = co-efficient of uniformity of the soil
d85 = particle size of soil fraction whereby 85% is smaller
Stellenbosch University http://scholar.sun.ac.za

32
2.13 POROSITY CRITERION
It is necessary, in the case of geotextile filters, to have a criterion to ensure that the number
of filter openings is sufficient. This results in a porosity criterion (Giroud 2010).
Many geotextiles are so permeable that even if they have a small number of openings per
unit area, they might still meet the permeability criterion. Therefore the permeability criterion
is not sufficient to eliminate those geotextile filters that do not have enough openings.
The flow of liquids through a porous medium, such as granular soil or fibrous filters, takes
place in channels. These channels are referred to as flow channels. The number of flow
channels per unit area is greater in the soil than in a filter that meets the retention criteria for
that soil. Therefore it can be expected that there will be a disturbance of flow at the soil-filter
interface (Giroud 2010). For the purposes of this thesis, the filter will be the geotextile.
Disturbance at the soil-geotextile interface could cause displacement of fine soil particles in
the vicinity of the filter, which could result in an accumulation of fine particles at the surface
of the geotextile or inside the geotextile. Therefore the number of flow channels per unit area
in the filter should be as large as possible, in order to minimise disturbance of the flow of
liquid from the soil to the geotextile.
The number of openings per unit area for a granular filter is expressed by the following
equation (Giroud 1996):
(11)
The number of openings per unit area for a woven geotextile filter is expressed by the
following equation (Giroud 2010):
(12)
where AR = relative opening area of a woven geotextile.
AR is only measured in flat woven geotextiles, as it does not exhibit thickness such as the
nonwovens have. The AR is measured by placing a woven geotextile is onto a light table; the
Stellenbosch University http://scholar.sun.ac.za

33
percentage of light shining through the voids is then expressed as a percentage of the entire
geotextile area. AR is synonymous with percentage open area (POA).
Therefore AR for woven geotextile filters:
(13)
Similarly, the lower and upper limit opening sizes of a non woven geotextile are expressed
by the following equation (Giroud 2010):
(14)
where n = porosity of the nonwoven geotextile
Experimenting with a wide range of values of porosity, n, gives a conservative criterion,
which ensures that the number of openings in the nonwoven geotextile is at least equal to
the number of openings in a granular filter having the same opening size. The conservative
criterion is that the porosity of a nonwoven geotextile should be equal to or greater than
0.55.
In summary the two criteria are (Giroud, 2010):
For woven geotextiles AR = 0.1 (10%)
For nonwoven geotextiles n ≥ 0.55 (55%)
Woven geotextiles with a relative opening area less than 0.1 should not be used as filters, as
they pose a high risk of clogging (Giroud, 2010).
2.14 THICKNESS CRITERION
A soil particle that travels through a filter must go through passages called constrictions
(Kenny and Lau 1985). In the case of a geotextile, a constriction is the passage between
fibres. These are typical of nonwoven geotextiles. Woven geotextiles are not considered in
this case, as they are usually thin. The size of a constriction is defined as the diameter of the
largest sphere that can pass through the constriction as shown in Figure 2.24 below.
Stellenbosch University http://scholar.sun.ac.za

34
Figure 2.24: Soil particles passing through a constriction (Kenny and Lau 1985)
The soil particle that travels through a filter moves from one constriction to another, following
a filtration path, which is identical to a flow channel. The soil particle will either pass through
or be trapped, depending on the size of the constrictions along the filtration path. In practice,
a soil particle can be stopped at the soil-filter interface or inside the filter, or can pass
through the filter as shown in Figure 2.25 below.
Figure 2.25: Schematic cross section of a nonwoven geotextile (Kenny and Lau, 1985)
This shows a particle stopped at the soil-geotextile interface, two particles trapped inside the
geotextile filter and a particle passing through the geotextile filter (Kenny and Lau, 1985).The
number of constrictions (Nconstrictions) through a nonwoven geotextile filter is given by the
following approximate equation (Kenney et al., 1985):
(15)
where: µGT = nonwoven geotextile mass per unit area
ρf = fibre density of nonwoven geotextile
df = fibre diameter of nonwoven geotextile
n = porosity of nonwoven geotextile
Stellenbosch University http://scholar.sun.ac.za

35
Studies by Kenney et al. (1984) have shown that beyond a geotextile thickness containing
approximately 25 constrictions, the opening size is not significantly affected by changes in
the geotextile thickness. In other words, a geotextile thickness that contains more than 25
constrictions is approximately an infinite thickness from the viewpoint of opening size.
Thickness, geotextile opening size and fibre diameter are all measured in mm.
Figure 2.26: Zone of the graph with more than 25 constrictions (Kenny and Lau, 1985)
To be reliable, a nonwoven geotextile filter should have a thickness that corresponds to at
least 25 constrictions (Kenney et al. 1984). This concludes the explanation of the thickness
criterion.
2.15 MODES OF FAILURE
Too often, when there is a failure in a drainage and filtration application where geotextiles
are used, the first assumption is that the geotextile is the cause of such failure. In order to
understand the cause of failure it is important to understand the mechanism of failure.
2.15.1 Base soil failure
The soil referred to as base soil is that soil which needs to be drained and is usually in
intimate contact with the geotextile. As earlier discussed in this chapter, it is quite possible
that the base soil is unstable and it is quite possible for the failure to occur internally as a
result thereof. Too much fine material can be lost to seepage and under low hydraulic
gradients these fine soil particles settle at the soil-geotextile interface. This can cause a
phenomenon known as blinding, in the case of a nonwoven geotextile, and blocking in the
case of a woven geotextile (Figures 2.27 to 2.30)
Stellenbosch University http://scholar.sun.ac.za

36
Figure 2.27: Caked layers of fine particles blind a nonwoven geotextile (McGown,
1982)
Figure 2.28: Cake forming on a nonwoven geotextile also known as blinding (Kaytech)
In Figure 2.28 above, when blinding occurs, the flow of water through the geotextile is
impeded. This is not because the geotextile has clogged but due to the impervious silty soil
layer which has settled on top or adjacent to the geotextile. If this cake layer is removed, as
illustrated in Figure 2.29, quite often one would find that the geotextile is still functional.
Figure 2.29: Soil particles blocking and reducing the pore openings of a wovengeotextile (McGown, 1985)
Stellenbosch University http://scholar.sun.ac.za

37
Figure 2.30: Woven geotextile showing openings being blocked by soil particles(Courtesy: Kaytech)
2.15.2 Physical Clogging
Physical clogging is a primary result of base soil characteristics. It is inevitable that, in the
case of nonwoven geotextiles, a percentage of the fine particles in suspension will either
pass through the geotextile into the drain or get trapped into the porometry of the geotextile.
If the percentage of trapped particles is too high, the geotextile is said to be clogged (Figure
2.31).
Figure 2.31: Geotextile clogging (Hoare, 1982)
Furthermore, clogging of a geotextile can also be in response to chemical, biological and
physical mechanisms. The influence of stress level, pore fluid and integrity of the soil to
geotextile contact also have an influence on the geotextile’s clogging potential (Moraci,
2010).
Stellenbosch University http://scholar.sun.ac.za

38
2.15.3 Biological clogging due to permeating fluid
Biological clogging occurs in municipal solid waste landfills (Brune et al. 1991; McBean et
al.1993) due to the flow through the geotextile of leachate. Giroud (1996) explains the
biological process further below.
Bacteria reacting to an excess of nutrients (in the case of leachate that contains organic
compounds) secrete fibrils of polysaccharide. In this case bacteria become entrapped in the
gelatinous matrix formed by these entangled fibrils. The gelatinous matrix adheres to the
surface of sand particles or geotextile fibres and a biofilm is formed. As bacteria continue to
be supplied with nutrients, they reproduce and secrete more extracellular polysaccharide.
The presence of the network of biofilm decreases the pore space available for flow and can
cause clogging of filters with small openings, such as sands and geotextiles. Leachate
therefore contains suspended and microbial contaminants which are subjected to varying
degrees of temperature and availability of oxygen which result in either anoxic or aerobic
conditions. A combination of all these can create a biological regime that could promote
biological clogging of geotextiles (Figure 2.32).
Figure 2.32: Ferric oxide (biological) clogging of a nonwoven geotextile(Courtesy: Kaytech)
Mendoca et al. (2003) reported that the anoxic/aerobic interface in drainage systems
presents a favourable location for the development of iron bacteria and the formation of iron
ochre biofilm on geotextile filters. Palmeira et al. (2008) also did laboratory permittivity tests
on nonwoven geotextiles, using leachate from a waste containment facility. Reduced normal
and in-plane permeability through the candidate geotextiles occurred as a result of
biochemical clogging. Rapid reductions in permeability to unacceptable levels were
Stellenbosch University http://scholar.sun.ac.za

39
observed in as little as 60 days. Normal permeability, in-plane hydraulic conductivity which is
also known as transmissivity, and permittivity of nonwoven geotextiles are all interrelated as
follows:
Ψ = Kn / t
θ = Kp . t
where:
Ψ = permittivity of the geotextile
t = thickness of geotextile
Kn = permeability normal to the plane of the geotextile
Kp = permeability perpendicular to the plane of the geotextile
θ = transmissivity of the geotextile
Different studies have shown the potential risk of clogging and blinding for the geotextile
filters interacting with leachate (Cancelli & Cazzuffi 1987, Fourie et al. 1987, de Mendonca et
al. 2003). Therefore the use of geotextile filters in waste disposal applications must be
accurately evaluated by means of performance tests.
2.15.4 Stress levels
Knowledge of the vertical effective stress is important, since an increase of the vertical
effective stress produces a decrease in soil porosity (n). In addition, an increase in vertical
effective stress also involves a decrease in the pore size distribution in the geotextile filter,
especially for needle-punched nonwoven geotextiles. Therefore, for a specific nonwoven
geotextile, a vertical effective stress increase involves a decrease in porosity (n) that also
produces a reduction of thickness (tgt) and of geotextile filtration opening size (OF). The
same effect was observed also by Palmeira and Gardoni (2002), using the bubble point
method, relative to pore size distribution and filtration opening size O95 values. For woven
geotextiles, owing to the intrinsic structure of the material itself, an increase in vertical
effective stress is not associated with a corresponding variation of the filtration opening size
(Moraci, 2010).
Stellenbosch University http://scholar.sun.ac.za

40
Most geotextile filter design criteria do not consider the effect of the effective vertical stress,
despite the fact that the increase in vertical effective stress involves a decrease in the
filtration opening size of geotextiles. The influence of normal stress on the hydraulic
characteristic of nonwoven geotextiles was studied, using a different experimental
procedure, by Gardoni et al. (2000). Moreover, they also compared the test results with
existing theoretical methods of predicting geotextiles’ permeability. It was observed that even
for rather large normal stresses the porosity and the permeability of the geotextile might still
be greater than those values for typical sandy soils. The permeability coefficient normal to
the geotextile plane can be reduced about 10 times in the range of pressures between 0 and
200 KPa.
2.15.5 Type of contact
The continuity of soil to geotextile filter contact at the interface also plays an important role in
the filter design. This continuity depends on the building procedure used, the density of the
base soil and the stiffness of the geotextile filter. For instance, in the case of river bank
revetments, the impact energy due to the placing of rip-rap blocks could produce large
deformations in the base soil, if the latter is constituted of loose granular materials. In these
cases, surface irregularities are generated in the base soil and the geotextile filters may
follow these deformations, depending on their stiffness characteristics. For needle-punched
nonwoven geotextiles, the adjustment occurs without large tensile stresses, and
consequently without variations of filtration opening size. For woven geotextiles, the tensile
stress becomes important and could induce changes in the filtration opening size whereby it
becomes smaller.
2.16 LONG TERM DURABILITY OF GEOTEXTILES
Two phenomena have been identified as being responsible for the loss in mechanical
strength of geotextiles:
a) Mechanical degradation of the fibres themselves and/or
b) Degradation of the bonds between the fibres, due to microbiological and chemical
actions.
Degradation is a result of mechanical, environmental, chemical and bacterial actions. The
polymeric structure alteration or destruction is a slow process unless the fibres are submitted
to extreme conditions such as temperatures that increase the brittleness of the polymer. Any
Stellenbosch University http://scholar.sun.ac.za

41
sharp objects or materials that could potentially tear or puncture the geotextile are also a
factor.
2.16.1 Mechanical degradation
This commonly occurs during geotextile installation, when sharp edged materials are in
direct contact, which could possible tear or puncture the geotextile.However, it is not limited
to the installation process. Cyclic contact with a highly abrasive material can also erode and
puncture fibres over time. When holes occur in the geotextile, the geotextile’s ability to
perform as a filter is reduced. Localised flow would occur and smaller particles could migrate
through the geotextile and potentially become blocked and render the drain dysfunctional.
2.16.2 Microbiological degradation
Most polymers used today to manufacture geotextiles (polyesters and polyolefins) are
resistant to microbiological attack (Rankilor, 1981). Polyamides are known to be attacked by
mildew and bacteria. In the case of the latter it was observed that moulds, mildew and fungi
were adhering to some of the finished coatings applied to the geotextile during the
manufacturing process, but without attacking the fibres themselves. Ionescu et al. (1982)
immersed 1 400 samples of six geotextiles in eight types of soil containing different bacterial
media for five to seventeen months. Results showed no significant negative signs of bio-
degradation and no significant reduction in mechanical properties. Biological activity is more
likely to occur near the surface, rather than at the depth where geotextiles are often utilised.
2.16.3 Chemical degradation
Moncrieff (1975) has documented the performance and resistance of polymers with specific
chemicals. Most geotextile polymeric fibres have high resistance to chemical degradation.
Polyester can be degraded by strong alkalis, polyamides undergo hydrolysis and
polypropylene oxidises. It is advisable to do accelerated laboratory testing for chemical
compatibility for the specific application.
Troost and den Hoedt (1984) investigated the reaction of geotextiles made of polyester,
polyamide and aramid, submersed for up to thirty months in solutions ranging from pH 5 to
pH 9. None of the fabrics lost more than 10% of their inherent strength.
Further tests conducted by Halse et al. (1987a and 1987b), submersed geotextiles
composed of polypropylene, polyvinyl chloride and polyester for 120 days in alkaline
Stellenbosch University http://scholar.sun.ac.za

42
solutions ranging from pH 10 to pH 12. No significant loss of strength was observed for
polypropylene and polyvinyl chloride, but a 53% loss of strength was observed for the
polyester geotextile.
The above investigations have shown that, barring very aggressive conditions, polymers are
generally resistant to chemical attack. Table 2.3 below shows the performance of different
geotextile polymers when exposed to acidic and alkaline environments.
Table 2.3 Chemical and thermal stability of synthetic fibers used in the manufacture ofgeotextiles (Cooke & Rebenfield (1988), Lawson & Curiskis (1985) and van Zanten (1986))
2.16.4 Environmental degradation
Environmental factors which could negatively affect the properties of unprotected or
uncovered geotextiles are ultra-violet light, extreme temperatures, oxidation and polluted
Stellenbosch University http://scholar.sun.ac.za

43
atmospheres. In general, the most frequent risk for an uncovered geotextile is ultra-violet
exposure. Raumann (1982) reported outdoor exposure on a range of polypropylene and
polyester geotextiles for up to thirty six weeks. All samples showed significant strength loss
under outdoor exposure. Some samples lost all their strength in from sixteen to twenty four
weeks.
Polypropylene geotextiles are most susceptible to sunlight exposure, although chemical
stabilising agents have been added during the fibre manufacturing process. Polyester is
known to melt at temperatures of around 260 degrees Celsius and polypropylene at about
180 degrees Celsius. The extreme temperatures around the world are well within an
acceptable range and geotextile polymers will not degrade in the short term. During storage
it is advisable to keep all geotextile in its original wrapping and stored under cover or under
tarpaulins.
Geotextiles may also be placed near or in contact with radioactive waste. Van de Voorde
(1972) indicated that the elasticity modulus of the polymers is not affected, but the
elongation to break is decreased in all cases. The quantity of radiation required to reduce the
elongation of some industrial polymers by 50% has been measured: 3 x 10⁴ Gy for
polypropylene, 5 x 10⁵ Gy for polyethylene and 1 x 10⁸ Gy. Gy stands for ‘gray’ which is the
standard unit of measurement unit for absorbed radiation.
2.17 TESTS ON EXHUMED SAMPLES
A few studies have been carried out by examining samples of geotextiles buried for a
number of years. Colin, Mitton et al. (1986) carried out experiments where geotechnical
fabrics have been exposed to accelerated soil burial testing for up to seven years and the
recovered fabrics then examined for changes using burst strength testing, optical
microscopy and infrared spectroscopy. By analytical testing the test specimens were shown
to be based on monofilaments of polypropylene, polyethylene terephthalate and a mixture of
polypropylene and bi-component fibres respectively. None of the samples showed a
significant decrease in burst strength beyond the deviation of the experimental data. No
oxidation was observed.
Van Zanten and Thabet (1982) exhumed polypropylene, polyethylene and polyamide
geotextiles that had been buried for ten years, from the canal banks of the Netherlands.
They found the loss of strength and elongation to rupture respectively as 26% and 62% for
polypropylene, 11% and 24% for the polyethylene, and 23% and 0% for polyamide. These
Stellenbosch University http://scholar.sun.ac.za

44
results are somewhat of a contrast to those of Colin, Mitton et al. (1986). Van Zanten and
Thabet (1982) could not ascertain whether the loss of strength in their research was due to
environmental factors or installation damage.
The most significant of exhumed tests were commissioned by the French Ministry of Industry
and reported upon by Sotton et al. (1982). Approximately two hundred samples consisting of
polypropylene, polyester and polyester/polyamide were exhumed from over thirty sites in
France. The geotextiles had been buried in various soil types for up to twelve years. Testing
of exhumed samples included thickness, tensile strength, permittivity and fibre properties.
Losses in tensile strength of up to 30% were observed. No changes in polymer fibres were
observed to be due to soil conditions. No micro bacterial damage was observed upon visual
inspection.
Based on the above studies, it can be deduced that geotextiles are very robust and durable
against chemical attack and micro bacteria. Care should be exercised in leaving the
geotextile exposed to factors such as direct sunlight and oxidative environments.
2.18 INSTALLATION CONSIDERATIONS
The successful performance of geotextile filters is also a function of their survivability during
installation. It is desirable for soils to be relatively dry where geotextiles are to be installed.
Care should also be taken not to damage the geotextile by contact with sharp objects or
protrusions during installation.
Because of its relatively thin planar structure, geotextiles could be prone to rupture during
installation, which might result in the opposite of the desired outcomes of the performance of
the geotextile.
2.19 EVALUATION OF DRAINAGE SEVERITY
It is highly recommended that all drainage applications should start with an evaluation of how
critical or severe the application is (Table 2.4). Geotextiles should not be selected on costs
alone. The cost of a geotextile is often negligible in comparison to that of other components
and actual construction cost of the drain itself.
Stellenbosch University http://scholar.sun.ac.za

45
Table 2.4: Guidelines for evaluating the critical nature or severity of a drainageapplication (Carroll, 1983)
2.20 INTERNATIONAL GEOTEXTILE FILTER DESIGN CRITERIA
Many filter criteria have been developed internationally as regards uni-directional flow in
geotextiles.. Some of the more commonly researched criteria are highlighted in Table 2.4.
Stellenbosch University http://scholar.sun.ac.za

46
Table 2.4: Retention criteria based on previous research (Bergado et al., 1996)
Although many researchers have derived their own interpretation of what the retention and
permeability criteria should be, some countries have decided to adopt what has proved to be
best practice for themselves for their local conditions.
2.21 REGIONAL GEOTEXTILE FILTER DESIGN CRITERIA
Furthermore, various countries have adopted geotextile filter design criteria as follows:
2.21.1 Dutch practice (after N.W.M. John, 1989):
For static unidirectional flow, originally O95 < d90 for wovens, and O90 < 1.8d90 for nonwovens,
both of these are released by the Dutch Coastal Works Association to O90 < 2d90.
Where:
O90 = opening size of geotextile where 90% are smaller
d90 = particle size of soil where 90% are smaller
Stellenbosch University http://scholar.sun.ac.za

47
2.21.2 German Practice (after NWM John, 1989):
Soil Description Geotextile Criteria
d40<0.06mm, stable soil O95<10d50 and O95<2d90
d40<0.06mm, problem soil O95<10d50 and O95<d90
d40>0.06mm, stable soil O95<5d10.Cu0.5 and O95<2d90
d40>0.06mm, problem soil O95<5d10.Cu0.5 and O95<d90
Table 2.5: German practice in terms of geotextile filter criteria (NWM John, 1989)
where:
d40 = particles size of soil whereby 40% is smaller
O95 = characteristic pore size of the geotextile
and where problem soils are defined as those falling into any one of the following categories:
i) Fine-grained soils with a plasticity index of less than 15%
ii) Soils whose average particle size (d50) lies between 0.02 and 0.1mm
iii) Soils with a coefficient of uniformity of less than 15, which also contains clay or
silt-sized particles
2.21.3 American Practice (after N.W.M. John, 1989):
Soil Description Geotextile Criteria
d50>0.075mm 0.297mm ≤ O95 ≤ d85(wovens)
0.297mm ≤ O95 ≤ 1.8d85(nonwovens)
d50<0.075mm
Cu ≤ 2 O95 ≤ d85
2 ≤ Cu ≤ 4 O95 ≤ 0.5Cu.d85
4 ≤ Cu ≤ 8 O95 ≤ 8.d85/Cu
Cu ≥ 8 O95 ≤ d85
Table 2.6: American practice in terms of geotextile filter criteria (NWM John, 1989)
Stellenbosch University http://scholar.sun.ac.za

48
2.21.3 French Practice (after N.W.M. John, 1989):
These criteria recognise the base soil’s coefficient of uniformity (U); soil density and
hydraulic gradient (i).
Soil Description Geotextile Criteria
Well Graded (Cu > 4) and dense 4d15≤Of≤1.25d85
Well Graded (Cu > 4) and loose 4d15≤O f≤d85
Uniformly Graded (Cu≤4) and dense Of≤d85
Uniformly Graded (Cu≤4) and loose Of≤0.8d85
Table 2.7: French practice in terms of geotextile filter criteria (NWM John, 1989)
where:
d15 = particle size of soil whereby 15% is smaller
Of = geotextiles characteristic pore size as measured by the French AFNOR 38017
(Wet Sieve Test Method)
When the hydraulic gradient (i) in the vicinity of the geotextile lies between 5 and 20, then
the geotextile pore sizes specified above should be reduced by 20%. Similarly, if it exceeds
20, or reversing flow conditions are present, then the pore size should be reduced by 40%
(Table 2.7).
Stellenbosch University http://scholar.sun.ac.za

49
2.21.4 English Practice (N.W.M. John, 1989):
Minimum size of soil particle to be positively restrained Maximum value for O95
d5 d50Cu'-0.9
d15 d50Cu'-0.7
d50 d50
d60 d50Cu'0.2
d85 d50Cu'0.7
d90 d50Cu'0.8
d95 d50Cu'0.9
Table 2.8: English practice in terms of geotextile filter criteria (NWM John, 1989)
English Practice is based on the principle that if a characteristic particle size is retained, a
reverse filter will form. Even for a broadly graded soil, having a higher coefficient of
uniformity (Cu), a reverse filter will form (Table 2.8).
Arguably, one of the most comprehensive geotextile filter design methods developed was
based on work done by Luettich, Giroud and Bachus (1993). The research brought together
already developed design concepts and filter design criteria into a comprehensive nine-step
design methodology. These nine steps are listed as follows (Luettich et al.,1993):
Step 1: to define the application filter requirements
This is in order to understand what the requirements are for the filter for the intended
application. Furthermore it also involves the type of drainage material that will be used
adjacent to the geotextile filter.
Step 2: defining boundary conditions
This stage evaluates the confining pressure in the vicinity of the geotextile filter. Flow
conditions are further defined as either uni-directional or dynamic. This thesis evaluates only
unidirectional flow conditions.
Stellenbosch University http://scholar.sun.ac.za

50
Step 3: determining soil retention requirements
A chart which provides numerical retention criteria was developed in terms of uni-directional
flow (Table 2.9). This chart takes into account the soil’s particle size distribution, Atterberg
limits, dispersivity and density. It also correlates these aforementioned parameters to a
candidate geotextile’s pore opening size (O95).
Table 2.9: Geotextile filter criteria under uni-directional flow conditions (Luettich et al.,
1992)
where O95 = pore size of geotextile where 95 per cent are smaller.
Step 4: determining geotextile permeability requirements
Based on the soil’s permeability, the geotextiles permeability requirements can be
determined. The minimum allowable geotextile permeability can then be calculated (Giroud,
2010):
kg > isks
where:
kg = permeability of the geotextile
Stellenbosch University http://scholar.sun.ac.za

51
is = hydraulic gradient
ks = permeability of the soil
Step 5: determining anti-clogging requirements
To minimise the risk of clogging the following criteria should be met (Giroud 2010):
Use the largest opening size (O95) that satisfies the retention criteria.
For nonwoven geotextiles, use the largest porosity (n) available, but not less than 30%
For woven geotextiles, use the largest open percentage area (AR) available, but not
less than 4%
Step 6: determining survivability requirements
As previously mentioned, construction techniques and the type of drainage aggregate placed
adjacent to the geotextile, have a potential damaging effect on it. Minimum strength indices
should be specified to mitigate risk of damaging the geotextile (Table 2.10).
Table 2.10: Survivability strength requirements (AASHTO, 1986)
Stellenbosch University http://scholar.sun.ac.za

52
Step 7: Determining durability requirements
Reference is made to section 2.16 of this thesis.
Step 8: miscellaneous design considerations
Other geotextile filter design considerations, in no specific order:
Intimate contact between the soil and geotextile
Abrasion of the geotextile due to dynamic water action
Extrusion of fine soil particles through geotextile when exposed to high confining
pressures
Intrusion of the geotextile into stone drainage layer
Geotextile structure
Biological and bio-chemical clogging
Safety factors
Step 9: selecting a geotextile filter
The final step is to select a geotextile filter using the required material properties. Any
geotextile which meets these properties, irrespective of type, can be chosen as a filter. For
some applications, these properties are to be verified through third party conformance
testing.
2.22 AASHTO M288 GEOTEXTILE CRITERIA
In 1982, an American task force of representatives of the geotextile industry, private
contractors, and state and federal transportation agencies reviewed tables of suggested
geotextile property values for the Federal Highway Association Geotextile Manual that was
being prepared at the time. The resulting work was published in the AASHTO Specification
Book as Specification M-288 on Geotextiles. It was established that geotextiles need to have
a strength criteria, irrespective of their application (see Table 2.11). Geotextiles are classified
into different classes according to their strength. The geotextiles are also classified in terms
of their elongation characteristics. High elongation geotextiles (>50%) are normally classified
under the nonwoven group and low elongation (<50%) are usually classified under woven
geotextiles. The elongation of the geotextile is the strain measured at rupture, expressed as
a percentage, using standard test methods.
Stellenbosch University http://scholar.sun.ac.za

53
Table 2.11: Geotextile strength requirements (AASHTO M288)
Furthermore, a table was developed relating to a geotextile to be used as a filter in
subsurface drainage applications (Table 2.12). Note that class 2 geotextiles, in terms of
strength, are recommended across the spectrum.
Table 2.12: Subsurface drainage geotextile requirement (AASHTO M288)
2.23 SOUTH AFRICAN DESIGN GUIDELINES
Stellenbosch University http://scholar.sun.ac.za

54
Other than a few manufacturers’ recommendations, the standards and specifications for
geotextiles in South Africa are limited and out of date. A SABS code of practice for the
testing of geotextiles exists (SANS 10221:2007), which lists five in-isolation tests, serves as
a means to classify geotextiles. The code furthermore defines a list of geotextile grades, but
does not provide input into the actual design process nor does it consider the soil to
geotextile interface performance (Table 2.13).
Test Unit GRADES
1 2 3 4 5 6 7 8 9 10
Thickness mm As specified by Manufacturer
Mass per unit area g/m2 100 100 135 135 200 200 250 250 300 300
Penetration load
(CBR) kN 0.8 0.8 1.2 1.2 2 2 2.4 2.4 3 3
Tensile Strength kN/m 6 6 8 8 12 12 16 16 22 22
Elongation % 50 10 50 10 50 10 50 10 50 10
WaterPermeability l/s.m2 130 20 130 20 100 15 70 10 40 5
Table 2.13: Geotextile drainage and filtration specification (SABS 1200)
TRH15:1994 - Subsurface Drainage for Roads and COLTO: 1998 Section 2100 – Drains
aims to address some of the design inputs that are required. These specifications may be
deemed to follow most of the design requirements but fall short, as they do not reflect the
current state of practice and the possible performance of geotextiles is ignored. Referring to
Table 2.13 as in COLTO 1988 below, no mention is made of geotextile pore size and it also
does not take geotextile to soil interaction into account. The geotextiles, although for
drainage and filtration, are classified according their mechanical characteristics, whereas
reference to their hydraulic characteristics would be more appropriate (Table 2.14).
Stellenbosch University http://scholar.sun.ac.za

55
Property GRADE Test Method
2 3
Penetration Load
(minimum), N 2400 1500 3.5 of SABS 0221-1988
Puncture Resistance
(maximum), mm 26 32 Clause 8114
Water Percolation
(minimum), l/m2/s 20 20 3.7 of SABS 0221-1988
Table 2.14: Geotextile classification for drainage and filtration (COLTO, 1988)
As an example of the shortcomings, one should note that the geotextile strengths are
specified at 10% elongation, while geotextiles are known to function beyond this limit and are
particularly of benefit where large deformations must be accommodated. In view of these
shortcomings, the intention is to adopt international specifications rather than trying to
update existing specifications. SABS is a participating body of the International Organization
for Standardization (ISO). This provides the opportunity to adopt ISO standards and provide
them as South African National Standard (SANS) at relatively small cost. SABS has recently
formed Working Group 5: Geotextiles under Sub Committee 59J: Geosynthetics, to
investigate the ISO standards and to adopt them in a structured fashion.
2.25 CONCLUSION
This chapter has reviewed and discussed the different polymers and types of commercially
available geotextiles available in modern times. Their characteristics and their expected
performance as filtration media were discussed. Examples of geotextiles as filters were
illustrated, as well as the theoretical mechanisms of filtration. Further review were done on
the important criteria needed for geotextiles to function as filters, with reference to the theory
of natural soil filters. These criteria are permeability, retention, porosity and thickness.
Together, going forward, these criteria would form a coherent set of criteria to allow for the
Stellenbosch University http://scholar.sun.ac.za

56
safe design of geotextile filters. Long term durability of geotextiles, as well as various filter
criteria, were discussed.
Soils are infinitely different and so are their behaviour. It is good to bear cognisance of the
theories and criteria presented. When it comes to geotextile filter design, it is not to say that
these theories will present a definite answer to all soil types. The research contained in this
thesis is assessing only Berea sand’s compatibility with various commercially available
geotextiles commonly found in South Africa.
The aforementioned criteria given in this chapter are set to give a broad description of the
expected behaviour of soil in various category envelopes, but are not confined to a single
soil type, which in this case is the sands of the Berea formation. It is therefore critical,
depending on the nature of the project, to assess the filter criteria of each soil type in
isolation, and also to carry out further laboratory testing to substantiate the theory in every
case.
The next chapter will discuss the test method used for conducting the research, as well as
the engineering properties of the candidate soils and geotextiles. A computer spreadsheet
predictive model for the comparison of laboratory tests will also be briefly discussed.
Stellenbosch University http://scholar.sun.ac.za

57
Chapter 3 - Method
3.1 INTRODUCTION
The purpose of the laboratory study was to evaluate and report on the behaviour of three
different types of Berea sand found along the KwaZulu-Natal coastline when in intimate
contact with four commercially available geotextiles. Test outcomes would assist in
determining the following:
a) The clogging potential of the soil to geotextile system.
b) How the soil’s co-efficient of uniformity (Cu) influences the selection of the geotextile
filter.
c) The evaluation of a geotextile type in terms of its fabrication.
d) The design methods available that can be considered in a South African context.
In addition, a computer prediction model was incorporated into the study in order to compare
its results with the laboratory results. Furthermore, in this chapter, the test methodology and
engineering properties of the materials used in this research are discussed. The computer
spreadsheet used for predictive modeling is also referred to during the latter part of this
chapter.
3.2 RESEARCH DESIGN
Based on previous research done on soil to geotextile compatibility testing, it was decided to
carry out laboratory testing according to internationally accepted ASTM D5101, Standard
Test Method for Measuring the Soil-Geotextile System Clogging Potential by the Gradient
Ratio also known as the long term gradient ratio test (LTGRT). The LTGRT has been
developed by the US Army Corps engineers. The LTGRT measures the performance of soil
to geotextile permeability systems in cohesionless soils under unidirectional flow conditions.
It is designed to detect clogging, if any, of soil to geotextile systems. The general assumption
of the gradient ratio test is that a geotextile clogging level can be inferred from the gradient
ratio of hydraulic gradients in different zones of the soil to geotextile system. The test
apparatus is illustrated in Figure 3.1.
3.3 TESTING FACILITIES
The LTGRT was carried out at Geolaboratory in Durban, South Africa. Geolaboratory is a
third party quality control geosynthetics testing facility that carries out both internal and
Stellenbosch University http://scholar.sun.ac.za

58
external commercial testing. The apparatus at Geolaboratory is illustrated in Figure 3.2. The
apparatus measures approximately 1.5 m in length, 0.8 m in depth and 2 m in height. A total
of eight test permeameters can be operational simultaneously. To accommodate both
research and commercial testing it was decided to occupy only four permeameters at any
given time
Figure 3.1: LTGRT apparatus: ASTM D5101-01
It was noted that there were slight modifications in the apparatus used at Geolaboratory
compared to that described in the ASTM D5101 method. The main differences are
highlighted as follows:
The positioning of the inlet and outlet of the apparatus at Geolaboratory, which were situated
directly at the top and bottom, respectively, of the perspex cylinders, as opposed to
positioning them at right angles, as described in ASTM D5101
The Geolaboratory apparatus had seven standpipes of 8 mm diameter connected to one
side of the perspex cylinder only. The ASTM method describes the apparatus as having only
six standpipes.
Stellenbosch University http://scholar.sun.ac.za

59
The Geolaboratory apparatus can accommodate a soil sample of 200 mm in depth, as
opposed to 100 mm depth required by the ASTM D5101 method.
The apparatus in Geolaboratory did not have any vent valves positioned at the top and the
bottom of the permeameter.
The differences in the apparatus illustrated above should not have a negative effect on the
end results.
Figure 3.2: Long term gradient ratio test apparatus (Geolaboratory, Durban)
3.4 TEST MATERIAL ENGINEERING PROPERTIES
3.4.1 Geotextile properties
For the purpose of this research the names of the manufacturers were omitted and generic
nomenclature was used. The geotextiles all weighed between 110 g/m2 and 130 g/m2. The
geotextiles used for the research were as follows:
3.4.1.1 Woven slit film polypropylene geotextile (W-SLF-PP)
These geotextiles are made from long strips of polypropylene film, which are laid flat during
a mechanical weaving process. The strips are laid closely together and as a result there are
only limited openings in the fabric.
Stellenbosch University http://scholar.sun.ac.za

60
3.4.1.2 Nonwoven continuous filament needle-punched polyester geotextile (NW-N-CF-PET).
Continuous filament geotextiles are produced from fibres that are drawn from melted
polymer that is extruded through spinnerets. The fibres are continually extruded, drawn,
cooled and distributed to form a continuous web. The web is bonded by a needle punching
process. This type of geotextile is thicker in comparison with a woven or thermally bonded
geotextile.
3.4.1.3 Nonwoven needle punched staple fibre polypropylene geotextile with thermalafter treatment (NW-N-SF-PP)
Staple fibre nonwovens are manufactured from fibres of short lengths ranging from
approximately 20 mm to 150 mm. The fibres are mixed and laid by carding machines or
pneumatic web forming systems. There is a preferential orientation of the fibres, which has
an influence on the isotropic strength of the geotextile.
3.4.1.4 Nonwoven and heat bonded continuous filament polypropylene geotextile(NW-HB-SF-PP).
Thermally bonded non-woven geotextiles are manufactured by spraying polymer filaments
onto a moving belt which is then passed through heated rollers. These heated rollers
compress the layer of loose filaments and cause partial melting of the polymer filaments,
which leads to thermal bonding at the filament cross-over points. The random distribution of
the filaments as they are sprayed on to the belt ensures that the geotextile contains a wider
range of opening sizes than is found in a woven geotextile. As there is no preferred
orientation of the filaments during production, such as the warp and weft directions present
in geotextiles, better isotropic strength is achieved. Thermally bonded geotextiles are
relatively thin in comparison with geotextiles which do not have thermal treatment. The
generic specifications of the specimen geotextiles used in the research are listed in Table
3.1.
Stellenbosch University http://scholar.sun.ac.za

61
Properties Notes Unit W-SLF-PP
NW-N-CF-PET
NW-N-SF-PP
NW-HB-CF-PP
Test Method
Mass Nominal g/m2 120 130 130 110 ASTM D5261
Thickness Under 2kPa mm 0.7 1.4 0.8 0.43 ASTM D5199
Throughflow @50mmhead
l/s/m2 20 125 70 30 ASTM D4491
Permeability @50mmhead
m/s(10-4)
2.8 4 0.07 2.9 ASTM D4491
Permittivity s-1 N/A 2.7 1.4 0.6 ASTM D5199
Transmissivity m2/s N/A 8.9E-6 N/A ASTM D4716
Tensile strength Average kN/m 19 6 10 7.3 ASTM D4595
Elongation atbreak
% 16 60 >45 52
PunctureResistance(CBR)
Penetrationload (50mm)
N 2600 1300 1700 1100 ASTM D6241
Trapezoidal TearStrength
Average N 300 240 N/A 290 ASTM D4533
Grab Strength Average N 525 500 N/A 625 ASTM D4632
Burst Strength MPa N/A 1.5 N/A N/A ASTM D3786
Pore Size O95 μm 670 205 85 140 ASTM D4751
UV Resistance AS 3706.11
Table 3.1: Geotextile specifications as on manufacturer’s data sheets.
Stellenbosch University http://scholar.sun.ac.za

62
where:
g/m2 = grams per square meter
mm = millimetres
ℓ/s/m2 = litres per second per square meter
m/s = meters per second
s-1 = seconds to the negative power of one
m2/s = square meters d per second
kN/m = kilo Newton per meter
N = Newton
MPa = Mega Pascal
μm = Micrometers
3.4.2 Soil properties
For the purpose of the investigation, three different soil samples were used that were all
classified under the Berea sand formation. The main varying property was the plasticity
index (PI), according to which the first and second soil samples were non-plastic (PI=0) and
the third soil sample had a PIs of 7%.
Field samples were collected at various locations along the Durban coastline by Geosure
(Pty) Ltd, a geotechnical laboratory in Durban. Soil grading tests were compared for control
between Geosure geotechnical laboratories and Geosynthetic Laboratory in Pinetown. The
grading analysis results are illustrated in Figure 3.3. Full soil indicator laboratory tests were
carried out on the three Berea soil samples according to the TMH1 method A1 - A3 and
results are shown in Table 3.2.
Stellenbosch University http://scholar.sun.ac.za

63
Figure 3.3 Grading analysis of Berea sands
Soil Sample 1 Soil Sample 2 Soil Sample 3
Plasticity Index (%) Non Plastic (NP) 7 Non Plastic (NP 2)
Maximum Dry Density (kg/m3) 1861 1980 2052
Optimum moisture content (%) 8.9 13 10
TRH Classification G7 G10 G10
Co-efficient of uniformity (Cu) 7 76 112
Table 3.2 Summary of parameters of Berea sands
SoilSampleno.
d10
(mm)d20
(mm)d30
(mm)d50
(mm)d60
(mm)d85
(mm)
1 0.040 0.122 0.172 0.261 0.316 0.612
2 0.002 0.037 0.102 0.184 0.206 0.343
3 0.002 0.053 0.073 0.188 0.223 0.364
Table 3.3: dx of all the soil sampleswhere dx = dimension of soil particle size where x per cent is smaller.
0
25
50
75
100
0.0010 0.0100 0.1000 1.0000 10.0000
Perc
enta
ge P
assi
ng
Sieve Size mm
Particle Size Distribution Curve
Sample 1 Sample 2 Sample 3
Stellenbosch University http://scholar.sun.ac.za

64
All the soil samples’ vital parameters are illustrated in Table 3.3 above. These parameters
would prove useful when comparing regional filter criteria later in Chapter 5.
3.5 TEST DESCRIPTION
The long term gradient ratio test (LTGRT) apparatus has been discussed previously in this
chapter. During the test, water flows vertically downward through a permeameter that is filled
with a column of soil situated above a candidate geotextile. Standpipes and their positioning
are found along one side of the test apparatus. The purpose of the stand-pipes was to
monitor the water head at various points along the height of the permeameter.
The change in the flow rate was also monitored over time in order to calculate the entire
system’s permeability. If three consecutive similar flow readings were recorded at the outlet,
the system was classified as stable and the test was stopped. The gradient ratio over time
could then be calculated, which would give an idea of the clogging potential of the soil to
geotextile system. This is discussed later in this chapter. Furthermore, the permeability of
the soil and the soil to geotextile interface could be calculated. If the permeability of the soil
to geotextile interface fell below that of the soil, then the geotextile was considered to have
failed.
3.6 TEST SETUP AND PREPARATION
No scaling was necessary in order to perform the laboratory tests. The geotextile to soil tests
were simulated on a one to one scale, as would be encountered in the field.
Approximately 1000 grams of each soil was used for the long term gradient test. The soil
was oven dried for 24 hours at 200 °C. The candidate geotextile sample was cut into circular
specimens of 132 mm in diameter (Figure 3.4). The geotextile specimen was then placed
onto the base plate of the permeameter cylinder.
Stellenbosch University http://scholar.sun.ac.za

65
Figure 3.4: Berea soil sample with candidate geotextiles cut into discs (Author)
A steel support screen was placed on the base. The candidate geotextile disc was placed on
top of the steel mesh screen. The purpose of the steel mesh screen was to prevent the
geotextile from sagging into the base of the apparatus due to the soil load (Figure 3.5 and
Figure 3.6).
Figure 3.5: Steel support screen situated in base piece (Author)
Stellenbosch University http://scholar.sun.ac.za

66
Figure 3.6: Geotextile specimen placed on top of steel screen on base (Author)
After placing the geotextile onto the mesh screen, a perspex cylinder with an internal
diameter of 100 mm was placed on top of the permeameter base (Figure 3.7). The candidate
soil was placed into the permeameter, directly on top of the candidate geotextile, in layers of
approximately 25 mm. This was continued until a total soil thickness of 100 mm had been
achieved. A certain degree of compaction was obtained by hand tamping the cylinder ten
times on each opposite side whilst filling the cylinder with the candidate soil. Care was taken
not too tamp the cylinder too vigorously, as premature piping and loss of fines through the
geotextile could occur during this preparation stage. Subsequently, a 50 mm thick layer of
clean silica sand was carefully placed directly on top of the candidate soil. This layer of silica
sand was also placed in 25 mm layers. The purpose of the silica sand was to prevent the
Berea soil sample from being disturbed during the wetting up process, as described below.
Another purpose of the silica sand was to confine the Berea soil sample that was being
tested. A cover was attached to the top of the permeameter, which also had a water inlet
connected to it. Standpipes of 8 mm diameter were connected to outlet ports on one side of
the cylinder at pre-determined positions as described later in this section.
Stellenbosch University http://scholar.sun.ac.za

67
Figure 3.7: Permeameter ready to receive soil sample and top cover
The inlet pipes that were connected to the top and bottom of the permeameter were 16 mm
in diameter. The system underwent a wetting process from the bottom, whereby taps 2 and
3 were opened (Figure 3.8). Taps 1 and 4 remained closed during this period (Figure 3.8).
Water was fed from a reservoir situated on top of the apparatus (Figure 3.8). The wetting
process, which occurred in 25 mm increments, was slow so as not to disturb the soil to
geotextile interface within the permeameter. The purpose was to achieve soil saturation
before the start of the test. The wetting process for each set of tests ranged from
approximately one to two weeks. During the wetting process the water’s meniscus rose
slowly through the soils within the permeameter.
Stellenbosch University http://scholar.sun.ac.za

68
Figure 3.8: LTGRT flow diagram
After the water meniscus level had risen approximately 20 mm above the silica sand in the
permeameter cylinder, tap 2 was closed. Subsequently, tap 1 was opened and the system
was allowed to fill up with water from the top only. This was also done very slowly, in order
not to disturb the soil sample within the cylinder. Once this had been achieved, the hydraulic
head was pre-determined by adjusting the meniscus level in standpipe 1 in relation to the
level of the elbow at the outlet (Figure 3.8). This height difference was set at 100 mm. The
height difference was then divided by the soil sample height, also 100 mm, to result in a pre-
determined hydraulic gradient of 1. For the purpose of the testing a hydraulic gradient of one
(1) was chosen, as referenced in Table 2.1 in Chapter 2 for a typical roadside sub surface
drain (Giroud 1996). At this point, readings of the water levels in all the standpipes were
Tap 1
Tap 2 Tap 4
Tap 3
Geotextile
7
1
6
1
4
1
3
1
2
1
1
1
5
1
Standpipe Number
Wastewater
Water reservoir
Elbow
Water Mains
Inlet
Outlet/Inlet
Stellenbosch University http://scholar.sun.ac.za

69
taken. At this stage tap 2 was still closed. The system was left to stand for a period of 24
hours. This concluded the sample preparation stage. After the 24 hour period had lapsed,
tap 2 and 4 were re-opened and tap 3 was closed and the LTGRT test was started. The
aforementioned process was repeated for all 12 LTGRTs.
3.7 TESTING
Figure 3.9 below, illustrates an actual LTGRT taking place as part of this research.
Figure 3.9 Typical testing at Geolaboratory
The ports on the apparatus at Geolaboratory were vertically spaced at 25 mm intervals,
except for the two bottom most ports, which were spaced at 50 mm from each other. This
was to allow the soil to geotextile interface to be situated precisely between the two ports
numbered 6 and 7 (Figure 3.9). This meant that the soil to geotextile interface would be 25
mm away from both port 6 and port 7.
As the apparatus could accommodate a soil sample of up to approximately 200 mm in depth,
ports number 2, 3 and 4 were redundant, as the hydraulic head readings in these standpipes
would be the same, due them all being positioned in water. The LTGRT apparatus was
connected to a water reservoir situated directly above the bank of permeameters. One water
reservoir fed up to four permeameters simultaneously. This reservoir was in turn connected
to another storage tank situated in the laboratory, which was connected to the municipal
Outlet
Berea sand sample
Water
Clean silicasand
Soil/geotextileinterface
Inlet
Port 7
Port 6
Port 5
Port 1
Port 2
Port 3
Port 4
Stellenbosch University http://scholar.sun.ac.za

70
water mains. After one hour into the test, the flow rate of water passing through the entire
system was measured at the outlet. This was achieved by collecting the water passing
through the outlet into a measuring beaker over a period of one hour. Flow rate was
measured in millilitres per minute (ml/min). Subsequent to this, flow readings were taken on
a twenty four hourly basis. Therefore permeability of the entire system could be calculated at
regular intervals, using Darcy’s equation:
Q= kAi
The temperature in the laboratory was kept at approximately 20 degrees Celsius. When the
flow rates were found to be the same over three consecutive days, the flow of water through
the system was stopped at the inlet. The gradient ratio (GR) over time could be calculated
using the following equation (ASTM D5101):
GR = (Δhsf / Lsf) / ( Δhs / Ls) = LsΔhsf / LsfΔhs
where:
Δhs = [(S2 – S4) + (S3 – S5)] / 2
Δhsf = [(S4 – S6) + (S5 – S6)] / 2
Sn = the standpipe reading in cm for the standpipe numbered n.
Ls = 50mm
Lsf = 25mm + the geotextile thickness
Refer to Figure 3.10 as a reference diagram.
Stellenbosch University http://scholar.sun.ac.za

71
Figure 3.10: Values for calculating gradient ratios (ASTM D5101)
Due to the modifications of the apparatus at Geolaboratory, the formula used for the gradient
ratio was modified as follows:
where:
Δhs = (S2 – S4)
Δhsf = (S4 – S6)
Sn, Ls, Lsf remain as defined.
3.8 INTERPRETATION OF THE GRADIENT RATIO
According to ASTM D5101, a gradient ratio of 1 is desirable and this renders a soil to
geotextile system which has good compatibility. A gradient ratio of more than 1 suggests that
the soil to geotextile system is tending towards clogging. Previous research by others has
suggested that the upper limit for the gradient ratio should be 3. For the purposes of this
research, a gradient ratio of 3 and above would be considered as a soil to geotextile
system’s tendency towards failure due to clogging.
Stellenbosch University http://scholar.sun.ac.za

72
On the other hand, a gradient ratio of less than 1 suggests that piping of the soil through the
geotextile has occurred. A rapid decline in gradient ratio at any point suggests that excessive
piping of soil has occurred and this can have the effect of blocking up the drainage system
and lead to subsequent failure as a result. The gradient ratio results, analysis and
interpretation thereof will be discussed in detail in further chapters of this thesis.
3.9 PERMEABILITY
Height readings of the water levels in the standpipes were taken with a tape measure and
manually recorded. Initial readings were taken at the start of the flow test. Subsequent
readings were taken at the start of the flow tests and then at 24 hourly intervals. The quantity
of water flowing through each system was also recorded on a 24 hourly basis. This quantity
was measured at the outlet of the permeameter. In this way, the permeability of the system
could be calculated using Darcy’s equation:
Q = k (ΔH / ΔL) A
If the permeability of the soil to geotextile system results in permeability lower than that of
the soil, the soil to geotextile system has failed. Luettich et al. (1992) had suggested that the
permeability of the soil to geotextile system need only be more than that of the soil tested, in
order for it to be satisfactory.
3.10 CONSTRICTIONS
An evaluation was done of the geotextiles filtration characteristics in relation to its number of
constrictions Ns. This was achieved by calculating the candidate geotextile’s number of
constrictions by using the equation below (Giroud 1996):
Ns = √ (1-P) x (geotextile thickness/fibre diameter)
where:
P = Porosity of the geotextile expressed as a percentage
A value Ns of between 25 and 40 is desirable for a geotextile to function optimally as a filter.
(Giroud 1996) The geotextile parameters were obtained from the manufacturer’s data sheets
and, where information was not published, it was requested from the manufacturers.
Stellenbosch University http://scholar.sun.ac.za

73
3.11 DESKTOP COMPUTER ANALYSIS
A computer spread sheet program, developed by Kaytech, was used to predict the geotextile
filter specification requirements. The predicted computer results would be used to compare
with the actual laboratory test results. The computer model was based on the flow chart
below (Figure 3.11).
Figure 3.11: Flow chart for computer spreadsheet (Kaytech)
The input parameters of the spread sheet were based on:
Soil zone classification (Figure 3.12)
Water flow conditions (unidirectional)
Dispersive, non-dispersive or poor soil conditions
Relative density (RD) of soil
Permeability
Survivability
where:
Loose soil = RD < 35%Medium dense soil = 35% < RD > 65%Dense soil = RD > 65%
Stellenbosch University http://scholar.sun.ac.za

74
Figure 3.12: Soil zone classification (Luettich et al. 1992)
Based on the input parameters selected, the program would provide a required generic
specification for a geotextile filter for the prevailing conditions. Table 3.3 below highlights the
important parameters for the required geotextile filter, as well as the associated test
methods. Any geotextile which meets these criteria could potentially be selected as the filter.
For critical filter applications where geotextiles are proposed as filters in dams, deep
excavations and tailings dam drainage, the program should not be used in isolation.
Table 3.3: Generic geotextile filter specification (Kaytech)
Geotextile Properties Test Method Units
Trapezoidal Tear Across ASTM D4533 N
CBR 50mmprobe SANS 10221-2007 kN
Dart Test Dia. ofhole EN ISO 13433-2006 mm
Tensile Strength Across SANS 10221-2007 kN/m
Permeability @ 100mm head SANS 10221-2008 m/s
Pore size O95 EN ISO 12956-1999 m
3.12 MICROSCOPE IMAGING
Post-test imaging of the contaminated geotextiles was done at the microscopy and
microanalysis unit at the University of KwaZulu-Natal, using a scanning electron microscope
Stellenbosch University http://scholar.sun.ac.za

75
(SEM). This was done to assist in visual assessment of the contaminated geotextiles. These
results will be presented and discussed in Chapter 4.
3.13 LIMITATIONS
Limitations were noted during the experimental phase of the research and are discussed
below.
3.13.1 Applied vertical stress
No vertical stress was applied to the soil sample, as this is a limitation of the apparatus used.
A modified gradient ratio test apparatus has been developed by others, which was not
pertinent to the outcomes that this research was trying attempting to achieve.
3.13.2 Hydraulic gradient
For the purpose of this research a hydraulic gradient of one (1) was used. Most drainage
and filtration applications are situated where low hydraulic gradients are prevalent, for
example, sports field drainage, and road and railway drainage. The results for low hydraulic
heads would also give us enough understanding of how the geotextiles performed as filters.
3.13.3 Algae and iron oxide suppressants
No additives for the prevention of algae and ferric oxide formation were added to the water,
as the testing time would not be long enough to warrant the use of these additives.
3.13.4 Soil samples
The number of soil to geotextiles permutations was limited to twelve. This equated to three
soils and four geotextiles. The main reasons for this were to keep the testing within the time
constraints of this study, and to keep it concise. It was also felt that enough data could be
extracted from this number of tests in order to deduce some meaningful conclusions.
3.14 CONCLUSION
This chapter has summarised the method which was used to try and achieve the desired
outcomes of the study. A description of the laboratory tests, as well as the materials used,
was given. This chapter further discussed the computer model with its associated parameter
predictions. With any testing there are limitations, and these were also alluded to in this
Stellenbosch University http://scholar.sun.ac.za

76
chapter. In the following chapter the results obtained from the long term gradient ratio tests
and from the computer program will be presented.
Stellenbosch University http://scholar.sun.ac.za

77
Chapter 4 - Test Results
4.1 INTRODUCTION
A total of 12 long term gradient ratio tests (LTGRT) were carried out, which consisted of four
variants of geotextiles exposed to three types of Berea sand. The sands were selected on
the basis of their plasticity indices, as well as their silt to clay ratios. It was decided to limit
the tests to three types of sand as this provided a sufficient base to understand the
behaviour of soil to geotextile systems for Berea sand. Each LTGRT was exposed to a
hydraulic gradient of 1. A hydraulic gradient (is) of 1 was used for all test permutations, to
enable comparison and mathematical correlation during the analysis. Twelve soil-to-
geotextile LTGRT tests were carried out, as illustrated in Table 4.1 below.
Test Number Soil SampleNo.
Soil PI (%) HydraulicGradient
Geotextile Type
1 1 NP 1 NW-N-CF-PET
2 1 NP 1 NW-N-SF-PP
3 1 NP 1 NW-HB-CF-PP
4 1 NP 1 W-SLF-PP
5 2 7 1 NW-N-CF-PET
6 2 7 1 NW-N-SF-PP
7 2 7 1 NW-HB-CF-PP
8 2 7 1 W-SLF-PP
9 3 NP (2)* 1 NW-N-CF-PET
10 3 NP (2)* 1 NW-N-SF-PP
11 3 NP (2)* 1 NW-HB-CF-PP
12 3 NP (2)* 1 W-SLF-PP
Table 4.1: Summary of soil to geotextile tests performed
* where this is the second sample of non-plastic soil.
Stellenbosch University http://scholar.sun.ac.za

78
Figure: 4.1: Reference diagram illustrating standpipe numbers on the LTGRT testapparatus
For easy reference, the LTGRT diagrammatic layout is illustrated in Figure 4.1 above. The
soil to geotextile interface is situated in between standpipes No 6 and 7. Therefore the
observations between standpipes 6 and 7 can be regarded as the most important.
Soil
Water
Water
Silica
Stellenbosch University http://scholar.sun.ac.za

79
4.2 NON-PLASTIC SAND VS. NW-N-CF-PET GEOTEXTILE: TEST NO. 1
Standpipe Readings - mm
Standpipe Number
Test Permeability Sample 1 2 3 4 5 6 7
Cumulative Quantity Duration k Height 300 250 200 150 100 50 0
Hours ml min m/s mm Inlet Silica Sand Soil Sample Outlet
1 150 60 4.348E-06 100 1582 1582 1582 1582 1576 1492 1460
8 135 60 3.914E-06 100 1582 1582 1582 1582 1576 1500 1460
72 90 60 2.609E-06 100 1582 1582 1582 1582 1578 1492 1460
96 75 60 2.174E-06 100 1582 1582 1582 1582 1575 1482 1460
120 60 60 1.739E-06 100 1582 1582 1582 1582 1575 1475 1460
144 60 60 1.739E-06 100 1582 1582 1582 1582 1575 1495 1460
168 60 60 1.739E-06 100 1582 1582 1582 1582 1575 1495 1460
Table 4.2: Soil to geotextile permeability and standpipe readings vs. time for test no. 1
The first test ran for approximately 168 hours before flow equilibrium was reached
throughout the entire system (Table 4.2). The sample specimen height for all tests was 100
mm. As in ASTM D5101, all the test readings were stopped when three consecutive
unchanged readings in terms of quantity of water, in millilitres, had been observed.
Equilibrium flow was achieved from approximately 120 hours onwards. The flow results
showed that there was a reduction in the system permeability from the start to the end of the
test. Readings in the standpipes numbered 1-4 were constant. The reduction in permeability
was observed as illustrated in Figure 4.2. It was also observed that the head difference
between standpipes 1 and 7 was 122 mm, as opposed to the desired 100 mm. The
difference is attributable to the pressure in the municipal mains and should not have a
negative effect on the outcomes of the test results. Head differences closest to 100 mm can
therefore be expected for all the testing going forward between standpipes 1 and 7.
Stellenbosch University http://scholar.sun.ac.za

80
Figure 4.2: permeability vs. time of entire system: Test no. 1
In Figure 4.2 it was observed that there was a general drop in permeability between
standpipes 4-5 at approximately 75 hours into the test.
Figure 4.3: Permeability analyses between standpipes 4-5; 5-6 and 6-7: Test no. 1
The permeability between standpipes 5 and 6 showed a constant decrease and after
approximately 125 hours it started to increase slightly, and this continued to the end of the
test (Figure 4.3). It was observed that the permeability between standpipes 6 and 7 was
higher than that between standpipes 5 and 6. This means that the soil to geotextile
permeability was higher than that of the soil itself, and therefore should be acceptable. Head
readings throughout all tests were measured and are obtainable in Appendix A of this thesis.
1.00E-06
1.00E-05
1 51 101 151 201
Perm
eabi
lity
(m/s
)
Time (hours)
1.00E-06
1.00E-05
1.00E-04
0 50 100 150 200
Pem
eabi
lity
(m/s
)
Time (Hrs)Standpipes 4&5 Standpipes 5&6 Standpipes 6&7
Stellenbosch University http://scholar.sun.ac.za

81
Figure 4.4: Gradient ratio vs. time: Test no. 1
Gradient ratios versus time were recorded and are illustrated in Figure 4.4. The gradient
ratios were calculated according to the formula discussed in Chapter 3. It was observed that
the gradient ratio increased slightly at the beginning of the test and showed a gradual
decrease during the middle third of the test. An increase in gradient ratio was observed
toward the end of the test. The gradient ratio at the end of the test was 0.846. From the test
result, it is evident that the geotextile performed well as a filter with the soil tested.
4.3 NON-PLASTIC SAND VS. NW-N-SF-PP GEOTEXTILE: TEST NO. 2
The second LTGRT test lasted 288 hours (Table 4.3). A difference in inlet and outlet
readings was observed, when compared with test No.1. The reading in standpipe 5
remained constant from approximately 120 hours until completion of the test. The test was
stopped after 288 hours after three consecutive identical readings of 40 ml over a one hour
period had been recorded (Table 4.3)
0.000
0.200
0.400
0.600
0.800
1.000
1.200
1 8 72 96 120 144 168
Gra
dien
t Rat
io
Time (Hrs)
Stellenbosch University http://scholar.sun.ac.za

82
Table 4.3: Summary of soil to geotextile permeability and standpipe readings vs. time:Test no. 2
Standpipe Readings - mm
Standpipe number
Test Permeability Sample 1 2 3 4 5 6 7
Accumulative Quantity Duration k Height 300 250 200 150 100 50 0
Hours ml min m/s mm Inlet Silica Sand Soil Sample Outlet
1 117 60 4.138E-06 100 1578 1578 1578 1578 1572 1490 1478
8 115 60 4.067E-06 100 1578 1578 1578 1578 1572 1490 1478
72 115 60 4.067E-06 100 1578 1578 1578 1578 1567 1488 1478
96 100 60 3.537E-06 100 1578 1578 1578 1578 1565 1488 1478
120 70 60 2.476E-06 100 1578 1578 1578 1578 1560 1488 1478
144 60 60 2.122E-06 100 1578 1578 1578 1578 1560 1488 1478
168 55 60 1.945E-06 100 1578 1578 1578 1578 1560 1485 1478
240 40 60 1.415E-06 100 1578 1578 1578 1578 1560 1485 1478
264 40 60 1.415E-06 100 1578 1578 1578 1578 1560 1485 1478
288 40 60 1.415E-06 100 1578 1578 1578 1578 1560 1485 1478
Stellenbosch University http://scholar.sun.ac.za

83
Figure 4.5 Permeability vs. time of entire system: Test no. 2
Similar to test number 1, a reduction in permeability was observed over time for the entire
system (Figure 4.5). It was observed that the permeability of the system was brought to
equilibrium much more quickly than was the case in test No 1.
Figure 4.6 Permeability vs. time across standpipes 4-5; 5-6 and 6-7: Test no. 2
Figure 4.6 illustrates that the reduction in permeability between standpipes 4 and 5 as well
as 5 and 6 followed an even trend downwards. The permeability between standpipes 6 and
7 also showed a reduction in permeability but not at the same rate as across standpipes 4
and 5 and 5and 6. Also interesting to note is that at the beginning of the test, the
permeability between standpipes 6 and 7 is higher than that between standpipes 5 and 6.
The test also ends with the highest permeability across standpipes 6 and 7. The soil to
1.00E-06
1.00E-05
0 50 100 150 200 250 300 350
Perm
eabi
lity
(m/s
)
Duration (hours)
1.00E-07
1.00E-06
1.00E-05
1.00E-04
0 50 100 150 200 250 300 350
Perm
eabi
lity
(m/s
)
Time (hours)Standpipes 4&5 Standpipes 5&6 Standpipes 6&7
Stellenbosch University http://scholar.sun.ac.za

84
geotextile permeability was observed to be higher than that of the soil and, therefore, should
be acceptable.
Figure 4.7 Gradient ratios vs. time: Test no. 2
The gradient ratio was observed to start at a relatively low level and continued to decrease
slightly to stability towards the end of the test (Figure 4.7). A rapid decline in gradient ratio
was observed between 144 hours and 168 hours. This was indicative that the fine soil
particles had piped through the geotextile. The gradient ratio ended at 0.180. The test result
shows that a piping of the finer soil particles had occurred through the geotextile, which is
not desirable.
4.4 NON- PLASTIC SAND VS. WITH NW-HB-CF-PP GEOTEXTILE: TEST NO. 3
Test number 3 endured for 504 hours (Table 4.4). It was observed that the readings in
standpipes 5 and 6 remained constant from approximately 144 hours onwards. Three
consecutive readings of 100 ml were recorded at the end of the test.
0.000
0.050
0.100
0.150
0.200
0.250
0.300
1 8 72 96 120 144 168 240 264 288
Gra
dien
t Rat
io
Time (Hrs)
Stellenbosch University http://scholar.sun.ac.za

85
Table 4.4: Summary of soil to geotextile permeability and standpipe readings vs.time: Test no. 3
Standpipe Readings - mm
Test Permeability Sample 1 2 3 4 5 6 7
Accumulative Quantity Duration k Height 300 250 200 150 100 50 0
Hours ml min m/s mm Inlet Silica Sand Soil Sample Outlet
1 225 60 7.958E-06 100 1575 1575 1575 1575 1565 1520 1475
8 200 60 7.074E-06 100 1575 1575 1575 1575 1565 1520 1475
72 135 60 4.775E-06 100 1575 1575 1575 1575 1562 1514 1475
96 135 60 4.775E-06 100 1575 1575 1575 1575 1562 1514 1475
120 100 60 3.537E-06 100 1575 1575 1575 1575 1555 1510 1475
144 100 60 3.537E-06 100 1575 1575 1575 1575 1550 1505 1475
168 91 60 3.218E-06 100 1575 1575 1575 1575 1550 1505 1475
240 80 60 2.829E-06 100 1575 1575 1575 1575 1548 1505 1475
264 90 60 3.183E-06 100 1575 1575 1575 1575 1548 1505 1475
288 75 60 2.653E-06 100 1575 1575 1575 1575 1548 1505 1475
312 90 60 3.183E-06 100 1575 1575 1575 1575 1548 1505 1475
336 80 60 2.829E-06 100 1575 1575 1575 1575 1548 1505 1475
408 95 60 3.360E-06 100 1575 1575 1575 1575 1548 1505 1475
432 115 60 4.067E-06 100 1575 1575 1575 1575 1548 1505 1475
456 100 60 3.537E-06 100 1575 1575 1575 1575 1548 1505 1475
480 100 60 3.537E-06 100 1575 1575 1575 1575 1548 1505 1475
504 100 60 3.537E-06 100 1575 1575 1575 1575 1548 1505 1475
Stellenbosch University http://scholar.sun.ac.za

86
Figure 4.8: Permeability vs. time of entire system: Test no. 3
It was observed that the entire system’s permeability reduced up to a period of
approximately 300 hours, after which it increased until it reached stabilization at 588 hours.
Figure 4.9: Permeability vs. time across standpipes 4-5; 5-6 and 6-7: Test no. 3
The permeability between all standpipes dropped relative to each other for the entire
duration of the test. The highest residual permeability for this test was observed between
standpipes 5 and 6 (Figure 4.9). The permeability of the soil to geotextile was found to be
lower than that of the soil, and the combination, therefore, could be problematic.
1.00E-06
1.00E-05
0 100 200 300 400 500 600
Perm
eabi
lity
(m/s
)
Time (hours)
1.00E-06
1.00E-05
1.00E-04
0 200 400 600
Perm
eabi
lity
(m/s
)
Time (hours)Standpipes 4&5 Standpipes 5&6 Standpipes 6&7
Stellenbosch University http://scholar.sun.ac.za

87
Figure 4.10: Gradient ratio vs. time: Test no. 3
It was observed that the gradient ratio reduced and reached stabilisation after approximately
240 hours. Although the gradient ratio remained stable, the test was stopped once the
permeability of the system stabilised (Figure 4.10). The gradient ratio obtained at the end of
the test was 3.075. The result of this test showed that the geotextile had shown a marginal
tendency to clog.
4.5 NON-PLASTIC SAND VS. WITH W-SLF-PP GEOTEXTILE: TEST NO. 4
Test no. 4 had a duration of 480 hours (Table 4.5). A rapid decrease in permeability was
observed during the early stages of the test and it stabilised during the latter part of the test.
The reading in standpipe no. 5 stabilised after 144 hours and that of standpipe no. 6 after
240 hours.
The reduction in permeability of the system was fairly rapid over the early stages of the test
(Figure 4.11).
0
1
2
3
4
5
6
7
8
9
10
1 8 72 96 120 144 168 240 264 288 312 336 408 432 456 480 504
Gra
dien
t Rat
io
Time (Hrs)
Stellenbosch University http://scholar.sun.ac.za

88
Table: 4.5 Summary of soil to geotextile permeability and standpipe readings vs. time:Test no. 4
Standpipe Readings - mm
Test Permeability Sample 1 2 3 4 5 6 7
Accumulative Quantity Duration k Height 300 250 200 150 100 50 0
Hours ml min m/s mm Inlet Silica Sand Soil Sample Outlet
1 309 60 1.093E-05 100 1570 1570 1570 1570 1550 1520 1470
8 270 60 9.549E-06 100 1570 1570 1570 1570 1550 1520 1470
72 125 60 4.421E-06 100 1570 1570 1570 1570 1548 1486 1470
96 110 60 3.890E-06 100 1570 1570 1570 1570 1548 1486 1470
120 95 60 3.360E-06 100 1570 1570 1570 1570 1538 1485 1470
144 85 60 3.006E-06 100 1570 1570 1570 1570 1530 1480 1470
168 75 60 2.653E-06 100 1570 1570 1570 1570 1530 1480 1470
240 60 60 2.122E-06 100 1570 1570 1570 1570 1523 1475 1470
264 70 60 2.476E-06 100 1570 1570 1570 1570 1528 1475 1470
288 60 60 2.122E-06 100 1570 1570 1570 1570 1528 1475 1470
312 70 60 2.476E-06 100 1570 1570 1570 1570 1528 1475 1470
336 70 60 2.476E-06 100 1570 1570 1570 1570 1528 1475 1470
408 65 60 2.299E-06 100 1570 1570 1570 1570 1528 1475 1470
432 80 60 2.829E-06 100 1570 1570 1570 1570 1528 1475 1470
456 80 60 2.829E-06 100 1570 1570 1570 1570 1528 1475 1470
480 80 60 2.829E-06 100 1570 1570 1570 1570 1528 1475 1470
Stellenbosch University http://scholar.sun.ac.za

89
Figure 4.11: Permeability vs. time of entire system: Test no. 4
Figure 4.12: Permeability vs. time across standpipes 4-5; 5-6 and 6-7: Test no. 4
A reduction of permeability was observed between standpipes 4 and 5 as well as 5 and 6.
Between standpipes 6 and 7, an increase in permeability over time was observed (Figure
4.12). The soil to geotextile permeability was observed to be considerably higher than that of
the soil and, therefore, should be acceptable.
1.00E-06
1.00E-05
1.00E-04
0 100 200 300 400 500 600
Perm
eabi
lity
(m/s
)
Time (hours)
1.00E-06
1.00E-05
1.00E-04
0 200 400 600
Perm
eabi
lity
(m/s
)
Time (hours)Standpipes 4&5 Standpipes 5&6 Standpipes 6&7
Stellenbosch University http://scholar.sun.ac.za

90
Figure 4.13: Gradient ratio vs. time: Test no. 4
It was observed that the gradient ratio increased rapidly during the early parts of the test and
reduced to stabilisation after approximately 144 hours (Figure 4.13). Although the gradient
ratio stabilised at approximately 264 hours, the test was stopped after the permeability for
the entire system stabilised. The gradient ratio obtained at the end of the test was 2.436.
From this test result it was evident that the geotextile did not clog and showed relatively
good performance as a filter with the soil tested.
4.6 SAND WITH PLASTICITY INDEX OF 7 VS. NW-N-CF-PET GEOTEXTILE: TESTNO. 5
The test duration was 860 hours. It was noted that this test took a considerably longer time
to stabilise compared to that of tests numbered 1-4. It was also observed that there were
fluctuations in standpipe 5 up to approximately 840 hours into the test. Similarly, there were
also fluctuations in standpipe 6 up to about 900 hours into the test after it stabilised. The
permeability of the system was an order of magnitude of 1 more than that of tests 1-4 (Table
4.6).
0.000
1.000
2.000
3.000
4.000
5.000
6.000
7.000
1 8 72 96 120 144 168 240 264 288 312 336 408 432 456 480
Gra
dien
t Rat
io
Time (Hrs)
Stellenbosch University http://scholar.sun.ac.za

91
Table: 4.6 Summary of soil to geotextile permeability and standpipe readings vs. time:Test no. 5
Standpipe Readings - mm
Test Permeability Sample 1 2 3 4 5 6 7
Accumulative Quantity Duration k Height 300 250 200 150 100 50 0
Hours ml min m/s mm Inlet Silica Sand Soil Sample Outlet
1 1080 60 3.237E-05 100 1570 1570 1570 1570 1565 1510 1460
24 1125 60 3.617E-05 100 1570 1570 1570 1570 1550 1500 1460
48 1260 60 4.051E-05 100 1570 1570 1570 1570 1548 1492 1460
72 1250 60 4.421E-05 100 1570 1570 1570 1560 1540 1482 1460
96 1570 60 5.048E-05 100 1570 1570 1570 1570 1548 1475 1460
168 1400 60 4.716E-05 100 1570 1570 1570 1570 1550 1495 1460
192 1350 60 4.547E-05 100 1570 1570 1570 1570 1548 1495 1460
240 1275 60 4.295E-05 100 1570 1570 1570 1570 1543 1492 1460
264 1250 60 4.210E-05 100 1570 1570 1570 1570 1548 1492 1460
336 1200 60 3.858E-05 100 1570 1570 1570 1570 1550 1495 1460
360 1150 60 3.874E-05 100 1570 1570 1570 1570 1548 1493 1460
384 1150 60 3.874E-05 100 1570 1570 1570 1570 1548 1492 1460
408 1125 60 3.789E-05 100 1570 1570 1570 1570 1548 1490 1460
432 1100 60 3.705E-05 100 1570 1570 1570 1570 1548 1490 1460
504 1075 60 3.621E-05 100 1570 1570 1570 1570 1548 1490 1460
528 1025 60 3.453E-05 100 1570 1570 1570 1570 1548 1490 1460
552 1010 60 3.402E-05 100 1570 1570 1570 1570 1548 1490 1460
576 980 60 3.301E-05 100 1570 1570 1570 1570 1548 1490 1460
840 910 60 2.980E-05 100 1570 1570 1570 1570 1550 1492 1460
Stellenbosch University http://scholar.sun.ac.za

92
864 946 60 3.098E-05 100 1570 1570 1570 1570 1550 1492 1460
888 940 60 3.078E-05 100 1570 1570 1570 1570 1550 1492 1460
912 950 60 3.111E-05 100 1570 1570 1570 1570 1550 1492 1460
936 950 60 3.111E-05 100 1570 1570 1570 1570 1550 1492 1460
1008 937 60 2.589E-05 100 1570 1570 1570 1570 1550 1492 1460
1032 825 60 2.653E-05 100 1570 1570 1570 1570 1550 1490 1460
1056 905 60 2.910E-05 100 1570 1570 1570 1570 1550 1490 1460
1080 900 60 2.894E-05 100 1570 1570 1570 1570 1550 1490 1460
1104 890 60 2.862E-05 100 1570 1570 1570 1570 1550 1490 1460
1176 800 60 2.572E-05 100 1570 1570 1570 1570 1550 1490 1460
1200 790 60 2.540E-05 100 1570 1570 1570 1570 1550 1490 1460
1224 860 60 2.816E-05 100 1570 1570 1570 1570 1550 1480 1460
1248 860 60 2.816E-05 100 1570 1570 1570 1570 1550 1480 1460
1272 860 60 2.816E-05 100 1570 1570 1570 1570 1550 1480 1460
Figure 4.14: Permeability vs. time of entire system: Test no. 5
It was observed that after an initial increase in permeability, there was a gradual drop in
permeability up to the end of the test (Figure 4.14).
1.00E-05
1.00E-04
0 200 400 600 800 1000 1200 1400
Perm
eabi
lity
(m/s
)
Time (Hrs)
Stellenbosch University http://scholar.sun.ac.za

93
Figure 4.15: Permeability vs. time across standpipes 4-5; 5-6 and 6-7: Test no. 5
A reduction in permeability was observed across standpipes 4 and 5 as well as across
standpipes 5 and 6 (Figure 4.15). There was also an increase in permeability across
standpipes 6 and 7 at the start of the test, after which it dropped quite quickly. There was
also a slight increase in permeability towards the end of the test. The soil to geotextile
permeability was higher than that of the soil and therefore should be acceptable.
Figure 4.16: Gradient ratio vs. time: Test no. 5
The gradient ratio for this test showed a rapid decline up to approximately 96 hours (Figure
4.16). From this it is evident, that some of the fine soil material had passed through the
1.000E-05
1.000E-04
0 200 400 600 800 1000 1200 1400
Perm
eabi
lity
(m/s
)
Time (hours)Standpipes 4&5 Standpipes 5&6 Standpipes 6&7
0.0000.2000.4000.6000.8001.0001.2001.4001.6001.8002.000
1 48 96 192
264
360
408
504
552
840
888
936
1032
1080
1176
1224
1272
Gra
dien
t Rat
io
Time (Hrs)
Stellenbosch University http://scholar.sun.ac.za

94
geotextile due to the piping effect. This coincided with the high permeability observed
between standpipes 6 and 7 (Figure 4.15). Subsequently, the gradient ratio showed an
increase to approximately 1.2, after which it showed some stability up to approximately
1 200 hours into the test. The gradient ratio obtained at the end of the test was 0.542. From
this test result, it is evident that the geotextile did not clog and was compatible as a filter with
the soil tested.
4.7 SAND WITH PLASTICITY INDEX OF 7 VS. NW-N-SF-PP GEOTEXTILE: TESTNO. 6
Table: 4.7 Summary of soil to geotextile permeability and standpipe readings vs. time:Test no. 6
Standpipe Readings - mm
Standpipe Number
Test Permeability Sample 1 2 3 4 5 6 7
Accumulative Quantity Duration k Height 300 250 200 150 100 50 0
Hours ml min m/s mm Inlet Silica Sand Soil Sample Outlet
1 975 60 2.874E-05 100 1560 1560 1560 1560 1555 1505 1450
24 975 60 3.079E-05 100 1560 1560 1560 1560 1542 1495 1450
48 1010 60 3.247E-05 100 1560 1560 1560 1560 1542 1493 1450
72 1000 60 3.158E-05 100 1560 1560 1560 1560 1535 1480 1450
96 1325 60 4.184E-05 100 1560 1560 1560 1560 1544 1480 1450
168 1150 60 3.874E-05 100 1560 1560 1560 1560 1542 1486 1450
192 1100 60 3.705E-05 100 1560 1560 1560 1560 1540 1486 1450
240 1040 60 3.503E-05 100 1560 1560 1560 1560 1542 1486 1450
264 1040 60 3.344E-05 100 1560 1560 1560 1560 1540 1485 1450
336 1000 60 3.215E-05 100 1560 1560 1560 1560 1542 1486 1450
360 925 60 2.974E-05 100 1560 1560 1560 1560 1542 1486 1450
384 925 60 2.974E-05 100 1560 1560 1560 1560 1540 1485 1450
Stellenbosch University http://scholar.sun.ac.za

95
408 950 60 3.054E-05 100 1560 1560 1560 1560 1540 1485 1450
432 900 60 2.894E-05 100 1560 1560 1560 1560 1540 1485 1450
504 850 60 2.733E-05 100 1560 1560 1560 1560 1540 1485 1450
528 825 60 2.653E-05 100 1560 1560 1560 1560 1540 1485 1450
552 800 60 2.572E-05 100 1560 1560 1560 1560 1540 1485 1450
576 800 60 2.572E-05 100 1560 1560 1560 1560 1540 1485 1450
840 725 60 2.331E-05 100 1560 1560 1560 1560 1553 1495 1450
864 775 60 2.492E-05 100 1560 1560 1560 1560 1553 1495 1450
888 770 60 2.476E-05 100 1560 1560 1560 1560 1553 1488 1450
912 771 60 2.479E-05 100 1560 1560 1560 1560 1553 1488 1450
936 780 60 2.508E-05 100 1560 1560 1560 1560 1553 1488 1450
1008 760 60 2.444E-05 100 1560 1560 1560 1560 1553 1488 1450
1032 750 60 2.411E-05 100 1560 1560 1560 1560 1550 1490 1450
1056 730 60 2.347E-05 100 1560 1560 1560 1560 1550 1490 1450
1080 720 60 2.315E-05 100 1560 1560 1560 1560 1550 1490 1450
1104 720 60 2.315E-05 100 1560 1560 1560 1560 1550 1490 1450
1176 640 60 2.058E-05 100 1560 1560 1560 1560 1550 1490 1450
1200 640 60 2.058E-05 100 1560 1560 1560 1560 1550 1490 1450
1224 700 60 2.251E-05 100 1560 1560 1560 1560 1550 1488 1450
1248 700 60 2.251E-05 100 1560 1560 1560 1560 1550 1488 1450
1272 700 60 2.251E-05 100 1560 1560 1560 1560 1550 1488 1450
Test 6 had a duration of 1 272 hours (Table 4.7). A difference of 110 mm was observed
between the inlet and outlet at the end of the test. The level in standpipe 5 only stabilised
after 1 032 hours and that of standpipe 6 after 1 224 hours.
Stellenbosch University http://scholar.sun.ac.za

96
Figure 4.17: Permeability vs. time of entire system: Test no. 6
Similar to test no 5, there was an increase in permeability at the start of the test and a
gradual decrease over time to the end of the test (Figure 4.17).
Figure 4.18: Permeability vs. time across standpipes 4-5; 5-6 and 6-7: Test no. 6
In Figure 4.18 it was observed that the permeability across standpipes 4 and 5 showed a
drop at the start of the test and then showed peaked at approximately 200 hours and 900
hours respectively. The permeability across standpipes 5 and 6 decreased gradually from
the start of the test. The permeability across standpipes 6 and 7 showed an increase at the
start of the test and a reduction in permeability was observed till the end of the test. The
permeability of the soil to geotextile was lower than that of the soil, which could be
problematic.
1.00E-05
1.00E-04
0 200 400 600 800 1000 1200 1400
Perm
eabi
lity
(m/s
)
Time (hours)
1.00E-05
1.00E-04
0 200 400 600 800 1000 1200 1400
Perm
eabi
lity
(m/s
)
Duration (hours)Standpipes 4&5 Standpipes 5&6 Standpipes 6&7
Stellenbosch University http://scholar.sun.ac.za

97
Figure 4.19: Gradient ratio vs. time: Test no. 6
At the start of the test, the gradient ratio started above 2 and showed a rapid decrease up to
approximately 96 hours (Figure 4.19). It was observed that the gradient ratio of less than 1
was obtained, which coincided with a high permeability measured across standpipes 6-7
(Figure 4.18) over the same time period. The gradient ratio stabilised after approximately
168 hours. The gradient ratio obtained at the end of this test was 1.193. The test result
shows that although the geotextile had not clogged, a fair degree of piping of fine soil
through the geotextile had occurred at the start of the test, which could potentially be
problematic.
4.8 SAND WITH PLASTICITY INDEX OF 7 VS. WITH NW-HB-CF-PP GEOTEXTILE:TEST NO. 7
Test 7 endured for 1680 hours (Table 4.8). It was observed that the standpipes 5 and 6
reached stabilisation at 72 hours and 168 hours, respectively. It was observed that the
permeability only stabilised after 1 680 hours. A difference of 100 mm was observed
between the inlet and outlet at the end of the test.
0.000
0.500
1.000
1.500
2.000
2.500
1 24 48 72 96 168
192
240
264
336
360
384
408
432
504
528
552
576
840
864
888
912
936
1008
1032
1056
1080
1104
1176
1200
1224
1248
1272
Gra
dien
t Rat
io
Time (Hrs)
Stellenbosch University http://scholar.sun.ac.za

98
Table: 4.8 Summary of soil to geotextile permeability and standpipe readings vs. time:Test no. 7
Standpipe Readings - mm
Standpipe Number
Test Permeability Sample 1 2 3 4 5 6 7
Accumulative Quantity Duration k Height 300 250 200 150 100 50 0
Hours ml min m/s mm Inlet Silica Sand Soil Sample Outlet
1 1375 60 4.421E-05 100 1550 1550 1550 1550 1550 1525 1450
24 1490 60 5.019E-05 100 1550 1550 1550 1550 1542 1515 1450
48 1520 60 5.120E-05 100 1550 1550 1550 1550 1538 1512 1450
72 1500 60 5.584E-05 100 1550 1550 1550 1550 1532 1502 1450
96 1725 60 5.810E-05 100 1550 1550 1550 1550 1540 1505 1450
168 1800 60 6.366E-05 100 1550 1550 1550 1550 1535 1505 1450
192 1850 60 6.543E-05 100 1550 1550 1550 1550 1535 1505 1450
240 1700 60 6.013E-05 100 1550 1550 1550 1550 1535 1505 1450
264 1740 60 6.154E-05 100 1550 1550 1550 1550 1535 1505 1450
336 1750 60 6.189E-05 100 1550 1550 1550 1550 1535 1505 1450
360 1625 60 5.747E-05 100 1550 1550 1550 1550 1535 1505 1450
384 1690 60 5.977E-05 100 1550 1550 1550 1550 1535 1505 1450
408 1725 60 6.101E-05 100 1550 1550 1550 1550 1535 1505 1450
432 1620 60 5.730E-05 100 1550 1550 1550 1550 1535 1505 1450
504 1590 60 5.623E-05 100 1550 1550 1550 1550 1535 1505 1450
528 1525 60 5.394E-05 100 1550 1550 1550 1550 1535 1505 1450
552 1500 60 5.305E-05 100 1550 1550 1550 1550 1535 1505 1450
576 1450 60 5.128E-05 100 1550 1550 1550 1550 1535 1505 1450
840 1225 60 4.248E-05 100 1550 1550 1550 1550 1535 1505 1450
Stellenbosch University http://scholar.sun.ac.za

99
864 1285 60 4.456E-05 100 1550 1550 1550 1550 1535 1505 1450
888 1285 60 4.545E-05 100 1550 1550 1550 1550 1535 1505 1450
912 1280 60 4.527E-05 100 1550 1550 1550 1550 1535 1505 1450
936 1290 60 4.562E-05 100 1550 1550 1550 1550 1535 1505 1450
1008 1275 60 4.509E-05 100 1550 1550 1550 1550 1535 1505 1450
1032 1260 60 4.456E-05 100 1550 1550 1550 1550 1535 1505 1450
1056 1220 60 4.315E-05 100 1550 1550 1550 1550 1535 1505 1450
1080 1205 60 4.262E-05 100 1550 1550 1550 1550 1535 1505 1450
1104 1205 60 4.262E-05 100 1550 1550 1550 1550 1535 1505 1450
1176 1070 60 3.784E-05 100 1550 1550 1550 1550 1535 1505 1450
1200 1060 60 3.749E-05 100 1550 1550 1550 1550 1535 1505 1450
1224 1160 61 4.035E-05 100 1550 1550 1550 1550 1535 1505 1450
1248 1190 62 4.073E-05 100 1550 1550 1550 1550 1535 1505 1450
1272 1190 63 4.008E-05 100 1550 1550 1550 1550 1535 1505 1450
1368 1060 64 3.515E-05 100 1550 1550 1550 1550 1535 1505 1450
1392 1100 65 3.591E-05 100 1550 1550 1550 1550 1535 1505 1450
1416 1150 66 3.698E-05 100 1550 1550 1550 1550 1535 1505 1450
1512 1120 67 3.547E-05 100 1550 1550 1550 1550 1535 1505 1450
1526 1017 68 3.174E-05 100 1550 1550 1550 1550 1535 1505 1450
1560 1010 69 3.106E-05 100 1550 1550 1550 1550 1535 1505 1450
1584 1120 70 3.395E-05 100 1550 1550 1550 1550 1535 1505 1450
1628 1120 71 3.347E-05 100 1550 1550 1550 1550 1535 1505 1450
1680 1120 72 3.301E-05 100 1550 1550 1550 1550 1535 1505 1450
Stellenbosch University http://scholar.sun.ac.za

100
Figure 4.20: Permeability vs. time of entire system: Test no. 7
Figure 4.20 shows an initial rise of permeability at the beginning of the test and then a
constant drop over the duration of the test.
Figure 4.21: Permeability vs. time across standpipes 4-5; 5-6 and 6-7: Test no. 7
The permeabilities across standpipes 4 and 5, and 5 and 6 showed consistency relative to
each other. A proportional drop in permeability was observed across standpipe 6 and 7
(Figure 4.21). The soil to geotextile permeability was lower than that of the soil, and this
could be problematic.
1.00E-05
1.00E-04
0 500 1000 1500
Perm
eabi
lity
(m/s
)
Duration (hours)
1.00E-05
1.00E-04
1.00E-03
0 500 1000 1500 2000
Perm
eabi
lity
(m/s
)
Time (hours)Standpipes 4&5 Standpipes 5&6 Standpipes 6&7
Stellenbosch University http://scholar.sun.ac.za

101
Figure 4.22: Gradient ratio vs. time: Test no. 7
The gradient ratio for this test started at approximately 6 (Figure 4.22). After approximately
96 hours, the gradient ratio decreased considerably, by an amount of between 3 and 4. This
was indicative of piping of fine soil particles through the geotextile. The gradient ratio
obtained at the end of the test was 2.537. This result meant that the geotextile was
compatible with this soil in terms of the results of the gradient ratio. However, as alluded to in
Figure 4.21, this soil to geotextile permeability was lower than the soil and therefore, in this
respect, problematic.
4.9 SAND WITH PLASTICITY INDEX OF 7 VS. WITH W-SLF-PP GEOTEXTILE:TEST NO. 8
Test number 8 endured for 1680 hours (Table 4.9). The drop in permeability from the start of
the test through to the end of the test was observed to be negligible. The water levels in both
standpipes 5 and 6 reach stability after 1 512 hours. Head readings between standpipes 1
and 7 were observed to be 90 mm.
0.000
1.000
2.000
3.000
4.000
5.000
6.000
7.000
1 48 96 192
264
360
408
504
552
840
888
936
1032
1080
1176
1224
1272
1392
1512
1560
1628
Gra
dien
t Rat
io
TIme (hrs)
Stellenbosch University http://scholar.sun.ac.za

102
Table 4.9: Soil to geotextile permeability and standpipe readings vs. time: Test no. 8Standpipe Readings - mm
Test Permeability Sample 1 2 3 4 5 6 7
Accumulative Quantity Duration k Height 300 250 200 150 100 50 0
Hours ml min m/s mm Inlet Silica Sand Soil Sample Outlet
1 1210 60 4.755E-05 100 1540 1540 1540 1540 1544 1502 1450
24 1540 60 6.052E-05 100 1540 1540 1540 1540 1532 1480 1450
48 1540 60 6.052E-05 100 1540 1540 1540 1540 1530 1480 1450
72 1490 60 5.855E-05 100 1540 1540 1540 1540 1523 1473 1450
96 1900 60 7.467E-05 100 1540 1540 1540 1540 1530 1475 1450
168 1800 60 7.074E-05 100 1540 1540 1540 1540 1525 1473 1450
192 1750 60 6.877E-05 100 1540 1540 1540 1540 1523 1473 1450
240 1650 60 6.484E-05 100 1540 1540 1540 1540 1525 1473 1450
264 1640 60 6.445E-05 100 1540 1540 1540 1540 1526 1470 1450
336 1600 60 6.288E-05 100 1540 1540 1540 1540 1526 1470 1450
360 1500 60 5.895E-05 100 1540 1540 1540 1540 1526 1470 1450
384 1500 60 5.895E-05 100 1540 1540 1540 1540 1530 1470 1450
408 1575 60 6.189E-05 100 1540 1540 1540 1540 1530 1470 1450
432 1450 60 5.698E-05 100 1540 1540 1540 1540 1530 1470 1450
504 1400 60 5.502E-05 100 1540 1540 1540 1540 1530 1470 1450
528 1250 60 4.912E-05 100 1540 1540 1540 1540 1530 1470 1450
552 1325 60 5.207E-05 100 1540 1540 1540 1540 1530 1470 1450
576 1275 60 5.010E-05 100 1540 1540 1540 1540 1530 1470 1450
840 1160 60 4.559E-05 100 1540 1540 1540 1540 1530 1470 1450
Stellenbosch University http://scholar.sun.ac.za

103
864 1225 60 4.814E-05 100 1540 1540 1540 1540 1530 1478 1450
888 1200 60 4.716E-05 100 1540 1540 1540 1540 1530 1478 1450
912 1224 60 4.810E-05 100 1540 1540 1540 1540 1530 1478 1450
936 1220 60 4.794E-05 100 1540 1540 1540 1540 1530 1478 1450
1008 1210 60 4.755E-05 100 1540 1540 1540 1540 1530 1478 1450
1032 1206 60 4.739E-05 100 1540 1540 1540 1540 1527 1475 1450
1056 1170 60 4.598E-05 100 1540 1540 1540 1540 1527 1475 1450
1080 1160 60 4.559E-05 100 1540 1540 1540 1540 1527 1475 1450
1104 1155 60 4.539E-05 100 1540 1540 1540 1540 1527 1475 1450
1176 1020 60 4.008E-05 100 1540 1540 1540 1540 1527 1475 1450
1200 1000 60 3.930E-05 100 1540 1540 1540 1540 1527 1475 1450
1224 1100 60 4.323E-05 100 1540 1540 1540 1540 1527 1475 1450
1248 1140 60 4.480E-05 100 1540 1540 1540 1540 1527 1475 1450
1272 1140 60 4.480E-05 100 1540 1540 1540 1540 1527 1475 1450
1368 1020 60 4.008E-05 100 1540 1540 1540 1540 1527 1475 1450
1392 1060 60 4.166E-05 100 1540 1540 1540 1540 1527 1475 1450
1416 1100 60 4.323E-05 100 1540 1540 1540 1540 1527 1475 1450
1512 1050 60 4.126E-05 100 1540 1540 1540 1540 1522 1470 1450
1526 976 60 3.835E-05 100 1540 1540 1540 1540 1522 1470 1450
1560 1002 60 3.938E-05 100 1540 1540 1540 1540 1522 1470 1450
1584 1100 60 4.323E-05 100 1540 1540 1540 1540 1522 1470 1450
1628 1100 60 4.323E-05 100 1540 1540 1540 1540 1522 1470 1450
1680 1100 60 4.323E-05 100 1540 1540 1540 1540 1522 1470 1450
Stellenbosch University http://scholar.sun.ac.za

104
Figure 4.23: Permeability vs. time of entire system: Test no. 8
In line with most of the previous tests, there was an initial rise in permeability at the start of
the test and a gradual decrease in permeability across the duration of the test (Figure 4.23).
Figure 4.24: Permeability vs. time across standpipes 4-5; 5-6 and 6-7: Test no. 8
The permeability across standpipes 6 and 7 was observed to exceed the permeability across
standpipes 5 and 6 (Figure 4.24). The permeabilities across these standpipes were
approximately the same after 800 hours up to the end of the test. This meant that the soil to
geotextile permeability was almost equal to that of the soil, which was not ideal.
1.00E-05
1.00E-04
0 200 400 600 800 1000 1200 1400
Perm
eabi
lity
(m/s
)
Time (hours)
1.00E-05
1.00E-04
1.00E-03
0 200 400 600 800 1000 1200 1400
Perm
eabi
lity
(m/s
)
Duration (hours)Standpipes 4&5 Standpipes 5&6 Standpipes 6&7
Stellenbosch University http://scholar.sun.ac.za

105
Figure 4.25: Gradient ratio vs. time: Test no. 8
During the early parts of the test there was a rapid decline in the gradient from 3.000 to
approximately 1.100 (Figure 4.25). This was indicative that initial piping of the soil occurred
during this part of the test. The gradient ratio obtained at the end of the test was 0.751.
According to the test results obtained, the geotextile was compatible as a filter with the soil
tested.
4.10 NON PLASTIC SAND (2) VS. WITH NW-N-CF-PET GEOTEXTILE: TEST NO. 9
Test no. 9 had a duration of 648 hours (Table 4.10). The readings in standpipe 5 stabilised
after 504 hours and those of standpipe 6 stabilised after 624 hours. The head across the
entire system was determined to be 100 mm.
0.000
0.500
1.000
1.500
2.000
2.500
3.000
3.500
1 48 96 192
264
360
408
504
552
840
888
936
1032
1080
1176
1224
1272
1392
1512
1560
1628
Gra
dien
t Rat
io
Time (Hrs)
Stellenbosch University http://scholar.sun.ac.za

106
Table 4.10: Soil to geotextile permeability and standpipe readings vs. time: Test no. 9Standpipe Readings - mm
Test Permeability Sample
1 2 3 4 5 6 7
Accumulative Quantity Duration k Height
300 250 200 150 100 50 0
Hoursml min m/s mm
Inlet Silica Sand Soil Sample Outlet
1 180 60 6.366E-06 100 1575 1575 1575 1575 1570 1550 1475
24 165 60 5.836E-06 100 1575 1575 1575 1575 1570 1550 1475
48 165 60 5.836E-06 100 1575 1575 1575 1575 1570 1550 1475
120 325 60 1.149E-05 100 1575 1575 1575 1575 1565 1550 1475
144 350 60 1.238E-05 100 1575 1575 1575 1575 1565 1550 1475
168 375 60 1.326E-05 100 1575 1575 1575 1575 1565 1550 1475
192 380 60 1.344E-05 100 1575 1575 1575 1575 1565 1550 1475
216 345 60 1.220E-05 100 1575 1575 1575 1575 1565 1550 1475
288 245 60 8.665E-06 100 1575 1575 1575 1575 1565 1555 1475
312 225 60 7.958E-06 100 1575 1575 1575 1575 1565 1555 1475
336 200 60 7.074E-06 100 1575 1575 1575 1575 1565 1555 1475
360 175 60 6.189E-06 100 1575 1575 1575 1575 1565 1555 1475
384 155 60 5.482E-06 100 1575 1575 1575 1575 1568 1560 1475
456 129 60 4.562E-06 100 1575 1575 1575 1575 1568 1560 1475
480 115 60 4.519E-06 100 1575 1575 1575 1575 1568 1560 1475
504 110 60 4.323E-06 100 1575 1575 1575 1575 1570 1568 1475
528 100 60 3.930E-06 100 1575 1575 1575 1575 1570 1568 1475
600 70 60 2.751E-06 100 1575 1575 1575 1575 1570 1567 1475
624 70 60 2.662E-06 100 1575 1575 1575 1575 1570 1565 1475
648 70 60 2.662E-06 100 1575 1575 1575 1575 1570 1565 1475
Stellenbosch University http://scholar.sun.ac.za

107
Figure 4.26: Permeability vs. time of entire system: Test no. 9
There was a drop in permeability across the entire system (Figure 4.26).
Figure 4.27: Permeability vs. time across standpipes 4-5; 5-6 and 6-7: Test no. 9
The permeability measured across standpipes 6 and 7 was found to be at least one order of
magnitude lower than that measured across standpipes 4 and 5 and standpipes 5 and 6
(Figure 4.27). The permeability across standpipes 6 and 7 proved to have had a drawdown
effect on the permeability of the entire system. This also means that the soil to geotextile
permeability was lower than that of the soil and therefore problematic.
1.00E-06
1.00E-05
1.00E-04
0 100 200 300 400 500 600 700
Perm
eabi
lity
(m/s
)
Duration (hours)
1.00E-07
1.00E-06
1.00E-05
1.00E-04
1.00E-03
0 200 400 600 800
Perm
eabi
lity
(m/s
)
Time (hours)Standpipes 4&5 Standpipes 5&6 Standpipes 6&7
Stellenbosch University http://scholar.sun.ac.za

108
Figure 4.28: Gradient ratio vs. time: Test no. 9
The gradient ratio of test 9 was shown to be relatively high from the start of the test (Figure
4.28). This trend continued and the gradient ratio peaked after approximately 505 hours into
the test, resulting in a value of 90. The test could have been stopped at this point, but it was
decided to rather continue to see what the results of the gradient ratio would yield until the
permeability had stabilised. There was a drop in gradient ratio up to the end of the test. The
gradient ratio at the end of this test yielded a result of 34.1. The results of this test show that
the geotextile experienced a high degree of clogging.
4.11 NON PLASTIC SAND (2) VS. WITH NW-N-SF-PP GEOTEXTILE: TEST NO. 10
Test no. 10 had a duration of 528 hours (Table 4.11). There was not much observed
movement in the permeability readings over time. Readings in standpipes 5 and 6 stabilised
at 504 hours and 384 hours respectively. The head reading across standpipes 1 and 7 was
observed to be 100 mm.
0.000
10.000
20.000
30.000
40.000
50.000
60.000
70.000
80.000
90.000
100.000
Gra
dien
t Rat
io
Time (Hrs)
Stellenbosch University http://scholar.sun.ac.za

109
Table 4.11: Soil to geotextile permeability and standpipe readings vs. time: Test no. 10Standpipe Readings - mm
Test Permeability Sample 1 2 3 4 5 6 7
Accumulative Quantity Duration k Height 300 250 200 150 100 50 0
Hours ml min m/s mm Inlet Silica Sand Soil Sample Outlet
1 305 60 1.079E-05 100 1570 1570 1570 1570 1555 1525 1470
24 290 60 1.026E-05 100 1570 1570 1570 1570 1555 1525 1470
48 400 60 1.415E-05 100 1570 1570 1570 1570 1555 1525 1470
120 800 60 2.829E-05 100 1570 1570 1570 1570 1545 1515 1470
144 800 60 2.829E-05 100 1570 1570 1570 1570 1545 1515 1470
168 820 60 2.900E-05 100 1570 1570 1570 1570 1545 1515 1470
192 845 60 2.989E-05 100 1570 1570 1570 1570 1545 1515 1470
216 835 60 2.953E-05 100 1570 1570 1570 1570 1545 1515 1470
288 765 60 2.706E-05 100 1570 1570 1570 1570 1545 1515 1470
312 770 60 2.723E-05 100 1570 1570 1570 1570 1545 1515 1470
336 760 60 2.688E-05 100 1570 1570 1570 1570 1545 1515 1470
360 725 60 2.564E-05 100 1570 1570 1570 1570 1548 1515 1470
384 700 60 2.476E-05 100 1570 1570 1570 1570 1550 1520 1470
456 690 60 2.440E-05 100 1570 1570 1570 1570 1550 1520 1470
480 670 60 2.370E-05 100 1570 1570 1570 1570 1550 1520 1470
504 670 60 2.370E-05 100 1570 1570 1570 1570 1547 1520 1470
528 670 60 2.370E-05 100 1570 1570 1570 1570 1547 1520 1470
Stellenbosch University http://scholar.sun.ac.za

110
Figure 4.29: Permeability vs. time of entire system: Test no. 10
The permeability measured across the system was observed to increase at the beginning of
the test and then, approximately 200 hours into the test, the permeability continued to
decreaseslightly until the end of the test (Figure 4.29).
Figure 4.30: Permeability vs. time across standpipes 4-5; 5-6 and 6-7: Test no. 10
1.00E-05
1.00E-04
0 100 200 300 400 500 600
Perm
eabi
lity
(m/s
)
Time (hours)
1.00E-06
1.00E-05
1.00E-04
0 200 400 600
Perm
eabi
lity
(m/s
)
Duration (hours)Standpipes 4&5 Standpipes 5&6 Standpipes 6&7
Stellenbosch University http://scholar.sun.ac.za

111
Similarly to test no. 9, the permeability across standpipes 6 and 7 in test no.10 had the
biggest drawdown effect on the overall permeability performance of the entire system
(Figure 4.30). Similar to test 9, the soil to geotextile permeability was observed to be much
lower than that of the soil itself, which was problematic.
The gradient ratio for test no. 10 started out slightly high (Figure 4.31). The system then
showed some recovery, whereby the gradient ratio dropped to below 3, which was within the
desirable zone.
Figure 4.31: Gradient ratio vs. time: Test no. 10
After approximately 360 hours into the test, the gradient ratio increased above a level above
3. The gradient ratio ended at 3.604 which is an indication that the geotextile had a tendency
to clog.
4.12 NON PLASTIC SAND (2) VS. WITH NW-HB-CF-PP GEOTEXTILE: TEST NO. 11
This test, similar to test no 9, lasted for 648 hours (Table 4.12). Standpipes 5 and 6
stabilised at 384 and 570 hours respectively. Except during the first hour, it was noted that
there was no substantial difference in the permeability of the entire system at the start and at
the end of the test. The head reading across standpipes 1 and 7 was observed to be 100
mm.
0.000
1.000
2.000
3.000
4.000
1 24 48 120 144 168 192 216 288 312 336 360 384 456 480 504 528
Gra
dien
t Rat
io
Time (Hrs)
Stellenbosch University http://scholar.sun.ac.za

112
Table 4.12: Soil to geotextile permeability and standpipe readings vs. time: Test no. 11Standpipe Readings - mm
Test Permeability Sample 1 2 3 4 5 6 7
Accumulative Quantity Duration k Height 300 250 200 150 100 50 0
Hours ml min m/s mm Inlet Silica Sand Soil Sample Outlet
1 270 60 9.549E-06 100 1565 1565 1565 1565 1555 1525 1465
24 340 60 1.203E-05 100 1565 1565 1565 1565 1555 1525 1465
48 590 60 2.087E-05 100 1565 1565 1565 1565 1555 1525 1465
120 920 60 3.254E-05 100 1565 1565 1565 1565 1550 1510 1465
144 930 60 3.289E-05 100 1565 1565 1565 1565 1550 1510 1465
168 950 60 3.360E-05 100 1565 1565 1565 1565 1550 1510 1465
192 950 60 3.360E-05 100 1565 1565 1565 1565 1550 1510 1465
216 870 60 3.077E-05 100 1565 1565 1565 1565 1545 1510 1465
288 830 60 2.936E-05 100 1565 1565 1565 1565 1545 1515 1465
312 830 60 2.936E-05 100 1565 1565 1565 1565 1545 1515 1465
336 815 60 2.882E-05 100 1565 1565 1565 1565 1545 1515 1465
360 770 60 2.723E-05 100 1565 1565 1565 1565 1545 1515 1465
384 740 60 2.617E-05 100 1565 1565 1565 1565 1550 1520 1465
456 700 60 2.476E-05 100 1565 1565 1565 1565 1550 1520 1465
480 680 60 2.405E-05 100 1565 1565 1565 1565 1550 1520 1465
504 670 60 2.370E-05 100 1565 1565 1565 1565 1550 1525 1465
528 650 60 2.299E-05 100 1565 1565 1565 1565 1550 1525 1465
600 570 60 2.016E-05 100 1565 1565 1565 1565 1560 1535 1465
624 570 60 2.016E-05 100 1565 1565 1565 1565 1560 1535 1465
648 570 60 2.016E-05 100 1565 1565 1565 1565 1560 1535 1465
Stellenbosch University http://scholar.sun.ac.za

113
Figure 4.32: Permeability vs. time of entire system: Test no. 11
An increase in permeability was observed at the start of the test (Figure 4.32). A slow
reduction in permeability was observed to the end of the test.
Figure 4.33: Permeability vs. time across standpipes 4-5; 5-6 and 6-7: Test no. 11
As with tests 9 and 10, the permeability across standpipes 6 and 7 had the greatest
drawdown effect of the system’s permeability (Figure 4.33). The permeability across these
standpipes was observed to be 1 order of magnitude lower than that measured across
standpipes 4 and 5, and 5 and 6. This is indicative that the soil to geotextile permeability was
1.00E-06
1.00E-05
1.00E-04
0 100 200 300 400 500 600 700
Perm
eabi
lity
(m/s
)
Time (hours)
1.00E-06
1.00E-05
1.00E-04
1.00E-03
0 200 400 600 800
Perm
eabi
lity
(m/s
)
Time (hours)Standpipes 4&5 Standpipes 5&6 Standpipes 6&7
Stellenbosch University http://scholar.sun.ac.za

114
lower than that of the permeating soil and this is classified as a failure of the geotextile. The
soil to geotextile permeability was observed to be much lower than that of the soil itself, and
this is problematic.
Figure 4.34: Gradient ratio vs. time: test no 11
The gradient ratio observed for this test started at approximately 4.000 (Figure 4.34). The
system reached a desirable gradient ratio, below 3, after approximately 120 hours.
Afterwards it was observed that the gradient ratio increased in stages to reach an
undesirable figure of 5.534 at the end of the test. From this test, is evident that the geotextile
showed a tendency to clog.
4.13 NON PLASTIC SAND (2) VS. WITH W-SLF-PP GEOTEXTILE: TEST NO. 12
The duration of the final test was also 672 hours (Table 4.13). It was observed that the test
ended with a similar quantity of water flowing through the system as had at the start. Both
head readings in standpipes 5 and 6 stabilised after approximately 600 hours.
0.000
1.000
2.000
3.000
4.000
5.000
6.000
Gra
dien
t Rat
io
Time (Hrs)
Stellenbosch University http://scholar.sun.ac.za

115
Table 4.13: Soil to geotextile permeability and standpipe readings vs. time: Test no. 12Standpipe Readings - mm
Permeability Sample
1 2 3 4 5 6 7
TestAccumulative
Hours Quantity Duration k Height
300 250 200 150 100 50 0
ml min m/s mmInlet Silica Sand Soil Sample Outlet
1 250 60 8.842E-06 100 1560 1560 1560 1560 1550 1523 1460
24 195 60 6.897E-06 100 1560 1560 1560 1560 1550 1525 1460
48 210 60 7.427E-06 100 1560 1560 1560 1560 1550 1525 1460
120 510 60 1.804E-05 100 1560 1560 1560 1560 1545 1520 1460
144 570 60 2.016E-05 100 1560 1560 1560 1560 1545 1520 1460
168 590 60 2.087E-05 100 1560 1560 1560 1560 1545 1520 1460
192 590 60 2.087E-05 100 1560 1560 1560 1560 1545 1520 1460
216 550 60 1.945E-05 100 1560 1560 1560 1560 1545 1515 1460
288 480 60 1.698E-05 100 1560 1560 1560 1560 1545 1520 1460
312 480 60 1.698E-05 100 1560 1560 1560 1560 1545 1520 1460
336 460 60 1.627E-05 100 1560 1560 1560 1560 1545 1520 1460
360 425 60 1.503E-05 100 1560 1560 1560 1560 1545 1520 1460
384 400 60 1.415E-05 100 1560 1560 1560 1560 1550 1525 1460
456 360 60 1.273E-05 100 1560 1560 1560 1560 1550 1525 1460
480 340 60 1.203E-05 100 1560 1560 1560 1560 1550 1535 1460
504 330 60 1.167E-05 100 1560 1560 1560 1560 1550 1535 1460
528 310 60 1.096E-05 100 1560 1560 1560 1560 1550 1535 1460
600 260 60 9.196E-06 100 1560 1560 1560 1560 1555 1540 1460
624 245 60 8.665E-06 100 1560 1560 1560 1560 1555 1540 1460
648 245 60 8.665E-06 100 1560 1560 1560 1560 1555 1540 1460
672 245 60 8.665E-06 100 1560 1560 1560 1560 1555 1540 1460
Stellenbosch University http://scholar.sun.ac.za

116
Figure 4.35: Permeability vs. time of entire system: Test no. 12
It was observed that that there was an increase in permeability up to approximately 200
hours. Thereafter, up to approximately 650 hours, a slight decrease in permeability was
observed.
Figure 4.36: Permeability vs. time across standpipes 4-5; 5-6 and 6-7: Test no. 12
The measured permeability across standpipes 6 and 7 was approximately one order of
magnitude lower than that measured across standpipes 4 and 5, and 6 and 7. The soil to
1.00E-06
1.00E-05
1.00E-04
0 100 200 300 400 500 600 700 800
Perm
eabi
lity
(m/s
)
Time (hours)
1.00E-06
1.00E-05
1.00E-04
1.00E-03
0 200 400 600 800
Perm
eabi
lity
(m/s
)
Time (hours)Standpipes 4&5 Standpipes 5&6 Standpipes 6&7
Stellenbosch University http://scholar.sun.ac.za

117
geotextile permeability was observed to be much lower than the soil itself and this is
problematic. The same trend was observed for all of the last four tests.
Figure 4.37: Gradient ratio vs. time: test no 12
The gradient ratio remained fairly constant for approximately 456 hours (Figure 4.37). It was
observed that the gradient ratio increased at the same time at which a higher permeability
across the entire system was encountered. The gradient ratio at the end of this test was
observed to be 10.250. This is evidence of the geotextile showing signs of a high degree of
clogging.
4.16 MICRO ELECTROSCOPIC IMAGES
After all permutations of the permeameter tests had been completed, the soil contaminated
candidate geotextiles were sent for micro imaging. A set of micro images was also obtained
of the uncontaminated geotextile samples. These visuals are presented below.
0.000
2.000
4.000
6.000
8.000
10.000
12.000G
radi
ent R
atio
Time (Hrs)
Stellenbosch University http://scholar.sun.ac.za

118
A=NW-N-CF-PET B=NW-N-SF-PP
C= NW-HB-CF-PP D= W-SLF-PP
Figure 4.38: Electro microscopic images of the geotextiles before tests:
Figure 4.38 illustrates all the geotextile in its uncontaminated form. It can be seen that the
fibre diameter for the geotextile in image A is much finer than that in image B. The geotextile
in image A also has the highest porosity and pore opening size of all the candidate
geotextiles. The pore opening size of the geotextile in image C was the second largest. The
geotextile in image C has a flatter fibre, because of the heat bonding process. The woven slit
film geotextile can be clearly seen in image D. It has a closed weave structure. Water and
particles would be able to pass through the openings only at the weave overlaps.
Stellenbosch University http://scholar.sun.ac.za

119
E-1: NW-N-CF-PET F-1: NW-N-SF-PP
G-1: NW-HB-CF-PP H-1: W-SLF-PP
Figure 4.39: Post-test photographic images of geotextiles: tests 1-4
Figure 4.39 shows photographic images of the geotextiles just after the tests had finished.
Some soil contamination was observed for the NW-N-CF-PET geotextile. It was observed
that the heavier soil contamination occurred on the NW-N-SF-PP as well as the NW-HB-CF-
PP geotextiles. It was also evident that the soil particles migrated towards the gaps at the slit
film overlaps for the W-SLF-PP geotextile. A ring formation or the remnants of an outer soil
ring were visible on the geotextiles. This should be ignored, as the ring is formed at the
permeameter clamped area, which falls outside the affected area of the tested geotextile .
Stellenbosch University http://scholar.sun.ac.za

120
E: NW-N-CF-PET F: NW-N-SF-PP
G: NW-HB-CF-PP H: W-SLF-PP
Figure 4.40: Post-test microscopic images of geotextiles at 100 x magnification:tests 1-4
Figure 4.40 shows the visible levels of contamination for the geotextiles in image F and G.
The geotextiles in image E and H show little or no contamination. The particles in image H
can be seen conglomerating in the openings at the weave overlaps.
Stellenbosch University http://scholar.sun.ac.za

121
I-1: NW-N-CF-PET J-1: NW-N-SF-PP
K-1: NW-HB-CF-PP L-1: W-SLF-PP
Figure 4.41: Post-test photographic images of geotextiles: tests 5-8
Photographs I-1 and L-1 show partial soil contamination (Figure 4.41. Photographs J-1 and
K-1 shows a heavier degree of contamination. Photo J-1 was taken after oven drying.
Stellenbosch University http://scholar.sun.ac.za

122
I: NW-N-CF-PET J: NW-N-SF-PP
K: NW-HB-CF-PP L: W-SLF-PP
Figure 4.42: Post-test microscopic images of geotextiles at 100x magnification:tests 5-8
Images J and K confirm that a higher number of soil particles has been trapped within the
geotextile fabric. As a result, the geotextiles in image J and K had a contaminated residual
permeability that was less than that of the soil. The geotextiles in images I and L showed
less contamination and as a result were acceptable as geotextile filters.
Stellenbosch University http://scholar.sun.ac.za

123
M-1 N-1
O-1 P-1
Figure 4.43: Post-test photographic images of geotextiles: tests 9-12
It can be seen in the photographic images that all the geotextiles suffered high degrees of
contamination. These geotextiles experienced a high degree of clogging and are therefore
not acceptable as filters in conjunction with the soil they were tested with.
Stellenbosch University http://scholar.sun.ac.za

124
M N
O P
Figure 4.44: Post-test microscopic images of geotextiles at 100x magnification:tests 9-12
From the images in Figure 4.44, it can be deduced that the pore openings of all these
geotextiles were clogged. This was also evident in the high gradient ratios obtained for this
set of tests, as well as the low soil to geotextile permeability. More soil residue is also
evident on the woven geotextile, near the overlap openings in image P.
Stellenbosch University http://scholar.sun.ac.za

125
4.17 COMPUTER SPREADSHEET
Select soil sample
Enter soil zone
Unidirectional or Multidirectional flow
Dispersive, Non-dispersive or poor soil conditions
Relative Density of the Soil
Permeability
Survivability
Figure 4.45: Input parameters for computer spreadsheet
The input parameters that were used for the computer program are shown in figure 4.45.
The input parameters remained the same for all three soil types as these were very similar.
The soil was classified as Zone 2 (Luettich et al., 1992) and problematic as far as geotextiles
are concerned. The computer spread sheet was adapted from Luettich et al. (1992);
however, it does not take the soil’s co-efficient of uniformity into account.
Stellenbosch University http://scholar.sun.ac.za

126
Table 4.14: Output with recommended geotextile specifications
Recommended Geotextile Test Method Units Recommended Specification
Trapezoidal Tear Across ASTM D4533 N 175
CBR 50 mmprobe SANS 10221-2007 kN 1
Dart Test Dia. ofhole EN ISO 13433-2006 mm 32
Tensile Strength Across SANS 10221-2007 kN/m 7
Permeability @ 100mm head SANS 10221-2008 m/s 1 x 10⁻⁴
Pore size O95 EN ISO 12956-1999 m 100μm<O95>250μm
After the input parameters have been inserted as shown in Figure 4.45, the spreadsheet
program recommends 6 parameters (Table 4.14). These parameters are further explained
as follows:
4.17.1 Trapezoidal Tear
This is the resistanceto tear, measured in Newtons (N), when a geotextile is clamped at
diagonally opposite corners and a strain applied to it. It is a parameter which is linked to the
survivability of the geotextile during installation.
4.17.2 CBR
This is the resistance, measured in kilo Newtons (kN), when a probe of a certain diameter is
pushed perpendicularly through the plane of the geotextile. This parameter is linked to the
survivability requirement of the geotextile.
4.17.3 Dart test
A probe of a certain diameter and weight is dropped from a certain height onto the
geotextile. The diameter of the hole is measured in mm. This test is also linked to
survivability.
Stellenbosch University http://scholar.sun.ac.za

127
4.17.4 Tensile strength
A strip of geotextile is clamped on opposite sides and strained at a certain rate. The
resistance to rupture is measured in kilo Newtons per meter (kN/m). This is a common test
done on geotextiles and is related to survivability.
4.17.5 Permeability
This parameter is the measure of the quantity of water, measured in m/s, which flows
perpendicularly through the plane of the geotextile. This is an important parameter, as it
must always be higher than that of the adjacent soil.
4.17.6 Pore size
This is the size of the openings (pore size) of the geotextile. This parameter is important and
linked to the retention criteria. The pore size must be small enough to retain the sand
particles and large enough to let water flow through it.
Table 4.15: Summary of geotextile to soil performance
TestNumber
Criteria met in terms ofclogging
Criteria met in terms ofpermeability
Comments
1 Y Y Pass
2 Y Y Pass
3 N N Fail
4 Y Y Pass
5 Y Y Pass
6 Y N Fail
7 Y N Fail
8 Y Y Pass
9 N N Fail
10 N N Fail
11 N N Fail
12 N N Fail
From all the test permutations performed it can be seen that the results of only four of the
twelve tests have been acceptable (Table 4.15). This proves the Berea sand to be very
challenging, as it is a highly variable soil in terms of its engineering properties.
Stellenbosch University http://scholar.sun.ac.za

128
4.18 CONCLUSION
The outcomes of the 12 tests performed in the laboratory have provided a greater
understanding of the soil to geotextile filtration behaviour when geotextiles commercially
available in South Africa are used in conjunction with some of the Berea sands encountered
along the KwaZulu-Natal coastline. The results of these tests are analysed and discussed in
further detail in the next chapter. Laboratory observations and outcomes allow for the
following preliminary conclusions:
i) No two of the geotextiles tested behaved identically when exposed to the same soil
type.
ii) The non-plastic Berea sands used in tests nos. 1-4 proved to be problematic when
used with some of the geotextiles.
iii) Berea sands with a relatively high plasticity index, used in tests nos. 5-8, did not pose
a threat in terms of clogging to the geotextiles tested.
iv) The non-plastic Berea sands used in tests nos. 9-12 proved to be problematic in
terms of clogging with all of the geotextiles tested.
v)None of the geotextiles met the criteria regarding the number of constrictions being
20>Ns<40, as proposed by Giroud (1996). However, at most times, the geotextiles
behaved satisfactorily.
vi) The coefficients of uniformity (Cu) of all the soils tested showed too much variation
and it was therefore inconclusive what effect the Cu had on all the soil to geotextile
test outcomes.
In the following chapter, the results obtained will be analysed in more detail and discussed.
Stellenbosch University http://scholar.sun.ac.za

129
Chapter 5 - Analysis
5.1 INTRODUCTION
This chapter will attempt to analyse the laboratory results obtained to add more meaning. In
addition to interpreting the results of the laboratory tests, this chapter also aims at the
following:
i) Meeting the primary objectives as set out in Chapter 1 of this thesis.
ii) Evaluating the currently available geotextile filter design criteria in the South African
context and adding meaningful contributions towards the way forward.
5.2 SOIL INTERNAL STABILITY AND CO-EFFICIENT OF UNIFORMITY.
Terzaghi’s criterion was used to assess the soil’s inherent internal stability by using the
following formula:
d85 / d15 >5 (soil is internally stable)
The co-efficient of uniformity (Cu) was calculated for all soils using the formula:
Cu = d60/d10
Similarly, the co-efficient of curvature (Cc) was calculated for all soils using the formula:
Cc = d302 / (d30.d60)
The results which were obtained are illustrated in Table 5.1 below.
Table 5.1: Inherent stability of soilSoil SampleNo
d85/d15 Cu Cc PlasticityIndex
1 7.17 8 2.341 Non Plastic
2 20.62 95 25.25 7%
3 32.69 111 11.95 Non Plastic
The soils all seemed to have inherent stability. There was a big variance in the results
obtained for the co-efficient of uniformity (Cu).
Stellenbosch University http://scholar.sun.ac.za

130
5.3 NUMBER OF CONSTRICTIONS
The number of constrictions for the geotextiles was calculated after Giroud (1996):
Ns = √ (1-P) x (geotextile thickness/fibre diameter)
The results are tabulated in Table 5.2 below.
Table 5.2: Number of constrictions (Ns) for the candidate geotextiles
Geotextile Type Porosity (%) Thickness (mm)(under 2kPa)
FibreDiameter(μm)
Ns Notes
NW-N-CF-PET 93 1.20 32 10 Ns <20
NW-N-SF-PP 65 0.80 60 8 Ns <20
NW-HB-CF-PP Not Applicable 0.43 45 5 Ns <20
W-SLF-PP Not Applicable Not applicableNotApplicable Not applicable -
It was noted that none of the geotextiles used in this experiments had met Giroud’s criteria,
according to which the number of constrictions (Ns) should preferably be between 20 and
40 if the geotextile is used as a filter.
5.4 SYSTEM PERMEABILITY VS. SOIL TO GEOTEXTILE PERMEABILITY
At the end of each of the tests, the soil’s permeability was determined by the permeability
calculated across standpipes 5 and 6. This was compared to that of the soil to geotextile
system, which was measured across standpipes 6 and 7 in all the tests. The permeability
across standpipes 6 and 7 was indicative of the soil to geotextile permeability. If this
permeability is lower than that of the soil, then the soil to geotextile system has failed.
The soil to geotextile permeability should always be more than that of the soil in order not to
have potential pore water pressure building up adjacent to the geotextile. Therefore the ratio
of the permeabilities k6-7 / k5-6 should always be a minimum of 1. The value of the gradient
ratio should be between 1 and 3 in order for it to be acceptable against clogging. A value of
less than 1 suggests that piping has occurred. A gradient ratio value of higher than 3
indicates that clogging of the geotextile has occurred, which is unacceptable.
Stellenbosch University http://scholar.sun.ac.za

131
5.4.1 Tests 1-4
Table 5.3: Soil to geotextile permeability vs. sand permeability with gradient ratios atend of tests
Testno.
Soilsampleno.
k5-6:
Soilpermeability(m/s)
k6-7:Acrossstandpipes 6-7 (m/s)
k6-7 / k5-6 GradientRatio
1 1 1.326E-06 1.516E-06 1.143 0.846
2 1 9.431E-07 5.053E-06 5.358 0.180
3 1 4.113E-06 2.947E-06 0.717 3.075
4 1 2.669E-06 1.415E-05 5.300 2.436
The soil to geotextile permeabilities for tests 2 and 4 were noticeably higher than those of
the soil itself (Table 5.3). This is not necessarily the case for the gradient ratios. It was also
observed that the soil to geotextile permeability for test no.1 was marginally higher than that
of the soil, given that this test yielded satisfactory results in terms of its gradient ratio. Test
no 3 shows that the soil to geotextile permeability was lower than that of the soil itself,
therefore making it undesirable.
From this set of tests it was evident that one cannot look at the gradient ratio in isolation but
need also to determine the permeability at the soil to geotextile interface. Testnumber 3 had
an acceptable gradient ratio, but fell short on the soil to geotextile permeability, which was
less than 1 and therefore a failure as a result. The geotextile used in test 2 had the smallest
opening size of all the geotextiles, but showed the highest degree of piping, as well as soil to
geotextile permeability. This could possibly have been caused by concentrated flow at one
point through the geotextile. This set of tests yielded only one geotextile failure.
Stellenbosch University http://scholar.sun.ac.za

132
5.4.2 Tests 5 – 8
Table 5.4: geotextile permeability vs. sand permeability with gradient ratios at end oftests
Testno.
Soilsampleno.
k5-6:
Soilpermeability(m/s)
k6-7:
Acrossstandpipes 6-7 (m/s)
k6-7 / k5-6 GradientRatio
5 2 2.173E-05 3.802E-05 1.750 0.542
6 2 1.997E-05 1.629E-05 0.816 1.193
7 2 5.659E-05 2.201E-05 0.389 2.537
8 2 3.741E-05 4.863E-05 1.300 0.751
From these tests, it can be seen that all geotextiles behaved satisfactorily in terms of the
gradient ratios obtained (Table 5.4). Tests 6 and 7 showed permeabilities across standpipes
6 and 7 that were lower than those across standpipes 5 and 6.
Once again, although the gradient ratios observed for this set of tests were all acceptable,
the soil to geotextile permeability was the deciding factor in determining whether the
geotextile was suitable or not. In the case of test 6, although the soil to geotextile
permeability was slightly below 1 it is left to the engineer’s discretion to decide whether the
application would be critical or not. The geotextiles used in conjunction with the slightly
plastic Berea sand thus yielded unacceptable results related to the soil to geotextile
permeability criteria, rather than to clogging.
Stellenbosch University http://scholar.sun.ac.za

133
5.4.3 Tests 9 – 12
Table 5.5: geotextile permeability vs. sand permeability with gradient ratios at end oftests
Testno.
Soilsampleno.
k5-6:
Soilpermeability(m/s)
k6-7:Acrossstandpipes 6-7 (m/s)
k6-7 / k5-6 GradientRatio
9 3 2.476E-05 6.877E-07 0.028 34.100
10 3 4.388E-05 1.185E-05 0.270 3.604
11 3 4.032E-05 7.200E-06 0.179 5.534
12 3 2.888E-05 2.708E-06 0.094 10.250
From this set of tests it was noticed that all the geotextiles had relatively high gradient ratios
(Table 5.5). The permeabilities across standpipes 6 and 7 were considerably lower than
those measured across standpipes 5 and 6. This means that all the geotextiles used with
this soil were inadequate to be used as filters.
The high gradient ratios are indicative of a high degree of clogging of the geotextile. The
results of the soil to geotextile permeabilities were all well below those of the soil, making all
these geotextile unacceptable. The sand tested was cohesionless and had a high Cu.
Migration of fines through the soil body had occurred. A sufficient number of fines became
entrapped in the geotextile to render it clogged. In the case of the woven geotextile, it was
considered blocked rather than clogged.
5.5 SUMMARY OF GRADIENT RATIOS VS. TIME
5.5.1 Test numbers 1 - 4
5.5.1.1 Test No.1: Nonwoven, needle-punched continuous filament polyestergeotextile (NW-N-CF-PET) vs. non plastic Berea sand
During the test this geotextile performed relatively well, as the system did not show
excessive build-up of gradient ratio nor a significant drop in gradient ratio (Table 5.6). At the
start of the test there was a slight rise in gradient ratio, which suggests a tendency for the
geotextile to clog.
Stellenbosch University http://scholar.sun.ac.za

134
Table 5.6: Summary of gradient ratios vs. time: test nos. 1-4
Time(hours)
Test No 1Gradient ratios
Test No 2Gradient ratios
Test No 3Gradient ratios
Test No 4Gradient ratios
1 0.737 0.283 8.687 2.896
8 1.018 0.283 8.687 2.896
72 0.719 0.244 7.128 5.441
96 0.457 0.251 7.128 5.441
120 0.290 0.268 4.344 3.197
144 0.846 0.268 3.475 2.413
168 0.846 0.180 3.475 2.413
240 0.180 3.075 1.972
264 0.180 3.075 2.436
288 0.180 3.075 2.436
312 3.075 2.436
336 3.075 2.436
408 3.075 2.436
432 3.075 2.436
456 3.075 2.436
480 3.075 2.436
504 3.075
The system showed some quick recovery by the gradient ratio dropping slightly below 1.
This suggests that some of the finer soil particles which were either lodged in the geotextile
or at the soil to geotextile interface were pushed through or out of the geotextile as water
continued to flow through the soil to geotextile interface. The test also equalised most
quickly, t which was indicative that a natural soil filter had formed most quickly on the
upstream side of the geotextile. According to the gradient ratio results obtained, no tendency
towards clogging and piping could be established. As ascertained in the previous chapter,
the soil to geotextile permeability was higher than that of the soil, which satisfied the
permeability criterion. The geotextile to soil compatibility for this test was therefore found to
be acceptable.
Stellenbosch University http://scholar.sun.ac.za

135
5.5.1.2 Test No.2: Nonwoven, needle-punched staple fibre polypropylene polyestergeotextile (NW-N-SF-PP) – with single side thermally treated * vs. non plasticBerea sand
The geotextile in test no 2 showed that excessive piping had occurred at the start of the test,
which was indicative of a gradient ratio which was recorded as well below 1 (Table 5.1).
Although this geotextile had smaller pore openings than the geotextile tested in test number
1, it was thinner and did not exhibit the thickness within which soil particles could lodge.
Therefore, instead of the finer soil particles soil being lodged in the geotextile, they had been
washed through it. This was also evident when comparing the number of constrictions of this
geotextile to that of the geotextile used in test number 1.
Although the gradient ratio for this test was found to be below 1, which meant that there was
a considerable amount of initial piping, it remained relatively constant for the remainder of
the test, which suggested that not much further piping occurred. This was due to a natural
reverse filter establishing itself on the adjacent upstream side of the geotextile. Although the
gradient ratio indicated that no clogging was evident, piping was evident, which could also
potentially be problematic. It should therefore be established by the design engineer whether
any piping of the soil through the geotextile is to be permitted for the design criteria, as silting
up of the drainage medium and pipe is possible, which could cause failure. It had already
been established in the previous chapter that the soil to geotextile permeability was
adequate. In conclusion, the geotextile to soil compatibility for this test was found to be
satisfactory.
5.5.1.3 Test No.3: Nonwoven, needle-punched staple fibre polypropylene polyestergeotextile (NW-HB-CF-PP) vs. non plastic Berea sand
The nonwoven needle-punched heat bonded continuous filament geotextile (NW-HB-CF-PP)
exhibited the highest gradient ratio for this test set (Table 5.1). This geotextile was also
found to have the lowest number of constrictions, which did not assist the efficiency of its
filtration characteristics in terms of encouraging the establishment of natural filter adjacently
upstream of the geotextile. Furthermore, the geotextile also exhibited a lack of thickness as
required by the criteria proposed by Giroud (1996), given in Chapter 2. During manufacture,
this type of geotextile is heat bonded which melts the filaments and reduces the pore
opening sizes considerably. This resulted in this geotextile being relatively thin compared to
the other geotextiles tested. The thickness of the NW-HB-CF-PP geotextile was, on average,
0.3 mm. This test also took the longest to stabilise of any in this test series. The gradient
Stellenbosch University http://scholar.sun.ac.za

136
ratio was on the upper limit of acceptability and, as established in the previous chapter, the
permeability of the soil to geotextile interface was lower than that of the soil. This rendered
the geotextile unsuitable to be used as a filter with this soil.
5.5.1.4 Test No.4: Woven, slit film polypropylene geotextile (W-SLF-PP) vs. nonplastic Berea sand
The gradient ratio for this test showed strong signs of blocking (Table 5.1). Blocking is
referred to when using woven geotextiles. This has been discussed in Chapter 2. The slit
film woven geotextile did not exhibit functional thickness when compared to the mechanically
bonded, 3 dimensional, fibrous nonwoven geotextiles. These flat slit film woven geotextiles
act as two dimensional filters, rather than as three dimensional filters as do nonwoven
geotextiles. From the test results it can be deduced that piping of the finer soil particles had
occurred through the openings of the geotextile after approximately 96 hours into the test.
This test also took the second longest of this test series to stabilise. The gradient ratio
stabilised at 2.436, which is close to the upper limit. The gradient ratio still suggested
blocking, but at an acceptable limit. Therefore this geotextile could to be used as a filter with
the soil tested.
5.5.1.5 Summary of tests numbers 1-4
The gradient ratios obtained from tests 1 to 4 provided the following conclusions about the
soil to geotextile compatibility:
1. The NW-N-CF-PET geotextile performed the best of all geotextiles tested with this
soil type. This test took the shortest time to stabilise. The soil to geotextile
performance was acceptable in terms of both gradient ratio and permeability.
2. The NW-N-SF-PP geotextile showed signs of excessive piping. This test was the
second quickest to stabilise. The soil to geotextile performance was adequate in
terms of both gradient ratio and permeability. The author suspected that
concentrated water throughflow was experienced at the soil to geotextile interface,
which resulted in a high amount of piping and low gradient ratio values.
3. The NW-HB-CF-PP geotextile started off with high gradient ratios and showed
recovery to the upper limit of around 3. This test took the longest to stabilise. This
geotextile posed a higher risk of failure due to clogging than the other geotextiles
tested in this series. The soil to geotextile performance was not good enough, as
high levels of clogging were apparent, as well as low soil to geotextile permeability.
Stellenbosch University http://scholar.sun.ac.za

137
4. The W-SLF-PP also exhibited signs of a high risk of failure due to blocking. This test
took third longest to stabilise.
5.5.2 Tests numbers 5 – 8
5.5.2.1 Test No.5: Nonwoven, needle-punched continuous filament polyestergeotextile (NW-N-CF-PET) vs. Berea sand (PI = 7)
This test exhibited a relatively high permeability. As observed in the previous chapter (Figure
4.15), the soil to geotextile permeability only showed recovery close to the end of the test. It
is uncertain whether the permeability across the soil to geotextile would have further reduced
in the future. The test should have been run for a longer period to determine what the long
term soil to geotextile permeability would have been. For the purpose of this test experiment,
the result of the soil to geotextile permeability was considered to be acceptable. The gradient
ratio at the start of the test was 1.724 and reduced to 0.39 after approximately 96 hours. This
was evidence that a high degree of piping had occurred. Subsequent to this, it was
anticipated that a reverse natural filter started forming adjacently upstream of the geotextile
to raise the gradient ratio up to approximately 1.200. The gradient ratio remained relatively
uniform up to approximately 1 200 hours. After this, a second stage of piping of fine material
through the geotextile occurred, which was in line with the increased permeability across
standpipes 6 and 7 at this time. The system’s gradient ratio stabilised at 0.542, which was
evidence that the geotextile was compatible as a filter with this soil (Table 5.7).
Stellenbosch University http://scholar.sun.ac.za

138
Table 5.7: Summary of gradient ratios vs. time: test nos. 5-8
Time(Hours)
Test No 5Gradient ratios
Test No 6Gradient ratios
Test No 7Gradient ratios
Test No 8Gradient ratios
1 1.724 2.142 5.919 2.985
24 1.517 1.864 4.750 1.126
48 1.084 1.709 4.705 1.171
72 0.719 1.062 3.420 0.898
96 0.390 0.913 3.101 0.887
168 1.207 1.252 3.617 0.863
192 1.253 1.298 3.617 0.898
240 1.190 1.252 3.617 0.863
264 1.084 1.239 3.617 0.697
336 1.207 1.252 3.617 0.697
360 1.138 1.252 3.617 0.697
384 1.084 1.239 3.617 0.651
408 0.981 1.239 3.617 0.651
432 0.981 1.239 3.617 0.651
504 0.981 1.239 3.617 0.651
528 0.981 1.239 3.617 0.651
552 0.981 1.239 3.268 0.651
576 0.981 1.239 3.268 0.651
840 1.047 1.511 3.268 0.651
864 1.047 1.511 3.606 1.051
888 1.047 1.138 3.606 1.051
912 1.047 1.138 3.083 1.051
936 1.047 1.138 3.083 1.051
1008 1.047 1.138 3.083 1.051
1032 0.948 1.298 3.083 0.938
1056 0.948 1.298 3.083 0.938
1080 0.948 1.298 2.650 0.938
1104 0.948 1.298 2.650 0.938
1176 0.948 1.298 2.650 0.938
1200 0.948 1.298 2.650 0.938
1224 0.542 1.193 2.650 0.938
1248 0.542 1.193 2.650 0.938
1272 0.542 1.193 2.650 0.938
Stellenbosch University http://scholar.sun.ac.za

139
1368 2.650 0.938
1392 2.810 0.938
1416 2.810 0.938
1512 2.537 0.751
1526 2.537 0.751
1560 2.537 0.751
1584 2.537 0.751
1628 2.537 0.751
1680 2.537 0.751
5.5.2.2 Test No.6: Nonwoven, needle-punched staple fibre polypropylene polyestergeotextile (NW-N-SF-PP) – with single side thermally treated * vs. Berea sand(PI=7)
The gradient ratios obtained from this test are all below 3 (Table 5.7). There was initial piping
at the start of the test. After approximately 198 hours into the test, the gradient ratio showed
some recovery as it was anticipated that the natural reverse filter had started forming on the
upstream side of the geotextile. However, the soil to geotextile permeability was found to be
lower than that of the soil and this was problematic (Figure 4.18). This could be a function of
the manufacturing technique, whereby one side of the geotextile is thermally treated. Quite
often geotextiles undergo thermal treatments to increase their tensile strength and doing so
compromises their filtration attributes. Therefore this geotextile did not perform satisfactorily
as a filter with this soil.
5.5.2.3 Test No.7: Nonwoven, needle-punched staple fibre polypropylene polyestergeotextile (NW-HB-CF-PP) vs. Berea sand (PI = 7)
The gradient ratios obtained for this test showed that from the onset the geotextile
experienced a high degree of clogging (Table 5.7). The gradient ratio recovered to a reading
of 2.537 at the end of the test. In terms of the requirements of ASTM D5101, the gradient
ratio was acceptable. However, the soil to geotextile permeability was much lower than that
of the soil and therefore not acceptable in terms of the permeability requirements. This
geotextile underwent a heat bonding process during manufacture. This had a significant
influence on its thickness, as it was reduced. The pore size of the geotextile was also
reduced, as the fibres were melted after the needle punching process. This is a probable
Stellenbosch University http://scholar.sun.ac.za

140
reason for this geotextile failing in terms of the required permeability criteria. In conclusion,
this geotextile was not suitable to be used as a filter with this soil.
5.5.2.4 Test No.8: Woven, slit film polypropylene geotextile (W-SLF-PP) vs. Bereasand (PI = 7)
From this test it was evident that a considerable amount of piping of the fine soil particles
had occurred through openings of the geotextile (Table 5.7). This geotextile had the biggest
opening size of all the geotextiles tested. The amount of piping could be problematic, as the
finer soil material could potentially block the drain system to the point where it became
dysfunctional. The soil to geotextile permeability, as shown in Table 5.4, was higher than
that of the soil. It was concluded that the geotextile was acceptable to be used as a filter with
the tested soil, although caution should be exercised with regard to potential piping.
5.5.2.5 Summary of tests numbers 5-8
The gradient ratios and soil to geotextile permeabilities obtained from tests 5 to 8 provided
the following conclusions about the soil to geotextile compatibility:
1. The NW-N-CF-PET geotextile again performed most optimally of all the geotextiles
tested with this soil type. This test had one of the shortest times to stabilise. The soil
to geotextile performance was acceptable in terms of both gradient ratio and
permeability (test 5).
2. The NW-N-SF-PP geotextile never showed signs of clogging and ended with an
acceptable gradient ratio which showed no signs of clogging. However, the soil to
geotextile interface had a permeability rating less than that of the soil. Therefore this
geotextile was not suited to be used as a filter with this soil. (test 6).
3. Similarly to test number 7, the test on the NW-HB-CF-PP geotextile resulted in a
gradient ratio which suggested that, although there was a tendency to clogging, it
was acceptable in terms of its gradient ratio. The soil to geotextile permeability,
however, was found to be much lower than that of the soil and therefore rendered
this geotextile unacceptable for use as a filter with the soil tested (test 7).
4. The W-SLF-PP was not observed to have any sign of blocking. The soil to geotextile
permeability was also found to be higher than that of the soil, which made this
geotextile suitable as a filter for this soil (test 8).
Stellenbosch University http://scholar.sun.ac.za

141
5.5.3 Test numbers 9-12
5.5.3.1 Test No.9: Nonwoven, needle-punched continuous filament polyestergeotextile (NW-N-CF-PET) vs. non plastic Berea sand (2)
From this test result it was evident that the gradient ratios obtained for this test were
relatively high (Table 5.8). This meant that the geotextile had experienced a high degree of
clogging. The finer fraction of the soil was trapped in the matrix of the fibre of the geotextile.
The geotextile showed signs of clogging very early in the test and showed no signs of
recovery until 624 hours into the test. The corresponding permeability, as is illustrated in
Table 5.5, also proved that the permeability of the soil to geotextile interface was way below
the soil’s permeability. This was due the fact that, according to the soil grading curve
illustrated in Chapter 3, it was a semi-gap graded soil. Together with the soil being non
plastic, it had been anticipated that the soil itself would not have enough bigger particles to
hold back the fine particles. This resulted in difficulty being experienced in forming a natural
filter adjacent to the geotextile, and the finer particles then clogged up the pores of the
geotextile. This was also unacceptable in terms of the soil to geotextile permeability criterion.
It was therefore concluded that the geotextile was not acceptable as a filter with this soil.
5.5.3.2 Test No.10: Nonwoven, needle-punched staple fibre polypropylene polyestergeotextile (NW-N-SF-PP) – with single side thermally treated * vs. non plasticBerea sand (2)
The gradient ratios observed for this test were just above 3, which was evidence that the
geotextile had experienced clogging (Table 5.8). The gradient ratio showed some recovery
to below 3 during the middle part of the test, but eventually ended up at 3.604. The soil to
geotextile permeability test results, as in Table 5.5, showed that it was much lower than that
of the soil. Therefore the geotextile was unfit to be used as a filter with the soil.
Stellenbosch University http://scholar.sun.ac.za

142
Table 5.8: Summary of gradient ratios vs. time: test nos. 9-12
Time(Hours)
Test No 9Gradient ratios
Test No 10Gradient ratios
Test No 11Gradient ratios
Test No 12Gradient ratios
1 7.105 3.568 3.953 4.485
24 7.105 3.568 3.953 4.998
48 7.105 3.568 3.953 4.998
120 9.473 2.919 2.223 4.614
144 9.473 2.919 2.223 4.614
168 9.473 2.919 2.223 4.614
192 9.473 2.919 2.223 4.614
216 9.473 2.919 2.541 3.524
288 15.16 2.919 3.294 4.614
312 15.16 2.919 3.294 4.614
336 15.16 2.919 3.294 4.614
360 15.16 2.654 3.294 4.614
384 20.13 3.244 3.623 4.998
456 20.13 3.244 3.623 4.998
480 20.13 3.244 3.623 9.612
504 88.1 3.604 4.743 9.612
528 88.1 3.604 4.743 9.612
600 58.1 5.534 10.25
624 34.1 5.534 10.25
648 34.1 5.534 10.25
672 10.25
5.5.3.3 Test No. 11: Nonwoven, needle-punched staple fibre polypropylene polyestergeotextile (NW-HB-CF-PP) vs. non plastic Berea sand (2)
As in tests 1 and 2, this test produced gradient ratios above 3, which were indicative that the
geotextile had experienced a degree of clogging (Table 5.8). In terms of the geotextile to soil
permeability test results in Table 5.5, it can be seen that this is lower than that of the soil.
From the test outcomes it was concluded that the geotextile was not compatible as a filter
with the soil.
Stellenbosch University http://scholar.sun.ac.za

143
5.5.3.4 Test No. 12: Woven, slit film polypropylene geotextile (W-SLF-PP) vs. nonplastic Berea sand (2)
The gradient ratios observed for this test showed that an excessive degree of blocking of the
geotextile had occurred from the start of the test (Table 5.8). The gradient ratios never
showed recovery and ended at an unacceptable gradient ratio of 10.25. The soil to
geotextile permeability was also much lower than that of the soil. It is concluded that the
geotextile was unacceptable to be used as a filter with this soil.
5.5.3.5 Summary of test numbers 9-12
All these geotextiles showed signs of high gradient ratios, which are indicative of excessive
clogging. This was also proven by the results of the soil to geotextile permeabilities for all the
tests. Judging from the grading curve of soil sample 3, compared to that of sample 2, one
would have expected the soils to behave similarly when in contact with the same geotextiles.
However, soil sample 2 was found to have some cohesion, which assisted with holding back
the finer particles within the soil so that it did not clog the geotextile or pipe. It can be seen
that a slight variation in the soil parameters had a huge effect on its compatibility with the
geotextiles. The challenge of Berea sands is their high degree of variability over a small
area.
5.6 EVALUATION OF GEOTEXTILE FILTER DESIGN CRITERIA
In order to evaluate the available filter design criteria, a comparative analysis was carried out
using the results of the laboratory tests. This was a way to validate the laboratory results,
provided that there was correlation between the two sets of results.
5.6.1 SABS 1200
SABS 1200 defines the geotextiles in grades from 1-10, Grade 1 being the lowest in mass
(100 g/m2) and grade 10 (300 g/m2) being the highest. It is the author’s opinion that most
specifications that are based on the SABS specifications would call for filtration grade
geotextile of grades between 1 and 6. All the geotextiles tested in this study would meet the
criteria set out by SABS 1200. Thus, if an engineer were to use only the SABS specifications
to justify its use in the Berea sands tested in this study, the probability of failure of a
geotextile would be high. It is therefore suggested that the SABS specifications not be
considered in isolation, as they have proved to be inadequate.
Stellenbosch University http://scholar.sun.ac.za

144
5.6.2 COLTO: 1988
COLTO (1988) tabulates drainage and filtration grade geotextiles in terms of penetration
load, puncture resistance and water percolation. Similar to the case of the SABS, it will be
risky to use the COLTO required specifications in isolation. Most of the geotextiles presented
in this thesis would meet the criteria of a grade 3 geotextile, according to COLTO. If an
engineer were to use grade 3 geotextile as his criteria in the Berea sand context, one can
easily see that the recipe is set up for probable failure.
5.6.3 AASHTO M288
An analysis was performed according to AASHTO M288, in order to find what the geotextile
criteria should be with the three Berea sands. This was done with reference to Tables 2.10
and 2.11 in Chapter 2 of this study and as outlined below. This method has already been
discussed in Chapter 2. The tables are included again below for easy reference.
Table 5.9: Geotextile strength requirements (AASHTO M288)
Stellenbosch University http://scholar.sun.ac.za

145
Table 5.10: Subsurface drainage geotextile requirement (AASHTO M288)
5.6.3.1 Soil sample 1 – Berea sand non-plastic
The percentage of particles of a size below 0.075mm < 15% (Table 5.10). For soil sample 1,
the required geotextile specifications according to AASHTO M288 are defined in Table 5.11.
Table 5.11: Soil sample 1: AASHTO geotextile specification requirements vs. testedgeotextiles
AASHTO M288Required Specification
GeotextileProperty
Unit Test Method <50%Elongation
>50%elongation
NW-N-CF-PET
NW-N-SF-PP
NW-HB-CF-PP
W-SLF-PP
Grab Strength N ASTM D 4632 1100 700 500 N/A 625 525
Tear strength N ASTM D 4533 400 350 240 N/A 290 300
PunctureStrength
N ASTM D4833 400 350 1300 1700 1100 2600
Burst Strength kPa ASTM 3786 2700 1700 1500 N/A N/A N/A
Permittivity Sec-1 ASTM D4491 0.5 0.5 2.7 1.4 0.6 N/A
ApparentOpening size
mm ASTM D4751 0.43 0.43 0.205 0.085 0.140 N/A
UltravioletStability
% ASTM D 4355 50% after 500
hrs exposure
50% after 500
hrs exposure
N/A
Stellenbosch University http://scholar.sun.ac.za

146
It is evident from Table 5.11 that woven geotextiles are not recommended as filters (Table
5.11). It can also be established that all the geotextiles tested had smaller openings than
those suggested by AASHTO M288. The strength characteristics were not as important for
this study, besides their consideration regarding possible installation damage.
5.6.3.2 Soil samples 2 and 3 – Berea sand (PI = 7) and Berea sand non plastic (2)
Table 5.12: Soil samples 2 and 3: AASHTO geotextile specification requirements vs.tested geotextiles
AASHTO M288Required Specification
GeotextileProperty
Unit Test Method <50%Elongation
>50%Elongation
NW-N-CF-PET
NW-N-SF-PP
NW-HB-CF-PP
W-SLF-PP
Grab Strength N ASTM D 4632 1100 700 500 N/A 625 525
Tear strength N ASTM D 4533 400 350 240 N/A 290 300
PunctureStrength
N ASTM D4833 400 350 1300 1700 1100 2600
Burst Strength kPa ASTM 3786 2700 1700 1500 N/A N/A N/A
Permittivity Sec-1 ASTM D4491 0.200 0.200 2.7 1.4 0.6 N/A
ApparentOpening size
mm ASTM D4751 0.250 0.250 0.205 0.085 0.140 N/A
UltravioletStability
% ASTM D 4355 50% after 500
hrs exposure
50% after 500
hrs exposure
N/A
When comparing the AASHTO requirements in terms of geotextile opening sizes, it was
evident that all the geotextiles’ pore opening sizes were smaller than the recommended pore
opening sizes (Table 5.12). It is uncertain whether using geotextiles with larger pore opening
sizes would be compatible with the Berea sand. The theory of the number of constrictions
(Ns) is also ignored by AASHTO M288. Whilst the table is a guideline, it should be
established whether the application of the geotextile filter is critical or non-critical. Critical
applications would imply that the consequence of failure of the geotextile performance could
lead to a loss of human life; for example, a dam embankment failure due to the failed
performance of a geotextile. If the application of the geotextile filter is for a critical
application, AASHTO suggest that long term filtration tests, such as the long term gradient
ratio testing according to ASTM D5101, be carried out.
Stellenbosch University http://scholar.sun.ac.za

147
5.6.4 Dutch practice
The geotextile filter criteria based on the d90 of the soil is as follows:
O95 < d90 for wovens,
O90 < 1.8d90 for nonwovens
Soil sample 1: d90 = 0.799 mm
For woven geotextile 095 < 0.799 mm
For a nonwoven geotextile 090 < 1.43 mm
A summary of the actual geotextile pore opening size and the recommended geotextile pore
opening size for soil samples 1, 2 and 3 according to Dutch practice is illustrated in Tables
5.13-5.15 below.
Table 5.13: Geotextile pore opening vs. Dutch criteria for soil sample 1
Geotextile Pore opening size(mm)
Recommended poreopening size (mm)
Geotextilecompatibility
NW-N-CF-PET 0.205 <1.430 Adequate
NW-N-SF-PP 0.085 <1.430 Adequate
NW-HB-CF-PP 0.140 <1.430 Unacceptable
W-SLF-PP 0.670 <0.799 Adequate
Soil sample 2: d90 = 0.372 mm
For a woven geotextile: 095 < 0.372 mm
For nonwoven geotextile: 090 < 0.670 mm
Table 5.14: Geotextile pore opening vs. Dutch criteria for soil sample 2
Geotextile Pore opening size(mm)
Recommended poreopening size (mm)
Geotextilecompatibility
NW-N-CF-PET 0.205 <0.670 Adequate
NW-N-SF-PP 0.085 <0.670 Unacceptable
NW-HB-CF-PP 0.140 <0.670 Unacceptable
W-SLF-PP 0.670 <0.372 Adequate
Stellenbosch University http://scholar.sun.ac.za

148
For soil sample 3: d90 = 0.392 mm
For a woven geotextile: 095 < 0.392 mm
For a nonwoven geotextile: 090 < 0.710 mm
Table 5.15: Geotextile pore opening vs. Dutch criteria for soil sample 3
Geotextile Pore opening size(mm)
Recommended poreopening size (mm)
Geotextilecompatibility
NW-N-CF-PET 0.205 <0.710 Unacceptable
NW-N-SF-PP 0.085 <0.710 Unacceptable
NW-HB-CF-PP 0.140 <0.710 Unacceptable
W-SLF-PP 0.670 <0.392 Unacceptable
Table 5.16: Summary of Dutch filter criteria and geotextile performance
Test No Soil Sample Gtx Pore openingcriteria met
Overall Gtxperformance inlaboratory
1 1 Yes Pass
2 1 Yes Pass
3 1 Yes Fail
4 1 Yes Pass
5 2 Yes Pass
6 2 Yes Fail
7 2 Yes Fail
8 2 No Pass
9 3 Yes Fail
10 3 Yes Fail
11 3 Yes Fail
12 3 No Fail
It can be seen from Table 5.16 that although the geotextiles in most cases met the pore
opening criteria of the Dutch method, there were still a fair number of soil to geotextile
failures. So there was a poor correlation between the geotextile opening size criteria versus
the soil to geotextile systems that had actually passed. From the results t of a total of twelve
tests, only five of the recommended criteria resulted in adequate soil to geotextile
performance. Using the Dutch practice with the Berea sand would not have been ideal.
Stellenbosch University http://scholar.sun.ac.za

149
5.6.5 German practice
Soil Sample 1: d40 = 0.208 mm > 0.06 mm (stable problematic soil)
d10 = 0.040 mm
d90 = 0.799 mm
Cu = 8
Soil sample 2: d40 = 0.161 mm > 0.06 mm (stable problematic soil)
d10 = 0.002 mm
d90 = 0.372 mm
Cu = 95.2
Soil sample 3: d40 = 0.157 mm > 0.06mm (stable problematic soil)
d10 = 0.002 mm
d90 = 0.392 mm
Cu = 111.6
Therefore recommended geotextile opening size is:
O95 < 5d10.Cu0.5 and O95<d90
Stellenbosch University http://scholar.sun.ac.za

150
Soil sample 1: O95 < 0.566 mm and O95 < 0.799 mm
A summary of the actual geotextile pore opening size and the recommended geotextile pore
opening size for soil samples 1, 2 and 3 according to German practice is illustrated in Tables
5.17- 5.19 below.
Table 5.17: Geotextile pore opening vs. German criteria for soil sample 1
Geotextile Pore opening size(mm)
Recommended poreopening size (mm)
Geotextilecompatibility
NW-N-CF-PET 0.205 <0.566 and <0.799 Adequate
NW-N-SF-PP 0.085 <0.566 and <0.799 Adequate
NW-HB-CF-PP 0.140 <0.566 and <0.799 Unacceptable
W-SLF-PP 0.670 <0.566 and <0.799 Adequate
Soil sample 2: O95 < 0.097 mm and O95 < 0.372 mm
Table 5.18: Geotextile pore opening vs. German criteria for soil sample 2
Geotextile Pore opening size(mm)
Recommended poreopening size (mm)
Geotextilecompatibility
NW-N-CF-PET 0.205 <0.097 and <0.372 Adequate
NW-N-SF-PP 0.085 <0.097 and <0.372 Unacceptable
NW-HB-CF-PP 0.140 <0.097 and <0.372 Unacceptable
W-SLF-PP 0.670 <0.097 and <0.372 Adequate
Soil sample 3: O95 < 0.106 mm and O95 < 0.392 mm
Table 5.19: Geotextile pore opening vs. German criteria for soil sample 3
Geotextile Pore opening size(mm)
Recommended poreopening size (mm)
Geotextilecompatibility
NW-N-CF-PET 0.205 <0.106 and <0.392 Unacceptable
NW-N-SF-PP 0.085 <0.106 and <0.392 Unacceptable
NW-HB-CF-PP 0.140 <0.106 and <0.392 Unacceptable
W-SLF-PP 0.670 <0.106 and <0.392 Unacceptable
Stellenbosch University http://scholar.sun.ac.za

151
Table 5.20: Summary of German filter criteria and geotextile performance
Test no Soil Sample no Gtx Pore openingcriteria met
Overall Gtxperformance inlaboratory
1 1 Yes Pass
2 1 Yes Pass
3 1 Yes Fail
4 1 No Pass
5 2 No Pass
6 2 Yes Fail
7 2 No Fail
8 2 No Pass
9 3 No Fail
10 3 Yes Fail
11 3 No Fail
12 3 No Fail
As can be seen in Table 5.20, there is a poor correlation between the geotextile pore
opening criteria versus the soil to geotextile system performance. The German practice also
does not really seem to work well for the Berea sands tested.
5.6.6 American practice
Soil sample 1: d50 = 0.261 mm > 0.075 mm
d85 = 0.612 mm
Soil sample 2: d50 = 0.184 mm > 0.075 mm
d85 = 0.343 mm
Soil Sample 3: d50 = 0.188 mm > 0.075 mm
d85 = 0.364 mm
Geotextile filter criteria for nonwovens: 0.297 mm ≤ O95 ≤ 1.8d85
Geotextile filter criteria for woven geotextiles: 0.297 mm ≤ O95 ≤ d85
Stellenbosch University http://scholar.sun.ac.za

152
Soil Sample 1:
Nonwoven geotextiles: 0.297mm ≤ O95 ≤ 1.102 mm
Woven geotextiles: 0.297mm ≤ O95 ≤ 0.612 mm
A summary of the actual geotextile pore opening size and the recommended geotextile pore
opening size for soil samples 1, 2 and 3 according to American practice is illustrated in
Tables 5.21- 5.23 below.
Table 5.21: Geotextile pore opening vs. American criteria for soil sample 1
Geotextile Pore opening size(mm)
Recommended poreopening size (mm)
Geotextilecompatibility
NW-N-CF-PET 0.205 >0.297 and <1.102 Adequate
NW-N-SF-PP 0.085 >0.297 and <1.102 Adequate
NW-HB-CF-PP 0.140 >0.297 and <1.102 Unacceptable
W-SLF-PP 0.670 >0.297 and <0.612 Adequate
Soil Sample 2
Nonwoven geotextiles: 0.297 mm ≤ O95 ≤ 0.617 mm
Woven geotextiles: 0.297 mm ≤ O95 ≤ 0.343 mm
Table 5.22: Geotextile pore opening vs. American criteria for soil sample 2
Geotextile Pore opening size(mm)
Recommended poreopening size (mm)
Geotextilecompatibility
NW-N-CF-PET 0.205 >0.297 and <1.102 Adequate
NW-N-SF-PP 0.085 >0.297 and <1.102 Unacceptable
NW-HB-CF-PP 0.140 >0.297 and <1.102 Unacceptable
W-SLF-PP 0.670 >0.297 and <0.343 Adequate
Soil Sample 3
Nonwoven geotextiles: 0.297mm ≤ O95 ≤ 0.655 mm
Woven geotextiles: 0.297mm ≤ O95 ≤ 0.364 mm
Stellenbosch University http://scholar.sun.ac.za

153
Table 5.23: Geotextile pore opening vs. American criteria for soil sample 3
Geotextile Pore opening size(mm)
Recommended poreopening size (mm)
Geotextilecompatibility
NW-N-CF-PET 0.205 >0.297 and <1.102 Adequate
NW-N-SF-PP 0.085 >0.297 and <1.102 Adequate
NW-HB-CF-PP 0.140 >0.297 and <1.102 Unacceptable
W-SLF-PP 0.670 >0.297 and <0.364 Adequate
Table 5.24: Summary of American filter criteria and geotextile performance
Test no Soil Sample no Gtx Pore openingcriteria met
Overall Gtxperformance inlaboratory
1 1 No Pass
2 1 No Pass
3 1 No Fail
4 1 No Pass
5 2 No Pass
6 2 No Fail
7 2 No Fail
8 2 No Pass
9 3 No Fail
10 3 No Fail
11 3 No Fail
12 3 No Fail
The results observed from Table 5.24 showed a stronger correlation between the failed
systems and those where the required geotextile pore opening size was not met. However,
there still remains a fair degree of uncertainty and room for error. The American practice
would not be ideal to follow for the Berea sand tested.
Stellenbosch University http://scholar.sun.ac.za

154
5.6.7 French practice
Soil sample 1: Cu = 8 > 4
d15 = 0.085 mm
d85 = 0.612 mm
Soil Sample 2: Cu = 95.2 > 4
d15 = 0.017 mm
d85 = 0.343 mm
Soil Sample 3: Cu = 111.6 >4
d15 = 0.011 mm
d85 = 0.364 mm
The soils are all considered as loose and therefore the geotextile characteristic pore opening
size is recommended to be as follows:
4d15 ≤ O95 ≤ d85
Soil sample 1: 0.340 mm ≤ O95 ≤ 0.612 mm
A summary of the actual geotextile pore opening size and the recommended geotextile pore
opening size for soil samples 1, 2 and 3 according to French practice is illustrated in Tables
5.25- 5.27.
Table 5.25: Geotextile pore opening vs. French criteria for soil sample 1
Geotextile Pore opening size(mm)
Recommended poreopening size (mm)
Geotextilecompatibility
NW-N-CF-PET 0.205 >0.340 and <0.612 Adequate
NW-N-SF-PP 0.085 >0.340 and <0.612 Adequate
NW-HB-CF-PP 0.140 >0.340 and <0.612 Unacceptable
W-SLF-PP 0.670 >0.340 and <0.612 Adequate
Stellenbosch University http://scholar.sun.ac.za

155
Soil Sample 2: 0.068 mm ≤ O95 ≤ 0.343 mm
Table 5.26: Geotextile pore opening vs. French criteria for soil sample 2
Geotextile Pore opening size(mm)
Recommended poreopening size (mm)
Geotextilecompatibility
NW-N-CF-PET 0.205 >0.068 and <0.343 Adequate
NW-N-SF-PP 0.085 >0.068 and <0.343 Unacceptable
NW-HB-CF-PP 0.140 >0.068 and <0.343 Unacceptable
W-SLF-PP 0.670 >0.068 and <0.343 Adequate
Soil Sample 3: 0.044mm ≤ O95 ≤ 0.364 mm
Table 5.27: Geotextile pore opening vs. French criteria for soil sample
Geotextile Pore opening size(mm)
Recommended poreopening size (mm)
Geotextilecompatibility
NW-N-CF-PET 0.205 >0.044 and <0.364 Unacceptable
NW-N-SF-PP 0.085 >0.044 and <0.364 Unacceptable
NW-HB-CF-PP 0.140 >0.044 and <0.364 Unacceptable
W-SLF-PP 0.670 >0.044 and <0.364 Unacceptable3
Stellenbosch University http://scholar.sun.ac.za

156
Table 5.26: Summary of French filter criteria and geotextile performance
Test no Soil Sample no Gtx Pore openingcriteria met
Overall Gtxperformance inlaboratory
1 1 No Pass
2 1 No Pass
3 1 No Fail
4 1 No Pass
5 2 Yes Pass
6 2 Yes Fail
7 2 Yes Fail
8 2 No Pass
9 3 Yes Fail
10 3 Yes Fail
11 3 Yes Fail
12 3 No Fail
Once again, it could be observed in Table 5.26 that there was a poor correlation between the
geotextile pore opening criteria versus the overall soil to geotextile performance. The French
criteria would therefore not be ideal to have adopted for the Berea sand.
Stellenbosch University http://scholar.sun.ac.za

157
5.6.8 Luettich et al. design chart
Figure 5.1: Geotextile filter design chart (after Luettich et al. 1992)
157
5.6.8 Luettich et al. design chart
Figure 5.1: Geotextile filter design chart (after Luettich et al. 1992)
157
5.6.8 Luettich et al. design chart
Figure 5.1: Geotextile filter design chart (after Luettich et al. 1992)
Stellenbosch University http://scholar.sun.ac.za
Stellenbosch University http://scholar.sun.ac.za

158
Soil sample 1:
d10 = 0.040 mm
d20 = 0.122 mm
C’u = d60/d10 = 1.837 < 3
095 < C’u. d’50 = 0.813 mm
A summary of the actual geotextile pore opening size and the recommended geotextile pore
opening size for soil samples 1, 2 and 3 according to the Leuttich et al. practice is illustrated
in Tables 5.27-5.29 below.
Table 5.27: Geotextile pore opening vs. Leuttich et al. criteria for soil sample 1Geotextile Pore opening size
(mm)
Recommended poreopening size (mm)
Geotextilecompatibility
NW-N-CF-PET 0.205 0.813 Adequate
NW-N-SF-PP 0.085 0.813 Adequate
NW-HB-CF-PP 0.140 0.813 Unacceptable
W-SLF-PP 0.670 0.813 Adequate
Soil sample 2
d10 = 0.002 mm
PI = 7 > 5
Soil dispersivity is unknown, as it was not tested. If a soil were dispersive, then all geotextile
filter opening sizes are recommended to be < 0.210 mm. If the soil were dispersive it is
recommended that a 75 mm- 150 mm layer of clean filter sand be placed between the
geotextile and the in-situ soil. The geotextile should then be designed for the clean filter sand
layer. For the purpose of this study this would be the better option in this case, as it
eliminates the uncertainties in variation and behaviour of the Berea sand.
Stellenbosch University http://scholar.sun.ac.za

159
Table 5.28: Geotextile pore opening vs. Leuttich et al. criteria for soil sample 2
Geotextile Pore opening size(mm)
Recommended poreopening size (mm)
Geotextilecompatibility
NW-N-CF-PET 0.205 <0.210 Adequate
NW-N-SF-PP 0.085 <0.210 Unacceptable
NW-HB-CF-PP 0.140 <0.210 Unacceptable
W-SLF-PP 0.670 <0.210 Adequate
Soil sample 3
d10 = 0.002 mm
PI = Non plastic
Cc = 11.95
C’u = d30/d10 = 4.300 > 3
d’50 = 0.235 mm
095 < (9 / C’u). d’50 = 0.492 mm
Table 5.29: Geotextile pore opening vs. Leuttich et al. criteria for soil sample 3
Geotextile Pore opening size(mm)
Recommended poreopening size (mm)
Geotextilecompatibility
NW-N-CF-PET 0.205 <0.492 Unacceptable
NW-N-SF-PP 0.085 <0.492 Unacceptable
NW-HB-CF-PP 0.140 <0.492 Unacceptable
W-SLF-PP 0.670 <0.492 Unacceptable
Once again, all the nonwoven geotextiles had a pore opening size of less than 0.492 mm.
However, the test results still showed high degree of clogging for all of them (Table 5.29).
The woven geotextile had an opening size greater than 0.492 yet also showed results
indicating excessive blocking.
It can be concluded from the above results that the method proposed by Luettich et al. has
not entirely satisfied the design geotextile filter requirements of the Berea sand.
Stellenbosch University http://scholar.sun.ac.za

160
5.8 COMPUTER PROGRAM
The computer program used in this study was based on an Excel spreadsheet produced by
Kaytech. The flowchart is shown again below for easy reference.
Figure 5.2: Flowchart for computer spreadsheet (Kaytech)
Based on the input, the spreadsheet produced the following geotextile criteria:
100 μm<O95>250 μm
A summary of the actual geotextile pore opening sizes and those recommended by the
computer spreadsheet for all soils is illustrated in Table 5.30 below.
Table 5.30: Geotextile pore opening vs. computer spreadsheet output for all soils
Geotextile Pore opening size(mm)
Recommended poreopening size (mm)
NW-N-CF-PET 0.205 >0.100 and <0.250
NW-N-SF-PP 0.085 >0.100 and <0.250
NW-HB-CF-PP 0.140 >0.100 and <0.250
W-SLF-PP 0.670 >0.100 and <0.250
Stellenbosch University http://scholar.sun.ac.za

161
Table 5.31: Summary of computer output filter criteria and geotextile performance
Test no Soil Sample no Gtx Pore openingcriteria met
Overall Gtxperformance inlaboratory
1 1 Yes Pass
2 1 No Pass
3 1 Yes Fail
4 1 No Pass
5 2 Yes Pass
6 2 No Fail
7 2 Yes Fail
8 2 No Pass
9 3 Yes Fail
10 3 No Fail
11 3 Yes Fail
12 3 No Fail
From the computer results it can be seen that there is a poor correlation between the
recommended pore opening size and the actual filter performance (Table 5.30). From the
computer results it is apparent that the computer spreadsheet cannot be applied in isolation
to the Berea sands tested.
5.7 FINE SOIL FRACTION ANALYSIS
An analysis was done on the fine soil fraction that was lodged in the geotextile and the fine
soil fraction passing through? the geotextiles. The amount of fine soil passing through the
geotextiles was too small to enable the researcher to carry out further grading analysis. The
results are illustrated in Table 5.31.
Stellenbosch University http://scholar.sun.ac.za

162
Table 5.32: Fine soil fraction lodged within and passing geotextileTest no. Total mass
of soilsample (g)
Gtx massbefore test (g)
Gtx massafter test (g)
Mass of finesoil fraction
lodged insideGtx (g)
Mass of finesoil fractionpassing Gtx
(g)
1 1200 1.46 5.52 4.06 2.08
2 1200 1.92 3.26 1.34 3.01
3 1200 1.46 2.34 0.88 0.67
4 1200 1.70 1.89 0.19 0.42
5 1200 2.10 4.80 2.70 1.07
6 1200 1.81 2.33 0.52 0.88
7 1200 1.49 1.76 0.27 1.18
8 1200 1.73 1.97 0.24 1.10
9 1200 1.90 11.40 9.50 1.56
10 1200 1.89 10.08 8.19 1.84
11 1200 1.56 4.40 2.84 0.70
12 1200 1.82 4.08 2.26 0.21
Tests 1- 4
From tests 1-4, it can be seen that most fines had piped through the geotextile in test no. 2.
Although this geotextile had the smallest opening size of the tested geotextiles, the author is
of the opinion that some localised flow and piping occurred at the soil to geotextile interface.
The NW-N-CF-PET geotextile which was used in test 1 was the thickest and had the most
soil particles lodged within it.
Stellenbosch University http://scholar.sun.ac.za

163
Tests 5- 9
The soil had some cohesion and it was evident by observation that a lesser amount of fine
soil particles had piped through the geotextiles compared to tests 1- 4. This means that the
soil, due to its cohesive nature, held back the finer soil particles within the soil matrix. There
were also fewer soil particles lodged within the geotextile compared to those found during
tests 1-4.
Tests 9- 12
During this set of tests, the geotextiles experienced the highest degree of clogging. This was
apparent by the mass of fines lodged within the geotextile. The nonwovens, because of their
thickness, had the greatest amount of fines trapped within them. The amount of soil particles
that piped through the geotextiles was minimal.
5.8 DISCUSSION OF RESULTS
From the analysis of the laboratory test results and the evaluation of the available geotextile
filter design criteria, much has been learnt and discovered about the interactive behaviour
between Berea sand and some of the commercially available geotextiles in South Africa.
5.8.1 Geotextiles
The geotextiles used in the study were all considered as filtration grade geotextiles in the
current industry. The geotextiles were made of different polymers as well as by different
manufacturing techniques. It was evident that none of the geotextiles met the criteria for the
number of constrictions according to Giroud. The only way this could have been improved on
was to use much thicker geotextiles in the study. This could be one of the important reasons
why there were unexpected failures in some cases.
5.8.2 Soil to geotextile interaction
Out of the 12 long term gradient ratio tests performed it was found that only 5 of the tests
were acceptable; those where the geotextiles had not clogged and which also met the soil to
geotextile permeability requirement. It was also found that the two geotextiles with the bigger
pore opening sizes performed better overall than the two geotextiles with smaller sized pore
openings. This is indicative that the Berea sand is unique in the sense that it has a very high
degree of variability in terms of is engineering properties. It is also common to find a high
degree of variability of the Berea sand when two investigative test pits are dug even only a
Stellenbosch University http://scholar.sun.ac.za

164
few meters apart. The Berea sand proved to be highly problematic when the geotextiles
were expected to perform as a filter in conjunction with the Berea sands in this study.
Piping of fine soil particles was observed in various magnitudes across the range of
geotextiles. The amount of fines that piped through the geotextile was considered negligible
as a percentage of the sample of soil used. Therefore, from this study, piping would not be
considered as a cause of failure. It was observed that the thicker nonwoven geotextiles
retained the fines within themselves due to their thickness. It is the author’s opinion that
some piping might also have occurred during the test setup, when the permeameters were
manually tapped by hand.
5.8.2 Failure mechanisms
It was found from the study that the geotextiles either:
i) Clogged due to high gradient ratio
ii) Failed the soil to geotextile permeability criteria, but had an acceptable gradient ratio
iii) Suffered from a combination of the above inadequacies
From the results of the study it could be deduced that there were more cases of the soil to
geotextile permeability falling short of the criteria than cases in which the geotextiles were
clogged.
5.8.3 Soil properties
The three soil samples exhibited varying co-efficients of uniformity. It can be deduced that
the highest coefficient of uniformity encountered, that of soil sample 3, together with its non-
plastic nature, made it the most problematic of all the soils. It can also be deduced that the
even when the gradings of soil samples 2 and 3 exhibited the same grading, they differed in
PI, which yielded different results when in conjunction with the various geotextiles.
5.8.4 Regional filter criteria
When the regional filter criteria were compared to the laboratory results, there were poor
correlations throughout. This proves that the Berea sand is a challenge to the design of
geotextile filters, because of its high variability in engineering properties. It is suggested that
a new set of filter criteria should be developed for Berea sands.
Stellenbosch University http://scholar.sun.ac.za

165
5.8.5 Computer results
From the computer results it was observed that there was a poor correlation between the
suggested filter requirements and the outcomes of the laboratory study. The computer
program is therefore not recommended for use in isolation as a predictive tool for geotextile
filters to be used in conjunction with Berea sands.
Stellenbosch University http://scholar.sun.ac.za

166
6 Conclusions and Recommendations
6.1 INTRODUCTION
Through this study, a greater understanding has been achieved of how common
commercially available geotextiles behave as filters when used in intimate contact with the
Berea sands found along the KwaZulu-Natal coastline of South Africa. The study focussed
only on uni-directional flow conditions through the soil. The gradient ratio according to ASTM
D5101 proved to be a satisfactory method for determining the geotextile’s clogging potential
and, ultimately, its suitability as a filter in the Berea sands.
The analysis of the laboratory test results highlighted and confirmed the high variability of the
Berea sands and the challenges that confront engineers wanting to design geotextile filters
to operate in it. The study also highlights that fine gap and semi-gap graded soils with little or
no cohesion proved to be the most problematic to the geotextiles.
The co-efficients of uniformity of the soils were widespread and no inter-soil correlation could
be made as to which co-efficient of uniformity performed best with the tested geotextiles. It
could be concluded that the non-plastic soil with the highest co-efficient of uniformity was the
most problematic to the geotextiles in terms of clogging.
It was confirmed that out of twelve soil to geotextile tests performed, only five permutations
behaved satisfactorily, equating to a failure rate of 58.33%. Although the gradient ratio
provides an early warning that a geotextile might clog or block, the study also proved that the
permeability criteria are just as important.
None of the geotextiles met the criteria regarding number of constrictions. The low number
of constrictions encountered in the geotextiles tested could possibly be the reason why there
were a high number of geotextile failures. In order for the geotextiles to have met this
criterion, they would have to be thicker. This would have cost implications which could
render the use of geotextiles as questionably non-competitive against conventional drainage
techniques.
With all the uncertainties that confront engineers wanting to design for the use of geotextile
filters in Berea sands, it is recommended that the severity of the conditions and whether the
drain is critical or not should be evaluated. It should then be decided whether laboratory
tests are necessary to complement their design. In the case of Berea sands it is highly
recommended that these laboratory tests be considered in the design process.
Stellenbosch University http://scholar.sun.ac.za

167
6.2 FILTER DESIGN CRITERIA
It has been established that the existing recommendations for geotextiles in drainage works
in a South African context is out of date and that they do not consider the soil to geotextile
interaction. Most of the guidelines seem to concentrate on the mechanical characteristics of
the geotextile such as tensile strength and CBR, whereas very little is mentioned by way of
the geotextiles’ hydraulic characteristics such pore size, thickness and number of
constrictions. Some of the international filter criteria guidelines were used, in conjunction
with the properties of the Berea sand, to predict geotextile pore opening sizes. It was found
that there was poor correlation between the recommended filter opening sizes versus the
results of the laboratory tests.
6.3 RECOMMENDATIONS FOR FURTHER STUDIES
The study was limited to four variants of geotextile and three variants of Berea sand. It is
therefore recommended that more variants of Berea sand be tested with the same geotextile
types. This would be useful in obtaining repeatability of results upon which to develop
specific geotextile filter criteria for Berea sands. The relevance of geotextile fibre diameter
and stiffness were not discussed in this study and it would be useful to know what effect
these parameters would have on the geotextile compatibility with Berea sands. Lastly, the
study was limited to a hydraulic gradient of 1 and more tests should be conducted at higher
hydraulic gradients to ascertain how these geotextiles would perform in deep drains or in
conjunction with sand tailings, especially on the KwaZulu-Natal north coast.
There is much to gain from knowing more about how geotextiles perform in a challenging
environment, such as the Berea sands. It is not the intention that the conclusions of this
study should suggest refraining from the use of geotextiles in Berea sands, but merely to
highlight the potential risks associated with it. If approached in the correct manner, there are
many benefits to be gained by the use of geotextiles.
Stellenbosch University http://scholar.sun.ac.za

168
REFERENCES
Agershou, H.A. 1961. Synthetic material filters in coastal protection. Journal of theWaterways, Harbours, and Coastal Engineering Division, 87(WW1), 111-124.
ASTM D5101 2006. Standard test method for measuring the soil-geotextile system cloggingpotential by the gradient ratio.
Barrett, R.J.1966. Use of plastic filters in coastal structures. Proceedings of the TenthInternational Conference on Coastal Engineering. American Society of Civil Engineers, vol.2, 1048-1067.
Bergado, D.T., Manivannan, R. and Balasubramanian, A.S. 1996. Proposed criteria fordischarge capacity of prefabricated vertical drains. J. Geotextiles and Geomembranes,14(9), 481-506.
Bertram, G.E. 1940. An experimental investigation of protective filters. Soil mechanics seriesno. 7, Publication No. 267, Graduate School of Engineering. Cambridge, MA: HarvardUniversity.
Brune, M., Ramke, H.G., Collins, H.J. and Hanert, H.H. 1991. Incrustation Processes inDrainage Systems of Sanitary Landfills. Proceedings Sardinia 1991, Third InternationalLandfill Symposium. CISA, Environmental Sanitary Engineering Centre, Cagliari, Italy, 999-1035.
Cancelli, A. and Cazzuffi, D. 1987. Permeability of Geotextiles in the Presence of WaterPolluted Fluids. Proceedings of Geosynthetics 1987, vol. 2, New Orleans, LA.
Carroll, R.G. Jr. 1983. Geotextile filter criteria. Transportation Research Record, 916, 46-53.
Colin, G., Mitton, M.T., Carlson, D.J. and Wiles, D.M. 1986. The effect of soil burial exposureon some geotechnical fabrics. Geotextiles and Geomembranes, 4(1), 1-8.
COLTO, Committee of Land Transport Officials 1998. Standard Specifications for Road andBridge Works for State Road Authorities.
Curiskis, J.I. and Lawson, C.R. 1985. An introduction to geotextiles with specific reference toapplications in pavement design and construction. Proceedings of the Symposium onRecent Developments in Pavement Design and Construction, Canberra, ADFA, 3-1-3.134.
De Medoca, M. and Ehrlich, M. 2006. Column Test Studies of Ochre Biofilm Formation inGeotextile Filters. J. Geotech. Geoenvironmental Engineering, 1284-1292.
Stellenbosch University http://scholar.sun.ac.za

169
De Mello, V.F.B. 1977. Reflections on Design Decisions of Practical Significance toEmbankment Dams. Geotechnique, 27(3), 279-355.
Dunham, J. W, and Barrett, R. J. 1974. Woven Plastic Cloth Filters for Stone Seawalls,Journal of the Waterways, Harbours, and Coastal Engineering Division, American Society ofCivil Engineers, 100(WW1), 13-22.
Fannin, R.J. 2010. On the clogging of geotextiles. Proceedings of 9th InternationalConference on Geosynthetics, Brazil 2010, 402-412.
Fannin, R.J., and Moffat, R.A. 2006. Observations on internal stability of cohesionless soils.Geotechnique, 56(7), 497-500.
Fourie, A.B., Kuchema, S.M. and Blight, G.E. 1994. Effect of biological clogging on thefiltration capacity of geotextiles. Proceedings of the fifth International Conference onGeosynthetics, Singapore, vol. 2, 721-724.
Fry, J.J., and Fell, R. 2007. Internal Erosion of Dams and their Foundations. Taylor andFrancis.
Giroud, J.P. 1982. Filter criteria for Geotextiles. Proceedings of the Second InternationalConference of Geotextiles, Las Vegas, vol. 1, 103-108.
Giroud, J.P. 1996. Granular filters and geotextile filters. Proceedings of Geofilters 1996,Montreal, Canada, 565-680.
Giroud, J.P. 2010. Development of criteria for geotextile and granular filters. Proceedings of9th International Conference on Geosynthetics, Brazil 2010, 45-64
Halse, Y.H., Koerner, R.M and Lord, A.E., Jr. (1987a). Effect of high levels of alkalinity ongeotextiles. Part 1: Ca(OH)2 solutions. Geotextiles and Geomembranes, 5, 261-282.
Halse, Y.H., Koerner, R.M. and Lord, A.E., Jr. (1987b). Effect of high levels of alkalinity ongeotextiles. Part 2: NaOH solutions. Geotextiles and Geomembranes, 6, 295-306.
John, N.W.M., 1987. Geotextiles., Glasgow and London: Blackie and Son.
Kenney, T.C. and Lau, D. 1985. Internal stability of granular filters. Canadian GeotechnicalJournal, 22, 215-225.
Kenney, T.C., Lau, D., and Ofoegbu, G.I. 1984. Permeability of compacted granularmaterials. Canadian Geotechnical Journal, 21, 726-729.
Koerner, R.M. 2005. Designing with geosynthetics. 5th ed. New Jersey: Pearson PrenticeHall:.
Stellenbosch University http://scholar.sun.ac.za

170
Lafleur, J. 1984. Filter testing of broadly graded cohesionless tills. Canadian GeotechnicalJournal., 21(4), 634-643.
Lawson, C.R. 1982. Filter criteria for geotextiles: relevance and use. American Society ofCivil Engineers Journal of Geotechnical Engineering, , 8, 1300-1317.
Luettich, S.M., Giroud, J.P. and Bachus, R.C. 1992. Geotextile filter design guide.Geotextiles and Geomembranes, 11. 355-370.
Lund, A. 1949. An experimental study of graded filters. MSc Thesis, University of London.
McBean, E.A., Rovers, F.A. and Farquhar, G.J. 1995. Solid waste landfill engineering anddesign. Englewood Cliffs, New Jersey: Prentice Hall.
McGown, A., Kabir, M.H. and Murray, R.T. 1982. Compressibility and hydraulic conductivityof geotextiles. Proceedings of the Second International Conference on Geotextiles, LasVegas, vol. 1, 167-172.
Mitchell, J.K, and Soga, K. 2005. Fundamentals of Soil behaviour. Canada: John Wiley andSons.
Moncrieff, R.W., 1975. Man-made fibres, 6th ed. New York: Wiley and Sons.
Moraci, N., 2010. Geotextile filter: Design, characterization and factors affecting cloggingand blinding limit states. Proceedings of the Ninth International Conference onGeosynthetics, Brazil, 413-435.
Palmeira, E.M and Gardoni, M.G. 2002. Drainage and filtration properties of nonwovengeotextiles under confinement using different experimental techniques. Geotextiles andGeomembranes, 20, 97-115.
Rankilor, R.R. 1981. Membranes in Ground Engineering. Chichester: John Wiley and Sons.
Raumann, G. 1982. Outdoor exposure tests of geotextiles. Proceedings of the SecondInternational Conference on Geotextiles, Las Vegas, vol. 2, 541-546.
Rollin, A.L. and Lombard, G. 1988. Mechanisms affecting long-term filtration behaviour ofgeotextiles. Geotextiles and Geomembranes, 7, 119-145.
SABS, South African Bureau of Standards 1982. Standardised specification for civilengineering construction.
Scheurenberg, R.J. 1986. Internal stability of Granular Filters. Proceedings of theSymposium on Filters. Geotechnical Division, South African Institution of Civil Engineers.
Stellenbosch University http://scholar.sun.ac.za

171
Sherard, J.L. 1979. Sinkholes in dams of coarse broadly graded soils. Transactions of theThirteenth International Congress on Large Dams, New Delhi, vol. 2, 25-35.
Sherard, J.L. and Dunnigan, L.P. 1986. Discussion on “Internal stability of granular filters” byKenny and Lau (1985). Canadian Geotechnical Journal, 23, 418-420.
Soares, H.F. 1980. Experiments on the retention of soils by filters. M Phil Thesis, Universityof London.
Sotton, M. Leclercq, B., Fedoroff, N., Fayoux, D. and Paute, J.L. 1982. Contribution to thestudy of clogging of geotextiles: morphological approach. Proceedings of the SecondInternational Conference on Geotextiles, Las Vegas, vol. 1, 109-114.
Terzhagi, K. 1922. Bon-Hanifa Dam, North Africa. Unpublished report quoted by Bertram,1940.
TRH 14, 1985. Technical Recommendations for Highways. Guidelines for road constructionmaterials.
Troost, G.H., and den Hoedt, G. 1984. Resistance of geotextiles to physical, chemical andmicrobiological attacks. Nationales Symposium geotextilien im Erd-und Grundbau, Koln,West Germany, 91-96.
Van Zanten, R.V. (Editor) 1986. Geotextiles and Geomembranes in Civil Engineering.Rotterdam: Balkema.
Van Zanten, R.V. and Thabet, R.A.H. 1982. Investigation on long-term behaviour ofgeotextiles in bank protection works. Proceedings of the second International Conference ofGeotextiles, Las Vegas, vol. 1, 259-264.
Watson, P.D.J., and John, N.W.M. 1999. Geotextile filter design and simulated bridgeformation at the soil-geotextile interface. Geotextiles and Geomembranes, 17(5-6), 265-280.
Wolski, W. 1987. Filters – General Report. Proceedings of the Ninth European Conferenceon Soil Mechanics and Foundation Engineering, Dublin, vol. 3, 1351-1366.
Stellenbosch University http://scholar.sun.ac.za

172
APPENDIX A – Soil grading analysis
Client Justin November Test Number 20130312
Consultant Date Received
Project Soil to Geotextile research - Berea sand Date Start
Date Fin
Sample ID Sands Tested by JN
Compiled by JN
Sample Details : Sample 1 Sample 2 Sample 3 Data Form 4 Test Status
Total mass
Particle % passing % passing % passing % passing
Size - mm
Stellenbosch University http://scholar.sun.ac.za
Stellenbosch University http://scholar.sun.ac.za

173
5.6000 100 100 100
4.7500 100 100 100
2.0000 99 100 100
1.0000 95 100 98
0.4250 80 99 96
0.2120 41 63 58
0.1500 24 35 38
0.0750 14 27 31
0.0450 11 22 16
0.0120 5 14 15
0.0036 2 11 12
0.0020 1 10 10
0.0015 1 9 8
Stellenbosch University http://scholar.sun.ac.za
Stellenbosch University http://scholar.sun.ac.za

174
APPENDIX B – Calculated soil parameters
SOIL SAMPLE 1
AUTOSTABILITY d85 / d15 > 5 7.17 Soil Stable
COEF. OF UNIFORMITY Cu = d60 / d10 < 15 7.95 Soil Well Graded
COEF.OF CURVATURE d30^2 / d60 * d10 2.36 Soil Internally Stable
CLAY TO SILT RATIO % Clay (0.002) / % Silt (0.075) > 0.5 0.097 Problem Soil
COHESION non-cohesive
Critical Area: Percent between 20 and 100 micron. 0.02 mm < d < 0.1 mm > 50% 0.107 OK
Stellenbosch University http://scholar.sun.ac.za
Stellenbosch University http://scholar.sun.ac.za

175
SOIL SAMPLE 2
AUTOSTABILITY d85 / d15 > 5 20.62 Soil Stable
COEF. OF UNIFORMITY Cu = d60 / d10 < 15 95.2 Soil Broadly Graded
COEF.OF CURVATURE d30^2 / d60 * d10 23.2 Soil Internally Unstable
CLAY TO SILT RATIO % Clay (0.002) / % Silt (0.075) > 0.5 0.57 Soil OK
COHESION cohesive
Critical Area: Percent between 20 and 100 micron. 14% Soil OK
SOIL SAMPLE 3
AUTOSTABILITY d85 / d15 > 5 32.69 Soil Stable
COEF. OF UNIFORMITY Cu = d60 / d10 < 15 111.56 Soil Broadly Graded
COEF.OF CURVATURE d30^2 / d60 * d10 12.05 Soil Internally Unstable
CLAY TO SILT RATIO % Clay (0.002) / % Silt (0.075) > 0.5 0.48 Problem Soil
COHESION non-cohesive
Critical Area: Percent between 20 and 100 micron. 0.02mm < d < 0.1mm > 50% 0.18 Soil OK
Stellenbosch University http://scholar.sun.ac.za
Stellenbosch University http://scholar.sun.ac.za

176
Stellenbosch University http://scholar.sun.ac.za
Stellenbosch University http://scholar.sun.ac.za