Embed Size (px)
Citation preview
International Journal of Heat and Fluid Flow 42 (2013) 139–150
Contents lists available at SciVerse ScienceDirect
International Journal of Heat and Fluid Flow
journal homepage: www.elsevier .com/ locate/ i jhf f
Study of active flow control for a simplified vehicle modelusing the PANS method
0142-727X/$ - see front matter � 2013 Elsevier Inc. All rights reserved.http://dx.doi.org/10.1016/j.ijheatfluidflow.2013.02.001
⇑ Corresponding author. Tel.: +46 31 772 5272.E-mail addresses: [email protected] (X. Han), [email protected] (S. Krajnovic),
[email protected] (B. Basara).
Xingsi Han a, Siniša Krajnovic a,⇑, Branislav Basara b
a Division of Fluid Dynamics, Department of Applied Mechanics, Chalmers University of Technology, 41296 Gothenburg, Swedenb AVL List GmbH, Advanced Simulation Technologies, 8020 Graz, Austria
a r t i c l e i n f o a b s t r a c t
Article history:Received 18 July 2012Received in revised form 30 January 2013Accepted 1 February 2013Available online 10 May 2013
Keywords:Active flow controlPANS methodDrag reductionHybrid methodVehicle aerodynamics
Flow control has shown a potential in reducing the drag in vehicle aerodynamics. The present numericalstudy deals with active flow control for a quasi-2D simplified vehicle model using a synthetic jet (zero netmass flux jet). Recently developed near-wall Partially-Averaged Navier–Stokes (PANS) method, based onthe f–f RANS turbulence model, is used. The aim is to validate the performance of this new method for thecomplex flow control problem. Results are compared with previous studies using LES and experiments,including global flow parameters of Strouhal number, drag coefficients and velocity profiles. The PANSmethod predicts a drag reduction of approximately 15%, which is closer to the experimental data thanthe previous LES results. The velocity profiles predicted by the PANS method agree well with LES resultsand experimental data for both natural and controlled cases. The PANS prediction showed that the near-wake region is locked-on due to the synthetic jet, and the shear layer instabilities are thus depressedwhich resulted in an elongated wake region and reduced drag. It demonstrates that the PANS methodis able to predict the flow control problem well and is thus appropriate for flow control studies.
� 2013 Elsevier Inc. All rights reserved.
1. Introduction
Reduction in drag is highly related to energy savings and globalenvironment protection, and successful flow control for dragreduction can lead to significant financial benefits. Some car com-panies have the target to reduce at least 30% of the vehicles’ dragusing flow control solutions. The topic of flow control for dragreduction has thus attracted increasing interest in recent years,not only from industry, but also from academic research (Spalartand Mclean, 2011).
Road vehicles are essentially bluff bodies, and the total drag isthus dominated by the pressure drag caused by the flow separationat the rear end of the vehicles. An increased drag is a negative con-sequence of this flow separation. Thus, the suppression or a desiredcontrol of flow separation has been addressed for many decades inthe domain of fluid dynamics. Various methods for bluff body flowcontrol have been proposed and well-investigated. The majorachievements of bluff body flow controls were recently reviewed(Choi et al., 2008). The flow control methods can be generally clas-sified as passive or active. Passive control devices, such as riblets(Klumpp et al., 2010) and vortex generators (Kuya et al., 2009),have been shown to be quite effective in delaying flow separationbut cannot adapt to changes in the incoming flow. Particularly for
commercial vehicles such as trucks and buses, the design con-straints make it more difficult to achieve passive flow control bychanging the geometry. As an alternative, active flow control canbe achieved by influencing the flow field instead of changing thegeometry. The active control approaches, such as vibrating rod(Huang et al., 2011), and steady or unsteady blowing and suction(Krajnovic and Fernandes, 2011; Krajnovic et al., 2010; Ben-Hamouet al., 2007; Lengani et al., 2011), coupled with the control input tothe flow instabilities can operate in a broad range of conditions.Among them, synthetic jets have recently emerged as a versatileactuation technology tool. One of the most appealing features ofthe synthetic jet is the possibility of inducing momentum transferwithout a consumption of mass flow. The effects of aerodynamicflow control by the synthetic jet were recently reviewed (Glezer,2011). In practice, actuators based on synthetic jets have beenshown to be very effective for several applications of aerodynamicflow control (Henning, 2008; Ben-Hamou et al., 2007; Lenganiet al., 2011; Sahni et al., 2011).
Although the effectiveness of the synthetic jet for flow controlhas been extensively observed in experimental investigations, itis still not easy to recover the effects in a numerical study. Aspointed out by Spalart and Mclean (2011), the situation of CFDstudies is difficult for active flow control, and there are major is-sues with computing cost and turbulence modeling. This is becausenumerical study of flow control requires accurate predictions offlow structures, even small ones. For the bluff body flow, the flowcontrol effects are highly related to the shear layer instabilities and
140 X. Han et al. / International Journal of Heat and Fluid Flow 42 (2013) 139–150
vortex movements. A numerical method should be able to repro-duce the process accurately so as to be able to reproduce the flowcontrol effects. Reynolds-Averaged Navier–Stokes (RANS) turbu-lence models cannot accurately represent complex unsteady flowdynamics associated with flow control, and therefore the RANS cal-culation is generally untrustworthy in flow control problems (Spal-art and Mclean, 2011). Large Eddy Simulation (LES) is a candidatefor studying active flow control problems as it can resolve the un-steady flow structures well. Krajnovic and Fernandes (2011) re-cently studied the flow control case from the present workapplying LES and predicted a decrease in the drag force of about9.8%. It was found that the LES can be used to simulate active flowcontrol of vehicle-like bluff bodies at moderate Reynolds numbers.
However, the LES technique still needs great computational ef-fort for operational Re number flows in vehicle aerodynamics. Withthe rapid development of the hybrid RANS–LES methodology, someattempts have been made to study vehicle aerodynamics using hy-brid methodology. Hemida and Krajnovic used DES to study flowaround a double-deck bus influenced by the crosswind (Hemidaand Krajnovic, 2009). Guilmineau et al. (2011) investigated themain flow features of the Ahmed body applying the Detached EddySimulation (DES) approach. Several versions of the DES modelsbased on the k–x SST turbulence model are used. The work showsthat the DES approaches, and particularly the DES-SST model, givea better solution than the RANS solution. Basara et al. (2008) pres-ent a comparative analysis of simulations for the so-called Ahmedbody at a slant angle of 25� between the Partially-Averaged Na-vier–Stokes (PANS) and previous LES (Krajnovic and Davidson,2005a; Krajnovic and Davidson, 2005b) methods. A comparativeassessment of the different approaches is made with an apprecia-tion of the respective advantages and disadvantages of the method.
The PANS method is a recently developed hybrid approach thatis a bridging closure model intended for any level of resolution be-tween the RANS method and Direct Numerical Simulation (DNS)(Girimaji, 2006). It has been successfully used in some complexflow problems (Basara et al., 2011; Jeong and Girimaji, 2010;Lakshmipathy and Girimaji, 2010). Recently, the PANS strategywas further applied to the four-equation k–e–f–f turbulence modelfor the purpose of improved near-wall behavior (Basara et al.,2011). The new four-equation PANS model retains the simplicityof the previous two-equation PANS versions, but significantly im-proves predictions in the near-wall region confirmed in a turbulentchannel flow and flow around a three-dimensional circular cylin-der mounted vertically on a flat plate (Basara et al., 2011). Thismodel was recently successfully applied in a large PANS simulation(Krajnovic et al., 2012) where the flow around rudimentary landinggear is predicted.
As mentioned above, the active flow control problem is chal-lenging for turbulence modeling. In the present work, the new
Fig. 1. The geometry of the simplified vehicle model: quasi-2D Ahmed body, r
four-equation PANS methodology is further applied to the activeflow control problem in vehicle aerodynamics. It is used to studythe active flow control for a quasi-2D simplified vehicle model bya synthetic jet. The performance of this model is addressed in com-parisons with experimental data (Henning, 2008) and previous LESresults (Krajnovic and Fernandes, 2011). The long term goal ofpresent work is to use the PANS method for investigating flow con-trol processes at operational Reynolds number of road vehicles.
2. Problem descriptions
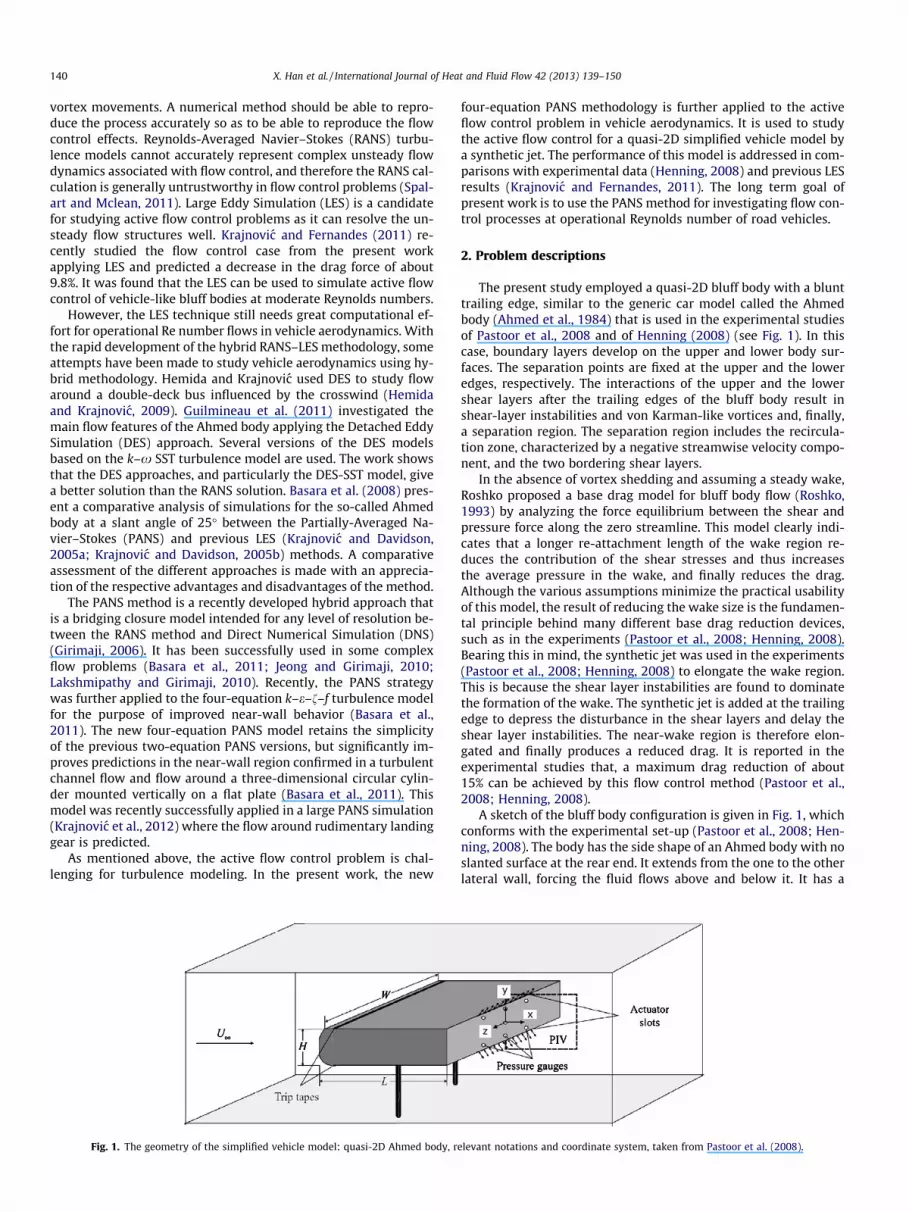
The present study employed a quasi-2D bluff body with a blunttrailing edge, similar to the generic car model called the Ahmedbody (Ahmed et al., 1984) that is used in the experimental studiesof Pastoor et al., 2008 and of Henning (2008) (see Fig. 1). In thiscase, boundary layers develop on the upper and lower body sur-faces. The separation points are fixed at the upper and the loweredges, respectively. The interactions of the upper and the lowershear layers after the trailing edges of the bluff body result inshear-layer instabilities and von Karman-like vortices and, finally,a separation region. The separation region includes the recircula-tion zone, characterized by a negative streamwise velocity compo-nent, and the two bordering shear layers.
In the absence of vortex shedding and assuming a steady wake,Roshko proposed a base drag model for bluff body flow (Roshko,1993) by analyzing the force equilibrium between the shear andpressure force along the zero streamline. This model clearly indi-cates that a longer re-attachment length of the wake region re-duces the contribution of the shear stresses and thus increasesthe average pressure in the wake, and finally reduces the drag.Although the various assumptions minimize the practical usabilityof this model, the result of reducing the wake size is the fundamen-tal principle behind many different base drag reduction devices,such as in the experiments (Pastoor et al., 2008; Henning, 2008).Bearing this in mind, the synthetic jet was used in the experiments(Pastoor et al., 2008; Henning, 2008) to elongate the wake region.This is because the shear layer instabilities are found to dominatethe formation of the wake. The synthetic jet is added at the trailingedge to depress the disturbance in the shear layers and delay theshear layer instabilities. The near-wake region is therefore elon-gated and finally produces a reduced drag. It is reported in theexperimental studies that, a maximum drag reduction of about15% can be achieved by this flow control method (Pastoor et al.,2008; Henning, 2008).
A sketch of the bluff body configuration is given in Fig. 1, whichconforms with the experimental set-up (Pastoor et al., 2008; Hen-ning, 2008). The body has the side shape of an Ahmed body with noslanted surface at the rear end. It extends from the one to the otherlateral wall, forcing the fluid flows above and below it. It has a
elevant notations and coordinate system, taken from Pastoor et al. (2008).
X. Han et al. / International Journal of Heat and Fluid Flow 42 (2013) 139–150 141
cross section with chord length L = 262 mm, height H = 72 mm andspanwise width W = 550 mm. The front of the body has a radius of25 mm. Two trip tapes with a height of 0.8 mm and length of 5 mmwere placed on the upper and the lower face of the body 30 mmdownstream of the front. The bluff body is mounted on two rods.The rods have a diameter of 15 mm and are attached to the bluffbody’s lower surface at (x,z) = (�131 mm, �175 mm) and(x,z) = (�131 mm,175 mm), respectively. In the present numericalstudy, the Reynolds number of the flow is ReH = 2.0 � 104 based onthe inlet velocity and the height of the model, while a slightly high-er Reynolds number, ReH = 2.3 � 104, was applied in the experi-mental studies (Pastoor et al., 2008; Henning, 2008).
The idea of the flow control used in Henning (2008), Pastooret al. (2008) and a previous LES study (Krajnovic and Fernandes,2011) is to use a synthetic jet (i.e. alternating blowing and suction)at the rear end of the body with the purpose of delaying the shearlayer instabilities and thereby the interactions of the shear layers.For actuation in the experiments, spanwise slots with a width ofs = 1 mm and a spanwise length of 250 mm were placed at theupper and the lower edges with an actuation angle of 45� to thestreamwise direction. Harmonic actuations ~us ¼ uAsinð2pfAtÞðcosð/Þ~iþ sinð/Þ~jÞ, with actuation amplitude uA, actuation fre-quency fA, and the actuation angle /, where~i and~j are the unit vec-tors in the x and y directions, respectively, were applied for eachslot. This leads to a periodic suction and blowing with a corre-sponding effective velocity at the slots. A non-dimensional descrip-tion of the actuation frequency is given by the Strouhal numberStA = fAH/U1, where H is the height of the body and U1 is the freestream velocity. The non-dimensional momentum coefficient Cm
is used to characterize the actuation amplitude in the form ofCm ¼ 4su2
A=HU21.
In the previous numerical simulation using LES (Krajnovic andFernandes, 2011), parametric studies of the location of the actua-tion slots, the actuation amplitude and frequencies were conductedat a lower Reynolds number, ReH = 2.0 � 103. The optimal parame-ters were then used for the real flow with a higher Reynolds numberof ReH = 2.0 � 104. In the present work, the optimal parameters areadopted from the previous LES study (Krajnovic and Fernandes,2011). The optimal set of actuating parameters are StA = 0.17 andCm = 0.015, identified in the experimental study (Henning, 2008)and the previous LES study (Krajnovic and Fernandes, 2011). Har-monic actuation is applied to each slot in the simulation by impos-ing a velocity on the boundary equal to ~us ¼ uAsinð2pfAtÞðcosð/Þ~iþ sinð/Þ~jÞ. It should be noted that the two actuation slotsin the experimental study were inclined at a 45� angle. However,in the LES study (Krajnovic and Fernandes, 2011), two pairs of slotsaround the upper and the lower edges were used because a betterhexahedral computational grid can be obtained with this slot set-up. Nevertheless, the same momentum coefficient and directionof the actuating flow as in the experiments were kept in the LESstudy. The present numerical study used the same set-up of theactuation slots as in the previous LES study.
3. Numerical set-up
The new four-equation-based PANS method (Basara et al., 2011)is used in the present simulations. The PANS approach is a recentlyproposed method that changes seamlessly from the RANS model toDNS according to the given level of physical resolution. The twokey features of the PANS method are: (1) it provides the possibleclosure at any given level of physical resolution; and (2) it can yieldimproved accuracy with increasing resolution. These imply that onan arbitrary computation mesh, the PANS can predict a better re-sult than the underlying RANS model, and the result can be im-proved with refining the mesh. For complex flow problems
encountered in engineering applications, it is not feasible to per-form simulations at a mesh fine enough to fulfill the requirementfor the LES study (i.e. resolution of the near-wall coherent struc-tures is important for the maintenance of turbulence). If the LESruns on a mesh that is not fine enough, the accuracy would be re-duced dramatically and the predictions may be wrong. Therefore,the PANS method has an obvious advantage for very complex flowproblems compared with LES, as the baseline of the PANS methodis the RANS simulation.
The PANS method is a bridging technique between RANS andDNS. The switch in PANS is continuous and based on the ratios ofunresolved to total kinetic energy and dissipation rate. The PANSequations read:
@Ui
@tþ Uj
@Ui
@xjþ @sðVi;VjÞ
@xj¼ � 1
q@p@xiþ m
@2Ui
@xj@xjð1Þ
Here a turbulent velocity Vi field is decomposed into two parts by anarbitrary filter as Vi = Ui + ui and s(Vi,Vj) = �2mu Sij + 2/3kudij whereku is the unresolved trubulent kinetic energy and mu is the eddy vis-cosity of unresolved scales.
The resolved stress tensor is given by
Sij ¼12
@Ui
@xjþ @Uj
@xi
� �ð2Þ
In the present study here, an improved near-wall modeling in PANSrecently proposed by Basara et al. (2011) is used in the form of thePANS f–f (also called PANS k–e–f–f) model. The PANS f–f model usesthe four equation k–e–f–f RANS turbulence model proposed byHanjalic et al. (2004). The k–e–f–f model is derived from the�v2 � f model with a difference that a transport equation for wallnormal velocity scale f (defined as f ¼ �v2=k, where k is turbulent ki-netic energy) is used rather than the velocity scale �v2. In this RANSturbulence model, the k–e model is extended with an additionaltransport equation for the velocity scale ratio f and an equationfor the elliptic relaxation function f for the purpose of improvednear-wall behavior.
The complete set of the governing equations of the new variantof PANS f–f model (Basara et al., 2011) is given in Eq. (3).
Dku
Dt¼ Pu � eu þ
@
@xjmþ mu
rku
� �@ku
@xj
� �Deu
Dt¼ Ce1Pu
eu
ku� C�e2
e2u
kuþ @
@xjmþ mu
reu
� �@eu
@xj
� �Dfu
Dt¼ fu � Pu
fu
kuþ fu
kueuð1� fkÞ þ
@
@xjmþ mu
rfu
� �@fu
@xj
� �
L2ur2fu � fu ¼
1Tu
C1 þ C2Pu
eu
� �fu �
23
� �
mu ¼ Clfuk2
u
eu
ð3Þ
where Pu is the production of unresolved turbulent kinetic energy
Pu ¼ �sðVi;VkÞ@Ui
@xkð4Þ
and the model constants Cl, C1, C2 and Ce2 are equal to 0.22, 0.4,0.65 and 1.9, respectively. Lu is the length scale and Tu is the timescale defined by using unresolved kinetic energy:
Tu ¼ maxku
e;Cs
me
� �1=2� �
; Lu ¼ CLmaxk3=2
u
e;Cg
m3
e
� �1=4" #
ð5Þ
where constants CL and Cs are equal to 0.36 and 6.0, respectively.The model parameters in Eq. (3) are determined by
C�e2 ¼ Ce1 þfk
feðCe2 � Ce1Þ; rku;eu ¼ rk;e
f 2k
feð6Þ
Table 1Model constants for the present PANS f–f turbulence model.
Cl C1 C2 Ce1 Ce2 CL Cs Cg rku reu rfu
0.22 0.4 0.65 1:4ð1þ 0:045=ffiffiffifp
uÞ 1.9 0.36 6.0 85 1.0 1.3 1.2
142 X. Han et al. / International Journal of Heat and Fluid Flow 42 (2013) 139–150
where the two key model parameters fk and fe, which represents theunresolved to total ratios of kinetic energy and dissipation rate, aredefined as
fk ¼ku
k; f e ¼
eu
eð7Þ
Girimaji (2006) showed that the implied cutoff can be placed in anypart of the spectrum including the dissipation range by varyingthese parameters of fk and fe. The PANS asymptotic behavior goessmoothly from RANS to DNS with decreasing fk. The PANS energet-ics, characterized by the unresolved production-to-dissipation ratio,behaves as required at intermediate cutoff length scales, and theproduction-to-dissipation ratio varies gradually from the RANS va-lue to the DNS value as fk is reduced from one to zero.
The unresolved-to-total-kinetic-energy ratio fk in the originalPANS model was prescribed as a constant. Following the proposalof Girimaji and Abdul-Hamid (2005) and Basara et al. (2008) latermodified the fk to become a variable parameter that depends uponthe grid spacing as follows
fk ¼1ffiffiffiffifficlp
DK
� �2=3
; K ¼ k3=2
eð8Þ
where D is the grid cell dimension defined as D = (DxDyDz)1/3, andK is the integral length scale of turbulence. When the grid size ismuch smaller than the local integral length scale, more and moreof the turbulent kinetic energy can be resolved. The fk parameteris thus introduced as a dynamic one in the computational proce-dure. The parameter k in Eq. (8) is computed as k = kres + ku and kres
is the resolved turbulent kinetic energy computed from the velocityflow field.
We assume that the numerical meshes support the cutoff in theenergy containing scales and inertial range, and choose fe = 1 (i.e.eu = e) (Basara et al., 2011; Girimaji, 2006). The parameter Ce1 iscomputed as Ce1 ¼ 1:4ð1þ 0:045=
ffiffiffifp
uÞ. This represents the four-equation PANS f–f model with enhanced near-wall attributes. Allthe model constants involved in the present PANS f–f model aresummarized in Table 1.
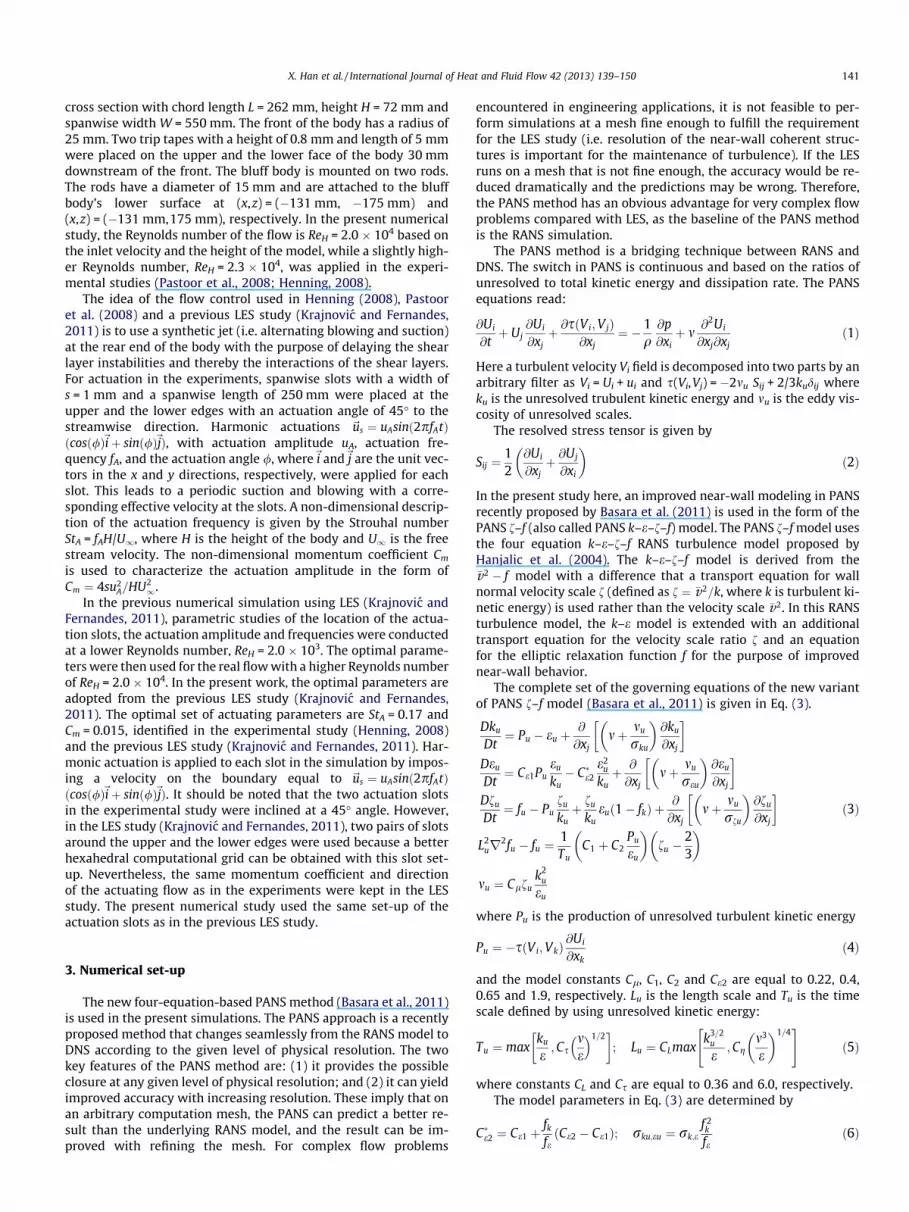
Fig. 2. The computational mesh: (a) side view; (b)
In the present simulations, the vehicle model was centered inthe computational domain with a height of 7.7H, identical to thatof the wind tunnel. The width in the spanwise direction is alsoidentical to that of the wind tunnel and no-slip wall conditionsare used in the simulations. The distance from the model to the in-let and the outlet was 10.25H and 20.83H respectively. A struc-tured hexahedral computational grid was used, as shown inFig. 2. In the experiments, trip tapes were placed on both the upperand the lower sides of the body just after the curved part in orderto trigger the transition. Although they are rather small (a height of0.8 mm and length of 5 mm), they were still included in the mesh-ing (Fig. 2) in order to remove the possible sources of discrepanciesbetween the experiments and the simulations. The details on themeshing near the actuation slots are also given in Fig. 2.
In a previous LES study of the flow control problem by Krajnovicand Fernandes (2011), the mesh used has a total of about 5.5 � 106
nodes. The present PANS study uses three sets of meshes, a coarsemesh, a medium mesh and a fine mesh. As mentioned above, therequirement of the computational mesh is not as rigid in PANSstudy as in a LES study. Thus there are two motivations for usingthree meshes, the first to evaluate the performance of the PANSmethod for the complex flow control problem with different meshresolutions and the other to evaluate whether we can use a coarsemesh in the PANS study compared with the previous LES study. Forthe medium mesh (referred as ‘‘M2’’), the set-up and computa-tional grid are exactly the same as in the LES study (Krajnovicand Fernandes, 2011). A resolution expressed in wall units wasapproximately y+ = 1, Mx+ = 14 and Mz+ = 30 on the bluff body inthe mean. Here y+ = MyUs/m, Mx+ = Mx Us/m and Mz+ = Mz Us/m, andUs is the local friction velocity. In the near region around the bluffbody, the typical stretching ratio of the grid is about 1.3 in thewall-normal direction and about 1.1 in the streamwise direction.The grids are uniformly distributed in the spanwise direction ex-cept in the very-near regions close to the lateral walls. On the basisof the medium mesh, the grids were reduced in the three direc-tions and resulted in the coarse mesh (referred as ‘‘M1’’), whichhas a total of about 3.0 � 106 nodes. Also the grids were increasedin the three directions on the basis of the medium mesh and re-sulted in the fine mesh (referred as ‘‘M3’’), which has a total ofabout 7.5 � 106 nodes. The same computational grids were usedfor both the natural and the controlled flow simulations.
The number of computational cells in the actuation region is animportant parameter for accurate prediction of the actuated flow.Previous numerical studies of actuated flows used very different
zoom of the trip tape and the actuation slot.
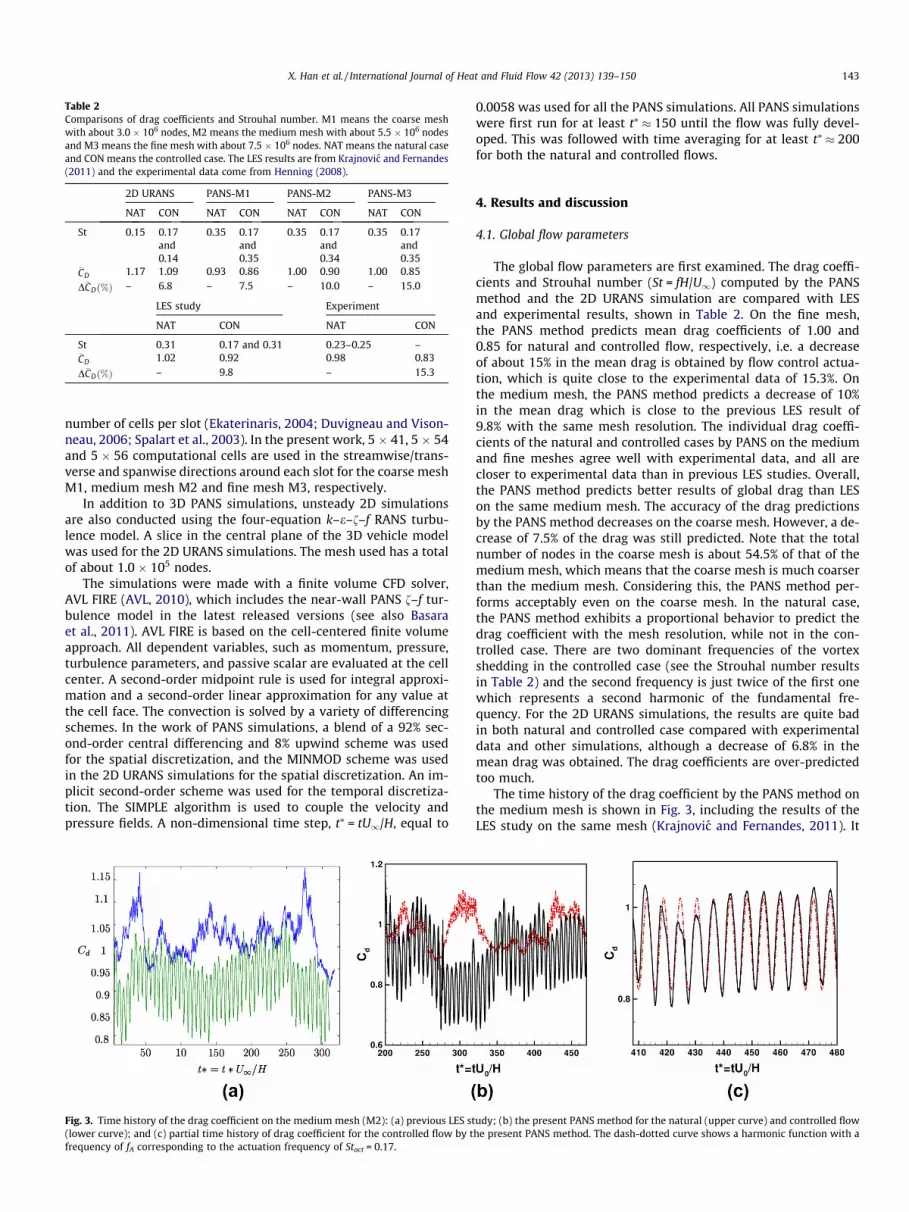
Table 2Comparisons of drag coefficients and Strouhal number. M1 means the coarse meshwith about 3.0 � 106 nodes, M2 means the medium mesh with about 5.5 � 106 nodesand M3 means the fine mesh with about 7.5 � 106 nodes. NAT means the natural caseand CON means the controlled case. The LES results are from Krajnovic and Fernandes(2011) and the experimental data come from Henning (2008).
2D URANS PANS-M1 PANS-M2 PANS-M3
NAT CON NAT CON NAT CON NAT CON
St 0.15 0.17and0.14
0.35 0.17and0.35
0.35 0.17and0.34
0.35 0.17and0.35
�CD 1.17 1.09 0.93 0.86 1.00 0.90 1.00 0.85
D�CDð%Þ – 6.8 – 7.5 – 10.0 – 15.0
LES study Experiment
NAT CON NAT CON
St 0.31 0.17 and 0.31 0.23–0.25 –�CD 1.02 0.92 0.98 0.83
D�CDð%Þ – 9.8 – 15.3
X. Han et al. / International Journal of Heat and Fluid Flow 42 (2013) 139–150 143
number of cells per slot (Ekaterinaris, 2004; Duvigneau and Vison-neau, 2006; Spalart et al., 2003). In the present work, 5 � 41, 5 � 54and 5 � 56 computational cells are used in the streamwise/trans-verse and spanwise directions around each slot for the coarse meshM1, medium mesh M2 and fine mesh M3, respectively.
In addition to 3D PANS simulations, unsteady 2D simulationsare also conducted using the four-equation k–e–f–f RANS turbu-lence model. A slice in the central plane of the 3D vehicle modelwas used for the 2D URANS simulations. The mesh used has a totalof about 1.0 � 105 nodes.
The simulations were made with a finite volume CFD solver,AVL FIRE (AVL, 2010), which includes the near-wall PANS f–f tur-bulence model in the latest released versions (see also Basaraet al., 2011). AVL FIRE is based on the cell-centered finite volumeapproach. All dependent variables, such as momentum, pressure,turbulence parameters, and passive scalar are evaluated at the cellcenter. A second-order midpoint rule is used for integral approxi-mation and a second-order linear approximation for any value atthe cell face. The convection is solved by a variety of differencingschemes. In the work of PANS simulations, a blend of a 92% sec-ond-order central differencing and 8% upwind scheme was usedfor the spatial discretization, and the MINMOD scheme was usedin the 2D URANS simulations for the spatial discretization. An im-plicit second-order scheme was used for the temporal discretiza-tion. The SIMPLE algorithm is used to couple the velocity andpressure fields. A non-dimensional time step, t⁄ = tU1/H, equal to
Fig. 3. Time history of the drag coefficient on the medium mesh (M2): (a) previous LES st(lower curve); and (c) partial time history of drag coefficient for the controlled flow by tfrequency of fA corresponding to the actuation frequency of Stact = 0.17.
0.0058 was used for all the PANS simulations. All PANS simulationswere first run for at least t⁄ � 150 until the flow was fully devel-oped. This was followed with time averaging for at least t⁄ � 200for both the natural and controlled flows.
4. Results and discussion
4.1. Global flow parameters
The global flow parameters are first examined. The drag coeffi-cients and Strouhal number (St = fH/U1) computed by the PANSmethod and the 2D URANS simulation are compared with LESand experimental results, shown in Table 2. On the fine mesh,the PANS method predicts mean drag coefficients of 1.00 and0.85 for natural and controlled flow, respectively, i.e. a decreaseof about 15% in the mean drag is obtained by flow control actua-tion, which is quite close to the experimental data of 15.3%. Onthe medium mesh, the PANS method predicts a decrease of 10%in the mean drag which is close to the previous LES result of9.8% with the same mesh resolution. The individual drag coeffi-cients of the natural and controlled cases by PANS on the mediumand fine meshes agree well with experimental data, and all arecloser to experimental data than in previous LES studies. Overall,the PANS method predicts better results of global drag than LESon the same medium mesh. The accuracy of the drag predictionsby the PANS method decreases on the coarse mesh. However, a de-crease of 7.5% of the drag was still predicted. Note that the totalnumber of nodes in the coarse mesh is about 54.5% of that of themedium mesh, which means that the coarse mesh is much coarserthan the medium mesh. Considering this, the PANS method per-forms acceptably even on the coarse mesh. In the natural case,the PANS method exhibits a proportional behavior to predict thedrag coefficient with the mesh resolution, while not in the con-trolled case. There are two dominant frequencies of the vortexshedding in the controlled case (see the Strouhal number resultsin Table 2) and the second frequency is just twice of the first onewhich represents a second harmonic of the fundamental fre-quency. For the 2D URANS simulations, the results are quite badin both natural and controlled case compared with experimentaldata and other simulations, although a decrease of 6.8% in themean drag was obtained. The drag coefficients are over-predictedtoo much.
The time history of the drag coefficient by the PANS method onthe medium mesh is shown in Fig. 3, including the results of theLES study on the same mesh (Krajnovic and Fernandes, 2011). It
udy; (b) the present PANS method for the natural (upper curve) and controlled flowhe present PANS method. The dash-dotted curve shows a harmonic function with a
U/Uinlet
y/H
-0.5 0 0.5 1 1.5-1
-0.5
0
0.5
1
Exp.LESPANS -M1PANS -M2PANS -M32D URANS
x/H=0.5
V/Uinlet
U/Uinlet V/Uinlet
U/Uinlet V/Uinlet
y/H
-0.5 0 0.5-1
-0.5
0
0.5
1Exp.LESPANS -M1PANS -M2PANS -M32D URANS
x/H=0.5
y/H
-0.5 0 0.5 1 1.5-1
-0.5
0
0.5
1
Exp.LESPANS -M1PANS -M2PANS -M32D URANS
x/H=0.98
y/H
-0.5 0 0.5-1
-0.5
0
0.5
1Exp.LESPANS -M1PANS -M2PANS -M32D URANS
x/H=0.98
y/H
-0.5 0 0.5 1 1.5-1
-0.5
0
0.5
1
Exp.LESPANS -M1PANS -M2PANS -M32D URANS
x/H=1.4
y/H
-0.5 0 0.5-1
-0.5
0
0.5
1Exp.LESPANS -M1PANS -M2PANS -M32D URANS
x/H=1.4
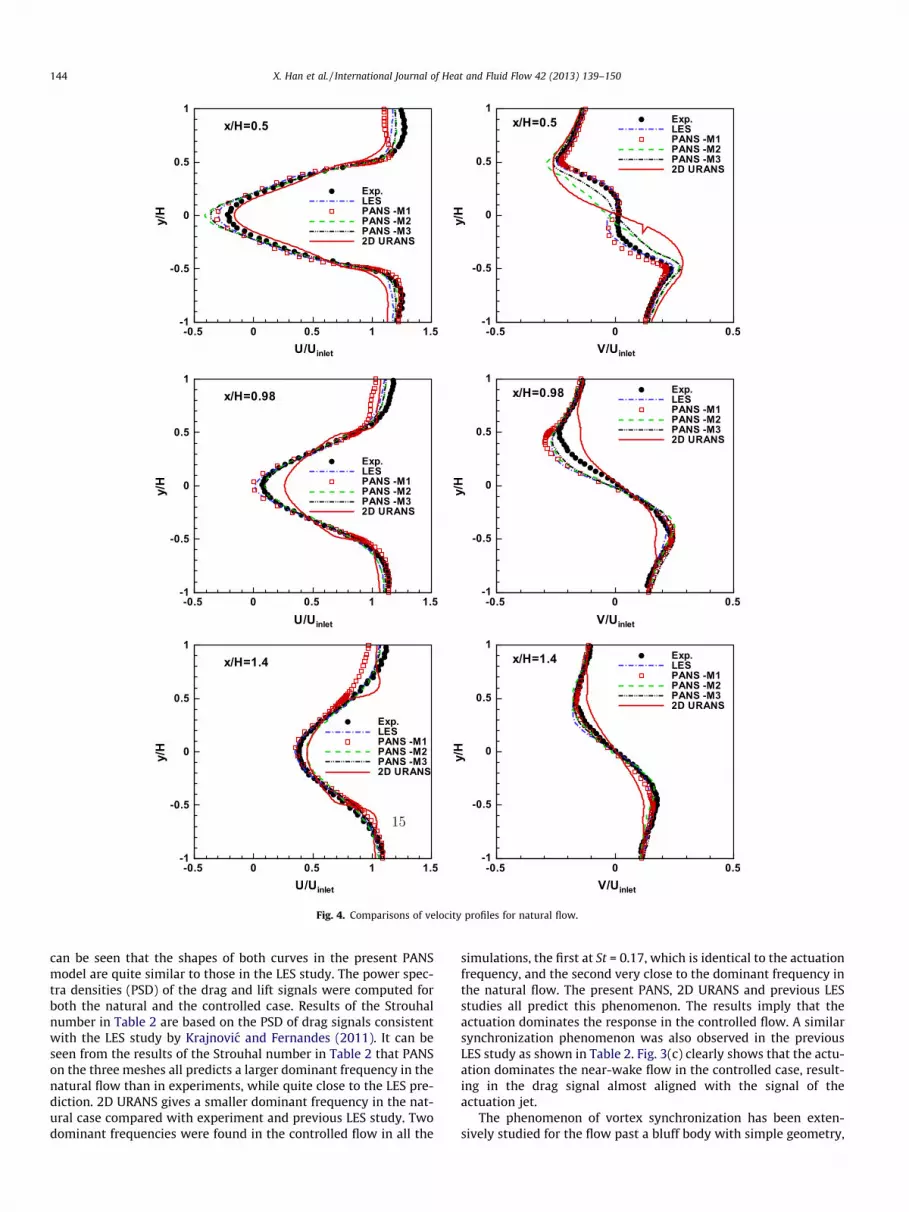
Fig. 4. Comparisons of velocity profiles for natural flow.
144 X. Han et al. / International Journal of Heat and Fluid Flow 42 (2013) 139–150
can be seen that the shapes of both curves in the present PANSmodel are quite similar to those in the LES study. The power spec-tra densities (PSD) of the drag and lift signals were computed forboth the natural and the controlled case. Results of the Strouhalnumber in Table 2 are based on the PSD of drag signals consistentwith the LES study by Krajnovic and Fernandes (2011). It can beseen from the results of the Strouhal number in Table 2 that PANSon the three meshes all predicts a larger dominant frequency in thenatural flow than in experiments, while quite close to the LES pre-diction. 2D URANS gives a smaller dominant frequency in the nat-ural case compared with experiment and previous LES study. Twodominant frequencies were found in the controlled flow in all the
simulations, the first at St = 0.17, which is identical to the actuationfrequency, and the second very close to the dominant frequency inthe natural flow. The present PANS, 2D URANS and previous LESstudies all predict this phenomenon. The results imply that theactuation dominates the response in the controlled flow. A similarsynchronization phenomenon was also observed in the previousLES study as shown in Table 2. Fig. 3(c) clearly shows that the actu-ation dominates the near-wake flow in the controlled case, result-ing in the drag signal almost aligned with the signal of theactuation jet.
The phenomenon of vortex synchronization has been exten-sively studied for the flow past a bluff body with simple geometry,
U/Uinlet
y/H
-0.5 0 0.5 1 1.5-1
-0.5
0
0.5
1
Exp.LESPANS -M1PANS -M2PANS -M32D URANS
x/H=0.31
V/Uinlet
U/Uinlet V/Uinlet
U/Uinlet V/Uinlet
y/H
-0.5 0 0.5-1
-0.5
0
0.5
1 Exp.LESPANS -M1PANS -M2PANS -M32D URANS
x/H=0.31
y/H
-0.5 0 0.5 1 1.5-1
-0.5
0
0.5
1
Exp.LESPANS -M1PANS -M2PANS -M32D URANS
x/H=0.47
y/H
-0.5 0 0.5-1
-0.5
0
0.5
1 Exp.LESPANS -M1PANS -M2PANS -M32D URANS
x/H=0.47
y/H
-0.5 0 0.5 1 1.5-1
-0.5
0
0.5
1
Exp.LESPANS -M1PANS -M2PANS -M32D URANS
x/H=0.89
y/H
-0.5 0 0.5-1
-0.5
0
0.5
1 Exp.LESPANS -M1PANS -M2PANS -M32D URANS
x/H=0.89
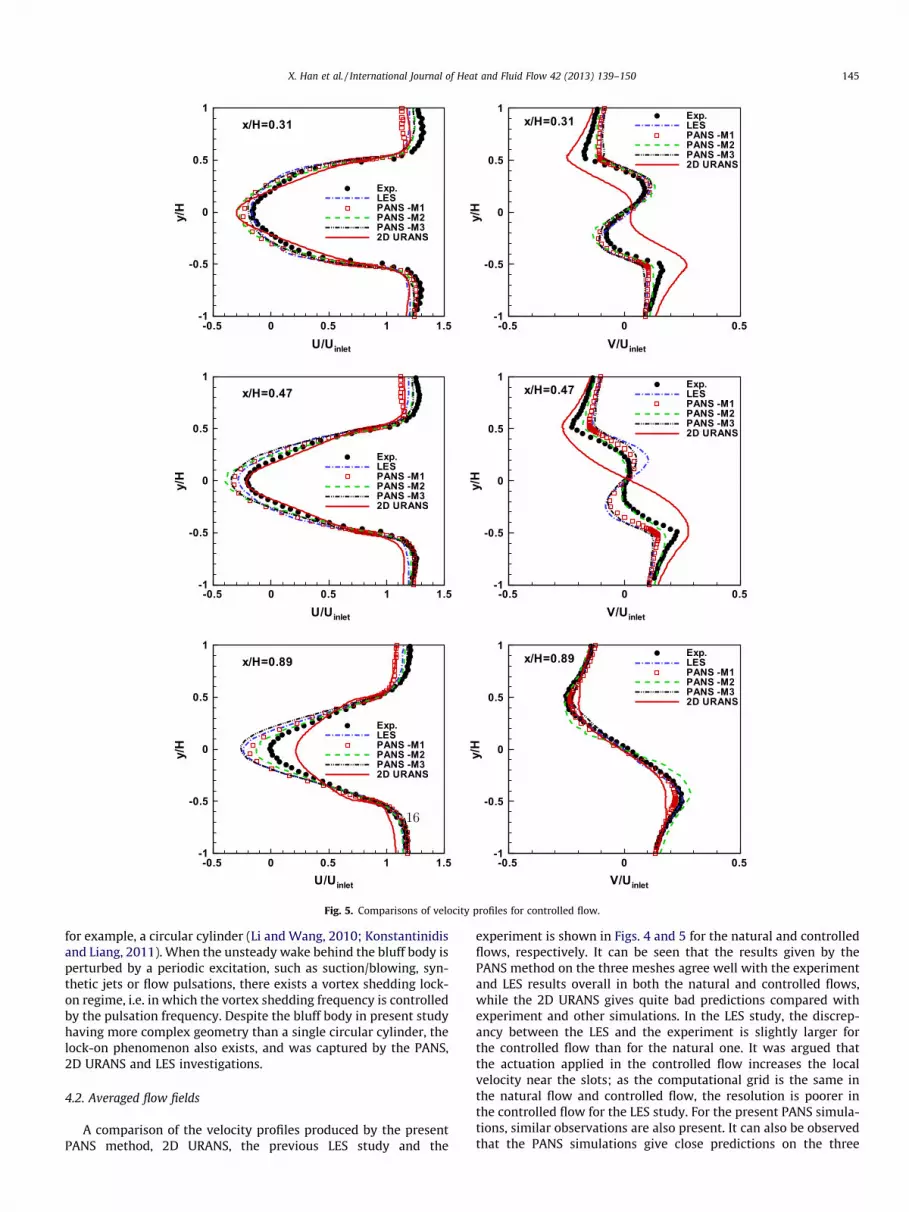
Fig. 5. Comparisons of velocity profiles for controlled flow.
X. Han et al. / International Journal of Heat and Fluid Flow 42 (2013) 139–150 145
for example, a circular cylinder (Li and Wang, 2010; Konstantinidisand Liang, 2011). When the unsteady wake behind the bluff body isperturbed by a periodic excitation, such as suction/blowing, syn-thetic jets or flow pulsations, there exists a vortex shedding lock-on regime, i.e. in which the vortex shedding frequency is controlledby the pulsation frequency. Despite the bluff body in present studyhaving more complex geometry than a single circular cylinder, thelock-on phenomenon also exists, and was captured by the PANS,2D URANS and LES investigations.
4.2. Averaged flow fields
A comparison of the velocity profiles produced by the presentPANS method, 2D URANS, the previous LES study and the
experiment is shown in Figs. 4 and 5 for the natural and controlledflows, respectively. It can be seen that the results given by thePANS method on the three meshes agree well with the experimentand LES results overall in both the natural and controlled flows,while the 2D URANS gives quite bad predictions compared withexperiment and other simulations. In the LES study, the discrep-ancy between the LES and the experiment is slightly larger forthe controlled flow than for the natural one. It was argued thatthe actuation applied in the controlled flow increases the localvelocity near the slots; as the computational grid is the same inthe natural flow and controlled flow, the resolution is poorer inthe controlled flow for the LES study. For the present PANS simula-tions, similar observations are also present. It can also be observedthat the PANS simulations give close predictions on the three
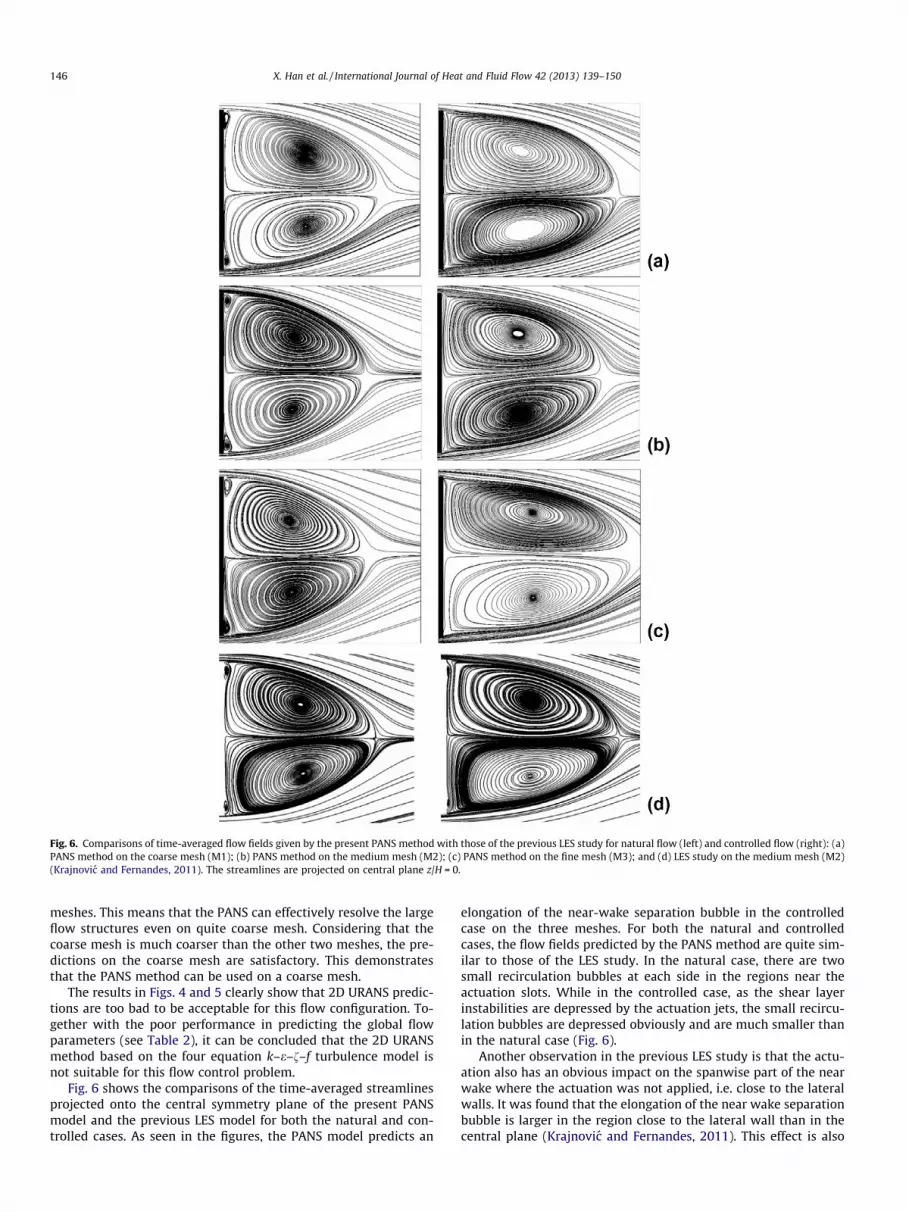
Fig. 6. Comparisons of time-averaged flow fields given by the present PANS method with those of the previous LES study for natural flow (left) and controlled flow (right): (a)PANS method on the coarse mesh (M1); (b) PANS method on the medium mesh (M2); (c) PANS method on the fine mesh (M3); and (d) LES study on the medium mesh (M2)(Krajnovic and Fernandes, 2011). The streamlines are projected on central plane z/H = 0.
146 X. Han et al. / International Journal of Heat and Fluid Flow 42 (2013) 139–150
meshes. This means that the PANS can effectively resolve the largeflow structures even on quite coarse mesh. Considering that thecoarse mesh is much coarser than the other two meshes, the pre-dictions on the coarse mesh are satisfactory. This demonstratesthat the PANS method can be used on a coarse mesh.
The results in Figs. 4 and 5 clearly show that 2D URANS predic-tions are too bad to be acceptable for this flow configuration. To-gether with the poor performance in predicting the global flowparameters (see Table 2), it can be concluded that the 2D URANSmethod based on the four equation k–e–f–f turbulence model isnot suitable for this flow control problem.
Fig. 6 shows the comparisons of the time-averaged streamlinesprojected onto the central symmetry plane of the present PANSmodel and the previous LES model for both the natural and con-trolled cases. As seen in the figures, the PANS model predicts an
elongation of the near-wake separation bubble in the controlledcase on the three meshes. For both the natural and controlledcases, the flow fields predicted by the PANS method are quite sim-ilar to those of the LES study. In the natural case, there are twosmall recirculation bubbles at each side in the regions near theactuation slots. While in the controlled case, as the shear layerinstabilities are depressed by the actuation jets, the small recircu-lation bubbles are depressed obviously and are much smaller thanin the natural case (Fig. 6).
Another observation in the previous LES study is that the actu-ation also has an obvious impact on the spanwise part of the nearwake where the actuation was not applied, i.e. close to the lateralwalls. It was found that the elongation of the near wake separationbubble is larger in the region close to the lateral wall than in thecentral plane (Krajnovic and Fernandes, 2011). This effect is also
x/H
U/U
inle
t
0 0.5 1 1.5 2 2.5 3
-0.4
0
0.4
0.8 NAT case - M1 - z/H=0NAT case - M1 - z/H=3.47CON case - M1 - z/H=0CON case - M1 - z/H=3.47
(a)x/H
U/U
inle
t
0 0.5 1 1.5 2 2.5 3
-0.4
0
0.4
0.8 NAT case - M2 - z/H=0NAT case - M2 - z/H=3.47CON case - M2 - z/H=0CON case - M2 - z/H=3.47
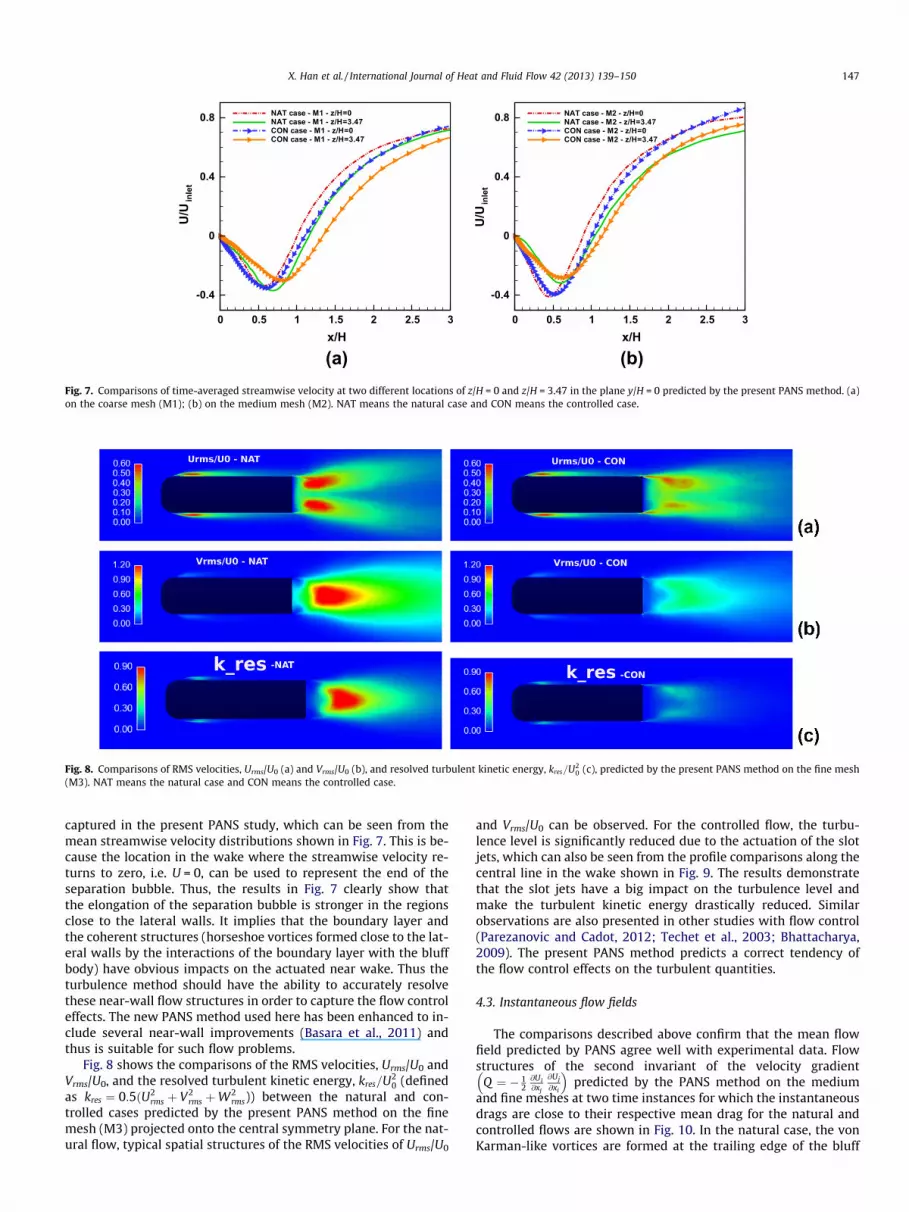
(b)Fig. 7. Comparisons of time-averaged streamwise velocity at two different locations of z/H = 0 and z/H = 3.47 in the plane y/H = 0 predicted by the present PANS method. (a)on the coarse mesh (M1); (b) on the medium mesh (M2). NAT means the natural case and CON means the controlled case.
Fig. 8. Comparisons of RMS velocities, Urms/U0 (a) and Vrms/U0 (b), and resolved turbulent kinetic energy, kres=U20 (c), predicted by the present PANS method on the fine mesh
(M3). NAT means the natural case and CON means the controlled case.
X. Han et al. / International Journal of Heat and Fluid Flow 42 (2013) 139–150 147
captured in the present PANS study, which can be seen from themean streamwise velocity distributions shown in Fig. 7. This is be-cause the location in the wake where the streamwise velocity re-turns to zero, i.e. U = 0, can be used to represent the end of theseparation bubble. Thus, the results in Fig. 7 clearly show thatthe elongation of the separation bubble is stronger in the regionsclose to the lateral walls. It implies that the boundary layer andthe coherent structures (horseshoe vortices formed close to the lat-eral walls by the interactions of the boundary layer with the bluffbody) have obvious impacts on the actuated near wake. Thus theturbulence method should have the ability to accurately resolvethese near-wall flow structures in order to capture the flow controleffects. The new PANS method used here has been enhanced to in-clude several near-wall improvements (Basara et al., 2011) andthus is suitable for such flow problems.
Fig. 8 shows the comparisons of the RMS velocities, Urms/U0 andVrms/U0, and the resolved turbulent kinetic energy, kres=U2
0 (definedas kres ¼ 0:5ðU2
rms þ V2rms þW2
rms)) between the natural and con-trolled cases predicted by the present PANS method on the finemesh (M3) projected onto the central symmetry plane. For the nat-ural flow, typical spatial structures of the RMS velocities of Urms/U0
and Vrms/U0 can be observed. For the controlled flow, the turbu-lence level is significantly reduced due to the actuation of the slotjets, which can also be seen from the profile comparisons along thecentral line in the wake shown in Fig. 9. The results demonstratethat the slot jets have a big impact on the turbulence level andmake the turbulent kinetic energy drastically reduced. Similarobservations are also presented in other studies with flow control(Parezanovic and Cadot, 2012; Techet et al., 2003; Bhattacharya,2009). The present PANS method predicts a correct tendency ofthe flow control effects on the turbulent quantities.
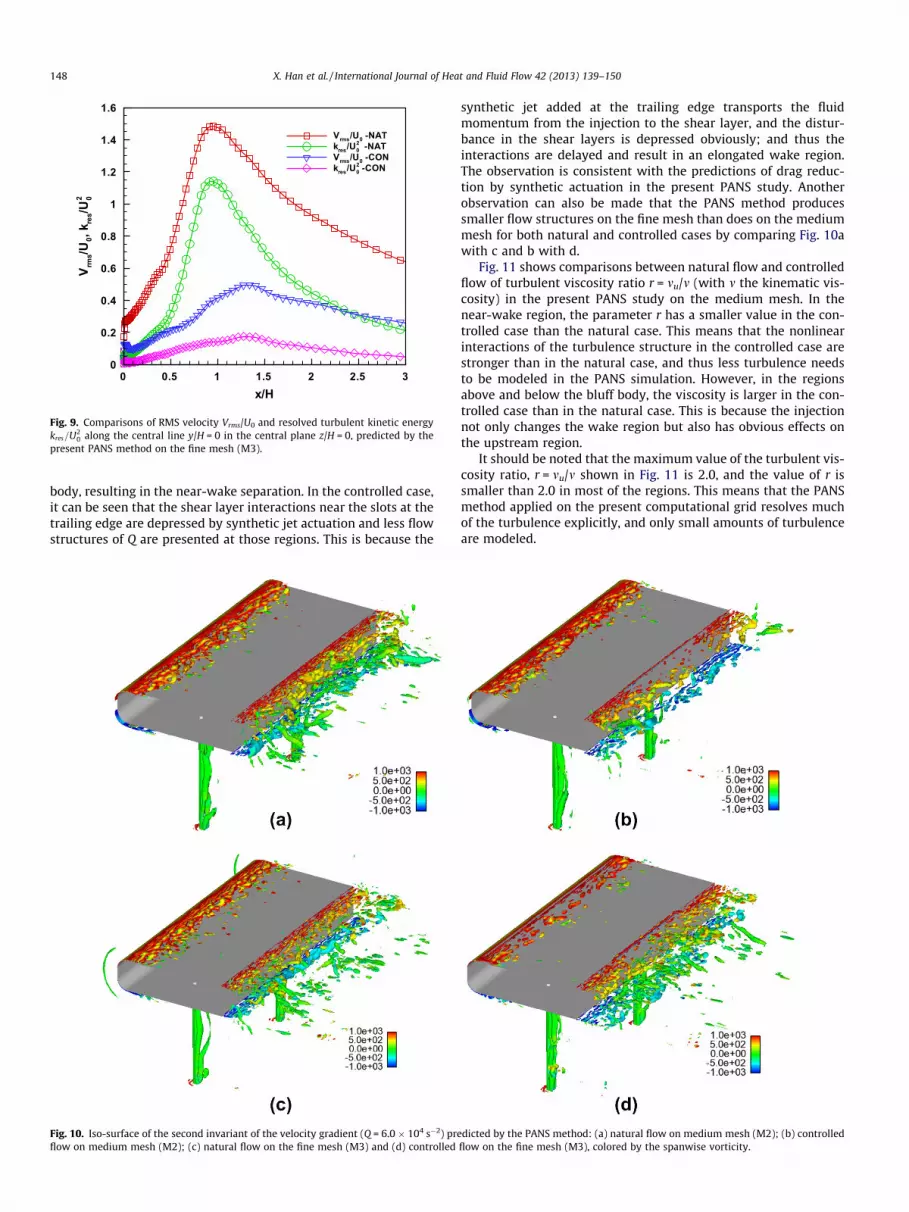
4.3. Instantaneous flow fields
The comparisons described above confirm that the mean flowfield predicted by PANS agree well with experimental data. Flowstructures of the second invariant of the velocity gradient
Q ¼ � 12@Ui@xj
@Uj
@xi
� �predicted by the PANS method on the medium
and fine meshes at two time instances for which the instantaneousdrags are close to their respective mean drag for the natural andcontrolled flows are shown in Fig. 10. In the natural case, the vonKarman-like vortices are formed at the trailing edge of the bluff
x/H
V rms/U
0,k re
s/U02
0 0.5 1 1.5 2 2.5 30
0.2
0.4
0.6
0.8
1
1.2
1.4
1.6
Vrms/U0 -NATkres/U0
2 -NATVrms/U0 -CONkres/U0
2 -CON
Fig. 9. Comparisons of RMS velocity Vrms/U0 and resolved turbulent kinetic energykres=U2
0 along the central line y/H = 0 in the central plane z/H = 0, predicted by thepresent PANS method on the fine mesh (M3).
148 X. Han et al. / International Journal of Heat and Fluid Flow 42 (2013) 139–150
body, resulting in the near-wake separation. In the controlled case,it can be seen that the shear layer interactions near the slots at thetrailing edge are depressed by synthetic jet actuation and less flowstructures of Q are presented at those regions. This is because the
Fig. 10. Iso-surface of the second invariant of the velocity gradient (Q = 6.0 � 104 s�2) preflow on medium mesh (M2); (c) natural flow on the fine mesh (M3) and (d) controlled
synthetic jet added at the trailing edge transports the fluidmomentum from the injection to the shear layer, and the distur-bance in the shear layers is depressed obviously; and thus theinteractions are delayed and result in an elongated wake region.The observation is consistent with the predictions of drag reduc-tion by synthetic actuation in the present PANS study. Anotherobservation can also be made that the PANS method producessmaller flow structures on the fine mesh than does on the mediummesh for both natural and controlled cases by comparing Fig. 10awith c and b with d.
Fig. 11 shows comparisons between natural flow and controlledflow of turbulent viscosity ratio r = mu/m (with m the kinematic vis-cosity) in the present PANS study on the medium mesh. In thenear-wake region, the parameter r has a smaller value in the con-trolled case than the natural case. This means that the nonlinearinteractions of the turbulence structure in the controlled case arestronger than in the natural case, and thus less turbulence needsto be modeled in the PANS simulation. However, in the regionsabove and below the bluff body, the viscosity is larger in the con-trolled case than in the natural case. This is because the injectionnot only changes the wake region but also has obvious effects onthe upstream region.
It should be noted that the maximum value of the turbulent vis-cosity ratio, r = mu/m shown in Fig. 11 is 2.0, and the value of r issmaller than 2.0 in most of the regions. This means that the PANSmethod applied on the present computational grid resolves muchof the turbulence explicitly, and only small amounts of turbulenceare modeled.
dicted by the PANS method: (a) natural flow on medium mesh (M2); (b) controlledflow on the fine mesh (M3), colored by the spanwise vorticity.
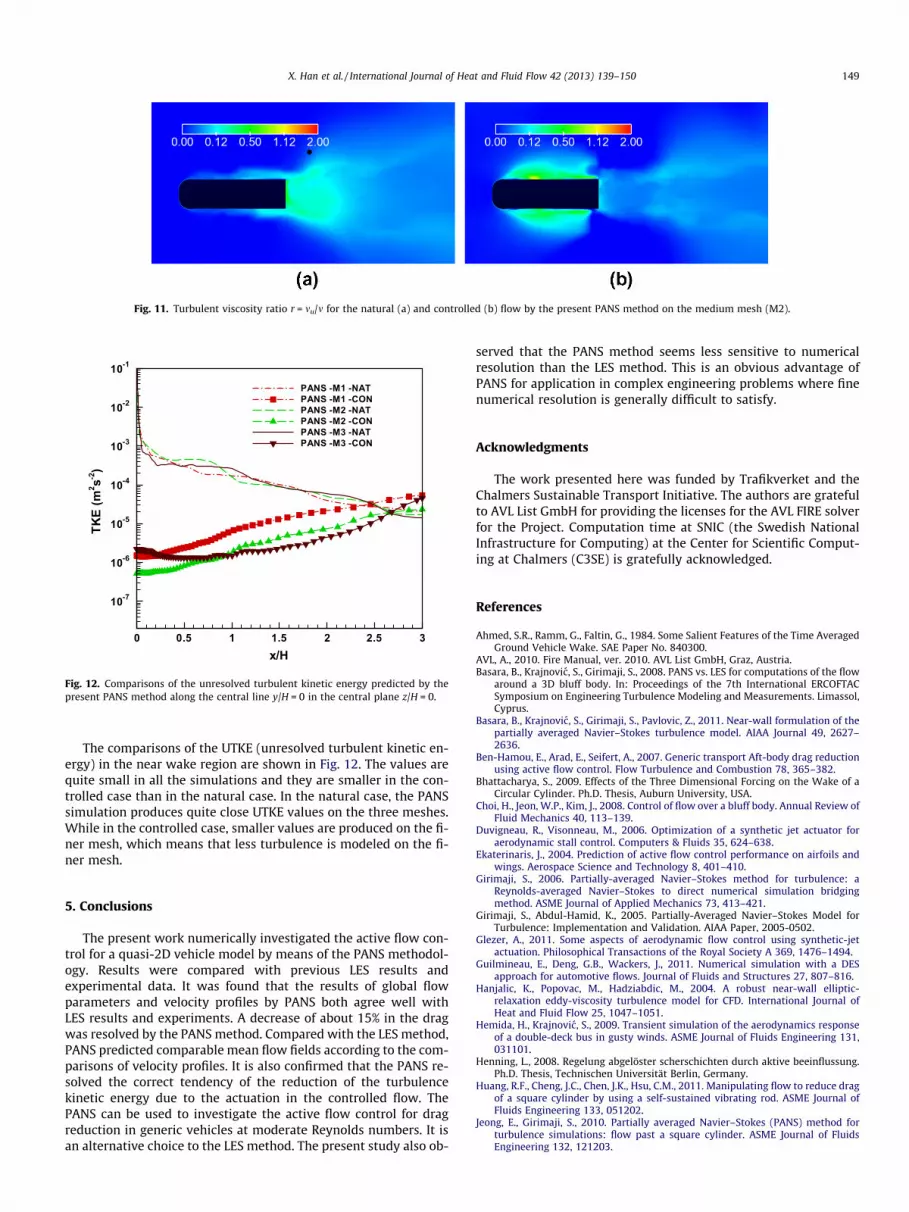
Fig. 11. Turbulent viscosity ratio r = mu/m for the natural (a) and controlled (b) flow by the present PANS method on the medium mesh (M2).
x/H
TKE
(m2 s-2
)
0 0.5 1 1.5 2 2.5 3
10-7
10-6
10-5
10-4
10-3
10-2
10-1
PANS -M1 -NATPANS -M1 -CONPANS -M2 -NATPANS -M2 -CONPANS -M3 -NATPANS -M3 -CON
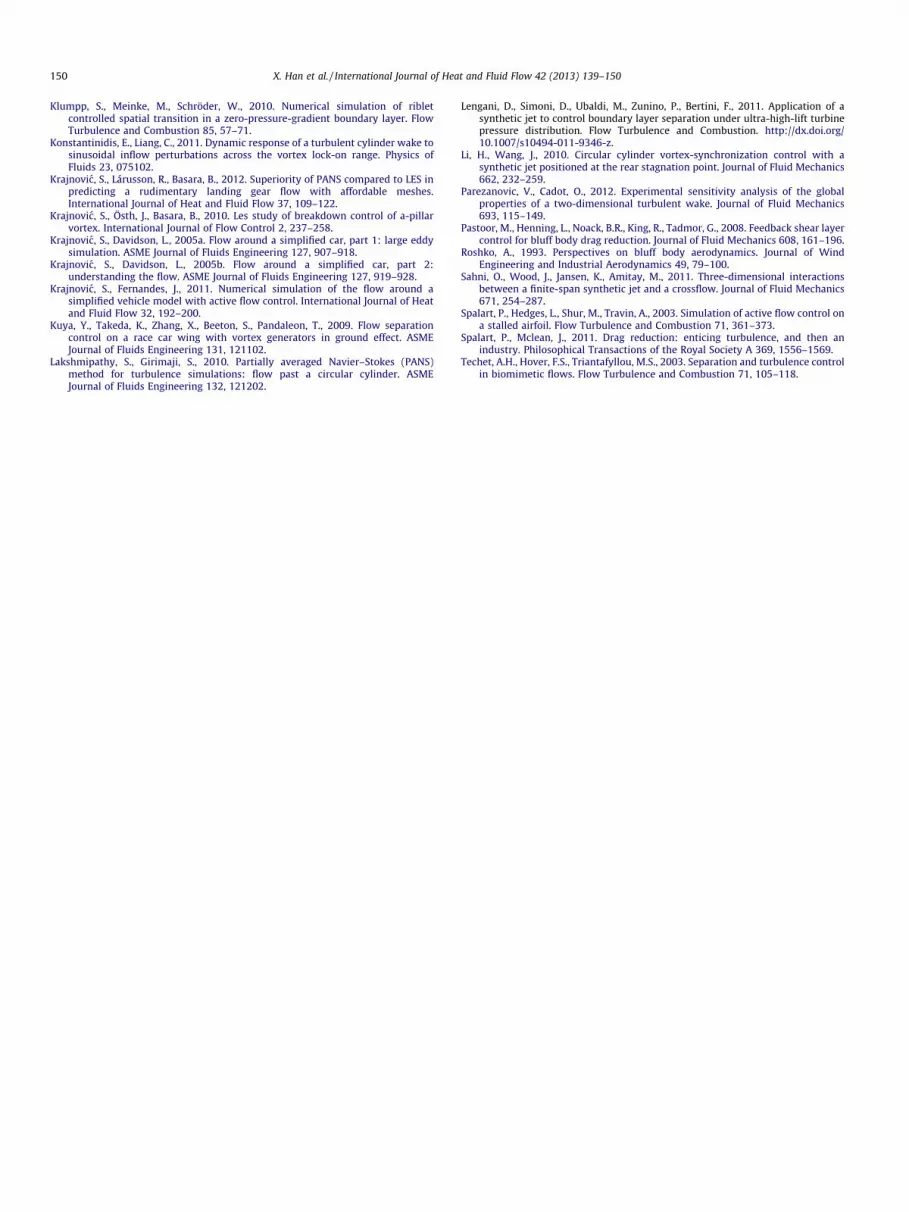
Fig. 12. Comparisons of the unresolved turbulent kinetic energy predicted by thepresent PANS method along the central line y/H = 0 in the central plane z/H = 0.
X. Han et al. / International Journal of Heat and Fluid Flow 42 (2013) 139–150 149
The comparisons of the UTKE (unresolved turbulent kinetic en-ergy) in the near wake region are shown in Fig. 12. The values arequite small in all the simulations and they are smaller in the con-trolled case than in the natural case. In the natural case, the PANSsimulation produces quite close UTKE values on the three meshes.While in the controlled case, smaller values are produced on the fi-ner mesh, which means that less turbulence is modeled on the fi-ner mesh.
5. Conclusions
The present work numerically investigated the active flow con-trol for a quasi-2D vehicle model by means of the PANS methodol-ogy. Results were compared with previous LES results andexperimental data. It was found that the results of global flowparameters and velocity profiles by PANS both agree well withLES results and experiments. A decrease of about 15% in the dragwas resolved by the PANS method. Compared with the LES method,PANS predicted comparable mean flow fields according to the com-parisons of velocity profiles. It is also confirmed that the PANS re-solved the correct tendency of the reduction of the turbulencekinetic energy due to the actuation in the controlled flow. ThePANS can be used to investigate the active flow control for dragreduction in generic vehicles at moderate Reynolds numbers. It isan alternative choice to the LES method. The present study also ob-
served that the PANS method seems less sensitive to numericalresolution than the LES method. This is an obvious advantage ofPANS for application in complex engineering problems where finenumerical resolution is generally difficult to satisfy.
Acknowledgments
The work presented here was funded by Trafikverket and theChalmers Sustainable Transport Initiative. The authors are gratefulto AVL List GmbH for providing the licenses for the AVL FIRE solverfor the Project. Computation time at SNIC (the Swedish NationalInfrastructure for Computing) at the Center for Scientific Comput-ing at Chalmers (C3SE) is gratefully acknowledged.
References
Ahmed, S.R., Ramm, G., Faltin, G., 1984. Some Salient Features of the Time AveragedGround Vehicle Wake. SAE Paper No. 840300.
AVL, A., 2010. Fire Manual, ver. 2010. AVL List GmbH, Graz, Austria.Basara, B., Krajnovic, S., Girimaji, S., 2008. PANS vs. LES for computations of the flow
around a 3D bluff body. In: Proceedings of the 7th International ERCOFTACSymposium on Engineering Turbulence Modeling and Measurements. Limassol,Cyprus.
Basara, B., Krajnovic, S., Girimaji, S., Pavlovic, Z., 2011. Near-wall formulation of thepartially averaged Navier–Stokes turbulence model. AIAA Journal 49, 2627–2636.
Ben-Hamou, E., Arad, E., Seifert, A., 2007. Generic transport Aft-body drag reductionusing active flow control. Flow Turbulence and Combustion 78, 365–382.
Bhattacharya, S., 2009. Effects of the Three Dimensional Forcing on the Wake of aCircular Cylinder. Ph.D. Thesis, Auburn University, USA.
Choi, H., Jeon, W.P., Kim, J., 2008. Control of flow over a bluff body. Annual Review ofFluid Mechanics 40, 113–139.
Duvigneau, R., Visonneau, M., 2006. Optimization of a synthetic jet actuator foraerodynamic stall control. Computers & Fluids 35, 624–638.
Ekaterinaris, J., 2004. Prediction of active flow control performance on airfoils andwings. Aerospace Science and Technology 8, 401–410.
Girimaji, S., 2006. Partially-averaged Navier–Stokes method for turbulence: aReynolds-averaged Navier–Stokes to direct numerical simulation bridgingmethod. ASME Journal of Applied Mechanics 73, 413–421.
Girimaji, S., Abdul-Hamid, K., 2005. Partially-Averaged Navier–Stokes Model forTurbulence: Implementation and Validation. AIAA Paper, 2005-0502.
Glezer, A., 2011. Some aspects of aerodynamic flow control using synthetic-jetactuation. Philosophical Transactions of the Royal Society A 369, 1476–1494.
Guilmineau, E., Deng, G.B., Wackers, J., 2011. Numerical simulation with a DESapproach for automotive flows. Journal of Fluids and Structures 27, 807–816.
Hanjalic, K., Popovac, M., Hadziabdic, M., 2004. A robust near-wall elliptic-relaxation eddy-viscosity turbulence model for CFD. International Journal ofHeat and Fluid Flow 25, 1047–1051.
Hemida, H., Krajnovic, S., 2009. Transient simulation of the aerodynamics responseof a double-deck bus in gusty winds. ASME Journal of Fluids Engineering 131,031101.
Henning, L., 2008. Regelung abgelöster scherschichten durch aktive beeinflussung.Ph.D. Thesis, Technischen Universität Berlin, Germany.
Huang, R.F., Cheng, J.C., Chen, J.K., Hsu, C.M., 2011. Manipulating flow to reduce dragof a square cylinder by using a self-sustained vibrating rod. ASME Journal ofFluids Engineering 133, 051202.
Jeong, E., Girimaji, S., 2010. Partially averaged Navier–Stokes (PANS) method forturbulence simulations: flow past a square cylinder. ASME Journal of FluidsEngineering 132, 121203.
150 X. Han et al. / International Journal of Heat and Fluid Flow 42 (2013) 139–150
Klumpp, S., Meinke, M., Schröder, W., 2010. Numerical simulation of ribletcontrolled spatial transition in a zero-pressure-gradient boundary layer. FlowTurbulence and Combustion 85, 57–71.
Konstantinidis, E., Liang, C., 2011. Dynamic response of a turbulent cylinder wake tosinusoidal inflow perturbations across the vortex lock-on range. Physics ofFluids 23, 075102.
Krajnovic, S., Lárusson, R., Basara, B., 2012. Superiority of PANS compared to LES inpredicting a rudimentary landing gear flow with affordable meshes.International Journal of Heat and Fluid Flow 37, 109–122.
Krajnovic, S., Östh, J., Basara, B., 2010. Les study of breakdown control of a-pillarvortex. International Journal of Flow Control 2, 237–258.
Krajnovic, S., Davidson, L., 2005a. Flow around a simplified car, part 1: large eddysimulation. ASME Journal of Fluids Engineering 127, 907–918.
Krajnovic, S., Davidson, L., 2005b. Flow around a simplified car, part 2:understanding the flow. ASME Journal of Fluids Engineering 127, 919–928.
Krajnovic, S., Fernandes, J., 2011. Numerical simulation of the flow around asimplified vehicle model with active flow control. International Journal of Heatand Fluid Flow 32, 192–200.
Kuya, Y., Takeda, K., Zhang, X., Beeton, S., Pandaleon, T., 2009. Flow separationcontrol on a race car wing with vortex generators in ground effect. ASMEJournal of Fluids Engineering 131, 121102.
Lakshmipathy, S., Girimaji, S., 2010. Partially averaged Navier–Stokes (PANS)method for turbulence simulations: flow past a circular cylinder. ASMEJournal of Fluids Engineering 132, 121202.
Lengani, D., Simoni, D., Ubaldi, M., Zunino, P., Bertini, F., 2011. Application of asynthetic jet to control boundary layer separation under ultra-high-lift turbinepressure distribution. Flow Turbulence and Combustion. http://dx.doi.org/10.1007/s10494-011-9346-z.
Li, H., Wang, J., 2010. Circular cylinder vortex-synchronization control with asynthetic jet positioned at the rear stagnation point. Journal of Fluid Mechanics662, 232–259.
Parezanovic, V., Cadot, O., 2012. Experimental sensitivity analysis of the globalproperties of a two-dimensional turbulent wake. Journal of Fluid Mechanics693, 115–149.
Pastoor, M., Henning, L., Noack, B.R., King, R., Tadmor, G., 2008. Feedback shear layercontrol for bluff body drag reduction. Journal of Fluid Mechanics 608, 161–196.
Roshko, A., 1993. Perspectives on bluff body aerodynamics. Journal of WindEngineering and Industrial Aerodynamics 49, 79–100.
Sahni, O., Wood, J., Jansen, K., Amitay, M., 2011. Three-dimensional interactionsbetween a finite-span synthetic jet and a crossflow. Journal of Fluid Mechanics671, 254–287.
Spalart, P., Hedges, L., Shur, M., Travin, A., 2003. Simulation of active flow control ona stalled airfoil. Flow Turbulence and Combustion 71, 361–373.
Spalart, P., Mclean, J., 2011. Drag reduction: enticing turbulence, and then anindustry. Philosophical Transactions of the Royal Society A 369, 1556–1569.
Techet, A.H., Hover, F.S., Triantafyllou, M.S., 2003. Separation and turbulence controlin biomimetic flows. Flow Turbulence and Combustion 71, 105–118.


