Embed Size (px)
Citation preview
Structure-rheology relations in sodium caseinate containing systems
Promotor: Prof. dr. E. van der Linden Hoogleraar in de fysica en fysische chemie van levensmiddelen, Wageningen Universiteit Co-promotor: Dr. P. Venema
Universitair docent bij de leerstoelgroep fysica en fysische chemie van levensmiddelen, Wageningen Universiteit
Promotiecommissie: Prof. dr. ir. R. M. Boom (Wageningen Universiteit, Nederland) Prof. dr. M. Kolb (INRA, Frankrijk) Dr. H.T.M. van den Ende (Universiteit Twente, Nederland) Dr. T. Jongsma (Friesland Foods, Nederland) Dit onderzoek is uitgevoerd binnen de onderzoeksschool VLAG.
Structure-rheology relations in sodium caseinate containing systems
Hilde G.M. Ruis
Proefschrift ter verkrijging van de graad van doctor
op gezag van de rector magnificus van Wageningen Universiteit,
Prof. dr. M. J. Kropff, in the openbaar te verdedigen
op dinsdag 19 juni 2007 des namiddags te 16.00 uur in de Aula
Ruis, H.G.M. Structure-rheology relations in sodium caseinate containing systems PhD Thesis Wageningen University, The Netherlands 2007 – with summary in Dutch ISBN: 978-90-8504-648-6
Abstract
Hilde G.M. Ruis (2007) Structure-rheology relations in sodium caseinate containing systems
PhD thesis, Wageningen University, The Netherlands
Keywords: Sodium caseinate, emulsion, acidification, gelation, rheology, light scattering, diffusing wave spectroscopy, shear
Abstract The general aim of the work described in this thesis was to investigate structure-rheology relations for dairy related products, focusing on model systems containing sodium caseinate. The acid induced gelation of sodium caseinate, of sodium caseinate stabilized emulsions, and the effect of shear on the structure formation was characterized. Special attention was given to the sol-gel transition point, which was defined by a frequency independent loss tangent. It was shown that the sol-gel transition point is completely controlled by the pH and the temperature, independent of the concentration sodium caseinate or the applied shear rate. Considering sodium caseinate solutions, increase of the temperature of acidification caused a decrease of the critical pH for gelation and a more dense gel structure. The formed gels were not in thermodynamic equilibrium, however, due to the slow kinetics of the system they were stable on the time scale of the experiment. At the gel point we have strong indications that the structure can not be characterized by a single fractal dimension. During the acid induced gelation of sodium caseinate stabilized emulsions a single sol-gel transition was observed. Addition of an excess of sodium caseinate to the emulsion resulted in two sol-gel transitions upon acidification. Application of shear during the acidification of the emulsions showed a decreasing radius of the aggregates formed at the gelpoint with increasing shear rate. The aggregates formed became more dense due to the application of shear while the network that was formed by the aggregates became less compact. No shear induced alignment was observed of emulsion droplets dispersed in water or in a sodium caseinate solution, while emulsion droplets dispersed in a xanthan solution did align in a shear field. Addition of sodium inhibited the string formation of the emulsion droplets

Table of contents
Table of contents
1 Introduction 1 1.1 Aim of research 2 1.2 Sodium caseinate 3 1.3 Gelation of sodium caseinate 3 1.4 Sodium caseinate stabilized emulsions 4 1.5 Effect of shear on aggregation 5 1.6 Outline of this thesis 6
2 Relation between pH-induced stickiness and gelation behavior of sodium caseinate aggregates as determined by light scattering and rheology* 9
2.1 Introduction 10 2.2 Background 11
2.2.1 Interactions in colloidal dispersions 11 2.2.2 Phase behaviour 12
2.3 Materials and Methods 13 2.3.1 Sample preparation 13 2.3.2 Viscosity 14 2.3.3 Static light scattering 14 2.3.4 Rheology 14
2.4 Results 15 2.4.1 Viscosity 15 2.4.2 Light scattering 15 2.4.3 Rheology 17
2.5 Discussion 20 2.5.1 Viscosity 20 2.5.2 Light scattering 21 2.5.3 Rheology 22
2.6 Conclusion 27
Table of contents
3 Aggregation of sodium caseinate as studied by diffusing wave spectroscopy * 29
3.1 Introduction 30 3.2 Materials and Methods 31
3.2.1 Materials 31 3.2.2 Sample preparation 31 3.2.3 Viscosity 32 3.2.4 Rheology 32 3.2.5 DWS 32 3.2.6 Theory DWS 33
3.3 Results and discussion 34 3.3.1 Determination l* 34 3.3.2 Zero shear viscosity 35 3.3.3 Rheological behaviour during acidification 36
3.4 Conclusion 46
4 Transitions in structure in O/W emulsions as studied by diffusing wave spectroscopy* 49
4.1 Introduction 50 4.2 Materials and Methods 52
4.2.1 Materials. 52 4.2.2 Sample preparation 52 4.2.3 DWS 52
4.3 Theoretical Background 53 4.4 Results and Discussion 55
4.4.1 Effect of the sodium caseinate concentration on emulsions at neutral pH 55 4.4.2 Acidification of sodium caseinate stabilized emulsions without a surplus of
sodium caseinate 56 4.4.3 Acidification of sodium caseinate stabilized emulsions with a surplus of
sodium caseinate 59 4.5 Conclusion 64
Table of contents
5 Diffusing wave spectroscopy used to study the influence of shear on aggregation 69
5.1 Introduction 70 5.2 DWS under shear 71 5.3 Materials and methods 73
5.3.1 Materials 73 5.3.2 Sample preparation 74 5.3.3 Rheometry 74 5.3.4 Diffusing Wave Spectroscopy under shear 75
5.4 Results and Discussion 75 5.4.1 Water 75 5.4.2 Sodium caseinate stabilized emulsion 77 5.4.3 Emulsion with surplus of sodium caseinate 84
5.5 Conclusion 91
6 Influence of the continuous phase on the shear induced string formation of emulsion droplets 95
6.1 Introduction 96 6.2 Materials and methods 97
6.2.1 Materials 97 6.2.2 Sample preparation 97 6.2.3 Rheometry 98 6.2.4 Rheo-optica 98 6.2.5 Shear cell 98
6.3 Results and Discussion 99 6.3.1 Characterization continuous phase 99 6.3.2 Alignment of emulsion droplets under shear 103
6.4 Conclusion 107
Summary Samenvatting 109
Dankwoord 117

Table of contents
List of publications 121
Curriculum Vitae 123
Educational activities 125

1 Introduction
Chapter 1
2
1.1 Aim of research Milk is a complex system containing numerous different components. The main components beside water are lactose (~ 4.6 %), fat (~ 4.3 %), proteins (~ 3.3 %), and minerals (~ 0.7 %). Lactose is a disaccharide formed by glucose and galactose. Milk fat consists mainly of triglycerides in a very complex mixture in which the fatty acids strongly vary in chain length (2-20 C-atoms) and in saturation. Approximately 80% of the proteins are casein proteins; the other proteins are β-lactoglobulin, α-lactalbumin, bovine serum albumin and immune globulins.1 The casein proteins are an unique and diverse group of proteins present in bovine milk. In bovine milk mainly αS1-, αS2-, β- and κ-casein in the ratio 4:1:4:1.3 are found.2, 3 The function of casein is presumed to be primarily nutritional.4 Caseins are often described as rheomorphic (from the greek rheos, meaning stream and morphe, form5) proteins,6 which means that they have relatively little secondary or tertiary structure under physiological conditions. All casein proteins are extremely flexible and essentially unfolded. They have an amphiphilic character arising from a separation between distinct hydrophobic and hydrophilic regions along the polypeptide chain.4, 6 Due to its characteristics, the different caseins exhibit a strong tendency to associate through hydrophobic and electrostatic interactions.7 In milk, the caseins form large aggregates (historically called micelles), with a radius that varies from 30-150 nm. These aggregates are thought to be held together by colloidal calcium phosphate. Electrostatic and steric repulsion, induced by a “hairy layer” of mainly κ-casein on the outside of the aggregates,2 make them very stable against high temperatures, salt and ethanol addition.8 The aggregates are considered as hard spheres. Upon removal of the colloidal calcium phosphate the large aggregates dissociate and smaller subunits of approximately 10-12 nm remain.8 Extensive research is performed to explain the behavior of casein in milk, however up to now still no general picture of the complex structure of the casein aggregates as found in milk exists. There is also no theory that completely explains the behavior of the casein aggregates.6, 9 Several changes of the environment of milk can lead to aggregation of the casein aggregates. A high temperature (above 120°C) for example causes heat coagulation.10, 11 Acidification to the isoelectric point of the different caseins (pH ~4.6)3 causes aggregation because calcium and inorganic phosphate dissolve gradually and the net negative electric charge of the casein aggregates decreases. Addition of rennet, causes removal of the κ-casein hairs and excess of calcium will result in the formation of Ca-bridges.10
Introduction
3
When the casein aggregates in skim milk quiescently aggregate a gel is formed. These gels have high commercial and traditional value in the dairy product industry. Examples are yoghurt, quark or cheese. The main building element in all these products are the caseins.12 The characteristics of the structures found in the different products are caused by the treatment used, for example acidification versus rennet or processing in rest versus processing under shear. The general aim of the work described in this thesis was to investigate structure-rheology relations for dairy related products, focusing on model systems containing sodium caseinate. Special attention was given to the effects of pH and shear on aggregation phenomena.
1.2 Sodium caseinate Sodium caseinate is produced from skim milk by acidification to a pH of 4.6. At this pH the colloidal calcium phosphate dissolves and the different casein proteins precipitate. Several washing steps are applied to remove the soluble salts, lactose and whey proteins and eventually the precipitated caseins are dissolved by re-neutralization of the system to pH ~7 with NaOH.13 After spray drying sodium caseinate powder remains. In a sodium caseinate solution (which also contains mainly αS1-, αS2-, β- and κ-casein in the ratio 4:1:4:1.3) the caseins self-associate into small aggregates of approximately 10-12 nm.10, 14 The critical concentration for this association is assumed to be ~0.05 wt%.15 Because hardly any calcium phosphate is present in sodium caseinate solutions, the aggregates formed are much smaller than those found in milk. Sodium caseinate is widely used as an ingredient in the food industry. Its functional properties include emulsification, water-binding, fat-binding, thickening, gelation and whipping. Sodium caseinate is especially important as an stabilizer for emulsions, because of its ability for rapidly conferring a low interfacial tension during emulsification and because of the strongly amphiphilic characteristics of the major individual caseins (αS1- and β-casein).16
1.3 Gelation of sodium caseinate Above a critical volume fraction of particles, at sufficiently strong inter particle attraction, and if the applied stress is small enough, a gel will be formed.17-19Gelation is a gradual transition from a liquid to a viscoelastic gel. This makes the determination of the rheological properties useful.
Chapter 1
4
Slow acidification of a caseinate solution causes the formation of a gel. The microstructures of acid caseinate gels have been studied by several workers using for example rheology,3 permeability, transmission electron microscopy (TEM),2, 20 confocal scanning laser microscopy (CSLM)21 and water holding capacity.3 The main factors governing the formation of acid sodium caseinate gels are the caseinate concentration, pH, temperature and ionic strength.13 The maximum gelstrength, determined using rheology, will be obtained at low ionic strength at a pH of ~4.6, which is around the iso-electric point of the different caseins.20 The formed gels are not in thermodynamic equilibrium. The acid induced gelation is reversible; adjustment of the pH from 4,6 to 7, will dissolve the gel.2 This indicates that no covalent bonds are formed during the acidification. Increase of the aging temperature results in lower moduli of the formed gels.13, 20, 22 The acid caseinate gels are often considered as particle gels and described by a collection of fractal clusters.2
1.4 Sodium caseinate stabilized emulsions Emulsions consist of droplets of one liquid dispersed in another one, which is termed the continuous phase.23 The dispersed phase of oil in water emulsions is in general less dense than the continuous phase, causing the droplets to rise (cream) in a gravitational field. The larger the droplets the faster the creaming rate. To prevent phase separation, a stabilizer, which will be located at the interface of the droplets, is needed. Due to its amphiphilic character, sodium caseinate is a good stabilizer for oil in water emulsions. The caseins adsorb at the oil-water interface and stabilize the emulsion droplets through a combination of steric and electrostatic interactions. For this ability sodium caseinate finds a wide use in the food industry. The inter droplet interaction of sodium caseinate stabilized emulsions is determined by the amount of adsorbed as well as by the amount of nonadsorbed protein.24 At low surface coverage, flocculation can be caused by the coalescence of two emulsion droplets or by a bridging mechanism.25 In the latter case a surface-active protein is adsorbed on two (or more) droplets at the same time.24 The increase of the average droplets size, occurring in both situations, enhances the creaming of the emulsion droplets. At sodium caseinate concentrations around that required for saturation monolayer coverage, the emulsion is stabilized by effective steric stabilization. The emulsion will show an almost Newtonian rheological behavior, remains unflocculated, and is very stable towards creaming and coalescence.15 When excess of sodium caseinate is present in the continuous phase, in the
Introduction
5
form of small aggregates, destabilization of the emulsion can be induced by a depletion mechanism.25-27 The basis for depletion flocculation in emulsions containing excess of sodium caseinate is the loss of entropy of the caseinate aggregates. The centre of mass of the aggregates can not approach the surface of the oil droplets to a distance less than the aggregate’s radius, causing a lower concentration in the so-called depletion layer around the oil droplets compared to the bulk solution. This depletion effect causes a loss of entropy and can induce an attractive force between the oil droplets. When the attraction is sufficiently strong, which is at high enough caseinate concentration, the droplets flocculate.24, 28 In order to describe the depletion interaction in a mixture of colloidal spherical particles and nonadsorbing polymer molecules a thermodynamic model was developed by Vrij.29 In this model the position of the phase boundary is predicted.26, 28-30 Depending on the strength of the depletion interaction, in the work described in this thesis controlled by the excess of sodium caseinate present in the continuous phase, flocs of emulsion droplets can be formed leading to enhanced creaming. With increasing depletion force the emulsion droplets can form a temporarily homogeneous system that spontaneously creams after a composition dependent delay time.25, 27 The viscosity of the emulsion can be adjusted by the addition of excess of sodium caseinate and changes with increasing caseinate concentration from an almost Newtonian to a shear-thinning rheological behavior.15, 27
1.5 Effect of shear on aggregation Numerous products are processed under shear. This highly affect the structure formation and the final structure of a product. Changes in the microscopic structure are induced by shear, which in turn affect the rheological behavior. For example, the shear thinning rheological behavior of emulsions containing excess of sodium caseinate in the continuous phase is caused by gradual breakup of droplet aggregates due to shear. The effect of shear on structure is profound and often irreversible. Depending on the attraction strength, shear does not only break clusters, but can also substantially rearrange the clusters.31-34 Eventually an equilibrium will be formed between aggregation and break-up of the clusters. Application of shear can also induce ordering in a system, which will, for example, influence the perception and mouth feeling of a product. Anisotropic macromolecules can align due to shear. Considering a dispersion, depending on the rheological properties of the
Chapter 1
6
continuous phase, shear can induce string formation of a dispersed phase. However, much is still unknown about the mechanism that causes string formation.353637
1.6 Outline of this thesis An important challenge in food science is to understand and to control the changes in colloidal interaction, rheology and microstructure during processing and storage. In this thesis the effect of, among others, pH and shear on the structure-rheology relations in sodium caseinate containing systems are described. Chapter 2 and 3 deal with the acid induced gelation of sodium caseinate. In chapter 2 static light scattering was used to analyze the interactions, in very dilute systems, between the casein proteins as a function of the pH and of the temperature. For higher concentrations (1-10 wt%) the acid induced gelation after the onset of gelation was followed using rheometry. On basis of an adhesive hard sphere model, light scattering results could be used to explain the rheological results. Chapter 3 describes the structure development of the acid induced gelation of sodium caseinate solutions up to the gel point. The gel point was defined as the point where the loss tangent, as determined by DWS, becomes frequency independent. Subsequently the average cluster size of the sodium caseinate aggregates at the critical point was determined. At the gel point our data strongly indicate that the system used cannot on all length sales be characterized with a single fractal dimension. Chapter 4 describes the acid induced gelation of sodium caseinate stabilized emulsions containing different amount of sodium caseinate in the continuous phase. The excess of sodium caseinate present in the continuous phase forms small aggregates of approximately 10 nm, inducing depletion flocculation of the oil droplets. DWS was used to analyze the structural development up to the gel point, and to deduce the visco-elastic moduli, which were subsequently used to determine the sol-gel transition point. Chapter 5 deals with the effect of shear on the acidification of two sodium caseinate stabilized emulsion. The emulsions contained 15 wt% of palmfat and either 0.6 wt% or 5 wt% of sodium caseinate. The structure formation was followed using a rheometer and using DWS. Special attention was again given to the critical (sol-gel) point. In chapter 6 the effect of shear on the alignment of emulsion droplets is described. In order to induce alignment of the emulsion droplets xanthan was added (0.1 wt%). The effect of shear on the continuous phase was studied using rheo-optical techniques. The alignment of the emulsion droplets was studied using microscopic images.
Introduction
7
References 1. Walstra, P., Geurts, T. J., Noomen, A., Jellema, A., Boekel van, M. A. J. S., Dairy
technology; principles of milk properties and processes. Marcel Dekker, inc: New York - Basel, 1999.
2. Roefs, S. P. F. M., Groot-Mostert de, A. E. A., Vliet van, T. Colloids and Surfaces 1990a, 50, 141-159.
3. Braga, A. L. M., Menossi, M., Cunha, R. L. Int. Dairy J. 2006, 16, 389-398. 4. Thorn, D. C., Meehan, S., Sunde, M., Rekas, A., Gras, S. L., MacPee, C. E., Dobson, C., M.,
Wilson, M. R., Carver, J. A. Biochemistry 2005, 44, 17027-17036. 5. Kruif de, C. G., Chapter VI: Caseins. In Progress in biotechnology 23, Aalbersberg, W. Y.,
Hamer, R. J., Jasperse, P., Jong de, H. H. J., Kruif de, C. G., Walstra, P., Wolf, F. A., Eds. Elsevier Science B.V.: Amsterdam, 2003.
6. Horne, D. S. Curr. Opin. Colloid Interface Sci. 2006, 11, 148-153. 7. Dickinson, E. Soft Matter 2006, 2, 642-652. 8. Panouillé, M., Nicolai, T., Durand, D. Int. Dairy J. 2004, 14, 297-303. 9. Dalgleish, D. G., Spagnuolo, P. A., Goff, H. D. Int. Dairy J. 2004, 14, 1025-1031. 10. Chu, B., Zhou, Z., Wu, G., Farrell, H. M. J. Colloid Interface Sci. 1995, 170, 102-112. 11. Guo, M. R., Fox, P. F., Flynn, A., Kindstedt, P. S. Int. Dairy J. 1996, 6, 473-483. 12. Arshad, M., Paulssson, M., Dejmek, P. J. Dairy Sci. 1993, 76, 3310-3316. 13. O'Kennedy, B. T., Mounsey, J. S., Murphy, J. M., Duggan, E., Kelly, P. M. Int. Dairy J. 2006,
16, 1132-1141. 14. Farrer, D., Lips, A. Int. Dairy J. 1999, 9, 281-286. 15. Berli, C. L. A., Quemada, D., Parker, A. Colloids Surf., A 2002, 203, 11-20. 16. Dickinson, E., Golding, M. J. Colloid Interface Sci. 1997, 191, 166-176. 17. Liu, A. J., Nagel, S. R. Nature 1998, 396, 21-22. 18. Yanez, J. A., Laarz, E., Bergström, L. J. Colloid Interface Sci. 1999, 209, 162-172. 19. Prasad, V., Trappe, V., Dinsmore, A. D., Segre, P. N., Cipelletti, L., Weitz, D. A. Faraday
Discuss. 2003, 123, 1-12. 20. Roefs, S. P. F. M., Vliet van, T. Colloids and Surfaces 1990b, 50, 161-175. 21. Lucey, J. A., Vliet van, T., Grolle, K., Geurts, T. J., Walstra, P. Int. Dairy J. 1997b, 7, 389-
397. 22. Lucey, J. A., Vliet van, T., Grolle, K., Geurts, T. J., Walstra, P. Int. Dairy J. 1997a, 7, 381-
388. 23. Robins, M. M., Watson, A. D., Wilde, P. J. Curr. Opin. Colloid Interface Sci. 2002, 7, 419-
425. 24. Dickinson, E., Semenova, M. G., Belyakova, L. E., Antipova, A. S., Il'in, M. M., Tsapkina, E.
N., Ritzoulis, C. J. Colloid Interface Sci. 2001, 2398, 87-97. 25. Dickinson, E., Golding, M., Povey, M. J. W. J. Colloid Interface Sci. 1997, 185, 515-529. 26. Radford, S. J., Dickinson, E. Colloids Surf., A 2004, 238, 71-81.
Chapter 1
8
27. Dickinson, E., Golding, M. Food Hydrocolloids 1997, 11, 13-18. 28. Tuinier, R., Grotenhuis ten, E., Holt, C., Timmins, P. A., Kruif de, C. G. Phys. Rev. E 1999,
60, 848-456. 29. Vrij, A. Pure Appl. Chem. 1976, 48, 471-483. 30. Tuinier, R., Kruif de, C. G. J. Chem. Phys. 1999, 110, 9296-9304. 31. Rooij de, R., Potanin, A. A., Ende van den, D., Mellema, J. J. Chem. Phys. 1993, 99, 9213-
9223. 32. Wolthers, W., Duits, M. H. G., Ende van den, D., Mellema, J. J. Rheol. 1996, 40, 799-811. 33. Reub, C. J., Zukoski, C. F. J. Rheol. 1997, 41, 197-217. 34. Varadan, P., Solomon, M. J. Langmuir 2001, 17, 2918-2929. 35. Michele, J., Pätzold, R., Donis, R. Rheol. Acta 1977, 16, 317-321. 36. Scirocco, R., Vermant, J., Mewis, J. J. Non-Newtonian Fluid Mech. 2004, 117, 183-192. 37. Won, D., Kim, C. J. Non-Newtonian Fluid Mech. 2004, 117, 141-146.
*H.G.M. Ruis, P. Venema and E. van der Linden, Food Hydrocolloids 2007, 21, 545-555
2 Relation between pH-induced stickiness and gelation
behavior of sodium caseinate aggregates as determined by light scattering and rheology*
Abstract The effect of pH and temperature on the interaction potential of sodium caseinate solutions in terms of an adhesive-(or sticky)-hard-sphere model was studied. The sodium caseinate aggregates are regarded to be sticky hard spheres with a certain radius. The value of the stickiness parameter as deduced from light scattering is consistent with that as deduced from viscosity measurements. The stickiness between the caseinate aggregates strongly increased between a pH of 5.5 and 5, corresponding to a transition of the second viral coefficient from positive to negative, and also to the onset of gelation. The critical concentration necessary for gelation was determined to approach zero, allowing to describe the gelation using a fractal model. The fractal dimension, determined at a temperature of 293 K, increased with acidification temperature from 2.35 to 2.55 at 293 K and 323 K respectively, indicating that the pH as well as the temperature relates to the stickiness of the aggregates and can influence the final structure of the gel.
Chapter 2
10
2.1 Introduction Assemblies of proteins in a fluid play an important role in the macroscopic properties of food products, being for instance foams, emulsions or gels. Exploring the morphology, physico-chemical characteristics and mutual interactions of protein assemblies is thus relevant for the engineering of food materials. One of the proteins that are important regarding structure formation is casein. Many different products (for example yoghurt, quark, and cheese) contain casein molecules as one of their main building blocks. The different colloidal structures built by caseins lead to differences in product characteristics. One way to change the product characteristics is by changing the process treatment during the build-up of the structure. This will change the interaction between the casein building blocks and therefore result in different structural properties. Important issues in quantifying relations between process treatment and structure are the strength of the interactions and the modeling of structural build up as a function of these interaction forces. The integrity of native casein micelles, as found in milk, is kept mainly by colloidal calcium phosphate. Upon removal of the calcium phosphate the micellar structure falls apart. The individual casein molecules interact with each other and form associate structures with a radius of approximately 10 nm,1 which are called aggregates in this work. This system, for example formed in sodium caseinate solutions, can be described as a colloidal dispersion. The stability of sodium caseinate solutions is determined by, amongst others, the temperature and the pH. Adjustment of the pH towards the iso-electric point causes a decrease of the repulsive interaction, resulting in destabilization of the dispersion as soon as the pH drops below approximately 5.2, 3 The resulting sodium caseinate gels, formed at 303 K up to 4 wt% of sodium caseinate, were described as a collection of aggregated fractal clusters,4, 5 with a fractal dimension of approximately 2.35.6 Increase of temperature caused a decrease of the gelstrength2 and an increase of the permeability and of the pore size as observed with CSLM, indicating a coarsening of the network.7 Effects of subsequent cooling on the structure of the gels have not been reported. De Kruif (1998) performed a systematic study on the effect of the acidification of skim milk on the viscosity and the particle size of the native casein micelles.8 He could describe his data consistently using an adhesive-hard-sphere (AHS) model. The AHS model was also used by Farrer and Lips (1999) to describe the self assembly of sodium caseinate solutions (without calcium phosphate) at neutral pH over a wide concentration regime.9 The model fitted reasonably at higher temperatures, but at 303 k the fit was unsatisfactory.
Relation between stickiness and gelation behavior of sodium caseinate
11
In this work sodium caseinate solutions (without colloidal calcium phosphate) are acidified at different temperatures and the AHS model is used to discuss the relation between the stickiness parameter, pH, and gel characteristics, over a broad range of sodium caseinate concentrations. The parameters of interest are the relative viscosity (ηr), the second virial coefficient (B2), stickiness parameter (τ), pH, temperature, storage modulus (G’), loss modulus (G”), tan δ and the fractal dimension (df). It is shown that the interaction forces between the micelles strongly increase on approach of the iso-electic point of sodium caseinate causing gel formation. The formed gels are described using a fractal model. A significant temperature dependence of the final gel characteristics was found.
2.2 Background 2.2.1 Interactions in colloidal dispersions The interaction potential (ν) of a colloidal dispersion is related to the second osmotic virial coefficient, B2, according to the following equation:
∫∞
⎥⎦
⎤⎢⎣
⎡⎟⎠
⎞⎜⎝
⎛ −−⋅=
0
22
)(exp12
kTr
rdrBν
π [ 2.1 ]
where k is Boltzmann’s constant, T the absolute temperature, and r the inter particle centre-to-centre distance between two spheres.10 The simplest approach to model the gelation of attractive hard spheres is the AHS model. The AHS model of Baxter (1986)11 describes an assembly of particles with a spherical hard core plus infinitely thin attraction layer on the surface of the particle. The effective attraction in this model is expressed by one parameter,τ, [0,∞]. This dimensionless parameter, which is proportional to the inverse of the temperature, is also called the stickiness parameter. Its inverse is interpreted as the interparticle adhesiveness. The Baxter model can be used as long as the range of interaction, δ, is short compared to the hard core diameter, σ, ( 1.0<σδ ). The limit
∞→τ corresponds to a system of hard spheres,12 whereas at low values of τ there is an adhesive potential.13 The AHS potential has the same appearance as a square well potential, but is infinitely narrow (δ) and deep (ε) while the square well model has a finite width and depth. The AHS pair potential introduced by Baxter, is obtained when the limit of the width of the square well potential to zero is used, and is defined as follows.13
Chapter 2
12
∞ σ<r
0lim/)(
→=
δν kTr ⎥
⎦
⎤⎢⎣
⎡⎟⎠⎞
⎜⎝⎛
+δσδτ12ln δσσ +≤≤ r
{
0 δσ +>r
The Boltzmann factor thus develops a Dirac delta contribution ( )Δ at contact.12
( ) =⎟⎠⎞⎜
⎝⎛−
kTrνexp ( ) ( )στ
σ −Δ r12 σ≤r
{
1 σ>r
The Baxter parameter is related to the B2 by the following equation:
τ142 −=
mVB
[ 2.2 ]
where mV is the volume of one particle.
2.2.2 Phase behaviour The interaction parameter τ is essential for the final state of the system. In the phase diagram14 of an AHS (Figure 2.1), three different regions can be distinguished. A system in region I is a non-percolating fluid. The relative viscosity ηr of a dilute dispersion of solid hard spherical particles as given by Einstein:
φη 5.21+=r [ 2.3 ]
where φ denotes the volume fraction of the particles. For semi-dilute dispersions (up to φ~0.2) of adhesive, non-percolating, hard spheres, the relative viscosity, in the limit of zero shear rate, as a function of the volume fraction is described by:15
29.19.55.21 φτ
φη ⎟⎠⎞
⎜⎝⎛ +++=r [ 2.4 ]
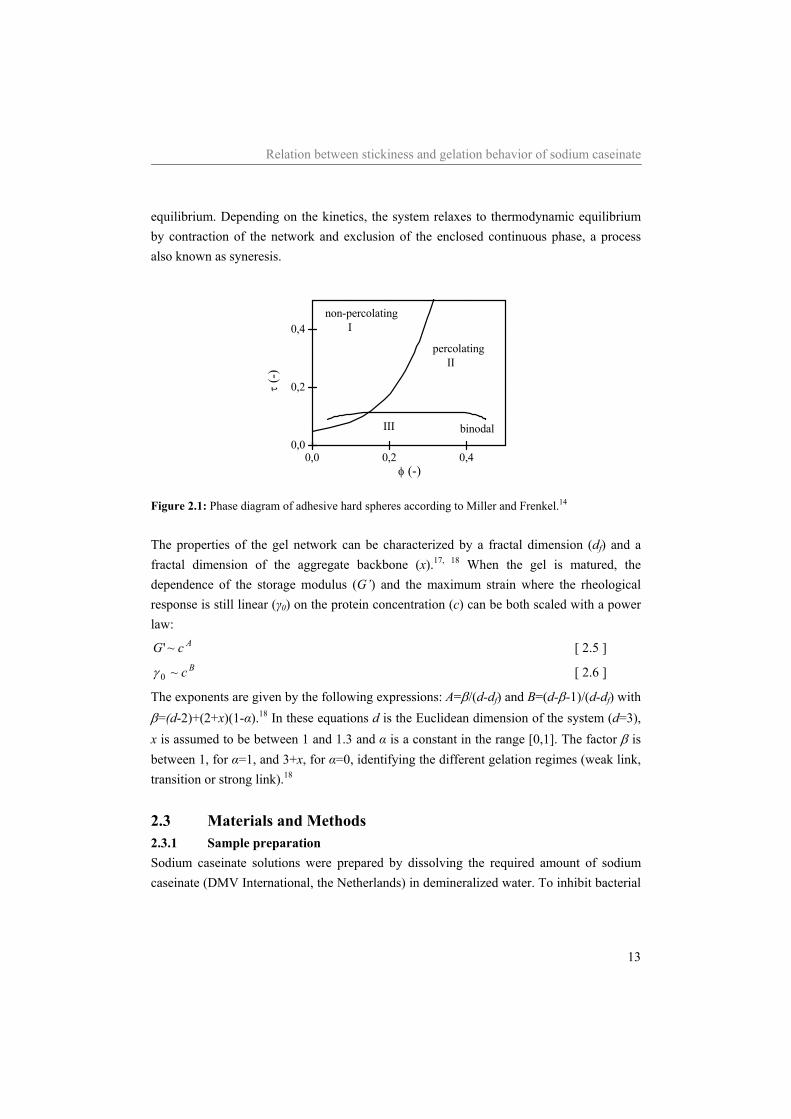
As soon as the volume fraction increases above a critical value,14 a percolating system is formed (region II in Figure 2.1). Networks formed in this region are described using percolation models. Baxter11 showed that AHS systems exhibit a first order phase transition. Underneath the binodal (region III in Figure 2.1), i.e. strong attraction, the system is thermodynamically unstable, causing phase separation.16 In this region, the stickiness between the spheres is that high that they immediately aggregate upon contact. A gel-like network of closely packed fractal clusters can be formed, which has the appearance of one phase, but is out of
Relation between stickiness and gelation behavior of sodium caseinate
13
equilibrium. Depending on the kinetics, the system relaxes to thermodynamic equilibrium by contraction of the network and exclusion of the enclosed continuous phase, a process also known as syneresis.
0,0 0,2 0,40,0
0,2
0,4
binodalIII
percolating II
non-percolating I
τ (-)
φ (-)
Figure 2.1: Phase diagram of adhesive hard spheres according to Miller and Frenkel.14 The properties of the gel network can be characterized by a fractal dimension (df) and a fractal dimension of the aggregate backbone (x).17, 18 When the gel is matured, the dependence of the storage modulus (G’) and the maximum strain where the rheological response is still linear (γ0) on the protein concentration (c) can be both scaled with a power law:
AcG ~' [ 2.5 ] Bc~0γ [ 2.6 ]
The exponents are given by the following expressions: A=β/(d-df) and B=(d-β-1)/(d-df) with β=(d-2)+(2+x)(1-α).18 In these equations d is the Euclidean dimension of the system (d=3), x is assumed to be between 1 and 1.3 and α is a constant in the range [0,1]. The factor β is between 1, for α=1, and 3+x, for α=0, identifying the different gelation regimes (weak link, transition or strong link).18
2.3 Materials and Methods 2.3.1 Sample preparation Sodium caseinate solutions were prepared by dissolving the required amount of sodium caseinate (DMV International, the Netherlands) in demineralized water. To inhibit bacterial
Chapter 2
14
growth, 0.02 wt% sodium azide (Merck, Schuchart, Germany) was added. To allow for equilibrium, the solutions were stirred overnight at room temperature. 2.3.2 Viscosity The viscosity of the sodium caseinate solutions was determined as a function of temperature and protein concentration with the use of Ubbelohde viscometers. The Ubbelohdes were thermal equilibrated in a waterbath. 2.3.3 Static light scattering The influence of temperature and pH on the interaction potential between the colloidal particles was studied with multi-angle static light scattering. A DAW-EOS MALLS photometer (Wyatt technology, Santa Barbara, CA) fitted with a helium-neon laser (λ=632.8 nm) was used to perform static light scattering experiments. The data were processed with ASTRA (version 4.90.07) software. HPLC-grade toluene, filtered through a 0.02 μm filter, was used to calibrate the system. With this calibration the factor to correct the Rayleigh ratio at 90° was obtained. The responses to light scattering intensity were normalized to the detector at 90° with a bovine serum albumin sample. Before measuring, protein samples were centrifuged at 4°C for 120 minutes at 45000g (Sorval RC-5B centrifuge, Du Pont Instruments). Samples were filtered (0.2 μm filter) followed by acidification with HCl. The light scattering measurements were performed at an amplification of 100 times. The concentrations used at pH 7 were between 10-3 g/ml and 10-4 g/ml and at pH 4 between 10-6 g/ml and 10-7 g/ml. The second virial coefficient (B2), radius of gyration (rg), and the molecular weight (Mw), were determined from a Zimm-plot and the refractive index increment (dn/dc) was taken equal to 0.189 cm3/g.19 2.3.4 Rheology For the rheological experiments, protein solutions were acidified with glucono-δ-lactone (GDL) to reach a pH of 4.6 ± 0.1 in 24 hours. For this acidification, 0.15 gram GDL granules per gram of protein were added to the protein solution. To dissolve the GDL granules, solutions were stirred for at least one minute. Rheological and pH measurements were started 5 minutes after the addition of GDL. The acid induced gel formation was followed in a Paar Physica MCR 300 (Anton Paar, Austria) stress-controlled rheometer, operating in the strain-controlled mode through a feedback loop, using a Couette geometry. Samples were covered with paraffin oil to
Relation between stickiness and gelation behavior of sodium caseinate
15
prevent evaporation. Temperature was controlled by a Peltier element. The acidification was followed at a strain (0.5%) and frequency (0.1 Hz) low enough to assure that all measurements were performed in the linear regime. After 24 hours the samples were cooled down to 293 K and equilibrated at 293 K for 30 minutes. After equilibration of the sample a strain sweep was performed. In the strain sweep, the strain was increased logarithmic from 0.1 to 300% at a frequency of 0.1 Hz, from which the limit of linearity of the gel was determined.
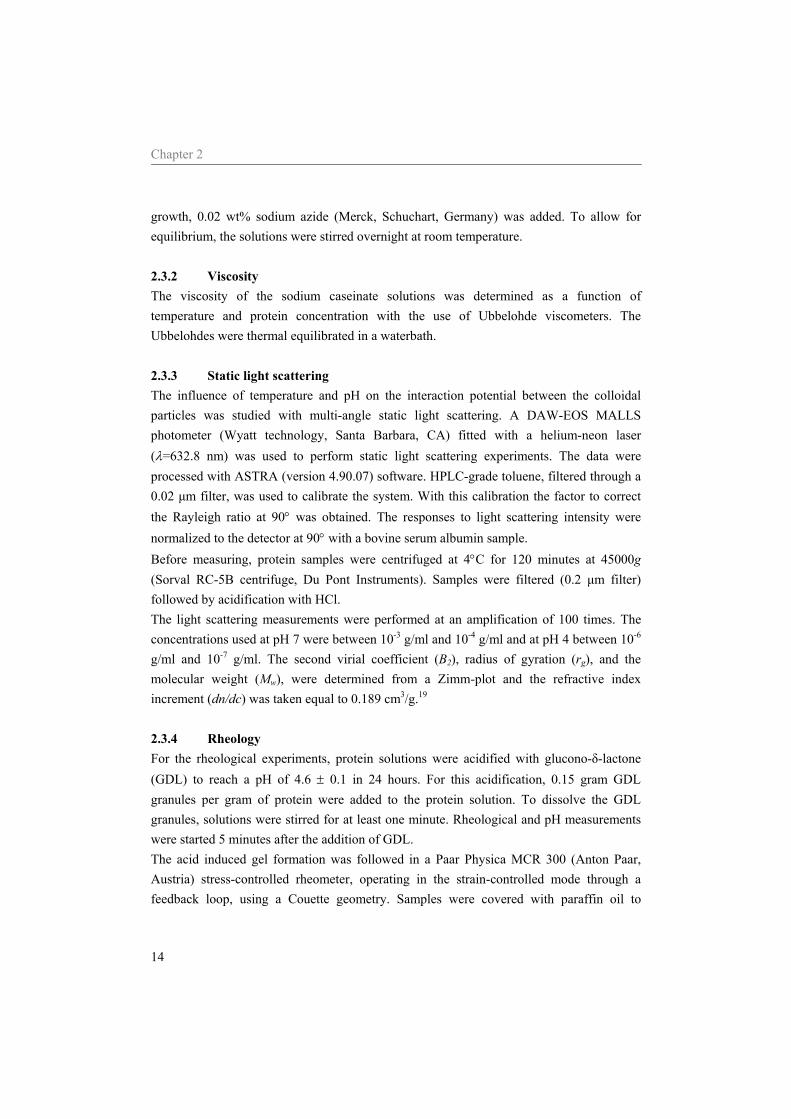
2.4 Results 2.4.1 Viscosity Figure 2.2 shows an increase of the relative viscosity, rη , with the concentration sodium
caseinate determined at a pH of 7 and a temperature of 293 K. The relative viscosity decreased with temperature, but the shape of the curves was preserved.
0 1 2 3 4 5
1,0
1,5
2,0
2,5
3,0
3,5
η r (−)
concentration sodium caseinate (wt%)
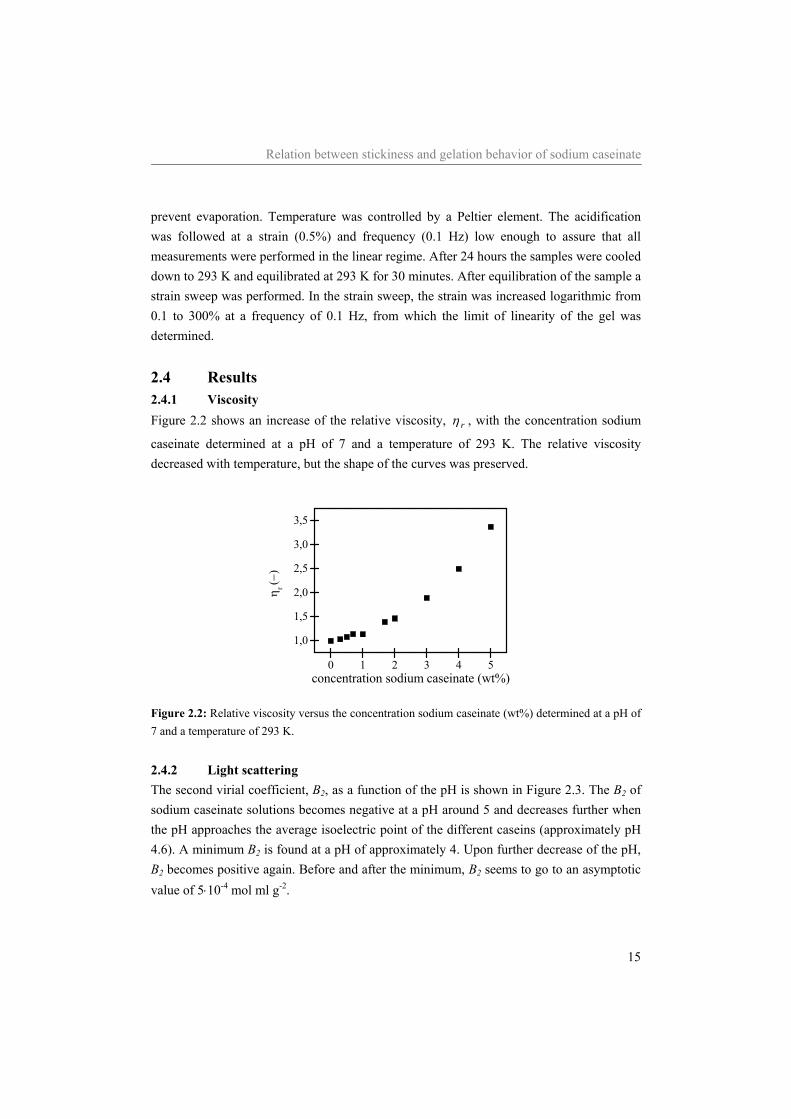
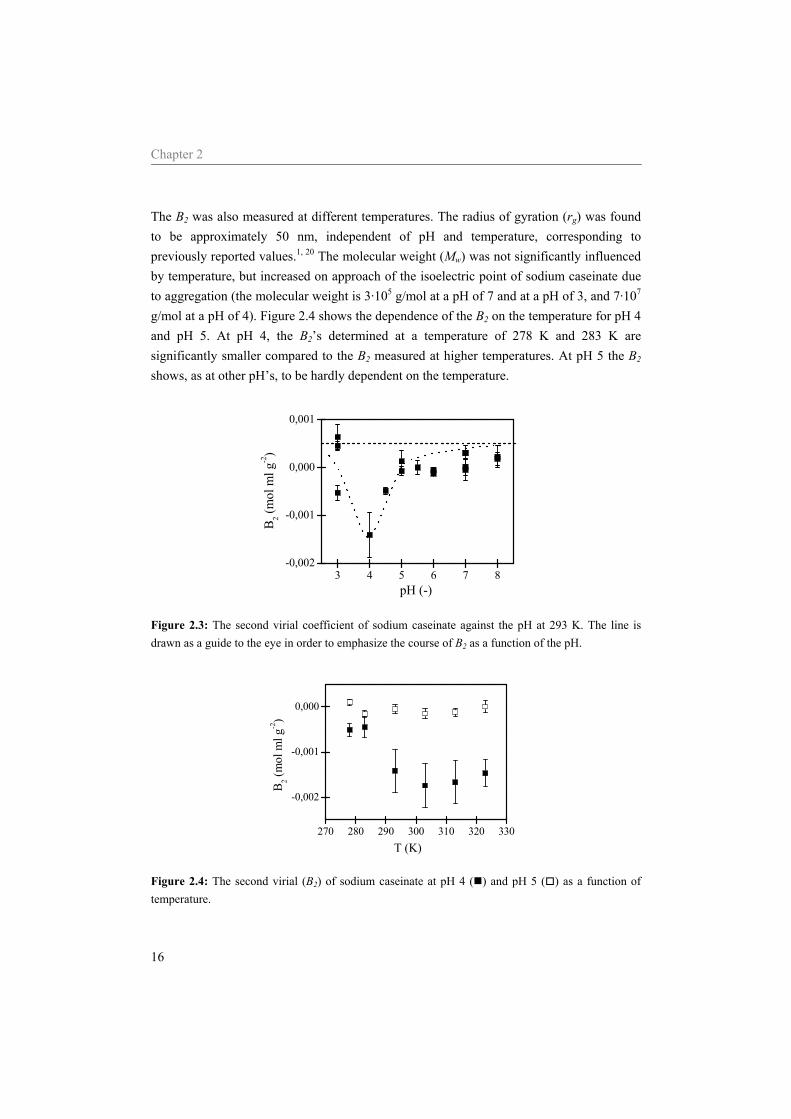
Figure 2.2: Relative viscosity versus the concentration sodium caseinate (wt%) determined at a pH of 7 and a temperature of 293 K. 2.4.2 Light scattering The second virial coefficient, B2, as a function of the pH is shown in Figure 2.3. The B2 of sodium caseinate solutions becomes negative at a pH around 5 and decreases further when the pH approaches the average isoelectric point of the different caseins (approximately pH 4.6). A minimum B2 is found at a pH of approximately 4. Upon further decrease of the pH, B2 becomes positive again. Before and after the minimum, B2 seems to go to an asymptotic value of 5⋅10-4 mol ml g-2.
Chapter 2
16
The B2 was also measured at different temperatures. The radius of gyration (rg) was found to be approximately 50 nm, independent of pH and temperature, corresponding to previously reported values.1, 20 The molecular weight (Mw) was not significantly influenced by temperature, but increased on approach of the isoelectric point of sodium caseinate due to aggregation (the molecular weight is 3·105 g/mol at a pH of 7 and at a pH of 3, and 7·107 g/mol at a pH of 4). Figure 2.4 shows the dependence of the B2 on the temperature for pH 4 and pH 5. At pH 4, the B2’s determined at a temperature of 278 K and 283 K are significantly smaller compared to the B2 measured at higher temperatures. At pH 5 the B2 shows, as at other pH’s, to be hardly dependent on the temperature.
3 4 5 6 7 8-0,002
-0,001
0,000
0,001
B 2 (mol
ml g
-2)
pH (-)
Figure 2.3: The second virial coefficient of sodium caseinate against the pH at 293 K. The line is drawn as a guide to the eye in order to emphasize the course of B2 as a function of the pH.
270 280 290 300 310 320 330
-0,002
-0,001
0,000
B 2 (mol
ml g
-2)
T (K)
Figure 2.4: The second virial (B2) of sodium caseinate at pH 4 ( ) and pH 5 ( ) as a function of temperature.
Relation between stickiness and gelation behavior of sodium caseinate
17
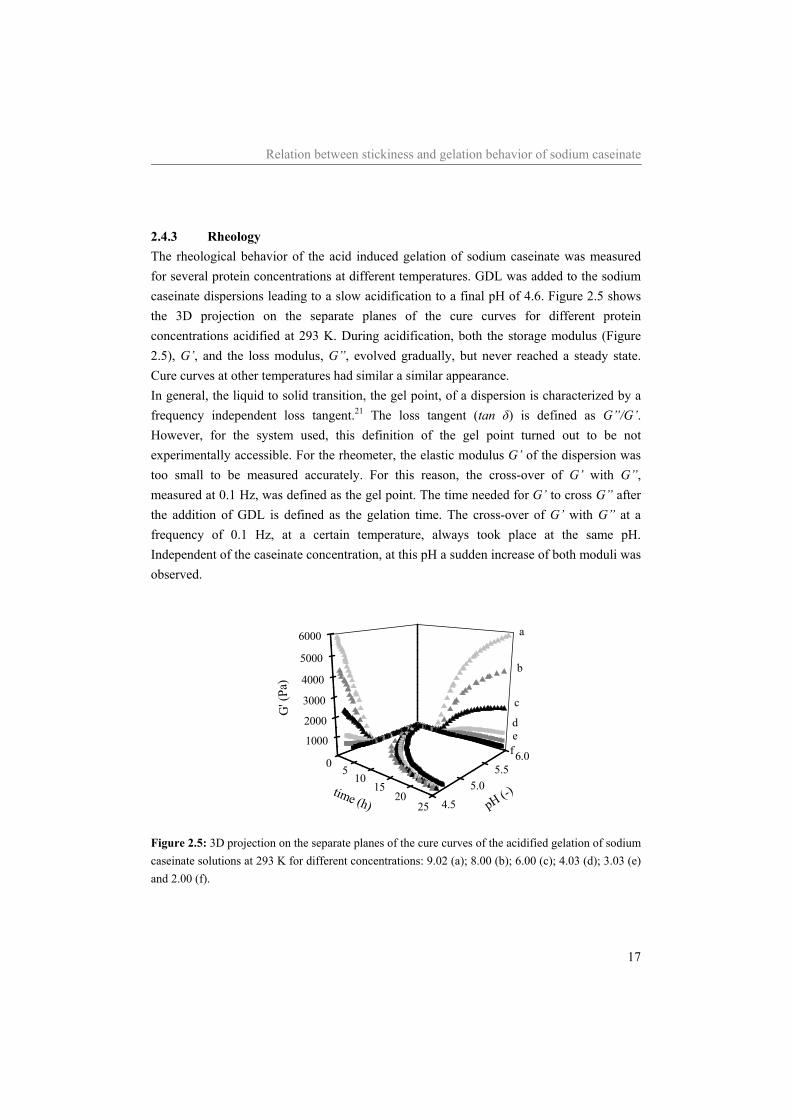
2.4.3 Rheology The rheological behavior of the acid induced gelation of sodium caseinate was measured for several protein concentrations at different temperatures. GDL was added to the sodium caseinate dispersions leading to a slow acidification to a final pH of 4.6. Figure 2.5 shows the 3D projection on the separate planes of the cure curves for different protein concentrations acidified at 293 K. During acidification, both the storage modulus (Figure 2.5), G’, and the loss modulus, G”, evolved gradually, but never reached a steady state. Cure curves at other temperatures had similar a similar appearance. In general, the liquid to solid transition, the gel point, of a dispersion is characterized by a frequency independent loss tangent.21 The loss tangent (tan δ) is defined as G”/G’. However, for the system used, this definition of the gel point turned out to be not experimentally accessible. For the rheometer, the elastic modulus G’ of the dispersion was too small to be measured accurately. For this reason, the cross-over of G’ with G”, measured at 0.1 Hz, was defined as the gel point. The time needed for G’ to cross G” after the addition of GDL is defined as the gelation time. The cross-over of G’ with G” at a frequency of 0.1 Hz, at a certain temperature, always took place at the same pH. Independent of the caseinate concentration, at this pH a sudden increase of both moduli was observed.
0 510
1520
25
1000
2000
3000
4000
5000
6000
4.55.0
5.56.0fe
b
c
d
a
pH (-)
G' (
Pa)
time (h)
Figure 2.5: 3D projection on the separate planes of the cure curves of the acidified gelation of sodium caseinate solutions at 293 K for different concentrations: 9.02 (a); 8.00 (b); 6.00 (c); 4.03 (d); 3.03 (e) and 2.00 (f).
Chapter 2
18
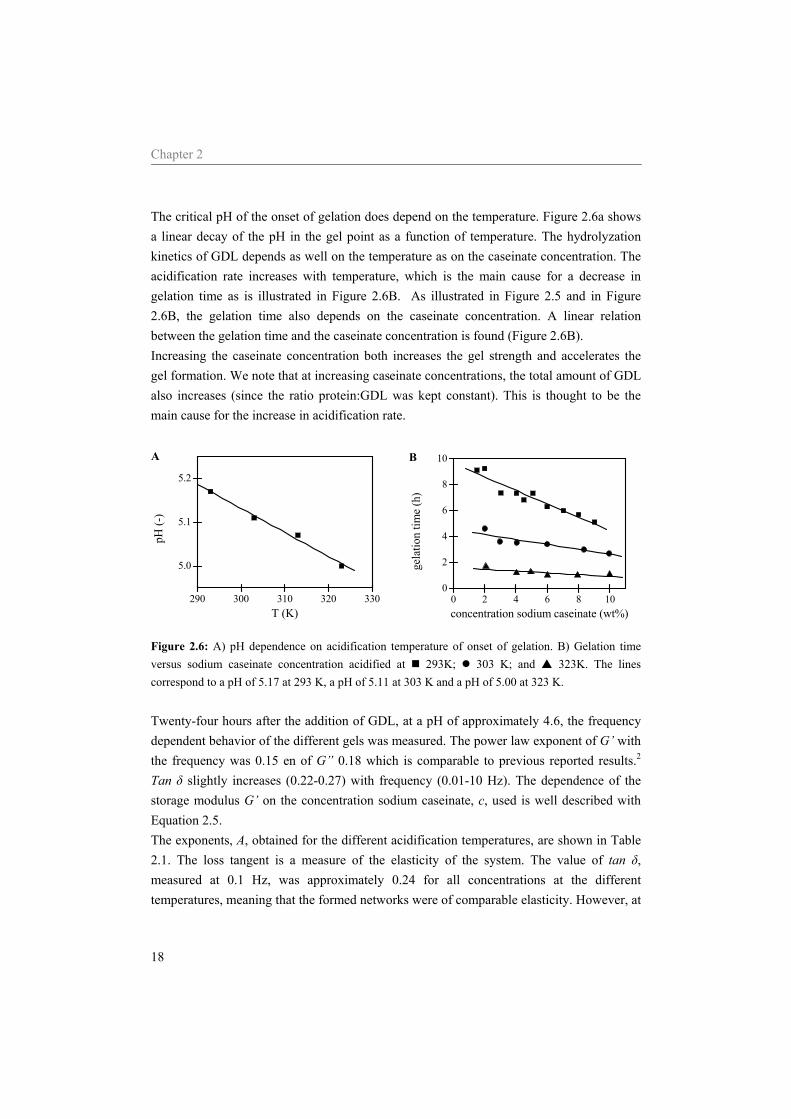
The critical pH of the onset of gelation does depend on the temperature. Figure 2.6a shows a linear decay of the pH in the gel point as a function of temperature. The hydrolyzation kinetics of GDL depends as well on the temperature as on the caseinate concentration. The acidification rate increases with temperature, which is the main cause for a decrease in gelation time as is illustrated in Figure 2.6B. As illustrated in Figure 2.5 and in Figure 2.6B, the gelation time also depends on the caseinate concentration. A linear relation between the gelation time and the caseinate concentration is found (Figure 2.6B). Increasing the caseinate concentration both increases the gel strength and accelerates the gel formation. We note that at increasing caseinate concentrations, the total amount of GDL also increases (since the ratio protein:GDL was kept constant). This is thought to be the main cause for the increase in acidification rate.
290 300 310 320 330
5.0
5.1
5.2
A
pH (-
)
T (K)
0 2 4 6 8 100
2
4
6
8
10B
gela
tion
time
(h)
concentration sodium caseinate (wt%)
Figure 2.6: A) pH dependence on acidification temperature of onset of gelation. B) Gelation time versus sodium caseinate concentration acidified at 293K; 303 K; and 323K. The lines correspond to a pH of 5.17 at 293 K, a pH of 5.11 at 303 K and a pH of 5.00 at 323 K. Twenty-four hours after the addition of GDL, at a pH of approximately 4.6, the frequency dependent behavior of the different gels was measured. The power law exponent of G’ with the frequency was 0.15 en of G” 0.18 which is comparable to previous reported results.2 Tan δ slightly increases (0.22-0.27) with frequency (0.01-10 Hz). The dependence of the storage modulus G’ on the concentration sodium caseinate, c, used is well described with Equation 2.5. The exponents, A, obtained for the different acidification temperatures, are shown in Table 2.1. The loss tangent is a measure of the elasticity of the system. The value of tan δ, measured at 0.1 Hz, was approximately 0.24 for all concentrations at the different temperatures, meaning that the formed networks were of comparable elasticity. However, at
Relation between stickiness and gelation behavior of sodium caseinate
19
a temperature of 343 K the value of tan δ was 0.05, indicating the formation of a very elastic network. 24 Hours after the addition of GDL, the gels were cooled to a temperature of 293 K. During the cooling of the gels, both moduli increased, as did the value of tan δ. The gels became less elastic. Subsequently the gels were equilibrated for 30 minutes at a temperature of 293 K. During this thermal equilibration several things occurred: The value of tan δ decreased again towards its original value. The values of tan δ after 30 minutes of equilibration are in table 2.1 (tan δ’). Both moduli reached a plateau value. The moduli of the gels acidified at 303 K reached comparable values as the gels aged at a temperature of 293 K. The moduli of the gels aged at a temperature of 323 K stayed significantly smaller than the moduli of gels acidified at 293 K. This is an indication that time and temperature are no substitute for each other. In addition, the exponent of the dependence of G’ on the concentration sodium caseinate changed slightly though significantly, but could still be described with a power law with exponent A’.
1 100.1
1
10
100
1000
10000
A
G' (
Pa)
concentration sodium caseinate (wt%)
1 100.01
0.1
1B
max
imum
stra
in (-
)
concentration sodium caseinate (wt%)
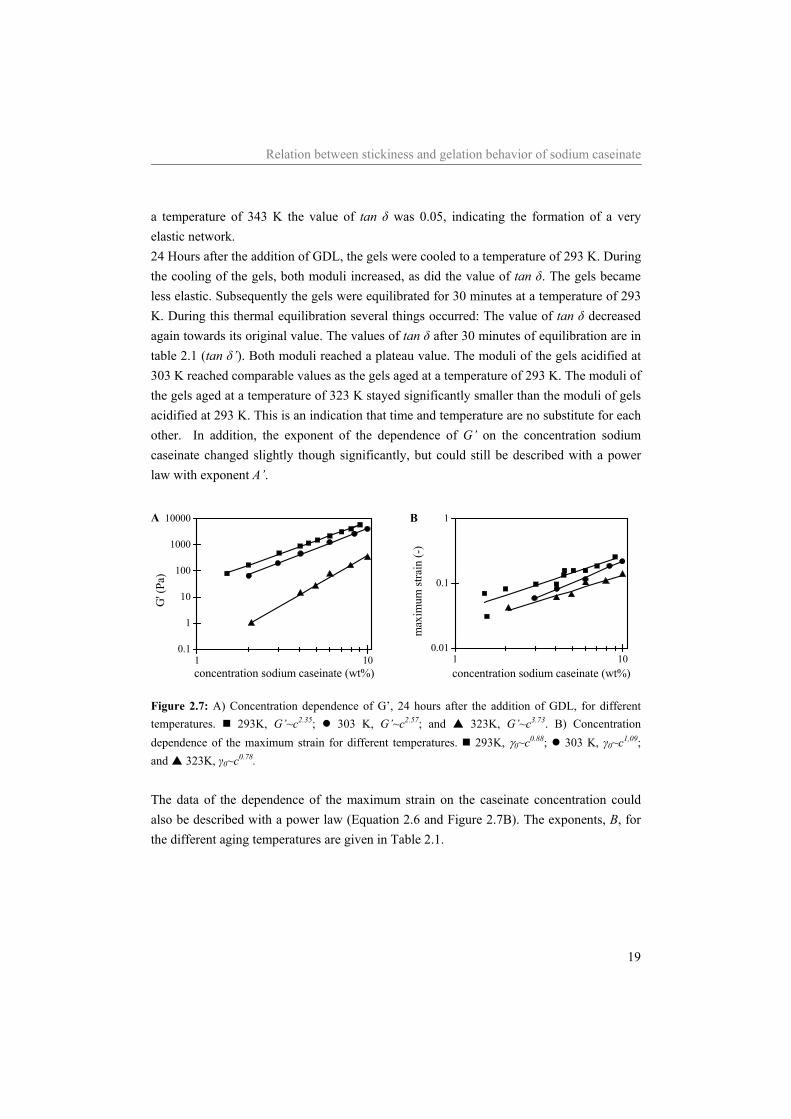
Figure 2.7: A) Concentration dependence of G’, 24 hours after the addition of GDL, for different temperatures. 293K, G’~c2.35; 303 K, G’~c2.57; and 323K, G’~c3.73. B) Concentration dependence of the maximum strain for different temperatures. 293K, γ0~c0.88; 303 K, γ0~c1,09; and 323K, γ0~c0.78. The data of the dependence of the maximum strain on the caseinate concentration could also be described with a power law (Equation 2.6 and Figure 2.7B). The exponents, B, for the different aging temperatures are given in Table 2.1.
Chapter 2
20
Table 2.1: Exponents and fractal dimensions calculated by theory of Wu et al.;18 G’~cA and γ0~cB. A=β/(d-df), B=(d-β-1)/(d-df), β=(d-2)+(2+x)(1-α), d=3 and x=1.3
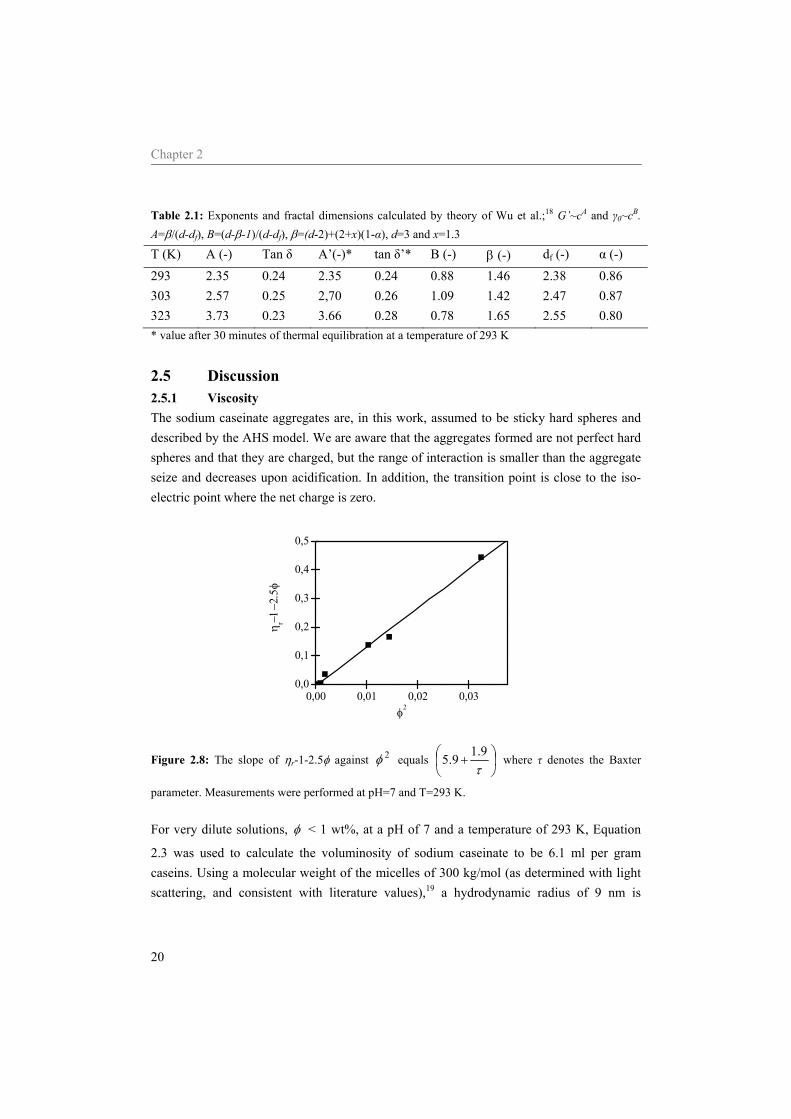
T (K) A (-) Tan δ A’(-)* tan δ’* B (-) β (-) df (-) α (-) 293 2.35 0.24 2.35 0.24 0.88 1.46 2.38 0.86 303 2.57 0.25 2,70 0.26 1.09 1.42 2.47 0.87 323 3.73 0.23 3.66 0.28 0.78 1.65 2.55 0.80 * value after 30 minutes of thermal equilibration at a temperature of 293 K
2.5 Discussion 2.5.1 Viscosity The sodium caseinate aggregates are, in this work, assumed to be sticky hard spheres and described by the AHS model. We are aware that the aggregates formed are not perfect hard spheres and that they are charged, but the range of interaction is smaller than the aggregate seize and decreases upon acidification. In addition, the transition point is close to the iso-electric point where the net charge is zero.
0,00 0,01 0,02 0,030,0
0,1
0,2
0,3
0,4
0,5
η r−1−2
.5φ
φ2
Figure 2.8: The slope of ηr-1-2.5φ against 2φ equals ⎟⎠⎞
⎜⎝⎛ +
τ9.19.5 where τ denotes the Baxter
parameter. Measurements were performed at pH=7 and T=293 K. For very dilute solutions, φ < 1 wt%, at a pH of 7 and a temperature of 293 K, Equation
2.3 was used to calculate the voluminosity of sodium caseinate to be 6.1 ml per gram caseins. Using a molecular weight of the micelles of 300 kg/mol (as determined with light scattering, and consistent with literature values),19 a hydrodynamic radius of 9 nm is
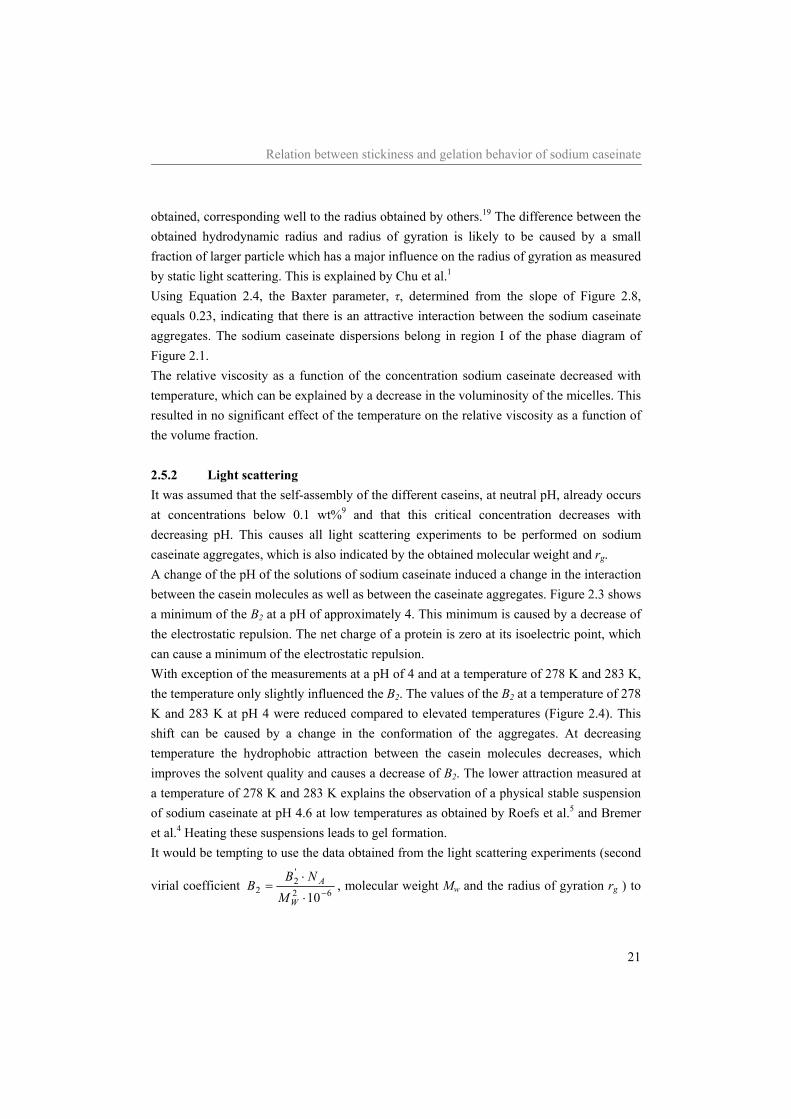
Relation between stickiness and gelation behavior of sodium caseinate
21
obtained, corresponding well to the radius obtained by others.19 The difference between the obtained hydrodynamic radius and radius of gyration is likely to be caused by a small fraction of larger particle which has a major influence on the radius of gyration as measured by static light scattering. This is explained by Chu et al.1 Using Equation 2.4, the Baxter parameter, τ, determined from the slope of Figure 2.8, equals 0.23, indicating that there is an attractive interaction between the sodium caseinate aggregates. The sodium caseinate dispersions belong in region I of the phase diagram of Figure 2.1. The relative viscosity as a function of the concentration sodium caseinate decreased with temperature, which can be explained by a decrease in the voluminosity of the micelles. This resulted in no significant effect of the temperature on the relative viscosity as a function of the volume fraction. 2.5.2 Light scattering It was assumed that the self-assembly of the different caseins, at neutral pH, already occurs at concentrations below 0.1 wt%9 and that this critical concentration decreases with decreasing pH. This causes all light scattering experiments to be performed on sodium caseinate aggregates, which is also indicated by the obtained molecular weight and rg. A change of the pH of the solutions of sodium caseinate induced a change in the interaction between the casein molecules as well as between the caseinate aggregates. Figure 2.3 shows a minimum of the B2 at a pH of approximately 4. This minimum is caused by a decrease of the electrostatic repulsion. The net charge of a protein is zero at its isoelectric point, which can cause a minimum of the electrostatic repulsion. With exception of the measurements at a pH of 4 and at a temperature of 278 K and 283 K, the temperature only slightly influenced the B2. The values of the B2 at a temperature of 278 K and 283 K at pH 4 were reduced compared to elevated temperatures (Figure 2.4). This shift can be caused by a change in the conformation of the aggregates. At decreasing temperature the hydrophobic attraction between the casein molecules decreases, which improves the solvent quality and causes a decrease of B2. The lower attraction measured at a temperature of 278 K and 283 K explains the observation of a physical stable suspension of sodium caseinate at pH 4.6 at low temperatures as obtained by Roefs et al.5 and Bremer et al.4 Heating these suspensions leads to gel formation. It would be tempting to use the data obtained from the light scattering experiments (second
virial coefficient 62
'2
210−⋅
⋅=
W
A
MNB
B , molecular weight Mw and the radius of gyration rg ) to
Chapter 2
22
calculate τ as a function of pH as well as temperature. However, due to the presence of a small weight fraction of larger particle in the samples used for the light scattering experiments, the determined radii of gyration are too large, as is the molecular weight. The molecular weight is not as much affected as the radius of gyration. Both effects make it hard to obtain a reliable indication of τ as a function of the pH and the temperature. The Baxter parameter calculated from the second virial coefficient obtained from light scattering at a pH of 7 and a temperature of 293 K, assuming a radius of 10 nm and a molecular weight of 300 kg/mol19, is 0.26. This value corresponds, within the experimental errors, to the one obtained by the viscosity measurements. 2.5.3 Rheology 2.5.3.1 Kinetics of gelation As Figure 2.3 illustrates, the second virial coefficient sharply decreases when the pH approaches the iso-electric point of sodium caseinate dispersions. The light scattering
measurements at pH 4 were performed at the lowest concentration possible ( %wt101 5−⋅ ) in order to minimize the complications in interpretation as pointed out in a recent paper by Prinsen and Odijk22. The stickiness between the particles upon lowering the pH towards the iso-electric point suddenly becomes that large that the critical concentration for aggregation approaches zero. Even at the sodium caseinate concentration used for the light scattering experiments aggregation occurred, as indicated by the increase of the molecular weight. As Figure 2.5 shows, both moduli increase as soon as the pH drops below its critical value causing the formation of a gel. Since the gels are in region III of the phase diagram (Figure 2.1), they are out of equilibrium and no steady state can be reached. Eventually the system will phase separate into a protein rich and a protein poor phase. The onset of gelation was found to be around a pH of 5 (Figure 2.6A). In contrast with earlier work on sodium caseinate gels2 as well as on acid skim milk gels,23, 24 the critical pH for the onset of gelation decreased with increasing temperature (Figure 2.6A). A possible explanation for this would be that with increase in temperature the Baxter parameter, τ, would also increase, which corresponds to a decrease in stickiness. A pH closer to the iso-electric point of the different caseins would thus be necessary to induce gelation at increasing temperature. Due to the inaccuracy of the light scattering experiment this was not established. However, it was shown that, corresponding with the rheological results, B2 steeply decreased between pH 5.5 and 5. After the onset of gelation, the protein molecules start to rearrange. The dynamic moduli G’ and G”, measured at 293 K, did not reach a plateau value in at least 60 hours but increased
Relation between stickiness and gelation behavior of sodium caseinate
23
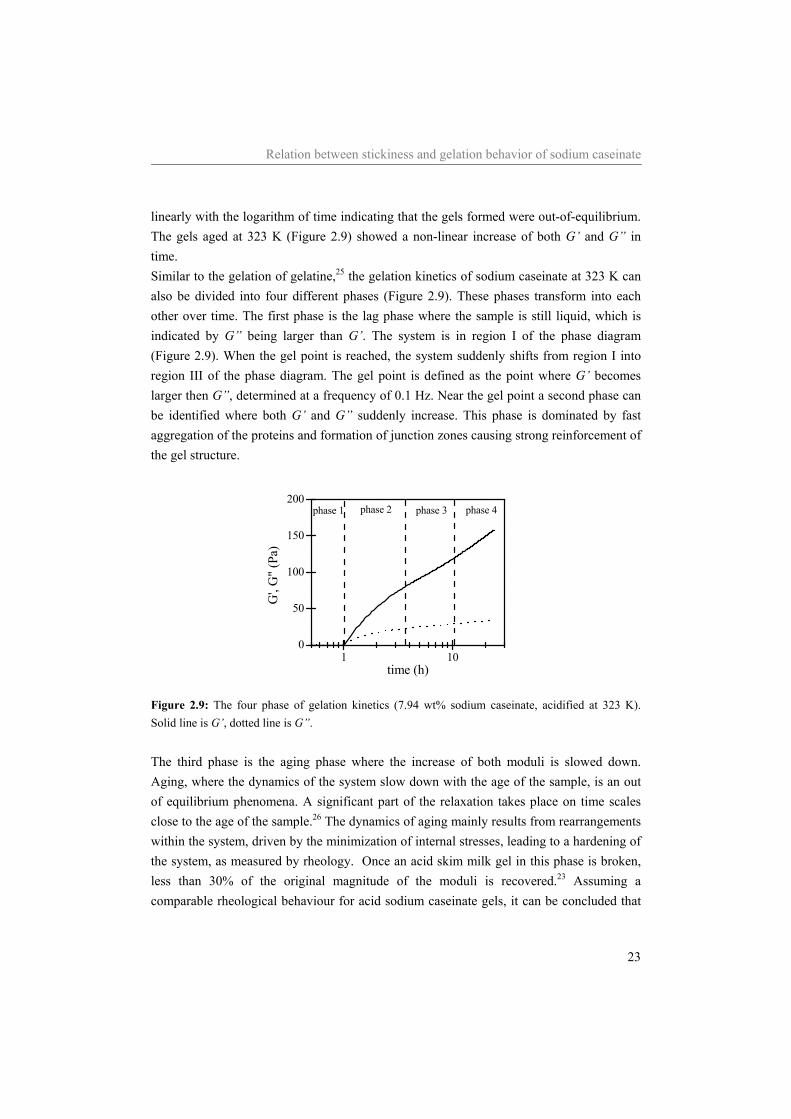
linearly with the logarithm of time indicating that the gels formed were out-of-equilibrium. The gels aged at 323 K (Figure 2.9) showed a non-linear increase of both G’ and G” in time. Similar to the gelation of gelatine,25 the gelation kinetics of sodium caseinate at 323 K can also be divided into four different phases (Figure 2.9). These phases transform into each other over time. The first phase is the lag phase where the sample is still liquid, which is indicated by G” being larger than G’. The system is in region I of the phase diagram (Figure 2.9). When the gel point is reached, the system suddenly shifts from region I into region III of the phase diagram. The gel point is defined as the point where G’ becomes larger then G”, determined at a frequency of 0.1 Hz. Near the gel point a second phase can be identified where both G’ and G” suddenly increase. This phase is dominated by fast aggregation of the proteins and formation of junction zones causing strong reinforcement of the gel structure.
1 100
50
100
150
200
phase 4phase 3phase 2phase 1
G',
G" (
Pa)
time (h)
Figure 2.9: The four phase of gelation kinetics (7.94 wt% sodium caseinate, acidified at 323 K). Solid line is G’, dotted line is G”. The third phase is the aging phase where the increase of both moduli is slowed down. Aging, where the dynamics of the system slow down with the age of the sample, is an out of equilibrium phenomena. A significant part of the relaxation takes place on time scales close to the age of the sample.26 The dynamics of aging mainly results from rearrangements within the system, driven by the minimization of internal stresses, leading to a hardening of the system, as measured by rheology. Once an acid skim milk gel in this phase is broken, less than 30% of the original magnitude of the moduli is recovered.23 Assuming a comparable rheological behaviour for acid sodium caseinate gels, it can be concluded that
Chapter 2
24
reinforcement of the gel in this phase is mainly caused by extension of existing cross-links and little by the formation of new ones. The gel rearranges into more stable conformations. In the fourth phase the slope of G’ versus the logarithm of time increased again. Contraction of the gel network is dominating in this phase, resulting in the exclusion of water; phase separation. The system slowly moves towards a more thermodynamic stable situation. The structure of the casein aggregates determines the ease of water removal from the gels. On a microscopic level, syneresis is most likely due to the strong Van der Waals attraction. Only three of these four phases were observed in the gelation kinetics at temperatures below 323 K. At those temperatures all processes were slowed down. With decreasing temperature, the rate of hydrolysis of GDL decreases and the duration of the different phases increased. The acidification was monitored for 24 hours, which was probably not long enough for the fourth phase to appear. 2.5.3.2 Scaling of the data with a fractal model The formed gels are in region III of the phase diagram (Figure 2.1) and the gel networks are considered to be a collection of fractal clusters, which are closely packed throughout the sample. As Figure 2.7 illustrates, the dependence of G’ on the protein concentration can be described with a power law (Equation 2.5), with an increasing exponent with temperature (Table 2.1). According to Roefs et al,27 acid caseinate gels have a particulate heterogeneous structure, consisting of fairly large conglomerates and holes.27 The gel strength depends on the concentration sodium caseinate, the time elapsed after the addition of GDL and on the acidification temperature. Increasing protein concentration as well as extending the time elapsed after the addition of GDL increased the gel strength. This is due to the formation of more contact points between the clusters and to reinforcement of the already existing ones. As long as the pH during the acidification decreases towards pH 4.6 (final pH of the caseinate gels), the attraction between the casein particles increases (Figure 2.3). At increasing temperature the gel strength decreases. The interactions between the aggregates, between a temperature of 293 K and a temperature of 323 K, as measured with light scattering, did not significantly change. However, due to the inaccuracy of the measurements at pH 4, it can not be concluded that the interaction is really independent on the temperature at this pH. The hydrophobic interactions between the casein molecules within and between the aggregates, which are most sensitive to changes in temperature, that monotonically increase with increasing temperature can lead to an increased number or
Relation between stickiness and gelation behavior of sodium caseinate
25
strength of hydrophobic bonds inside each aggregates (and also between the aggregates). This can cause shrinkage of the micelles, which results in a decrease of the voluminosity and smaller and perhaps also less contact points between the aggregates.2 A decrease of rg with temperature was not found, which can be caused by the presence of a few bigger particles which have a major influence on the rg measured. Shrinkage, with increasing temperature, can cause an overall decrease in gelstrength and a reduced fractal dimension. A reduction in the fractal dimension with increasing temperature was also found for acidification of skim milk.28 Twenty-four hours after the addition of GDL the temperature was decreased with 1 K/minute to a final temperature of 293 K. When the gels were cooled, the aggregates expanded and more contact points between different aggregates could be formed, resulting in an increase of both moduli. After a thermal equilibration of 30 minutes at a temperature of 293 K a strain sweep was performed. The maximum strain increased with the protein concentration according to a power law (Equation 2.6 and Table 2.1). Combining Equation 2.5 for the “final” gel strength (after cooling and thermal equilibration, A’ in Table 2.1) with Equation 2.6 for the maximum strain gives a way to determine the fractal dimension. Table 2.1 shows an increase of the fractal dimension with acidification temperature, meaning that the network became denser. Lucey et al.7 showed, with help of permeability experiments and CSLM pictures, a coarsening of the structure of acid caseinate gels with increasing acidification temperature, indicating that the fractal dimension of the gels decreases with temperature. Vétier et al.28 used light scattering to determine the fractal dimension of highly diluted skim milk. The fractal dimensions obtained at 293K was of the same order as ours, but their fractal dimensions also decreased with increasing temperature.28 The results of Lucey et al. and of Vétier et al. at first sight seem to be in contrast with our observations. However, our gels were cooled before the fractal dimension was determination, while others determined the fractal dimension at the acidification temperature. When the gels were cooled, the formed aggregates swelled and became more deformable. During swelling, more contact points were formed, leading to a denser structure, which resulted in an increase of the fractal dimension. Temperature is thus a good parameter to manipulate the final gel structure. Whether aggregation occurs or not depends on the pH. At the start of acidification, the rate of the hydrolyzes of GDL determines the gelation time. If the dissociation rate increases, the gelation time decreases. The fractal dimension of 2.38 at 293 K indicates that a dense network is formed. The parameter α introduced by Wu et al.18 defined the type of gel
Chapter 2
26
structure and is a measure for the strength of the intra and inter cluster links. However, the considered network is build of links between caseinate molecules, which are all assumed to be identical. This makes it impossible to make a distinction between intra and inter cluster links, which causes the parameter α not to have a physical meaning in the system used.
104 105100
101
102
103
104
A
T
a G *
G'
at * t
1 1010-1
100
101
102
103
104
B
a G, a
t
concentration sodium caseinate (wt%)
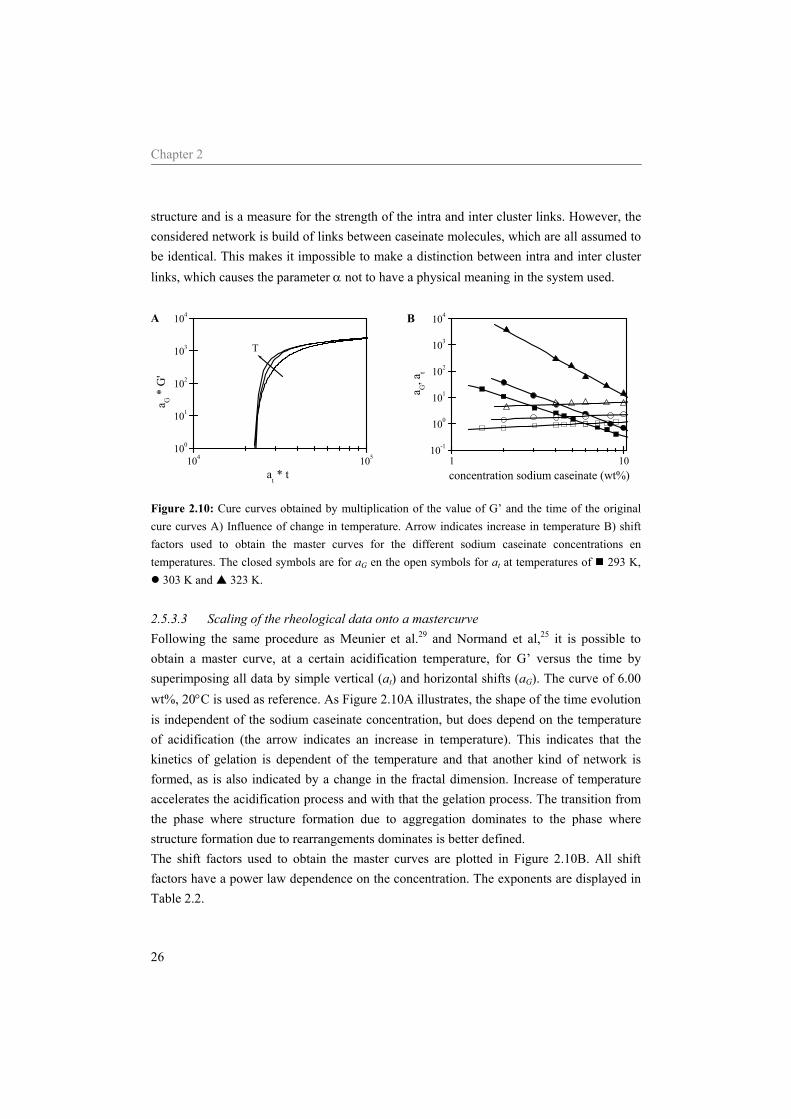
Figure 2.10: Cure curves obtained by multiplication of the value of G’ and the time of the original cure curves A) Influence of change in temperature. Arrow indicates increase in temperature B) shift factors used to obtain the master curves for the different sodium caseinate concentrations en temperatures. The closed symbols are for aG en the open symbols for at at temperatures of 293 K,
303 K and 323 K. 2.5.3.3 Scaling of the rheological data onto a mastercurve Following the same procedure as Meunier et al.29 and Normand et al,25 it is possible to obtain a master curve, at a certain acidification temperature, for G’ versus the time by superimposing all data by simple vertical (at) and horizontal shifts (aG). The curve of 6.00 wt%, 20°C is used as reference. As Figure 2.10A illustrates, the shape of the time evolution is independent of the sodium caseinate concentration, but does depend on the temperature of acidification (the arrow indicates an increase in temperature). This indicates that the kinetics of gelation is dependent of the temperature and that another kind of network is formed, as is also indicated by a change in the fractal dimension. Increase of temperature accelerates the acidification process and with that the gelation process. The transition from the phase where structure formation due to aggregation dominates to the phase where structure formation due to rearrangements dominates is better defined. The shift factors used to obtain the master curves are plotted in Figure 2.10B. All shift factors have a power law dependence on the concentration. The exponents are displayed in Table 2.2.
Relation between stickiness and gelation behavior of sodium caseinate
27
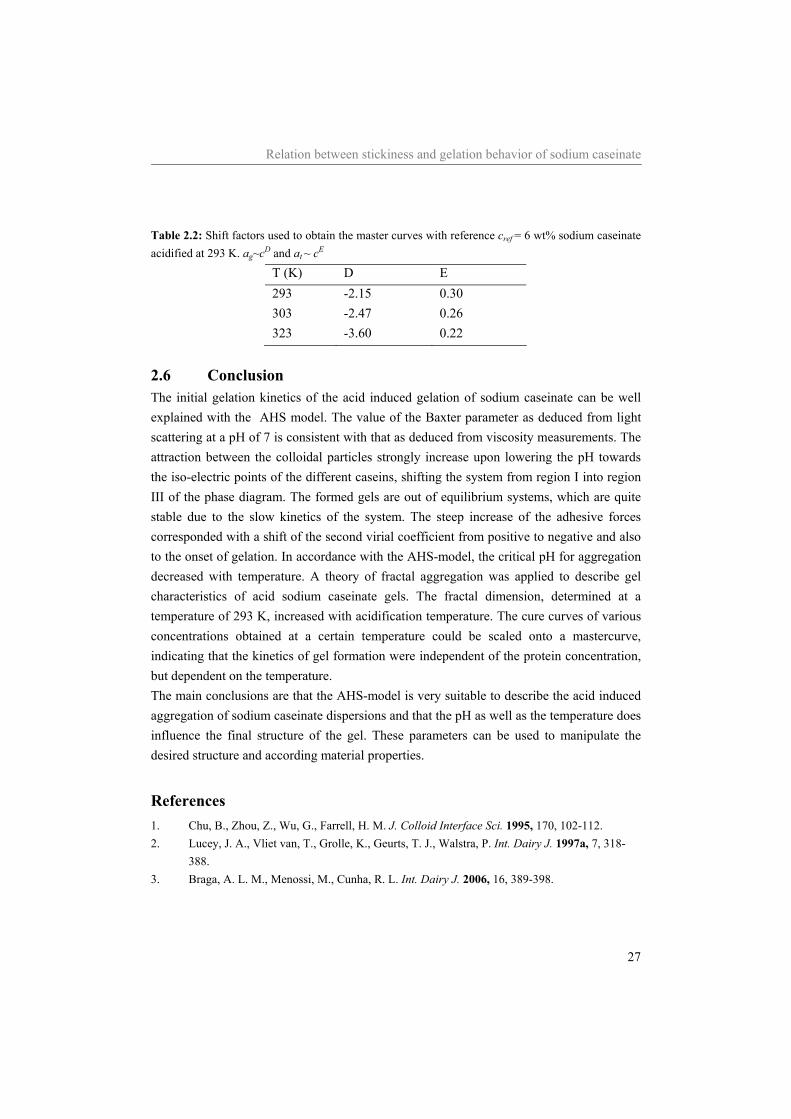
Table 2.2: Shift factors used to obtain the master curves with reference cref = 6 wt% sodium caseinate acidified at 293 K. ag~cD and at ~ cE
T (K) D E 293 -2.15 0.30 303 -2.47 0.26 323 -3.60 0.22
2.6 Conclusion The initial gelation kinetics of the acid induced gelation of sodium caseinate can be well explained with the AHS model. The value of the Baxter parameter as deduced from light scattering at a pH of 7 is consistent with that as deduced from viscosity measurements. The attraction between the colloidal particles strongly increase upon lowering the pH towards the iso-electric points of the different caseins, shifting the system from region I into region III of the phase diagram. The formed gels are out of equilibrium systems, which are quite stable due to the slow kinetics of the system. The steep increase of the adhesive forces corresponded with a shift of the second virial coefficient from positive to negative and also to the onset of gelation. In accordance with the AHS-model, the critical pH for aggregation decreased with temperature. A theory of fractal aggregation was applied to describe gel characteristics of acid sodium caseinate gels. The fractal dimension, determined at a temperature of 293 K, increased with acidification temperature. The cure curves of various concentrations obtained at a certain temperature could be scaled onto a mastercurve, indicating that the kinetics of gel formation were independent of the protein concentration, but dependent on the temperature. The main conclusions are that the AHS-model is very suitable to describe the acid induced aggregation of sodium caseinate dispersions and that the pH as well as the temperature does influence the final structure of the gel. These parameters can be used to manipulate the desired structure and according material properties.
References 1. Chu, B., Zhou, Z., Wu, G., Farrell, H. M. J. Colloid Interface Sci. 1995, 170, 102-112. 2. Lucey, J. A., Vliet van, T., Grolle, K., Geurts, T. J., Walstra, P. Int. Dairy J. 1997a, 7, 318-
388. 3. Braga, A. L. M., Menossi, M., Cunha, R. L. Int. Dairy J. 2006, 16, 389-398.
Chapter 2
28
4. Bremer, L. G. B., Bijsterbosch, B. H., Schrijvers, R., Vliet van, T., Walstra, P. Colloids and Surfaces 1990, 51, 159-170.
5. Roefs, S. P. F. M., Groot-Mostert de, A. E. A., Vliet van, T. Colloids and Surfaces 1990a, 50, 141-159.
6. Bremer, L. G. B., Bijsterbosch, B. H., Walstra, P., Vliet van, T. Adv. Colloid Interface Sci 1993, 46, 117-128.
7. Lucey, J. A., Vliet van, T., Grolle, K., Geurts, T. J., Walstra, P. Int. Dairy J. 1997b, 7, 389-397.
8. Kruif de, C. G. J. Dairy Sci. 1998, 81, 3019-3028. 9. Farrer, D., Lips, A. Int. Dairy J. 1999, 9, 281-286. 10. Reichl, L. E., A modern course in statistical physics: Chapter 11 Classical Fluids. Edward
Arnold LTD: Texas, 1980. 11. Baxter, R. J. J. Chem. Phys. 1968, 49, 2770-2774. 12. Chiew, Y. C., Glandt, E. D. J. Phys. A: Math. Gen. 1983, 16, 2599-2608. 13. Kruif de, C. G. J. Colloid Interface Sci. 1997, 185, 19-25. 14. Miller, M. A., Frenkel, D. J. Chem. Phys. 2004, 121, 535-545. 15. Woutersen, A. T. J. M., Kruif de, C. G. J. Chem. Phys. 1990, 94, 5739-5750. 16. Grant, M. C., Russel, W. B. Phys. Rev. E 1993, 47, 2606-2614. 17. Shih, W. H., Shih, W. Y., Kimm, S., Liu, J., Aksay, I. A. Phys. Rev. A 1999, 42, 4772-4779. 18. Wu, H., Morbidelli, M. Langmuir 2001, 17, 1030-1036. 19. Panouillé, M., Nicolai, T., Durand, D. Int. Dairy J. 2004, 14, 297-303. 20. Lucey, J. A., Srinivasan, M., Singh, H., Munro, P. A. J. Agric. Food Chem. 2000, 48, 1610-
1616. 21. Winter, H. H., Mours, M. Adv. Polym. Sci. 1997, 134, 165-234. 22. Prinssen, P., Odijk, T. J. Chem. Phys. 2004, 121, 6225-6537. 23. Arshad, M., Paulssson, M., Dejmek, P. J. Dairy Sci. 1993, 76, 3310-3316. 24. Vétier, N., Banon, S., Chardot, V., Hardy, J. J. Dairy Sci. 2003, 86, 2504-2507. 25. Normand, V., Muller, S., Ravey, J. C., Parker, A. Macromolecules 2000, 33, 1063-1071. 26. Ramos, L., Cipelletti, L. Phys. Rev. Lett. 2001, 87, 245503. 27. Roefs, S. P. F. M., Vliet van, T. Colloids and Surfaces 1990b, 50, 161-175. 28. Vétier, N., Desobry-Banon, S., Ould Eleya, M. M., Hardy, J. J. Dairy Sci. 1997, 80, 3161. 29. Meunier, V., Nicolai, T., Durand, D., Parker, A. Macromolecules 1999, 32, 2610-2616.
*H.G.M Ruis, P. Venema and E. van der Linden, submitted for publication
3 Aggregation of sodium caseinate as studied by
diffusing wave spectroscopy * Abstract Aggregation and gelation are important during the processing and structure formation of all kind of products. In dairy products casein is mainly responsible for the different final structures. In this chapter DWS is used to study the acidification of sodium caseinate. The application of DWS to study such a, food related, system en the assumptions needed in order to interpret the data are emphasized. Upon acidification, a gradual growth of the sodium caseinate aggregates is found. At pH 5.4 the aggregates are grown large enough to affect the DWS-measurements. At pH values below approximately 5.05 a fast growth of the sodium caseinate aggregate size is observed together with a decrease of the mobility of the scattering particles. At pH 5.0 the scatterers of all samples are caged due to the formation of a network by sodium caseinate. The gel point of the system was determined as the point where the loss tangent is frequency independent. This point coincided with the ergodic to non-ergodic transition. At the gel point our data strongly indicate that the system used can not on all length scaled be characterized with a single fractal dimension.
Chapter 3
30
3.1 Introduction Proteins can be used to control the structure and structure formation in a variety of products. In dairy products like milk, yogurt, quark and cheese, casein molecules are the structure forming components. With respect to their structure forming properties, caseins are, amongst others, sensitive to calcium (αS1-, αS2- and β-casein)1 and to the pH. In milk casein is, due to the presence of calcium phosphate, associated in (historically called) micelles with a radius of approximately 100 nm.2 Upon removal of the calcium phosphate, which is located inside the micelles, the micellar structure falls apart and due to the interaction of the individual casein molecules with each other, an equilibrium between monomers and associated structures with a radius of approximately 10 nm remains.3 In sodium caseinate these small aggregates exist in equilibrium with monomers. Adjustment of the pH of sodium caseinate solutions towards the iso-electric point of sodium caseinate (~pH 4.6) causes a change in the interaction between the sodium caseinates from being repulsive, at a pH above ~5.1, to attractive, at a pH smaller than ~5.1. At a pH smaller than 5.1 fast flocculation of sodium caseinate is induced. Slow adjustment of the pH of sodium caseinate solutions towards pH 4.6 causes a sol to gel transition.4-7 The transition point, also called the gel point, is in general defined by a frequency independent loss tangent.8 However, as shown in the previous chapter,9 for acidifying sodium caseinate dispersions, this definition of the gel point turned out to be experimentally inaccessible by rheology. Due to the limited accuracy of the rheometer used it was not possible to follow the structure development of the acidifying sodium caseinate dispersion up to the sol to gel transition. Most other methods often used to characterize the initial structure development are highly intrusive, which is problematic when studying fragile structural development. Diffusing wave spectroscopy (DWS) is a light scattering technique, especially suited for non-diluted, turbid samples. With DWS, the intensity fluctuations of the multiple scattered light (required condition), which are due to the Brownian motion of the scatterers, are analyzed. The scatterers are the particles that are responsible for the turbid appearance of the samples. Because DWS measurements reflect the motion of the scattering particles, it can provide valuable information on the extent and kinetics of the gelation process.10 Since only an external strain of order kT (caused by the Brownian motion of the scatterers) is applied to the sample, DWS is able to follow the structure development without disruption of the structure of the sample. DWS has frequently been used to study the structure formation during the acidification of skim milk.11-14 In skim milk the motion of the casein micelles is monitored. A shift of the autocorrelation curve to longer decay times was observed upon acidification. From the
Aggregation of sodium caseinate as studied by DWS
31
measured intensity autocorrelation function the mean square displacement was deduced. Simultaneously with the shift of the autocorrelation curves, the exponent obtained from a power law fit of the mean square displacement, decreased from 1 to 0.7. This decrease coincided with an increase in the viscoelastic moduli.12 Special attention was given to the effect of acidification on the transport mean free path, l*, in relation to the particle size of the scatterers.14, 15 So far, the technique has never been used to study sodium caseinate solutions. In this work DWS experiments are performed in order to follow the structure development of the acid induced gelation of sodium caseinate solution. Since turbid solutions are necessary to perform DWS and sodium caseinate solutions at neutral pH are rather transparant, tracer particles were added as scatterers. With decreasing pH, a slight increase in the turbidity of acidifying sodium caseinate solutions was found at a pH of ~5.4, indicating an increase in the size of the sodium caseinate aggregates. At a pH of ~5.1 a strong decrease of the mobility of the scatterers and an increase of the size of the sodium caseinate aggregates was observed. At a pH of ~5.0 all solutions formed a network in which the scatterers were confined. The gel point of the clusters was determined by a frequency independent loss tangent. Subsequently the radius of the clusters at the gel point was determined. The size decreased with increasing sodium caseinate concentration. From the data the fractal dimension of the clusters and of the network were estimated.
3.2 Materials and Methods 3.2.1 Materials Sodium caseinate, with a protein content over 90%, was obtained from DMV International (Veghel, the Netherlands). The latex used consisted of polystyrene beads with a diameter of 892 nm (ICI AgroChemicals, Tealott’s Hill). Glucono-δ-lactone, GDL, was obtained from Fluka, Riedel de Haën (Buch, Switzerland) and thiomersal from Merck (Schuchart, Germany). Sunflower oil (Reddy, Vandemoortele, the Netherlands) was obtained from a local retailer and 1-bromo-octane from Fluka Chemika (Buchs, Switzerland). 3.2.2 Sample preparation Solutions of sodium caseinate were prepared by dissolving the required amount of sodium caseinate in demineralized water, followed by gently stirring overnight at 4°C. All samples contained 0.02 wt% thiomersal to prevent bacterial spoilage.
Chapter 3
32
A stock emulsion containing 0.7 wt% sodium caseinate and 10 wt% oil (consisting of a mixture of 50% sunflower oil and 50% 1-bromo-octane) was prepared by mixing the oil into a sodium caseinate solution using an Ultra Turrax (Polytron, Switzerland). Subsequently this pre-emulsion was homogenized by at least 10 passes through a lab-scale homogenizer (Delta Instruments, Drachten, The Netherlands) operating at a pressure of 60 bar. The stock emulsion had a d3,2 value of 0.56 μm as determined from laser diffraction (Coulter LS 230, Miami, USA). The emulsion droplets had approximately the same density as the continuous phase, which prevented creaming instabilities. Acid induced gelation of the samples was induced by the addition of 0.15 gram GDL granules per gram sodium caseinate. The samples were stirred for 1 minute to dissolve the GDL granules. A pH of 4.6 ± 0.1 was reached within 10 hours after the addition of GDL. The development of the pH in time was monitored at room temperature. For the DWS-experiments, either latex spheres or emulsion droplets were added to the sodium caseinate solutions, to a final concentration of approximately 0.5 vol% or 1 wt% respectively, to serve as tracer particles. 3.2.3 Viscosity The viscosity of the sodium caseinate solutions was determined as a function of protein concentration with the use of Ubbelohde viscometers. The Ubblelohdes were thermally equilibrated at 20°C in a water bath. 3.2.4 Rheology Dynamic measurements were carried out using a Paar Physica MCR 300 (Anton Paar, Austria) stress-controlled rheometer, operating in the strain-controlled mode through a feedback loop. A Couette geometry (CC17) with a gap size of 0.71 mm was used. The acid induced gelation was followed at a temperature of 20°C at low strain (0.5 %) and low frequency (0.1 Hz). 3.2.5 DWS DWS experiments were performed in transmission mode at room temperature. Samples were contained in flat-faced glass cells with an optical path length of 4.96 mm. The samples were illuminated with an expanded laser beam (3.0 mm diameter) from a HeNe-laser (20mW) operating at a wavelength of 633 nm. The tracer particles, latex beads or emulsion droplets, caused multiple scattering of the light. The multiply scattered light transmitted through the cell was collected, after passing a polarizer with its polarization direction
Aggregation of sodium caseinate as studied by DWS
33
perpendicular to the incident light, with a singe-mode optical fiber. The signal was equally spit into two by a polarization cube and directed into two separate photomultiplier tubes (ALV / SO-SIPD, ALV, Germany). The output of these two tubes was cross-correlated using an ALV-6010 correlator (ALV, Germany), to obtain the autocorrelation function. A latex sample with known l* (photon transport mean free path) was used as a reference sample. 3.2.6 Theory DWS DWS measures the intensity autocorrelation function of multiply scattered light, ( )tg2 , as a
function of time. The photons of the light scattered by the system are supposed to be completely randomized and their paths are described by diffusion theory. Furthermore, all scattering events are approached by an average scattering event.16 In ergodic systems ( )tg 2
is related to the motion of the scatterers by the following equation, where the last equality follows from the Siegert relation.17
( ) ( ) ( ) ( ) 21
2
0
2202 3
11 tgds*lstrkexpsPtg βΔβ =⎟
⎟⎠
⎞⎜⎜⎝
⎛⎟⎠⎞
⎜⎝⎛−=− ∫
∞
[ 3.1 ]
In this equation is β a constant determined primarily by the collection optics, P(s) is the path-length distribution function of paths of length s, λπnk 20 = with n the refractive
index of the solvent and λ the wavelength of the laser, ( )tr2Δ is the mean square
displacement of the scatterers and l* is the photon transport mean free path which is related to the mean free path of photons between scattering events (l).14 For unhindered diffusive
colloidal motion we have ( ) Dttr 62 =Δ where the self-diffusion coefficient is given by
aTk
D B
πη6= , with Bk the constant of Boltzmann, T the absolute temperature, η the
viscosity of the continuous phase and a the radius of the scatterers.
The short time behavior of ( )tr2Δ , corresponding to the initial decay of the
autocorrelation function, is a reflection of the viscoelasticity of the sample and can be
described as a power law ( )( )pttr ≈2Δ .18-20 For thermally-driven spheres, the exponent p
must lie between zero, corresponding to pure elastic confinement, and one, corresponding to pure viscous diffusion.21
Chapter 3
34
The path length distribution function, ( )sP , of equation 3.1 depends on the geometry used.
It has been shown that for a transmission geometry, using an incident beam of arbitrary width, equation 1 reduces to the following expression:16
( ) ( )( ) ( ) ( )∫∞
−−−−=Q
Q de,,DeCtg ξξζεξ ξζδξ 141
222 [ 3.2 ]
In this equation ( ) τt*l/LQ 6≡ ; L*l 32≡ε ; L*lLz ≈≡ 0ζ and Ld≡δ . L is the
optical pathlength, l* is the photon transport mean free path, τ is a characteristic autocorrelation time which is related to the Brownian motion of the particles
( ) ⎟⎠⎞⎜
⎝⎛ =
−120 Dkτ , d the Gaussian diameter of the illuminating light beam and C is a
normalization constant chosen so that ( ) 101 =g . The function ( )ζεξ ,,D is given by:
( ) ( ) ( )[ ]( ) ( ) ξ
ζξ
εξεξεξεξεζεξ
222
2
11112
−
−
−−+
−−+=
ee,,D [ 3.3 ]
The storage and loss modulus were calculated using an algebraic method, as introduced by Mason,21 which assumes a local power law expansion of the mean square displacement.
3.3 Results and discussion 3.3.1 Determination l* An important parameter for DWS is the photon transport mean free path, l*. The sample used as reference contained latex beads, with a bead size of 892 nm, dispersed in water. The photon transport mean free path, l*, of the sample can be determined in various ways. The parameter can theoretically be calculated from Mie scattering theory16 but can also be experimentally determined. In this work l* of the reference cell was determined in two different experimental ways. First by determining the transmitted intensity of a turbid sample as a function of the optical pathlength (L). When L>l* the measured transmitted intensity scales as L*lT ≈ . At large
l*/L this scaling is no longer applicable.16 At the transition point the optical pathlength L is equal to l*. The second method consists of a fit of equation 3.2 with the measured autocorrelation function. Because the viscosity of the reference sample and particle size of the latex beads and thusτ are known, l* remains the only fitting parameter. Both experimental methods gave a comparable result which was also in agreement with the theoretical value.16
Aggregation of sodium caseinate as studied by DWS
35
Assuming a diffusive propagation of the light, the value of l* of an unknown sample can be determined using the average intensity of the transmitted light of the sample combined with the transmission, T, of a reference sample with known l* by:13, 15, 22-24
L*lL*l
IIT
34135
0 +== [ 3.4 ]
In this equation I0 and I are the initial and transmitted intensities of the light respectively. 3.3.2 Zero shear viscosity DWS can be used to calculate the diffusion coefficient of a sample, which can be used to calculate either the viscosity or the particle size. As a control the viscosity of sodium caseinate solutions at neutral pH was determined using an Ubbelohde and using DWS. Figure 3.1 shows the viscosity of sodium caseinate solutions determined using both techniques. The solutions used in the Ubbelohdes contained only sodium caseinate while for the DWS measurements approximately 0.5 vol% latex beads (approximately monodisperse) were added to the sodium caseinate solutions. Using DWS, a fit of the autocorrelation curve and l* with equation 3.2 yields the diffusion coefficient, from which the viscosity was calculated. As is illustrated in Figure 3.1, good agreement is found for the viscosity as a function of the concentration sodium caseinate determined by the two completely different techniques. Figure 3.1 shows that the addition of latex hardly influenced the viscosity of the system. This is in good approximation described by:25
φη 521 .r += [ 3.5 ]
where rη is the relative viscosity of the dispersion and φ is the volume fraction of the
dispersed phase. An important difference between both techniques is that using DWS no external flow is applied to the sample, meaning that the zero shear viscosity is measured. The zero shear viscosity of a solution using an Ubbelohde can only be obtained by extrapolation of the flow rate through the capillary to zero. The viscosity obtained using both techniques can thus only be identical for extrapolation of the shear flow to zero or for liquids with a Newtonian rheological behavior, as is most likely the case for the sodium caseinate solutions used.
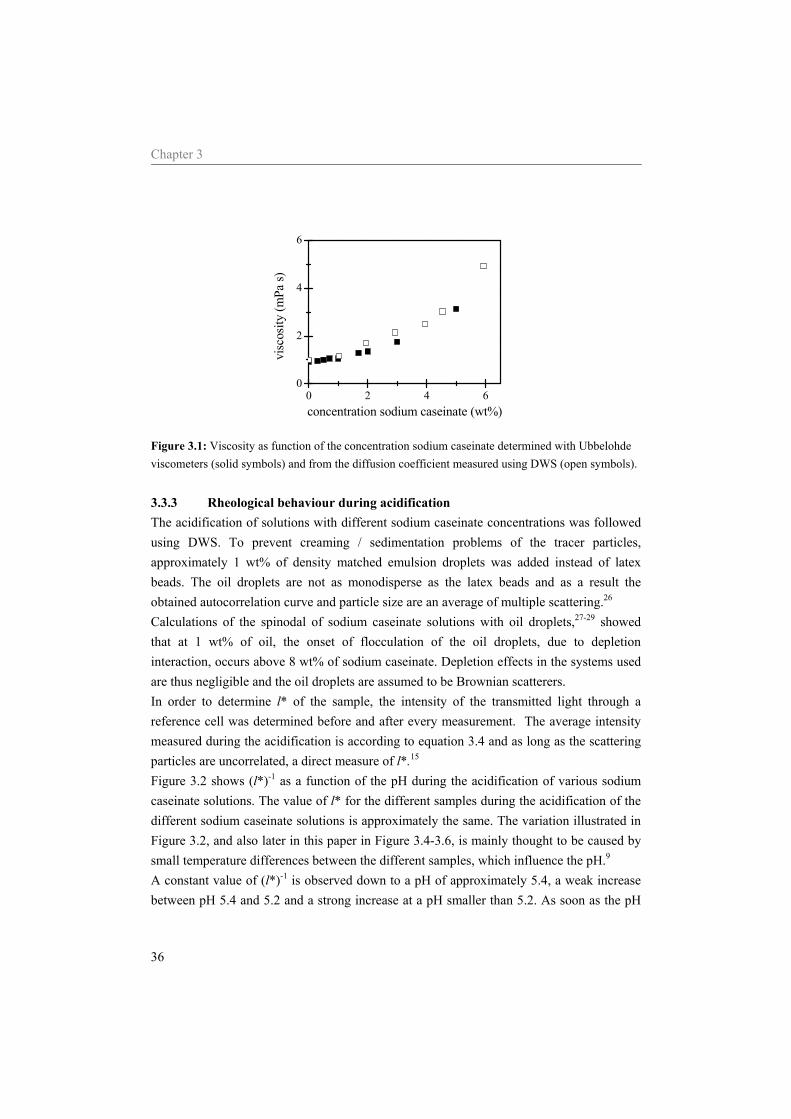
Chapter 3
36
0 2 4 60
2
4
6
visc
osity
(mPa
s)
concentration sodium caseinate (wt%)
Figure 3.1: Viscosity as function of the concentration sodium caseinate determined with Ubbelohde viscometers (solid symbols) and from the diffusion coefficient measured using DWS (open symbols). 3.3.3 Rheological behaviour during acidification The acidification of solutions with different sodium caseinate concentrations was followed using DWS. To prevent creaming / sedimentation problems of the tracer particles, approximately 1 wt% of density matched emulsion droplets was added instead of latex beads. The oil droplets are not as monodisperse as the latex beads and as a result the obtained autocorrelation curve and particle size are an average of multiple scattering.26 Calculations of the spinodal of sodium caseinate solutions with oil droplets,27-29 showed that at 1 wt% of oil, the onset of flocculation of the oil droplets, due to depletion interaction, occurs above 8 wt% of sodium caseinate. Depletion effects in the systems used are thus negligible and the oil droplets are assumed to be Brownian scatterers. In order to determine l* of the sample, the intensity of the transmitted light through a reference cell was determined before and after every measurement. The average intensity measured during the acidification is according to equation 3.4 and as long as the scattering particles are uncorrelated, a direct measure of l*.15 Figure 3.2 shows (l*)-1 as a function of the pH during the acidification of various sodium caseinate solutions. The value of l* for the different samples during the acidification of the different sodium caseinate solutions is approximately the same. The variation illustrated in Figure 3.2, and also later in this paper in Figure 3.4-3.6, is mainly thought to be caused by small temperature differences between the different samples, which influence the pH.9 A constant value of (l*)-1 is observed down to a pH of approximately 5.4, a weak increase between pH 5.4 and 5.2 and a strong increase at a pH smaller than 5.2. As soon as the pH
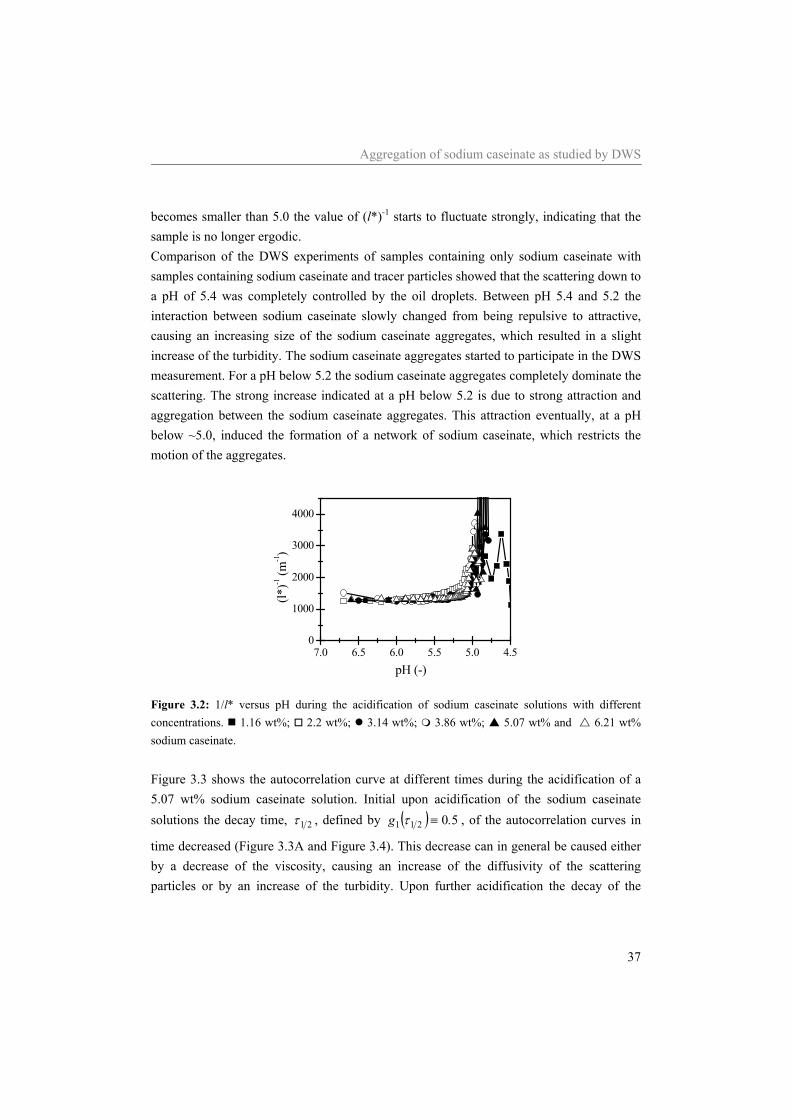
Aggregation of sodium caseinate as studied by DWS
37
becomes smaller than 5.0 the value of (l*)-1 starts to fluctuate strongly, indicating that the sample is no longer ergodic. Comparison of the DWS experiments of samples containing only sodium caseinate with samples containing sodium caseinate and tracer particles showed that the scattering down to a pH of 5.4 was completely controlled by the oil droplets. Between pH 5.4 and 5.2 the interaction between sodium caseinate slowly changed from being repulsive to attractive, causing an increasing size of the sodium caseinate aggregates, which resulted in a slight increase of the turbidity. The sodium caseinate aggregates started to participate in the DWS measurement. For a pH below 5.2 the sodium caseinate aggregates completely dominate the scattering. The strong increase indicated at a pH below 5.2 is due to strong attraction and aggregation between the sodium caseinate aggregates. This attraction eventually, at a pH below ~5.0, induced the formation of a network of sodium caseinate, which restricts the motion of the aggregates.
7.0 6.5 6.0 5.5 5.0 4.50
1000
2000
3000
4000
(l*)-1
(m-1)
pH (-)
Figure 3.2: 1/l* versus pH during the acidification of sodium caseinate solutions with different concentrations. 1.16 wt%; 2.2 wt%; 3.14 wt%; 3.86 wt%; 5.07 wt% and 6.21 wt% sodium caseinate. Figure 3.3 shows the autocorrelation curve at different times during the acidification of a 5.07 wt% sodium caseinate solution. Initial upon acidification of the sodium caseinate solutions the decay time, 21τ , defined by ( ) 50211 .g ≡τ , of the autocorrelation curves in
time decreased (Figure 3.3A and Figure 3.4). This decrease can in general be caused either by a decrease of the viscosity, causing an increase of the diffusivity of the scattering particles or by an increase of the turbidity. Upon further acidification the decay of the
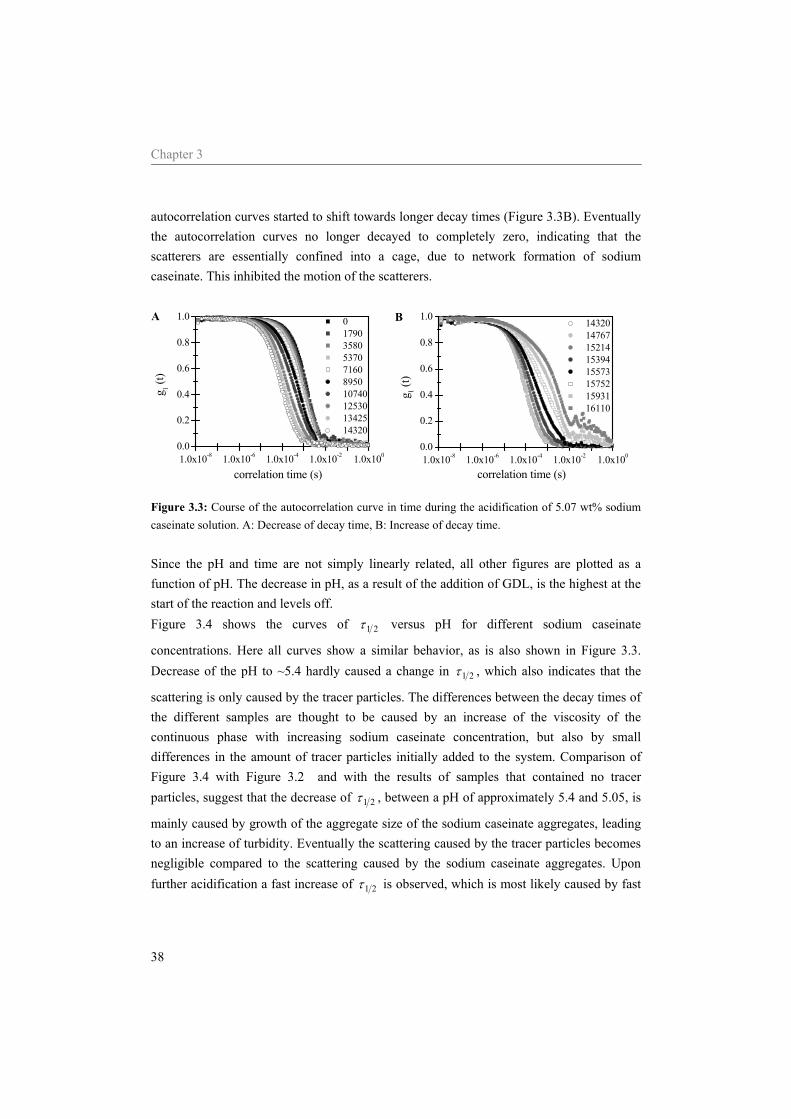
Chapter 3
38
autocorrelation curves started to shift towards longer decay times (Figure 3.3B). Eventually the autocorrelation curves no longer decayed to completely zero, indicating that the scatterers are essentially confined into a cage, due to network formation of sodium caseinate. This inhibited the motion of the scatterers.
1.0x10⁻⁸ 1.0x10⁻⁶ 1.0x10⁻⁴ 1.0x10⁻² 1.0x1000.0
0.2
0.4
0.6
0.8
1.0A
g 1 (t)
correlation time (s)
0 1790 3580 5370 7160 8950 10740 12530 13425 14320
1.0x10⁻⁸ 1.0x10⁻⁶ 1.0x10⁻⁴ 1.0x10⁻² 1.0x1000.0
0.2
0.4
0.6
0.8
1.0B
g 1 (t)
correlation time (s)
14320 14767 15214 15394 15573 15752 15931 16110
Figure 3.3: Course of the autocorrelation curve in time during the acidification of 5.07 wt% sodium caseinate solution. A: Decrease of decay time, B: Increase of decay time. Since the pH and time are not simply linearly related, all other figures are plotted as a function of pH. The decrease in pH, as a result of the addition of GDL, is the highest at the start of the reaction and levels off. Figure 3.4 shows the curves of 21τ versus pH for different sodium caseinate
concentrations. Here all curves show a similar behavior, as is also shown in Figure 3.3. Decrease of the pH to ~5.4 hardly caused a change in 21τ , which also indicates that the
scattering is only caused by the tracer particles. The differences between the decay times of the different samples are thought to be caused by an increase of the viscosity of the continuous phase with increasing sodium caseinate concentration, but also by small differences in the amount of tracer particles initially added to the system. Comparison of Figure 3.4 with Figure 3.2 and with the results of samples that contained no tracer particles, suggest that the decrease of 21τ , between a pH of approximately 5.4 and 5.05, is
mainly caused by growth of the aggregate size of the sodium caseinate aggregates, leading to an increase of turbidity. Eventually the scattering caused by the tracer particles becomes negligible compared to the scattering caused by the sodium caseinate aggregates. Upon further acidification a fast increase of 21τ is observed, which is most likely caused by fast
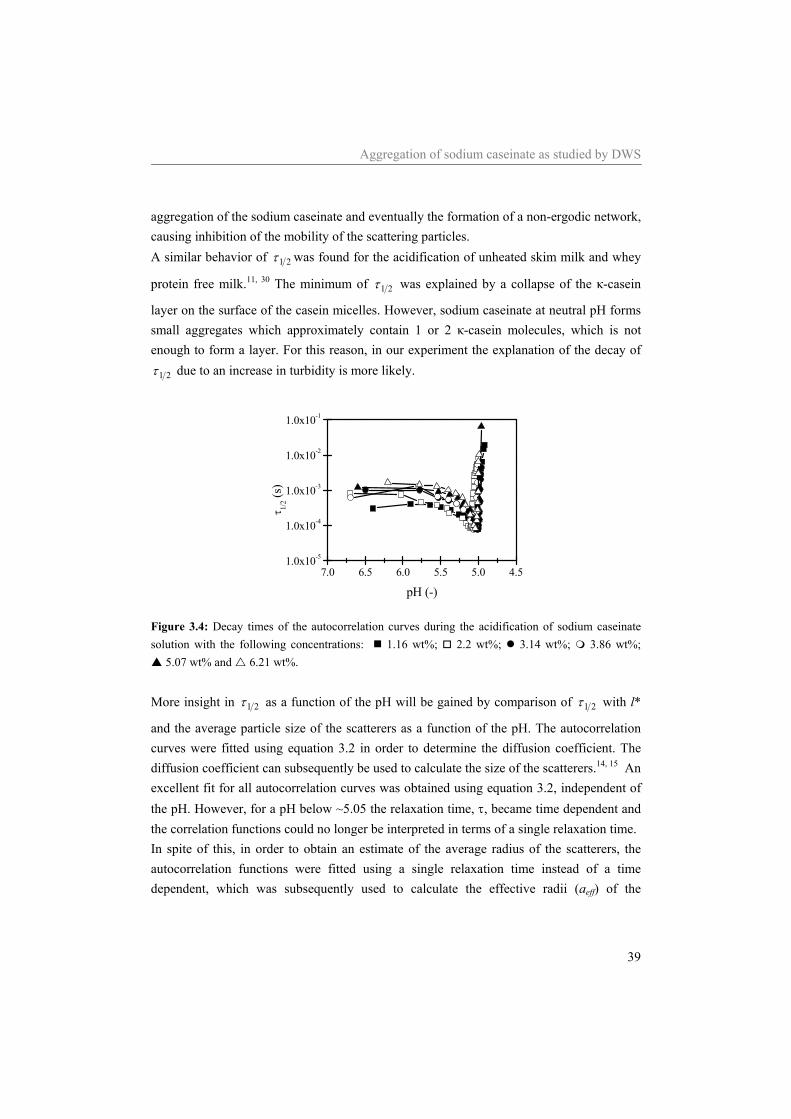
Aggregation of sodium caseinate as studied by DWS
39
aggregation of the sodium caseinate and eventually the formation of a non-ergodic network, causing inhibition of the mobility of the scattering particles. A similar behavior of 21τ was found for the acidification of unheated skim milk and whey
protein free milk.11, 30 The minimum of 21τ was explained by a collapse of the κ-casein
layer on the surface of the casein micelles. However, sodium caseinate at neutral pH forms small aggregates which approximately contain 1 or 2 κ-casein molecules, which is not enough to form a layer. For this reason, in our experiment the explanation of the decay of
21τ due to an increase in turbidity is more likely.
7.0 6.5 6.0 5.5 5.0 4.51.0x10-5
1.0x10⁻⁴
1.0x10⁻³
1.0x10⁻²
1.0x10⁻¹
τ 1/2 (s
)
pH (-)
Figure 3.4: Decay times of the autocorrelation curves during the acidification of sodium caseinate solution with the following concentrations: 1.16 wt%; 2.2 wt%; 3.14 wt%; 3.86 wt%;
5.07 wt% and 6.21 wt%. More insight in 21τ as a function of the pH will be gained by comparison of 21τ with l*
and the average particle size of the scatterers as a function of the pH. The autocorrelation curves were fitted using equation 3.2 in order to determine the diffusion coefficient. The diffusion coefficient can subsequently be used to calculate the size of the scatterers.14, 15 An excellent fit for all autocorrelation curves was obtained using equation 3.2, independent of the pH. However, for a pH below ~5.05 the relaxation time, τ, became time dependent and the correlation functions could no longer be interpreted in terms of a single relaxation time. In spite of this, in order to obtain an estimate of the average radius of the scatterers, the autocorrelation functions were fitted using a single relaxation time instead of a time dependent, which was subsequently used to calculate the effective radii (aeff) of the
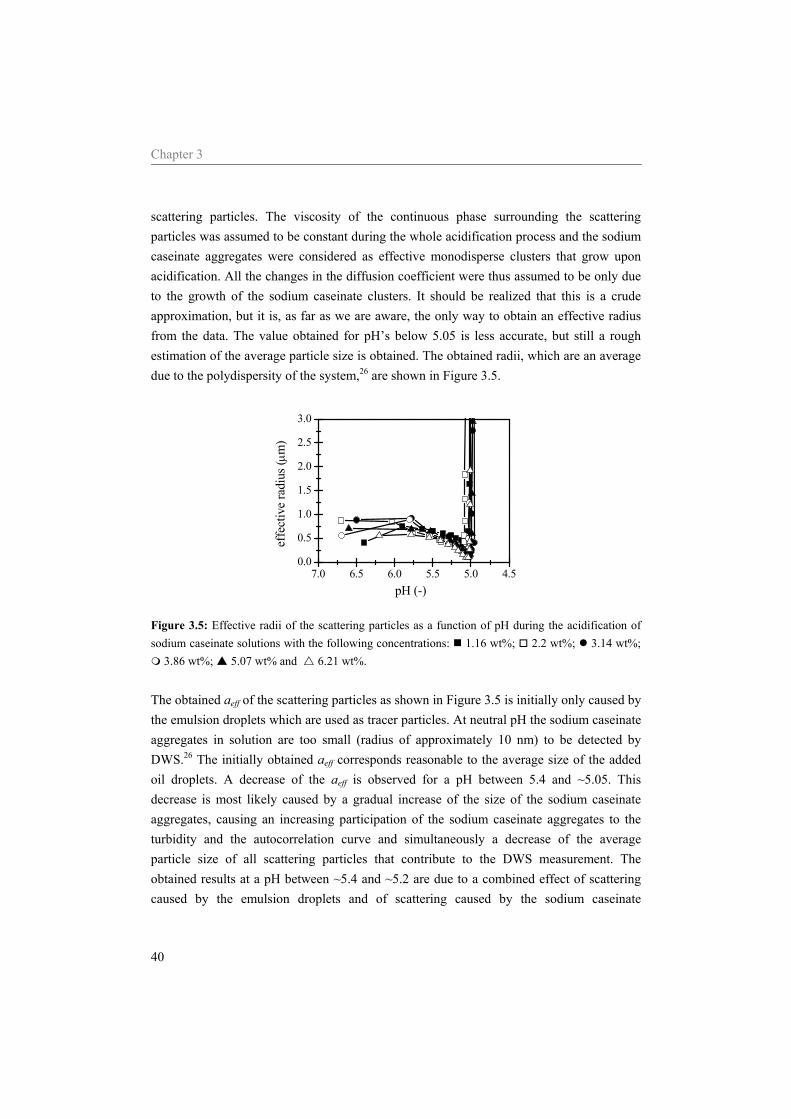
Chapter 3
40
scattering particles. The viscosity of the continuous phase surrounding the scattering particles was assumed to be constant during the whole acidification process and the sodium caseinate aggregates were considered as effective monodisperse clusters that grow upon acidification. All the changes in the diffusion coefficient were thus assumed to be only due to the growth of the sodium caseinate clusters. It should be realized that this is a crude approximation, but it is, as far as we are aware, the only way to obtain an effective radius from the data. The value obtained for pH’s below 5.05 is less accurate, but still a rough estimation of the average particle size is obtained. The obtained radii, which are an average due to the polydispersity of the system,26 are shown in Figure 3.5.
7.0 6.5 6.0 5.5 5.0 4.50.0
0.5
1.0
1.5
2.0
2.5
3.0
effe
ctiv
e ra
dius
(μm
)
pH (-)
Figure 3.5: Effective radii of the scattering particles as a function of pH during the acidification of sodium caseinate solutions with the following concentrations: 1.16 wt%; 2.2 wt%; 3.14 wt%;
3.86 wt%; 5.07 wt% and 6.21 wt%. The obtained aeff of the scattering particles as shown in Figure 3.5 is initially only caused by the emulsion droplets which are used as tracer particles. At neutral pH the sodium caseinate aggregates in solution are too small (radius of approximately 10 nm) to be detected by DWS.26 The initially obtained aeff corresponds reasonable to the average size of the added oil droplets. A decrease of the aeff is observed for a pH between 5.4 and ~5.05. This decrease is most likely caused by a gradual increase of the size of the sodium caseinate aggregates, causing an increasing participation of the sodium caseinate aggregates to the turbidity and the autocorrelation curve and simultaneously a decrease of the average particle size of all scattering particles that contribute to the DWS measurement. The obtained results at a pH between ~5.4 and ~5.2 are due to a combined effect of scattering caused by the emulsion droplets and of scattering caused by the sodium caseinate
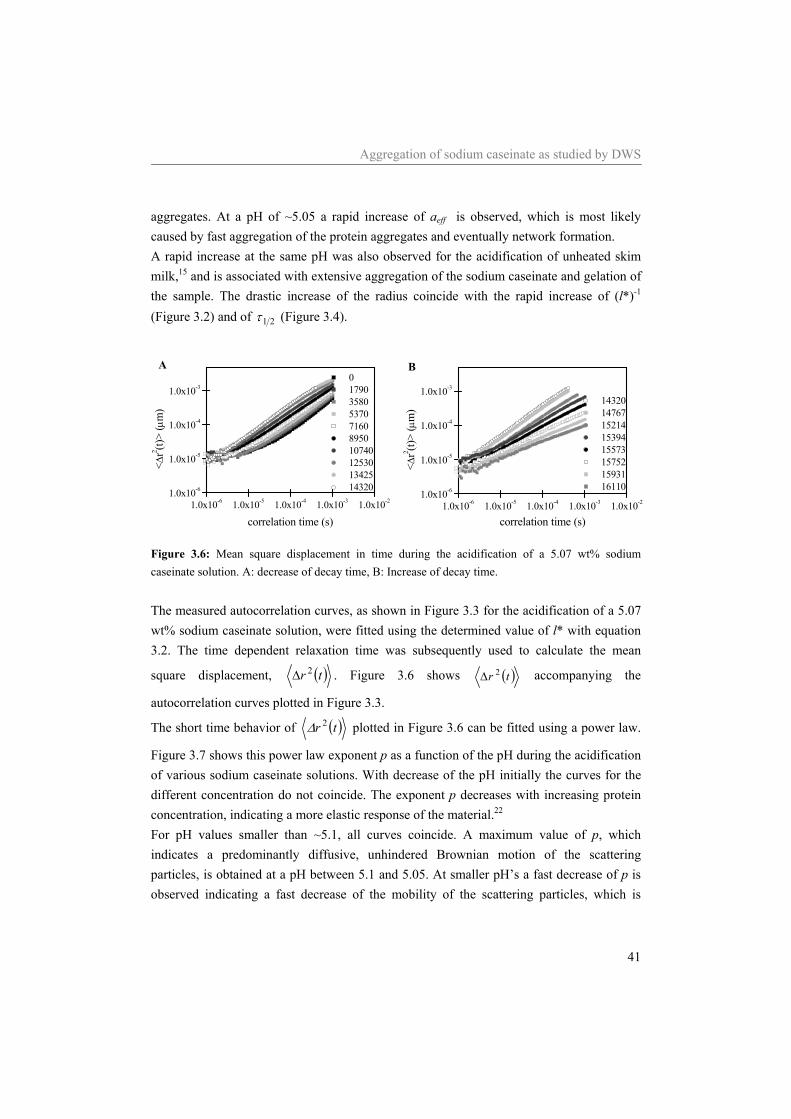
Aggregation of sodium caseinate as studied by DWS
41
aggregates. At a pH of ~5.05 a rapid increase of aeff is observed, which is most likely caused by fast aggregation of the protein aggregates and eventually network formation. A rapid increase at the same pH was also observed for the acidification of unheated skim milk,15 and is associated with extensive aggregation of the sodium caseinate and gelation of the sample. The drastic increase of the radius coincide with the rapid increase of (l*)-1 (Figure 3.2) and of 21τ (Figure 3.4).
1.0x10⁻⁶ 1.0x10⁻⁵ 1.0x10⁻⁴ 1.0x10⁻³ 1.0x10-21.0x10-6
1.0x10⁻⁵
1.0x10⁻⁴
1.0x10⁻³
A
<Δr2 (t)
> (μ
m)
correlation time (s)
0 1790 3580 5370 7160 8950 10740 12530 13425 14320
1.0x10⁻⁶ 1.0x10⁻⁵ 1.0x10⁻⁴ 1.0x10⁻³ 1.0x10-21.0x10-6
1.0x10⁻⁵
1.0x10⁻⁴
1.0x10⁻³
B
<Δr2 (t)
> (μ
m)
correlation time (s)
14320 14767 15214 15394 15573 15752 15931 16110
Figure 3.6: Mean square displacement in time during the acidification of a 5.07 wt% sodium caseinate solution. A: decrease of decay time, B: Increase of decay time. The measured autocorrelation curves, as shown in Figure 3.3 for the acidification of a 5.07 wt% sodium caseinate solution, were fitted using the determined value of l* with equation 3.2. The time dependent relaxation time was subsequently used to calculate the mean
square displacement, ( )tr 2Δ . Figure 3.6 shows ( )tr 2Δ accompanying the
autocorrelation curves plotted in Figure 3.3.
The short time behavior of ( )tr 2Δ plotted in Figure 3.6 can be fitted using a power law.
Figure 3.7 shows this power law exponent p as a function of the pH during the acidification of various sodium caseinate solutions. With decrease of the pH initially the curves for the different concentration do not coincide. The exponent p decreases with increasing protein concentration, indicating a more elastic response of the material.22 For pH values smaller than ~5.1, all curves coincide. A maximum value of p, which indicates a predominantly diffusive, unhindered Brownian motion of the scattering particles, is obtained at a pH between 5.1 and 5.05. At smaller pH’s a fast decrease of p is observed indicating a fast decrease of the mobility of the scattering particles, which is
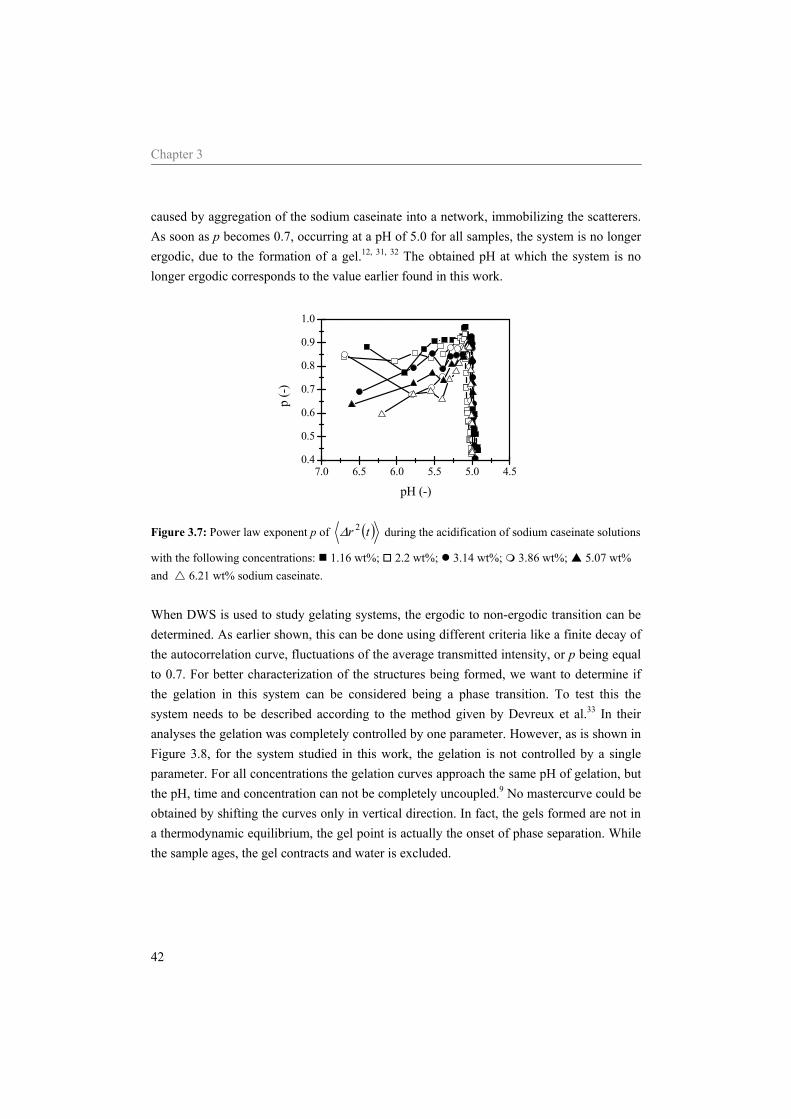
Chapter 3
42
caused by aggregation of the sodium caseinate into a network, immobilizing the scatterers. As soon as p becomes 0.7, occurring at a pH of 5.0 for all samples, the system is no longer ergodic, due to the formation of a gel.12, 31, 32 The obtained pH at which the system is no longer ergodic corresponds to the value earlier found in this work.
7.0 6.5 6.0 5.5 5.0 4.50.4
0.5
0.6
0.7
0.8
0.9
1.0
p (-)
pH (-)
Figure 3.7: Power law exponent p of ( )tr 2Δ during the acidification of sodium caseinate solutions
with the following concentrations: 1.16 wt%; 2.2 wt%; 3.14 wt%; 3.86 wt%; 5.07 wt% and 6.21 wt% sodium caseinate. When DWS is used to study gelating systems, the ergodic to non-ergodic transition can be determined. As earlier shown, this can be done using different criteria like a finite decay of the autocorrelation curve, fluctuations of the average transmitted intensity, or p being equal to 0.7. For better characterization of the structures being formed, we want to determine if the gelation in this system can be considered being a phase transition. To test this the system needs to be described according to the method given by Devreux et al.33 In their analyses the gelation was completely controlled by one parameter. However, as is shown in Figure 3.8, for the system studied in this work, the gelation is not controlled by a single parameter. For all concentrations the gelation curves approach the same pH of gelation, but the pH, time and concentration can not be completely uncoupled.9 No mastercurve could be obtained by shifting the curves only in vertical direction. In fact, the gels formed are not in a thermodynamic equilibrium, the gel point is actually the onset of phase separation. While the sample ages, the gel contracts and water is excluded.
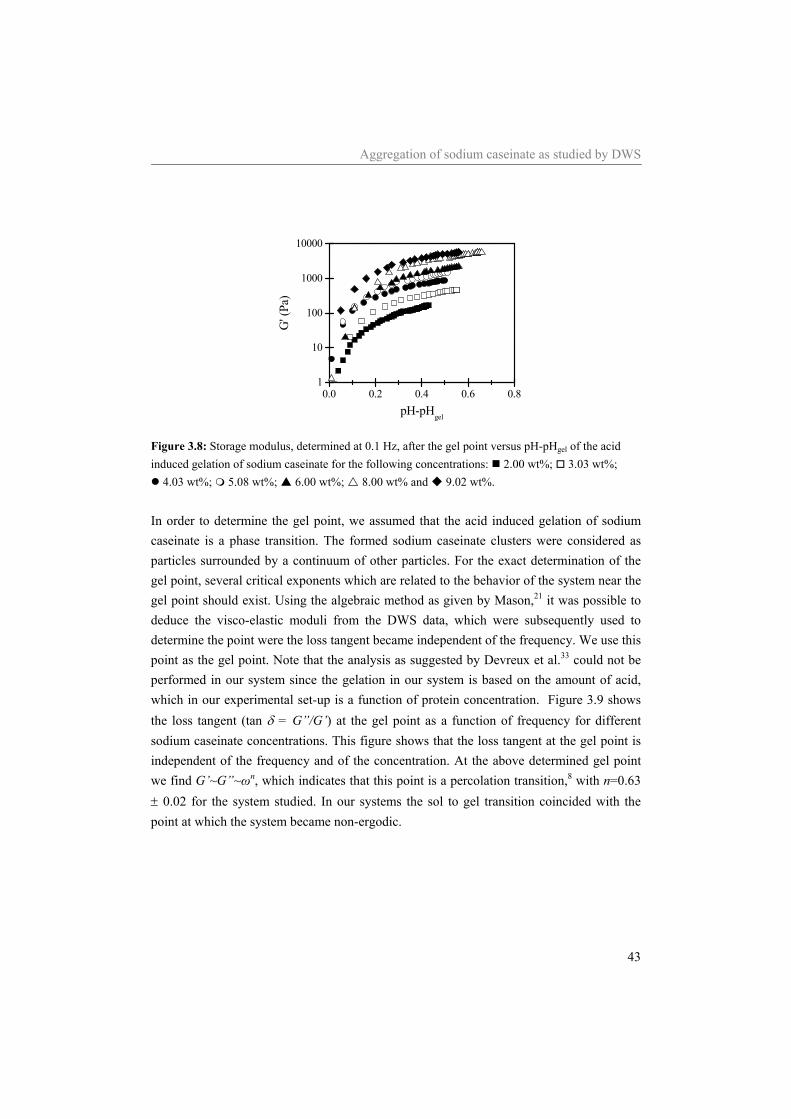
Aggregation of sodium caseinate as studied by DWS
43
0.0 0.2 0.4 0.6 0.81
10
100
1000
10000
G' (
Pa)
pH-pHgel
Figure 3.8: Storage modulus, determined at 0.1 Hz, after the gel point versus pH-pHgel of the acid induced gelation of sodium caseinate for the following concentrations: 2.00 wt%; 3.03 wt%;
4.03 wt%; 5.08 wt%; 6.00 wt%; 8.00 wt% and 9.02 wt%. In order to determine the gel point, we assumed that the acid induced gelation of sodium caseinate is a phase transition. The formed sodium caseinate clusters were considered as particles surrounded by a continuum of other particles. For the exact determination of the gel point, several critical exponents which are related to the behavior of the system near the gel point should exist. Using the algebraic method as given by Mason,21 it was possible to deduce the visco-elastic moduli from the DWS data, which were subsequently used to determine the point were the loss tangent became independent of the frequency. We use this point as the gel point. Note that the analysis as suggested by Devreux et al.33 could not be performed in our system since the gelation in our system is based on the amount of acid, which in our experimental set-up is a function of protein concentration. Figure 3.9 shows the loss tangent (tan δ = G”/G’) at the gel point as a function of frequency for different sodium caseinate concentrations. This figure shows that the loss tangent at the gel point is independent of the frequency and of the concentration. At the above determined gel point we find G’~G”~ωn, which indicates that this point is a percolation transition,8 with n=0.63 ± 0.02 for the system studied. In our systems the sol to gel transition coincided with the point at which the system became non-ergodic.
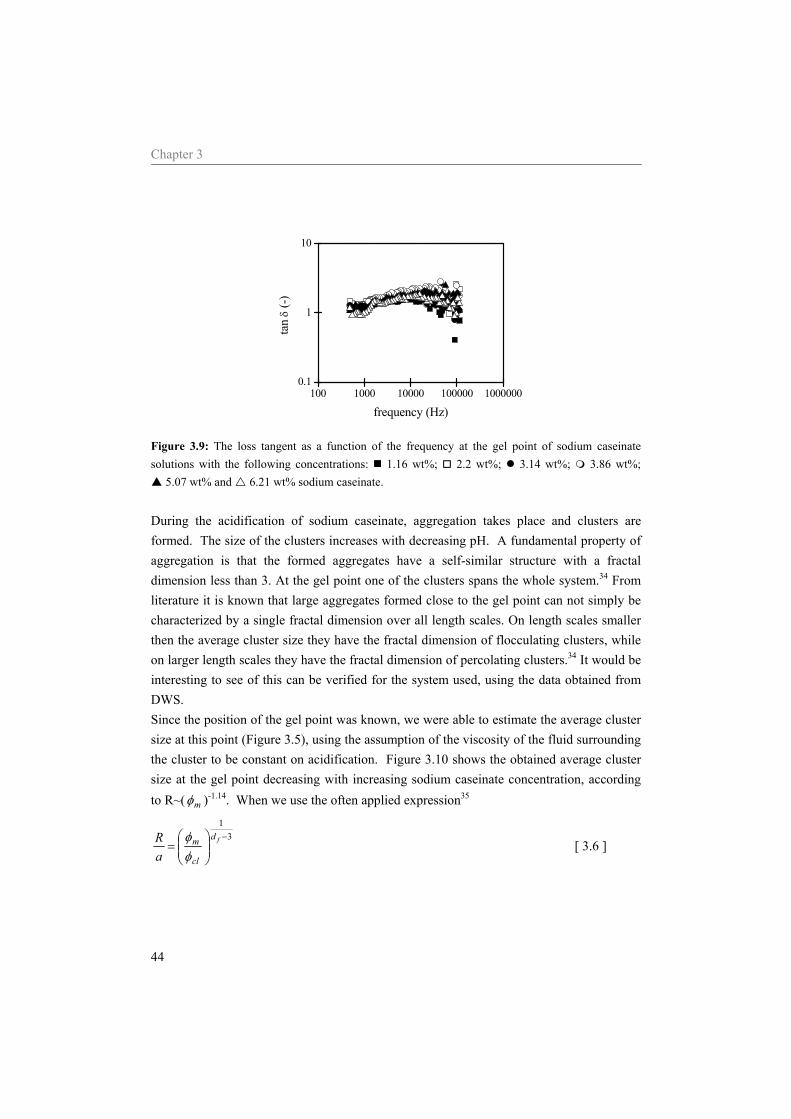
Chapter 3
44
100 1000 10000 100000 10000000.1
1
10
tan
δ (-)
frequency (Hz)
Figure 3.9: The loss tangent as a function of the frequency at the gel point of sodium caseinate solutions with the following concentrations: 1.16 wt%; 2.2 wt%; 3.14 wt%; 3.86 wt%;
5.07 wt% and 6.21 wt% sodium caseinate. During the acidification of sodium caseinate, aggregation takes place and clusters are formed. The size of the clusters increases with decreasing pH. A fundamental property of aggregation is that the formed aggregates have a self-similar structure with a fractal dimension less than 3. At the gel point one of the clusters spans the whole system.34 From literature it is known that large aggregates formed close to the gel point can not simply be characterized by a single fractal dimension over all length scales. On length scales smaller then the average cluster size they have the fractal dimension of flocculating clusters, while on larger length scales they have the fractal dimension of percolating clusters.34 It would be interesting to see of this can be verified for the system used, using the data obtained from DWS. Since the position of the gel point was known, we were able to estimate the average cluster size at this point (Figure 3.5), using the assumption of the viscosity of the fluid surrounding the cluster to be constant on acidification. Figure 3.10 shows the obtained average cluster size at the gel point decreasing with increasing sodium caseinate concentration, according to R~( mφ )-1.14. When we use the often applied expression35
31−
⎟⎟⎠
⎞⎜⎜⎝
⎛=
fd
cl
m
aR
φφ
[ 3.6 ]
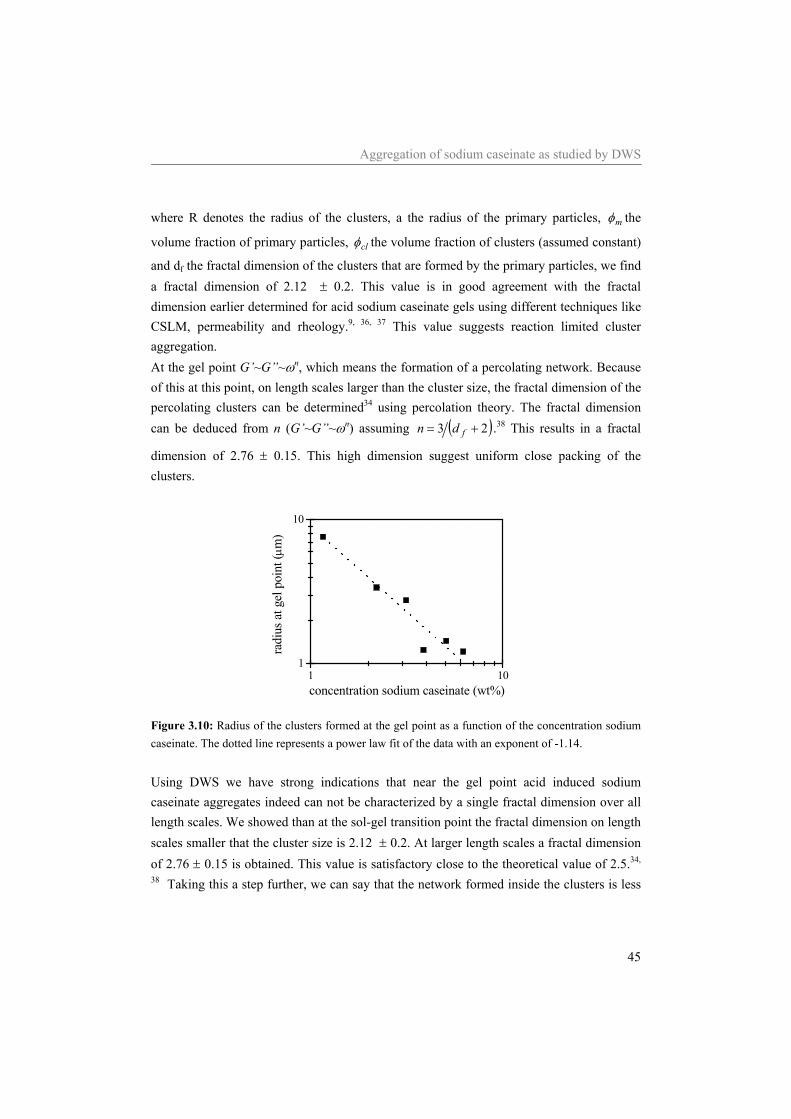
Aggregation of sodium caseinate as studied by DWS
45
where R denotes the radius of the clusters, a the radius of the primary particles, mφ the
volume fraction of primary particles, clφ the volume fraction of clusters (assumed constant)
and df the fractal dimension of the clusters that are formed by the primary particles, we find a fractal dimension of 2.12 ± 0.2. This value is in good agreement with the fractal dimension earlier determined for acid sodium caseinate gels using different techniques like CSLM, permeability and rheology.9, 36, 37 This value suggests reaction limited cluster aggregation. At the gel point G’~G”~ωn, which means the formation of a percolating network. Because of this at this point, on length scales larger than the cluster size, the fractal dimension of the percolating clusters can be determined34 using percolation theory. The fractal dimension can be deduced from n (G’~G”~ωn) assuming ( )23 += fdn .38 This results in a fractal
dimension of 2.76 ± 0.15. This high dimension suggest uniform close packing of the clusters.
1 101
10
radi
us a
t gel
poi
nt (μ
m)
concentration sodium caseinate (wt%)
Figure 3.10: Radius of the clusters formed at the gel point as a function of the concentration sodium caseinate. The dotted line represents a power law fit of the data with an exponent of -1.14. Using DWS we have strong indications that near the gel point acid induced sodium caseinate aggregates indeed can not be characterized by a single fractal dimension over all length scales. We showed than at the sol-gel transition point the fractal dimension on length scales smaller that the cluster size is 2.12 ± 0.2. At larger length scales a fractal dimension of 2.76 ± 0.15 is obtained. This value is satisfactory close to the theoretical value of 2.5.34,
38 Taking this a step further, we can say that the network formed inside the clusters is less
Chapter 3
46
tenuous that the network formed by the clusters. In addition, to obtain a more complete picture of the microstructure of the gels obtained additional information about for example the permeability and the pore size and microscopic images would be useful. Some of this information can be found in previous studies.4-6
3.4 Conclusion In this work DWS is used to study the structure development during the acidification of sodium caseinate solutions. The application of DWS to study such a, food related, system en the assumptions needed in order to interpret the data are emphasized. Bringing down the pH towards the iso-electric point of sodium caseinate causes a decrease of the surface charge of the aggregates in solution inducing aggregation and eventually gelation. The results showed hardly any changes between a pH of 7 and ~5.4. The turbidity as well as 21τ , (l*)-1 and aeff remained constant, indicating no mayor change in the mobility of the
scattering particles which are in this pH regime the added tracer particles. At a pH below 5.4 an increase in the turbidity of the system was observed, which was caused by aggregation of the sodium caseinate into larger aggregates. The size of the sodium caseinate aggregates is thought to be a function of the pH and the growth is assumed to be a gradual process upon decrease of pH that already starts at neutral pH. Besides an increasing turbidity, also a decrease of 21τ and a decrease of the average determined radius was
observed. These effects can all be explained by an increase of the size of the sodium caseinate aggregates. Fast increase of 21τ , (l*)-1, aeff and fast decrease of p all occurred between pH 5.05 and pH
5.00 indicated a rapid decrease of the mobility of the scattering particles. This could be explained by fast aggregation of the sodium caseinate and eventually the formation of a network in which the oil droplets form an integrated part. Scattering of the turbidity and the radius, a finite decay of the correlation curves, p equal to 0.7, and the appearance of a frequency independent loss tangent all occurred at the same pH, independent of the concentration sodium caseinate, as soon as the pH became 5.0. This indicated that the ergodic-non-ergodic transition coincided with the sol-gel transition. The pH of network formation found was slightly higher than the pH observed using a rheometer,9 which can be explained by a slightly higher temperature used for the measurements or by another definition of the gel point.
Aggregation of sodium caseinate as studied by DWS
47
The system exhibits a constant, frequency independent loss tangent for each concentration studied, at a given pH, which we denote as the gel point. At the gel point we have strong indications that the system can not be characterized by a single fractal dimension. At small length scale, using the average cluster size, a fractal dimension of the clusters of 2.12 ± 0.2 was obtained. For larger length scales the fractal dimension of the network was determined, using percolation theory, to be 2.76 ± 0.15. This value is satisfactory close to the theoretical value of 2.5, and indicates uniform ordering of the cluster. It would be valuable to test whether other particle gels also show this behavior at the gelpoint, in particular in systems where one can tune the cluster fractal dimension to a lower value close to that of the diffusion limited aggregation case with a lower bound of 1.8.
References 1. Horne, D. S. Curr. Opin. Colloid Interface Sci. 2006, 11, 148-153. 2. Kruif de, C. G., Chapter VI: Caseins. In Progress in biotechnology 23, Aalbersberg, W. Y.,
Hamer, R. J., Jasperse, P., Jong de, H. H. J., Kruif de, C. G., Walstra, P., Wolf, F. A., Eds. Elsevier Science B.V.: Amsterdam, 2003.
3. Eliot, C., Horne, D. S., Dickinson, E. Food Hydrocolloids 2005, 19, 279-287. 4. Bremer, L. G. B., Bijsterbosch, B. H., Schrijvers, R., Vliet van, T., Walstra, P. Colloids and
Surfaces 1990, 51, 159-170. 5. Roefs, S. P. F. M., Groot-Mostert de, A. E. A., Vliet van, T. Colloids and Surfaces 1990a, 50,
141-159. 6. Lucey, J. A., Vliet van, T., Grolle, K., Geurts, T. J., Walstra, P. Int. Dairy J. 1997a, 7, 381-
388. 7. Braga, A. L. M., Menossi, M., Cunha, R. L. Int. Dairy J. 2006, 16, 389-398. 8. Winter, H. H., Mours, M. Adv. Polym. Sci. 1997, 134, 165-234. 9. Ruis, H. G. M., Venema, P., Linden van der, E. Food Hydrocolloids 2007, 21, 545-554. 10. Wijmans, C. M., Horne, D. S., Hemar, Y., Dickinson, E. Langmuir 2000, 16, 5856-5863. 11. Vasbinder, A. J., Mil van, P. J. J. M., Bot, A., Kruif de, C. G. Colloid and Surfaces B:
Biointerfaces 2001, 21, 245-250. 12. Cardinaux, F., Stradner, A., Scheffold, F., Schurtenberger, P. 3rd International Symposium on
Food Rheology and Structure 2003. 13. Dalgleish, D. G., Alexander, M., Corredig, M. Food Hydrocolloids 2004, 18, 747-755. 14. Alexander, M., Dalgleish, D. G. Colloid and Surfaces B: Biointerfaces 2004, 38, 83-90. 15. Alexander, M., Dalgleish, D. G. Langmuir 2005, 21, 11380-11386. 16. Weitz, D. A., Pine, D. J., Diffusing wave spectroscopy. In Dynamic light scattering, the
method and some applications, Brown, W., Ed. Clarendon Press: Oxford, 1993; pp 652-719.
Chapter 3
48
17. Wyss, H. M., Romer, S., Scheffold, F., Schurtenberger, P., Gauckler, L. J. J. Colloid Interface Sci. 2001, 240, 89-97.
18. Mason, T. G., Gang, H., Weitz, D. A. J. Mol. Struct. 1996, 383, 81-90. 19. Cardinaux, F., Cipelletti, L., Scheffold, F., Schurtenberger, P. Europhys. Lett. 2002, 57, 738-
744. 20. Dasgupta, B. R., Weitz, D. A. Phys. Rev. E 2005, 71, 021504. 21. Mason, T. G. Rheol. Acta 2000, 39, 371-378. 22. Dasgupta, B. R., Tee, S. Y., Crocker, J. C., Frisken, B. J., Weitz, D. A. Phys. Rev. E 2002, 65,
051505. 23. Bonnet, C., Corredig, M., Alexander, M. J. Agric. Food Chem. 2005, 53, 8600-8606. 24. Alexander, M., Rojas-Ochoa, L. F., Leser, M., Schurtenberger, P. J. Colloid Interface Sci.
2002, 253, 35-46. 25. Woutersen, A. T. J. M., Kruif de, C. G. J. Chem. Phys. 1990, 94, 5739-5750. 26. Scheffold, F. J. Dispersion Sci. Technol. 2002, 23, 591-599. 27. Tuinier, R., Kruif de, C. G. J. Chem. Phys. 1999, 110, 9296-9304. 28. Radford, S. J., Dickinson, E. Colloids Surf., A 2004, 238, 71-81. 29. Berli, C. L. A., Quemada, D., Parker, A. Colloids Surf., A 2002, 203, 11-20. 30. Vasbinder, A. J., Alting, A. C., Kruif de, C. G. Colloids Surf., B 2003, 31, 115-123. 31. Romer, S., Scheffold, F., Schurtenberger, P. Phys. Rev. Lett. 2000, 85, 4980-4983. 32. Scheffold, F., Schurtenberger, P. Soft. Matt. 2003, 1, 139-165. 33. Devreux, F., Boilot, J. P., Chaput, F., Malier, L., Axelos, M. A. V. Phys. Rev. E 1993, 47,
2689-2694. 34. Rottereau, M., Gimel, J. C., Nicolai, T., Durand, D. Eur. Phys. J. E. 2004, 15, 133-255. 35. Gisler, T., Ball, R. C., Weitz, D. A. Phys. Rev. Lett. 1999, 82, 1064-1067. 36. Bremer, L. G. B., Bijsterbosch, B. H., Walstra, P., Vliet van, T. Adv. Colloid Interface Sci
1993, 46, 117-128. 37. Lucey, J. A., Vliet van, T., Grolle, K., Geurts, T. J., Walstra, P. Int. Dairy J. 1997b, 7, 389-
397. 38. Muthukumar, M. Macromolecules 1989, 22, 4656-4658.
*H.G.M. Ruis, K. van Gruijthuijsen, P. Venema and E. van der Linden, Langmuir 2007, 23, 1007-1013
4 Transitions in structure in O/W emulsions as studied
by diffusing wave spectroscopy* Abstract Transitions in structure of sodium caseinate stabilized emulsions were studied using conventional rheometry as well as diffusing wave spectroscopy (DWS). Structural differences were induced by different amounts of stabilizer, and transitions in structure were induced by acidification. Special attention was given to the sol-gel transition. In this chapter the criterion of the sol-gel transition being frequency independent was verified for emulsions using DWS. It was shown that this sol-gel transition did not correspond to the so-called ergodic-nonergodic transition. Differences, as a function of the pH, were found for emulsions containing different amounts of stabilizer. The emulsion droplets in an emulsion without extra stabilizer formed a continuous network upon acidification, while the droplets in emulsions with an excess of stabilizer formed a network of oil droplets at neutral pH. Upon acidification of the latter one, the initial network of oil droplets fell apart, and eventually a network of sodium caseinate, in which the oil droplets were embedded, was formed. This caused the appearance of two sol-gel transitions. The breaking of the initial network as well as the network formation of sodium caseinate in time was observed by DWS.
Chapter 4
50
4.1 Introduction Proteins and especially protein interactions are important for the structure formation of food products, being for instance foams, emulsions, or gels. The structure is one of the most important characteristics of a product because it controls, among others, taste and perception. Understanding the role of the inter particle interactions on protein assembly and structure formation is essential for the engineering of food materials.1 One of the important, and often used, proteins with regards to structure formation, is casein. Examples of products containing casein are manifold, such as milk, yogurt, quark and cheese. In all these products casein molecules are the main building blocks. Besides, these products are all, with the exception of cheese, oil-in-water emulsions. The differences in the product characteristics are among others due to different protein-protein interactions between the casein molecules and their different concentrations, causing the formation of different aggregated states of casein. Milk is a complex system containing many different components, all interacting with each other. In milk, casein exists in (historically called) micelles with a radius of approximately 100 nm. The integrity of these casein micelles is kept mainly by colloidal clustered calcium phosphate. Upon removal of the calcium phosphate from the micelle, the micellar structure falls apart, and due to mutual interaction of individual casein molecules with each other, associated structures with a radius of approximately 10 nm remain.2 These small aggregates are also found in solutions of sodium caseinate, which do not contain calcium phosphate. Sodium caseinate is often used to study the interactions of casein and is, due to its amphiphilic structure, a good stabilizer for emulsions. There is a finite range of caseinate concentrations offering stability with respect to creaming and flocculation of emulsions. When insufficient caseinate is present, coalescence will occur. At low enough emulsion droplet volume fraction, when the caseinate concentration is approximately equal to the amount required for a saturated monolayer on the droplet surface coverage, the rheological behavior of the emulsion is Newtonian, and the emulsion remains unflocculated and is stable against creaming and coalescence. The presence of excess of caseinate in the continuous phase at neutral pH, in the form of small caseinate aggregates with a radius of approximately 10 nm, will cause creaming instability due to depletion flocculation.3-6 At high enough caseinate concentrations, the depletion interaction becomes strong enough to induce flocs of emulsion droplets, which can lead to the formation of a network. Such formation of flocs and a gel network increases the low-shear rate viscosity and causes shear-thinning behavior.3, 7
Transitions in structure in O/W emulsions as studied by DWS
51
Gelation of sodium caseinate stabilized emulsions can also be induced by slow adjustment of the pH toward the isoelectric point of sodium caseinate (approximately at pH 4.6). Upon acidification the interdroplet repulsion changes into a net attraction.8 This happens as soon as the pH becomes smaller than approximately 5.1. Droplet flocculation is induced, and the emulsion converts into an emulsion gel. The emulsion droplets, which are coated with sodium caseinate, become an integral part of the formed network and hence enhance the viscoelasticity of the emulsion gel.9 In general, the point at which the sol-gel transition takes place, the gel point, is indicated by a frequency independent loss tangent.10 This criterion was verified for a wide frequency range using diffusing wave spectroscopy (DWS) for the gelation of potato starch dispersions.11 DWS has been used to study the effect of heat treatment on the rheological behavior of the acid induced aggregation of skim milk.12, 13 As a result it was found that the pH of coagulation as well as the final gel strength is highly affected by heat treatment, which is caused by denaturation and aggregation of the whey proteins. However, the effect of acidification on the interactions between the different components within skim milk is still not well understood. Changes in the dynamical properties of concentrated sodium caseinate stabilized emulsions as a function of temperature have also been monitored by DWS.8 As a result a pH dependent heat induced thickening was observed. In this study transitions in structure of sodium caseinate stabilized oil in water emulsions are presented. The structural changes, due to either excess of sodium caseinate in the continuous phase or due to acidification, were followed in a rheometer and with DWS. The latter technique is used because it is noninvading and specially suited for turbid samples. Special care was taken that no visual creaming or sedimentation occurred on the time scale of the experiments. With DWS the Brownian motion of the light scattering particles, the emulsion droplets, which induce a strain on the order kT, is monitored. Using this motion, which does not destroy the initial network formation, the visco-elastic moduli are calculated. The criterion for the sol-gel transition, being a frequency independent loss tangent, for the acid induced gelation of sodium caseinate stabilized emulsions is verified using DWS. Different structures as a function of the pH and the amount of stabilizer in the continuous phase were found. Upon acidification the emulsion droplets of emulsions without excess of sodium caseinate in the continuous phase formed a network. A continuous network of emulsion droplets was also formed at neutral pH in emulsions with excess of sodium caseinate. Upon acidification of the latter one, the initial network of oil droplets fell apart, and eventually, a network of sodium caseinate, in which the oil droplets
Chapter 4
52
were embedded, was formed. This sequence of phenomena caused the appearance of two sol-gel transitions.
4.2 Materials and Methods 4.2.1 Materials. Sodium caseinate, with a protein content of over 90 %, was obtained from DMV International (Veghel, The Netherlands). Palm fat was obtained from Barentz Raw Materials (Hoofddorp, The Netherlands). Glucono-δ-lactone (GDL) was obtained from Fluka, Riedel de Haën (Buch, Switzerland) and thiomersal from Merck (Schuchart, Germany). 4.2.2 Sample preparation Solutions of sodium caseinate were prepared by dissolving the required amount of sodium caseinate in demineralized water, followed by gently stirring overnight at 4°C. For the preparation of a stock emulsion, containing 30 wt% palm fat and 1.2 wt% sodium caseinate, a mixture of sodium caseinate solution and palm fat was heated at 60°C until all fat was melted. This mixture was pre-homogenized using an Ultra Turrax (Polytron, Switzerland) and subsequently homogenized with a Ranny homogenizer (Rannie, Copenhagen, Denmark) at a pressure of 35 bar and a temperature of 60°C for 25 minutes. The stock emulsion hardly contained excess of sodium caseinate in the continuous phase and had a D3,2-value of 0.97 μm as determined from laser diffraction (Coulter LS 230, Miami, FL). Samples with 15 wt% fat and different sodium caseinate contents were prepared by dilution of the stock emulsion with a concentrated sodium caseinate solution and demineralized water. All samples contained a final amount of 0.02 wt% thiomersal to prevent bacterial spoilage. Acid induced gelation of the emulsions was induced by the addition of 0.15 gram GDL granules per gram of sodium caseinate. The samples were stirred for 1 minute to dissolve the GDL granules. A pH of 4.6 ± 0.1 was reached within 10 hours after the addition of GDL. The development of the pH in time was monitored at room temperature. 4.2.3 DWS DWS experiments were performed in transmission mode. Emulsion samples were contained in flat-faced glass cells with an optical path length of 2.00 mm. The emulsions were, at room temperature, illuminated with an expanded laser beam (3.0 mm diameter)
Transitions in structure in O/W emulsions as studied by DWS
53
from a HeNe laser (20 mW) operating at a wavelength of 633 nm. The emulsion droplets cause forward, multiple scattering of the light. The multiply scattered light transmitted through the cell was collected, after passing a linear polarizer with its polarization direction perpendicular to the incident light, with a single-mode optical fiber. The signal was equally split into two by a polarization cube and directed into two separate photomultiplier tubes (ALV / SO-SIPD, ALV, Germany). The output of these two tubes was cross-correlated using an ALV-6010 correlator (ALV, Germany), to obtain the autocorrelation function. A latex sample (with a diameter of the latex spheres of 892 nm) with known l* (photon transport mean free path) was used as a reference sample.
4.3 Theoretical Background DWS measures the intensity autocorrelation function of multiply scattered light, ( )tg2 , as a
function of time. Light scattered from the system is supposed to be completely randomized and its path is described by diffusion theory. Furthermore, all scattering events are approached by an average scattering event.14 In ergodic systems ( )tg2 is related to the
motion of the scatterers by the following equation, where the last equality follows from the Siegert relation.15
( ) ( ) ( ) ( ) 21
2
0
2202 3
11 tgds*lstrkexpsPtg βΔβ =⎟
⎟⎠
⎞⎜⎜⎝
⎛⎟⎠⎞
⎜⎝⎛−=− ∫
∞
[ 4.1 ]
In this equation β is a constant determined primarily by the collection optics, P(s) is the pathlength distribution function of paths of length s, λπnk 20 = , with n the refractive
index of the solvent and λ the wavelength of the laser, ( )tr 2Δ is the mean square
displacement of the scatterers, and l* is the photon transport mean free path. For
unhindered diffusive colloidal motion ( ) Dttr 62 =Δ , with D being the self-diffusion
coefficient.
The short time behavior of ( )tr 2Δ , corresponding to the initial decay of the
autocorrelation function, can generally be described as a power law ( )( )pttr ≈2Δ . For
thermally driven spheres, the exponent p must lie between 0, corresponding to the elastic confinement, and 1, corresponding to viscous diffusion.16
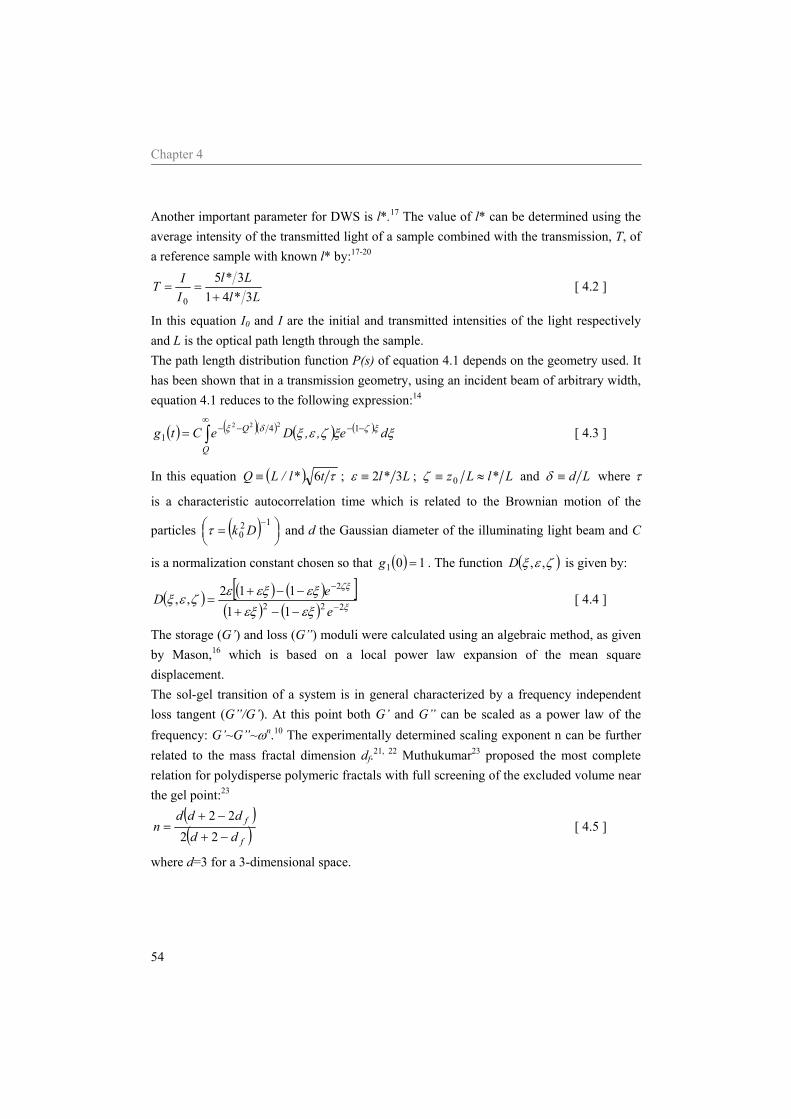
Chapter 4
54
Another important parameter for DWS is l*.17 The value of l* can be determined using the average intensity of the transmitted light of a sample combined with the transmission, T, of a reference sample with known l* by:17-20
L*lL*l
IIT
34135
0 +== [ 4.2 ]
In this equation I0 and I are the initial and transmitted intensities of the light respectively and L is the optical path length through the sample. The path length distribution function P(s) of equation 4.1 depends on the geometry used. It has been shown that in a transmission geometry, using an incident beam of arbitrary width, equation 4.1 reduces to the following expression:14
( ) ( )( ) ( ) ( )∫∞
−−−−=Q
Q de,,DeCtg ξξζεξ ξζδξ 141
222 [ 4.3 ]
In this equation ( ) τt*l/LQ 6≡ ; L*l 32≡ε ; L*lLz ≈≡ 0ζ and Ld≡δ where τ
is a characteristic autocorrelation time which is related to the Brownian motion of the
particles ( ) ⎟⎠⎞⎜
⎝⎛ =
−120 Dkτ and d the Gaussian diameter of the illuminating light beam and C
is a normalization constant chosen so that ( ) 101 =g . The function ( )ζεξ ,,D is given by:
( ) ( ) ( )[ ]( ) ( ) ξ
ζξ
εξεξεξεξεζεξ
222
2
11112,,
−
−
−−+
−−+=
eeD [ 4.4 ]
The storage (G’) and loss (G”) moduli were calculated using an algebraic method, as given by Mason,16 which is based on a local power law expansion of the mean square displacement. The sol-gel transition of a system is in general characterized by a frequency independent loss tangent (G”/G’). At this point both G’ and G” can be scaled as a power law of the frequency: G’~G”~ωn.10 The experimentally determined scaling exponent n can be further related to the mass fractal dimension df.21, 22 Muthukumar23 proposed the most complete relation for polydisperse polymeric fractals with full screening of the excluded volume near the gel point:23
( )( )f
f
ddddd
n−+
−+=
2222
[ 4.5 ]
where d=3 for a 3-dimensional space.
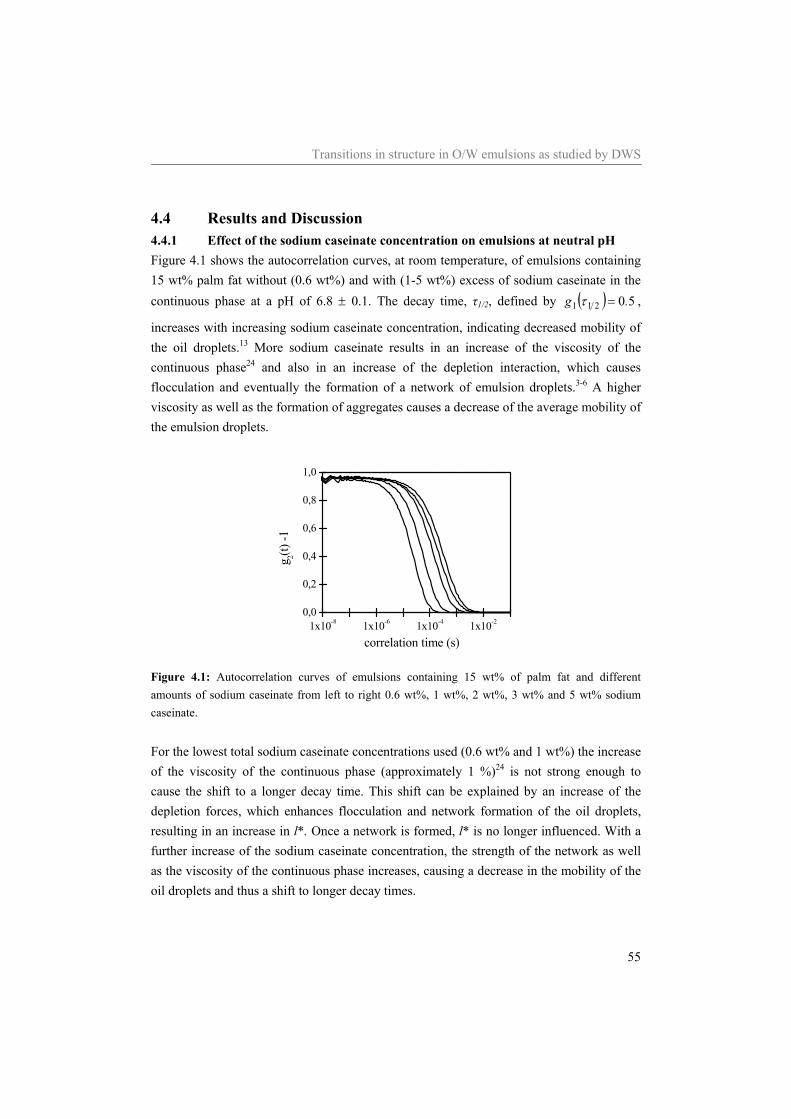
Transitions in structure in O/W emulsions as studied by DWS
55
4.4 Results and Discussion 4.4.1 Effect of the sodium caseinate concentration on emulsions at neutral pH Figure 4.1 shows the autocorrelation curves, at room temperature, of emulsions containing 15 wt% palm fat without (0.6 wt%) and with (1-5 wt%) excess of sodium caseinate in the continuous phase at a pH of 6.8 ± 0.1. The decay time, τ1/2, defined by ( ) 50211 .g =τ ,
increases with increasing sodium caseinate concentration, indicating decreased mobility of the oil droplets.13 More sodium caseinate results in an increase of the viscosity of the continuous phase24 and also in an increase of the depletion interaction, which causes flocculation and eventually the formation of a network of emulsion droplets.3-6 A higher viscosity as well as the formation of aggregates causes a decrease of the average mobility of the emulsion droplets.
1x10⁻⁸ 1x10⁻⁶ 1x10⁻⁴ 1x10-20,0
0,2
0,4
0,6
0,8
1,0
g 2(t) -1
correlation time (s)
Figure 4.1: Autocorrelation curves of emulsions containing 15 wt% of palm fat and different amounts of sodium caseinate from left to right 0.6 wt%, 1 wt%, 2 wt%, 3 wt% and 5 wt% sodium caseinate. For the lowest total sodium caseinate concentrations used (0.6 wt% and 1 wt%) the increase of the viscosity of the continuous phase (approximately 1 %)24 is not strong enough to cause the shift to a longer decay time. This shift can be explained by an increase of the depletion forces, which enhances flocculation and network formation of the oil droplets, resulting in an increase in l*. Once a network is formed, l* is no longer influenced. With a further increase of the sodium caseinate concentration, the strength of the network as well as the viscosity of the continuous phase increases, causing a decrease in the mobility of the oil droplets and thus a shift to longer decay times.
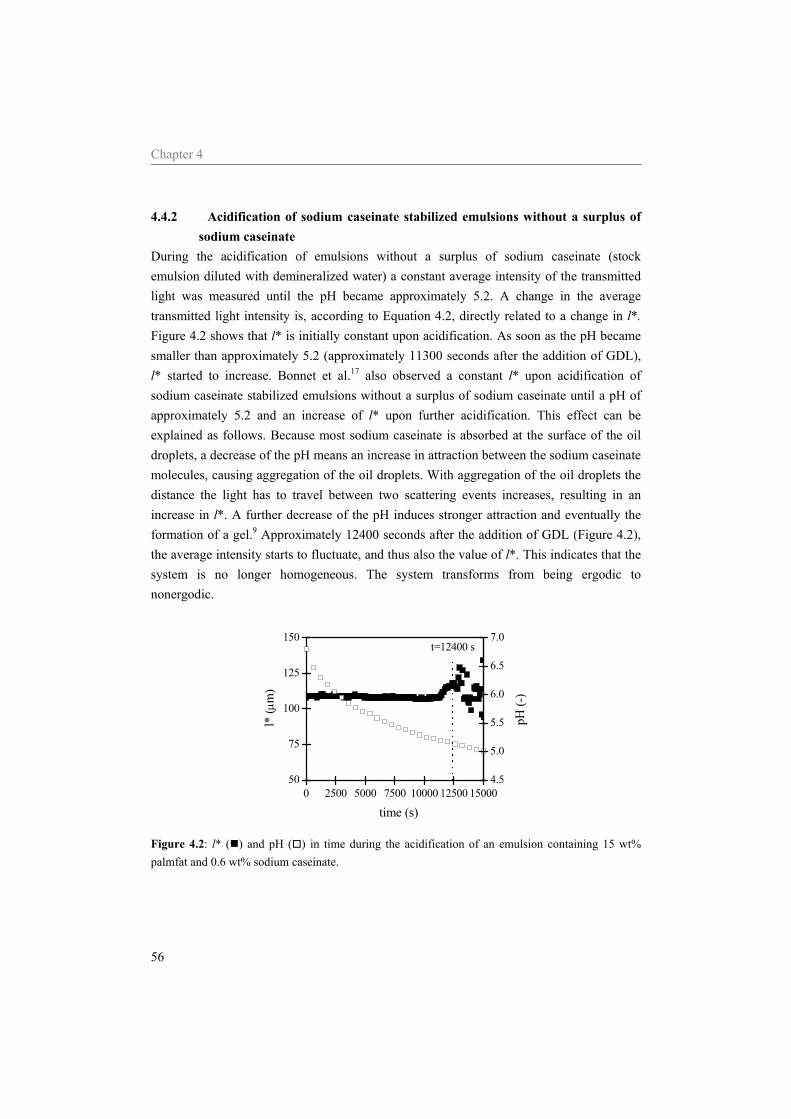
Chapter 4
56
4.4.2 Acidification of sodium caseinate stabilized emulsions without a surplus of sodium caseinate
During the acidification of emulsions without a surplus of sodium caseinate (stock emulsion diluted with demineralized water) a constant average intensity of the transmitted light was measured until the pH became approximately 5.2. A change in the average transmitted light intensity is, according to Equation 4.2, directly related to a change in l*. Figure 4.2 shows that l* is initially constant upon acidification. As soon as the pH became smaller than approximately 5.2 (approximately 11300 seconds after the addition of GDL), l* started to increase. Bonnet et al.17 also observed a constant l* upon acidification of sodium caseinate stabilized emulsions without a surplus of sodium caseinate until a pH of approximately 5.2 and an increase of l* upon further acidification. This effect can be explained as follows. Because most sodium caseinate is absorbed at the surface of the oil droplets, a decrease of the pH means an increase in attraction between the sodium caseinate molecules, causing aggregation of the oil droplets. With aggregation of the oil droplets the distance the light has to travel between two scattering events increases, resulting in an increase in l*. A further decrease of the pH induces stronger attraction and eventually the formation of a gel.9 Approximately 12400 seconds after the addition of GDL (Figure 4.2), the average intensity starts to fluctuate, and thus also the value of l*. This indicates that the system is no longer homogeneous. The system transforms from being ergodic to nonergodic.
0 2500 5000 7500 10000 12500 1500050
75
100
125
150
t=12400 s
l* (μ
m)
time (s)
4.5
5.0
5.5
6.0
6.5
7.0
pH (-
)
Figure 4.2: l* ( ) and pH ( ) in time during the acidification of an emulsion containing 15 wt% palmfat and 0.6 wt% sodium caseinate.
Transitions in structure in O/W emulsions as studied by DWS
57
As illustrated in Figure 4.3, the autocorrelation curves of the emulsions without an excess of sodium caseinate initially coincide. As soon as the oil droplets start to aggregate, in the illustrated case 11300 seconds after the addition of GDL, l* increases and the decay time τ1/2 shifts to longer times. As expected, flocculation of the oil droplets leads to a decrease of the mobility of the oil droplets. Gelation occurs when a single cluster fills the entire sample volume.25 Careful analysis of Figure 4.3A showed that the last curve that decayed to zero is measured 12351 seconds after the addition of GDL. Hereafter the time-averaged intensity correlation function depends on the measuring position in the sample and the sample is therefore nonergodic. The time of the transition from ergodic to nonergodic determined with either l* (Figure 4.2) or the correlation curves (Figure 4.3A) coincide. To overcome the nonergodicity problem, a setup with two independent glass cells, the first containing the sample to be investigated and the second containing an ergodic system with slow internal dynamics and moderate turbidity, might be used.25 Unfortunately, we were not able to find an ergodic sample with internal dynamics slow enough to successfully use this setup.
1x10⁻⁸ 1x10⁻⁶ 1x10⁻⁴ 1x10⁻² 1x1000.0
0.2
0.4
0.6
0.8
1.0A 0 s 11456 s 11635 s 11814 s 11993 s 12172 s 12351 s 12530 s 12709 s 12888 s
g 1 (t)
correlation time (s)
0 2500 5000 7500 10000 12500 150001x10-5
1x10⁻⁴
1x10⁻³
1x10⁻²B
τ 1/2 (s
)
time (s)
Figure 4.3: A Autocorrelation curve, at different times after the addition of GDL, during the acid induced gelation of a sodium caseinate stabilized emulsion containing 15 wt% palm fat and 0.6 wt% sodium caseinate. B: Corresponding decay times in time.
From the fit of the curves of Figure 4.3A, the mean square displacement, ( )tr 2Δ , was
calculated. Figure 4.4A shows ( )tr 2Δ during the acidification and Figure 4.4B the power
law exponent p of the short time behavior of ( )tr 2Δ . The curves of ( )tr 2Δ initially
coincide and are lines with p equal to 1, indicating unhindered Brownian motion of the
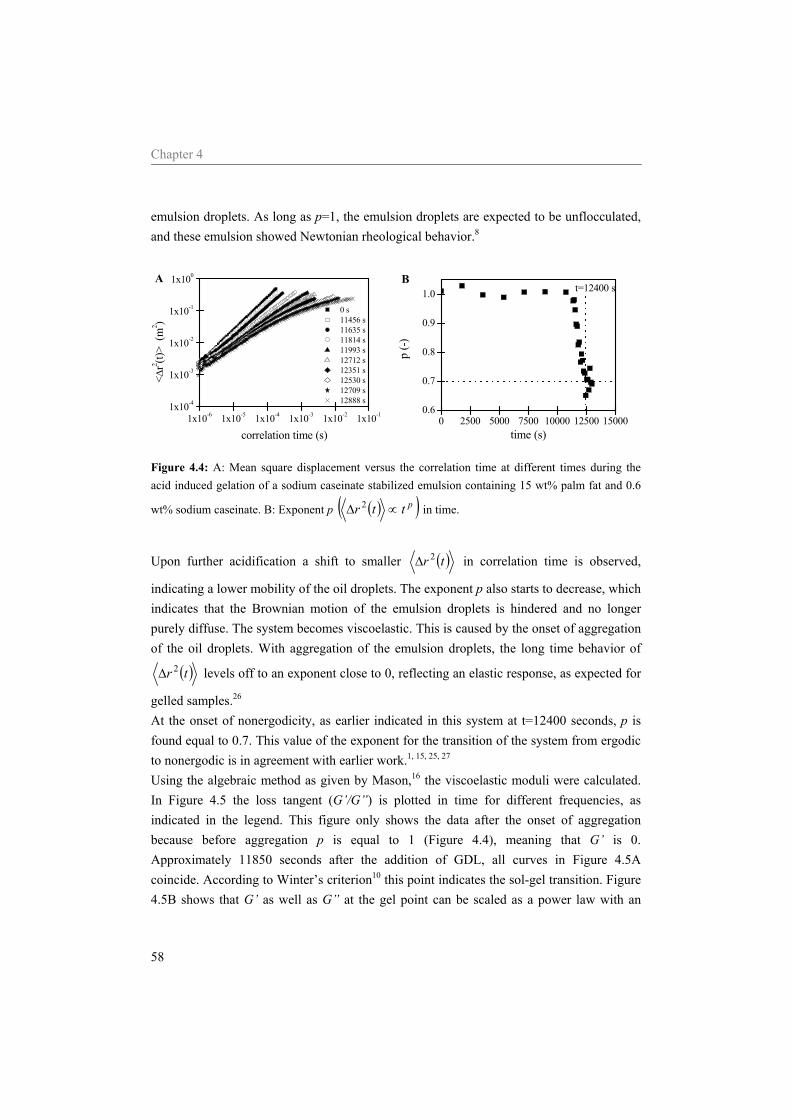
Chapter 4
58
emulsion droplets. As long as p=1, the emulsion droplets are expected to be unflocculated, and these emulsion showed Newtonian rheological behavior.8
1x10⁻⁶ 1x10⁻⁵ 1x10⁻⁴ 1x10⁻³ 1x10⁻² 1x10-11x10-4
1x10⁻³
1x10⁻²
1x10⁻¹
1x100A
<Δr2 (t)
> (m
2 )
correlation time (s)
0 s 11456 s 11635 s 11814 s 11993 s 12712 s 12351 s 12530 s 12709 s 12888 s
0 2500 5000 7500 10000 12500 150000.6
0.7
0.8
0.9
1.0B
t=12400 s
p (-)
time (s)
Figure 4.4: A: Mean square displacement versus the correlation time at different times during the acid induced gelation of a sodium caseinate stabilized emulsion containing 15 wt% palm fat and 0.6
wt% sodium caseinate. B: Exponent p ( )( )pttr ∝Δ 2 in time.
Upon further acidification a shift to smaller ( )tr 2Δ in correlation time is observed,
indicating a lower mobility of the oil droplets. The exponent p also starts to decrease, which indicates that the Brownian motion of the emulsion droplets is hindered and no longer purely diffuse. The system becomes viscoelastic. This is caused by the onset of aggregation of the oil droplets. With aggregation of the emulsion droplets, the long time behavior of
( )tr 2Δ levels off to an exponent close to 0, reflecting an elastic response, as expected for
gelled samples.26 At the onset of nonergodicity, as earlier indicated in this system at t=12400 seconds, p is found equal to 0.7. This value of the exponent for the transition of the system from ergodic to nonergodic is in agreement with earlier work.1, 15, 25, 27 Using the algebraic method as given by Mason,16 the viscoelastic moduli were calculated. In Figure 4.5 the loss tangent (G’/G”) is plotted in time for different frequencies, as indicated in the legend. This figure only shows the data after the onset of aggregation because before aggregation p is equal to 1 (Figure 4.4), meaning that G’ is 0. Approximately 11850 seconds after the addition of GDL, all curves in Figure 4.5A coincide. According to Winter’s criterion10 this point indicates the sol-gel transition. Figure 4.5B shows that G’ as well as G” at the gel point can be scaled as a power law with an
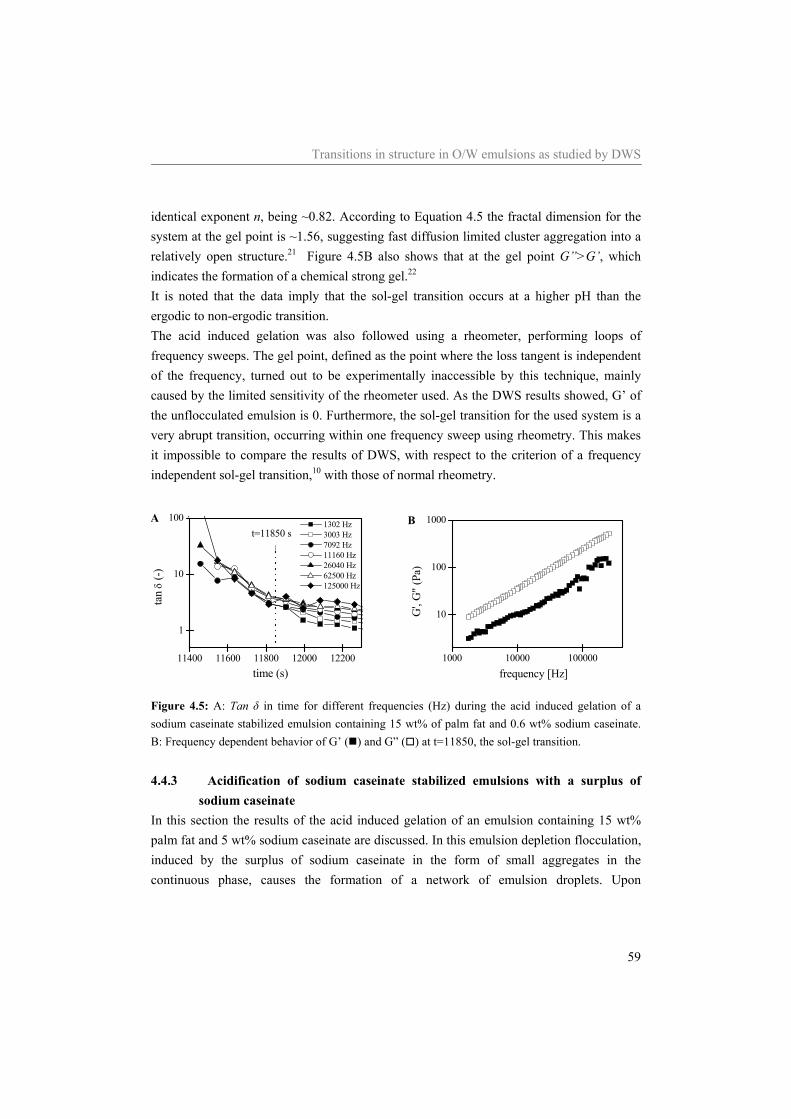
Transitions in structure in O/W emulsions as studied by DWS
59
identical exponent n, being ~0.82. According to Equation 4.5 the fractal dimension for the system at the gel point is ~1.56, suggesting fast diffusion limited cluster aggregation into a relatively open structure.21 Figure 4.5B also shows that at the gel point G”>G’, which indicates the formation of a chemical strong gel.22 It is noted that the data imply that the sol-gel transition occurs at a higher pH than the ergodic to non-ergodic transition. The acid induced gelation was also followed using a rheometer, performing loops of frequency sweeps. The gel point, defined as the point where the loss tangent is independent of the frequency, turned out to be experimentally inaccessible by this technique, mainly caused by the limited sensitivity of the rheometer used. As the DWS results showed, G’ of the unflocculated emulsion is 0. Furthermore, the sol-gel transition for the used system is a very abrupt transition, occurring within one frequency sweep using rheometry. This makes it impossible to compare the results of DWS, with respect to the criterion of a frequency independent sol-gel transition,10 with those of normal rheometry.
11400 11600 11800 12000 12200
1
10
100At=11850 s
tan
δ (-)
time (s)
1302 Hz 3003 Hz 7092 Hz 11160 Hz 26040 Hz 62500 Hz 125000 Hz
1000 10000 100000
10
100
1000B
G',
G"
(Pa)
frequency [Hz]
Figure 4.5: A: Tan δ in time for different frequencies (Hz) during the acid induced gelation of a sodium caseinate stabilized emulsion containing 15 wt% of palm fat and 0.6 wt% sodium caseinate. B: Frequency dependent behavior of G’ ( ) and G” ( ) at t=11850, the sol-gel transition. 4.4.3 Acidification of sodium caseinate stabilized emulsions with a surplus of
sodium caseinate In this section the results of the acid induced gelation of an emulsion containing 15 wt% palm fat and 5 wt% sodium caseinate are discussed. In this emulsion depletion flocculation, induced by the surplus of sodium caseinate in the form of small aggregates in the continuous phase, causes the formation of a network of emulsion droplets. Upon
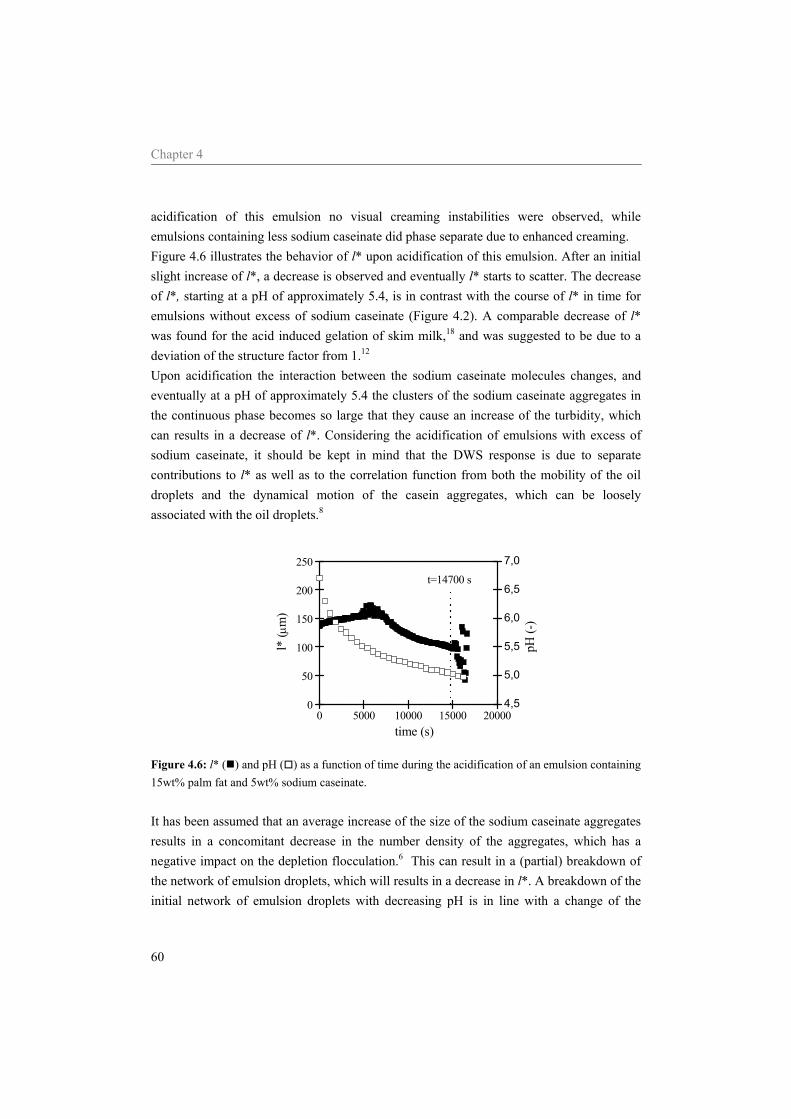
Chapter 4
60
acidification of this emulsion no visual creaming instabilities were observed, while emulsions containing less sodium caseinate did phase separate due to enhanced creaming. Figure 4.6 illustrates the behavior of l* upon acidification of this emulsion. After an initial slight increase of l*, a decrease is observed and eventually l* starts to scatter. The decrease of l*, starting at a pH of approximately 5.4, is in contrast with the course of l* in time for emulsions without excess of sodium caseinate (Figure 4.2). A comparable decrease of l* was found for the acid induced gelation of skim milk,18 and was suggested to be due to a deviation of the structure factor from 1.12 Upon acidification the interaction between the sodium caseinate molecules changes, and eventually at a pH of approximately 5.4 the clusters of the sodium caseinate aggregates in the continuous phase becomes so large that they cause an increase of the turbidity, which can results in a decrease of l*. Considering the acidification of emulsions with excess of sodium caseinate, it should be kept in mind that the DWS response is due to separate contributions to l* as well as to the correlation function from both the mobility of the oil droplets and the dynamical motion of the casein aggregates, which can be loosely associated with the oil droplets.8
0 5000 10000 15000 200000
50
100
150
200
250
t=14700 s
pH (-
)
l* (μ
m)
time (s)
4,5
5,0
5,5
6,0
6,5
7,0
Figure 4.6: l* ( ) and pH ( ) as a function of time during the acidification of an emulsion containing 15wt% palm fat and 5wt% sodium caseinate. It has been assumed that an average increase of the size of the sodium caseinate aggregates results in a concomitant decrease in the number density of the aggregates, which has a negative impact on the depletion flocculation.6 This can result in a (partial) breakdown of the network of emulsion droplets, which will results in a decrease in l*. A breakdown of the initial network of emulsion droplets with decreasing pH is in line with a change of the
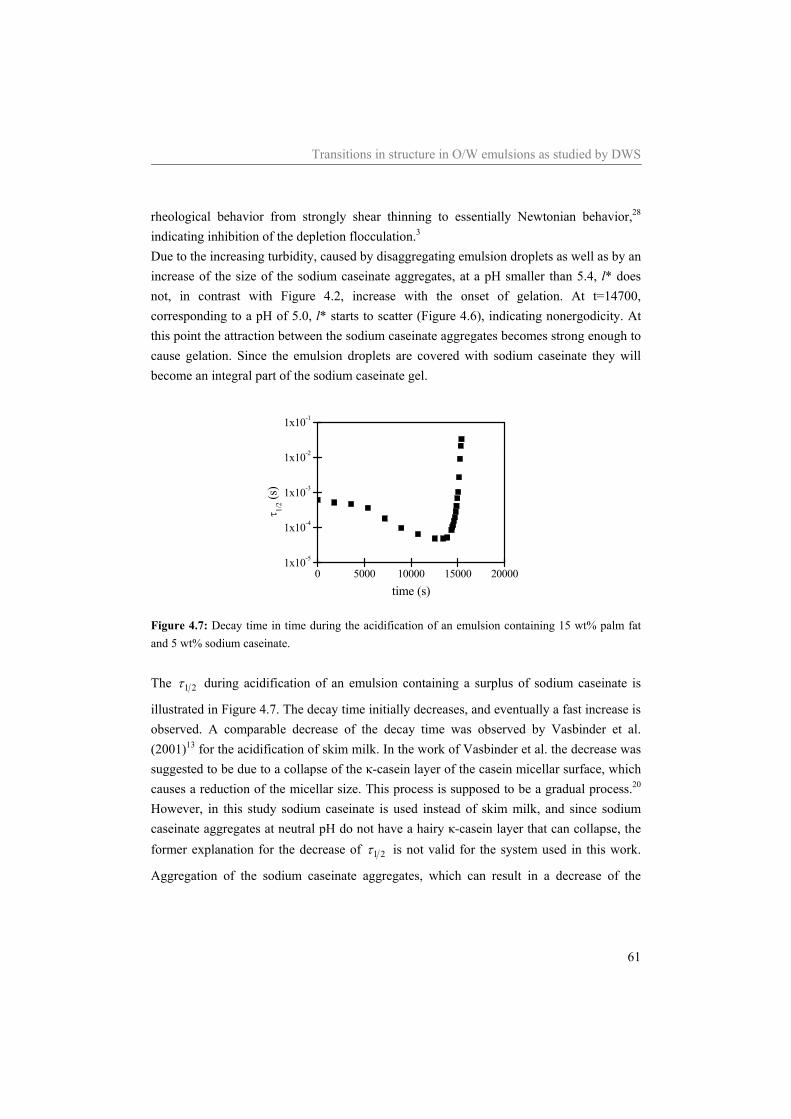
Transitions in structure in O/W emulsions as studied by DWS
61
rheological behavior from strongly shear thinning to essentially Newtonian behavior,28 indicating inhibition of the depletion flocculation.3 Due to the increasing turbidity, caused by disaggregating emulsion droplets as well as by an increase of the size of the sodium caseinate aggregates, at a pH smaller than 5.4, l* does not, in contrast with Figure 4.2, increase with the onset of gelation. At t=14700, corresponding to a pH of 5.0, l* starts to scatter (Figure 4.6), indicating nonergodicity. At this point the attraction between the sodium caseinate aggregates becomes strong enough to cause gelation. Since the emulsion droplets are covered with sodium caseinate they will become an integral part of the sodium caseinate gel.
0 5000 10000 15000 200001x10-5
1x10⁻⁴
1x10⁻³
1x10⁻²
1x10⁻¹
τ 1/2 (s
)
time (s)
Figure 4.7: Decay time in time during the acidification of an emulsion containing 15 wt% palm fat and 5 wt% sodium caseinate. The 21τ during acidification of an emulsion containing a surplus of sodium caseinate is
illustrated in Figure 4.7. The decay time initially decreases, and eventually a fast increase is observed. A comparable decrease of the decay time was observed by Vasbinder et al. (2001)13 for the acidification of skim milk. In the work of Vasbinder et al. the decrease was suggested to be due to a collapse of the κ-casein layer of the casein micellar surface, which causes a reduction of the micellar size. This process is supposed to be a gradual process.20 However, in this study sodium caseinate is used instead of skim milk, and since sodium caseinate aggregates at neutral pH do not have a hairy κ-casein layer that can collapse, the former explanation for the decrease of 21τ is not valid for the system used in this work.
Aggregation of the sodium caseinate aggregates, which can result in a decrease of the
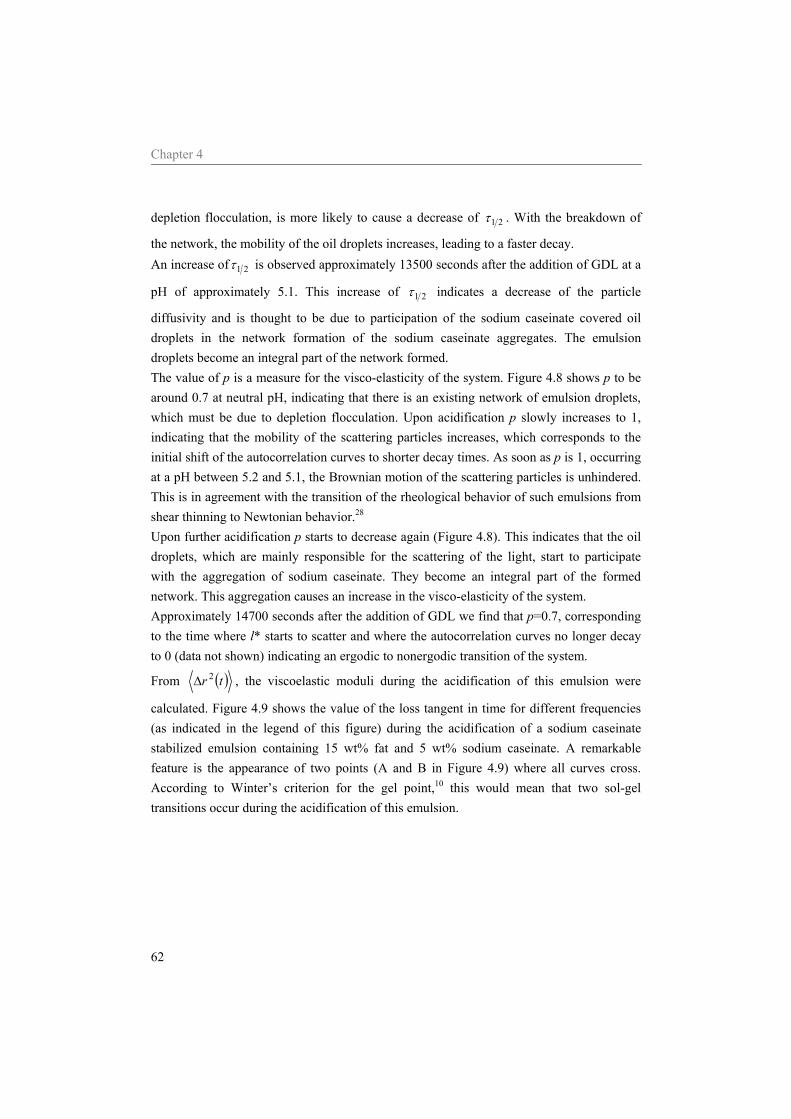
Chapter 4
62
depletion flocculation, is more likely to cause a decrease of 21τ . With the breakdown of
the network, the mobility of the oil droplets increases, leading to a faster decay. An increase of 21τ is observed approximately 13500 seconds after the addition of GDL at a
pH of approximately 5.1. This increase of 21τ indicates a decrease of the particle
diffusivity and is thought to be due to participation of the sodium caseinate covered oil droplets in the network formation of the sodium caseinate aggregates. The emulsion droplets become an integral part of the network formed. The value of p is a measure for the visco-elasticity of the system. Figure 4.8 shows p to be around 0.7 at neutral pH, indicating that there is an existing network of emulsion droplets, which must be due to depletion flocculation. Upon acidification p slowly increases to 1, indicating that the mobility of the scattering particles increases, which corresponds to the initial shift of the autocorrelation curves to shorter decay times. As soon as p is 1, occurring at a pH between 5.2 and 5.1, the Brownian motion of the scattering particles is unhindered. This is in agreement with the transition of the rheological behavior of such emulsions from shear thinning to Newtonian behavior.28 Upon further acidification p starts to decrease again (Figure 4.8). This indicates that the oil droplets, which are mainly responsible for the scattering of the light, start to participate with the aggregation of sodium caseinate. They become an integral part of the formed network. This aggregation causes an increase in the visco-elasticity of the system. Approximately 14700 seconds after the addition of GDL we find that p=0.7, corresponding to the time where l* starts to scatter and where the autocorrelation curves no longer decay to 0 (data not shown) indicating an ergodic to nonergodic transition of the system.
From ( )tr 2Δ , the viscoelastic moduli during the acidification of this emulsion were
calculated. Figure 4.9 shows the value of the loss tangent in time for different frequencies (as indicated in the legend of this figure) during the acidification of a sodium caseinate stabilized emulsion containing 15 wt% fat and 5 wt% sodium caseinate. A remarkable feature is the appearance of two points (A and B in Figure 4.9) where all curves cross. According to Winter’s criterion for the gel point,10 this would mean that two sol-gel transitions occur during the acidification of this emulsion.
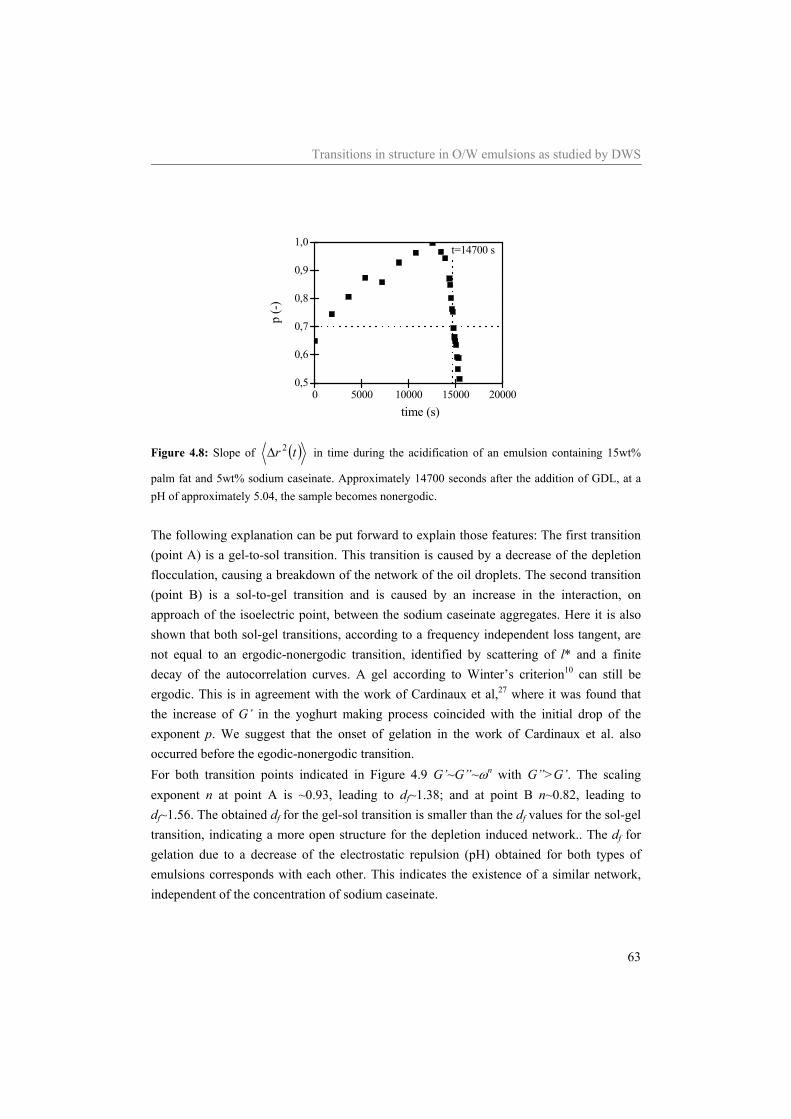
Transitions in structure in O/W emulsions as studied by DWS
63
0 5000 10000 15000 200000,5
0,6
0,7
0,8
0,9
1,0t=14700 s
p (-)
time (s)
Figure 4.8: Slope of ( )tr 2Δ in time during the acidification of an emulsion containing 15wt%
palm fat and 5wt% sodium caseinate. Approximately 14700 seconds after the addition of GDL, at a pH of approximately 5.04, the sample becomes nonergodic. The following explanation can be put forward to explain those features: The first transition (point A) is a gel-to-sol transition. This transition is caused by a decrease of the depletion flocculation, causing a breakdown of the network of the oil droplets. The second transition (point B) is a sol-to-gel transition and is caused by an increase in the interaction, on approach of the isoelectric point, between the sodium caseinate aggregates. Here it is also shown that both sol-gel transitions, according to a frequency independent loss tangent, are not equal to an ergodic-nonergodic transition, identified by scattering of l* and a finite decay of the autocorrelation curves. A gel according to Winter’s criterion10 can still be ergodic. This is in agreement with the work of Cardinaux et al,27 where it was found that the increase of G’ in the yoghurt making process coincided with the initial drop of the exponent p. We suggest that the onset of gelation in the work of Cardinaux et al. also occurred before the egodic-nonergodic transition. For both transition points indicated in Figure 4.9 G’~G”~ωn with G”>G’. The scaling exponent n at point A is ~0.93, leading to df~1.38; and at point B n~0.82, leading to df~1.56. The obtained df for the gel-sol transition is smaller than the df values for the sol-gel transition, indicating a more open structure for the depletion induced network.. The df for gelation due to a decrease of the electrostatic repulsion (pH) obtained for both types of emulsions corresponds with each other. This indicates the existence of a similar network, independent of the concentration of sodium caseinate.
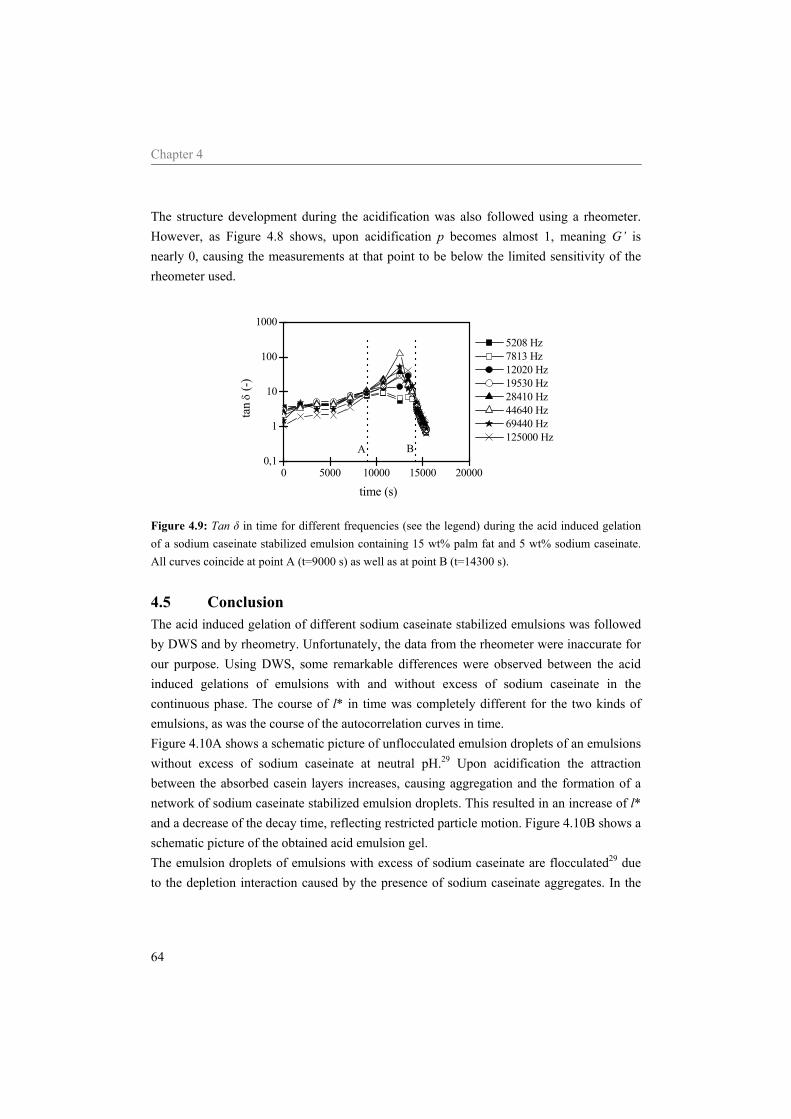
Chapter 4
64
The structure development during the acidification was also followed using a rheometer. However, as Figure 4.8 shows, upon acidification p becomes almost 1, meaning G’ is nearly 0, causing the measurements at that point to be below the limited sensitivity of the rheometer used.
0 5000 10000 15000 200000,1
1
10
100
1000
BA
tan
δ (-)
time (s)
5208 Hz 7813 Hz 12020 Hz 19530 Hz 28410 Hz 44640 Hz 69440 Hz 125000 Hz
Figure 4.9: Tan δ in time for different frequencies (see the legend) during the acid induced gelation of a sodium caseinate stabilized emulsion containing 15 wt% palm fat and 5 wt% sodium caseinate. All curves coincide at point A (t=9000 s) as well as at point B (t=14300 s).
4.5 Conclusion The acid induced gelation of different sodium caseinate stabilized emulsions was followed by DWS and by rheometry. Unfortunately, the data from the rheometer were inaccurate for our purpose. Using DWS, some remarkable differences were observed between the acid induced gelations of emulsions with and without excess of sodium caseinate in the continuous phase. The course of l* in time was completely different for the two kinds of emulsions, as was the course of the autocorrelation curves in time. Figure 4.10A shows a schematic picture of unflocculated emulsion droplets of an emulsions without excess of sodium caseinate at neutral pH.29 Upon acidification the attraction between the absorbed casein layers increases, causing aggregation and the formation of a network of sodium caseinate stabilized emulsion droplets. This resulted in an increase of l* and a decrease of the decay time, reflecting restricted particle motion. Figure 4.10B shows a schematic picture of the obtained acid emulsion gel. The emulsion droplets of emulsions with excess of sodium caseinate are flocculated29 due to the depletion interaction caused by the presence of sodium caseinate aggregates. In the

Transitions in structure in O/W emulsions as studied by DWS
65
illustrated case (15 wt% palm fat and 5 wt% sodium caseinate) the emulsion droplets formed a self-supporting network, which is schematically shown in Figure 4.10B. Upon acidification l* decreased and the mobility of the emulsion droplets increased as indicated by a shift to shorter decay times and by an increase of the exponent p from approximately 0.7 to approximately 1. This can be explained by a (partial) breakdown of the network, causing a decrease of the distance between two scattering events and a less restricted motion of the scattering particles. This phase is schematically illustrated in Figure 4.10C. Furthermore, the size of the sodium caseinate aggregates increases, causing an increase of the turbidity, which also leads to a decrease of l*. Upon further acidification, the sodium caseinate present in the continuous phase will eventually form a gel (at a pH of approximately 5.1). As Figure 4.10D schematically shows, the emulsion droplets are expected to be more or less randomly embedded in the sodium caseinate network. During the acidification of an emulsion containing excess of sodium caseinate in the continuous phase the network of emulsion droplets transformed into a network of sodium caseinate.
D C B A
Figure 4.10: Schematic picture of the different emulsion structures obtained with different amounts of stabilizer upon acidification. Ο represents an emulsion droplet covered with sodium caseinate and • represents a sodium caseinate aggregate. No correct scaling is used, in reality the sodium caseinate aggregates are at neutral pH approximately 50 times smaller than the emulsion droplets. In this work the criterion for the gel point, being a frequency independent loss tangent, is verified by DWS and for acid induced gelation of emulsions. Using this criterion, it also turned out that the sol-gel transition and the ergodic-nonergodic transition do not necessarily have to coincide. Using the criterion for the gel point, two sol-gel transitions were observed during the acidification of sodium caseinate stabilized emulsions with excess of sodium caseinate. This was explained as follows. The first transition is the result
Chapter 4
66
of a breakdown of the emulsion network due to inhibition of the depletion flocculation, and the second transition is the result of the aggregation of the sodium caseinate.
References 1. Mezzenga, R., Schurtenberger, P., Burbidge, A., Michel, M. Nature Materials 2005, 4, 729-
740. 2. Chu, B., Zhou, Z., Wu, G., Farrell, H. M. J. Colloid Interface Sci. 1995, 170, 102-112. 3. Dickinson, E., Golding, M., Povey, M. J. W. J. Colloid Interface Sci. 1997, 185, 515-529. 4. Berli, C. L. A., Quemada, D., Parker, A. Colloids Surf., A 2002, 203, 11-20. 5. Dickinson, E., Radford, S. J., Golding, M. Food Hydrocolloids 2003, 17, 211-220. 6. Radford, S. J., Dickinson, E. Colloids Surf., A 2004, 238, 71-81. 7. Dickinson, E., Golding, M. J. Colloid Interface Sci. 1997, 191, 166-176. 8. Eliot, C., Horne, D. S., Dickinson, E. Food Hydrocolloids 2005, 19, 279-287. 9. Chen, J., Dickinson, E., Edwards, M. Journal of Texture Studies 1999, 30, 377-396. 10. Winter, H. H., Mours, M. Adv. Polym. Sci. 1997, 134, 165-234. 11. Heinemann, C., Cardinaux, F., Scheffold, F., Schurtenberger, P., Escher, F., Conde-Petit, B.
Carbohydr. Polym. 2004, 55, 155-161. 12. Alexander, M., Corredig, M., Dalgleish, D. G. Food Hydrocolloids 2006, 20, 325-331. 13. Vasbinder, A. J., Mil van, P. J. J. M., Bot, A., Kruif de, C. G. Colloid and Surfaces B:
Biointerfaces 2001, 21, 245-250. 14. Weitz, D. A., Pine, D. J., Diffusing wave spectroscopy. In Dynamic light scattering, the
method and some applications, Brown, W., Ed. Clarendon Press: Oxford, 1993; pp 652-719. 15. Wyss, H. M., Romer, S., Scheffold, F., Schurtenberger, P., Gauckler, L. J. J. Colloid Interface
Sci. 2001, 240, 89-97. 16. Mason, T. G. Rheol. Acta 2000, 39, 371-378. 17. Bonnet, C., Corredig, M., Alexander, M. J. Agric. Food Chem. 2005, 53, 8600-8606. 18. Alexander, M., Dalgleish, D. G. Langmuir 2005, 21, 11380-11386. 19. Alexander, M., Rojas-Ochoa, L. F., Leser, M., Schurtenberger, P. J. Colloid Interface Sci.
2002, 253, 35-46. 20. Dalgleish, D. G., Alexander, M., Corredig, M. Food Hydrocolloids 2004, 18, 747-755. 21. Jokinen, M., Györvary, E., Rosenholm, J. B. Colloids and Surfaces A: Physicochemical and
Engineering Aspects 1998, 141, 205-216. 22. Ponton, A., Barboux-Doeuff, S., Sanchez, C. Journal of Non-Crystalline Solids 2005, 351,
45-53. 23. Muthukumar, M. Macromolecules 1989, 22, 4656-4658. 24. Ruis, H. G. M., Venema, P., Linden van der, E. Food Hydrocolloids 2006, 21, 545-555. 25. Romer, S., Scheffold, F., Schurtenberger, P. Phys. Rev. Lett. 2000, 85, 4980-4983. 26. Dasgupta, B. R., Weitz, D. A. Phys. Rev. E 2005, 71, 021504.
Transitions in structure in O/W emulsions as studied by DWS
67
27. Cardinaux, F., Stradner, A., Scheffold, F., Schurtenberger, P. 3rd International Symposium on Food Rheology and Structure 2003.
28. Eliot, C., Dickinson, E. Int. Dairy J. 2003, 13, 679-684. 29. Hemar, Y., Pinder, D. N., Hunter, R. J., Singh, H., Hébraud, P., Horne, D. S. J. Colloid
Interface Sci. 2003, 264, 502-508.

*H.G.M. Ruis, P. Venema and E. van der Linden, submitted for publication
5 Diffusing wave spectroscopy used to study the
influence of shear on aggregation Abstract In this study diffusing wave spectroscopy (DWS) is used to investigate the effect of shear on a known suspension of latex beads in water and on two different, food related, aggregating emulsions. The decay time of the autocorrelation curves decreased with increasing shear rate and the form of the autocorrelation curves changed from nearly exponential to Gaussian. The exponent of the power law fit of the mean square displacement increased from 1 to 2 with increasing shear rate, indicating that the diffusive motion of the scatterers became negligible compared to the convective motion. Considering aggregating systems, for example acidifying sodium caseinate stabilized emulsions, an exponent larger than 1 means that the aggregation can no longer be diffusion limited. The effect of shear on the acidification of sodium caseinate stabilized emulsions without and with excess of sodium caseinate in the continuous phase was studied using DWS and using a rheometer. At neutral pH the emulsion droplets in the emulsion without excess of sodium caseinate were randomly distributed while the emulsion droplets in the emulsion with excess of sodium caseinate formed a network due to depletion forces. Notable was that during the acidification down to the critical sol-gel transition point no effect of shear was found using a rheometer while DWS did show an effect of shear on the breakup of the depletion stabilized network of oil droplets. Using DWS the critical sol-gel transition point was determined, and subsequently the radius of the clusters at the critical point was calculated. The radius of the clusters at the critical point was found to decrease with increasing shear rate and also with increasing protein concentration. The results suggested that shear will result in a less dense structure of the network formed by the aggregates.
Chapter 5
70
5.1 Introduction Structure is an important parameter for numerous products and processes. To control the desired structure one has to understand the effect of different interactions and treatments on the structure formation. The process of gelation has been described as the growth of clusters of particles leading to a space-filling network. This process only succeeds if the particles are present above a critical concentration, if the attractive interparticle interactions are of sufficient strength and if the applied stress is sufficiently low.1, 2 The rheological properties of the system reflect the gel structure and are as such an indicator of the interaction potential between the particles. Many food products are processed using shear, it is therefore important to understand the effect of shear on the final structure of the product. Application of shear can induce changes in the structure, which in turn will affect the rheological behavior. In particle colloids shear can, depending on e.g. the nature of the interactions involved, produce a whole variety of effects, for example, shear thickening, shear thinning, gelation, flocculation or ordering like flow induced alignment.3 When the interaction of the particles on the periphery of the clusters is attractive, an increased shear rate can result in an increased flocculation rate, because of an increased number of collisions between particles. Shear can also cause a decrease of the aggregate size, because high shear rate causes break-up of the aggregates.4, 5 Eventually an equilibrium between formation and break-up of interaggregate bonds will be established. Due to shear aggregates can compact, which will be reflected in an increase of the fractal dimension of the aggregates. Simultaneously the volume fraction of the aggregates decreases, which will lower the viscosity of dispersions.6 In general the dynamics of colloidal systems that are driven away from equilibrium by the application of shear flow are determined by the interplay of the intrinsic relaxation of the system with shear flow.7 The particle motion is often studied using light scattering techniques like dynamic light scattering. An extension of this technique for concentrated, turbid samples is diffusing wave spectroscopy (DWS).8 Mainly static systems are studied; however this technique has also been used to study the effect of either oscillatory shear7, 9-
11or continuous shear.12-17 The extension of DWS for continuous flow has previously been used to determine the bubble dynamics in continuously sheared aqueous foam,15 and to follow the grain dynamics during flow.14, 17 At high shear rate, when the motion of the scatterers due to Brownian motion is negligible, the autocorrelation function becomes independent of l* and only depends on the shear rate.12, 15
DWS used to study the influence of shear on aggregation
71
In this work we are interested in the response of different colloidal systems to a continuous shear field. The systems subjected to shear are a suspension of latex beads in water, an aggregating sodium caseinate stabilized emulsion, and an aggregating sodium caseinate stabilized emulsion with excess of sodium caseinate in the continuous phase. At neutral pH the excess of sodium caseinate in the continuous phase forms small aggregates (~10 nm), which cause the formation of a depletion stabilized network of oil droplets.18 Aggregation of the emulsions used can also be induced by continuous, slow acidification to pH 4.6, which is the isoelectric point of sodium caseinate. To understand the aggregation behavior and the effect of shear on the aggregation of these emulsions is relevant for the food industry, especially for the dairy industry. The effect of continuous shear on the structure formation was studied using a rheometer and using DWS. Notable are the differences before the sol-gel transition as measured by DWS and classical rheology. Using DWS the critical (sol-gel) transition point as a function of the shear rate was determined. Subsequently the radius of the clusters formed at the critical point was estimated, where a decreasing radius of the clusters with increasing shear rate was obtained. The results suggested a decreasing density of the network formed by the aggregates with increasing shear rate
5.2 DWS under shear An important parameter for DWS is the photon transport mean free path, l*.19 The value of l* can be determined using the average intensity of the transmitted light of a sample combined with the transmission, T, of a reference sample with known l* by: 19-21 22
LlLl
IIT
3*413*5
0 +== [ 5.1 ]
In this equation I0 and I are the initial and transmitted average intensities of the light and L is the optical path length. For completely non-interacting scatterers, which are spatially completely uncorrelated, the value of l* depends on the particle size, particle concentration, index of refraction of the scatterers and of the dispersion medium and the wavelength of the laser light.23, 24 DWS measures the intensity autocorrelation function of multiply scattered light, ( )tg 2 , as a
function of time. Light scattered from the system is supposed to be completely randomized and its path can be described by diffusion theory.12 Furthermore, all scattering events are approached by an average scattering event.8 In ergodic systems ( )tg 2 is related to the
Chapter 5
72
motion of the scatterers by the following equation,15 where the last equality follows from the Siegert relation.25
( ) ( ) ( ) ( ) 21
2
02 *3
1exp1 tgdslstXsPtg ββ =⎟
⎟⎠
⎞⎜⎜⎝
⎛⎟⎠⎞
⎜⎝⎛−=− ∫
∞
[ 5.2 ]
In this equation β is a constant, smaller than one, determined primarily by the collection optics, P(s) is the path-length distribution function of paths of length s, and the term X(t) represents the average contribution of a moving scatterer to the dephasing of a light path.15 The path length distribution function P(s) of equation 5.2 depends on the geometry used. For light transmitted through a slab-shaped sample that is much wider than it is thick and which is also optically thick, 10* >lL , with negligible absorption,8, 15 it has been shown
that, using an incident beam of arbitrary width, equation 5.2 reduces to the following expression:8
( ) ( )( ) ( ) ( )∫∞
−−−−=Q
Q deDeCtg ξξζεξ ξζδξ 141 ,,
222 [ 5.3 ]
In this equation C is a normalization constant chosen so that ( ) 101 =g ; ( ) ( )tXlLQ */≡ ;
Ll 3*2≡ε ; LlLz *0 ≈≡ζ and Ld≡δ , where d is the Gaussian diameter of the
illuminating light beam. The function ( )ζεξ ,,D is given by:
( ) ( ) ( )[ ]( ) ( ) ξ
ζξ
εξεξεξεξεζεξ
222
2
11112,,
−
−
−−+
−−+=
eeD [ 5.4 ]
The term X(t) depends on the motion of the scatterers. For stochastic motion, only Brownian motion has to be taken into account. For pure diffusive Brownian
motion ( ) 06 τttX = , with 200 1 Dk≡τ .12, 15 In the latter equality D ( aTkD B πη6= ) is
the diffusion coefficient of the scatterers with radius a, dispersed in a continuous phase with viscosity η and λπnk 20 = with n the refractive index of the solvent and λ the
wavelength of the laser. For suspensions of colloidal particles subjected to homogeneous laminar flow the relative positions between the scatters are correlated and evolve
deterministically. In this case ( ) ( )26 SttX τ= , with12, 13, 15
γτ
&*30
0lkS ≡ [ 5.5 ]
DWS used to study the influence of shear on aggregation
73
Here γ& is the macroscopically applied shear rate. Both 0τ and Sτ represent an average
time for wavelength-scale motion between successive scattering sites, a distance l* apart,15 due to diffusive and convective motion respectively In the absence of shear ( )tg1 has an exponential decay of ( )02exp τt− per scattering
event, which is characteristic for pure diffusive motion. For a system in which Brownian
motion can be neglected, ( )tg1 has a Gaussian decay of ( )( )22exp St τ− per scattering
event, which is characteristic for convective motion.12, 13 When a system under continuous shear is described, the motion of the particles will be caused by the Brownian motion as well as by the applied shear. Assuming that the Brownian motion is not affected by the flow field, the total displacement of a scatterer can
be separated into a diffusive and convective part. In this case ( ) ( )20 66 StttX ττ += .
From this equation follows that for times when ( ) ( )20 Stt ττ >> the Brownian motion of
the scatterers is responsible for the decay of the autocorrelation function.15 The total mean square displacement also consists of a contribution of the diffusive as well as of the convective motion and can be calculated by:
( ) ( ) 20
2 ktXtrtotal
=Δ [ 5.6 ]
It is assumed that the contribution of the convective motion to the mean square displacement is only affected by the applied shear rate and does not depend on the rheological properties of the system. In this case the contribution of the Brownian motion of the scatterers to the mean square displacement can be deduced. From the latter the short time behavior can generally be described as a power law:
( ) ( ) ( ) pconvectivetotalbrownian
ttrtrtr ≈Δ−Δ=Δ 222 [ 5.7 ]
For thermally-driven spheres, the exponent p must lie between zero, corresponding to the elastic confinement, and one, corresponding to viscous diffusion.26 The storage and loss modulus of the system can subsequently be calculated using an algebraic method, as given by Mason,26 which is based on a local power law expansion of the mean square displacement only caused by the Brownian motion of the scatterers.
5.3 Materials and methods 5.3.1 Materials Sodium caseinate, with a protein content over 90%, was obtained from DMV-International (Veghel, the Netherlands). Palm fat was obtained from Barentz Raw Materials (Hoofddorp,
Chapter 5
74
the Netherlands. Glucono-δ-lactone (GDL) was obtained from Fluka, Riedel de Haën (Buch, Switzerland) and thiomersal from Merck (Schuchart, Germany). 5.3.2 Sample preparation Solutions of sodium caseinate were prepared by dissolving the required amount of sodium caseinate in demineralised water, followed by gently stirring overnight at 4°C. A stock emulsion containing 30 wt% of palm fat and 1.2 wt% of sodium caseinate was prepared. For the preparation of the stock emulsion a mixture of sodium caseinate solution and palm fat was heated at 60°C until all fat was melted. This mixture was prehomogenized using an Ultra Turrax (Polytron, Switzerland) and subsequently homogenized with a Ranny homogenizer (Rannie, Copenhagen, Denmark) at a pressure of 35 Bar and a temperature of 60°C for 25 minutes. The stock emulsion hardly contained excess of sodium caseinate in the continuous phase and had a D3,2-value of 0.8 ± 0.02 μm as determined from laser diffraction (Coulter LS 230, Miami, USA). Samples with different fat and sodium caseinate content were prepared by dilution of the stock emulsion with a concentrated sodium caseinate solution and dematerialized water. All samples contained a final amount of 0.02 wt% thiomersal to prevent bacterial spoilage. Acid induced gelation of the emulsions was induced by a continuous, non-linear, slow decrease of the pH towards the iso-electric point of sodium caseinate (~pH 4.6) using GDL. For the acidification 0.15 gram GDL granules per gram of sodium caseinate was added to the emulsions. A pH of 4.6 ± 0.1 was reached within 10 hours after the addition of GDL. The development of the pH in time was monitored at 25°C. 5.3.3 Rheometry Dynamic as well as static measurements were carried out using a Paar Physica MCR 300 (Anton Paar, Austria) stress-controlled rheometer, operating in a strain-controlled mode through a feedback loop. A Couette geometry (CC17) with a gap size of 0.71 mm was used. The effect of shear during acidification at 25°C was studied. The acidifying samples were continuously sheared at a rate of either 0.005, 0.01, 0.1, 1, or 10 s-1 for 7 hours. After 7 hours the pH of all samples was 4.7 ± 0.1. The obtained structures were subsequently characterized with a frequency sweep and a strain sweep. The pH was monitored during all acidification experiments. The effect of shear up on the onset of aggregation was also studied. A continuous shear rate of either 0.005, 0.01, 0.1, 1, or 10 s-1 was applied to the samples until the torque of the rheometer became above 5 µNm, which is the point at which rapid aggregation of the
DWS used to study the influence of shear on aggregation
75
acidifying emulsions started. From that point on the gelation was followed, for 3.5 hours, using a dynamic measurement with a strain of 0.5% and a frequency of 0.1 Hz. The obtained structures, with a final pH of 4.7 ± 0.1, were subsequently characterized with a frequency sweep and a strain sweep. For both emulsions the torque value exceeded 5 µNm at a pH of 5.17 ± 0.05, independent of the shear rate used. Besides, no effect of preshear on the rheological behavior of the final gel was observed for the two different emulsions studied. Because of this these results will not be further discussed. 5.3.4 Diffusing Wave Spectroscopy under shear In order to follow the effect of shear on the structure formation with DWS, samples were contained in a parallel plate shear cell (Linkam Scientific Instruments, type CSS 450), with a rotating lower plate and a fixed upper plate and a gap size of 2.00 mm. A HeNe-laser (20 mW), operating at a wavelength of 633 nm, was vertically placed above the shear cell. The optical path length through the cell was 2.00 mm. The cell was illuminated at a distance of 7.5 mm from the centre of the parallel plates with an expanded laser beam (2.0 mm diameter). The latex beads or emulsion droplets caused multiple scattering of the light. The multiply scattered light transmitted through the cell was collected with a single-mode optical fiber. The signal was equally split into two by a polarization cube and directed into two separate photomultiplier tubes (ALV / SO-SIPD, ALV, Germany). The output of these two tubes was cross-correlated using an ALV-6010 correlator (ALV, Germany), to obtain the autocorrelation function. A latex sample (with a diameter of the latex spheres of 892 nm) with known l* (photon transport mean free path) was used as a reference sample.
5.4 Results and Discussion 5.4.1 Water A suspension of latex beads (bead size 892 nm) in water with known l* (330 nm) was continuously sheared ( γ& ranged from 0 to 200 s-1) to investigate the effect of shear using
DWS. The relative motion of the latex beads was expected to increase with increasing shear rate causing that the diffusive motion of the latex beads eventually became negligible. The average transmitted intensity was found to be independent of the applied shear. This was also observed for sheared foams.15 According to equation 5.1, the average transmitted intensity is directly related to l*, meaning that l* is also independent of the shear rate. Figure 5.1A shows the autocorrelation curves obtained for shear rates ranging from 0 s-1 (right) to 200 s-1 (left). Figure 5.1B shows the corresponding decay time, τ1/2, defined by
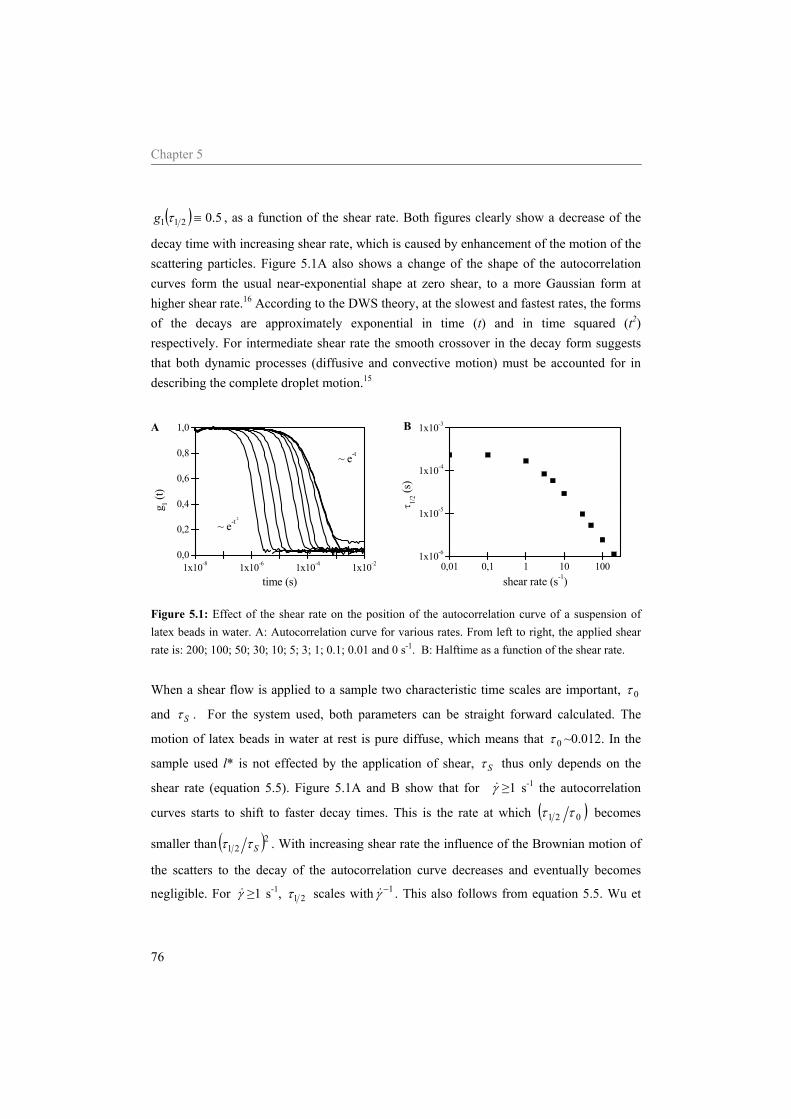
Chapter 5
76
( ) 5.0211 ≡τg , as a function of the shear rate. Both figures clearly show a decrease of the
decay time with increasing shear rate, which is caused by enhancement of the motion of the scattering particles. Figure 5.1A also shows a change of the shape of the autocorrelation curves form the usual near-exponential shape at zero shear, to a more Gaussian form at higher shear rate.16 According to the DWS theory, at the slowest and fastest rates, the forms of the decays are approximately exponential in time (t) and in time squared (t2) respectively. For intermediate shear rate the smooth crossover in the decay form suggests that both dynamic processes (diffusive and convective motion) must be accounted for in describing the complete droplet motion.15
1x10⁻⁸ 1x10⁻⁶ 1x10⁻⁴ 1x10-20,0
0,2
0,4
0,6
0,8
1,0A
~ e-t 2
~ e-t
g 1 (t)
time (s)
0,01 0,1 1 10 1001x10-6
1x10⁻⁵
1x10⁻⁴
1x10⁻³B
τ 1/
2 (s)
shear rate (s-1)
Figure 5.1: Effect of the shear rate on the position of the autocorrelation curve of a suspension of latex beads in water. A: Autocorrelation curve for various rates. From left to right, the applied shear rate is: 200; 100; 50; 30; 10; 5; 3; 1; 0.1; 0.01 and 0 s-1. B: Halftime as a function of the shear rate. When a shear flow is applied to a sample two characteristic time scales are important, 0τ
and Sτ . For the system used, both parameters can be straight forward calculated. The
motion of latex beads in water at rest is pure diffuse, which means that 0τ ~0.012. In the
sample used l* is not effected by the application of shear, Sτ thus only depends on the
shear rate (equation 5.5). Figure 5.1A and B show that for γ& ≥1 s-1 the autocorrelation
curves starts to shift to faster decay times. This is the rate at which ( )021 ττ becomes
smaller than ( )221 Sττ . With increasing shear rate the influence of the Brownian motion of
the scatters to the decay of the autocorrelation curve decreases and eventually becomes
negligible. For γ& ≥1 s-1, 21τ scales with 1−γ& . This also follows from equation 5.5. Wu et
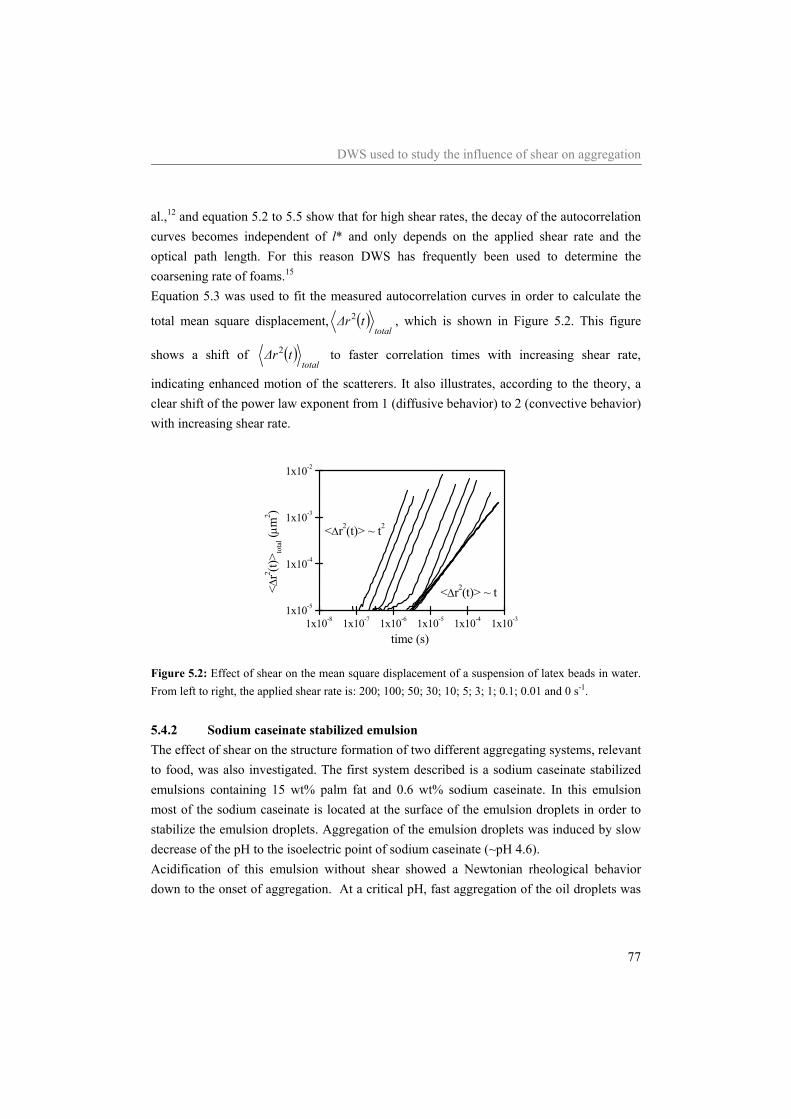
DWS used to study the influence of shear on aggregation
77
al.,12 and equation 5.2 to 5.5 show that for high shear rates, the decay of the autocorrelation curves becomes independent of l* and only depends on the applied shear rate and the optical path length. For this reason DWS has frequently been used to determine the coarsening rate of foams.15 Equation 5.3 was used to fit the measured autocorrelation curves in order to calculate the
total mean square displacement, ( )total
tΔr2 , which is shown in Figure 5.2. This figure
shows a shift of ( )total
tΔr2 to faster correlation times with increasing shear rate,
indicating enhanced motion of the scatterers. It also illustrates, according to the theory, a clear shift of the power law exponent from 1 (diffusive behavior) to 2 (convective behavior) with increasing shear rate.
1x10⁻⁸ 1x10⁻⁷ 1x10⁻⁶ 1x10⁻⁵ 1x10⁻⁴ 1x10-31x10-5
1x10⁻⁴
1x10⁻³
1x10⁻²
<Δr2(t)> ~ t2
<Δr2(t)> ~ t
<Δr2 (t)
> tota
l (μm
2 )
time (s)
Figure 5.2: Effect of shear on the mean square displacement of a suspension of latex beads in water. From left to right, the applied shear rate is: 200; 100; 50; 30; 10; 5; 3; 1; 0.1; 0.01 and 0 s-1. 5.4.2 Sodium caseinate stabilized emulsion The effect of shear on the structure formation of two different aggregating systems, relevant to food, was also investigated. The first system described is a sodium caseinate stabilized emulsions containing 15 wt% palm fat and 0.6 wt% sodium caseinate. In this emulsion most of the sodium caseinate is located at the surface of the emulsion droplets in order to stabilize the emulsion droplets. Aggregation of the emulsion droplets was induced by slow decrease of the pH to the isoelectric point of sodium caseinate (~pH 4.6). Acidification of this emulsion without shear showed a Newtonian rheological behavior down to the onset of aggregation. At a critical pH, fast aggregation of the oil droplets was
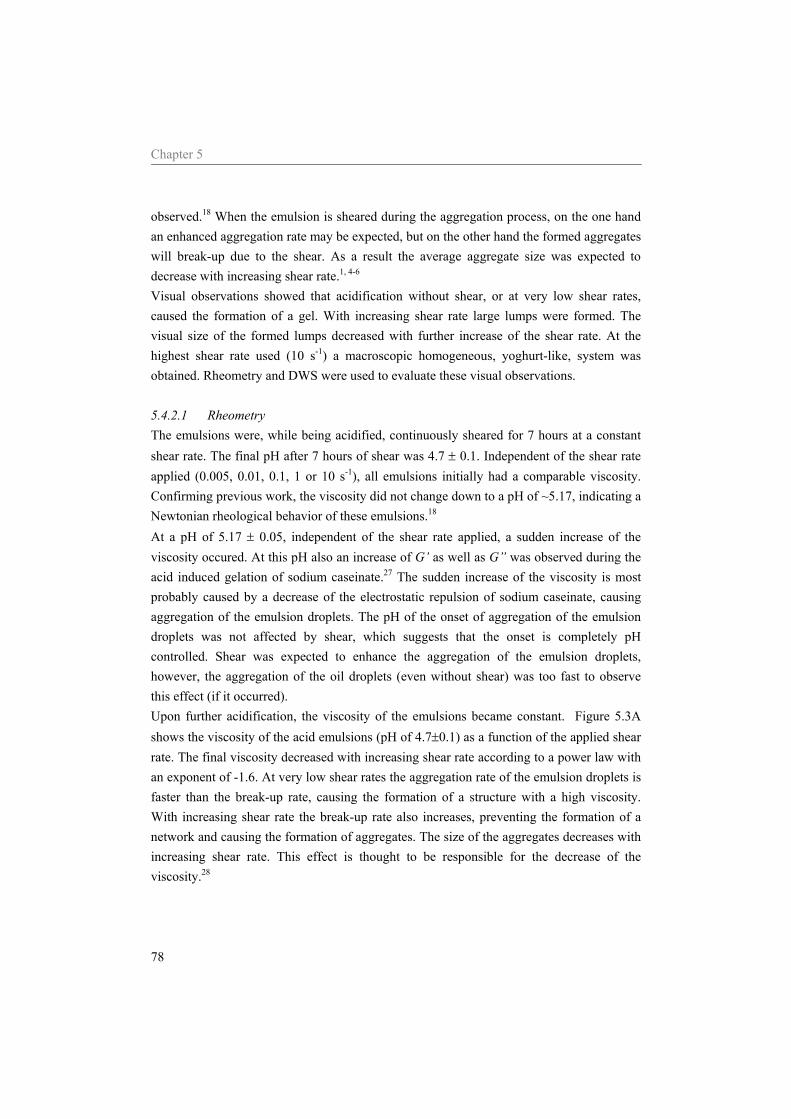
Chapter 5
78
observed.18 When the emulsion is sheared during the aggregation process, on the one hand an enhanced aggregation rate may be expected, but on the other hand the formed aggregates will break-up due to the shear. As a result the average aggregate size was expected to decrease with increasing shear rate.1, 4-6 Visual observations showed that acidification without shear, or at very low shear rates, caused the formation of a gel. With increasing shear rate large lumps were formed. The visual size of the formed lumps decreased with further increase of the shear rate. At the highest shear rate used (10 s-1) a macroscopic homogeneous, yoghurt-like, system was obtained. Rheometry and DWS were used to evaluate these visual observations. 5.4.2.1 Rheometry The emulsions were, while being acidified, continuously sheared for 7 hours at a constant shear rate. The final pH after 7 hours of shear was 4.7 ± 0.1. Independent of the shear rate applied (0.005, 0.01, 0.1, 1 or 10 s-1), all emulsions initially had a comparable viscosity. Confirming previous work, the viscosity did not change down to a pH of ~5.17, indicating a Newtonian rheological behavior of these emulsions.18 At a pH of 5.17 ± 0.05, independent of the shear rate applied, a sudden increase of the viscosity occured. At this pH also an increase of G’ as well as G” was observed during the acid induced gelation of sodium caseinate.27 The sudden increase of the viscosity is most probably caused by a decrease of the electrostatic repulsion of sodium caseinate, causing aggregation of the emulsion droplets. The pH of the onset of aggregation of the emulsion droplets was not affected by shear, which suggests that the onset is completely pH controlled. Shear was expected to enhance the aggregation of the emulsion droplets, however, the aggregation of the oil droplets (even without shear) was too fast to observe this effect (if it occurred). Upon further acidification, the viscosity of the emulsions became constant. Figure 5.3A shows the viscosity of the acid emulsions (pH of 4.7±0.1) as a function of the applied shear rate. The final viscosity decreased with increasing shear rate according to a power law with an exponent of -1.6. At very low shear rates the aggregation rate of the emulsion droplets is faster than the break-up rate, causing the formation of a structure with a high viscosity. With increasing shear rate the break-up rate also increases, preventing the formation of a network and causing the formation of aggregates. The size of the aggregates decreases with increasing shear rate. This effect is thought to be responsible for the decrease of the viscosity.28
DWS used to study the influence of shear on aggregation
79
After being sheared for 7 hours, the viscoelastic behavior of the under shear acidified emulsions was determined. Figure 5.3B shows G’ (solid symbols) and G” (open symbols)
as a function of the shear rate used during acidification. For low shear rates, γ& ≤ 0.01 s-1, an
increase of G’ and G” is obtained, compared to when no shear (indicated before the break) is applied during acidification. Without shear, none of the links formed between the emulsion droplets will break. At low shear rate, first the weakest link will break, the strongest links become extended, but will remain. This can result in a slightly higher G’ and G” of the network formed. Corresponding to the observed decrease of the viscosity with increasing shear rate (Figure 5.3A), for γ& > 0.01 s-1, G’ as well as G” decreased with increasing shear rate, indicating a
decrease of the strength of the formed network with increasing shear rate. This can be explained by an increasing destruction of the bonds within the system, which will result in smaller aggregates. Note that the loss tangent, determined at a pH of 4.7 ± 0.1, was not affected by shear. After cessation of shear a gel was formed at all shear rates used.
1x10⁻³ 1x10⁻² 1x10⁻¹ 1x100 1x101 1x1021x10-3
1x10⁻¹
1x101
1x10³
1x10⁵A
visc
osity
(Pa
s)
shear rate (s-1)
1x10⁻² 1x10⁻¹ 1x100 1x101 1x1020.1
1
10
100
1000
10000B
G',
G"
(Pa)
shear rate (s-1)
Figure 5.3: Rheological properties of acid (pH~4.7) emulsions containing 15 wt% palm fat and 0.6 wt% sodium caseinate. The emulsions were continuously sheared during the whole acidification process at the shear rates indicated. A: Viscosity B: G’ ( ) and G” ( ). G’ and G” indicated for the break are obtained without shear. 5.4.2.2 DWS According to equation 5.1 the average transmitted intensity depends on l*. A change of l* therefore indicates a structural transition.18 Figure 5.4 shows the effect of shear on l* during the acidification of a sodium caseinate stabilized emulsion. When the emulsion is acidified in rest, l* remains constant down to a pH of 5.2 ± 0.05 (Figure 5.4). Upon further decrease
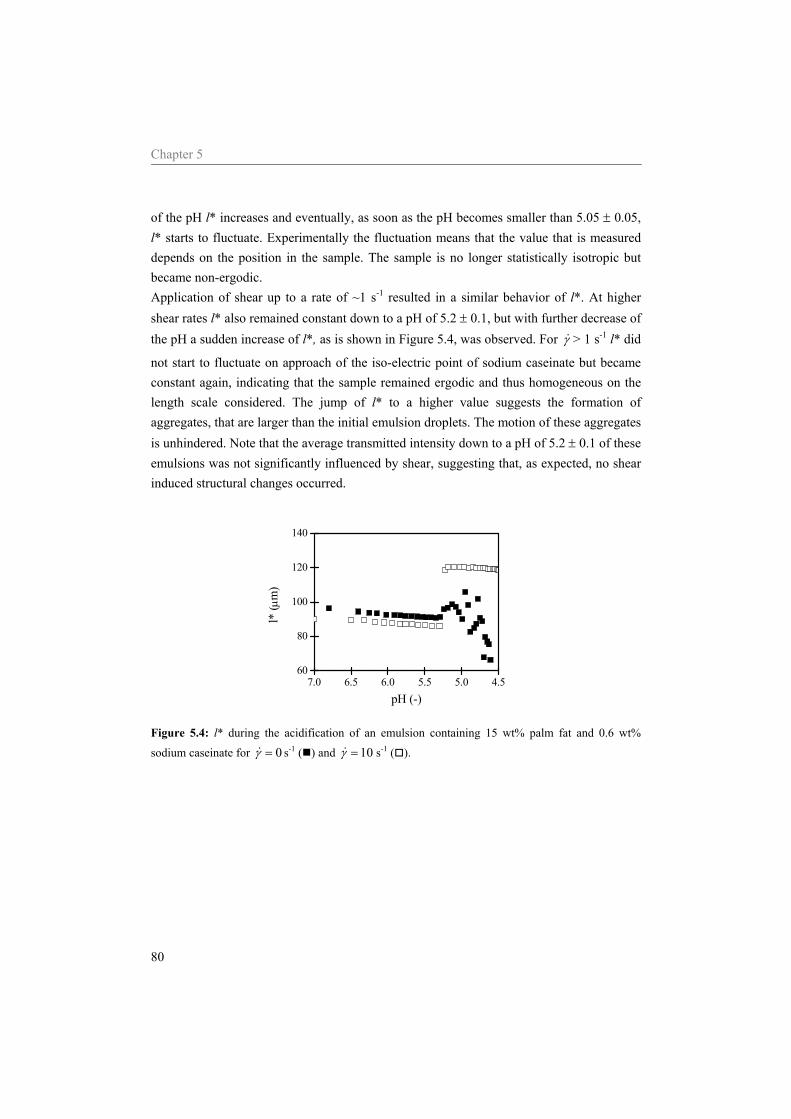
Chapter 5
80
of the pH l* increases and eventually, as soon as the pH becomes smaller than 5.05 ± 0.05, l* starts to fluctuate. Experimentally the fluctuation means that the value that is measured depends on the position in the sample. The sample is no longer statistically isotropic but became non-ergodic. Application of shear up to a rate of ~1 s-1 resulted in a similar behavior of l*. At higher shear rates l* also remained constant down to a pH of 5.2 ± 0.1, but with further decrease of the pH a sudden increase of l*, as is shown in Figure 5.4, was observed. For γ& > 1 s-1 l* did
not start to fluctuate on approach of the iso-electric point of sodium caseinate but became constant again, indicating that the sample remained ergodic and thus homogeneous on the length scale considered. The jump of l* to a higher value suggests the formation of aggregates, that are larger than the initial emulsion droplets. The motion of these aggregates is unhindered. Note that the average transmitted intensity down to a pH of 5.2 ± 0.1 of these emulsions was not significantly influenced by shear, suggesting that, as expected, no shear induced structural changes occurred.
7.0 6.5 6.0 5.5 5.0 4.560
80
100
120
140
l* (μ
m)
pH (-)
Figure 5.4: l* during the acidification of an emulsion containing 15 wt% palm fat and 0.6 wt%
sodium caseinate for 0=γ& s-1 ( ) and 10=γ& s-1 ( ).
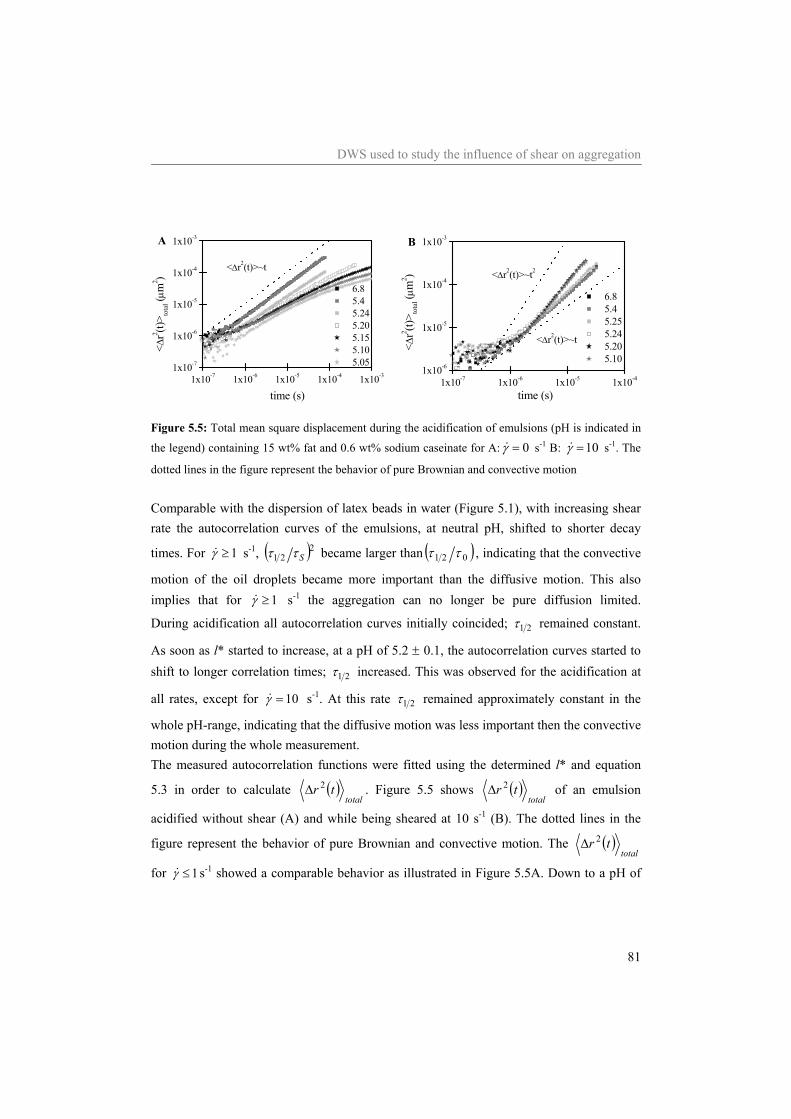
DWS used to study the influence of shear on aggregation
81
1x10⁻⁷ 1x10⁻⁶ 1x10⁻⁵ 1x10⁻⁴ 1x10-31x10-7
1x10⁻⁶
1x10⁻⁵
1x10⁻⁴
1x10⁻³
<Δr2(t)>~t
A
<Δr2 (t)
> tota
l (μm
2 )
time (s)
6.8 5.4 5.24 5.20 5.15 5.10 5.05
1x10⁻⁷ 1x10⁻⁶ 1x10⁻⁵ 1x10-41x10-6
1x10⁻⁵
1x10⁻⁴
1x10⁻³
<Δr2(t)>~t
<Δr2(t)>~t2
B
<Δr2 (t)
> tota
l (μm
2 )time (s)
6.8 5.4 5.25 5.24 5.20 5.10
Figure 5.5: Total mean square displacement during the acidification of emulsions (pH is indicated in
the legend) containing 15 wt% fat and 0.6 wt% sodium caseinate for A: 0=γ& s-1 B: 10=γ& s-1. The
dotted lines in the figure represent the behavior of pure Brownian and convective motion Comparable with the dispersion of latex beads in water (Figure 5.1), with increasing shear rate the autocorrelation curves of the emulsions, at neutral pH, shifted to shorter decay
times. For 1≥γ& s-1, ( )221 Sττ became larger than ( )021 ττ , indicating that the convective
motion of the oil droplets became more important than the diffusive motion. This also implies that for 1≥γ& s-1 the aggregation can no longer be pure diffusion limited.
During acidification all autocorrelation curves initially coincided; 21τ remained constant.
As soon as l* started to increase, at a pH of 5.2 ± 0.1, the autocorrelation curves started to shift to longer correlation times; 21τ increased. This was observed for the acidification at
all rates, except for 10=γ& s-1. At this rate 21τ remained approximately constant in the
whole pH-range, indicating that the diffusive motion was less important then the convective motion during the whole measurement. The measured autocorrelation functions were fitted using the determined l* and equation
5.3 in order to calculate ( )total
tr 2Δ . Figure 5.5 shows ( )total
tr 2Δ of an emulsion
acidified without shear (A) and while being sheared at 10 s-1 (B). The dotted lines in the
figure represent the behavior of pure Brownian and convective motion. The ( )total
tr 2Δ
for 1≤γ& s-1 showed a comparable behavior as illustrated in Figure 5.5A. Down to a pH of
Chapter 5
82
~5.3 all curves of ( )total
tr 2Δ coincided. The power law exponent of the short time
behavior of ( )total
tr 2Δ (equation 5.6) remained 1, down to a pH of 5.2 ± 0.1 (at this pH l*
and of 21τ started to increase). With further decrease of the pH, ( )total
tr 2Δ shifted to
longer correlation times, the power law exponent decreased, and for longer correlation
times ( )total
tr 2Δ reaches a plateau value. The decrease of the power law exponent
indicates that the Brownian motion of the scatterers is inhibited. As soon as the exponent becomes 0.7, an ercodic non-ergodic transition occurs.25, 29-31
Notable is the behavior of ( )total
tr 2Δ when the emulsion is sheared during acidification at
10=γ& s-1 (Figure 5.5B). The initial power law exponent of ( )total
tr 2Δ is larger than 1,
indicating a significant contribution of the convective motion to the total motion of the
scatterers. Down to a pH of ~5.25 all ( )total
tr 2Δ coincided. At a pH of 5.24 ( )total
tr 2Δ
jumped, in contrast with the emulsions acidified at 1≤γ& s-1, to shorter correlation times and
the power law exponent increased. An increase of the power law exponent indicates and increase of the contribution of the convective motion. This can be explained by an increase of the average particle size, which causes a decrease of the diffusive motion. The sample remained ergodic over the whole pH-range. This was also shown in Figure 5.4 where l* became constant at pH<5.2, and macroscopic by the appearance of an homogeneous sample. In order to calculate the viscoelastic moduli of the emulsions during acidification, the mean square displacement caused by the Brownian motion of the emulsion droplets,
( )brownian
tr2Δ , was extracted from ( )total
tr 2Δ , according to equation 5.6. It was
assumed that the convective and the Brownian motion are independent of each other. From
the short time behavior of ( )brownian
tr2Δ the power law exponent p was also obtained.
Subsequently, using the algebraic method introduced by Mason, the viscoelastic moduli of the systems were calculated. To obtain an estimate of the viscoelastic moduli (especially G’) p must have a value between 0 and 1. For p=1, G’ ≡0 and for p>1 G’ is negative. The viscoelastic moduli were subsequently used to determine the critical sol-gel transition point, which was defined by a frequency independent loss tangent.32 Earlier work18 showed that
DWS used to study the influence of shear on aggregation
83
the critical transition point, for these emulsions did not coincide with the ergodic-non-ergodic transition point.
The power law exponent p calculated for ( )brownian
tr2Δ remained larger than 1 for shear
rates above 1 s-1, which indicates that the assumption of the Brownian motion and the convective motion being independent of each other, is violated. Besides, it also means that G’ is negative, which does not have a physical meaning. For these samples the point at which l* jumped to a higher value was used as the critical transition point (no longer sol-gel transition point, because as long as the sample is sheared no gel is formed).
At the transition point of the samples sheared at 1≤γ& s-1, we find that nGG ω~"~' ,
indicating the occurrence of a percolation transition. The value of n slightly increased with increasing shear rate. However, we have to wonder about the physical meaning of this. Is percolation theory still valid for a sample being sheared? Assuming validity of percolation theories, and the formation of a percolation network, then an increase of n would indicate a decrease of the fractal dimension, df , of the network formed by the aggregates,33 and thus the formation of a less dense network. A decrease of the df of the network at first sight seems in contrast with work of others,1, 6,
28, 34 who all found an increase of the df of the aggregates with increasing shear rate. The aggregates formed at high shear rate were smaller, and the internal structure of the aggregates became more compact. The volume fraction of the aggregates thus decreased. This subsequently will cause a less dense structure of the network formed by the aggregates with increasing shear rate. The df of the network, instead of the df of the aggregates, as is determined in this work, will thus decrease with increasing shear rate. The transition point was determined by either tan ð being independent of the frequency or by the jump of l*. Assuming that the viscosity of the continuous phase did not change upon aggregation down to the gel point (indicated by the rheological experiments), an average radius at the critical point was calculated from the diffusion coefficient of the scatterers. In order to obtain an estimate of the average radius of the scatterers at the critical point, the assumption was made that the autocorrelation functions could be fitted using a time independent relaxation time, 0τ , and that any change of the diffusion coefficient was
caused by change of the size of the scattering particles and not by a change of the viscosity. Figure 5.6 shows a clear trend of a decreasing radius with increasing shear rate, confirming our expectations and earlier work.1, 6, 28, 34 This can be explained by an increased break-up rate of the aggregate with increasing shear rate.
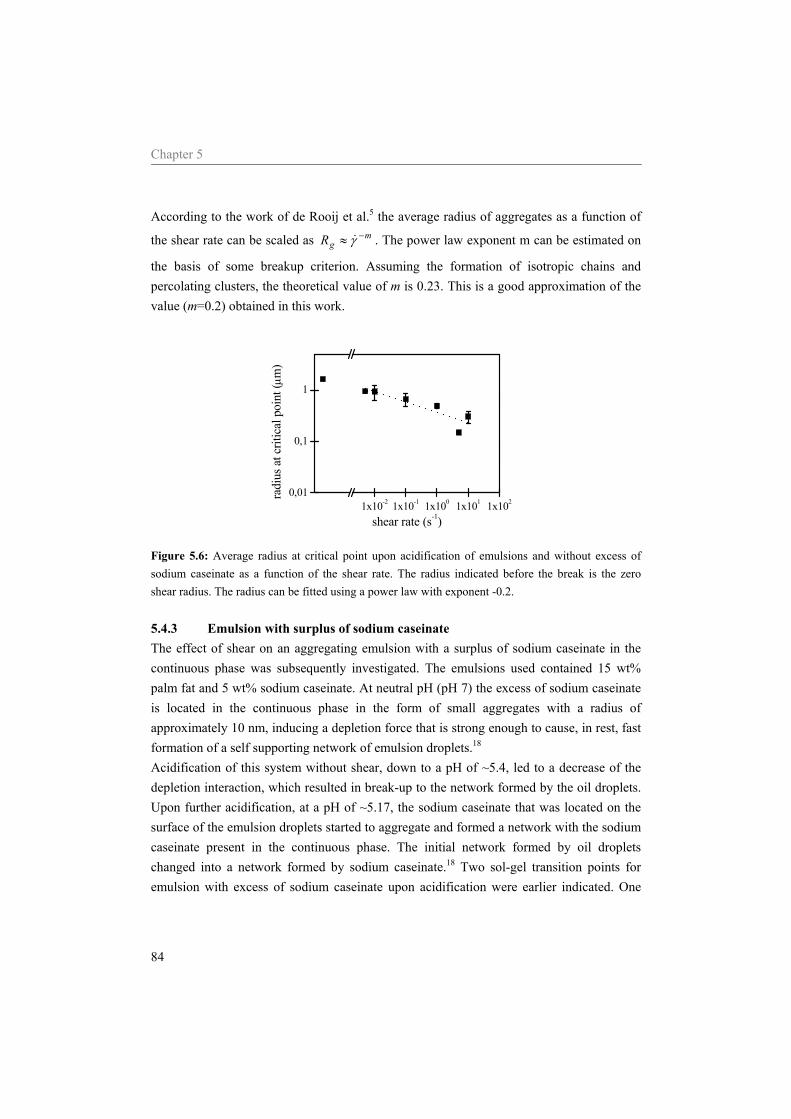
Chapter 5
84
According to the work of de Rooij et al.5 the average radius of aggregates as a function of
the shear rate can be scaled as mgR −≈ γ& . The power law exponent m can be estimated on
the basis of some breakup criterion. Assuming the formation of isotropic chains and percolating clusters, the theoretical value of m is 0.23. This is a good approximation of the value (m=0.2) obtained in this work.
1x10⁻² 1x10⁻¹ 1x100 1x101 1x1020,01
0,1
1
radi
us a
t crit
ical
poi
nt (μ
m)
shear rate (s-1)
Figure 5.6: Average radius at critical point upon acidification of emulsions and without excess of sodium caseinate as a function of the shear rate. The radius indicated before the break is the zero shear radius. The radius can be fitted using a power law with exponent -0.2. 5.4.3 Emulsion with surplus of sodium caseinate The effect of shear on an aggregating emulsion with a surplus of sodium caseinate in the continuous phase was subsequently investigated. The emulsions used contained 15 wt% palm fat and 5 wt% sodium caseinate. At neutral pH (pH 7) the excess of sodium caseinate is located in the continuous phase in the form of small aggregates with a radius of approximately 10 nm, inducing a depletion force that is strong enough to cause, in rest, fast formation of a self supporting network of emulsion droplets.18 Acidification of this system without shear, down to a pH of ~5.4, led to a decrease of the depletion interaction, which resulted in break-up to the network formed by the oil droplets. Upon further acidification, at a pH of ~5.17, the sodium caseinate that was located on the surface of the emulsion droplets started to aggregate and formed a network with the sodium caseinate present in the continuous phase. The initial network formed by oil droplets changed into a network formed by sodium caseinate.18 Two sol-gel transition points for emulsion with excess of sodium caseinate upon acidification were earlier indicated. One
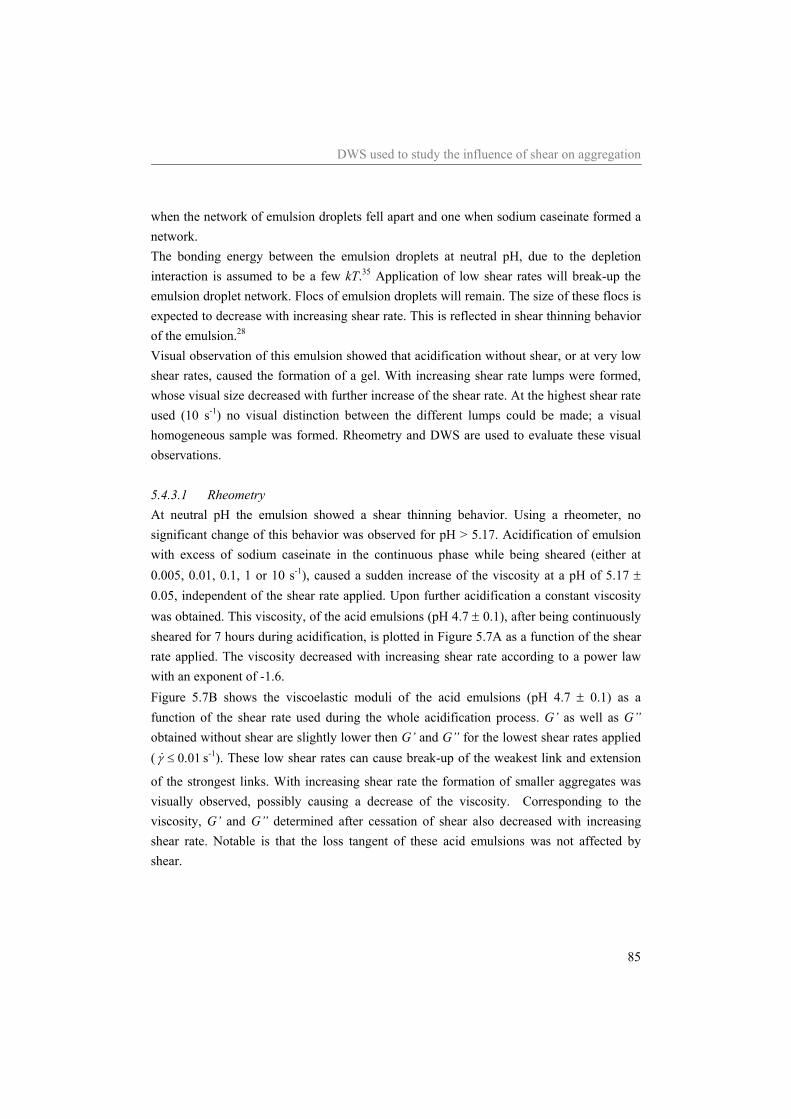
DWS used to study the influence of shear on aggregation
85
when the network of emulsion droplets fell apart and one when sodium caseinate formed a network. The bonding energy between the emulsion droplets at neutral pH, due to the depletion interaction is assumed to be a few kT.35 Application of low shear rates will break-up the emulsion droplet network. Flocs of emulsion droplets will remain. The size of these flocs is expected to decrease with increasing shear rate. This is reflected in shear thinning behavior of the emulsion.28 Visual observation of this emulsion showed that acidification without shear, or at very low shear rates, caused the formation of a gel. With increasing shear rate lumps were formed, whose visual size decreased with further increase of the shear rate. At the highest shear rate used (10 s-1) no visual distinction between the different lumps could be made; a visual homogeneous sample was formed. Rheometry and DWS are used to evaluate these visual observations. 5.4.3.1 Rheometry At neutral pH the emulsion showed a shear thinning behavior. Using a rheometer, no significant change of this behavior was observed for pH > 5.17. Acidification of emulsion with excess of sodium caseinate in the continuous phase while being sheared (either at 0.005, 0.01, 0.1, 1 or 10 s-1), caused a sudden increase of the viscosity at a pH of 5.17 ± 0.05, independent of the shear rate applied. Upon further acidification a constant viscosity was obtained. This viscosity, of the acid emulsions (pH 4.7 ± 0.1), after being continuously sheared for 7 hours during acidification, is plotted in Figure 5.7A as a function of the shear rate applied. The viscosity decreased with increasing shear rate according to a power law with an exponent of -1.6. Figure 5.7B shows the viscoelastic moduli of the acid emulsions (pH 4.7 ± 0.1) as a function of the shear rate used during the whole acidification process. G’ as well as G” obtained without shear are slightly lower then G’ and G” for the lowest shear rates applied ( 01.0≤γ& s-1). These low shear rates can cause break-up of the weakest link and extension
of the strongest links. With increasing shear rate the formation of smaller aggregates was visually observed, possibly causing a decrease of the viscosity. Corresponding to the viscosity, G’ and G” determined after cessation of shear also decreased with increasing shear rate. Notable is that the loss tangent of these acid emulsions was not affected by shear.
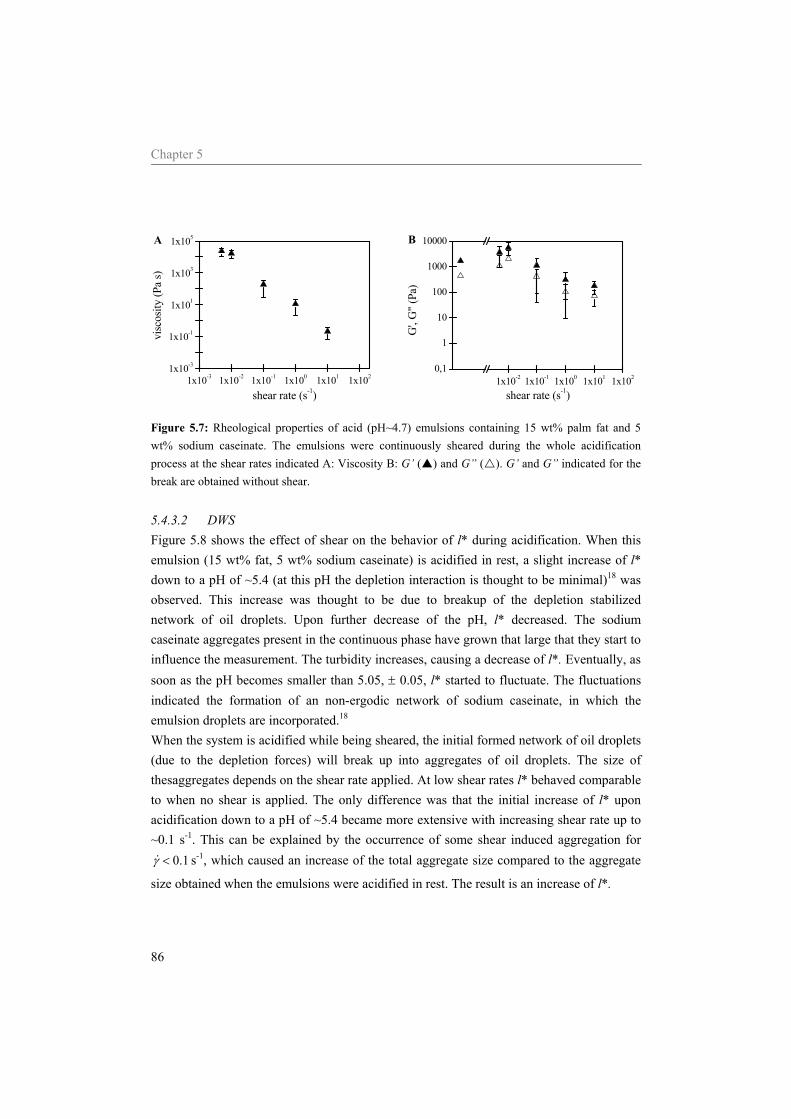
Chapter 5
86
1x10⁻³ 1x10⁻² 1x10⁻¹ 1x100 1x101 1x1021x10-3
1x10⁻¹
1x101
1x10³
1x10⁵A
visc
osity
(Pa
s)
shear rate (s-1)
1x10⁻² 1x10⁻¹ 1x100 1x101 1x1020,1
1
10
100
1000
10000B
G',
G"
(Pa)
shear rate (s-1)
Figure 5.7: Rheological properties of acid (pH~4.7) emulsions containing 15 wt% palm fat and 5 wt% sodium caseinate. The emulsions were continuously sheared during the whole acidification process at the shear rates indicated A: Viscosity B: G’ ( ) and G” ( ). G’ and G” indicated for the break are obtained without shear. 5.4.3.2 DWS Figure 5.8 shows the effect of shear on the behavior of l* during acidification. When this emulsion (15 wt% fat, 5 wt% sodium caseinate) is acidified in rest, a slight increase of l* down to a pH of ~5.4 (at this pH the depletion interaction is thought to be minimal)18 was observed. This increase was thought to be due to breakup of the depletion stabilized network of oil droplets. Upon further decrease of the pH, l* decreased. The sodium caseinate aggregates present in the continuous phase have grown that large that they start to influence the measurement. The turbidity increases, causing a decrease of l*. Eventually, as soon as the pH becomes smaller than 5.05, ± 0.05, l* started to fluctuate. The fluctuations indicated the formation of an non-ergodic network of sodium caseinate, in which the emulsion droplets are incorporated.18 When the system is acidified while being sheared, the initial formed network of oil droplets (due to the depletion forces) will break up into aggregates of oil droplets. The size of thesaggregates depends on the shear rate applied. At low shear rates l* behaved comparable to when no shear is applied. The only difference was that the initial increase of l* upon acidification down to a pH of ~5.4 became more extensive with increasing shear rate up to ~0.1 s-1. This can be explained by the occurrence of some shear induced aggregation for
1.0<γ& s-1, which caused an increase of the total aggregate size compared to the aggregate
size obtained when the emulsions were acidified in rest. The result is an increase of l*.
DWS used to study the influence of shear on aggregation
87
At higher shear rates ( 1.0>γ& s-1) the initial increase of l* diminishes and eventually
completely vanishes at 10=γ& s-1. This can be explained by an increased break up rate of the
aggregates, resulting in smaller aggregates. Figure 5.8 (open symbols) shows l* during the acidification at 10=γ& s-1. As soon as the pH
became smaller than approximately 5.8, l* started to decreases. On approach of the isoelectric point at this shear rate, no scattering of l* was observed, but a jump to a higher constant l*. In contrast with samples sheared at lower shear rates, no ergodic non-ergodic transition occurred. The system remains ergodic. The final value of l* was slightly smaller than the initial value of l*. This was most probably due to an increased turbidity caused by an increase of the aggregate size of the sodium caseinate aggregates present in the continuous phase.
7.0 6.5 6.0 5.5 5.0 4.5
60
80
100
120
140
160
l* (μ
m)
pH (-)
Figure 5.8: l* during the acidification of an emulsion containing 15 wt% palm fat and 5 wt% sodium
caseinate for 0=γ& s-1 ( ) and 10=γ& s-1 ( ).
With increasing shear rate the autocorrelation curves of these emulsions shifted to shorter
decay times and for a shear rate of 1 and 10 s-1 ( )221 Sττ became larger than ( )021 ττ ,
indicating an increasing contribution of the convective motion to the position and shape of the autocorrelation curves. Upon acidification of emulsions containing excess of sodium caseinate the decay time initially decreased. The faster decay of the autocorrelation curves is thought to be caused by less restricted motion of the emulsion droplets, due to decreasing depletion forces, as well
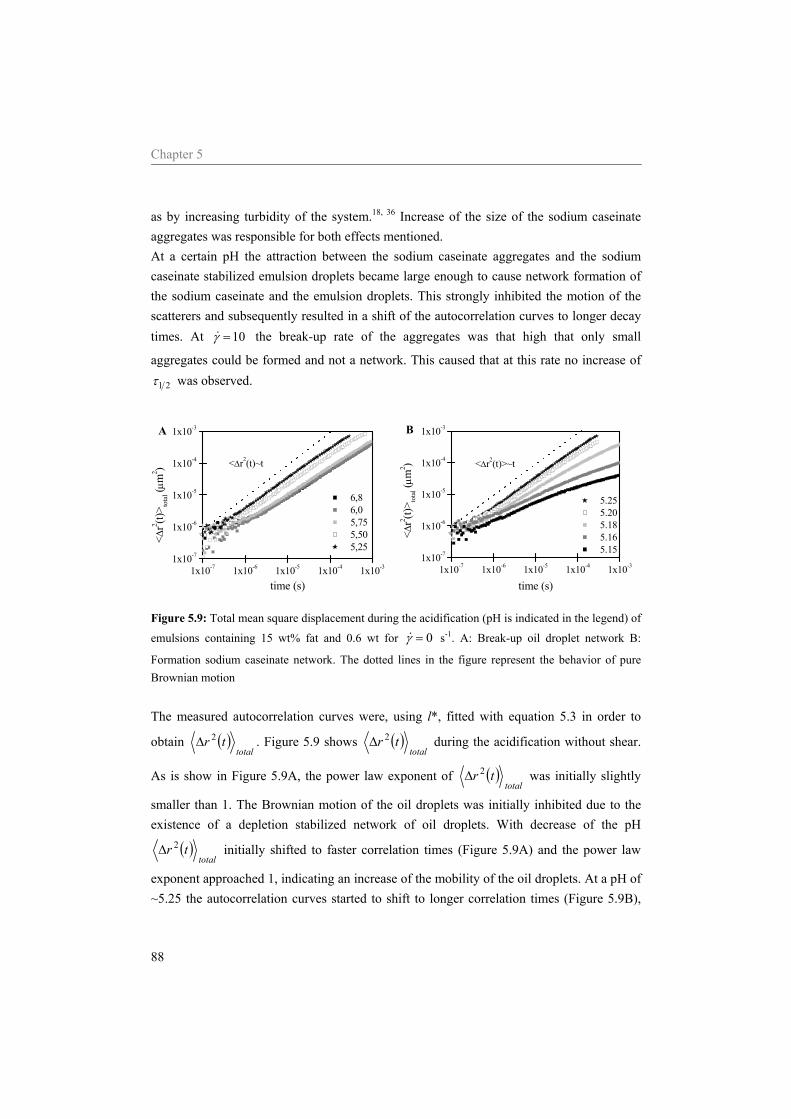
Chapter 5
88
as by increasing turbidity of the system.18, 36 Increase of the size of the sodium caseinate aggregates was responsible for both effects mentioned. At a certain pH the attraction between the sodium caseinate aggregates and the sodium caseinate stabilized emulsion droplets became large enough to cause network formation of the sodium caseinate and the emulsion droplets. This strongly inhibited the motion of the scatterers and subsequently resulted in a shift of the autocorrelation curves to longer decay times. At 10=γ& the break-up rate of the aggregates was that high that only small
aggregates could be formed and not a network. This caused that at this rate no increase of
21τ was observed.
1x10⁻⁷ 1x10⁻⁶ 1x10⁻⁵ 1x10⁻⁴ 1x10-31x10-7
1x10⁻⁶
1x10⁻⁵
1x10⁻⁴
1x10⁻³A
<Δr2(t)~t
6,8 6,0 5,75 5,50 5,25
<Δr2 (t)
> tota
l (μm
2 )
time (s)
1x10⁻⁷ 1x10⁻⁶ 1x10⁻⁵ 1x10⁻⁴ 1x10-31x10-7
1x10⁻⁶
1x10⁻⁵
1x10⁻⁴
1x10⁻³B
<Δr2(t)>~t
<Δ
r2 (t)> to
tal (μ
m2 )
time (s)
5.25 5.20 5.18 5.16 5.15
Figure 5.9: Total mean square displacement during the acidification (pH is indicated in the legend) of
emulsions containing 15 wt% fat and 0.6 wt for 0=γ& s-1. A: Break-up oil droplet network B:
Formation sodium caseinate network. The dotted lines in the figure represent the behavior of pure Brownian motion The measured autocorrelation curves were, using l*, fitted with equation 5.3 in order to
obtain ( )total
tr 2Δ . Figure 5.9 shows ( )total
tr 2Δ during the acidification without shear.
As is show in Figure 5.9A, the power law exponent of ( )total
tr 2Δ was initially slightly
smaller than 1. The Brownian motion of the oil droplets was initially inhibited due to the existence of a depletion stabilized network of oil droplets. With decrease of the pH
( )total
tr 2Δ initially shifted to faster correlation times (Figure 5.9A) and the power law
exponent approached 1, indicating an increase of the mobility of the oil droplets. At a pH of ~5.25 the autocorrelation curves started to shift to longer correlation times (Figure 5.9B),
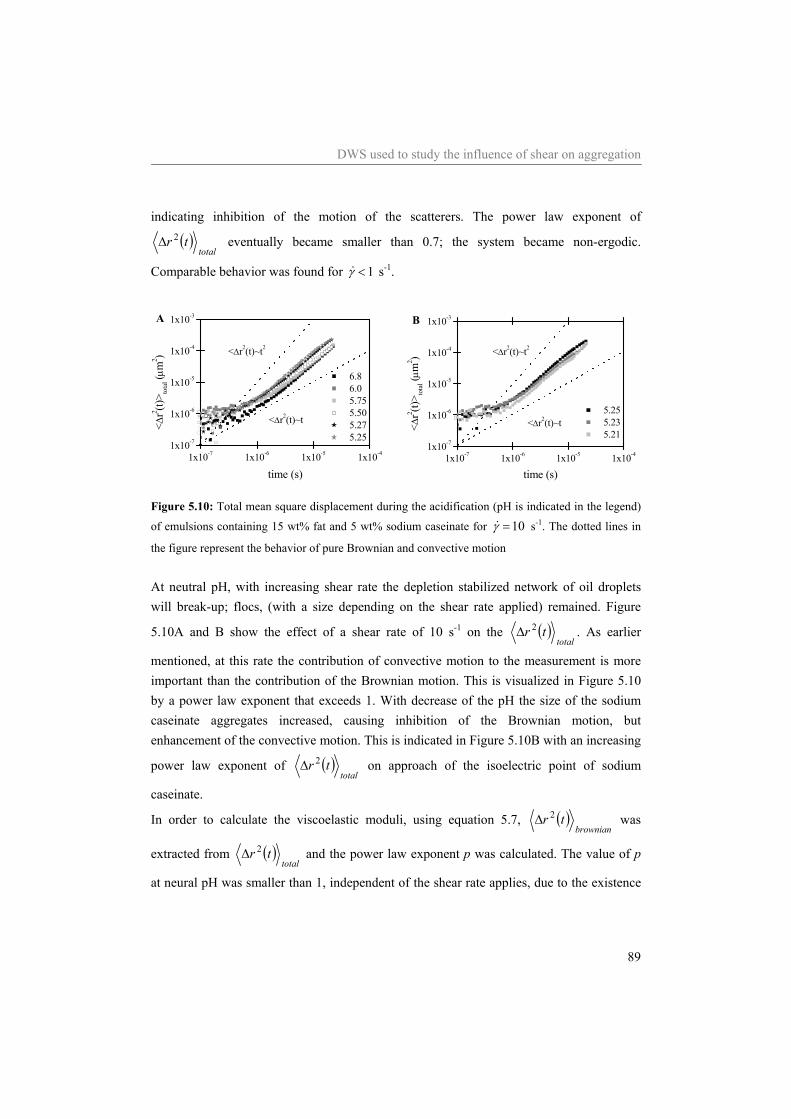
DWS used to study the influence of shear on aggregation
89
indicating inhibition of the motion of the scatterers. The power law exponent of
( )total
tr 2Δ eventually became smaller than 0.7; the system became non-ergodic.
Comparable behavior was found for 1<γ& s-1.
1x10⁻⁷ 1x10⁻⁶ 1x10⁻⁵ 1x10-41x10-7
1x10⁻⁶
1x10⁻⁵
1x10⁻⁴
1x10⁻³A
<Δr2(t)~t
<Δr2(t)~t2
6.8 6.0 5.75 5.50 5.27 5.25
<Δr2 (t)
> tota
l (μm
2 )
time (s)
1x10⁻⁷ 1x10⁻⁶ 1x10⁻⁵ 1x10-41x10-7
1x10⁻⁶
1x10⁻⁵
1x10⁻⁴
1x10⁻³B
<Δr2(t)~t
<Δr2(t)~t2
<Δr2 (t)
> tota
l (μm
2 )
time (s)
5.25 5.23 5.21
Figure 5.10: Total mean square displacement during the acidification (pH is indicated in the legend)
of emulsions containing 15 wt% fat and 5 wt% sodium caseinate for 10=γ& s-1. The dotted lines in
the figure represent the behavior of pure Brownian and convective motion At neutral pH, with increasing shear rate the depletion stabilized network of oil droplets will break-up; flocs, (with a size depending on the shear rate applied) remained. Figure
5.10A and B show the effect of a shear rate of 10 s-1 on the ( )total
tr 2Δ . As earlier
mentioned, at this rate the contribution of convective motion to the measurement is more important than the contribution of the Brownian motion. This is visualized in Figure 5.10 by a power law exponent that exceeds 1. With decrease of the pH the size of the sodium caseinate aggregates increased, causing inhibition of the Brownian motion, but enhancement of the convective motion. This is indicated in Figure 5.10B with an increasing
power law exponent of ( )total
tr 2Δ on approach of the isoelectric point of sodium
caseinate.
In order to calculate the viscoelastic moduli, using equation 5.7, ( )brownian
tr 2Δ was
extracted from ( )total
tr 2Δ and the power law exponent p was calculated. The value of p
at neural pH was smaller than 1, independent of the shear rate applies, due to the existence
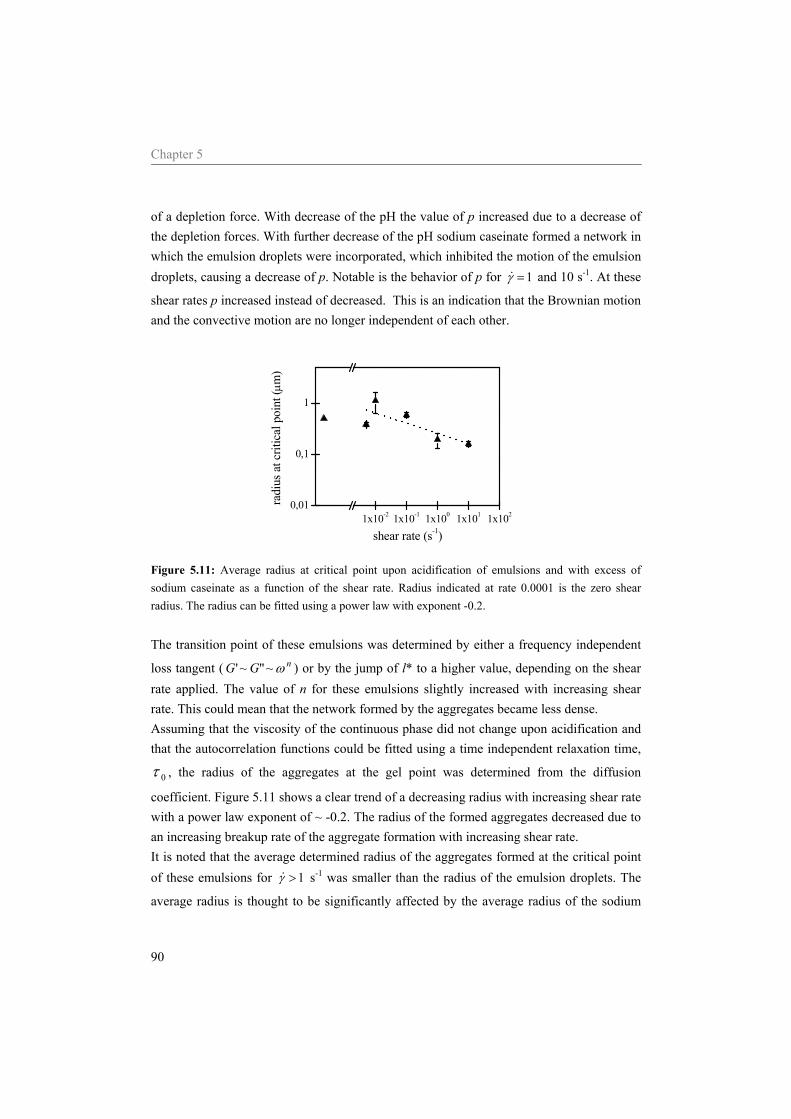
Chapter 5
90
of a depletion force. With decrease of the pH the value of p increased due to a decrease of the depletion forces. With further decrease of the pH sodium caseinate formed a network in which the emulsion droplets were incorporated, which inhibited the motion of the emulsion droplets, causing a decrease of p. Notable is the behavior of p for 1=γ& and 10 s-1. At these
shear rates p increased instead of decreased. This is an indication that the Brownian motion and the convective motion are no longer independent of each other.
1x10⁻² 1x10⁻¹ 1x100 1x101 1x1020,01
0,1
1
radi
us a
t crit
ical
poi
nt (μ
m)
shear rate (s-1)
Figure 5.11: Average radius at critical point upon acidification of emulsions and with excess of sodium caseinate as a function of the shear rate. Radius indicated at rate 0.0001 is the zero shear radius. The radius can be fitted using a power law with exponent -0.2. The transition point of these emulsions was determined by either a frequency independent
loss tangent ( nGG ω~"~' ) or by the jump of l* to a higher value, depending on the shear rate applied. The value of n for these emulsions slightly increased with increasing shear rate. This could mean that the network formed by the aggregates became less dense. Assuming that the viscosity of the continuous phase did not change upon acidification and that the autocorrelation functions could be fitted using a time independent relaxation time,
0τ , the radius of the aggregates at the gel point was determined from the diffusion
coefficient. Figure 5.11 shows a clear trend of a decreasing radius with increasing shear rate with a power law exponent of ~ -0.2. The radius of the formed aggregates decreased due to an increasing breakup rate of the aggregate formation with increasing shear rate. It is noted that the average determined radius of the aggregates formed at the critical point of these emulsions for 1>γ& s-1 was smaller than the radius of the emulsion droplets. The
average radius is thought to be significantly affected by the average radius of the sodium
DWS used to study the influence of shear on aggregation
91
caseinate aggregates. The results suggest that the size of the formed sodium caseinate aggregates also decreases with increasing shear rate and in this way resulted in a smaller total average radius.
5.5 Conclusion The effect of shear on a suspension of hard spheres and on two different aggregating emulsions was determined using two complementary techniques, rheometry and DWS. The decay of the autocorrelation curves shifted to faster correlation times with increasing shear rate. At low shear rates the autocorrelation curves scale exponential in time (t) and at high shear rates in time squared (t2). Exponential scaling in t2 indicates that the diffusive motion of the scatterers becomes negligible and that aggregation can no longer be diffusive limited. The shear rates used were in the pure diffusive, the intermediate and in the convective regime. Application of preshear on aggregating emulsion up to the critical point did not influence the final obtained structure. The amount of sodium caseinate (0.6 wt% or 5.0 wt%) did not seem to have an effect on the observed trends of the rheological experiments. For all emulsions the viscosity suddenly increased at a pH of 5.17 ± 0.05, indicating that the aggregation was completely pH-controlled. The final viscosity of all emulsions decreased with increasing shear rate (according to a power law with exponent -1.6), as did G’ and G”. Excess of sodium caseinate caused a slightly higher viscosity as well as viscoelastic moduli. Due to the higher sodium caseinate concentration, the distance between the caseinate molecules is smaller, which will results in more contact point in the network and thus a higher viscosity and viscoelastic moduli. It should be noted that when the acidification is followed in a rheometer no effect of shear up to the onset of gelation could be identified, while using DWS some clear differences were found, especially for emulsions containing excess of sodium caseinate as a function of the shear rate. Application of high shear rates (10 s-1) resulted for both emulsion, on approach of the isoelectric point, in a jump of l* to a higher value instead of scattering of l*. For these samples no ergodic non-ergodic transition occurred. The DWS results were used to determine the critical transition point defined by a frequency independent loss tangent
( nGG ω~"~' ) or by the jump of l*. The average radii of the formed aggregates at the critical transition point were estimated. A decrease of the radius of the aggregates (according to a power law with exponent -0.2) at the critical transition point was found with increasing shear rate. The value of n slightly increased with increasing shear rate,
Chapter 5
92
suggesting the formation of a less dense network structure with increasing shear rate, while the aggregates that formed the network became more compact.
References 1. Varadan, P., Solomon, M. J. Langmuir 2001, 17, 2918-2929. 2. Trappe, V., Weitz, D. A. Phys. Rev. E 2000, 85, 449-452. 3. Scirocco, R., Vermant, J., Mewis, J. J. Non-Newtonian Fluid Mech. 2004, 117, 183-192. 4. Schokker, E. P., Dalgleish, D. G. J. Agric. Food Chem. 2000, 48, 198-203. 5. Rooij de, R., Potanin, A. A., Ende van den, D., Mellema, J. J. Chem. Phys. 1993, 99, 9213-
9223. 6. Wolthers, W., Duits, M. H. G., Ende van den, D., Mellema, J. J. Rheol. 1996, 40, 799-811. 7. Petekidis, G., Moussaïd, A., Pusey, P. N. Phys. Rev. E 2002, 66, 051402. 8. Weitz, D. A., Pine, D. J., Diffusing wave spectroscopy. In Dynamic light scattering, the
method and some applications, Brown, W., Ed. Clarendon Press: Oxford, 1993; pp 652-719. 9. Hébraud, P., Lequeux, F., Munch, J. P., Pine, D. J. Phys. Rev. Lett. 1997, 78, 4657-4660. 10. Petekidis, G., Vlassopoulos, D., Pusey, P. N. Faraday Discuss. 2002, 123, 1-16. 11. Blijdenstein, T. B. J., Linden van der, E., Vliet van, T., Aken van, G. A. Langmuir 2004, 20,
11321-11328. 12. Wu, X. L., Pine, D. J., Chaikin, P. M., Huang, J. S., Weitz, D. A. Journal of Optical Society of
America 1990, 7, 15-20. 13. Bicout, D. J., Maret, G. Physica A 1994, 210, 87-112. 14. Menon, N., Durian, D. J. Science 1997, 275, 1920-1922. 15. Gopal, A. D., Durian, D. J. J. Colloid Interface Sci. 1999, 213, 169-178. 16. Uhomoibhi, J. O., Earnshaw, J. C. J. Phys.: Condens. Matter 2000, 12, 9591-9598. 17. Lemieux, P. A., Durian, D. J. Phys. Rev. Lett. 2000, 85, 4273-4276. 18. Ruis, H. G. M., Venema, P., Linden van der, E. Langmuir 2007, 23, 1007-1013. 19. Bonnet, C., Corredig, M., Alexander, M. J. Agric. Food Chem. 2005, 53, 8600-8606. 20. Alexander, M., Dalgleish, D. G. Langmuir 2005, 21, 11380-11386. 21. Alexander, M., Rojas-Ochoa, L. F., Leser, M., Schurtenberger, P. J. Colloid Interface Sci.
2002, 253, 35-46. 22. Dalgleish, D. G., Alexander, M., Corredig, M. Food Hydrocolloids 2004, 18, 747-755. 23. Alexander, M., Dalgleish, D. G. Colloid and Surfaces B: Biointerfaces 2004, 38, 83-90. 24. Alexander, M., Dalgleish, D. G. Food Biophysics 2006, 1, 2-13. 25. Wyss, H. M., Romer, S., Scheffold, F., Schurtenberger, P., Gauckler, L. J. J. Colloid Interface
Sci. 2001, 240, 89-97. 26. Mason, T. G. Rheol. Acta 2000, 39, 371-378. 27. Ruis, H. G. M., Venema, P., Linden van der, E. Food Hydrocolloids 2007, 21, 545-554. 28. Reub, C. J., Zukoski, C. F. J. Rheol. 1997, 41, 197-217.
DWS used to study the influence of shear on aggregation
93
29. Mezzenga, R., Schurtenberger, P., Burbidge, A., Michel, M. Nature Materials 2005, 4, 729-740.
30. Cardinaux, F., Stradner, A., Scheffold, F., Schurtenberger, P. 3rd International Symposium on Food Rheology and Structure 2003.
31. Romer, S., Scheffold, F., Schurtenberger, P. Phys. Rev. Lett. 2000, 85, 4980-4983. 32. Devreux, F., Boilot, J. P., Chaput, F., Malier, L., Axelos, M. A. V. Phys. Rev. E 1993, 47,
2689-2694. 33. Muthukumar, M. Macromolecules 1989, 22, 4656-4658. 34. Hoekstra, H., Mewis, J., Narayanan, T., Vermant, J. Langmuir 2005, 21, 11017-11025. 35. Berli, C. L. A., Quemada, D., Parker, A. Colloids Surf., A 2002, 203, 11-20. 36. Ruis, H. G. M., Venema, P., Linden van der, E. 2007, Submitted for publication

6 Influence of the continuous phase on the shear induced string formation of emulsion droplets
Abstract The shear induced string formation of emulsion droplets dispersed in various continuous phases was investigated. Application of shear (200 s-1 for 600 s) on a system containing 0.6 wt% emulsion droplets dispersed in a xanthan solution caused alignment of the emulsion droplets. The string formation of the dispersed phase was inhibited by the addition of sodium caseinate to a 0.1 wt% xanthan solution. In order to understand this phenomenon, the continuous phases, containing different amounts of xanthan (0 to 0.4 wt%) and sodium caseinate (0 to 4.5 wt%), were characterized using rheological and rheo-optical measurements. It was shown that addition of sodium caseinate to a 0.1 wt% xanthan solution hardly influenced the shear thinning behavior of the system; only the viscosity of the Newtonian plateau, observed at the low shear rates, increased with the addition of sodium caseinate concentration. The overall alignment of the xanthan molecules increased with the addition of sodium caseinate, while the orientation in the direction of the flow decreased. This was thought to be caused by thermodynamic incompatibility of sodium caseinate and xanthan. This might induce the alignment of the smaller xanthan molecules. The rheo-optical data showed a decrease of the first normal stress difference with the addition of sodium caseinate and a decrease of the Weissenberg number with increasing shear rate.
Chapter 6
96
6.1 Introduction Structure formation during flow is strongly affected by a delicate balance between Brownian motion and interparticle forces like hydrodynamic interactions. Application of flow can lead to orientation, break-up, densification and spatial reorganization of
aggregates.1 As the Péclet number (kTaPe ηγπ &6
= with a the aggregate radius, γ& de shear
rate, η the viscosity of the medium, k the Boltzman constant and T the absolute temperature) is increased, the microstructure becomes distorted. Under shear, the particles are pushed together along the compression axis of the flow field, while being separated along the extensional axis.1 Various studies describe shear-induced alignment and chaining of spherical particles that are dispersed in viscoelastic media, whereas there is no indication of the same phenomenon happening in Newtonian fluids. However, the underlying theory and the specific conditions needed to obtain such behavior are not understood. There are strong indications that the continuous phase should show a shear thinning rheological behavior as well as a normal force.1-4 The first normal stress difference is thought to be the driving force for the formation of the string-like structure while the shear thinning behavior is hold responsible for the maintenance of the string-like structure.3 In the food industry polysaccharides are usually added to an aqueous phase as a thickening agent in order to modify the rheological behavior of a system, to provide good stability or to obtain a desirable texture. Xanthan, a bacterial polysaccharide that is produced by the bacteria Xanthomonas Campestris, is an example of a structuring agent that is often used because of its viscoelastic and shear thinning properties. It consists of a linear backbone consisting of (1-4)-β-D glucose units. On every second glucose residue there is a trisaccharide side chain, causing a rigid secondary structure. The molecular weight of xanthan used here is in the order of 103 kg/mol. In aqueous solutions the stable conformation of xanthan is double helical below a transition temperature that rised form near room temperature in the absence of added salt to above the boiling point of water when the salt concentration reaches ~0.1 M NaCl 5-7 The double-helices have a hydrodynamic diameter of 2.2 nm in aqueous solution and a weight-averaged contour length is 2 μm. The double helical xanthan chains are semiflexible with a persistence length in the range of 100-150 nm and a radius of gyration is 264 nm. The overlap concentration is ~0.008 wt%.5, 7, 8 Polymer chains, like xanthan, are optically anisotropic due to the different polarizability along and perpendicular to the polymer backbone. At rest the polymer segments are
Shear induced string formation of emulsion droplets
97
distributed isotropically while under shear the polymer segments align on the average in the direction of the shear flow.9-12 The rotational mobility, orientation and stretching of polymer solutions can directly be probed by means of flow induced birefringence. The flow induced birefringence, Δn’, is a measure for the average alignment of the sample. The extinction angle, θ, is a measure of the average orientation of the polymers relative to the direction of flow. An extinction angle of 0° corresponds to complete alignment of the polymers in the direction of the shear. For anisotropic molecules, in general increase of the shear rate will result in an increase of Δn’ and a decrease of θ.9, 13 When the stress optical rule applies, the rheo-optical information can be combined with the rheological measurements in order to obtain the normal stress differences that are present in the system. These normal stress differences are, especially at low shear rates, normally too small to be measured by conventional rheological equipment.13, 14 This study is based on previous work 3, 4 and concentrates on the conditions necessary to obtain shear induced ordering of sodium caseinate stabilized emulsion droplets that are dispersed in a continuous phase containing sodium caseinate as well as xanthan. Xanthan is used in this study because it is a food grade polymer that already showed to be able to cause shear induced alignment of a dispersed phase.3 The different continuous phases used are characterized using rheo-optical measurements.
6.2 Materials and methods 6.2.1 Materials Sodium caseinate, with protein content over 90%, was obtained from DMV-International (Veghel, the Netherlands). Xanthan gum from Xanthomonas Campestris was obtained from Fluka, Riedel de Haën (Buch, Switserland). Palm fat was obtained form Barentz Raw Materials (Hoofddorp, the Netherland) and thiomersal from Merck (Schuchart, Germany). 6.2.2 Sample preparation Xanthan and sodium caseinate solutions were prepared by dissolving the required amount in demineralised water, followed by gently stirring overnight at 4°C. A stock emulsion containing 30 wt% of palm fat and 1.2 wt% of sodium caseinate was prepared. For the preparation of the stock emulsion a mixture of a sodium caseinate solution and palm fat was heated at 60°C until all fat was melted. This mixture was prehomogenized using an Ultra Turrax (Polytron, Switzerland) and subsequently homogenized with a Rannie homogenizer (Rannie, Denmark) at a pressure of 10 Bar and a temperature of 60°C. The
Chapter 6
98
stock emulsion hardly contained excess of sodium caseinate in the continuous phase and the emulsion droplets had a D3,2 of ~1.5 μm as determined from laser diffraction (Coulter LS 230, Miami, USA). 6.2.3 Rheometry Static measurements were carried out using a Paar Physica MCR 301 (Anton Paar, Austria) stress-controlled rheometer, operating in a strain-controlled mode through a feed-back loop. Shear rate sweeps (shear rate logarithmically increased from 0.01 to 500 s-1) were performed using a concentric cylindrical double gap geometry (DG 26.7). 6.2.4 Rheo-optica Rheo-optical measurements were performed using a strain-controlled ARES rheometer (Rheometrics Scientific) equipped with a modified optical analysis module,12 using a Couette geometry with a static inner bob (diameter 30 mm) and a rotating outer cup (diameter 38.3 mm) with a quartz bottom plate. A laserbeam of wavelength 670 nm vertically passed through the sample. The optical path length through the sample was 20 mm. The flow induced birefringence and the extinction angle were determined. The birefringence could be measured as low as 10-8, at a sampling frequency of 24 Hz. The optical signal from the detector was digitized using an analogue-to-digital converter and analyzed subsequently. The rheo-optical experiments were performed in an air-conditioned room at 22 ±0.1 °C. Before the measurements, all samples were centrifuged for 30 minutes at 22000 g in order to remove aggregates and insoluble material that was present in the sodium caseinate powder. 6.2.5 Shear cell Dispersions containing ~0.6 wt% of emulsion droplets and various amount of xanthan and sodium caseinate were poured in a parallel plate shear cell (Linkam Scientific Instruments, type SCC 450), with a rotating lower plate and a fixed upper plate. The shear cell was mounted on a microscope (Zeiss Axioskop 2 plus) equipped with a CCD camera (Hitachi CCD color camera). The gap size between the plates was adjusted to 100 μm, which is at least more than 50 times the droplet size, to minimize possible wall effect. The dispersions were, at room temperature, subjected to a shear flow and directly after cessation of flow images were taken. In order to minimize wall effects, images were obtained by focusing the microscope halfway the gap, in the middle of the sample.
Shear induced string formation of emulsion droplets
99
6.3 Results and Discussion Whether shear induced ordering of a dispersed phase occurs depends on the properties of the continuous phase.1-4 In order to explore under what conditions shear induced ordering of a dispersed phase occurs, first different continuous phases containing various amounts of xanthan and sodium caseinate were analyzed using rheological and rheo-optical measurements. Subsequently, emulsion droplets were added to the different continuous phases and the effect of flow on the ordering of the emulsion droplets was visualized using light microscopy. 6.3.1 Characterization continuous phase Figure 6.1 shows the effect of the xanthan concentration on the viscosity, Δn’ and θ as a function of the shear rate. The viscosity of xanthan decreases with decreasing concentration and with increasing shear rate (Figure 6.1A). At low shear rates a high viscosity Newtonian plateau is observed. This is caused by the formation of complex aggregates through hydrogen bonds and entanglements of the high-molecular-weight xanthan molecules. With increasing shear rate the viscosity of the xanthan solutions decreases due to disentanglement of the network and alignment of the xanthan molecules in the direction of flow. When the shear stops, aggregates will be formed again.15 Figure 6.1B shows an increase of Δn’ as a function of the shear rate, confirming earlier observation.16 Increase of the xanthan concentration causes a linear increase of Δn’. The extinction angle corresponds to the average orientation of the xanthan molecules in the shear field. At high shear rates an angle of 0° will be approached.13 Figure 6.1C shows the orientation angle for 0.05 wt% and 0.1 wt% xanthan. As this figure shows, θ decreases with increasing shear rate, caused by a higher average alignment of the xanthan molecules in the direction of the flow. The birefringence and the stress are related to each other via the stress optical rule (SOR). The SOR states that the refractive index tensor and the stress tensor are linearly related through the stress optical coefficient, C, according to the following relation:11, 13, 14
( ) ( )sCn σσθ −=Δ 22sin' [ 6.1 ]
Where σ is the total stress and σs is the stress of the solvent. According to the following equation, the stress optical coefficient is proportional to the first normal stress difference, N1.
( ) 12cos' CNn =Δ θ [ 6.2 ]
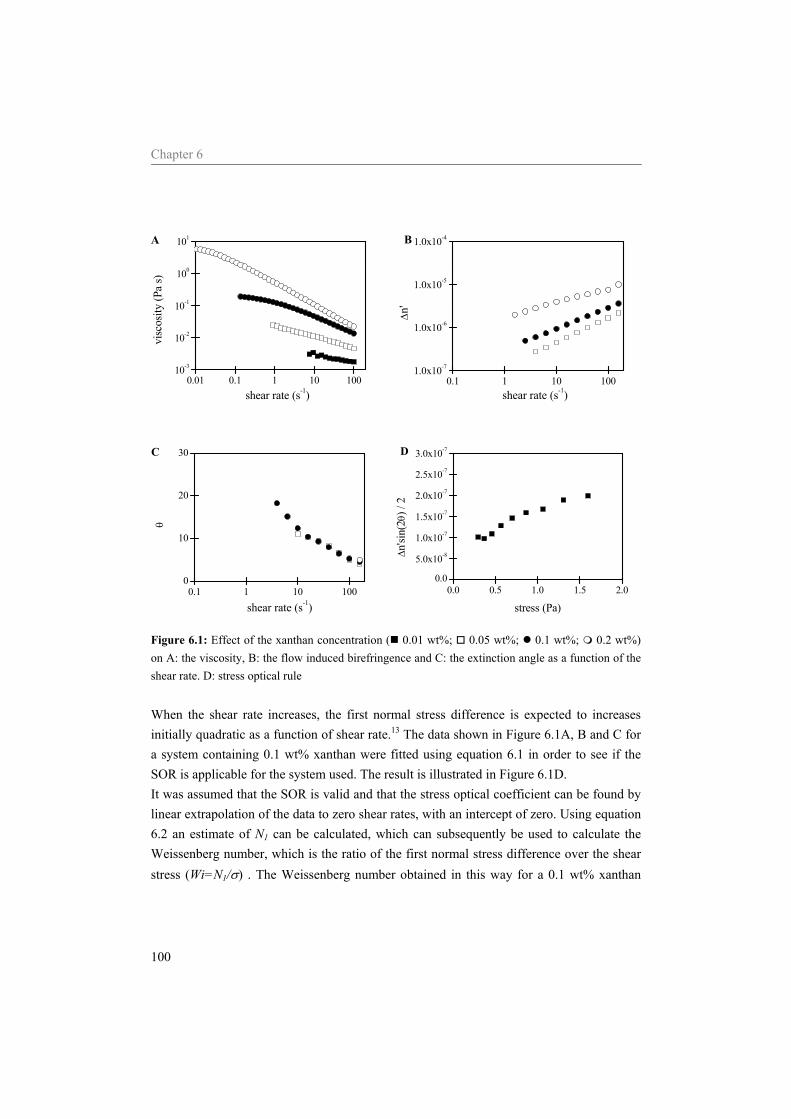
Chapter 6
100
0.01 0.1 1 10 10010-3
10-2
10-1
100
101A
visc
osity
(Pa
s)
shear rate (s-1)
0.1 1 10 1001.0x10-7
1.0x10⁻⁶
1.0x10⁻⁵
1.0x10⁻⁴B
Δn'
shear rate (s-1)
0.1 1 10 1000
10
20
30C
θ
shear rate (s-1)
0.0 0.5 1.0 1.5 2.00.0
5.0x10⁻⁸
1.0x10⁻⁷
1.5x10⁻⁷
2.0x10⁻⁷
2.5x10⁻⁷
3.0x10⁻⁷D
Δn'si
n(2θ
) / 2
stress (Pa)
Figure 6.1: Effect of the xanthan concentration ( 0.01 wt%; 0.05 wt%; 0.1 wt%; 0.2 wt%) on A: the viscosity, B: the flow induced birefringence and C: the extinction angle as a function of the shear rate. D: stress optical rule When the shear rate increases, the first normal stress difference is expected to increases initially quadratic as a function of shear rate.13 The data shown in Figure 6.1A, B and C for a system containing 0.1 wt% xanthan were fitted using equation 6.1 in order to see if the SOR is applicable for the system used. The result is illustrated in Figure 6.1D. It was assumed that the SOR is valid and that the stress optical coefficient can be found by linear extrapolation of the data to zero shear rates, with an intercept of zero. Using equation 6.2 an estimate of N1 can be calculated, which can subsequently be used to calculate the Weissenberg number, which is the ratio of the first normal stress difference over the shear stress (Wi=N1/σ) . The Weissenberg number obtained in this way for a 0.1 wt% xanthan
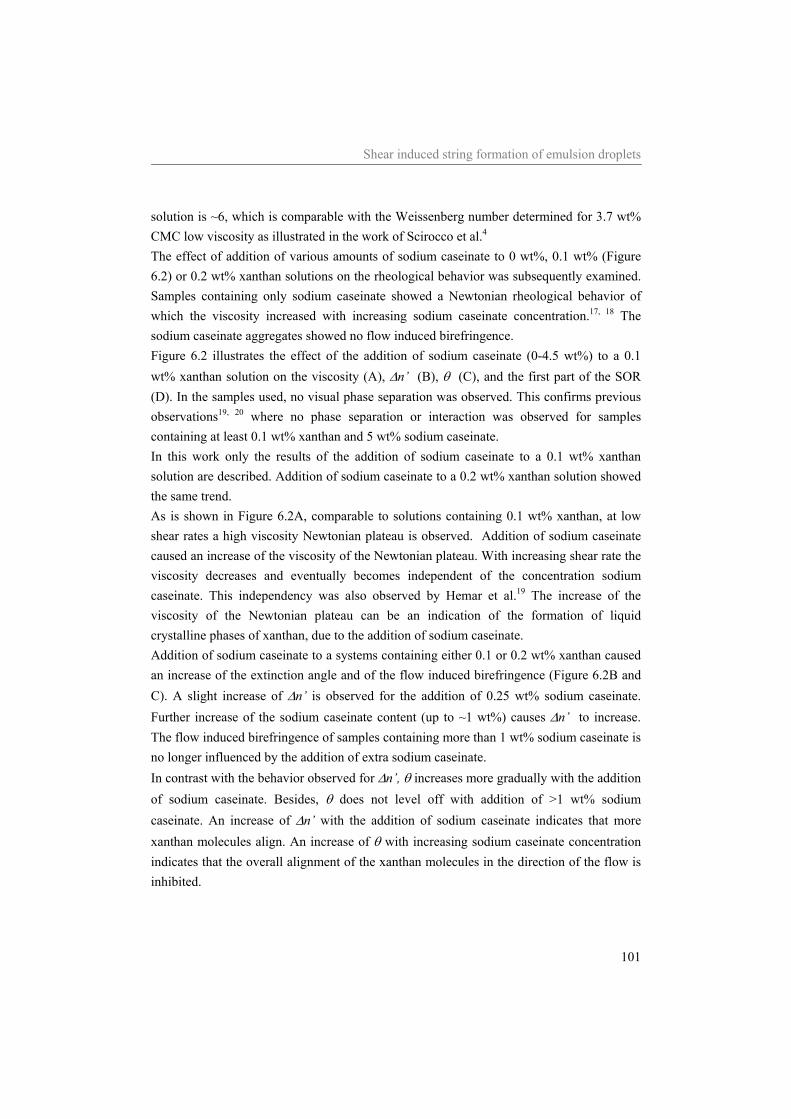
Shear induced string formation of emulsion droplets
101
solution is ~6, which is comparable with the Weissenberg number determined for 3.7 wt% CMC low viscosity as illustrated in the work of Scirocco et al.4 The effect of addition of various amounts of sodium caseinate to 0 wt%, 0.1 wt% (Figure 6.2) or 0.2 wt% xanthan solutions on the rheological behavior was subsequently examined. Samples containing only sodium caseinate showed a Newtonian rheological behavior of which the viscosity increased with increasing sodium caseinate concentration.17, 18 The sodium caseinate aggregates showed no flow induced birefringence. Figure 6.2 illustrates the effect of the addition of sodium caseinate (0-4.5 wt%) to a 0.1 wt% xanthan solution on the viscosity (A), Δn’ (B), θ (C), and the first part of the SOR (D). In the samples used, no visual phase separation was observed. This confirms previous observations19, 20 where no phase separation or interaction was observed for samples containing at least 0.1 wt% xanthan and 5 wt% sodium caseinate. In this work only the results of the addition of sodium caseinate to a 0.1 wt% xanthan solution are described. Addition of sodium caseinate to a 0.2 wt% xanthan solution showed the same trend. As is shown in Figure 6.2A, comparable to solutions containing 0.1 wt% xanthan, at low shear rates a high viscosity Newtonian plateau is observed. Addition of sodium caseinate caused an increase of the viscosity of the Newtonian plateau. With increasing shear rate the viscosity decreases and eventually becomes independent of the concentration sodium caseinate. This independency was also observed by Hemar et al.19 The increase of the viscosity of the Newtonian plateau can be an indication of the formation of liquid crystalline phases of xanthan, due to the addition of sodium caseinate. Addition of sodium caseinate to a systems containing either 0.1 or 0.2 wt% xanthan caused an increase of the extinction angle and of the flow induced birefringence (Figure 6.2B and C). A slight increase of Δn’ is observed for the addition of 0.25 wt% sodium caseinate. Further increase of the sodium caseinate content (up to ~1 wt%) causes Δn’ to increase. The flow induced birefringence of samples containing more than 1 wt% sodium caseinate is no longer influenced by the addition of extra sodium caseinate. In contrast with the behavior observed for Δn’, θ increases more gradually with the addition of sodium caseinate. Besides, θ does not level off with addition of >1 wt% sodium caseinate. An increase of Δn’ with the addition of sodium caseinate indicates that more xanthan molecules align. An increase of θ with increasing sodium caseinate concentration indicates that the overall alignment of the xanthan molecules in the direction of the flow is inhibited.
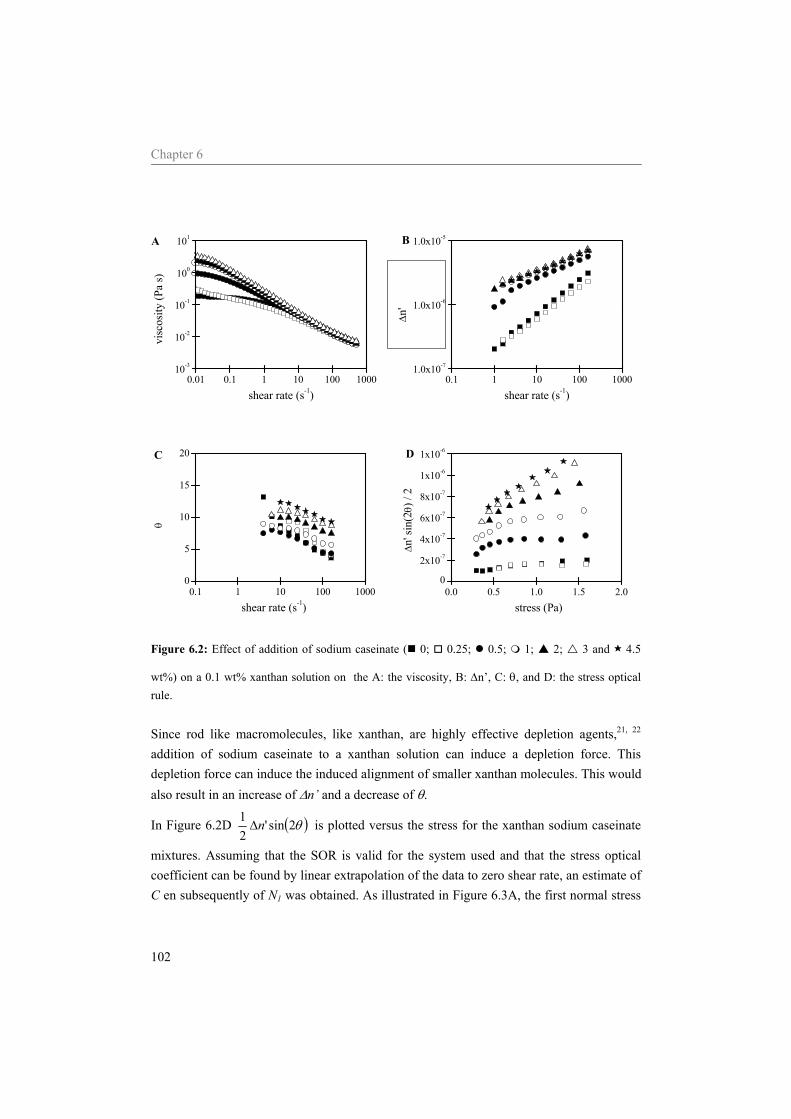
Chapter 6
102
0.01 0.1 1 10 100 100010-3
10-2
10-1
100
101A
visc
osity
(Pa
s)
shear rate (s-1)
0.1 1 10 100 10001.0x10-7
1.0x10⁻⁶
1.0x10⁻⁵B
Δn'
shear rate (s-1)
0.1 1 10 100 10000
5
10
15
20C
θ
shear rate (s-1)
0.0 0.5 1.0 1.5 2.00
2x10⁻⁷
4x10⁻⁷
6x10⁻⁷
8x10⁻⁷
1x10⁻⁶
1x10⁻⁶D
Δn' s
in(2
θ) /
2
stress (Pa)
Figure 6.2: Effect of addition of sodium caseinate ( 0; 0.25; 0.5; 1; 2; 3 and 4.5
wt%) on a 0.1 wt% xanthan solution on the A: the viscosity, B: Δn’, C: θ, and D: the stress optical rule. Since rod like macromolecules, like xanthan, are highly effective depletion agents,21, 22 addition of sodium caseinate to a xanthan solution can induce a depletion force. This depletion force can induce the induced alignment of smaller xanthan molecules. This would also result in an increase of Δn’ and a decrease of θ.
In Figure 6.2D ( )θ2sin'21 nΔ is plotted versus the stress for the xanthan sodium caseinate
mixtures. Assuming that the SOR is valid for the system used and that the stress optical coefficient can be found by linear extrapolation of the data to zero shear rate, an estimate of C en subsequently of N1 was obtained. As illustrated in Figure 6.3A, the first normal stress
Shear induced string formation of emulsion droplets
103
difference of all samples increased with shear rate en decreased with the addition of sodium caseinate. The decrease of the normal force with the addition of sodium caseinate became more pronounced with increasing shear rate.
1 10 1000
2
4
6
8
10
12
14A
N1 (P
a)
shear rate (s-1)
1 10 1000
2
4
6
8
10B
Wi (
-)
shear rate (s-1)
Figure 6.3: Effect of addition of sodium caseinate ( 0; 0.25; 0.5; 1; 2; 3 and 4.5
wt%) on a 0.1 wt% xanthan solution on A: Normal force and B: Weissenberg number as a function of the shear rate. Figure 6.3B shows the effect of the addition of different amounts of sodium caseinate to a 0.1 wt% xanthan solution on the Weissenberg number. It should be noted, that the Weissenberg number of 0.1wt% xanthan solutions containing up to 0.25 wt% sodium caseinate increased with increasing shear rate. In contrast with this, the Weissenberg number of samples containing 0.1 wt% xanthan and 0.5 wt% sodium caseinate (or more) decreased with increasing shear rate. 6.3.2 Alignment of emulsion droplets under shear Emulsion droplets were added to the different continuous phases earlier mentioned. By means of light microscopy the shear induced alignment of the emulsion droplets was qualitatively investigated. The effect of time, rate and composition of the continuous phase on the ordering of an ~0.6 wt% emulsion was investigated. The gap size used in all measurements was 100 μm, which is at least 50 times the size of the emulsion droplets. Particle necklaces were seen to stick and slip at the walls, interacting amongst themselves and joining up along each other in close packed sheets. The walls seemed to hinder, rather than promote alignment.4 Increase of the gap size did indeed support the alignment, however the turbidity limited the maximum gap size.
Chapter 6
104
Optical microscopy and measurements of the droplet size before and after application of shear indicated that all suspensions used were stable. No coalescence or aggregation of the emulsion droplets was observed. Using Stokes law, the time for the particles to cream over 10% of the gap size was calculated.4 In all cases the time scale associated with creaming was considerably longer than the time scale of the experiment. Figure 6.4 shows the effect of the concentration xanthan on the alignment of emulsion droplets. The dispersions were sheared at a shear rate of 200 s-1 during 600 seconds. As is shown in Figure 6.4, a 0.01 wt% xanthan solution did not induce any alignment of the emulsion droplets, whereas for xanthan concentrations ≥ 0.05 wt% chaining of the emulsion droplets was observed. Most probably the rheological behavior of a 0.01 wt% xanthan solution is not sufficient shear thinning (Figure 6.1A), which resulted in no alignment.3, 4 Maximum alignment was observed for xanthan concentrations of ~0.1 wt%. Further increase of the xanthan concentration reduced the alignment and at xanthan concentrations above 0.4 wt% hardly any alignment was observed. Previous studies4 indicated the time-rate combination as important, however, investigations of different time-rate combinations ( constant=⋅ tγ& ) showed that a certain amount of time
was needed to obtain strings of emulsion droplets, but once the strings were formed, longer shearing did not always result in longer necklaces. Application of shear at rates below ~100 s-1 did not give pronounced string formation while at higher shear rates the ordering increased with increasing shear rate. The degree of shear-thinning is thought to be one of the key factors for string formation, however, with increasing xanthan concentration the degree of shear thinning also increased, while the string formation was inhibited. Perhaps it would take more than 600 s to obtain maximum alignment at xanthan concentration >0.1 wt% due to the higher viscosity of the continuous phase. All other experiments were performed with samples containing 0.1 wt% xanthan. After cessation of shear, the aligned droplets remained for at least 3600 seconds aligned, while, as was indicated by the rheo-optical experiments (data is not shown in this work), the aligned xanthan molecules immediately randomized after cessation of shear. This can be explained based on the different rotation diffusion coefficients of the xanthan molecules and of the strings of emulsion droplets.
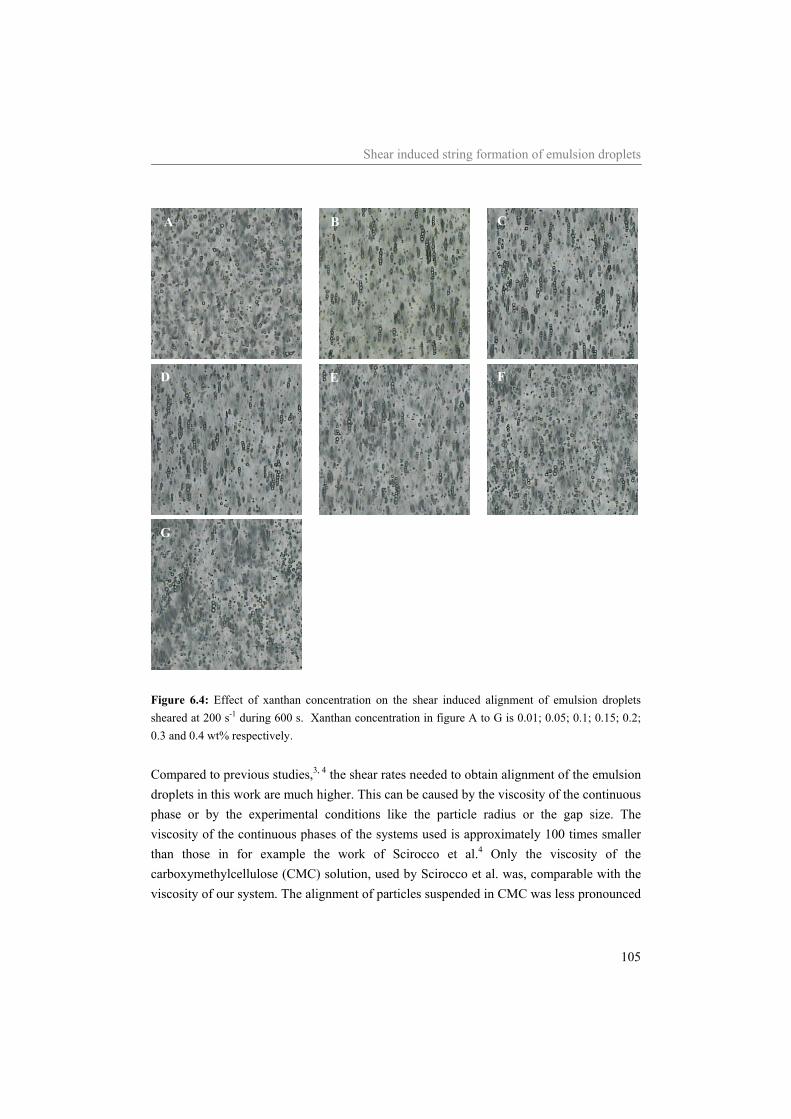
Shear induced string formation of emulsion droplets
105
Figure 6.4: Effect of xanthan concentration on the shear induced alignment of emulsion droplets sheared at 200 s-1 during 600 s. Xanthan concentration in figure A to G is 0.01; 0.05; 0.1; 0.15; 0.2; 0.3 and 0.4 wt% respectively. Compared to previous studies,3, 4 the shear rates needed to obtain alignment of the emulsion droplets in this work are much higher. This can be caused by the viscosity of the continuous phase or by the experimental conditions like the particle radius or the gap size. The viscosity of the continuous phases of the systems used is approximately 100 times smaller than those in for example the work of Scirocco et al.4 Only the viscosity of the carboxymethylcellulose (CMC) solution, used by Scirocco et al. was, comparable with the viscosity of our system. The alignment of particles suspended in CMC was less pronounced
A B C
E F D
G
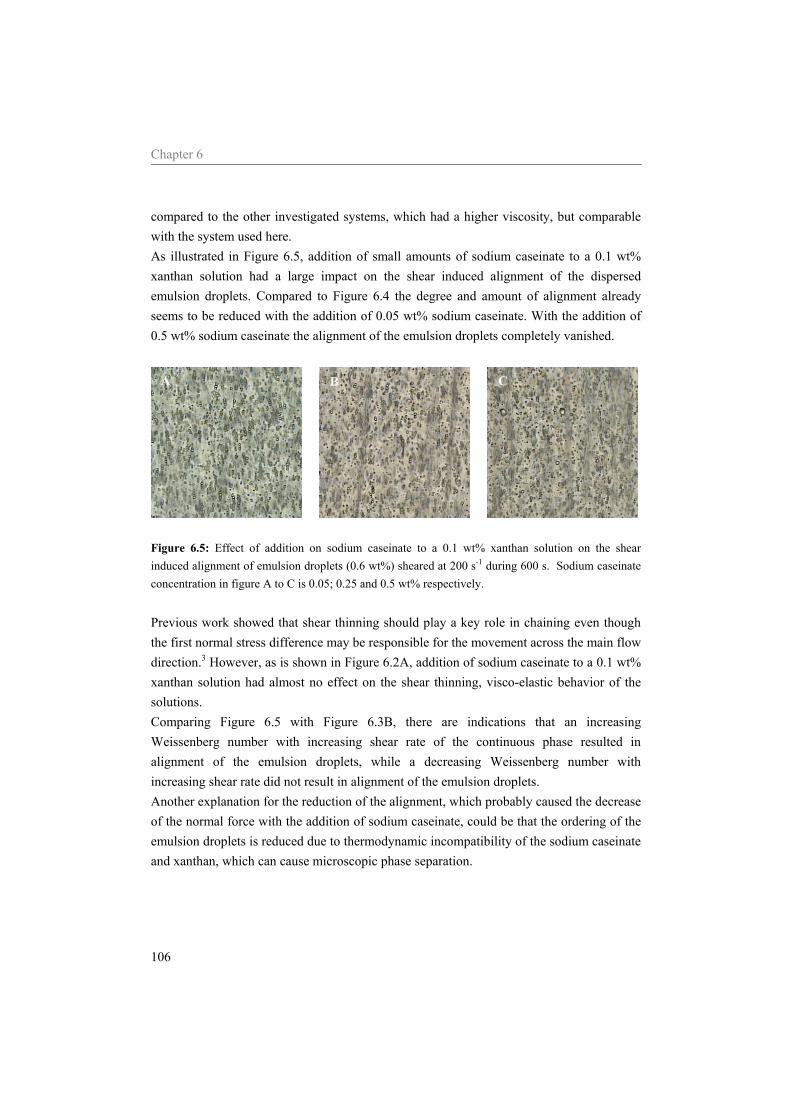
Chapter 6
106
compared to the other investigated systems, which had a higher viscosity, but comparable with the system used here. As illustrated in Figure 6.5, addition of small amounts of sodium caseinate to a 0.1 wt% xanthan solution had a large impact on the shear induced alignment of the dispersed emulsion droplets. Compared to Figure 6.4 the degree and amount of alignment already seems to be reduced with the addition of 0.05 wt% sodium caseinate. With the addition of 0.5 wt% sodium caseinate the alignment of the emulsion droplets completely vanished.
Figure 6.5: Effect of addition on sodium caseinate to a 0.1 wt% xanthan solution on the shear induced alignment of emulsion droplets (0.6 wt%) sheared at 200 s-1 during 600 s. Sodium caseinate concentration in figure A to C is 0.05; 0.25 and 0.5 wt% respectively. Previous work showed that shear thinning should play a key role in chaining even though the first normal stress difference may be responsible for the movement across the main flow direction.3 However, as is shown in Figure 6.2A, addition of sodium caseinate to a 0.1 wt% xanthan solution had almost no effect on the shear thinning, visco-elastic behavior of the solutions. Comparing Figure 6.5 with Figure 6.3B, there are indications that an increasing Weissenberg number with increasing shear rate of the continuous phase resulted in alignment of the emulsion droplets, while a decreasing Weissenberg number with increasing shear rate did not result in alignment of the emulsion droplets. Another explanation for the reduction of the alignment, which probably caused the decrease of the normal force with the addition of sodium caseinate, could be that the ordering of the emulsion droplets is reduced due to thermodynamic incompatibility of the sodium caseinate and xanthan, which can cause microscopic phase separation.
A B C
Shear induced string formation of emulsion droplets
107
6.4 Conclusion In this study we investigated the conditions of a continuous phase necessary to obtain string formation of a dispersed phase. Continuous phases containing different amounts of xanthan and sodium caseinate were analyzed using rheological and rheo-optical methods. The properties of the different continuous phases were strongly affected by the application of shear. Increase of the xanthan concentration caused an increase of the viscosity as well as more pronounced shear thinning behavior. The alignment of xanthan increased with increasing shear rate as well as with increasing concentration. String formation of the emulsion droplets of samples being sheared for 600 s at 200 s-1 was found to be maximal for ~0.1 wt% xanthan. The string formation was inhibited with increasing xanthan concentration, probably due to the higher viscosity of the continuous phase, which inhibits the rate of ordering. Addition of various amount of sodium caseinate to a 0.1 wt% xanthan solution did hardly change the visco-elastic properties of the samples. However, the overall alignment of the xanthan increased, while the orientation decreased. Using the stress optical rule an estimate of the first normal stress difference was obtained, which was found to decrease with the addition of sodium caseinate. The string formation of dispersed emulsion droplets was also reduced by the addition of sodium caseinate, probably caused by the decrease of the first normal stress difference or by a decrease of the Weissenberg number with increasing shear rate. Another explanation can be that addition of sodium caseinate to a xanthan solution caused microscopic phase separation, which can also have a negative effect on the string formation of the emulsion droplets.
References 1. Vermant, J., Solomon, M. J. J. Phys.: Condens. Matter 2005, 17, 187-216. 2. Michele, J., Pätzold, R., Donis, R. Rheol. Acta 1977, 16, 317-321. 3. Won, D., Kim, C. J. Non-Newtonian Fluid Mech. 2004, 117, 141-146. 4. Scirocco, R., Vermant, J., Mewis, J. J. Non-Newtonian Fluid Mech. 2004, 117, 183-192. 5. Stokke, B. T., Elsaeter, A. Carbohydr. Res. 1987, 160, 13-28. 6. Lee, H. C., Brant, D. A. Macromolecules 2002, 35, 2212-2222. 7. Koenderink, G. H., Sacanna, S., Aarts, D. G. A., Philipse, A. P. Phys. Rev. E 2004, 69,
021804. 8. Koenderink, G. H., Aarts, D. G. A., Villeneuve de, V. W. A., Philipse, A. P., Tuinier, R.,
Lekkerkerker, H. N. W. Biomacromolecules 2003, 4, 129-136. 9. Clasen, C., Kulicke, W. M. Rheol. Acta 2001, 40, 74-85.
Chapter 6
108
10. Linden van der, E., Sagis, L. M. C., Venema, P. Curr. Opin. Colloid Interface Sci. 2003, 8, 349-358.
11. Meerveld van, J. J. Non-Newtonian Fluid Mech. 2004, 123, 259-267. 12. Klein, C., Venema, P., Sagis, L. M. C., Dusschoten van, D., Wilhelm, M., Wolfgang Spiess,
H., Linden van der, E., Rogers, S. S., Donald, A. M. Applied Rheology 2007, 17, 45210. 13. Zarzycki, R., Linden van der, E., Sagis, L. M. C., Venema, P., Babuchowski, A. Rheol. Acta
2004, 43, 464-471. 14. Kulkarni, A., Kharchenko, S., Kannan, R. M. Rheol. Acta 2006, 46, 951-958. 15. Hemar, Y., Tamehana, M., Munro, P. A., Singh, H. Food Hydrocolloids 2001, 15, 513-519. 16. Ross-Murphy, S. B., Morris, V. J., Morris, E. R. Faraday Symposium Chemical Society 1983,
18, 115-129. 17. Ruis, H. G. M., Venema, P., Linden van der, E. Food Hydrocolloids 2007, 21, 545-554. 18. Ruis, H. G. M., Venema, P., Linden van der, E. Langmuir 2007, 23, 1007-1013. 19. Hemar, Y., Tamehana, M., Munro, P. A., Singh, H. Food Hydrocolloids 2001, 15, 565-574. 20. Nash, W., Pinder, D. N., Hemar, Y., Singh, H. Int. J. Biol. Macromol. 2002, 30, 269-271. 21. Moschakis, T., Murray, B. S., Dickinson, E. Langmuir 2006, 22, 4710-4719. 22. Vliegenthart, G. A., Lekkerkerker, H. N. W. J. Chem. Phys. 1999, 111, 4153-4157. 23. Dickinson, E. Soft Matter 2006, 2, 642-652.

Summary
Samenvatting
Summary
110
Summary Proteins, and especially protein interactions are important for the structure formation of food products, like foams, emulsions or gels. The structure is one of the important characteristics of a product, because it controls, among other properties taste and perception. For the development of food materials it is essential to understand the role of the interparticle interactions on protein aggregation and structure formation. Since a lot of products are processed under shear, it is also important to understand the effect of shear on the structure. The general aim of the work described in this thesis was to investigate the structure-rheology relations for dairy related products, focusing on model systems containing sodium caseinate. Special attention was given to the effects of pH and shear on aggregation phenomena. In chapter 2 and 3 the acid induced gelation of sodium caseinate is described. With static light scattering the interaction between sodium caseinate molecules in a dilute solution was determined as a function of pH and temperature. This data was used, in combination with the adhesive hard sphere model, to explain the initial gelation kinetics of the acid induced gelation of sodium caseinate. The onset of gelation was found to be independent of the protein concentration, but controlled by pH and temperature. The critical pH for the onset of gelation slightly decreased with increasing temperature. The obtained gels, with a final pH of ~4.6, were out of equilibrium systems. However, due to the slow kinetics of the system they were quite stable on the time scale studied. The formed gels were described using a fractal dimension. Increasing temperature during gelation caused densification of the final structure. The main structural development is assumed to take place near the gel point. Because of this characterization of the rheological behavior near the gel point is important. However, chapter 2 showed that, using rheology, the behavior near the gel point could not be satisfactory characterized. It was impossible to follow the structure formation in a semi-dilute caseinate solution up to the onset of gelation. Because of this, in chapter 3, diffusing wave spectroscopy (DWS) was used to analyze the initial structure formation. At neutral pH sodium caseinate solutions are rather transparent. Since DWS is specially suited for turbid systems, a small amount (~1 wt%) of density matched emulsion droplets was added to the system to act as tracer particles. Upon acidification down to a pH of ~5.4 almost no changes were observed. The autocorrelation curves coincided and the transmitted intensity did not change. Further decrease of the pH caused an increase of the size of the sodium caseinate aggregates. They started to contribute to the measured signal, resulting in an
Summary
111
increased turbidity and a shift of the correlation curves to shorter decay times. At a pH below 5.2 the scattering caused by the added emulsion droplets became negligible. With further decrease of the pH eventually a network was formed by the sodium caseinate. The DWS data were used to obtain an estimate of the viscoelastic moduli, which were subsequently used to indicate the gel point by a frequency independent loss tangent. At the gel point we obtained strong indications that the system could not be characterized by a single fractal dimension. Chapter 4 and 5 describe the acid induced gelation of sodium caseinate stabilized emulsions. Chapter 4 describes the acidification of emulsions without shear and chapter 5 describes the acidification of the same systems while being sheared at 0, 0.005, 0.01, 0.1, 1 or 10 s-1. The emulsions contained 15 wt% of palmfat and either 0.6 wt% or 5 wt% of sodium caseinate. Excess of sodium caseinate present in the continuous phase forms small aggregates of ~10 nm. These small sodium caseinate aggregates induce a depletion force between the oil droplets, causing flocculation of the oil droplets. Using the criterion of the gel point being identified by a frequency independent loss tangent showed that the sol-gel transition and the ergodic-nonergodic transition of the acidifying emulsions did not coincide. Upon acidification of an emulsion without excess of sodium caseinate in the continuous phase one sol-gel transition was observed. The random distribution of oil droplets at neutral pH transformed upon acidification into a continuous network of oil droplets. In contrast with the former, two sol-gel transitions were observed during the acid induced gelation of sodium caseinate stabilized emulsions containing excess of sodium caseinate. The initial depletion induced network of oil droplets changed upon acidification into a network of sodium caseinate in which the oil droplets were expected to be randomly embedded. The first transition, a gel-sol transition, was the result of breakdown of the emulsion droplets network and the second transition, a sol-gel transition, was the result of the aggregation of the sodium caseinate. Acidification of these emulsions while being sheared up to the onset of gelation did not affect the rheological behavior of the final obtained gel. Continuous shear during the whole acidification process did cause several changes. At a pH of 5.17 ± 0.05 the viscosity of all emulsions, independent of the shear rate applied or of the protein concentration, suddenly increased. The final viscosity of the emulsions (at a pH of ~4.6) decreased with increasing shear rate, as did G’ and G”. This is most probably caused by a shift in the aggregation-break-up equilibrium of the clusters towards the break-up of clusters. At neutral pH the autocorrelation curves shifted to shorter decay times with increasing shear rate, and the shape changed from exponential in time (t) to exponential in time
Summary
112
squared (t2). The latter scaling showing that the diffusive motion of the scatterers became, relative to the shear induced motion, negligible. The DWS data indicated a shear rate dependent aggregate size for emulsions with excess of sodium caseinate upon acidification down to a pH of ~5.4. Acidification of both emulsions while being sheared at 10 s-1 resulted in a jump of l* on approach of the isoelectric point, indicating that the emulsions remained ergodic. In this chapter the critical point was defined either by a frequency independent loss tangent or by a jump of l*. The radius which was determined at the critical point decreased with increasing shear rate. The results suggested the formation of a less dense network structure with increasing shear rate, while the aggregates that formed the network became more compact. In the final chapter of this thesis the effect of shear on alignment of emulsion droplets was investigated. No alignment of emulsion droplets was observed when the emulsion droplets were dispersed in either water or a sodium caseinate solution. Application of shear (200 s-1 for 600 s) of a system in which the emulsion droplets were dispersed in a 0.1 wt% xanthan solution did result in moderate alignment in strings of the emulsion droplets. Addition of sodium caseinate to this system reduced the string formation of the emulsion droplets. Rheo-optical measurements of the different continuous phases suggested microscopic phase separation in samples containing xanthan as well as sodium caseinate. This was assumed to be the cause of inhibited string formation of the oil droplets. To conclude, this thesis contributes to the knowledge relevant to the dairy industry. The effect of shear on the acid induced structure formation of sodium caseinate and of sodium caseinate stabilized emulsions is analyzed and enables one to better understand the structure formation of dairy based soft solids. This will facilitate the control of the structure formation and as such support the development of new dairy products..
Samenvatting
113
Samenvatting Eiwitten, en in het bijzonder interacties tussen eiwitten zijn belangrijk voor de structuurvorming van levensmiddelen zoals schuimen, emulsies en gelen. De structuur is een belangrijke productparameters omdat de structuur mede verantwoordelijk is voor bepaalde eigenschappen van levensmiddelen zoals smaak en perceptie. Voor de ontwikkeling van nieuwe levensmiddelen is het essentieel om het effect van verschillende interacties op eiwit aggregatie en structuurvorming te begrijpen. Aangezien veel producten onder invloed van stroming gemaakt worden, is the ook belangrijk om het effect van stroming op de structuur te begrijpen. Het doel van het onderzoek dat beschreven is in dit proefschrift is het vergroten van de variatie in, en het beheersen van de structuureigenschappen van zuivel gerelateerde gelen met behulp van fundamentele inzichten. Speciale aandacht is besteedt aan het effect van pH en van stroming op de totstandkoming van structuur. Aangezien melk een complex mengsel is, is gekozen om te werken met een modelsysteem bestaande uit natrium caseïnaat, palmvet en xanthan (alleen in hoofdstuk 6 gebruikt). In hoofdstuk 2 en 3 is de zuur geïnduceerde gelering van natrium caseïnaat beschreven. Met behulp van statische lichtverstrooiings experimenten is de interactie tussen de caseïnaat moleculen als een functie van de pH en de temperatuur bepaald. Het “adhesive hard sphere” model is vervolgens gebruikt om de natrium caseïnaat systemen als een functie van de interactie te beschrijven. Het gelpunt is onafhankelijk van de concentratie natrium caseïnaat en wordt volledig bepaald door de pH en de temperatuur. De kritische pH van het gelpunt daalt met stijgende temperatuur. De verkregen gelen, met een pH van 4.6, waren niet in thermodynamisch evenwicht. Echter, als gevolg van langzame kinetiek was er, op de beschouwde tijdschaal, geen fase scheiding waargenomen. De structuur van de gevormde gelen is beschreven met behulp van een fractale dimensie. Gelering bij hogere temperatuur veroorzaakt de vorming van een dichtere gel structuur. De belangrijkste structurele ontwikkelingen vinden plaats nabij het gelpunt. Dit maakt de karakterisatie van het reologische gedrag rondom het gelpunt belangrijk. In hoofdstuk 2 hebben we laten zien dat de structurele ontwikkeling nabij het gelpunt niet nauwkeurig gevolgd kan worden met een reometer. In hoofdstuk 3 is daarom de initiële structuur vorming beschreven aan de hand van “diffusing wave spectroscopy” (DWS) experimenten. Natrium caseïnaat oplossingen zijn bij neutrale pH transparant. Aangezien DWS in het bijzonder geschikt is voor turbide systemen, zijn dichtheidsgematchte emulsiedruppels aan de natrium caseïnaat oplossingen toegevoegd. Gedurende de verzuring tot een pH van ~5.4 werden er geen veranderingen waargenomen. De autocorrelatie functie en de intensiteit van
Samenvatting
114
het doorgelaten licht veranderde niet. Verdere verzuring induceerde groei van de natrium caseinate aggregaten, wat resulteerde in een bijdrage aan het gemeten signaal. De turbiditeit van het systeem nam toe en de autocorrelatie functies verschoven naar kortere verval tijden. Bij een pH kleiner dan 5.2 werd de bijdrage van de emulsie druppels aan de verstrooiing van het licht verwaarloosbaar. Verdere verzuring resulteerde in de vorming van een netwerk van het natrium caseïnaat. Het gelpunt, gedefinieerd als het punt waar de verlies tangens (G”/G’) onafhankelijk is van de frequentie, was met behulp van de DWS data bepaald. De resultaten suggereerde dat de structuur gevormd op het gelpunt niet beschreven kan worden met een enkele fractale dimensie. Hoofdstuk 4 en 5 beschrijven de verzuring van natrium caseïnaat gestabiliseerde emulsies. Hoofdstuk 4 beschrijft de verzuring van emulsies in rust en hoofdstuk 5 beschrijft het effect van stroming (0, 0.005, 0.01, 0.1, 1 of 10 s-1) op de verzuring van deze emulsies. De emulsies bevatte 15 wt% palmvet en 0.6 of 5 wt% natrium caseïnaat. De overmaat aan natrium caseïnaat in de laatst genoemde emulsie vormt, in de continue fase, kleine aggregaten van ongeveer 10 nm. Deze aggregaten induceren een depletie kracht tussen de emulsie druppels, wat resulteert in vlokvorming van de emulsie druppels. Gedurende de verzuring van een emulsie zonder overmaat aan natrium caseïnaat in de continue fase (15 wt% palmvet en 0.6 wt% natrium caseïnaat) was aan de hand van een frequentie onafhankelijke verlies tangens een vloeistof-vast overgang geïdentificeerd. De emulsie druppels, die bij neutrale pH een willekeurige verdeling hebben, vormde als gevolg van de verzuring een continue netwerk. Gedurende de verzuring van een emulsie met overmaat aan natrium caseïnaat in de continue fase (15 wt% palmvet en 5 wt% natrium caseïnaat) zijn er twee vloeistof-vast overgangen geïdentificeerd. Bij neutrale pH vormde de emulsie druppels een depletie geïnduceerd netwerk. Door de verzuring veranderde de depletie interactie en viel dit netwerk uiteen. Dit is de eerst vast-vloeistof overgang. Als gevolg van verdere verzuring aggregeerde het natrium caseïnaat, wat resulteerde in de vorming van een netwerk van natrium caseïnaat waarin de emulsie druppels naar verwachting willekeurig verdeeld zijn. Dit is de tweede overgang, namelijk een vloeistof-vast overgang. Opvallend was dat voor de verzuurde emulsies geen van de gevonden vloeistof-vast overgangen correspondeerde met een ergodisch-nonergodische overgang. Verzuring van deze emulsies onder stroming tot het gelpunt had geen effect of het waargenomen reologische gedrag van de uiteindelijk verkregen gelen. Het opleggen van een continue stroming gedurende het gehele verzurings- en geleringsproces veroorzaakte wel een andere structuur. Bij een pH van 5.17 ± 0.05 nam de viscositeit van alle emulsies sterk toe, onafhankelijk van de aangelegde stromingssnelheid en de concentratie eiwit. De
Samenvatting
115
uiteindelijke viscositeit van de emulsies (bij een pH van ~4.6), net als G’ en G”, nam af met toenemende stromingssnelheid. Dit is meest waarschijnlijk veroorzaakt door verschuiving van het evenwicht van aggregatie van cluster en opbreken van clusters in de richting van opbreken. De met DWS gemeten autocorrelatie functies verschoven met toenemende stromingssnelheid naar kortere vervaltijden. Daarnaast veranderde de vorm van exponentieel in de tijd (t) naar exponentieel in het kwadraat van de tijd (t2). De laatst genoemde relatie geeft aan dat de diffuse beweging van de lichtverstrooiende deeltjes verwaarloosbaar is ten opzichte van de convectie geïnduceerde beweging. De vlokgrootte van emulsies met een overmaat natrium caseinate in de continue fase, tussen pH 7 en 5.4, was afhankelijk van de aangelegde stromingssnelheid. Een hoge stromingssnelheid (10 s-1) tijdens de verzuring resulteerde voor beide emulsies, in een plotselinge toename van l*. De emulsies verzuurd bij een hoge stromingssnelheid bleven tijdens de gehele verzuring ergodisch, ook nabij het iso-electrisch punt terwijl een lagere stromingssnelheid ( 1<γ& s-1) resulteerde in een ergodische niet-ergodische overgang.
In hoofdstuk 5 is de kritische overgang gedefinieerd als het punt waar de verlies tangens onafhankelijk is van de frequentie of als het punt waar l* naar een hoger waarde springt. Op het kritische punt is een schatting gemaakt van de straal van de gevormde aggregaten. De gemiddelde straal nam af met toenemende stromingssnelheid. De resultaten suggereerde dat het gevormde netwerk met toenemende stromingssnelheid minder compact werd en dat de aggregaten die het netwerk vormen compacter werden. In het laatste hoofdstuk in dit proefschrift is het effect van stroming op de uitlijning van emulsie druppels beschreven. Emulsiedruppels gedispergeerd in water dan wel in een natrium caseïnaat oplossing herrangschikte niet onder stroming. Emulsiedruppels gedispergeerd in een 0.1 wt% xanthan oplossing lijnde uit onder stroming (200 s-1 gedurende 600 seconde) en vormde kettingen van emulsie druppels. Toevoeging van natrium caseïnaat aan een 0.1 wt% xanthan oplossing reduceerde de uitlijning van de emulsie druppels. Reo-optische experimenten suggereerde microscopische fase scheiding in mengsels van xanthan en natrium caseïnaat. Er is verondersteld dat deze fase scheiding een negatief effect heeft op de uitlijning van emulsie druppels. Samenvattend draagt dit proefschrift bij aan kennis die relevant is voor de zuivel industrie. Het effect van stroming op de zuur geïnduceerde structuurvorming van natrium caseïnaat en van natrium caseïnaat gestabiliseerde emulsies is geanalyseerd, waardoor we de structuur vorming van zuivel gerelateerde gelen beter begrijpen. De totstandkoming van
Samenvatting
116
een structuur kan gestuurd worden, wat als zodanig gebruikt kan worden bij de ontwikkeling van nieuwe zuivelproducten.
Dankwoord
Dankwoord
118
Dankwoord Mijn proefschrift af! U heeft nu een mooi exemplaar in uw handen. Na vier jaar hier hard aan gewerkt te hebben, is het nu tijd om terug te kijken naar alle mooie herinneringen van deze periode. September 2002, vers afgestudeerd als levensmiddelentechnoloog, besloot ik om niet het bedrijfsleven in te gaan, maar om promotieonderzoek te gaan doen. En het kon niet beter, een zuivel gerelateerd onderzoek lag, bij de leerstoelgroep fysica en fysische chemie van levensmiddelen, op mij te wachten. Helemaal op mijn lijf geschreven. In januari 2003 ben ik vol enthousiasme aan de slag gegaan. Na een aantal brainstormsessies samen met Friesland Foods was er een modelsysteem gekozen en een projectplan geschreven. De fundamenten voor mijn proefschrift waren bij deze gelegd. Natuurlijk heb ik tijdens mijn promotieonderzoek veel steun van de mensen om mij heen gehad. Dit is dan ook de plek om de mensen die mij bij hebben gestaan persoonlijk te bedanken. Allereerst wil ik mijn begeleiders bedanken voor de fijne samenwerking en voor alles wat ik van jullie heb geleerd. Erik bedankt dat je mij de mogelijkheid hebt gegeven om op dit onderwerk te promoveren. De werkbesprekingen en discussies waren altijd erg stimulerend. Paul bedankt dat je altijd voor me klaar stond als ik een vraag had of wat dan ook wilde bespreken. In de afgelopen vier jaar heb ik je beter leren kennen, wat de samenwerking ten goede kwam en wat leuke gesprekken over van alles en nog wat opleverde. Ook wil ik Friesland Foods en dan met name Marcel Paques, Frank Jeurissen en Jaap de Slegte bedanken voor het mogelijk maken van dit project, voor de continue interesse in de voortgang en voor de discussies aangaande mijn onderzoek. Mijn kamergenoten, die ik vele heb gehad, wil ik natuurlijk ook bedanken. Jullie stonden altijd voor mij klaar om gezellig te kletsen, om het onderzoek te bespreken, of om mijn geklaag aan te horen als alles niet naar wens ging. Elke en Suzanne wil ik in het bijzonder noemen; kamer 306 was uiteindelijk toch echt mijn “thuis”. Dank jullie wel voor de gezelligheid, voor alle wetenschappelijke en niet wetenschappelijke gesprekken! Suus, ik vind het erg fijn dat je tijdens mijn verdediging paranimf bent. En dan zijn er natuurlijk ook nog de andere collega’s van Food Physics en van PDQ met wie ik vele koffie-pauzes, lunch-pauzes, uitjes en borrels heb doorgebracht. Leonard, Els en Harry, bedankt dat jullie altijd klaarstonden om mij te helpen of om gewoon gezellig even te kletsen. Natuurlijk mag ik “mijn” studenten ook niet vergeten. Jeanette van Traag, Anneke Verhaart, Mariska Asselman, Kitty van Gruijthuijsen en Jojanneke Bron heel erg bedankt. Jullie hebben een bijzondere bijdrage geleverd aan mijn onderzoek. Ik vond het erg leuk om met jullie samen te werken en heb er hiervan veel geleerd.
Dankwoord
119
Paula, Ruth en Julita, bedankt voor de ontspanning tijdens alle gezellige avonden en weekendjes weg. Dat er nog vele mogen volgen! Julita, ik vond het erg leuk om samen met jou in hetzelfde project AIO te zijn. Ook vind ik het erg fijn dat je tijdens mijn verdediging aan mijn zijde zit als paranimf. Tenslotte moet ik natuurlijk ook het thuisfront niet vergeten. Zonder jullie steun weet ik niet of het allemaal gelukt was. Mam en pap, veel frustraties hebben jullie van mij aan moeten horen, maar toch staan jullie altijd voor mij klaar. Ik ben dan ook erg blij dat ik thuis altijd met open armen ontvangen wordt. Echt geweldig. Henri & Ellen, Walter & Heidie, Jan & Lenie en Sonja, waarschijnlijk was het niet altijd duidelijk wat ik nu aan het doen was, maar dit is waar ik de afgelopen jaren aan gewerkt heb. Corné, jij wist misschien ook niet altijd precies waar ik mee bezig was, maar je toont altijd veel interesse en probeert het te begrijpen. Bedankt voor je liefde, je steun, de ontspanning en vrolijkheid die jij mij geeft. Bedankt allemaal
Hilde

List of Publications
121
List of publications C. Veerman, H. Ruis, L.M.C. Sagis, E. van der Linden. Effect of electrostatic interactions on the percolation concentration of β-lactoglobulin gels. Biomacromolecules 2002, 3, 869-873 C. Veerman, H. Ruis, L.M.C. Sagis, E. van der Linden. Rheology and mesostructure of β-lactoglobulin gels at pH 2. Proceedings 6th European conference of rheology, 2002, Erlangen, Germany, 321-322 H.G.M. Ruis, P. Venema, E. van der Linden. Phase transition behaviour of acidifying oil in water emulsions; micro-rheology versus macro-rheology. Proceedings of the 4th International Symposium on Food Rheology and Structure, 2006, Zurich, Switserland, 311-315 H.G.M. Ruis, P. Venema and E. van der Linden. Relation between pH-induced stickiness and gelation behaviour of sodium caseinate aggregates as determined by light scattering and rheology. Food Hydrocolloids 2007, 21, 545-554 H.G.M. Ruis, K. van Gruijthuijsen, P. Venema and E. van der Linden. Transitions in structure in O/W emulsions studied by diffusing wave spectroscopy. Langmuir 2007, 23, 1007-1013 H.G.M. Ruis, P. Venema and E. van der Linden. Aggregation of sodium caseinate as studied by DWS. Submitted for publication H.G.M. Ruis, P. Venema and E. van der Linden. DWS used to study the influence of shear on aggregation. Submitted for publication H.G.M. Ruis, J. Bron, P. Venema and E. van der Linden. Properties of the continuous phase to cause shear induced string formation of emulsion droplets. To be submitted

Curriculum Vitae
123
Curriculum Vitae Hilde Gertruda Maria Ruis werd geboren op 1 februari 1979 in Lithoyen. In 1997 behaalde zij het VWO-diploma aan het Maasland college in Oss, waarna zij in datzelfde jaar begon met de studie levensmiddelentechnolog aan Wageningen Universiteit. Tijdens haar studie deed ze twee afstudeervakken. Een bij de leerstoelgroep fysica en fysische chemie van levensmiddelen en een bij de leerstoelgroep bij zuivelkunde. Het laatstgenoemde afstudeervak werd uigevoerd bij NIZO food research te Ede. Haar stage voerde zij gedurende 6 maanden uit bij het “Food Research and Development Centre” in Saint-Hyacinthe in Canada. Zij studeerde af in september 2002. Vanaf januari 2003 was zij in dienst van Wageningen Universiteit bij de leerstoelgroep fysica en fysische chemie van levensmiddelen, waar zij gedurende vier jaar dit promotieonderzoek in samenwerking met Friesland Foods heeft uitgevoerd. De resultaten van dit onderzoek staan beschreven in dit proefschrift. Sinds 1 april 2007 is Hilde werkzaam als product technoloog bij N.V. Nutricia in Zoetermeer.

Educational activities
125
Educational activities Discipline specific activities Courses − Rheology course, 2003, KU Leuven, Belgium − Han-sur-Lesse Winterschool, 2004 and 2005, Han-sur-Lesse, Belgium Meetings − NWO Meetings Liquids & Interfaces, 2003, 2004 and 2006, Lunteren, the Netherlands − Food Colloids Conference: Interactions, Microstructure & Processing, 2004, Harrogate,
UK − Symposium: Bionanotechnology for Food, 2004, Wageningen, The Netherlands − Jülich Soft Matter Days, 2004, Jüllich Forschungszentrum, Germany − Student conference, 2005, Biezenmortel, The Netherlands − Liquid Matter Days, 2005, Utrecht, The Netherlands − 4th International Symposium on Food Rheology and Structure, 2006, Zurich,
Switzerland − 8th International Hydrocolloids Conference, 2006, Trondheim, Norway General Courses − Organizing and supervising MSc thesis projects (2004) − Project planning and time management (2004) − Scientific writing (2004) − Professional communication strategies (2005) − Ethics and philosophy on food science (2006) − Career perspectives (2006) The research described in this thesis was carried out at Wageningen University, the Netherlands. This research was part of the research programme of the graduate school VLAG (Food Technology, Agrobiotechnology, Nutrition & Health Sciences).

Het project is uitgevoerd met subsidie van het Programma E.E.T. (Economie, Ecologie en Technologie) een gezamenlijk initiatief van de Ministeries van Economische Zaken, Onderwijs, Cultuur en Wetenschappen en Volkshuisvesting, Ruimtelijke Ordening en Milieubeheer. Het programma wordt uitgevoerd door het Programmabureau E.E.T., een onderdeel van SenterNovem.


