Embed Size (px)
Citation preview
Structural studies of a baboon~Papio sp.! plasmaprotein inhibitor of cholesteryl ester transferase
GARRY W. BUCHKO,1,2 ANNETT ROZEK,1,4 PATRICK KANDA,3,5
MICHAEL A. KENNEDY,2 and ROBERT J. CUSHLEY11Institute of Molecular Biology and Biochemistry, Simon Fraser University, Burnaby, British Columbia V5A 1S6, Canada2Environmental Molecular Sciences Laboratory, Pacific Northwest National Laboratories, Richland, Washington 993523Department of Virology and Immunology, Southwest Foundation for Biomedical Research, San Antonio, Texas 78228-0147
~Received December 7, 2000;Final Revision May 25, 2000;Accepted June 2, 2000!
Abstract
A 38-residue protein associated with cholesteryl ester transfer inhibition has been identified in baboons~Papiosp.!. Thecholesteryl ester transfer inhibitor protein~CETIP! corresponds to the N-terminus of baboon apoC-I. Relative to CETIP,baboon apoC-I is a weak inhibitor of baboon cholesteryl ester transferase~CET!. To study the structural featuresresponsible for CET inhibition, CETIP was synthesized by solid-phase methods. Using sodium dodecyl sulfate~SDS!to model the lipoprotein environment, the solution structure of CETIP was probed by optical and1H NMR spectroscopy.Circular dichroism data show that the protein lacks a well-defined structure in water but, upon the addition of SDS,becomes helical~56%!. A small blue shift of 8 nm was observed in the intrinsic tryptophan fluorescence of CETIP inthe presence of saturating amounts of SDS, suggesting that tryptophan-23 is not buried deeply in the lipid environment.The helical nature of CETIP in the presence of SDS was confirmed by upfield1Ha secondary shifts and an averagesolution structure determined by distance geometry0simulated annealing calculations using 476 NOE-based distancerestraints. The backbone~N2Ca2C5O! root-mean-square deviation of an ensemble of 17 out of 25 calculatedstructures superimposed on the average structure was 1.066 0.30 Å using residues V4–P35 and 0.516 0.17 Å usingresidues A7–S32. Although the side-chain orientations fit the basic description of a class A amphipathic helix, bothintramolecular salt bridge formation and “snorkeling” of basic side chains toward the polar face play minor, if any, rolesin stabilizing the lipid-bound amphipathic structure. Conformational features of the calculated structures for CETIP arediscussed relative to models of CETIP inhibition of cholesteryl ester transferase.
Keywords: apolipoproteins; atherosclerosis; CD; fluorescence spectroscopy; lipoproteins; NMR; reverse cholesteroltransport
High plasma HDL-cholesterol levels have been correlated with adecreased risk of developing coronary artery disease in both hu-mans and animals~Miller & Miller, 1975; Kannel et al., 1980!.
The biochemical events that regulate the plasma lipoprotein levelsare not well understood. One plasma component identified in mod-ulating HDL levels in humans is cholesteryl ester transferase~CET,Mr 74 kDa, 476 residues! ~Koizumi et al., 1985; Yokoyama et al.,1986; Tall, 1993!, a protein that exchanges cholesterol esters inHDL for triglycerides in lower density lipoproteins~LDL and VLDL!~Morton & Zilversmit, 1983!. The level of CET activity influencesthe pathway for reverse cholesterol transport, an intricate mecha-nism that moves cholesterol from peripheral tissue to the liver forclearance~Agellon et al., 1990!.
Plasma CET-deficient states have been associated with a de-creased risk for developing coronary artery disease. Individualswith below normal CET activity due to mutations in the CET geneoften have above normal HDL levels~Tall, 1995! and a longerlifespan ~Inazu et al., 1990!. The level of CET activity varieswidely between mammalian species~Ha & Barter, 1982! and,except for the pig, there is a general correlation between low CETactivity levels and reduced susceptibility to atherosclerosis~Tall,1986!. The elevation of CET levels in rodents, a species with low
Reprint requests to: Garry W. Buchko, Macromolecular Structure andDynamics, Environmental Molecular Sciences Laboratory, Pacific North-west National Laboratories, P.O. Box 999, MSIN K8-98, Richland, Wash-ington 99352; e-mail: [email protected].
4Present address: Department of Microbiology, University of BritishColumbia, Vancouver, British Columbia, Canada.
5Present address: BioSynthesis Inc., 612 E. Main St., Lewisville, Texas75057.
Abbreviations:HDL, high-density lipoprotein; VLDL, very low-densitylipoprotein; LDL, low-density lipoprotein; CET, cholesteryl ester transfer-ase; CETIP, cholesteryl ester transfer inhibitor protein; LCAT, lecithin:cholesterol acyltransferase; SDS, sodium dodecyl sulfate; DPC, dedecyl-phosphocholine; cmc, critical micelle concentration; CD, circular dichroism;NOE, nuclear Overhauser effect; NOESY, nuclear Overhauser enhance-ment spectroscopy; DQF-COSY, double-quantum filtered correlation spec-troscopy; TOCSY, total correlation spectroscopy; CSI, chemical shift index;DSSP, description of secondary structure in proteins.
Protein Science~2000!, 9:1548–1558. Cambridge University Press. Printed in the USA.Copyright © 2000 The Protein Society
1548
CET activity, through either injection~Dullaart et al., 1989! ortransgenesis~Marotti et al., 1992!, results in a plasma lipoproteinprofile associated with the development of atherosclerosis.
Baboons have been used to model human dyslipoproteinemiasand cardiovascular diseases because their lipoproteins and lipo-protein metabolism are similar to humans~Bojanovski et al., 1978;Kushwaha et al., 1978!. Through selective breeding a family ofbaboons has been identified whose HDL levels rise when fed a diethigh in cholesterol and saturated fats~Williams et al., 1984!. Suchdiets normally produce lower HDL levels and higher VLDL levelsbecause cholesterol stimulates CET gene expression~Jiang et al.,1992!, which is believed to increase reverse cholesterol transportthrough the VLDL–LDL pathway~Tall, 1993!. While elevatedlevels of CET may provide a direct anti-atherogenic effect byhelping to deplete cholesterol from arterial wall foam cells~Faustet al., 1990!, the concomitant changes in the plasma lipoproteinprofile are pro-atherogenic. The high HDL response observed inthe unique baboon family after a diet high in cholesterol and sat-urated fats has been attributed to an HDL associated protein~Kush-waha et al., 1993! that inhibits cholesteryl ester transfer mediatedby CET. The amino acid sequence of this baboon CET inhibitorprotein ~CETIP, Mr 4.0 kDa! corresponds to the N-terminal 38residues of baboon apolipoprotein C-I~apoC-I,Mr 6.6 kDa!. Rel-ative to CETIP, baboon apoC-I~57 residues! is a weak in vitroinhibitor of baboon CET~Kushwaha et al., 1993!. The biologicalorigin of CETIP is unknown, and the currently favored hypothesisis that it arises from postsynthetic proteolysis of full-length apoC-Iin the liver or plasma~Kushwaha et al., 1993!.
Because CETIP is associated with high-density lipoprotein, it isan apolipoprotein. A prominent feature of the exchangeable apo-lipoproteins is repeating amino acid motifs of 11 or 22 residues,which, based upon predictions from primary sequences, may adoptamphipathic helical structures in the presence of lipid. Such astructure, by definition, contains polar and nonpolar amino acidresidues segregated on opposing faces of the long axis of ana-helix~Segrest et al., 1974!. In a phospholipid environment, the hydro-phobic amino acid residues on the nonpolar face are predicted tointeract with the acyl chains of the lipid while the hydrophilicamino acid residues on the polar face are exposed to the aqueousmilieu. CETIP contains one region, spanning residues 7–32, which,on the basis of similarities to human apoC-I~Segrest et al., 1990,1992!, is predicted to adopt an amphipathic helical structure in thepresence of lipid.
To further understand the conformational changes that occurupon the association of apolipoprotein with lipid, and to betterdefine secondary structural elements responsible for CET inhibi-tion, CETIP was chemically synthesized for study by optical andtwo-dimensional1H NMR spectroscopy. Sodium dodecyl sulfate,an agent commonly used to model membranes~Oppella & Mc-Donnell, 1993; Henry & Sykes, 1994!, was used to model thelipoprotein environment~Rozek et al., 1995, 1997, 1999; Buchkoet al., 1996a, 1996b, 1997; Wang et al., 1996a, 1996b, 1997! inpart, because the spherical micelle resembles a lipoprotein; a hy-drophobic lipid core of cholesterol and triglycerides surrounded bya surface monolayer of cholesterol esters, phospholipids, and apo-lipoproteins~Assmann & Brewer, 1974; Shen et al., 1977!. Fur-thermore, the diameter of an SDS micelle,;50 Å, is the same sizeas the smallest HDL particles~HDL particle diameters range from40–100 Å~Scanu et al., 1982!!. Circular dichroism spectroscopyand 1Ha NMR secondary shift analysis was used to estimate theamount of helical structure adopted by CETIP in the presence of
SDS. Two-dimensional1H NMR studies were performed in thepresence of deuterated SDS~SDS-d25! at a molar ratio of proteinto detergent of 1:80. Distance restraints obtained from NOESYdata were used to calculate an ensemble of structures for CETIP inSDS with distance geometry0simulated annealing methods. Thebiological significance of the major structural features observedfor CETIP in the model lipid environment is discussed in relationto models for cholesteryl ester transferase inhibition.
Results
Optical spectroscopy
The addition of SDS to an aqueous solution of CETIP, at levelsabove the critical micelle concentration, produced a blue shift of8 nm in the intrinsic tryptophan fluorescence. Such a shift in themaximum emission wavelength of the fluorescence of tryptophansuggests an association of the protein with SDS accompanied by atransfer of the tryptophan residue from a polar to nonpolar envi-ronment~Lakowicz, 1983; Buchko et al., 1996a!.
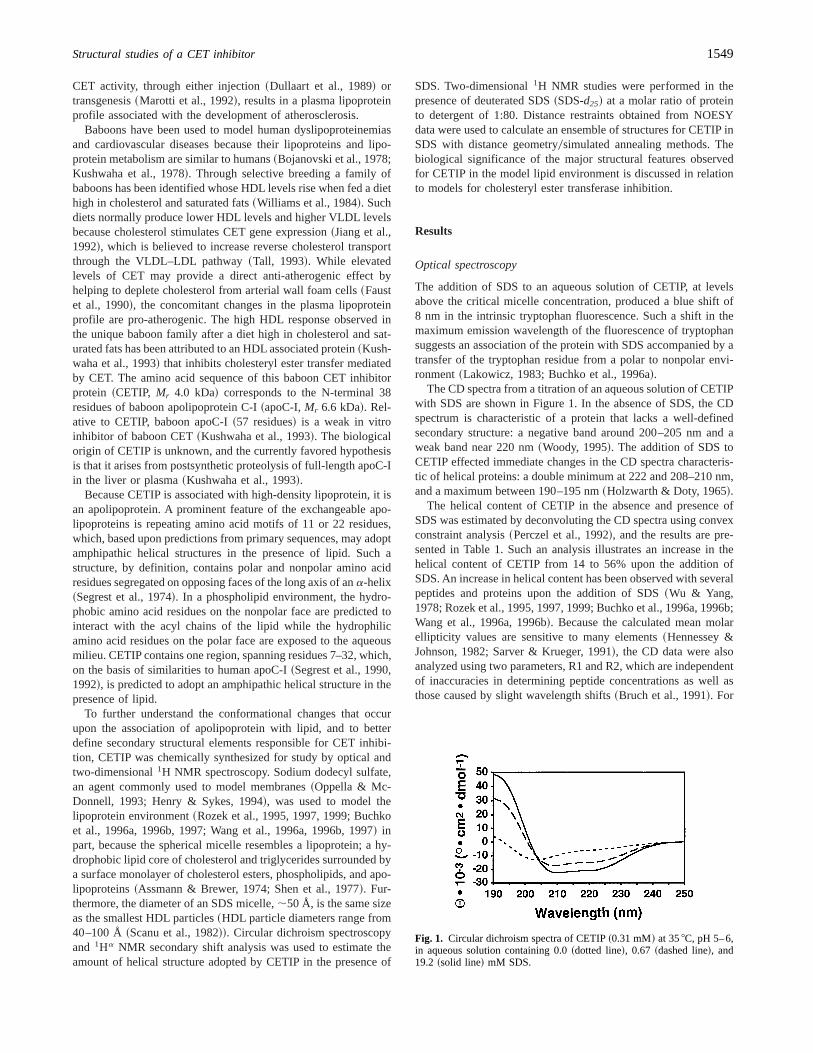
The CD spectra from a titration of an aqueous solution of CETIPwith SDS are shown in Figure 1. In the absence of SDS, the CDspectrum is characteristic of a protein that lacks a well-definedsecondary structure: a negative band around 200–205 nm and aweak band near 220 nm~Woody, 1995!. The addition of SDS toCETIP effected immediate changes in the CD spectra characteris-tic of helical proteins: a double minimum at 222 and 208–210 nm,and a maximum between 190–195 nm~Holzwarth & Doty, 1965!.
The helical content of CETIP in the absence and presence ofSDS was estimated by deconvoluting the CD spectra using convexconstraint analysis~Perczel et al., 1992!, and the results are pre-sented in Table 1. Such an analysis illustrates an increase in thehelical content of CETIP from 14 to 56% upon the addition ofSDS. An increase in helical content has been observed with severalpeptides and proteins upon the addition of SDS~Wu & Yang,1978; Rozek et al., 1995, 1997, 1999; Buchko et al., 1996a, 1996b;Wang et al., 1996a, 1996b!. Because the calculated mean molarellipticity values are sensitive to many elements~Hennessey &Johnson, 1982; Sarver & Krueger, 1991!, the CD data were alsoanalyzed using two parameters, R1 and R2, which are independentof inaccuracies in determining peptide concentrations as well asthose caused by slight wavelength shifts~Bruch et al., 1991!. For
Fig. 1. Circular dichroism spectra of CETIP~0.31 mM! at 358C, pH 5–6,in aqueous solution containing 0.0~dotted line!, 0.67 ~dashed line!, and19.2 ~solid line! mM SDS.
Structural studies of a CET inhibitor 1549
a random structure R1 is positive and R2 is close to 0; in a highlyhelical state R1 is near22, and R2 approaches 1. Such parameters,tabulated in Table 1, follow trends characteristic of an increase inhelical secondary structure of CETIP upon association with SDS.
Proton resonance assignments
In a nonlipid aqueous environment above a pH of 2.5 and at aconcentration of;2.5 mM, the one-dimensional1H NMR spec-trum of CETIP contained poorly resolved resonances characteristicof self-aggregation~Fitton, 1981; Wilson et al., 1994!. Further
indirect evidence for aggregation was the inability to prepare aprotein solution with a concentration greater than 2.5 mM and theformation of a thixotropic solution upon lowering the pH below2.5. The thixotropic state was reversed by either raising the pHabove 2.5 or adding SDS to the solution.
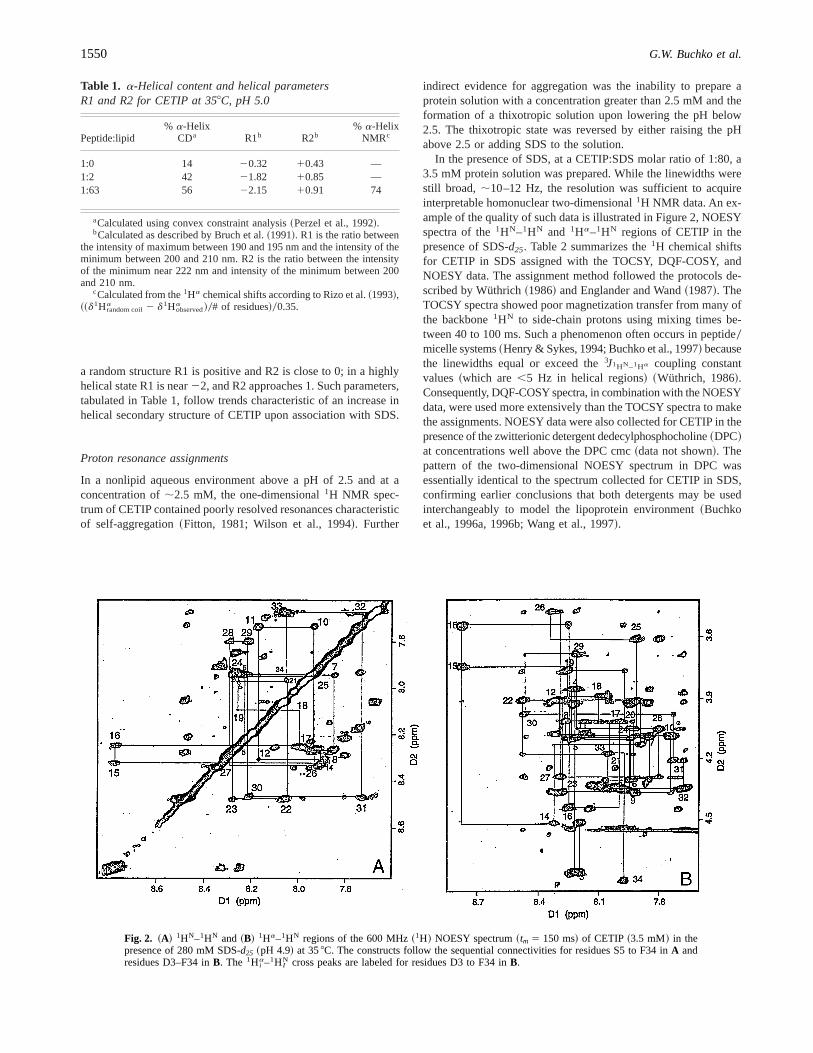
In the presence of SDS, at a CETIP:SDS molar ratio of 1:80, a3.5 mM protein solution was prepared. While the linewidths werestill broad, ;10–12 Hz, the resolution was sufficient to acquireinterpretable homonuclear two-dimensional1H NMR data. An ex-ample of the quality of such data is illustrated in Figure 2, NOESYspectra of the1HN–1HN and 1Ha–1HN regions of CETIP in thepresence of SDS-d25. Table 2 summarizes the1H chemical shiftsfor CETIP in SDS assigned with the TOCSY, DQF-COSY, andNOESY data. The assignment method followed the protocols de-scribed by Wüthrich~1986! and Englander and Wand~1987!. TheTOCSY spectra showed poor magnetization transfer from many ofthe backbone1HN to side-chain protons using mixing times be-tween 40 to 100 ms. Such a phenomenon often occurs in peptide0micelle systems~Henry & Sykes, 1994; Buchko et al., 1997! becausethe linewidths equal or exceed the3J1HN–1Ha coupling constantvalues~which are,5 Hz in helical regions! ~Wüthrich, 1986!.Consequently, DQF-COSY spectra, in combination with the NOESYdata, were used more extensively than the TOCSY spectra to makethe assignments. NOESY data were also collected for CETIP in thepresence of the zwitterionic detergent dedecylphosphocholine~DPC!at concentrations well above the DPC cmc~data not shown!. Thepattern of the two-dimensional NOESY spectrum in DPC wasessentially identical to the spectrum collected for CETIP in SDS,confirming earlier conclusions that both detergents may be usedinterchangeably to model the lipoprotein environment~Buchkoet al., 1996a, 1996b; Wang et al., 1997!.
Table 1. a-Helical content and helical parametersR1 and R2 for CETIP at 358C, pH 5.0
Peptide:lipid% a-Helix
CDa R1b R2b% a-Helix
NMRc
1:0 14 20.32 10.43 —1:2 42 21.82 10.85 —1:63 56 22.15 10.91 74
aCalculated using convex constraint analysis~Perzel et al., 1992!.bCalculated as described by Bruch et al.~1991!. R1 is the ratio between
the intensity of maximum between 190 and 195 nm and the intensity of theminimum between 200 and 210 nm. R2 is the ratio between the intensityof the minimum near 222 nm and intensity of the minimum between 200and 210 nm.
cCalculated from the1Ha chemical shifts according to Rizo et al.~1993!,~~d1Hrandom coil
a 2 d1Hobserveda !0# of residues!00.35.
Fig. 2. ~A! 1HN–1HN and ~B! 1Ha–1HN regions of the 600 MHz~1H! NOESY spectrum~tm 5 150 ms! of CETIP ~3.5 mM! in thepresence of 280 mM SDS-d25 ~pH 4.9! at 358C. The constructs follow the sequential connectivities for residues S5 to F34 inA andresidues D3–F34 inB. The 1H i
a–1H IN cross peaks are labeled for residues D3 to F34 inB.
1550 G.W. Buchko et al.
1Ha secondary shifts, interresidue NOEs,and secondary structure
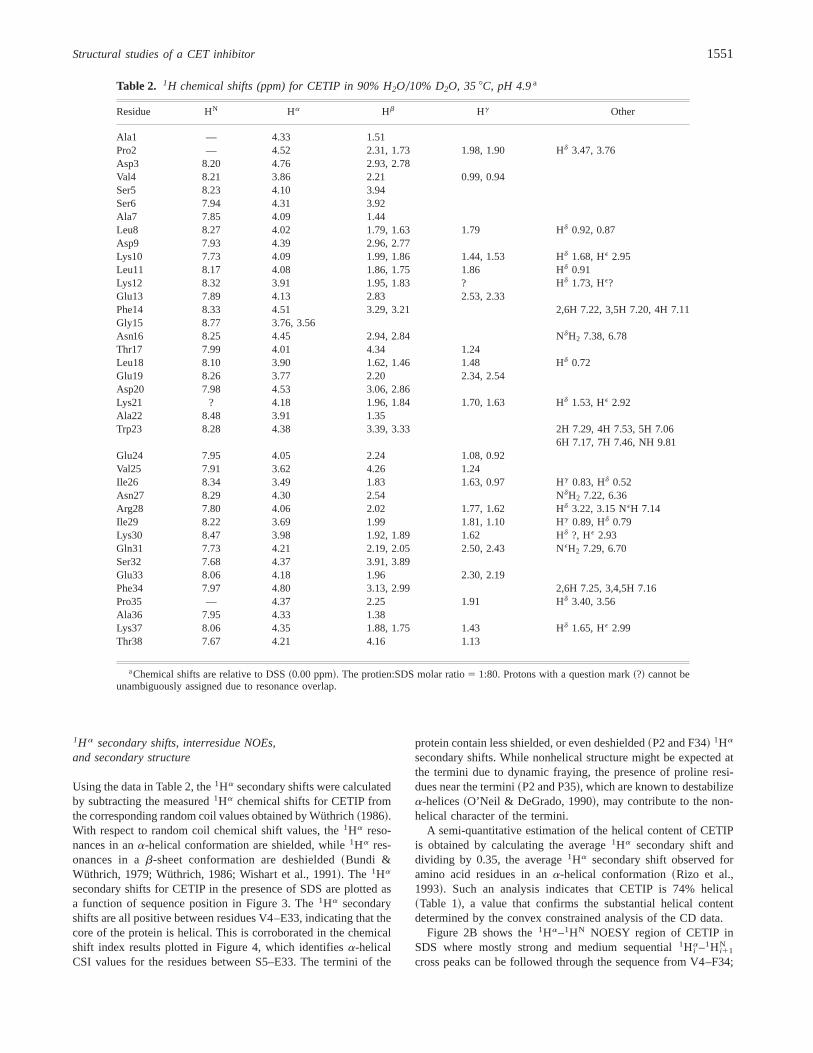
Using the data in Table 2, the1Ha secondary shifts were calculatedby subtracting the measured1Ha chemical shifts for CETIP fromthe corresponding random coil values obtained by Wüthrich~1986!.With respect to random coil chemical shift values, the1Ha reso-nances in ana-helical conformation are shielded, while1Ha res-onances in ab-sheet conformation are deshielded~Bundi &Wüthrich, 1979; Wüthrich, 1986; Wishart et al., 1991!. The 1Ha
secondary shifts for CETIP in the presence of SDS are plotted asa function of sequence position in Figure 3. The1Ha secondaryshifts are all positive between residues V4–E33, indicating that thecore of the protein is helical. This is corroborated in the chemicalshift index results plotted in Figure 4, which identifiesa-helicalCSI values for the residues between S5–E33. The termini of the
protein contain less shielded, or even deshielded~P2 and F34! 1Ha
secondary shifts. While nonhelical structure might be expected atthe termini due to dynamic fraying, the presence of proline resi-dues near the termini~P2 and P35!, which are known to destabilizea-helices~O’Neil & DeGrado, 1990!, may contribute to the non-helical character of the termini.
A semi-quantitative estimation of the helical content of CETIPis obtained by calculating the average1Ha secondary shift anddividing by 0.35, the average1Ha secondary shift observed foramino acid residues in ana-helical conformation~Rizo et al.,1993!. Such an analysis indicates that CETIP is 74% helical~Table 1!, a value that confirms the substantial helical contentdetermined by the convex constrained analysis of the CD data.
Figure 2B shows the1Ha–1HN NOESY region of CETIP inSDS where mostly strong and medium sequential1H i
a–1H i11N
cross peaks can be followed through the sequence from V4–F34;
Table 2. 1H chemical shifts (ppm) for CETIP in 90% H2O010% D2O, 358C, pH 4.9a
Residue HN Ha Hb Hg Other
Ala1 — 4.33 1.51Pro2 — 4.52 2.31, 1.73 1.98, 1.90 Hd 3.47, 3.76Asp3 8.20 4.76 2.93, 2.78Val4 8.21 3.86 2.21 0.99, 0.94Ser5 8.23 4.10 3.94Ser6 7.94 4.31 3.92Ala7 7.85 4.09 1.44Leu8 8.27 4.02 1.79, 1.63 1.79 Hd 0.92, 0.87Asp9 7.93 4.39 2.96, 2.77Lys10 7.73 4.09 1.99, 1.86 1.44, 1.53 Hd 1.68, HE 2.95Leu11 8.17 4.08 1.86, 1.75 1.86 Hd 0.91Lys12 8.32 3.91 1.95, 1.83 ? Hd 1.73, HE?Glu13 7.89 4.13 2.83 2.53, 2.33Phe14 8.33 4.51 3.29, 3.21 2,6H 7.22, 3,5H 7.20, 4H 7.11Gly15 8.77 3.76, 3.56Asn16 8.25 4.45 2.94, 2.84 NdH2 7.38, 6.78Thr17 7.99 4.01 4.34 1.24Leu18 8.10 3.90 1.62, 1.46 1.48 Hd 0.72Glu19 8.26 3.77 2.20 2.34, 2.54Asp20 7.98 4.53 3.06, 2.86Lys21 ? 4.18 1.96, 1.84 1.70, 1.63 Hd 1.53, HE 2.92Ala22 8.48 3.91 1.35Trp23 8.28 4.38 3.39, 3.33 2H 7.29, 4H 7.53, 5H 7.06
6H 7.17, 7H 7.46, NH 9.81Glu24 7.95 4.05 2.24 1.08, 0.92Val25 7.91 3.62 4.26 1.24Ile26 8.34 3.49 1.83 1.63, 0.97 Hg 0.83, Hd 0.52Asn27 8.29 4.30 2.54 NdH2 7.22, 6.36Arg28 7.80 4.06 2.02 1.77, 1.62 Hd 3.22, 3.15 NEH 7.14Ile29 8.22 3.69 1.99 1.81, 1.10 Hg 0.89, Hd 0.79Lys30 8.47 3.98 1.92, 1.89 1.62 Hd ?, HE 2.93Gln31 7.73 4.21 2.19, 2.05 2.50, 2.43 NEH2 7.29, 6.70Ser32 7.68 4.37 3.91, 3.89Glu33 8.06 4.18 1.96 2.30, 2.19Phe34 7.97 4.80 3.13, 2.99 2,6H 7.25, 3,4,5H 7.16Pro35 — 4.37 2.25 1.91 Hd 3.40, 3.56Ala36 7.95 4.33 1.38Lys37 8.06 4.35 1.88, 1.75 1.43 Hd 1.65, HE 2.99Thr38 7.67 4.21 4.16 1.13
aChemical shifts are relative to DSS~0.00 ppm!. The protien:SDS molar ratio5 1:80. Protons with a question mark~?! cannot beunambiguously assigned due to resonance overlap.
Structural studies of a CET inhibitor 1551
the helical core suggested by the1Ha secondary shift data. Alsoobserved in the NOESY spectra were many strong, medium, andweak 1H i
a–1H i12N , 1H i
a–1H i13N , 1H i
a–1H i14N , 1H i
b–1H i11N ,
1H iN–1H i11
N , 1H iN–1H i12
N , and 1H ia–1H i13
b NOE cross peaks, assummarized in Figure 4. The presence of strong to medium~i ! 2~i 1 1! and medium to weak~i ! 2 ~i 1 2!, ~i ! 2 ~i 1 3!, and~i ! 2~i 1 4! NOE contacts throughout the sequence between residuesV4 to F34 suggests that CETIP adopts a highly helical conforma-tion when bound to SDS~Wüthrich et al., 1984; Wüthrich, 1986!.The paucity of interresidue NOEs at the N-terminus and the ab-sence of interresidue NOEs from F34 to T38 imply the termini,especially the carboxyl end, are frayed.
Three-dimensional structure calculations
A total of 476 NOE-derived distance restraints~261 intraresidueand 215 interresidue! was used to generate a final set of 25 struc-tures using distance geometry0simulated annealing methods. Ofthese, 17 structures were selected as representative samples of theconformation of CETIP on the basis of few NOE distance restraintviolations. The convergence of the final set of 17 calculated struc-
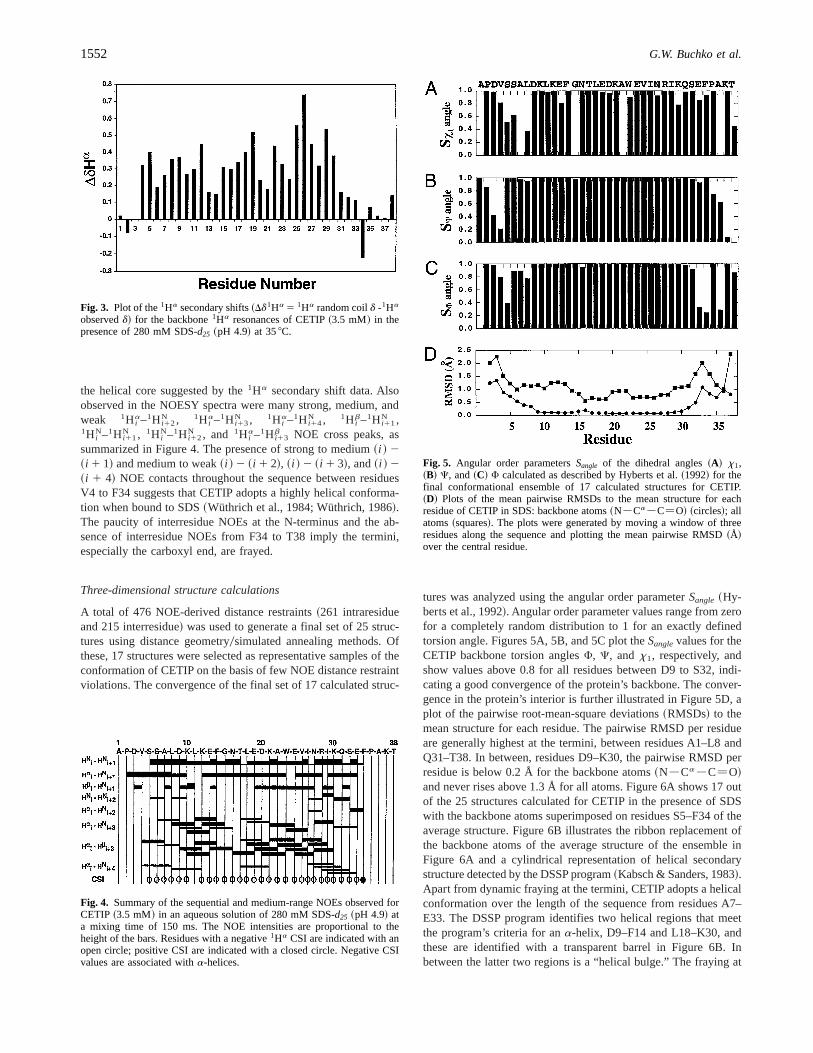
tures was analyzed using the angular order parameterSangle ~Hy-berts et al., 1992!. Angular order parameter values range from zerofor a completely random distribution to 1 for an exactly definedtorsion angle. Figures 5A, 5B, and 5C plot theSanglevalues for theCETIP backbone torsion anglesF, C, and x1, respectively, andshow values above 0.8 for all residues between D9 to S32, indi-cating a good convergence of the protein’s backbone. The conver-gence in the protein’s interior is further illustrated in Figure 5D, aplot of the pairwise root-mean-square deviations~RMSDs! to themean structure for each residue. The pairwise RMSD per residueare generally highest at the termini, between residues A1–L8 andQ31–T38. In between, residues D9–K30, the pairwise RMSD perresidue is below 0.2 Å for the backbone atoms~N2Ca2C5O!and never rises above 1.3 Å for all atoms. Figure 6A shows 17 outof the 25 structures calculated for CETIP in the presence of SDSwith the backbone atoms superimposed on residues S5–F34 of theaverage structure. Figure 6B illustrates the ribbon replacement ofthe backbone atoms of the average structure of the ensemble inFigure 6A and a cylindrical representation of helical secondarystructure detected by the DSSP program~Kabsch & Sanders, 1983!.Apart from dynamic fraying at the termini, CETIP adopts a helicalconformation over the length of the sequence from residues A7–E33. The DSSP program identifies two helical regions that meetthe program’s criteria for ana-helix, D9–F14 and L18–K30, andthese are identified with a transparent barrel in Figure 6B. Inbetween the latter two regions is a “helical bulge.” The fraying at
Fig. 3. Plot of the1Ha secondary shifts~Dd1Ha 5 1Ha random coild -1Ha
observedd! for the backbone1Ha resonances of CETIP~3.5 mM! in thepresence of 280 mM SDS-d25 ~pH 4.9! at 358C.
Fig. 4. Summary of the sequential and medium-range NOEs observed forCETIP ~3.5 mM! in an aqueous solution of 280 mM SDS-d25 ~pH 4.9! ata mixing time of 150 ms. The NOE intensities are proportional to theheight of the bars. Residues with a negative1Ha CSI are indicated with anopen circle; positive CSI are indicated with a closed circle. Negative CSIvalues are associated witha-helices.
Fig. 5. Angular order parametersSangle of the dihedral angles~A! x1,~B! C, and~C! F calculated as described by Hyberts et al.~1992! for thefinal conformational ensemble of 17 calculated structures for CETIP.~D! Plots of the mean pairwise RMSDs to the mean structure for eachresidue of CETIP in SDS: backbone atoms~N2Ca2C5O! ~circles!; allatoms~squares!. The plots were generated by moving a window of threeresidues along the sequence and plotting the mean pairwise RMSD~Å!over the central residue.
1552 G.W. Buchko et al.
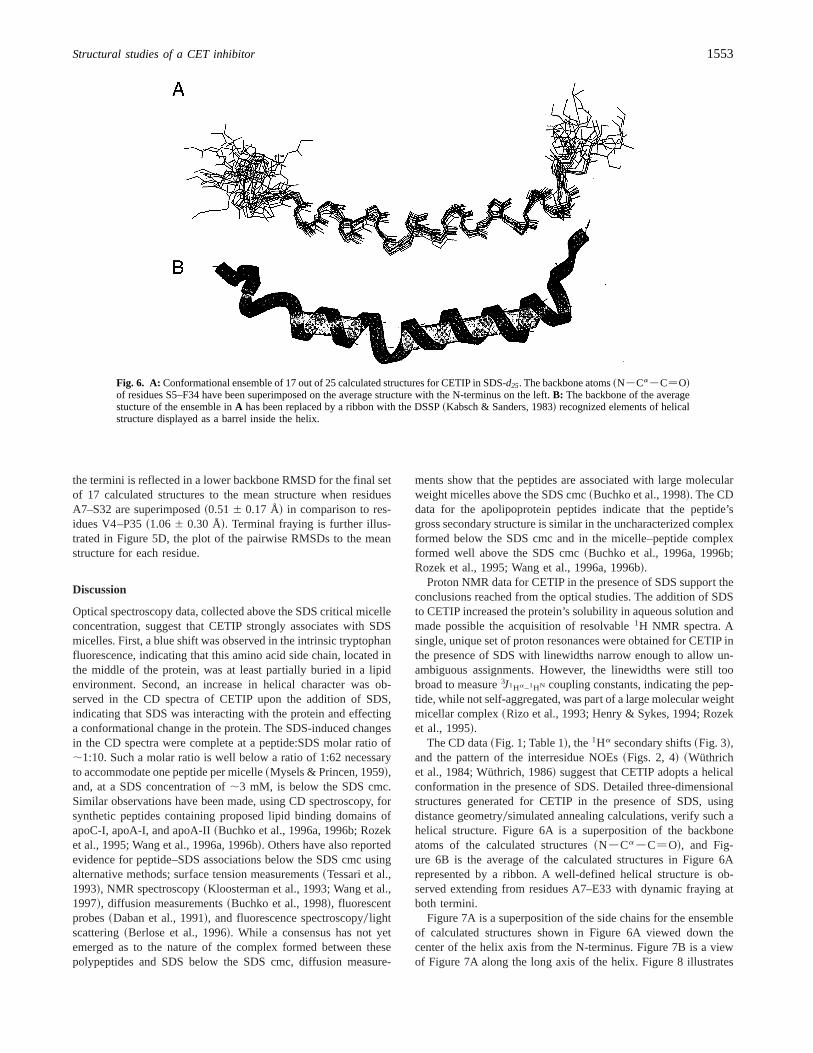
the termini is reflected in a lower backbone RMSD for the final setof 17 calculated structures to the mean structure when residuesA7–S32 are superimposed~0.516 0.17 Å! in comparison to res-idues V4–P35~1.066 0.30 Å!. Terminal fraying is further illus-trated in Figure 5D, the plot of the pairwise RMSDs to the meanstructure for each residue.
Discussion
Optical spectroscopy data, collected above the SDS critical micelleconcentration, suggest that CETIP strongly associates with SDSmicelles. First, a blue shift was observed in the intrinsic tryptophanfluorescence, indicating that this amino acid side chain, located inthe middle of the protein, was at least partially buried in a lipidenvironment. Second, an increase in helical character was ob-served in the CD spectra of CETIP upon the addition of SDS,indicating that SDS was interacting with the protein and effectinga conformational change in the protein. The SDS-induced changesin the CD spectra were complete at a peptide:SDS molar ratio of;1:10. Such a molar ratio is well below a ratio of 1:62 necessaryto accommodate one peptide per micelle~Mysels & Princen, 1959!,and, at a SDS concentration of;3 mM, is below the SDS cmc.Similar observations have been made, using CD spectroscopy, forsynthetic peptides containing proposed lipid binding domains ofapoC-I, apoA-I, and apoA-II~Buchko et al., 1996a, 1996b; Rozeket al., 1995; Wang et al., 1996a, 1996b!. Others have also reportedevidence for peptide–SDS associations below the SDS cmc usingalternative methods; surface tension measurements~Tessari et al.,1993!, NMR spectroscopy~Kloosterman et al., 1993; Wang et al.,1997!, diffusion measurements~Buchko et al., 1998!, fluorescentprobes~Daban et al., 1991!, and fluorescence spectroscopy0 lightscattering~Berlose et al., 1996!. While a consensus has not yetemerged as to the nature of the complex formed between thesepolypeptides and SDS below the SDS cmc, diffusion measure-
ments show that the peptides are associated with large molecularweight micelles above the SDS cmc~Buchko et al., 1998!. The CDdata for the apolipoprotein peptides indicate that the peptide’sgross secondary structure is similar in the uncharacterized complexformed below the SDS cmc and in the micelle–peptide complexformed well above the SDS cmc~Buchko et al., 1996a, 1996b;Rozek et al., 1995; Wang et al., 1996a, 1996b!.
Proton NMR data for CETIP in the presence of SDS support theconclusions reached from the optical studies. The addition of SDSto CETIP increased the protein’s solubility in aqueous solution andmade possible the acquisition of resolvable1H NMR spectra. Asingle, unique set of proton resonances were obtained for CETIP inthe presence of SDS with linewidths narrow enough to allow un-ambiguous assignments. However, the linewidths were still toobroad to measure3J1Ha–1HN coupling constants, indicating the pep-tide, while not self-aggregated, was part of a large molecular weightmicellar complex~Rizo et al., 1993; Henry & Sykes, 1994; Rozeket al., 1995!.
The CD data~Fig. 1; Table 1!, the1Ha secondary shifts~Fig. 3!,and the pattern of the interresidue NOEs~Figs. 2, 4! ~Wüthrichet al., 1984; Wüthrich, 1986! suggest that CETIP adopts a helicalconformation in the presence of SDS. Detailed three-dimensionalstructures generated for CETIP in the presence of SDS, usingdistance geometry0simulated annealing calculations, verify such ahelical structure. Figure 6A is a superposition of the backboneatoms of the calculated structures~N2Ca2C5O!, and Fig-ure 6B is the average of the calculated structures in Figure 6Arepresented by a ribbon. A well-defined helical structure is ob-served extending from residues A7–E33 with dynamic fraying atboth termini.
Figure 7A is a superposition of the side chains for the ensembleof calculated structures shown in Figure 6A viewed down thecenter of the helix axis from the N-terminus. Figure 7B is a viewof Figure 7A along the long axis of the helix. Figure 8 illustrates
Fig. 6. A: Conformational ensemble of 17 out of 25 calculated structures for CETIP in SDS-d25. The backbone atoms~N2Ca2C5O!of residues S5–F34 have been superimposed on the average structure with the N-terminus on the left.B: The backbone of the averagestucture of the ensemble inA has been replaced by a ribbon with the DSSP~Kabsch & Sanders, 1983! recognized elements of helicalstructure displayed as a barrel inside the helix.
Structural studies of a CET inhibitor 1553
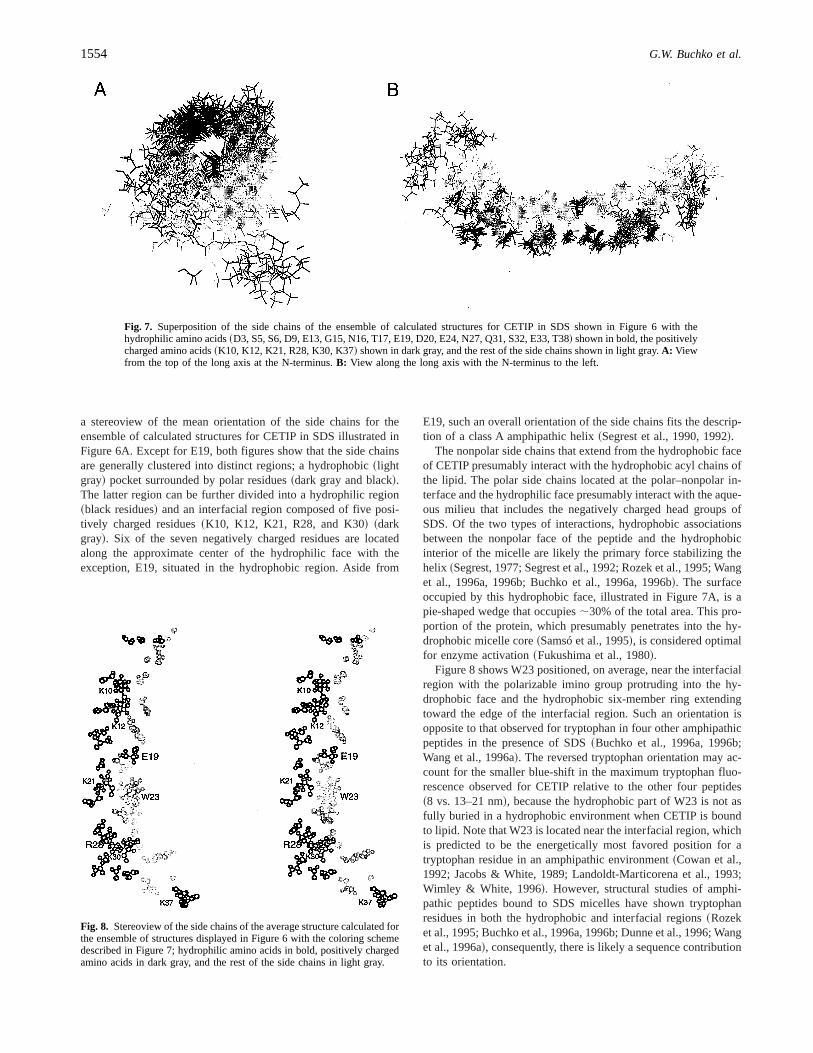
a stereoview of the mean orientation of the side chains for theensemble of calculated structures for CETIP in SDS illustrated inFigure 6A. Except for E19, both figures show that the side chainsare generally clustered into distinct regions; a hydrophobic~lightgray! pocket surrounded by polar residues~dark gray and black!.The latter region can be further divided into a hydrophilic region~black residues! and an interfacial region composed of five posi-tively charged residues~K10, K12, K21, R28, and K30! ~darkgray!. Six of the seven negatively charged residues are locatedalong the approximate center of the hydrophilic face with theexception, E19, situated in the hydrophobic region. Aside from
E19, such an overall orientation of the side chains fits the descrip-tion of a class A amphipathic helix~Segrest et al., 1990, 1992!.
The nonpolar side chains that extend from the hydrophobic faceof CETIP presumably interact with the hydrophobic acyl chains ofthe lipid. The polar side chains located at the polar–nonpolar in-terface and the hydrophilic face presumably interact with the aque-ous milieu that includes the negatively charged head groups ofSDS. Of the two types of interactions, hydrophobic associationsbetween the nonpolar face of the peptide and the hydrophobicinterior of the micelle are likely the primary force stabilizing thehelix ~Segrest, 1977; Segrest et al., 1992; Rozek et al., 1995; Wanget al., 1996a, 1996b; Buchko et al., 1996a, 1996b!. The surfaceoccupied by this hydrophobic face, illustrated in Figure 7A, is apie-shaped wedge that occupies;30% of the total area. This pro-portion of the protein, which presumably penetrates into the hy-drophobic micelle core~Samsó et al., 1995!, is considered optimalfor enzyme activation~Fukushima et al., 1980!.
Figure 8 shows W23 positioned, on average, near the interfacialregion with the polarizable imino group protruding into the hy-drophobic face and the hydrophobic six-member ring extendingtoward the edge of the interfacial region. Such an orientation isopposite to that observed for tryptophan in four other amphipathicpeptides in the presence of SDS~Buchko et al., 1996a, 1996b;Wang et al., 1996a!. The reversed tryptophan orientation may ac-count for the smaller blue-shift in the maximum tryptophan fluo-rescence observed for CETIP relative to the other four peptides~8 vs. 13–21 nm!, because the hydrophobic part of W23 is not asfully buried in a hydrophobic environment when CETIP is boundto lipid. Note that W23 is located near the interfacial region, whichis predicted to be the energetically most favored position for atryptophan residue in an amphipathic environment~Cowan et al.,1992; Jacobs & White, 1989; Landoldt-Marticorena et al., 1993;Wimley & White, 1996!. However, structural studies of amphi-pathic peptides bound to SDS micelles have shown tryptophanresidues in both the hydrophobic and interfacial regions~Rozeket al., 1995; Buchko et al., 1996a, 1996b; Dunne et al., 1996; Wanget al., 1996a!, consequently, there is likely a sequence contributionto its orientation.
Fig. 7. Superposition of the side chains of the ensemble of calculated structures for CETIP in SDS shown in Figure 6 with thehydrophilic amino acids~D3, S5, S6, D9, E13, G15, N16, T17, E19, D20, E24, N27, Q31, S32, E33, T38! shown in bold, the positivelycharged amino acids~K10, K12, K21, R28, K30, K37! shown in dark gray, and the rest of the side chains shown in light gray.A: Viewfrom the top of the long axis at the N-terminus.B: View along the long axis with the N-terminus to the left.
Fig. 8. Stereoview of the side chains of the average structure calculated forthe ensemble of structures displayed in Figure 6 with the coloring schemedescribed in Figure 7; hydrophilic amino acids in bold, positively chargedamino acids in dark gray, and the rest of the side chains in light gray.
1554 G.W. Buchko et al.
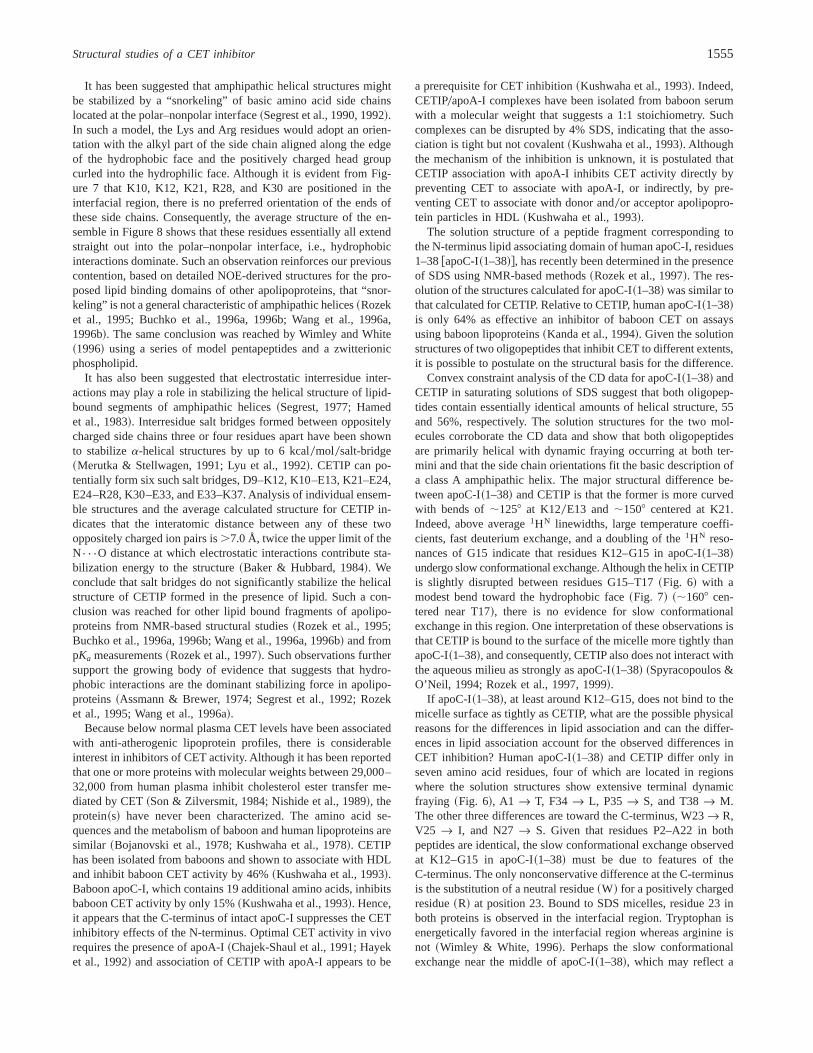
It has been suggested that amphipathic helical structures mightbe stabilized by a “snorkeling” of basic amino acid side chainslocated at the polar–nonpolar interface~Segrest et al., 1990, 1992!.In such a model, the Lys and Arg residues would adopt an orien-tation with the alkyl part of the side chain aligned along the edgeof the hydrophobic face and the positively charged head groupcurled into the hydrophilic face. Although it is evident from Fig-ure 7 that K10, K12, K21, R28, and K30 are positioned in theinterfacial region, there is no preferred orientation of the ends ofthese side chains. Consequently, the average structure of the en-semble in Figure 8 shows that these residues essentially all extendstraight out into the polar–nonpolar interface, i.e., hydrophobicinteractions dominate. Such an observation reinforces our previouscontention, based on detailed NOE-derived structures for the pro-posed lipid binding domains of other apolipoproteins, that “snor-keling” is not a general characteristic of amphipathic helices~Rozeket al., 1995; Buchko et al., 1996a, 1996b; Wang et al., 1996a,1996b!. The same conclusion was reached by Wimley and White~1996! using a series of model pentapeptides and a zwitterionicphospholipid.
It has also been suggested that electrostatic interresidue inter-actions may play a role in stabilizing the helical structure of lipid-bound segments of amphipathic helices~Segrest, 1977; Hamedet al., 1983!. Interresidue salt bridges formed between oppositelycharged side chains three or four residues apart have been shownto stabilizea-helical structures by up to 6 kcal0mol0salt-bridge~Merutka & Stellwagen, 1991; Lyu et al., 1992!. CETIP can po-tentially form six such salt bridges, D9–K12, K10–E13, K21–E24,E24–R28, K30–E33, and E33–K37. Analysis of individual ensem-ble structures and the average calculated structure for CETIP in-dicates that the interatomic distance between any of these twooppositely charged ion pairs is.7.0 Å, twice the upper limit of theN{{{O distance at which electrostatic interactions contribute sta-bilization energy to the structure~Baker & Hubbard, 1984!. Weconclude that salt bridges do not significantly stabilize the helicalstructure of CETIP formed in the presence of lipid. Such a con-clusion was reached for other lipid bound fragments of apolipo-proteins from NMR-based structural studies~Rozek et al., 1995;Buchko et al., 1996a, 1996b; Wang et al., 1996a, 1996b! and frompKa measurements~Rozek et al., 1997!. Such observations furthersupport the growing body of evidence that suggests that hydro-phobic interactions are the dominant stabilizing force in apolipo-proteins~Assmann & Brewer, 1974; Segrest et al., 1992; Rozeket al., 1995; Wang et al., 1996a!.
Because below normal plasma CET levels have been associatedwith anti-atherogenic lipoprotein profiles, there is considerableinterest in inhibitors of CET activity. Although it has been reportedthat one or more proteins with molecular weights between 29,000–32,000 from human plasma inhibit cholesterol ester transfer me-diated by CET~Son & Zilversmit, 1984; Nishide et al., 1989!, theprotein~s! have never been characterized. The amino acid se-quences and the metabolism of baboon and human lipoproteins aresimilar ~Bojanovski et al., 1978; Kushwaha et al., 1978!. CETIPhas been isolated from baboons and shown to associate with HDLand inhibit baboon CET activity by 46%~Kushwaha et al., 1993!.Baboon apoC-I, which contains 19 additional amino acids, inhibitsbaboon CET activity by only 15%~Kushwaha et al., 1993!. Hence,it appears that the C-terminus of intact apoC-I suppresses the CETinhibitory effects of the N-terminus. Optimal CET activity in vivorequires the presence of apoA-I~Chajek-Shaul et al., 1991; Hayeket al., 1992! and association of CETIP with apoA-I appears to be
a prerequisite for CET inhibition~Kushwaha et al., 1993!. Indeed,CETIP0apoA-I complexes have been isolated from baboon serumwith a molecular weight that suggests a 1:1 stoichiometry. Suchcomplexes can be disrupted by 4% SDS, indicating that the asso-ciation is tight but not covalent~Kushwaha et al., 1993!. Althoughthe mechanism of the inhibition is unknown, it is postulated thatCETIP association with apoA-I inhibits CET activity directly bypreventing CET to associate with apoA-I, or indirectly, by pre-venting CET to associate with donor and0or acceptor apolipopro-tein particles in HDL~Kushwaha et al., 1993!.
The solution structure of a peptide fragment corresponding tothe N-terminus lipid associating domain of human apoC-I, residues1–38@apoC-I~1–38!#, has recently been determined in the presenceof SDS using NMR-based methods~Rozek et al., 1997!. The res-olution of the structures calculated for apoC-I~1–38! was similar tothat calculated for CETIP. Relative to CETIP, human apoC-I~1–38!is only 64% as effective an inhibitor of baboon CET on assaysusing baboon lipoproteins~Kanda et al., 1994!. Given the solutionstructures of two oligopeptides that inhibit CET to different extents,it is possible to postulate on the structural basis for the difference.
Convex constraint analysis of the CD data for apoC-I~1–38! andCETIP in saturating solutions of SDS suggest that both oligopep-tides contain essentially identical amounts of helical structure, 55and 56%, respectively. The solution structures for the two mol-ecules corroborate the CD data and show that both oligopeptidesare primarily helical with dynamic fraying occurring at both ter-mini and that the side chain orientations fit the basic description ofa class A amphipathic helix. The major structural difference be-tween apoC-I~1–38! and CETIP is that the former is more curvedwith bends of;1258 at K120E13 and;1508 centered at K21.Indeed, above average1HN linewidths, large temperature coeffi-cients, fast deuterium exchange, and a doubling of the1HN reso-nances of G15 indicate that residues K12–G15 in apoC-I~1–38!undergo slow conformational exchange.Although the helix in CETIPis slightly disrupted between residues G15–T17~Fig. 6! with amodest bend toward the hydrophobic face~Fig. 7! ~;1608 cen-tered near T17!, there is no evidence for slow conformationalexchange in this region. One interpretation of these observations isthat CETIP is bound to the surface of the micelle more tightly thanapoC-I~1–38!, and consequently, CETIP also does not interact withthe aqueous milieu as strongly as apoC-I~1–38! ~Spyracopoulos &O’Neil, 1994; Rozek et al., 1997, 1999!.
If apoC-I~1–38!, at least around K12–G15, does not bind to themicelle surface as tightly as CETIP, what are the possible physicalreasons for the differences in lipid association and can the differ-ences in lipid association account for the observed differences inCET inhibition? Human apoC-I~1–38! and CETIP differ only inseven amino acid residues, four of which are located in regionswhere the solution structures show extensive terminal dynamicfraying ~Fig. 6!, A1 r T, F34 r L, P35 r S, and T38r M.The other three differences are toward the C-terminus, W23r R,V25 r I, and N27r S. Given that residues P2–A22 in bothpeptides are identical, the slow conformational exchange observedat K12–G15 in apoC-I~1–38! must be due to features of theC-terminus. The only nonconservative difference at the C-terminusis the substitution of a neutral residue~W! for a positively chargedresidue~R! at position 23. Bound to SDS micelles, residue 23 inboth proteins is observed in the interfacial region. Tryptophan isenergetically favored in the interfacial region whereas arginine isnot ~Wimley & White, 1996!. Perhaps the slow conformationalexchange near the middle of apoC-I~1–38!, which may reflect a
Structural studies of a CET inhibitor 1555
micelle bound and unbound region of the peptide~Rozek et al.,1997!, is the price paid for the energetically unfavorable argininein the interfacial region. Because apoA-I association with CETIPappears to be a prerequisite for CET inhibition, the differences inmicelle binding between CETIP and apoC-I~1–38! may enableCETIP to associate more tightly with apoA-I, and this may accountfor the greater CET inhibitory effects of CETIP over human apoC-I ~1–38!. Alternatively, the differences in lipid binding may allowCET to more easily displace apoC-I~1–38! than CETIP from apoA-Ion the lipoprotein surface, or, allow CET to better penetrate thelipoprotein surface to associate with donor and0or acceptorlipoprotein particles in HDL. To experimentally determine if theW23r R difference between apoC-I~1–38! and CETIP is respon-sible for the observed biological and structural differences, it willbe necessary to chemically synthesis CETIP containing an arginineresidue in the place of W23 and assay its ability to inhibit CET.
Materials and methods
Materials
Baboon CETIP, APDVSSALDKLKEFGNTLEDKAWEVINRIKQSEFPAKT, was synthesized using solid-phase methods as previ-ously described~Kushwaha et al., 1993; Rozek et al., 1997!. Residualsalts were removed by extensive dialysis~4 3 4 L! against de-ionized water. SDS was purchased from BDH Chemicals Ltd.~Poole, UK!; perdeuterated SDS~SDS-d25! was purchased fromCambridge Isotope Laboratories Inc.~Woburn, Massachusetts!;D2O was purchased from STOHLER0KOR Stable Isotopes Inc.~Cambridge, Massachusetts!.
Fluorescence spectroscopy
Fluorescence measurements were obtained at 208C, pH 5, on aSLM 4800 C spectrofluorometer. A 10mM solution of CETIP wasexcited at 280 nm, and the emission spectra recorded between 300and 450 nm. Increments of SDS were added to the solution until nofurther shift in the emission maxima was observed. The emissionmaxima were reproducible to61 nm on replicate experiments.
Circular dichroism spectroscopy
CD spectra were acquired on a Jasco J710 spectropolarimeter cal-ibrated with an aqueous solution of ammoniumd-~1!-camphor-sulfonate. Measurements were performed in a quartz cell of 0.02 cmpathlength on a 0.31 mM protein solution containing various con-centrations of SDS~0–19 mM!. The pH of the samples was ad-justed to between 5–6 prior to recording data at 358C ~NeslabRTE-110 circulating water bath!. Each raw spectrum was the meanof two consecutive scans from 260 to 190 nm recorded with abandwidth of 0.5 nm, a time constant of 0.25 s, and a scan rate of10 nm0min. The raw data were converted to mean molar residueellipticities, @u#, in units of deg3 cm20dmol, after the subtractionof a water spectrum, baseline correction, and noise reduction.
NMR spectroscopy
A 3.5 mM sample was prepared in 90% H2O010% D2O by dis-solving CETIP in 400mL of 280 mM SDS-d25 and adjusting thepH to 4.9. Because the detergent concentration may effect theNMR spectra of proteins and peptides in micelles~Oppella &
McDonnell, 1993; Henry & Sykes, 1994!, a peptide-to-detergentmolar ratio of 1:80 at a concentration well above the cmc of SDS~8.1 mM! was used to ensure the incorporation of;1 peptide0micelle; the aggregation number of SDS micelles in pure water isestimated at 62 SDS molecules per micelle~Mysels & Princen,1959!.
Standard phase-sensitive~TPPI! two-dimensional NOESY~Jeeneret al., 1979!, TOCSY ~Braunschweiler & Ernst, 1983; Bax &Davis, 1985!, and DQF-COSY~Rance et al., 1983! spectra wererecorded at 358C on a Bruker AMX-600~14.1 T! narrow-boreNMR spectrometer. A recycle delay of 1.5 s and a spectral widthof 6,000 Hz was used to collect 840t1 increments with 40 tran-sients in 2 K of real data points. A WATERGATE technique~Piottoet al., 1992!, which employed the 3-9-19 pulse sequence~Sklenáret al., 1993!, was used to suppress the water resonance in theNOESY and TOCSY experiments. NOESY data were recorded withmixing times of 50, 100, and 150 ms. Mixing times between 40–100 ms were used in the MLEV-17 spinlocking sequence of theTOCSY experiment. A DQF-COSY spectrum was obtained after ly-ophilizing the protein sample in the NMR tube and resuspending itin 99.9% D2O. The residual HDO resonance in the latter experi-ment was suppressed by presaturation during the 1.2 s recycle delay.
Spectra were processed using UXNMR on a Bruker Aspect-Station and FELIX v.2.3~MSI, San Diego, California! on an In-digo2 computer~Silicon Graphics Inc., Mountain View, Califor-nia!. Prior to Fourier transformation, the data were zero-filled togenerate a 2 K3 2 K matrix and apodized by a cosine function inD2 and a sine function in D1. Processed spectra were baselinecorrected with a fifth-order polynomial function in both dimen-sions. Chemical shifts were referenced to external 4,4-dimethyl-4-silapentane-1-sulfonate~DSS, 0 ppm!.
Structure calculations
Initial three-dimensional structures were calculated for CETIP inSDS from the NOE distance data using the distance geometryprogram~DGII ! of Insight II, v.95,~MSI, San Diego, California!as described by Rozek et al.~1995!. The initial distance restraintswere obtained by classifying the NOE peak volumes into strong~1.8–2.5 Å! medium ~2.5–3.5 Å! and weak~3.5–5.0 Å! ranges.Following the generation of 10 distance geometry and simulatedannealing derived structures, the distance restraints were eitherwidened or eliminated to reflect uncertainty in the distance clas-sification or the integration of overlapping cross peaks. The pro-cess was repeated until no distance violation greater than 0.3 Åwas observed. At this stage, further rounds of distance geometryand refinement calculations were performed using the X-PLORsoftware package, v.3.1~Brünger, 1992! until no distance violationgreater than 0.2 Å was observed. Ten of the 28 pairs of methyleneprotons on the side chainb-carbons were stereospecifically as-signed. In the end, 476~261 intraresidue and 215 interresidue!distance restraints were used in the final calculation of 25 energyminimized structures using X-PLOR. An average structure forCETIP in SDS was then generated using 17 out of the 25 finalcalculated structures. The average structure was deposited in theRCSB Protein Data Bank, PDB ID code 1EZE.
Acknowledgments
We thank Dr. Frank D. Sönnischsen~Case Western University, Cleveland!for X-PLOR advice and Dr. Susan Weintraub for mass spectral analysis of
1556 G.W. Buchko et al.
CETIP ~University of Texas, San Antonio!. This research was funded bythe Natural Science and Engineering Research Council of Canada and B.C.and Yukon Heart and Stroke Foundation fellowships for G.W.B.~postdoc-toral! and A.R.~graduate studies!.
References
Agellon L, Quinet E, Gillette T, Drayna D, Brown M, Tall AR. 1990. Organi-zation of the human cholesteryl ester transfer protein gene.Biochemistry29:1372–1376.
Assmann G, Brewer H Jr. 1974. Lipid–protein interactions in high densitylipoproteins.Proc Natl Acad Sci USA 71:1534–1538.
Baker EN, Hubbard RE. 1984. Hydrogen bonding in globular proteins.ProgBiophys Mol Biol 44:97–179.
Bax A, Davis DG. 1985. MLEV-17-based two-dimensional homonuclear mag-netization transfer spectroscopy.J Magn Reson 65:355–360.
Berlose J-P, Convert O, Derossi D, Brunissen A, Chassaing G. 1996. Confor-mational and associative behaviours of the third helix of antennapediahomeodomain in membrane-mimetic environments.Eur J Biochem 242:372–386.
Bojanovski D, Alaupovic P, Kelley JL, Stout C. 1978. Isolation and character-ization of the major lipoprotein density classes of normal and diabeticbaboon~Papio anubis! plasma.Atherosclerosis 31:481–487.
Braunschweiler L, Ernst RR. 1983. Coherence transfer by isotropic mixing:Application to proton correlation spectroscopy.J Magn Reson 53:521–528.
Bruch MD, Dhingra MM, Gierasch LM. 1991. Side chain-backbone hydrogenbonding contributes to helix stability in peptides derived from ana-helicalregion of carboxypeptidase A.Proteins Struct Funct Genet 10:130–139.
Brünger AT. 1992.X-PLOR manual, version 3.1.New Haven, Connecticut: YaleUniversity.
Buchko GW, Rozek A, Hoyt DW, Cushley RJ, Kennedy MA. 1998. The use ofsodium dodecyl sulfate to model the apolipoprotein environment. Evidencefor peptide-SDS complexes using pulse-field-gradient NMR spectroscopy.Biochim Biophys Acta 1392:101–108.
Buchko GW, Rozek A, Wang G, Frohlich JJ, Cushley RJ. 1997. High resolution1H NMR spectra of human apolipoprotein C-III2 using DPC to model thelipoprotein environment.Protein Pept Lett 4:47–54.
Buchko GW, Treleaven WD, Dunne SJ, Tracey AS, Cushley RJ. 1996a. Struc-tural studies of a peptide activator of human lecithin-cholesterol acyltrans-ferase.J Biol Chem 271:3039–3045.
Buchko GW, Wang G, Pierens GK, Cushley RJ. 1996b. Conformational studiesof an amphipathic peptide corresponding to human apolipoprotein A-II res-idues 18-30 with a C-terminal lipid binding motif, EWLNS.Int J PeptideProtein Res 48:21–30.
Bundi A, Wüthrich K. 1979.1H-NMR parameters of the common amino acidresidues measured in aqueous solutions of the linear tripeptides H-Gly-Gly-X-L-Ala-OH. Biopolymers 18:285–298.
Chajek-Shaul T, Hayek T, Walsh A, Breslow JL. 1991. Expression of the humanapolipoprotein A-I gene in transgenic mice alters high density lipoprotein~HDL! particle size distribution and diminishes selective uptake of HDLcholesteryl esters.Proc Natl Acad Sci USA 88:6731–6735.
Cowan SW, Schirmir T, Rummel G, Steiert M, Ghosh R, Pauptit RA, JansoniusJN, Rosenbusch JP. 1992. Crystal structures explain functional properties oftwo E. coli proteins.Nature 358:727–733.
Daban J-R, Samsó M, Bartolomé S. 1991. Use of nile red as a fluorescent probefor the study of hydrophobic properties of protein–sodium dodecyl sulfatecomplexes in solution.Anal Biochem 199:162–168.
Dullaart RPF, Groener JEM, Dikkeschei LD, Erkelens DW, Doorenbos H. 1989.Increased cholesteryl ester transfer activity in complicated Type I~insulin-dependent! diabetes mellitus—its relationship with serum lipids.Diabeto-logia 32:14–19.
Dunne SJ, Cornell RB, Johnson JE, Glover NR, Tracey AS. 1996. Structure ofthe membrane binding domain of CTP:phosphocholine cytidyltransferase.Biochemistry 35:11975–11984.
Englander SW, Wand AJ. 1987. Main-chain-directed strategy for the assignmentof 1H NMR spectra of proteins.Biochemistry 26:5953–5958.
Faust RA, Tollefson JH, Chait A, Albers JJ. 1990. Regulation of LTP-I secretionfrom human monocyte-derived macrophage by differentiation and choles-terol accumulation in vitro.Biochim Biophys Acta 1042:404–409.
Fitton JE. 1981. Physiochemical studies on delta haemolysin, a staphylococcalcytolytic polypeptide.FEBS Lett 130:257–260.
Fukushima D, Yokoyama S, Kroon DJ, Kezdy FJ, Kaiser ET. 1980. Chainlength-function correlation of amphiphilic peptides.J Biol Chem 255:10651–10657.
Ha YC, Barter PJ. 1982. Differences in plasma cholesteryl ester transfer activityin sixteen vertebrate species.Comp Biochem Physiol 71B:265–269.
Hamed MM, Robinson RM, Mattice WL. 1983. Behavior of amphipathic heli-ces on analysis via matrix methods, with application to glucagon, secretin,and vasoactive peptide.Biopolymers 22:1003–1021.
Hayek T, Chajek-Shaul T, Walsh A, Moulin P, Tall AR, Breslow JL. 1992. Aninteraction between the cholesteryl ester transfer protein~CETP! and apo-lipoprotein A-I genes in transgenic mice results in a profound CETP-mediated depression of high density lipoprotein cholesterol levels.J ClinInvest 90:505–510.
Hennessey JP Jr, Johnson WC Jr. 1982. Experimental errors and their effecton analyzing circular dichroism spectra of proteins.Anal Biochem 125:177–188.
Henry GD, Sykes BD. 1994. Methods to study membrane protein structures insolution.Methods Enzymol 239:515–535.
Holzwarth GM, Doty P. 1965. The ultraviolet circular dichroism of polypep-tides.J Am Chem Soc 87:218–228.
Hyberts SG, Goldberg MS, Havel TF, Wagner G. 1992. The solution structureof elgin c based on measurements of many NOEs and coupling constantsand its comparison with X-ray structures.Protein Sci 1:736–751.
Inazu A, Brown ML, Hesler CB, Agellon LB, Koizumi J, Takata K, MaruhamaY, Mabuchi H, Tall AR. 1990. Increased high-density lipoprotein levelscaused by a common cholesteryl-ester transfer gene mutation.N Engl J Med323:1234–1238.
Jacobs RE, White SH. 1989. The nature of the hydrophobic binding of smallpeptides at the bilayer interface: Implications for the insertion of transbi-layer helices.Biochemistry 28:3421–3437.
Jeener J, Meier BH, Bachmann P, Ernst RR. 1979. Investigation of exchangeprocesses by two-dimensional NMR spectroscopy.J Chem Phys 71:4546–4553.
Jiang XC, Agellon LB, Walsh A, Breslow JL, Tall A. 1992. Dietary cholesterolincreases transcription of the human cholesteryl ester transfer protein genein transgenic mice.J Clin Invest 90:1290–1295.
Kabsch W, Sanders C. 1983. Dictionary of protein secondary structure: Patternrecognition of hydrogen-bonding and geometrical features.Biopolymers22:2577–2637.
Kanda P, Dunham RG, Hasan SQ, Weintraub ST, Kushwaha RS. 1994. Syn-thetic apolipoprotein C-I peptide inhibition of cholesteryl ester transfer pro-tein activity in baboon plasma. In: Hodges RS, Smith JA, eds.Peptides:Chemistry, structure and biology. Proceedings of the thirteenth Americanpeptide symposium.Leiden: ESCOM. pp 408–409.
Kannel WB, Sorlie P, Brand F, Castelli NP, McNamara PM, Gherardi GJ. 1980.Epidemiology of coronary atherosclerosis: Postmortem vs. clinical risk fac-tor correlations. The Framinham study. In Gotto AM Jr, Smith LC, Allen B,eds. Proceedings of the 5th international symposium of atherosclerosis.New York: Springer-Verlag. pp 54–56.
Kloosterman DA, Scahill TA, Friedman AR. 1993. Secondary structure of ahuman growth hormone-releasing factor fragment~Leu27-hGRF~15-32!NH2!in aqueous0SDS micelle environments.Pept Res 6:211–218.
Koizumi J, Mabuchi H, Yoshimura A, Michishita I, Takeda M, Itoh H, Sakai Y,Sakai T, Nuda K, Takeda R. 1985. Deficiency of serum cholesteryl-estertransfer activity in patients with familial hyperalphalipoproteinaemia.Ath-erosclerosis 58:175–186.
Kushwaha RS, Hasan SQ, McGill HC Jr, Getz GS, Dunham RG, Kanda P. 1993.Characterization of cholesteryl ester transfer protein inhibitor from plasmaof baboons~Papio sp.!. J Lipid Res 34:1285–1297.
Kushwaha RS, Hazzard WR, Harker LA, Engblom J. 1978. Lipoprotein metab-olism in baboons: Effect of feeding cholesterol-rich diet.Atherosclerosis31:65–76.
Lakowicz JR. 1983.Principles of fluorescence spectroscopy.New York: PlenumPress.
Landoldt-Marticorena C, Williams KA, Deber CM, Reithmeir RAF. 1993.Non-random distribution of amino acids in the transmembrane segmentsof human type I single span membrane protein.J Mol Biol 229:602–608.
Lyu PC, Gans PJ, Kallenbach NR. 1992. Energetic contribution of solvent-exposed ion pairs to alpha-helix structure.J Mol Biol 223:343–350.
Marotti KR, Castle CK, Murray RW, Rehberg EF, Polites HG, Melchoir GW.1992. The role of cholesteryl ester transfer protein in primate apolipoproteinA-I metabolism: Insights from studies with transgenic mice.ArteriosclerThromb 12:736–744.
Merutka G, Stellwagen E. 1991. Effect of amino acid ion pairs on peptidehelicity. Biochemistry 30:1591–1594.
Miller GJ, Miller NE. 1975. Plasma high density lipoprotein concentrations anddevelopment of ischaemic heart-disease.Lancet 1:16–19.
Morton RE, Zilversmit DB. 1983. Purification and characterization of lipidtransfer protein~s! from human lipoprotein-deficient plasma.J Biol Chem267:19023–19026.
Mysels KJ, Princen LH. 1959. Light scattering by some lauryl sulfate solutions.J Phys Chem 63:1696–1700.
Structural studies of a CET inhibitor 1557
Nishide T, Tollefson JH, Albers JJ. 1989. Inhibition of lipid transfer by a uniquehigh density lipoprotein subclass containing an inhibitor protein.J Lipid Res30:149–158.
O’Neil KT, DeGrado WF. 1990. A thermodynamic scale for the helix formingtendencies of the commonly occurring amino acids.Science 250:646–651.
Oppella SJ, McDonnell PA. 1993. NMR structural studies of membrane protein.In: Clore GM, Gronenborn AM, eds.Topics in molecular structural biology.NMR of proteins. London: MacMillan Press Ltd. pp 158–189.
Perczel A, Park K, Fasman GD. 1992. Analysis of the circular dichroism spec-trum of proteins using the convex constraint algorithm: A practical guide.Anal Biochem 203:83–93.
Piotto M, Saudek V, Sklenár V. 1992. Gradient-tailored excitation for single-quantum NMR spectroscopy of aqueous solutions.J Biomol NMR 2:661–665.
Rance M, Sørensen OW, Bodenhausen G, Wagner G, Ernst RR, Wüthrich K.1983. Improved spectral resolution in COSY1H NMR spectra of proteinsvia double-quantum filtering.Biochem Biophys Res Commun 117:479–485.
Rizo J, Blanco FJ, Kobe B, Bruch MD, Gierasch LM. 1993. Conformationalbehavior ofEscherichia coliOmpA signal peptides in membrane mimeticenvironments.Biochemistry 32:4881–4894.
Rozek A, Buchko GW, Cushley RJ. 1995. Conformation of two peptides cor-responding to human apolipoprotein C-I residues 7–24 and 35–53 in thepresence of sodium dodecyl sulfate by CD and NMR spectroscopy.Bio-chemistry 34:7401–7408.
Rozek A, Buchko GW, Kanda P, Cushley RJ. 1997. Conformational studies ofthe N-terminal lipid-associating domain of human apolipoprotein C-I by CDand 1H NMR spectroscopy.Protein Sci 6:1858–1868.
Rozek A, Sparrow JT, Weisgraber KH, Cushley RJ. 1999. Conformation ofhuman apolipoprotein C-I in a lipid-mimetic environment determined byCD and NMR spectroscopy.Biochemistry 38:14475–14484.
Samsó M, Daban J-R, Hansen S, Jones GR. 1995. Evidence for sodium dodecylsulfate0protein complexes adopting a necklace structure.Eur J Biochem232:818–824.
Sarver RW, Krueger KC. 1991. Protein secondary structure from Fouriertransform infrared spectroscopy: A data base analysis.Anal Biochem 194:89–100.
Scanu AM, Edelstein C, Shen BW. 1982. Lipid–protein interactions in plasmalipoproteins. Model: High density lipoprotein. In: Jost PC, Griffith OH, eds.Lipid–protein interactions. New York: John Wiley & Sons. pp 259–316.
Segrest JP. 1977. Amphipathic helixes and plasma lipoproteins: Thermodynamicand geometric considerations.Chem Phys Lipids 18:1–16.
Segrest JP, DeLoof H, Dohlman JG, Brouillette CG, Anantharamaiah GM. 1990.The amphipathic helix motif: Classes and properties.Proteins Struct FunctGenet 8:103–117.
Segrest JP, Jackson RL, Morrisett JD, Gotto AM Jr. 1974. A molecular theory oflipid–protein interactions in the plasma lipoproteins.FEBS Lett 38:247–253.
Segrest JP, Jones MK, de Loof H, Brouillette CG, Venkatachalapathi YV,Anantharamaiah GM. 1992. The amphipathic helix in the exchangeableapolipoproteins: A review of secondary structure and function.J Lipid Res33:141–166.
Shen BW, Seanu AM, Kezdy FJ. 1977. Structure of human serum lipoproteinsinferred from compositional analysis.Proc Natl Acad Sci USA 74:837–841.
Sklenár V, Piotto M, Leppik R, Saudek V. 1993. Gradient-tailored water sup-pression for1H-15N HSQC experiments optimized to retain full sensitivity.J Magn Reson A 102:241–245.
Spyracopoulos L, O’Neil JDJ. 1994. Effect of a hydrophobic environment on thehydrogen exchange kinetics of model amides determined by1H-NMR spec-troscopy.J Am Chem Soc 116:1395–1402.
Son Y-SC, Zilversmit DB. 1984. Purification and characterization of humanplasma proteins that inhibit lipid transfer activities.Biochim Biophys Acta795:473–480.
Tall AR. 1986. Plasma lipid transfer proteins.J Lipid Res 27:361–367.Tall AR. 1993. Plasma cholesteryl transfer protein.J Lipid Res 34:1255–1274.Tall AR. 1995. Plasma cholesteryl ester transfer protein and high-density lipo-
proteins: New insights from molecular genetics studies.J Intern Med 237:5–12.
Tessari M, Foffani MT, Mammi S, Peggion E. 1993. Conformation and inter-actions of uteroglobin fragments 4–14 and 49–65 in aqueous solution con-taining surfactant micelles.Biopolymers 38:1877–1887.
Wang G, Pierens GK, Treleaven WD, Sparrow JT, Cushley RJ. 1996a. Confor-mations of human apolipoprotein E~263–286! and E~267–289! in aqueoussolutions of sodium dodecyl sulfate by CD and1H NMR. Biochemistry35:10348–10366.
Wang G, Sparrow JT, Cushley RJ. 1997. The helix-hinge-helix structural motifin human apolipoprotein A-I determined by NMR spectroscopy.Biochem-istry 36:13657–13666.
Wang G, Treleaven DW, Cushley RJ. 1996b. Conformation of human serumapolipoprotein A-I~166–185! in the presence of sodium dodecyl sulfate ordodecylphosphocholine by1H NMR and CD. Biochim Biophys Acta1301:174–184.
Williams MC, Kelley JL, Kushwaha RS. 1984. Detection of an abnormal lipo-protein in a large colony of pedigreed baboons using high-performance gelexclusion chromatography.J Chromatogr 308:101–109.
Wilson JC, Nielson KJ, McLeish MJ, Craik DJ. 1994. A determination of thesolution conformation of the nonmammalian tachykinin eledoisin by NMRand CD spectroscopy.Biochemistry 33:6802–6811.
Wimley WC, White SH. 1996. Experimentally determined hydrophobicity scalefor proteins at membrane interfaces.Nat Struct Biol 3:842–848.
Wishart DS, Sykes BD, Richards FM. 1991. Relationship between nuclearmagnetic resonance chemical shifts and protein secondary structure.J MolBiol 222:311–333.
Woody RW. 1995. Circular dichroism.Methods Enzymol 246:34–71.Wu C, Yang JT. 1978. Conformation of naturally-occurring peptides in surfac-
tant solution: Its relation to the structure-forming potential of amino acidsequence.Biochem Biophys Res Commun 82:85–91.
Wüthrich K. 1986.NMR of proteins and nucleic acids.New York: John Wiley& Sons.
Wüthrich K, Billeter M, Braun W. 1984. Polypeptide secondary structure de-termination by nuclear magnetic resonance observation of short proton–proton distances.J Mol Biol 180:715–740.
Yokoyama S, Kurasawa T, Nishikawa O, Yamamoto A. 1986. High densitylipoprotein with poor reactivity to cholesteryl transfer reaction observed inhomozygote of familial hyperalphalipoproteinemia.Artery 14:43–51.
1558 G.W. Buchko et al.


