Embed Size (px)
Citation preview
This article appeared in a journal published by Elsevier. The attachedcopy is furnished to the author for internal non-commercial researchand education use, including for instruction at the authors institution
and sharing with colleagues.
Other uses, including reproduction and distribution, or selling orlicensing copies, or posting to personal, institutional or third party
websites are prohibited.
In most cases authors are permitted to post their version of thearticle (e.g. in Word or Tex form) to their personal website orinstitutional repository. Authors requiring further information
regarding Elsevier’s archiving and manuscript policies areencouraged to visit:
http://www.elsevier.com/authorsrights
Author's personal copy
Structural condition assessment and functional appraisal of a largebasement affected by groundwater leakage
Muhammad Tariq A. Chaudhary ⇑Al Imam Mohammad Ibn Saud Islamic University, P.O. Box 84937, Riyadh 11681, Saudi Arabia
a r t i c l e i n f o
Article history:Received 26 April 2011Revised 19 February 2013Accepted 3 March 2013
Keywords:Structural condition assessmentFunctional appraisalWater leakageRaised groundwater levelBasementReinforced concreteFEM analysis
a b s t r a c t
A systematic approach to assess the structural integrity and functional viability of the basement of a40,000 m2 building complex, which was affected by a 3 m rise in groundwater level (GWL) after occu-pancy, is presented. Visual observations, in situ testing of structural components and analytical studiesusing commercially available finite element analysis programs were employed to implement the struc-tural condition assessment and appraisal program. Functional viability of the basement, after beingaffected by groundwater, was carried out based on BS 8102 guidelines. It was concluded that the base-ment structure was to be strengthened for 25% of the plan area to withstand the applied hydrostatic pres-sure. In the meanwhile, functionality of the basement, after required strengthening, was also determinedto be slightly impaired due to the revised loading conditions. Increased maintenance and periodic inspec-tion were recommended for satisfactory operation of the basement.
� 2013 Elsevier Ltd. All rights reserved.
1. Introduction
Water leakage in a basement can have serious structural, dura-bility and functional implications. The matter is worsened if leak-age happens during the operational phase which could haveserious financial and functional consequences. In fact, the mostpredominant and costly problems in buildings, around the globe,are water related [1,2].
This paper presents the approach adopted for structural condi-tion assessment and appraisal of 40,000 m2 basement of a buildingcomplex due to water leakage caused by a 3 m rise in groundwaterlevel. Water started to leak into the basement and the elevator pitsafter about one and half year of partial occupancy of the buildingcomplex. Hydrostatic water pressure not only resulted in the for-mation of cracks in basement slab, opening up of construction/coldjoints, water leakage through cracks and expansion joints but alsoimpaired the functionality of the basement that was being used forparking. The owner installed a temporary dewatering system tolower the groundwater level for maintaining the use of the base-ment as parking as well as to alleviate hydrostatic loading on thebasement slab and walls. This investigation was undertaken atthe owner’s request to: (i) assess the extent of structural damagecaused by raised groundwater level, (ii) comment on strengthand durability of the affected reinforced concrete structural ele-
ments that were not designed for the additional load from hydro-static water head and (iii) report on the viability of the intendedfunctional use of the basement. An additional purpose of this paperwas to introduce a procedure for risk assessment of basementssubjected to groundwater based on BS 8102 code [3] for countriesoutside the influence of British Codes. This is especially true forNorth America where lack of such guidelines creates ambiguityin appraisal of structures for appropriate use.
Subsequent sections of the paper describe the structural systemof the building complex, visual observations of the damage due towater leakage, details of the in situ structural testing program andits results, appraisal of the functionality of the basement for its in-tended use based on BS 8102 code guidelines [3] and results of fi-nite element method (FEM) analysis of the building system underrevised loading, boundary conditions and material properties. Con-clusions of the structural condition assessment and functional ap-praisal are presented in the last section.
2. Structural system of the building complex
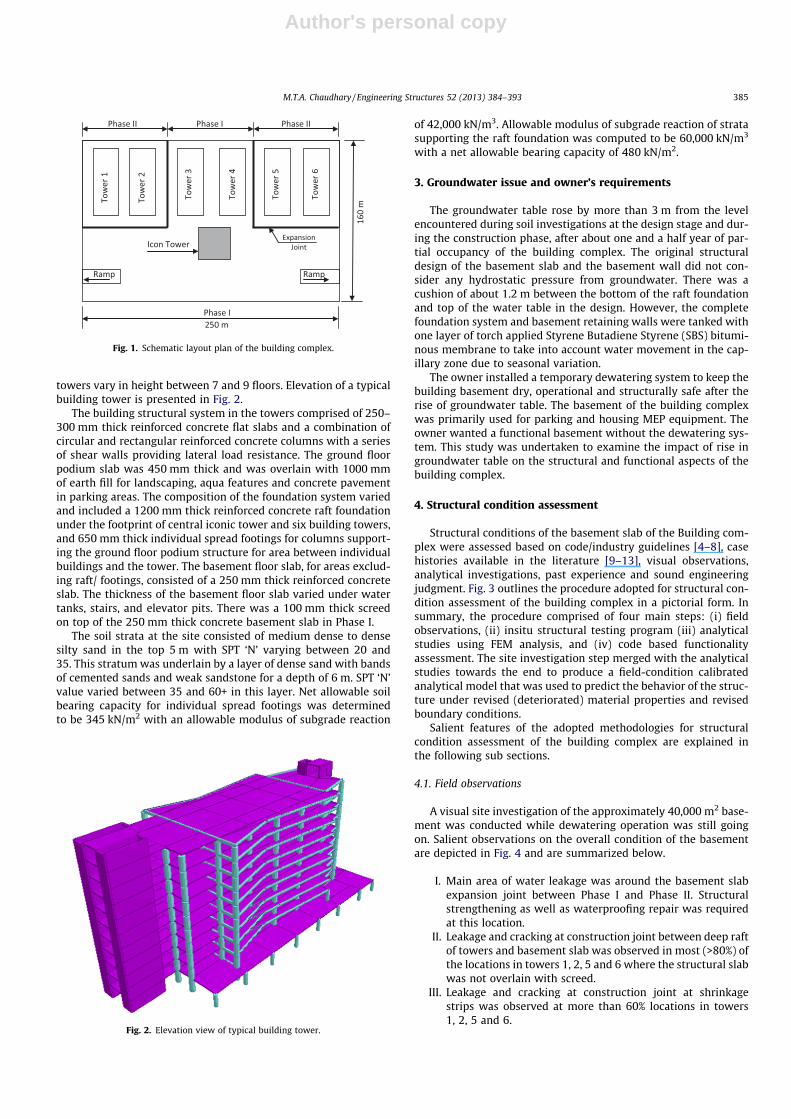
The building complex comprised of six multi-story buildingsand an iconic tower with common ground level podium and anunderground parking facility. Fig. 1 provides the schematic planview of the building complex. The building complex was built intwo phases. Phase I comprised of the central iconic tower and tow-ers 3 and 4. Whereas, Phase II consisted of four towers (1, 2, 5, 6)built symmetrically around the Phase I construction. The building
0141-0296/$ - see front matter � 2013 Elsevier Ltd. All rights reserved.http://dx.doi.org/10.1016/j.engstruct.2013.03.003
⇑ Tel.: +966 56 594 9865.E-mail addresses: [email protected], [email protected]
Engineering Structures 52 (2013) 384–393
Contents lists available at SciVerse ScienceDirect
Engineering Structures
journal homepage: www.elsevier .com/locate /engstruct
Author's personal copy
towers vary in height between 7 and 9 floors. Elevation of a typicalbuilding tower is presented in Fig. 2.
The building structural system in the towers comprised of 250–300 mm thick reinforced concrete flat slabs and a combination ofcircular and rectangular reinforced concrete columns with a seriesof shear walls providing lateral load resistance. The ground floorpodium slab was 450 mm thick and was overlain with 1000 mmof earth fill for landscaping, aqua features and concrete pavementin parking areas. The composition of the foundation system variedand included a 1200 mm thick reinforced concrete raft foundationunder the footprint of central iconic tower and six building towers,and 650 mm thick individual spread footings for columns support-ing the ground floor podium structure for area between individualbuildings and the tower. The basement floor slab, for areas exclud-ing raft/ footings, consisted of a 250 mm thick reinforced concreteslab. The thickness of the basement floor slab varied under watertanks, stairs, and elevator pits. There was a 100 mm thick screedon top of the 250 mm thick concrete basement slab in Phase I.
The soil strata at the site consisted of medium dense to densesilty sand in the top 5 m with SPT ‘N’ varying between 20 and35. This stratum was underlain by a layer of dense sand with bandsof cemented sands and weak sandstone for a depth of 6 m. SPT ‘N’value varied between 35 and 60+ in this layer. Net allowable soilbearing capacity for individual spread footings was determinedto be 345 kN/m2 with an allowable modulus of subgrade reaction
of 42,000 kN/m3. Allowable modulus of subgrade reaction of stratasupporting the raft foundation was computed to be 60,000 kN/m3
with a net allowable bearing capacity of 480 kN/m2.
3. Groundwater issue and owner’s requirements
The groundwater table rose by more than 3 m from the levelencountered during soil investigations at the design stage and dur-ing the construction phase, after about one and a half year of par-tial occupancy of the building complex. The original structuraldesign of the basement slab and the basement wall did not con-sider any hydrostatic pressure from groundwater. There was acushion of about 1.2 m between the bottom of the raft foundationand top of the water table in the design. However, the completefoundation system and basement retaining walls were tanked withone layer of torch applied Styrene Butadiene Styrene (SBS) bitumi-nous membrane to take into account water movement in the cap-illary zone due to seasonal variation.
The owner installed a temporary dewatering system to keep thebuilding basement dry, operational and structurally safe after therise of groundwater table. The basement of the building complexwas primarily used for parking and housing MEP equipment. Theowner wanted a functional basement without the dewatering sys-tem. This study was undertaken to examine the impact of rise ingroundwater table on the structural and functional aspects of thebuilding complex.
4. Structural condition assessment
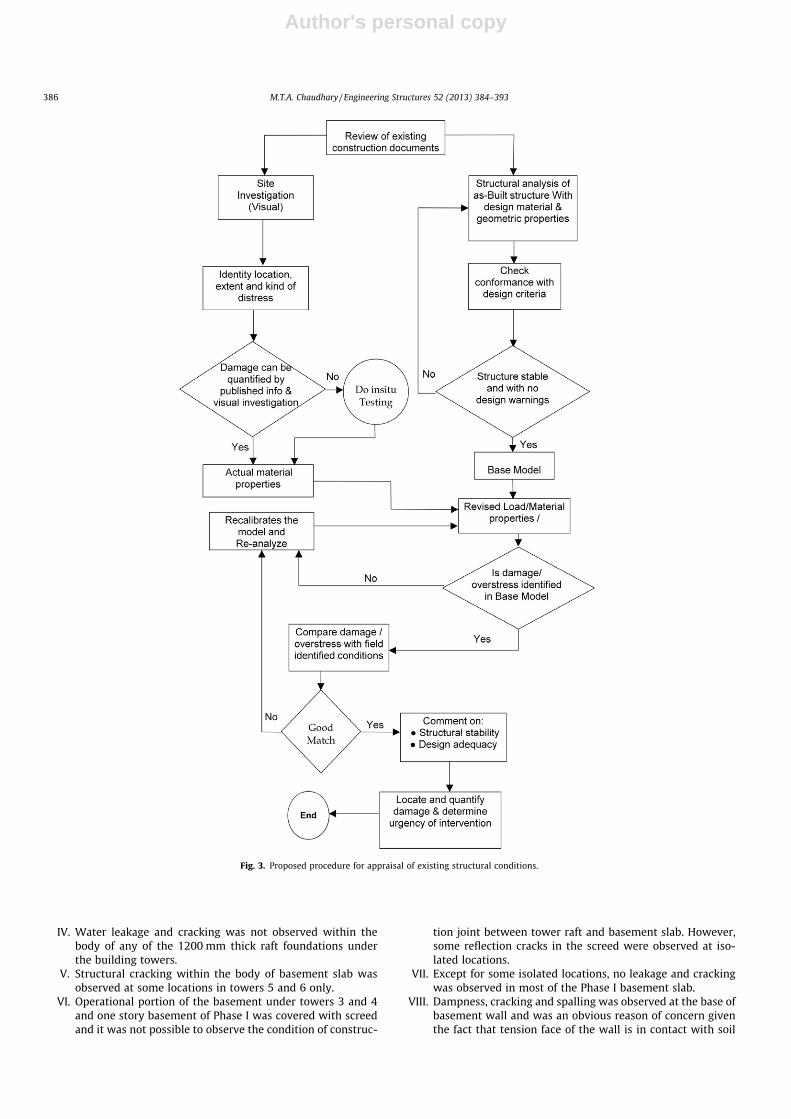
Structural conditions of the basement slab of the Building com-plex were assessed based on code/industry guidelines [4–8], casehistories available in the literature [9–13], visual observations,analytical investigations, past experience and sound engineeringjudgment. Fig. 3 outlines the procedure adopted for structural con-dition assessment of the building complex in a pictorial form. Insummary, the procedure comprised of four main steps: (i) fieldobservations, (ii) insitu structural testing program (iii) analyticalstudies using FEM analysis, and (iv) code based functionalityassessment. The site investigation step merged with the analyticalstudies towards the end to produce a field-condition calibratedanalytical model that was used to predict the behavior of the struc-ture under revised (deteriorated) material properties and revisedboundary conditions.
Salient features of the adopted methodologies for structuralcondition assessment of the building complex are explained inthe following sub sections.
4.1. Field observations
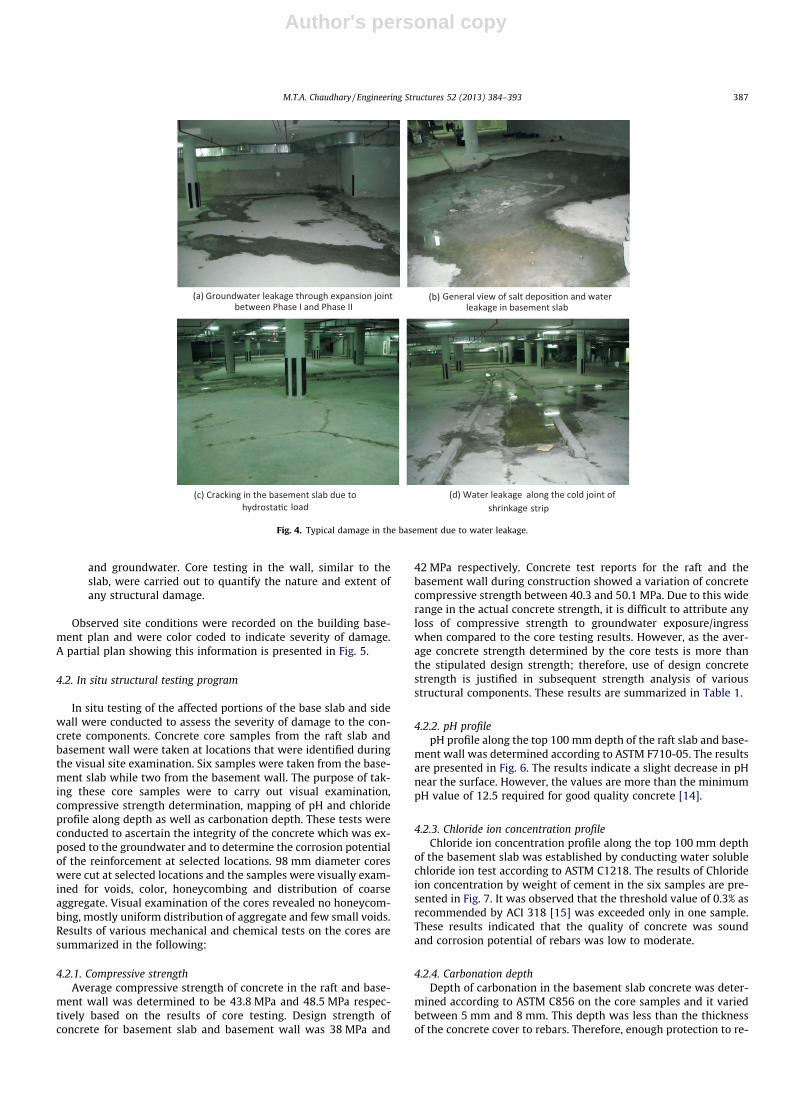
A visual site investigation of the approximately 40,000 m2 base-ment was conducted while dewatering operation was still goingon. Salient observations on the overall condition of the basementare depicted in Fig. 4 and are summarized below.
I. Main area of water leakage was around the basement slabexpansion joint between Phase I and Phase II. Structuralstrengthening as well as waterproofing repair was requiredat this location.
II. Leakage and cracking at construction joint between deep raftof towers and basement slab was observed in most (>80%) ofthe locations in towers 1, 2, 5 and 6 where the structural slabwas not overlain with screed.
III. Leakage and cracking at construction joint at shrinkagestrips was observed at more than 60% locations in towers1, 2, 5 and 6.
Fig. 1. Schematic layout plan of the building complex.
Fig. 2. Elevation view of typical building tower.
M.T.A. Chaudhary / Engineering Structures 52 (2013) 384–393 385
Author's personal copy
IV. Water leakage and cracking was not observed within thebody of any of the 1200 mm thick raft foundations underthe building towers.
V. Structural cracking within the body of basement slab wasobserved at some locations in towers 5 and 6 only.
VI. Operational portion of the basement under towers 3 and 4and one story basement of Phase I was covered with screedand it was not possible to observe the condition of construc-
tion joint between tower raft and basement slab. However,some reflection cracks in the screed were observed at iso-lated locations.
VII. Except for some isolated locations, no leakage and crackingwas observed in most of the Phase I basement slab.
VIII. Dampness, cracking and spalling was observed at the base ofbasement wall and was an obvious reason of concern giventhe fact that tension face of the wall is in contact with soil
Fig. 3. Proposed procedure for appraisal of existing structural conditions.
386 M.T.A. Chaudhary / Engineering Structures 52 (2013) 384–393
Author's personal copy
and groundwater. Core testing in the wall, similar to theslab, were carried out to quantify the nature and extent ofany structural damage.
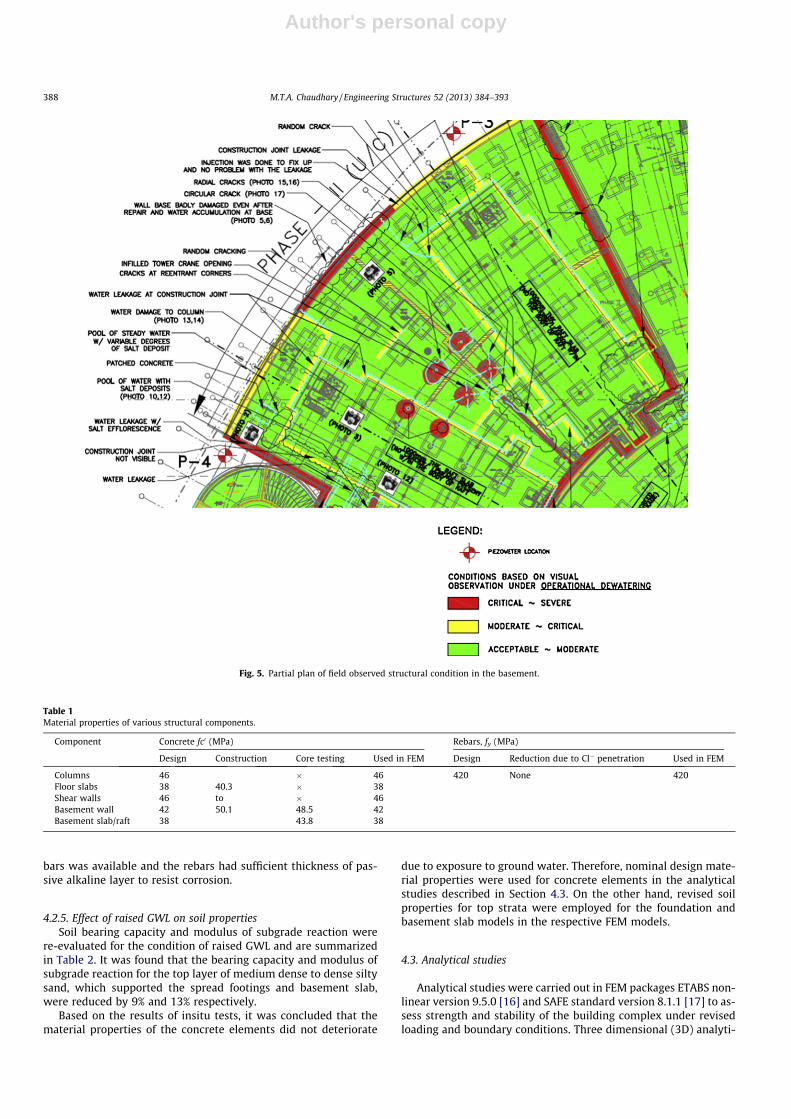
Observed site conditions were recorded on the building base-ment plan and were color coded to indicate severity of damage.A partial plan showing this information is presented in Fig. 5.
4.2. In situ structural testing program
In situ testing of the affected portions of the base slab and sidewall were conducted to assess the severity of damage to the con-crete components. Concrete core samples from the raft slab andbasement wall were taken at locations that were identified duringthe visual site examination. Six samples were taken from the base-ment slab while two from the basement wall. The purpose of tak-ing these core samples were to carry out visual examination,compressive strength determination, mapping of pH and chlorideprofile along depth as well as carbonation depth. These tests wereconducted to ascertain the integrity of the concrete which was ex-posed to the groundwater and to determine the corrosion potentialof the reinforcement at selected locations. 98 mm diameter coreswere cut at selected locations and the samples were visually exam-ined for voids, color, honeycombing and distribution of coarseaggregate. Visual examination of the cores revealed no honeycom-bing, mostly uniform distribution of aggregate and few small voids.Results of various mechanical and chemical tests on the cores aresummarized in the following:
4.2.1. Compressive strengthAverage compressive strength of concrete in the raft and base-
ment wall was determined to be 43.8 MPa and 48.5 MPa respec-tively based on the results of core testing. Design strength ofconcrete for basement slab and basement wall was 38 MPa and
42 MPa respectively. Concrete test reports for the raft and thebasement wall during construction showed a variation of concretecompressive strength between 40.3 and 50.1 MPa. Due to this widerange in the actual concrete strength, it is difficult to attribute anyloss of compressive strength to groundwater exposure/ingresswhen compared to the core testing results. However, as the aver-age concrete strength determined by the core tests is more thanthe stipulated design strength; therefore, use of design concretestrength is justified in subsequent strength analysis of variousstructural components. These results are summarized in Table 1.
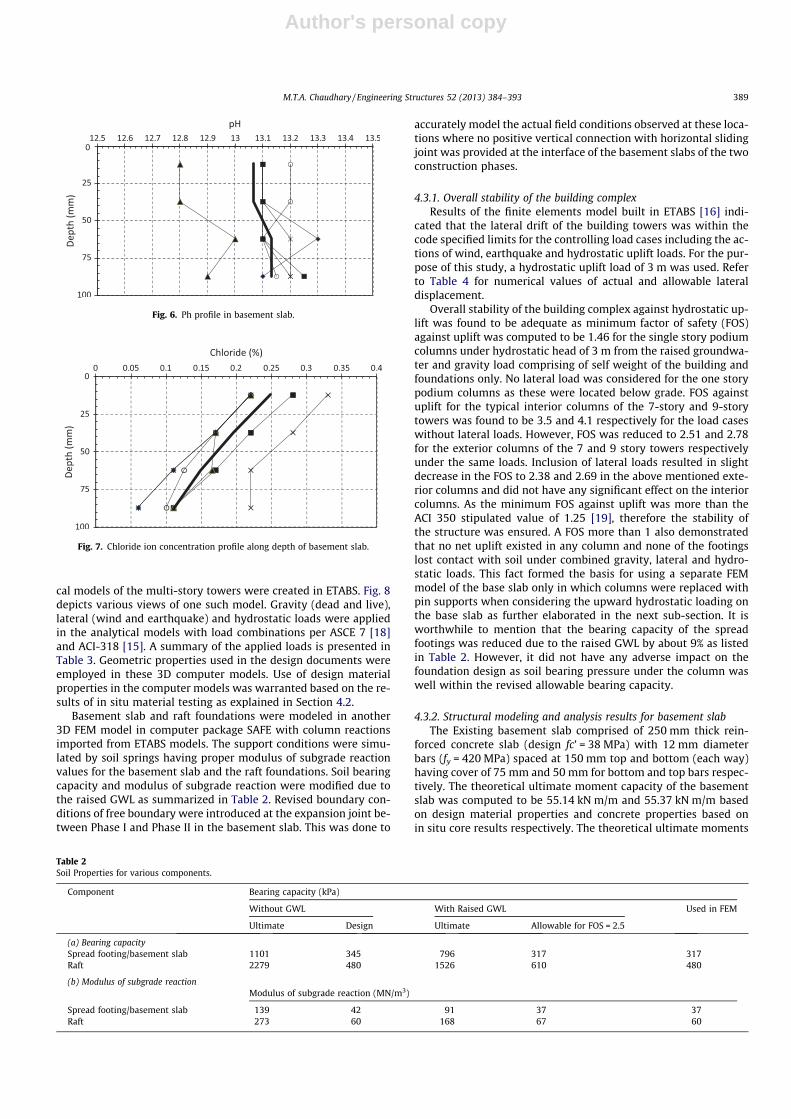
4.2.2. pH profilepH profile along the top 100 mm depth of the raft slab and base-
ment wall was determined according to ASTM F710-05. The resultsare presented in Fig. 6. The results indicate a slight decrease in pHnear the surface. However, the values are more than the minimumpH value of 12.5 required for good quality concrete [14].
4.2.3. Chloride ion concentration profileChloride ion concentration profile along the top 100 mm depth
of the basement slab was established by conducting water solublechloride ion test according to ASTM C1218. The results of Chlorideion concentration by weight of cement in the six samples are pre-sented in Fig. 7. It was observed that the threshold value of 0.3% asrecommended by ACI 318 [15] was exceeded only in one sample.These results indicated that the quality of concrete was soundand corrosion potential of rebars was low to moderate.
4.2.4. Carbonation depthDepth of carbonation in the basement slab concrete was deter-
mined according to ASTM C856 on the core samples and it variedbetween 5 mm and 8 mm. This depth was less than the thicknessof the concrete cover to rebars. Therefore, enough protection to re-
Fig. 4. Typical damage in the basement due to water leakage.
M.T.A. Chaudhary / Engineering Structures 52 (2013) 384–393 387
Author's personal copy
bars was available and the rebars had sufficient thickness of pas-sive alkaline layer to resist corrosion.
4.2.5. Effect of raised GWL on soil propertiesSoil bearing capacity and modulus of subgrade reaction were
re-evaluated for the condition of raised GWL and are summarizedin Table 2. It was found that the bearing capacity and modulus ofsubgrade reaction for the top layer of medium dense to dense siltysand, which supported the spread footings and basement slab,were reduced by 9% and 13% respectively.
Based on the results of insitu tests, it was concluded that thematerial properties of the concrete elements did not deteriorate
due to exposure to ground water. Therefore, nominal design mate-rial properties were used for concrete elements in the analyticalstudies described in Section 4.3. On the other hand, revised soilproperties for top strata were employed for the foundation andbasement slab models in the respective FEM models.
4.3. Analytical studies
Analytical studies were carried out in FEM packages ETABS non-linear version 9.5.0 [16] and SAFE standard version 8.1.1 [17] to as-sess strength and stability of the building complex under revisedloading and boundary conditions. Three dimensional (3D) analyti-
Fig. 5. Partial plan of field observed structural condition in the basement.
Table 1Material properties of various structural components.
Component Concrete fc0 (MPa) Rebars, fy (MPa)
Design Construction Core testing Used in FEM Design Reduction due to Cl� penetration Used in FEM
Columns 46 � 46 420 None 420Floor slabs 38 40.3 � 38Shear walls 46 to � 46Basement wall 42 50.1 48.5 42Basement slab/raft 38 43.8 38
388 M.T.A. Chaudhary / Engineering Structures 52 (2013) 384–393
Author's personal copy
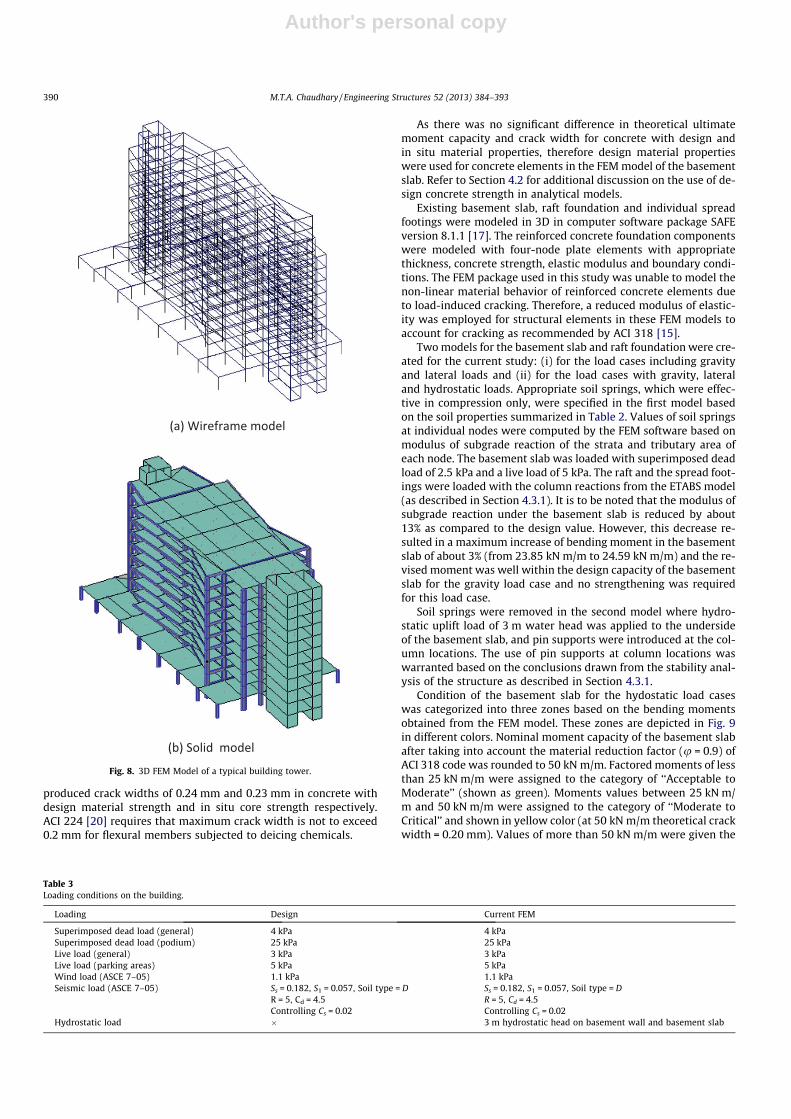
cal models of the multi-story towers were created in ETABS. Fig. 8depicts various views of one such model. Gravity (dead and live),lateral (wind and earthquake) and hydrostatic loads were appliedin the analytical models with load combinations per ASCE 7 [18]and ACI-318 [15]. A summary of the applied loads is presented inTable 3. Geometric properties used in the design documents wereemployed in these 3D computer models. Use of design materialproperties in the computer models was warranted based on the re-sults of in situ material testing as explained in Section 4.2.
Basement slab and raft foundations were modeled in another3D FEM model in computer package SAFE with column reactionsimported from ETABS models. The support conditions were simu-lated by soil springs having proper modulus of subgrade reactionvalues for the basement slab and the raft foundations. Soil bearingcapacity and modulus of subgrade reaction were modified due tothe raised GWL as summarized in Table 2. Revised boundary con-ditions of free boundary were introduced at the expansion joint be-tween Phase I and Phase II in the basement slab. This was done to
accurately model the actual field conditions observed at these loca-tions where no positive vertical connection with horizontal slidingjoint was provided at the interface of the basement slabs of the twoconstruction phases.
4.3.1. Overall stability of the building complexResults of the finite elements model built in ETABS [16] indi-
cated that the lateral drift of the building towers was within thecode specified limits for the controlling load cases including the ac-tions of wind, earthquake and hydrostatic uplift loads. For the pur-pose of this study, a hydrostatic uplift load of 3 m was used. Referto Table 4 for numerical values of actual and allowable lateraldisplacement.
Overall stability of the building complex against hydrostatic up-lift was found to be adequate as minimum factor of safety (FOS)against uplift was computed to be 1.46 for the single story podiumcolumns under hydrostatic head of 3 m from the raised groundwa-ter and gravity load comprising of self weight of the building andfoundations only. No lateral load was considered for the one storypodium columns as these were located below grade. FOS againstuplift for the typical interior columns of the 7-story and 9-storytowers was found to be 3.5 and 4.1 respectively for the load caseswithout lateral loads. However, FOS was reduced to 2.51 and 2.78for the exterior columns of the 7 and 9 story towers respectivelyunder the same loads. Inclusion of lateral loads resulted in slightdecrease in the FOS to 2.38 and 2.69 in the above mentioned exte-rior columns and did not have any significant effect on the interiorcolumns. As the minimum FOS against uplift was more than theACI 350 stipulated value of 1.25 [19], therefore the stability ofthe structure was ensured. A FOS more than 1 also demonstratedthat no net uplift existed in any column and none of the footingslost contact with soil under combined gravity, lateral and hydro-static loads. This fact formed the basis for using a separate FEMmodel of the base slab only in which columns were replaced withpin supports when considering the upward hydrostatic loading onthe base slab as further elaborated in the next sub-section. It isworthwhile to mention that the bearing capacity of the spreadfootings was reduced due to the raised GWL by about 9% as listedin Table 2. However, it did not have any adverse impact on thefoundation design as soil bearing pressure under the column waswell within the revised allowable bearing capacity.
4.3.2. Structural modeling and analysis results for basement slabThe Existing basement slab comprised of 250 mm thick rein-
forced concrete slab (design fc’ = 38 MPa) with 12 mm diameterbars (fy = 420 MPa) spaced at 150 mm top and bottom (each way)having cover of 75 mm and 50 mm for bottom and top bars respec-tively. The theoretical ultimate moment capacity of the basementslab was computed to be 55.14 kN m/m and 55.37 kN m/m basedon design material properties and concrete properties based onin situ core results respectively. The theoretical ultimate moments
Table 2Soil Properties for various components.
Component Bearing capacity (kPa)
Without GWL With Raised GWL Used in FEM
Ultimate Design Ultimate Allowable for FOS = 2.5
(a) Bearing capacitySpread footing/basement slab 1101 345 796 317 317Raft 2279 480 1526 610 480
(b) Modulus of subgrade reactionModulus of subgrade reaction (MN/m3)
Spread footing/basement slab 139 42 91 37 37Raft 273 60 168 67 60
Fig. 7. Chloride ion concentration profile along depth of basement slab.
Fig. 6. Ph profile in basement slab.
M.T.A. Chaudhary / Engineering Structures 52 (2013) 384–393 389
Author's personal copy
produced crack widths of 0.24 mm and 0.23 mm in concrete withdesign material strength and in situ core strength respectively.ACI 224 [20] requires that maximum crack width is not to exceed0.2 mm for flexural members subjected to deicing chemicals.
As there was no significant difference in theoretical ultimatemoment capacity and crack width for concrete with design andin situ material properties, therefore design material propertieswere used for concrete elements in the FEM model of the basementslab. Refer to Section 4.2 for additional discussion on the use of de-sign concrete strength in analytical models.
Existing basement slab, raft foundation and individual spreadfootings were modeled in 3D in computer software package SAFEversion 8.1.1 [17]. The reinforced concrete foundation componentswere modeled with four-node plate elements with appropriatethickness, concrete strength, elastic modulus and boundary condi-tions. The FEM package used in this study was unable to model thenon-linear material behavior of reinforced concrete elements dueto load-induced cracking. Therefore, a reduced modulus of elastic-ity was employed for structural elements in these FEM models toaccount for cracking as recommended by ACI 318 [15].
Two models for the basement slab and raft foundation were cre-ated for the current study: (i) for the load cases including gravityand lateral loads and (ii) for the load cases with gravity, lateraland hydrostatic loads. Appropriate soil springs, which were effec-tive in compression only, were specified in the first model basedon the soil properties summarized in Table 2. Values of soil springsat individual nodes were computed by the FEM software based onmodulus of subgrade reaction of the strata and tributary area ofeach node. The basement slab was loaded with superimposed deadload of 2.5 kPa and a live load of 5 kPa. The raft and the spread foot-ings were loaded with the column reactions from the ETABS model(as described in Section 4.3.1). It is to be noted that the modulus ofsubgrade reaction under the basement slab is reduced by about13% as compared to the design value. However, this decrease re-sulted in a maximum increase of bending moment in the basementslab of about 3% (from 23.85 kN m/m to 24.59 kN m/m) and the re-vised moment was well within the design capacity of the basementslab for the gravity load case and no strengthening was requiredfor this load case.
Soil springs were removed in the second model where hydro-static uplift load of 3 m water head was applied to the undersideof the basement slab, and pin supports were introduced at the col-umn locations. The use of pin supports at column locations waswarranted based on the conclusions drawn from the stability anal-ysis of the structure as described in Section 4.3.1.
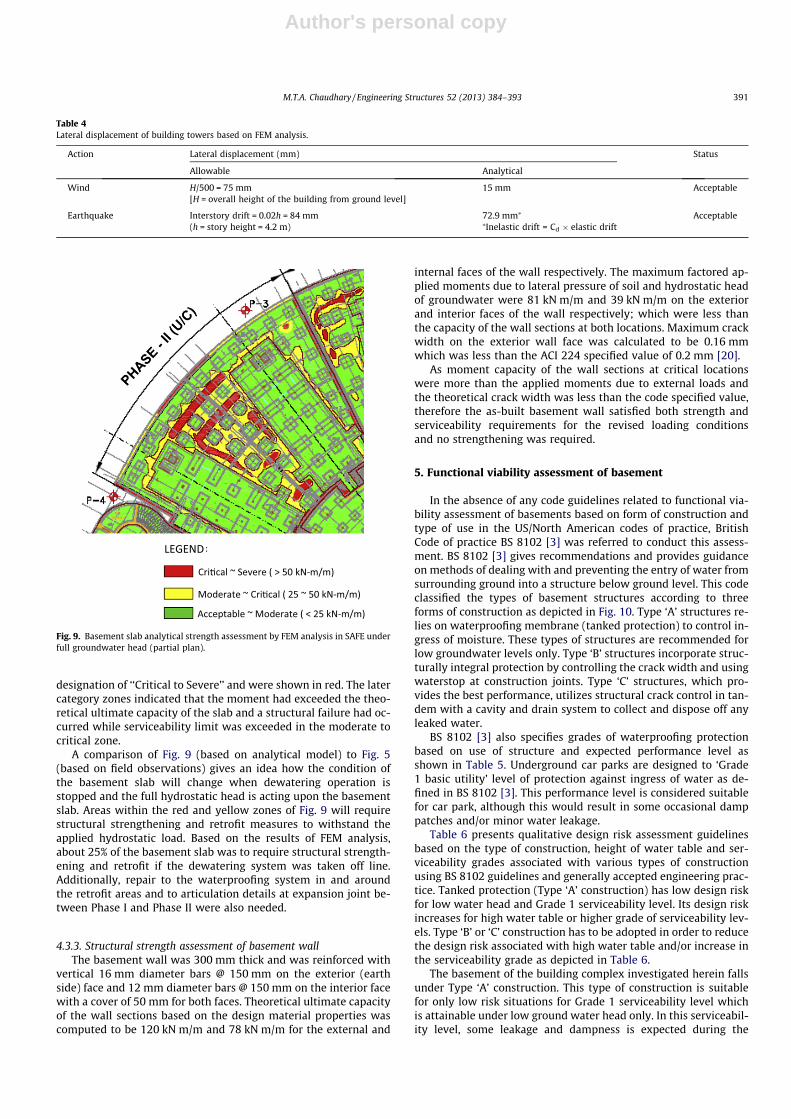
Condition of the basement slab for the hydostatic load caseswas categorized into three zones based on the bending momentsobtained from the FEM model. These zones are depicted in Fig. 9in different colors. Nominal moment capacity of the basement slabafter taking into account the material reduction factor (u = 0.9) ofACI 318 code was rounded to 50 kN m/m. Factored moments of lessthan 25 kN m/m were assigned to the category of ‘‘Acceptable toModerate’’ (shown as green). Moments values between 25 kN m/m and 50 kN m/m were assigned to the category of ‘‘Moderate toCritical’’ and shown in yellow color (at 50 kN m/m theoretical crackwidth = 0.20 mm). Values of more than 50 kN m/m were given the
Table 3Loading conditions on the building.
Loading Design Current FEM
Superimposed dead load (general) 4 kPa 4 kPaSuperimposed dead load (podium) 25 kPa 25 kPaLive load (general) 3 kPa 3 kPaLive load (parking areas) 5 kPa 5 kPaWind load (ASCE 7–05) 1.1 kPa 1.1 kPaSeismic load (ASCE 7–05) Ss = 0.182, S1 = 0.057, Soil type = D Ss = 0.182, S1 = 0.057, Soil type = D
R = 5, Cd = 4.5 R = 5, Cd = 4.5Controlling Cs = 0.02 Controlling Cs = 0.02
Hydrostatic load � 3 m hydrostatic head on basement wall and basement slab
Fig. 8. 3D FEM Model of a typical building tower.
390 M.T.A. Chaudhary / Engineering Structures 52 (2013) 384–393
Author's personal copy
designation of ‘‘Critical to Severe’’ and were shown in red. The latercategory zones indicated that the moment had exceeded the theo-retical ultimate capacity of the slab and a structural failure had oc-curred while serviceability limit was exceeded in the moderate tocritical zone.
A comparison of Fig. 9 (based on analytical model) to Fig. 5(based on field observations) gives an idea how the condition ofthe basement slab will change when dewatering operation isstopped and the full hydrostatic head is acting upon the basementslab. Areas within the red and yellow zones of Fig. 9 will requirestructural strengthening and retrofit measures to withstand theapplied hydrostatic load. Based on the results of FEM analysis,about 25% of the basement slab was to require structural strength-ening and retrofit if the dewatering system was taken off line.Additionally, repair to the waterproofing system in and aroundthe retrofit areas and to articulation details at expansion joint be-tween Phase I and Phase II were also needed.
4.3.3. Structural strength assessment of basement wallThe basement wall was 300 mm thick and was reinforced with
vertical 16 mm diameter bars @ 150 mm on the exterior (earthside) face and 12 mm diameter bars @ 150 mm on the interior facewith a cover of 50 mm for both faces. Theoretical ultimate capacityof the wall sections based on the design material properties wascomputed to be 120 kN m/m and 78 kN m/m for the external and
internal faces of the wall respectively. The maximum factored ap-plied moments due to lateral pressure of soil and hydrostatic headof groundwater were 81 kN m/m and 39 kN m/m on the exteriorand interior faces of the wall respectively; which were less thanthe capacity of the wall sections at both locations. Maximum crackwidth on the exterior wall face was calculated to be 0.16 mmwhich was less than the ACI 224 specified value of 0.2 mm [20].
As moment capacity of the wall sections at critical locationswere more than the applied moments due to external loads andthe theoretical crack width was less than the code specified value,therefore the as-built basement wall satisfied both strength andserviceability requirements for the revised loading conditionsand no strengthening was required.
5. Functional viability assessment of basement
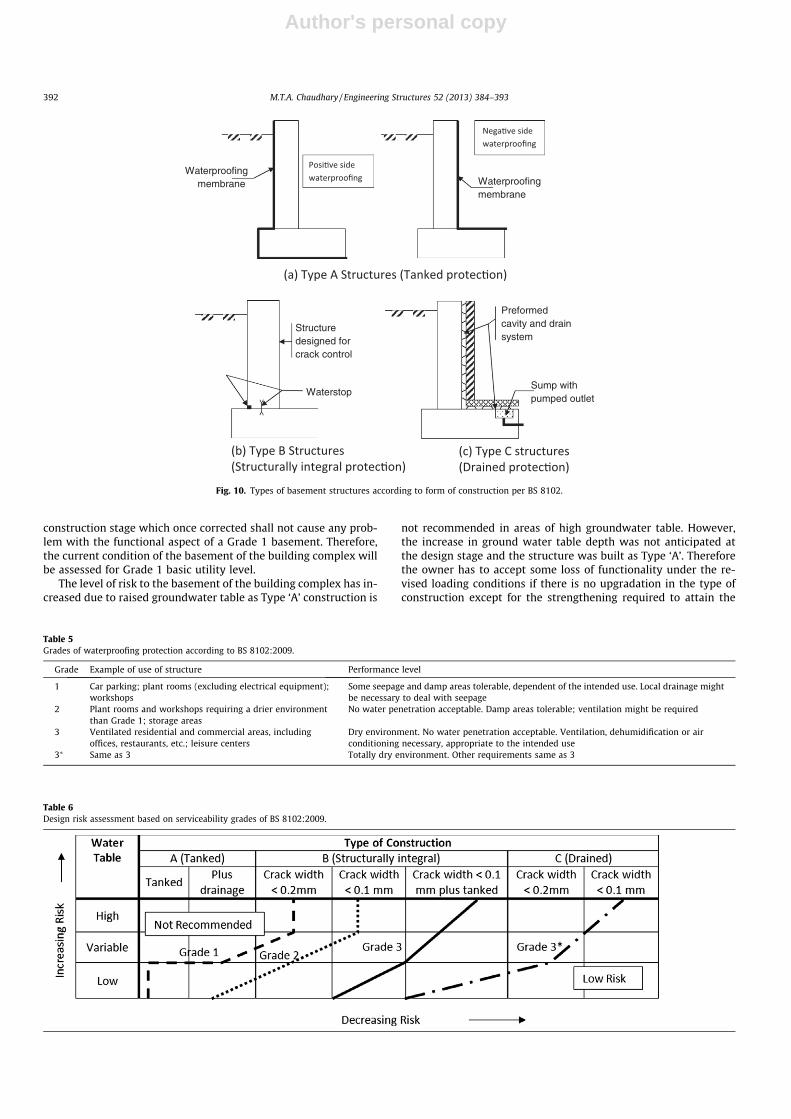
In the absence of any code guidelines related to functional via-bility assessment of basements based on form of construction andtype of use in the US/North American codes of practice, BritishCode of practice BS 8102 [3] was referred to conduct this assess-ment. BS 8102 [3] gives recommendations and provides guidanceon methods of dealing with and preventing the entry of water fromsurrounding ground into a structure below ground level. This codeclassified the types of basement structures according to threeforms of construction as depicted in Fig. 10. Type ‘A’ structures re-lies on waterproofing membrane (tanked protection) to control in-gress of moisture. These types of structures are recommended forlow groundwater levels only. Type ‘B’ structures incorporate struc-turally integral protection by controlling the crack width and usingwaterstop at construction joints. Type ‘C’ structures, which pro-vides the best performance, utilizes structural crack control in tan-dem with a cavity and drain system to collect and dispose off anyleaked water.
BS 8102 [3] also specifies grades of waterproofing protectionbased on use of structure and expected performance level asshown in Table 5. Underground car parks are designed to ‘Grade1 basic utility’ level of protection against ingress of water as de-fined in BS 8102 [3]. This performance level is considered suitablefor car park, although this would result in some occasional damppatches and/or minor water leakage.
Table 6 presents qualitative design risk assessment guidelinesbased on the type of construction, height of water table and ser-viceability grades associated with various types of constructionusing BS 8102 guidelines and generally accepted engineering prac-tice. Tanked protection (Type ‘A’ construction) has low design riskfor low water head and Grade 1 serviceability level. Its design riskincreases for high water table or higher grade of serviceability lev-els. Type ‘B’ or ‘C’ construction has to be adopted in order to reducethe design risk associated with high water table and/or increase inthe serviceability grade as depicted in Table 6.
The basement of the building complex investigated herein fallsunder Type ‘A’ construction. This type of construction is suitablefor only low risk situations for Grade 1 serviceability level whichis attainable under low ground water head only. In this serviceabil-ity level, some leakage and dampness is expected during the
Fig. 9. Basement slab analytical strength assessment by FEM analysis in SAFE underfull groundwater head (partial plan).
Table 4Lateral displacement of building towers based on FEM analysis.
Action Lateral displacement (mm) Status
Allowable Analytical
Wind H/500 = 75 mm 15 mm Acceptable[H = overall height of the building from ground level]
Earthquake Interstory drift = 0.02h = 84 mm 72.9 mm⁄ Acceptable(h = story height = 4.2 m) ⁄Inelastic drift = Cd � elastic drift
M.T.A. Chaudhary / Engineering Structures 52 (2013) 384–393 391
Author's personal copy
construction stage which once corrected shall not cause any prob-lem with the functional aspect of a Grade 1 basement. Therefore,the current condition of the basement of the building complex willbe assessed for Grade 1 basic utility level.
The level of risk to the basement of the building complex has in-creased due to raised groundwater table as Type ‘A’ construction is
not recommended in areas of high groundwater table. However,the increase in ground water table depth was not anticipated atthe design stage and the structure was built as Type ‘A’. Thereforethe owner has to accept some loss of functionality under the re-vised loading conditions if there is no upgradation in the type ofconstruction except for the strengthening required to attain the
Table 6Design risk assessment based on serviceability grades of BS 8102:2009.
Fig. 10. Types of basement structures according to form of construction per BS 8102.
Table 5Grades of waterproofing protection according to BS 8102:2009.
Grade Example of use of structure Performance level
1 Car parking; plant rooms (excluding electrical equipment);workshops
Some seepage and damp areas tolerable, dependent of the intended use. Local drainage mightbe necessary to deal with seepage
2 Plant rooms and workshops requiring a drier environmentthan Grade 1; storage areas
No water penetration acceptable. Damp areas tolerable; ventilation might be required
3 Ventilated residential and commercial areas, includingoffices, restaurants, etc.; leisure centers
Dry environment. No water penetration acceptable. Ventilation, dehumidification or airconditioning necessary, appropriate to the intended use
3⁄ Same as 3 Totally dry environment. Other requirements same as 3
392 M.T.A. Chaudhary / Engineering Structures 52 (2013) 384–393
Author's personal copy
necessary structural strength as pointed out in Section 4.3. Thisloss in functionality may be in the form of periodic dampness orleakage in certain area which may require mopping, collection &disposal. Although it is not required by the code, it will also be pru-dent to periodically inspect the critical components of the base-ment to ensure structural soundness and durability under theseoperating conditions.
6. Conclusions
The following conclusions are drawn from this investigation:
(a) The proposed methodology for structural condition assess-ment and strength evaluation was successfully implementedfor this large scale project.
(b) It was concluded by in situ material testing that the raisedgroundwater did not compromise the durability andstrength of the reinforced concrete components.
(c) The building complex was found to be globally stable underthe combined actions of gravity, lateral (wind and earth-quake) and hydrostatic loads.
(d) The values of soil bearing capacity and modulus of subgradereaction were reduced due to the effect of raised GWL. How-ever, this reduction did not result in any overstress in thefoundations and basement slab under gravity and lateralloads.
(e) There was a need of strengthening about 25% of the base-ment slab to withstand the applied hydrostatic load in theabsence of a dewatering system.
(f) The basement wall had adequate strength to withstand therevised loads and required no strengthening.
(g) The basement was designed as a Type ‘A’ structure per BS8102 which is suitable for low ground water levels only.Therefore, the functionality of the basement as a car parkingwas affected due to increase in ground water table. Thismeans periodic maintenance and monitoring of the struc-ture will be required to maintain the desired level of func-tionality in the future.
(h) Costly strengthening and remedial measures may be neededif partial and periodic loss of functionally is not acceptable.This will include major structural upgrade of affected com-
ponents and installation of cavity drains. These structuralretrofit measures are beyond the essential structuralstrengthening required for withstanding the applied hydro-static pressure as discussed in Section 4.3.2 and summarizedin point ‘e’ above.
References
[1] CIB, Building pathology: a state-of-the-art report. CIB Report Publication 155.CIB Working Commission W86. International Council for Building Researchand Information, Holland; 1993.
[2] Chew MYL, Nayanthara DS. Factors affecting water-tightness in wet area ofhigh-rise residential buildings. Archit Sci Rev 2002;45(4):375–83 [Australia].
[3] BS 8102, Code of practice for protection of below grade structures againstwater from the ground. British Standards Institution; 2009.
[4] Appraisal of existing structures. The Institution of Structural Engineers,London, UK; 1996.
[5] International atomic energy agency. Guidebook on non-destructive testing ofconcrete structures. Training Course Series No. 17. Vienna; 2002.
[6] Repair of concrete structures to EN 1504. Danish Standards Association; 2004.[7] Perkins PH. Repair, protection and waterproofing of concrete structures. UK: E
& FN Spon; 1997.[8] Kabul MT. Construction waterproofing handbook. New York: McGraw Hill;
2008.[9] Wong IW. Experience with waterproofing of basements constructed of
concrete diaphragm walls in Singapore. Tunnel Undergr Space Technol1997;12(4):491–5.
[10] Chew MYL, Egodage NDDS. Benchmarks to minimise water leakages inbasements. Struct Survey 2003;21(4):131–45.
[11] Kenai S, Bahar R. Evaluation and repair of Algiers new airport building. CemConcr Compos 2003;25:633–41.
[12] Chew MYL. Defect analysis in wet areas of buildings. Construct Build Mater2005;16:165–73.
[13] McNicholl DP, Ainsworth PR, Harley MV, Stubbings BJ, Watkins RAM. Publichousing blocks in Hong Kong: the identification, investigation and rectificationof structural defects. Struct Eng 1990;68(16):307–26.
[14] Neville AM. Properties of concrete. NJ: Pearson; 2009.[15] AC1 318 – Building code requirements for concrete structures. American
Concrete Institute, MI; 2005.[16] ETABS v 9.5.0 – Integrated analysis, design and drafting of building systems.
Computers and Structures Inc., CA; 2009.[17] SAFE v 8.1.1 – Design of slabs, beams and foundations. Computers and
Structures Inc., CA; 2009.[18] ASCE 7 – Minimum design loads for buildings and other structures. American
Society of Civil Engineers, VA; 2005.[19] ACI 350 – Code requirements for environmental engineering concrete
structures. American Concrete Institute, MI; 2006.[20] ACI 224 – Control of cracking in concrete structures. American Concrete
Institute, MI; 2001.
M.T.A. Chaudhary / Engineering Structures 52 (2013) 384–393 393