Embed Size (px)
Citation preview

ORI GIN AL PA PER
Strike probability judgments and protective actionrecommendations in a dynamic hurricane tracking task
Hao-Che Wu1 • Michael K. Lindell2 • Carla S. Prater2
Received: 25 November 2014 / Accepted: 30 May 2015� Springer Science+Business Media Dordrecht 2015
Abstract This experiment assessed the strike probability (ps) judgments and protective
action recommendations (PARs) of students playing the roles of county emergency
managers during four different hurricane scenarios. The results show that participants’ ps
judgments (1) increased for target cities (projected landfall locations) and generally
decreased for adjacent cities and remote cities as hurricanes approached landfall, and (2)
were significantly correlated with PARs, but (3) were not consistent with the requirement
that Rps\ 1.0 for a set of non-exhaustive events. Participants also (4) chose more PARs as
hurricanes approached landfall, especially for the counties to which they participants were
assigned, but (5) failed to choose as many PARS as appropriate, especially evacuating
areas at risk of hurricane impacts. Overall, the results suggest that participants were able to
utilize the available hurricane information to make reasonable ps judgments, but failed to
make the appropriate inferences about the significance of those ps judgments. This suggests
a need for further research on people’s interpretation of threat information, development of
better training manuals on hurricane evacuation decision making, and better hurricane
information displays to guide people’s responses to hurricane threats.
Keywords Hurricane tracking � Hurricane strike probability � Protective action
recommendations � Hurricane evacuation
& Hao-Che [email protected]
Michael K. [email protected]
Carla S. [email protected]
1 Political Science Department, Oklahoma State University, Stillwater, OK 74078-1066, USA
2 Texas A&M University Hazard Reduction and Recovery Center, College Station, TX 77843-3137,USA
123
Nat HazardsDOI 10.1007/s11069-015-1846-z
1 Introduction
Effective hurricane evacuations are important because thousands of lives are at risk in major
urban areas. There has been a substantial amount of social science research on hurricane
evacuation behavior, but most studies have been post-storm surveys of people’s risk perceptions
and evacuation decisions (Baker 1991; Huang et al. 2015). This research has identified many
valuable principles that can be used to design evacuation warnings, but these studies necessarily
rely on people’s retrospective reports of the extent to which they relied on different types of
information in making their evacuation decisions. By contrast, experiments can capture con-
current measurements of people’s information processing. Moreover, post-storm surveys are
necessarily limited to conditions that did occur, whereas experiments can examine conditions
that have not yet occurred but might occur in the future. Finally, past hurricane evacuation
studies have focused on the decision processes of risk area residents but overlooked those of
local officials. This is an important oversight because risk area residents tend to rely substan-
tially on local officials’ protective action recommendations—PARs (Baker 1991, 1995; Huang
et al. 2015; Lin et al. 2014). The types of information available to local officials are well
understood; the National Hurricane Center (NHC) and regional Weather Forecast Offices
(WFOs) provide information about a hurricane’s current status—including location, intensity
(Saffir–Simpson category), and size (radius of tropical storm wind)—and likely future behavior
(e.g., forecast track, uncertainty cone, storm surge, and rainfall). Unfortunately, it is unclear how
local officials integrate this information about storm behavior with their counties’ evacuation
time estimates (ETEs) in order to decide whether and when to issue evacuation orders (Baker
2000; Lindell 2008, 2013; Murray-Tuite and Wolshon 2013)—a process that can be modeled as
a dynamic decision in which the long periods of forewarning for most hurricanes allow decision
makers to periodically update their threat perceptions and their PARs (Czajkowski 2011).
Specifically, local officials should initiate evacuations everyplace that is likely to be affected by
wind, storm surge, and inland flooding of that storm’s intensity (i.e., the hurricane risk area).
Moreover, these evacuations should be initiated soon enough to clear the risk area before arrival
of these storm conditions (the evacuation deadline). For example, the evacuation deadlines
presented in hurricane ETE tables for some Texas counties range from 15 h for a Category 1
hurricane to 33 h for a Category 5 hurricane (Lindell et al. 2002).
This article begins by introducing the protective action decision model (PADM—
Lindell and Perry 2004, 2012) as a theoretical framework for addressing hurricane threat
perceptions and protective actions and continues with a review of previous experiments on
hurricane evacuation decision making that leads to five research hypotheses and five
research questions. The following section explains the methods by which experiment
participants were provided with numeric (storm parameters), graphic (tracking maps), and
verbal (NHC/WFO watch and warning) information and asked to report strike probability
(ps) judgments and PARs after each of six forecast advisories in a series of four different
hurricane scenarios. The presentation of results is followed by a discussion of their sig-
nificance and an examination of study limitations.
2 Literature review
Lindell and Perry (2012) proposed a revised version of the PADM that explains how people
decide how to respond in an emergency. The information flow in this model starts with
observations of environmental/social cues and receipt of information from social sources
Nat Hazards
123

such as authorities, news media, and peers (Arlikatti et al. 2007; Lin et al. 2014). The PADM
also proposes that—after being received, heeded, and comprehended—this information
produces perceptions of the stakeholders, threats, and protective actions. In turn, these
perceptions produce protective action decisions that, depending upon the effects of facili-
tating and inhibiting conditions, result in behaviors such as information seeking, protective
action, or emotion-focused coping. The role of information seeking is particularly important
when a threat is believed to be imminent but not immediate and potentially severe but
uncertain with respect to the location, severity, and timing of impact. Thus, decision makers
seek updated information and might engage in an increasing number of preparedness
activities as a storm approaches. Of particular interest for this study is an examination of the
effects of hurricane information on participants’ ps judgments and PARs.
To date, few experiments have examined hurricane threat perceptions or protective
action decisions. Christensen and Ruch (1980) studied 24 Galveston Island residents by
providing a series of forecast advisories that described the hurricane’s behavior at 6-h
intervals. Similar to NHC forecast advisories (see www.nhc.noaa.gov), each forecast
advisory provided information about the hurricane’s current location, track, forward
movement speed, and maximum wind speed. In response to each forecast advisory, par-
ticipants decided which protective action to take—ranging from wait for further infor-
mation (=1) to evacuate immediately (=10). The researchers found that participants’
protective actions escalated as the storm approached landfall.
Baker (1995) conducted a study of hurricane protective action decisions with 400 Pinellas
County, FL residents. He provided four threat cues (storm location, wind speed, hurricane
watch/warning, and local officials’ evacuation action) and hurricane strike probabilities
(ps = 50, 30, 10 %, or none). Consistent with survey study findings, he concluded that
participants’ evacuation expectations were strongly affected by local officials’ PARs.
Wu et al. (2014) conducted a study of ps judgments in which participants viewed eight
hurricane tracking maps (4 hurricane directions 9 2 intensities) plus one hurricane map
showing hurricane location only. As a between-subject manipulation, each group received a
different type of information display—forecast track only, uncertainty cone only, and fore-
cast track and uncertainty cone. Participants were asked to make ps judgments for the eight
cardinal and ordinal directions (north, northwest, …, northeast) from the center of each
hurricane, which resulted in ps distributions that were unimodal and centered on the direction
that the hurricane forecast track/uncertainty cone was pointed. Moreover, participants’ ps
judgments steadily decreased as the angle from the hurricane direction increased, and they
assigned nonzero ps values to the direction that was exactly opposite to forecast track/
uncertainty cone. Although the participants provided qualitatively appropriate ps distribu-
tions, the values of Rps over the eight sectors were consistently greater than 1.0—the nor-
matively appropriate value for a set of mutually exclusive and exhaustive categories.
Meyer et al. (2013) examined information search processes with their Stormview lab-
oratory that allows experiment participants to use a ‘‘virtual living room’’ to search for
information from simulated television, radio, newspaper, Internet, and peer channels as a
hurricane approaches. Consistent with Christensen and Ruch’s (1980) findings, Meyer and
his colleagues found that Stormview participants’ expectations of being struck by the
hurricane, levels of worry, and number of protective actions increased over time. However,
those who viewed uncertainty cones with track forecasts expected to take more protective
actions than those who saw only uncertainty cones, no matter how close they were to the
forecast point of landfall.
Finally, Wu et al. (2015) examined the information search patterns of university stu-
dents taking the roles of emergency managers determining which PARs to implement in
Nat Hazards
123

coastal counties. After reading the Local Official’s Guide to Making Hurricane Evacuation
Decisions1 (Lindell et al. 2008) to provide them with basic knowledge about hurricanes
and appropriate protective actions, participants were assigned to two different coastal
counties and participated in a process tracing study in which they could select which
numeric (hurricane parameter table), graphic (hurricane tracking map), and verbal (NHC
watches and warnings) display elements to view in each of six different forecast advisories
about four different hurricane scenarios. The study found that participants (1) had higher
click counts and click durations on the (verbal) NHC watch/warning message box than on
the numeric hurricane parameter table or the graphic hurricane tracking map. Within the
numeric hurricane parameter table, there were higher click counts and click durations on
hurricane intensity than on the other hurricane parameters as well as higher click counts
and click durations on the current day’s value and the 5-day forecast than on the other
forecast horizons. Moreover, within the graphic hurricane tracking map, they had higher
click counts for the forecast track than for the uncertainty cone but had higher click
durations for the uncertainty cone than for the forecast track and also had higher click
counts and click durations for the 5-day forecast than for the other forecast horizons.
In summary, previous experiments have shown that people are capable of using dif-
ferent types of information to make ps judgments in static decision tasks (Baker 1995; Wu
et al. 2012). In addition, people increase their protective actions as a hurricane approaches
(Christensen and Ruch 1980; Meyer et al. 2013). However, most of the experiments
collecting ps judgments have ignored PARs and vice versa. Moreover, most of these
studies have only examined the effects of a limited amount of hurricane information on
responses at a single coastal location.
The limitations of previous hurricane experiments can be addressed by a dynamic
hurricane tracking task—the procedure used by Wu et al. (2015) in which participants were
seated at workstations where they were provided with the basic information an emergency
manager would need to track an approaching hurricane and issue PARs. They began by
reading the Official’s Guide to ensure they had basic knowledge about hurricane evacu-
ation decisions and were provided with a risk area map that identified which portions of
their county were exposed to hurricane wind, storm surge, and inland flooding. At the time
the study was conducted, the state of Texas divided most coastal counties into five risk
areas, with Risk Area 1 being the area exposed to any hurricane that was Category 1 or
greater and Risk Area 5 being the area exposed only to a Category 5 hurricane. The
workstation also included an ETE table that displayed the time required to evacuate each of
the county’s risk areas. Participants were assigned to EOCs in two different counties to
ensure that their reactions to the hurricane scenarios were not determined by the unique
characteristics of a specific coastal location. Each participant viewed four hurricane sce-
narios, each of which was defined by six forecast advisories. At each forecast advisory,
participants could search tables of numerical hurricane parameters such as the storm’s
distance from possible points of landfall, its intensity, and its forward movement speed.
The parameter table provided information about the storm’s current status as well as at
forecast horizons ranging 1–5 days. Each forecast advisory also included a tracking map
that presented the storm’s current location, as well as its past track, forecast track, and
uncertainty cone over forecast horizons ranging 1–5 days. Finally, each forecast advisory
included a text box containing any NHC/WFO watches and warnings. Wu et al. (2015)
analyzed participants’ information search processes, but did not examine how participants
integrated the information they obtained into ps judgments for different cities around the
1 A copy of the Local Official’s Guide is available from the first author.
Nat Hazards
123

Gulf of Mexico or the PARs they would choose for their own county. These latter data are
addressed here.
3 Research hypotheses and research questions
This experiment employs two within-subject manipulations (multiple forecast advisories
and multiple hurricane scenarios) and two between-subject manipulations (multiple hur-
ricane sequences and different decision-maker locations). Multiple forecast advisories are
needed because hurricanes change characteristics such as their intensity over time. Con-
sequently, researchers need to understand how threat perceptions and PARs change as
hurricanes approach landfall. In addition, it is important to assess how threat perceptions
and PARs differ for a target city (the city toward which the storm is traveling), an adjacent
city (one of the two reference cities on either side of the target city—a ‘‘near miss’’), or a
remote city (any of the reference cities farther away than the adjacent cities—a ‘‘far miss’’).
Multiple hurricane scenarios are needed to verify that results are not limited to a single
set of storm conditions, a limitation of Christensen and Ruch (1980). Moreover, multiple
hurricane sequences are needed to detect order effects because research suggests that
anchoring and adjustment could cause participants’ responses to a near miss that was
preceded by a hit to differ from their responses to a near miss preceded by a ‘‘far miss’’
(Kahneman and Tversky 1979) and to avoid confounding the characteristics of individual
hurricanes with participants’ learning from their experience in successive hurricane sce-
narios. Participants need to be assigned to multiple target counties to preclude the possibility
that ps judgments and PARs are influenced by the specific characteristics of a given coastal
location. These experiment design features, together with the findings and limitations of
previous research, lead to five research hypotheses (RHs) and five research questions (RQs).
RH1 Participants’ ps judgments for target cities will start at a moderately high level and
increase over forecast advisories as each hurricane approaches landfall
RH2 Participants’ ps judgments for adjacent cities will start at a moderately high level
and decrease over forecast advisories as each hurricane approaches landfall
RH3 Participants’ ps judgments for remote cities will start at a low but nonzero level and
remain low over forecast advisories as each hurricane approaches landfall
The first three RHs test the generalizability of the findings from Wu et al. (2014), which
assessed ps values for different sectors around the Gulf of Mexico, but only at a single
point in time for hurricanes that were approximately 600 miles from landfall. Support for
RH 1–3 will indicate that participants’ risk perceptions change as a result of the infor-
mation they obtained in the information search phase of the experiment.
RH4 PARs will increase over forecast advisories as each hurricane approaches landfall,
but participants will implement more PARs when the projected landfall location is
their own county than when the projected landfall location is farther away
The first part of the RH4 tests the replicability of Christensen and Ruch’s (1980)
research findings, which only examined reactions to a single hurricane that was
approaching the participant’s location. The second part of RH4 tests whether participants
assign PARs in a different way when a hurricane is tracking elsewhere.
RH5 The number of PARs will be positively correlated with respondents’ ps judgments
for their counties
Nat Hazards
123

As noted earlier, previous hurricane experiments have assessed participants’ ps judg-
ments or their protective actions but not both. RH5 is a basic proposition of the PADM,
which hypothesizes that people’s protective action decisions are determined by their
perceived risk, has not previously been tested in any of the hurricane experiments con-
ducted to date.
RQ1 Will Rps B 1, since the six reference cities are not an exhaustive list of all possible
points of landfall even though they are mutually exclusive?
RQ1 tests the replicability of results from Wu et al. (2014), which found that—contrary
to the tenets of probability theory—Rps[ 1 for a set of mutually exclusive and exhaustive
sectors around the Gulf of Mexico.
RQ2 Will participants activate the local Emergency Operations Center (EOC) after the
first forecast advisory in each hurricane scenario?
RQ3 What percentage of participants will follow the instructions in the Official’s Guide
by evacuating the appropriate number of risk areas before the ETE deadline?
RQ2 and RQ3 examine whether participants follow two essential PAR principles listed
in the Official’s Guide. Activation of the EOC is important because it is the location from
which local officials monitor hurricanes and issue PARs. Evacuating the appropriate
number of risk areas before the ETE deadline provides reasonable assurance that local
residents will be protected from hurricane wind and storm surge.
RQ4 Will participants issue a different number of PARs after their last hurricane
scenario than after their first hurricane scenario?
RQ4 examines whether participants change their PAR judgment strategies over a series
of hurricane scenarios, just as Wu et al. (2015) found they changed their information search
strategies. It is unclear whether this will happen because they did not receive feedback
about whether they have made a decision error (e.g., failed to recommend an evacuation as
soon as they should or as extensively as they should).
RQ5 Will participants’ demographic characteristics—age, gender, permanent residence,
hurricane experience, or evacuation experience—account for differences in their
judgments of ps and PARs?
This RQ will examine whether demographic characteristics that have been found in
some previous studies to be correlated with risk perceptions or evacuation decisions in
actual evacuations influence in risk perceptions and protective action decisions in an
experiment.
4 Method
4.1 Experimental design
This experiment is a four-factor mixed design. Hurricane scenario has four levels, forecast
advisory has six levels, scenario sequence has four levels, and EOC location has two levels.
For the within-subject design, there were four different hurricane scenarios that varied in
their target (projected landfall location). The target for Hurricane A was Brownsville; the
target for Hurricane B was Port Arthur; the target for Hurricane C was a point just north of
Nat Hazards
123

Corpus Christi, which is roughly 300 mi. (500 km) southwest of Port Arthur; and the target
for Hurricane D was New Orleans, which is just over 250 mi (400 km) east of Port Arthur.
Each of the four hurricanes had six different forecast advisories that described the hurri-
cane traveling in a straight line progressively closer to the coast.
For the between-subject design, there were four different sequences in which the hur-
ricane scenarios were presented so as to control order effects (Sequence 1 = CADB;
Sequence 2 = ABCD; Sequence 3 = DCBA; and Sequence 4 = DBAC). In addition,
participants were randomly assigned to play the role of an Emergency Management
Coordinator in the EOC for either the Cameron County TX (Brownsville, the landfall for
Hurricane A) or Jefferson County TX (Port Arthur, the landfall for Hurricane B). All
hurricanes originated at points approximately 750 mi. (1200 km), which was 144 h. of
travel time from the US Gulf coast, and had approximately the same average forward
movement speed, radius of hurricane wind, and radius of tropical storm wind.
There were two sets of dependent variables (DVs) for this study. The first set of DVs
comprised the ps judgments for six reference cities located at roughly equal distances
(approximately 200–300 miles) around the Gulf of Mexico—Tampa, Apalachicola, New
Orleans, Beaumont/Port Arthur, Brownsville, and Tampico. Brownsville is the location of
the Cameron County EOC (to which one half of the participants were assigned), and
Beaumont/Port Arthur is the location of the Jefferson County EOC (to which the other half
of the participants were assigned). Participants were asked to provide ps judgments on a
scale of 0–100 % for each of the six reference cities.
The second set of the DVs consisted of 11 PARs that emergency managers commonly
issue in response to approaching hurricanes (see Lindell 2013). These PARs, which were
generally described in the Official’s Guide, are (1) activate the EOC, (2) activate the
emergency alert system (see http://en.wikipedia.org/wiki/Emergency_Alert_System), (3)
advise beach motel/hotel businesses of the potential storm, emergency evacuation may be
required, (4) recommend schools to close tomorrow, (5) recommend immediate activation
of public shelter (where people can stay while evacuating), (6) recommend immediate
evacuation of the following residents: people with special needs, people without trans-
portation, tourists, mobile homes, and recreational vehicles, (7) recommend immediate
evacuation Risk Area 1—the area at risk from a Category 1 hurricane, (8) recommend
immediate evacuation of Risk Area 2, (9) recommend immediate evacuation of Risk Area
3, (10) recommend immediate evacuation of Risk Area 4, and (11) recommend immediate
evacuation of Risk Area 5—the area at risk from a Category 5 hurricane. After each
forecast advisory, participants clicked a radio button indicating whether they would (=1) or
would not (=0) issue each of these PARs.
4.2 Procedure
This research was performed in a laboratory setting using 80 volunteers recruited from
Texas A&M University, each of whom was paid $20 for participating in the experiment. In
accordance with an approved IRB protocol, the experimenter posted recruiting flyers on
bulletin boards and personally distributed them on campus. The recruiting process con-
tinued until 80 participants successfully completed the experiment.2
2 After each participant finished the experiment, the experimenter checked to see whether she had finishedall the tasks properly. If not, the data were deleted and the same experimental condition was assigned to thenext available participant. In total, 98 participants took part in the experiment; 80 of them completed itsuccessfully.
Nat Hazards
123

Each participant was assigned to one of the eight (4 hurricane sequences 9 2 EOC
locations) between-subject conditions using a systematic random assignment method that
increased the probability of assignment to each condition in proportion to the number of
remaining slots in that condition. Before the participants began, the experimenter displayed
four documents in each participant’s workstation. These were (1) a sign identifying which
county EOC the participant represented; (2) a hurricane ETE table for that county from
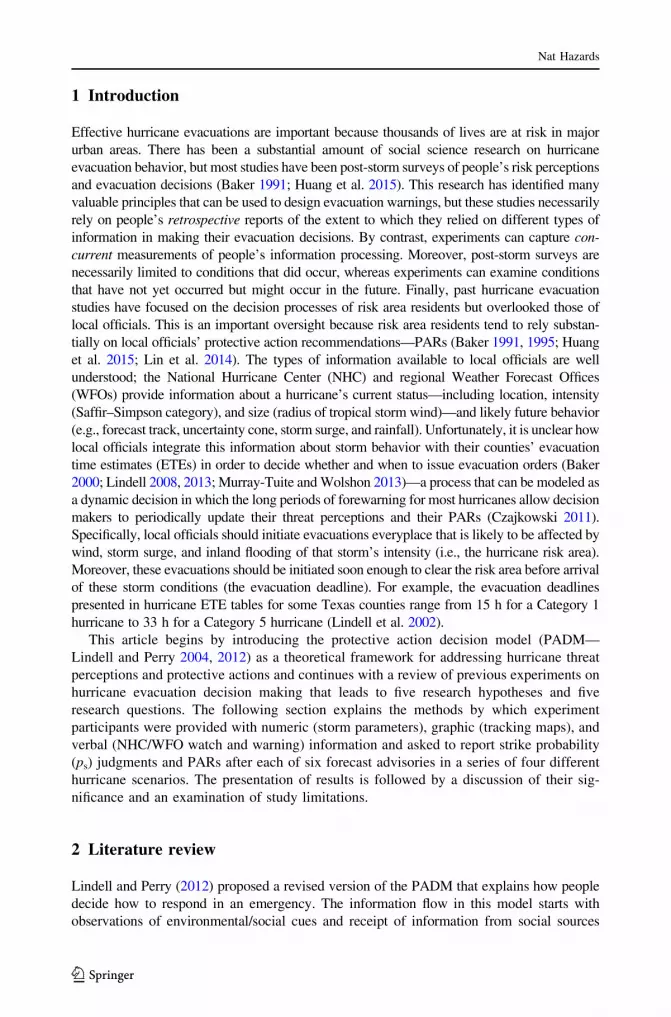
Lindell et al. (2002), (3) a hurricane risk area map for that county (see Fig. 1 for the
Cameron County map), and (4) a map showing all US counties bordering the Gulf of
Mexico. Half of the participants saw the display documents for the Cameron County EOC;
the other half of the participants saw the display documents for the Jefferson County EOC.
All participants saw the same Gulf of Mexico counties map. These documents were posted
on the walls of each workstation throughout the experiment. Once the participants were
seated, they were asked to read the 12 page Local Official’s Guide to Making Hurricane
Evacuation Decisions (Official’s Guide) and took the 43 item Hurricane Knowledge Test
(HKT) before the experiment (Lindell et al. 2008). Reading the Official’s Guide allowed
participants to acquire basic knowledge about hurricanes and appropriate PARs for coastal
counties; taking the HKT assessed their knowledge of the material in the Official’s Guide.
In particular, the Official’s Guide indicated that participants should ‘‘take a number of
actions such as activating the community Emergency Operations Center as soon as a
hurricane forms in the Gulf of Mexico or moves into it from the Atlantic Ocean or
Caribbean Sea.’’ In addition, they should recommend evacuation of the same number of
risk areas as a hurricane’s forecast intensity at landfall. That is, Risk Areas 1–4 should be
evacuated for a Category 4 hurricane.
After participants read the Official’s Guide and took the HKT, the experimenter gave
them a city classification sheet, which was used along with the hurricane risk area map in
Fig. 1 to identify the cities within their assigned counties. This task was intended to ensure
Fig. 1 Cameron County risk area map
Nat Hazards
123

that each participant was able to recognize their assigned county’s locations on the Dy-
naSearch hurricane tracking maps and to pay attention to the differences among their
county’s risk areas. After completing these preliminary tasks (Official’s Guide, HKT, and
city identification), participants began the hurricane tracking experiment using Dy-
naSearch, a program developed by the Texas A&M University Hazard Reduction and
Recovery Center in conjunction with Clemson University Savage Visualization Laboratory
(Lindell et al. in preparation).
When the participants first logged into the DynaSearch Program, they viewed a video
clip explaining how to operate the system. Next, DynaSearch presented the participants
with four different hurricanes scenarios, each of which had six forecast advisories. There
were slight variations from one forecast advisory to the next in order to simulate the
changing behavior of actual hurricanes. However, all four hurricane scenarios had the
same pattern of change in hurricane intensity over forecast advisories. Each forecast
advisory in this experiment represented a single day rather than the 6-h period that the
NHC forecast advisories represent. This 1-day time interval was used in order to move
the hurricane scenarios at a pace that seemed likely to maintain participants’ interest.
The first forecast advisory was 7 days before hurricane landfall, and the sixth forecast
advisory was 1 day before hurricane landfall. Each hurricane forecast advisory provided
the hurricane’s current information as well as the forecast information for the following
5 days. DynaSearch displayed a hurricane parameter table, a hurricane tracking map, and
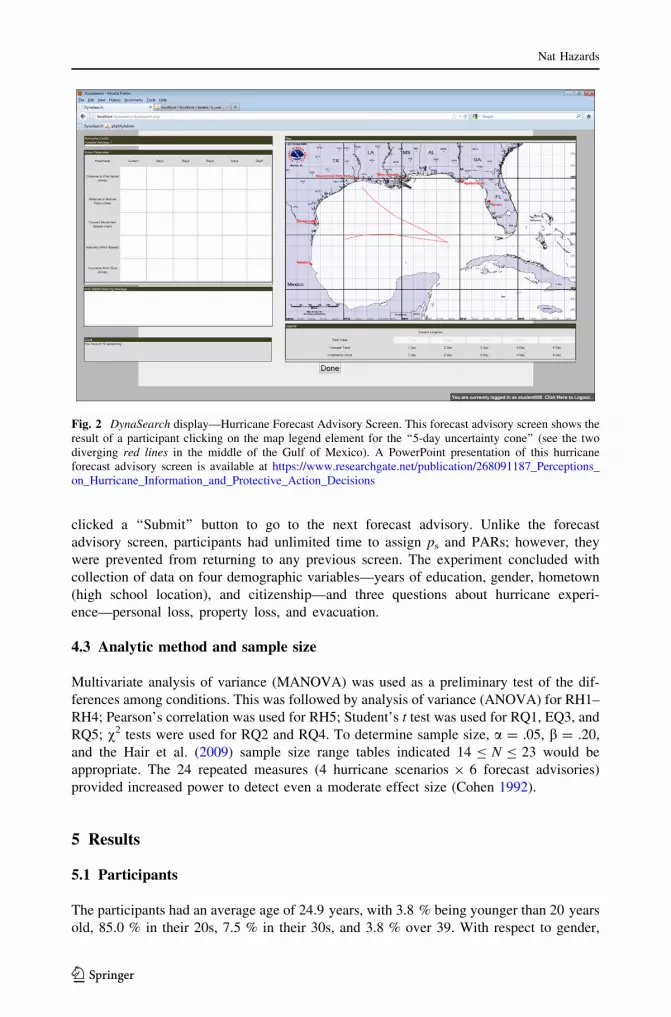
an NHC watch/warning message box on a single forecast advisory screen (Fig. 2). The
parameter table provided information about hurricane distance to Port Isabel (the nearest
point on the coast to the Cameron County EOC), hurricane distance to Sabine Pass (the
nearest point on the coast to the Jefferson County EOC), hurricane forward movement
speed (changes ranged from 1.24 to 8.33 mph), hurricane intensity (intensities were
tropical storm, Category 2 hurricane, Category 5 hurricane, Category 4 hurricane, Cat-
egory 3 hurricane, and finally tropical depression), and hurricane wind size (changes
ranged 0–180 mile radius). The changes in hurricane parameters other than center
location were adapted from Hurricane Katrina (see www.nhc.noaa.gov/archive/2005/
KATRINA.shtml?). The hurricane tracking map showed a hurricanes’ current location,
past track, forecast track, and uncertainty cone. Finally, the text message box showed
hurricane watch/warning messages for counties.3 This interactive hurricane forecast
advisory screen was adapted from the typical text and graphic hurricane information
typically provided by the NHC (2014). Unlike NHC forecast advisories, the DynaSearch
forecast advisories provided a limited amount of information in a single screen. Par-
ticipants clicked on a blank cell in the table or on the text messages box to reveal the
hidden information. Similarly, they click on the map legend elements to see the map
features. Participants had as long as 5 min to view the information on each forecast
advisory screen, although they could proceed to the next screen when they were finished
with their information search. Next, DynaSearch elicited participants’ ps judgments for
six locations around the Gulf of Mexico and their choices of as many as 11 PARs for the
county to which they were assigned. The participants used the keyboard to type in ps
judgment for each city, scrolled down the screen to click on their PAR choices, and
3 The following is an example of warning/watch warning messages provided to experiment participants.This is modified from NHC’s official hurricane warning/watch messages—‘‘A HURRICANE WATCH IS INEFFECT FROM CAMERON COUNTY, TX TO OKALOOSA COUNTY, AL. A HURRICANE WATCHMEANS THAT HURRICANE CONDITIONS ARE POSSIBLE WITHIN THE WATCH AREA GENERALLYWITHIN 36 HOURS.’’
Nat Hazards
123
clicked a ‘‘Submit’’ button to go to the next forecast advisory. Unlike the forecast
advisory screen, participants had unlimited time to assign ps and PARs; however, they
were prevented from returning to any previous screen. The experiment concluded with
collection of data on four demographic variables—years of education, gender, hometown
(high school location), and citizenship—and three questions about hurricane experi-
ence—personal loss, property loss, and evacuation.
4.3 Analytic method and sample size
Multivariate analysis of variance (MANOVA) was used as a preliminary test of the dif-
ferences among conditions. This was followed by analysis of variance (ANOVA) for RH1–
RH4; Pearson’s correlation was used for RH5; Student’s t test was used for RQ1, EQ3, and
RQ5; v2 tests were used for RQ2 and RQ4. To determine sample size, a = .05, b = .20,
and the Hair et al. (2009) sample size range tables indicated 14 B N B 23 would be
appropriate. The 24 repeated measures (4 hurricane scenarios 9 6 forecast advisories)
provided increased power to detect even a moderate effect size (Cohen 1992).
5 Results
5.1 Participants
The participants had an average age of 24.9 years, with 3.8 % being younger than 20 years
old, 85.0 % in their 20s, 7.5 % in their 30s, and 3.8 % over 39. With respect to gender,
Fig. 2 DynaSearch display—Hurricane Forecast Advisory Screen. This forecast advisory screen shows theresult of a participant clicking on the map legend element for the ‘‘5-day uncertainty cone’’ (see the twodiverging red lines in the middle of the Gulf of Mexico). A PowerPoint presentation of this hurricaneforecast advisory screen is available at https://www.researchgate.net/publication/268091187_Perceptions_on_Hurricane_Information_and_Protective_Action_Decisions
Nat Hazards
123

48.8 % were male and 51.3 % were female. They were highly educated—2.5 % freshmen,
5.0 % sophomores, 8.8 % juniors, 22.5 % seniors, and 56.3 % graduate students (5.0 %
did not respond to this item). With respect to citizenship, 45.0 % were international stu-
dents and 55.0 % were US citizens (none of them from Cameron County or Jefferson
County). Only 25.0 % had hurricane evacuation experience, 10.0 % reported personal
injury, and 23.8 % reported property damage.
5.2 Research hypotheses
Consistent with RH1 (strike probability judgments for target cities will increase over
forecast advisories as each hurricane approaches landfall), the ps judgments for each
target city (the ones at which the hurricanes made landfall) increased significantly over
forecast advisories for Hurricanes A (Brownsville, Fig. 3, F5, 395 = 26.95, p\ .01), B
(Port Arthur, Fig. 4, F5, 395 = 14.69, p\ .01), and D (New Orleans, Fig. 5,
F5, 395 = 47.15, p\ .01).
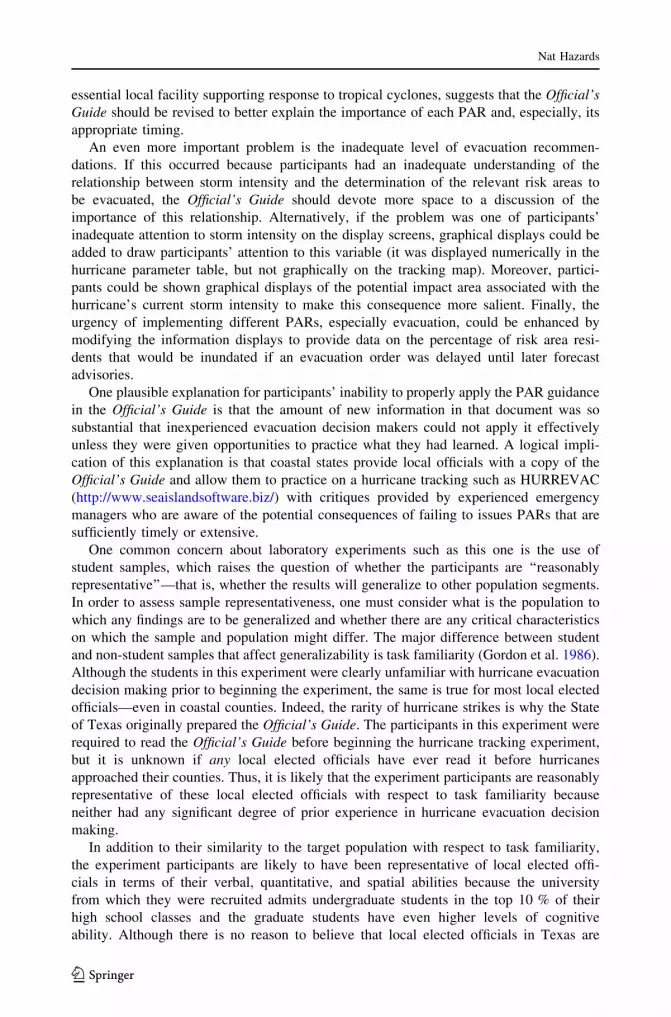
Consistent with RH2 (strike probability judgments for adjacent cities will decrease
over forecast advisories as each hurricane approaches landfall), the ps for the adjacent
cities (those on either side of the target city) generally decreased over time, especially
for Hurricane A/Brownsville. In Fig. 4 (Hurricane B/Port Arthur), the mean ps for New
Orleans did not decline until FA6. Conversely, Fig. 5 (Hurricane D/New Orleans) shows
that the mean ps for Port Arthur did not decline at all. The target city for Hurricane C
was Corpus Christi (Fig. 6), which was not a city to which the participants could assign
strike probabilities, but the ps for the adjacent cities (Brownsville and Port Arthur) both
declined over the six forecast advisories—although the participants did provide signif-
icantly (F1, 79 = 78.56, p\ .05) higher ps for Brownsville than Port Arthur during FA2–
FA6.
Consistent with RH3 (strike probability judgments for remote cities will be small but
nonzero and remain low over forecast advisories as each hurricane approaches landfall),
participants assigned small but nonzero strike probabilities to remote cities (cities farther
away from the target city than the adjacent cities). For example, in Hurricane
A/Brownsville (Fig. 3), the mean ps for Tampa, Apalachicola, and New Orleans (the
remote cities for this hurricane scenario) was lower than the mean ps for Port Arthur and
0
0.2
0.4
0.6
0.8
1
FA1 FA2 FA3 FA4 FA5 FA6
Tampa, FLApalachicola, FLNew Orleans, LAPort Arthur, TXBrownsville, TXTampico, Mexico
p sju
dgm
ent
Target city
Adjacent cities
Remote cities
Fig. 3 Mean ps for hurricane A (Brownsville)
Nat Hazards
123

0
0.2
0.4
0.6
0.8
1
FA1 FA2 FA3 FA4 FA5 FA6
Tampa, FLApalachicola, FLNew Orleans, LAPort Arthur, TXBrownsville, TXTampico, Mexico
Target city
Adjacent cities
Remote cities
Fig. 4 Mean ps for hurricane B (Port Arthur)
0
0.2
0.4
0.6
0.8
1
FA1 FA2 FA3 FA4 FA5 FA6
Tampa, FLApalachicola, FLNew Orleans, LAPort Arthur, TXBrownsville, TXTampico, Mexico
Target city
Adjacent cities
Remote cities
Fig. 5 Mean ps for hurricane D (New Orleans)
0
0.2
0.4
0.6
0.8
1
FA1 FA2 FA3 FA4 FA5 FA6
Tampa, FLApalachicola, FLNew Orleans, LAPort Arthur,, TXBrownsville, TXTampico, Mexico
Adjacent cities
Remote cities
Fig. 6 Mean ps for hurricane C (Corpus Christi)
Nat Hazards
123
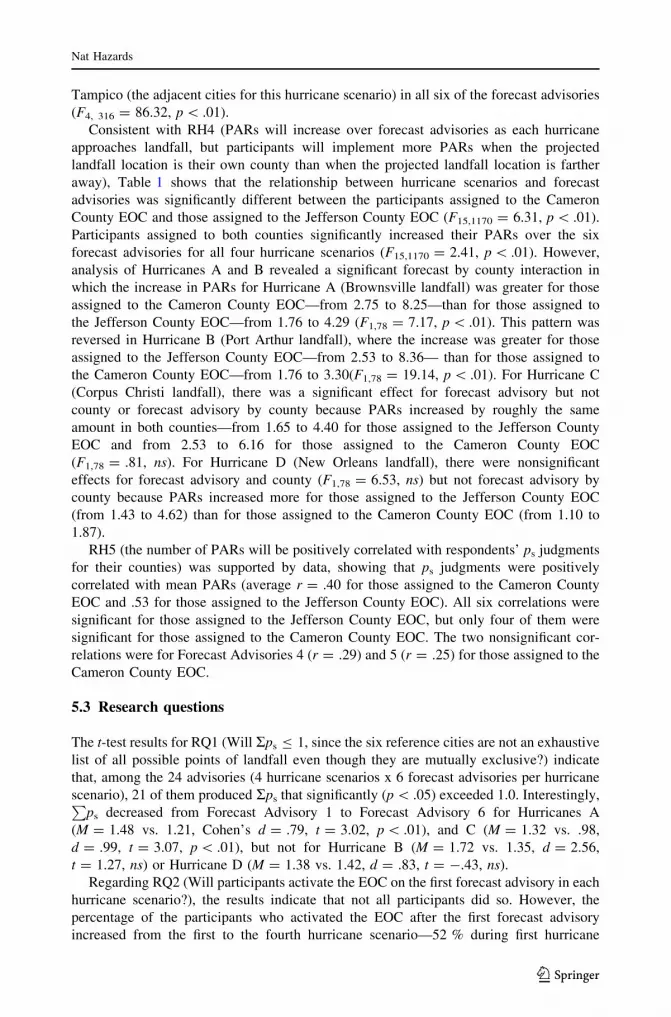
Tampico (the adjacent cities for this hurricane scenario) in all six of the forecast advisories
(F4, 316 = 86.32, p\ .01).
Consistent with RH4 (PARs will increase over forecast advisories as each hurricane
approaches landfall, but participants will implement more PARs when the projected
landfall location is their own county than when the projected landfall location is farther
away), Table 1 shows that the relationship between hurricane scenarios and forecast
advisories was significantly different between the participants assigned to the Cameron
County EOC and those assigned to the Jefferson County EOC (F15,1170 = 6.31, p\ .01).
Participants assigned to both counties significantly increased their PARs over the six
forecast advisories for all four hurricane scenarios (F15,1170 = 2.41, p\ .01). However,
analysis of Hurricanes A and B revealed a significant forecast by county interaction in
which the increase in PARs for Hurricane A (Brownsville landfall) was greater for those
assigned to the Cameron County EOC—from 2.75 to 8.25—than for those assigned to
the Jefferson County EOC—from 1.76 to 4.29 (F1,78 = 7.17, p\ .01). This pattern was
reversed in Hurricane B (Port Arthur landfall), where the increase was greater for those
assigned to the Jefferson County EOC—from 2.53 to 8.36— than for those assigned to
the Cameron County EOC—from 1.76 to 3.30(F1,78 = 19.14, p\ .01). For Hurricane C
(Corpus Christi landfall), there was a significant effect for forecast advisory but not
county or forecast advisory by county because PARs increased by roughly the same
amount in both counties—from 1.65 to 4.40 for those assigned to the Jefferson County
EOC and from 2.53 to 6.16 for those assigned to the Cameron County EOC
(F1,78 = .81, ns). For Hurricane D (New Orleans landfall), there were nonsignificant
effects for forecast advisory and county (F1,78 = 6.53, ns) but not forecast advisory by
county because PARs increased more for those assigned to the Jefferson County EOC
(from 1.43 to 4.62) than for those assigned to the Cameron County EOC (from 1.10 to
1.87).
RH5 (the number of PARs will be positively correlated with respondents’ ps judgments
for their counties) was supported by data, showing that ps judgments were positively
correlated with mean PARs (average r = .40 for those assigned to the Cameron County
EOC and .53 for those assigned to the Jefferson County EOC). All six correlations were
significant for those assigned to the Jefferson County EOC, but only four of them were
significant for those assigned to the Cameron County EOC. The two nonsignificant cor-
relations were for Forecast Advisories 4 (r = .29) and 5 (r = .25) for those assigned to the
Cameron County EOC.
5.3 Research questions
The t-test results for RQ1 (Will Rps B 1, since the six reference cities are not an exhaustive
list of all possible points of landfall even though they are mutually exclusive?) indicate
that, among the 24 advisories (4 hurricane scenarios x 6 forecast advisories per hurricane
scenario), 21 of them produced Rps that significantly (p\ .05) exceeded 1.0. Interestingly,Pps decreased from Forecast Advisory 1 to Forecast Advisory 6 for Hurricanes A
(M = 1.48 vs. 1.21, Cohen’s d = .79, t = 3.02, p\ .01), and C (M = 1.32 vs. .98,
d = .99, t = 3.07, p\ .01), but not for Hurricane B (M = 1.72 vs. 1.35, d = 2.56,
t = 1.27, ns) or Hurricane D (M = 1.38 vs. 1.42, d = .83, t = -.43, ns).
Regarding RQ2 (Will participants activate the EOC on the first forecast advisory in each
hurricane scenario?), the results indicate that not all participants did so. However, the
percentage of the participants who activated the EOC after the first forecast advisory
increased from the first to the fourth hurricane scenario—52 % during first hurricane
Nat Hazards
123

Table
1M
ean
PA
Rs
by
Fore
cast
Advis
ory
,hurr
ican
e,an
dE
OC
loca
tion
Fo
reca
stad
vis
ory
Hu
rric
ane
A(B
row
nsv
ille
)H
urr
ican
eB
(Po
rtA
rth
ur)
Hu
rric
ane
C(C
orp
us
Ch
rist
i)H
urr
ican
eD
(New
Orl
ean
s)
Cam
eron
EO
CJe
ffer
son
EO
CC
amer
on
EO
CJe
ffer
son
EO
CC
amer
on
EO
CJe
ffer
son
EO
CC
amer
on
EO
CJe
ffer
son
EO
C
FA
12
.75
1.7
61
.76
2.5
32
.53
1.6
51
.10
1.4
3
FA
24
.40
1.3
21
.32
4.0
73
.19
2.2
01
.10
1.9
8
FA
35
.72
2.0
92
.86
4.6
24
.29
2.7
51
.65
3.1
9
FA
46
.82
2.6
43
.30
5.6
15
.06
3.0
81
.76
3.6
3
FA
57
.70
4.0
73
.30
8.0
36
.05
4.6
21
.87
4.4
0
FA
68
.25
4.2
93
.30
8.3
66
.16
4.4
01
.87
4.6
2
Cam
ero
nC
ou
nty
isth
ela
nd
fall
for
Hu
rric
ane
A(B
row
nsv
ille
);Je
ffer
son
Cou
nty
isth
ela
nd
fall
for
Hu
rric
ane
B(P
ort
Art
hur)
Nat Hazards
123

scenario; 65 % in the second hurricane scenario; 72 % in third hurricane scenario; and
76 % in the fourth hurricane scenario. These differences are statistically significant (v2
(3) = 11.84, p\ .01).
In addressing RQ3 (What percentage of participants will evacuate the appropriate
number of risk areas—e.g., Risk Areas 1–4 for a CAT 4 hurricane—before the evac-
uation time estimate deadline—i.e., at least 32 h before storm arrival for both coun-
ties?), Table 2 indicates participants’ evacuation recommendations were far below the
standard described in the Official’s Guide. Specifically, only 50 % of participants
assigned to the Jefferson County EOC recommended evacuation of Risk Areas 1–4 in
Hurricane B (Port Arthur landfall) and only 33 % of participants assigned to the
Cameron County EOC did so for Hurricane A (Brownsville landfall) even though both
were Category 4 hurricanes so the percentages should have been 100 %. For those
assigned to the Cameron County EOC in Hurricane A, the percentages of participants
who recommend evacuation are significantly higher in Risk Areas 1, 2, and 3 than in
Risk Area 4—v2(4) = 31.48, p\ .01. However, there were no significant differences in
the corresponding test for those assigned to the Jefferson County EOC in Hurricane B—
v2(4) = 4.50, ns.
Regarding RQ4 (Will participants issue a different number of PARs after their fourth
hurricane scenario than after their first hurricane scenario?), there were no significant
differences. Participants chose 5.34 PARs after the first hurricane scenario and 4.69 after
the fourth hurricane scenario (t79 = .97, ns).
In regard to RQ5 (Will participants’ demographic characteristics—age, gender, per-
manent residence, hurricane experience, or evacuation experience—account for differences
in their judgments of ps and PARs?), international students tended to assign higher ps to
Port Arthur (M = .47 vs. .39, d = .42, t = 1.99, p\ .05) and Brownsville (M = .44 vs.
.37, d = .44, t = 2.07, p\ .05) and also recommended more PARs (M = 4.17 vs. 3.06,
d = .44, t = 2.90, p\ .01). Participants who had hurricane evacuation experience tended
to assign higher ps to all six cities, four of them significantly so—Apalachicola (M = .12
vs. .06, d = .75, t = 2.84, p\ .01), Port Arthur (M = .51 vs. .41, d = .53, t = 2.07,
p\ .05), Brownsville (M = .48 vs. .39, d = .56, t = 2.42, p\ .05), and Tampico
(M = .18 vs. .09, d = .75, t = 2.33, p\ .05), but had no significant differences in the
number of PARs.
Table 2 Percentage of participants who recommend evacuation for each risk area after viewing ForecastAdvisory 5
Hurricane A Brownsville,(Cameron County) landfall (%)
Hurricane B Port Arthur,(Jefferson County) landfall (%)
Risk area
RA1 77.5 65.0
RA2 70.0 65.0
RA3 55.0 60.0
RA4 32.5 50.0
RA5 27.5 47.5
Nat Hazards
123

6 Discussion
This study shows that participants had reasonably adequate but not highly proficient mental
models (Wood et al. 2012) of the hurricane evacuation decision task. These mental models
promoted qualitatively, but not necessarily quantitatively, appropriate ps judgments.
Specifically, all four hurricanes revealed a forecast advisory by city interaction in which ps
judgments started moderately high and increased over forecast advisory for target cities. In
addition, ps judgments started moderately high and then decreased for adjacent cities in
Hurricane A, but not B, C, and D. The ps judgments began low and remained low for
remote cities in all hurricanes. These results are consistent with those of Wu et al. (2014) in
showing that, at each forecast advisory, ps judgments declined with increasing distance
from the projected point of landfall. These results also are consistent with those of Meyer
et al. (2013) in revealing that ps judgments increased as each hurricane approached its
target city. These results extend those of previous studies because, unlike the Meyer et al.
(2013) and Wu et al. (2014) studies, the participants in the present study could choose
whether to view the forecast track or the uncertainty cone (or both) as an indicator of each
hurricane’s direction.
Overall, the present study is consistent with others’ (Meyer et al. 2013; Wu et al. 2014)
in suggesting that participants might be extracting little information from the uncertainty
cone other than its direction (i.e., the same information as provided by the forecast track)
because the Official’s Guide explained that there was uncertainty in track forecasts (if they
did not already know this). Consequently, it is possible that participants used a distance-
decay heuristic that generates a perceived risk gradient (Lindell and Earle 1983) in which
ps judgments decrease with distance from the expected landfall location—but do not reach
zero. Although a distance-decay heuristic would cause the ps distributions to have
appropriate shapes, it would not necessarily cause participants’ ps judgments to be ade-
quately calibrated—that is, to correspond exactly to the ps distributions that the National
Hurricane Center would post in forecast advisories based upon its meteorological models.
Thus, people who observe forecast tracks or uncertainty cones on TV might still under-
estimate their probability of being struck even though they recognize that they might be
struck.
Interestingly, the present study provided mixed support for border bias—distortions in
probabilities due to people considering ‘‘locations within a state to be part of the same
superordinate category, but … locations in two different states to be parts of different
superordinate categories’’ (Mishra and Mishra 2010, p. 1582). For example, Fig. 3 shows
that Tampico and Port Arthur had almost identical ps plots—suggesting that Port Arthur’s
location in the same state offset its significantly greater distance (351 mi/565 km) from
Brownsville than Tampico’s (255 mi/410 km). However, Fig. 4 shows that New Orleans’
location in a different state than Port Arthur failed to offset its much closer proximity (231
mi/372 km) to Port Arthur than Brownsville’s (351 mi/565 km).
In addition, the results confirmed that people have difficulty producing responses
consistent with one of the basic principles of probability theory because Rps[ 1.0 for the
six coastal cities (a mutually exclusive but non-exhaustive set). This is consistent with
previous findings by Wu et al. (2014), as well as by Wright and Whalley (1983), Fox and
Tversky (1998), and Tversky and Koehler (1994). As Wu and his colleagues noted, the
simplest explanation for Rps[ 1.0 is that participants had a basic understanding of
probabilities—all .0 B ps B 1.0—but working memory limitations prevented them from
Nat Hazards
123

adjusting the numbers for the six reference cities to be consistent with the summation
property of probabilities. Since the participants treated ps judgments like a set of six rating
scales, which do not have a summation property, it is important to continue to examine the
ways in which people interpret probabilities that others communicate to them as well as the
ways in which they use probabilities to express their uncertainty about different possible
events.
Participants’ ps judgments evidently had an effect on their PARs because the two types
of variables were significantly, and moderately highly, correlated with each other. This
result is consistent with the results of Meyer et al. (2013), who reported r = .64 between ps
judgments and the number of household evacuation preparation actions before hurricane
landfall. Accordingly, PARs in the present study increased over forecast advisories—just
as in Christensen and Ruch (1980). Moreover, participants issued more PARs when their
county contained the target city than when it did not. In broad terms, these results indicate
that participants issued appropriate PARs, but there were some notable deficiencies
because they failed to order suitably extensive evacuations. Specifically, the Official’s
Guide (Lindell et al. 2008, p. 4) stated
each Risk Area comprises the portion of a county that is expected to be affected by
the corresponding hurricane category (see Fig. 2). That is, Risk Area 1 is the area
expected to be affected by hurricane Category 1 (74–95 miles per hour winds), Risk
Area 2 is the area expected to be affected by hurricane Category 2 (96–110 miles per
hour winds), and so on.
Consequently, because all scenarios indicated that the storm was a Category 4 hurricane,
participants should have recommended evacuation of Risk Areas 1–4. However, as
indicated in Table 2, only 33 % of the participants assigned to the Cameron County EOC
and 50 % of those assigned to the Jefferson County EOC recommended evacuation for
Risk Area 4 at least 36 h before the arrival of Tropical Storm force wind. This is somewhat
surprising because the Official’s Guide explained the concept of ETEs and each county’s
ETE table was posted on the wall of the participant’s workstation. Even more troubling is
the fact that 22 % (of those assigned to the Cameron County EOC) to 35 % (of those
assigned to the Jefferson County EOC) of the participants failed to even issue an
evacuation recommendation for Risk Area 1 at this time—even though the Official’s Guide
was available to the participants throughout the entire experiment. This result, together
with the tardy activation of the EOC (only 76 % activated this facility on the first forecast
advisory of the fourth hurricane scenario), indicates that—although participants drew
reasonable inferences about ps—neither their preexisting mental models nor the
information they gleaned from the Official’s Guide led them to draw all of the appropriate
implications for responding to the hurricane threat. This finding does not appear to be an
artifact of the laboratory setting because some local officials failed to issue timely
evacuation orders in Hurricanes Katrina (Knabb et al. 2005) and Ike (Berg 2009).
The difference between the results for the ps judgments, which suggested that partici-
pants understood the risk to their counties, and the results for PARs, which failed to initiate
actions that were sufficiently timely and extensive, is a very important finding that is
consistent with the PADM’s emphasis on the distinction between these two concepts
(Lindell and Perry 2004, 2012). In turn, this finding suggests that one of a number of
corrective actions might be necessary. The fact that many participants failed to activate the
EOC as soon as they received the first forecast advisory, despite the fact that an EOC is the
Nat Hazards
123
essential local facility supporting response to tropical cyclones, suggests that the Official’s
Guide should be revised to better explain the importance of each PAR and, especially, its
appropriate timing.
An even more important problem is the inadequate level of evacuation recommen-
dations. If this occurred because participants had an inadequate understanding of the
relationship between storm intensity and the determination of the relevant risk areas to
be evacuated, the Official’s Guide should devote more space to a discussion of the
importance of this relationship. Alternatively, if the problem was one of participants’
inadequate attention to storm intensity on the display screens, graphical displays could be
added to draw participants’ attention to this variable (it was displayed numerically in the
hurricane parameter table, but not graphically on the tracking map). Moreover, partici-
pants could be shown graphical displays of the potential impact area associated with the
hurricane’s current storm intensity to make this consequence more salient. Finally, the
urgency of implementing different PARs, especially evacuation, could be enhanced by
modifying the information displays to provide data on the percentage of risk area resi-
dents that would be inundated if an evacuation order was delayed until later forecast
advisories.
One plausible explanation for participants’ inability to properly apply the PAR guidance
in the Official’s Guide is that the amount of new information in that document was so
substantial that inexperienced evacuation decision makers could not apply it effectively
unless they were given opportunities to practice what they had learned. A logical impli-
cation of this explanation is that coastal states provide local officials with a copy of the
Official’s Guide and allow them to practice on a hurricane tracking such as HURREVAC
(http://www.seaislandsoftware.biz/) with critiques provided by experienced emergency
managers who are aware of the potential consequences of failing to issues PARs that are
sufficiently timely or extensive.
One common concern about laboratory experiments such as this one is the use of
student samples, which raises the question of whether the participants are ‘‘reasonably
representative’’—that is, whether the results will generalize to other population segments.
In order to assess sample representativeness, one must consider what is the population to
which any findings are to be generalized and whether there are any critical characteristics
on which the sample and population might differ. The major difference between student
and non-student samples that affect generalizability is task familiarity (Gordon et al. 1986).
Although the students in this experiment were clearly unfamiliar with hurricane evacuation
decision making prior to beginning the experiment, the same is true for most local elected
officials—even in coastal counties. Indeed, the rarity of hurricane strikes is why the State
of Texas originally prepared the Official’s Guide. The participants in this experiment were
required to read the Official’s Guide before beginning the hurricane tracking experiment,
but it is unknown if any local elected officials have ever read it before hurricanes
approached their counties. Thus, it is likely that the experiment participants are reasonably
representative of these local elected officials with respect to task familiarity because
neither had any significant degree of prior experience in hurricane evacuation decision
making.
In addition to their similarity to the target population with respect to task familiarity,
the experiment participants are likely to have been representative of local elected offi-
cials in terms of their verbal, quantitative, and spatial abilities because the university
from which they were recruited admits undergraduate students in the top 10 % of their
high school classes and the graduate students have even higher levels of cognitive
ability. Although there is no reason to believe that local elected officials in Texas are
Nat Hazards
123

substantially above this level of intellectual ability, it is also unlikely that they are
significantly below it either. Even if there were differences in intellectual ability, there
appears to be no evidence that this would make a difference in the processing of the
probability information that is a central part of this experiment. Specifically, the Viss-
chers et al.’s (2009) review of probability information in risk communication examined
studies based upon a variety of different types of samples and observed only that stu-
dents ‘‘may have higher numeracy skills than the general public’’ (pp. 283–284, our
emphasis). Moreover, a wide range of research suggests that findings from laboratory
experiments on judgment and decision making generalize over a wide range of samples
(see Baron 2008; Kunreuther et al. 2013; Lindell 2014; Yates 1990). In summary, the
available evidence indicates that it is reasonable to generalize from this student sample to
other population groups that have similar levels of task familiarity and intellectual
ability.
The generalizability of results from student sample to other population segments is
further strengthened by the fact that, even though Dash and Gladwin (2007) suggested
that a variety of demographic characteristics (e.g., age, gender, education) might have an
effect on household evacuation decision making, the more recent Huang et al. (2015)
statistical meta-analysis found that few demographic characteristics had reliable effects
across studies. That conclusion is consistent with the findings of Meyer et al. (2013), who
reported that demographic characteristics had only an average r = .02 with ps judgments
and an average r = .01 with the number of evacuation preparation actions. In the present
study, only evacuation experience and citizenship were related to ps and PAR judgments
and even those variables had small correlations. Thus, the available evidence suggests
that this study sample’s differences in demographic characteristics from the ultimate
target populations (coastal elected officials) are unlikely to impair the generalizability of
the findings.
Nonetheless, future researchers will be able to obtain data on hurricane information
search, threat perception, and protective action from more diverse samples by using a new
version of DynaSearch that can collect experiment data over the Internet. This new version
of DynaSearch will also allow researchers to use more complex hurricane scenarios.
Specifically, the present study only presented hurricanes having straight-line tracks and
relatively constant intensity, size, and forward movement speed. Future studies should
examine the effects of recurved and stalled tracks, as well as substantial changes in other
hurricane parameters. Ultimately, a systematic program of research on hurricane tracking
and protective action decision making could lead to the development of better training
materials and improved tracking displays that will allow emergency managers, local
elected officials, and coastal residents to make more informed decisions about whether and
when to evacuate from approaching hurricanes.
Appendix
See Figs. 7, 8, 9, 10, 11, 12, and 13, and Tables 3 and 4.
Nat Hazards
123
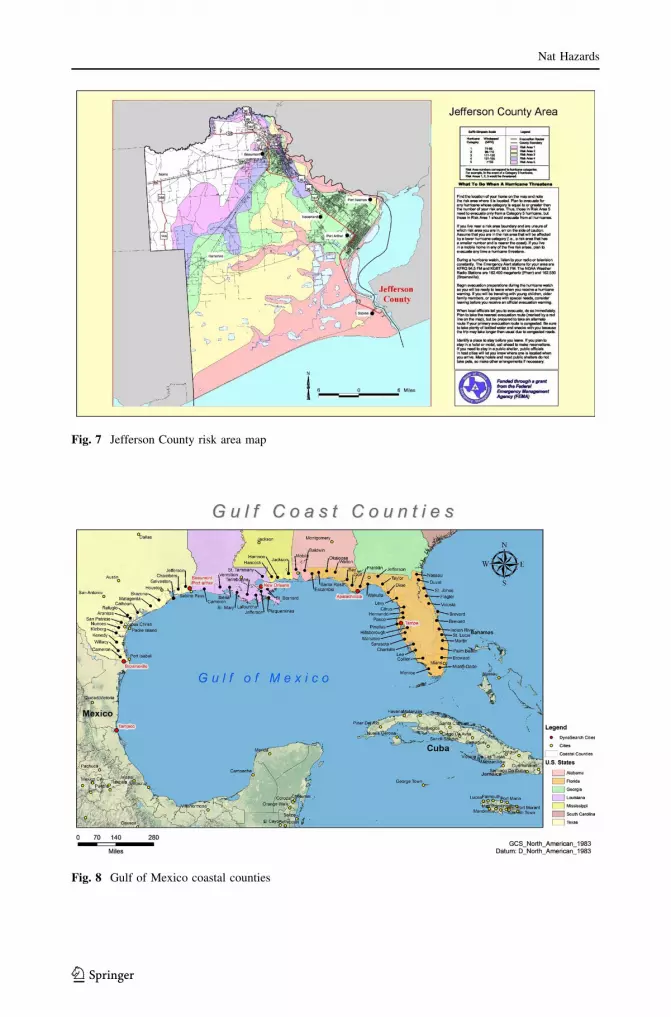
Fig. 8 Gulf of Mexico coastal counties
Fig. 7 Jefferson County risk area map
Nat Hazards
123
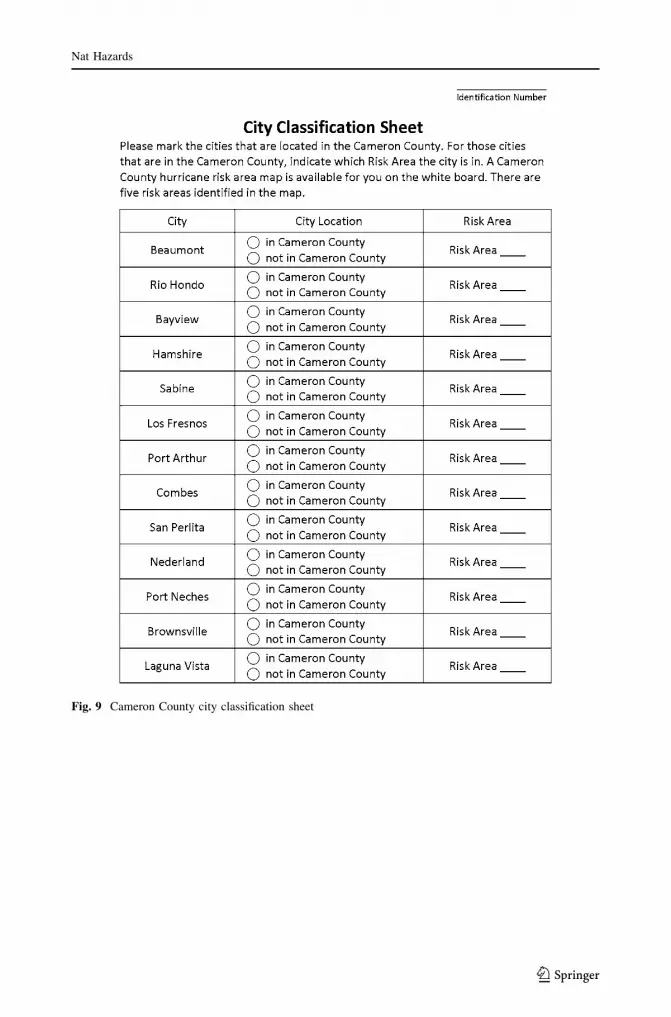
Fig. 9 Cameron County city classification sheet
Nat Hazards
123

Fig. 10 Jefferson County city classification sheet
Nat Hazards
123
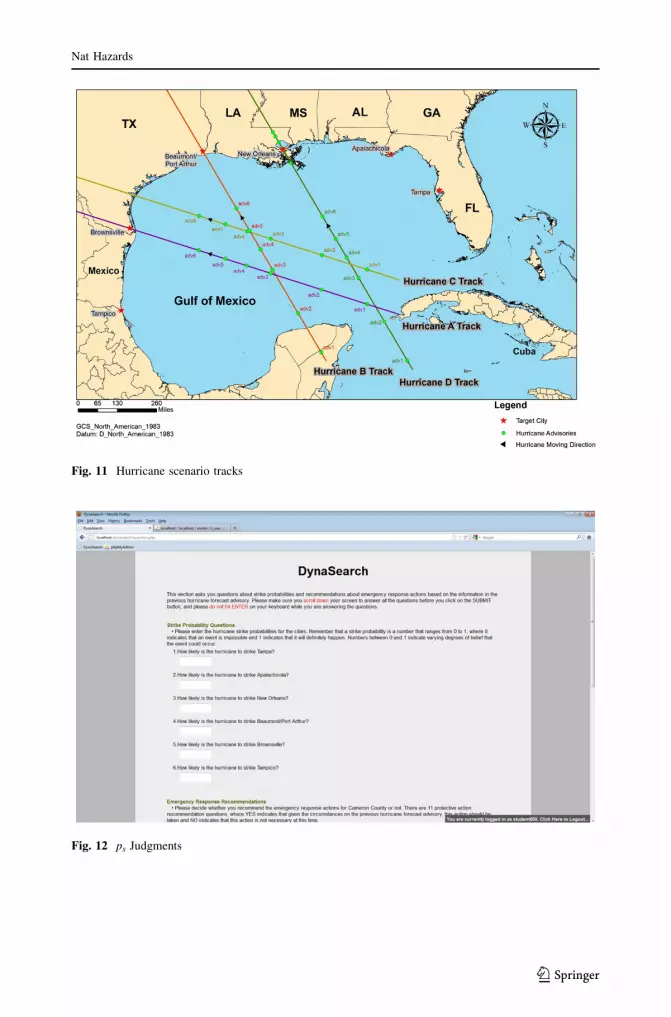
Fig. 11 Hurricane scenario tracks
Fig. 12 ps Judgments
Nat Hazards
123

References
Arlikatti S, Lindell MK, Prater CS (2007) Perceived stakeholder role relationships and adoption of seismichazard adjustments. Int J Mass Emerg Disasters 25:218–256
Baker EJ (1991) Hurricane evacuation behavior. Int J Mass Emerg Disasters 9:287–301Baker EJ (1995) Public response to hurricane probability forecasts. Prof Geogr 47(2):137–147Baker EJ (2000) Hurricane evacuation in the United States. In: Pielke R (ed) Storms, vol 1. Routledge, New
York, pp 306–319Baron J (2008) Thinking and deciding, 4th edn. Cambridge University Press, New YorkBerg R. (2009) NHC (National Hurricane Center, Miami, FL). Tropical cyclone report—Hurricane Ike.
Final report 23 Jan. 2009-18 Mar. 2014. Miami: Florida International University (FL): 2011. ReportNo.: TCR-AL092008, p 55
Christensen L, Ruch CE (1980) The effect of social influence on response to hurricane warnings. Disasters4:205–210
Cohen J (1992) A power primer. Psychol Bull 112(1):155–159
Fig. 13 PAR selection screen
Table 3 Cameron County evacuation time estimates
Saffir–Simpson category Category 1 Category 2 Category 3 Category 4 Category 5
Risk area 1 2 3 4 5
ETE (h) 15 21 28 32 33
Table 4 Jefferson County evacuation time estimates
Saffir–Simpson category Category 1 Category 2 Category 3 Category 4 Category 5
Risk area 1 2 3 4 5
ETE (h) 15 21 28 32 33
Nat Hazards
123
Czajkowski J (2011) Is it time to go yet? Understanding household hurricane evacuation decisions from adynamic perspective. Nat Hazards Rev 12:72–84
Dash N, Gladwin H (2007) Evacuation decision making and behavioral responses: individual and household.Nat Hazards Rev 8:69–77
Fox CR, Tversky A (1998) A belief-based account of decision under uncertainty. Manag Sci 44:879–895Gordon ME, Slade LA, Schmitt N (1986) The ‘science of the sophomore’ revisited: from conjecture to
empiricism. Acad Manag Rev 11:191–207Hair JF, Black WC, Babin BJ, Anderson RE (2009) Multivariate data analysis. Prentice Hall, New JerseyHuang SK, Lindell MK, Prater CS (2015) Who leaves and who stays? A review and statistical meta-analysis
of hurricane evacuation studies. Environ Behav. doi:10.1177/0013916515578485Kahneman D, Tversky A (1979) Prospect theory: an analysis of decisions under risk. Econometrica
47:263–291Knabb R, Brown DP, Rhome JR (2005). NHC (National Hurricane Center, Miami, FL). Tropical cyclone
report—Hurricane Katrina. Final report 20 Dec 2005-14 Sept 2011. Miami: Florida InternationalUniversity (FL): 2011. Report No.: TCR-AL122005, p 43
Kunreuther HC, Pauly MV, McMorrow S (2013) Insurance and behavioral economics: improving decisionsin the most misunderstood industry. Cambridge University Press, New York
Lin C-C, Siebeneck LK, Lindell MK, Prater CS, Wu TH, Huang SK (2014) Evacuees’ information sourcesand reentry decision making in the aftermath of Hurricane Ike. Nat Hazards 70:865–882
Lindell MK (2008) EMBLEM2: an empirically based large-scale evacuation time estimate model. TransportRes A 42:140–154
Lindell MK (2013) Evacuation planning, analysis, and management. In: Bariru AB, Racz L (eds) Handbookof emergency response: a human factors and systems engineering approach. CRC Press, Boca Raton,pp 121–149
Lindell MK (2014) Judgment and decision making. In: Webster M, Sell J (eds) Laboratory experiments inthe social sciences, 2nd edn. Academic Press, San Diego CA, pp 403–431
Lindell MK, Earle TC (1983) How close is close enough: public perceptions of the risks of industrialfacilities. Risk Anal 3:245–253
Lindell MK, Perry RW (2004) Communicating environmental risk in multiethnic communities. Sage,Thousand Oaks
Lindell MK, Perry RW (2012) The protective action decision model: theoretical modifications and addi-tional evidence. Risk Anal 32:616–632
Lindell MK, Prater CS, Hwang SN, Wu JY, Zhang Y (2002) Local population and estimated evacuation inrisk areas of the Texas Gulf Coast. College Station TX: Texas A&M University Hazard Reduction &Recovery Center. www.txdps.state.tx.us/dem/downloadableforms.htm
Lindell MK, Villado A, Prater CS (2008) Hurricane evacuation decision making for local officials:development and assessment of a training manual. Texas A&M University Hazard Reduction &Recovery Center, College Station
Lindell MK, House D, Cox J, Wu HC (in preparation) DynaSearch: a computer program for collectingprocess tracing data in dynamic decision tasks. Texas A&M University Hazard Reduction & RecoveryCenter, College Station
Meyer R, Broad K, Orlove B, Petrovic N (2013) Dynamic simulation as an approach to understandinghurricane risk response: insights from the Stormview lab. Risk Anal 33:1532–1552
Mishra A, Mishra H (2010) Border bias: the belief that state borders can protect against disasters. PsycholSci 21:1582–1586
Murray-Tuite P, Wolshon B (2013) Evacuation transportation modeling: an overview of research, devel-opment, and practice. Transp Res Part C 27:25–45
National Hurricane Center (NHC) (2014) National Hurricane Center Product Description Document: auser’s guide to hurricane products. http://www.nhc.noaa.gov/pdf/NHC_Product_Description.pdf
Tversky A, Koehler DJ (1994) Support theory: a nonextensional representation of subjective probability.Psychol Rev 101:547–567
Visschers VHM, Meertens RM, Passchier WWF, de Vries NNK (2009) Probability information in riskcommunication: a review of the research literature. Risk Anal 29:267–287
Wood MD, Bostrom A, Bridges T, Linkov I (2012) Cognitive mapping tools: review and risk managementneeds. Risk Anal 32:1333–1348
Wright G, Whalley P (1983) The supra-additivity of subjective probability. In: Stigum BP, Wenstop F (eds)Foundations of utility and risk theory with applications. Ridel, Dordrecht, pp 233–244
Wu HC, Lindell MK, Prater CS (2012) Logistics of hurricane evacuation in hurricanes Katrina and Rita.Transp Res Part F 15:445–461
Nat Hazards
123

Wu HC, Lindell MK, Prater CS, Samuelson CD (2014) Effects of track and threat information on judgmentsof hurricane strike probability. Risk Anal 34:1025–1039
Wu HC, Lindell MK, Prater CS (2015) Process tracing analysis of hurricane information displays. RiskAnal. doi:10.1111/risa.12423
Yates JF (1990) Judgment and decision making. Prentice-Hall, Englewood Cliffs
Nat Hazards
123