Embed Size (px)
Citation preview
• Develop a better understanding of the NHC forecast process and products
• Understand that NHC forecasts have significant uncertainties that must be considered in emergency management decision-making
• Develop a greater understanding of how to use NHC storm surge information
• Understand the components of Hurricane Evacuation Studies and how to plan for a hurricane threat
• Learn about the available resources and real-time products for evacuation decision-making
Course Objectives
L-311: Hurricane Readiness for
Coastal Communities
NHC
Hurricane Readiness for Coastal Communities 2014 National Hurricane Conference
• Have discussions with NHC & FEMA personnel
• Learn about the challenges of operational hurricane forecasting
• Learn about forecast uncertainties and how to factor them into decision making
• Learn about hurricane hazards, with particular focus on storm surge
• Learn about the resources available for decision making when a storm threatens
During this Course Participants Will:
HURRICANE BASICS
Hurricane Basics
ALL NORTH ATLANTIC AND EASTERN PACIFIC TROPICAL CYCLONES
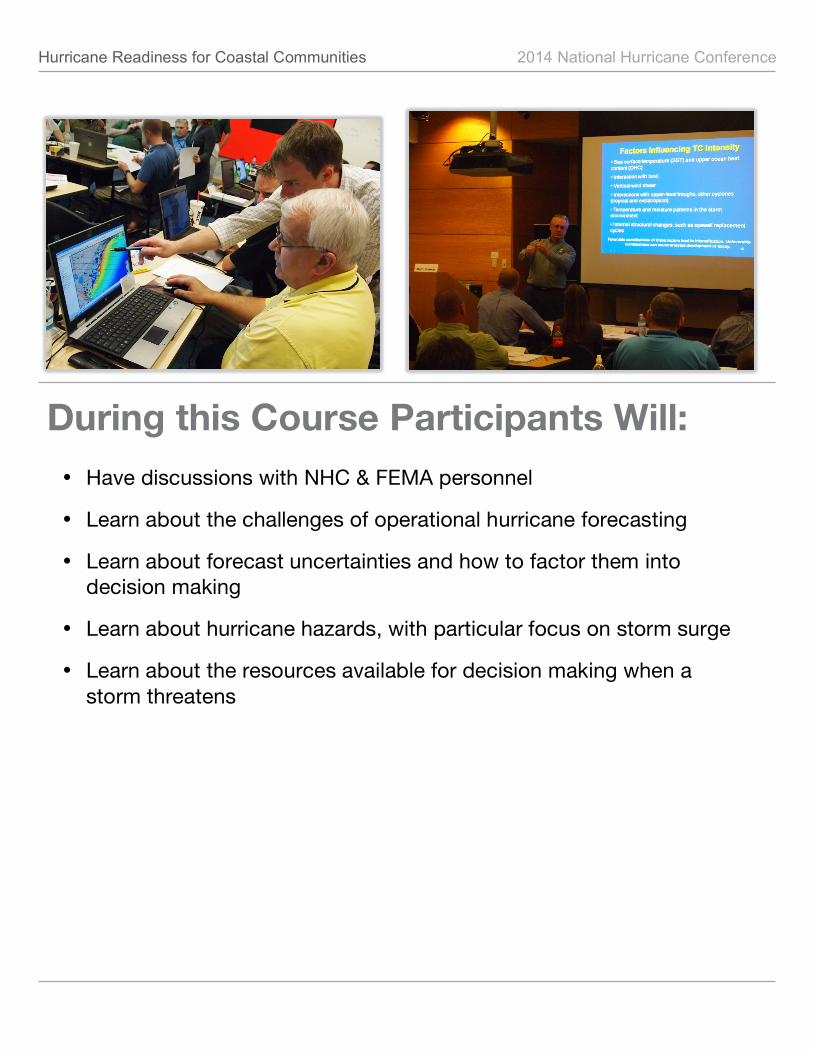
Tropical Cyclone is the generic term for a non-‐frontal, relatively large and long-‐lasting, low-‐pressure system over tropical or sub-‐tropical waters. Tropical cyclones must have organized thunderstorm activity and a closed surface wind circulation about a well-‐defined center. Tropical cyclones rotate counter-‐ clockwise in the Northern
Hemisphere. Tropical Cyclones are classified by their maximum sustained surface wind speeds.
• Tropical depression: <39 mph • Tropical storm: 39-‐73 mph • Hurricane: 74 mph or greater • Major hurricane: 111 mph or greater
NHC
What is a Tropical Cyclone?
Tropical cyclone tracks across the globe between 1985 and 2005. Tropical cyclones that achieve maximum sustained winds of 74 mph are called hurricanes in the Atlantic and eastern and central North Pacific ocean basins. In the Northwest Pacific Ocean basin they are called typhoons. Similar tropical cyclones are simply called cyclones in the Southwest Pacific and Indian Oceans.
HURRICANE BASICS 2
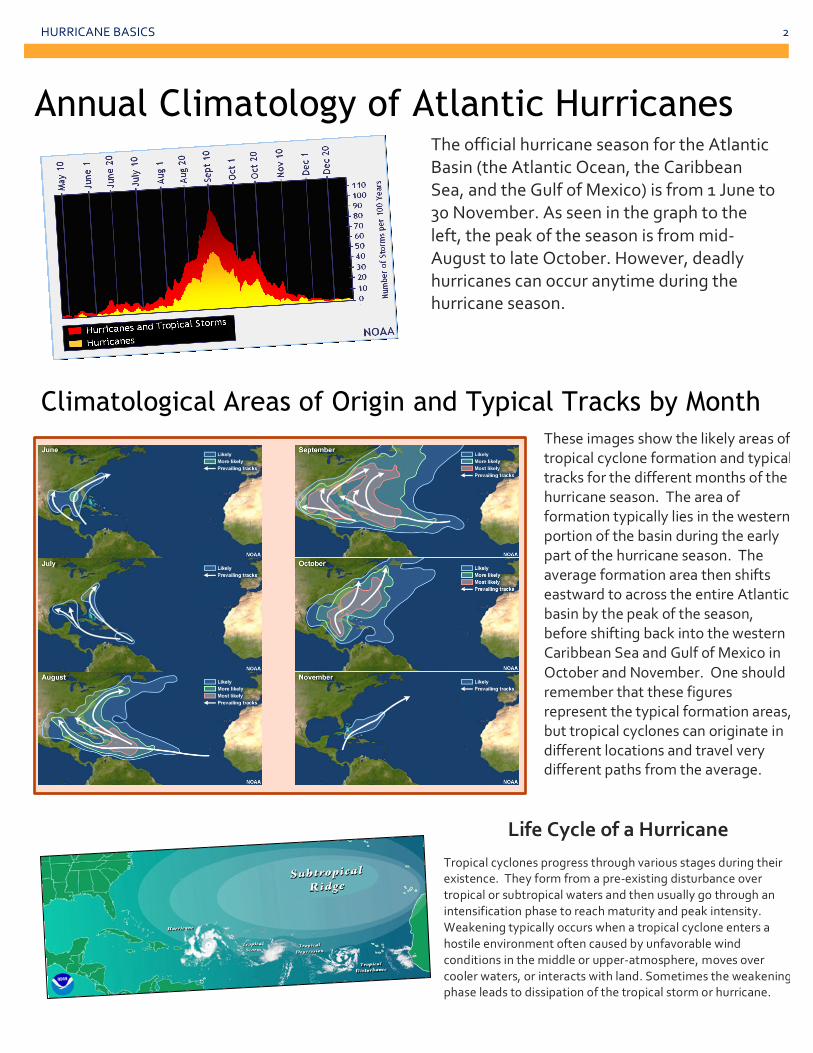
The official hurricane season for the Atlantic Basin (the Atlantic Ocean, the Caribbean Sea, and the Gulf of Mexico) is from 1 June to 30 November. As seen in the graph to the left, the peak of the season is from mid-‐August to late October. However, deadly hurricanes can occur anytime during the hurricane season.
Annual Climatology of Atlantic Hurricanes
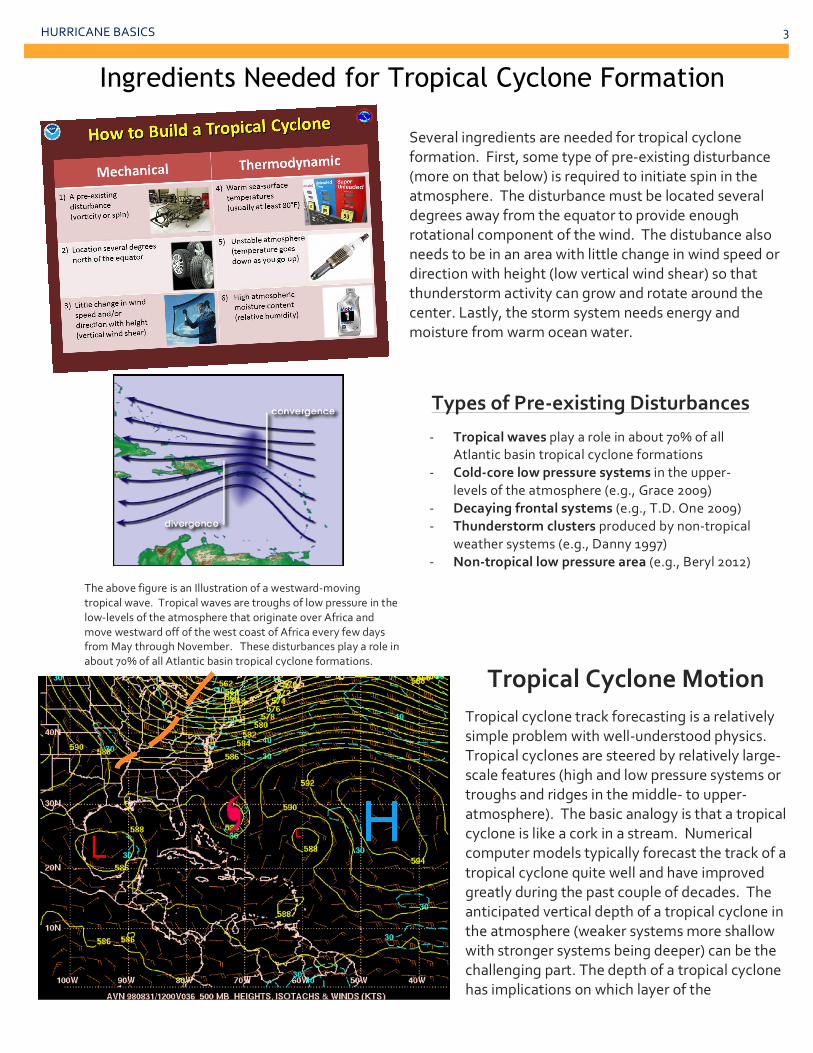
Climatological Areas of Origin and Typical Tracks by Month These images show the likely areas of tropical cyclone formation and typical tracks for the different months of the hurricane season. The area of formation typically lies in the western portion of the basin during the early part of the hurricane season. The average formation area then shifts eastward to across the entire Atlantic basin by the peak of the season, before shifting back into the western Caribbean Sea and Gulf of Mexico in October and November. One should remember that these figures represent the typical formation areas, but tropical cyclones can originate in different locations and travel very different paths from the average.
Life Cycle of a Hurricane Tropical cyclones progress through various stages during their existence. They form from a pre-‐existing disturbance over tropical or subtropical waters and then usually go through an intensification phase to reach maturity and peak intensity. Weakening typically occurs when a tropical cyclone enters a hostile environment often caused by unfavorable wind conditions in the middle or upper-‐atmosphere, moves over cooler waters, or interacts with land. Sometimes the weakening phase leads to dissipation of the tropical storm or hurricane.
HURRICANE BASICS 3
Ingredients Needed for Tropical Cyclone Formation
Types of Pre-‐existing Disturbances
-‐ Tropical waves play a role in about 70% of all Atlantic basin tropical cyclone formations
-‐ Cold-‐core low pressure systems in the upper-‐levels of the atmosphere (e.g., Grace 2009)
-‐ Decaying frontal systems (e.g., T.D. One 2009) -‐ Thunderstorm clusters produced by non-‐tropical
weather systems (e.g., Danny 1997) -‐ Non-‐tropical low pressure area (e.g., Beryl 2012)
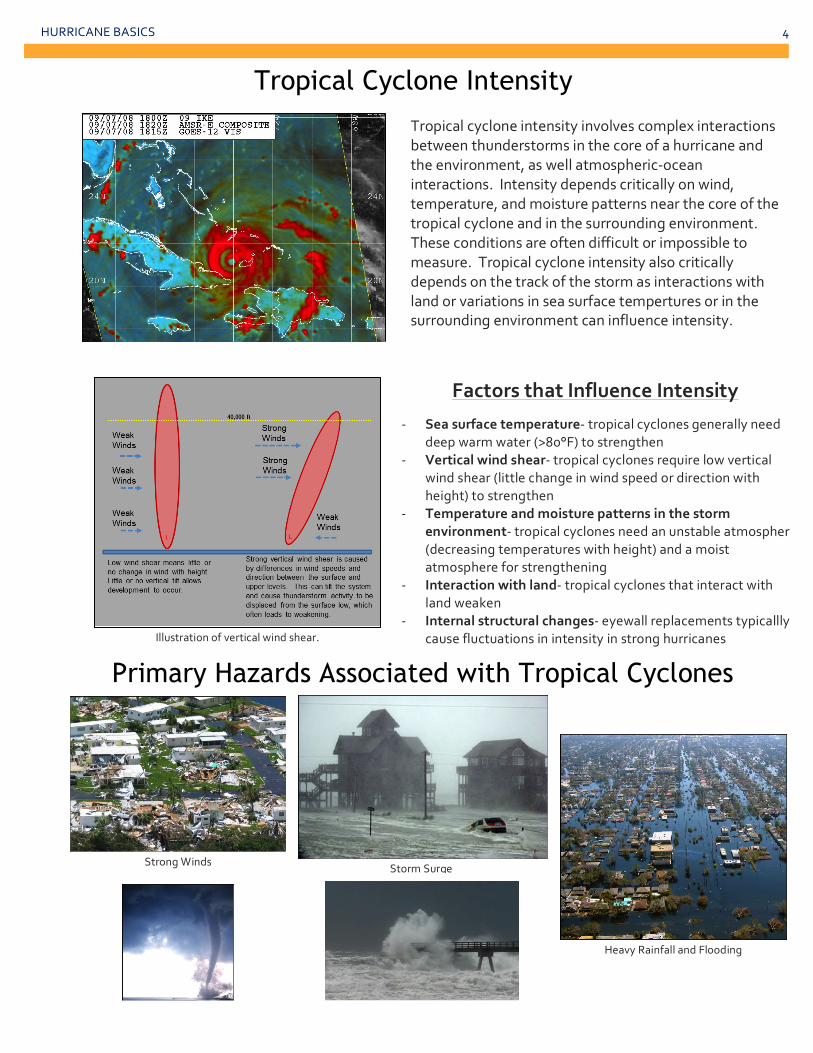
Several ingredients are needed for tropical cyclone formation. First, some type of pre-‐existing disturbance (more on that below) is required to initiate spin in the atmosphere. The disturbance must be located several degrees away from the equator to provide enough rotational component of the wind. The distubance also needs to be in an area with little change in wind speed or direction with height (low vertical wind shear) so that thunderstorm activity can grow and rotate around the center. Lastly, the storm system needs energy and moisture from warm ocean water.
The above figure is an Illustration of a westward-‐moving tropical wave. Tropical waves are troughs of low pressure in the low-‐levels of the atmosphere that originate over Africa and move westward off of the west coast of Africa every few days from May through November. These disturbances play a role in about 70% of all Atlantic basin tropical cyclone formations.
Tisting Disturb
Tropical Cyclone Motion Tropical cyclone track forecasting is a relatively simple problem with well-‐understood physics. Tropical cyclones are steered by relatively large-‐ scale features (high and low pressure systems or troughs and ridges in the middle-‐ to upper-‐atmosphere). The basic analogy is that a tropical cyclone is like a cork in a stream. Numerical computer models typically forecast the track of a tropical cyclone quite well and have improved greatly during the past couple of decades. The anticipated vertical depth of a tropical cyclone in the atmosphere (weaker systems more shallow with stronger systems being deeper) can be the challenging part. The depth of a tropical cyclone has implications on which layer of the atmosphere will provide the steering flow.
HURRICANE BASICS 4
Tropical cyclone intensity involves complex interactions between thunderstorms in the core of a hurricane and the environment, as well atmospheric-‐ocean interactions. Intensity depends critically on wind, temperature, and moisture patterns near the core of the tropical cyclone and in the surrounding environment. These conditions are often difficult or impossible to measure. Tropical cyclone intensity also critically depends on the track of the storm as interactions with land or variations in sea surface tempertures or in the surrounding environment can influence intensity.
Tropical Cyclone Intensity
Factors that Influence Intensity
-‐ Sea surface temperature-‐ tropical cyclones generally need deep warm water (>80°F) to strengthen
-‐ Vertical wind shear-‐ tropical cyclones require low vertical wind shear (little change in wind speed or direction with height) to strengthen
-‐ Temperature and moisture patterns in the storm environment-‐ tropical cyclones need an unstable atmosphere (decreasing temperatures with height) and a moist atmosphere for strengthening
-‐ Interaction with land-‐ tropical cyclones that interact with land weaken
-‐ Internal structural changes-‐ eyewall replacements typicallly cause fluctuations in intensity in strong hurricanes Illustration of vertical wind shear.
Primary Hazards Associated with Tropical Cyclones
Strong Winds Storm Surge
Heavy Rainfall and Flooding
Tornadoes Large Waves & Rip Currents
TROPICAL CYCLONE HAZARDS
Tropical Cyclone Hazards
PRIMARY HAZARDS ASSOCIATED WITH TROPICAL CYCLONES
NHC
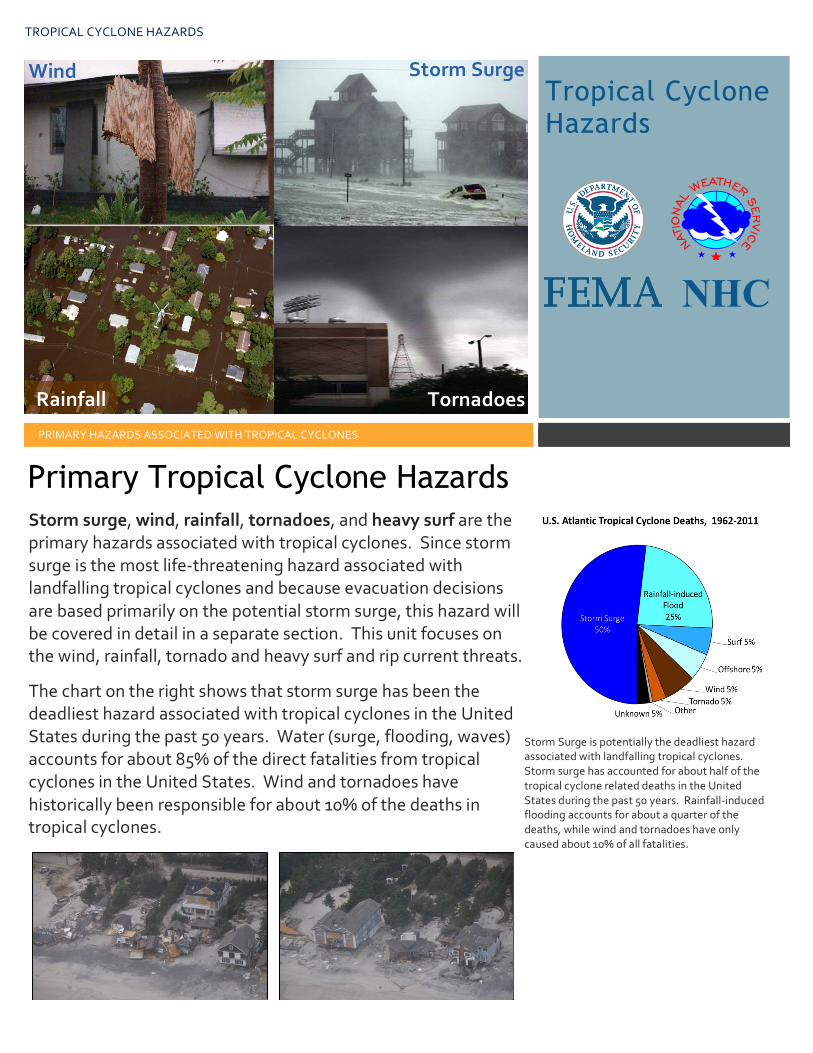
Primary Tropical Cyclone Hazards
Storm Surge is potentially the deadliest hazard associated with landfalling tropical cyclones. Storm surge has accounted for about half of the tropical cyclone related deaths in the United States during the past 50 years. Rainfall-‐induced flooding accounts for about a quarter of the deaths, while wind and tornadoes have only caused about 10% of all fatalities.
Wind Storm Surge
Rainfall Tornadoes
Storm surge, wind, rainfall, tornadoes, and heavy surf are the primary hazards associated with tropical cyclones. Since storm surge is the most life-‐threatening hazard associated with landfalling tropical cyclones and because evacuation decisions are based primarily on the potential storm surge, this hazard will be covered in detail in a separate section. This unit focuses on the wind, rainfall, tornado and heavy surf and rip current threats.
The chart on the right shows that storm surge has been the deadliest hazard associated with tropical cyclones in the United States during the past 50 years. Water (surge, flooding, waves) accounts for about 85% of the direct fatalities from tropical cyclones in the United States. Wind and tornadoes have historically been responsible for about 10% of the deaths in tropical cyclones.
TROPICAL CYCLONE HAZARDS 2
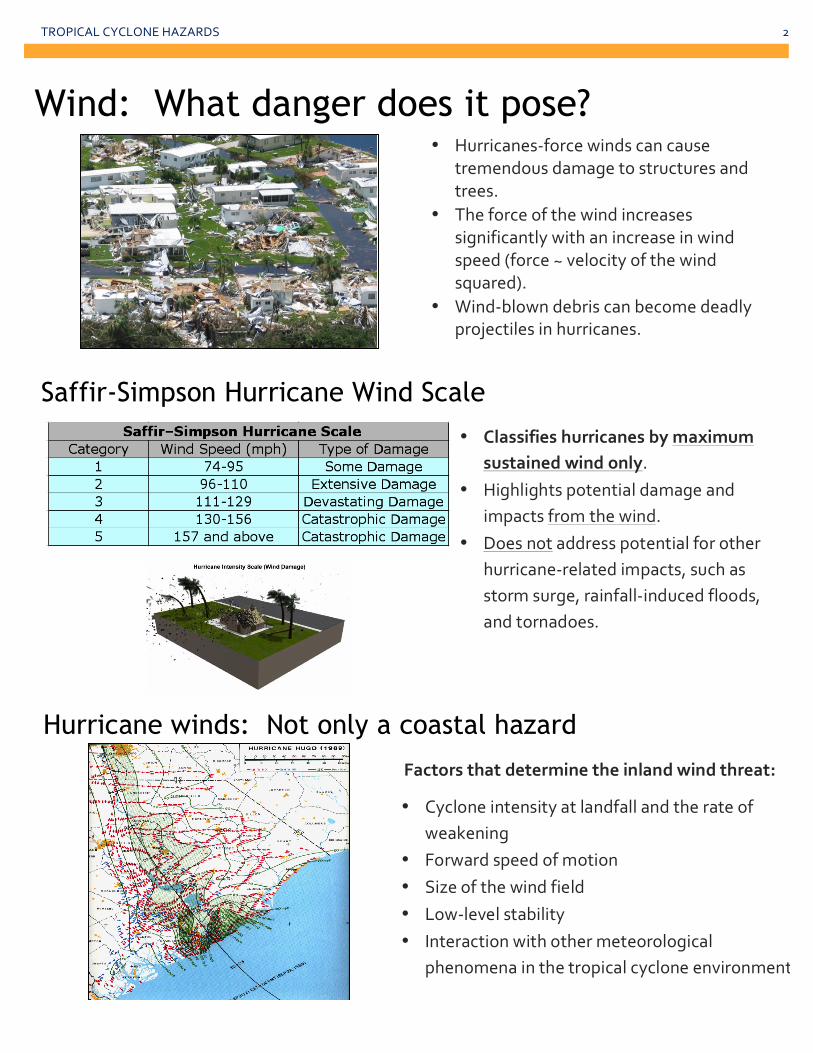
• Hurricanes-‐force winds can cause tremendous damage to structures and trees.
• The force of the wind increases significantly with an increase in wind speed (force ~ velocity of the wind squared).
• Wind-‐blown debris can become deadly projectiles in hurricanes.
Wind: What danger does it pose?
Saffir-Simpson Hurricane Wind Scale
• Classifies hurricanes by maximum sustained wind only.
• Highlights potential damage and impacts from the wind.
• Does not address potential for other hurricane-‐related impacts, such as storm surge, rainfall-‐induced floods, and tornadoes.
Hurricane winds: Not only a coastal hazard
Factors that determine the inland wind threat:
• Cyclone intensity at landfall and the rate of weakening
• Forward speed of motion • Size of the wind field • Low-‐level stability • Interaction with other meteorological
phenomena in the tropical cyclone environment
Hurricane Hugo (1989) brought hurricane-‐force winds well inland.

TROPICAL CYCLONE HAZARDS 3
Tropial cyclone intensity is a multi-‐scale problem that involves complex interactions between thunderstorms in the core and the environment, as well atmospheric-‐ocean interactions. Intensity deprends critically on wind, temperature, and moisture patterns over the core of the tropical cyclone and in the near environment. These conditions are often difficult or impossible to measure. Tropical cyclone intensity also depends strongly on the track of the storm as interactions with land or subtle variations in sea surface tempertures or in the surrounding evnironment can influence intensity.
Weakening rates of tropical cyclones after landfall • More intense tropical cyclones at landfall can bring strong winds farther inland. • However, stronger tropical cyclones weaken more quickly after landfall. • The average major hurricane weakens below hurricane strength about 7 hours after
moving inland. • Nearly all tropical cyclones decay 30-‐35 mph within 24 to 30 hours of landfall, regardless
of intensity at landfall. • Speed of forward motion critical in determining inland extent of strong winds.
Inland wind potential of a category 3 hurricane with a forward speed of 25 mph (left) versus a category 3 hurricane with a forward speed of about 10 mph.
Note how much farther inland strong winds occur in hurricanes of the same intensity but moving faster.
How do hurricane winds change with height?
Surface – Cat 1 – 90 mph
500 feet – Cat 3 – 125 mph 1000 feet – Cat 5 – 160 mph
• Wind speeds aloft are typically higher in a tropical cyclone as illustrated in the plot to the left.
• The idea in the early 1990’s of vertical evacuation (e.g., in high-‐rise buildings) to get people out of harm’s ways was no longer considered viable after this finding.
• Gusts over land can easily be one Saffir-‐Simpson scale category higher than sustained winds.
• Over land, a typical gust factor is 1.3. So an 80 mph wind should have an associated gust of 105 mph.
• Over complex terrain (e.g., mountains) and in the hurricane eyewall, this gust factor is higher at 1.65. So an 80 mph wind could have a gust as high as about 132 mph.
TROPICAL CYCLONE HAZARDS 4
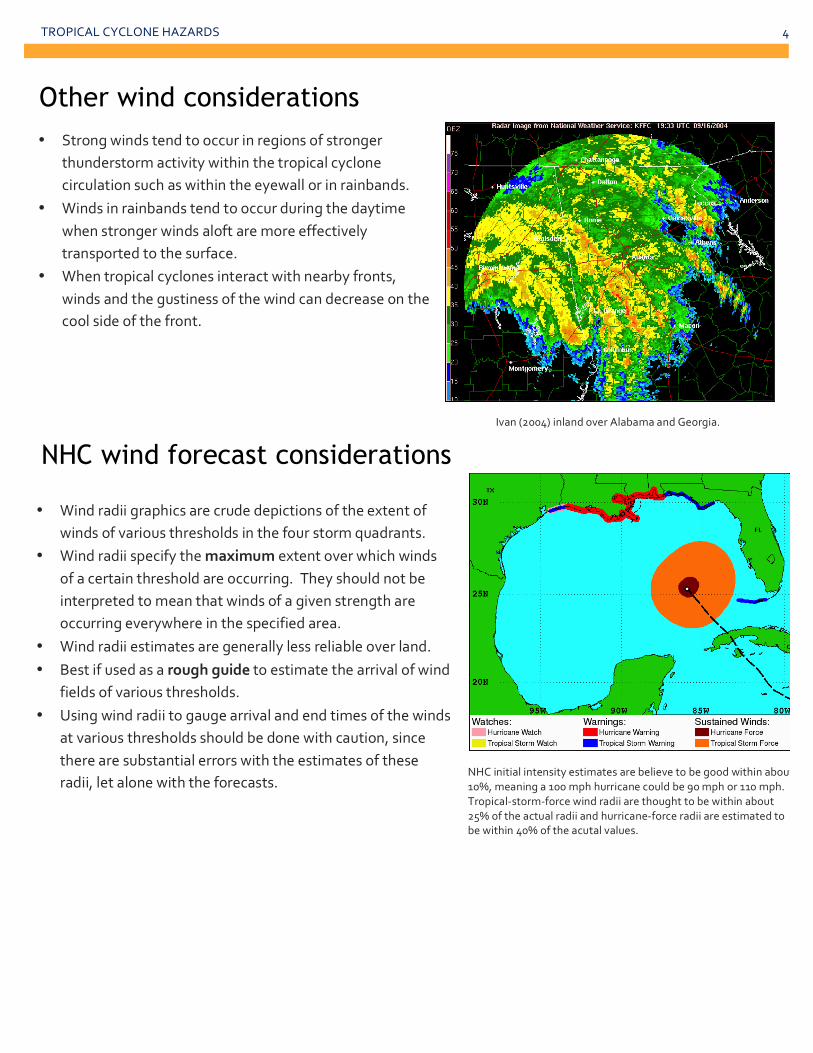
Other wind considerations • Strong winds tend to occur in regions of stronger
thunderstorm activity within the tropical cyclone circulation such as within the eyewall or in rainbands.
• Winds in rainbands tend to occur during the daytime when stronger winds aloft are more effectively transported to the surface.
• When tropical cyclones interact with nearby fronts, winds and the gustiness of the wind can decrease on the cool side of the front.
Ivan (2004) inland over Alabama and Georgia.
NHC wind forecast considerations
• Wind radii graphics are crude depictions of the extent of winds of various thresholds in the four storm quadrants.
• Wind radii specify the maximum extent over which winds of a certain threshold are occurring. They should not be interpreted to mean that winds of a given strength are occurring everywhere in the specified area.
• Wind radii estimates are generally less reliable over land. • Best if used as a rough guide to estimate the arrival of wind
fields of various thresholds. • Using wind radii to gauge arrival and end times of the winds
at various thresholds should be done with caution, since there are substantial errors with the estimates of these radii, let alone with the forecasts.
NHC initial intensity estimates are believe to be good within about 10%, meaning a 100 mph hurricane could be 90 mph or 110 mph. Tropical-‐storm-‐force wind radii are thought to be within about 25% of the actual radii and hurricane-‐force radii are estimated to be within 40% of the acutal values.
TROPICAL CYCLONE HAZARDS 5
• Heavy rains of up to 43 inches in a 24-‐hour period have been recorded in the United States in association with a tropical cyclone (Claudette 1979).
• These rains can produce considerable freshwater flooding. • Often times weaker systems such as tropical depressions or tropical storms can produce more rainfall
and flooding than hurricanes. • Historically, about one quarter of all deaths from occur to people who drowned in, or attempted to
abandon, their vehicles.
• The size of the storm matters. Bigger storms tend to produce more rainfall. • The forward motion is of critical importance. Slower storms can produce substantially more rainfall. • A more unstable atmosphere will enhance the overall rain rate, which will increase rainfall totals. • The vertical wind shear in the storm environment is also important. More rainfall generally occurs on the
side opposite the prevailing wind shear. For example, if the prevailing wind shear is westerly, the heaviest rains would likely occur to the east of the storm track.
• Topography in yet another factor. More rain falls on the windward side of elevated terrain, with less rain on the leeward side.
• The final factor is the proximity of a tropical cyclone to frontal boundaries or upper-‐level troughs. These features tend to enhance the rainfall potential associated with a tropical cyclone.
What factors govern how much rain falls?
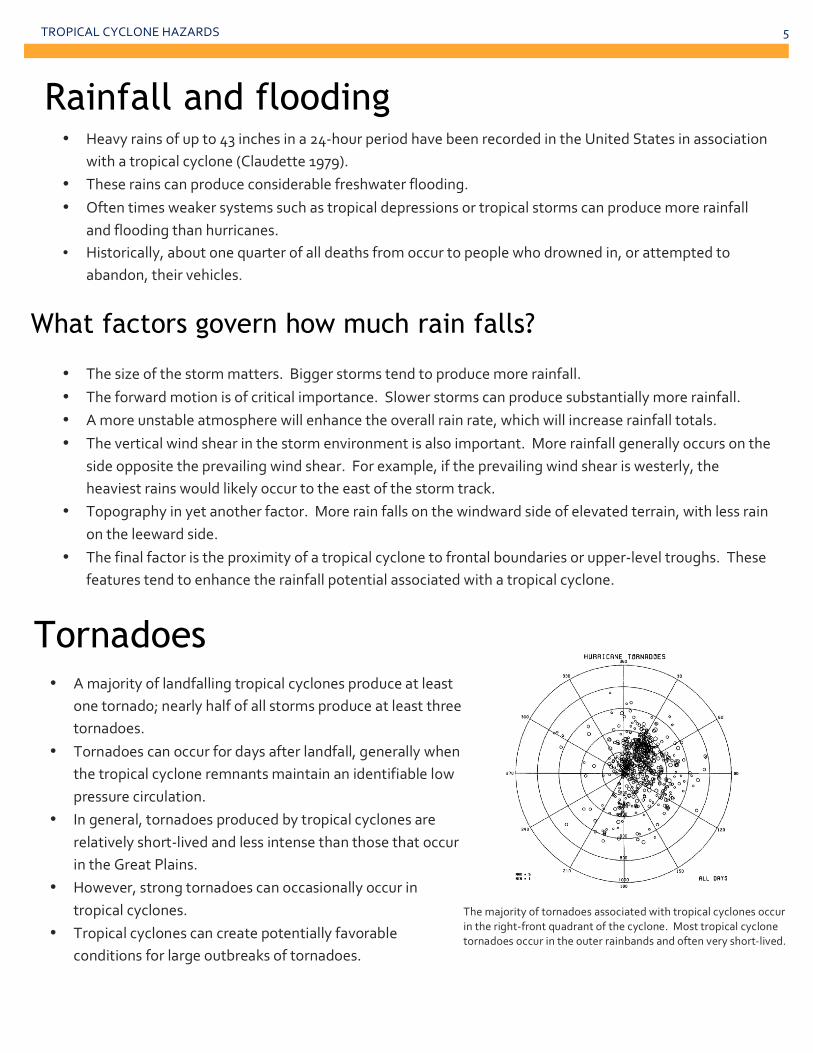
Tornadoes • A majority of landfalling tropical cyclones produce at least
one tornado; nearly half of all storms produce at least three tornadoes.
• Tornadoes can occur for days after landfall, generally when the tropical cyclone remnants maintain an identifiable low pressure circulation.
• In general, tornadoes produced by tropical cyclones are relatively short-‐lived and less intense than those that occur in the Great Plains.
• However, strong tornadoes can occasionally occur in tropical cyclones.
• Tropical cyclones can create potentially favorable conditions for large outbreaks of tornadoes.
The majority of tornadoes associated with tropical cyclones occur in the right-‐front quadrant of the cyclone. Most tropical cyclone tornadoes occur in the outer rainbands and often very short-‐lived.
Rainfall and flooding
TROPICAL CYCLONE HAZARDS 6
• In the northeast quadrant (or right-‐front quadrant), the orientation and speed of the winds over a shallow layer in the low-‐levels create vertical shear profiles favorable for the production of tornadoes.
• In general, the bigger and stronger wind fields are with a tropical cyclone, the greater the potential of favorable conditions for the production of tornadoes.
• Tropical cyclones tend to produce more tornadoes in the daytime. • Surface moisture is not lacking near a tropical cyclone, but instability sometimes is.
Conditions favoring tropical cyclone tornadoes
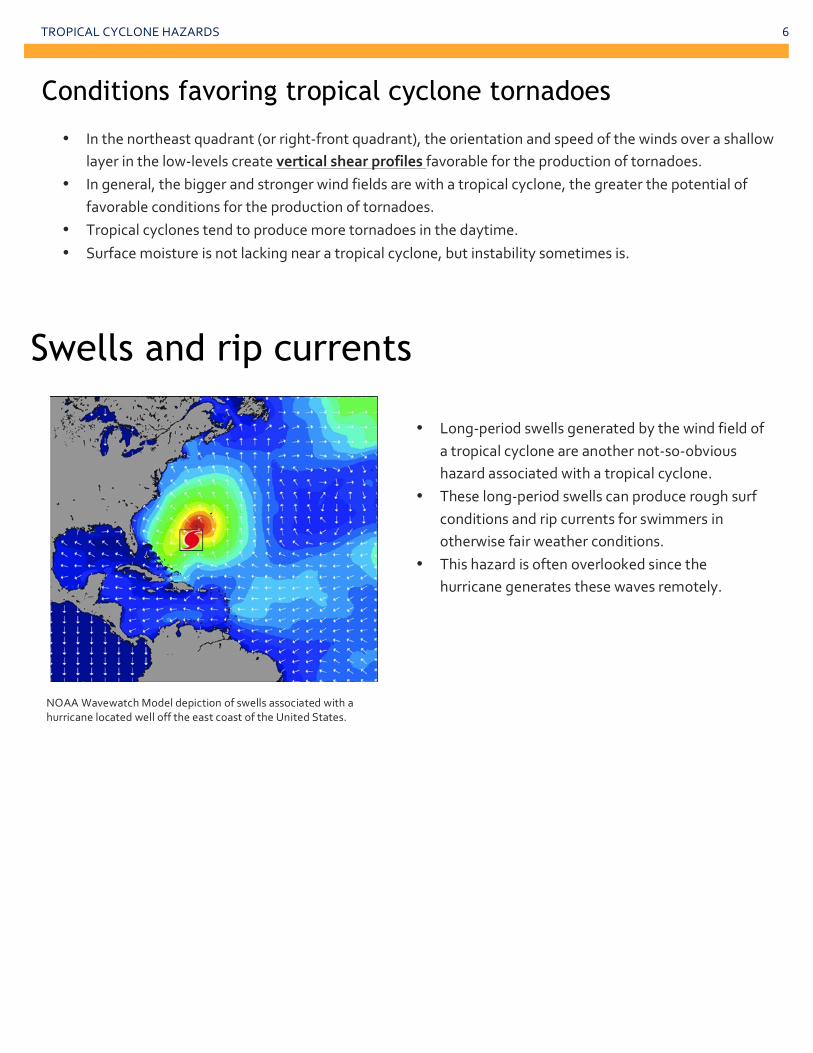
Swells and rip currents
NOAA Wavewatch Model depiction of swells associated with a hurricane located well off the east coast of the United States.
• Long-‐period swells generated by the wind field of a tropical cyclone are another not-‐so-‐obvious hazard associated with a tropical cyclone.
• These long-‐period swells can produce rough surf conditions and rip currents for swimmers in otherwise fair weather conditions.
• This hazard is often overlooked since the hurricane generates these waves remotely.
NHC FORECAST PROCESS
NHC Forecast Process
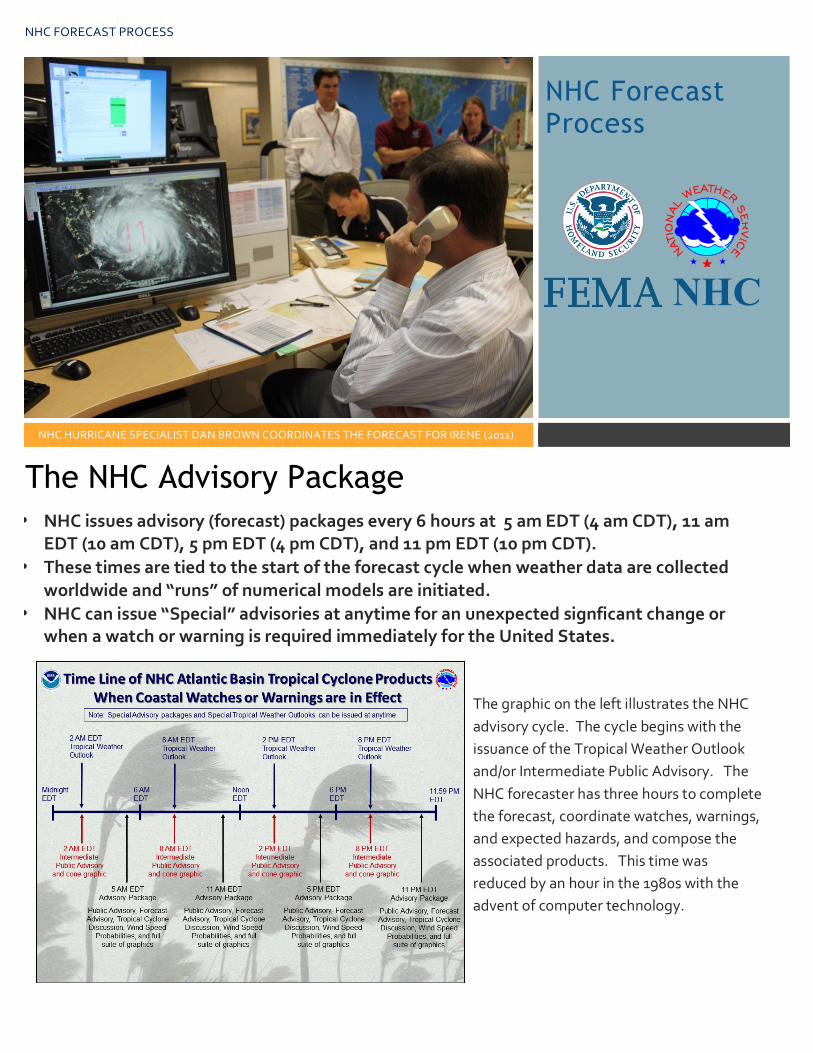
NHC HURRICANE SPECIALIST DAN BROWN COORDINATES THE FORECAST FOR IRENE (2011)
NHC
The NHC Advisory Package
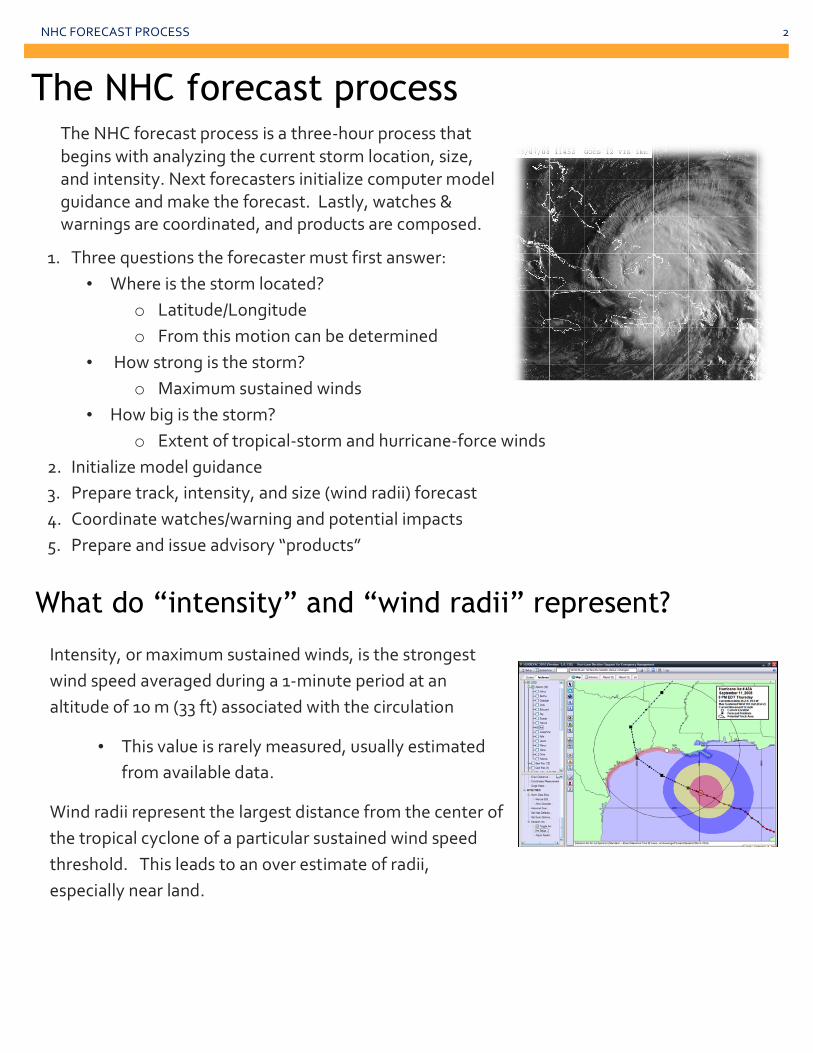
• NHC issues advisory (forecast) packages every 6 hours at 5 am EDT (4 am CDT), 11 am EDT (10 am CDT), 5 pm EDT (4 pm CDT), and 11 pm EDT (10 pm CDT).
• These times are tied to the start of the forecast cycle when weather data are collected worldwide and “runs” of numerical models are initiated.
• NHC can issue “Special” advisories at anytime for an unexpected signficant change or when a watch or warning is required immediately for the United States.
The graphic on the left illustrates the NHC advisory cycle. The cycle begins with the issuance of the Tropical Weather Outlook and/or Intermediate Public Advisory. The NHC forecaster has three hours to complete the forecast, coordinate watches, warnings, and expected hazards, and compose the associated products. This time was reduced by an hour in the 1980s with the advent of computer technology.
NHC FORECAST PROCESS 2
1. Three questions the forecaster must first answer: • Where is the storm located?
o Latitude/Longitude o From this motion can be determined
• How strong is the storm? o Maximum sustained winds
• How big is the storm? o Extent of tropical-‐storm and hurricane-‐force winds
2. Initialize model guidance 3. Prepare track, intensity, and size (wind radii) forecast 4. Coordinate watches/warning and potential impacts 5. Prepare and issue advisory “products”
The NHC forecast process The NHC forecast process is a three-‐hour process that begins with analyzing the current storm location, size, and intensity. Next forecasters initialize computer model guidance and make the forecast. Lastly, watches & warnings are coordinated, and products are composed.
What do “intensity” and “wind radii” represent?
Intensity, or maximum sustained winds, is the strongest wind speed averaged during a 1-‐minute period at an altitude of 10 m (33 ft) associated with the circulation
• This value is rarely measured, usually estimated from available data.
Wind radii represent the largest distance from the center of the tropical cyclone of a particular sustained wind speed threshold. This leads to an over estimate of radii, especially near land.
NHC FORECAST PROCESS 3
Considerations of track forecasts • Previous NHC forecast exerts a strong constraint on the
current forecast. o Credibility can be damaged by making big changes from
forecast to forecast, then having to go back to the original-‐ “Windshield Wipering”
• Changes to track forecasts are typically made in small increments.
• Persistence or current motion has strong influence on the first 12 hours or so of the forecast track.
• NHC strives for continuity within a forecast; therefore, changes in direction and speed of a cyclone from one forecast time to the next are also made gradually.
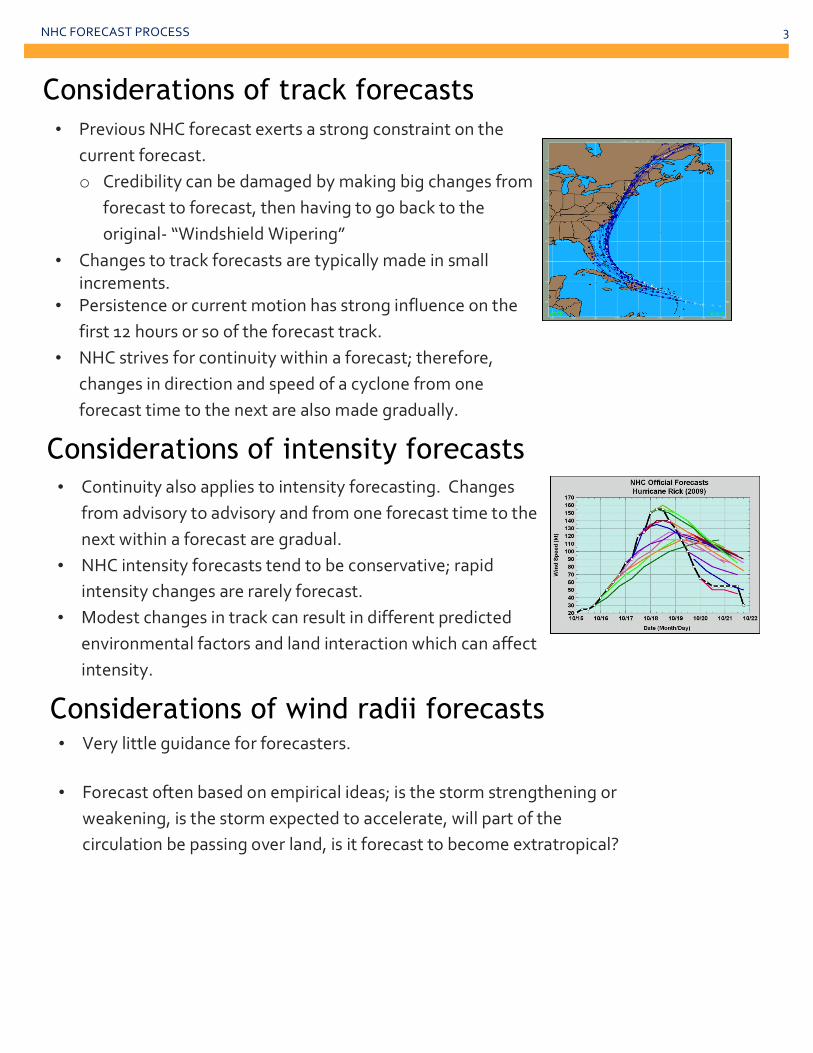
Considerations of intensity forecasts • Continuity also applies to intensity forecasting. Changes
from advisory to advisory and from one forecast time to the next within a forecast are gradual.
• NHC intensity forecasts tend to be conservative; rapid intensity changes are rarely forecast.
• Modest changes in track can result in different predicted environmental factors and land interaction which can affect intensity.
Considerations of wind radii forecasts • Very little guidance for forecasters.
• Forecast often based on empirical ideas; is the storm strengthening or
weakening, is the storm expected to accelerate, will part of the circulation be passing over land, is it forecast to become extratropical?
NHC FORECAST PROCESS 4
• Lead time of tropical storm and hurricane watches and warning are tied to the anticipated onset of tropical-‐storm-‐force winds.
• Watches issued 48 hours prior to the arrival of tropical-‐storm-‐force winds
• Warnings issued 36 hours prior to the arrival of tropical-‐storm-‐force winds
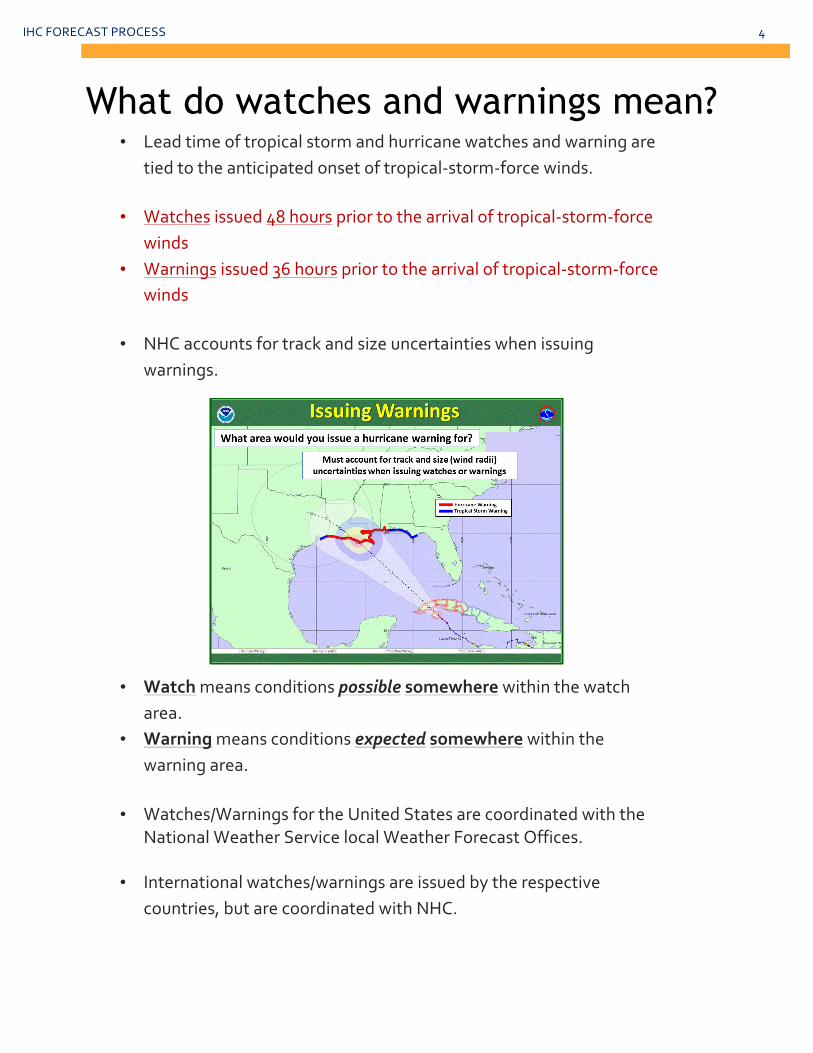
• NHC accounts for track and size uncertainties when issuing warnings.
• Watch means conditions possible somewhere within the watch area.
• Warning means conditions expected somewhere within the warning area.
• Watches/Warnings for the United States are coordinated with the National Weather Service local Weather Forecast Offices.
• International watches/warnings are issued by the respective countries, but are coordinated with NHC.
What do watches and warnings mean?
NHC FORECAST PROCESS 5
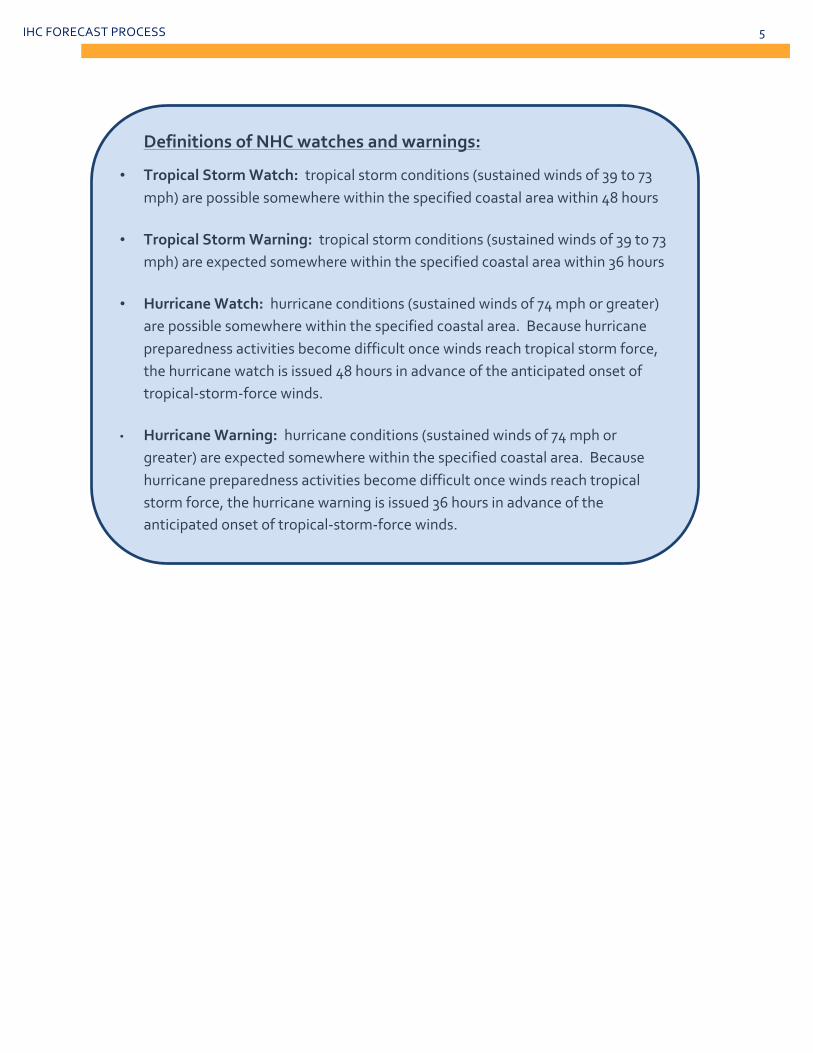
Definitions of NHC watches and warnings:
• Tropical Storm Watch: tropical storm conditions (sustained winds of 39 to 73 mph) are possible somewhere within the specified coastal area within 48 hours
• Tropical Storm Warning: tropical storm conditions (sustained winds of 39 to 73 mph) are expected somewhere within the specified coastal area within 36 hours
• Hurricane Watch: hurricane conditions (sustained winds of 74 mph or greater) are possible somewhere within the specified coastal area. Because hurricane preparedness activities become difficult once winds reach tropical storm force, the hurricane watch is issued 48 hours in advance of the anticipated onset of tropical-‐storm-‐force winds.
• Hurricane Warning: hurricane conditions (sustained winds of 74 mph or greater) are expected somewhere within the specified coastal area. Because hurricane preparedness activities become difficult once winds reach tropical storm force, the hurricane warning is issued 36 hours in advance of the anticipated onset of tropical-‐storm-‐force winds.
TROPICAL CYCLONE MODELS
Tropical Cyclone Models
TRACK MODEL GUIDANCE FOR HURRICANE ISAAC (2012)
NHC
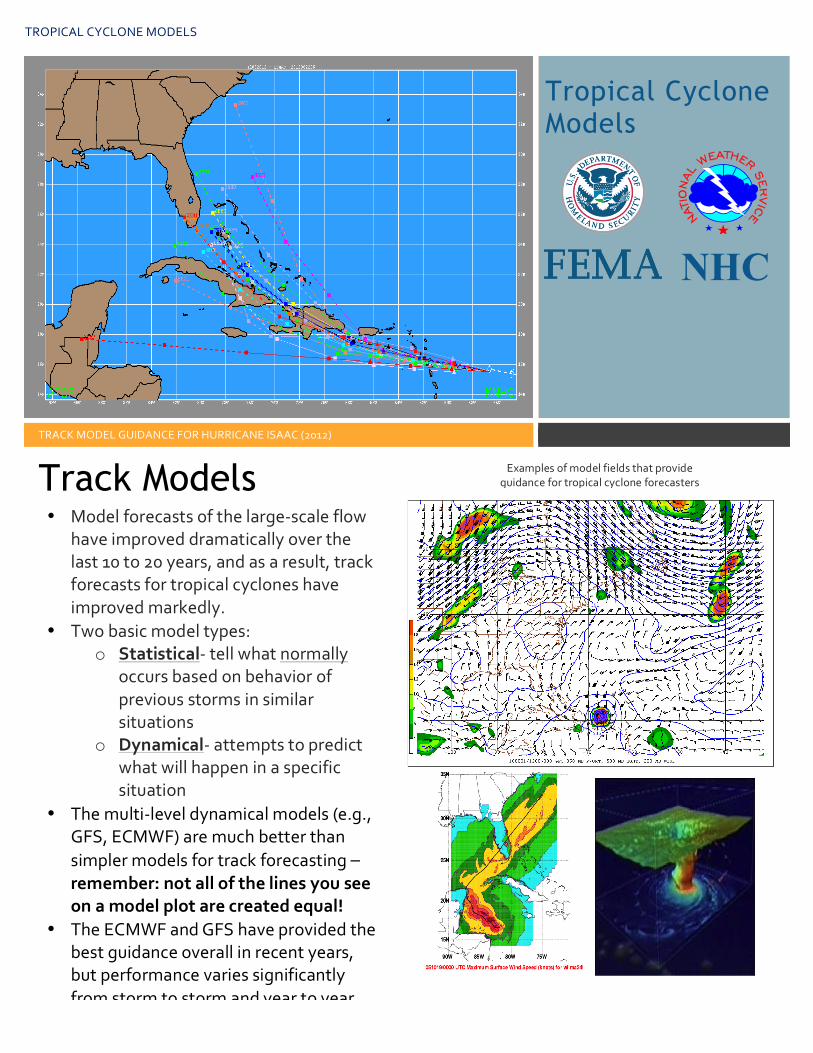
Track Models Examples of model fields that provide guidance for tropical cyclone forecasters
• Model forecasts of the large-‐scale flow have improved dramatically over the last 10 to 20 years, and as a result, track forecasts for tropical cyclones have improved markedly.
• Two basic model types: o Statistical-‐ tell what normally
occurs based on behavior of previous storms in similar situations
o Dynamical-‐ attempts to predict what will happen in a specific situation
• The multi-‐level dynamical models (e.g., GFS, ECMWF) are much better than simpler models for track forecasting – remember: not all of the lines you see on a model plot are created equal!
• The ECMWF and GFS have provided the best guidance overall in recent years, but performance varies significantly from storm to storm and year to year.
TROPICAL CYCLONE MODELS 2
Consensus Models
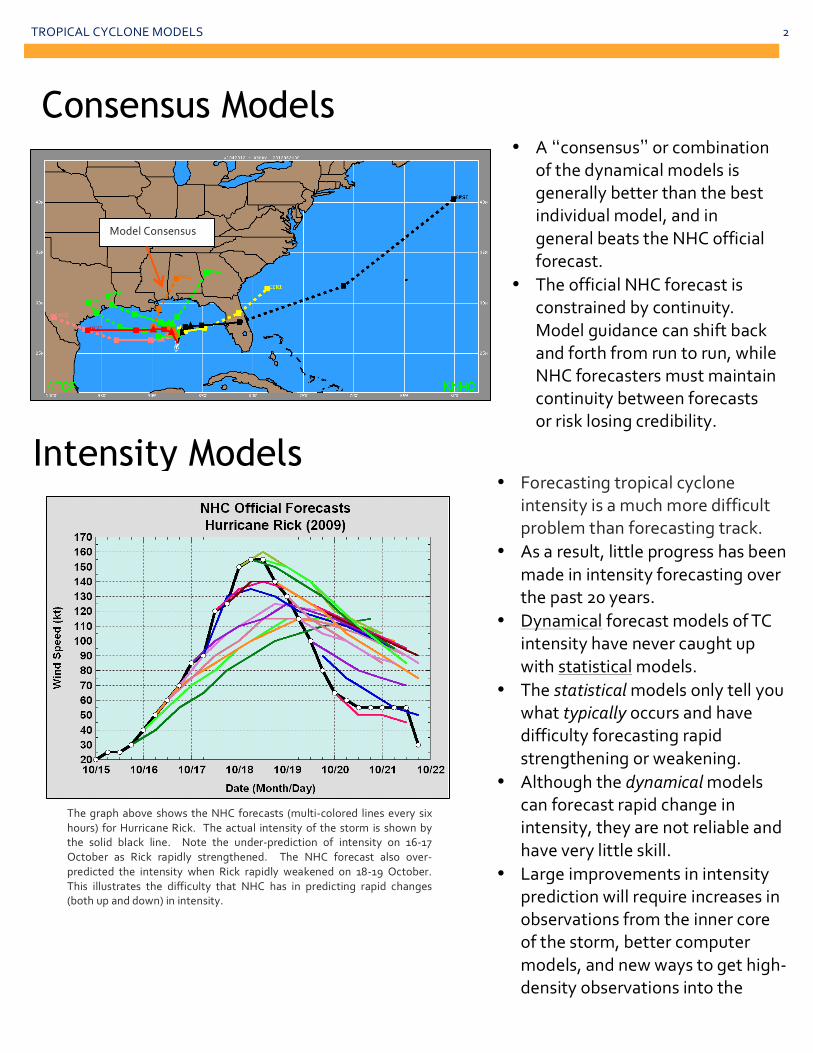
Model Consensus
• A “consensus” or combination of the dynamical models is generally better than the best individual model, and in general beats the NHC official forecast.
• The official NHC forecast is constrained by continuity. Model guidance can shift back and forth from run to run, while NHC forecasters must maintain continuity between forecasts or risk losing credibility.
Intensity Models • Forecasting tropical cyclone
intensity is a much more difficult problem than forecasting track.
• As a result, little progress has been made in intensity forecasting over the past 20 years.
• Dynamical forecast models of TC intensity have never caught up with statistical models.
• The statistical models only tell you what typically occurs and have difficulty forecasting rapid strengthening or weakening.
• Although the dynamical models can forecast rapid change in intensity, they are not reliable and have very little skill.
• Large improvements in intensity prediction will require increases in observations from the inner core of the storm, better computer models, and new ways to get high-‐density observations into the models.
The graph above shows the NHC forecasts (multi-‐colored lines every six hours) for Hurricane Rick. The actual intensity of the storm is shown by the solid black line. Note the under-‐prediction of intensity on 16-‐17 October as Rick rapidly strengthened. The NHC forecast also over-‐predicted the intensity when Rick rapidly weakened on 18-‐19 October. This illustrates the difficulty that NHC has in predicting rapid changes (both up and down) in intensity.
ACCURACY OF THE NHC FORECASTS
Accuracy of the NHC Forecasts
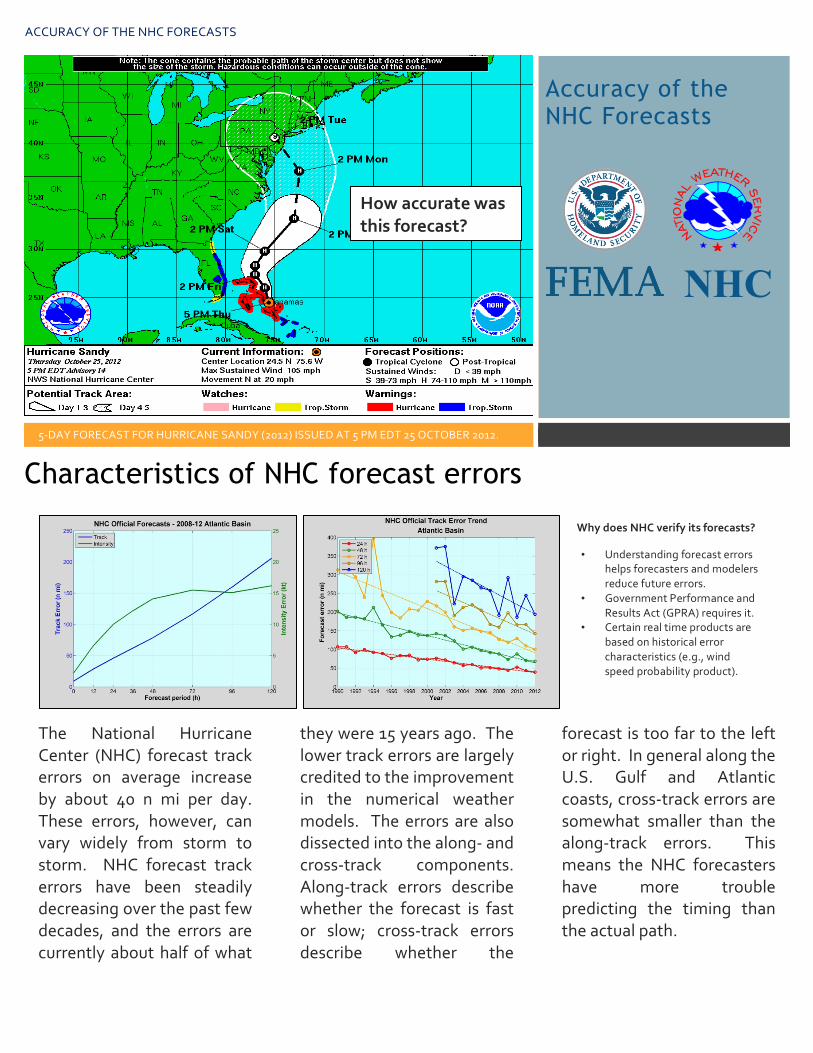
5-‐DAY FORECAST FOR HURRICANE SANDY (2012) ISSUED AT 5 PM EDT 25 OCTOBER 2012.
The National Hurricane Center (NHC) forecast track errors on average increase by about 40 n mi per day. These errors, however, can vary widely from storm to storm. NHC forecast track errors have been steadily decreasing over the past few decades, and the errors are currently about half of what
they were 15 years ago. The lower track errors are largely credited to the improvement in the numerical weather models. The errors are also dissected into the along-‐ and cross-‐track components. Along-‐track errors describe whether the forecast is fast or slow; cross-‐track errors describe whether the
forecast is too far to the left or right. In general along the U.S. Gulf and Atlantic coasts, cross-‐track errors are somewhat smaller than the along-‐track errors. This means the NHC forecasters have more trouble predicting the timing than the actual path.
NHC
Characteristics of NHC forecast errors
Why does NHC verify its forecasts?
• Understanding forecast errors helps forecasters and modelers reduce future errors.
• Government Performance and Results Act (GPRA) requires it.
• Certain real time products are based on historical error characteristics (e.g., wind speed probability product).
How accurate was this forecast?
ACCURACY OF THE NHC FORECASTS 2
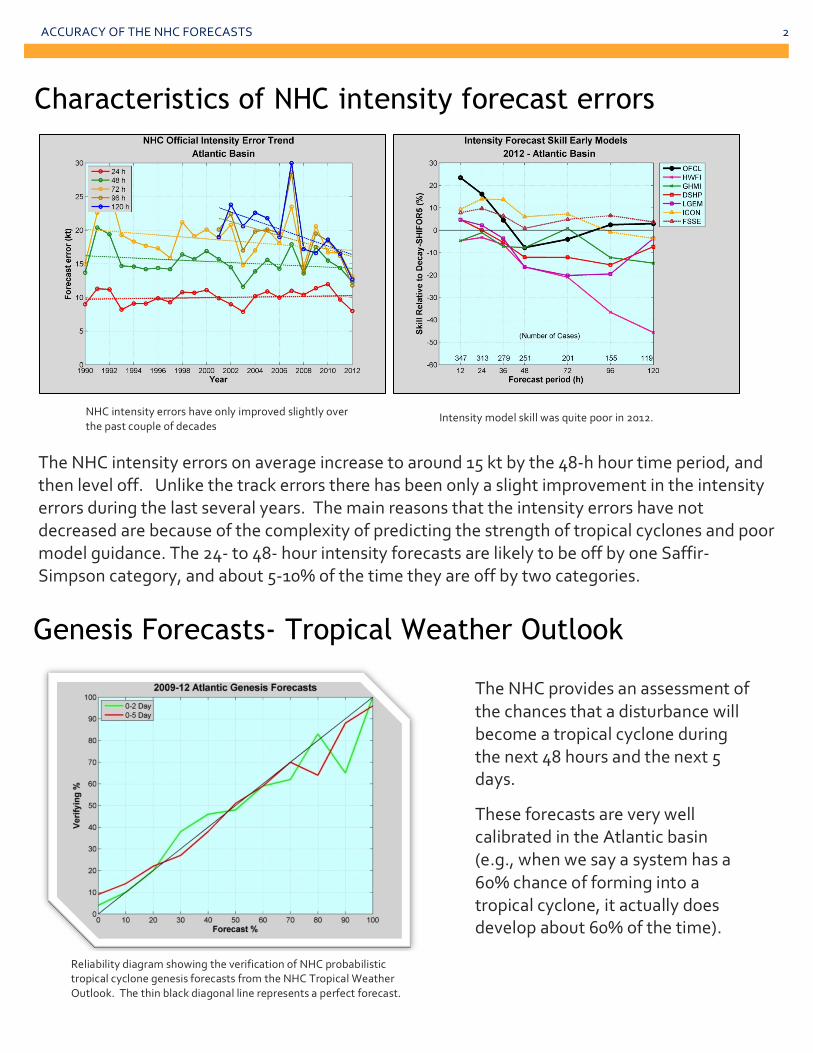
The NHC intensity errors on average increase to around 15 kt by the 48-‐h hour time period, and then level off. Unlike the track errors there has been only a slight improvement in the intensity errors during the last several years. The main reasons that the intensity errors have not decreased are because of the complexity of predicting the strength of tropical cyclones and poor model guidance. The 24-‐ to 48-‐ hour intensity forecasts are likely to be off by one Saffir-‐Simpson category, and about 5-‐10% of the time they are off by two categories.
Characteristics of NHC intensity forecast errors
NHC intensity errors have only improved slightly over the past couple of decades
Intensity model skill was quite poor in 2012.
Genesis Forecasts- Tropical Weather Outlook
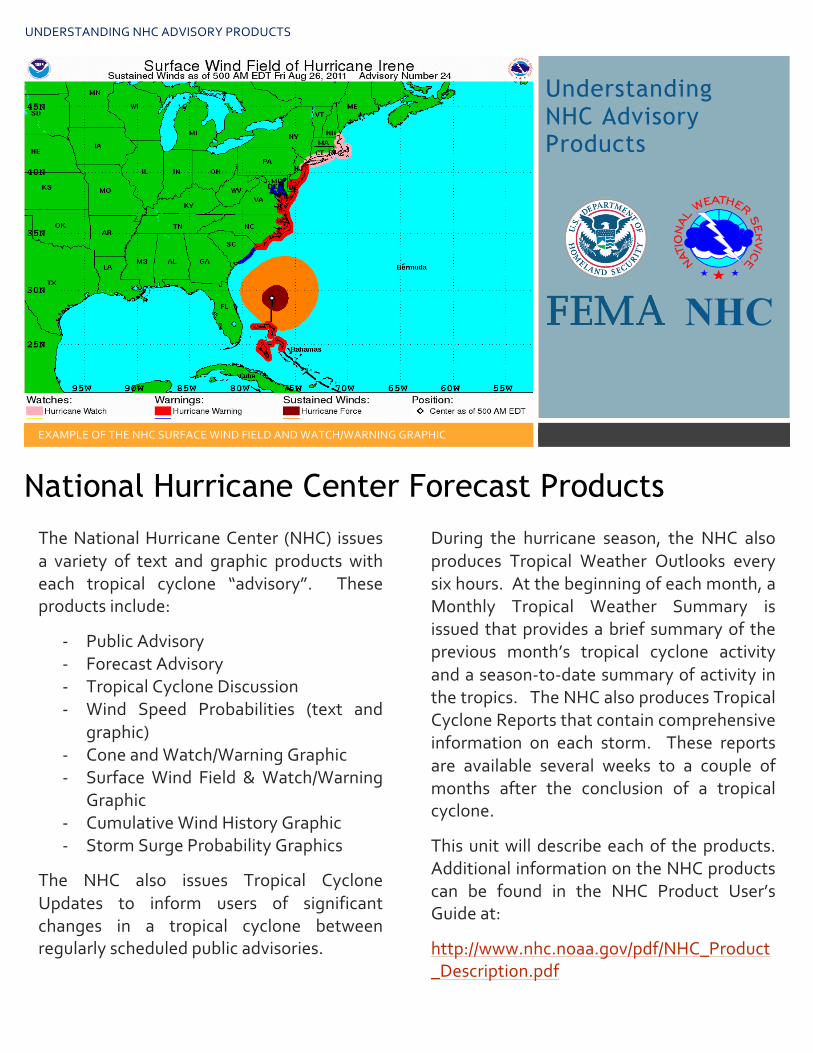
The NHC provides an assessment of the chances that a disturbance will become a tropical cyclone during the next 48 hours and the next 5 days.
These forecasts are very well calibrated in the Atlantic basin (e.g., when we say a system has a 60% chance of forming into a tropical cyclone, it actually does develop about 60% of the time).
Reliability diagram showing the verification of NHC probabilistic tropical cyclone genesis forecasts from the NHC Tropical Weather Outlook. The thin black diagonal line represents a perfect forecast.
UNDERSTANDING NHC ADVISORY PRODUCTS
Understanding NHC Advisory Products
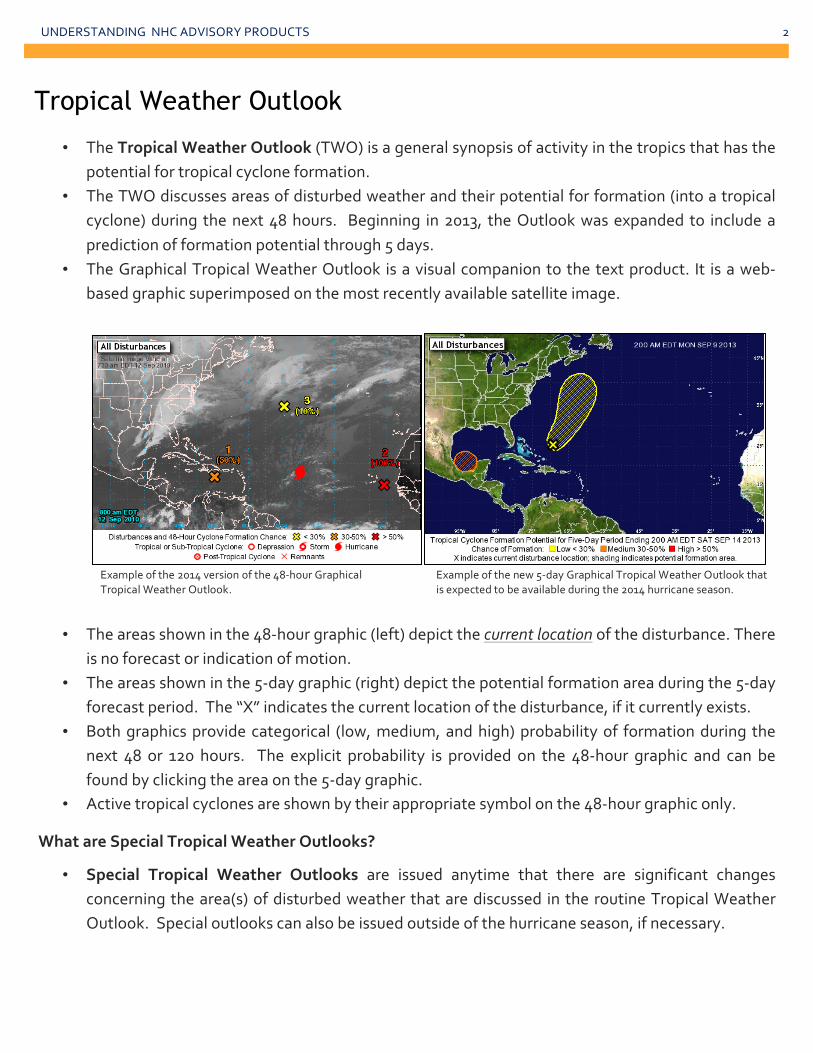
EXAMPLE OF THE NHC SURFACE WIND FIELD AND WATCH/WARNING GRAPHIC
The National Hurricane Center (NHC) issues a variety of text and graphic products with each tropical cyclone “advisory”. These products include:
-‐ Public Advisory -‐ Forecast Advisory -‐ Tropical Cyclone Discussion -‐ Wind Speed Probabilities (text and
graphic) -‐ Cone and Watch/Warning Graphic -‐ Surface Wind Field & Watch/Warning
Graphic -‐ Cumulative Wind History Graphic -‐ Storm Surge Probability Graphics
The NHC also issues Tropical Cyclone Updates to inform users of significant changes in a tropical cyclone between regularly scheduled public advisories.
During the hurricane season, the NHC also produces Tropical Weather Outlooks every six hours. At the beginning of each month, a Monthly Tropical Weather Summary is issued that provides a brief summary of the previous month’s tropical cyclone activity and a season-‐to-‐date summary of activity in the tropics. The NHC also produces Tropical Cyclone Reports that contain comprehensive information on each storm. These reports are available several weeks to a couple of months after the conclusion of a tropical cyclone.
This unit will describe each of the products. Additional information on the NHC products can be found in the NHC Product User’s Guide at:
http://www.nhc.noaa.gov/pdf/NHC_Product_Description.pdf
NHC
National Hurricane Center Forecast Products
UNDERSTANDING NHC ADVISORY PRODUCTS 2
• The Tropical Weather Outlook (TWO) is a general synopsis of activity in the tropics that has the potential for tropical cyclone formation.
• The TWO discusses areas of disturbed weather and their potential for formation (into a tropical cyclone) during the next 48 hours. Beginning in 2013, the Outlook was expanded to include a prediction of formation potential through 5 days.
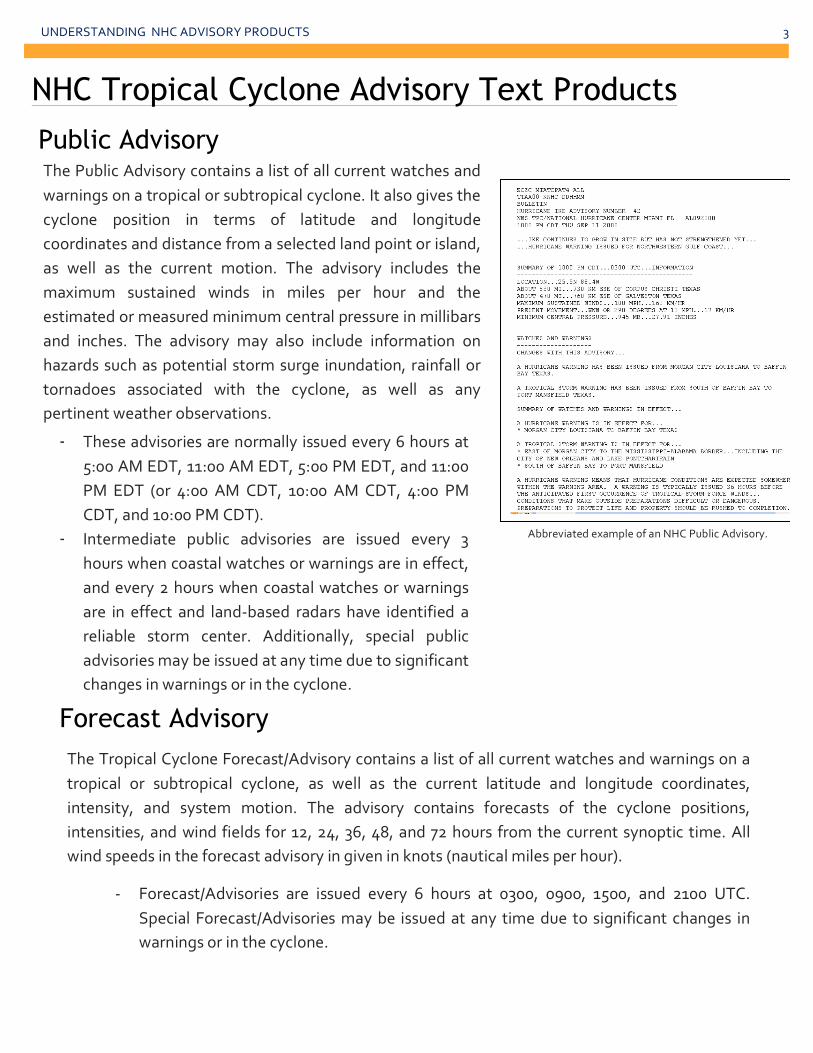
• The Graphical Tropical Weather Outlook is a visual companion to the text product. It is a web-‐based graphic superimposed on the most recently available satellite image.
• The areas shown in the 48-‐hour graphic (left) depict the current location of the disturbance. There is no forecast or indication of motion.
• The areas shown in the 5-‐day graphic (right) depict the potential formation area during the 5-‐day forecast period. The “X” indicates the current location of the disturbance, if it currently exists.
• Both graphics provide categorical (low, medium, and high) probability of formation during the next 48 or 120 hours. The explicit probability is provided on the 48-‐hour graphic and can be found by clicking the area on the 5-‐day graphic.
• Active tropical cyclones are shown by their appropriate symbol on the 48-‐hour graphic only.
What are Special Tropical Weather Outlooks?
• Special Tropical Weather Outlooks are issued anytime that there are significant changes concerning the area(s) of disturbed weather that are discussed in the routine Tropical Weather Outlook. Special outlooks can also be issued outside of the hurricane season, if necessary.
Tropical Weather Outlook
Example of the 2014 version of the 48-‐hour Graphical Tropical Weather Outlook.
Example of the new 5-‐day Graphical Tropical Weather Outlook that is expected to be available during the 2014 hurricane season.
UNDERSTANDING NHC ADVISORY PRODUCTS 3
NHC Tropical Cyclone Advisory Text Products
Public Advisory
The Public Advisory contains a list of all current watches and warnings on a tropical or subtropical cyclone. It also gives the cyclone position in terms of latitude and longitude coordinates and distance from a selected land point or island, as well as the current motion. The advisory includes the maximum sustained winds in miles per hour and the estimated or measured minimum central pressure in millibars and inches. The advisory may also include information on hazards such as potential storm surge inundation, rainfall or tornadoes associated with the cyclone, as well as any pertinent weather observations.
- These advisories are normally issued every 6 hours at 5:00 AM EDT, 11:00 AM EDT, 5:00 PM EDT, and 11:00 PM EDT (or 4:00 AM CDT, 10:00 AM CDT, 4:00 PM CDT, and 10:00 PM CDT).
- Intermediate public advisories are issued every 3 hours when coastal watches or warnings are in effect, and every 2 hours when coastal watches or warnings are in effect and land-‐based radars have identified a reliable storm center. Additionally, special public advisories may be issued at any time due to significant changes in warnings or in the cyclone.
The Tropical Cyclone Forecast/Advisory contains a list of all current watches and warnings on a tropical or subtropical cyclone, as well as the current latitude and longitude coordinates, intensity, and system motion. The advisory contains forecasts of the cyclone positions, intensities, and wind fields for 12, 24, 36, 48, and 72 hours from the current synoptic time. All wind speeds in the forecast advisory in given in knots (nautical miles per hour).
-‐ Forecast/Advisories are issued every 6 hours at 0300, 0900, 1500, and 2100 UTC. Special Forecast/Advisories may be issued at any time due to significant changes in warnings or in the cyclone.
Forecast Advisory
Abbreviated example of an NHC Public Advisory.
UNDERSTANDING NHC ADVISORY PRODUCTS 4
The Tropical Cyclone Discussion describes the rationale for the forecaster’s analysis and forecast of a tropical cyclone. It will typically discuss the observations justifying the analyzed intensity of the cyclone, a description of the environmental factors expected to influence the cyclone’s future track and intensity, and a description of the numerical guidance models. It may also describe the forecaster’s degree of confidence in the official forecast, discuss possible alternate scenarios, and highlight unusual hazards. The product also includes a table of forecast positions and intensities in knots and miles per hour out to 120 h. This table also indicates the forecast status of the cyclone, which may include any of the following: inland, dissipated, or post tropical. “Post tropical” describes a cyclone that no longer possesses sufficient tropical characteristics to be considered a tropical cyclone; however, these cyclones can continue to produce heavy rains and high winds. A remnant low is a post-‐tropical cyclone that no longer possesses the organized thunderstorms required of a tropical cyclone and has maximum sustained winds of less than 34 knots. An extratropical cyclone is a cyclone of any intensity for which the primary energy source results from the temperature contrast between warm and cold air masses.
-‐ The Tropical Cyclone Discussion is issued for active cyclones every six hours at 5:00 AM EDT (4:00 AM CDT), 11:00 AM EDT (10:00 AM CDT), 5:00 PM EDT (4:00 PM CDT), and 11:00 PM EDT (10:00 PM CDT).
The Tropical Cyclone Surface Wind Speed Probability product is a tabular text product that provides probabilistic (i.e., the likelihood of an event, expressed as a percentage) information on the future intensity of a tropical cyclone, as well as the likelihood of sustained (1-‐min average) winds meeting or exceeding specific thresholds (i.e., tropical-‐storm-‐ and hurricane-‐force) at particular locations.
-‐ More on this product will be presented in Unit 11 of this course.
Tropical Cyclone Discussion
Tropical Cyclone Wind Speed Probabilities
UNDERSTANDING NHC ADVISORY PRODUCTS 5
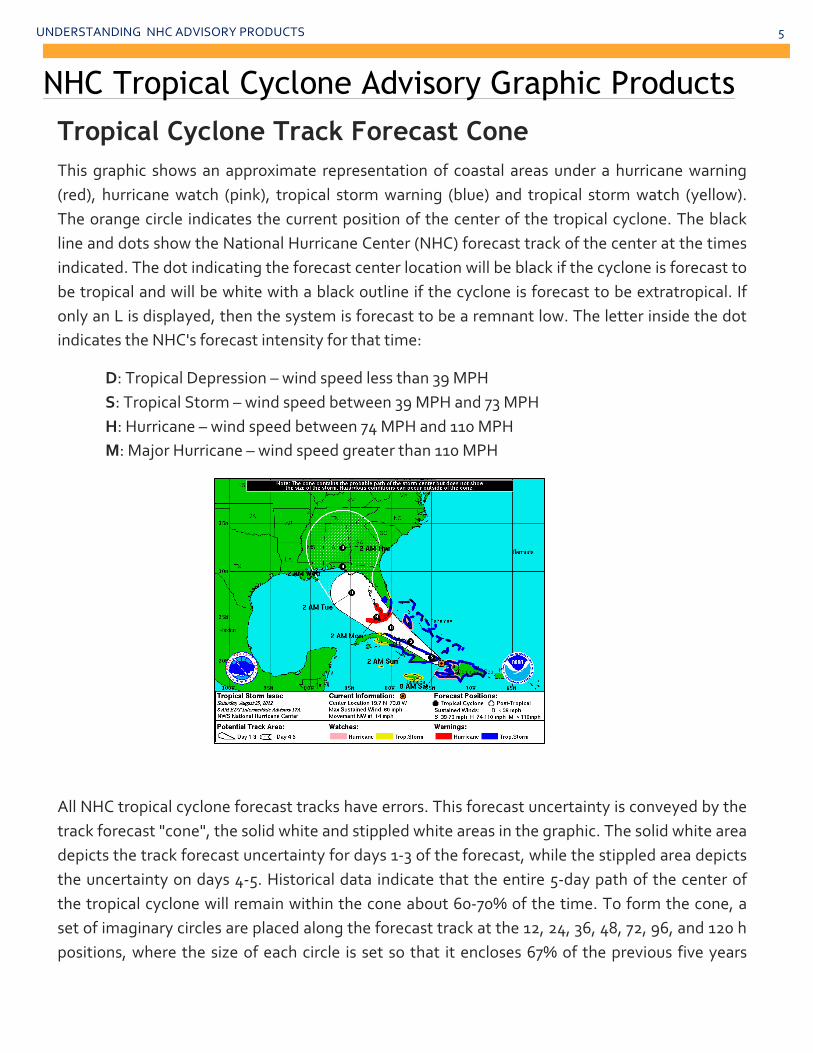
Tropical Cyclone Track Forecast Cone This graphic shows an approximate representation of coastal areas under a hurricane warning (red), hurricane watch (pink), tropical storm warning (blue) and tropical storm watch (yellow). The orange circle indicates the current position of the center of the tropical cyclone. The black line and dots show the National Hurricane Center (NHC) forecast track of the center at the times indicated. The dot indicating the forecast center location will be black if the cyclone is forecast to be tropical and will be white with a black outline if the cyclone is forecast to be extratropical. If only an L is displayed, then the system is forecast to be a remnant low. The letter inside the dot indicates the NHC's forecast intensity for that time:
D: Tropical Depression – wind speed less than 39 MPH S: Tropical Storm – wind speed between 39 MPH and 73 MPH H: Hurricane – wind speed between 74 MPH and 110 MPH M: Major Hurricane – wind speed greater than 110 MPH
All NHC tropical cyclone forecast tracks have errors. This forecast uncertainty is conveyed by the track forecast "cone", the solid white and stippled white areas in the graphic. The solid white area depicts the track forecast uncertainty for days 1-‐3 of the forecast, while the stippled area depicts the uncertainty on days 4-‐5. Historical data indicate that the entire 5-‐day path of the center of the tropical cyclone will remain within the cone about 60-‐70% of the time. To form the cone, a set of imaginary circles are placed along the forecast track at the 12, 24, 36, 48, 72, 96, and 120 h positions, where the size of each circle is set so that it encloses 67% of the previous five years
NHC Tropical Cyclone Advisory Graphic Products
UNDERSTANDING NHC ADVISORY PRODUCTS 6
official forecast errors. The cone is then formed by smoothly connecting the area swept out by the set of circles.
It is also important to realize that a tropical cyclone is not a point. Their effects can span many hundreds of miles from the center. The area experiencing hurricane-‐force (one-‐minute average wind speeds of at least 74 mph) and tropical-‐storm-‐force (one-‐minute average wind speeds of 39-‐73 mph) winds can extend well beyond the white areas shown enclosing the most likely track area of the center.
• The Cone Graphic is normally issued every 6 hours at 5:00 AM EDT, 11:00 AM EDT, 5:00 PM EDT, and 11:00 PM EDT (or 4:00 AM CDT, 10:00 AM CDT, 4:00 PM CDT, and 10:00 PM CDT).
• The graphics also will be updated when intermediate public advisories are issued, and special graphics may be issued at any time due to significant changes in warnings or in the cyclone.
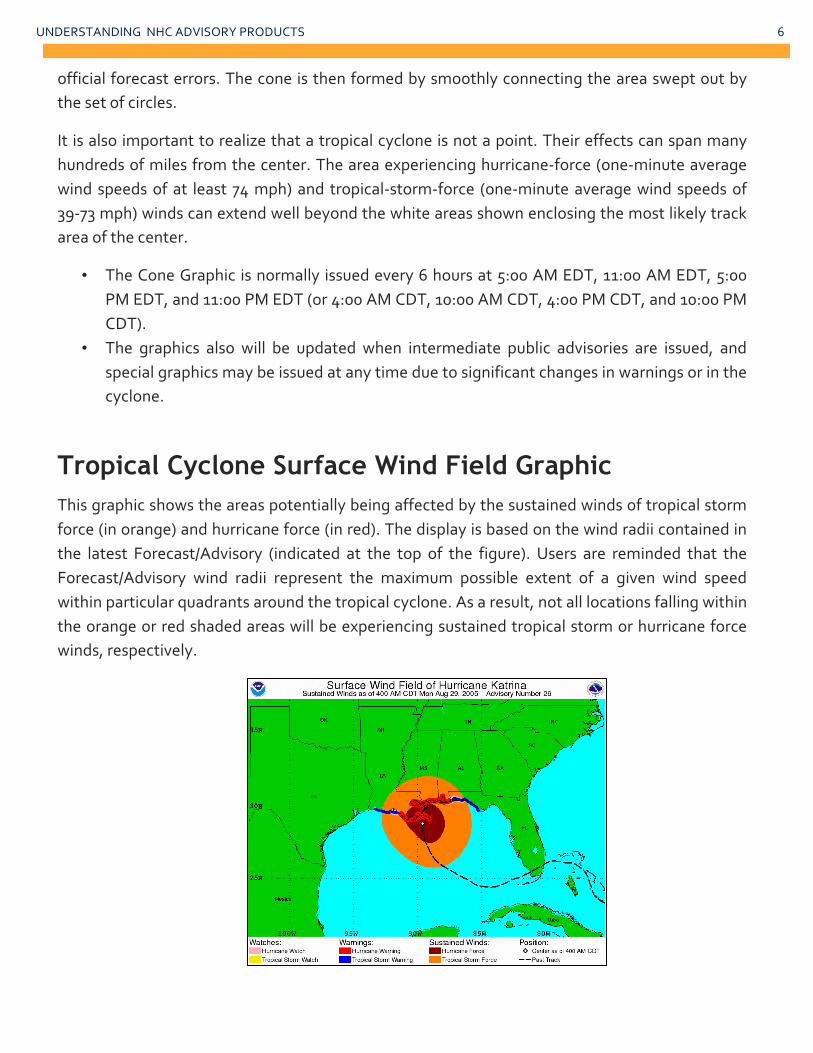
Tropical Cyclone Surface Wind Field Graphic This graphic shows the areas potentially being affected by the sustained winds of tropical storm force (in orange) and hurricane force (in red). The display is based on the wind radii contained in the latest Forecast/Advisory (indicated at the top of the figure). Users are reminded that the Forecast/Advisory wind radii represent the maximum possible extent of a given wind speed within particular quadrants around the tropical cyclone. As a result, not all locations falling within the orange or red shaded areas will be experiencing sustained tropical storm or hurricane force winds, respectively.
UNDERSTANDING NHC ADVISORY PRODUCTS 7
In addition to the wind field, this graphic shows an approximate representation of coastal areas under a hurricane warning (red), hurricane watch (pink), tropical storm warning (blue) and tropical storm watch (yellow). The white dot indicates the current position of the center of the tropical cyclone, and the dashed line shows the history of the track of the center of the tropical cyclone.
• The Surface Wind Field Graphic is issued every 6 hours at 5:00 AM EDT, 11:00 AM EDT, 5:00 PM EDT, and 11:00 PM EDT (or 4:00 AM CDT, 10:00 AM CDT, 4:00 PM CDT, and 10:00 PM CDT). Special graphics may be issued at any time due to significant changes in warnings or in the cyclone.
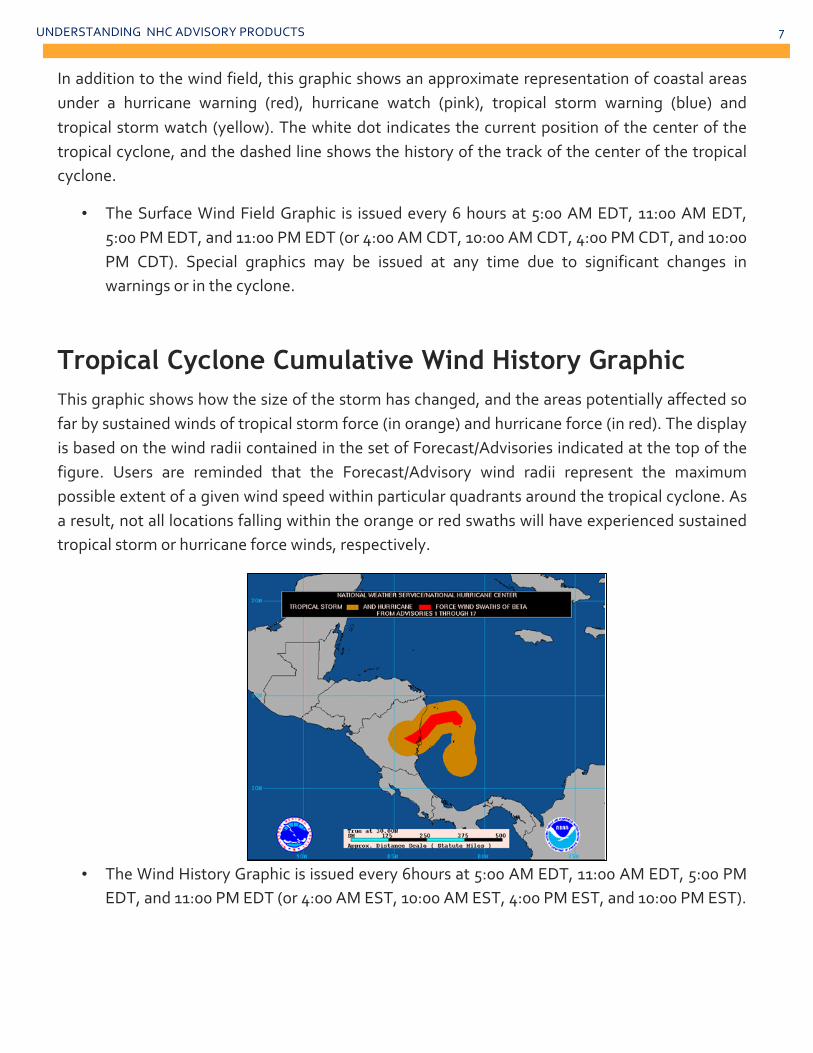
Tropical Cyclone Cumulative Wind History Graphic This graphic shows how the size of the storm has changed, and the areas potentially affected so far by sustained winds of tropical storm force (in orange) and hurricane force (in red). The display is based on the wind radii contained in the set of Forecast/Advisories indicated at the top of the figure. Users are reminded that the Forecast/Advisory wind radii represent the maximum possible extent of a given wind speed within particular quadrants around the tropical cyclone. As a result, not all locations falling within the orange or red swaths will have experienced sustained tropical storm or hurricane force winds, respectively.
• The Wind History Graphic is issued every 6hours at 5:00 AM EDT, 11:00 AM EDT, 5:00 PM
EDT, and 11:00 PM EDT (or 4:00 AM EST, 10:00 AM EST, 4:00 PM EST, and 10:00 PM EST).
UNDERSTANDING NHC ADVISORY PRODUCTS 8
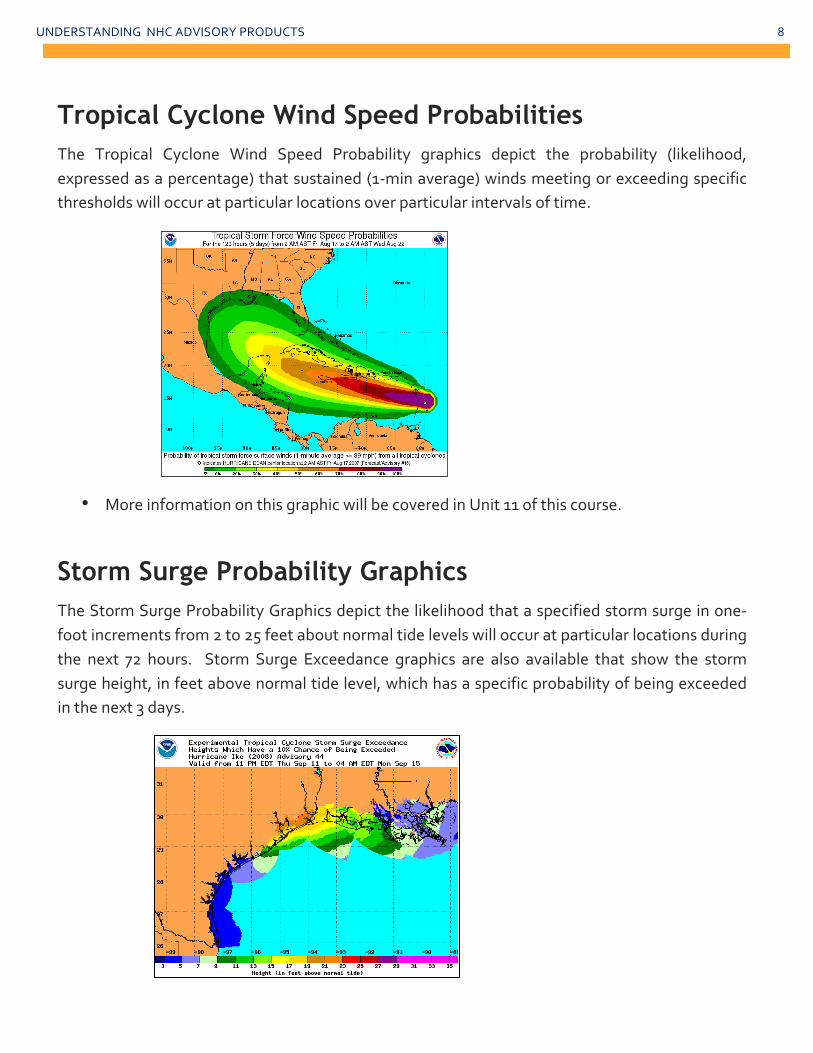
Tropical Cyclone Wind Speed Probabilities The Tropical Cyclone Wind Speed Probability graphics depict the probability (likelihood, expressed as a percentage) that sustained (1-‐min average) winds meeting or exceeding specific thresholds will occur at particular locations over particular intervals of time.
• More information on this graphic will be covered in Unit 11 of this course.
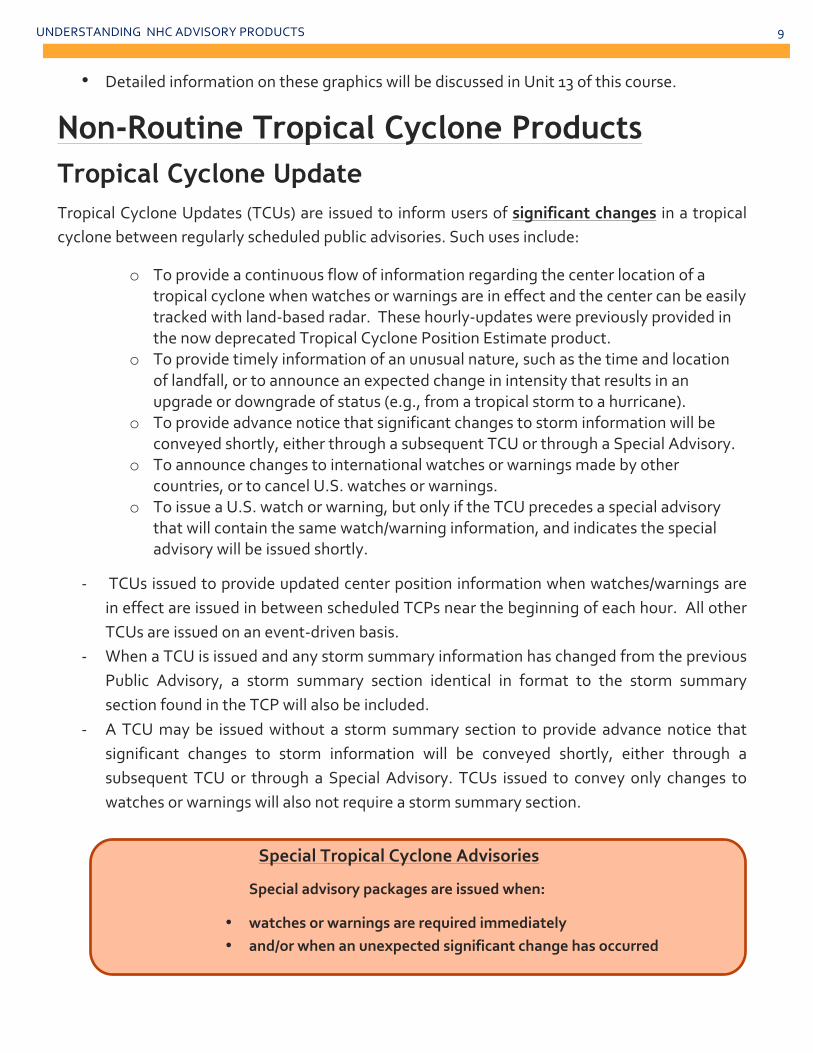
Storm Surge Probability Graphics The Storm Surge Probability Graphics depict the likelihood that a specified storm surge in one-‐foot increments from 2 to 25 feet about normal tide levels will occur at particular locations during the next 72 hours. Storm Surge Exceedance graphics are also available that show the storm surge height, in feet above normal tide level, which has a specific probability of being exceeded in the next 3 days.
UNDERSTANDING NHC ADVISORY PRODUCTS 9
• Detailed information on these graphics will be discussed in Unit 13 of this course.
Non-Routine Tropical Cyclone Products Tropical Cyclone Update Tropical Cyclone Updates (TCUs) are issued to inform users of significant changes in a tropical cyclone between regularly scheduled public advisories. Such uses include:
o To provide a continuous flow of information regarding the center location of a tropical cyclone when watches or warnings are in effect and the center can be easily tracked with land-‐based radar. These hourly-‐updates were previously provided in the now deprecated Tropical Cyclone Position Estimate product.
o To provide timely information of an unusual nature, such as the time and location of landfall, or to announce an expected change in intensity that results in an upgrade or downgrade of status (e.g., from a tropical storm to a hurricane).
o To provide advance notice that significant changes to storm information will be conveyed shortly, either through a subsequent TCU or through a Special Advisory.
o To announce changes to international watches or warnings made by other countries, or to cancel U.S. watches or warnings.
o To issue a U.S. watch or warning, but only if the TCU precedes a special advisory that will contain the same watch/warning information, and indicates the special advisory will be issued shortly.
-‐ TCUs issued to provide updated center position information when watches/warnings are in effect are issued in between scheduled TCPs near the beginning of each hour. All other TCUs are issued on an event-‐driven basis.
-‐ When a TCU is issued and any storm summary information has changed from the previous Public Advisory, a storm summary section identical in format to the storm summary section found in the TCP will also be included.
-‐ A TCU may be issued without a storm summary section to provide advance notice that significant changes to storm information will be conveyed shortly, either through a subsequent TCU or through a Special Advisory. TCUs issued to convey only changes to watches or warnings will also not require a storm summary section.
Special Tropical Cyclone Advisories
Special advisory packages are issued when:
• watches or warnings are required immediately • and/or when an unexpected significant change has occurred
UNDERSTANDING NHC ADVISORY PRODUCTS 10
Other NHC Tropical Cyclone Products
Monthly Tropical Weather Summary The Monthly Tropical Weather Summary is issued on the first day of every month during the hurricane season. It briefly describes the previous month's tropical cyclone activity and the overall activity of the season so far. The summary includes a table of basic meteorological statistics, such as the dates of occurrence and estimated peak intensity for all of the season's tropical cyclones to date.
Tropical Cyclone Reports The National Hurricane Center's Tropical Cyclone Reports contain comprehensive information on each storm, including synoptic history, meteorological statistics, casualties and damages, and the post-‐analysis best track (six-‐hourly positions and intensities). Tropical Cyclone Reports (TCRs) are written after a tropical cyclone event has ended, and all pertinent data has been gathered and analyzed. Once completed, the TCRs are posted to the archive section of the NHC website (http://www.nhc.noaa.gov/data/#tcr).
NHC WIND SPEED PROBABILITIES
NHC Wind Speed Probabilities
PROBABILITY OF TROPICAL-‐STORM-‐FORCE WINDS FOR HURRICANE IRENE-‐ ADVISORY 14
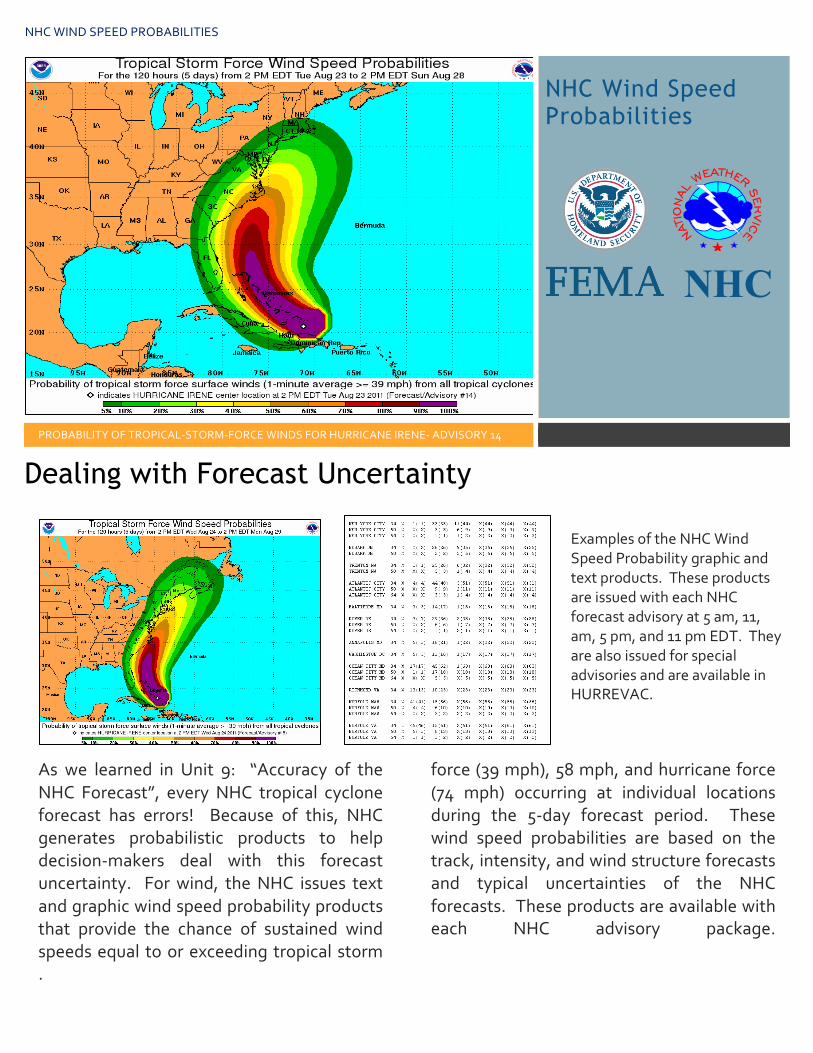
As we learned in Unit 9: “Accuracy of the NHC Forecast”, every NHC tropical cyclone forecast has errors! Because of this, NHC generates probabilistic products to help decision-‐makers deal with this forecast uncertainty. For wind, the NHC issues text and graphic wind speed probability products that provide the chance of sustained wind speeds equal to or exceeding tropical storm
force (39 mph), 58 mph, and hurricane force (74 mph) occurring at individual locations during the 5-‐day forecast period. These wind speed probabilities are based on the track, intensity, and wind structure forecasts and typical uncertainties of the NHC forecasts. These products are available with each NHC advisory package.
.
NHC
Dealing with Forecast Uncertainty
Examples of the NHC Wind Speed Probability graphic and text products. These products are issued with each NHC forecast advisory at 5 am, 11, am, 5 pm, and 11 pm EDT. They are also issued for special advisories and are available in HURREVAC.
NHC WIND SPEED PROBABILITIES 2
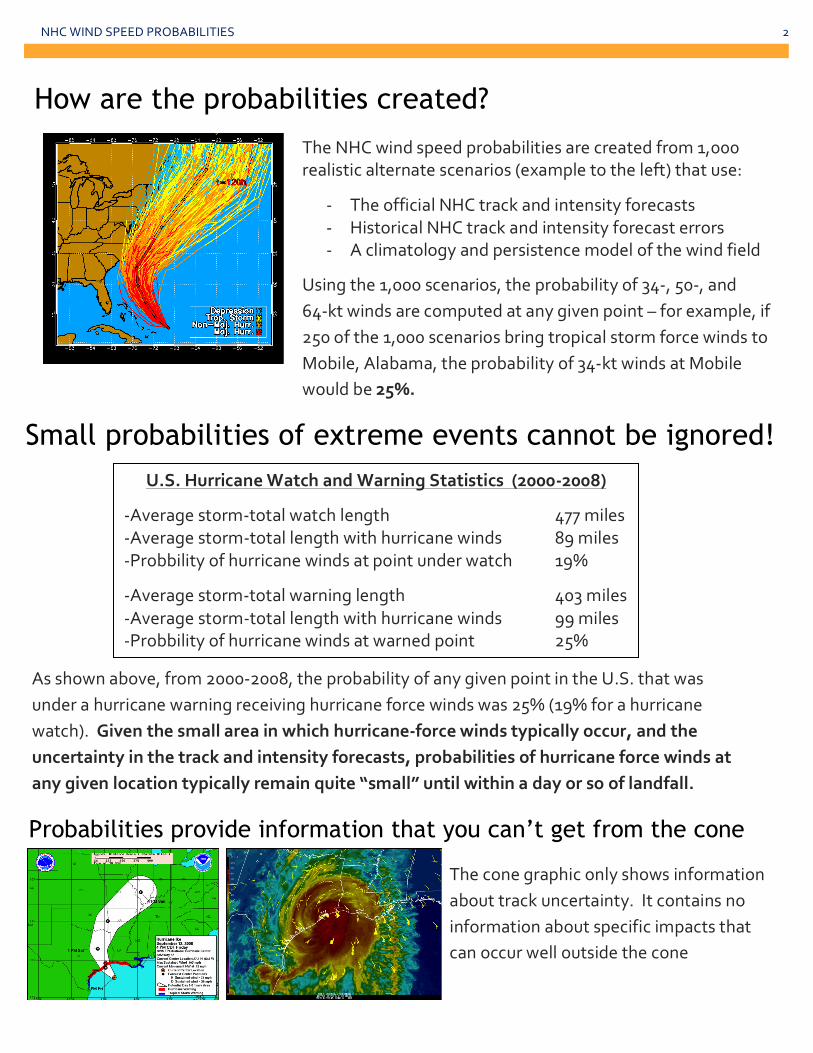
How are the probabilities created?
The NHC wind speed probabilities are created from 1,000 realistic alternate scenarios (example to the left) that use:
-‐ The official NHC track and intensity forecasts -‐ Historical NHC track and intensity forecast errors -‐ A climatology and persistence model of the wind field
Using the 1,000 scenarios, the probability of 34-‐, 50-‐, and 64-‐kt winds are computed at any given point – for example, if 250 of the 1,000 scenarios bring tropical storm force winds to Mobile, Alabama, the probability of 34-‐kt winds at Mobile would be 25%.
Small probabilities of extreme events cannot be ignored!
U.S. Hurricane Watch and Warning Statistics (2000-‐2008)
-‐Average st0rm-‐total watch length 477 miles -‐Average storm-‐total length with hurricane winds 89 miles -‐Probbility of hurricane winds at point under watch 19%
-‐Average st0rm-‐total warning length 403 miles -‐Average storm-‐total length with hurricane winds 99 miles -‐Probbility of hurricane winds at warned point 25%
As shown above, from 2000-‐2008, the probability of any given point in the U.S. that was under a hurricane warning receiving hurricane force winds was 25% (19% for a hurricane watch). Given the small area in which hurricane-‐force winds typically occur, and the uncertainty in the track and intensity forecasts, probabilities of hurricane force winds at any given location typically remain quite “small” until within a day or so of landfall.
Probabilities provide information that you can’t get from the cone
The cone graphic only shows information about track uncertainty. It contains no information about specific impacts that can occur well outside the cone
NHC WIND SPEED PROBABILITIES 3
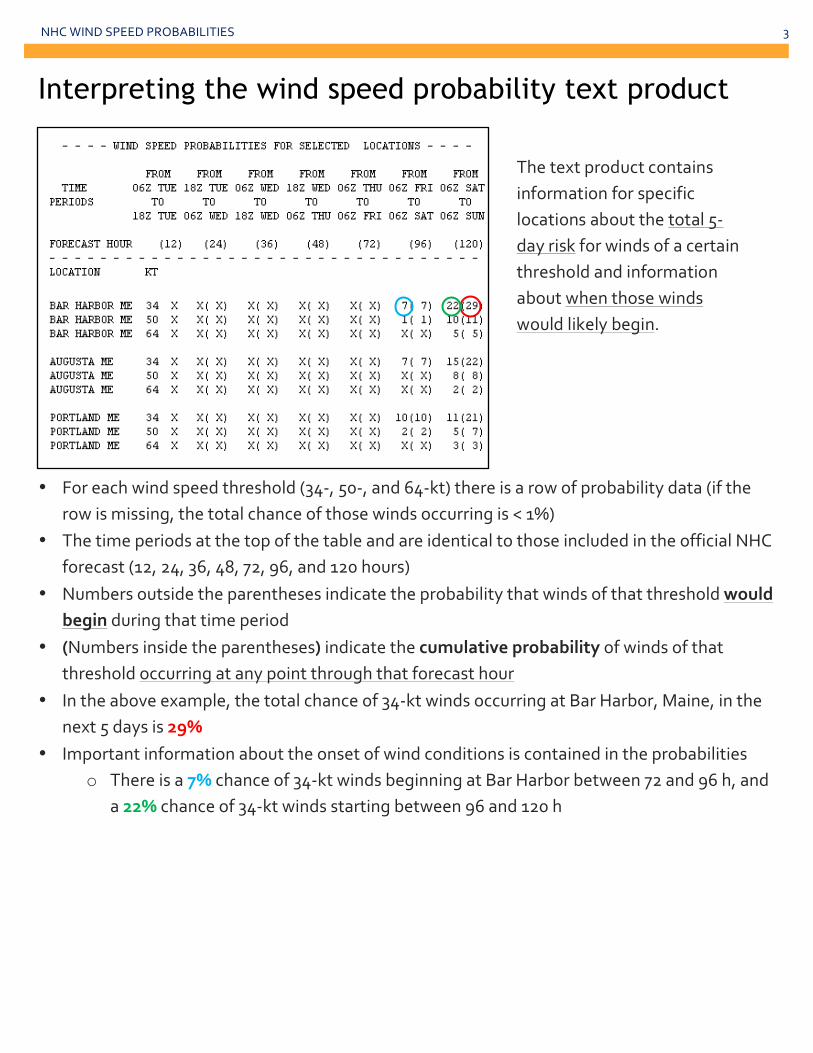
• For each wind speed threshold (34-‐, 50-‐, and 64-‐kt) there is a row of probability data (if the
row is missing, the total chance of those winds occurring is < 1%) • The time periods at the top of the table and are identical to those included in the official NHC
forecast (12, 24, 36, 48, 72, 96, and 120 hours) • Numbers outside the parentheses indicate the probability that winds of that threshold would
begin during that time period • (Numbers inside the parentheses) indicate the cumulative probability of winds of that
threshold occurring at any point through that forecast hour • In the above example, the total chance of 34-‐kt winds occurring at Bar Harbor, Maine, in the
next 5 days is 29% • Important information about the onset of wind conditions is contained in the probabilities
o There is a 7% chance of 34-‐kt winds beginning at Bar Harbor between 72 and 96 h, and a 22% chance of 34-‐kt winds starting between 96 and 120 h
The text product contains information for specific locations about the total 5-‐day risk for winds of a certain threshold and information about when those winds would likely begin.
Interpreting the wind speed probability text product
NHC WIND SPEED PROBABILITIES 4
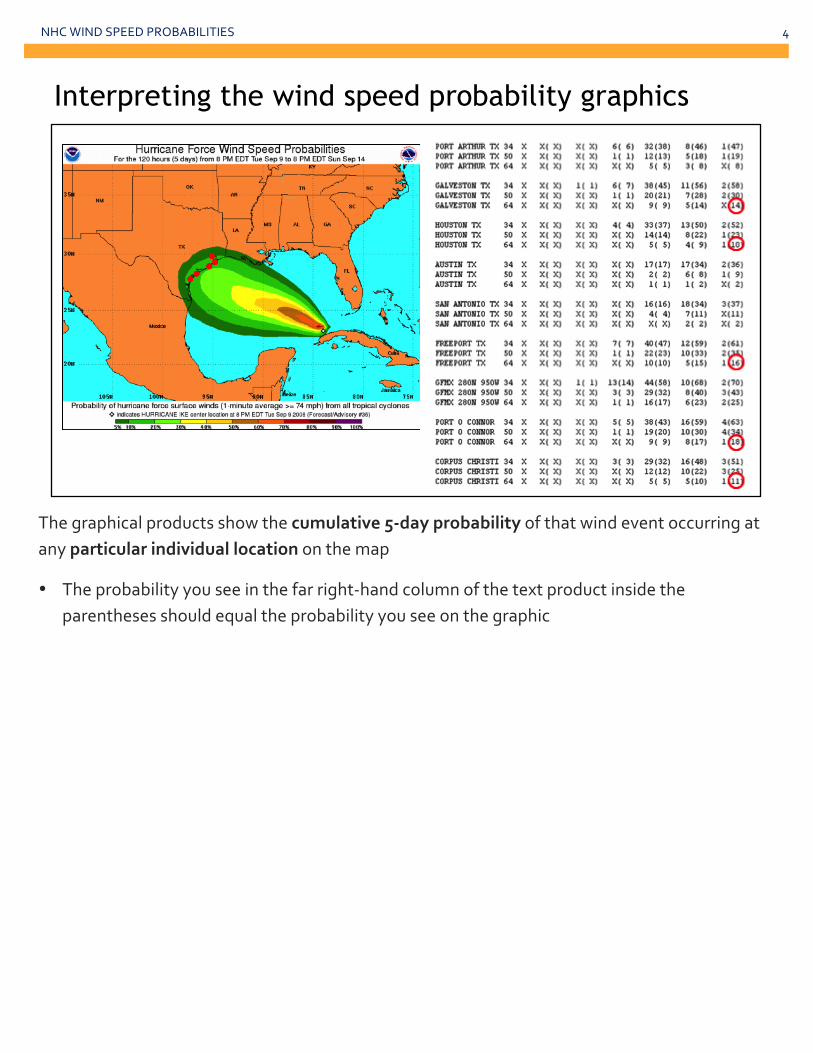
The graphical products show the cumulative 5-‐day probability of that wind event occurring at any particular individual location on the map
• The probability you see in the far right-‐hand column of the text product inside the parentheses should equal the probability you see on the graphic
Interpreting the wind speed probability graphics
INTRODUCTION TO STORM SURGE
Introduction to Storm Surge
National Hurricane Center Storm Surge Unit
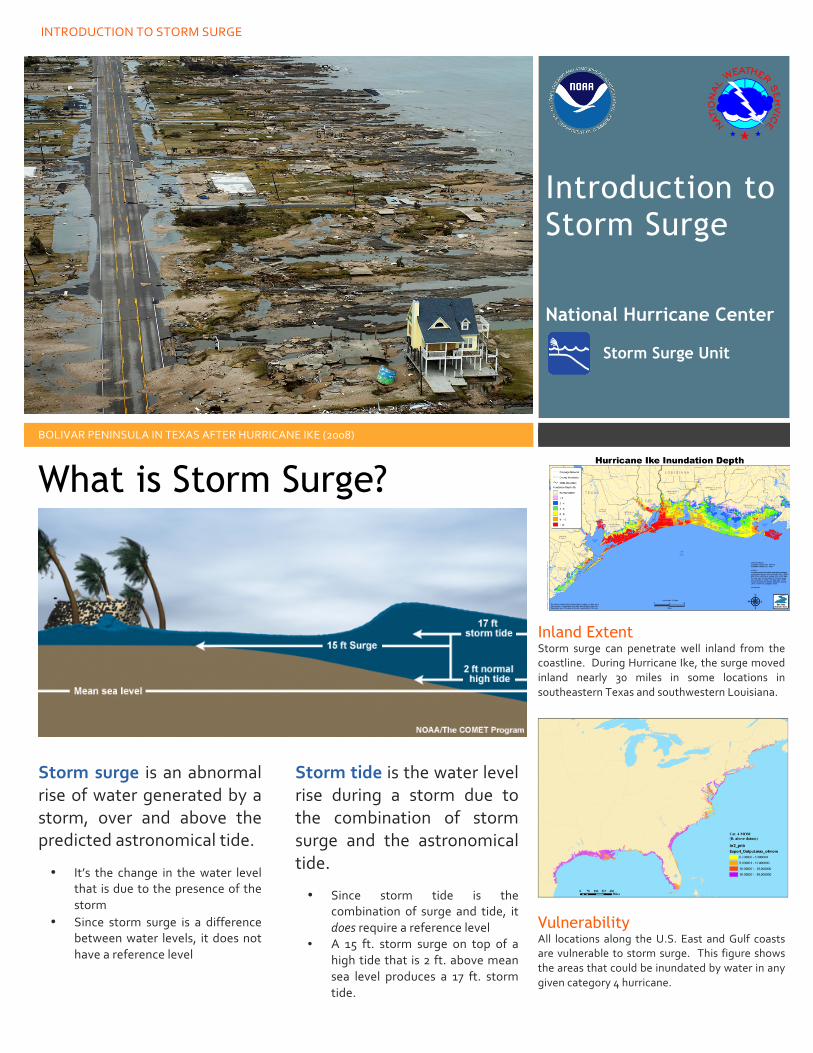
BOLIVAR PENINSULA IN TEXAS AFTER HURRICANE IKE (2008)
Storm surge is an abnormal rise of water generated by a storm, over and above the predicted astronomical tide.
• It’s the change in the water level that is due to the presence of the storm
• Since storm surge is a difference between water levels, it does not have a reference level
Storm tide is the water level rise during a storm due to the combination of storm surge and the astronomical tide.
• Since storm tide is the combination of surge and tide, it does require a reference level
• A 15 ft. storm surge on top of a high tide that is 2 ft. above mean sea level produces a 17 ft. storm tide.
Inland Extent Storm surge can penetrate well inland from the coastline. During Hurricane Ike, the surge moved inland nearly 30 miles in some locations in southeastern Texas and southwestern Louisiana.
Vulnerability All locations along the U.S. East and Gulf coasts are vulnerable to storm surge. This figure shows the areas that could be inundated by water in any given category 4 hurricane.
What is Storm Surge?
INTRODUCTION TO STORM SURGE 2
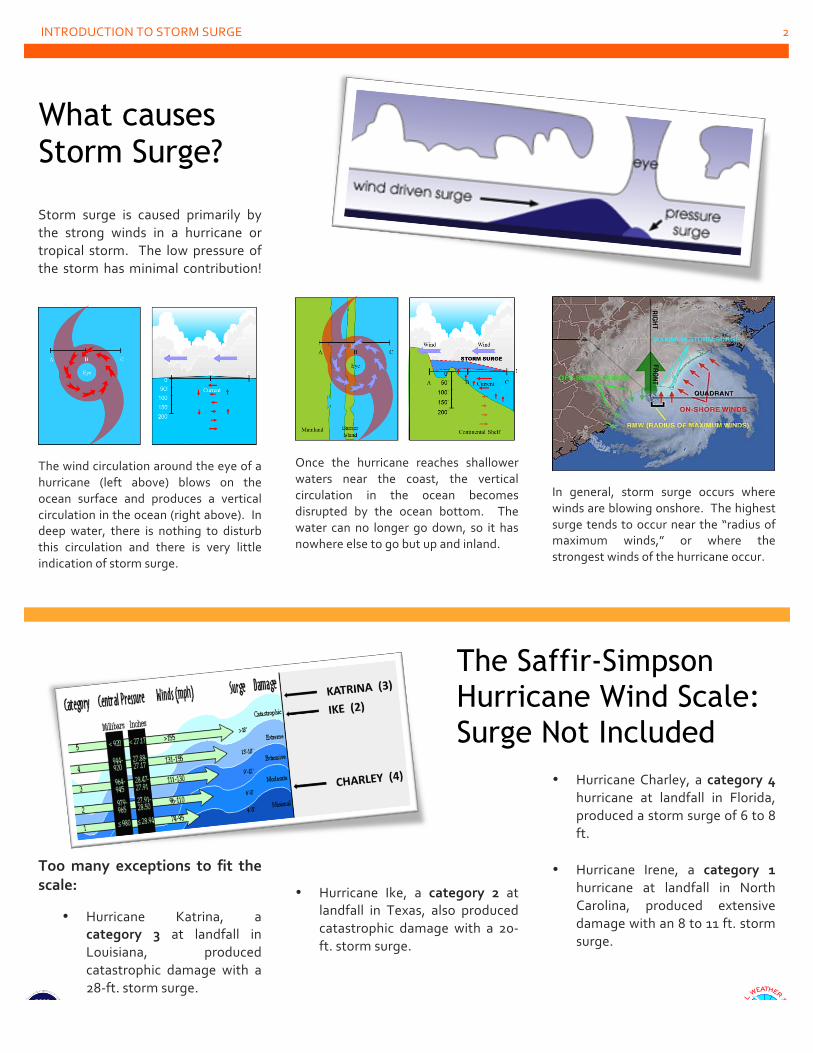
Storm surge is caused primarily by the strong winds in a hurricane or tropical storm. The low pressure of the storm has minimal contribution!
The wind circulation around the eye of a hurricane (left above) blows on the ocean surface and produces a vertical circulation in the ocean (right above). In deep water, there is nothing to disturb this circulation and there is very little indication of storm surge.
Too many exceptions to fit the scale:
• Hurricane Katrina, a category 3 at landfall in Louisiana, produced catastrophic damage with a 28-‐ft. storm surge.
Once the hurricane reaches shallower waters near the coast, the vertical circulation in the ocean becomes disrupted by the ocean bottom. The water can no longer go down, so it has nowhere else to go but up and inland.
• Hurricane Ike, a category 2 at landfall in Texas, also produced catastrophic damage with a 20-‐ft. storm surge.
In general, storm surge occurs where winds are blowing onshore. The highest surge tends to occur near the “radius of maximum winds,” or where the strongest winds of the hurricane occur.
• Hurricane Charley, a category 4 hurricane at landfall in Florida, produced a storm surge of 6 to 8 ft.
• Hurricane Irene, a category 1 hurricane at landfall in North Carolina, produced extensive damage with an 8 to 11 ft. storm surge.
What causes Storm Surge?
The Saffir-Simpson Hurricane Wind Scale: Surge Not Included
INTRODUCTION TO STORM SURGE 3
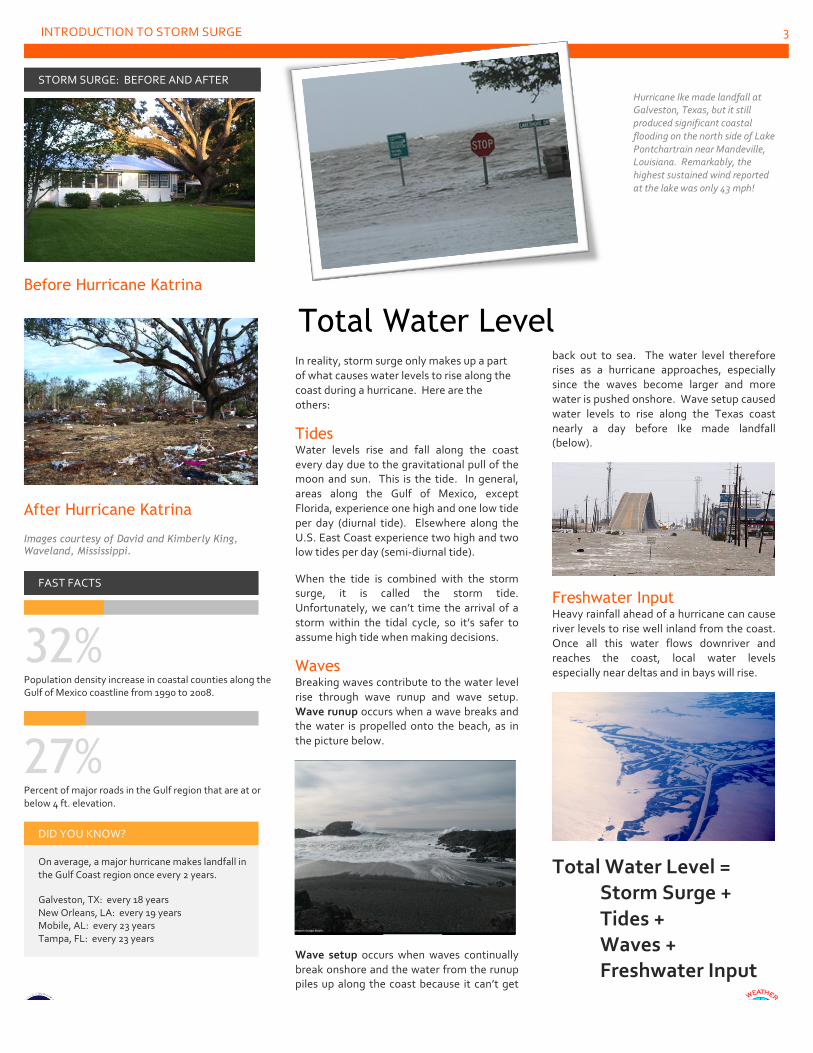
STORM SURGE: BEFORE AND AFTER
Before Hurricane Katrina
After Hurricane Katrina Images courtesy of David and Kimberly King, Waveland, Mississippi.
FAST FACTS
32% Population density increase in coastal counties along the Gulf of Mexico coastline from 1990 to 2008.
27% Percent of major roads in the Gulf region that are at or below 4 ft. elevation.
DID YOU KNOW?
On average, a major hurricane makes landfall in the Gulf Coast region once every 2 years.
Galveston, TX: every 18 years New Orleans, LA: every 19 years Mobile, AL: every 23 years Tampa, FL: every 23 years
In reality, storm surge only makes up a part of what causes water levels to rise along the coast during a hurricane. Here are the others:
Tides Water levels rise and fall along the coast every day due to the gravitational pull of the moon and sun. This is the tide. In general, areas along the Gulf of Mexico, except Florida, experience one high and one low tide per day (diurnal tide). Elsewhere along the U.S. East Coast experience two high and two low tides per day (semi-‐diurnal tide).
When the tide is combined with the storm surge, it is called the storm tide. Unfortunately, we can’t time the arrival of a storm within the tidal cycle, so it’s safer to assume high tide when making decisions.
Waves Breaking waves contribute to the water level rise through wave runup and wave setup. Wave runup occurs when a wave breaks and the water is propelled onto the beach, as in the picture below.
Wave setup occurs when waves continually break onshore and the water from the runup piles up along the coast because it can’t get
back out to sea. The water level therefore rises as a hurricane approaches, especially since the waves become larger and more water is pushed onshore. Wave setup caused water levels to rise along the Texas coast nearly a day before Ike made landfall (below).
Freshwater Input Heavy rainfall ahead of a hurricane can cause river levels to rise well inland from the coast. Once all this water flows downriver and reaches the coast, local water levels especially near deltas and in bays will rise.
Total Water Level = Storm Surge + Tides + Waves + Freshwater Input
Total Water Level
Hurricane Ike made landfall at Galveston, Texas, but it still produced significant coastal flooding on the north side of Lake Pontchartrain near Mandeville, Louisiana. Remarkably, the highest sustained wind reported at the lake was only 43 mph!
INTRODUCTION TO STORM SURGE 4
There are several factors that contribute to the amount of surge a given storm produces at a given location:
Central Pressure Lower pressure will produce a higher surge. However, as was shown on page 2, the central pressure is a minimal contributor compared to the other factors.
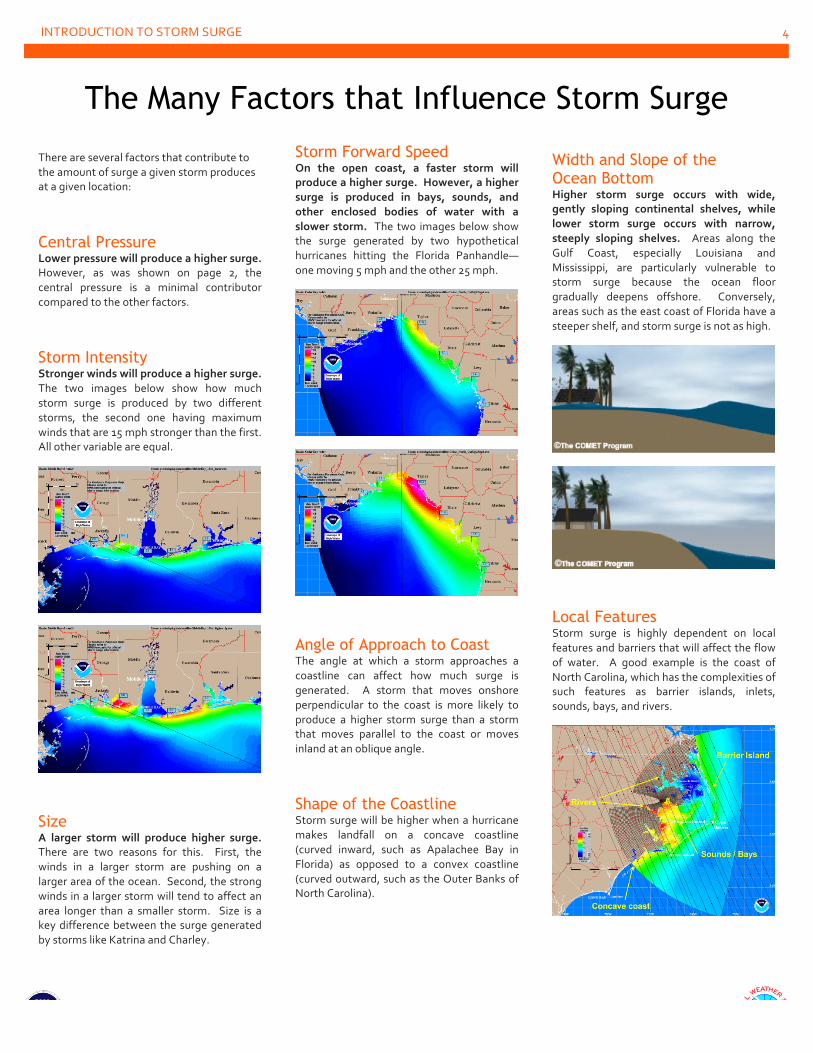
Storm Intensity Stronger winds will produce a higher surge. The two images below show how much storm surge is produced by two different storms, the second one having maximum winds that are 15 mph stronger than the first. All other variable are equal.
Size A larger storm will produce higher surge. There are two reasons for this. First, the winds in a larger storm are pushing on a larger area of the ocean. Second, the strong winds in a larger storm will tend to affect an area longer than a smaller storm. Size is a key difference between the surge generated by storms like Katrina and Charley.
Storm Forward Speed On the open coast, a faster storm will produce a higher surge. However, a higher surge is produced in bays, sounds, and other enclosed bodies of water with a slower storm. The two images below show the surge generated by two hypothetical hurricanes hitting the Florida Panhandle—one moving 5 mph and the other 25 mph.
Angle of Approach to Coast The angle at which a storm approaches a coastline can affect how much surge is generated. A storm that moves onshore perpendicular to the coast is more likely to produce a higher storm surge than a storm that moves parallel to the coast or moves inland at an oblique angle.
Shape of the Coastline Storm surge will be higher when a hurricane makes landfall on a concave coastline (curved inward, such as Apalachee Bay in Florida) as opposed to a convex coastline (curved outward, such as the Outer Banks of North Carolina).
Width and Slope of the Ocean Bottom Higher storm surge occurs with wide, gently sloping continental shelves, while lower storm surge occurs with narrow, steeply sloping shelves. Areas along the Gulf Coast, especially Louisiana and Mississippi, are particularly vulnerable to storm surge because the ocean floor gradually deepens offshore. Conversely, areas such as the east coast of Florida have a steeper shelf, and storm surge is not as high.
Local Features Storm surge is highly dependent on local features and barriers that will affect the flow of water. A good example is the coast of North Carolina, which has the complexities of such features as barrier islands, inlets, sounds, bays, and rivers.
The Many Factors that Influence Storm Surge
INTRODUCTION TO STORM SURGE 5
Tide Stations Tide stations measure the variation in water level along the coast. Since tidal cycles are predictable, storm surge can be calculated by subtracting what the water level would have been in the absence of the storm from the measured water level. NOAA’s National Ocean Service (NOS) maintains a network of approximately 175 tide stations throughout the United States, which serve as the foundation for NOAA’s tide prediction products. They are generally located in areas that are sheltered from waves. This enables a measurement of the “stillwater” height, or the height of the water when it is not disturbed by waves.
Pros: • Available in real time • Generally located in areas sheltered
from waves and are able to measure “stillwater”
• Traditionally the most reliable way of measuring surge
Cons: • Limited number of stations along the
coast, so there is often no real-‐time validation of storm surge in the most vulnerable areas
• Often fail at the height of an event due to loss of electrical power or damage
NOS tide gauge data can be obtained from: http://tidesonline.noaa.gov http://tidesandcurrents.noaa.gov
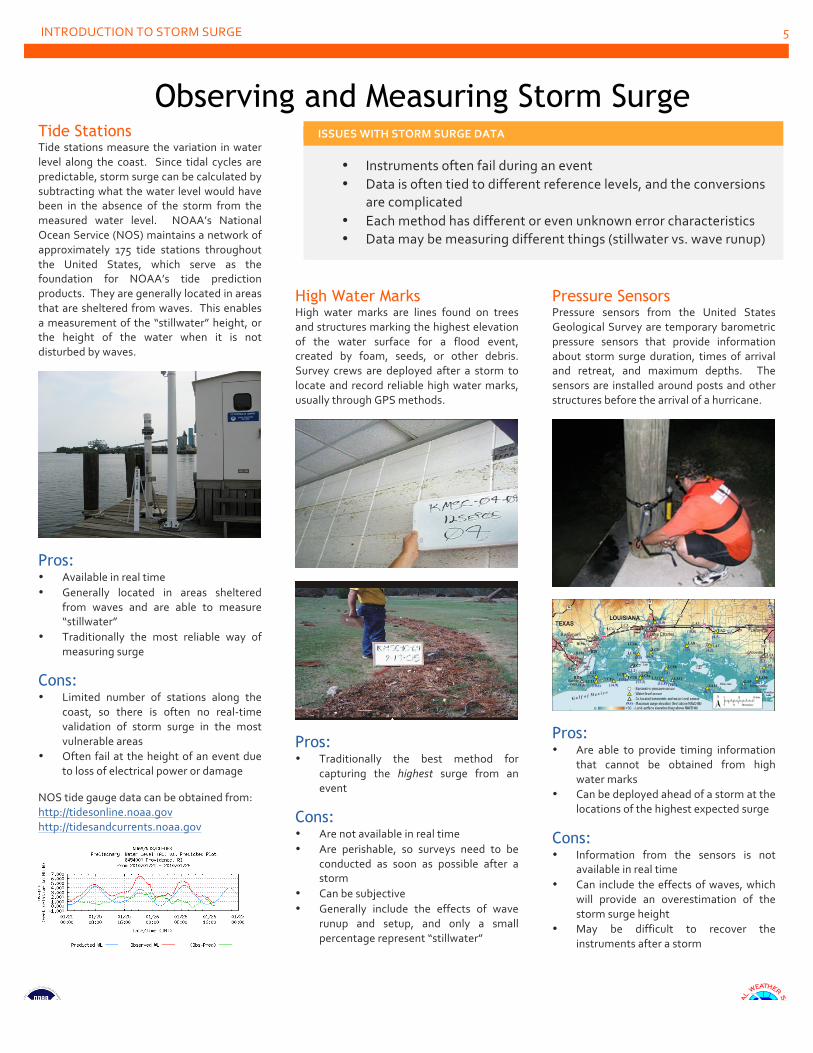
High Water Marks High water marks are lines found on trees and structures marking the highest elevation of the water surface for a flood event, created by foam, seeds, or other debris. Survey crews are deployed after a storm to locate and record reliable high water marks, usually through GPS methods.
Pros: • Traditionally the best method for
capturing the highest surge from an event
Cons: • Are not available in real time • Are perishable, so surveys need to be
conducted as soon as possible after a storm
• Can be subjective • Generally include the effects of wave
runup and setup, and only a small percentage represent “stillwater”
Pressure Sensors Pressure sensors from the United States Geological Survey are temporary barometric pressure sensors that provide information about storm surge duration, times of arrival and retreat, and maximum depths. The sensors are installed around posts and other structures before the arrival of a hurricane.
Pros: • Are able to provide timing information
that cannot be obtained from high water marks
• Can be deployed ahead of a storm at the locations of the highest expected surge
Cons: • Information from the sensors is not
available in real time • Can include the effects of waves, which
will provide an overestimation of the storm surge height
• May be difficult to recover the instruments after a storm
ISSUES WITH STORM SURGE DATA
• Instruments often fail during an event • Data is often tied to different reference levels, and the conversions
are complicated • Each method has different or even unknown error characteristics • Data may be measuring different things (stillwater vs. wave runup)
Observing and Measuring Storm Surge
Storm Surge Modeling and Forecasting
Hurricane Preparedness for Decision Makers (L324)
TIER 1 RESPONSE
< 48 h of landfall
TIER 3 PLANNING/MITIGATION
> 120 h of landfall
TIER 2
READINESS
48 h – 120 h of landfall
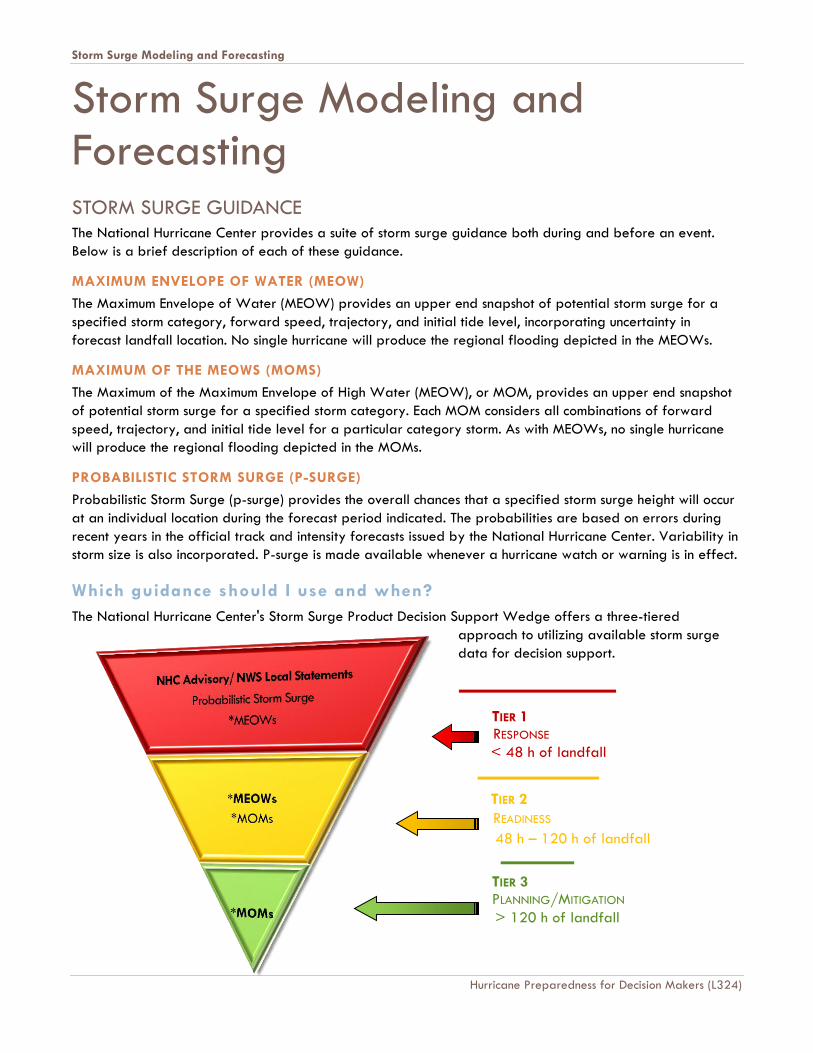
Storm Surge Modeling and Forecasting STORM SURGE GUIDANCE
The National Hurricane Center provides a suite of storm surge guidance both during and before an event.
Below is a brief description of each of these guidance.
MAXIMUM ENVELOPE OF WATER (MEOW)
The Maximum Envelope of Water (MEOW) provides an upper end snapshot of potential storm surge for a
specified storm category, forward speed, trajectory, and initial tide level, incorporating uncertainty in
forecast landfall location. No single hurricane will produce the regional flooding depicted in the MEOWs.
MAXIMUM OF THE MEOWS (MOMS)
The Maximum of the Maximum Envelope of High Water (MEOW), or MOM, provides an upper end snapshot
of potential storm surge for a specified storm category. Each MOM considers all combinations of forward
speed, trajectory, and initial tide level for a particular category storm. As with MEOWs, no single hurricane
will produce the regional flooding depicted in the MOMs.
PROBABILISTIC STORM SURGE (P-SURGE)
Probabilistic Storm Surge (p-surge) provides the overall chances that a specified storm surge height will occur
at an individual location during the forecast period indicated. The probabilities are based on errors during
recent years in the official track and intensity forecasts issued by the National Hurricane Center. Variability in
storm size is also incorporated. P-surge is made available whenever a hurricane watch or warning is in effect.
Which guidance should I use and when?
The National Hurricane Center's Storm Surge Product Decision Support Wedge offers a three-tiered
approach to utilizing available storm surge
data for decision support.
Storm Surge Modeling and Forecasting
Hurricane Preparedness for Decision Makers (L324)
VERTICAL DATUMS
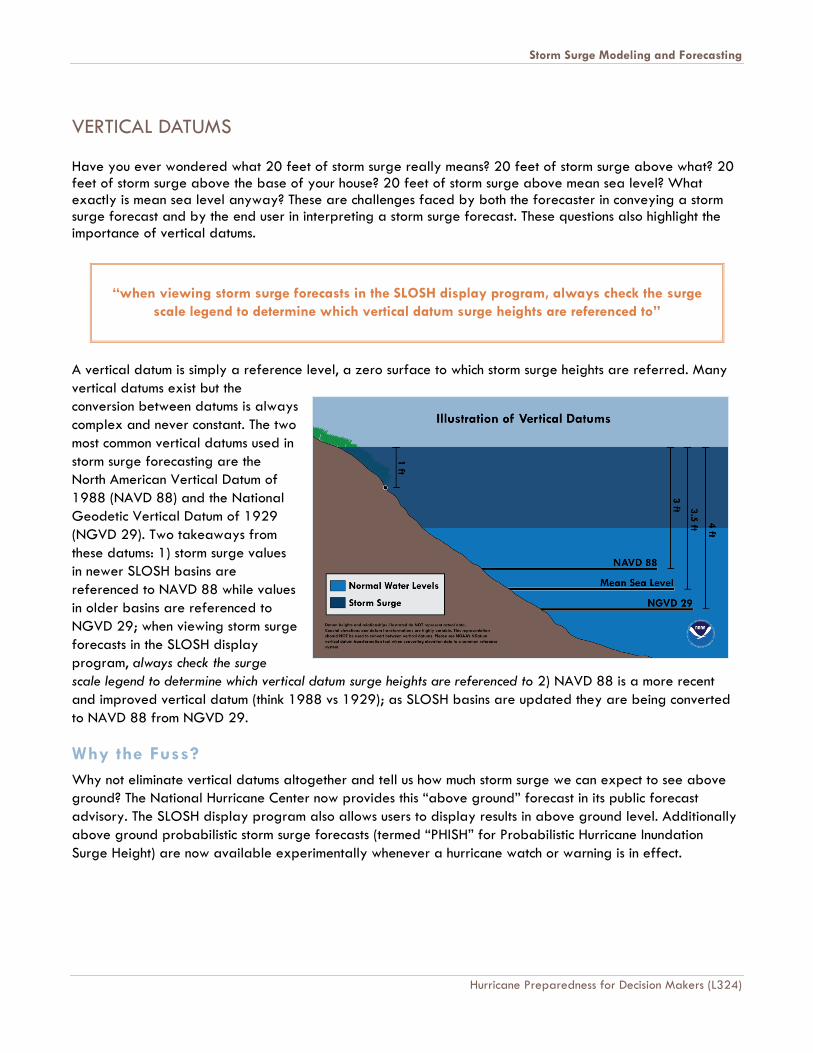
Have you ever wondered what 20 feet of storm surge really means? 20 feet of storm surge above what? 20 feet of storm surge above the base of your house? 20 feet of storm surge above mean sea level? What exactly is mean sea level anyway? These are challenges faced by both the forecaster in conveying a storm surge forecast and by the end user in interpreting a storm surge forecast. These questions also highlight the importance of vertical datums.
“when viewing storm surge forecasts in the SLOSH display program, always check the surge
scale legend to determine which vertical datum surge heights are referenced to”
A vertical datum is simply a reference level, a zero surface to which storm surge heights are referred. Many
vertical datums exist but the
conversion between datums is always
complex and never constant. The two
most common vertical datums used in
storm surge forecasting are the
North American Vertical Datum of
1988 (NAVD 88) and the National
Geodetic Vertical Datum of 1929
(NGVD 29). Two takeaways from
these datums: 1) storm surge values
in newer SLOSH basins are
referenced to NAVD 88 while values
in older basins are referenced to
NGVD 29; when viewing storm surge
forecasts in the SLOSH display
program, always check the surge
scale legend to determine which vertical datum surge heights are referenced to 2) NAVD 88 is a more recent
and improved vertical datum (think 1988 vs 1929); as SLOSH basins are updated they are being converted
to NAVD 88 from NGVD 29.
Why the Fuss?
Why not eliminate vertical datums altogether and tell us how much storm surge we can expect to see above
ground? The National Hurricane Center now provides this “above ground” forecast in its public forecast
advisory. The SLOSH display program also allows users to display results in above ground level. Additionally
above ground probabilistic storm surge forecasts (termed “PHISH” for Probabilistic Hurricane Inundation
Surge Height) are now available experimentally whenever a hurricane watch or warning is in effect.
HES-‐ PLANNING FOR THE THREAT
HES- Planning for the Threat
EVACUATION TRAFFIC
NHC
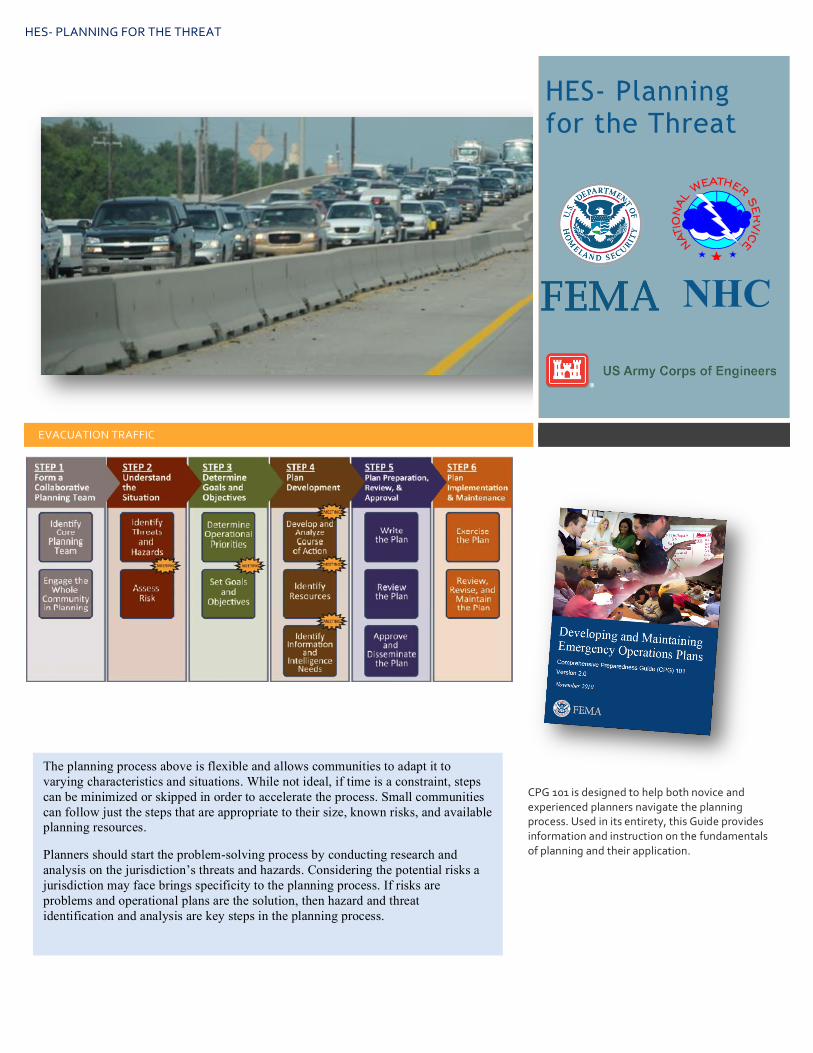
CPG 101 is designed to help both novice and experienced planners navigate the planning process. Used in its entirety, this Guide provides information and instruction on the fundamentals of planning and their application.
The planning process above is flexible and allows communities to adapt it to varying characteristics and situations. While not ideal, if time is a constraint, steps can be minimized or skipped in order to accelerate the process. Small communities can follow just the steps that are appropriate to their size, known risks, and available planning resources.
Planners should start the problem-solving process by conducting research and analysis on the jurisdiction’s threats and hazards. Considering the potential risks a jurisdiction may face brings specificity to the planning process. If risks are problems and operational plans are the solution, then hazard and threat identification and analysis are key steps in the planning process.
HES-‐ PLANNING FOR THE THREAT 2
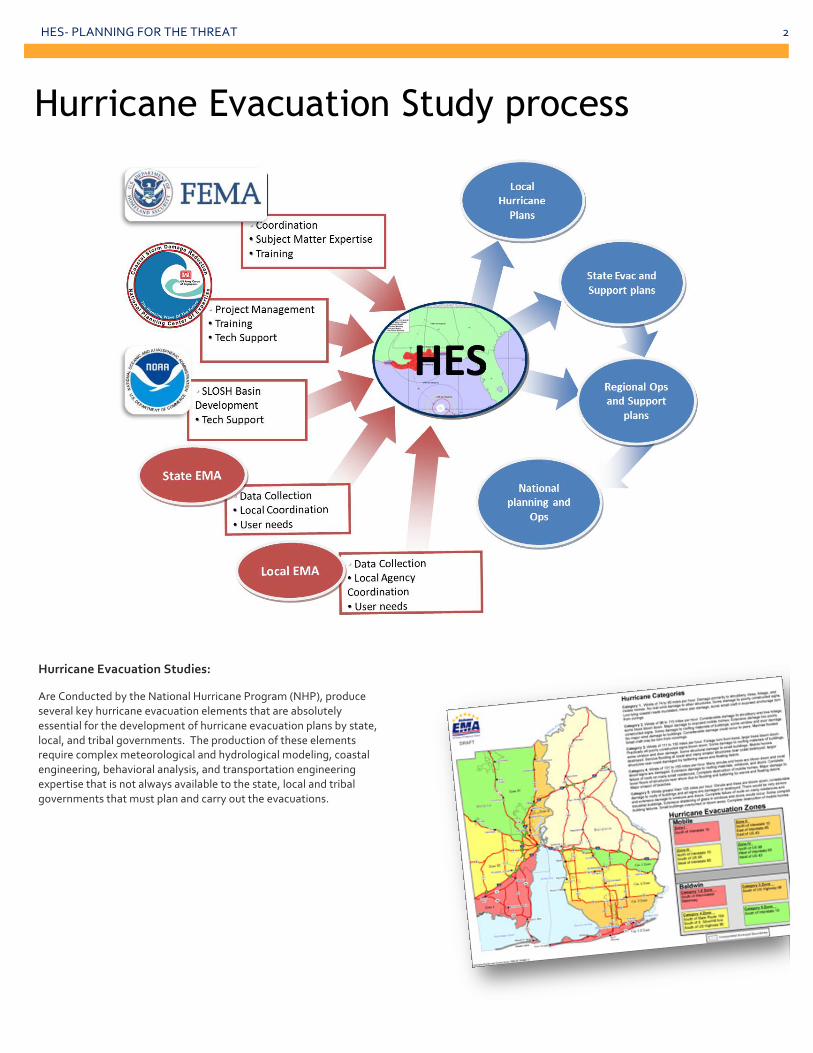
Hurricane Evacuation Studies:
Are Conducted by the National Hurricane Program (NHP), produce several key hurricane evacuation elements that are absolutely essential for the development of hurricane evacuation plans by state, local, and tribal governments. The production of these elements require complex meteorological and hydrological modeling, coastal engineering, behavioral analysis, and transportation engineering expertise that is not always available to the state, local and tribal governments that must plan and carry out the evacuations.
Hurricane Evacuation Study process
HES-‐ PLANNING FOR THE THREAT
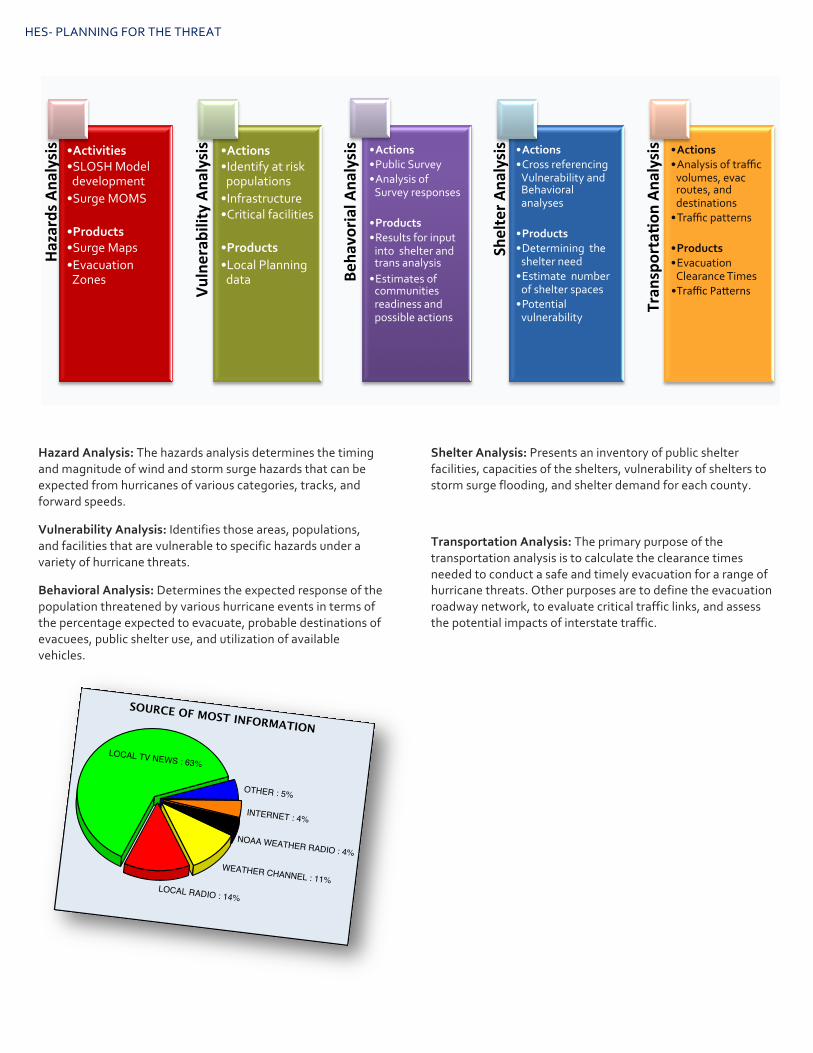
Hazard Analysis: The hazards analysis determines the timing and magnitude of wind and storm surge hazards that can be expected from hurricanes of various categories, tracks, and forward speeds.
Vulnerability Analysis: Identifies those areas, populations, and facilities that are vulnerable to specific hazards under a variety of hurricane threats.
Behavioral Analysis: Determines the expected response of the population threatened by various hurricane events in terms of the percentage expected to evacuate, probable destinations of evacuees, public shelter use, and utilization of available vehicles.
Shelter Analysis: Presents an inventory of public shelter facilities, capacities of the shelters, vulnerability of shelters to storm surge flooding, and shelter demand for each county.
Transportation Analysis: The primary purpose of the transportation analysis is to calculate the clearance times needed to conduct a safe and timely evacuation for a range of hurricane threats. Other purposes are to define the evacuation roadway network, to evaluate critical traffic links, and assess the potential impacts of interstate traffic.
Hazards A
nalysis • Activities
• SLOSH Model development • Surge MOMS
• Products • Surge Maps • Evacuation Zones
Vulnerab
ility Ana
lysis • Actions
• Identify at risk populations • Infrastructure • Critical facilities
• Products • Local Planning data Be
havoria
l Ana
lysis • Actions
• Public Survey • Analysis of Survey responses
• Products • Results for input into shelter and trans analysis • Estimates of communities readiness and possible actions
Shelter A
nalysis • Actions
• Cross referencing Vulnerability and Behavioral analyses
• Products • Determining the shelter need • Estimate number of shelter spaces • Potential vulnerability
Tran
sporta9o
n An
alysis
• Actions • Analysis of traffic volumes, evac routes, and destinations • Traffic patterns
• Products • Evacuation Clearance Times • Traffic Pa)erns
LOCAL TV NEWS : 63%
LOCAL RADIO : 14%
WEATHER CHANNEL : 11%
INTERNET : 4%
NOAA WEATHER RADIO : 4%
OTHER : 5%
SOURCE OF MOST INFORMATION
HES-‐ PLANNING FOR THE THREAT 4
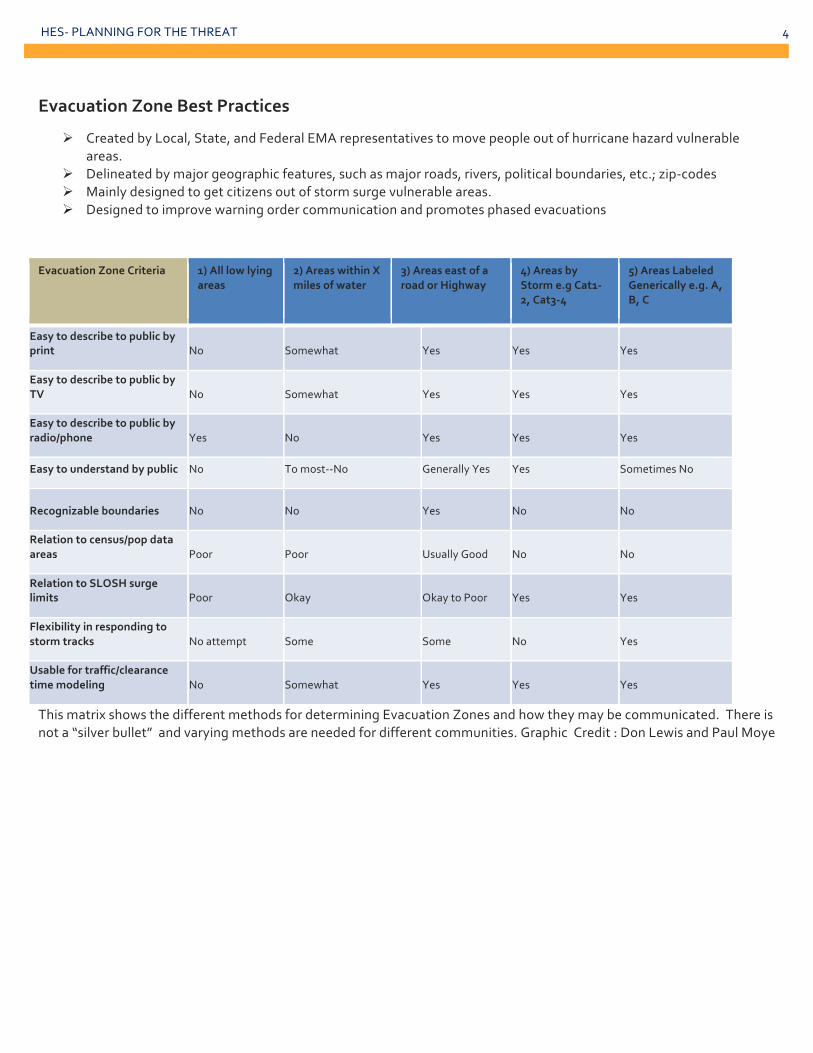
Evacuation Zone Best Practices
Ø Created by Local, State, and Federal EMA representatives to move people out of hurricane hazard vulnerable areas.
Ø Delineated by major geographic features, such as major roads, rivers, political boundaries, etc.; zip-‐codes Ø Mainly designed to get citizens out of storm surge vulnerable areas. Ø Designed to improve warning order communication and promotes phased evacuations
Evacuation Zone Criteria 1) All low lying areas
2) Areas within X miles of water
3) Areas east of a road or Highway
4) Areas by Storm e.g Cat1-‐2, Cat3-‐4
5) Areas Labeled Generically e.g. A, B, C
Easy to describe to public by print No Somewhat Yes Yes Yes
Easy to describe to public by TV No Somewhat Yes Yes Yes
Easy to describe to public by radio/phone Yes No Yes Yes Yes
Easy to understand by public No To most-‐-‐No Generally Yes Yes Sometimes No
Recognizable boundaries No No Yes No No
Relation to census/pop data areas Poor Poor Usually Good No No
Relation to SLOSH surge limits Poor Okay Okay to Poor Yes Yes
Flexibility in responding to storm tracks No attempt Some Some No Yes
Usable for traffic/clearance time modeling No Somewhat Yes Yes Yes
This matrix shows the different methods for determining Evacuation Zones and how they may be communicated. There is not a “silver bullet” and varying methods are needed for different communities. Graphic Credit : Don Lewis and Paul Moye
HES-‐ PLANNING FOR THE THREAT 5
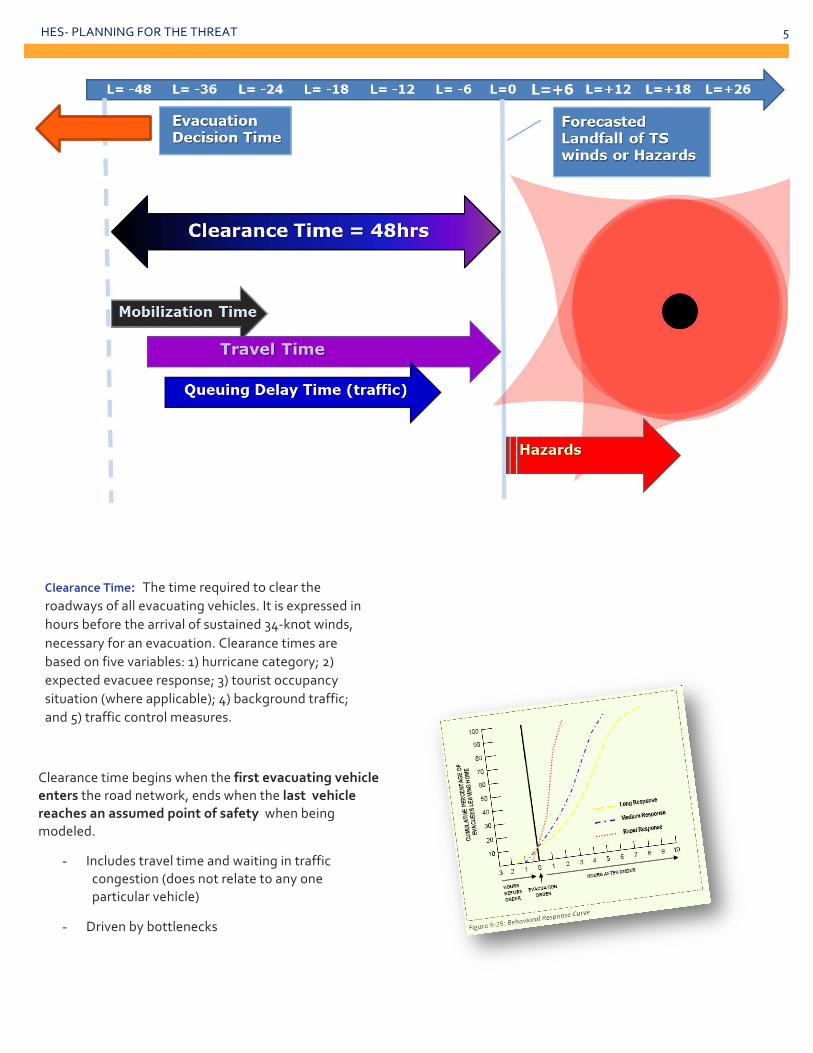
Clearance Time: The time required to clear the roadways of all evacuating vehicles. It is expressed in hours before the arrival of sustained 34-‐knot winds, necessary for an evacuation. Clearance times are based on five variables: 1) hurricane category; 2) expected evacuee response; 3) tourist occupancy situation (where applicable); 4) background traffic; and 5) traffic control measures.
Clearance time begins when the first evacuating vehicle enters the road network, ends when the last vehicle reaches an assumed point of safety when being modeled.
- Includes travel time and waiting in traffic congestion (does not relate to any one particular vehicle)
- Driven by bottlenecks
HES-‐ PLANNING FOR THE THREAT 6
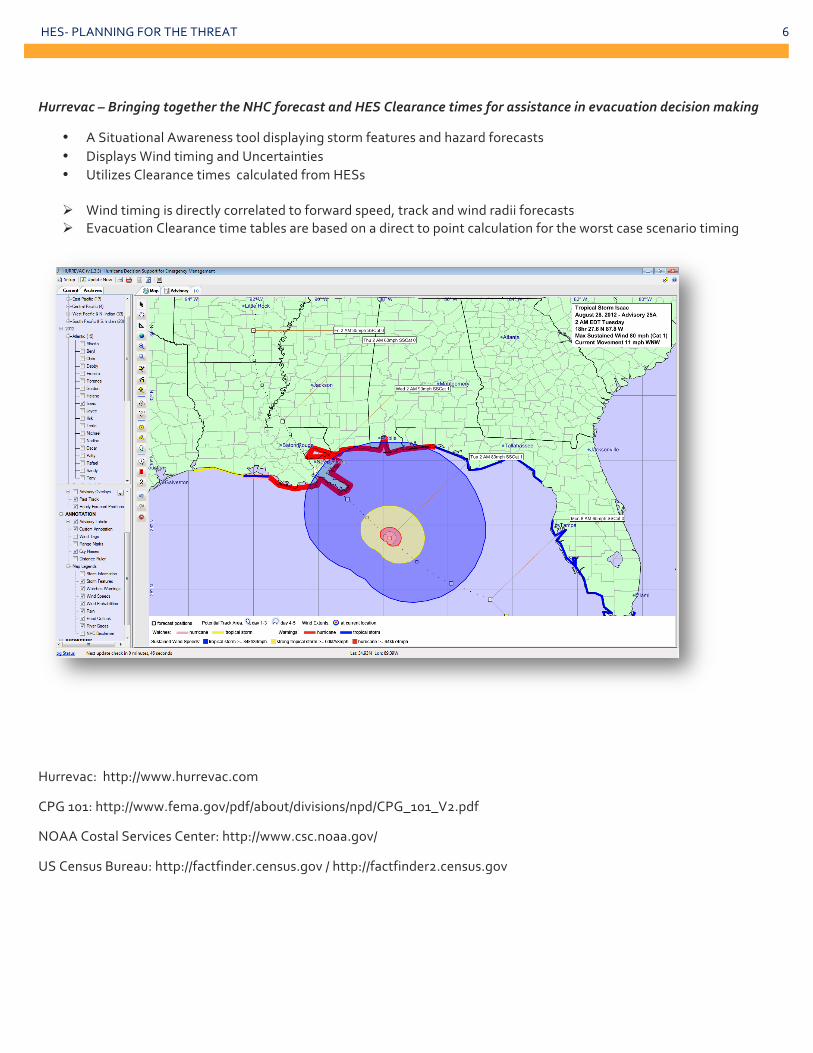
Hurrevac – Bringing together the NHC forecast and HES Clearance times for assistance in evacuation decision making
• A Situational Awareness tool displaying storm features and hazard forecasts • Displays Wind timing and Uncertainties • Utilizes Clearance times calculated from HESs
Ø Wind timing is directly correlated to forward speed, track and wind radii forecasts Ø Evacuation Clearance time tables are based on a direct to point calculation for the worst case scenario timing
Hurrevac: http://www.hurrevac.com
CPG 101: http://www.fema.gov/pdf/about/divisions/npd/CPG_101_V2.pdf
NOAA Costal Services Center: http://www.csc.noaa.gov/
US Census Bureau: http://factfinder.census.gov / http://factfinder2.census.gov