Embed Size (px)
Citation preview

ARTICLE IN PRESS
Journal of Financial Economics 82 (2006) 1–34
0304-405X/$
doi:10.1016/j
$We than
Womack, an
Florida, Tilb
thank Laura�CorrespoE-mail ad
www.elsevier.com/locate/jfec
Strength of analyst coverage following IPOs$
Christopher James�, Jason Karceski
Warrington College of Business, University of Florida, Gainesville, FL 32611, USA
Received 6 October 2004; received in revised form 9 September 2005; accepted 29 September 2005
Available online 11 April 2006
Abstract
Firms with poor aftermarket performance are given higher target prices and are more likely to
receive strong buy recommendations, especially by analysts affiliated with the lead underwriter. This
favorable coverage is relatively short lived, typically lasting less than six months. Controlling for the
quantity of coverage received, stock prices of newly public firms increase more when the target price
ratio is high and recommendation is a strong buy. These results suggest that when a firm goes public,
underwriter-affiliated analysts provide protection in the form of ‘‘booster shots’’ of stronger coverage
if the firm experiences poor aftermarket stock performance.
r 2006 Published by Elsevier B.V.
JEL classification: G14; G24
Keywords: IPO; Underpricing; Target price; Stock recommendation; Security analysts
1. Introduction
Both prior academic research and anecdotal evidence suggest that, at least until recently,analysts affiliated with the underwriters of an initial public offering (IPO) providefavorable coverage. For example, Bradley et al. (2003) show that when coverage isinitiated, it is almost always favorable. In addition, Michaely and Womack (1999) find thatlead analysts issue slightly more strong buy and buy recommendations in the year
- see front matter r 2006 Published by Elsevier B.V.
.jfineco.2005.09.003
k an anonymous referee, Hsuan-Chi Chen, Cem Demiroglu, Jay Ritter, Mike Ryngaert, Kent
d seminar participants at the University of Central Florida, Duke University, the University of
urg University, and the 2006 American Finance Association meetings for helpful comments. We also
Gonzalez for excellent research assistance.
nding author.
dress: [email protected] (C. James).
ARTICLE IN PRESSC. James, J. Karceski / Journal of Financial Economics 82 (2006) 1–342
following the IPO than do other analysts, and that firms recommended by lead analystshave poorer stock price performance both before and after the recommendation comparedto firms recommended by other analysts.With respect to anecdotal evidence, investment bank pitch books and recent SEC
investigations suggest a pre-commitment to provide favorable coverage. For example, aspart of the presentation to the board of directors of Viasource (a telecommunicationscompany that went public in August 2000), Donaldson, Lufkin, and Jenrette (DLJ)promised to provide ‘‘initiation of coverage with an investment rating and summaryopinion as soon as possible.’’1 Moreover, the allegation that underwriter-affiliated analystscommitted to provide favorable coverage is at the center of the recent settlement betweenten of the largest U.S. securities firms, the SEC, and various state attorney generalsregarding allegations of bias by research analysts.2
Previous work such as Cliff and Denis (2004), Aggarwal et al. (2002a), Chen and Ritter(2000), and Rajan and Servaes (1997) builds upon the observation of favorable analystcoverage and shows that underpricing is positively related to the likelihood and amount ofsubsequent analyst coverage.3 However, the relation between underpricing and coveragestrength has received much less attention. In this paper, we examine the relation betweenthe strength of analyst coverage and an IPO firm’s stock price performance in theaftermarket.The link between strength of coverage and stock price performance may reflect the
influence of several factors however, including the nature of the analyst’s commitment toprovide coverage, the impact of coverage strength on future investment banking business,and the relation between coverage strength and the brokerage business of the analyst’sfirm. Consider the nature of the analyst’s commitment, if any, to provide coverage. In theabsence of a commitment to provide coverage, high stock returns following an IPO maycreate information momentum, leading analysts to view the stock more favorably(Aggarwal, et al., 2002a). As a result, strength of coverage may be positively related toprior stock returns. Alternatively, a commitment by affiliated analysts to always providefavorable coverage coupled with other analysts initiating coverage only when they areoptimistic implies that, while the quantity of coverage increases with underpricing, strengthof coverage is unrelated to initial returns. Yet another alternative is that analysts pre-commit to provide more than a favorable recommendation. As Michaely and Womack(1999) suggest, analysts may commit to provide a ‘‘booster shot’’ by increasing the strengthof their recommendation in the face of an unfavorable market response to the IPO. This
1See DLJ’s Presentation to Viasource, dated January 25, 2000. The first-day return for Viasource was zero. True
to their word however, at the end of the quiet period DLJ issued a strong buy recommendation and set a target
price at 2.85 times the stock price at the time coverage was initiated. Other examples of pre-IPO assurances of
favorable coverage prior to an IPO can be found in financial press reports concerning the April 28, 2003
settlement of conflict of interest charges involving investment banking firms. See also Smith et al. (2003) and the
Stock Fraud Newswire at http://www.stockfraudnewswire.com.2The April 28, 2003 settlement requires a ‘‘clear’’ separation of stock research from investment banking,
including limits on analyst participation in road show presentations. Terms of the settlement, which were
approved by the court on October 31, 2003, are available at http://www.sec.gov/litigation/litreleases/lr18438.htm.3One possible reason for the positive relation between analyst coverage and underpricing is that underpricing is
used to compensate the lead and perhaps the managing underwriters for committing their analysts to provide
post-IPO coverage. As Cliff and Denis (2004) point out, since most underwriting spreads are 7% (see Chen and
Ritter, 2000), underpricing and the attendant benefits that underwriters receive can provide underwriters a method
to recoup the costs of providing coverage.
ARTICLE IN PRESSC. James, J. Karceski / Journal of Financial Economics 82 (2006) 1–34 3
argument suggests a negative relation between strength of affiliated coverage and stockprice performance. Which of these hypotheses best describes the strength of analystcoverage may depend on the returns prior to coverage. For example, momentum may drivethe strength of coverage up for deals that do extremely well while analysts provide boostershots for stocks that perform poorly in the aftermarket.
If the likelihood of future investment banking business depends on the strength ofcoverage, then the prospects for future business may yield a relation between strength ofcoverage and stock returns that is similar to the one that would obtain if analysts pre-committed to provide favorable coverage. However, prospects for future business willinfluence affiliated as well as some unaffiliated analysts, leading both groups to providemore favorable coverage in the face of poor aftermarket performance.
On the surface, pre-committing to provide favorable to win future investment bankingbusiness appears to be at odds with the interests of the analyst’s brokerage clients, whopresumably prefer unbiased stock research. This argument suggests that reputationconcerns may limit analyst optimism or lead to favorable coverage being short lived.However, in the case of deals that perform poorly, reputation concerns may be temporarilymitigated by the desire of brokerage clients to receive price support for the stocks theyown. In particular, if underwriters allocate IPO shares to their best brokerage clients andthese clients still own some shares at the end of the quiet period, the clients may prefer thatthe analyst give favorable coverage to support the IPO firm’s stock price.4 It seemsreasonable that the pressure on the lead analyst to support the stock will be highest whenaftermarket performance has been poor, since the brokerage clients will have a loss ontheir investment so far in the stock in this case. Consequently, the incentives for the leadanalyst to provide strong coverage should be greatest when the IPO firm performs poorlyin the aftermarket, to the extent that its brokerage clients continue to own shares of theIPO firm in the aftermarket. In contrast, in a broken deal where the investment bank wantsto stabilize the issuer’s share price in the aftermarket, it is possible that the investmentbank will repurchase the brokerage clients’ shares of the IPO firm. In this case, these clientswould no longer push for a booster shot from the bank’s analyst. However, a directconflict of interest may arise to the extent that the affiliated analyst’s recommendation andtarget price are designed to limit the investment bank’s loss exposure. The point here is thatthere are alternative explanations for a negative relation between strength of coverage andaftermarket returns besides pre-commitment on the part of affiliated analysts.
We examine the strength of coverage by affiliated and unaffiliated analysts for a sampleof 1,355 IPOs from November 1996 through August 2000. We extend previous research onanalyst coverage of IPOs in several ways. First, we measure the strength of coverage alongtwo dimensions, namely the buy/sell recommendation and the target price relative to thestock price just prior to the analyst report (we call this the target price ratio). Brav andLehavy (2003) show that the target price ratio provides a more finely tuned measure of theanalyst’s estimate of expected firm value. Given the informativeness of target prices (Bravand Lehavy, 2003) and the lack of variation in recommendations when coverage isinitiated, target price ratios have the potential to provide a more refined measure of the
4Reuter (2004) provides evidence that allocations of IPOs favor investors who direct brokerage business to the
lead underwriter. Aggarwal et al. (2002a) find that institutional clients receive more shares when the IPO has
strong premarket demand. Of course, the best brokerage clients are likely to receive the most underpriced IPOs,
thus reducing the need for a booster shot.
ARTICLE IN PRESSC. James, J. Karceski / Journal of Financial Economics 82 (2006) 1–344
strength of analyst coverage.5 Indeed, target prices may be the principal way to provideadditional support for deals with strong buy recommendations.Second, we separate strength of analyst coverage by (i) the length of time between the
offer date and the day coverage is initiated, (ii) the stock price performance of the IPO firmprior to the initiation of coverage, and (iii) analyst affiliation. ‘‘Lead analysts’’ are analyststhat work for the research arm of the lead or co-lead underwriter. Similarly, ‘‘co-manageranalysts’’ are analysts of co-managing underwriters and ‘‘unaffiliated analysts’’ areanalysts that work for a firm that was not a managing underwriter. If the role of theinvestment bank in the IPO affects strength of coverage, then recommendations and targetprice ratios should vary with analyst affiliation. Strength of coverage may also vary by thelength of time between the IPO date and coverage initiation, as well as by the stock priceperformance of the company prior to the initiation of coverage. For example, if affiliatedanalysts support IPOs to fulfill pre-IPO agreements with issuers and/or to avoid alienatinginstitutional clients who were allocated IPO shares, one would expect affiliated analysts toprovide earlier and more optimistic coverage (in terms of stronger recommendations andhigher target price ratios) than unaffiliated analysts for IPOs that perform poorly in theaftermarket.Finally, we examine how strength of coverage changes over time. While affiliated
analysts may attempt to boost share prices of poorly performing offerings by initiatingfavorable coverage as soon as possible after the IPO, how long they maintain this supportis unknown. If continued favorable coverage is one way to ensure being retained in follow-on offerings with the issuing firm, as Krigman et al. (2001), Cliff and Denis (2004) andothers suggest, then the strength of lead analyst coverage should change little over time.Alternatively, career concerns and reputation effects may lead to a quick convergence ofaffiliated analyst recommendations with those of other analysts. We examine how analysts’recommendations and target price ratios change during the year following the IPO.We find that lead analysts provide significantly more favorable recommendations and
higher target price ratios than co-manager and unaffiliated analysts. Controlling for timingdifferences, we find no significant difference between recommendations and target priceratios from co-manager analysts versus unaffiliated analysts. This result is consistent withMichaely and Womack (1999) and Chen (2004) who find evidence that affiliation bias isstrongest for analysts affiliated with lead and co-lead underwriters. However, this result isalso consistent with the view that lead underwriters are selected in part because they placea higher value on the firm compared to other potential underwriters.While, on average, lead analysts provide more favorable recommendations for all IPOs,
the biggest differences in strength of coverage between lead versus other analysts obtain for‘‘broken deals’’, that is, deals for which first-day returns are less than or equal to zero orwhen the IPO firm trades at or below the IPO offer price at the time coverage is initiated.In our sample, we find that when initial returns are less than or equal to zero, the averagetarget price ratio at initiation of coverage 1.74 for lead analysts versus 1.59 for unaffiliatedanalysts. However, for IPOs with positive first-day returns, the average target price ratio isabout 1.48 for both analyst groups.In contrast to previous findings that the likelihood of coverage is positively related to
first-day IPO returns, we find that the strength of coverage is negatively related to IPO
5Over 95% of recommendations in Bradley et al. (2003) sample in the five-day period surrounding the end of
the quiet period are strong buy or buy recommendations.
ARTICLE IN PRESSC. James, J. Karceski / Journal of Financial Economics 82 (2006) 1–34 5
returns. This relation is most pronounced for coverage by lead analysts. For broken deals,a one percentage point decline in stock price is associated with an increase in the leadanalyst’s target price of more than one percentage point. This result is consistent withaffiliated analysts providing a booster shot in the face of poor initial performance byincreasing their target price estimate. Although lead analysts may be selected because theyplace the highest valuation on the IPO firm, it is not clear why this valuation differencebetween the lead and other analysts would be largest for broken deals. The likelihood of astrong buy recommendation by lead and co-manager analysts is also negatively related topost-IPO returns. However, for unaffiliated analysts, we find no relation between thelikelihood of a strong buy recommendation and returns prior to coverage.
The unusually strong support by lead analysts appears to be short lived. For brokendeals, lead analysts revise target price ratios downward from an average of 1.82 atinitiation to 1.36 by the fourth target price posted, which occurs on average 467 calendardays on average after the initiation of coverage. Moreover, at the end of the first yearfollowing the IPO, the average affiliated analyst target price ratio (1.57) is slightly lowerthan the average unaffiliated analyst target price ratio (1.60). We find a similar pattern forchanges in recommendations over time.
Consistent with Bradley et al. (2003), we find that the market reacts positively to strongbuy recommendations. The market also reacts favorably to higher target prices. Consistentwith Chen (2004), we find that the market discounts strong buy recommendations and hightarget price ratios issued by lead affiliated analysts relative to non-lead affiliated analysts.This discount is greater for broken deals. Indeed, when only lead affiliated analysts providecoverage in broken deals, there is no statistically significant relation between the strengthof analyst coverage and abnormal returns around coverage initiation. However, themarket does react to favorably to high target price ratios from unaffiliated analysts inbroken deals. Thus, the market completely discounts any booster shot when the leadanalyst acts alone.
Our results indicate that affiliated analysts provide especially strong support for IPOsthat perform poorly in the aftermarket. While support for broken deals is strongestand most frequent among affiliated analysts, non-lead affiliated analysts also providestronger support for broken deals. Overall, our results are consistent with the argumentthat prospects for future investment banking business and a commitment to brokerageclients leads analysts to provide booster shots for deals with poor aftermarket stockperformance.
The rest of the paper proceeds as follows. Section 2 describes our data and our sample ofIPO firms. Section 3 examines the relations among strength of coverage, analyst affiliation,and stock price performance leading up to the initiation of analyst coverage. Section 4examines how the strength of analyst coverage changes over time. Section 5 examines therelation between the stock market’s reaction to coverage initiation and the strength of thecoverage. Section 6 concludes.
2. Data and sample description
2.1. Data
Target prices and analyst recommendations for our sample of IPO firms come from theThomson Financial First Call database. Coinciding with the beginning of target price
ARTICLE IN PRESSC. James, J. Karceski / Journal of Financial Economics 82 (2006) 1–346
coverage on First Call, our sample period starts in November 1996 and runs throughAugust 2000. We identify IPOs during this period using Thomson Financial’s SecuritiesData U.S. Common Stock Initial Public Offerings (SDC) database and Jay Ritter’s IPOdatabase. We use SDC to identify the lead, co-lead, and co-managing underwriters of theIPO. A firm is included in the sample if its IPO is reported in Ritter’s database and we canmatch it with an IPO in SDC. Reverse LBOs, unit offerings, spinoffs, and ADRs areexcluded from the sample. We also exclude IPOs of banks, REITs, and S&Ls.6 Thisprocedure generates 1,355 sample IPOs. Of these, First Call reports target prices in the yearfollowing the IPO for 1,189 (87%) firms. We obtain returns and share price informationfrom CRSP.To determine whether coverage is initiated by an analyst affiliated with the lead, co-lead,
or co-managing underwriter, we match SDC-identified IPO underwriters with theaffiliation of analysts providing coverage as reported in First Call. We divide analystsinto three groups: (1) those affiliated with the lead or co-lead investment bank, (2) thoseaffiliated with a co-managing investment bank, and (3) those affiliated with otherIPO syndicate members or unaffiliated with any syndicate members. To determinewhether an analyst is affiliated with a managing underwriter, we account for mergersbetween investment banks during the sample period. Consider the case in which aninvestment bank that was part of the underwriting syndicate subsequently merged withanother bank. If an analyst affiliated with the newly merged bank provided coveragewithin a year of the IPO, we assign an analyst affiliation based on the most active roleplayed by either of the merging banks in the IPO. For example, Credit Suisse First Boston(CSFB) acquired DLJ in 2000. If DLJ served as the lead underwriter in a 1999 IPO,post-merger coverage in 2000 by a CSFB analyst would be classified as affiliated with thelead underwriter.We measure strength of coverage using two proxies, the buy/sell recommendation and
the target price ratio. Recommendations are based on First Call’s numerical rating system,where ‘‘1’’ corresponds to the most favorable recommendation (‘‘strong buy’’) and ‘‘5’’corresponds to the least favorable recommendation (‘‘sell’’). However, an obvious problemwith analyst recommendations is their subjective nature. The same rating by differentanalysts may have different meanings for firm value or expected future stock performance.To address this shortcoming, we also measure strength of coverage by the analyst’s targetprice relative to the price of the stock on the day preceding the date of the analyst report.7
We drop all target prices that are not identified as ‘‘real-time’’ by First Call, and we alsodrop all target price observations that First Call does not confirm. The target price ratiorepresents the analyst’s expected or forecasted return for the stock, usually over thefollowing 12 months, and is arguably a less ambiguous measure of the analyst’s assessmentof future performance than the buy/sell recommendation. Brav and Lehavy (2003) findthat both recommendations and target prices have separate explanatory power inexplaining stock price reactions to new analyst reports.
6These IPOs are traditionally excluded because the degree of uncertainty over pricing is likely to be much less
than for other IPOs due to a public operating history (in the case of reverse LBOs), regulatory oversight (in the
case of banks and S&Ls), or the fact that the issuer is publicly traded (in the case of ADRs and spinoffs).7For a general discussion of how target prices are established, see Asquith et al. (2005). For a description of how
target prices are determined in the context of IPO firms, see Houston et al. (2006).
ARTICLE IN PRESSC. James, J. Karceski / Journal of Financial Economics 82 (2006) 1–34 7
2.2. Summary statistics
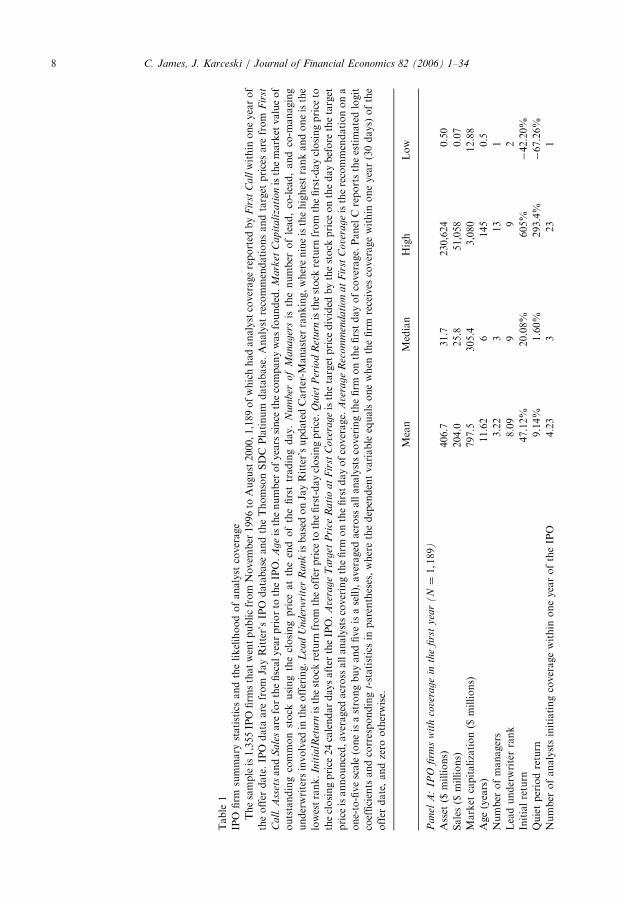
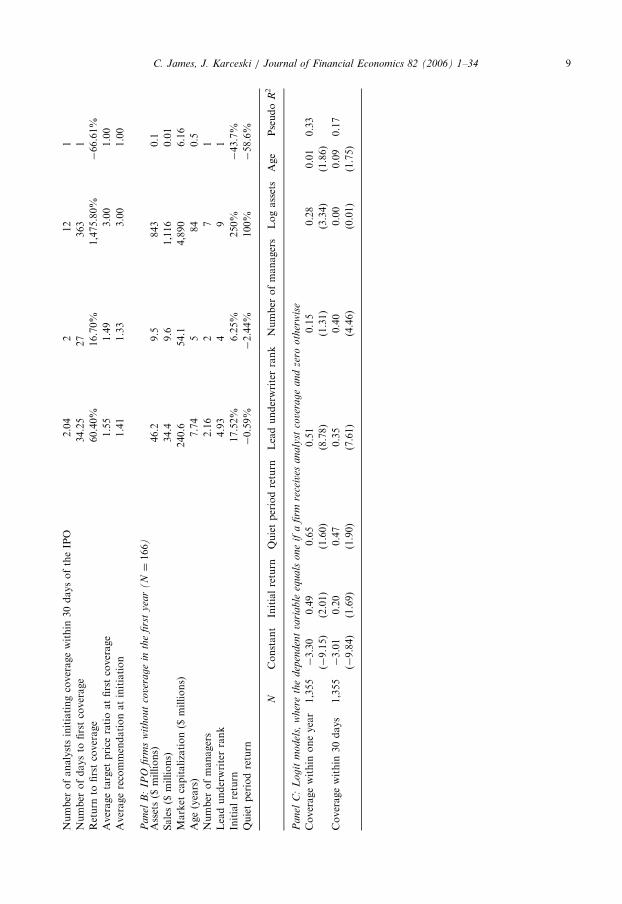
Panel A of Table 1 provides descriptive statistics for the 1,189 firms for which First Call
reports at least one analyst target price within one year of the IPO offer date. To comparethe factors that affect strength of coverage and the likelihood of coverage, Panel Bprovides information for the 166 firms with no analyst coverage.
Not surprisingly, firms with coverage are significantly larger in terms of assets, sales, andmarket capitalization, and are older than firms that do not receive analyst coverage withinone year of going public. Consistent with Cliff and Denis (2004) and Bradley et al. (2003),IPO firms with coverage are significantly more underpriced than IPO firms that do notreceive analyst coverage. Part of this variation is due to timing differences, sinceunderpricing and the likelihood of coverage both increase toward the latter half of oursample period. For example, 54% of our sample IPO firms that receive coverage did soduring the 1999–2000 IPO bubble period when underpricing was extraordinarily high.However, these two years account for only 32% of our sample of IPO firms that did notreceive coverage. Nevertheless, the positive relation between underpricing and coverageexists after controlling for time period. For instance, in 1999 and 2000, IPO firms notcovered by analysts in the first year were significantly less underpriced than firms receivingcoverage (first-day returns of 27% versus 72%). Coverage is also related to stock priceperformance during the 25-calendar-day quiet period. Mean and median returns duringthe quiet period for firms that did not receive coverage are negative. In contrast, the meanand median quiet period returns for firms receiving coverage are 9.14% and 1.60%,respectively.
On average, slightly more than four analysts initiate coverage within one year of theoffer date, with an average of approximately two analysts providing coverage within 30calendar days of the IPO.8 Consistent with previous studies, initiated coverage ispredominately favorable. For example, the mean and median recommendation is about1.5, and the mean target price ratio is 1.55. By comparison, Brav and Lehavy (2003) reportan average target price ratio of 1.28 for all (mostly seasoned) firms. Of course, higher targetprice ratios and more favorable recommendations upon the initiation of coverage for IPOfirms do not necessarily imply that analysts are overly optimistic. For instance, IPO firmsare likely to have better growth prospects than older, more established firms, possiblyjustifying higher expected returns.
Consistent with prior studies, sample firms that receive coverage use more highly ratedlead underwriters and employ more co-managing underwriters than do firms that do notreceive coverage. The effect of underwriter rank on the likelihood of coverage is significant.Almost all IPO firms (96%) underwritten by a top-ranked underwriter [those with a Carterand -Manaster (1990) ranking of greater than eight] receive coverage, but only 68% of IPO
8In addition to investigating the likelihood of any analyst initiating coverage, we also examine the factors
affecting the likelihood of multiple analysts initiating coverage. First, we estimate a multinomial logit model,
where the dependent variable equals the number of analysts that initiate coverage in the first year, with a
maximum value of four. The results are similar to those we present in Panel C of Table 1. In particular, coverage
in the first year is increasing in IPO underwriter rank, initial return, age, and firm size. Second, we investigate
whether, conditional on coverage, the likelihood of multiple analysts initiating coverage is related to underwriter
rank, the number of managers, firm characteristics, and IPO performance. In this model, the likelihood of multi-
analyst coverage is positively and significantly related to the number of managers, the return during the quiet
period, and firm size. The coefficient on underwriter rank is positive but not statistically significant.
ARTICLE IN PRESS
Table
1
IPO
firm
summary
statisticsandthelikelihoodofanalyst
coverage
Thesampleis1,355IPO
firm
sthatwentpublicfrom
Novem
ber
1996to
August2000,1,189ofwhichhadanalystcoveragereported
by
Fir
stC
allwithin
oneyearof
theoffer
date.IPO
data
are
from
JayRitter’sIPO
database
andtheThomsonSDC
Platinum
database.Analyst
recommendationsandtarget
pricesare
from
Fir
st
Ca
ll.
Ass
etsand
Sa
lesare
forthefiscalyearpriorto
theIPO.
Ag
eisthenumber
ofyears
since
thecompanywasfounded.
Mark
etC
apit
ali
zati
onisthemarket
valueof
outstandingcommonstock
usingtheclosingprice
attheendofthefirsttradingday.
Nu
mb
ero
fM
an
ag
ersis
thenumber
oflead,co-lead,andco-m
anaging
underwriters
involved
intheoffering.
Lea
dU
nd
erw
rite
rR
an
kisbasedonJayRitter’supdatedCarter-M
anaster
ranking,wherenineisthehighestrankandoneisthe
lowestrank.
Init
ialR
etu
rnisthestock
return
from
theoffer
price
tothefirst-dayclosingprice.
Qu
iet
Per
iod
Ret
urn
isthestock
return
from
thefirst-dayclosingprice
to
theclosingprice
24calendardaysafter
theIPO.
Ave
rag
eT
arg
etP
rice
Ra
tio
at
Fir
stC
ove
rageisthetarget
price
divided
bythestock
price
onthedaybefore
thetarget
price
isannounced,averaged
across
allanalystscoveringthefirm
onthefirstdayofcoverage.
Ave
rage
Rec
om
men
dati
on
at
Fir
stC
ove
rageistherecommendationona
one-to-fivescale(oneisastrongbuyandfiveisasell),averaged
across
allanalystscoveringthefirm
onthefirstdayofcoverage.PanelCreportstheestimatedlogit
coefficients
andcorresponding
t-statisticsin
parentheses,wherethedependentvariable
equalsonewhen
thefirm
receives
coveragewithin
oneyear(30days)
ofthe
offer
date,andzero
otherwise.
Mean
Median
High
Low
Pan
elA
:IP
Ofi
rms
wit
hco
vera
ge
inth
efi
rst
yea
r(
N¼
1;189)
Asset
($millions)
406.7
31.7
230,624
0.50
Sales($
millions)
204.0
25.8
51,058
0.07
Market
capitalization($
millions)
797.5
305.4
3,080
12.88
Age(years)
11.62
6145
0.5
Number
ofmanagers
3.22
313
1
Leadunderwriterrank
8.09
99
2
Initialreturn
47.12%
20.08%
605%
�42.20%
Quietperiodreturn
9.14%
1.60%
293.4%
�67.26%
Number
ofanalystsinitiatingcoveragewithin
oneyearoftheIPO
4.23
323
1
C. James, J. Karceski / Journal of Financial Economics 82 (2006) 1–348
ARTICLE IN PRESSNumber
ofanalystsinitiatingcoveragewithin
30daysoftheIPO
2.04
212
1
Number
ofdaysto
firstcoverage
34.25
27
363
1
Return
tofirstcoverage
60.40%
16.70%
1,475.80%
�66.61%
Averagetarget
price
ratioatfirstcoverage
1.55
1.49
3.00
1.00
Averagerecommendationatinitiation
1.41
1.33
3.00
1.00
Pan
elB
:IP
Ofi
rms
wit
ho
ut
cove
rag
ein
the
firs
ty
ear
(N¼
166)
Assets($
millions)
46.2
9.5
843
0.1
Sales($
millions)
34.4
9.6
1,116
0.01
Market
capitalization($
millions)
240.6
54.1
4,890
6.16
Age(years)
7.74
584
0.5
Number
ofmanagers
2.16
27
1
Leadunderwriterrank
4.93
49
1
Initialreturn
17.52%
6.25%
250%
�43.7%
Quietperiodreturn
�0.59%
�2.44%
100%
�58.6%
NConstant
Initialreturn
Quietperiodreturn
Leadunderwriterrank
Number
ofmanagers
Logassets
Age
Pseudo
R2
Pan
elC
:L
og
itm
od
els,
wher
eth
ed
epen
den
tva
ria
ble
equ
als
on
eif
afi
rmre
ceiv
esa
na
lyst
cove
rag
ea
nd
zero
oth
erw
ise
Coveragewithin
oneyear
1,355�3.30
0.49
0.65
0.51
0.15
0.28
0.01
0.33
(�9.15)
(2.01)
(1.60)
(8.78)
(1.31)
(3.34)
(1.86)
Coveragewithin
30days
1,355�3.01
0.20
0.47
0.35
0.40
0.00
0.09
0.17
(�9.84)
(1.69)
(1.90)
(7.61)
(4.46)
(0.01)
(1.75)
C. James, J. Karceski / Journal of Financial Economics 82 (2006) 1–34 9
ARTICLE IN PRESSC. James, J. Karceski / Journal of Financial Economics 82 (2006) 1–3410
firms underwritten by firms with Carter-Manaster ranks of eight or below receivedcoverage in the first year.Firm characteristics, underwriter rank, and IPO stock price performance are all
potentially related. To examine the incremental contribution of each of these factors to thelikelihood of coverage, we estimate a logit regression that relates whether an IPO firmreceives coverage to firm characteristics, the number of managers, lead underwriter rank,initial return (underpricing), and quiet period return. Panel C of Table 1 reports the results.Consistent with Cliff and Denis (2004), the likelihood of coverage is positively andsignificantly related to the rank of the lead underwriter. To examine the economicsignificance of this effect, we compare the estimated probability of coverage at the samplemean (Carter-Manaster rank of 8.09) to the probability associated with the maximum rankof nine. Moving from an average underwriter to a top-ranked underwriter increases thelikelihood of coverage by 5%.The likelihood of coverage within the first year is also related to initial return, firm size
(as measured by assets), and the age of the company at the time of the offering.9 Krigmanet al. (2001) argue that one reason to increase the number of co-managers is to increase thelikelihood and amount of analyst coverage. However, we find no significant relationbetween the likelihood of coverage in the first year following an IPO and the number of co-managers used in the IPO syndicate.To investigate whether the determinants of analyst coverage vary by when coverage is
initiated, we separately examine the determinants of coverage within 30 calendar daysof the IPO. While underwriter rank, age, and initial return remain positively andsignificantly related to the likelihood of coverage, asset size is no longer significant.Consistent with Bradley et al. (2003), the likelihood of coverage at the end of the quietperiod is positively and significantly related to the number of co-managers that participatein the IPO.10 Thus, the number of managers appears to affect the timing but not thelikelihood of coverage.Broken deals are less likely to receive coverage than IPOs that trade above the offer
price. In particular, 89% of IPOs with positive first-day returns receive coverage in the yearfollowing the IPO, while only 83% of IPOs with zero or negative first-day returns receivecoverage. The most important factor for whether or not a broken deal receives coverage isthe rank of the lead underwriter. Virtually all (96%) of the 85 broken deals underwrittenby a top-ranked underwriter receive coverage. In contrast, only 53% of broken dealsunderwritten by less prestigious underwriters receive coverage. The percentage of IPOsunderwritten by top-ranked underwriters that receive coverage does not differ significantlyby whether or not the IPO is a broken deal. In contrast, broken deals underwritten by lessprestigious underwriters are significantly less likely to receive coverage than successfulIPOs underwritten by less prestigious underwriters (t-statistic ¼ �3.68). Thus, one reasonto use a top-rated underwriter appears to be a higher likelihood of analyst support ifreturns are poor in the aftermarket.
9We measure firm size using assets rather than market value of equity since the latter is likely to be correlated
with the initial returns.10Panel C of Table 1 shows that having more co-managers does not have a statistically significant effect on the
probability of receiving coverage within the first year. Bradley et al. (2005) come to a similar conclusion when
interpreting their Table 7 results. There is no evidence that adding co-managers influences the likelihood of
receiving coverage after the end of the quiet period.
ARTICLE IN PRESSC. James, J. Karceski / Journal of Financial Economics 82 (2006) 1–34 11
Other than differences in the prestige of the lead underwriter, there are no otherapparent differences between broken deals that receive coverage and those that do not.11
For example, the average initial return for broken deals that receive coverage is –4.99%versus �4.98% for broken deals that do not receive coverage. Moreover, the lowest initialreturn for broken deals that receive coverage (�44% for DevX Energy) is slightly lowerthan the lowest initial return for broken deals not receiving coverage (�43% forEchapman.com).12
3. Strength of coverage by analyst affiliation
3.1. Hypotheses
Our first hypothesis is that underpricing creates momentum that leads in turn tostronger coverage. Aggarwal et al. (2002a) argue that IPO underpricing may generate‘‘information momentum’’ to attract investor attention, which makes it easier for analyststo issue stronger recommendations and higher target prices, and thereby to maximize thefirm’s stock price at the end of the 180-day lock-up period. Under the informationmomentum hypothesis, analysts provide stronger recommendations for IPO firms thatperform well in the secondary market.
Second, Michaely and Womack (1999) suggest that affiliated analysts may agree tosupport an issuer’s stock in the aftermarket by providing ‘‘booster shots’’ in the form ofstrong recommendations and higher target price ratios if the firm’s stock performs poorlyin the secondary market. The booster shot hypothesis predicts that affiliated analystsprovide particularly favorable coverage when firms experience poor stock priceperformance in the aftermarket. If booster shots are mostly given to IPO firms thatexperience negative aftermarket returns, then we expect an asymmetric negative relationbetween prior returns and target price ratios, such that the relation is more negative forbroken deals than for other deals.
Unaffiliated analysts may also provide more favorable coverage for broken deals eitherbecause they expect some form of mean reversion in prices or because they seek to obtainfuture investment banking business from the issuer. Nevertheless, if affiliated analystsprovide booster shots as part of a formal or informal commitment to provide coverage,one would expect that on average, affiliated analysts provide more favorable coverage inbroken deals than do unaffiliated analysts.
Our third hypothesis, the anchored target price ratio hypothesis, is based on the ideathat prior to the IPO, the underwriting team and its analyst essentially pre-commit to acertain target price ratio and recommendation before the stock begins trading. That is,target price ratios and recommendations are fixed at a particular level. For example, ifanalysts decide to always set target prices equal to a 45% premium over the current stock
11We estimate the same logit model as in Panel C of Table 1 for broken deals only. The only variable that is
statistically significant at the 5% level for this subsample is underwriter rank. The coefficient estimates for the
underwriter rank variable are 0.486 and 0.334 for all initiations and initiations within 30 days, respectively.12It is not surprising that Echapman.com did not receive coverage. Echapman.com is an on-line brokerage
company that was underwritten by its majority shareholder, the investment bank Chapman Company (with a
Carter–Manaster rank of five). DevX Energy was a small-cap energy company underwritten by Friedman Billings
Ramsey (FBR) Group. Analyst coverage for DevX Energy was initiated by FBR about two months after the
offering.
ARTICLE IN PRESSC. James, J. Karceski / Journal of Financial Economics 82 (2006) 1–3412
price at the time the analyst report is written, then regardless of what happens to the stockprice in the aftermarket, the target price ratio will always be 1.45. In this case no relation isexpected between the strength of coverage and prior returns.Our fourth hypothesis is that analysts are anchored on a particular pre-offer valuation.
In other words, when the offer price is set, the target price has also been determined, but itsvalue is not revealed until the analyst report is issued. As a result, there will be amechanical negative relation between the target price ratio and aftermarket returns. If theaftermarket return is unexpectedly very high, the current stock price at the time the analystreport is issued may be higher than the pre-determined target price. Analysts rarely settarget prices lower than the current price of the stock. Consequently, analysts will probablynot literally anchor on a pre-determined target price value if the firm’s stock price moveshigher than this target price. In this case, the analyst will set a lower-than-normal targetprice ratio for such an unexpectedly successful deal. The prediction of this anchored targetprice level hypothesis differs from the booster shot hypothesis in that much less asymmetryis expected when broken deals are separated from remaining deals. In other words, therelation between target price ratios and aftermarket performance should be negative butsimilar in magnitude for both broken deals and successful deals.Even in the absence of a commitment to provide favorable coverage, affiliated analysts
may provide more favorable coverage because investment banks that value the IPO firmmost highly tend to be awarded the role of lead underwriter. However, while such selectionbias may result in affiliated analysts providing more favorable coverage on average, it doesnot suggest a large asymmetry for broken deals. In other words, if the lead underwriterconsistently places the highest value on the IPO firm, the difference between the targetprice ratios of the lead analyst versus other analysts should be the same regardless ofwhether the firm’s stock price goes up or down in the aftermarket.A commitment by lead and co-lead analysts to provide coverage, especially for broken deals,
implies that recommendations and target prices of affiliated analysts are likely to be biasedupwards relative to those of unaffiliated analysts. Given this affiliation bias, market participantsmay discount the favorable recommendations and target price ratios of affiliated analysts. If so,we expect the stock price reaction to the initiation and strength of coverage given by affiliatedanalysts to be less positive than to coverage provided by unaffiliated analysts.Finally, pre-commitment to provide favorable coverage appears to conflict with an
analyst’s interest to preserve and promote their reputation with brokerage clients.Moreover, this conflict appears to be largest for broken deals. However, this conflict ismitigated by two factors. First, there is evidence that lead underwriters allocate IPOs totheir best brokerage clients (see Reuter, 2004; Aggarwal, et al., 2002b). Thus, if theanalyst’s best clients have a stake in the IPO, they are likely to take a dim view of anunfavorable but honest appraisal of the stock’s value, particularly if the stock is currentlytrading below the price at which it was purchased. Second, Malmendier and Shanthikumar(2004) find evidence that large institutional traders, presumably the brokerage house’s bestclients, recognize and account for the upward bias in security analyst recommendationsand exert a less than normal trade reaction to strong buy recommendations. These clientsat least partly see through the affiliation bias, so they take such strong recommendations tobe just ‘‘cheap talk’’ (see Farrell and Rabin, 1996).13
13In Malmendier and Shanthikumar (2004), ‘‘all-star’’ analysts are identified based on Investment Dealer Digest
polls of institutional investors. These polls suggest that analyst recommendation or earnings forecast accuracy are
ARTICLE IN PRESSC. James, J. Karceski / Journal of Financial Economics 82 (2006) 1–34 13
Which of these hypotheses best describes the strength of analyst coverage may dependon the returns prior to coverage. For example, affiliated analysts may provide boostershots for stocks that perform poorly in the aftermarket, whereas for stocks that performwell, they may attempt to add to the momentum by issuing strong recommendations andsetting high target prices. Given this possibility, we examine whether the relation betweenstrength of coverage and prior returns varies with the level of aftermarket return.
3.2. Univariate analysis of strength of coverage
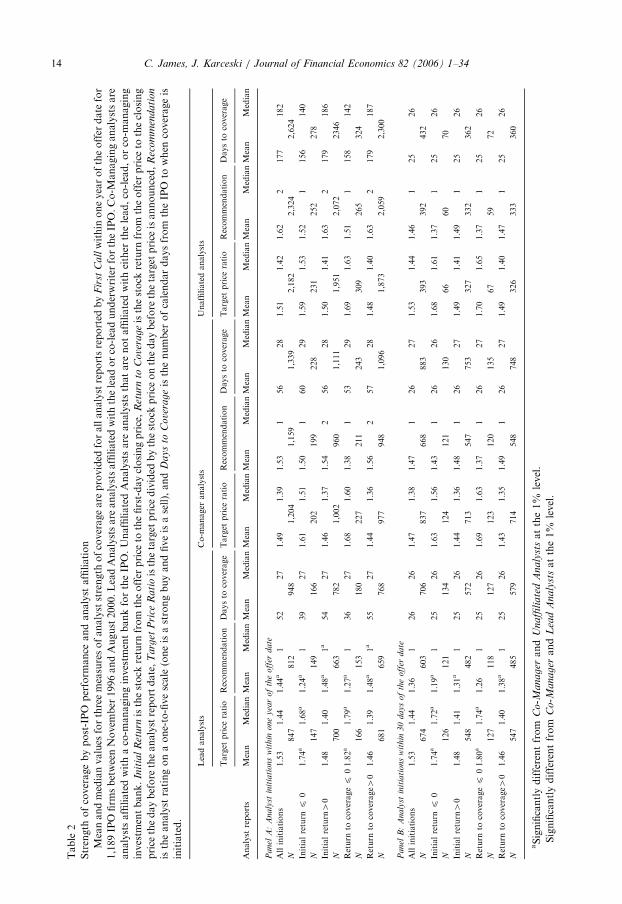
To investigate which hypothesis best describes strength of coverage for IPO firms, PanelA of Table 2 reports the average target price ratio, recommendation, and number of daysbetween the IPO date and coverage initiation, sorted by whether the analyst is affiliatedwith the lead or co-lead, with a co-manager, or with an unaffiliated underwriter. Toinvestigate whether strength of coverage varies with stock price performance, IPO firms aregrouped by initial returns and by what we refer to as return to coverage—the stock returncalculated from the offer price to the price the day before coverage is initiated. Althoughwe use raw returns when measuring stock price performance, results are qualitativelysimilar when using market-adjusted returns.
On average, lead analysts provide more favorable recommendations than other analysts(1.44 versus 1.53 and 1.62 for co-manager and unaffiliated analysts, respectively). Analystsaffiliated with co-managing underwriters also provide more favorable recommendationsthan unaffiliated analysts. Bradley et al. (2003) and Cliff and Denis (2004) find that leadanalysts issue more favorable recommendations, and Lin and McNichols (1998) find asimilar result for seasoned offerings. However, we find no significant difference in targetprice ratios by analyst affiliation. Target price ratios are all very close to 1.50 and differ byonly a few percentage points across the different analyst groups. One interpretation of thisresult is that because recommendations are inherently more subjective, affiliated analystsare more comfortable issuing a favorable recommendation rather than a particularvaluation as reflected in the target price.
Regardless of analyst affiliation, target price ratios and recommendations are higher forbroken deals than for successful IPOs. For example, co-manager analysts give an averagetarget price ratio of 1.61 for IPO firms with zero or negative initial returns, but assign anaverage target price ratio of 1.46 for firms that realize positive initial returns (the differenceis statistically significant at the 1% level). Recommendations are also more favorable forbroken deals, although the difference is only significant when return to coverage is used asa measure of whether or not the deal is broken. Surprisingly, unaffiliated analysts alsoprovide more favorable coverage for broken deals. Both target price ratios andrecommendations are substantially higher for broken deals, and these differences arestatistically significant at the 1% level.
Differences in strength of coverage by analyst affiliation are most pronounced forbroken deals. Lead analysts post much higher relative target prices for IPO firms that havenonpositive initial returns and for firms that trade at or below the IPO offer price when
(footnote continued)
among the least important analyst attributes when deciding which analysts become all-stars. The most important
characteristics of analysts in the rankings are industry knowledge and accessibility. See ‘‘What Investors Really
Want,’’ Investment Dealer Digest, October 2004, p. 8.
ARTICLE IN PRESSTable
2
Strength
ofcoveragebypost-IPO
perform
ance
andanalyst
affiliation
Meanandmedianvalues
forthreemeasuresofanalyststrength
ofcoverageare
provided
forallanalystreportsreported
by
Fir
stC
allwithin
oneyearoftheoffer
date
for
1,189IPO
firm
sbetweenNovem
ber
1996andAugust2000.LeadAnalystsare
analystsaffiliatedwiththeleadorco-leadunderwriterfortheIPO.Co-M
anaginganalystsare
analystsaffiliatedwithaco-m
anaginginvestm
entbankfortheIPO.UnaffiliatedAnalystsare
analyststhatare
notaffiliatedwitheither
thelead,co-lead,orco-m
anaging
investm
entbank.
Init
ial
Ret
urn
isthestock
return
from
theoffer
price
tothefirst-dayclosingprice,
Ret
urn
toC
ove
rageisthestock
return
from
theoffer
price
totheclosing
price
thedaybefore
theanalystreportdate,
Targ
etP
rice
Ra
tioisthetarget
price
divided
bythestock
price
onthedaybefore
thetarget
price
isannounced,
Rec
om
men
da
tio
n
istheanalyst
ratingonaone-to-fivescale
(oneisastrongbuyandfiveisasell),and
Da
ys
toC
ove
rageisthenumber
ofcalendardaysfrom
theIPO
towhen
coverageis
initiated.
Leadanalysts
Co-m
anager
analysts
Unaffiliatedanalysts
Target
price
ratio
Recommendation
Daysto
coverage
Target
price
ratio
Recommendation
Daysto
coverage
Target
price
ratio
Recommendation
Daysto
coverage
Analyst
reports
Mean
MedianMean
MedianMean
MedianMean
MedianMean
MedianMean
MedianMean
MedianMean
MedianMean
Median
Pa
nel
A:
An
aly
stin
itia
tio
ns
wit
hin
on
ey
ear
of
the
off
erd
ate
Allinitiations
1.53
1.44
1.44a
152
27
1.49
1.39
1.53
156
28
1.51
1.42
1.62�
2�
177�
182�
N847
812
948
1,204
1,159
1,339
2,182
2,324
2,624
Initialreturn
p0
1.74a
1.68a
1.24a
139
27
1.61
1.51
1.50
160
29
1.59
1.53
1.52
1156�
140�
N147
149
166
202
199
228
231
252
278
Initialreturn40
1.48
1.40
1.48a
1a
54
27
1.46
1.37
1.54
256
28
1.50
1.41
1.63�
2�
179�
186�
N700
663
782
1,002
960
1,111
1,951
2,072
2346
Return
tocoveragep
01.82a
1.79a
1.27a
136
27
1.68
1.60
1.38
153
29
1.69
1.63
1.51�
1�
158�
142�
N166
153
180
227
211
243
309
265
324
Return
tocoverage4
01.46
1.39
1.48a
1a
55
27
1.44
1.36
1.56
257
28
1.48
1.40
1.63
2179�
187�
N681
659
768
977
948
1,096
1,873
2,059
2,300
Pa
nel
B:
An
aly
stin
itia
tio
ns
wit
hin
30
da
ys
of
the
off
erd
ate
Allinitiations
1.53
1.44
1.36
126
26
1.47
1.38
1.47
126
27
1.53
1.44
1.46
125
26
N674
603
706
837
668
883
393
392
432
Initialreturn
p0
1.74a
1.72a
1.19a
125
26
1.63
1.56
1.43
126
26
1.68
1.61
1.37�
125
26
N126
121
134
124
121
130
66
60
70
Initialreturn40
1.48
1.41
1.31a
125
26
1.44
1.36
1.48
126
27
1.49
1.41
1.49
125
26
N548
482
572
713
547
753
327
332
362
Return
tocoveragep
01.80a
1.74a
1.26
125
26
1.69
1.63
1.37
126
27
1.70
1.65
1.37
125
26
N127
118
127
123
120
135
67
59
72
Return
tocoverage4
01.46
1.40
1.38a
125
26
1.43
1.35
1.49
126
27
1.49
1.40
1.47
125
26
N547
485
579
714
548
748
326
333
360
aSignificantlydifferentfrom
Co
-Ma
na
ger
and
Un
affi
lia
ted
An
aly
stsatthe1%
level.
�Significantlydifferentfrom
Co
-Ma
na
ger
and
Lea
dA
na
lyst
satthe1%
level.
C. James, J. Karceski / Journal of Financial Economics 82 (2006) 1–3414
ARTICLE IN PRESSC. James, J. Karceski / Journal of Financial Economics 82 (2006) 1–34 15
coverage is initiated. For these broken deals, lead analyst target price ratios are on averagemore than 26 and 36 percentage points higher than target price ratios for firms with zero ornegative initial returns or for firms with nonpositive return to coverage. Lead analysts arealso more optimistic relative to other analysts in broken deals in their recommendations aswell. The average lead analyst target price ratio for broken deals is 14 percentage pointshigher than the average target price ratio set by other analysts.
Overall, stronger coverage by lead analysts in broken deals is consistent with the boostershot hypothesis and the anchored target price level hypothesis, but it contradicts theinformation momentum hypothesis and the anchored target price ratio hypothesis. Whilethe strongest support comes from lead analysts, co-manager analysts and unaffiliatedanalysts also provide more favorable coverage for broken deals.14
Co-manager analysts may give more favorable coverage to broken deals than tosuccessful IPOs because of some kind of agreement to support the stock as part of theunderwriting process. However, it is unclear clear why unaffiliated analysts provide morefavorable recommendations and higher target prices for broken deals as well. Oneexplanation is that some unaffiliated analysts may also provide booster shots as well. Thismay arise from unaffiliated analysts participating in the syndicate even though they do notplay a role as a bookrunner or manager. Alternatively, unaffiliated analyst support maystem from a pre-commitment with one of the managing underwriters to provide analystcoverage. Anecdotal evidence from a recent settlement between the SEC and five largesecurities firms hints towards such an arrangement. In the settlement, the SEC alleged thatlead underwriters made payments out of underwriting fees to other securities firms toprovide coverage. These firms are not necessarily part of the IPO syndicate. Their researchreports contained no mention of side payments, which were described in the settlement as‘‘research guarantees’’ or ‘‘guaranteed economics of research.’’15
The results in Panel A of Table 2 indicate that the timing of coverage varies by analystaffiliation and the stock price performance of the IPO. Coverage is initiated more quicklyby lead and co-manager analysts than by unaffiliated analysts. For example, the mediantime to coverage for lead and co-manager analyst is less than 30 days, whereas the mediantime to coverage by unaffiliated analysts is about six months.
The more timely initiation of coverage by affiliated analysts raises the question ofwhether differences in coverage strength by analyst affiliation are simply due to timingdifferences. For example, if affiliated analysts provide more favorable coverage to assist inprice stabilization, differences in strength of coverage should be most noticeable whencoverage is initiated immediately after the end of the quiet period. More generally, if leadand co-manager analysts initiate coverage at the end of the quiet period while unaffiliatedanalysts initiate five or six months later, differences in recommendations and target priceratios by analyst affiliation may be driven by different information sets that are availablefor IPO firms at these different points in time. However, it is not clear why these differenceswould lead to affiliated analysts being systematically more optimistic about the firm’sprospects.
14We also test for differences in strength of coverage between analyst groups by computing the mean difference
in target price ratios and recommendations for each firm and then computing the mean and median across all
firms. The results are similar to those we report in Table 2.15See Smith (2003). Paying for coverage in this way is not illegal and does not violate NASD rules. However, the
SEC was principally concerned that the payments were not disclosed to investors.
ARTICLE IN PRESSC. James, J. Karceski / Journal of Financial Economics 82 (2006) 1–3416
To examine whether timing explains the differences in strength of coverage, we comparetarget price ratios and recommendations by analyst affiliation for all initiations that occurwithin 30 days of the IPO. Panel B of Table 2 presents the results. Since about 78% of leadand co-manager analyst recommendations occur within 30 days of the offer date, there isvery little difference between the mean and median target price ratios and recommenda-tions in Panels A and B across these two sets of analysts. However, only 16.5% ofunaffiliated analysts initiate coverage during this period, so there is the potential for largedifferences in the strength of coverage between all initiations that occur during the firstyear and initiations that occur within the first 30 days.Similar to Panel A, Panel B shows barely any difference between the mean and median
target price ratios across all three analyst affiliation categories. In addition, for initiationswithin 30 days, there is no significant difference between the average recommendation forlead, co-manager, and unaffiliated analysts. Thus, controlling for timing differences,affiliated analysts are no more optimistic in the target prices they assign than areunaffiliated analysts.Again, we find the largest difference in target price ratios by analyst affiliation for
broken deals. For initiations within the first 30 days, lead analysts assign an averagetarget price ratio of 1.80 for IPO firms with zero or negative return to coverage, but co-manager and unaffiliated analysts give these firms an average target price ratio ofabout 1.69. Although the differences are smaller than in Panel A, Panel B shows thatlead analyst recommendations are more favorable regardless of the performance ofthe IPO.In summary, all analyst groups issue more favorable coverage to IPO firms that
perform poorly in the aftermarket. Even for coverage within the first 30 days after the IPO,broken deals receive higher target price ratios and stronger recommendations for all threeanalyst affiliation categories. While the likelihood of coverage is positively related toaftermarket stock price performance, strength of coverage is inversely related toperformance.
3.3. Strength of coverage and stock price performance
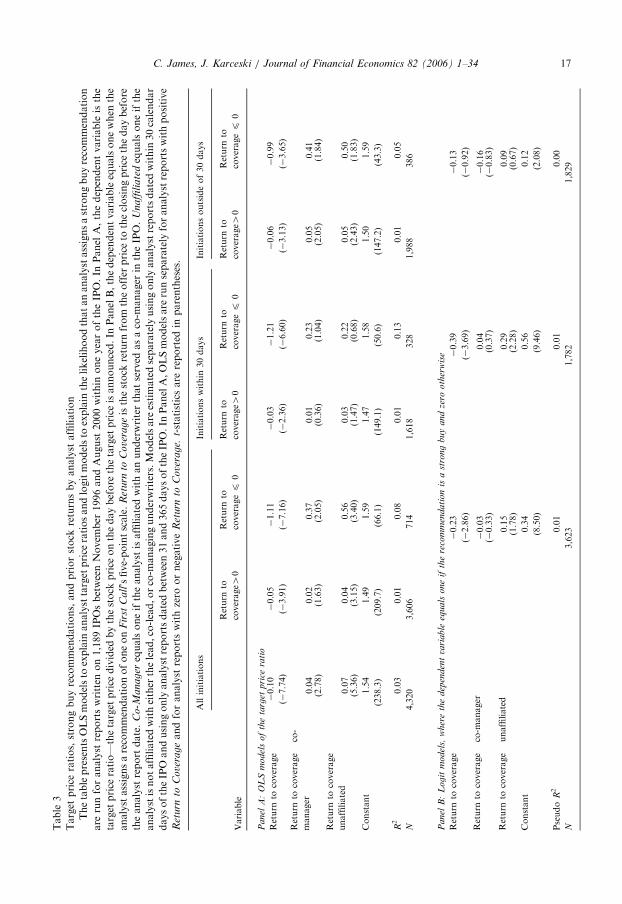
Panel A of Table 3 presents the results of regressions of the target price ratio on priorstock returns.16 To investigate whether this relation varies by analyst affiliation, weinteract return to coverage with two dummy variables, one for each alternative analysttype.As the first column shows, the target price ratio is negatively related to return to
coverage. Strong stock price performance prior to the initiation of coverage leads to lowertarget price ratios. This effect is greatest for lead analysts. In particular, the interactivevariables for co-manager and unaffiliated analysts are both positive and statisticallysignificant, revealing that stock returns prior to coverage has the least impact on targetprices of unaffiliated analysts.17
16To account for overall market movements, we further examine the relation between strength of coverage and
market-adjusted returns, where we compute market-adjusted returns by subtracting the return on the CRSP
value-weighted index over the relevant period from the return to coverage. The results using this measure are
qualitatively similar to those in Table 3.17Target price ratios are negative and significantly related to stock returns for both co-manager and unaffiliated
analysts at the 1% level.
ARTICLE IN PRESSTable
3
Target
price
ratios,strongbuyrecommendations,andpriorstock
returnsbyanalyst
affiliation
ThetablepresentsOLSmodelsto
explain
analysttarget
price
ratiosandlogitmodelsto
explain
thelikelihoodthatananalystassignsastrongbuyrecommendation
are
runforanalyst
reportswritten
on1,189IPOsbetweenNovem
ber
1996andAugust
2000within
oneyearoftheIPO.In
Panel
A,thedependentvariable
isthe
target
price
ratio—
thetarget
price
divided
bythestock
price
onthedaybefore
thetarget
price
isannounced.In
PanelB,thedependentvariableequalsonewhen
the
analystassignsarecommendationofoneon
Fir
stC
all’sfive-pointscale.
Ret
urn
toC
ove
rageisthestock
return
from
theoffer
price
totheclosingprice
thedaybefore
theanalyst
report
date.
Co
-Ma
na
ger
equalsoneiftheanalyst
isaffiliatedwithanunderwriterthatserved
asaco-m
anager
intheIPO.
Un
affi
lia
tedequalsoneifthe
analystisnotaffiliatedwitheither
thelead,co-lead,orco-m
anagingunderwriters.Modelsare
estimatedseparately
usingonly
analystreportsdatedwithin
30calendar
daysoftheIPO
andusingonly
analystreportsdatedbetween31and365daysoftheIPO.In
PanelA,OLSmodelsare
runseparately
foranalystreportswithpositive
Ret
urn
toC
ove
rageandforanalyst
reportswithzero
ornegative
Ret
urn
toC
ove
rage.
t-statisticsare
reported
inparentheses.
Allinitiations
Initiationswithin
30days
Initiationsoutsideof30days
Variable
Return
to
coverage4
0
Return
to
coveragep
0
Return
to
coverage4
0
Return
to
coveragep
0
Return
to
coverage4
0
Return
to
coveragep
0
Panel
A:
OL
Sm
odel
sof
the
targ
etpri
cera
tio
Return
tocoverage
�0.10
�0.05
�1.11
�0.03
�1.21
�0.06
�0.99
(�7.74)
(�3.91)
(�7.16)
(�2.36)
(�6.60)
(�3.13)
(�3.65)
Return
tocoverage�co-
manager
0.04
0.02
0.37
0.01
0.23
0.05
0.41
(2.78)
(1.63)
(2.05)
(0.36)
(1.04)
(2.05)
(1.84)
Return
tocoverage�
unaffiliated
0.07
0.04
0.56
0.03
0.22
0.05
0.50
(5.36)
(3.15)
(3.40)
(1.47)
(0.68)
(2.43)
(1.83)
Constant
1.54
1.49
1.59
1.47
1.58
1.50
1.59
(238.3)
(209.7)
(66.1)
(149.1)
(50.6)
(147.2)
(43.3)
R2
0.03
0.01
0.08
0.01
0.13
0.01
0.05
N4,320
3,606
714
1,618
328
1,988
386
Panel
B:
Logit
model
s,w
her
eth
edep
enden
tva
riable
equals
one
ifth
ere
com
men
dati
on
isa
stro
ng
buy
and
zero
oth
erw
ise
Return
tocoverage
�0.23
�0.39
�0.13
(�2.86)
(�3.69)
(�0.92)
Return
tocoverage�co-m
anager
�0.03
0.04
�0.16
(�0.33)
(0.37)
(�0.83)
Return
tocoverage�unaffiliated
0.15
0.29
0.09
(1.78)
(2.28)
(0.67)
Constant
0.34
0.56
0.12
(8.50)
(9.46)
(2.08)
Pseudo
R2
0.01
0.01
0.00
N3,623
1,782
1,829
C. James, J. Karceski / Journal of Financial Economics 82 (2006) 1–34 17
ARTICLE IN PRESSC. James, J. Karceski / Journal of Financial Economics 82 (2006) 1–3418
The negative relation between target price ratios and stock returns is consistent with thebooster shot hypothesis. However, the negative relation is also consistent with theanchored target price level hypothesis and may simply reflect the fact that strong pastperformance means that an analyst is less likely to view the firm as significantlyundervalued and may be less likely to post a high target price. If this argument is correct,the negative relation between target price ratios and stock returns should be the same forissues that perform well. In contrast, the booster shot hypothesis predicts that the negativerelation between target price ratios and returns will be strongest for poorly performingfirms.To investigate this issue, we estimate two separate regressions based on whether the
firm’s stock is above the offer price when coverage is initiated. For broken deals, leadanalyst target price ratios are very sensitive to share price performance. A one percentagepoint decline in return to coverage is associated with a 111 basis point increase in theanalyst’s target price ratio. In contrast, for issues that trade above the offer price atinitiation, a one percentage point increase in returns leads to a decline in analyst expectedreturns of about five basis points. This large asymmetry is consistent with affiliatedanalysts providing booster shots to support the stock in the aftermarket and not with theanchored target price level hypothesis.The inverse relation between target prices and stock price performance is not limited to
affiliated analysts. Co-manager and unaffiliated analyst target price ratios are alsonegatively related to prior stock returns. However, target prices for these groups ofanalysts are significantly less sensitive to stock returns than those for lead analysts. Again,the role the investment bank plays in the IPO affects how aggressively their analystsprovide support.There are three reasons why we believe the anchored target price hypothesis is not the
sole determinant of target price ratios for recent IPO firms. First, if the large negativecoefficient on return to coverage for broken deals is driven entirely from a mechanicalrelation between returns and the current stock price, the coefficient should not vary byanalyst affiliation. In fact, however, we observe large differences by analyst type.Second, there is a strong asymmetric relation between target price ratios and aftermarket
returns in Table 3 for broken and successful deals. If analysts anchor on a target pricevaluation on the offer date, large return differences can mechanically generate a morenegative slope coefficient when aftermarket returns are negative rather than when stockreturns are positive. This arises from the fact that when target prices are fixed, we areessentially regressing one divided by one plus the aftermarket return against theaftermarket return.18 The slope becomes more negative as aftermarket returns fall. Todetermine whether this effect is the source of the asymmetric slopes for broken versussuccessful deals in Table 3, we estimate the relation between the natural logarithm of thetarget price ratio and the natural logarithm of one plus the stock return prior to coverage.If target prices are fixed at some level and changes in the target price ratio are driven solelyby changes in returns to coverage, then the slope coefficient of this regression should be
18Consider the regression TP=OPð1þ rÞ ¼ aþ br; where TP equals the target price, OP equals the offer price,
and r equals the aftermarket return. If the offer price and target price are pre-determined at the offer date, then
regressing the target price ratio against the aftermarket return would give a more negative slope for broken deals
than for successful deals. However, if we consider the regression log TP=OPð1þ rÞ� �
¼ aþ b logð1þ rÞ; thisrelation will be linear and the same for broken deals and successful deals.
ARTICLE IN PRESSC. James, J. Karceski / Journal of Financial Economics 82 (2006) 1–34 19
constant as a function of aftermarket return. However, when estimated in logarithmicform, the slope coefficient is �0.58 and statistically different from zero for broken deals.The coefficients on both co-manager and unaffiliated interactive variables are positive andstatistically significant. In contrast, in successful deals that have a positive return tocoverage, the slope coefficient is�0.07 and is statistically larger than �0.58 at the 1% level.Thus, the asymmetry that we see in Table 3 is much larger than what can be explained bythe anchored target price level hypothesis.
Third, to insure the result is not simply mechanical, we also estimate the relationbetween returns and the target price to sales ratio, where sales is measured during the yearpreceding the IPO. We choose this metric for two reasons. First, there is no mechanicalrelation between sales and return to coverage, as there is between the stock’s current priceand return to coverage. Second, prior research by Houston et al. (2006) and Asquith et al.(2005) finds that price to sales is a metric frequently used by analysts to establish targetprices. We regress the target price to sales ratio on return to coverage using models similarto those in Table 3. For target price to sales ratios assigned by lead analysts, the coefficienton return to coverage is negative (�19.70) and highly significant for broken deals, but ispositive (5.97) and significant for successful deals. This strong asymmetric relation betweenreturns and target price to sales is another indication that the results in Table 3 are notdriven by a mechanical relation between returns and the price of the stock on the date ofthe analyst report.
Panel B of Table 3 shows the relation between analyst recommendations and past stockreturns. Since virtually all recommendations are favorable (either a ‘‘1’’ or ‘‘2’’ on a five-point scale), we examine the relation between the likelihood of a strong buyrecommendation and prior stock returns. As the first column shows, there is a negativeand significant relation between the likelihood of a strong buy recommendation and returnto coverage. This negative relation is weakest for unaffiliated analysts, where the effect isnot statistically different from zero.
We also estimate separate logit regressions for broken deals and all other IPO firms (notshown in Table 3). For broken deals, there is no relation between the likelihood of a strongbuy and return to coverage for any analyst group. However, for successful IPO firms, thereis a negative relation between the likelihood of a strong buy and stock returns. Theresponse does not differ across analyst groups. These results, coupled with those fromTable 2, suggest that while broken deals are more likely to receive a strong buyrecommendation, the chance of receiving a strong buy does not increase as performancedeteriorates further.
Table 3 addresses the question of whether strength of coverage differs between brokenand successful deals. However, the support that analysts provide may differ for IPOs thatperform unexpectedly well than for those that perform as expected or that underperform.We examine this issue by estimating a spline regression model that permits the relationbetween target price ratios and prior returns to be a piecewise linear function.19 Toestimate this relation, we assume return to coverage breakpoints of zero and 60%, thesample average for return to coverage. The relation between target price ratios and returnsis more negative for broken deals than for deals with positive returns but that perform lessthan the average. For deals with above-average returns, we find no significant relation
19See Greene (1993) for a discussion of spline regressions.
ARTICLE IN PRESSC. James, J. Karceski / Journal of Financial Economics 82 (2006) 1–3420
between target price ratios and prior returns. Thus, the relation between strength ofcoverage and prior returns varies depending on the level of aftermarket performance.Since an analyst’s risk assessment and expectations concerning future earnings growth
may vary with firm and industry characteristics, target price ratios and recommendationsmay be related to these attributes. To address this issue, we model the relation betweenstrength of coverage and returns controlling for analyst affiliation, firm size, sales, whetherthe IPO firm had positive earnings when it went public, rank of the lead underwriter,whether the IPO occurred during the 1999 to 2000 bubble period, whether the firm is in thetechnology sector, and the number of days between the offer date and coverage initiation.Since the results in Table 3 indicate that lead affiliation matters most in terms of strengthof coverage, we distinguish only lead underwriter affiliation.20
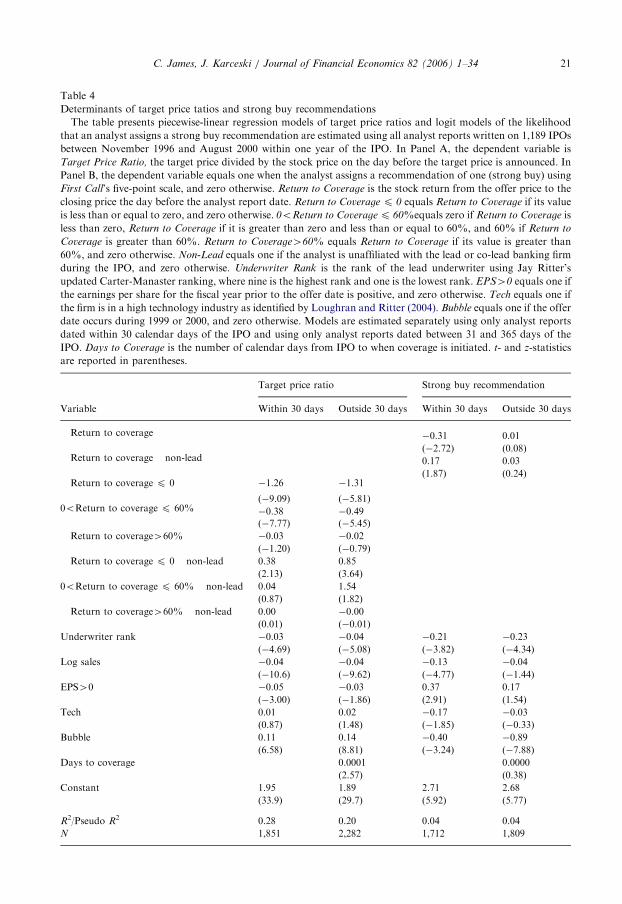
Table 4 shows that controlling for firm and offer characteristics, the relation betweenstrength of coverage and stock returns is similar to the relation reported in Table 3. Targetprice ratios and the likelihood of a strong buy recommendation remain negatively relatedto returns. Some firm characteristics are related to strength of coverage. Firms with lowersales generally receive higher target price ratios and are more likely to receive a strong buyrecommendation at the end of the quiet period. Using a highly ranked underwriter leads tolower target price ratios and a lower probability of a strong buy recommendation. Onepossible explanation for this is that while issues underwritten by prominent investmentbanking firms are more likely to receive coverage, given the underwriter’s prestige, lesssupport is required in the form of higher target prices.Firms with positive earnings are assigned lower target price ratios but are more likely to
receive strong buy recommendations. During the bubble period, IPO firms were assignedhigher target price ratios but were less likely to receive strong buy recommendations. Thesetwo results are consistent with higher target prices being assigned to smaller, riskier firmswith high growth prospects, while strong buy recommendations are reserved for moreestablished, less risky firms. Nevertheless, controlling for firm characteristics, we continueto find a negative, asymmetric relation between target price ratios and returns to coverage.
4. Changes in strength of coverage over time
The higher target prices and stronger recommendations for broken deals and thenegative relation between coverage strength and prior stock returns is most consistent withthe booster shot hypothesis. This raises several questions. Do changes in target price ratiosand recommendations differ over time for broken deals Versus other issues? Is strength ofcoverage subsequent to initiation negatively related to prior stock price performance justas it is for initial coverage? How quickly, if at all, does the unusually strong supportprovided for broken deals diminish over time?To address these questions, we collect information on target prices and recommenda-
tions for up to two years following the initiation of coverage for analysts that initiatecoverage within the first year following the IPO. We measure changes in the strength ofcoverage in several ways. First, we compare recommendations and target price ratios overtime. Second, following Brav and Lehavy (2003), we compute the difference between thecurrent and prior target price scaled by the previous target price. Third, we compute the
20The results do not change meaningfully when controlling for co-manager affiliated and unaffiliated analysts
separately.
ARTICLE IN PRESS
Table 4
Determinants of target price tatios and strong buy recommendations
The table presents piecewise-linear regression models of target price ratios and logit models of the likelihood
that an analyst assigns a strong buy recommendation are estimated using all analyst reports written on 1,189 IPOs
between November 1996 and August 2000 within one year of the IPO. In Panel A, the dependent variable is
Target Price Ratio, the target price divided by the stock price on the day before the target price is announced. In
Panel B, the dependent variable equals one when the analyst assigns a recommendation of one (strong buy) using
First Call’s five-point scale, and zero otherwise. Return to Coverage is the stock return from the offer price to the
closing price the day before the analyst report date. Return to Coverage p 0 equals Return to Coverage if its value
is less than or equal to zero, and zero otherwise. 0oReturn to Coverage p 60%equals zero if Return to Coverage is
less than zero, Return to Coverage if it is greater than zero and less than or equal to 60%, and 60% if Return to
Coverage is greater than 60%. Return to Coverage460% equals Return to Coverage if its value is greater than
60%, and zero otherwise. Non-Lead equals one if the analyst is unaffiliated with the lead or co-lead banking firm
during the IPO, and zero otherwise. Underwriter Rank is the rank of the lead underwriter using Jay Ritter’s
updated Carter-Manaster ranking, where nine is the highest rank and one is the lowest rank. EPS40 equals one if
the earnings per share for the fiscal year prior to the offer date is positive, and zero otherwise. Tech equals one if
the firm is in a high technology industry as identified by Loughran and Ritter (2004). Bubble equals one if the offer
date occurs during 1999 or 2000, and zero otherwise. Models are estimated separately using only analyst reports
dated within 30 calendar days of the IPO and using only analyst reports dated between 31 and 365 days of the
IPO. Days to Coverage is the number of calendar days from IPO to when coverage is initiated. t- and z-statistics
are reported in parentheses.
Target price ratio Strong buy recommendation
Variable Within 30 days Outside 30 days Within 30 days Outside 30 days
Return to coverage �0.31 0.01
(�2.72) (0.08)Return to coverage � non-lead 0.17 0.03
(1.87) (0.24)Return to coverage p 0 �1.26 �1.31
(�9.09) (�5.81)0oReturn to coverage p 60% �0.38 �0.49
(�7.77) (�5.45)
Return to coverage460% �0.03 �0.02
(�1.20) (�0.79)
Return to coverage p 0 � non-lead 0.38 0.85
(2.13) (3.64)
0oReturn to coverage p 60% � non-lead 0.04 1.54
(0.87) (1.82)
Return to coverage460% � non-lead 0.00 �0.00
(0.01) (�0.01)
Underwriter rank �0.03 �0.04 �0.21 �0.23
(�4.69) (�5.08) (�3.82) (�4.34)
Log sales �0.04 �0.04 �0.13 �0.04
(�10.6) (�9.62) (�4.77) (�1.44)
EPS40 �0.05 �0.03 0.37 0.17
(�3.00) (�1.86) (2.91) (1.54)
Tech 0.01 0.02 �0.17 �0.03
(0.87) (1.48) (�1.85) (�0.33)
Bubble 0.11 0.14 �0.40 �0.89
(6.58) (8.81) (�3.24) (�7.88)
Days to coverage 0.0001 0.0000
(2.57) (0.38)
Constant 1.95 1.89 2.71 2.68
(33.9) (29.7) (5.92) (5.77)
R2/Pseudo R2 0.28 0.20 0.04 0.04
N 1,851 2,282 1,712 1,809
C. James, J. Karceski / Journal of Financial Economics 82 (2006) 1–34 21
ARTICLE IN PRESSC. James, J. Karceski / Journal of Financial Economics 82 (2006) 1–3422
difference between the current and prior recommendation. We split subsequentrecommendations into upgrades, downgrades, and reiterations.Table 5 presents the mean and median target price ratio and recommendation for the
first four analyst reports made by each analyst that provides coverage within 30 days of theIPO date. Broken deals are separated from successful IPO firms on the basis of returns tocoverage, and we also separate coverage by analyst affiliation.Looking first at all analysts, there is a small decline in the target price ratio between the
initial and third and fourth subsequent reports. In addition, recommendations become lessfavorable over time, with the mean recommendation deteriorating from 1.48 to 1.60. Thus,analysts are most enthusiastic in their recommendations and target prices when coverage isinitiated than in later reports.The magnitude of the changes in target prices and recommendations over time depends
on the stock price performance prior to the initiation of coverage. The largest changes intarget price ratios and recommendations occur for broken deals. The average mean(median) target price ratio falls from 1.73 (1.69) to 1.42 (1.33), a reduction in the analystaverage return forecast of over 30 percentage points. Recommendations also become lessfavorable for broken deals with the mean rating increasing from 1.31 to 1.70. In contrast,for IPO firms with a positive return to coverage, target price ratios remain essentiallyunchanged, although recommendations become less favorable. Finally, the proportion ofbroken deals that receive subsequent recommendations by an affiliated analyst is about30%, which is slightly less than the 39% frequency that other IPO firms receive a secondanalyst report from an affiliated analyst.For broken deals, lead analysts go from higher average target price ratios and more
favorable recommendations than other analysts at the initiation of coverage to lowertarget price ratios and less favorable recommendations by the fourth recommendation.The average number of days from initiation of coverage to the fourth target price for leadanalysts is 467 days versus 472 days for other analysts, and the difference is not statisticallysignificant.21 Much of the adjustment in target price ratios for broken deals occurs duringthe second analyst report. For example, in the initiating report, lead analysts give anaverage target price ratio of 1.82 to broken deals and 1.45 to successful deals. However,when the second report comes out, this difference is almost completely gone. In the secondanalyst report, lead analysts give an average target price ratio of 1.59 to broken deals and1.56 to successful deals. Thus, while lead analysts provide stronger support for brokendeals, their support fades over time.Table 5 examines changes over time in target prices and recommendations for a
changing group of analysts (since fewer analysts make a fourth recommendation thaninitiate coverage). However, we find a similar pattern when we examine changes over timein the recommendations by an unchanging group of analysts. For example, of the 714analysts that initiate coverage for broken deals, 454 of these analysts provide a secondtarget price. The mean first target price ratio for these analysts is 1.67. For the group ofanalysts that issue a fourth target price ratio, the average first target price ratio is 1.66.One potential concern with the results in Table 5 is that the decline in target price ratios
reflects the influence of the dot-com bubble. If target prices were set higher during the late1990s and early 2000s and then were reduced as stock prices declined in the post-bubble
21The average number of days from initiation of coverage to the fourth recommendation for all IPO firms is 476
days.
ARTICLE IN PRESSC. James, J. Karceski / Journal of Financial Economics 82 (2006) 1–34 23
period, this might explain the decline in target price ratios that is apparent in Table 5.Target prices were indeed set at higher levels during the bubble period. For example, theaverage target price ratio for IPOs that went public during 1999 and 2000 was 1.55 versusan average target price ratio of 1.43 for IPOs that went public from 1996 to 1998.However, the decline in target price ratios over time for broken deals from Table 5 doesnot appear to be driven solely by the decline in target price ratios during the post-bubbleperiod. For example, for broken deals that went public before 1999, target price ratiosdecline from an average of 1.64 at the initiation of coverage to 1.46 by the fourth report.For firms that went public after January 1, 1999, the average target price ratio for brokendeals declines from 1.82 at initiation to 1.37 in the fourth report.
The second way we measure changes in coverage over time is to compare the strength ofcoverage provided some distance in time from the IPO date to recommendations andtarget prices at the initiation of coverage. While the selection of the time frame is somewhatarbitrary, one year is a natural breakpoint. A recommendation is considered to be at year-end if it is within 120 days of the one-year mark and no other recommendation is closer.For example, if the third target price estimate is issued 300 days after the IPO and a fourthtarget price is given 400 days after the IPO, we use the fourth target price estimate as theyear-end target price. With this approach, the target price or recommendation may reflectinformation that arrives after year-end. Thus, we also measure year-end coverage using themost current recommendation that occurs within one year of the IPO. The results usingboth approaches are similar, so we report our findings using only the first procedure.
Table 6 provides target price ratios and recommendations one year following the IPO aswell as differences between strength of coverage at initiation and one year following theIPO. The table splits summary statistics by analyst affiliation and by return to coverage.Consistent with lead analysts providing only a temporary booster shot, we find nodifference between lead and non-lead analyst target price ratios one year after the IPOdate. The average lead analyst recommendation is significantly more favorable than theaverage non-lead analyst recommendation, although the median recommendation is thesame for both groups. One year after the IPO, target price ratios of both lead andunaffiliated analysts for broken deals are the same or slightly higher than for other IPOs.Mean and median ratings are similar for broken deals, and the mean lead analystrecommendation is slightly more favorable (although the difference in means is statisticallysignificant at the 5% level only when return to coverage is greater than zero).
As Panel B shows, during the first year after the IPO, both lead and non-lead analystsrevise their target price ratios upward, while the average recommendation becomes lessfavorable. This divergent pattern may simply reflect the lack of variability inrecommendations when coverage is initiated. In other words, given that only 7% of allratings at initiation are less favorable than a buy, it is difficult for the averagerecommendation to improve over time. Consistent with analysts providing stronger butmore transitory booster shots for broken deals, the average target price ratio falls and theaverage recommendation becomes less favorable for these issues.
Table 7 presents the relation between changes in target prices and recommendationsversus prior stock returns over time. If high initial target prices are established to supportbroken deals, we expect the relation between target price adjustments and stock returns tovary depending on the level of initial support. In Panel A, we regress the percentage changein target prices against stock returns between analyst report dates by the same analyst (thisvariable is called Return from Prior Report). If analysts maintain a constant target price
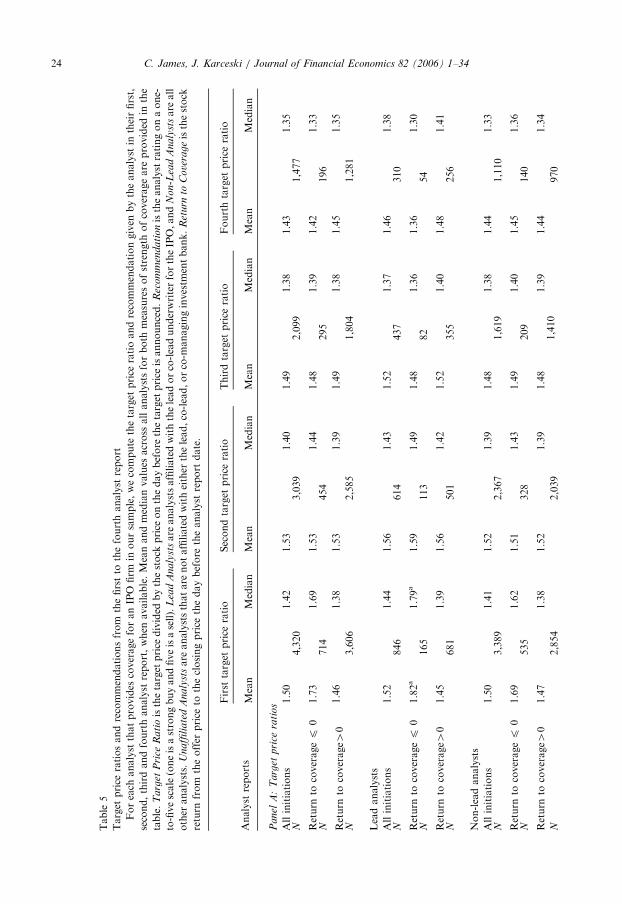
ARTICLE IN PRESS
Table
5
Target
price
ratiosandrecommendationsfrom
thefirstto
thefourthanalyst
report
Foreach
analyst
thatprovides
coverageforanIPO
firm
inoursample,wecompute
thetarget
price
ratioandrecommendationgiven
bytheanalyst
intheirfirst,
second,thirdandfourthanalyst
report,when
available.Meanandmedianvalues
across
allanalystsforboth
measuresofstrength
ofcoverageare
provided
inthe
table.
Ta
rget
Pri
ceR
ati
oisthetarget
price
divided
bythestock
price
onthedaybefore
thetarget
price
isannounced.
Rec
om
men
da
tio
nistheanalystratingonaone-
to-fivescale(oneisastrongbuyandfiveisasell).
Lea
dA
na
lyst
sare
analystsaffiliatedwiththeleadorco-leadunderwriterfortheIPO,and
No
n-L
ead
An
aly
stsare
all
other
analysts.
Un
affi
lia
ted
An
aly
stsare
analyststhatare
notaffiliatedwitheither
thelead,co-lead,orco-m
anaginginvestm
entbank.
Ret
urn
toC
ove
rageisthestock
return
from
theoffer
price
totheclosingprice
thedaybefore
theanalyst
report
date.
First
target
price
ratio
Secondtarget
price
ratio
Thirdtarget
price
ratio
Fourthtarget
price
ratio
Analyst
reports
Mean
Median
Mean
Median
Mean
Median
Mean
Median
Pan
elA
:T
arg
etp
rice
rati
os
Allinitiations
1.50
1.42
1.53
1.40
1.49
1.38
1.43
1.35
N4,320
3,039
2,099
1,477
Return
tocoveragep
01.73
1.69
1.53�
1.44�
1.48�
1.39�
1.42�
1.33�
N714
454
295
196
Return
tocoverage4
01.46
1.38
1.53
1.39
1.49
1.38
1.45
1.35
N3,606
2,585
1,804
1,281
Leadanalysts
Allinitiations
1.52
1.44
1.56
1.43
1.52
1.37
1.46
1.38
N846
614
437
310
Return
tocoveragep
01.82a
1.79a
1.59�
1.49�
1.48�
1.36�
1.36�
1.30�
N165
113
82
54
Return
tocoverage4
01.45
1.39
1.56
1.42
1.52
1.40
1.48
1.41
N681
501
355
256
Non-leadanalysts
Allinitiations
1.50
1.41
1.52
1.39
1.48
1.38
1.44
1.33
N3,389
2,367
1,619
1,110
Return
tocoveragep
01.69
1.62
1.51�
1.43�
1.49�
1.40�
1.45�
1.36�
N535
328
209
140
Return
tocoverage4
01.47
1.38
1.52
1.39
1.48
1.39
1.44
1.34
N2,854
2,039
1,410
970
C. James, J. Karceski / Journal of Financial Economics 82 (2006) 1–3424
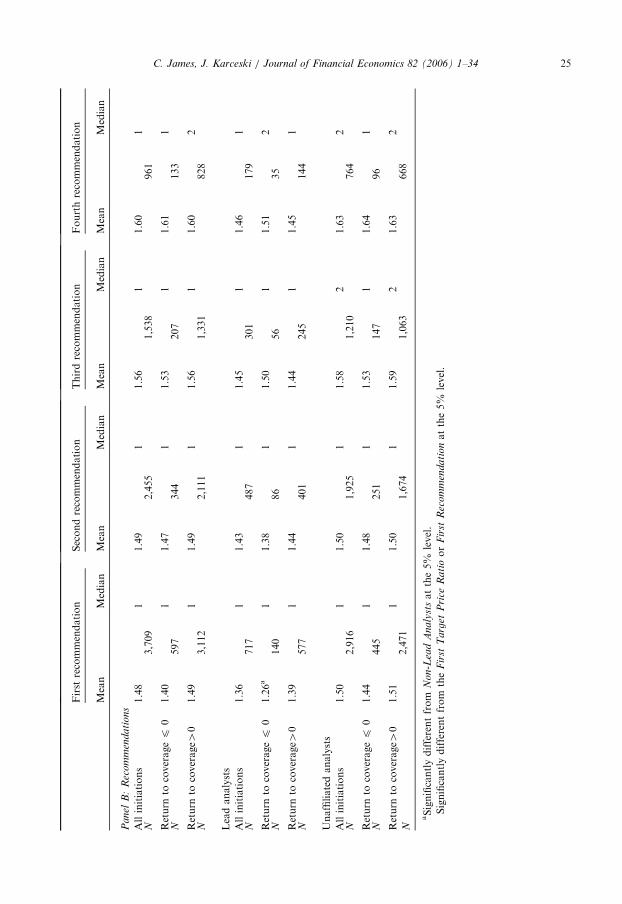
ARTICLE IN PRESS
First
recommendation
Secondrecommendation
Thirdrecommendation
Fourthrecommendation
Mean
Median
Mean
Median
Mean
Median
Mean
Median
Panel
B:
Rec
om
men
dati
ons
Allinitiations
1.48
11.49
11.56
11.60
1N
3,709
2,455
1,538
961
Return
tocoveragep
01.40
11.47
11.53
11.61�
1N
597
344
207
133
Return
tocoverage4
01.49
11.49
11.56
11.60
2N
3,112
2,111
1,331
828
Leadanalysts
Allinitiations
1.36
11.43
11.45
11.46
1N
717
487
301
179
Return
tocoveragep
01.26a
11.38
11.50�
11.51�
2�
N140
86
56
35
Return
tocoverage4
01.39
11.44
11.44
11.45
1N
577
401
245
144
Unaffiliatedanalysts
Allinitiations
1.50
11.50
11.58
21.63
2N
2,916
1,925
1,210
764
Return
tocoveragep
01.44
11.48
11.53
11.64�
1N
445
251
147
96
Return
tocoverage4
01.51
11.50
11.59
21.63
2
N2,471
1,674
1,063
668
aSignificantlydifferentfrom
No
n-L
ead
An
aly
stsatthe5%
level.
�Significantlydifferentfrom
the
Fir
stT
arg
etP
rice
Ra
tioor
Fir
stR
ecom
men
dati
onatthe5%
level.
C. James, J. Karceski / Journal of Financial Economics 82 (2006) 1–34 25
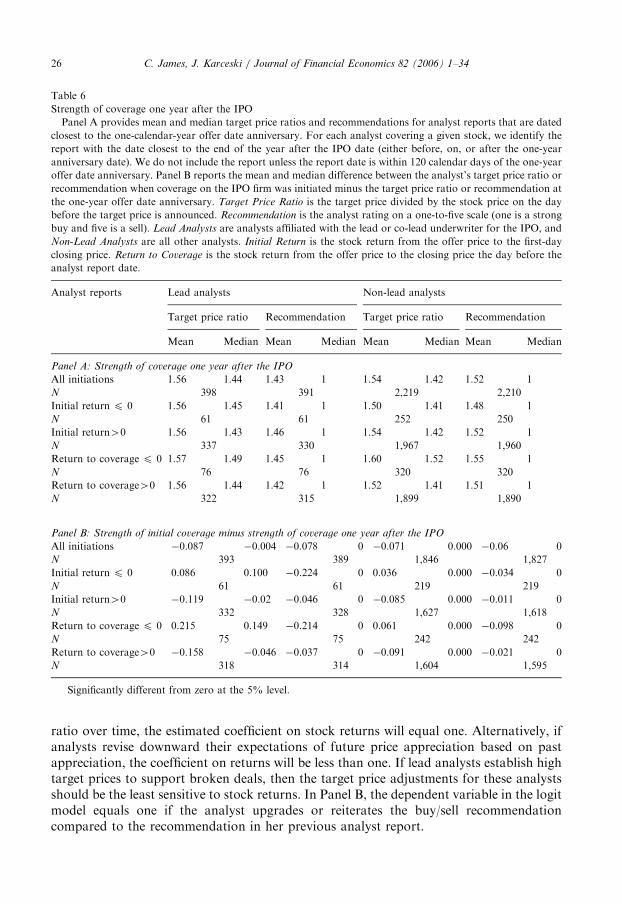
ARTICLE IN PRESS
Table 6
Strength of coverage one year after the IPO
Panel A provides mean and median target price ratios and recommendations for analyst reports that are dated
closest to the one-calendar-year offer date anniversary. For each analyst covering a given stock, we identify the
report with the date closest to the end of the year after the IPO date (either before, on, or after the one-year
anniversary date). We do not include the report unless the report date is within 120 calendar days of the one-year
offer date anniversary. Panel B reports the mean and median difference between the analyst’s target price ratio or
recommendation when coverage on the IPO firm was initiated minus the target price ratio or recommendation at
the one-year offer date anniversary. Target Price Ratio is the target price divided by the stock price on the day
before the target price is announced. Recommendation is the analyst rating on a one-to-five scale (one is a strong
buy and five is a sell). Lead Analysts are analysts affiliated with the lead or co-lead underwriter for the IPO, and
Non-Lead Analysts are all other analysts. Initial Return is the stock return from the offer price to the first-day
closing price. Return to Coverage is the stock return from the offer price to the closing price the day before the
analyst report date.
Analyst reports Lead analysts Non-lead analysts
Target price ratio Recommendation Target price ratio Recommendation
Mean Median Mean Median Mean Median Mean Median
Panel A: Strength of coverage one year after the IPO
All initiations 1.56 1.44 1.43 1 1.54 1.42 1.52 1
N 398 391 2,219 2,210
Initial return p 0 1.56 1.45 1.41 1 1.50 1.41 1.48 1
N 61 61 252 250
Initial return40 1.56 1.43 1.46 1 1.54 1.42 1.52 1
N 337 330 1,967 1,960
Return to coverage p 0 1.57 1.49 1.45 1 1.60 1.52 1.55 1
N 76 76 320 320
Return to coverage40 1.56 1.44 1.42 1 1.52 1.41 1.51 1
N 322 315 1,899 1,890
Panel B: Strength of initial coverage minus strength of coverage one year after the IPO
All initiations �0.087� �0.004 �0.078 0 �0.071 0.000 �0.06 0
N 393 389 1,846 1,827
Initial return p 0 0.086� 0.100 �0.224� 0 0.036 0.000 �0.034 0
N 61 61 219 219
Initial return40 �0.119� �0.02 �0.046 0 �0.085 0.000 �0.011 0
N 332 328 1,627 1,618
Return to coverage p 0 0.215� 0.149 �0.214� 0 0.061 0.000 �0.098 0
N 75 75 242 242
Return to coverage40 �0.158� �0.046 �0.037 0 �0.091 0.000 �0.021 0
N 318 314 1,604 1,595
�Significantly different from zero at the 5% level.
C. James, J. Karceski / Journal of Financial Economics 82 (2006) 1–3426
ratio over time, the estimated coefficient on stock returns will equal one. Alternatively, ifanalysts revise downward their expectations of future price appreciation based on pastappreciation, the coefficient on returns will be less than one. If lead analysts establish hightarget prices to support broken deals, then the target price adjustments for these analystsshould be the least sensitive to stock returns. In Panel B, the dependent variable in the logitmodel equals one if the analyst upgrades or reiterates the buy/sell recommendationcompared to the recommendation in her previous analyst report.
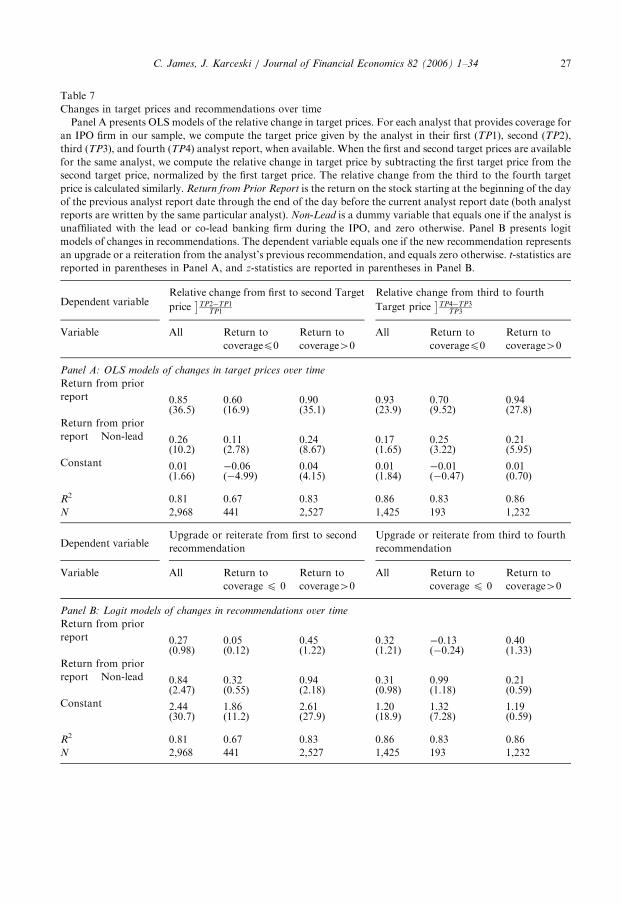
ARTICLE IN PRESS
Table 7
Changes in target prices and recommendations over time
Panel A presents OLS models of the relative change in target prices. For each analyst that provides coverage for
an IPO firm in our sample, we compute the target price given by the analyst in their first (TP1), second (TP2),
third (TP3), and fourth (TP4) analyst report, when available. When the first and second target prices are available
for the same analyst, we compute the relative change in target price by subtracting the first target price from the
second target price, normalized by the first target price. The relative change from the third to the fourth target
price is calculated similarly. Return from Prior Report is the return on the stock starting at the beginning of the day
of the previous analyst report date through the end of the day before the current analyst report date (both analyst
reports are written by the same particular analyst). Non-Lead is a dummy variable that equals one if the analyst is
unaffiliated with the lead or co-lead banking firm during the IPO, and zero otherwise. Panel B presents logit
models of changes in recommendations. The dependent variable equals one if the new recommendation represents
an upgrade or a reiteration from the analyst’s previous recommendation, and equals zero otherwise. t-statistics are
reported in parentheses in Panel A, and z-statistics are reported in parentheses in Panel B.
Dependent variableRelative change from first to second Target
price TP2�TP1TP1
� � Relative change from third to fourth
Target price TP4�TP3TP3
� �
Variable All Return to
coveragep0
Return to
coverage40
All Return to
coveragep0
Return to
coverage40
Panel A: OLS models of changes in target prices over time
Return from prior
report 0.85 0.60 0.90 0.93 0.70 0.94(36.5) (16.9) (35.1) (23.9) (9.52) (27.8)
Return from prior
report � Non-lead 0.26 0.11 0.24 0.17 0.25 0.21(10.2) (2.78) (8.67) (1.65) (3.22) (5.95)
Constant 0.01 �0.06 0.04 0.01 �0.01 0.01(1.66) (�4.99) (4.15) (1.84) (�0.47) (0.70)
R2 0.81 0.67 0.83 0.86 0.83 0.86
N 2,968 441 2,527 1,425 193 1,232
Dependent variableUpgrade or reiterate from first to second
recommendation
Upgrade or reiterate from third to fourth
recommendation
Variable All Return to
coverage p 0
Return to
coverage40
All Return to
coverage p 0
Return to
coverage40
Panel B: Logit models of changes in recommendations over time
Return from prior
report 0.27 0.05 0.45 0.32 �0.13 0.40(0.98) (0.12) (1.22) (1.21) (�0.24) (1.33)
Return from prior
report � Non-lead 0.84 0.32 0.94 0.31 0.99 0.21(2.47) (0.55) (2.18) (0.98) (1.18) (0.59)
Constant 2.44 1.86 2.61 1.20 1.32 1.19(30.7) (11.2) (27.9) (18.9) (7.28) (0.59)
R2 0.81 0.67 0.83 0.86 0.83 0.86
N 2,968 441 2,527 1,425 193 1,232
C. James, J. Karceski / Journal of Financial Economics 82 (2006) 1–34 27
ARTICLE IN PRESSC. James, J. Karceski / Journal of Financial Economics 82 (2006) 1–3428
The models in Table 7 and Table 3 are similar. Table 3 illustrates how prior stockreturns are related to the target price ratio and buy/sell recommendation assigned byanalysts in their initial report. Table 7 shows how prior stock returns are related to changesin the target price and changes in recommendations in subsequent analyst reports.As the first column of Table 7 Panel A shows, the percentage change from the initial
target price to the second target price is positively related to stock returns between the twoanalyst reports. The coefficient estimate on Return from Prior Report is 0.85, meaning thatas the stock return from the first to second analyst report increases by one percentagepoint, the target price of the lead underwriter increases by 85 basis points. Consequently,lead analysts do not maintain a fixed target price ratio between the first and second analystreports, rather, they adjust target prices less than the change in the stock price. Comparedto lead analysts, non-lead analyst target prices are more sensitive to stock returns with anoverall coefficient of 1.11 (0.85 + 0.26).The next two columns indicate that the relation between changes in target prices and
prior stock returns differs based on return to coverage. For broken deals, target prices aresignificantly less sensitive to stock returns than for other IPO firms. The coefficient of 0.60on Return from Prior Report indicates that for broken deals, if the stock’s return is onepercentage point lower between the two analyst reports, the lead analyst’s target price fallsby only 60 basis points. Non-lead analyst target price adjustments are significantly moresensitive to stock returns, with a combined coefficient of 0.71, than are the adjustments oflead analysts.As the target price date gets farther away from the offer date, the sensitivity of target
price adjustments to stock returns increases. As columns four though six of Panel A shows,the sensitivity of the third target price adjustment to prior stock returns is higher than it isfor the first target price adjustment. For example, in broken deals the coefficient on Return
from Prior Report is 0.70, while the combined coefficient for successful IPOs is 0.94.The positive coefficient on Return from Prior Report in all the models shown in Panel A
of Table 7 stands in stark contrast to the consistently negative coefficient on Return to
Coverage in Panel A of Table 3. This negative coefficient indicates that for the first targetprice ratio that is assigned to a recent IPO firm, the higher the prior return on the stock, thelower the target price to current price ratio. From Table 7, we see that this negativerelation is confined to the first analyst report. In subsequent analyst reports, the targetprice ratio tends to increase as prior returns increase.Similarly, the relation between analyst recommendations and prior stock returns is very
different for the first analyst report compared to subsequent analyst reports. Panel B ofTable 3 shows that for coverage initiations by lead analysts, the logit coefficient on Return
to Coverage is negative. This indicates that if the return on the recent IPO firm is low, thestock is more likely to receive a strong buy recommendation.In contrast, in Panel B of Table 7, the logit coefficient on Return from Prior Report is
usually positive but not significant. This means that in subsequent analyst reports, priorstock market performance does not impact the lead analyst’s likelihood of upgrading thestock or reiterating his prior recommendation. For the second analyst report from non-lead analysts, when return to coverage is positive, Panel B of Table 7 reports a coefficientof 0.94 on Return from Prior Report * Non-Lead. This means that for IPO firms withpositive aftermarket returns, non-lead analysts are more likely to upgrade the stock if ithas strong past returns. However, we do not observe a similar prior return effect in thefourth analyst report.
ARTICLE IN PRESSC. James, J. Karceski / Journal of Financial Economics 82 (2006) 1–34 29
5. Market reaction to the initiation of coverage
If the favorability of the information conveyed in analyst reports through targetprice ratios and recommendations are important to the market, there should be a posi-tive relation between strength of coverage and abnormal stock returns around coverageinitiation. Abnormal returns at the initiation of coverage should also be useful toidentify potential affiliation bias among different types of analysts. Results from priorstudies are mixed. For example, Michaely and Womack (1999) find that abnormalreturns are lower for lead analyst reports than for non-lead analyst reports. Chen (2004)also finds abnormal returns are lower for buy and strong buy recommendations bylead underwriters. These authors interpret this as evidence that the market sees throughthe conflicts that lead analysts face and therefore discounts any information issued bylead analysts. However, Bradley (2003) are unable to find any difference between themarket’s reaction to lead and non-lead analyst recommendations at the end of thequiet period.
For each day that any analyst initiates coverage for all IPO firms in our sample, weestimate the three-day abnormal return for the firm. We compute abnormal returns as thereturn on the IPO firm minus the return on the Nasdaq index from the day prior to theinitiating coverage analyst report date through the day after the report date. It is often thecase, especially at the end of the quiet period, that multiple analysts initiate coverage on thesame day. We count each of these dates only once. However, the potential for overlap stillexists. For example, if there is pre-announcement leakage of an analyst recommendation,then this leakage may affect the returns that we attribute to a different analyst’srecommendation. This overlap problem will tend to attenuate any differences in stockreturns by analyst affiliation.
Since our primary interest is whether the market discounts affiliation bias, we distinguishannouncements by the affiliation of the analyst. For announcements dates where morethan one analyst initiates coverage, we classify the affiliation as Both if an affiliated andunaffiliated analyst initiate coverage on the same day. If the market discountsrecommendations and target prices for affiliation bias, we expect a smaller positive stockprice reaction to recommendations and target prices when they are provided only by thelead analyst.
Panel A of Table 8 reports the mean and median three-day abnormal returns separatelyby strength of recommendation, analyst affiliation, and timing of the coverage. Regardlessof the analyst’s affiliation, buy and strong buy recommendations result in positive andstatistically significant returns. For example, when the average recommendation is lessthan or equal to 1.5, the mean three-day abnormal return is 3.41% when only lead analystsinitiate coverage, 4.40% when only non-lead analysts initiate coverage, and 4.13% whenboth lead and non-lead analysts initiate coverage. However, consistent with Chen (2004),we find significantly higher returns on days when only unaffiliated analysts provide strongbuy recommendations (i.e., the 4.40% non-lead analyst only abnormal return isstatistically greater than the 3.41% lead analyst only abnormal return). This differenceis largest in broken deals. When the initial return is less than or equal to zero and theinitiation occurs within 30 days of the offer date, the mean three-day abnormal return is4.92% when only non-lead analysts initiate coverage but is only 1.11% when only leadanalysts initiate coverage. These results are consistent with investors discountingrecommendations of lead analysts to account for affiliation bias.
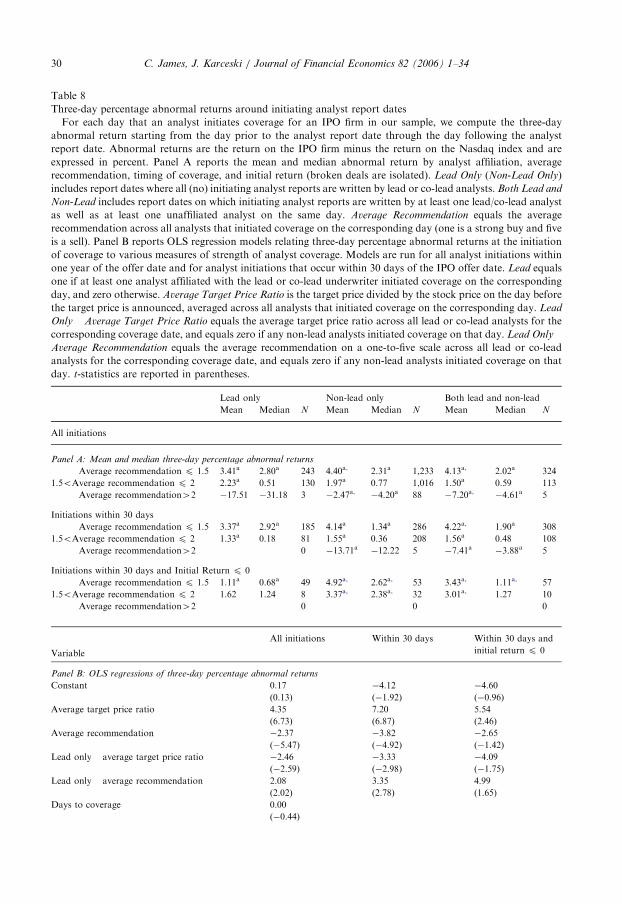
ARTICLE IN PRESS
Table 8
Three-day percentage abnormal returns around initiating analyst report dates
For each day that an analyst initiates coverage for an IPO firm in our sample, we compute the three-day
abnormal return starting from the day prior to the analyst report date through the day following the analyst
report date. Abnormal returns are the return on the IPO firm minus the return on the Nasdaq index and are
expressed in percent. Panel A reports the mean and median abnormal return by analyst affiliation, average
recommendation, timing of coverage, and initial return (broken deals are isolated). Lead Only (Non-Lead Only)
includes report dates where all (no) initiating analyst reports are written by lead or co-lead analysts. Both Lead and
Non-Lead includes report dates on which initiating analyst reports are written by at least one lead/co-lead analyst
as well as at least one unaffiliated analyst on the same day. Average Recommendation equals the average
recommendation across all analysts that initiated coverage on the corresponding day (one is a strong buy and five
is a sell). Panel B reports OLS regression models relating three-day percentage abnormal returns at the initiation
of coverage to various measures of strength of analyst coverage. Models are run for all analyst initiations within
one year of the offer date and for analyst initiations that occur within 30 days of the IPO offer date. Lead equals
one if at least one analyst affiliated with the lead or co-lead underwriter initiated coverage on the corresponding
day, and zero otherwise. Average Target Price Ratio is the target price divided by the stock price on the day before
the target price is announced, averaged across all analysts that initiated coverage on the corresponding day. Lead
Only � Average Target Price Ratio equals the average target price ratio across all lead or co-lead analysts for the
corresponding coverage date, and equals zero if any non-lead analysts initiated coverage on that day. Lead Only �
Average Recommendation equals the average recommendation on a one-to-five scale across all lead or co-lead
analysts for the corresponding coverage date, and equals zero if any non-lead analysts initiated coverage on that
day. t-statistics are reported in parentheses.
Lead only Non-lead only Both lead and non-lead
Mean Median N Mean Median N Mean Median N
All initiations
Panel A: Mean and median three-day percentage abnormal returns
Average recommendation p 1.5 3.41a 2.80a 243 4.40a,� 2.31a 1,233 4.13a,� 2.02a 324
1.5oAverage recommendation p 2 2.23a 0.51 130 1.97a 0.77 1,016 1.50a 0.59 113
Average recommendation42 �17.51 �31.18 3 �2.47a,� �4.20a 88 �7.20a,� �4.61a 5
Initiations within 30 days
Average recommendation p 1.5 3.37a 2.92a 185 4.14a 1.34a 286 4.22a,� 1.90a 308
1.5oAverage recommendation p 2 1.33a 0.18 81 1.55a 0.36 208 1.56a 0.48 108
Average recommendation42 0 �13.71a �12.22 5 �7.41a �3.88a 5
Initiations within 30 days and Initial Return p 0
Average recommendation p 1.5 1.11a 0.68a 49 4.92a,� 2.62a,� 53 3.43a,� 1.11a,� 57
1.5oAverage recommendation p 2 1.62 1.24 8 3.37a,� 2.38a,� 32 3.01a,� 1.27 10
Average recommendation42 0 0 0
Variable
All initiations Within 30 days Within 30 days and
initial return p 0
Panel B: OLS regressions of three-day percentage abnormal returns
Constant 0.17 �4.12 �4.60
(0.13) (�1.92) (�0.96)
Average target price ratio 4.35 7.20 5.54
(6.73) (6.87) (2.46)
Average recommendation �2.37 �3.82 �2.65
(�5.47) (�4.92) (�1.42)
Lead only � average target price ratio �2.46 �3.33 �4.09
(�2.59) (�2.98) (�1.75)
Lead only � average recommendation 2.08 3.35 4.99
(2.02) (2.78) (1.65)
Days to coverage 0.00
(�0.44)
C. James, J. Karceski / Journal of Financial Economics 82 (2006) 1–3430
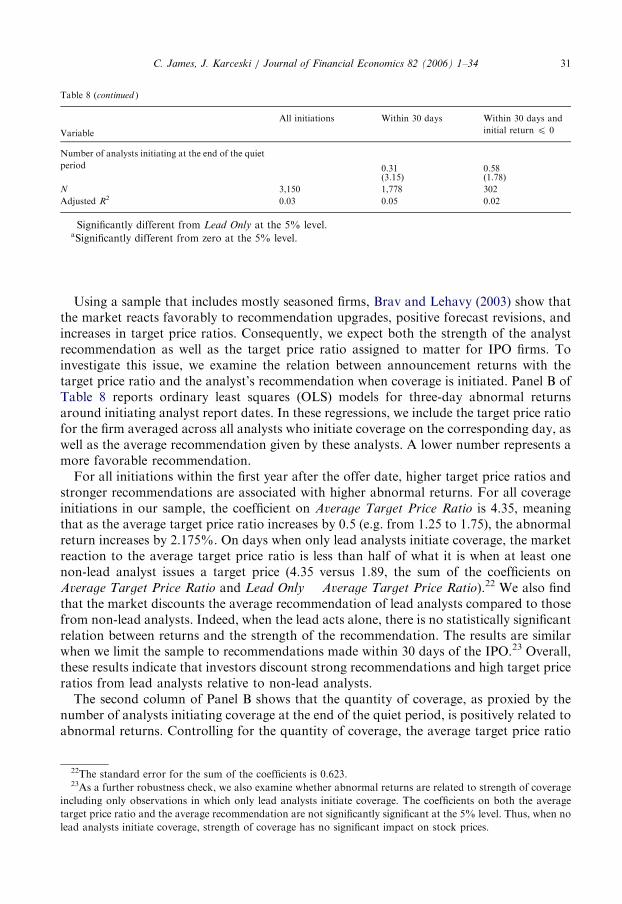
ARTICLE IN PRESS
Table 8 (continued )
Variable
All initiations Within 30 days Within 30 days and
initial return p 0
Number of analysts initiating at the end of the quiet
period 0.31 0.58(3.15) (1.78)
N 3,150 1,778 302
Adjusted R2 0.03 0.05 0.02
�Significantly different from Lead Only at the 5% level.aSignificantly different from zero at the 5% level.
C. James, J. Karceski / Journal of Financial Economics 82 (2006) 1–34 31
Using a sample that includes mostly seasoned firms, Brav and Lehavy (2003) show thatthe market reacts favorably to recommendation upgrades, positive forecast revisions, andincreases in target price ratios. Consequently, we expect both the strength of the analystrecommendation as well as the target price ratio assigned to matter for IPO firms. Toinvestigate this issue, we examine the relation between announcement returns with thetarget price ratio and the analyst’s recommendation when coverage is initiated. Panel B ofTable 8 reports ordinary least squares (OLS) models for three-day abnormal returnsaround initiating analyst report dates. In these regressions, we include the target price ratiofor the firm averaged across all analysts who initiate coverage on the corresponding day, aswell as the average recommendation given by these analysts. A lower number represents amore favorable recommendation.
For all initiations within the first year after the offer date, higher target price ratios andstronger recommendations are associated with higher abnormal returns. For all coverageinitiations in our sample, the coefficient on Average Target Price Ratio is 4.35, meaningthat as the average target price ratio increases by 0.5 (e.g. from 1.25 to 1.75), the abnormalreturn increases by 2.175%. On days when only lead analysts initiate coverage, the marketreaction to the average target price ratio is less than half of what it is when at least onenon-lead analyst issues a target price (4.35 versus 1.89, the sum of the coefficients onAverage Target Price Ratio and Lead Only � Average Target Price Ratio).22 We also findthat the market discounts the average recommendation of lead analysts compared to thosefrom non-lead analysts. Indeed, when the lead acts alone, there is no statistically significantrelation between returns and the strength of the recommendation. The results are similarwhen we limit the sample to recommendations made within 30 days of the IPO.23 Overall,these results indicate that investors discount strong recommendations and high target priceratios from lead analysts relative to non-lead analysts.
The second column of Panel B shows that the quantity of coverage, as proxied by thenumber of analysts initiating coverage at the end of the quiet period, is positively related toabnormal returns. Controlling for the quantity of coverage, the average target price ratio
22The standard error for the sum of the coefficients is 0.623.23As a further robustness check, we also examine whether abnormal returns are related to strength of coverage
including only observations in which only lead analysts initiate coverage. The coefficients on both the average
target price ratio and the average recommendation are not significantly significant at the 5% level. Thus, when no
lead analysts initiate coverage, strength of coverage has no significant impact on stock prices.
ARTICLE IN PRESSC. James, J. Karceski / Journal of Financial Economics 82 (2006) 1–3432
and average recommendation continue to be statistically related to three-day abnormalreturns, and both effects appear even stronger. For example, the coefficient on Average
Target Price Ratio is now 7.20, meaning that as the average target price ratio increases by0.5, the abnormal return increases by 3.6%. So, although the amount of coveragefollowing an IPO is important to the market value of the stock, the strength of thatcoverage is important as well.Given the relatively strong support provided for broken deals, does the market discount
all recommendations and target price ratios more in broken deals, and are recommenda-tions and target price ratios of lead underwriters especially discounted for broken deals? Asthe last column in Panel B shows, the coefficient estimates for Average Target Price Ratio
and Average Recommendation are similar to previous models (the coefficients in the lastcolumn are not statistically different from the previous two models in Panel B), althoughthe latter variable is not statistically different from zero. The coefficients on the Lead Only
interactive variables are more extreme in third column of Panel B compared to theprevious two models, but again there is no statistical difference across the three models.The results in the last column of Panel B present a bit of a puzzle. In particular, the sum
of the coefficients on the two target average target price variables is 1.45 and the sum of thecoefficients on the average recommendations is 2.35. Neither of these summed coefficientsis statistically significant (the standard errors of the sums are 1.51 and 2.34, respectively).Thus, when lead analysts act alone, stronger coverage has no effect on the issuing firm’sstock price. Apart from a pre-commitment to provide strong coverage, it is unclear whylead underwriters risk reputation capital to provide strong coverage for broken deals whenthe stronger coverage has no effect on the stock price. While it is tempting to argue thatthis lack of any relation results from the market fully anticipating the level of supportprovided, if this were the case one would also expect to see no significant price reaction tothe initiation of coverage by the lead analyst. However, the average abnormal return whenonly the lead analyst initiates coverage is 1.3% (significant at the 5% level).
6. Conclusion
What is the nature of the agreement or understanding, if any, between IPO firms andtheir underwriters for post-IPO analyst coverage? In this paper we show that all analysts,but especially those affiliated with the lead underwriter, provide particularly strongcoverage in the form of higher target price ratios and more favorable recommendations forIPO firms whose stock prices perform poorly in the aftermarket. For all analyst coverageinitiations within the first year, the average target price ratio that lead analysts assign IPOfirms that trade at a price higher than the offer price at initiation is 1.46. However, leadanalysts assign an average target price ratio of 1.82 to all other IPO firms (‘‘broken deals’’)for which the return to coverage is zero or negative. Controlling for firm characteristics, inthe first 30 days after the IPO, as return to coverage falls by one percentage point, thetarget price ratio assigned by the lead analyst increases by 1.45 percentage points. Otheranalysts also issue higher target price ratios to broken deals, but the difference is largest forlead analysts, highlighting the conflict of interest for analysts employed by the leadunderwriter. This especially favorable coverage for broken deals is short lived,disappearing on average by the third analyst report written by the lead underwriter’sanalyst.
ARTICLE IN PRESSC. James, J. Karceski / Journal of Financial Economics 82 (2006) 1–34 33
The relation between strength of coverage and returns is consistent with Michaely andWomack’s (1999) hypothesis that lead underwriters provide booster shots of especiallystrong coverage shortly after the offer date to IPO firms whose stocks perform poorly inthe aftermarket. Indeed, the relation between target price ratios and returns varies with thelevel of returns, suggesting that the strength of the booster shot varies with the level ofreturns.
Stronger coverage by lead analysts may be a manifestation of a conflict of interest,whereby lead analysts care more about future investment banking business than aboutpreserving their reputations as a good stock picker. According to this interpretation, theempirical results in our paper demonstrate that the biases in coverage strength are not fullymitigated by reputation effects. However, if the firm’s best brokerage clients hold shares ofthe IPO firm, the pressure on the lead analyst to support the stock may be highest forbroken deals, since the brokerage clients thus far have a loss on their investment in thiscase. Of course, in a broken deal the investment bank may repurchase the shares fromthese clients as part of its commitment to stabilize the issuer’s aftermarket stock price,reducing the pressure by these clients to provide a booster shot. In this case, there may bean even more direct conflict of interest on the part of the analyst to try to limit theinvestment bank’s loss on the stock. Consequently, the incentives for the lead analyst toprovide strong coverage may be greatest when the IPO firm performs poorly in theaftermarket.
The booster shot has a positive effect on the firm’s stock price in the first 30 days afterthe offer date. During this 30-day period, when the average recommendation across allanalysts is closer to strong buy than buy, the average three-day abnormal return is between3.41% and 4.40% depending on whether lead or non-lead analysts initiate on that day. Inaddition, the market reacts to the strength of the coverage provided. After controlling forthe quantity of analyst coverage, within the first 30 days after the IPO, as the target priceratio increases by 0.5 (say from 1.25 to 1.75), the three-day abnormal return increases byabout 3.6% when at least the non-lead analyst has initiated coverage. However, the marketreacts less to high target price ratios and strong recommendations given by lead analystscompared to coverage strength given by non-lead analysts. Moreover, for broken deals themarket appears to completely discount stronger coverage when the lead analyst acts alone.
References
Aggarwal, R.K., Krigman, L., Womack, K.L., 2002a. Strategic IPO underpricing information momentum, and
lockup expiration selling. Journal of Financial Economics 66, 105–137.
Aggarwal, R., Prabhala, N.R., Puri, M., 2002b. Institutional allocation of initial public offerings: empirical
evidence. Journal of Finance 57, 1421–1442.
Asquith, P., Mikhail, M.B., Au, A.S., 2005. Information content of equity analyst reports. Journal of Financial
Economics 75, 245–282.
Bradley, D.J., Jordan, B.D., Ritter, J.R., 2003. The quiet period goes out with a bang. Journal of Finance 58,
1–36.
Bradley, D.J., Jordan, B.D., Ritter, J.R., 2005. Analyst behavior following IPOs: the ‘‘bubble period’’ evidence.
Review of Financial Studies, forthcoming.
Brav, A., Lehavy, R., 2003. An empirical analysis of analysts’ target prices: short-term informativeness and long-
term dynamics. Journal of Finance 58, 1933–1967.
Carter, R.B., Manaster, S., 1990. Initial public offerings and underwriter reputation. Journal of Finance 45,
1045–1067.
Chen, H., Ritter, J.R., 2000. The seven percent solution. Journal of Finance 55, 1105–1131.

ARTICLE IN PRESSC. James, J. Karceski / Journal of Financial Economics 82 (2006) 1–3434
Chen, X., 2004. Analysts affiliation ranking and the market reaction to stock recommendations for IPOs.
Working paper, University of British Columbia.
Cliff, M.T., Denis, D.J., 2004. Do initial public offering firms purchase analyst coverage with underpricing?
Journal of Finance 59, 2871–2901.
Farrell, J., Rabin, M., 1996. Cheap talk. Journal of Economic Perspectives 10, 103–118.
Greene, W.H., 1993. Econometric Analysis, Second ed. Macmillan, New York.
Houston, J., James, C., Karceski, J., 2006. What a difference a month makes: stock analyst valuations following
initial public offerings. Journal of Financial and Quantitative Analysis 41, 111–137.
Krigman, L., Shaw, W.H., Womack, K.L., 2001. Why do firms switch underwriters? Journal of Financial
Economics 60, 245–284.
Lin, H., McNichols, M.F., 1998. Underwriting relationships, analysts’ earnings forecasts and investment
recommendations. Journal of Accounting and Economics 25, 101–127.
Loughran, T., Ritter, J.R., 2004. Why has IPO underpricing changed over time? Financial Management 33, 5–37.
Malmendier, U., Shanthikumar, D., 2004. Are investors naı̈ve about incentives? Working paper, Stanford
University.
Michaely, R., Womack, K.L., 1999. Conflict of interest and the credibility of underwriter analyst
recommendations. Review of Financial Studies 12, 653–686.
Rajan, R.G., Servaes, H., 1997. Analyst following of initial public offerings. Journal of Finance 52, 507–529.
Reuter, J., 2004. Are IPO allocations for sale? Evidence from mutual funds. Journal of Finance, forthcoming.
Smith, R., 2003. The stock-research pact: big firms and research ploy, settlement reveals quiet payments. The Wall
Street Journal, April 30.
Smith, R., Craig, S., Solomon, D., 2003. Wall Street firms to pay $1.4 billion to end inquiry—record payment
settles conflict-of-interest charges. The Wall Street Journal, April 29.