Embed Size (px)
Citation preview
Investor Presentation – FY19
2
Performance update
Strategy and initiatives
Industry overview
I
II
III
AnnexureIV
Agenda
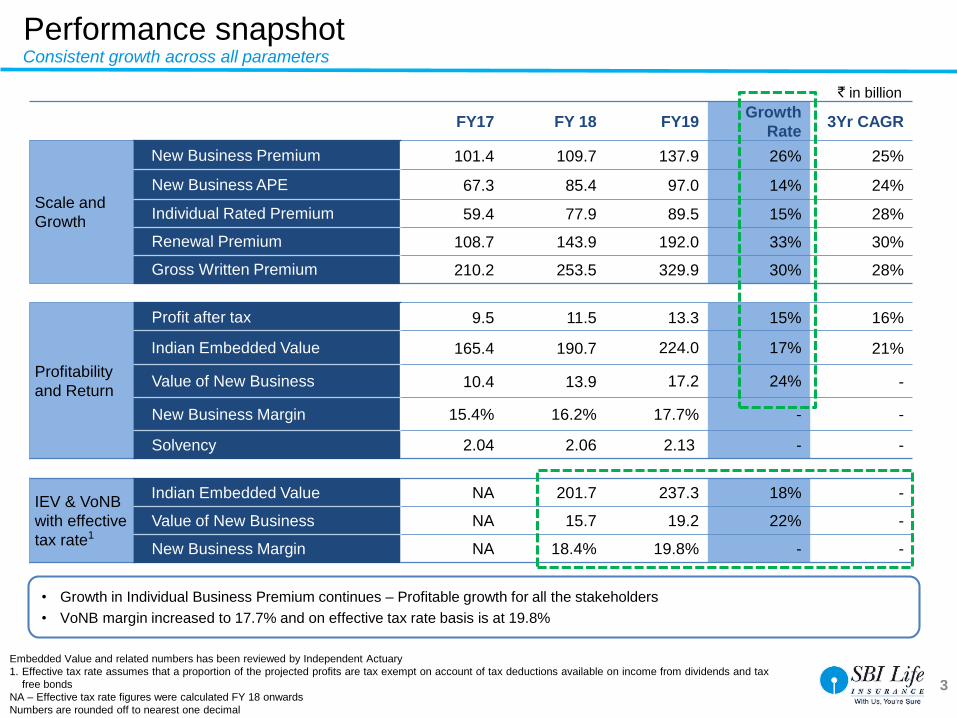
Performance snapshot
` in billion
3
Embedded Value and related numbers has been reviewed by Independent Actuary
1. Effective tax rate assumes that a proportion of the projected profits are tax exempt on account of tax deductions available on income from dividends and tax
free bonds
NA – Effective tax rate figures were calculated FY 18 onwards
Numbers are rounded off to nearest one decimal
FY17 FY 18 FY19 Growth
Rate 3Yr CAGR
Scale and
Growth
New Business Premium 101.4 109.7 137.9 26% 25%
New Business APE 67.3 85.4 97.0 14% 24%
Individual Rated Premium 59.4 77.9 89.5 15% 28%
Renewal Premium 108.7 143.9 192.0 33% 30%
Gross Written Premium 210.2 253.5 329.9 30% 28%
Profitability
and Return
Profit after tax 9.5 11.5 13.3 15% 16%
Indian Embedded Value 165.4 190.7 224.0 17% 21%
Value of New Business 10.4 13.9 17.2 24% -
New Business Margin 15.4% 16.2% 17.7% - -
Solvency 2.04 2.06 2.13 - -
IEV & VoNB
with effective
tax rate1
Indian Embedded Value NA 201.7 237.3 18% -
Value of New Business NA 15.7 19.2 22% -
New Business Margin NA 18.4% 19.8% - -
• Growth in Individual Business Premium continues – Profitable growth for all the stakeholders
• VoNB margin increased to 17.7% and on effective tax rate basis is at 19.8%
Consistent growth across all parameters
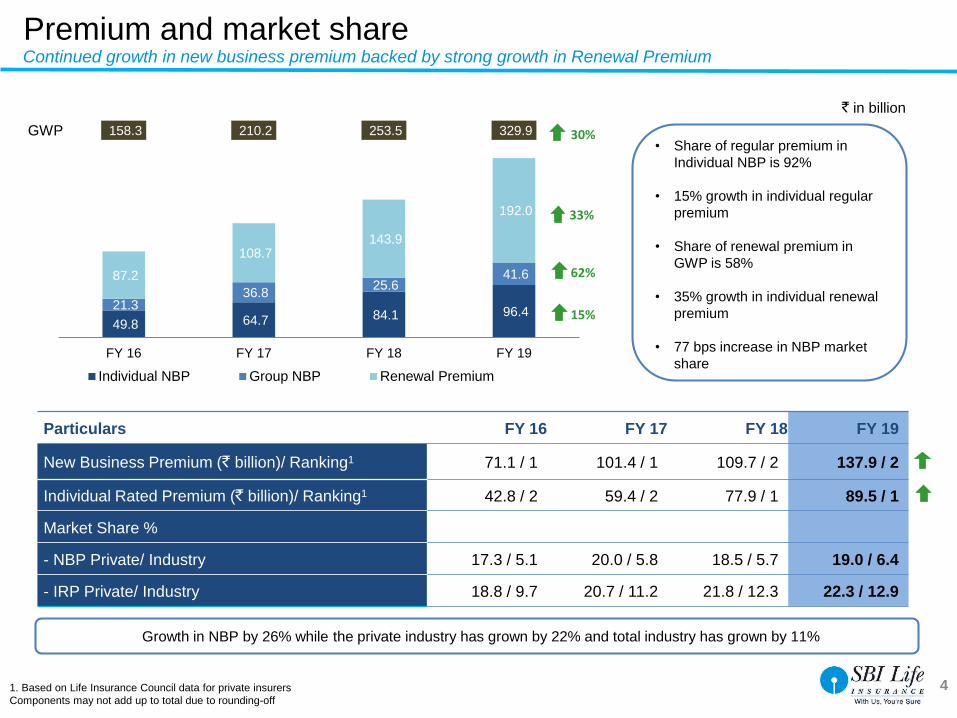
49.8 64.7 84.1 96.4 21.3
36.8 25.6
41.6 87.2
108.7 143.9
192.0
158.3 210.2 253.5 329.9
FY 16 FY 17 FY 18 FY 19
Individual NBP Group NBP Renewal Premium
4
Continued growth in new business premium backed by strong growth in Renewal Premium
1. Based on Life Insurance Council data for private insurers
Components may not add up to total due to rounding-off
Growth in NBP by 26% while the private industry has grown by 22% and total industry has grown by 11%
` in billion
15%
33%
62%
Particulars FY 16 FY 17 FY 18 FY 19
New Business Premium (` billion)/ Ranking1 71.1 / 1 101.4 / 1 109.7 / 2 137.9 / 2
Individual Rated Premium (` billion)/ Ranking1 42.8 / 2 59.4 / 2 77.9 / 1 89.5 / 1
Market Share %
- NBP Private/ Industry 17.3 / 5.1 20.0 / 5.8 18.5 / 5.7 19.0 / 6.4
- IRP Private/ Industry 18.8 / 9.7 20.7 / 11.2 21.8 / 12.3 22.3 / 12.9
30%GWP
Premium and market share
• Share of regular premium in
Individual NBP is 92%
• 15% growth in individual regular
premium
• Share of renewal premium in
GWP is 58%
• 35% growth in individual renewal
premium
• 77 bps increase in NBP market
share
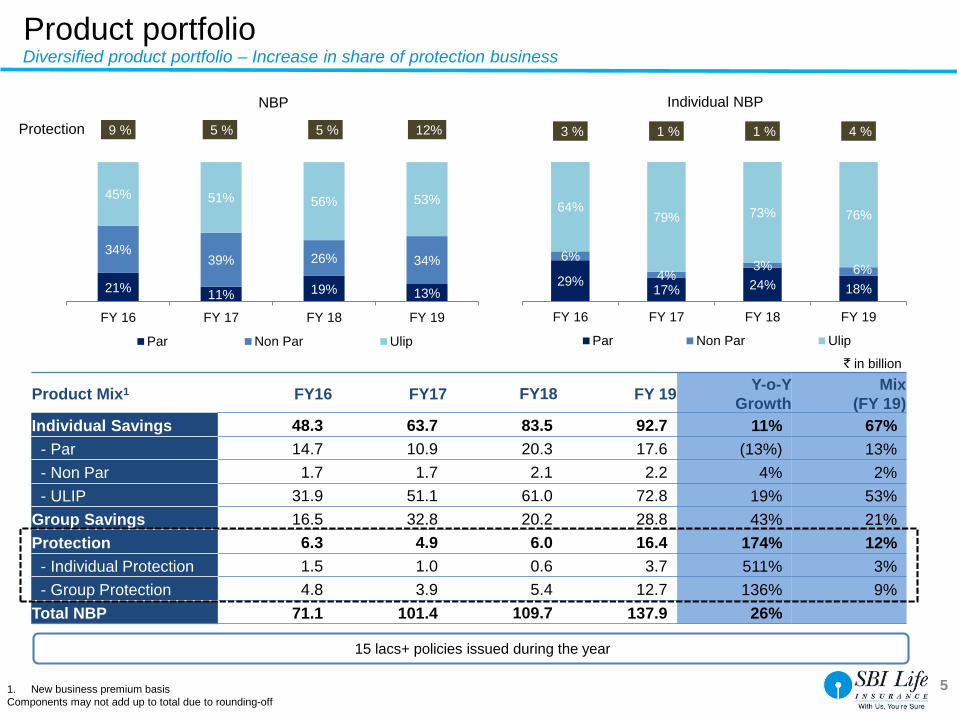
21%11% 19% 13%
34%39% 26% 34%
45% 51% 56% 53%
9 % 5 % 5 % 12%
FY 16 FY 17 FY 18 FY 19
Par Non Par Ulip
5
NBP
` in billion
1. New business premium basis
Components may not add up to total due to rounding-off
15 lacs+ policies issued during the year
Product Mix11 FY16 FY17 FY18 FY 19Y-o-Y
Growth
Mix
(FY 19)
Individual Savings 48.3 63.7 83.5 92.7 11% 67%
- Par 14.7 10.9 20.3 17.6 (13%) 13%
- Non Par 1.7 1.7 2.1 2.2 4% 2%
- ULIP 31.9 51.1 61.0 72.8 19% 53%
Group Savings 16.5 32.8 20.2 28.8 43% 21%
Protection 6.3 4.9 6.0 16.4 174% 12%
- Individual Protection 1.5 1.0 0.6 3.7 511% 3%
- Group Protection 4.8 3.9 5.4 12.7 136% 9%
Total NBP 71.1 101.4 109.7 137.9 26%
29%17% 24% 18%
6%
4%3% 6%
64%79% 73% 76%
3 % 1 % 1 % 4 %
FY 16 FY 17 FY 18 FY 19
Par Non Par Ulip
Individual NBP
Product portfolio
Protection
Diversified product portfolio – Increase in share of protection business
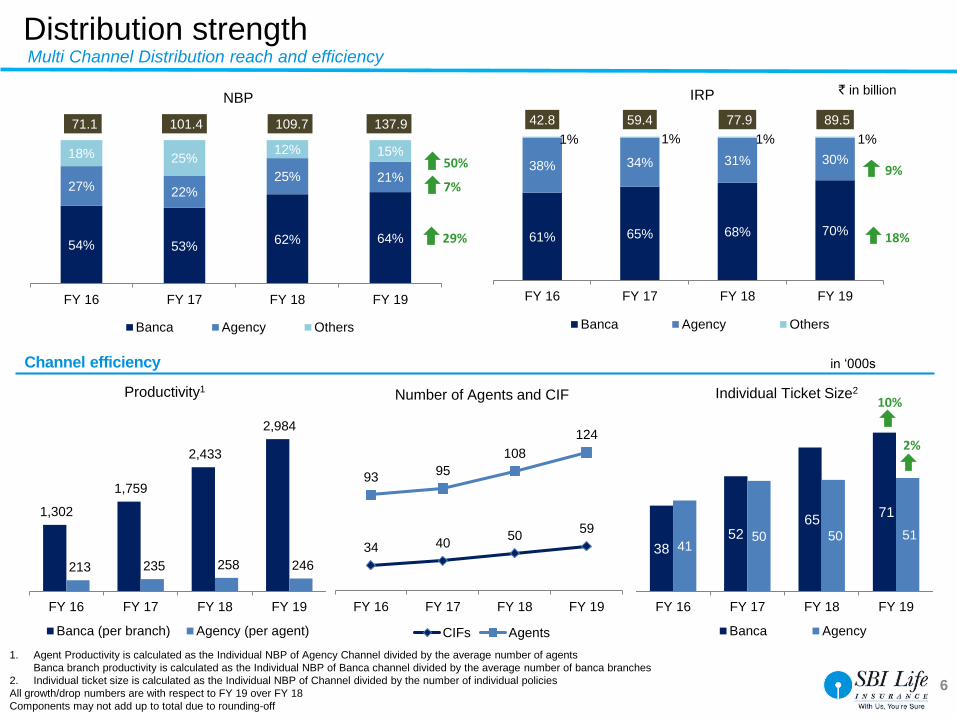
61% 65% 68% 70%
38% 34% 31% 30%
1% 1% 1% 1%
42.8 59.4 77.9 89.5
FY 16 FY 17 FY 18 FY 19
Banca Agency Others
IRP
6
` in billion
1. Agent Productivity is calculated as the Individual NBP of Agency Channel divided by the average number of agents
Banca branch productivity is calculated as the Individual NBP of Banca channel divided by the average number of banca branches
2. Individual ticket size is calculated as the Individual NBP of Channel divided by the number of individual policies
All growth/drop numbers are with respect to FY 19 over FY 18
Components may not add up to total due to rounding-off
54% 53%62% 64%
27% 22%25% 21%
18% 25%12% 15%
71.1 101.4 109.7 137.9
FY 16 FY 17 FY 18 FY 19
Banca Agency Others
NBP
29%
7%9%
18%
in ‘000s
3852
65 71
4150 50 51
FY 16 FY 17 FY 18 FY 19
Individual Ticket Size2
Banca Agency
50%
34 4050
59
9395
108
124
FY 16 FY 17 FY 18 FY 19
Number of Agents and CIF
CIFs Agents
2%
10%
Distribution strength
1,302
1,759
2,433
2,984
213 235 258 246
FY 16 FY 17 FY 18 FY 19
Productivity1
Banca (per branch) Agency (per agent)
Multi Channel Distribution reach and efficiency
Channel efficiency
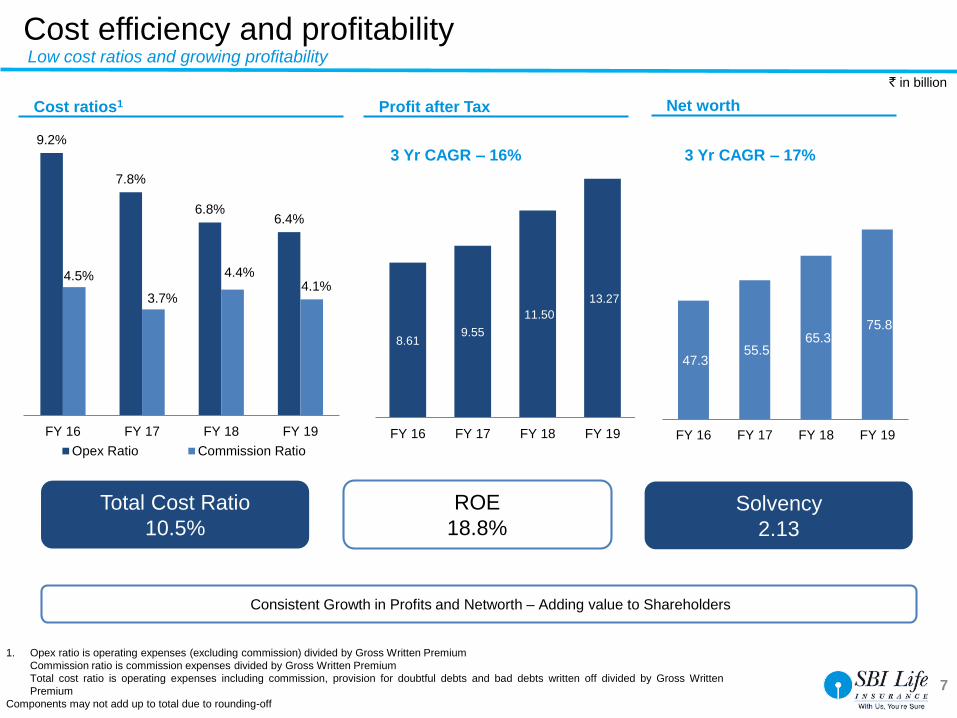
47.3 55.5
65.3 75.8
FY 16 FY 17 FY 18 FY 19
8.619.55
11.50
13.27
FY 16 FY 17 FY 18 FY 19
7
Cost ratios1
9.2%
7.8%
6.8%6.4%
4.5%
3.7%
4.4%4.1%
FY 16 FY 17 FY 18 FY 19
Opex Ratio Commission Ratio
1. Opex ratio is operating expenses (excluding commission) divided by Gross Written Premium
Commission ratio is commission expenses divided by Gross Written Premium
Total cost ratio is operating expenses including commission, provision for doubtful debts and bad debts written off divided by Gross Written
Premium
Components may not add up to total due to rounding-off
` in billion
Cost efficiency and profitability
Solvency
2.13
ROE
18.8%
Total Cost Ratio
10.5%
Profit after Tax Net worth
Consistent Growth in Profits and Networth – Adding value to Shareholders
Low cost ratios and growing profitability
3 Yr CAGR – 16% 3 Yr CAGR – 17%
8
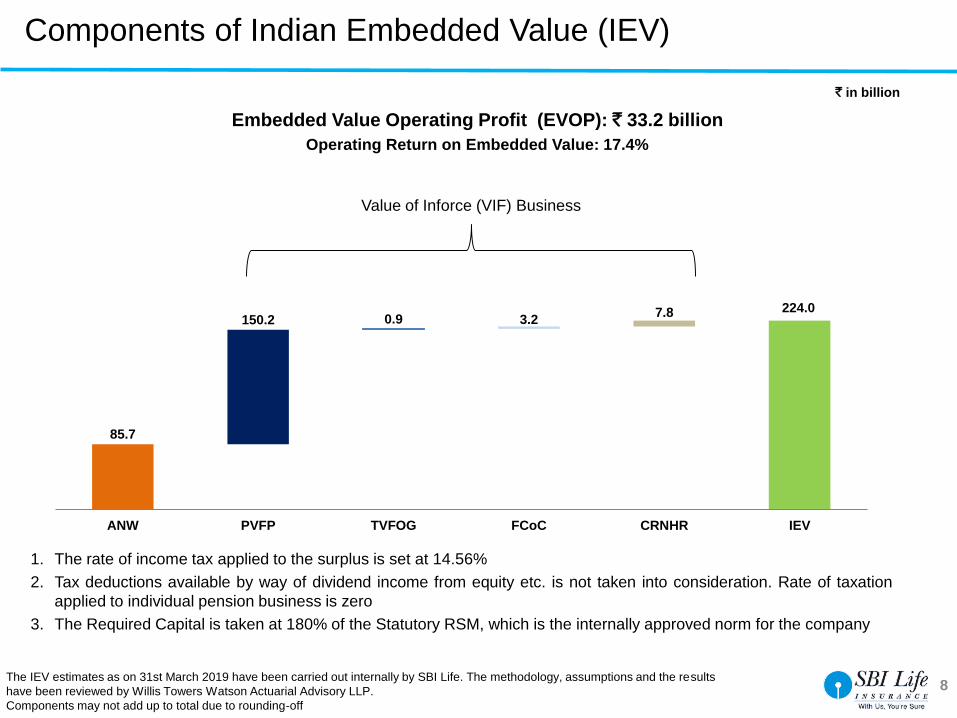
Components of Indian Embedded Value (IEV)
1. The rate of income tax applied to the surplus is set at 14.56%
2. Tax deductions available by way of dividend income from equity etc. is not taken into consideration. Rate of taxation
applied to individual pension business is zero
3. The Required Capital is taken at 180% of the Statutory RSM, which is the internally approved norm for the company
The IEV estimates as on 31st March 2019 have been carried out internally by SBI Life. The methodology, assumptions and the results
have been reviewed by Willis Towers Watson Actuarial Advisory LLP.
Components may not add up to total due to rounding-off
Embedded Value Operating Profit (EVOP): ` 33.2 billion
Operating Return on Embedded Value: 17.4%
` in billion
Value of Inforce (VIF) Business
85.7
150.2 0.9 3.27.8 224.0
ANW PVFP TVFOG FCoC CRNHR IEV
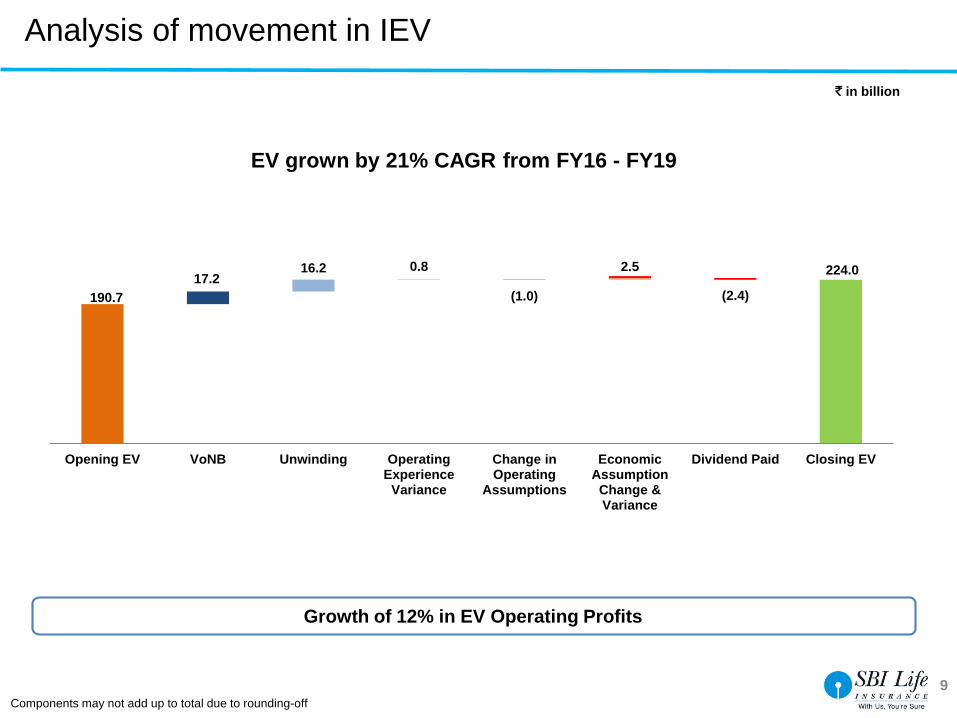
(1.0) (2.4)
224.0
190.7
17.216.2 0.8 2.5
Opening EV VoNB Unwinding OperatingExperience
Variance
Change inOperating
Assumptions
EconomicAssumption
Change &Variance
Dividend Paid Closing EV
9
Analysis of movement in IEV
Growth of 12% in EV Operating Profits
EV grown by 21% CAGR from FY16 - FY19
Components may not add up to total due to rounding-off
` in billion
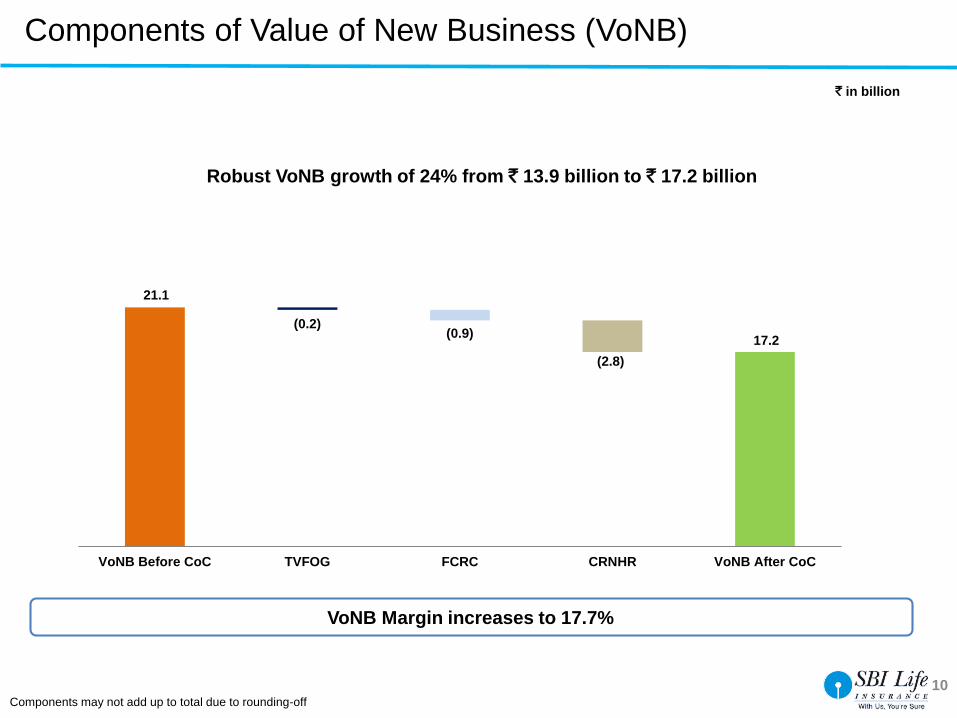
(0.2)(0.9)
(2.8)
21.1
17.2
VoNB Before CoC TVFOG FCRC CRNHR VoNB After CoC
10
Components of Value of New Business (VoNB)
Robust VoNB growth of 24% from ` 13.9 billion to ` 17.2 billion
` in billion
VoNB Margin increases to 17.7%
Components may not add up to total due to rounding-off

80.7%73.2%
69.2%
76.9%
53.8%
81.1%73.9%
67.4%62.5%
67.2%
83.0%
75.2%70.0%
63.9%58.4%
85.1%76.7%
71.4%66.4%
57.2%
13th Month 25th Month 37th Month 49th Month 61st Month
Persistency1
FY 16 FY 17 FY 18 FY 19
0.29%
0.20%0.14%
0.10%
FY 16 FY 17 FY 18 FY 19
Unfair Business Practice3
8.2% 8.7%7.2%
5.2%
FY 16 FY 17 FY 18 FY 19
Surrender Ratio2
11
Customer retention through quality underwriting
Customer satisfaction metrics
1. The persistency ratios are calculated as per IRDAI circular dated 23rd January 2014. Single premium and fully paid-up policies are considered.
Ratios are calculated based on premium.
2. Surrender ratio-individual linked products (Surrender/average AuM).
3. Number of grievances with respect to unfair business practice that are reported to the Company divided by policies issued by the Company in the
same period.
• Strong customer service ethos resulting in consistent reduction in Unfair business practices ratio
• Customer engagement and awareness campaigns resulting in reduction in Surrender ratio
Customer retention and satisfaction
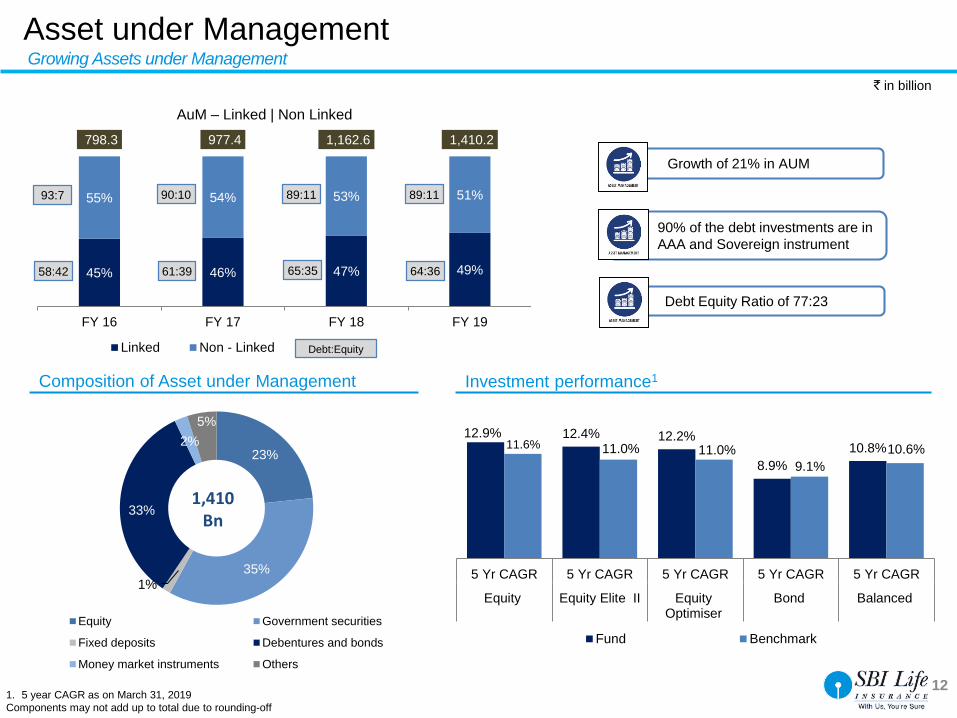
Composition of Asset under Management
45% 46% 47% 49%
55% 54% 53% 51%
798.3 977.4 1,162.6 1,410.2
FY 16 FY 17 FY 18 FY 19
AuM – Linked | Non Linked
Linked Non - Linked
12
Growing Assets under Management
Investment performance1
` in billion
1. 5 year CAGR as on March 31, 2019
Components may not add up to total due to rounding-off
12.9% 12.4% 12.2%
8.9%
10.8%11.6% 11.0% 11.0%
9.1%
10.6%
5 Yr CAGR 5 Yr CAGR 5 Yr CAGR 5 Yr CAGR 5 Yr CAGR
Equity Equity Elite II EquityOptimiser
Bond Balanced
Fund Benchmark
Debt:Equity
23%
35%1%
33%
2%
5%
Equity Government securities
Fixed deposits Debentures and bonds
Money market instruments Others
1,410Bn
Asset under Management
58:42 64:36
89:1190:10 89:11
65:3561:39
Growth of 21% in AUM
90% of the debt investments are in
AAA and Sovereign instrument
Debt Equity Ratio of 77:23
93:7
13
Performance update
Strategy and initiatives
Industry overview
I
II
III
AnnexureIV
Agenda
14
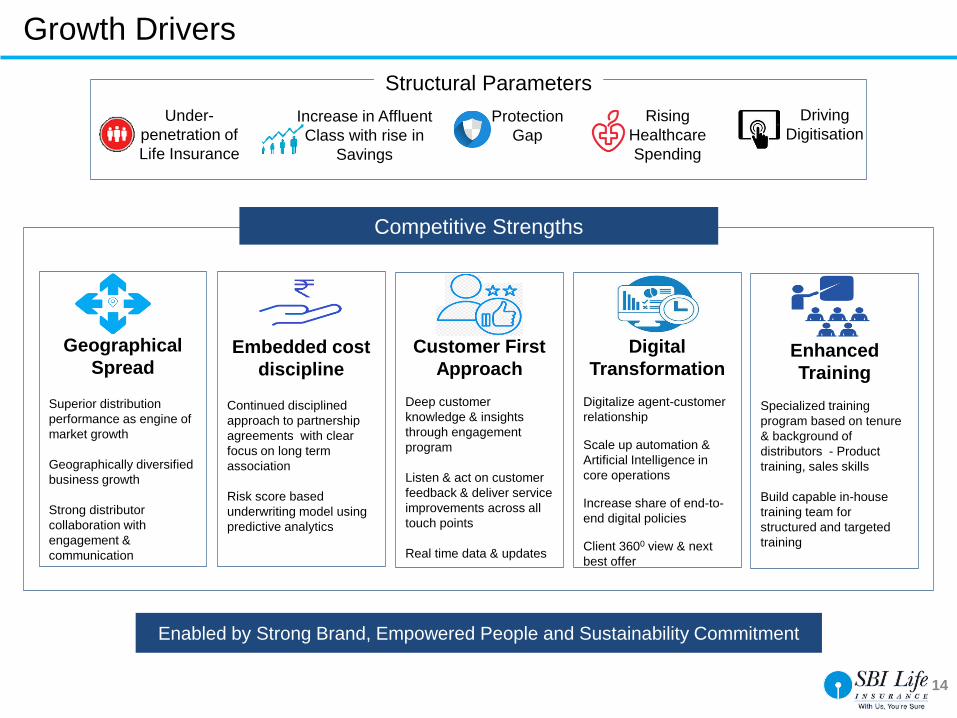
Growth Drivers
Competitive Strengths
Geographical
Spread
Superior distribution
performance as engine of
market growth
Geographically diversified
business growth
Strong distributor
collaboration with
engagement &
communication
Embedded cost
discipline
Continued disciplined
approach to partnership
agreements with clear
focus on long term
association
Risk score based
underwriting model using
predictive analytics
Enhanced
Training
Specialized training
program based on tenure
& background of
distributors - Product
training, sales skills
Build capable in-house
training team for
structured and targeted
training
Customer First
Approach
Deep customer
knowledge & insights
through engagement
program
Listen & act on customer
feedback & deliver service
improvements across all
touch points
Real time data & updates
Enabled by Strong Brand, Empowered People and Sustainability Commitment
Under-
penetration of
Life Insurance
Increase in Affluent
Class with rise in
Savings
Protection
Gap
Rising
Healthcare
Spending
Driving
Digitisation
Digital
Transformation
Digitalize agent-customer
relationship
Scale up automation &
Artificial Intelligence in
core operations
Increase share of end-to-
end digital policies
Client 3600 view & next
best offer
Structural Parameters
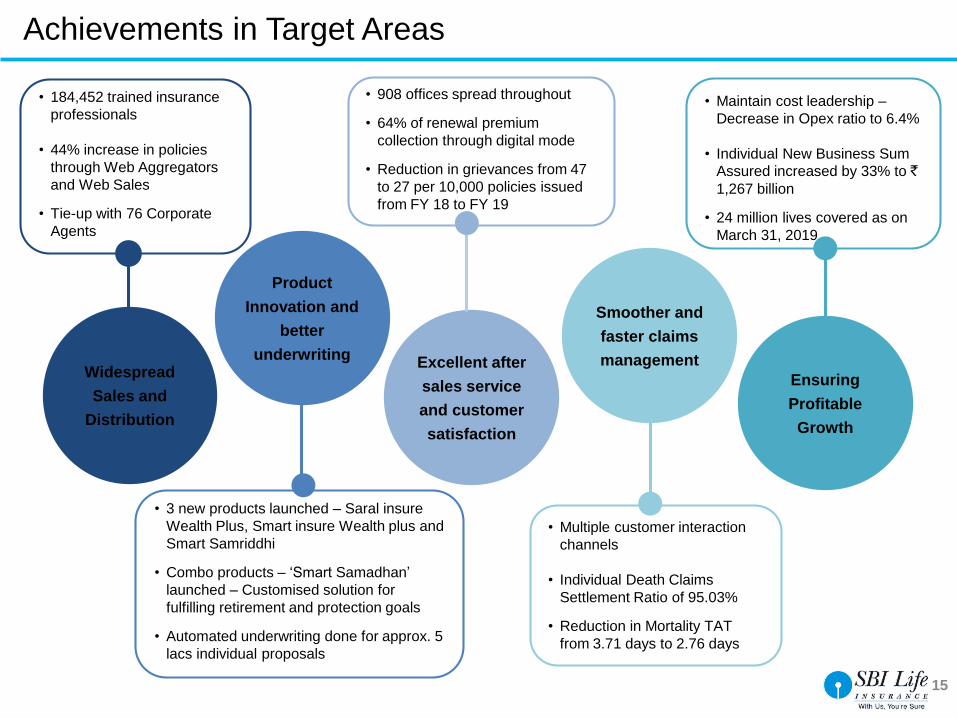
• Multiple customer interaction
channels
• Individual Death Claims
Settlement Ratio of 95.03%
• Reduction in Mortality TAT
from 3.71 days to 2.76 days
• 184,452 trained insurance
professionals
• 44% increase in policies
through Web Aggregators
and Web Sales
• Tie-up with 76 Corporate
Agents
• 3 new products launched – Saral insure
Wealth Plus, Smart insure Wealth plus and
Smart Samriddhi
• Combo products – ‘Smart Samadhan’
launched – Customised solution for
fulfilling retirement and protection goals
• Automated underwriting done for approx. 5
lacs individual proposals
Widespread
Sales and
Distribution
Product
Innovation and
better
underwritingExcellent after
sales service
and customer
satisfaction
Smoother and
faster claims
management
Ensuring
Profitable
Growth
15
Achievements in Target Areas
• Maintain cost leadership –
Decrease in Opex ratio to 6.4%
• Individual New Business Sum
Assured increased by 33% to `1,267 billion
• 24 million lives covered as on
March 31, 2019
• 908 offices spread throughout
• 64% of renewal premium
collection through digital mode
• Reduction in grievances from 47
to 27 per 10,000 policies issued
from FY 18 to FY 19
16
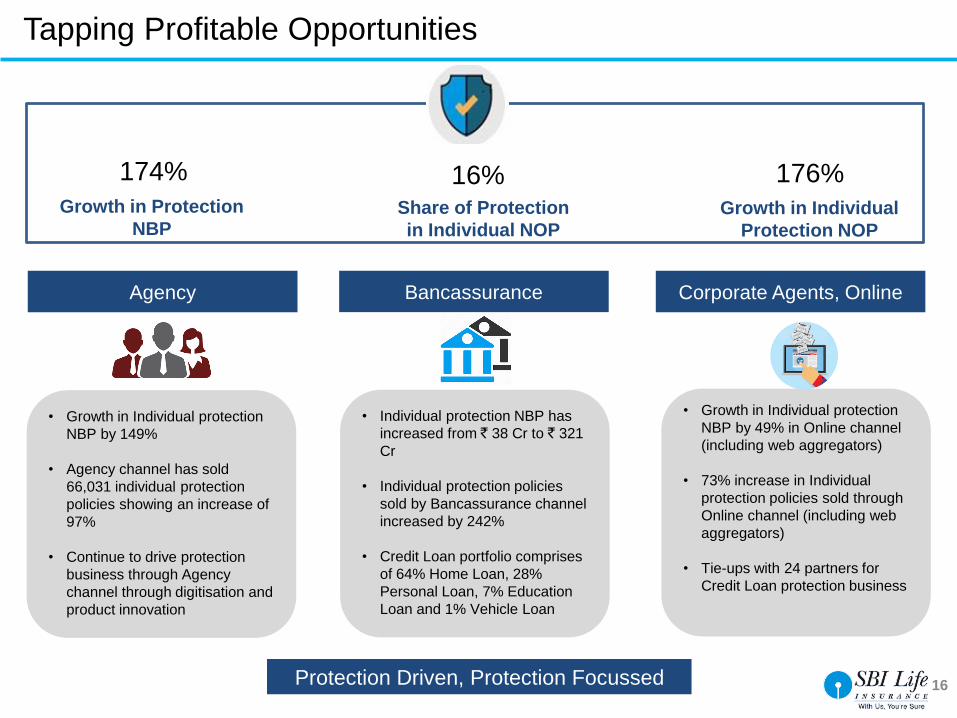
Tapping Profitable Opportunities
• Growth in Individual protection
NBP by 149%
• Agency channel has sold
66,031 individual protection
policies showing an increase of
97%
• Continue to drive protection
business through Agency
channel through digitisation and
product innovation
Agency Bancassurance Corporate Agents, Online
Protection Driven, Protection Focussed
• Individual protection NBP has
increased from ` 38 Cr to ` 321
Cr
• Individual protection policies
sold by Bancassurance channel
increased by 242%
• Credit Loan portfolio comprises
of 64% Home Loan, 28%
Personal Loan, 7% Education
Loan and 1% Vehicle Loan
• Growth in Individual protection
NBP by 49% in Online channel
(including web aggregators)
• 73% increase in Individual
protection policies sold through
Online channel (including web
aggregators)
• Tie-ups with 24 partners for
Credit Loan protection business
Share of Protection
in Individual NOP
16%Growth in Protection
NBP
174%
Growth in Individual
Protection NOP
176%
Net Promoter Score – Customer
satisfaction and feedback on services and
products
17
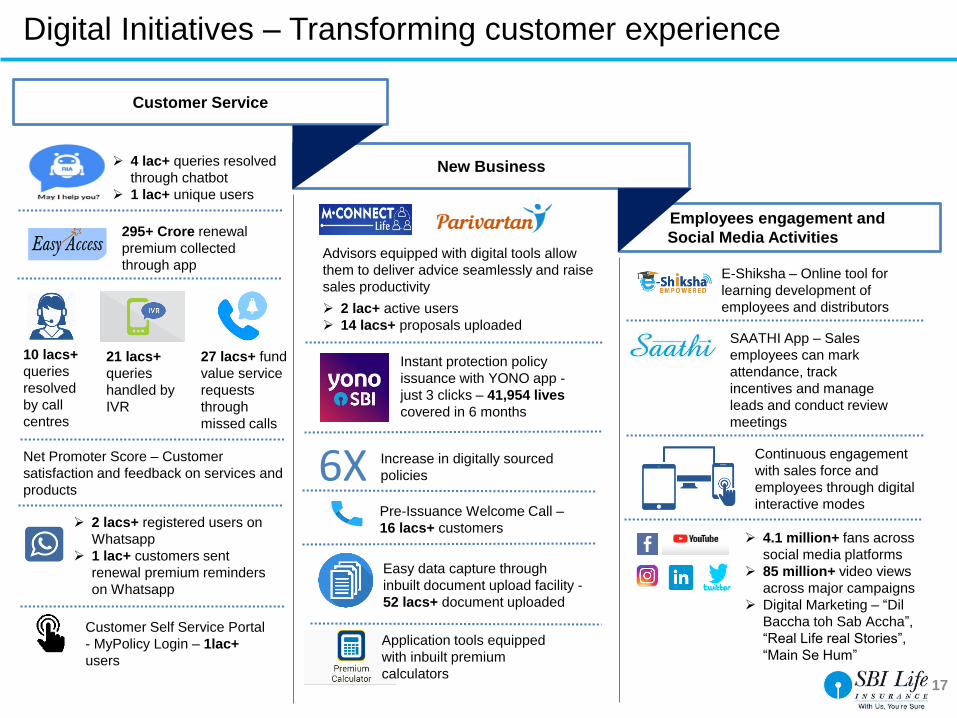
Digital Initiatives – Transforming customer experience
Customer Service
New Business
Employees engagement and
Social Media Activities
4 lac+ queries resolved
through chatbot
1 lac+ unique users
295+ Crore renewal
premium collected
through app
10 lacs+
queries
resolved
by call
centres
21 lacs+
queries
handled by
IVR
27 lacs+ fund
value service
requests
through
missed calls
2 lacs+ registered users on
1 lac+ customers sent
renewal premium reminders
on Whatsapp
Customer Self Service Portal
- MyPolicy Login – 1lac+
users
Advisors equipped with digital tools allow
them to deliver advice seamlessly and raise
sales productivity
2 lac+ active users
14 lacs+ proposals uploaded
Instant protection policy
issuance with YONO app -
just 3 clicks – 41,954 lives
covered in 6 months
6X Increase in digitally sourced
policies
Easy data capture through
inbuilt document upload facility -
52 lacs+ document uploaded
Application tools equipped
with inbuilt premium
calculators
E-Shiksha – Online tool for
learning development of
employees and distributors
SAATHI App – Sales
employees can mark
attendance, track
incentives and manage
leads and conduct review
meetings
4.1 million+ fans across
social media platforms
85 million+ video views
across major campaigns
Digital Marketing – “Dil
Baccha toh Sab Accha”,
“Real Life real Stories”,
“Main Se Hum”
Continuous engagement
with sales force and
employees through digital
interactive modesPre-Issuance Welcome Call –
16 lacs+ customers
18
Performance update
Strategy and initiatives
Industry overview
I
II
III
AnnexureIV
Agenda
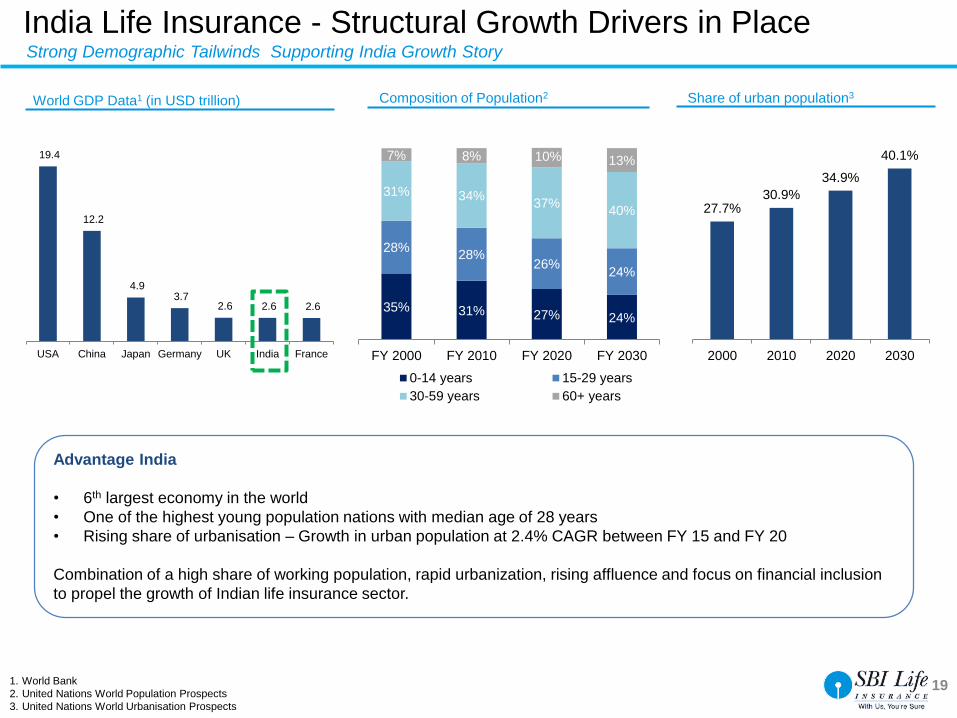
35% 31% 27% 24%
28%28%
26%24%
31% 34%37%
40%
7% 8% 10% 13%
FY 2000 FY 2010 FY 2020 FY 2030
0-14 years 15-29 years
30-59 years 60+ years
19.4
12.2
4.9 3.7
2.6 2.6 2.6
USA China Japan Germany UK India France
19
World GDP Data1 (in USD trillion)
1. World Bank
2. United Nations World Population Prospects
3. United Nations World Urbanisation Prospects
Composition of Population2
India Life Insurance - Structural Growth Drivers in Place
27.7%30.9%
34.9%
40.1%
2000 2010 2020 2030
Advantage India
• 6th largest economy in the world
• One of the highest young population nations with median age of 28 years
• Rising share of urbanisation – Growth in urban population at 2.4% CAGR between FY 15 and FY 20
Combination of a high share of working population, rapid urbanization, rising affluence and focus on financial inclusion
to propel the growth of Indian life insurance sector.
Share of urban population3
Strong Demographic Tailwinds Supporting India Growth Story
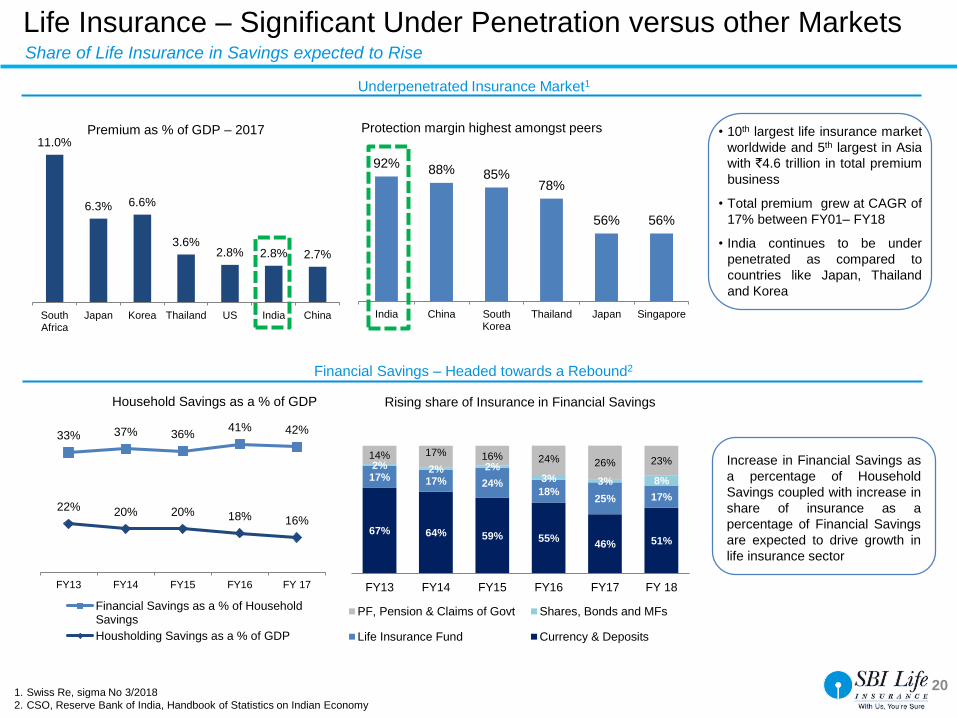
67% 64% 59% 55%46% 51%
17% 17% 24%18%
25% 17%
2% 2% 2%3% 3% 8%
14% 17% 16% 24% 26% 23%
FY13 FY14 FY15 FY16 FY17 FY 18
PF, Pension & Claims of Govt Shares, Bonds and MFs
Life Insurance Fund Currency & Deposits
20
Underpenetrated Insurance Market1
11.0%
6.3% 6.6%
3.6%2.8% 2.8% 2.7%
SouthAfrica
Japan Korea Thailand US India China
Premium as % of GDP – 2017 • 10th largest life insurance market
worldwide and 5th largest in Asia
with `4.6 trillion in total premium
business
• Total premium grew at CAGR of
17% between FY01– FY18
• India continues to be under
penetrated as compared to
countries like Japan, Thailand
and Korea
RUSJPN BRZ TURKOR RSA THA CHN IDN IND
22% 20% 20% 18% 16%
33% 37% 36%41% 42%
FY13 FY14 FY15 FY16 FY 17
Financial Savings as a % of HouseholdSavings
Housholding Savings as a % of GDP
Household Savings as a % of GDP Rising share of Insurance in Financial Savings
1. Swiss Re, sigma No 3/2018
2. CSO, Reserve Bank of India, Handbook of Statistics on Indian Economy
92%88% 85%
78%
56% 56%
India China SouthKorea
Thailand Japan Singapore
Protection margin highest amongst peers
Life Insurance – Significant Under Penetration versus other Markets
Financial Savings – Headed towards a Rebound2
Increase in Financial Savings as
a percentage of Household
Savings coupled with increase in
share of insurance as a
percentage of Financial Savings
are expected to drive growth in
life insurance sector
Share of Life Insurance in Savings expected to Rise
21Source: IRDAI, Life Council, IMF, RBI, CSO
1. Insurance Premium as % of GDP
2. Premium per capita
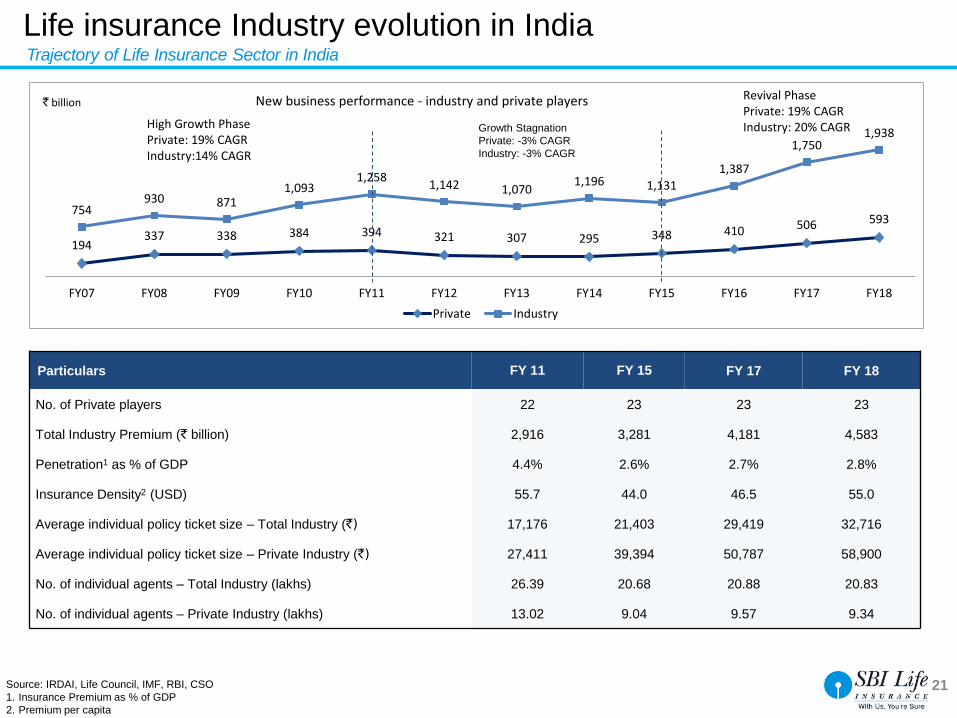
Particulars FY 11 FY 15 FY 17 FY 18
No. of Private players 22 23 23 23
Total Industry Premium (` billion) 2,916 3,281 4,181 4,583
Penetration1 as % of GDP 4.4% 2.6% 2.7% 2.8%
Insurance Density2 (USD) 55.7 44.0 46.5 55.0
Average individual policy ticket size – Total Industry (`) 17,176 21,403 29,419 32,716
Average individual policy ticket size – Private Industry (`) 27,411 39,394 50,787 58,900
No. of individual agents – Total Industry (lakhs) 26.39 20.68 20.88 20.83
No. of individual agents – Private Industry (lakhs) 13.02 9.04 9.57 9.34
194337 338 384 394 321 307 295 348 410 506 593
754930 871
1,0931,258
1,142 1,0701,196 1,131
1,387
1,7501,938
FY07 FY08 FY09 FY10 FY11 FY12 FY13 FY14 FY15 FY16 FY17 FY18
` billion New business performance - industry and private players
Private Industry
High Growth PhasePrivate: 19% CAGRIndustry:14% CAGR
Growth Stagnation
Private: -3% CAGR
Industry: -3% CAGR
Revival PhasePrivate: 19% CAGRIndustry: 20% CAGR
Life insurance Industry evolution in IndiaTrajectory of Life Insurance Sector in India
22
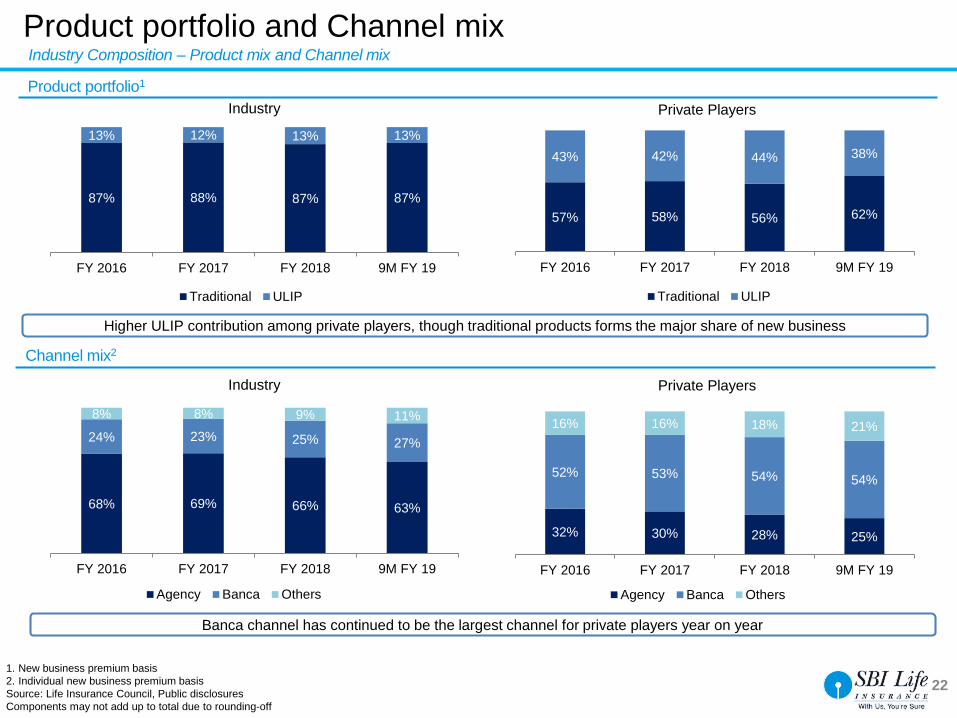
87% 88% 87% 87%
13% 12% 13% 13%
FY 2016 FY 2017 FY 2018 9M FY 19
Traditional ULIP
Industry
57% 58% 56% 62%
43% 42% 44% 38%
FY 2016 FY 2017 FY 2018 9M FY 19
Traditional ULIP
Private Players
Higher ULIP contribution among private players, though traditional products forms the major share of new business
1. New business premium basis
2. Individual new business premium basis
Source: Life Insurance Council, Public disclosures
Components may not add up to total due to rounding-off
Banca channel has continued to be the largest channel for private players year on year
68% 69% 66% 63%
24% 23% 25% 27%
8% 8% 9% 11%
FY 2016 FY 2017 FY 2018 9M FY 19
Agency Banca Others
Industry
32% 30% 28% 25%
52% 53% 54% 54%
16% 16% 18% 21%
FY 2016 FY 2017 FY 2018 9M FY 19
Agency Banca Others
Private Players
Product portfolio1
Channel mix2
Product portfolio and Channel mix Industry Composition – Product mix and Channel mix
23
Performance update
Strategy and initiatives
Industry overview
I
II
III
AnnexureIV
Agenda
24
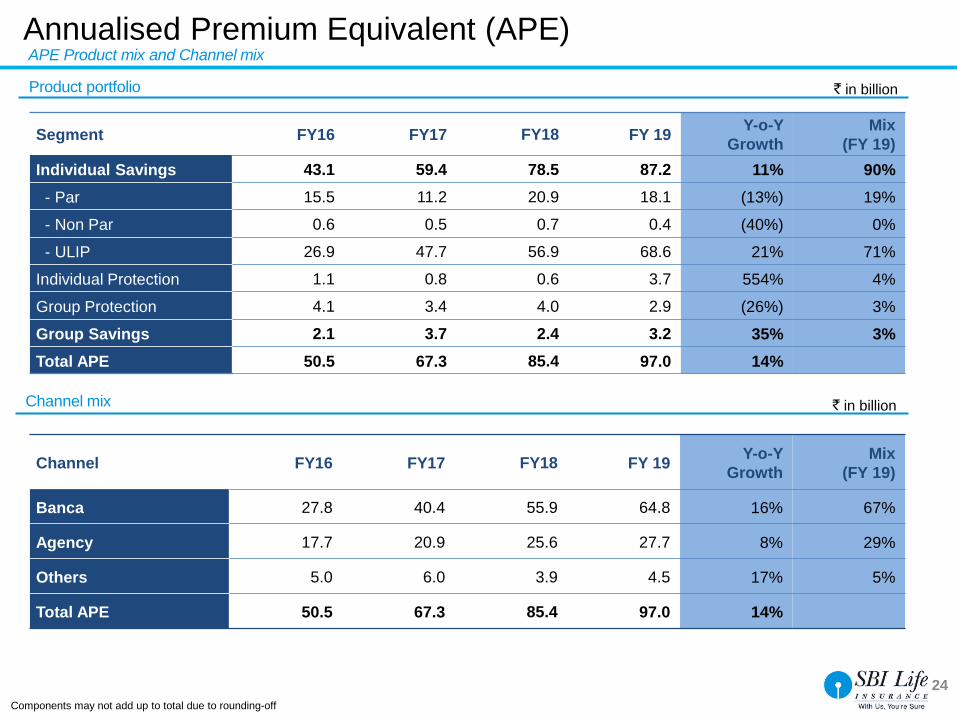
Segment FY16 FY17 FY18 FY 19Y-o-Y
Growth
Mix
(FY 19)
Individual Savings 43.1 59.4 78.5 87.2 11% 90%
- Par 15.5 11.2 20.9 18.1 (13%) 19%
- Non Par 0.6 0.5 0.7 0.4 (40%) 0%
- ULIP 26.9 47.7 56.9 68.6 21% 71%
Individual Protection 1.1 0.8 0.6 3.7 554% 4%
Group Protection 4.1 3.4 4.0 2.9 (26%) 3%
Group Savings 2.1 3.7 2.4 3.2 35% 3%
Total APE 50.5 67.3 85.4 97.0 14%
Annualised Premium Equivalent (APE)
Channel FY16 FY17 FY18 FY 19Y-o-Y
Growth
Mix
(FY 19)
Banca 27.8 40.4 55.9 64.8 16% 67%
Agency 17.7 20.9 25.6 27.7 8% 29%
Others 5.0 6.0 3.9 4.5 17% 5%
Total APE 50.5 67.3 85.4 97.0 14%
Product portfolio
Channel mix
Components may not add up to total due to rounding-off
` in billion
APE Product mix and Channel mix
` in billion
25
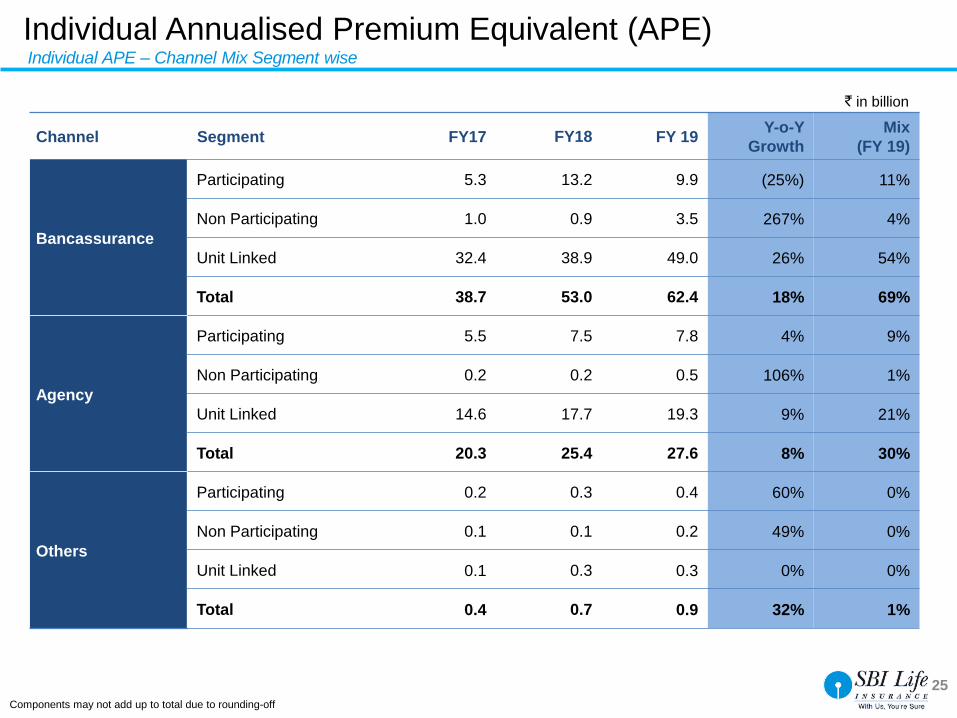
Channel Segment FY17 FY18 FY 19Y-o-Y
Growth
Mix
(FY 19)
Bancassurance
Participating 5.3 13.2 9.9 (25%) 11%
Non Participating 1.0 0.9 3.5 267% 4%
Unit Linked 32.4 38.9 49.0 26% 54%
Total 38.7 53.0 62.4 18% 69%
Agency
Participating 5.5 7.5 7.8 4% 9%
Non Participating 0.2 0.2 0.5 106% 1%
Unit Linked 14.6 17.7 19.3 9% 21%
Total 20.3 25.4 27.6 8% 30%
Others
Participating 0.2 0.3 0.4 60% 0%
Non Participating 0.1 0.1 0.2 49% 0%
Unit Linked 0.1 0.3 0.3 0% 0%
Total 0.4 0.7 0.9 32% 1%
Individual Annualised Premium Equivalent (APE)Individual APE – Channel Mix Segment wise
Components may not add up to total due to rounding-off
` in billion
26
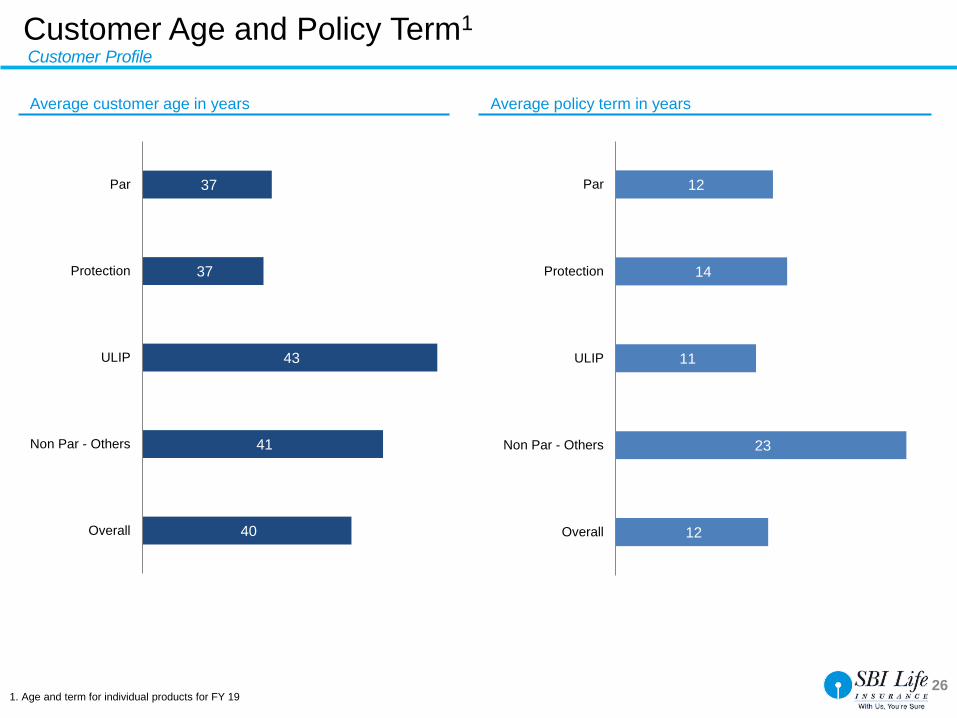
37
37
43
41
40
Par
Protection
ULIP
Non Par - Others
Overall
12
14
11
23
12
Par
Protection
ULIP
Non Par - Others
Overall
Average customer age in years Average policy term in years
1. Age and term for individual products for FY 19
Customer Age and Policy Term1
Customer Profile
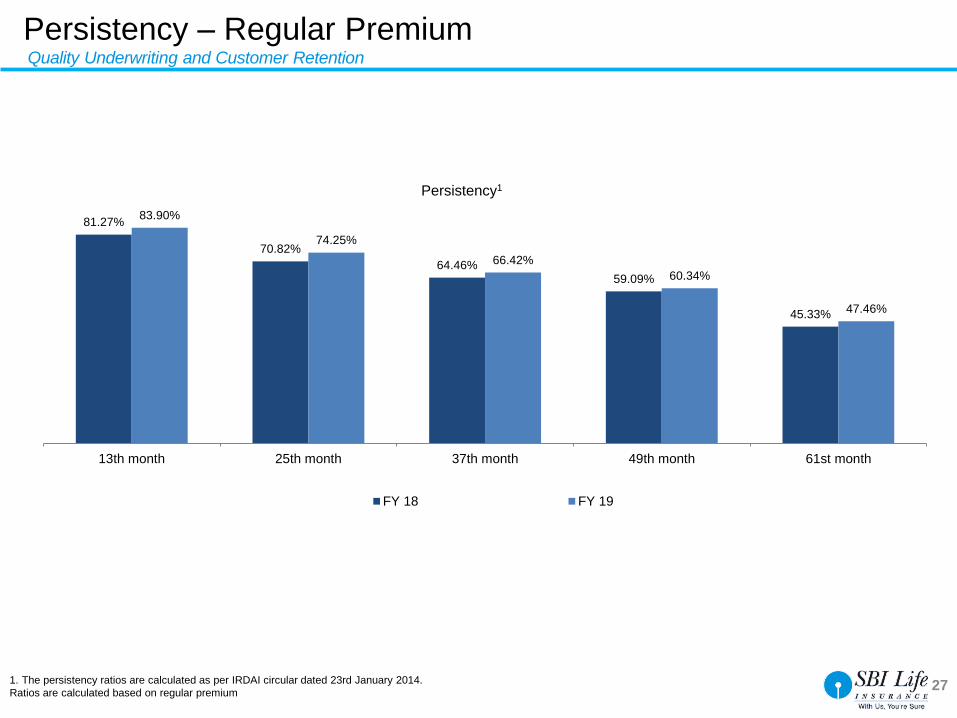
81.27%
70.82%
64.46%59.09%
45.33%
83.90%
74.25%
66.42%
60.34%
47.46%
13th month 25th month 37th month 49th month 61st month
Persistency1
FY 18 FY 19
27
Quality Underwriting and Customer Retention
1. The persistency ratios are calculated as per IRDAI circular dated 23rd January 2014.
Ratios are calculated based on regular premium
Persistency – Regular Premium
28
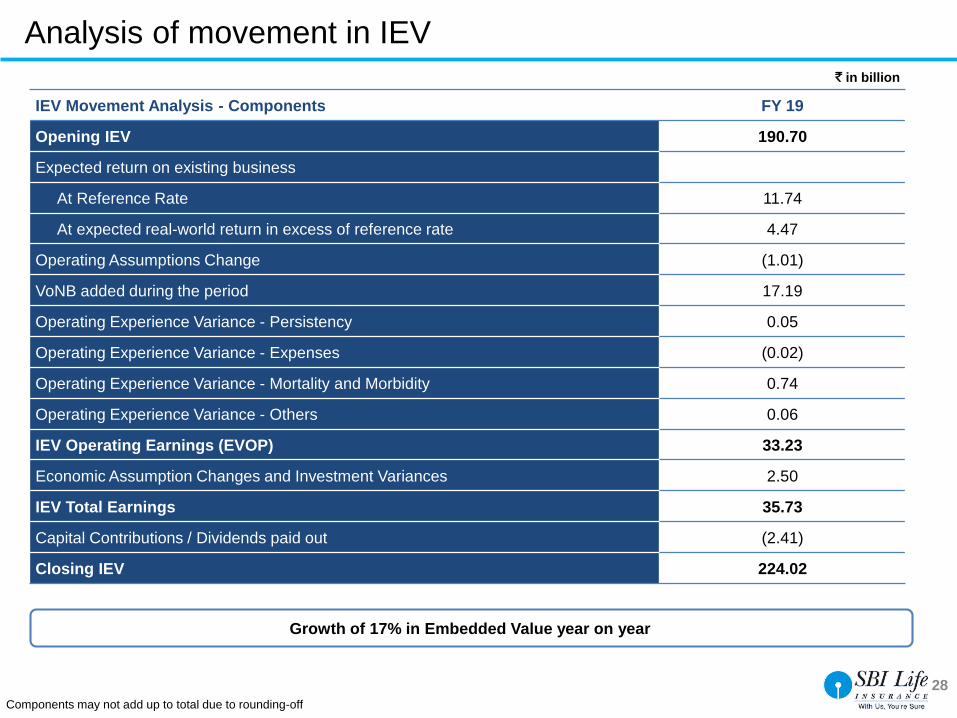
Analysis of movement in IEV
IEV Movement Analysis - Components FY 19
Opening IEV 190.70
Expected return on existing business
At Reference Rate 11.74
At expected real-world return in excess of reference rate 4.47
Operating Assumptions Change (1.01)
VoNB added during the period 17.19
Operating Experience Variance - Persistency 0.05
Operating Experience Variance - Expenses (0.02)
Operating Experience Variance - Mortality and Morbidity 0.74
Operating Experience Variance - Others 0.06
IEV Operating Earnings (EVOP) 33.23
Economic Assumption Changes and Investment Variances 2.50
IEV Total Earnings 35.73
Capital Contributions / Dividends paid out (2.41)
Closing IEV 224.02
Growth of 17% in Embedded Value year on year
` in billion
Components may not add up to total due to rounding-off
29
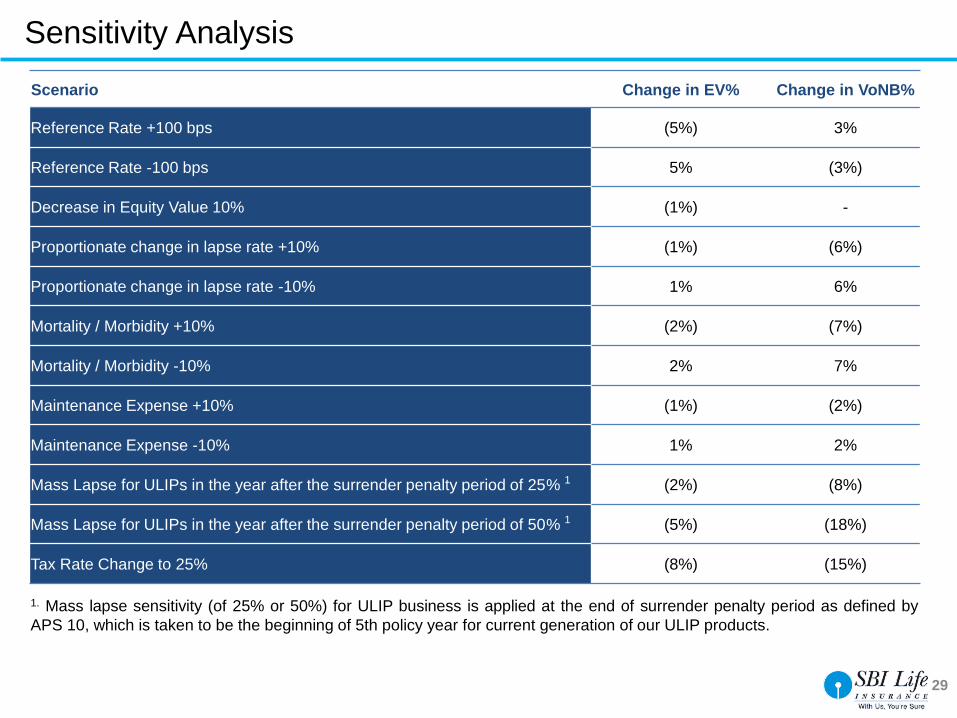
Sensitivity Analysis
Scenario Change in EV% Change in VoNB%
Reference Rate +100 bps (5%) 3%
Reference Rate -100 bps 5% (3%)
Decrease in Equity Value 10% (1%) -
Proportionate change in lapse rate +10% (1%) (6%)
Proportionate change in lapse rate -10% 1% 6%
Mortality / Morbidity +10% (2%) (7%)
Mortality / Morbidity -10% 2% 7%
Maintenance Expense +10% (1%) (2%)
Maintenance Expense -10% 1% 2%
Mass Lapse for ULIPs in the year after the surrender penalty period of 25% 1 (2%) (8%)
Mass Lapse for ULIPs in the year after the surrender penalty period of 50% 1 (5%) (18%)
Tax Rate Change to 25% (8%) (15%)
1. Mass lapse sensitivity (of 25% or 50%) for ULIP business is applied at the end of surrender penalty period as defined by
APS 10, which is taken to be the beginning of 5th policy year for current generation of our ULIP products.
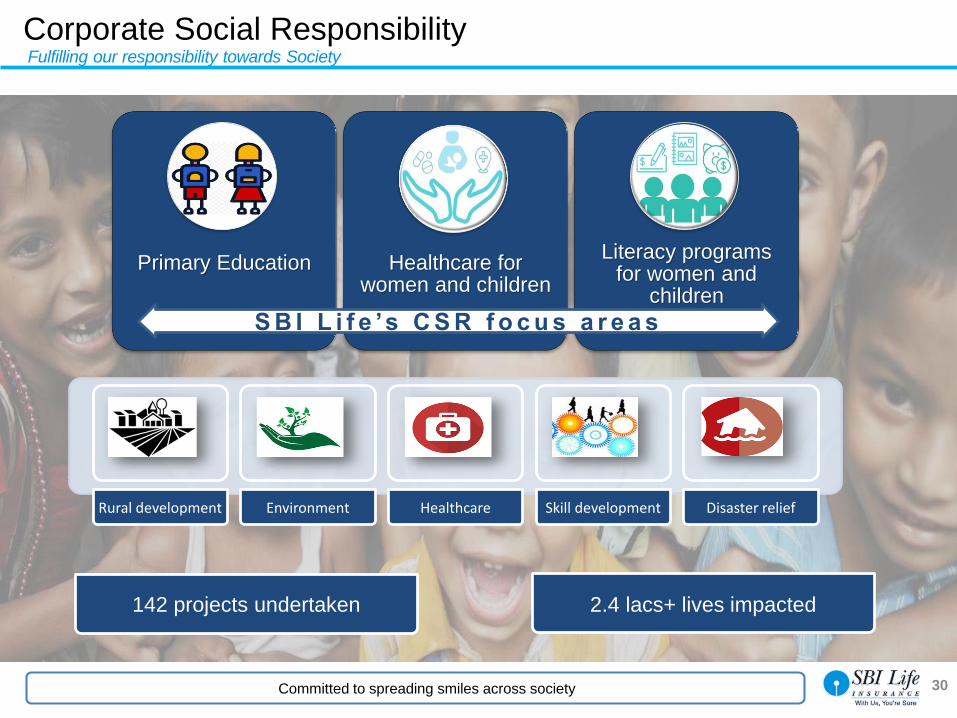
Primary Education Healthcare for women and children
Literacy programs for women and
children
S B I L i f e ’s C S R f o c u s a r e a s
Rural development Environment Healthcare Skill development Disaster relief
Corporate Social Responsibility
142 projects undertaken 2.4 lacs+ lives impacted
30Committed to spreading smiles across society
Fulfilling our responsibility towards Society
31
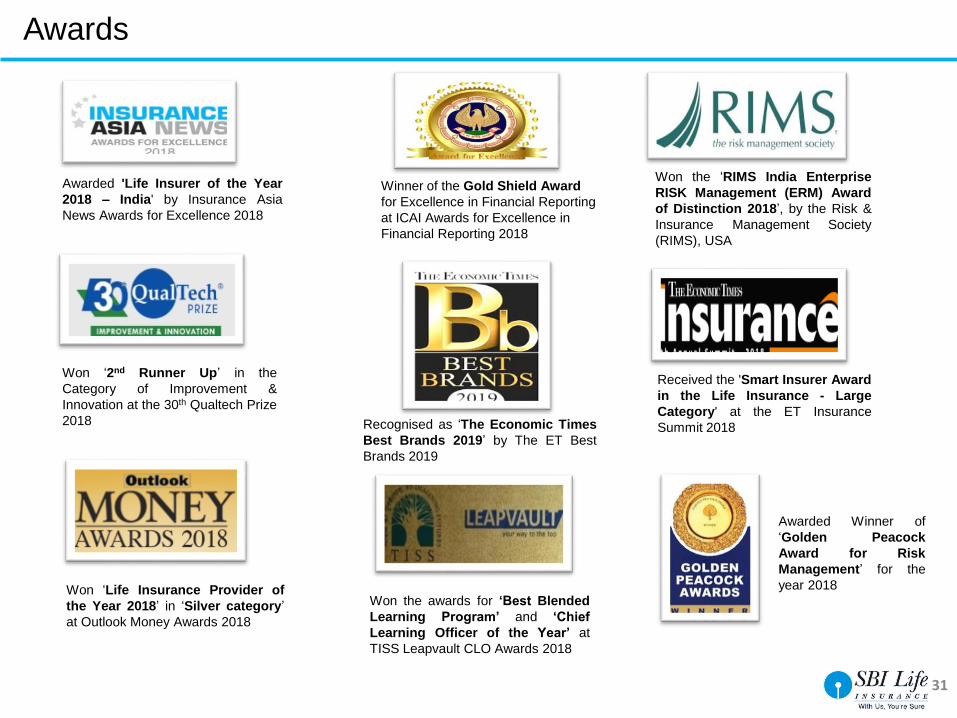
Awarded 'Life Insurer of the Year
2018 – India' by Insurance Asia
News Awards for Excellence 2018
Won ‘2nd Runner Up’ in the
Category of Improvement &
Innovation at the 30th Qualtech Prize
2018
Awarded Winner of
‘Golden Peacock
Award for Risk
Management’ for the
year 2018
Won the ‘RIMS India Enterprise
RISK Management (ERM) Award
of Distinction 2018’, by the Risk &
Insurance Management Society
(RIMS), USA
Won ‘Life Insurance Provider of
the Year 2018’ in ‘Silver category’
at Outlook Money Awards 2018
Won the awards for ‘Best Blended
Learning Program’ and ‘Chief
Learning Officer of the Year’ at
TISS Leapvault CLO Awards 2018
Received the 'Smart Insurer Award
in the Life Insurance - Large
Category' at the ET Insurance
Summit 2018Recognised as ‘The Economic Times
Best Brands 2019’ by The ET Best
Brands 2019
Winner of the Gold Shield Award
for Excellence in Financial Reporting
at ICAI Awards for Excellence in
Financial Reporting 2018
Awards
32
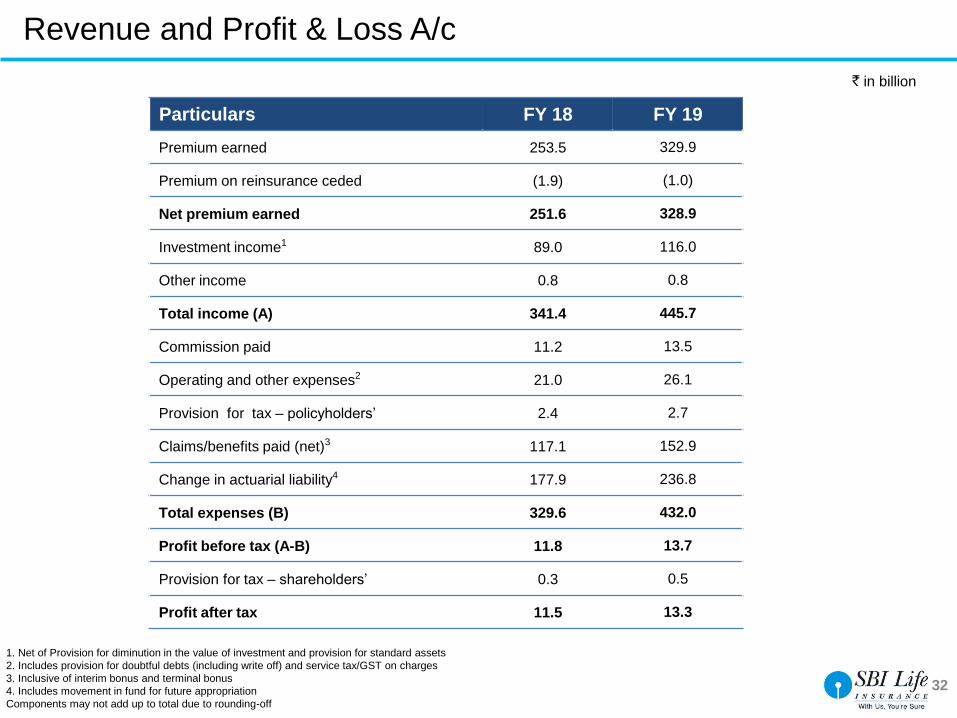
` in billion
1. Net of Provision for diminution in the value of investment and provision for standard assets
2. Includes provision for doubtful debts (including write off) and service tax/GST on charges
3. Inclusive of interim bonus and terminal bonus
4. Includes movement in fund for future appropriation
Components may not add up to total due to rounding-off
Particulars FY 18 FY 19
Premium earned 253.5 329.9
Premium on reinsurance ceded (1.9) (1.0)
Net premium earned 251.6 328.9
Investment income1 89.0 116.0
Other income 0.8 0.8
Total income (A) 341.4 445.7
Commission paid 11.2 13.5
Operating and other expenses2 21.0 26.1
Provision for tax – policyholders’ 2.4 2.7
Claims/benefits paid (net)3 117.1 152.9
Change in actuarial liability4 177.9 236.8
Total expenses (B) 329.6 432.0
Profit before tax (A-B) 11.8 13.7
Provision for tax – shareholders’ 0.3 0.5
Profit after tax 11.5 13.3
Revenue and Profit & Loss A/c
33
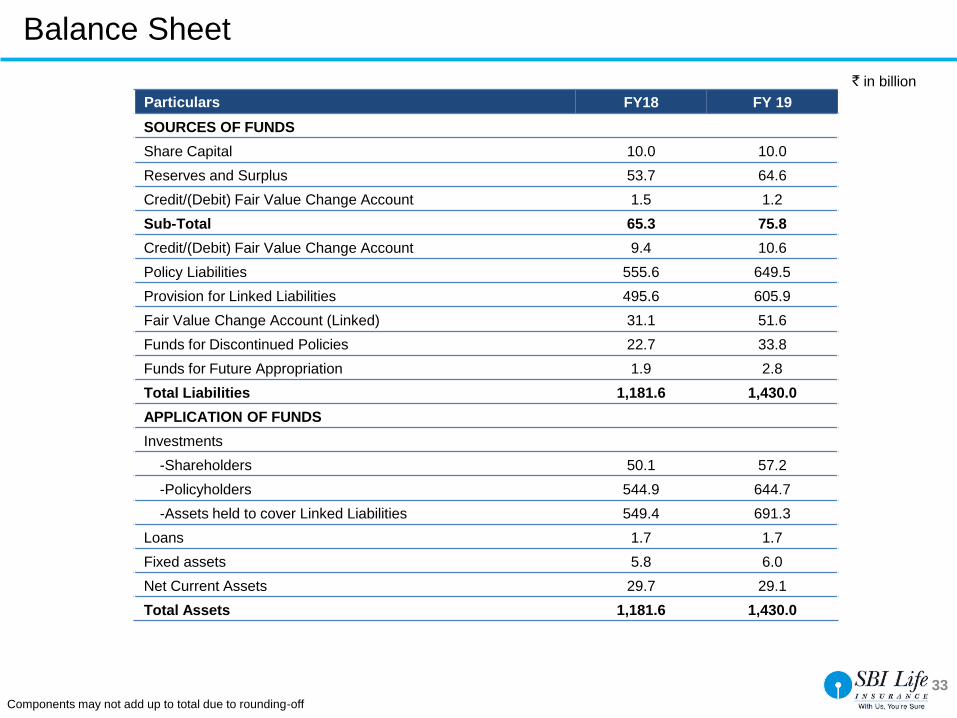
` in billion
Particulars FY18 FY 19
SOURCES OF FUNDS
Share Capital 10.0 10.0
Reserves and Surplus 53.7 64.6
Credit/(Debit) Fair Value Change Account 1.5 1.2
Sub-Total 65.3 75.8
Credit/(Debit) Fair Value Change Account 9.4 10.6
Policy Liabilities 555.6 649.5
Provision for Linked Liabilities 495.6 605.9
Fair Value Change Account (Linked) 31.1 51.6
Funds for Discontinued Policies 22.7 33.8
Funds for Future Appropriation 1.9 2.8
Total Liabilities 1,181.6 1,430.0
APPLICATION OF FUNDS
Investments
-Shareholders 50.1 57.2
-Policyholders 544.9 644.7
-Assets held to cover Linked Liabilities 549.4 691.3
Loans 1.7 1.7
Fixed assets 5.8 6.0
Net Current Assets 29.7 29.1
Total Assets 1,181.6 1,430.0
Components may not add up to total due to rounding-off
Balance Sheet
34
IEV Methodology and Approach (1/2)
Embedded Value is a measure of the consolidated value of shareholders’ interest in the covered life insurance business. The
embedded value has been determined by following a market consistent methodology, as per the requirements and principles
set forth by the IAI within the APS10.
Components of Embedded Value:
IEV is calculated as the sum of Adjusted Net Worth (ANW) and Value of In-Force business (VIF).
ANW comprises Free Surplus (FS) and Required Capital (RC).
VIF consists of the following components:
Present Value of Future Profits (PVFP) expected to emerge from the covered business;
Less Frictional Cost of Capital (FCoC);
Less Time Value of Financial Options and Guarantees (TVFOG);
Less Cost of Residual Non-Hedgeable Risks (CRNHR).
Components of Adjusted Net Worth (ANW):
This is the value of all assets allocated to the covered business that are not required to back the liabilities of the covered
business.
Free Surplus (FS): Free Surplus represents the market value of any assets in excess of liabilities and Required Capital which
is potentially distributable to shareholders immediately. Free Surplus has been calculated as the excess of ANW over the
Required Capital.
Required Capital (RC): Required Capital is the amount of assets attributed to the covered business over and above that
required to back liabilities for the covered business. Required Capital has been set at 180% of the RSM, based on the
Company’s internal capital target. RSM has been projected by applying the solvency margin factors prescribed by the IRDAI
appropriate to each line of business.
The IEV estimates as on 31st March 2018 have been carried out internally by SBI Life. The methodology, assumptions and the
results have been reviewed by Willis Towers Watson Actuarial Advisory LLP.
35
Components of Value of Inforce (VIF) business:
Present Value of Future Profits (PVFP): PVFP represents the present value of future post taxation shareholder cash-flows
projected to emerge from the in-force covered business and the assets backing liabilities of the in-force covered business. The
PVFP incorporates an allowance for the intrinsic value of financial options and guarantees.
Frictional Cost of Capital (FCoC): Allowance is made for the impact of taxation on investment returns and for the impact of
investment expenses (after tax) on the assets backing the projected Required Capital, together with an allowance for
shareholders’ fund expenses.
Time Value of Financial Options and Guarantees (TVFOG): Allowance is made for asymmetric impact on shareholder value
due to any financial options and guarantees within the covered business.
Cost of Residual Non-Hedgeable Risks (CRNHR): A bottom-up assessment of risks has been undertaken to allow for the
cost of residual non-hedgeable risks not already allowed for elsewhere. CRNHR has been estimated using a cost of capital
approach.
Assumptions used for IEV Calculation:
The expense assumptions used in the IEV (Indian Embedded Value) estimation represent the unit costs arising out of actual
experience of the FY 2018/19 and makes no allowance for any productivity gains/cost efficiencies beyond what is achieved up
to the valuation date.
The Required Capital is taken at 180% of the Statutory RSM, which is the internally approved norm for the company.
The rate of income tax applied to the surplus is set at 14.56%. Tax deductions available by way of dividend income from equity
etc. is not taken into consideration. Rate of taxation applied to individual pension business is zero.
The zero coupon government bond yield curve published by FIMMDA was used as the assumed reference rates.
The IEV estimates as on 31st March 2018 have been carried out internally by SBI Life. The methodology, assumptions and the
results have been reviewed by Willis Towers Watson Actuarial Advisory LLP.
IEV Methodology and Approach (2/2)
36
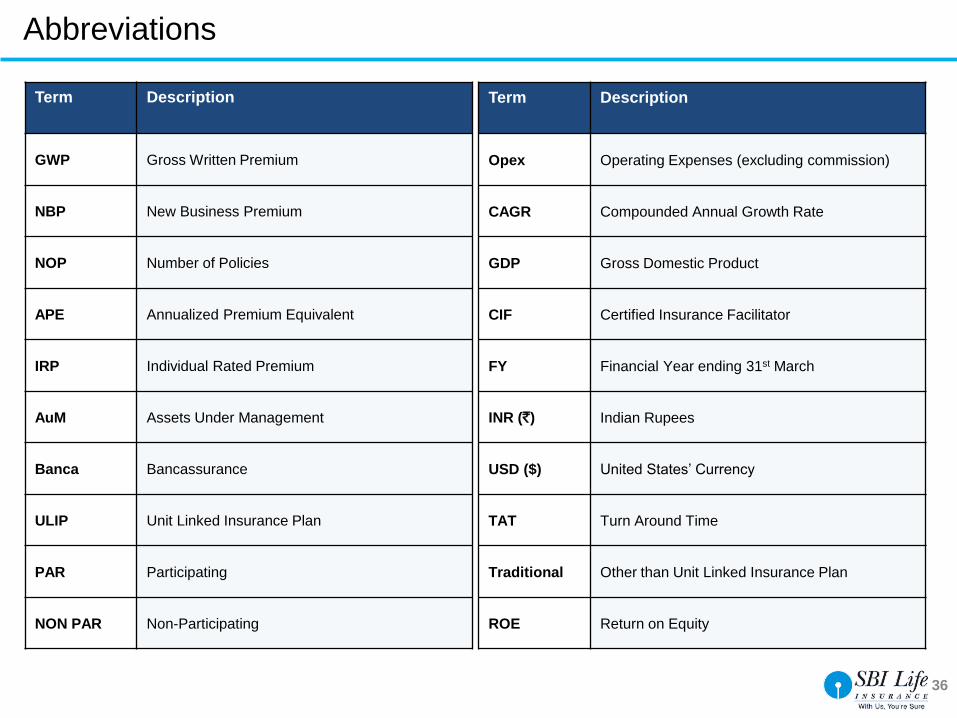
Term Description
GWP Gross Written Premium
NBP New Business Premium
NOP Number of Policies
APE Annualized Premium Equivalent
IRP Individual Rated Premium
AuM Assets Under Management
Banca Bancassurance
ULIP Unit Linked Insurance Plan
PAR Participating
NON PAR Non-Participating
Term Description
Opex Operating Expenses (excluding commission)
CAGR Compounded Annual Growth Rate
GDP Gross Domestic Product
CIF Certified Insurance Facilitator
FY Financial Year ending 31st March
INR (`) Indian Rupees
USD ($) United States’ Currency
TAT Turn Around Time
Traditional Other than Unit Linked Insurance Plan
ROE Return on Equity
Abbreviations
37
New Business APE: The sum of annualized first year premiums on regular premium policies, and 10.00% of single premiums,
written by the Company during the fiscal year from both retail and group customers
New Business Premium (NBP): Insurance premium that is due in the first policy year of a life insurance contract or a single lump
sum payment from the policyholder
Individual Rated Premium (IRP): New business premiums written by the Company under individual products and weighted at the
rate of 10.00% for single premiums
Renewal Premium: Life insurance premiums falling due in the years subsequent to the first year of the policy
Gross Written Premium (GWP): The total premium written by the Company before deductions for reinsurance ceded
Embedded Value: The measure of the consolidated value of shareholders’ interest in the covered life insurance business, which
is all life insurance business written by the Company since inception and in-force as on the valuation date (including lapsed
business which have the potential of getting revived). The Embedded Value of the Company has been determined on the basis of
the Indian Embedded Value (IEV) Methodology calculated as per APS 10 set forth by the Institute of Actuaries of India (IAI)
Value of New Business (VoNB): Value of New Business is the present value of expected future earnings from new policies
written during a specified period and it reflects the additional value to shareholders expected to be generated through the activity
of writing new policies during a specified period
VoNB Margin: VoNB Margin is the ratio of VoNB to New Business Annualized Premium Equivalent for a specified period and is a
measure of the expected profitability of new business
Solvency Ratio: Solvency ratio means ratio of the amount of Available Solvency Margin to the amount of Required Solvency
Margin as specified in form-KT-3 of IRDAI Actuarial Report and Abstracts for Life Insurance Business Regulations
Glossary
38
Except for the historical information contained herein, statements in this presentation which contain words
or phrases such as 'will', 'would', ‘indicating’, ‘expected to’ etc., and similar expressions or variations of such
expressions may constitute ‘forward-looking statements'. These forward-looking statements involve a
number of risks, uncertainties and other factors that could cause actual results to differ materially from
those suggested by the forward-looking statements.
These risks and uncertainties include, but are not limited to our ability to successfully implement our
strategy, our growth and expansion in business, the impact of any acquisitions, technological
implementation and changes, the actual growth in demand for insurance products and services, investment
income, cash flow projections, our exposure to market risks, policies and actions of regulatory authorities;
impact of competition; experience with regard to mortality and morbidity trends, lapse rates and policy
renewal rates; the impact of changes in capital, solvency or accounting standards, tax and other legislations
and regulations in the jurisdictions as well as other risks detailed in the reports filed by State Bank of India,
our holding company. We undertake no obligation to update forward-looking statements to reflect events or
circumstances after the date thereof.
The assumptions, estimates and judgments used in the calculations are evaluated internally where
applicable and have been externally reviewed. They represent the best estimate based on the company’s
experience and knowledge of relevant facts and circumstances. While the management believes that such
assumptions, estimates and judgments to be reasonable; the actual experience could differ from those
assumed whereby the results may be materially different from those shown herein.
Disclaimer

39
Thank you
Investor Relations Contact:
SBI Life Insurance Co Ltd
Fifth Floor, Natraj, M V Road & Western Expressway Highway , Andheri (E), Mumbai
Dial - +91 22 6191 0281/ 0399
Email – [email protected]
Website – www.sbilife.co.in


