Embed Size (px)
Citation preview
An examination of short-run… / M. Zubair M., Z.A. Smith, A. Maqsood A. 71Estudios de Economía. Vol. 43 - Nº 1, Junio 2016. Págs. 71-95
An examination of short-run performance of IPOs using Extreme Bounds Analysis*1
Examinando el desempeño de corto plazo de las ofertas públicas iniciales de acciones con el análisis de límites extremos
Muhammad Zubair Mumtaz**Zachary A. Smith***
Ather Maqsood Ahmed****
Abstract
This paper estimates the short-run performance of IPOs issued on the Karachi Stock Exchange in Pakistan. The present study extends the existing literature concentrating on the degree of underpricing over a 3-month period lasting from the listing date to the 3-month anniversary showing significant evidence of IPO underpricing. The analyses support the investors’ sentiment and underwriters’ prestige hypothesis but not ex-ante uncertainty. The EBA technique has been used to examine fifteen explanatory variables of IPO underpricing. The study finds that the aftermarket risk level of the IPO, the oversubscription ratio, the offer price, the return on assets, post issue promoters’ holding and size of the firm are six robust determinants of IPO underpricing.
Key words: Initial public offerings; underpricing; short-run; extreme bounds analysis; wealth relative; three-month.
JEL Classification: G12, G14
Resumen
Este trabajo estudia el desempeño de corto plazo de las ofertas públicas iniciales de acciones en la bolsa de Karachi (Pakistán), mostrándose subvaluaciones de precios desde la fecha de la oferta hasta los tres meses. Se encuentra soporte
* We are grateful for valuable feedback that was given by Rómulo Chumacero (the editor) and an anonymous referee and believe that our paper benefited greatly from their com-ments and suggestions.
** School of Social Sciences & Humanities, National University of Sciences and Technology (NUST). Corresponding author. Tel.: +92 51 90853566. Address: Sector H-12, Islamabad, Pakistan. Email: [email protected]
*** Saint Leo University, USA, [email protected]**** School of Social Sciences and Humanities, NUST, Pakistan, [email protected].
edu.pk
Estudios de Economía, Vol. 43 - Nº 172
a las hipótesis de percepción y prestigio, pero no de incertidumbre ex ante. La técnica de análisis de límites extremos permite analizar quince potenciales determinantes de la subvaluación de manera robusta.
Palabras clave: Oferta inicial de acciones; análisis de límites extremos; subvaluación.
Clasificación JEL: G12, G14
1. Introduction
The topic of underpricing of initial public offerings (IPOs) in developed and emerging markets has been of interest to academics, researchers, and practitioners for decades. Many researchers attempted to shed light on the degree of under-pricing in different countries as well as across the different time periods. The general sentiment is that on average, IPOs are underpriced; but the magnitude of underpricing varied. Banerjee et al. (2011) examined the underpricing of IPOs in 36 countries whereby the degree of underpricing is not specifically a country issue but also a general phenomenon. In particular, initial underpricing in Asian countries is comparatively higher than other markets (Moshirian, Ng and Wu, 2010). Asymmetric information, underwriters’ prestige, ex-ante uncertainty, investor sentiment, and seasoned offerings are some of the important factors to explain the IPO underpricing. The objective of this study is: (a) to investigate the short-run performance of newly issued shares on the Karachi Stock Exchange and (b) to identify the potential determinants of the IPO underpricing.
Pakistan is an emerging market economy and its markets are volatile. In an early study, Sohail and Nasr (2007) reported underpricing at 35.66%. Further, Sohail and Rehman (2010) documented that underpricing ranges from 37% to 42% over the 20 trading day period lasting from listing date. This study extends the work of Sohail and Nasr which analyzed the underpricing of IPOs in Pakistan during the period lasting from 2000 to 2013 and to identify factors that affected IPO underpricing on the trading of the first day, one- and 3-month periods. The present study empirically investigates the short-run performance of 80 IPOs issued on the Karachi Stock Exchange over the 3-month period. A comprehensive analysis of short-run IPO performance has been carried out by using different factors so as to explain the underpricing. To identify the robust predictors of short-run underpricing, this study applied Extreme Bounds Analysis (EBA) techniques, which reduces the problem of choosing variables.
This study finds that on average IPOs are underpriced by 22.08% on the first trading day. At the end of 3-month, underpricing deteriorates to 17.40%. The abnormal returns are highly significant at 1% level over the 3-month period. Also the median level of underpricing indicates that the differences between underpriced and overpriced IPOs are significant in all the event windows. The study also finds that the investors’ sentiment hypothesis and underwriter’s prestige hypothesis seem to be valid descriptions of IPO underpricing. This study does not support the ex-ante uncertainty hypothesis. Using the EBA method, the study finds that robust predictors of short-run performance include the aftermarket risk level of the IPO, oversubscription, offer price, return on assets, post issue promoters’ holding and the size of the firm.
An examination of short-run… / M. Zubair M., Z.A. Smith, A. Maqsood A. 73
This paper is structured as follows: Section 2 provides the literary review, Section 3 describes the Pakistani IPO market, Section 4 discusses the research methodology, Section 5 explains the data and provides a brief description of the variables, Section 6 examines empirical findings and Section 7 concludes.
2. Literary Review
The question of whether IPOs are underpriced has been an area of curios-ity for academics and practitioners for some time. Prior research has provided evidence in support of underpricing which seems to exist in all countries. To explain IPO underpricing, a number of theoretical models have been developed; some of these models are: the winner’s curse hypothesis, underwriter’s prestige, ex-ante uncertainty and signaling mechanism. Empirical evidence found that IPO underpricing in the US market was approximately11% (Reilly and Hatfield, 1969). From 1980 to 1990, underpricing was roughly 7% whereas it was almost double, i.e. 15% during the 1990 to 2000 period. Recently, Liu and Ritter (2010) reported underpricing of 12% in the US market from 2001 to 2008. These studies indicate that the magnitude of underpricing has changed over time. In the UK market, underpricing was reported at 19% during 1989-2007 period (Chambers and Dimson, 2009).
In a study of the Australian market by Perera and Kulendran (2012), the researchers found average initial underpricing of 25.47%. Further, they used cumulative abnormal returns and documented that there was underpricing of about 23% on the 10-trading day. Alqahtani and More (2012) reported that the initial underpricing in New Zealand was 9.16% illustrating that had the under-pricing be lower, the risk will be smaller. Falck (2013) found underpricing of 3.14% in the Norwegian IPO market. He argued that the information revelation theory is one of the most important theories of underpricing.
Researchers have documented that underpricing in emerging markets is higher when compared against developed markets (Loughran et al., 1994). Generally, it is argued that emerging markets may bear more volatility and ex-ante uncertainty of the financial exchanges thereby inflating the underpricing. In an examination of initial underpricing during the 2000-2005 period, Sohail and Nasr (2007) found that on average, IPOs are underpriced by 35.66% using 50 Pakistani IPOs. They identified that the aftermarket risk level of the IPOs, oversubscription, offer size, and market capitalization are the significant de-terminants that affect underpricing. Hassan and Quayes (2008) reported that the average underpricing on the first and 21st trading day was 108% and 119% respectively in the Bangladeshi IPO market. Sohail and Rehman (2010) inves-tigated short-run underpricing over a 20 trading-day period lasting from listing day to the 20th trading day and documented that underpricing ranged from 37%-42%. Sahoo and Rajib (2010) found underpricing of 46.55% using 92 Indian IPOs during the 2002-2006 period. This higher underpricing attributed to over-expectations of investors. Samarakoon (2010) found underpricing of 33.50% in Sri Lanka. Kayani and Amjad (2011) reported initial underpricing of 39.87% when considering 59 Pakistani IPOs during the 2000-2011 period.
Adjasi et al. (2011) documented an initial underpricing of 43.10% when considering 77 Nigerian IPOs during the 1990-2006 period. They found that
Estudios de Economía, Vol. 43 - Nº 174
underpricing is influenced significantly by a firm’s size and its audit quality. In the Malaysian Market, Abubaker and Uzaki (2012) studied 476 IPOs during the 2000-2011 period and found evidence of initial underpricing of 35.87%.
Borges (2007) reported initial underpricing of 11.12% in the Portuguese IPO market. Kucukkocaoglu (2008) argued that short-run underpricing was higher when underwriters use fixed offer and book building methods. He reported that underpricing on the first day and for the first month was 11.73% and 14.12%, respectively. Tunis, Zouari et al. (2009) found average initial underpricing of 16.1%. Omran et al. (2010) found that IPOs were underpriced by 290% in 47 Gulf Firms. Researchers have found evidence that the average underpricing of IPOs issued in the Hong Kong Market was 16.8% (Chong et al., 2010).
The EBA technique has been used in empirical studies to identify the deter-minants of: (a) democracy (Vreeland et. al., 2012) (b) R&D investment (Wang, 2010), (c) foreign direct investment (Moosa, 2009), (d) corruption (Haan and Seldadyo, 2006), (e) stock prices in Kuwait stock exchange (Al-Deehani, 2005) and (f) regional trading arrangements (Ghosh and Yamarik, 2004).
3. Pakistani IPO market
After the liberalization in 1991, the Pakistani Capital Market took on various initiatives. It was an era when IPOs increased tremendously and private firms issued IPOs to diversify ownership, raise funds for investment, and create an exit strategy for mature firms. The Corporate Law Authority (CLA) was established in 1986 to administer the capital market reforms and monitor the corporate sector to achieve transparency and compliance with laws. CLA was abolished and Securities and Exchange of Commission of Pakistan (SECP) was formu-lated in 1997 in order to make the IPO process more rigorous and competitive. During the 2000-2013 period, 86 IPO were issued. IPOs are normally issued under fixed price method whereas only eight IPOs have been issued under the process of book building.
4. Research methodology
4.1. Estimation of the level of short-run IPO underpricing
This study follows the methodology used by Agathee et al. (2012) in which IPO underpricing is determined by obtaining the initial return and then adjust-ing the initial return through the benchmark index. This study examines the underpricing over the 3-month period starting on the listing day because it is assumed that in emerging markets the stock prices may take long time to adjust for market expectations to reach their equilibrium prices (Ljungqvist et al., 2006). The underpricing (UP) for stock i at the tth time period is computed as:
(1) UPi,t =100 × (1+ Ri,t )
(1+ Rm,t ) −1
⎡
⎣⎢
⎤
⎦⎥
⎧⎨⎪
⎩⎪
⎫⎬⎪
⎭⎪
An examination of short-run… / M. Zubair M., Z.A. Smith, A. Maqsood A. 75
where Ri,t = Pi,t
Pi,0
⎛
⎝⎜
⎞
⎠⎟−1, Ri,t and Pi,t = the return and price of stock i at the tth
trading period respectively and Pi,0 = offer price of stock i, Rm,t = Im,t
Im,0
⎛
⎝⎜
⎞
⎠⎟−1,
Rm,t = market return at the tth trading period, Im,t = market index (KSE-100) value at the tth trading period of stock i and Im,0 = market index value on the offering date of stock i. t is defined as trading on the 1-day, 1-month, 2-month and 3-month.
Wealth relative is another measure researchers have used to investigate IPO underpricing and is calculated as:
(2) WRi,t = 1+1
n
⎛⎝⎜⎞⎠⎟ ri,ti=1
n
∑⎛
⎝⎜⎜
⎞
⎠⎟⎟ 1+
1
n
⎛⎝⎜⎞⎠⎟ rm,tm=1
n
∑⎛
⎝⎜⎜
⎞
⎠⎟⎟
where ri,t = return for stock i at tth trading period, rm,t = market return at tth trading period of stock i and n = sample IPOs. If WRi,t > 1.00 it shows that the IPOs outperformed and if WRi,t < 1.00 then it shows that IPOs underperformed.
4.2. Econometric methodology for testing short-run IPO performance:
The determinant factors that cause IPO underpricing are examined using Extreme Bounds Analysis (EBA). This technique is used to test the sensitivity and robustness of the explanatory variables over IPO underpricing. Eventually, it reduces the ambiguity to select determinants which affect IPO underpricing. The EBA method was theoretically developed by Leamer (1983, 1985) and ap-plied by Levine and Renelt (1992) to inquire about the determinants of economic growth. Initially, the concept of EBA was conceived by Cooley and LeRoy (1981) who stated that economic theory does not provide a complete specification of which variables are to be held constant when performing statistical analysis.
Typically, the determinants of IPO underpricing are elaborated as:
(3) UPi =α0 + α jX ji +εij=1
n
∑
where UPi is the underpricing of firm i at tth trading period and Xji is the jth expla-natory variable of firm i. Earlier studies on the determinates of IPO underpricing identified a number of explanatory variables and applied regression analysis to determine which variables have a significant influence on IPO underpricing, but the problem is to identify the variables which are not explained by theory of underpricing reflecting the “true” model. Thus, a number of preferred models on the basis of diagnostic tests were tested; however, the degree of the reliability of the explanatory variables is uncertain. To emphasize all possible combinations of potential control variables, this method determines the upper and lower bounds from the parameter of interest. Moreover, it assesses and reports the sensitivity of the estimated results to specification changes which ultimately reduces the chances of model uncertainty (Leamer and Leonard, 1983).
Estudios de Economía, Vol. 43 - Nº 176
The EBA technique is applied to a linear regression that explains the under-pricing of IPOs and the model is elaborated as follows:
(4) UPi =α0 + δiX jij=1
n
∑ +βQi + γ iZ jij=1
m
∑ +εi
where X is a vital explanatory variable(s) as indicated by earlier studies included in every regression, Q is the variable of interest of which robustness is tested and Z is a potentially important variable. The X’s are free variables while Q is the variable of interest. Under this method, a number of regressions are requi-red to find the value of coefficient of the variable of interest. In a combination of regressions if value of coefficient has the same sign and its extreme value remains statistically significant, then it is a “robust” variable otherwise it is reported as a “fragile” variable.
The drawback of the EBA is that it generates multicollinearity which results in the inflation of standard errors. Leamer (1978) argued that this problem is caused by the weak data problem. In response to this, Levine and Renelt (1992) reported that multicollinearity is not a procedural problem, but it reflects an in-ability to identify a statistical relationship. To authenticate the results, Levine and Renelt (1992) suggested three conditions: (1) only three Z variables are used in each regression, (2) select the three Z variables from a small group of variables, and (3) for each variable of interest, the pool of variables are restricted from the selection of Z variables. Another drawback of EBA is too stringent a test of robustness. Using this technique, a variable is treated as fragile if even one regression changes it signs out of thousands of regressions. This refers to the “one rotten apple” problem for which McAleer et al (1985) refers to when they speak of “families of models”. Sala-i-Martin (1997) argued that researchers are virtually guaranteed to find a model where the coefficient of interest changes its sign or statistically insignificant when applying the EBA technique. This implies that either no variables are robust or fail to clear the test for robustness. Hence, it seems difficult to rely on EBA method for testing the robustness of any variable without having full information of the model’s characteristics that generate the extreme bounds (McAleer et al., 1985).
The EBA technique has been used in various empirical studies to identify the determinants of economic growth, foreign direct investment, stock prices, R&D investment, emergence and survival of democracy, corruption and regional trading arrangements.
4.3. Comparison of the EBA technique with other traditional econometric methods
The purpose of employing the EBA technique in this study is to examine the sensitivity and robustness of the explanatory variables of IPO underpric-ing. To determine the robustness of the EBA, we compare the results obtained from other traditional methods namely: Akaike’s (1973) Information Criterion (AIC), Schwarz’s (1978) Bayesian Information Criterion (SBIC) and Hannan-Quinn (1979) Information Criterion (HQIC). AIC is valid for both nested and non-nested models. It compares the model’s error distribution and avoids the
An examination of short-run… / M. Zubair M., Z.A. Smith, A. Maqsood A. 77
multiple testing issues. The results, therefore, are selected on the basis of their lower error value. The pitfall of this method is that it cannot be used to compare models from different data sets. SBIC is a statistical approach for model selec-tion among a class of parametric models with a different number of parameters. This model identifies the unexplained variation in the dependent variable and the number of explanatory variables increases the value of SBIC. This method penalizes free parameters more strongly than does the AIC. Thus, it reflects that a smaller value of the information criterion is considered to be better. The problem with this technique is the non-existence of the true model. Hence, the convergence in probability is not based logically as the target model must rely on true data-generating distribution. HQIC is another statistical measure used to identify an autoregressive model. Its adjusted version can also be applied to the regressions. The best model corresponds to minimum HQIC. The order selection procedure presents the advantage of being objective and automatic, but it over-fits the data when the sample size is small. A common approach to model building is the general-to-specific methodology (Phillips et al., 1988; Hendry, 1995). This approach fundamentally contains a large model which is statistically suitable and restricts and rearranges the model to arrive at a parsi-monious final formulation. This approach is a part of a critical methodology as it is not guaranteed that a particular simplification will be the true specification and the searches involve multiple tests with unknown distributional properties (Lovell, 1983).
5. Data and description of variables
This empirical study uses 80 IPOs listed on Karachi Stock Exchange during the 2000 to 2013 period, which encompasses 93% of total IPOs issued. The data for the study on IPOs was obtained from the prospectus for issuance of new shares from the SECP and both opening and closing prices of shares as well as KSE-100 Index was gathered from the KSE database.
To determine the important factors prior studies used for various explanatory variables it is crucial to identify those variables which “truly” influence the IPO underpricing. The EBA is used to examine the sensitivity and robustness of the possible explanatory variables, more formally:
(5)
UPi = α0 + α1Riski + α2Subi + α3OPricei + α4Agei + α5ROAi + α6FinLevi + α7UWi + α8Mkt_return + α9Mkt_vol +
α10PIPHi, + α11LDeli + α12FSizei +α13EPSi + α14Hot + α15OSizei + i
where UPi is underpricing, Riski is aftermarket risk level of the IPO (standard deviation of post-issue pricing of first 30 trading days), Sub is oversubscrip-tion ratio, OPrice is of offer price, Age is firm age, ROA is return on assets, FinLev is financial leverage, UW is a dummy variable where the high prestige underwriter is treated as 1 and 0 otherwise, Mkt_return is measured through KSE-100 value-weighted index over 45 trading days prior to IPO, Mkt_volatility is market volatility scaled by standard deviation of market return over 45 trading days prior to IPO, PIPHi is post-issue promoters’ holding, LDel is listing delay
Estudios de Economía, Vol. 43 - Nº 178
between subscription and listing date, FSize is firm size, EPSi is earnings per share, Hot is a dummy variable if IPOs issued in hot period it is 1 otherwise 0 and OSize is offer size.
Out of fifteen variables, two X-variables were fixed. From the remaining 13-variables, Q and Z variables are selected. Thirteen variables are selected as the variables of interest Q for which the robustness is examined. For a given Q variable, three variables are selected from the remaining twelve, giving 2,860 regressions (220 regressions for each variable of interest) and 8,580 regressions in total.
6. Empirical Findings
6.1. Average underpricing
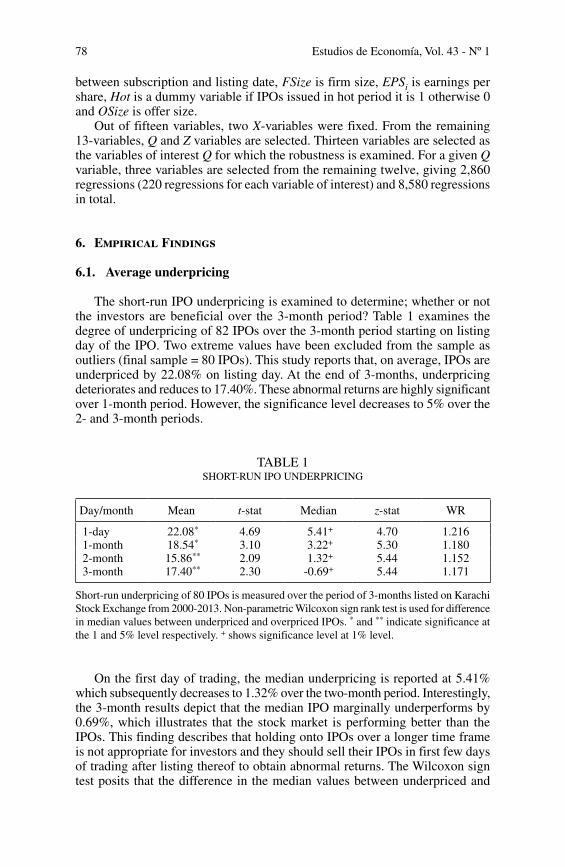
The short-run IPO underpricing is examined to determine; whether or not the investors are beneficial over the 3-month period? Table 1 examines the degree of underpricing of 82 IPOs over the 3-month period starting on listing day of the IPO. Two extreme values have been excluded from the sample as outliers (final sample = 80 IPOs). This study reports that, on average, IPOs are underpriced by 22.08% on listing day. At the end of 3-months, underpricing deteriorates and reduces to 17.40%. These abnormal returns are highly significant over 1-month period. However, the significance level decreases to 5% over the 2- and 3-month periods.
TABLE 1SHORT-RUN IPO UNDERPRICING
Day/month Mean t-stat Median z-stat WR
1-day 22.08* 4.69 5.41+ 4.70 1.216 1-month 18.54* 3.10 3.22+ 5.30 1.180 2-month 15.86** 2.09 1.32+ 5.44 1.152 3-month 17.40** 2.30 -0.69+ 5.44 1.171
Short-run underpricing of 80 IPOs is measured over the period of 3-months listed on Karachi Stock Exchange from 2000-2013. Non-parametric Wilcoxon sign rank test is used for difference in median values between underpriced and overpriced IPOs. * and ** indicate significance at the 1 and 5% level respectively. + shows significance level at 1% level.
On the first day of trading, the median underpricing is reported at 5.41% which subsequently decreases to 1.32% over the two-month period. Interestingly, the 3-month results depict that the median IPO marginally underperforms by 0.69%, which illustrates that the stock market is performing better than the IPOs. This finding describes that holding onto IPOs over a longer time frame is not appropriate for investors and they should sell their IPOs in first few days of trading after listing thereof to obtain abnormal returns. The Wilcoxon sign test posits that the difference in the median values between underpriced and
An examination of short-run… / M. Zubair M., Z.A. Smith, A. Maqsood A. 79
overpriced IPOs is statistically significant in all the event windows. The value of wealth relative (WR) is more than 1.00 in all illustrating IPOs outperformed over the sample period. Eliminating overpriced IPOs, 51 IPOs (63.75%) are underpriced by 41.01% on the first day of trading. These abnormal returns range from 38% to 41% over the 3-month period.
6.2. Post-issue performance expectations of newly issued shares
Lowry, Officer and Schwert (2010) claimed that on average IPOs are un-derpriced meaning that the market price of a stock is on average higher than its offer price for a short time after its issuance. The determination of the IPO’s price is based on an estimate of the secondary market price. These estimates are not only biased downward but the range of estimation errors seem to be substan-tial. This initial mispricing may be due to informational asymmetries between the corporation that issues the unseasoned equity shares and the prospective investor. We could assume that the underwriters are not exposed to these same informational asymmetries, because they are given full access to the organization and its management team during the underwriting process. Furthermore, there is a period of time in which the ‘investor’ is unable to uncover the information that was disclosed to the underwriter in the underwriting process. We could conjecture that the efficiency of the ‘market’s pricing mechanism’ is influenced by these informational asymmetries and its ability to properly price these newly issued securities is affected because the market lacks information. We believe that information asymmetry affects the accuracy of the price-setting process (Sherman and Titman, 2002), which leads to higher uncertainty and may cause higher post-IPO returns.
If there is statistically significant evidence of abnormal returns experienced by investors from the offer of the unseasoned shares to the initial and subsequent trades, it seems that this mispricing could be considered ‘underpricing’ by the underwriter. It seems to be clear that the company ‘left money on the table’ be-cause there is a difference between what the ‘market’ valued the company at and what the ‘underwriter’ valued the company at. There are many plausible reasons that a company or underwriter may do this (i.e. “leave a good taste in investors’ mouths” for future seasoned equity offers’ or to “compensate investors to provide them with non-public information” to help them to determine a fair market price).
Determining a value for an IPO is complex. The complexity of the pricing problems adds to the IPO’s return volatility which results in large fractions of information asymmetry (Lowry et al., 2010). The volatility of IPO price perfor-mance is used as a proxy for the complexity of pricing IPOs; therefore, as the volatility changes over time, the difficulty of the pricing problem changes over time. In line with this argument, we find that the volatility of post-IPO prices changes a lot when researchers are using different examination periods. When markets are considered ‘hot’ there seems to be a considerably large variation in post-IPO prices and performance, which coincides with the belief that there is a strong positive relationship between the average the volatility of post-IPO returns over time (Ritter 1984).
Whether the newly issued securities are priced to incorporate the potential future volatility of the security is debatable and that is why the researchers used the future price performance of the newly issued security as a determinate of the
Estudios de Economía, Vol. 43 - Nº 180
initial underpricing. Perhaps the underwriter has the ability to predict the future volatility of the new issue and adjusts the price downward to compensate investors to bare this risk. What our results suggest is that the market and the underwriters have a different interpretation of the required compensation for bearing that risk.
In reference to the process that the underwriter goes through to obtain their estimate of the price of the initial offering, this paper conjectures that alterna-tive price discovery mechanisms, such as book building methods as compared against firm commitment offerings, could result in much more accurate price discovery in the pre-trading period for IPO companies. In fact, our sample showed that firms went public through book building process experienced less underpricing and less variability of underpricing compared to other similar firm that did a firm-commitment IPO.
Our findings suggest serious concerns regarding the efficacy of the conventional firm-commitment underwritten IPO process which ultimately seems to add to the volatility of pricing errors in the process IPO issuance. The patterns observed in the volatility of underpricing over time and across a diversified set of firms demonstrate that this process is a high uncertainty process. More specifically, this study posits that the concept of short-run performance of IPOs is influenced by the potential volatility in post-IPO prices. Interestingly, the standard deviation of post-IPO returns shows an upward trend over different windows implying volatility in post-IPO prices. If the outliers from the sample were removed, the average underpricing on listing day was 16.08% which reduces to 8.87% at the end of first-month. However, no evidence of underpricing is found on the 2- and 3-month trading periods, which illustrates that longer-term investment in IPOs is not beneficial to investors.
In short, this study analyses the performance of IPOs over three-month period following the issuance of equity shares and found that investors earn abnormal excess returns due to the high volatility in aftermarket post-IPO prices. This illustrates a strong positive relationship between IPO returns and the volatility of post-IPO prices in the Pakistani market.
6.3. Underpricing by issue year and different periods
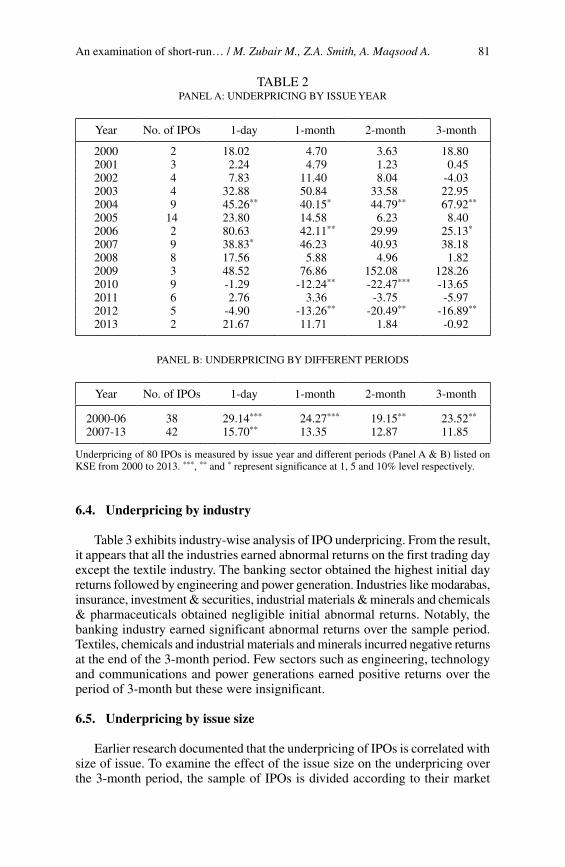
Table 2-Panel A demonstrates that the investors earned abnormal returns except in years 2010 and 2012. The negative returns are attributed to adverse movements in the stock market. It was, therefore, appropriate for the investors to sell IPO stocks during the identical years on the first trading day as negative returns increased over the 3-month period. A year-wise analysis showed that in the 2003-04, 2006-07 and 2009 periods, the investors earned high positive returns over the 3-month period representing an economic upswing in the coun-try. Considering these results in this view, it is concluded that the Pakistan IPO market showed strong evidence of short-run underpricing.
During the sub periods: (a) 2000 to 2006 (38 IPOs), and (b) 2007 to 2013 (42 IPOs), average IPOs were underpriced by 29.14% during 2000-2006 on the listing day as compared to 15.70% during 2007-2013 (Panel B). The higher level of underpricing illustrates notable improvements in the economy during 2004 and 2005. Underpricing remained higher during the 2000-2006 period the initial 3 months depicting an economic upsurge that maximized IPOs returns as opposed to the 2007-2013 period.
An examination of short-run… / M. Zubair M., Z.A. Smith, A. Maqsood A. 81
TABLE 2PANEL A: UNDERPRICING BY ISSUE YEAR
Year No. of IPOs 1-day 1-month 2-month 3-month
2000 2 18.02 4.70 3.63 18.802001 3 2.24 4.79 1.23 0.452002 4 7.83 11.40 8.04 -4.032003 4 32.88 50.84 33.58 22.952004 9 45.26** 40.15* 44.79** 67.92**
2005 14 23.80 14.58 6.23 8.402006 2 80.63 42.11** 29.99 25.13*
2007 9 38.83* 46.23 40.93 38.182008 8 17.56 5.88 4.96 1.822009 3 48.52 76.86 152.08 128.262010 9 -1.29 -12.24** -22.47*** -13.652011 6 2.76 3.36 -3.75 -5.972012 5 -4.90 -13.26** -20.49** -16.89**
2013 2 21.67 11.71 1.84 -0.92
PANEL B: UNDERPRICING BY DIFFERENT PERIODS
Year No. of IPOs 1-day 1-month 2-month 3-month
2000-06 38 29.14*** 24.27*** 19.15** 23.52**
2007-13 42 15.70** 13.35 12.87 11.85
Underpricing of 80 IPOs is measured by issue year and different periods (Panel A & B) listed on KSE from 2000 to 2013. ***, ** and * represent significance at 1, 5 and 10% level respectively.
6.4. Underpricing by industry
Table 3 exhibits industry-wise analysis of IPO underpricing. From the result, it appears that all the industries earned abnormal returns on the first trading day except the textile industry. The banking sector obtained the highest initial day returns followed by engineering and power generation. Industries like modarabas, insurance, investment & securities, industrial materials & minerals and chemicals & pharmaceuticals obtained negligible initial abnormal returns. Notably, the banking industry earned significant abnormal returns over the sample period. Textiles, chemicals and industrial materials and minerals incurred negative returns at the end of the 3-month period. Few sectors such as engineering, technology and communications and power generations earned positive returns over the period of 3-month but these were insignificant.
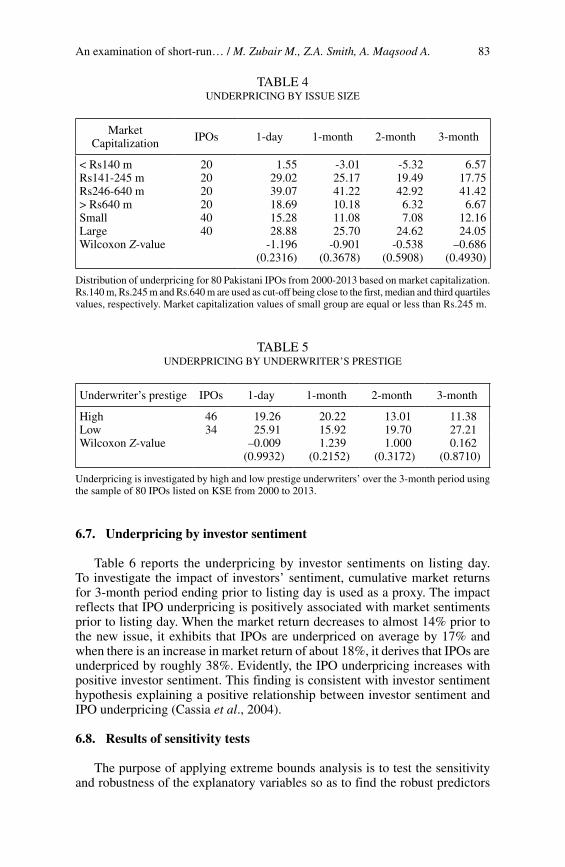
6.5. Underpricing by issue size
Earlier research documented that the underpricing of IPOs is correlated with size of issue. To examine the effect of the issue size on the underpricing over the 3-month period, the sample of IPOs is divided according to their market
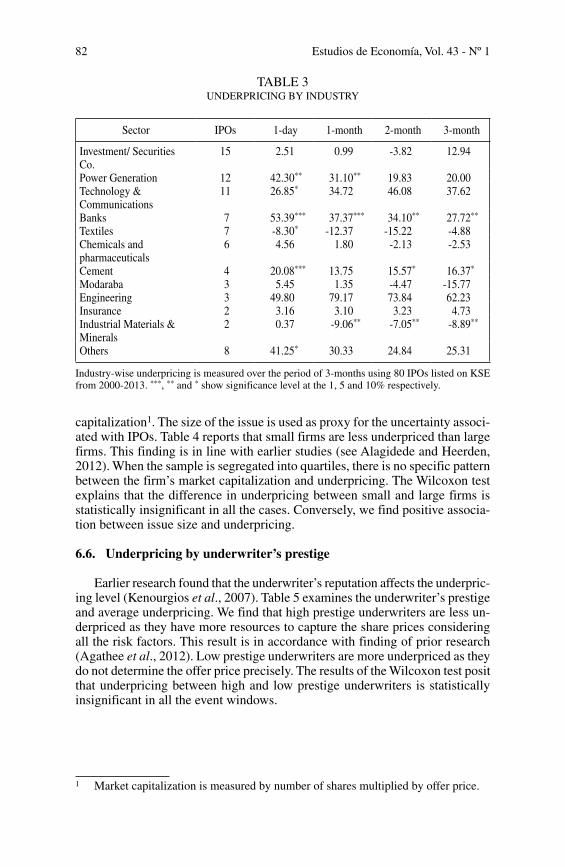
Estudios de Economía, Vol. 43 - Nº 182
capitalization1. The size of the issue is used as proxy for the uncertainty associ-ated with IPOs. Table 4 reports that small firms are less underpriced than large firms. This finding is in line with earlier studies (see Alagidede and Heerden, 2012). When the sample is segregated into quartiles, there is no specific pattern between the firm’s market capitalization and underpricing. The Wilcoxon test explains that the difference in underpricing between small and large firms is statistically insignificant in all the cases. Conversely, we find positive associa-tion between issue size and underpricing.
6.6. Underpricing by underwriter’s prestige
Earlier research found that the underwriter’s reputation affects the underpric-ing level (Kenourgios et al., 2007). Table 5 examines the underwriter’s prestige and average underpricing. We find that high prestige underwriters are less un-derpriced as they have more resources to capture the share prices considering all the risk factors. This result is in accordance with finding of prior research (Agathee et al., 2012). Low prestige underwriters are more underpriced as they do not determine the offer price precisely. The results of the Wilcoxon test posit that underpricing between high and low prestige underwriters is statistically insignificant in all the event windows.
1 Market capitalization is measured by number of shares multiplied by offer price.
TABLE 3UNDERPRICING BY INDUSTRY
Sector IPOs 1-day 1-month 2-month 3-month
Investment/ Securities Co.
15 2.51 0.99 -3.82 12.94
Power Generation 12 42.30** 31.10** 19.83 20.00Technology & Communications
11 26.85* 34.72 46.08 37.62
Banks 7 53.39*** 37.37*** 34.10** 27.72**
Textiles 7 -8.30* -12.37 -15.22 -4.88Chemicals and pharmaceuticals
6 4.56 1.80 -2.13 -2.53
Cement 4 20.08*** 13.75 15.57* 16.37*
Modaraba 3 5.45 1.35 -4.47 -15.77Engineering 3 49.80 79.17 73.84 62.23Insurance 2 3.16 3.10 3.23 4.73Industrial Materials & Minerals
2 0.37 -9.06** -7.05** -8.89**
Others 8 41.25* 30.33 24.84 25.31
Industry-wise underpricing is measured over the period of 3-months using 80 IPOs listed on KSE from 2000-2013. ***, ** and * show significance level at the 1, 5 and 10% respectively.
An examination of short-run… / M. Zubair M., Z.A. Smith, A. Maqsood A. 83
TABLE 4UNDERPRICING BY ISSUE SIZE
Market Capitalization IPOs 1-day 1-month 2-month 3-month
< Rs140 m 20 1.55 -3.01 -5.32 6.57Rs141-245 m 20 29.02 25.17 19.49 17.75Rs246-640 m 20 39.07 41.22 42.92 41.42> Rs640 m 20 18.69 10.18 6.32 6.67Small 40 15.28 11.08 7.08 12.16Large 40 28.88 25.70 24.62 24.05Wilcoxon Z-value -1.196
(0.2316)-0.901
(0.3678)-0.538
(0.5908)–0.686
(0.4930)
Distribution of underpricing for 80 Pakistani IPOs from 2000-2013 based on market capitalization. Rs.140 m, Rs.245 m and Rs.640 m are used as cut-off being close to the first, median and third quartiles values, respectively. Market capitalization values of small group are equal or less than Rs.245 m.
TABLE 5UNDERPRICING BY UNDERWRITER’S PRESTIGE
Underwriter’s prestige IPOs 1-day 1-month 2-month 3-month
High 46 19.26 20.22 13.01 11.38Low 34 25.91 15.92 19.70 27.21Wilcoxon Z-value –0.009
(0.9932)1.239
(0.2152)1.000
(0.3172)0.162
(0.8710)
Underpricing is investigated by high and low prestige underwriters’ over the 3-month period using the sample of 80 IPOs listed on KSE from 2000 to 2013.
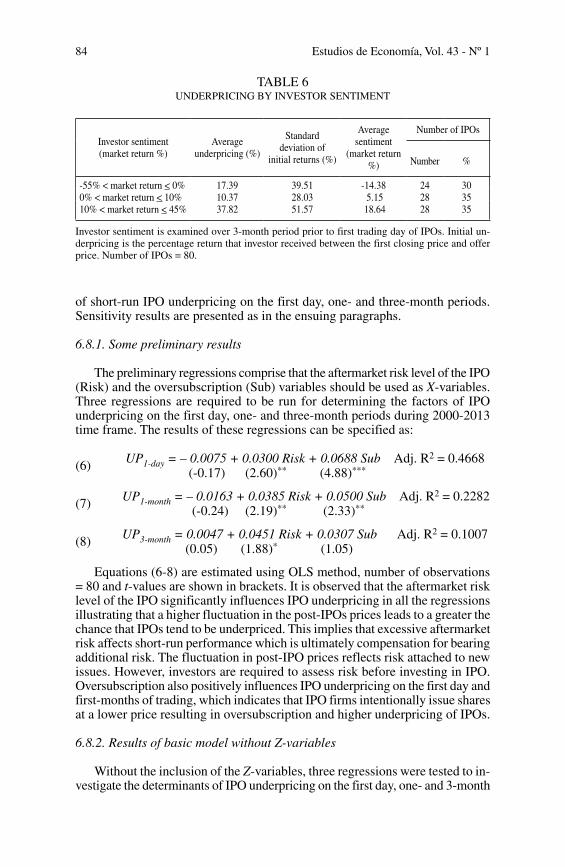
6.7. Underpricing by investor sentiment
Table 6 reports the underpricing by investor sentiments on listing day. To investigate the impact of investors’ sentiment, cumulative market returns for 3-month period ending prior to listing day is used as a proxy. The impact reflects that IPO underpricing is positively associated with market sentiments prior to listing day. When the market return decreases to almost 14% prior to the new issue, it exhibits that IPOs are underpriced on average by 17% and when there is an increase in market return of about 18%, it derives that IPOs are underpriced by roughly 38%. Evidently, the IPO underpricing increases with positive investor sentiment. This finding is consistent with investor sentiment hypothesis explaining a positive relationship between investor sentiment and IPO underpricing (Cassia et al., 2004).
6.8. Results of sensitivity tests
The purpose of applying extreme bounds analysis is to test the sensitivity and robustness of the explanatory variables so as to find the robust predictors
Estudios de Economía, Vol. 43 - Nº 184
of short-run IPO underpricing on the first day, one- and three-month periods. Sensitivity results are presented as in the ensuing paragraphs.
6.8.1. Some preliminary results
The preliminary regressions comprise that the aftermarket risk level of the IPO (Risk) and the oversubscription (Sub) variables should be used as X-variables. Three regressions are required to be run for determining the factors of IPO underpricing on the first day, one- and three-month periods during 2000-2013 time frame. The results of these regressions can be specified as:
(6) UP1-day = – 0.0075 + 0.0300 Risk + 0.0688 Sub Adj. R2 = 0.4668 (-0.17) (2.60)** (4.88)***
(7) UP1-month = – 0.0163 + 0.0385 Risk + 0.0500 Sub Adj. R2 = 0.2282 (-0.24) (2.19)** (2.33)**
(8) UP3-month = 0.0047 + 0.0451 Risk + 0.0307 Sub Adj. R2 = 0.1007 (0.05) (1.88)* (1.05)
Equations (6-8) are estimated using OLS method, number of observations = 80 and t-values are shown in brackets. It is observed that the aftermarket risk level of the IPO significantly influences IPO underpricing in all the regressions illustrating that a higher fluctuation in the post-IPOs prices leads to a greater the chance that IPOs tend to be underpriced. This implies that excessive aftermarket risk affects short-run performance which is ultimately compensation for bearing additional risk. The fluctuation in post-IPO prices reflects risk attached to new issues. However, investors are required to assess risk before investing in IPO. Oversubscription also positively influences IPO underpricing on the first day and first-months of trading, which indicates that IPO firms intentionally issue shares at a lower price resulting in oversubscription and higher underpricing of IPOs.
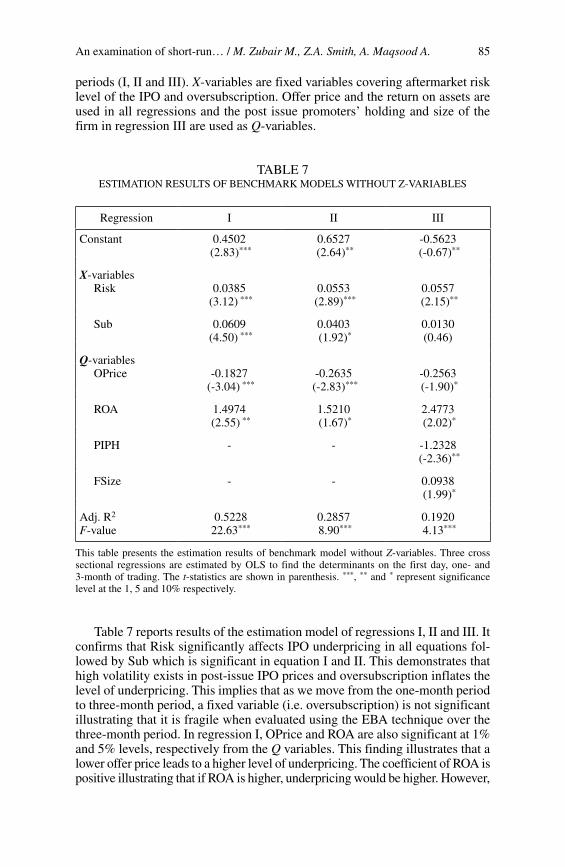
6.8.2. Results of basic model without Z-variables
Without the inclusion of the Z-variables, three regressions were tested to in-vestigate the determinants of IPO underpricing on the first day, one- and 3-month
TABLE 6UNDERPRICING BY INVESTOR SENTIMENT
Investor sentiment (market return %)
Average underpricing (%)
Standard deviation of
initial returns (%)
Average sentiment
(market return %)
Number of IPOs
Number %
-55% < market return < 0% 17.39 39.51 -14.38 24 300% < market return < 10% 10.37 28.03 5.15 28 3510% < market return < 45% 37.82 51.57 18.64 28 35
Investor sentiment is examined over 3-month period prior to first trading day of IPOs. Initial un-derpricing is the percentage return that investor received between the first closing price and offer price. Number of IPOs = 80.
An examination of short-run… / M. Zubair M., Z.A. Smith, A. Maqsood A. 85
periods (I, II and III). X-variables are fixed variables covering aftermarket risk level of the IPO and oversubscription. Offer price and the return on assets are used in all regressions and the post issue promoters’ holding and size of the firm in regression III are used as Q-variables.
TABLE 7ESTIMATION RESULTS OF BENCHMARK MODELS WITHOUT Z-VARIABLES
Regression I II III
Constant 0.4502 (2.83)***
0.6527 (2.64)**
-0.5623 (-0.67)**
X-variables Risk 0.0385
(3.12) ***0.0553
(2.89)***0.0557
(2.15)**
Sub 0.0609 (4.50) ***
0.0403 (1.92)*
0.0130(0.46)
Q-variables OPrice -0.1827
(-3.04) ***-0.2635
(-2.83)***-0.2563 (-1.90)*
ROA 1.4974 (2.55) **
1.5210 (1.67)*
2.4773 (2.02)*
PIPH - - -1.2328 (-2.36)**
FSize - - 0.0938 (1.99)*
Adj. R2 0.5228 0.2857 0.1920F-value 22.63*** 8.90*** 4.13***
This table presents the estimation results of benchmark model without Z-variables. Three cross sectional regressions are estimated by OLS to find the determinants on the first day, one- and 3-month of trading. The t-statistics are shown in parenthesis. ***, ** and * represent significance level at the 1, 5 and 10% respectively.
Table 7 reports results of the estimation model of regressions I, II and III. It confirms that Risk significantly affects IPO underpricing in all equations fol-lowed by Sub which is significant in equation I and II. This demonstrates that high volatility exists in post-issue IPO prices and oversubscription inflates the level of underpricing. This implies that as we move from the one-month period to three-month period, a fixed variable (i.e. oversubscription) is not significant illustrating that it is fragile when evaluated using the EBA technique over the three-month period. In regression I, OPrice and ROA are also significant at 1% and 5% levels, respectively from the Q variables. This finding illustrates that a lower offer price leads to a higher level of underpricing. The coefficient of ROA is positive illustrating that if ROA is higher, underpricing would be higher. However,
Estudios de Economía, Vol. 43 - Nº 186
this finding is contrary to prior research (Agathee et al. 2012). Regression II indicates that OPrice and ROA are significant. In regression III, OPrice, ROA and FSize are statistically significant at the 10% level whereas PIPH is significant at the 5% level. The high proportion of post issue retention indicates that the floatation of a small percentage of shares results in higher underpricing. As the firm size variable increases investors expect greater performance, which leads to an increased expectation of underpricing.
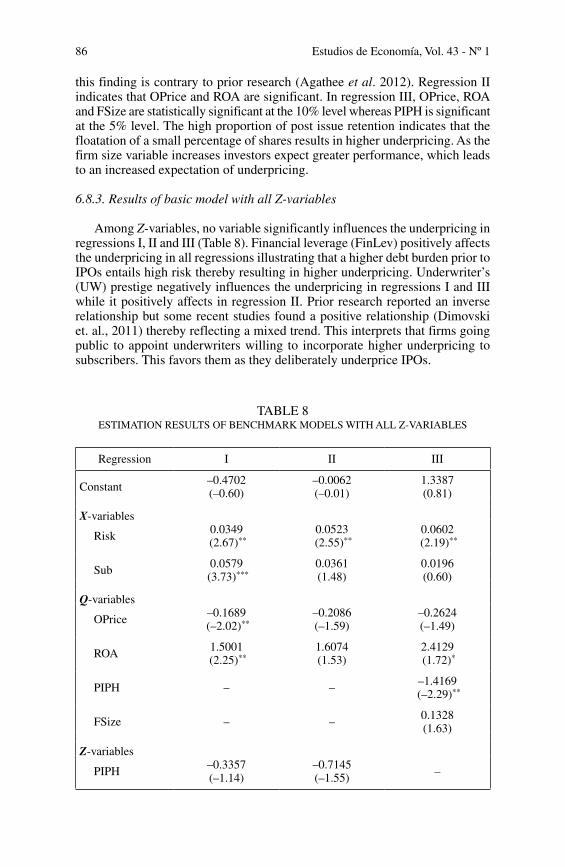
6.8.3. Results of basic model with all Z-variables
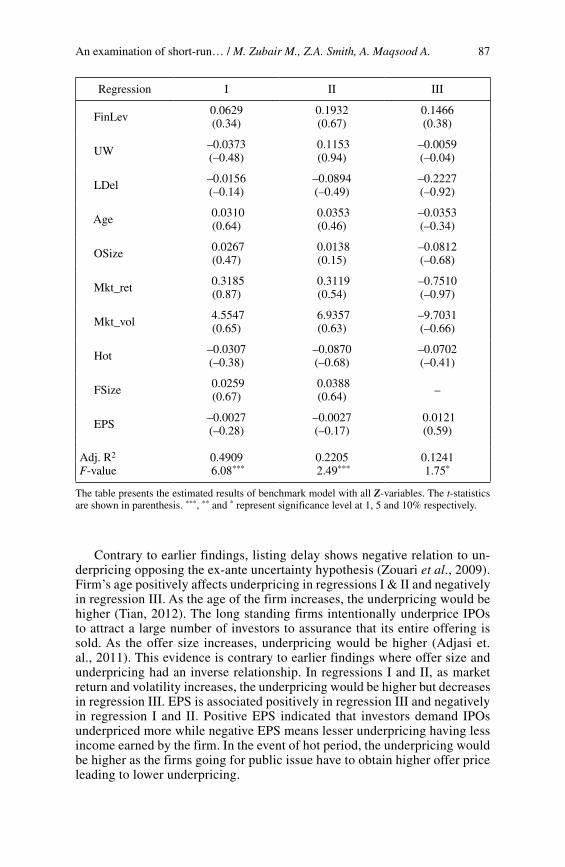
Among Z-variables, no variable significantly influences the underpricing in regressions I, II and III (Table 8). Financial leverage (FinLev) positively affects the underpricing in all regressions illustrating that a higher debt burden prior to IPOs entails high risk thereby resulting in higher underpricing. Underwriter’s (UW) prestige negatively influences the underpricing in regressions I and III while it positively affects in regression II. Prior research reported an inverse relationship but some recent studies found a positive relationship (Dimovski et. al., 2011) thereby reflecting a mixed trend. This interprets that firms going public to appoint underwriters willing to incorporate higher underpricing to subscribers. This favors them as they deliberately underprice IPOs.
TABLE 8ESTIMATION RESULTS OF BENCHMARK MODELS WITH ALL Z-VARIABLES
Regression I II III
Constant –0.4702(–0.60)
–0.0062(–0.01)
1.3387(0.81)
X-variables
Risk 0.0349 (2.67)**
0.0523 (2.55)**
0.0602 (2.19)**
Sub 0.0579 (3.73)***
0.0361(1.48)
0.0196(0.60)
Q-variables
OPrice –0.1689 (–2.02)**
–0.2086(–1.59)
–0.2624(–1.49)
ROA 1.5001 (2.25)**
1.6074(1.53)
2.4129 (1.72)*
PIPH – – –1.4169 (–2.29)**
FSize – – 0.1328(1.63)
Z-variables
PIPH –0.3357(–1.14)
–0.7145(–1.55) –
An examination of short-run… / M. Zubair M., Z.A. Smith, A. Maqsood A. 87
Regression I II III
FinLev 0.0629(0.34)
0.1932(0.67)
0.1466(0.38)
UW –0.0373(–0.48)
0.1153(0.94)
–0.0059(–0.04)
LDel –0.0156(–0.14)
–0.0894(–0.49)
–0.2227(–0.92)
Age 0.0310(0.64)
0.0353(0.46)
–0.0353(–0.34)
OSize 0.0267(0.47)
0.0138(0.15)
–0.0812(–0.68)
Mkt_ret 0.3185(0.87)
0.3119(0.54)
–0.7510(–0.97)
Mkt_vol 4.5547(0.65)
6.9357(0.63)
–9.7031(–0.66)
Hot –0.0307(–0.38)
–0.0870(–0.68)
–0.0702(–0.41)
FSize 0.0259(0.67)
0.0388(0.64) –
EPS –0.0027(–0.28)
–0.0027(–0.17)
0.0121(0.59)
Adj. R2 0.4909 0.2205 0.1241F-value 6.08*** 2.49*** 1.75*
The table presents the estimated results of benchmark model with all Z-variables. The t-statistics are shown in parenthesis. ***, ** and * represent significance level at 1, 5 and 10% respectively.
Contrary to earlier findings, listing delay shows negative relation to un-derpricing opposing the ex-ante uncertainty hypothesis (Zouari et al., 2009). Firm’s age positively affects underpricing in regressions I & II and negatively in regression III. As the age of the firm increases, the underpricing would be higher (Tian, 2012). The long standing firms intentionally underprice IPOs to attract a large number of investors to assurance that its entire offering is sold. As the offer size increases, underpricing would be higher (Adjasi et. al., 2011). This evidence is contrary to earlier findings where offer size and underpricing had an inverse relationship. In regressions I and II, as market return and volatility increases, the underpricing would be higher but decreases in regression III. EPS is associated positively in regression III and negatively in regression I and II. Positive EPS indicated that investors demand IPOs underpriced more while negative EPS means lesser underpricing having less income earned by the firm. In the event of hot period, the underpricing would be higher as the firms going for public issue have to obtain higher offer price leading to lower underpricing.
Estudios de Economía, Vol. 43 - Nº 188
Comparing the results of regressions without and with all of the Z-variables, it clearly emphasizes that economic theory does not produce a complete speci-fication as to which variables are held constant to perform statistical tests.
6.8.4. Comparison of the EBA technique with other traditional econometric methods
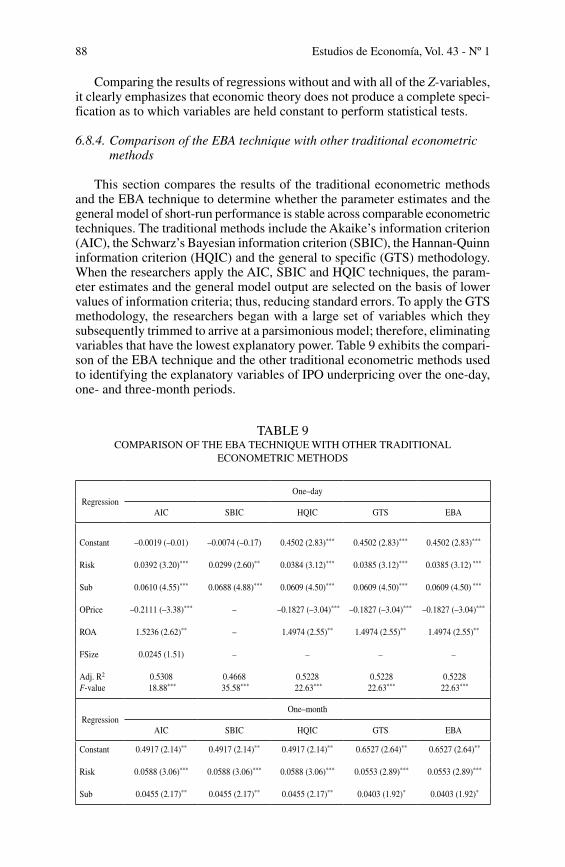
This section compares the results of the traditional econometric methods and the EBA technique to determine whether the parameter estimates and the general model of short-run performance is stable across comparable econometric techniques. The traditional methods include the Akaike’s information criterion (AIC), the Schwarz’s Bayesian information criterion (SBIC), the Hannan-Quinn information criterion (HQIC) and the general to specific (GTS) methodology. When the researchers apply the AIC, SBIC and HQIC techniques, the param-eter estimates and the general model output are selected on the basis of lower values of information criteria; thus, reducing standard errors. To apply the GTS methodology, the researchers began with a large set of variables which they subsequently trimmed to arrive at a parsimonious model; therefore, eliminating variables that have the lowest explanatory power. Table 9 exhibits the compari-son of the EBA technique and the other traditional econometric methods used to identifying the explanatory variables of IPO underpricing over the one-day, one- and three-month periods.
TABLE 9COMPARISON OF THE EBA TECHNIQUE WITH OTHER TRADITIONAL
ECONOMETRIC METHODS
RegressionOne–day
AIC SBIC HQIC GTS EBA
Constant –0.0019 (–0.01) –0.0074 (–0.17) 0.4502 (2.83)*** 0.4502 (2.83)*** 0.4502 (2.83)***
Risk 0.0392 (3.20)*** 0.0299 (2.60)** 0.0384 (3.12)*** 0.0385 (3.12)*** 0.0385 (3.12) ***
Sub 0.0610 (4.55)*** 0.0688 (4.88)*** 0.0609 (4.50)*** 0.0609 (4.50)*** 0.0609 (4.50) ***
OPrice –0.2111 (–3.38)*** – –0.1827 (–3.04)*** –0.1827 (–3.04)*** –0.1827 (–3.04)***
ROA 1.5236 (2.62)** – 1.4974 (2.55)** 1.4974 (2.55)** 1.4974 (2.55)**
FSize 0.0245 (1.51) – – – –
Adj. R2 0.5308 0.4668 0.5228 0.5228 0.5228F-value 18.88*** 35.58*** 22.63*** 22.63*** 22.63***
RegressionOne–month
AIC SBIC HQIC GTS EBA
Constant 0.4917 (2.14)** 0.4917 (2.14)** 0.4917 (2.14)** 0.6527 (2.64)** 0.6527 (2.64)**
Risk 0.0588 (3.06)*** 0.0588 (3.06)*** 0.0588 (3.06)*** 0.0553 (2.89)*** 0.0553 (2.89)***
Sub 0.0455 (2.17)** 0.0455 (2.17)** 0.0455 (2.17)** 0.0403 (1.92)* 0.0403 (1.92)*
An examination of short-run… / M. Zubair M., Z.A. Smith, A. Maqsood A. 89
The parameter and model estimates generated using traditional methods compared against the EBA technique clearly indicate small variations when researchers select one method over the other. The aftermarket risk level of IPO and oversubscription variables are statistically significant across all econometric techniques over the first-day and one-month trading periods. The AIC identi-fies five variables that affect IPO underpricing on the first trading day, which seems to illustrate a trade-off between the accuracy and complexity of model. In particular, the AIC does not always proposes the most parsimonious model as it is largely based on the log likelihood function. When two or more models are nested, the AIC may fail to select the most parsimonious model if these models are accurately specified (Davidson and MacKinnon, 2004). Conversely, if all the models are non-nested and only one is well specified, the AIC selects the well-specified model asymptotically considering the largest value of the log
RegressionOne–month
AIC SBIC HQIC GTS EBA
OPrice –0.1938 (–2.30) ** –0.1938 (–2.30)** –0.1938 (–2.30)** –0.2635 (–2.83)*** –0.2635 (–2.83)***
ROA – – – 1.5210 (1.67)* 1.5210 (1.67)*
Adj. R2 0.2689 0.2689 0.2689 0.2857 0.2857F-value 10.69*** 10.69*** 10.69*** 8.90*** 8.90***
RegressionThree–month
AIC SBIC HQIC GTS EBA
Constant –0.5377 (–0.65) 0.6004 (1.93)* –0.5377 (–0.65) –0.5377 (–0.65) –0.5623 (–0.67)**
Risk 0.0620 (2.85)*** 0.0800 (3.67)*** 0.0620 (2.85)*** 0.0620 (2.85)*** 0.0557 (2.15)**
Sub – – – – 0.0130 (0.46)
OPrice –0.2637 (–1.98)* –0.2139 (–1.84)* –0.2637 (–1.98)* –0.2637 (–1.98)* –0.2563 (–1.90)*
ROA 2.5636 (2.12)** – 2.5636 (2.12)** 2.5636 (2.12)** 2.4773 (2.02)*
PIPH –1.2509 (–2.41)** – –1.2509 (–2.41)** –1.2509 (–2.41)** –1.2328 (–2.36)**
FSize 0.0949 (2.03)** – 0.0949 (2.03)** 0.0949 (2.03)** 0.0938 (1.99)*
Adj. R2 0.2006 0.1265 0.2006 0.2006 0.1920F-value 4.96*** 6.72*** 4.96*** 4.96*** 4.13***
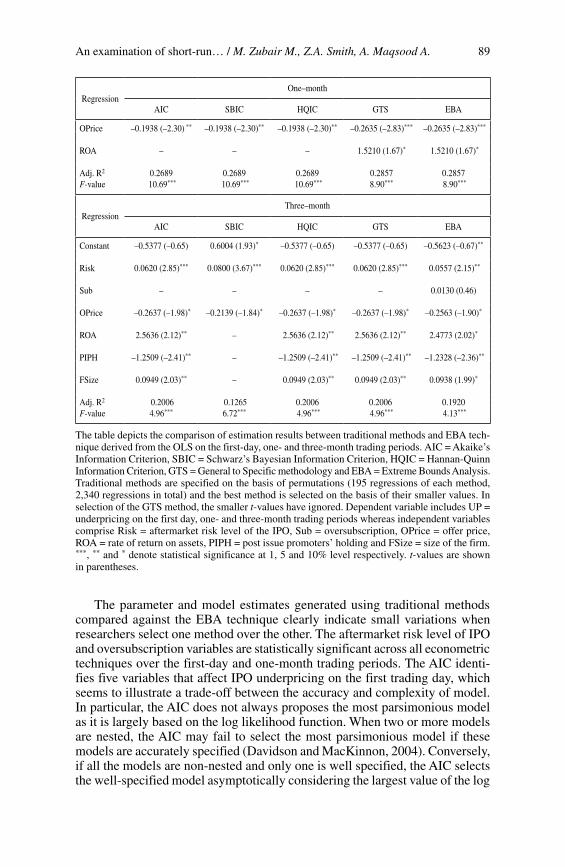
The table depicts the comparison of estimation results between traditional methods and EBA tech-nique derived from the OLS on the first-day, one- and three-month trading periods. AIC = Akaike’s Information Criterion, SBIC = Schwarz’s Bayesian Information Criterion, HQIC = Hannan-Quinn Information Criterion, GTS = General to Specific methodology and EBA = Extreme Bounds Analysis. Traditional methods are specified on the basis of permutations (195 regressions of each method, 2,340 regressions in total) and the best method is selected on the basis of their smaller values. In selection of the GTS method, the smaller t-values have ignored. Dependent variable includes UP = underpricing on the first day, one- and three-month trading periods whereas independent variables comprise Risk = aftermarket risk level of the IPO, Sub = oversubscription, OPrice = offer price, ROA = rate of return on assets, PIPH = post issue promoters’ holding and FSize = size of the firm. ***, ** and * denote statistical significance at 1, 5 and 10% level respectively. t-values are shown in parentheses.
Estudios de Economía, Vol. 43 - Nº 190
likelihood function. The results of the SBIC over the one-day period indicate that the only two variables that have statistically significant explanatory power over IPO underpricing are risk and oversubscription. Asymptotically, SBIC would consider the more parsimonious model when compared against the AIC technique, but Stock and Watson (2007) argued that researchers should choose the model suggested by AIC rather than SBIC. Further, they argued that the inclusion of additional parameters is better than omitting statistically significant parameter estimates. Interestingly, the HQIC, GTS and EBA tech-niques generate the same parameter and model estimates, which illustrates that there is consistency in their model specification. According to Hurrich and Tsai (1989), the model specification methods related to the SBIC and HQIC techniques are order consistent and they are not asymptotically efficient like the AIC. Regarding the GTS methodology, Lovel (1983) suggested that there is no assurance that the particular specification relates to the true specification due to unknown distributional properties with multiple testing. The other criticism of this method is the lack of clear guidelines on the best way to proceed when simplifying the general method (Pagan, 1987). The EBA technique identifies the same results which are derived by examining the sensitivity and robustness of the explanatory variables after running thousands of regressions. The size of the firm is not included in EBA as it did not pass the sensitivity test; however, it has reduced the values of SBIC. Hence, this variable is not reflected except when applying the AIC. In short, every econometric method has its own build-in features to identify the model specification but interestingly their results are almost the same on the first trading day.
The results of the AIC, SBIC and HQIC approaches to identify determinates of IPO underpricing over the first month of trading indicate similar findings, which illustrates that their model specifications are more or less same. The GTS and EBA methodologies provide the same results; however, they identify more variables than information criteria technique. It is observed that both the GTS and EBA techniques find that the ROA variable is a significant predictor of IPO underpricing. With the inclusion of ROA, the values of information criteria have increased as one variable may be influencing the impact of other variables. While simplifying the GTS model, the ROA is significant and does not produce the lowest t-value so it is included in the final model whereas when applying the EBA technique it passes the sensitivity test without changes its sign throughout a set of regressions.
When the researchers compared the results for the three-month trading period, they found that AIC, HQIC and GTS produce the same results whereas the specification of the model using the EBA technique is slightly different. The aftermarket risk level of the IPO is significant in all the econometric methods but the examination of results indicates that oversubscription has been excluded from the analysis due to its higher value of information criteria and small t-value using the GTS methodology. This variable is kept fixed in EBA technique because it has been identified by prior studies and is deemed an important determinant of IPO underpricing, thereby reflecting a slight change in the results. By construction, the EBA method fixes variable(s) in the model based upon their perceived importance in the prior literature. The ‘best’ descriptive model of IPO underpricing may change as we move from the one-day to the one-month to the three-month periods, but the goal of this
An examination of short-run… / M. Zubair M., Z.A. Smith, A. Maqsood A. 91
research project was to identify a general model of short-term IPO perfor-mance (i.e. that provides a general description of this phenomenon over the one-day, one-month, and three-month periods). The influence of the ‘Sub’ variable (i.e. oversubscription) seems to weaken as we increase the study’s time horizon; therefore, the affect seems to be short-lived, but seems to be a relevant predictor of IPO underpricing over the short-run.
Summarizing the results presented in Table 9, the traditional econometric methods and the EBA technique offer similar descriptions of IPO underpricing; however, the alternative model’s procedural foundations are different. The pur-pose of this study is to identify the best descriptive model of IPO underpricing and the inclusion of the EBA technique enhances the project by: (a) introduc-ing a sensitivity analysis to make sure that the parameter estimates are stable, (b) delineating the ambiguity in selecting the choice of method (Leamer and Leonard, 1983), and (c) providing an enhanced platform to identify and evaluate whether the variables are ‘true’ predictors of IPO underpricing. In addition to those advantages, the EBA technique adds rigidity to the process of searching for and identifying the explanatory variables that affect the dependent variable.
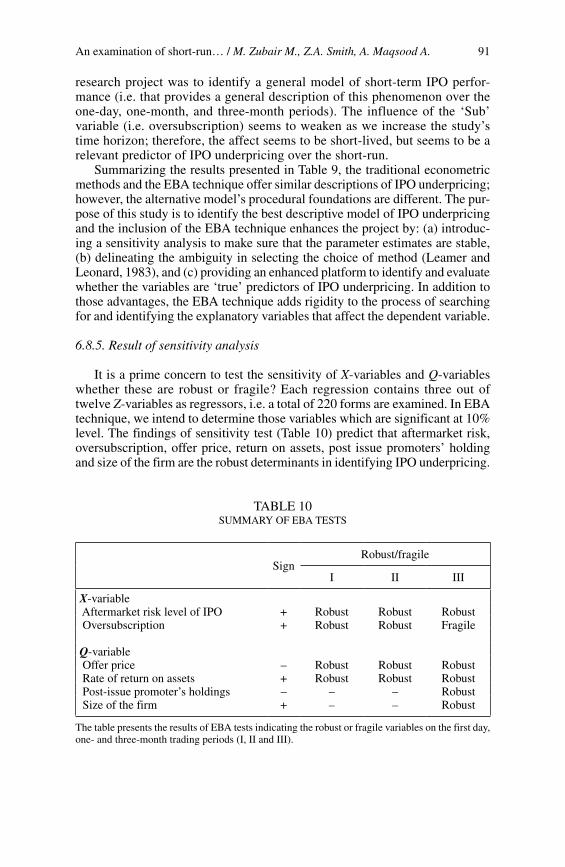
6.8.5. Result of sensitivity analysis
It is a prime concern to test the sensitivity of X-variables and Q-variables whether these are robust or fragile? Each regression contains three out of twelve Z-variables as regressors, i.e. a total of 220 forms are examined. In EBA technique, we intend to determine those variables which are significant at 10% level. The findings of sensitivity test (Table 10) predict that aftermarket risk, oversubscription, offer price, return on assets, post issue promoters’ holding and size of the firm are the robust determinants in identifying IPO underpricing.
TABLE 10SUMMARY OF EBA TESTS
SignRobust/fragile
I II III
X-variable Aftermarket risk level of IPO + Robust Robust Robust Oversubscription + Robust Robust Fragile
Q-variable Offer price – Robust Robust Robust Rate of return on assets + Robust Robust Robust Post-issue promoter’s holdings – – – Robust Size of the firm + – – Robust
The table presents the results of EBA tests indicating the robust or fragile variables on the first day, one- and three-month trading periods (I, II and III).
Estudios de Economía, Vol. 43 - Nº 192
7. Conclusions
This study empirically examines the underpricing of IPOs in Pakistan over the 3-month period beginning on the listing date from 2000 to 2013. The present study provides a comprehensive analysis of the short-run underpricing of IPOs and uses the EBA technique to identify the factors which cause this underpric-ing. Using a sample of 80 IPOs, this study reports that on average IPOs are significantly underpriced. The median underpricing is positive over two-month period after the listing day and trends are the negative over the 3-month period. The Wilcoxon sign test also identifies that the difference in the median values between underpriced and overpriced IPOs are statistically significant. In addi-tion, the value of wealth relative is more than one which indicates that investors have earned abnormal excess returns during the 3-month period. The findings of the study support the investors’ sentiment and underwriters’ prestige hypothesis but do not favor ex-ante uncertainty. The EBA technique identifies that only six factors are robust predictors of IPO underpricing: (1) aftermarket risk illustrates uncertainty associated with the respective IPO which increases the degree of underpricing, (2) higher oversubscription leads to inflate IPO underpricing, (3) the lower the offer price, greater the chance of underpricing, (4) the higher the return on assets prior to the IPO lead investors to perceive that new issues will tend to be underpriced, (5) the greater the proportion of promoters’ holding leads lower underpricing, and (6) as a firm’s size increases, investor’s expectations increase. In nutshell, the EBA is an effective process to analyze the underpricing of IPOs relative to other substitutes for reporting variables because it broadens the search and identifies the most and least favorable outcomes. Hence, this study concludes that Pakistani IPOs show significant signs of underpricing over the sample period. For future research, it is suggested that additional variables are included in the analysis to assess the sensitivity and robustness of explanatory variables over IPO underpricing. Further, the fixed variable(s) may be changed which reflects their importance in determining IPO underpricing.
References
Abubakar, N.B. & Uzaki, K. (2012). “A test of initial public offerings (IPOs) underpricing performance in Malaysian stock exchange”, Paper presented at the Third Asian Business and Management Conference, Osaka, Japan.
Adjasi, C. K. D., Osei, K. A. & Fiawoyife, E. U. (2011). “Explaining underpricing of IPOs in frontier markets: evidence from the Nigeria stock exchange”, Research in International Business and Finance, Vol. 25; 255-265.
Agathee, U. S., Sannassee, R. V. & Brooks, C. (2012). “The underpricing of IPOs on the stock exchange of Mauritius”, Research in International Business and Finance, Vol. 26, No. 2; 281-303.
Akaike, H. (1973). “Information theory and an extension of the maximum likeli-hood principle”, in Petrov B. N. and Csaki F. (eds), Second International Symposium on Information Theory; 267-281. Akademia Kiado, Budapest.
Alagidede, P. & Heerden G. V. (2012). “Short run underpricing of initial public offerings (IPOs) in the Johannesburg Stock Exchange”, Review of Development Finance, Vol. 2; 130-138.
An examination of short-run… / M. Zubair M., Z.A. Smith, A. Maqsood A. 93
Al-Deehani, T. M. (2005). “The determinants of stock prices in Kuwait stock exchange: an extreme bounds analysis”, Investment Management and Financial Innovation, Vol. 3; 16-24.
Alqahtani, F. & More, V. (2012). “Underpricing phenomenon in New Zealand IPO market”, Available from Internet: http://ssrn.com/abstract= 2215402
Banerjee, S., Dai, L. & Shrestha, K. (2011). “Cross-country IPOs: what explain differences in underpricing?”, Journal of Corporate Finance, Vol. 17, No. 5; 1289-1305.
Borges, M.R. (2007). “Underpricing of initial public offerings: the case of Portugal”, International Advances in Economic Research, Vol. 13; 65-80.
Cassia, L., Giudici, G., Paleari, S. & Redondi, R. (2004). “IPO underpricing in Italy”, Applied Financial Economics, Vol. 14; 179-194.
Chambers, D. & E. Dimson (2009). “IPO underpricing over the very long-run”, Journal of Finance, Vol. 64; 1407-1443
Chong, T. T-L., Yuan, S. & Yan, I. K-M. (2010). “An examination of the underpri-cing of H-share IPOs in Hong Kong”, Review of Pacific Basin Financial Markets and Policies, Vol. 13, No. 4; 559-582.
Cooley, T. F. & LeRoy, S. F. (1981). “Identification and estimation of money demand”. American Economic Review, Vol. 71; 825-844.
Davidson, R. & MacKinnon, J.G. (2004). “Econometric Theory and Methods”, Oxford University Press.
Dimovski, W., Philavanh, S. & Brooks, R. (2011). “Underwriter reputation and underpricing: evidence from the Australian IPO market”, Review of Quantitative Financial Accounting, Vol. 37; 409-426.
Falck, F. (2013). “Underpricing of Norwegian IPOs: Empirical testing of selected underpricing theories on the Oslo Stock Exchange from 2003 to 2012”, (Master Thesis). Copenhagen Business School, Denmark.
Ghosh, S. & Yamarik, S. (2004). “Are regional trading arrangements trade crea-ting? An application of extreme bounds analysis”, Journal of International Economics, Vol. 63; 369-395.
Haan, J. & Seldadyo, H. (2006). The determinants of corruption. EPCS confe-rence, Turku, Finland.
Hannan, E. J. & Quinn, B. G. (1979). “The determination of the order of an autoregression”, Journal of the Royal Statistical Association, B Series, Vol. 41; 713-723
Hassan, T. & Quayes, S. (2008). “Underpricing of initial public offerings in Bangladesh”, Applied Financial Economic Letters, Vol. 4; 5-8.
Hendry, David F. (1995). “Dynamic Econometrics”, Oxford. Oxford University Press.Hurrich, C. M. & Tsai, C. L. (1989). “Regression and time series model selection
in small samples”, Biometrika, Vol. 57; 297-307Kayani, S. & Amjad, S. (2011). “Investor interest, underpricing and trading
volume in Pakistan secondary market”, Business and Economic Journal, Vol. 39; 1-15.
Kenourgios, D.F., Papathanasiou, S. & Melas, E. R. (2007). “Initial performance of Greek IPOs, underwriter’s reputation and oversubscription”, Managerial Finance, Vol. 33, No. 5; 332-343.
Kucukkocaoglu G. (2008). “Underpricing in Turkey: a comparison of the IPO methods”, International Research Journal of Finance and Economics, Vol. 13; 162-182.
Estudios de Economía, Vol. 43 - Nº 194
Leamer, E. E. (1978). “Specification search: ad hoc inference from non-expe-rimental data”. Wiley, New York.
Leamer, E. E. (1983). “Let’s take the con out of econometrics”, American Economic Review, Vol. 73; 31-43.
Leamer, E. E. (1985). “Sensitivity analyses would help”, American Economic Review, Vol. 75, No. 3; 308-313.
Leamer, E. E. & Leonard, H. (1983). “Reporting the fragility of regression estimates”, Review of Economics and Statistics, Vol. 65; 307-317.
Levine, R. & Renelt, D. (1992). “A sensitivity analysis of cross-country growth regressions”, American Economic Review, Vol. 82, No. 4; 942-963.
Liu, X. & Ritter, J. R. (2010). “Economic consequences of IPO spinning”, Review of Financial Studies, Vol. 23, No. 5; 2024-2059.
Ljungqvist, A., V. Nanda & R. Singh. (2006). “Hot markets, investor sentiment and IPO pricing”, The Journal of Business. Chicago Press.
Loughran, T., Ritter, J. R. & Rydqvist, K. (1994). “Initial public offerings: international insights”, Pacific-Basin Finance Journal, Vol. 2; 165-199.
Lovell, Michael C. (1983). “Data Mining”, The Review of Economics and Statistics, Vol. 65, No. 1; 1-12.
Lowry, M., Officer, M.S. & Schwert, G. W. (2010). “The variability of IPO initial returns”, The Journal of Finance, Vol. 65, No. 2; 425-465.
McAleer, M., Pagan, A. & Volker, P. A. (1985). “What will take the con out of econometrics?” American Economic Review, Vol. 75; 293-307.
Moosa, I. A. (2009). “The determinants of foreign direct investment in MENA countries: an extreme bounds analysis”, Applied Economic Letters, Vol. 16; 1559-1563.
Moshirian, F., Ng, D. & Wu, E. (2010). “Model specification and IPO perfor-mance: New insights from Asia”, Research in International Business and Finance, Vol. 24; 62-74.
Omran, M., Delgado, F. & Al-Hassan, A. (2010). “The underpricing of IPOs in Gulf cooperation council countries”, Research in International Business and Finance, Vol. 24; 344-360.
Pagan, A. (1987). “Three econometric methodologies: a critical appraisal”, Journal of Economic Survey, Vol. 1; 3-24
Perera, W. & Kulendran, N. (2012). “New evidence of short-run underpricing in Australian IPOs”, Paper presented in Financial Markets and Corporate Governance Conference, January 4, 2012.
Phillips, P.C.B. & P. Perron. (1988), “Testing for a unit root in time series re-gression”, Biometrika, Vol. 75; 335-346
Reilly, F. K. & Hatfield, K. (1969). “Investor experience with new stock issues”, Financial Analysts Journal, 73-80.
Ritter, J. R. (1984). “The ‘hot issue’ market of 1980”, Journal of Business, Vol. 57; 215-240.
Sahoo, S. & Rajib, P. (2010). “Aftermarket pricing performance of initial public offerings: Indian IPO market 2002-2006”, VIKALPA, Vol. 35, No. 4; 27-43.
Sala-i-Martin, X. (1997). “I just ran two million regressions”. American Economic Review, Vol. 87; 178-183
Samarakoon, L. P. (2010). “The short-run underpricing of initial public offerings in the Sri Lankan stock market”, Journal of Multinational Financial Management, Vol. 20; 197-213.
An examination of short-run… / M. Zubair M., Z.A. Smith, A. Maqsood A. 95
Schwarz, G. (1978). “Estimating the dimension of a model”, Annals of Statistics, Vol. 6; 461-464.
Sherman, A. E. & Titman, S. (2002). “Building the IPO order book: underpricing and participation limits with costly information”, Journal of Financial economics, Vol. 65; 3-29.
Sohail, M. K. & Nasr, M. (2007). “Performance of initial public offerings in Pakistan”, International Review of Business Research Papers, Vol. 3, No. 2; 420-441.
Sohail, M. K. & Rehman, A. (2010). “Examining the short-run IPOs performance in stat of economy: normal, boom and recession”, International Research Journal of Finance and Economics, Vol. 35; 173-186.
Stock J. H. & Watson, M. W. (2007). “Introduction to Econometrics” Third edition, Pearson publication.
Tian, Y. (2012). “An examination factors influencing underpricing of IPOs on the London Stock Exchange”. (Master Thesis), Saint Mary’s University, London.
Vreeland, J.M., Lamla, M. J. & Gassebner, M. (2012). “Extreme bounds of democracy”, Journal of Conflict Resolution, Vol. 57, No. 2; 171-197
Wang, E.C. (2010). “Determinants of R&D investment: The extreme bounds analysis approach applied to 26 OECD countries”, Research Policy, Vol. 39; 103-116.
Zouari, S., Boudriga, A. & Boulila, N. (2009). “What determines IPO underpri-cing? Evidence from a frontier market”, Working paper 18069.