Embed Size (px)
Citation preview

JOURNAL OF GEOPHYSICAL RESEARCH, VOL. 97, NO. D16, PAGES 18,035-18,045, NOVEMBER 20, 1992
Stratospheric Minor Constituent Distributions From Far-Infrared Thermal Emission Spectra
MIAN M. ABBAS
Space Science Laboratory, NASA Marshall Space •Iight •enter, Huntsv•le, Alabama
WESt, V.¾ A. TRAUB
Har•ard-$mithsonian Center ]or Astrophysics, Cambridge, Massachus•ts
We retrieve mixing ratio profiles of Os, H:2160, H2170, H:2180, HF, and HC1 from far-infrared thermal emission observations of the limb in the 80-220 cm -1 spectral region. The observations were made with a balloon-borne Fourier transform spectrometer as a part of the 1983 Balloon Intercomparison Campaign (BIC-2). A subset of the data was analyzed previously using the method in the work of •q,aub d a/. [1982, 1991]; in the present paper we use an alternative method of calibration and analysis, given by Abl• et al. [1985]. The retrieved constituent profiles are compared with the measurements made with other instruments on the BIC-2 flights. The results for the concentrations of H217 O and H2180 obtained in this study indicate no isotopic enhancement or depletion with a standard deviation of about 20%.
1. INTRODUCTION
Far-infrared thermal emission spectroscopy provides a powerful tool for studies of stratospheric thermal struc- ture and constituent distributions, via the numerous ro- tational transitions in this spectral region. Stratospheric limb observations of thermal emission spectra having high spectral resolution and high sensitivity can be analyzed to retrieve vertical profiles of temperature and constituent species abundances. Some recent results from far-infrared spectra obtained with high altitude balloon-borne instru- ments include H20, H2170, H21SO, HDO, 16016OlsO, 16OlsO160 [Abbas et al., 1984b, 1985; Carli and Park, 1988; DinelK et al., 1991; Guo et al., 1989; Rindand et al., 1991]; CO [Abbas et al., 1988]; HCH [Abbas et al., 1987b, Carli and Park, 1988]; HF, HC1 [Carli and Park, 1988; Park and Carli, 1991]; O($P)[œin et al., 1987]; HOC1 [Chance et al., 1989]; HO2, OH, H202 [Traub et al., 1990; Chance et al., 1991 a; Park and Carli, 1991]; HBr [Park et al., 1989; Traub et al., 1992].
After the surprising measurements indicating an en- hancement in stratospheric heavy ozone concentrations [e.g., Maursberger, 1981, 1987; Abbas et aL, 1987c; Gold- man et aL, 1989], there has been a considerable amount of interest in observing the isotopic distribution of other con- stituents, in particular of water vapor. Theoretical con- siderations [Kaye, 1987, 1990] indicate a small depletion in the stratospheric H2•SO distribution relative to normal water vapor. Measurements by Dinelli et al. [1991] from far-infrared thermal emission observations and Rindand et
al. [1991] from mid-infrared solar absorption observations showed no enhancements or small depletions indicating agreement with the theoretical predictions. Inconsistent with the two latter investigations the results obtained by
Copyright 1992 by the American Geophysical Union.
Paper number 92JD02083. 0148-0227 / 92/92 J D-02083 $05.00
Guo et al. [1989] showed substantial relative enhancements in the H2•SO concentration.
We report here the results of an analysis which was carried out with two objectives in mind. The first objective is to analyze the existing set of 1983 far-infrared spectra for 03, H20, HF, and HC1 using a method of calibration, angle determination, and analysis which was developed independently from that originally used on a subset of these data. The second objective is to analyze the spectra for H2•70 and H2•80, which has not been done previously, and to compare these results with those of other investigations.
2. OBSERVATIONS
Far-infrared stratospheric limb thermal emission spectra were obtained with a double-beam Fourier transform
spectrometer [Traub et al., 1982, 1991] launched on a balloon flight from Palestine, Texas, on June 23, 1983, as part of the Balloon Intercomparison Campaign (BIC- 2). The spectra analyzed in this paper were obtained between about 1000 and 2200 local time at a float altitude
of about 37 kin. The field of view is a circular beam with
0.3 ø full width at half maximum, which corresponds to a vertical resolution of about 2 km at the limb. The
telescope pointing direction is controlled in azimuth to about 1 ø by the gondola and in elevation by a single- axis stabilization system which employs a gyroscope for short-term reference (gondola sway) and an inclinometer for long-term reference (gondola tilt).
The usable spectral range is about 80 to 220 cm -1, and the unapodized spectral resolution is 0.032 cm-•. A com- plete limb scan sequence comprises spectral observations at seven angles: a black body reference, a high-elevation background scan, and five scans near the limb with tan- gent heights from 21 to 37 km. Three segments of the observed, calibrated, and summed spectra from a complete limb sequence are shown in Figures 1-3. Selected spectral features due to the rotational lines of 03, H21sO, HF, HC1, and 02 are identified.
18,035
18,036 ABBAS AND TRAUB' STRATOSPHERIC MINOR CONSTITUENT DISTRIBUTIONS
2O
• lO o
• 0
? 10 o
o
• lO
- o
• lO
•2 km
03 03 03 03 03 03 A 03 03 , I . , I / k,, I
28 km
24 km
21 km
I I I I I I I I I I i I I I I I I I I I I I I I
24
'•' o 7
ih 0
0
40 t ' ' ' ' I ' ' ' ' I ' ' ' ' I ' ' ' ' ! ' ' ' ' :20 HT -57 k,,, 01 .zo
•o :20• i "2 ø 5R km }12'7ø • Ih 0
'• :20 o
90 91 92 93 94 95
WAVE NUMBER (cm -t)
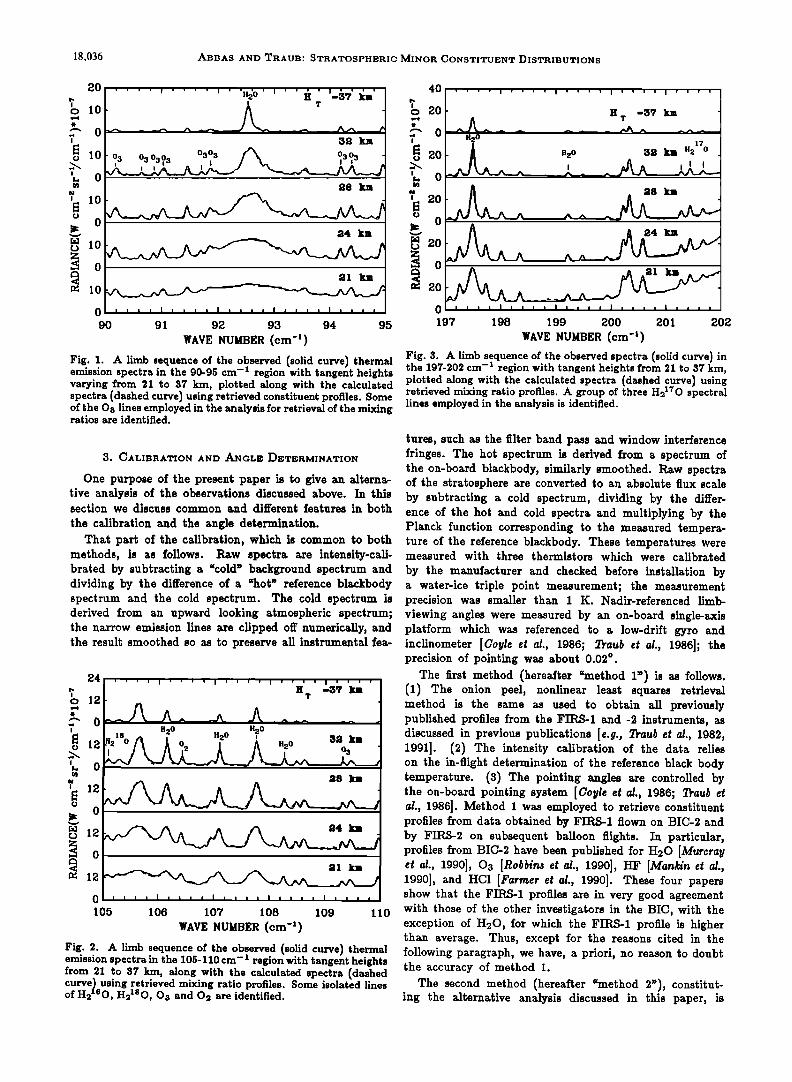
Fig. 1. A limb sequence of the observed (solid curve) thermal Fig. 3. A limb sequence of the observed spectra (solid curve) in emission spectra in the 90-95 cm -1 region with tangent heights the 197-202 cm -1 region with tangent heights from 21 to 37 km, varying from 21 to 37 km, plotted along with the calculated plotted along with the calculated spectra (dashed curve) using
retrieved mixing ratio profiles. A group of three H2170 spectral spectra (dashed curve) using retrieved constituent profiles. Some lines employed in the analysis is identified. of the O3 lines employed in the analysis for retrieval of the mixing
ratios are identified.
tures, such as the filter band pass and window interference 3. CALIBRATION AND ANGLE DETERMINATION fringes. The hot spectrum is derived from a spectrum of
the on-board blackbody, similarly smoothed. Raw spectra One purpose of the present paper is to give an alterna- of the stratosphere are converted to an absolute flux scale
five analysis of the observations discussed above. In this by subtracting a cold spectrum, dividing by the differ- section we discuss common and different features in both ence of the hot and cold spectra and multiplying by the the calibration and the angle determination. Planck function corresponding to the measured tempera-
That part of the calibration, which is common to both ture of the reference blackbody. These temperatures were methods, is as follows. Raw spectra are intensity-call- measured with three thermistors which were calibrated brated by subtracting a %old • background spectrum and by the manufacturer and checked before installation by dividing by the difference of a 'hot • reference blackbody a water-ice triple point measurement; the measurement spectrum and the cold spectrum. The cold spectrum is precision was smaller than 1 K. Nadir-referenced limb- derived from an upward looking atmospheric spectrum; viewing angles were measured by an on-board single-axis the narrow emission lines are clipped off numerically, and platform which was referenced to a low-drift gyro and the result smoothed so as to preserve all instrumental fed- inclinometer [Co•/le et al., 1986; Traub et al., 1986]; the
precision of pointing was about 0.02 ø .
The first method (hereafter 'method 1 •) is as follows. ' ' ' ' I ' ' ' ' I ' ' ' ' I ' ' ' ' I ' ' ' '
H T -57 !m (1) The onion peel, nonlinear least squares retrieval A method is the same as used to obtain all previously • /• • • • •...• _.• published profiles from the FIRS-1 and -2 instruments, as
H20 }!20
,a . o , j discussed in previous publications [e.9., Traub et al., 1982, .a• o/'% I o ',2 A .-o 52 km 1991]. (2) The intensity calibration of the data relies '•/• - --• --•••••••,• on the in-flight determination of the reference black body
[ temperature. (3) The pointing angles are controlled by
0 I I I I ] I I I I I I I I I [ I I I I [ I I I I 197 198 199 200 201 202
WAVE NUMBER (cm -l)
105 106 107 108 109 110 with those of the other investigators in the BIC, with the WAVE NUMBER (cm -l) exception of H20, for which the FIRS-1 profile is higher
than average. Thus, except for the reasons cited in the following paragraph, we have, a priori, no reason to doubt the accuracy of method 1.
The second method (hereafter 'method 2"), constitut- ing the alternative analysis discussed in this paper, is
Fig. 2. A limb sequence of the observed (solid curve) thermal emission spectra in the 105-110 cm -i region with tangent heights from 21 to 37 km, along with the calculated spectra (dashed curve 1 using retrieved mixing ratio profiles. Some isolated lines of H2 eO, H21sO, Os and O2 are identified.
21 km
i I I I I i I i I I . I I I ! I I I I I I I I i
the on-board pointing system [ Covle et al., 1986; Traub et el., 1986]. Method 1 was employed to retrieve constituent profiles from data obtained by FIRS-1 flown on BIC-2 and by FIRS-2 on subsequent balloon flights. In particular, profiles from BIC-2 have been published for H20 [Murcra•/ et al., 1990], 03 [Robbins et al., 1990], HF [Mankin et al., 1990], and HC1 [Farmer et al., 1990]. These four papers show that the FIRS-1 profiles are in very good agreement
ABBAS AND TRAUB: STRATOSPHERIC MINOR CONSTITUENT DISTRIBUTIONS 18,037
as follows. (1) The onion peel, non linear least squares 0.26(0.02), 0.45(0.05), and 0.95(0.20) ø, respectively. Val- inversion technique is the same as that discussed in pre- ues in parentheses are the rms scatter of the three oxygen vious publications [,4•a• et •., 1984a, •, 1985, 1987a, 5, ½, lines used in the calculation. The average shift is 0.40 ø 1988]. (2) The flux intensity scale is calibrated using the downward. (For completeness we note that neither the observed fluxes at the peaks of saturated emission lines. magnitude nor the systematic variation of these angular (3) The pointing angles are obtained from an analysis of offsets can be explained by any known properties of the three observed 02 lines at 83.469, 85.349, and 106.421 pointing platform.)
-1
cm . Chance et al. [1991b] pointed out that the oxygen line The reasoning behind our method 2 adjustment of the broadening coefficients in the AFGL catalog might be
intensity scale is the following. In principle, the intensity represented better by values which were about 20% larger, of any optically thick spectral line should depend only although it was not recommended that this correction be on the atmospheric temperature profile. However, we adopted until more extensive laboratory measurements be found that the observed peak intensities of fully saturated undertaken. To see what effect such a change in the H20 lines, which should reflect atmospheric temperatures broadening parameter might have, we repeated the above in the vicinity of the balloon float height, were slightly calculation with broadening parameters which were 20% smaller than the values calculated with the radiative larger and found the best fit angles to again be shifted in transfer model. In order to match the peak intensities the sense of viewing lower in altitude but now by amounts of the observed and calculated lines the observed spectra 0.04(0.12), 0.10(0.03), 0.17(0.06), 0.21(0.12), 0.56(0.60) ø, were multiplied by a factor of 1.02 to 1.03, depending respectively. Here again the values in parentheses are the on the wavenumber. This implies that the reference rms scatter of the three lines. The average shift is 0.22 ø blackbody is actually about 3 to 4 K warmer than the downward. Clearly, the larger broadening parameters give thermistors indicated. shifts which are about half the nominally required values,
The reasons for employing the pointing angles retrieved which suggests that perhaps the broadening parameters from the observed spectra are two fold. (1) The mixing are indeed too small. However, the increased broadening ratio profile of H20 (and to a much lesser extent 03, HF, parameter still requires that the viewing angles be shifted and HC1) retrieved by employing the nadir angles from by substantial (albeit smaller) amounts; also, the rms method I appeared to be systematically higher than the scatter is larger, indicating poorer overall agreement average of other experiments on the same gondola. (2) between the three oxygen lines. In conclusion, this More striking however, we found that the three observed exercise shows us that (1) the magnitude of the angle 02 lines were poorly matched by the calculated lines correction increases with tangent altitude and (2) part when we used the standard 02 mixing ratio and the of the correction (but not all of it)might be assignable nadir angles from method 1. This discrepancy could to broadening parameter error. In the remainder of this arise partly from errors in the Air Force Geophysics paper we adopt the oxygen-derived angles as determined Laboratory (AFGL)02 line-broadening coefficients, since by the nominal broadening coefficients, to give nadir these parameters are subject to considerable uncertainties angles of 86.00- 0.14 equal to 86.86, etc., and use these [Chance et al., 19915]. The broadening coefficient of the alternative viewing angles to derive mixing ratio profiles 83.469 cm -1 line of 02 at 245 K (I. G. Nolt et al., private for the SAO BIC-2 species, plus two water vapor isotopes. communication, 1990, cited by Chance et al. [19915]) is larger than the AFGL value by about 16%. Experimental 4. ABUNDANCE ANALYSES data on the other two lines employed in the present The radiative transfer model and the analytical tech- analysis are not available. However, errors of the order of niques employed in obtaining the results presented in this the above magnitude in the broadening coefficients are not paper have been discussed in several previous publica- sufficient to explain the mismatch between the observed tions [e.g., Abbas et al., 1984b, 1985, 1987a]. The model is and the calculated 02 lines. based on full layer-by-layer and line-by-line calculations,
Another possibility is that the assumed altitude of the including the Earth's curvature and atmospheric refrac- balloon is in error. We believe that this is unlikely to be a tion effects. The calculated spectra are convolved with significant effect in the present case because, according to a Hamming function having a full width at half maxi- our published error analyses [cf. Murcray et al., 1990; Rob- mum of 0.064 cm -1. The molecular spectral data are bins et al., 1990; Mankin et al., 1990; Farmer et al., 1990] from the AFGL 1986 edition of the trace gas compilation the uncertainty in mixing ratio at any point in the profile HITRAN [Rothrnan et al., 1987], which was updated to is only about 3-4% for H20, O•, HF, or HC1; of the seven accommodate recent data for I-IF and HC1 [K. Chance, other error sources identified in these BIC-2 studies, the private communication, 1991]. The temperature-pressure estimated contribution is either about the same amount profile used in the analysis was obtained from radiosonde (from, for example, pointing uncertainty) or substantially measurements near the balloon path. The spectral lines larger (from pressure-broadening uncertainty). employed are listed in Table 1.
Recognizing the above uncertainties, we proceed nev- In addition to the spectral line contribution of at- ertheless in the spirit of a numerical experiment. The toospheric constituents the radiance calculations include results for the retrieved pointing angles are as follows. pressure-induced N2 absorptions with maximum at about From the lowest to highest viewing angle, initially cot- 90 cm -• and water vapor continuum absorptions through- responding to nadir angles of 86.0, 86.5, 87.2, 88.1, and out the analyzed spectral region. The pressure-induced 91.0 ø, we find the best fit angles to all be revised in the N2-N2 and N2-O2 absorptions were calculated using a sense of viewing lower, by amounts 0.14(0.02), 0.18(0.01), model developed at Goddard Space Flight Center [G.

18,038 ABBAS AND TRAUB' STRATOSPHERIC MINOR CONSTITUENT DISTRIBUTIONS
TABLE 1. Wavenumbers (cm -1) of Analyzed Spectral Lines
O3 H2160 H2ZsO H2170 HCI HF
84.1759
84.2687 84.8324
90.2037 90.6415 90.8682
91.0349 97.7587
102.7913
106.6300 109.3157 112.6753
112.7948 113.5147
113.6321
114.1614
115.3057
122.8439 91.4520 152.7300 130.8519 98.0350 176.6940 152.4981 121.2990 180.7670 155.7379 125.7380 201.2790 158.9109 147.3110 201.4410 160.1753 165.4180 201.6750 178.6202 168.4930 207.7350 198.0182 172.8910 210.8833 200.3660
212.6339 207.1080 214.8745
124.8269 163.9362 145.2225 204.5404 145.4399
186.3896
L. Bjoraker, private communication, 1990]. An empirical model for continuum water vapor absorption in the 80-220 cm -1 spectral region was constructed from the currently available observations and employed in the calculations.
The iterative inversion method employed is a nonlinear least squares fitting technique which proceeds by succes- sively retrieving mixing ratios from the top to the lower levels at tangent heights corresponding to the observa- tion angles. A set of frequencies around suitable spectral lines is chosen for each observation angle such that the weighting functions are narrow and sharply peaked at the tangent heights. The spectral lines employed in the anal- ysis are isolated and have small values of the lower state energy in order to minimize the temperature dependence of the line strength. The effect of a finite field of view on radiative transfer and inversion calculations is negligibly small and is ignored.
5. CONSTITUENT DISTRIBUTIONS
Using the inversion technique discussed above, vertical profiles of O3, H2160, H2•sO, H2•70, HF, and HC1 have been derived. These profiles are compared with (1) those obtained earlier using method 1 calibration on a subset of the present data, (2) those obtained from other data sets but using a method 2 analysis for water isotopes, and (3) those obtained independently by other groups. We expect that there could be real differences between the results of the current analysis and the previously published (method 1) results, owing to the fact that the current data base covers the full flight (11.0 hours of observation, looking both west and north from the balloon), whereas the previous results covered only the designated intercomparison part of the flight (1.5 hours, looking west).
5.1. Ozone
The ozone profile obtained from the 17 lines in Table 1 is shown in Figure 4, and a comparison of the observed and calculated spectra for the ozone line at 114.16 cm -• is shown in Figure 5. The average uncertainty (1 standard deviation) of points in the retrieved profile is' about 16%; this is the quadrature sum of the fitting errors (4 to 10%), pointing errors (6 to 11% of column), and line parameter errors (6% of column).
For comparison we also show the results obtained from other BIC experiments carried out on the same flight [Robbins et ai., 1990]: Atmospheric Environment Service (AES) in situ electrochemical cell sondes experiment; National Physical Laboratory (NPL) mid-infrared atmos- pheric emission grating spectrometer; and Office National d'Etudes et de Recherches Aerospatial (ONERA) infrared grille absorption spectrometer. The present profile is in general agreement with these other profiles.
Comparing the profiles from this work and the original analysis (Smithsonian Astrophysical Observatory, SAO)
5o
4o
3o
2o
10
10 -7
i i i i i i i i [
ß This Work (BIC 2) ß SAO (SIC 2) • AES (BIC 2) o 0NERA (SIC 2)
NPL (SIC 2 )
i i i i I I ii I i i i
I I I I I I Ill I I I I I IIII I I
10-s 10 -5
MIXING RATIO
i i i i I
_
_
i
_
_
_
_
l
_
l
_
l
_
--
_
_
_
l
I I I III
10 -•
Fig. 4. The 08 profile retrieved from the 1983 Balloon Intercomparison Campaign (BIC-2) far-infrared data analyzed in this work. Also shown for comparison are the results obtained by other BIC-2 experiments on the June 20, 1983, balloon fight: National Physical Laboratory (NPL), Office National d'Etudes et de Recherches Aerospatial (ONERA), Atmospheric Environment Service (AES), and Smithsonian Astrophysical Observatory (SAO) with the original (method 1) analysis.
ABBAS AND TRAUB' STRATOSPHERIC MINOR CONSTITUENT DISTRIBUTIONS 18,039
12
• 10
o
o
114.1o
0 3
_ _ _
I I I i
114.•4
WAVE NUMBER (cm -s)
Fig. 5. Comparison of the observed and synthetic 03 line at 114.16 cm -z for a limb sequence of five angles with tangent heights at 21, 24, 28, 32, and 37 km with increasing radiance for lower altitudes.
we see that the present profile yields smaller mixing ratios at high altitudes and larger mixing ratios at low altitudes. This may be a reflection of the corresponding O2 curves, which have qualitatively similar shifts. Quantitatively, as noted by Robbins et al. [1990], the original analysis of SAO data gave a curve which differed from the BIC-2 weighted mean value (derived from seven experiments on two days) by about +4% offset, with an rms scatter of 12%. By coincidence, the results of the present analysis deviate by essentially identical amounts. Thus, on balance, although the present analysis clearly yields an ozone profile which is weaker at high altitude and stronger at low altitude than the original analysis, there still is no significant difference in shift or rms with respect between either of these profiles and the BIC-2 %tandard"ozone profile.
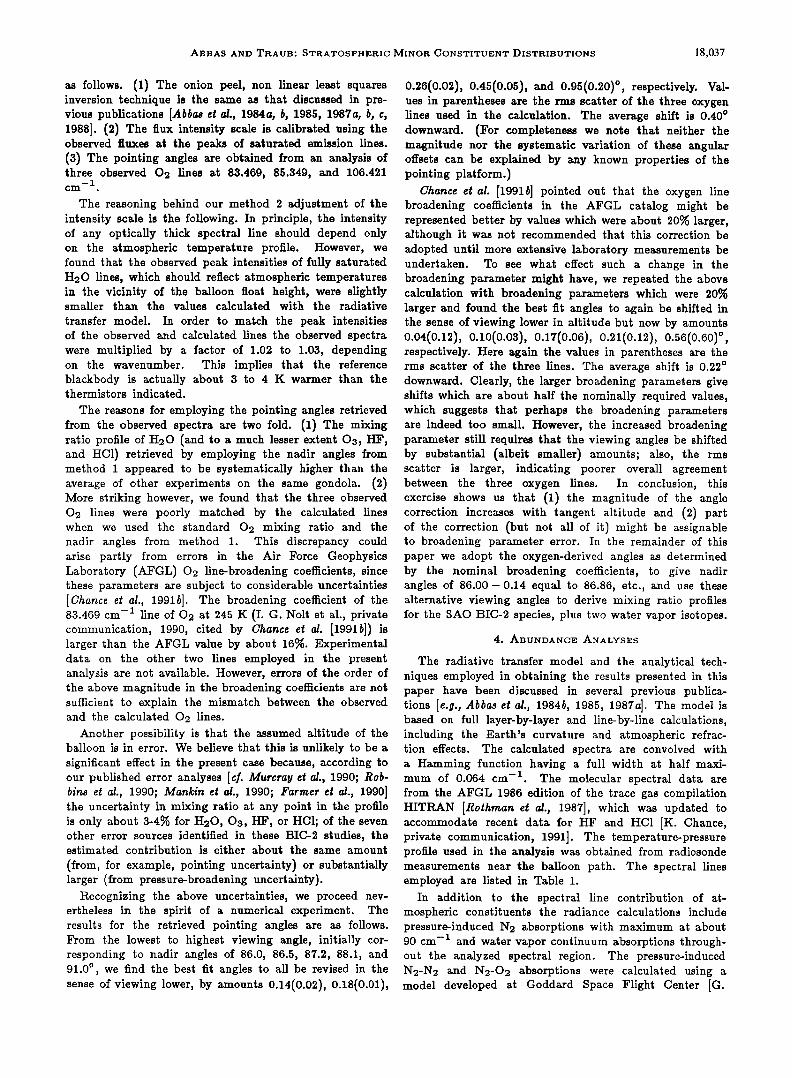
5.•. Water Vavor (H2 •6 O) The vertical profile for H2160 retrieved from the 11
lines in Table 1 is shown in Figure 6. The average standard deviation is about 15%, calculated in the same way as for ozone, above. Also shown for comparison in Figure 6 are the measurements made by other groups in the BIC-2 campaign [Murcray et al., 1990]: AES, atmospheric emission measurements in ascent in the 6.3- /•m region; Denver University (DU), infrared emission measurements in the 25 to 26-/•m region; NPL, mid- infrared emission measurements in the 1339-1350 cm -• region; and SAO. The measurements by AES, •L, and SAO were made on the balloon flight on June 20, 1983, while the DU measurements were made three days earlier on June 17.
The present profile for H2•60 is lower than that of the original SAO analysis, dropping from an average of roughly 5 parts per million by volume (ppmv) to 3.5 ppmv. Part of this drop is attributable to the different methods of analysis and part is likely due to the fact that the lines used in the original analysis were highly saturated, so the results were quite sensitive to both the intensity scale factor and the broadening coe•cients. The present profile clearly falls well within the range of water profiles menured by the other BIC-2 experiments in Fi•re 6, instead of being well above the range as was the case from the original analysis. (But, of course, this does not insure that the result is correct, because the other measurements shown have considerable sca•ter themselves.
Indeed, on a climatological basis, one might expect to see a monotonic increase with height, from about 3.5 ppmv near 20 km to about 4.8 ppmv near 40 kin, which does not match any of the cu•es shown in Figure 6.)
A comparison of the obse•ed (solid cu•e) and syn- thetic (dashed cu•es) spectra for a typical line of H2160 is shown in Figure 7, indicating a good fit of the peak intensities, the continuum, and the line shapes.
5O
4O
3O
2O
This Work (BIC 2) ^ES (B•c 2) DU BIC 2) NPL (BIC 2) SAO (BIC 2) • •
a 0
0 ¸
¸
.. t A .....
,
ß
A
H20
10 , I , I • I , I I I , I , I , 0 1 2 3 4 5 6 7 8
MIXING RATIO
Fig. 6. The H20 profile retrieved from the BIC-2 far-infrared data analyzed in this work. Also shown for comparison are the results obtained by other BIC-2 experiments on the June 20, 1983 balloon fight' AES, NPL, and SAO with an alternative analysis. The Denver University (DU) measurements were made on June 17, 1983.

18,040 ABBAS AND TRAUB' STRATOSPHERIC MINOR CONSTITUENT DISTRIBUTIONS
2O
? lO
o
155.6o
- I I I I I I I I ,
155.70 155.80 155.90
WAVE NUMBER (cm -•)
Fig. 7. Comparison of an observed and synthetic (dashed curve) H20 line at 155.74 cm -1 analyzed in this work for a limb sequence of five angles with tangent heights at 21, 24, 28, 32, and 37 km with increasing radiance for lower altitudes.
5.$. It21S o The present retrieval of H3ZSO is based on 10 spec.
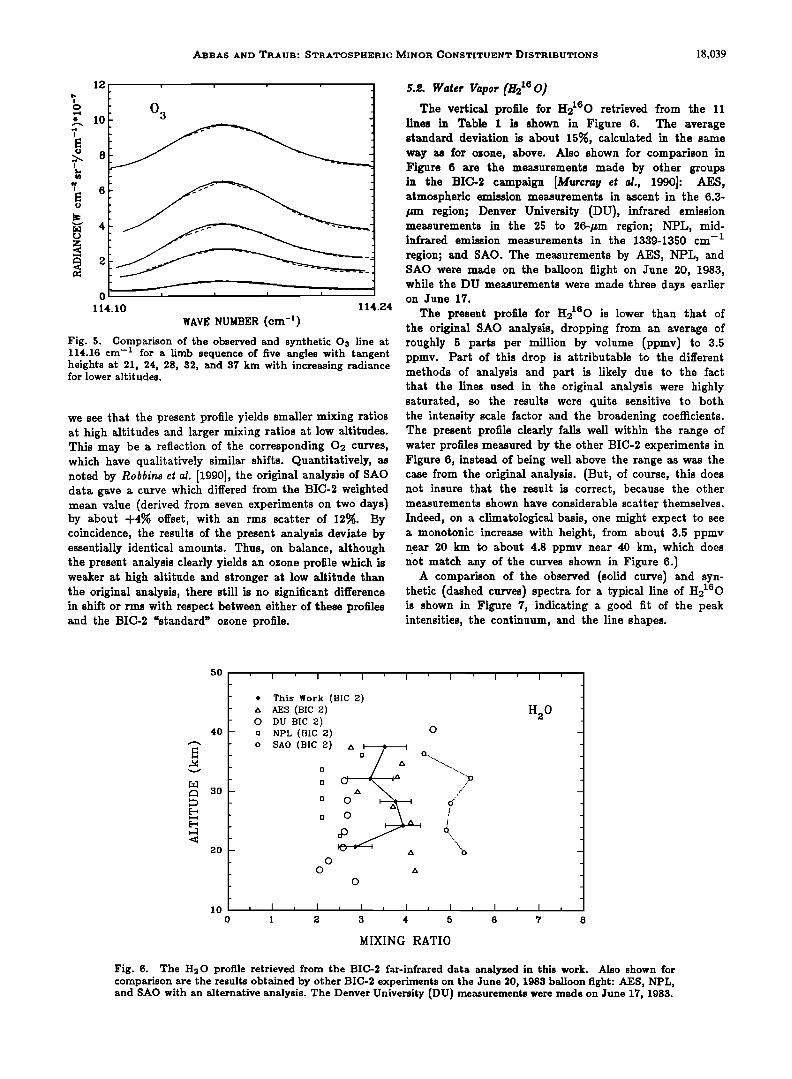
tral lines identified in Table 1. The derived profile, witt, the mixing ratios normalized to their natural abundances in accordance with the HITP•N data base, is shown in Figure 8. The error bars represent the total standard de- viation of the measurement, calculated as the quadrature sum of the random and systematic errors. Also shown on the same figure is the simultaneously measured H2160 mixing ratio profile (circles) discussed just above. Figure 9 shows a comparison of the observed (solid curve) and the synthetic spectra (dashed curve), indicating a good fit of some lines employed in the analysis.
In Figure 8 we see that the H3ZSO and H3z60 profiles
are almost identical. No enhancement or depletion of the heavier isotope is seen. The ratio of the two profiles is essentially unity, with an average standard deviation of the ratio of about 20%. This result is in
good agreement with two previous findings: Rinsland et a/. [1991], from an analysis of the ATMOS Spacelab 3 infrared solar absorption spectra in the 1414 to 1690 cm -1 region, and Dinelli et al. [1991], from balloon-borne far-infrared observations in the 46 to 72 cm -• made on a flight on October 5, 1982, during BIC-1. Both of the above referenced studies reported small depletions or no enhancements in the stratospheric H2•SO profile relative to the simultaneously measured H•60 profile. The result of no enhancement or a small depletion in stratospheric
5O
4O
• 30 • - • - • -
•.• - .< _
20_
-
-
-
-
lO o
' I ' I ' I ' I ' I ' I ' I '
ß H2180 (BIC 2) o H2160 (BIC 2)
ii i
II i•1 l_ I 11 I [ I•'"' •111 I
J J c .,,,., ,
H2180
1 2 3 4 5 6 7
MIXING RATIO (ppmv) Fig. 8. The H21so mixing ratio profile retrieved from the BIC-2 far-infrared data analyzed in this work, normalized by the standard isotope ratio as given by the HITRAN data base. Also shown for comparison is the normal H2160 profile retrieved in this work (from Figure 6).
ABBAS AND TRAUB: STRATOSPHERIO MINOR OONSTITUENT DISTRIBUTIONS 18,041
4O ' ' ' ' I ' ' ' ' I ' ! ' ' I ' ' ' '
' H2•80 ,, ? 20
0
206.9 207.0 207.1 207.2 207.3
WAVE NUMBER (em -•)
Fig. 9. Comparison of an observed and synthetic (dashed curve) H3•sO line at 207.11 cm -• analyzed in this work for a limb sequence of five angles with tangent heights at 21, 24, 28, 32, and 3? km with increasing radiance for lower altitudes.
heavy isotopic water vapor is consistent with theoretical considerations [Kaye, 1990].
The enigmatic results presented by Guo et al. [1989], in- dicating significant enhancements in the H21sO concentra- tions, are therefore inconsistent with three studies' Dinelli • •. [•], •rom •e •me a• •e•; ni•• • •. [•1, from a different data set; and the present study.
The reason for the discrepancy in the result obtained by Guo et aL [1989] is not clear. It may be noted that the water vapor mixing ratios obtained by Rinsland et al. [1991] are generally higher by about 35-40% than those obtained by DineIll et al. [1991] from a different data set. The H:•160 profile obtained by Guo et al. [1989]
is almost identical to the profile obtained independently by DineIIi ei al. [1991] from the same data set with a different retrieval method (see Figure 3 of Dinelli et al.). Also, the I-I•lSo absolute mixing ratio profiles of Guo ei al. [1989] and of Rinsland et •1.1•1991] generally overlap within the error bars. The H• O profile of the latter reference, however, is 35-40% higher over most of the altitude range.
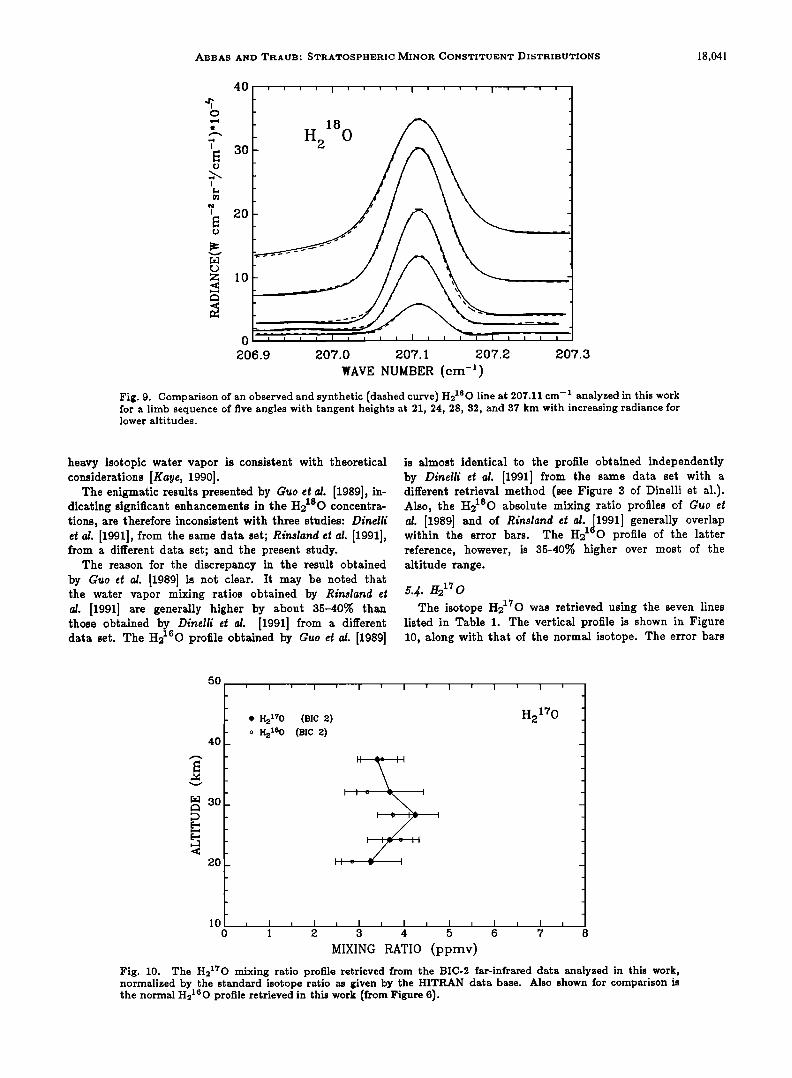
5.g. H•x • O The isotope H2170 was retrieved using the seven lines
listed in Table 1. The vertical profile is shown in Figure 10, along with that of the normal isotope. The error bars
5O
4O
30 - - _
- _
20_ -
-
-
-
lO o
' I ' I ' 1 ' I
ß H•.I?o (BIC 2) o H•.180 (BIC 2)
' I ' I ' I '
H2170
I I I I I I I I I I t 3 4 5 6 7 8
MIXING RATIO (ppmv)
Fig. 10. The H2170 mixing ratio profile retrieved from the BIC-2 far-infrared data analyzed in this work, normalized by the standard isotope ratio as given by the HITRAN data base. Also shown for comparison is the normal H2160 profile retrieved in this work (from Figure 6).
18,042 ABBAS AND TRAUB: STRATOSPHERIC MINOR CONSTITUENT DISTRIBUTIONS
4O
• I ' I " I ' I ' I " I ' I ' 7 30 •
? •0
z lO
o
201.1 201.2 201.3 201.4 201.5 201.6 201.7 201.8
WAVE NUMBER (em-')
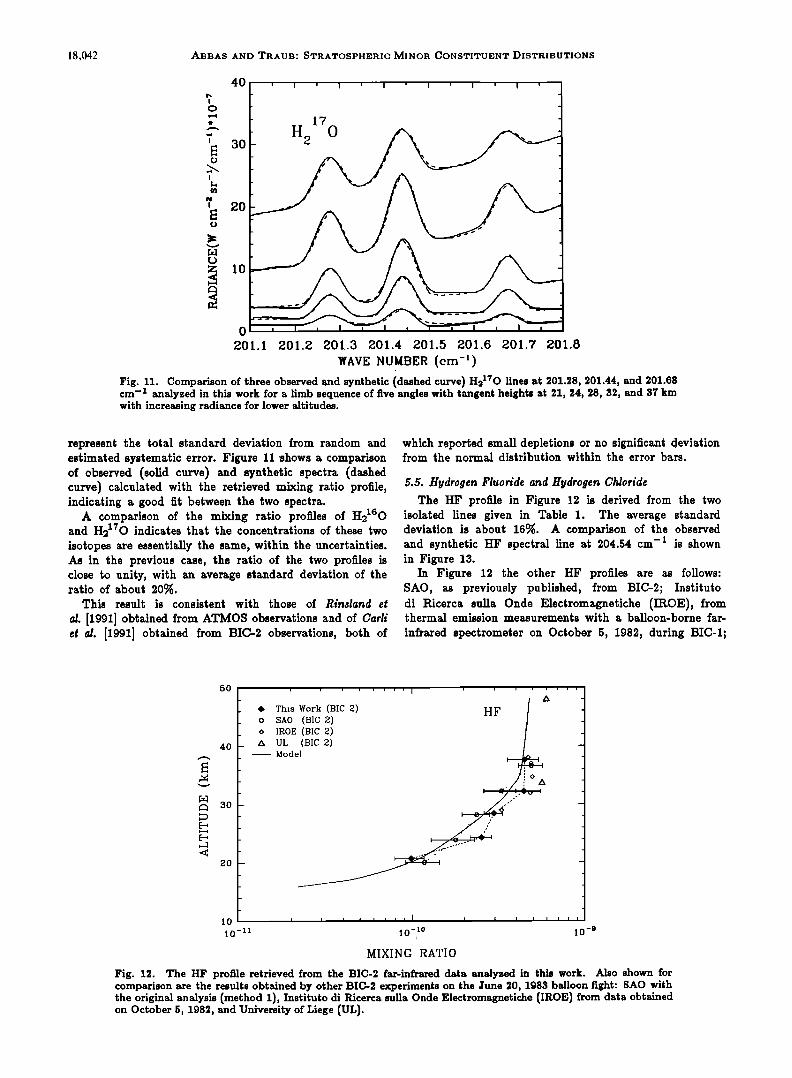
Fig. 11. Comparison of three observed and synthetic (dashed curve) H2170 lines at 201.28, 201.44, and 201.68 cm- 1 analyzed in this work for a limb sequence of five angles with tangent heights at 21, 24, 28, 32, and 37 km with increasing radiance for lower altitudes.
represent the total standard deviation from random and estimated systematic error. Figure 11 shows a comparison of observed (solid curve) and synthetic spectra (dashed curve) calculated with the retrieved mixing ratio profile, indicating a good fit between the two spectra.
A comparison of the mixing ratio profiles of H2160 and H2170 indicates that the concentrations of these two isotopes are essentially the same, within the uncertainties. As in the previous case, the ratio of the two profiles is close to unity, with an average standard deviation of the ratio of about 20%.
This result is consistent with those of Rinsland et
a/. [1991] obtained from ATMOS observations and of Carli et al. [1991] obtained from BIC-2 observations, both of
which reported small depletions or no significant deviation from the normal distribution within the error bars.
5.5. Hydrogen Fluoride and Hydrogen Chloride The HF profile in Figure 12 is derived from the two
isolated lines given in Table 1. The average standard deviation is about 16%. A comparison of the observed and synthetic HF spectral line at 204.54 cm -x is shown in Figure 13.
In Figure 12 the other HF profiles are as follows: SAO, as previously published, from BIC-2; Instituto di Ricerca sulla Onde Electromagnetiche (IROE), from thermal emission measurements with a balloon-borne far-
infrared spectrometer on October 5, 1982, during BIC-1;
5O
4O
3O
2O
This Work (BIC 2) SA0 (SIC 2) IROE (BIC 2) UL (BIC 2) Model
i i , i I
10
10-11
i I i I i i i i
HF
_
_
ß
ß
!
I I I I I I I I ,I I I I I I t I l
10-10 10 -9
MIXING RATIO
Fig. 12. The HF profile retrieved from the BIC-2 far-infrared data analyzed in this work. Also shown for comparison are the results obtained by other BIC-2 experiments on the June 20, 1983 balloon fight: SAO with the original analysis (method 1), Instituto di Ricerca sulla Onde Electromagnetiche (IROE) from data obtained on October $, 1982, and University of Liege (UL).
ABBAS AND TRAUB: STRATOSPHERIC MINOR CONSTITUENT DISTRIBUTIONS 18,043
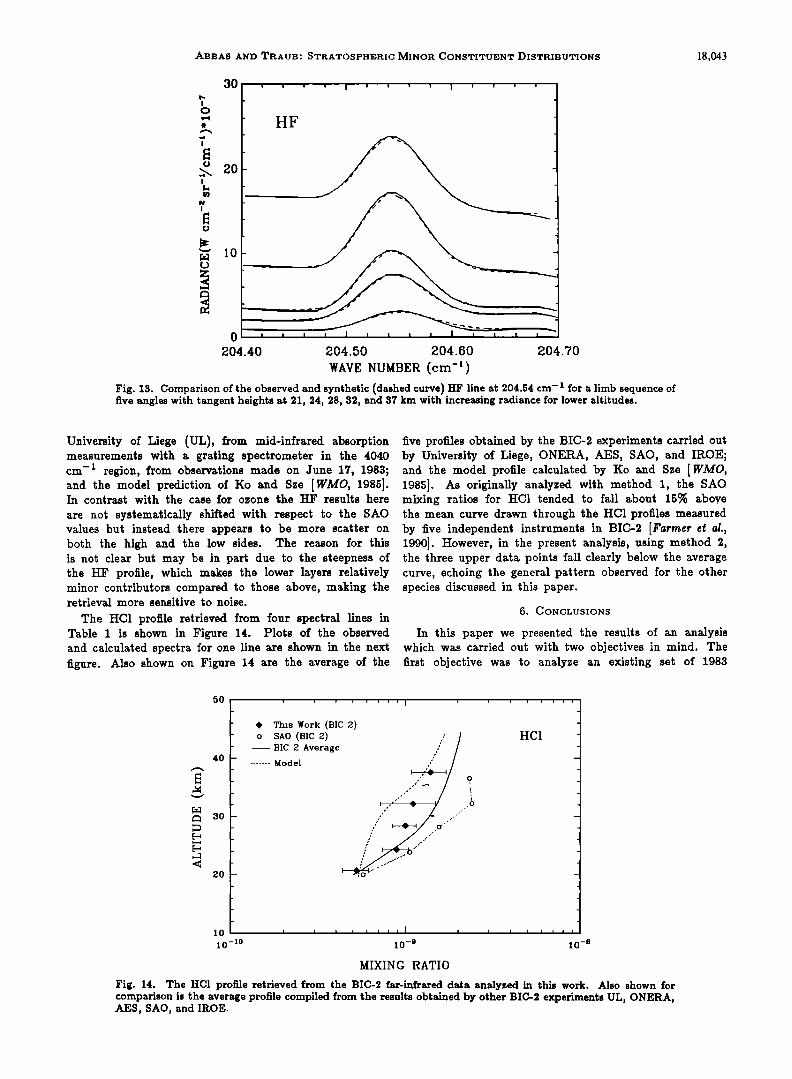
0 , , J i I 204.40 204.50 204.60 204.70
WAVE NUMBER (cm -t) Fig. 13. Comparison of the observed and synthetic (dashed curve) HF line at 204.54 cm-1 for a limb sequence of five angles with tangent heights at 21, 24, 28, 32, and 37 km with increasing radiance for lower altitudes.
University of Liege (UL), from mid-infrared absorption five profiles obtained by the BIC-2 experiments carried out measurements with a grating spectrometer in the 4040 by University of Liege, ONERA, AES, SAO, and IROE; cm -1 region, from observations made on June 17, 1983; and the model profile calculated by Ko and Sze [WMO, and the model prediction of Ko and Sze [WMO, 1985]. 1985]. As originally analyzed with method 1, the SAO In contrast with the case for ozone the HF results here mixing ratios for HC1 tended to fall about 15% above are not systematically shifted with respect to the SAO the mean curve drawn through the HC1 profiles measured values but instead there appears to be more scatter on by five independent instruments in BIC-2 [Farmer et sl., both the high and the low sides. The reason for this 1990]. However, in the present analysis, using method 2, is not clear but may be in part due to the steepness of the three upper data points fall clearly below the average the HF profile, which makes the lower layers relatively curve, echoing the general pattern observed for the other minor contributors compared to those above, making the species discussed in this paper. retrieval more sensitive to noise.
The HC1 profile retrieved from four spectral lines in 6. CONCLUSIONS Table 1 is shown in Figure 14. Plots of the observed In this paper we presented the results of an analysis and calculated spectra for one line are shown in the next which was carried out with two objectives in mind. The figure. Also shown on Figure 14 are the average of the first objective was to analyze an existing set of 1983
5O
40 -
iz• 30 -
20 -
lo
10-lo
! i ! i ! ! ! ! { ! i ! i i i i 1
o SAO (sic •) -- BIC 2 Average
....... Model
This Work (BIC 2) HC1
I I I I t I I I [ I I I I I I I I
10-s 10-a
MIXING RATIO
Fig. 14. The HCI profile retrieved from the BIC-•. far-infrared data analyzed in this work. Also shown for comparison is the average profile compiled from the results obtained by other BIC-3 experiments UL, ONERA, AES, SAO, and IROE.
18,044 ABBAS AND TRAUB' STRATOSPHERIC MINOR CONSTITUENT DISTRIBUTIONS
lO
0 I I I
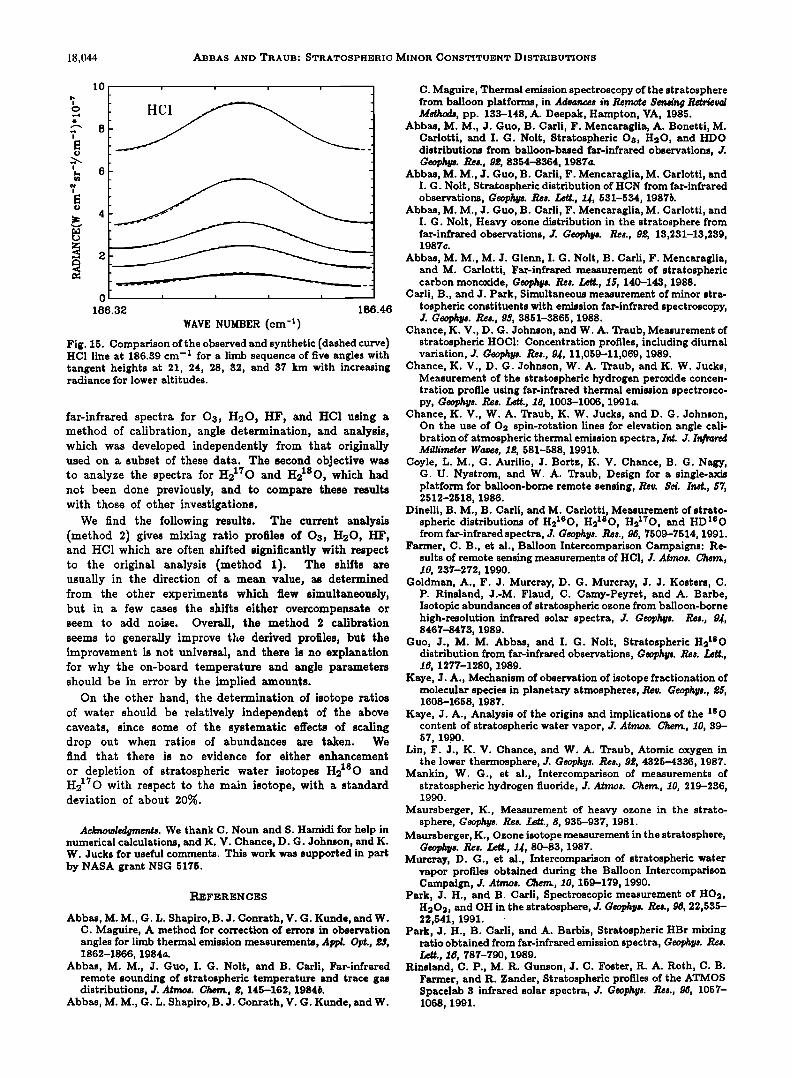
186.32 ! 86.46
WAVE NUMBER (cm -•)
Fig. 15. Comparison of the observed and synthetic (dashed curve) HC1 line at 186.39 cm -1 for a limb sequence of five angles with tangent heights at 21, 24, 28, 32, and 37 km with increasing radiance for lower altitudes.
far-infrared spectra for O$, H20, HF, and HC1 using a method of calibration, angle determination, and analysis, which was developed independently from that originally used on a subset of these data. The second objective was to analyze the spectra for H2170 and H•lSo, which had not been done previously, and to compare these results with those of other investigations.
We find the following results. The current analysis (method 2) gives mixing ratio profiles of O$, H20, HF, and HC1 which are often shifted significantly with respect to the original analysis (method 1). The shifts are usually in the direction of a mean value, as determined from the other experiments which flew simultaneously, but in a few cases the shifts either overcompensate or seem to add noise. Overall, the method 2 calibration seems to generally improve the derived profiles, but the improvement is not universal, and there is no explanation for why the on-board temperature and angle parameters should be in error by the implied amounts.
On the other hand, the determination of isotope ratios of water should be relatively independent of the above caveats, since some of the systematic effects of scaling drop out when ratios of abundances are taken. We find that there is no evidence for either enhancement
or depletion of stratospheric water isotopes H21sO and H•70 with respect to the main isotope, with a standard deviation of about 20%.
Aekr&owledgrneats. We thank C. Noun and S. Hamidi for help in numerical calculations, and K. V. Chance, D. G. Johnson, and K. W. Jucks for useful comments. This work was supported in part by NASA grant NSG 5175.
P,•EFEl%EN CES
Abbas, M. M., G. L. Shapiro, B. J. ConraSh, V. G. Kunde, and W. C. Maguire, A method for correction of errors in observation angles for limb thermal emission measurements, Appl. Opt., œ$, 1862-1866, 1984a.
Abbas, M. M., J. Guo, I. G. Nolt, and B. Carli, Far-infrared remote sounding of stratospheric temperature and trace gas distributions, J. Atmos. Gherr•, œ, 145-162, 1984b.
Abbas, M. M., G. L. Shapiro, B. J. ConraSh, V. G. Kunde, and W.
C. Maguire, Thermal emission spectroscopy of the stratosphere from balloon platforms, in Adva,•es in/•mote $e,M-4 Retrieval M•, pp. 133-148, A. Deepak, Hampton, ¾A, 1985.
Abbas, M. M., J. Guo, B. Carli, F. Mencaraglia, A. Bonetti, M. Carlotti, and I. G. Nolt, Stratospheric Os, H20, and HDO distributions from balloon-based far-infrared observations, J. Geoph•ts. Res., 9œ, 8354-8364, 1987a.
Abbas, M. M., J. Guo, B. Carli, F. Mencaraglia, M. Carlotti, and I. G. Nolt, Stratospheric distribution of HCN from far-infrared observations, Geophtls. Res. Left., lg, 531-534, 1987b.
Abbas, M. M., J. Guo, B. Carli, F. Mencaraglia, M. Carlotti, and I. G. Nolt, Heavy ozone distribution in the stratosphere from far-infrared observations, J. Geophys. Res., 9œ, 13,231-13,239, 1987½.
Abbas, M. M., M. J. Glenn, I. G. Nolt, B. Carli, F. Mencaraglia, and M. Carlotti, Far-infrared measurement of stratospheric carbon monoxide, Geophys. Res. I. ett., 15, 140-143, 1988.
Carli, B., and J. Park, Simultaneous measurement of minor stra- tospheric constituents with emission far-infrared spectroscopy, J. Geophlls. Res., 93, 3851-3865, 1988.
Chance, K. V., D. G. Johnson, and W. A. Traub, Measurement of stratospheric HOCh Concentration profiles, including diurnal variation, J. Geophlts. Res., 94, 11,059-11,069, 1989.
Chance, K. V., D. G. Johnson, W. A. Traub, and K. W. Jucks, Measurement of the stratospheric hydrogen peroxide concen- tration profile using far-infrared thermal emission spectrosco- py, Geophys. Res. Left., 18, 1003-1006, 1991a.
Chance, K. V., W. A. Traub, K. W. Jucks, and D. G. Johnson, On the use of 02 spin-rotation lines for elevation angle cali- bration of atmospheric thermal emission spectra, lat. J. Infrared Millimeter Waves, 1œ, 581-588, 1991b.
Coyle, L. M., G. Aurilio, J. Bortz, K. V. Chance, B. G. Nagy, G. U. Nystrom, and W. A. Traub, Design for a single-axis platform for balloon-borne remote sensing, Rev. $d. Inst., 57, 2512-2518, 1986.
Dinelli, B. M., B. Carli, and M. Carlotti, Measurement of strato- spheric distributions of H2160, H21sO, H2170, and HD160 from far-infraredspectra, J. Geophlts. Res., 96, 7509-7514, 1991.
Farmer, C. B., et al., Balloon Intercomparison Campaigns: Re- sults of remote sensing measurements of HC1, J. Atrnos. Cherry, 10, 237-272, 1990.
Goldman, A., F. J. Murcray, D. G. Murcray, J. J. Kosters, C. P. Rinsland, J.-M. Flaud, C. Camy-Peyret, and A. Barbe, Isotopic abundances of stratospheric ozone from balloon-borne high-resolution infrared solar spectra, J. Geophys. Res., 9J, 8467-8473, 1989.
Guo, J., M. M. Abbas, and I. G. Nolt, Stratospheric H21sO distribution from far-infrared observations, Geophys. Res. Left., 16, 1277-1280, 1989.
Kaye, J. A., Mechanism of observation of isotope fractionation of molecular species in planetary atmospheres, Rev. Geophlts., œ5, 1608-1658, 1987.
Kaye, J. A., Analysis of the origins and implications of the •SO content of stratospheric water vapor, J. Atmos. C'herr•, 10, 39- 57, 1990.
Lin, F. J., K. V. Chance, and W. A. Traub, Atomic oxygen in the lower thermosphere, J. Geophlls. Res., 9œ, 4325-4336, 1987.
Mankin, W. G., et al., Intercomparison of measurements of stratospheric hydrogen fluoride, J. Atrnos. Chern., 10, 219-236, 1990.
Maursberger, K., Measurement of heavy ozone in the strato- sphere, Geophlls. Res. Left., 8, 935-937, 1981.
Maursberger, K., Ozone isotope measurement in the stratosphere, Geophys. Res. Left., lJ, 80-83, 1987.
Murcray, D. G., et al., Intercomparison of stratospheric water vapor profiles obtained during the Balloon Intercomparison Campaign, J. Atrnos. Cherry, 10, 159-179, 1990.
Park, J. H., and B. Carli, Spectroscopic measurement of HO2, H202, and OH in the stratosphere, J. Geophlls. Res., 96, 22,535- 22,541, 1991.
Park, J. H., B. Carli, and A. Barbis, Stratospheric HBr mixing ratio obtained from far-infrared emission spectra, Geophys. Res. Left., 16, 787-790, 1989.
Rinsland, C. P., M. R. Gunson, J. C. Foster, R. A. Roth, C. B. Farmer, and R. Zander, Stratospheric profiles of the ATMOS Spacelab 3 infrared solar spectra, J. Geophlts. Res., 9i;, 1057- 1068, 1991.
ABBAS AND TRAUB: STRATOSPHERIC MINOR CONSTITUENT DISTRIBUTIONS 18,045
Robbins, D., et al., Ozone measurements during the Balloon Intercomparison Campaign, Y. Armor. C•em., 10, 181-218, 1990.
Rothman, L. S., et al., The HITRAN database: 1986 edition, .4pl•l. Opt., •6, 4058-4097, 1987.
Traub, W. A., K. V. Chance, J. C. Brasunas, J. M. Vrtilek, and N. P. Carleton, Use of a Fourier transform spectrometer on balloon-borne telescope and at the Multiple Mirror Telescope (MMT), Pr•. $•. Photo O•t. E•., $$i, 208-218, 1982.
Traub, W. A., L. M. Coyle, and K. V. Chance, Performance of a single-axis platform for balloon-borne remote sensing, Rev. I•t., •7, 2519-2522, 1986.
Traub, W. A., D. G. Johnson, and K. V. Chance, Stratospheric hydroperoxyl measurements, $½•½•, œ•7, 446-449, 1990.
Traub, W. A., K. V. Chance, D. G. Johnson, and K. W. Jucks, Stratos•heric spectroscopy with the far-infrared spectrometer
(FIRS-•)' Overview and recent results, Proc. $oc. Photo Opt. Eng., 1491, 298-307, 1991.
Traub, W. A., D. G. Johnson, K. W. Jucks, and K. V. Chance, Upper limit for stratospheric HBr using far-infrared thermal emission spectroscopy, Geophil. Re•. Left., 19, 1651-1654, 1992.
World Meteorological Organization, Atmospheric ozone, WMO Rep. 16, p. 628, 1985.
M. M. Abbas, Mail Stop ES 55, Space Science Laboratory, NASA Marshall Space Flight Center, Huntsville, AL 35812.
W. A. Traub, Harvard-Smithsonian Center for Astrophysics, 60 Garden St., Cambridge, MA 02138.
(Received March 16, 1992; revised September 1, 1992;
accepted September 1, 1992.)


