Embed Size (px)
Citation preview

1 IntroductionThe perception of motion transparency can arise from physically transparent objects,such as windows or shadows, or from non-contiguously occluded objects, such as leavesor fences. In these cases, transparency is not indicated by the light reaching the eyefrom any one location in visual space, but rather by the pattern of light intensities acrossa wide area (Metelli 1974). Motion transparency provides a case that is incompatiblewith single-velocity-field mechanisms (Braddick and Qian 2001). A common feature ofnatural transparent scenes is that the two overlapping objects do not exist at the sameplace in three-dimensional space, but are generally separated in depth. Thus, depthseparation may provide an additional solution to interpreting moving transparentscenes; if the visual system is able to separate the motion components into differentdepth planes, it may be able to recognize that they arise from different objects.
A number of psychophysical researchers have investigated motion transparency(Clifford et al 2004), and have shown that human observers are able to see multipletransparent-motion components (Stoner et al 1990), even without a depth separation.However, detection thresholds for transparency are higher than thresholds for coher-ent motion (one direction) (Hibbard and Bradshaw 1999). This suggests that independentmotion detectors are required to detect each component of the transparent motion.When a disparity difference is applied to the two directions of motion, this performancepenalty is removed, and subjects are able to detect transparency as easily as coherentmotion, perhaps through scene segmentation. This effect of disparity is observed withonly a few minutes of arc of disparity, but also appears to reverse soon after, causingthresholds to rise again after about 4 min of arc of disparity. Similarly, adding a dispar-ity difference between two perpendicularly moving gratings favors the perception oftransparent over coherent motion (Farell and Li 2004). Another recent study showedthat a unidirectional motion aftereffect is seen after adapting to transparent motions,and provides evidence for two temporal channels (Alais et al 2005).
Stereo motion transparency processing implementsan ecological smoothness constraint
Perception, 2006, volume 35, pages 1219 ^ 1232
Finnegan J Calabro, Lucia M VainaôBrain and Vision Research Laboratory, Department of Biomedical Engineering, Boston University,44 Cummington Street, Boston, MA 02215, USA; ô also Department of Neurology, Harvard MedicalSchool, 75 Francis Street, Boston, MA 02215, USA; e-mail: [email protected], [email protected] 28 January 2005, in revised form 19 September 2005; published online 26 July 2006
Abstract. Transparent motion stimuli allow us to investigate how visual motion is processed inthe presence of multiple sources of information. We used stereo random-dot kinematograms todetermine how motion processing is affected by the difference in direction and depth of twooverlapping motion components. Observers judged whether a noise dot display contained one ortwo directions of motion. For all disparity differences, performance did not change among anglesgreater than 608, but the ability to detect transparent motion fell dramatically as the directiondifference decreased below 608. When a disparity difference was added between the two motioncomponents, detection became easier. We compared these results to an ideal-observer modellimited by stimulus uncertainty and low-level sources of internal noise. The resulting measure ofefficiencyöthe ratio of human to model performanceöreflects changes in how motion stimuliare being processed. A decrease of both the direction and disparity differences had the effect ofdecreasing efficiency. These results suggest that the mechanism processing transparent motion mayimplement a smoothness constraint that tends to combine similar motions into a single percept.
DOI:10.1068/p5426

The effect on motion transparency of angular difference between two movingpatterns was addressed by Braddick et al (2002) and Edwards and Nishida (1999).Their experiments have shown motion repulsion for angles greater than about 208,making the directions appear further apart than they are. Below this limit the twomotion components are more often seen as a single coherent motion, rather than asseparate transparent-motion components (Edwards and Nishida 1999), suggesting thatinhibition among detectors tuned to similar directions of motion may cause worseperformance in a transparency detection task when the angle difference is less than 908.
Transparent stimuli are processed in local to global processing stages in the motionpathway. Results from experiments in which opposite directions of motion occur withina few minutes of arc of each other demonstrate cancellation effect which preventsperception of transparency (Qian et al 1994). Yet, when the local dots are unpaired,either by a vertical displacement or a separation in depth, the perception of trans-parency is restored. Physiological studies with paired dots showed that neurons in themiddle temporal (MT) area responded significantly better to unpaired stimuli (Qianand Andersen 1994). Furthermore, Snowden et al reported that V1 neurons continue tofire normally when their preferred direction is embedded in a transparent display, whileMT neurons are suppressed (Snowden et al 1991). Taken together, these results suggestthat global motion processing provides a plausible neural basis for motion transparency.
In this study, we address the joint effects of angle and disparity, which are of par-ticular interest in elucidating the role of constraints on motion processing. Furthermore,we provide a quantitative analysis to account for stimulus ambiguity and characterizethe behavior of the underlying motion processing mechanisms. Several existing testsof transparency have required subjects to detect transparency relative to an interval ofpure noise (Hibbard and Bradshaw 1999). While this experimental design allows acomparison of detection difficulty between transparent and coherent motion stimuli,it may not necessarily require the perception of motion transparency (the tasks maybe solved by simply detecting one of the motion components). In the experimentspresented here, we aim to characterize the conditions necessary for the perception ofmotion transparency and to quantitatively analyze performance as a function of theangle and disparity differences between the two motion components. Additionally, weargue that performance under various depth and angle conditions presents psycho-physical evidence for the implementation of an ecological smoothness constraint in themotion processing system. Part of this work was presented at the Vision Science Society2004 Annual Meeting (Calabro et al 2004).
2 General methods2.1 StimulusObservers were presented with stereo random-dot kinematograms. Stimuli consisted of141 dots split between two depth planes, presented in a 6 deg diameter circular aperture(5 dots degÿ2 ). At each depth, one direction was chosen a priori for all signal dotsoccurring there. All signal dots moved in their specified direction at 4 deg sÿ1. Thedirections of motion for each plane were specified as one of two angles independently.They could have either the same (coherent) or different (transparent) directions, but knowl-edge of one direction of motion gave no information as to the transparency of the display.
A fixation cross was shown at the center of the aperture, at a depth of 0 min ofarc disparity. One of the depth planes was always presented at this disparity, while thesecond plane occurred at some depth. The stimulus was presented for 12 frames lasting481 ms. Dots were square with 2 pixels per side (20.37 min of arc2) and were presentedwith antialiased subpixel resolution of ÃÄÂth of a pixel (allowing disparity and displacementincrements of 0.1 min of arc). Dot luminance was 79.55 cd mÿ2 with a backgroundluminance of 42.3 cd mÿ2 and fixation luminance of 84.08 cd mÿ2.
1220 F J Calabro, L M Vaina

2.2 ProcedureObservers were asked to make a two-temporal-alternative forced-choice judgment todiscriminate between spatially superimposed dots moving in a single direction of motionand two sets of dots moving transparently. In one interval, the two sets of dots had thesame direction of motion, while in the other interval they moved at some angle relativeto each other (transparency). The observers were asked to identify which interval con-tained the transparent motion (figure 1). Both intervals contained the same number of dotsat each depth, so the transparent interval could be distinguished only by a comparisonof the directions of motion at each depth.
Data were collected with an adaptive staircase (Vaina 2003), by varying the propor-tion of signal in the display. In each trial, a proportion of the dots in each framewere randomly pre-selected as signal dots, and moved in the specified direction. Theremaining noise dots were replaced randomly from one frame to the next (Newsomeand Pare 1988). During a staircase, the coherence was varied to find the level at whichthe observer correctly identified the transparent stimulus 79% of the time. Step sizeswere initially large in the adaptive phase of the staircase, to get a rough estimate ofthe threshold. After the first three reversals, the test switched to a classical three-upone-down staircase (Levitt 1970). In this phase, step sizes were equal within each decade.Thresholds were calculated on the basis of the final six reversals. Standard deviationswere measured across the independent threshold estimates and reflected the varianceof the threshold measurements.
2.3 ApparatusStimuli were generated by a Power Mac G4 and presented in 8-bit gray-scale mode on acalibrated Apple monitor. A pair of stereo glasses (Crystal Eyes 2, StereoGraphicsCorporation, San Rafael, CA) was used to temporally interlace the left-eye and right-eye images, and was synchronized with LCD shutter glasses allowing each eye to seethe specified image. Dots were displaced between the images for each eye to give theperception of depth.
2.4 SubjectsEight observers were tested in the first experiment and three of them also took thesecond test. All had normal or corrected-to-normal vision, and were screened with astereoacuity test, described below. One author was used as a subject; the other seven sub-jects were naive as to the purposes of the experiments. All participants gave informedwritten consent before the start of the experimental sessions, and the Boston University,Charles River Campus, approved all the procedures under the Protocol #989E.
fixation interval 1 (200 ms) interval 2 fixation(481 ms) (481 ms)
Figure 1. Paradigm for the stereomotion transparency task. Subjects were presented sequentialstimuli both containing motion at two depth planes. The task was to identify the interval whichcontained motions in two different directions.
Stereo motion transparency 1221
2.5 Control task: Assessment of stereoacuityPrior to the experimental sessions, we measured subjects' ability to perceive depthfrom disparity. Two dots were presented sequentially and the subjects were asked torespond which dot was nearer to them in depth (dots were presented randomly: bothin front, both behind, or on either side of fixation in this case). Data were collectedby a staircase procedure varying the depth difference between the two dots. The resultswere used as a screening test to show that all subjects were able to determine depthfrom disparity. The test also served as a quantitative measure of the subjects' stereoacuity,used in an ideal-observer model described below.
3 Experiment 1: Effects of angle and disparity3.1 StimuliThe stimuli were generated according to the description in section 2. During eachstaircase, angles and disparities were selected from a predefined set. The disparityand angle were changed between staircases in a predetermined, randomized sequence.A threshold estimate was obtained for each staircase, and data points show the meanof 4 ^ 8 staircases on a given condition. Coherence thresholds for detecting the intervalcontaining transparent motion were measured for disparities of 0, 4, and 12 min ofarc, and for angles of 158, 308, 458, 608, 908, and 1808 at each disparity. Outliers wereidentified and eliminated if greater than 5 median absolute deviations from the medianvalue (Sheskin 2000).
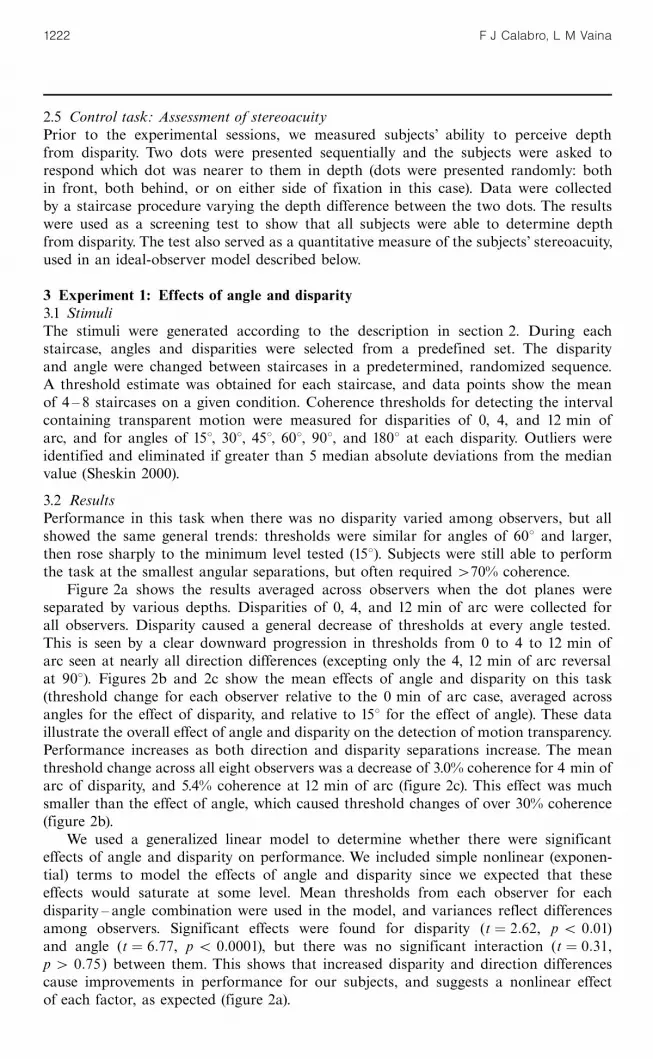
3.2 ResultsPerformance in this task when there was no disparity varied among observers, but allshowed the same general trends: thresholds were similar for angles of 608 and larger,then rose sharply to the minimum level tested (158). Subjects were still able to performthe task at the smallest angular separations, but often required 470% coherence.
Figure 2a shows the results averaged across observers when the dot planes wereseparated by various depths. Disparities of 0, 4, and 12 min of arc were collected forall observers. Disparity caused a general decrease of thresholds at every angle tested.This is seen by a clear downward progression in thresholds from 0 to 4 to 12 min ofarc seen at nearly all direction differences (excepting only the 4, 12 min of arc reversalat 908). Figures 2b and 2c show the mean effects of angle and disparity on this task(threshold change for each observer relative to the 0 min of arc case, averaged acrossangles for the effect of disparity, and relative to 158 for the effect of angle). These dataillustrate the overall effect of angle and disparity on the detection of motion transparency.Performance increases as both direction and disparity separations increase. The meanthreshold change across all eight observers was a decrease of 3.0% coherence for 4 min ofarc of disparity, and 5.4% coherence at 12 min of arc (figure 2c). This effect was muchsmaller than the effect of angle, which caused threshold changes of over 30% coherence(figure 2b).
We used a generalized linear model to determine whether there were significanteffects of angle and disparity on performance. We included simple nonlinear (exponen-tial) terms to model the effects of angle and disparity since we expected that theseeffects would saturate at some level. Mean thresholds from each observer for eachdisparity ^ angle combination were used in the model, and variances reflect differencesamong observers. Significant effects were found for disparity (t � 2:62, p 5 0:01)and angle (t � 6:77, p 5 0:0001), but there was no significant interaction (t � 0:31,p 4 0:75) between them. This shows that increased disparity and direction differencescause improvements in performance for our subjects, and suggests a nonlinear effectof each factor, as expected (figure 2a).
1222 F J Calabro, L M Vaina

3.3 DiscussionThe results shown in figure 2c are at odds with previous studies of the effect of disparityon motion transparency detection (Hibbard and Bradshaw 1999). Hibbard and Bradshawshowed that as the disparity separation increased from 0, thresholds decreased, butthat this continued only for 2 ^ 4 min of arc. Beyond this value, thresholds rose backto the 0 min of arc separation levels. In contrast, our results show a monotonicallydecreasing trend in thresholds as disparity is increased, up to 12 min of arc. A furtherdata point (16 min of arc) was collected on one subject (FC) and showed a continua-tion of the trend. One possible explanation might be that the higher density used(12.5 dots degÿ2 ) by Hibbard and Bradshaw might have led to stereo mismatches orstereo correspondence problems. This would occur when dots are near enough to eachother so that the correct stereo pair becomes ambiguous. This mismatch may happenwhen stereo separation (the amount of displacement necessary for the specified dispar-ity) exceeds half the distance to the nearest dot. In this case, the nearest dot will not
Disparity=min of arc
0
4
12
60
50
40
30
20
Coherence
threshold=%
signal
Threshold
change=%
coherence
20
10
0
ÿ10
ÿ20
ÿ30
ÿ40
Threshold
change=%
coherence
0 45 90 135 180Angle=8
2
0
ÿ2
ÿ4
ÿ6
ÿ8
ÿ100 45 90 135 180 0 4 8 12
Angle=8 Disparity=min of arc
(a)
(b) (c)
Figure 2. Effects of direction and disparity on transparency detection. (a) Mean results for all eightobservers, shown for each disparity. (b) Effect of angle on thresholds, averaged across dispari-ties. Values are the change in threshold from the 158 condition. (c) Effect of disparity averagedacross angles. Values are the change in threshold from 0 min of arc disparity. In (b) and (c), opensymbols show each observer, solid circles are the mean of all observers.
Stereo motion transparency 1223

be the correct stereo match, but rather one of the dots from another stereo pair. Thus,to avoid stereo correspondence problems, the stereo pair separation (dcm ) must be lessthan half the average dot spacing (d ). The stereo pair separation is a function of thedisparity used and viewing distance, given as
dcm � vdmin
60
p180
where dmin is the disparity (in min of arc) and v is the viewing distance in cm. For a dotdensity N (N dots degÿ2 ) and a uniform distribution, the dot spacing, d, is given by
ddeg ����1p����Np � 1����
Np ,
dcm �1����
Np
tanÿ1�1=v� :
Thus, we can find the densities and disparities at which stereo correspondencebegins to become a problem:
dist�aR, bL �5 dist�aR, aL � ,dÿ d 5 d12d 5 d
1����Np
tanÿ1�1=v� 5 vdmin
60
N 41
2
1
tanÿ1�1=v�60
dmin�1=v�
� �2� 30
dmin
� �2.
For example, for 16 min of arc of disparity and a viewing distance of 120 cm,stereo correspondence should become a problem for densities greater than 3.5 dotsdegÿ2. Reformulating to solve for d, we find that for a density of 12.5 dots degÿ2, stereomismatches begin to occur at a disparity of 8.5 min of arc. This is higher than the2 ^ 4 min of arc Hibbard and Bradshaw found as their peak disparities, and thus cannotexplain the threshold reversal they reported.
Another possible explanation for the discrepancy between our results and those ofHibbard and Bradshaw is that a time-dependent process (such as a time requirementto shift attention in depth) prevents the observers from fully processing both planes(their display timeö150 msöwas significantly shorter than ours, 481 ms). To test thispossibility, we reduced our stimulus presentation to 3 frames (120 ms) and collected datafor motions 1808 apart for various disparities. The results are shown in figure 3. Thesame trend we observed in the long-duration displays persists for the short-durationdisplay, suggesting that the temporal properties of the stimuli do not explain the dis-crepancy in results.
A third possible explanation for the difference between the results of the twogroups could be the nature of the task. In Hibbard and Bradshaw's task, subjects wereasked to judge which interval contained transparency compared to an interval of purenoise. We suggest that, in their task, observers do not have to actually detect trans-parency, but that it is sufficient that they segregate the two planes and perform amotion-detection task on one of them. Thus, the U-shaped function (Hibbard andBradshaw 1999, their figure 3) may be a combination of two factors: a decrease inthresholds over the first few minutes as the segregation of the planes becomes easier,and a slow, steady rise in thresholds as the motion-detection task gets harder (both planes
1224 F J Calabro, L M Vaina

were being moved away from the fixation depth, so the motion detection must be doneat larger disparities, which may be underrepresented or underused). Data presented atthe Vision Sciences Society Annual Meeting (2006) by our laboratory suggest that thesegregation occurs at 2 ^ 6 min of arc of disparity separation (varying by observer), whichwould agree with the location of the peak of the U-shape function in the Hibbardand Bradshaw experiment. On this basis we suggest that the task used by Hibbard andBradshaw does not necessarily require the detection of multiple directions of motion,and the difference between our results and theirs stems from the nature of the tasks.
4 Ideal-observer model4.1 MethodsIdeal-observer models have been productive in motion (Crowell and Banks 1996;Watamaniuk 1993) and motion-transparency (Wallace and Mamassian 2003) experimentsin determining whether psychophysical results can be explained simply by stimulusproperties. Generally, ideal-observer models use a Bayesian statistics approach to solvethe psychophysical task and use exact knowledge of the stimulus, thus setting the upperlimit of performance, and providing a reference for comparison with human results.
We developed an ideal-observer model to determine whether performance changesreported in experiment 1 could be explained by changes in the information availablein the stimulus and noise in early visual processing stages. Our model is limited bysubjects' error in determining the direction and disparity of a single dot in controlexperiments, similar to an ideal-observer model proposed for solving heading directionfrom optic flow (Crowell and Banks 1996). It encapsulates sources of local noise, suchas that arising from early visual processing areas, including the retina and area V1.In experiment 1, direction and disparity are the only relevant variables for solvingthe task; therefore, we can assume that error in judging any other characteristics of thestimulus (eg speed, luminance, or size) will not affect performance. We chose as inputto the model a noisy-motion vector field, with each dot perturbed in direction anddepth by Gaussian noise. Error ranges reported by Crowell and Banks for directiondiscrimination are used here, and a similar task (which was used as the stereoacuityscreening test) was implemented to determine error in representing the depth of asingle dot. Error values were found by independently estimating the direction anddisparity which would give d 0 � 1, in which case the internal representation of theparameter is equal to the variance of the representation.
The ideal observer has knowledge of the potential directions and disparities used ina given trial, and compares the input to four templates (either of two motions pre-sented at each disparity). A probability is calculated for each dot as having arisen from
30
25
20
15
10
Coherence
threshold=%
signal
0 4 8 12Disparity separation=min of arc
Figure 3. Threshold as a function of disparity forshort (120 ms) stimulus presentations. To determinewhether long display times enabled subjects to pro-cess both planes when separated by large disparities,we repeated the experiment on subject FC foropposing motions and various depth separations.Although thresholds are higher than before, thesteady decline in thresholds as disparity is addedpersists.
Stereo motion transparency 1225

each of the four templates. Probabilities are combined by Bayes's rule (see appendix:Ideal-observer formulation) to give the probability that the stimulus presented wasgenerated by each of the underlying distributions, and from there an overall probabilityof transparency can be calculated.
By comparing the probability of transparency for the two intervals, the model is ableto determine which interval is more likely to contain transparency. As in the case ofthe human observers in experiment 1, here too noise was added to the stimulus (againrestricted to the two available disparities), and coherence thresholds were measuredfor various angle and depth parameters. We used Monte Carlo simulations of the modelto determine the 79%-correct level for comparison to psychophysical results.
4.2 EfficiencyWe compared the model with the data from the three observers with an efficiencymeasure (Crowell and Banks 1996) defined as the ratio of thresholds (or, equivalently,as human sensitivity over ideal-observer sensitivity). An efficiency of 1.0 indicates iden-tical performance, while smaller efficiencies mean that the human observer is unableto perform as well as the ideal observer. Since the model is subject to the same sourcesof local noise as the human observers, changes in efficiency reflect changes in higher-level areas, possibly including area MT. We therefore suggest that efficiency is a metricof performance independent of the information available to the mechanism, and thatchanges in efficiency should reflect changes in the processing mechanism itself.
4.3 ResultsOverall, the model performs much better than the human observers did in experiment 1,by a factor of roughly 10, which is within the range of other ideal-observer models(Crowell and Banks 1996). Figure 4 shows the changes in efficiency caused by directiondifferences (figure 4a, relative to the 158 condition) and disparity differences (figure 4b,relative to the 0 min of arc condition). In both cases, efficiencies increase as the separa-tions increase, before saturating among the highest levels of each variable.
We again modeled both angle and disparity as exponential terms in our statisticalmodel (efficiencies are modeled as the ratio of two exponential functions, which producesanother exponential). Both angle (t � ÿ4:10, p 5 0:0001) and disparity (t � ÿ1:96,p � 0:05) were significant factors when controlling for differences in baseline performance
0.06
0.04
0.02
0.00
ÿ0.02
Efficiency
change
0.2
0.1
0.0
ÿ0.1
Efficiency
change
0 4 8 12 0 45 90 135 180Disparity=min of arc Angle=8
(a) (b)
Figure 4. Effects of angle and disparity on efficiencies. (a) Effect of angle on efficiencies, averagedacross disparities.Values are the change in efficiency from the 158 condition. (b) Effect of disparityon efficiencies, averaged across angle, relative to the 0 min of arc disparity case. Open symbolsshow each observer, solid circles are the mean of all observers.
1226 F J Calabro, L M Vaina

by subject, but there was no interaction between the two (t � 0:56, p 4 0:5). Theresults show a large drop in efficiency for angles below 608 (figure 4a), despite notchanging among the larger angles tested (linear model for angles 608 and larger givesp � 0:88, t � ÿ0:14 for the effect of angle). For these small angles, human performancebegins to suffer, while the model has not yet been noticeably affected. Thus, efficienciesdrop as the angle decreases, and this continues even when the model performance isno longer constant (below 308). This shows that the angle separating the motionsaffects observers on a motion-transparency task at much larger angles than predictedby a model limited by observers' resolution in making motion-direction judgments.The effect of disparity shows a similar trend, with efficiencies decreasing when the depthseparation is removed. There is little to no effect of disparity on efficiency between the4 and 12 min of arc conditions.
4.4 DiscussionThe results reported here suggest that as both the disparity and direction differencesbetween two components of motion decrease, not only do subjects' performancessuffer, but efficiencies drop as well. Since our ideal-observer model is limited by thedirection and disparity resolution of the observers who performed the task, the efficiencyresults demonstrate that performance changes are not fully governed by the ability ofthese subjects to determine the depth and direction of the individual dots in the stim-ulus. The results demonstrate that variations in the stimulus uncertainty as limited bylocal noise cannot completely account for the performance changes reported in experi-ment 1. This suggests the existence of an additional effect on the mechanism, either asan external effect or as a consequence of the properties of the processing mechanism.
A direct comparison of the ideal-observer model as applied to experiment 1 mightbe flawed if human observers were not using all of the stimulus area available tothem. Even if they were, it is known that foveal resolution is much better than in theperiphery, causing some parts of the visual field to have a disproportionate representa-tion. The ideal-observer uses the entire stimulus available and makes no distinctionbased on visual field location. Furthermore, the ideal-observer performance is rela-tively constant until very small angles, and coherence thresholds are very low since itis able to utilize all information maximally. We extended the ideal observer by varyingthe available stimulus size in order to determine whether trends in ideal-observer per-formance and human efficiency depend on the summation area. As the stimulus areais decreased, down to a radius of 0.5 deg (area of 0.78 deg2 ), the baseline performanceof the ideal observer becomes more similar to that of the human observers. However,the drops in efficiency for smaller direction and disparity differences are maintainedfor all summation areas tested.
5 Experiment 2: Is the perception of depth necessary for depth segmentation?5.1 StimuliUsing the test methodology described in section 2, we used anticorrelated dots to deter-mine whether the perception of depth was a necessary condition for performanceimprovements in the transparency task. This method alters a corresponding pair ofdots to have opposite contrasts relative to the background. Each opposite-contrast dotis presented to one eye. Although early visual areas respond to this phenomenon in asimilar way as they do to veridical disparity (Cumming and Parker 1997), the display isnot perceived to have any depth. This allows the investigation of the requirements andprocessing stages of stereo transparency.
Anticorrelated dot luminances were calculated by computing Michelson contrastsof equal magnitude but opposite sign, and presenting each contrast to one eye. Thisgave dots of luminances 79.55 cd mÿ2 and 22.5 cd mÿ2 on a background of 42.3 cd mÿ2.
Stereo motion transparency 1227

Each eye randomly saw either the positive or negative contrast dot, so each eye sawan approximately equal number of each contrast level. Other than changing the contrastof one of each pair of dots, the stimuli from experiment 1 were used.
5.2 ResultsThree disparities (0, 4, 12 min of arc) were tested at five angles (158, 308, 458, 908, 1808)for observer FC and two angles (458, 1808) for observers EC and AG. An N-way ANOVAtest showed that the effects of angle, as seen in experiment 1, persist ( p 5 0:0001),but there is no longer any change in performance caused by disparity ( p � 0:848).Further, there is no effect of disparity or angle for large angles (908 and 1808, p � 0:09for disparity, p � 0:35 for angle). For angles of 458 and larger, the effect of angle isnearly significant ( p � 0:059), although that of disparity is not ( p � 0:368). This cutoffof significance agrees with the results of experiment 1, suggesting that anticorrelation didnot affect the role that angular separation plays in motion-transparency perception, butdid remove all effects of disparity. The results for one observer (FC) are shown in figure 5.
5.3 DiscussionThe result of this experiment supports the hypothesis that the perception of disparityis a necessary condition for the improvement in performance created by a depth separa-tion between the transparent planes. Neurophysiological experiments with anticorrelateddots suggest that early stages of the visual processing pathway (ie V1) pair these dots, butthat no depth is perceived. This suggestion, along with the results of this experiment,supports the hypothesis that segregation between transparent motions is processedfurther along the motion processing pathway, perhaps in area MT as has been suggested(Snowden et al 1991).
6 General discussionIn this study we have shown how psychophysical performance in a motion-transparencydetection task varies as a function of the depth and angular separations between themotion components. Experiment 1, figure 2 demonstrates that motion transparencybecomes easier to detect as the angle and disparity differences between the motioncomponents increase. To explain these results we proposed an ideal-observer modelwhich suggests that the experimental outcomes reflect true changes in the underlyingmotion-processing mechanisms. Not only do subjects' performances drop for smalldisparity and direction differences, but stimulus ambiguity and low-level sources ofnoise cannot fully account for the experimental results, which indicates an additionalnegative effect on the processing of motion transparency.
40
30
20
10
0
Coherence
threshold=%
signal
Disparity=min of arc
0
4
12
0 45 90 135 180Angle=8
Figure 5. Results with anticorrelated dots. The effectof direction difference is unchanged, but there isno longer any effect of disparity. Data from oneobserver (FC) are plotted.
1228 F J Calabro, L M Vaina

Perception of depth is required to gain any performance benefit from increaseddisparity in detecting motion transparency, as indicated by experiment 2, figure 5. Thissuggests that depth segmentation for this task occurs beyond areas that respond toanticorrelated disparities, such as V1 (Cumming and Parker 1997). This is consistentwith previous neurophysiological studies which indicate that neurons in area MT under-lie the perception of motion transparency (Qian and Andersen 1994; for a review, seeBraddick and Qian 2001).
Taken together, the psychophysical and ideal-observer model results presented hereindicate that the mechanism processing motion transparency attempts to implement asmoothness constraint (Hildreth 1983; Marr 1982) by grouping across similar features(eg depth and direction). When local motions are observed at very similar depths, ormoving in very similar directions, it is more likely that they actually arise from thesame object, and external noise or measurement error caused slight variations inthe perceived features. It would be advantageous for the visual system to exploit thisconstraint in order to form the most probable scene interpretation from the availablevisual information. The results presented here provide psychophysical evidence thatthe visual motion system obeys such a smoothness constraint by combining similarfeatures into a single percept.
Several physiological implementations are plausible for such a constraint. Onepossibility would be the use of detectors with large tuning widths that are unableto make fine discriminations, as tuning widths for direction (Gattass and Gross 1981)and disparity (Maunsell and Van Essen 1983) are large relative to the ranges tested inour experiments. However, population responses are known to be capable of discrim-inating on a much finer scale than the individual detectors by looking for peaks or bythe overall shape of the activity profile (Treue et al 2000). Furthermore, psychophysicaldiscrimination limits reported for direction (Ball and Sekuler 1979) and disparity (seesection 2.5) are well below the level at which effects are observed in our experiments.Edwards and Nishida (1999) suggest another potential implementation, where inhibi-tion among similarly tuned detectors may favor the perception of a single directionof motion and disparity.
About 70% of MT neurons are tuned to disparity in addition to motion (Gonzalezand Perez 1998), about 84% are strongly directionally selective (Maunsell and Van Essen1983; Snowden et al 1992), and MT activity is strongly correlated with psychophysicalperformance on motion tasks (Newsome et al 1986). This is consistent with the like-lihood that the nervous system would find it ecologically advantageous to implementa smoothness constraint at the level of area MT. MT is the first level in the visualmotion hierarchy where individual neural responses are consistent with the perceptionof motion, and hence should accurately reflect real-world visual events.
Acknowledgments. Many thanks to Scott Beardsley for his ideas and to Greg DeAngelis forsuggestions regarding the anticorrelated dot experiment. Stimulus code was contributed byMartin Kopcik and Mike Lekyr. Thanks to all our subjects. This work was funded by NIH grantEY-2RO1-07861 to LMV.
ReferencesAlais D, Verstraten F, Burr D, 2005 ` The motion aftereffect of transparent motion: Two temporal
channels account for perceived direction'' Vision Research 45 403 ^ 412Ball K, Sekuler R, 1979 ``Masking of motion by broadband and filtered directional noise'' Perception
& Psychophysics 26 206 ^ 214Braddick O, Qian N, 2001 ` The organization of global motion and transparency'', in Motion
VisionöComputational, Neural, and Ecological Constraints Eds J M Zanker, J Zeil (Berlin:Springer) pp 85 ^ 112
Braddick O J, Wishart K A, Curran W, 2002 ` Directional performance in motion transparency''Vision Research 42 1237 ^ 1248
Stereo motion transparency 1229

Calabro F J, Beardsley S A,Vaina L M, 2004 ` Effects of disparity and noise on motion transparency''Journal of Vision 4 857a (abstract)
Clifford C W, Spehar B, Pearson J, 2004 ` Motion transparency promotes synchronous perceptualbinding'' Vision Research 44 3073 ^ 3080
Crowell J A, Banks M S, 1996 ` Ideal observer for heading judgments'' Vision Research 36 471 ^ 490Cumming B, Parker A, 1997 ` Responses of primary visual cortical neurons to binocular disparity
without depth perception'' Nature 389 280 ^ 283Edwards M, Nishida S, 1999 ` Global-motion detection with transparent-motion signals'' Vision
Research 39 2239 ^ 2249Farell B, Li S, 2004 ` Seeing depth coherence and transparency'' Journal of Vision 4 209 ^ 223Gattass R, Gross C G, 1981 ` Visual topography of striate projection zone (MT) in posterior
superior temporal sulcus of the macaque'' Journal of Neurophysiology 46 621 ^ 638Gonzalez F, Perez R, 1998 ` Neural mechanisms underlying stereoscopic vision'' Progress in Neuro-
biology 55 191 ^ 224Hibbard P B, Bradshaw M F, 1999 ` Does binocular disparity facilitate the detection of transparent
motion?'' Perception 28 183 ^ 191Hildreth E C, 1983 The Measurement of Visual Motion (Cambridge, MA: MIT Press)Levitt H, 1970 ` Transformed up ^ down methods in psychoacoustics'' Journal of Acoustical Society
of America 49 467 ^ 477Marr D, 1982 Vision (New York: W H Freeman)Maunsell J H, Van Essen D C, 1983 ` Functional properties of neurons in middle temporal visual
area of the macaque monkey. I. Selectivity for stimulus direction, speed, and orientation''Journal of Neurophysiology 49 1127 ^ 1147
Metelli F, 1974 ` The perception of transparency'' Scientific American 230(4) 90 ^ 98Newsome W T, Mikami A, Wurtz R H, 1986 ` Motion selectivity in macaque visual cortex.
III. Psychophysics and physiology of apparent motion'' Journal of Neurophysiology 55 1340 ^ 1351Newsome W T, Pare E B, 1988 `A selective impairment of motion perception following lesions
of the middle temporal visual area (MT)'' Journal of Neuroscience 8 2201 ^ 2211Qian N, Andersen R A, 1994 ` Transparent motion perception as detection of unbalanced motion
signals. II. Physiology'' Journal of Neuroscience 14 7367 ^ 7380Qian N, Andersen R A, Adelson E H, 1994 ` Transparent motion perception as detection of
unbalanced motion signals. I. Psychophysics'' Journal of Neuroscience 14 7357 ^ 7366Sheskin D J, 2000 Handbook of Parametric and Nonparametric Statistical Procedures (New York:
Chapman and Hall/CRC)Snowden R J, Treue S, Andersen R A, 1992 ` The response of neurons in areas V1 and MT of the
alert rhesus monkey to moving random dot patterns'' Experimental Brain Research 88 389 ^ 400Snowden R J, Treue S, Erickson R G, Andersen R A, 1991 ` The response of area MT and V1
neurons to transparent motion'' Journal of Neuroscience 11 2768 ^ 2785Stoner G R, Albright T D, Ramachandran V S, 1990 ``Transparency and coherence in human
motion perception'' Nature 344 153 ^ 155Treue S, Hol K, Rauber H-J, 2000 ` Seeing multiple directions of motionöphysiology and psycho-
physics'' Nature Neuroscience 3 270 ^ 276Vaina L M, Grzywacz N M, Saiviroonporn P, LeMay M, Bienfang D C, Cowey A, 2003 ` Can
spatial and temporal motion integration compensate for deficits in local motion mechanisms?''Neuropsychologia 41 1817 ^ 1836
Wallace J M, Mamassian P, 2003 ` The efficiency of speed discrimination for coherent and trans-parent motion'' Vision Research 43 2795 ^ 2810
Watamaniuk S N J, 1993 ` Ideal observer for discrimination of the global direction of dynamicrandom-dot stimuli'' Journal of the Optical Society of America A 10 16 ^ 28
Appendix: Ideal-observer formulationThe ideal-observer model receives a noisy vector field, shown in figure A1, as an inputand must integrate the local motions (where each moving dot comprises one localmotion) and make a decision regarding the global transparency of the stimulus. Thereare four possible templates of motions. These are defined by direction and disparity,and consist of two Gaussian peaks (the two motions at each of two disparities, eitherin the same or different directions) and a Gaussian ridge centered at each of the twodisparities but flat for all directions to represent the probability of a noise dot. Theseprobability density functions are illustrated in figure A2.
1230 F J Calabro, L M Vaina

Each dot has a probability for having come from each distribution (Y1 , ..., Y4),or for the noise distribution. The signal and noise distributions are given by:
ps �xn jYi � �1
2psdszexp ÿ 1
2
�zÿ mza �2s 2z
� �dÿ mda �2s 2d
" #( )
� exp ÿ 1
2
�zÿ mzb �2s 2z
� �dÿ mdb �2s 2d
" #( ),
pn �xn jnoise� �1
360����������2p�p
szexp ÿ 1
2
�zÿ z1 �2sz
� �zÿ z2 �2sz
" #( ),
20
15
10
5
0
ÿ5
ÿ10
Disparity
0 50 100 150 200 250 300 350 0 50 100 150 200 250 300 350Direction of motion=8 Direction of motion=8
Figure A1. Example inputs to the ideal-observer model. The signal dots originate from two cen-ters (at either the same or different angle, for two depths), but are perturbed by noise in bothof these dimensions. Noise dots occur at a random direction at one of the two specified depths.Example stimuli without (left) and with (right) external noise are shown.
350
300
250
200
150
100
50
0
350
300
250
200
150
100
50
0
Direction=8
Direction=8
ÿ10 ÿ5 0 5 10 15 20 ÿ10 ÿ5 0 5 10 15 20
Disparity=min of arc Disparity=min of arc
Figure A2. Probability density functions for ideal-observer model. The model uses these as thefour possible templates that could have generated the input display. By calculating the prob-ability that each of these gave rise to the display, the model determines whether the stimuluswas more likely to have contained transparent motion.
Stereo motion transparency 1231

where md n and mz n are the centers of Gaussians for direction (d ) and disparity (z)for distributions n. Each distribution Yi is given by the sum of Gaussians for the twoappropriate ns. The total PDF for a given dot, then, is given by:
p (xn jYi � � cps �xn jYi � � �1ÿ c�pn �xn jnoise� ,where c is the coherence. From these four probabilities for each dot, we find theprobability of the entire dot distribution, X, having arisen from each of the four dis-tributions:
P(X jYi � �YNn�1
p �xn jYi � .
Using Bayes's rules, we may reformulate this as the probability of each of the fourdistributions being the underlying distribution, given the exact display observed:
P �Yi jX� �P�X jYi �P�Yi �
P�X� ,
where P(Yi ) is the prior for each of the four distributions [since all four are equallylikely, P(Yi ) � 0:25 for all i ] and P(X) is the probability of observing the exact dotdistribution. This is derived as follows:
P�X� ��P�Y 0�
YNn�1
p�xn jY 0�dY 0 � 1
4
�YNn�1
p�xn jY 0�dY 0
� 1
4
X4i�1
YNn�1
p�xn jYi � �1
4
X4i�1
P�X jYi � .Thus,
P�Yi jX� �P�X jYi �P�Yi �
P�X� ,
P�Yi jX� �P�X jYi �X4
i�1P�X jYi �
.
If we revisit the four distributions, the third and fourth represent the stimuli contain-ing transparency motion, so the probability for transparency in the given interval, i , is:
Pt �i� �P�Y3 jX� � P�Y4 jX�X4
i
P�Yi jX�.
Finally, from this we can compute a likelihood ratio between the probability of thetransparency occurring in the first and second interval:
L � Pt �1�Pt �2�
.
For L 4 1, we select the first interval as that which contains transparency. ForL 5 1, we choose the second interval.
, ,
ß 2006 a Pion publication
1232 F J Calabro, L M Vaina

ISSN 0301-0066 (print)
Conditions of use. This article may be downloaded from the Perception website for personal researchby members of subscribing organisations. Authors are entitled to distribute their own article (in printedform or by e-mail) to up to 50 people. This PDF may not be placed on any website (or other onlinedistribution system) without permission of the publisher.
www.perceptionweb.com
ISSN 1468-4233 (electronic)