Embed Size (px)
Citation preview
LANDSCAPE AND
URBAN PLANNING
Landscape and Urban Planning 30 ( 1994) 49-58 ELSEVIER
Conceptualizing smoothness and density as landscape elements in visual resource management
Terry Brown School of Natural Resources and Environment, lkiversity of Michigan, ,4nn Arbor, MI 48109-l 115, C!YA
Abstract
Several dilemmas stand in the way of meeting the goals of visual resource management. The landscape is rich in potential qualities that can be assessed, but the choice of appropriate attributes is more difficult. What is readily measured is not necessarily what is most useful to examine. Furthermore, what is readily discernible from eye- level photographs may not be readily available as mapped information. Two attributes, smoothness and density, are the focus of the current study. Their choice is based on prior empirical efforts and their promise as qualities that could be translated to mapped (e.g. geographic information system; GIS) form. Though intuitively straight- forward, definitions of these concepts in terms that are amenable to computer-based spatial format posed a variety of challenges. The present effort has developed working definitions of these attributes that make them storable in other contexts and by other researchers. Further, an initial exploration of the relationship of these attributes to different landcover types suggests that although each landcover type tends to have its own characteristic range, these attributes also permit meaningful distinctions within these categories.
Keywords: GIS; Spatial information: Visual resource management
1. Introduction
Visual resource management has been an area of concern for landscape architects for several decades. The passage of the National Environ- mental Policy Act (NEPA) in 1969 mandated the use of a “systematic, interdisciplinary approach that will ensure the integrated use of the natural and social sciences and the environmental de- sign arts in planning and in decision making”. This Act marked the turning point in acknowl- edging landscape as a visual resource: “To the fullest extent possible . . . all agencies of the Fed- eral Government shall . . . identify and develop methods and procedures . . . which will ensure that presently unquantified environmental amenities
and values be given an appropriate considera- tion in decision making.”
The intention of NEPA and the numerous similar acts developed by states and regional agencies in this country as well as by agencies of several other countries seems straightforward and unquestionable. Certainly, what is scenic should be recognized and considered in any efforts that might detrimentally alter it. Protection of the visual resource is rightfully a topic of legislative concern, as are the uses and misuses of other nat- ural resources. However, the intention and its re- alization are quite different matters. Although it would seem reasonable to expect that by now re- liable assessment procedures would be well in hand, the actual situation falls far short.
0169-2046/94/$07.00 0 1994 Elsevier Science B.V. All rights reserved SSDIO169-2046(94)05004-L
50 T. Brown /Landscape and Urban Planning 30 (I 994) 49-53
In the quarter century since NEPA became law, various procedures have been developed for as- sessing the scenic resource. To a large extent these procedures rely on expert judgment. Empirical research has often not paralleled the evaluations made by professionals (Zube et al., 1982; Daniel and Vining, 1983; Smardon et al., 1986). Fur- thermore, the official procedures used by federal agencies (e.g. US Forest Service, 1974; US Bu- reau of Land Management (BLM), 1980) are more appropriate for some parts of the country than others. The emphasis on western land- scapes is understandable given the enormous federal land holdings in the west. Using such guidelines, however, vast portions of the country that lack dramatic variation in topography and spectacular scenery might simply be considered as unscenic.
The focus of this paper is on the relatively typ- ical landscape of a large region of the country that would probably fail to qualify as scenic by usual scenic assessment approaches. Nonetheless, to local populations such scenery also merits pro- tection and consideration. Within the region, there is variation in what is scenic yet the avail- able procedures for decision-making offer little help in making such distinctions.
2. Choosing appropriate landscape attributes
Central to any assessment of the scenic re- source is the decision about the attributes that are to be included in the assessment. Despite the significance of such decisions, the choices are often made with little substantial evidence. Un- derstandably, there is heavy reliance on profes- sional judgment. The BLM ( 1980) framework, for example, focuses on seven categories: land- form, vegetation, water, color, adjacent scenery, scarcity, and cultural modification. Conve- nience is another factor that determines the se- lection of attributes. Environmental features that can be counted relatively easily are often in- cluded in assessment procedures. The number of trees, their height and canopy might thus play a role in visual resource management.
From a convenience standpoint, it would be
most helpful to select attributes that do not de- pend on extensive field-work. If decisions about scenic resources could be made by resorting to spatial data banks, the landscape manager’s task would be greatly facilitated. If, for example, top- ographic variation and large bodies of water are highly likely to be considered scenic, this infor- mation is readily available from maps. Similarly, were it the case that scrubland is less scenic, this too could be ascertained from mappable inputs. Especially with the capability of computerized geographic information, it would thus be rela- tively easy to identify scenic resources.
There are, however, two major barriers to the effective use of such a powerful technology. The first of these involves the choice of attributes. Some attributes, such as the BLM’s ‘scarcity’, might be difficult to discern from computerized spatial information. Nonetheless, there is an abundance of information in a data base that could accrue to scenic assessment. The challenge is to develop criteria for the selection of a man- ageable number of particularly appropriate attributes.
The second hurdle, assuming that attributes have been selected, involves the considerable variability in what is scenic within any attribute category. Even if a particular landform or land- cover category were selected as an appropriate attribute, it is likely that scenic quality would vary substantially. For example, mountain views or waterscapes-both frequently included in highly preferred scenery--can show considera- ble variation in preference. Thus to use a simple translation of landform or landcover as a surro- gate for scenic quality would often lead to false conclusions.
Choosing attributes turns out to be complex and problematic. An inclusive approach can be overwhelming and unproductive. On the other hand, an approach that focuses on a few, broad categories could well lead to misguided deci- sions. Exacerbating the situation is the inherent variability in natural features. Climate, season, region, subregion, and cultural influences all af- fect the attributes that comprise the landscape. The task of identifying the scenic resource turns
T Brown /Landscape and Urban Planning 30 (I 994) 49-58 51
out to be far more challenging than the NEPA charge would suggest.
3. Objectives of study
The underlying purpose of this study is to link mapped data with scenic resource evaluation. This paper addresses an admittedly small piece of this puzzle. The focus is on two landscape at- tributes: smoothness of the ground texture and density of vegetation. The reasons for selecting these attributes are explained first. The discus- sion then turns to efforts to conceptualize these attributes in ways that could be translatable to information that is available from mappable data. It would have been appropriate to con- clude the paper with the empirical verification of this conceptualization. Such is the process of vis- ible science. Instead, the paper is an expression of the struggle inherent in invisible science. The interplay between empirical input and concep- tualization, the complications that the ‘real world’ imposes, and the frustrations that high- powered technological advances entail are all parts of this challenging process.
4. Basis for selecting study attributes
There is a considerable literature on environ- mental preference. Various authors have offered schemes for broadly grouping these works in terms of underlying research traditions or para- digms (e.g. Zube et al., 1982; Daniel and Vining, 1983). Most of the empirical work on environ- mental preference is based on ratings of individ- ual scenes. These ratings include judgments of liking, preference, scenic quality, scenic beauty or similar qualities that provide the ‘outcome’ measure. The scenes are also rated in terms of environmental attributes and these are used to predict the outcomes. These attributes vary widely across studies, ranging from physical characteristics that would be considered rela- tively objective to characteristics that depend on more inference.
A study we conducted that compared four do-
mains of such predictor variables (Kaplan et al., 1989) provided the impetus for the present proj- ect. The 59 scenes used in the study were of the common landscape of much of the inland Great Lakes region, offering variety in land cover and relatively little variation in land form. The 180 study participants rated each scene in terms of preference. The scenes were also rated on each of 20 attributes representing the four domains. Two of these domains focused on environmental at- tributes that would be relatively easy to obtain from mapped information. The so-called ‘physi- cal attributes’ did not turn out to be useful in predicting the preference ratings for the particu- lar set of scenes included in that study. The sec- ond domain, comprising six landcover types, by contrast, provided a highly significant basis for preference prediction.
The remaining two domains consisted of attri- butes that pose greater challenges to mappabil- ity. Nonetheless, there were strong reasons for including these in the study. The ‘informational variables’ derive from research by Kaplan and Kaplan ( 1978, 1989) that was based on the per- ceptual process involved in extracting informa- tion from the environment. Rather than focus- ing on specific elements in the physical setting, this framework is concerned with the organiza- tion of the space. ‘Mystery’ (defined in terms of ‘promise of new but related information’) was a significant predictor. Gimblett et al. ( 1985) have worked on operationalizing the mystery con- struct in terms of physical features in the environment.
The other domain, ‘perception-based vari- ables’, consisted of attributes which had been found to be pertinent in prior empirical work on preference. On the basis of regression analyses, this proved to be the most powerful domain in predicting the preference ratings in the 1989 study. ‘Openness’, (defined as ‘amount of space perceivable to the viewer’) was the single best predictor of the 20 included in the study. Nota- bly, it was scenes that were low in openness that were the more preferred. To avoid the awkward- ness of ‘non-openness’, the work discussed here refers to this attribute as ‘density’. Another per- ception-based variable, ‘smoothness’ (defined as
52 7: Brown /Landscape and Urban Plunntt~g 30 (1994) 49-58
‘uniformity and shortness of ground texture’), was also significant.
These results suggested to us that smoothness and density would be useful candidates for fur- ther exploration. In particular, they appeared relatively close in concept to characteristics in the environment that might be available in mappa- ble form. The selection of these variables, then, came largely from empirical input.
At the same time, however, both of these attri- butes are reasonable candidates from a theoreti- cal perspective. Certainly, the presence of cover in an otherwise treeless field would appear ad- vantageous both from the point of view of shade and in terms of not being overly visible to poten- tial predators. The negative valence of ‘open- ness’ is parallel to what Woodcock ( 1982 ) called ‘agoraphobia’ in his study of biome preference. He found a clear aversion to scenes devoid of vegetative cover. The lack of distinctive features in a wide open area also makes way-finding more problematic. A smooth ground texture, by con- trast, enhances locomotion and increases visual access.
It is useful to emphasize that the results of the study provide support for the importance of drawing on diverse domains of indicators in as- sessing scenic quality. In multiple regression analysis, the landcover types, informational variables, and perception-based variables all contributed to the prediction of preference, sug- gesting that they tap nonoverlapping attributes of the landscape. Openness and smoothness are not directly derivable from landcover and land- form information. For example, within a single landcover designation one can find great varia- tion in smoothness. Similarly, a comparable de- gree of openness can be found in diverse land- cover categories.
5. Translation of density and smoothness to mappable terms
Density and smoothness make good sense from an intuitive standpoint and are straightforward concepts to explain to others. Smooth ground textures are low and even. Dense places permit
less light to enter whereas open areas have more visible space. One would expect these constructs to be readily measurable, and, in fact, the initial ratings of the 59 scenes in terms of these con- structs presented no problems.
Explaining such ratings to a computer pre- sents different challenges. More accurately, ex- tracting comparable information from spatial data bases requires a different level of analysis from the integration we humans take for granted based on the power of eye and brain. A simple exercise makes this evident. If one examines sev- eral scenes that received comparable ratings in terms of either of these attributes, one quickly tinds that the ratings reflect a variety of sub- themes. Although these are readily grasped at an intuitive level, they are surprisingly difficult to define. Each of these subthemes is in itself a rel- atively complex construct to articulate.
As with any construct, one can approach the operationalization by explicit assessment of each of the potential features, or subthemes. Such an approach can yield a relatively long list of char- acteristics and the dilemma of their relative weighting. Alternatively, one can define the con- cept in a manner that permits some trade-offs among the salient features. To take a simple ex- ample: one might rate several objects as ‘chairs’ even though they lack common characteristics. Here the features or ‘subthemes’ might include: number of legs, having a back, whether one can sit on it, cushioned or not, etc. Thus an antique, high-back, upholstered, wobbly chair and an ob- ject with a central pedestal, no arms, or cushion might both be labeled chairs without hesitation. Rather than defining the chair in terms of the number of features that meet specified criteria, the features are treated as compensatory, per- mitting a variety of combinations to yield the same result.
Consistent definitions and scoring criteria are essential if we are to bridge the gap between the scene-based information and the data derived from maps. Furthermore, these criteria would ideally focus on environmental characteristics that are, in fact, obtainable from mappable in- formation. It is important to note here that mappable information includes not only tradi-
T. Brown /Landscape and Urban Planning 30 (1994) 49-M 53
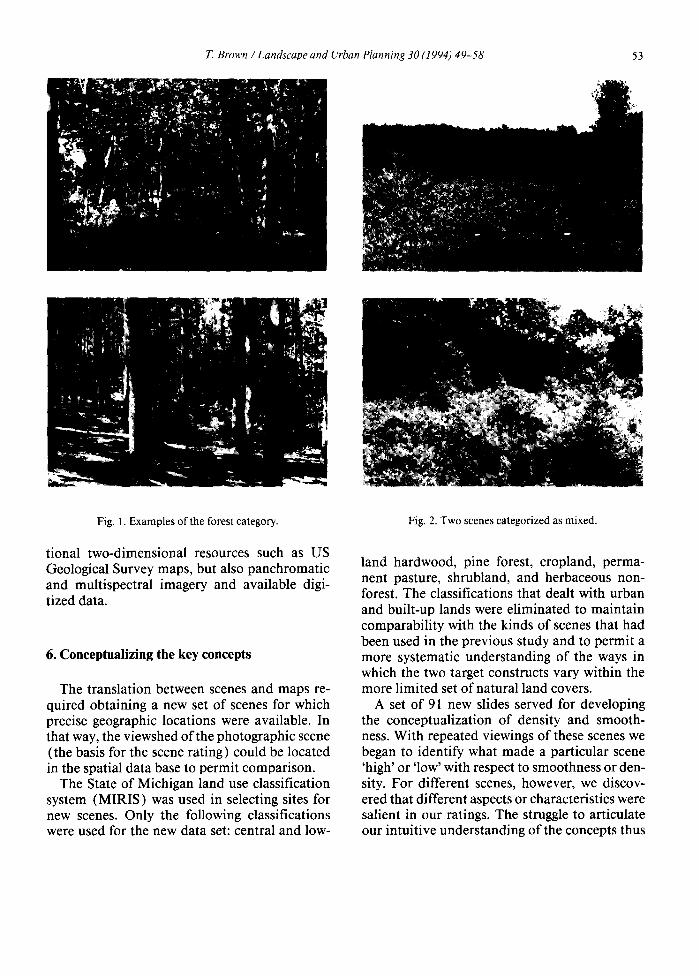
Fig. 1. Examples of the forest category.
tional two-dimensional resources such as US Geological Survey maps, but also panchromatic and multispectral imagery and available digi- tized data.
6. Conceptualizing the key concepts
The translation between scenes and maps re- quired obtaining a new set of scenes for which precise geographic locations were available. In that way, the viewshed of the photographic scene (the basis for the scene rating) could be located in the spatial data base to permit comparison.
The State of Michigan land use classification system (MIRIS) was used in selecting sites for new scenes. Only the following classifications were used for the new data set: central and low-
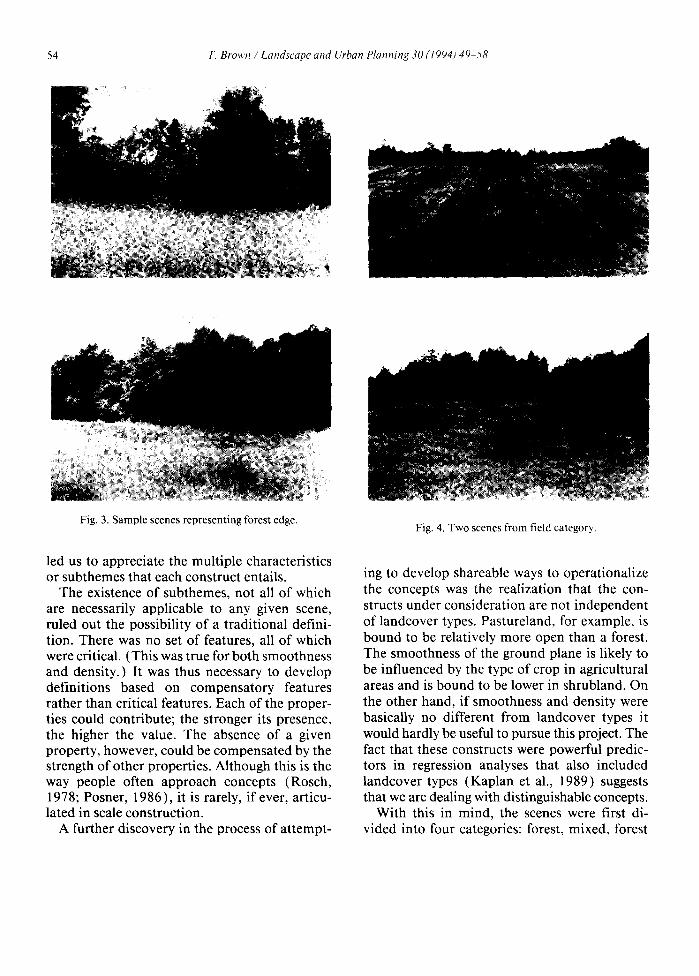
Fig. 2. Two scenes categorized as mixed.
land hardwood, pine forest, cropland, perma- nent pasture, shrubland, and herbaceous non- forest. The classifications that dealt with urban and built-up lands were eliminated to maintain comparability with the kinds of scenes that had been used in the previous study and to permit a more systematic understanding of the ways in which the two target constructs vary within the more limited set of natural land covers.
A set of 91 new slides served for developing the conceptualization of density and smooth- ness. With repeated viewings of these scenes we began to identify what made a particular scene ‘high’ or ‘low’ with respect to smoothness or den- sity. For different scenes, however, we discov- ered that different aspects or characteristics were salient in our ratings. The struggle to articulate our intuitive understanding of the concepts thus
54 T. Brow /Landscape and Urban Planning 30 (I 994) 49-S
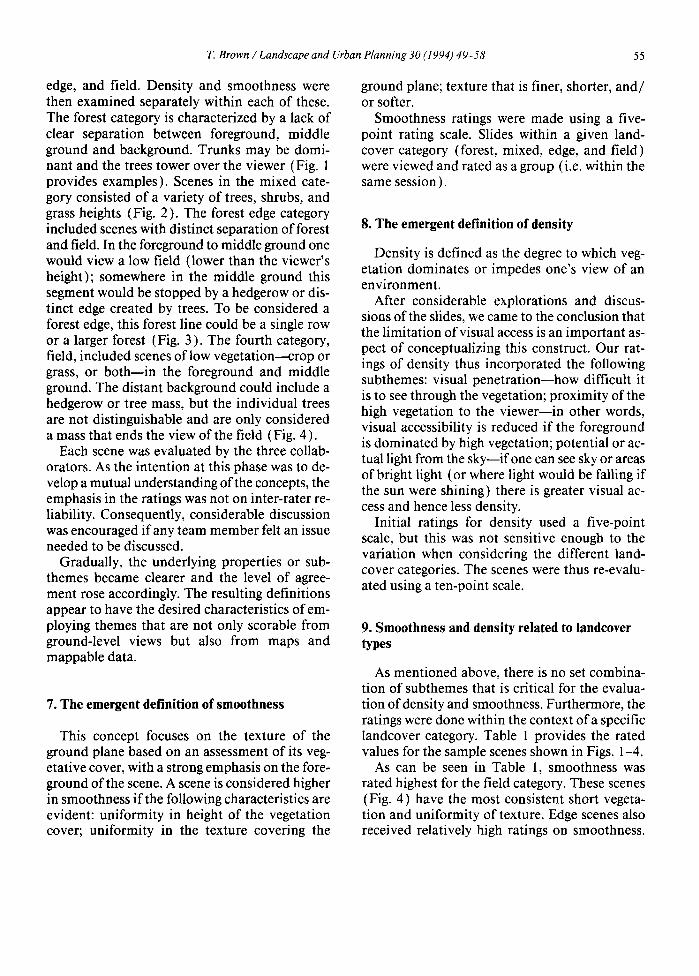
Fig. 3. Sample scenes representing forest edge.
led us to appreciate the multiple characteristics or subthemes that each construct entails.
The existence of subthemes, not all of which are necessarily applicable to any given scene, ruled out the possibility of a traditional detini- tion. There was no set of features, all of which were critical. (This was true for both smoothness and density.) It was thus necessary to develop definitions based on compensatory features rather than critical features. Each of the proper- ties could contribute; the stronger its presence, the higher the value. The absence of a given property, however, could be compensated by the strength of other properties. Although this is the way people often approach concepts (Rosch, 1978; Posner, 1986), it is rarely, if ever, articu- lated in scale construction.
A further discovery in the process of attempt-
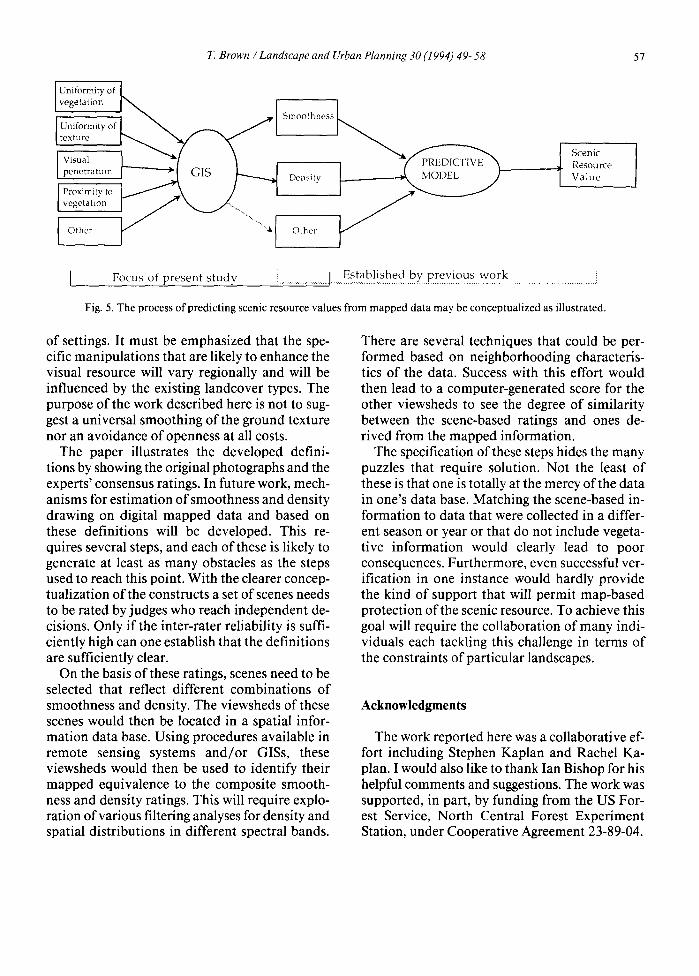
Fig. 4. Two scenes from field category.
ing to develop shareable ways to operationalize the concepts was the realization that the con- structs under consideration are not independent of landcover types. Pastureland, for example, is bound to be relatively more open than a forest. The smoothness of the ground plane is likely to be influenced by the type of crop in agricultural areas and is bound to be lower in shrubland. On the other hand, if smoothness and density were basically no different from landcover types it would hardly be useful to pursue this project. The fact that these constructs were powerful predic- tors in regression analyses that also included landcover types (Kaplan et al., 1989) suggests that we are dealing with distinguishable concepts.
With this in mind, the scenes were first di- vided into four categories: forest, mixed, forest
T. Brown /Landscape and Urban Planning 30 (1994) 49-58 55
edge, and field. Density and smoothness were then examined separately within each of these. The forest category is characterized by a lack of clear separation between foreground, middle ground and background. Trunks may be domi- nant and the trees tower over the viewer (Fig. 1 provides examples). Scenes in the mixed cate- gory consisted of a variety of trees, shrubs, and grass heights (Fig. 2). The forest edge category included scenes with distinct separation of forest and field. In the foreground to middle ground one would view a low field (lower than the viewer’s height); somewhere in the middle ground this segment would be stopped by a hedgerow or dis- tinct edge created by trees. To be considered a forest edge, this forest line could be a single row or a larger forest (Fig. 3 ) . The fourth category, field, included scenes of low vegetation-crop or grass, or both-in the foreground and middle ground. The distant background could include a hedgerow or tree mass, but the individual trees are not distinguishable and are only considered a mass that ends the view of the field (Fig. 4).
Each scene was evaluated by the three collab- orators. As the intention at this phase was to de- velop a mutual understanding of the concepts, the emphasis in the ratings was not on inter-rater re- liability. Consequently, considerable discussion was encouraged if any team member felt an issue needed to be discussed.
Gradually, the underlying properties or sub- themes became clearer and the level of agree- ment rose accordingly. The resulting definitions appear to have the desired characteristics of em- ploying themes that are not only storable from ground-level views but also from maps and mappable data.
7. The emergent definition of smoothness
This concept focuses on the texture of the ground plane based on an assessment of its veg- etative cover, with a strong emphasis on the fore- ground of the scene. A scene is considered higher in smoothness if the following characteristics are evident: uniformity in height of the vegetation cover; uniformity in the texture covering the
ground plane; texture that is finer, shorter, and/ or softer.
Smoothness ratings were made using a five- point rating scale. Slides within a given land- cover category (forest, mixed, edge, and field) were viewed and rated as a group (i.e. within the same session ) .
8. The emergent definition of density
Density is defined as the degree to which veg- etation dominates or impedes one’s view of an environment.
After considerable explorations and discus- sions of the slides, we came to the conclusion that the limitation of visual access is an important as- pect of conceptualizing this construct. Our rat- ings of density thus incorporated the following subthemes: visual penetration-how difficult it is to see through the vegetation; proximity of the high vegetation to the viewer-in other words, visual accessibility is reduced if the foreground is dominated by high vegetation; potential or ac- tual light from the sky-if one can see sky or areas of bright light (or where light would be falling if the sun were shining) there is greater visual ac- cess and hence less density.
Initial ratings for density used a five-point scale, but this was not sensitive enough to the variation when considering the different land- cover categories. The scenes were thus re-evalu- ated using a ten-point scale.
9. Smoothness and density related to landcover types
As mentioned above, there is no set combina- tion of subthemes that is critical for the evalua- tion of density and smoothness. Furthermore, the ratings were done within the context of a specific landcover category. Table 1 provides the rated values for the sample scenes shown in Figs. l-4.
As can be seen in Table 1, smoothness was rated highest for the field category. These scenes (Fig. 4) have the most consistent short vegeta- tion and uniformity of texture. Edge scenes also received relatively high ratings on smoothness.

56 T. Brown /Landscape and Urban Plarmng 30 (I 994) 49-58
Table 1 Smoothness and density Ratings for Figs. 1-4 scenes
Top Bottom
Forest (Fig. 1) Smoothness’ 3.6 8.0 Density’ IO 8
Mixed (Fig. 2) Smoothness’ 6.0 3.0 Density* 7 1
Edge (Fig. 3) Smoothness’ 5.6 7.0 Density’ 7 6
Field (Fig. 4) Smoothness’ 8.8 9.0 Density’ 2 3
‘Although smoothness ratings used a five-point scale, the val- ues are doubled for comparability with density ratings. ‘Based on a ten-point scale.
For this category (Fig. 3 ) the vegetation is not as short nor as uniform, but the foreground ex- hibits the ‘softer’ texture subtheme. However, in the overall comparison between the field and edge categories on the one hand, and the forest and mixed on the other, the differences in smoothness ratings are very much influenced by the uniformity of vegetation height and texture. The pairs of scenes in the mixed (Fig. 2 ) and the forest (Fig. 1) categories, respectively, demon- strate the considerable variability that is possible within a landcover type. Across the full set of scenes, the forest and edge categories showed the widest ranges.
The forest scene at the bottom in Fig. 1 shows a ground plane that is quite bare. In fact, the ma- jor difficulty encountered in evaluating scenes for smoothness concerned the definition of the ground plane. As the amount (height) of vege- tation (e.g. grass, shrub, or trees) increases, it becomes more difficult to consider it as a part of the ground plane. Different plant species also contribute to this dilemma.
Density is understandably greatest in the for- est scenes, although forests too can vary in the degree of visual access and penetrability of light from the sky. Whereas the two field scenes in Fig.
4 are both at the low end of density ratings (i.e. very open), other field scenes received scores as high as six on this attribute. Higher vegetation can be relatively high in smoothness, although adding markedly to the density.
The mixed and edge categories are less likely to be at either extreme of the density scale. Al- though the mixed (Fig. 2) and edge (Fig. 3) scenes are visually distinct, the density ratings for the four scenes are very similar. The vegetation in the mixed category scenes impedes one’s view of the area. The varying height of the vegetation and its position in the foreground of the scene limits visual penetration. Although the fore- ground plays an important role in the definition of smoothness, density has no comparable em- phasis. As a result, one might expect that scenes in the edge category would vary widely in den- sity. This expectation was in fact borne out. Across the entire set of scenes, those in the edge category showed the most variability in density.
10. Next steps and conclusions
Smoothness and density are not reflected in assessments of the visual resource used by fed- eral agencies. However, previous studies have identified these constructs as important vari- ables among those useful in predicting scenic values. To extract variables such as these from mapped data one must have operational defini- tions that are expressed in terms of geographic information system (GIS ) derivable values (Fig. 5 ) . This research used expert landscape evalua- tors who rated a set of landscape photographs from different landcover categories to generate a consensus on effective operational definitions. From this effort we have a far clearer under- standing of smoothness and density in the con- text of the relatively characteristic landscape of the local region.
Smoothness and density are also potentially useful constructs in the management of the vis- ual resource. Manipulation of ground texture to enhance scenic quality and attention to the rela- tive openness of different kinds of covers are practices that lend themselves to a great variety
T. Brown /Landscape and Urban Planning 30 (1994) 49-58 57
Scenic
Fig. 5. The process of predicting scenic resource values from mapped data may be conceptualized as illustrated.
of settings. It must be emphasized that the spe- cific manipulations that are likely to enhance the visual resource will vary regionally and will be influenced by the existing landcover types. The purpose of the work described here is not to sug- gest a universal smoothing of the ground texture nor an avoidance of openness at all costs.
The paper illustrates the developed defini- tions by showing the original photographs and the experts’ consensus ratings. In future work, mech- anisms for estimation of smoothness and density drawing on digital mapped data and based on these definitions will be developed. This re- quires several steps, and each of these is likely to generate at least as many obstacles as the steps used to reach this point. With the clearer concep- tualization of the constructs a set of scenes needs to be rated by judges who reach independent de- cisions. Only if the inter-rater reliability is suffi- ciently high can one establish that the definitions are sufficiently clear.
On the basis of these ratings, scenes need to be selected that reflect different combinations of smoothness and density. The viewsheds of these scenes would then be located in a spatial infor- mation data base. Using procedures available in remote sensing systems and/or GISs, these viewsheds would then be used to identify their mapped equivalence to the composite smooth- ness and density ratings. This will require explo- ration of various filtering analyses for density and spatial distributions in different spectral bands.
There are several techniques that could be per- formed based on neighborhooding characteris- tics of the data. Success with this effort would then lead to a computer-generated score for the other viewsheds to see the degree of similarity between the scene-based ratings and ones de- rived from the mapped information.
The specification of these steps hides the many puzzles that require solution. Not the least of these is that one is totally at the mercy of the data in one’s data base. Matching the scene-based in- formation to data that were collected in a differ- ent season or year or that do not include vegeta- tive information would clearly lead to poor consequences. Furthermore, even successful ver- ification in one instance would hardly provide the kind of support that will permit map-based protection of the scenic resource. To achieve this goal will require the collaboration of many indi- viduals each tackling this challenge in terms of the constraints of particular landscapes.
Acknowledgments
The work reported here was a collaborative ef- fort including Stephen Kaplan and Rachel Ka- plan. I would also like to thank Ian Bishop for his helpful comments and suggestions. The work was supported, in part, by funding from the US For- est Service, North Central Forest Experiment Station, under Cooperative Agreement 23-89-04.
58 T. Brown / Landscape and Urban Planning 30 (I 994) 49-58
References Craig (Editor). Noun Classes and Categorization. John Benjamins, Amsterdam.
Daniel. T.C. and Vining, J.. 1983. Methodological issues in the assessment of landscape quality. In: I. Altman and J.F. Wohlwill (Editors), Behavior and the Natural Environ- ment. Plenum. New York.
Rosch, E., 1978. Principles of categorization. In: E. Rosch and B.B. Lloyd (Editors), Cognition and Categorization. Erlbaum, Hillsdale, NJ.
Gimblett. R.H., Itami. R.M. and Fitzgibbon, J.E.. 1985. Mystery in an information processing model of landscape preference. Landscape J., 4: 87-95.
Kaplan, S. and Kaplan. R., 1978. Humanscape: Environ- ments for People. Duxbuty. Belmont, CA (republished by Ulrich, Ann Arbor, Ml, 1982).
Kaplan, R. and Kaplan, S.. 1989. The Experience of Nature: A Psychological Perspective. Cambridge University Press, New York.
Kaplan, R., Kaplan, S. and Brown, T., 1989. Environmental preference: a comparison of four domains of predictors. Environ. Behav.. 2 1: 509-530.
Posner, M.I., 1986. Empirical studies of prototypes. In: C.
Smardon, R.C., Palmer, J.F. and Fellernan, J.P. (Editors). 1986. Foundations for Visual Project Analysis. Wiley, New York.
US Bureau of Land Management, 1980. Visual resource management program. US Department of Interior. Wash- ington, DC.
US Forest Service, 1974. The visual management system. In: National Forest Landscape Management. Vol. 2. US De- partment of Agnculturc, Washington, DC.
Woodcock. D.M.. 1982. A functionalist approach to environ- mental preference. Doctoral Dissertation, University of Michigan.
Zube, E.H., Sell, J.L. and Taylor. J.G.. 1982. Landscape per- ception: research. application and theory. Landscape Plann., 9: l-33.