Embed Size (px)
Citation preview
BANK OF GUYANA
STATISTICAL
BULLETIN
RESEARCH DEPT. MAR. 2005
TABLE OF CONTENTS
1. MONETARY AUTHORITY
1.1 Bank of Guyana: Assets1.2 Bank of Guyana: Liabilities1.3 Bank of Guyana: Currency Notes Issue1.4 Bank of Guyana: Coins Issue
2. COMMERCIAL BANKS
2.1(a) Commercial Banks: Assets2.1(b) Commercial Banks: Liabilities, Capital and Reserves2.2 Commercial Banks: Total Deposits2.3 Commercial Banks: Demand Deposits2.4 Commercial Banks: Time Deposits2.5 Commercial Banks: Savings Deposits2.6 Commercial Banks: Time Deposits by Maturity2.7 Commercial Banks: Debits and Credits on Savings Accounts2.8 Commercial Banks: Debits on Chequing Accounts2.9 Commercial Banks: Clearing Balances2.10 Commercial Banks: Total Loans and Advances2.11 Commercial Banks: Demand Loans and Advances2.12 Commercial Banks: Term Loans and Advances2.13(a) Commercial Banks: Loans and Advances to Residents by Sector2.13(b) Commercial Banks: Loans and Advances to Residents by Sector2.13(c) Commercial Banks: Loans and Advances to Residents by Sector2.13(d) Commercial Banks: Loans and Advances to Residents by Sector2.13(e) Commercial Banks: Loans and Advances to Residents by Sector2.14 Commercial Banks: Liquid Assets2.15 Commercial Banks: Minimum Reserve Requirements
3. BANKING SYSTEM
3.1 Monetary Survey
4. MONEY AND CAPITAL MARKET RATES
4.1 Guyana: Selected Interest Rates4.2 Commercial Banks: Selected Interest Rates4.3 Comparative Treasury Bill Rates and Bank Rates
5. NON-BANK FINANCIAL INSTITUTIONS
5.1 The New Building Society: Assets and Liabilities5.2(a) Trust Companies: Assets5.2(b) Trust Companies: Liabilities5.2(c) Finance Companies: Assets5.2(d) Finance Companies: Liabilities5.3(a) Life Domestic Insurance Companies: Assets and Liabilities5.3(b) Non-Life Domestic Insurance Companies: Assets and Liabilities5.3(c) Consolidated Domestic Insurance Companies: Assets and Liabilities5.4 Pension Schemes: Assets and Liabilities5.5 Guyana Co-Operative Mortgage Finance Bank: Assets and Liabilities
6. PUBLIC FINANCE
6.1 Central Government Finances: Summary6.2 Central Government: Current Revenue6.3 Central Government: Current Expenditure6.4 Public Corporations Finances: Summary
7. PUBLIC DEBT
7.1 Domestic Public Debt7.2 Government of Guyana: Treasury Bills by Holders and Defence Bonds7.3 Government of Guyana: Debentures By Holders and Defence Bonds7.4 Government of Guyana: Debentures by Maturity and Terms7.5 External Public Debt
8. INTERNATIONAL TRADE AND PAYMENTS
8.1(1) Imports by End-Use (1994-2004)8.1(2) Imports by End-Use (G$ Summary)8.1(2a) Imports by End-Use (US$ Summary)8.2 Domestic Exports (G$)8.2(a) Domestic Exports (US$)8.3 Guyana: Selected Exports by Volume, Value and Unit Value8.4(a) Guyana: Destination of Major Exports for 19938.4(b) Guyana: Destination of Major Exports for 19948.4(c) Guyana: Destination of Major Exports for 19958.5 Visible Trade (G$)8.5(a) Visible Trade (US$)8.6 International Reserves and Foreign Assets8.7(a) Foreign Exchange Market: Purchases8.7(b) Foreign Exchange Market: Sales8.8 Balance of Payments

9. FOREIGN EXCHANGE RATES AND COMMODITY PRICES
9.1 Changes in Bank of Guyana Transaction Exchange Rate9.2(a) Exchange Rates of CARICOM Countries9.2(b) Exchange Rate (G$/US$)9.3 Exchange Cross-Rates of CARICOM Countries9.4 Exchange Rates Against the U.S. Dollar (1990 - 1998)9.4(a) Fixed Exchange Rates Of EMU-Member Countries Against the Euro9.5 Selected Exchange Rates Against the U.S. Dollar (Dec. 2001 – Dec. 2004)9.5(a) Commodity Prices9.6 Monthly Average Market Exchange Rates
10. NATIONAL INCOME ACCOUNTS AND PRODUCTION INDICATORS
10.1 Gross Domestic Product, Income And Expenditure (At Current Prices)10.2 Gross Domestic Product (At 1988 Prices)10.3(a) Production of Major Commodities10.3(b) Production Indicators: Agriculture10.3(c1) Production Indicators: Manufacturing10.3(c2) Production Indicators: Manufacturing10.3(c3) Production Indicators: Manufacturing10.3(d) Production Indicators: Mining
11. CONSUMER PRICES
11.1 Guyana: Urban Consumer Price Index11.2 Georgetown: Urban Consumer Price Index11.3 Caricom Countries: Consumer Price Indices
12. APPENDICES
I. General NotesII. Notes to the Tables
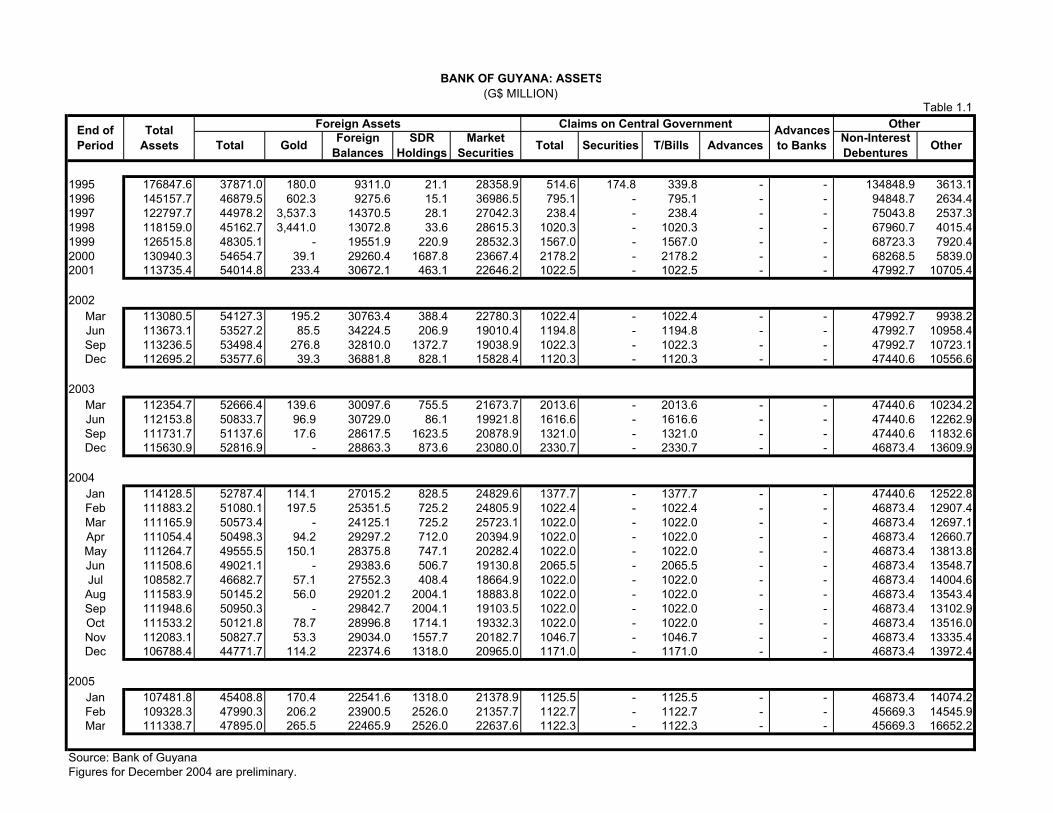
1995 176847.6 37871.0 180.0 9311.0 21.1 28358.9 514.6 174.8 339.8 - - 134848.9 3613.11996 145157.7 46879.5 602.3 9275.6 15.1 36986.5 795.1 - 795.1 - - 94848.7 2634.41997 122797.7 44978.2 3,537.3 14370.5 28.1 27042.3 238.4 - 238.4 - - 75043.8 2537.31998 118159.0 45162.7 3,441.0 13072.8 33.6 28615.3 1020.3 - 1020.3 - - 67960.7 4015.41999 126515.8 48305.1 - 19551.9 220.9 28532.3 1567.0 - 1567.0 - - 68723.3 7920.42000 130940.3 54654.7 39.1 29260.4 1687.8 23667.4 2178.2 - 2178.2 - - 68268.5 5839.02001 113735.4 54014.8 233.4 30672.1 463.1 22646.2 1022.5 - 1022.5 - - 47992.7 10705.4
2002Mar 113080.5 54127.3 195.2 30763.4 388.4 22780.3 1022.4 - 1022.4 - - 47992.7 9938.2Jun 113673.1 53527.2 85.5 34224.5 206.9 19010.4 1194.8 - 1194.8 - - 47992.7 10958.4Sep 113236.5 53498.4 276.8 32810.0 1372.7 19038.9 1022.3 - 1022.3 - - 47992.7 10723.1Dec 112695.2 53577.6 39.3 36881.8 828.1 15828.4 1120.3 - 1120.3 - - 47440.6 10556.6
2003Mar 112354.7 52666.4 139.6 30097.6 755.5 21673.7 2013.6 - 2013.6 - - 47440.6 10234.2Jun 112153.8 50833.7 96.9 30729.0 86.1 19921.8 1616.6 - 1616.6 - - 47440.6 12262.9Sep 111731.7 51137.6 17.6 28617.5 1623.5 20878.9 1321.0 - 1321.0 - - 47440.6 11832.6Dec 115630.9 52816.9 - 28863.3 873.6 23080.0 2330.7 - 2330.7 - - 46873.4 13609.9
2004Jan 114128.5 52787.4 114.1 27015.2 828.5 24829.6 1377.7 - 1377.7 - - 47440.6 12522.8Feb 111883.2 51080.1 197.5 25351.5 725.2 24805.9 1022.4 - 1022.4 - - 46873.4 12907.4Mar 111165.9 50573.4 - 24125.1 725.2 25723.1 1022.0 - 1022.0 - - 46873.4 12697.1Apr 111054.4 50498.3 94.2 29297.2 712.0 20394.9 1022.0 - 1022.0 - - 46873.4 12660.7May 111264.7 49555.5 150.1 28375.8 747.1 20282.4 1022.0 - 1022.0 - - 46873.4 13813.8Jun 111508.6 49021.1 - 29383.6 506.7 19130.8 2065.5 - 2065.5 - - 46873.4 13548.7Jul 108582.7 46682.7 57.1 27552.3 408.4 18664.9 1022.0 - 1022.0 - - 46873.4 14004.6Aug 111583.9 50145.2 56.0 29201.2 2004.1 18883.8 1022.0 - 1022.0 - - 46873.4 13543.4Sep 111948.6 50950.3 - 29842.7 2004.1 19103.5 1022.0 - 1022.0 - - 46873.4 13102.9Oct 111533.2 50121.8 78.7 28996.8 1714.1 19332.3 1022.0 - 1022.0 - - 46873.4 13516.0Nov 112083.1 50827.7 53.3 29034.0 1557.7 20182.7 1046.7 - 1046.7 - - 46873.4 13335.4Dec 106788.4 44771.7 114.2 22374.6 1318.0 20965.0 1171.0 - 1171.0 - - 46873.4 13972.4
2005Jan 107481.8 45408.8 170.4 22541.6 1318.0 21378.9 1125.5 - 1125.5 - - 46873.4 14074.2Feb 109328.3 47990.3 206.2 23900.5 2526.0 21357.7 1122.7 - 1122.7 - - 45669.3 14545.9Mar 111338.7 47895.0 265.5 22465.9 2526.0 22637.6 1122.3 - 1122.3 - - 45669.3 16652.2
Source: Bank of GuyanaFigures for December 2004 are preliminary.
Other
Other
Claims on Central GovernmentForeign AssetsMarket
SecuritiesSDR
HoldingsForeign
BalancesGoldTotal Advances
(G$ MILLION)BANK OF GUYANA: ASSETS
Non-Interest Debentures
Advances to Banks
End of Period
Table 1.1
Total Assets Total Securities T/Bills
EPDs Other
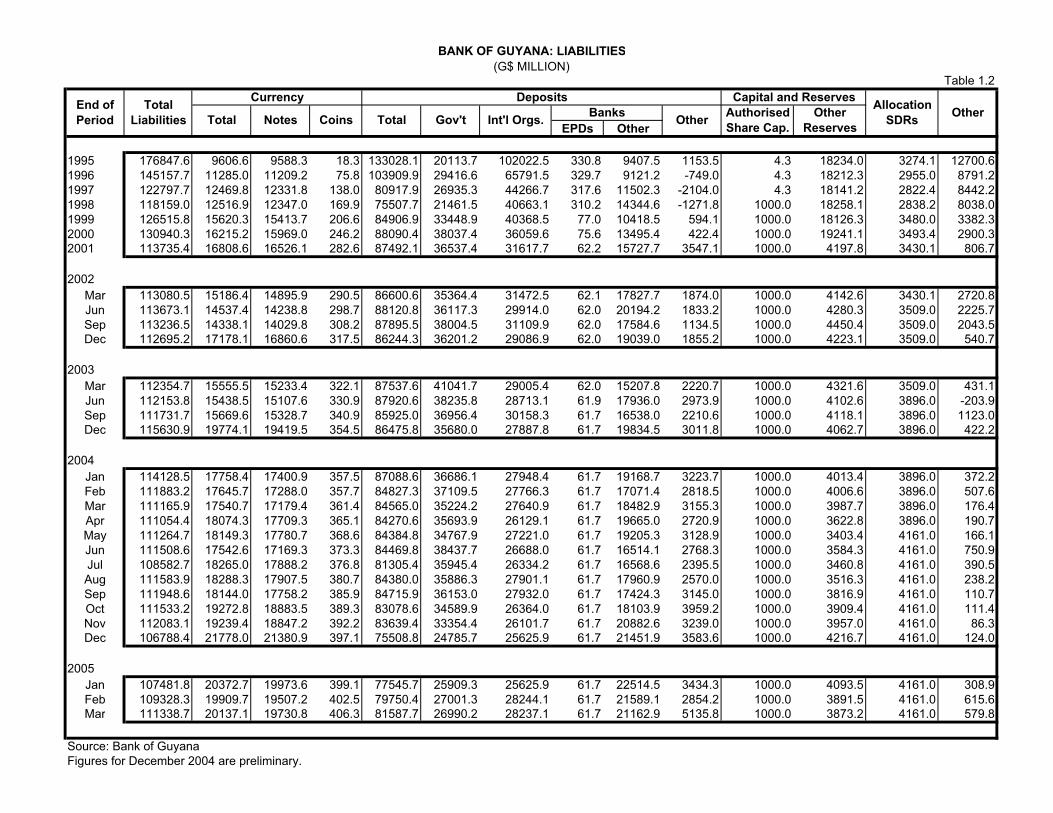
1995 176847.6 9606.6 9588.3 18.3 133028.1 20113.7 102022.5 330.8 9407.5 1153.5 4.3 18234.0 3274.1 12700.61996 145157.7 11285.0 11209.2 75.8 103909.9 29416.6 65791.5 329.7 9121.2 -749.0 4.3 18212.3 2955.0 8791.21997 122797.7 12469.8 12331.8 138.0 80917.9 26935.3 44266.7 317.6 11502.3 -2104.0 4.3 18141.2 2822.4 8442.21998 118159.0 12516.9 12347.0 169.9 75507.7 21461.5 40663.1 310.2 14344.6 -1271.8 1000.0 18258.1 2838.2 8038.01999 126515.8 15620.3 15413.7 206.6 84906.9 33448.9 40368.5 77.0 10418.5 594.1 1000.0 18126.3 3480.0 3382.32000 130940.3 16215.2 15969.0 246.2 88090.4 38037.4 36059.6 75.6 13495.4 422.4 1000.0 19241.1 3493.4 2900.32001 113735.4 16808.6 16526.1 282.6 87492.1 36537.4 31617.7 62.2 15727.7 3547.1 1000.0 4197.8 3430.1 806.7
2002Mar 113080.5 15186.4 14895.9 290.5 86600.6 35364.4 31472.5 62.1 17827.7 1874.0 1000.0 4142.6 3430.1 2720.8Jun 113673.1 14537.4 14238.8 298.7 88120.8 36117.3 29914.0 62.0 20194.2 1833.2 1000.0 4280.3 3509.0 2225.7Sep 113236.5 14338.1 14029.8 308.2 87895.5 38004.5 31109.9 62.0 17584.6 1134.5 1000.0 4450.4 3509.0 2043.5Dec 112695.2 17178.1 16860.6 317.5 86244.3 36201.2 29086.9 62.0 19039.0 1855.2 1000.0 4223.1 3509.0 540.7
2003Mar 112354.7 15555.5 15233.4 322.1 87537.6 41041.7 29005.4 62.0 15207.8 2220.7 1000.0 4321.6 3509.0 431.1Jun 112153.8 15438.5 15107.6 330.9 87920.6 38235.8 28713.1 61.9 17936.0 2973.9 1000.0 4102.6 3896.0 -203.9Sep 111731.7 15669.6 15328.7 340.9 85925.0 36956.4 30158.3 61.7 16538.0 2210.6 1000.0 4118.1 3896.0 1123.0Dec 115630.9 19774.1 19419.5 354.5 86475.8 35680.0 27887.8 61.7 19834.5 3011.8 1000.0 4062.7 3896.0 422.2
2004Jan 114128.5 17758.4 17400.9 357.5 87088.6 36686.1 27948.4 61.7 19168.7 3223.7 1000.0 4013.4 3896.0 372.2Feb 111883.2 17645.7 17288.0 357.7 84827.3 37109.5 27766.3 61.7 17071.4 2818.5 1000.0 4006.6 3896.0 507.6Mar 111165.9 17540.7 17179.4 361.4 84565.0 35224.2 27640.9 61.7 18482.9 3155.3 1000.0 3987.7 3896.0 176.4Apr 111054.4 18074.3 17709.3 365.1 84270.6 35693.9 26129.1 61.7 19665.0 2720.9 1000.0 3622.8 3896.0 190.7May 111264.7 18149.3 17780.7 368.6 84384.8 34767.9 27221.0 61.7 19205.3 3128.9 1000.0 3403.4 4161.0 166.1Jun 111508.6 17542.6 17169.3 373.3 84469.8 38437.7 26688.0 61.7 16514.1 2768.3 1000.0 3584.3 4161.0 750.9Jul 108582.7 18265.0 17888.2 376.8 81305.4 35945.4 26334.2 61.7 16568.6 2395.5 1000.0 3460.8 4161.0 390.5Aug 111583.9 18288.3 17907.5 380.7 84380.0 35886.3 27901.1 61.7 17960.9 2570.0 1000.0 3516.3 4161.0 238.2Sep 111948.6 18144.0 17758.2 385.9 84715.9 36153.0 27932.0 61.7 17424.3 3145.0 1000.0 3816.9 4161.0 110.7Oct 111533.2 19272.8 18883.5 389.3 83078.6 34589.9 26364.0 61.7 18103.9 3959.2 1000.0 3909.4 4161.0 111.4Nov 112083.1 19239.4 18847.2 392.2 83639.4 33354.4 26101.7 61.7 20882.6 3239.0 1000.0 3957.0 4161.0 86.3Dec 106788.4 21778.0 21380.9 397.1 75508.8 24785.7 25625.9 61.7 21451.9 3583.6 1000.0 4216.7 4161.0 124.0
2005Jan 107481.8 20372.7 19973.6 399.1 77545.7 25909.3 25625.9 61.7 22514.5 3434.3 1000.0 4093.5 4161.0 308.9Feb 109328.3 19909.7 19507.2 402.5 79750.4 27001.3 28244.1 61.7 21589.1 2854.2 1000.0 3891.5 4161.0 615.6Mar 111338.7 20137.1 19730.8 406.3 81587.7 26990.2 28237.1 61.7 21162.9 5135.8 1000.0 3873.2 4161.0 579.8
Source: Bank of GuyanaFigures for December 2004 are preliminary.
Other Reserves
Allocation SDRs Other
BANK OF GUYANA: LIABILITIES(G$ MILLION)
Table 1.2
Gov't Banks Other Authorised Share Cap.
Capital and ReservesEnd of Period
Total Liabilities
Currency
Total Notes Coins
Deposits
Int'l Orgs.Total
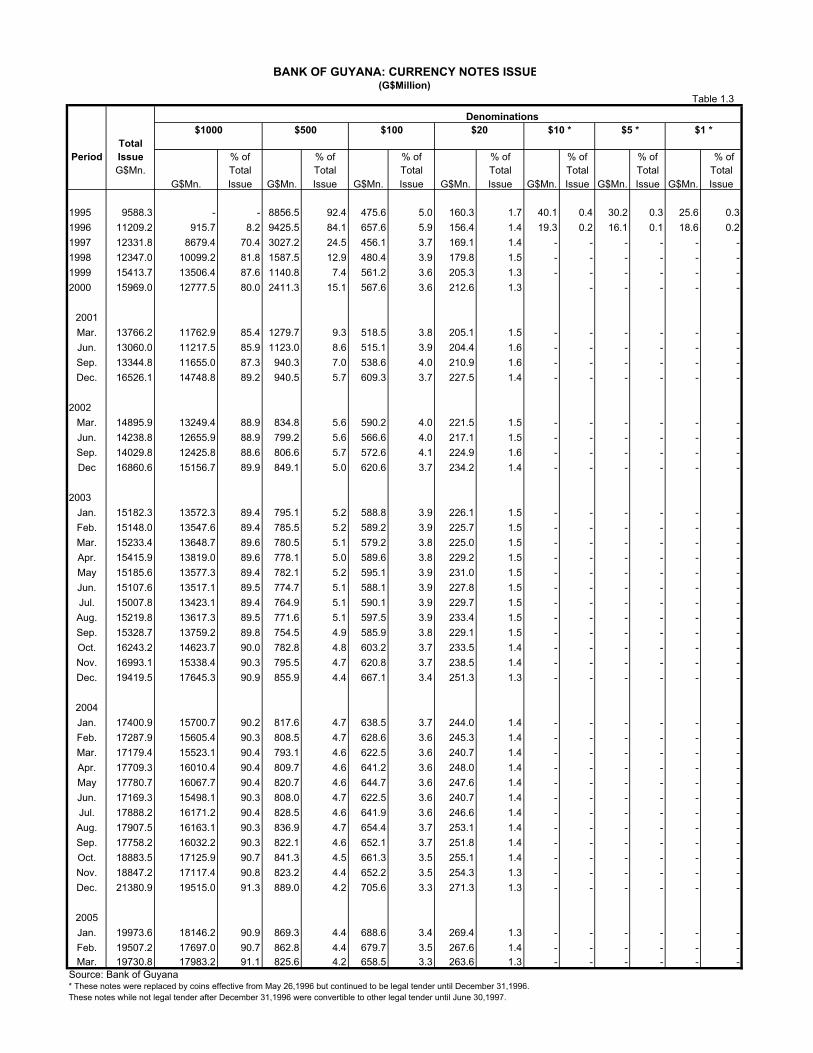
BANK OF GUYANA: CURRENCY NOTES ISSUE(G$Million)
Table 1.3
Denominations$1000 $500 $100 $20 $10 * $5 * $1 *
TotalPeriod Issue % of % of % of % of % of % of % of
G$Mn. Total Total Total Total Total Total TotalG$Mn. Issue G$Mn. Issue G$Mn. Issue G$Mn. Issue G$Mn. Issue G$Mn. Issue G$Mn. Issue
1995 9588.3 - - 8856.5 92.4 475.6 5.0 160.3 1.7 40.1 0.4 30.2 0.3 25.6 0.31996 11209.2 915.7 8.2 9425.5 84.1 657.6 5.9 156.4 1.4 19.3 0.2 16.1 0.1 18.6 0.21997 12331.8 8679.4 70.4 3027.2 24.5 456.1 3.7 169.1 1.4 - - - - - -1998 12347.0 10099.2 81.8 1587.5 12.9 480.4 3.9 179.8 1.5 - - - - - -1999 15413.7 13506.4 87.6 1140.8 7.4 561.2 3.6 205.3 1.3 - - - - - -2000 15969.0 12777.5 80.0 2411.3 15.1 567.6 3.6 212.6 1.3 - - - - -
2001Mar. 13766.2 11762.9 85.4 1279.7 9.3 518.5 3.8 205.1 1.5 - - - - - -Jun. 13060.0 11217.5 85.9 1123.0 8.6 515.1 3.9 204.4 1.6 - - - - - -Sep. 13344.8 11655.0 87.3 940.3 7.0 538.6 4.0 210.9 1.6 - - - - - -Dec. 16526.1 14748.8 89.2 940.5 5.7 609.3 3.7 227.5 1.4 - - - - - -
2002Mar. 14895.9 13249.4 88.9 834.8 5.6 590.2 4.0 221.5 1.5 - - - - - -Jun. 14238.8 12655.9 88.9 799.2 5.6 566.6 4.0 217.1 1.5 - - - - - -Sep. 14029.8 12425.8 88.6 806.6 5.7 572.6 4.1 224.9 1.6 - - - - - -Dec 16860.6 15156.7 89.9 849.1 5.0 620.6 3.7 234.2 1.4 - - - - - -
2003Jan. 15182.3 13572.3 89.4 795.1 5.2 588.8 3.9 226.1 1.5 - - - - - -Feb. 15148.0 13547.6 89.4 785.5 5.2 589.2 3.9 225.7 1.5 - - - - - -Mar. 15233.4 13648.7 89.6 780.5 5.1 579.2 3.8 225.0 1.5 - - - - - -Apr. 15415.9 13819.0 89.6 778.1 5.0 589.6 3.8 229.2 1.5 - - - - - -May 15185.6 13577.3 89.4 782.1 5.2 595.1 3.9 231.0 1.5 - - - - - -Jun. 15107.6 13517.1 89.5 774.7 5.1 588.1 3.9 227.8 1.5 - - - - - -Jul. 15007.8 13423.1 89.4 764.9 5.1 590.1 3.9 229.7 1.5 - - - - - -Aug. 15219.8 13617.3 89.5 771.6 5.1 597.5 3.9 233.4 1.5 - - - - - -Sep. 15328.7 13759.2 89.8 754.5 4.9 585.9 3.8 229.1 1.5 - - - - - -Oct. 16243.2 14623.7 90.0 782.8 4.8 603.2 3.7 233.5 1.4 - - - - - -Nov. 16993.1 15338.4 90.3 795.5 4.7 620.8 3.7 238.5 1.4 - - - - - -Dec. 19419.5 17645.3 90.9 855.9 4.4 667.1 3.4 251.3 1.3 - - - - - -
2004Jan. 17400.9 15700.7 90.2 817.6 4.7 638.5 3.7 244.0 1.4 - - - - - -Feb. 17287.9 15605.4 90.3 808.5 4.7 628.6 3.6 245.3 1.4 - - - - - -Mar. 17179.4 15523.1 90.4 793.1 4.6 622.5 3.6 240.7 1.4 - - - - - -Apr. 17709.3 16010.4 90.4 809.7 4.6 641.2 3.6 248.0 1.4 - - - - - -May 17780.7 16067.7 90.4 820.7 4.6 644.7 3.6 247.6 1.4 - - - - - -Jun. 17169.3 15498.1 90.3 808.0 4.7 622.5 3.6 240.7 1.4 - - - - - -Jul. 17888.2 16171.2 90.4 828.5 4.6 641.9 3.6 246.6 1.4 - - - - - -Aug. 17907.5 16163.1 90.3 836.9 4.7 654.4 3.7 253.1 1.4 - - - - - -Sep. 17758.2 16032.2 90.3 822.1 4.6 652.1 3.7 251.8 1.4 - - - - - -Oct. 18883.5 17125.9 90.7 841.3 4.5 661.3 3.5 255.1 1.4 - - - - - -Nov. 18847.2 17117.4 90.8 823.2 4.4 652.2 3.5 254.3 1.3 - - - - - -Dec. 21380.9 19515.0 91.3 889.0 4.2 705.6 3.3 271.3 1.3 - - - - - -
2005Jan. 19973.6 18146.2 90.9 869.3 4.4 688.6 3.4 269.4 1.3 - - - - - -Feb. 19507.2 17697.0 90.7 862.8 4.4 679.7 3.5 267.6 1.4 - - - - - -Mar. 19730.8 17983.2 91.1 825.6 4.2 658.5 3.3 263.6 1.3 - - - - - -
Source: Bank of Guyana* These notes were replaced by coins effective from May 26,1996 but continued to be legal tender until December 31,1996.These notes while not legal tender after December 31,1996 were convertible to other legal tender until June 30,1997.
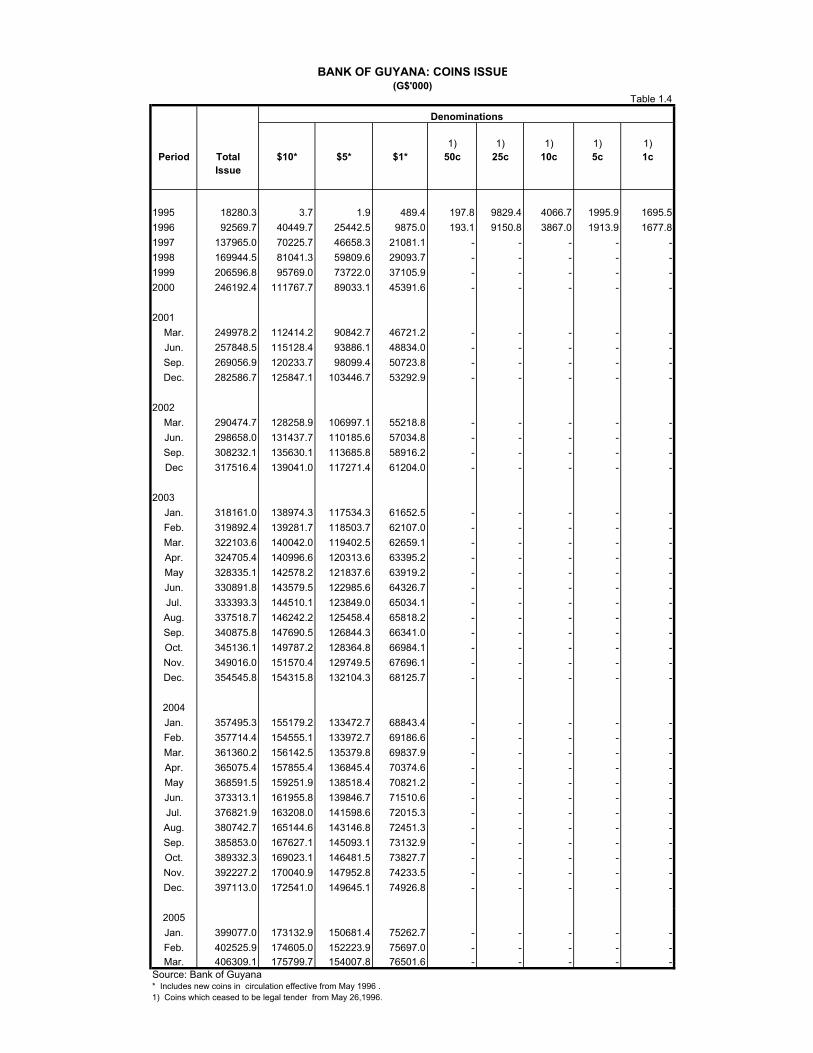
BANK OF GUYANA: COINS ISSUE(G$'000)
Table 1.4
Denominations
1) 1) 1) 1) 1)Period Total $10* $5* $1* 50c 25c 10c 5c 1c
Issue
1995 18280.3 3.7 1.9 489.4 197.8 9829.4 4066.7 1995.9 1695.51996 92569.7 40449.7 25442.5 9875.0 193.1 9150.8 3867.0 1913.9 1677.81997 137965.0 70225.7 46658.3 21081.1 - - - - -1998 169944.5 81041.3 59809.6 29093.7 - - - - -1999 206596.8 95769.0 73722.0 37105.9 - - - - -2000 246192.4 111767.7 89033.1 45391.6 - - - - -
2001Mar. 249978.2 112414.2 90842.7 46721.2 - - - - -Jun. 257848.5 115128.4 93886.1 48834.0 - - - - -Sep. 269056.9 120233.7 98099.4 50723.8 - - - - -Dec. 282586.7 125847.1 103446.7 53292.9 - - - - -
2002Mar. 290474.7 128258.9 106997.1 55218.8 - - - - -Jun. 298658.0 131437.7 110185.6 57034.8 - - - - -Sep. 308232.1 135630.1 113685.8 58916.2 - - - - -Dec 317516.4 139041.0 117271.4 61204.0 - - - - -
2003Jan. 318161.0 138974.3 117534.3 61652.5 - - - - -Feb. 319892.4 139281.7 118503.7 62107.0 - - - - -Mar. 322103.6 140042.0 119402.5 62659.1 - - - - -Apr. 324705.4 140996.6 120313.6 63395.2 - - - - -May 328335.1 142578.2 121837.6 63919.2 - - - - -Jun. 330891.8 143579.5 122985.6 64326.7 - - - - -Jul. 333393.3 144510.1 123849.0 65034.1 - - - - -Aug. 337518.7 146242.2 125458.4 65818.2 - - - - -Sep. 340875.8 147690.5 126844.3 66341.0 - - - - -Oct. 345136.1 149787.2 128364.8 66984.1 - - - - -Nov. 349016.0 151570.4 129749.5 67696.1 - - - - -Dec. 354545.8 154315.8 132104.3 68125.7 - - - - -
2004Jan. 357495.3 155179.2 133472.7 68843.4 - - - - -Feb. 357714.4 154555.1 133972.7 69186.6 - - - - -Mar. 361360.2 156142.5 135379.8 69837.9 - - - - -Apr. 365075.4 157855.4 136845.4 70374.6 - - - - -May 368591.5 159251.9 138518.4 70821.2 - - - - -Jun. 373313.1 161955.8 139846.7 71510.6 - - - - -Jul. 376821.9 163208.0 141598.6 72015.3 - - - - -Aug. 380742.7 165144.6 143146.8 72451.3 - - - - -Sep. 385853.0 167627.1 145093.1 73132.9 - - - - -Oct. 389332.3 169023.1 146481.5 73827.7 - - - - -Nov. 392227.2 170040.9 147952.8 74233.5 - - - - -Dec. 397113.0 172541.0 149645.1 74926.8 - - - - -
2005Jan. 399077.0 173132.9 150681.4 75262.7 - - - - -Feb. 402525.9 174605.0 152223.9 75697.0 - - - - -Mar. 406309.1 175799.7 154007.8 76501.6 - - - - -
Source: Bank of Guyana* Includes new coins in circulation effective from May 1996 .1) Coins which ceased to be legal tender from May 26,1996.
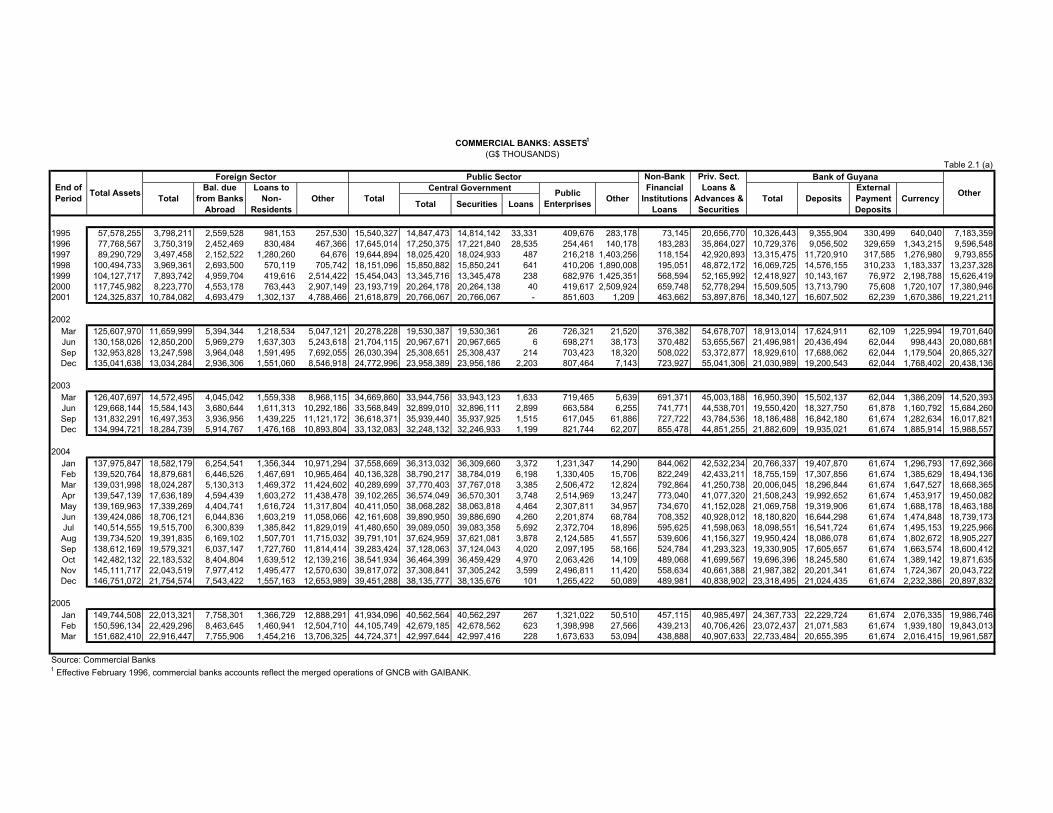
1995 57,578,255 3,798,211 2,559,528 981,153 257,530 15,540,327 14,847,473 14,814,142 33,331 409,676 283,178 73,145 20,656,770 10,326,443 9,355,904 330,499 640,040 7,183,3591996 77,768,567 3,750,319 2,452,469 830,484 467,366 17,645,014 17,250,375 17,221,840 28,535 254,461 140,178 183,283 35,864,027 10,729,376 9,056,502 329,659 1,343,215 9,596,5481997 89,290,729 3,497,458 2,152,522 1,280,260 64,676 19,644,894 18,025,420 18,024,933 487 216,218 1,403,256 118,154 42,920,893 13,315,475 11,720,910 317,585 1,276,980 9,793,8551998 100,494,733 3,969,361 2,693,500 570,119 705,742 18,151,096 15,850,882 15,850,241 641 410,206 1,890,008 195,051 48,872,172 16,069,725 14,576,155 310,233 1,183,337 13,237,3281999 104,127,717 7,893,742 4,959,704 419,616 2,514,422 15,454,043 13,345,716 13,345,478 238 682,976 1,425,351 568,594 52,165,992 12,418,927 10,143,167 76,972 2,198,788 15,626,4192000 117,745,982 8,223,770 4,553,178 763,443 2,907,149 23,193,719 20,264,178 20,264,138 40 419,617 2,509,924 659,748 52,778,294 15,509,505 13,713,790 75,608 1,720,107 17,380,9462001 124,325,837 10,784,082 4,693,479 1,302,137 4,788,466 21,618,879 20,766,067 20,766,067 - 851,603 1,209 463,662 53,897,876 18,340,127 16,607,502 62,239 1,670,386 19,221,211
2002Mar 125,607,970 11,659,999 5,394,344 1,218,534 5,047,121 20,278,228 19,530,387 19,530,361 26 726,321 21,520 376,382 54,678,707 18,913,014 17,624,911 62,109 1,225,994 19,701,640Jun 130,158,026 12,850,200 5,969,279 1,637,303 5,243,618 21,704,115 20,967,671 20,967,665 6 698,271 38,173 370,482 53,655,567 21,496,981 20,436,494 62,044 998,443 20,080,681Sep 132,953,828 13,247,598 3,964,048 1,591,495 7,692,055 26,030,394 25,308,651 25,308,437 214 703,423 18,320 508,022 53,372,877 18,929,610 17,688,062 62,044 1,179,504 20,865,327Dec 135,041,638 13,034,284 2,936,306 1,551,060 8,546,918 24,772,996 23,958,389 23,956,186 2,203 807,464 7,143 723,927 55,041,306 21,030,989 19,200,543 62,044 1,768,402 20,438,136
2003Mar 126,407,697 14,572,495 4,045,042 1,559,338 8,968,115 34,669,860 33,944,756 33,943,123 1,633 719,465 5,639 691,371 45,003,188 16,950,390 15,502,137 62,044 1,386,209 14,520,393Jun 129,668,144 15,584,143 3,680,644 1,611,313 10,292,186 33,568,849 32,899,010 32,896,111 2,899 663,584 6,255 741,771 44,538,701 19,550,420 18,327,750 61,878 1,160,792 15,684,260Sep 131,832,291 16,497,353 3,936,956 1,439,225 11,121,172 36,618,371 35,939,440 35,937,925 1,515 617,045 61,886 727,722 43,784,536 18,186,488 16,842,180 61,674 1,282,634 16,017,821Dec 134,994,721 18,284,739 5,914,767 1,476,168 10,893,804 33,132,083 32,248,132 32,246,933 1,199 821,744 62,207 855,478 44,851,255 21,882,609 19,935,021 61,674 1,885,914 15,988,557
2004Jan 137,975,847 18,582,179 6,254,541 1,356,344 10,971,294 37,558,669 36,313,032 36,309,660 3,372 1,231,347 14,290 844,062 42,532,234 20,766,337 19,407,870 61,674 1,296,793 17,692,366Feb 139,520,764 18,879,681 6,446,526 1,467,691 10,965,464 40,136,328 38,790,217 38,784,019 6,198 1,330,405 15,706 822,249 42,433,211 18,755,159 17,307,856 61,674 1,385,629 18,494,136Mar 139,031,998 18,024,287 5,130,313 1,469,372 11,424,602 40,289,699 37,770,403 37,767,018 3,385 2,506,472 12,824 792,864 41,250,738 20,006,045 18,296,844 61,674 1,647,527 18,668,365Apr 139,547,139 17,636,189 4,594,439 1,603,272 11,438,478 39,102,265 36,574,049 36,570,301 3,748 2,514,969 13,247 773,040 41,077,320 21,508,243 19,992,652 61,674 1,453,917 19,450,082May 139,169,963 17,339,269 4,404,741 1,616,724 11,317,804 40,411,050 38,068,282 38,063,818 4,464 2,307,811 34,957 734,670 41,152,028 21,069,758 19,319,906 61,674 1,688,178 18,463,188Jun 139,424,086 18,706,121 6,044,836 1,603,219 11,058,066 42,161,608 39,890,950 39,886,690 4,260 2,201,874 68,784 708,352 40,928,012 18,180,820 16,644,298 61,674 1,474,848 18,739,173Jul 140,514,555 19,515,700 6,300,839 1,385,842 11,829,019 41,480,650 39,089,050 39,083,358 5,692 2,372,704 18,896 595,625 41,598,063 18,098,551 16,541,724 61,674 1,495,153 19,225,966Aug 139,734,520 19,391,835 6,169,102 1,507,701 11,715,032 39,791,101 37,624,959 37,621,081 3,878 2,124,585 41,557 539,606 41,156,327 19,950,424 18,086,078 61,674 1,802,672 18,905,227Sep 138,612,169 19,579,321 6,037,147 1,727,760 11,814,414 39,283,424 37,128,063 37,124,043 4,020 2,097,195 58,166 524,784 41,293,323 19,330,905 17,605,657 61,674 1,663,574 18,600,412Oct 142,482,132 22,183,532 8,404,804 1,639,512 12,139,216 38,541,934 36,464,399 36,459,429 4,970 2,063,426 14,109 489,068 41,699,567 19,696,396 18,245,580 61,674 1,389,142 19,871,635Nov 145,111,717 22,043,519 7,977,412 1,495,477 12,570,630 39,817,072 37,308,841 37,305,242 3,599 2,496,811 11,420 558,634 40,661,388 21,987,382 20,201,341 61,674 1,724,367 20,043,722Dec 146,751,072 21,754,574 7,543,422 1,557,163 12,653,989 39,451,288 38,135,777 38,135,676 101 1,265,422 50,089 489,981 40,838,902 23,318,495 21,024,435 61,674 2,232,386 20,897,832
2005Jan 149,744,508 22,013,321 7,758,301 1,366,729 12,888,291 41,934,096 40,562,564 40,562,297 267 1,321,022 50,510 457,115 40,985,497 24,367,733 22,229,724 61,674 2,076,335 19,986,746Feb 150,596,134 22,429,296 8,463,645 1,460,941 12,504,710 44,105,749 42,679,185 42,678,562 623 1,398,998 27,566 439,213 40,706,426 23,072,437 21,071,583 61,674 1,939,180 19,843,013Mar 151,682,410 22,916,447 7,755,906 1,454,216 13,706,325 44,724,371 42,997,644 42,997,416 228 1,673,633 53,094 438,888 40,907,633 22,733,484 20,655,395 61,674 2,016,415 19,961,587
Source: Commercial Banks1 Effective February 1996, commercial banks accounts reflect the merged operations of GNCB with GAIBANK.
End of Period Total Assets OtherTotal
Public SectorForeign Sector Bank of GuyanaCentral GovernmentBal. due
from Banks Abroad
Loans to Non-
Residents
Priv. Sect. Loans &
Advances & Securities
Other TotalExternal Payment Deposits
Total Deposits
COMMERCIAL BANKS: ASSETS1
Table 2.1 (a)(G$ THOUSANDS)
CurrencyTotal Securities LoansPublic
Enterprises Other
Non-Bank Financial
Institutions Loans
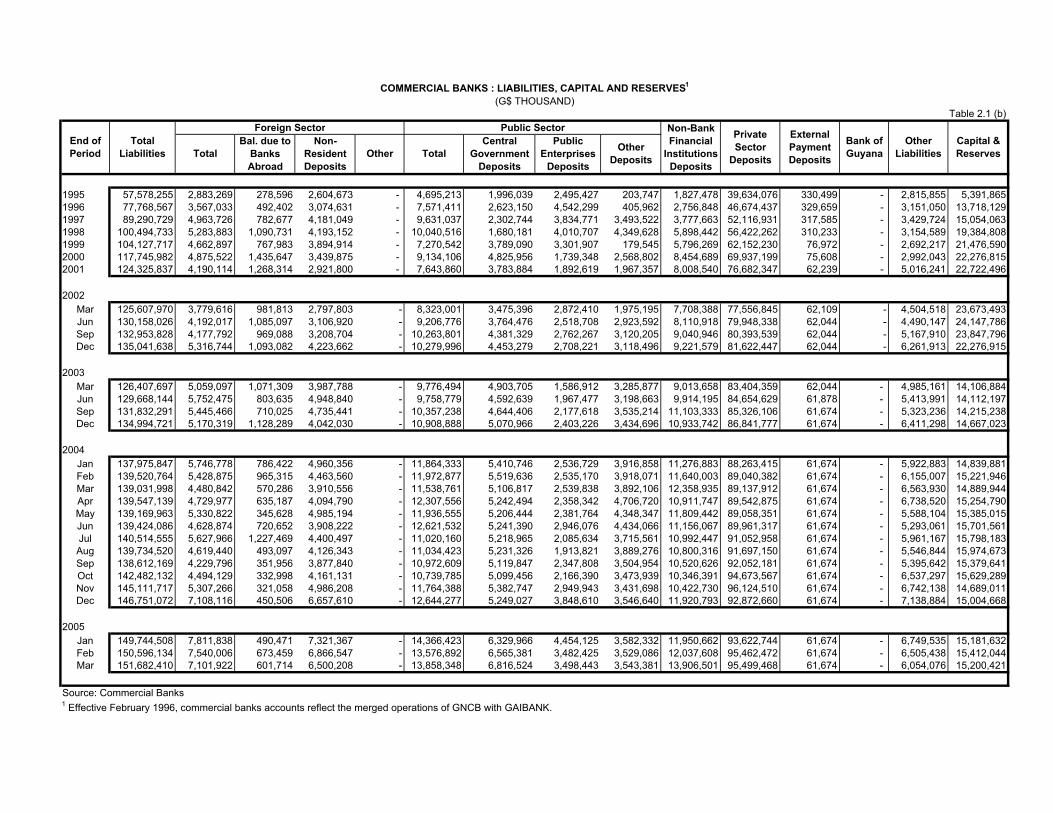
1995 57,578,255 2,883,269 278,596 2,604,673 - 4,695,213 1,996,039 2,495,427 203,747 1,827,478 39,634,076 330,499 - 2,815,855 5,391,8651996 77,768,567 3,567,033 492,402 3,074,631 - 7,571,411 2,623,150 4,542,299 405,962 2,756,848 46,674,437 329,659 - 3,151,050 13,718,1291997 89,290,729 4,963,726 782,677 4,181,049 - 9,631,037 2,302,744 3,834,771 3,493,522 3,777,663 52,116,931 317,585 - 3,429,724 15,054,0631998 100,494,733 5,283,883 1,090,731 4,193,152 - 10,040,516 1,680,181 4,010,707 4,349,628 5,898,442 56,422,262 310,233 - 3,154,589 19,384,8081999 104,127,717 4,662,897 767,983 3,894,914 - 7,270,542 3,789,090 3,301,907 179,545 5,796,269 62,152,230 76,972 - 2,692,217 21,476,5902000 117,745,982 4,875,522 1,435,647 3,439,875 - 9,134,106 4,825,956 1,739,348 2,568,802 8,454,689 69,937,199 75,608 - 2,992,043 22,276,8152001 124,325,837 4,190,114 1,268,314 2,921,800 - 7,643,860 3,783,884 1,892,619 1,967,357 8,008,540 76,682,347 62,239 - 5,016,241 22,722,496
2002Mar 125,607,970 3,779,616 981,813 2,797,803 - 8,323,001 3,475,396 2,872,410 1,975,195 7,708,388 77,556,845 62,109 - 4,504,518 23,673,493Jun 130,158,026 4,192,017 1,085,097 3,106,920 - 9,206,776 3,764,476 2,518,708 2,923,592 8,110,918 79,948,338 62,044 - 4,490,147 24,147,786Sep 132,953,828 4,177,792 969,088 3,208,704 - 10,263,801 4,381,329 2,762,267 3,120,205 9,040,946 80,393,539 62,044 - 5,167,910 23,847,796Dec 135,041,638 5,316,744 1,093,082 4,223,662 - 10,279,996 4,453,279 2,708,221 3,118,496 9,221,579 81,622,447 62,044 - 6,261,913 22,276,915
2003Mar 126,407,697 5,059,097 1,071,309 3,987,788 - 9,776,494 4,903,705 1,586,912 3,285,877 9,013,658 83,404,359 62,044 - 4,985,161 14,106,884Jun 129,668,144 5,752,475 803,635 4,948,840 - 9,758,779 4,592,639 1,967,477 3,198,663 9,914,195 84,654,629 61,878 - 5,413,991 14,112,197Sep 131,832,291 5,445,466 710,025 4,735,441 - 10,357,238 4,644,406 2,177,618 3,535,214 11,103,333 85,326,106 61,674 - 5,323,236 14,215,238Dec 134,994,721 5,170,319 1,128,289 4,042,030 - 10,908,888 5,070,966 2,403,226 3,434,696 10,933,742 86,841,777 61,674 - 6,411,298 14,667,023
2004Jan 137,975,847 5,746,778 786,422 4,960,356 - 11,864,333 5,410,746 2,536,729 3,916,858 11,276,883 88,263,415 61,674 - 5,922,883 14,839,881Feb 139,520,764 5,428,875 965,315 4,463,560 - 11,972,877 5,519,636 2,535,170 3,918,071 11,640,003 89,040,382 61,674 - 6,155,007 15,221,946Mar 139,031,998 4,480,842 570,286 3,910,556 - 11,538,761 5,106,817 2,539,838 3,892,106 12,358,935 89,137,912 61,674 - 6,563,930 14,889,944Apr 139,547,139 4,729,977 635,187 4,094,790 - 12,307,556 5,242,494 2,358,342 4,706,720 10,911,747 89,542,875 61,674 - 6,738,520 15,254,790May 139,169,963 5,330,822 345,628 4,985,194 - 11,936,555 5,206,444 2,381,764 4,348,347 11,809,442 89,058,351 61,674 - 5,588,104 15,385,015Jun 139,424,086 4,628,874 720,652 3,908,222 - 12,621,532 5,241,390 2,946,076 4,434,066 11,156,067 89,961,317 61,674 - 5,293,061 15,701,561Jul 140,514,555 5,627,966 1,227,469 4,400,497 - 11,020,160 5,218,965 2,085,634 3,715,561 10,992,447 91,052,958 61,674 - 5,961,167 15,798,183Aug 139,734,520 4,619,440 493,097 4,126,343 - 11,034,423 5,231,326 1,913,821 3,889,276 10,800,316 91,697,150 61,674 - 5,546,844 15,974,673Sep 138,612,169 4,229,796 351,956 3,877,840 - 10,972,609 5,119,847 2,347,808 3,504,954 10,520,626 92,052,181 61,674 - 5,395,642 15,379,641Oct 142,482,132 4,494,129 332,998 4,161,131 - 10,739,785 5,099,456 2,166,390 3,473,939 10,346,391 94,673,567 61,674 - 6,537,297 15,629,289Nov 145,111,717 5,307,266 321,058 4,986,208 - 11,764,388 5,382,747 2,949,943 3,431,698 10,422,730 96,124,510 61,674 - 6,742,138 14,689,011Dec 146,751,072 7,108,116 450,506 6,657,610 - 12,644,277 5,249,027 3,848,610 3,546,640 11,920,793 92,872,660 61,674 - 7,138,884 15,004,668
2005Jan 149,744,508 7,811,838 490,471 7,321,367 - 14,366,423 6,329,966 4,454,125 3,582,332 11,950,662 93,622,744 61,674 - 6,749,535 15,181,632Feb 150,596,134 7,540,006 673,459 6,866,547 - 13,576,892 6,565,381 3,482,425 3,529,086 12,037,608 95,462,472 61,674 - 6,505,438 15,412,044Mar 151,682,410 7,101,922 601,714 6,500,208 - 13,858,348 6,816,524 3,498,443 3,543,381 13,906,501 95,499,468 61,674 - 6,054,076 15,200,421
Source: Commercial Banks1 Effective February 1996, commercial banks accounts reflect the merged operations of GNCB with GAIBANK.
End of Period
Total Liabilities Total Other
Non-Resident Deposits
External Payment Deposits
Foreign Sector Public SectorBal. due to
Banks Abroad
TotalCentral
Government Deposits
COMMERCIAL BANKS : LIABILITIES, CAPITAL AND RESERVES1
(G$ THOUSAND)Table 2.1 (b)
Public Enterprises
Deposits
Other Deposits
Non-Bank Financial
Institutions Deposits
Private Sector
Deposits
Capital & Reserves
Other Liabilities
Bank of Guyana
1995 48761.4 46156.8 4695.2 2199.8 1996.0 129.0 74.8 2495.4 39634.1 4786.6 34847.5 1827.5 976.9 850.6 2604.71996 60077.3 57002.7 7571.4 3029.1 2623.2 109.1 296.8 4542.3 46674.4 5118.7 41555.8 2756.8 93.6 2663.3 3074.61997 69706.7 65525.6 9631.0 5796.3 2302.7 134.6 3358.9 3834.8 52116.9 6506.8 45610.1 3777.7 764.3 3013.4 4181.01998 76554.4 72361.2 10040.5 6029.8 1680.2 248.1 4101.6 4010.7 56422.3 6943.5 49478.7 5898.4 429.1 5469.4 4193.21999 79114.0 75219.0 7270.5 3968.6 3789.1 111.2 68.3 3301.9 62152.2 7955.8 54196.4 5796.3 1528.6 4267.7 3894.92000 90979.7 87539.8 9148.0 7394.8 4826.0 110.4 2458.4 1753.2 69937.2 13165.3 56771.9 8454.7 1006.5 7448.2 3439.92001 95256.5 92334.7 7643.9 5751.2 3783.9 263.5 1703.9 1892.6 76682.3 13967.2 62715.1 8008.5 608.3 7400.3 2921.8
2002Mar 96386.0 93588.2 8323.0 5450.6 3475.4 237.7 1737.5 2872.4 77556.8 14839.0 62717.8 7708.4 576.7 7131.7 2797.8Jun 100373.0 97266.0 9206.8 6688.1 3764.5 239.1 2684.5 2518.7 79948.3 15406.8 64541.5 8110.9 534.0 7576.9 3106.9Sep 102907.0 99698.3 10263.8 7501.5 4381.3 159.0 2961.2 2762.3 80393.5 15095.4 65298.1 9040.9 535.7 8505.2 3208.7Dec 105347.7 101124.0 10280.0 7571.8 4453.3 196.5 2922.0 2708.2 81622.4 16407.2 65215.3 9221.6 526.8 8694.8 4223.7
2003Mar 106182.3 102194.5 9776.5 8189.6 4903.7 306.8 2979.0 1586.9 83404.4 16442.4 66962.0 9013.7 1164.2 7849.4 3987.8Jun 109276.4 104327.6 9758.8 7791.3 4592.6 178.2 3020.5 1967.5 84654.6 16943.4 67711.2 9914.2 1282.1 8632.1 4948.8Sep 111522.1 106786.7 10357.2 8179.6 4644.4 140.3 3394.9 2177.6 85326.1 18231.5 67094.6 11103.3 846.9 10256.4 4735.4Dec 112726.4 108684.4 10908.9 8505.7 5071.0 144.7 3290.0 2403.2 86841.8 18500.8 68341.0 10933.7 863.4 10070.3 4042.0
2004Jan 116365.0 111404.6 11864.3 9327.6 5410.7 210.6 3706.3 2536.7 88263.4 18822.3 69441.1 11276.9 867.0 10409.9 4960.4Feb 117116.8 112653.3 11972.9 9437.7 5519.6 179.0 3739.1 2535.2 89040.4 19782.0 69258.4 11640.0 981.3 10658.7 4463.6Mar 116946.2 113035.6 11538.8 8998.9 5106.8 195.6 3696.5 2539.8 89137.9 19147.8 69990.1 12358.9 932.3 11426.6 3910.6Apr 116857.0 112762.2 12307.6 9949.2 5242.5 196.9 4509.8 2358.3 89542.9 19036.8 70506.1 10911.7 1001.9 9909.9 4094.8May 117789.5 112804.3 11936.6 9554.8 5206.4 163.5 4184.9 2381.8 89058.4 18921.0 70137.4 11809.4 963.1 10846.3 4985.2Jun 117647.1 113738.9 12621.5 9675.5 5241.4 156.7 4277.4 2946.1 89961.3 19217.9 70743.4 11156.1 989.2 10166.9 3908.2Jul 117466.1 113065.6 11020.2 8934.5 5219.0 196.3 3519.2 2085.6 91053.0 19714.9 71338.0 10992.4 967.9 10024.6 4400.5Aug 117658.2 113531.9 11034.4 9120.6 5231.3 196.5 3692.8 1913.8 91697.2 19851.0 71846.2 10800.3 998.3 9802.0 4126.3Sep 116731.7 112853.8 10972.6 8624.8 5119.8 161.1 3343.8 2347.8 92052.2 19574.9 72477.2 9829.0 508.8 9320.2 3877.8Oct 119920.9 115759.7 10739.8 8573.4 5099.5 254.4 3219.6 2166.4 94673.6 20887.3 73786.3 10346.4 1050.8 9295.6 4161.1Nov 123297.8 118311.6 11764.4 8814.4 5382.7 190.5 3241.2 2949.9 96124.5 22632.3 73492.2 10422.7 1096.2 9326.6 4986.2Dec 124095.3 117437.7 12644.3 8795.7 5249.0 147.8 3398.8 3848.6 92872.7 15016.6 77856.1 11920.8 1165.5 10755.3 6657.6
2005Jan 127261.2 119939.8 14366.4 9912.3 6330.0 210.3 3372.0 4454.1 93622.7 14657.1 78965.7 11950.7 959.6 10991.1 7321.4Feb 127943.5 121077.0 13576.9 10094.5 6565.4 177.0 3352.1 3482.4 95462.5 16195.8 79266.7 12037.6 764.3 11273.3 6866.5Mar 129764.5 123264.3 13858.3 10359.9 6816.5 203.8 3339.6 3498.4 95499.5 16108.6 79390.9 13906.5 779.1 13127.4 6500.2
Source: Commercial Banks
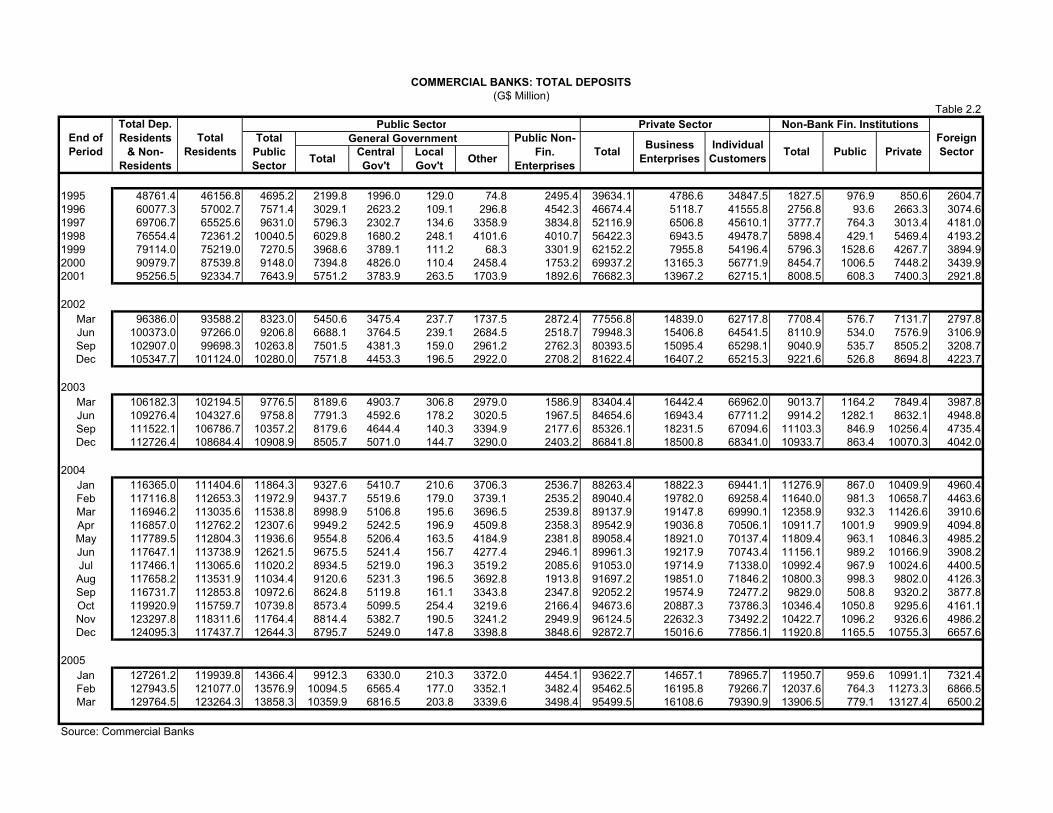
COMMERCIAL BANKS: TOTAL DEPOSITS(G$ Million)
Table 2.2Public Sector
Foreign SectorPrivateIndividual
CustomersBusiness
Enterprises
Public Non-Fin.
Enterprises
General GovernmentPrivate Sector Non-Bank Fin. Institutions
Central Gov't
Local Gov't OtherTotal Total Total Public
Total Public Sector
Total Residents
Total Dep. Residents
& Non-Residents
End of Period
1995 8486.0 7733.0 2230.2 1034.0 910.4 100.1 23.4 1196.3 4301.3 2345.5 1955.9 1201.5 923.1 278.4 753.01996 8911.8 7955.3 2472.5 1009.4 962.6 23.8 23.0 1463.0 5131.3 2539.2 2592.1 351.5 22.7 328.8 956.51997 9647.5 8354.1 2568.8 812.7 677.2 112.2 23.3 1756.1 5186.4 3351.7 1834.7 598.9 204.5 394.5 1293.41998 9312.8 7827.7 1727.8 715.0 544.7 139.8 30.5 1012.7 5547.3 3169.3 2378.0 552.7 195.2 357.5 1485.01999 12617.2 10692.9 3309.4 1561.6 1447.0 47.8 66.8 1747.9 6720.5 3548.0 3172.5 662.9 119.1 543.9 1924.32000 14053.2 12475.3 2521.1 1593.5 1497.3 40.7 55.5 927.7 9318.7 6166.3 3152.4 635.5 151.7 483.8 1577.82001 13489.3 11975.4 2852.6 1659.6 1556.3 82.6 20.8 1193.0 8454.3 5117.9 3336.4 668.5 104.5 564.0 1513.9
2002Mar 14376.4 13009.1 3686.8 1562.8 1420.4 88.1 54.3 2124.0 8869.4 5282.6 3586.8 452.9 63.1 389.7 1367.3Jun 15876.5 14321.8 3525.6 1750.6 1589.1 100.0 61.4 1775.1 10288.1 6557.0 3731.1 508.1 58.1 449.9 1554.7Sep 16667.9 14928.5 4302.8 2264.3 2125.5 62.8 76.0 2038.6 9632.1 5687.8 3944.3 993.6 38.9 954.7 1739.4Dec 15864.3 14039.8 3627.7 1981.2 1845.8 98.7 36.7 1646.5 9839.9 6095.8 3744.1 572.2 40.6 531.6 1824.6
2003Mar 15309.8 13422.9 3183.3 2194.6 1916.2 184.7 93.8 988.7 9413.3 5803.1 3610.2 826.2 343.8 482.4 1886.9Jun 17253.7 14345.9 3664.6 2249.9 2079.6 102.1 68.3 1414.6 9900.2 6359.2 3541.0 781.1 321.2 459.9 2907.9Sep 18205.9 15599.9 3586.6 1953.1 1818.4 65.3 69.5 1633.5 11014.0 7339.2 3674.8 999.3 437.1 562.2 2606.0Dec 17821.0 15874.1 3355.7 2107.8 1973.7 70.0 64.0 1248.0 11375.3 7455.8 3919.5 1143.1 437.0 706.0 1946.9
2004Jan 18640.3 16700.6 3763.7 2085.9 1870.0 135.7 80.2 1677.8 11814.4 7719.4 4095.0 1122.5 440.6 681.9 1939.7Feb 20066.5 18224.7 3927.1 2313.9 2096.6 104.4 112.9 1613.2 12576.6 8442.1 4134.5 1721.0 559.9 1161.1 1841.9Mar 19449.4 17794.1 3349.6 2150.6 1959.8 120.6 70.2 1199.0 12210.8 8024.0 4186.9 2233.7 507.5 1726.2 1655.3Apr 20913.3 18922.0 3656.8 2340.3 2109.6 122.3 108.4 1316.4 14048.8 8232.2 5816.6 1216.4 499.8 716.7 1991.2May 21218.4 18369.8 3700.0 2192.4 2028.5 88.7 75.1 1507.6 13301.8 8114.4 5187.5 1368.0 461.9 906.0 2848.6Jun 19878.7 18204.1 3834.5 2229.7 2080.0 82.1 67.6 1604.8 13258.3 7858.9 5399.4 1111.3 484.7 626.6 1674.7Jul 20670.2 18631.2 3488.3 2325.1 2094.3 121.5 109.3 1163.1 13685.6 8582.5 5103.1 1457.3 462.8 994.5 2039.1Aug 20800.7 19000.4 3204.3 2186.3 1992.2 121.5 72.7 1017.9 14553.6 9056.7 5496.9 1242.5 493.3 749.2 1800.3Sep 19244.2 17482.7 3298.5 2025.4 1853.5 89.1 82.7 1273.1 13725.5 8660.8 5064.7 458.7 0.0 458.7 1761.4Oct 21761.7 19678.9 3326.7 2274.0 1999.2 141.3 133.4 1052.7 15138.0 9658.2 5479.8 1214.3 541.3 673.0 2082.8Nov 24788.0 21832.0 4080.2 2373.8 2213.3 105.4 55.1 1706.5 16391.3 10547.8 5843.5 1360.5 569.6 791.0 2955.9Dec 23171.4 19042.9 4318.9 2398.8 2215.7 70.6 112.5 1920.1 12984.4 9469.6 3514.8 1739.5 652.7 1086.8 4128.5
2005Jan 23866.2 19682.0 4994.5 2334.7 2133.3 133.1 68.4 2659.8 13327.2 9203.3 4123.8 1360.3 537.2 823.1 4184.3Feb 24602.1 20821.1 5177.4 2726.4 2578.3 99.8 48.3 2451.1 14394.9 10219.7 4175.2 1248.8 341.9 906.9 3781.0Mar 26838.4 23385.2 5008.7 2806.0 2569.5 125.8 110.7 2202.7 14524.5 9901.9 4622.7 3852.0 353.3 3498.7 3453.2
Source: Commercial Banks
Private Sector Non-Bank Fin. InstitutionsForeign SectorTotal Public
Total Public Sector
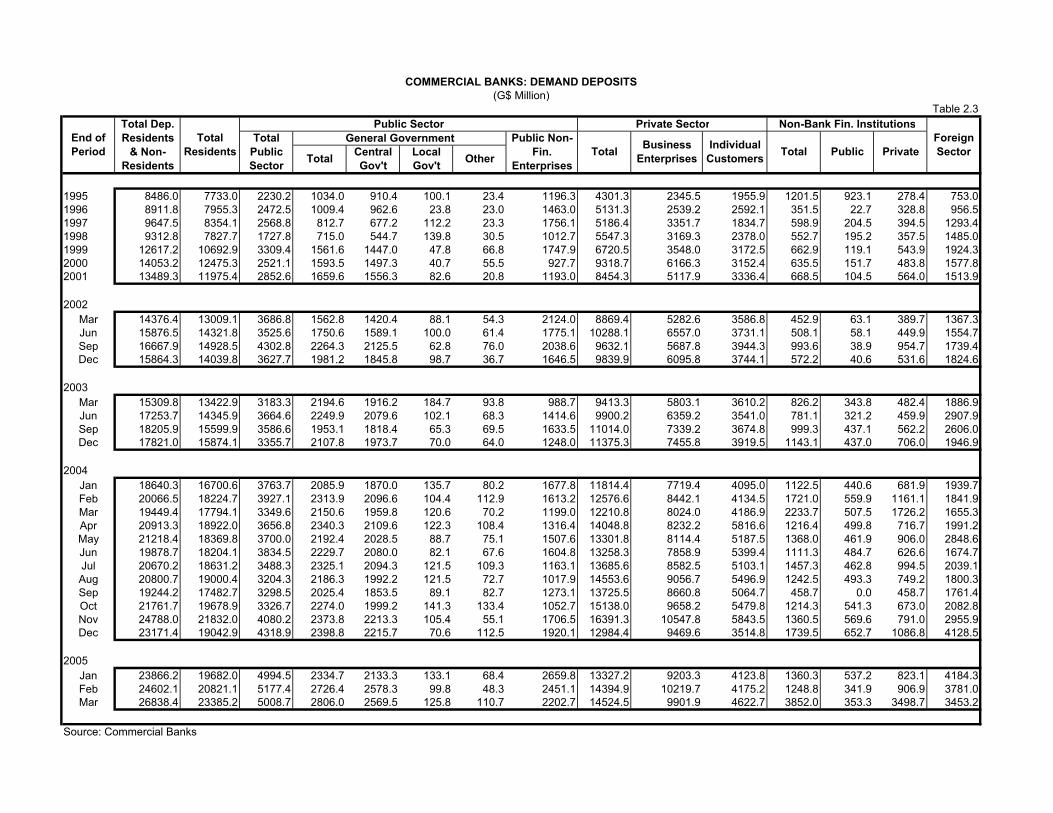
COMMERCIAL BANKS: DEMAND DEPOSITS(G$ Million)
Table 2.3
End of Period
Total Dep. Residents
& Non-Residents
Total Residents
Public Sector
PrivateTotal Central Gov't
Local Gov't Other
General Government Public Non-Fin.
EnterprisesTotal Business
EnterprisesIndividual
Customers
(G$Million)
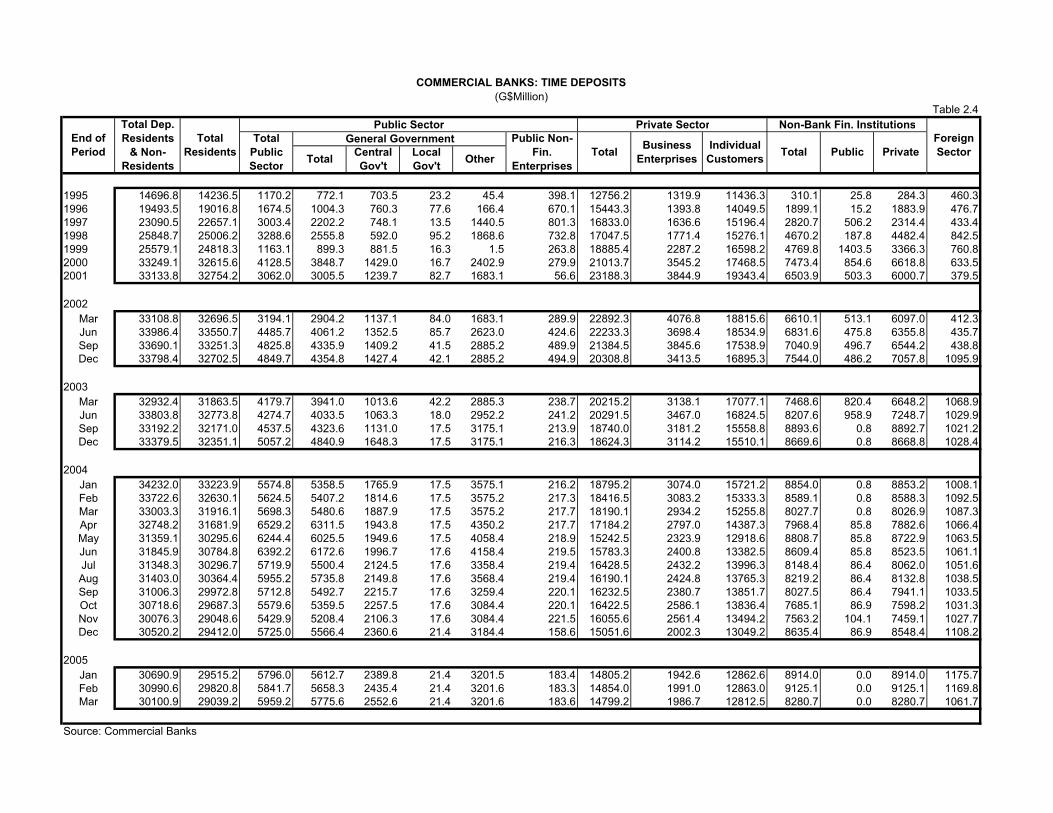
1995 14696.8 14236.5 1170.2 772.1 703.5 23.2 45.4 398.1 12756.2 1319.9 11436.3 310.1 25.8 284.3 460.31996 19493.5 19016.8 1674.5 1004.3 760.3 77.6 166.4 670.1 15443.3 1393.8 14049.5 1899.1 15.2 1883.9 476.71997 23090.5 22657.1 3003.4 2202.2 748.1 13.5 1440.5 801.3 16833.0 1636.6 15196.4 2820.7 506.2 2314.4 433.41998 25848.7 25006.2 3288.6 2555.8 592.0 95.2 1868.6 732.8 17047.5 1771.4 15276.1 4670.2 187.8 4482.4 842.51999 25579.1 24818.3 1163.1 899.3 881.5 16.3 1.5 263.8 18885.4 2287.2 16598.2 4769.8 1403.5 3366.3 760.82000 33249.1 32615.6 4128.5 3848.7 1429.0 16.7 2402.9 279.9 21013.7 3545.2 17468.5 7473.4 854.6 6618.8 633.52001 33133.8 32754.2 3062.0 3005.5 1239.7 82.7 1683.1 56.6 23188.3 3844.9 19343.4 6503.9 503.3 6000.7 379.5
2002Mar 33108.8 32696.5 3194.1 2904.2 1137.1 84.0 1683.1 289.9 22892.3 4076.8 18815.6 6610.1 513.1 6097.0 412.3Jun 33986.4 33550.7 4485.7 4061.2 1352.5 85.7 2623.0 424.6 22233.3 3698.4 18534.9 6831.6 475.8 6355.8 435.7Sep 33690.1 33251.3 4825.8 4335.9 1409.2 41.5 2885.2 489.9 21384.5 3845.6 17538.9 7040.9 496.7 6544.2 438.8Dec 33798.4 32702.5 4849.7 4354.8 1427.4 42.1 2885.2 494.9 20308.8 3413.5 16895.3 7544.0 486.2 7057.8 1095.9
2003Mar 32932.4 31863.5 4179.7 3941.0 1013.6 42.2 2885.3 238.7 20215.2 3138.1 17077.1 7468.6 820.4 6648.2 1068.9Jun 33803.8 32773.8 4274.7 4033.5 1063.3 18.0 2952.2 241.2 20291.5 3467.0 16824.5 8207.6 958.9 7248.7 1029.9Sep 33192.2 32171.0 4537.5 4323.6 1131.0 17.5 3175.1 213.9 18740.0 3181.2 15558.8 8893.6 0.8 8892.7 1021.2Dec 33379.5 32351.1 5057.2 4840.9 1648.3 17.5 3175.1 216.3 18624.3 3114.2 15510.1 8669.6 0.8 8668.8 1028.4
2004Jan 34232.0 33223.9 5574.8 5358.5 1765.9 17.5 3575.1 216.2 18795.2 3074.0 15721.2 8854.0 0.8 8853.2 1008.1Feb 33722.6 32630.1 5624.5 5407.2 1814.6 17.5 3575.2 217.3 18416.5 3083.2 15333.3 8589.1 0.8 8588.3 1092.5Mar 33003.3 31916.1 5698.3 5480.6 1887.9 17.5 3575.2 217.7 18190.1 2934.2 15255.8 8027.7 0.8 8026.9 1087.3Apr 32748.2 31681.9 6529.2 6311.5 1943.8 17.5 4350.2 217.7 17184.2 2797.0 14387.3 7968.4 85.8 7882.6 1066.4May 31359.1 30295.6 6244.4 6025.5 1949.6 17.5 4058.4 218.9 15242.5 2323.9 12918.6 8808.7 85.8 8722.9 1063.5Jun 31845.9 30784.8 6392.2 6172.6 1996.7 17.6 4158.4 219.5 15783.3 2400.8 13382.5 8609.4 85.8 8523.5 1061.1Jul 31348.3 30296.7 5719.9 5500.4 2124.5 17.6 3358.4 219.4 16428.5 2432.2 13996.3 8148.4 86.4 8062.0 1051.6Aug 31403.0 30364.4 5955.2 5735.8 2149.8 17.6 3568.4 219.4 16190.1 2424.8 13765.3 8219.2 86.4 8132.8 1038.5Sep 31006.3 29972.8 5712.8 5492.7 2215.7 17.6 3259.4 220.1 16232.5 2380.7 13851.7 8027.5 86.4 7941.1 1033.5Oct 30718.6 29687.3 5579.6 5359.5 2257.5 17.6 3084.4 220.1 16422.5 2586.1 13836.4 7685.1 86.9 7598.2 1031.3Nov 30076.3 29048.6 5429.9 5208.4 2106.3 17.6 3084.4 221.5 16055.6 2561.4 13494.2 7563.2 104.1 7459.1 1027.7Dec 30520.2 29412.0 5725.0 5566.4 2360.6 21.4 3184.4 158.6 15051.6 2002.3 13049.2 8635.4 86.9 8548.4 1108.2
2005Jan 30690.9 29515.2 5796.0 5612.7 2389.8 21.4 3201.5 183.4 14805.2 1942.6 12862.6 8914.0 0.0 8914.0 1175.7Feb 30990.6 29820.8 5841.7 5658.3 2435.4 21.4 3201.6 183.3 14854.0 1991.0 12863.0 9125.1 0.0 9125.1 1169.8Mar 30100.9 29039.2 5959.2 5775.6 2552.6 21.4 3201.6 183.6 14799.2 1986.7 12812.5 8280.7 0.0 8280.7 1061.7
Source: Commercial Banks
Individual Customers Total Public Private
General Government Public Non-Fin.
EnterprisesTotal Business
EnterprisesTotal Central Gov't
Local Gov't Other
COMMERCIAL BANKS: TIME DEPOSITS
Table 2.4
End of Period
Total Dep. Residents
& Non-Residents
Total Residents
Public Sector Private Sector Non-Bank Fin. InstitutionsForeign Sector
Total Public Sector
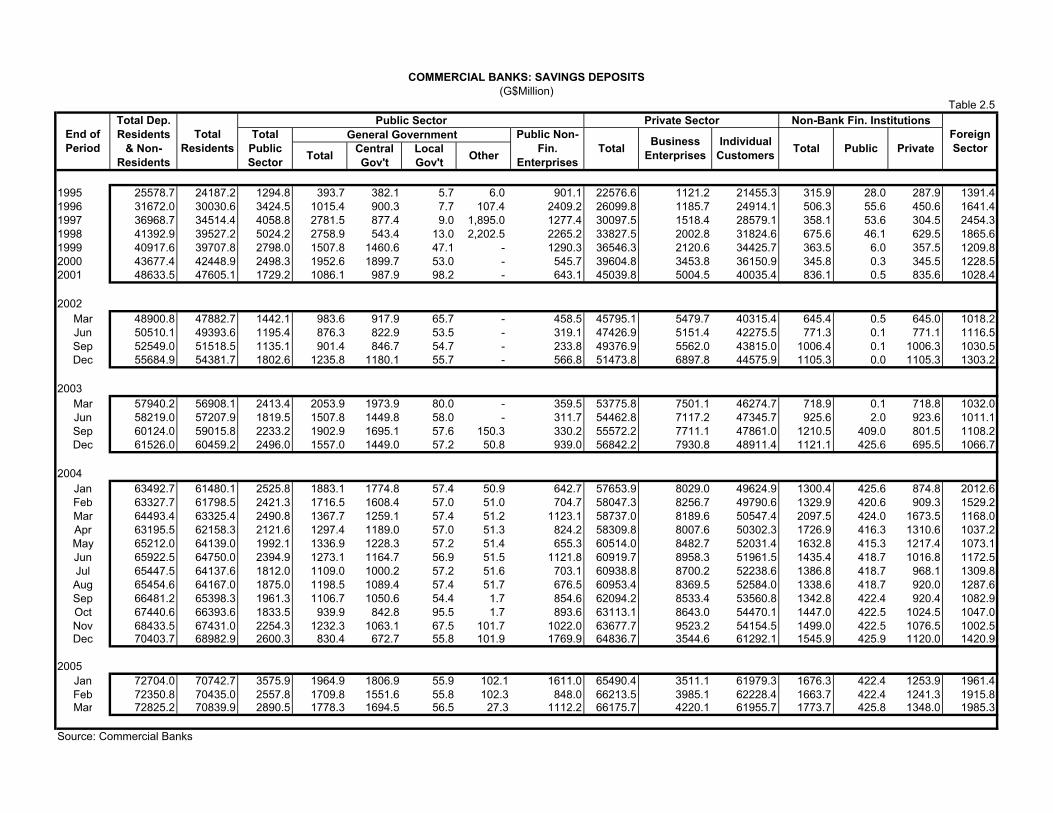
1995 25578.7 24187.2 1294.8 393.7 382.1 5.7 6.0 901.1 22576.6 1121.2 21455.3 315.9 28.0 287.9 1391.41996 31672.0 30030.6 3424.5 1015.4 900.3 7.7 107.4 2409.2 26099.8 1185.7 24914.1 506.3 55.6 450.6 1641.41997 36968.7 34514.4 4058.8 2781.5 877.4 9.0 1,895.0 1277.4 30097.5 1518.4 28579.1 358.1 53.6 304.5 2454.31998 41392.9 39527.2 5024.2 2758.9 543.4 13.0 2,202.5 2265.2 33827.5 2002.8 31824.6 675.6 46.1 629.5 1865.61999 40917.6 39707.8 2798.0 1507.8 1460.6 47.1 - 1290.3 36546.3 2120.6 34425.7 363.5 6.0 357.5 1209.82000 43677.4 42448.9 2498.3 1952.6 1899.7 53.0 - 545.7 39604.8 3453.8 36150.9 345.8 0.3 345.5 1228.52001 48633.5 47605.1 1729.2 1086.1 987.9 98.2 - 643.1 45039.8 5004.5 40035.4 836.1 0.5 835.6 1028.4
2002Mar 48900.8 47882.7 1442.1 983.6 917.9 65.7 - 458.5 45795.1 5479.7 40315.4 645.4 0.5 645.0 1018.2Jun 50510.1 49393.6 1195.4 876.3 822.9 53.5 - 319.1 47426.9 5151.4 42275.5 771.3 0.1 771.1 1116.5Sep 52549.0 51518.5 1135.1 901.4 846.7 54.7 - 233.8 49376.9 5562.0 43815.0 1006.4 0.1 1006.3 1030.5Dec 55684.9 54381.7 1802.6 1235.8 1180.1 55.7 - 566.8 51473.8 6897.8 44575.9 1105.3 0.0 1105.3 1303.2
2003Mar 57940.2 56908.1 2413.4 2053.9 1973.9 80.0 - 359.5 53775.8 7501.1 46274.7 718.9 0.1 718.8 1032.0Jun 58219.0 57207.9 1819.5 1507.8 1449.8 58.0 - 311.7 54462.8 7117.2 47345.7 925.6 2.0 923.6 1011.1Sep 60124.0 59015.8 2233.2 1902.9 1695.1 57.6 150.3 330.2 55572.2 7711.1 47861.0 1210.5 409.0 801.5 1108.2Dec 61526.0 60459.2 2496.0 1557.0 1449.0 57.2 50.8 939.0 56842.2 7930.8 48911.4 1121.1 425.6 695.5 1066.7
2004Jan 63492.7 61480.1 2525.8 1883.1 1774.8 57.4 50.9 642.7 57653.9 8029.0 49624.9 1300.4 425.6 874.8 2012.6Feb 63327.7 61798.5 2421.3 1716.5 1608.4 57.0 51.0 704.7 58047.3 8256.7 49790.6 1329.9 420.6 909.3 1529.2Mar 64493.4 63325.4 2490.8 1367.7 1259.1 57.4 51.2 1123.1 58737.0 8189.6 50547.4 2097.5 424.0 1673.5 1168.0Apr 63195.5 62158.3 2121.6 1297.4 1189.0 57.0 51.3 824.2 58309.8 8007.6 50302.3 1726.9 416.3 1310.6 1037.2May 65212.0 64139.0 1992.1 1336.9 1228.3 57.2 51.4 655.3 60514.0 8482.7 52031.4 1632.8 415.3 1217.4 1073.1Jun 65922.5 64750.0 2394.9 1273.1 1164.7 56.9 51.5 1121.8 60919.7 8958.3 51961.5 1435.4 418.7 1016.8 1172.5Jul 65447.5 64137.6 1812.0 1109.0 1000.2 57.2 51.6 703.1 60938.8 8700.2 52238.6 1386.8 418.7 968.1 1309.8Aug 65454.6 64167.0 1875.0 1198.5 1089.4 57.4 51.7 676.5 60953.4 8369.5 52584.0 1338.6 418.7 920.0 1287.6Sep 66481.2 65398.3 1961.3 1106.7 1050.6 54.4 1.7 854.6 62094.2 8533.4 53560.8 1342.8 422.4 920.4 1082.9Oct 67440.6 66393.6 1833.5 939.9 842.8 95.5 1.7 893.6 63113.1 8643.0 54470.1 1447.0 422.5 1024.5 1047.0Nov 68433.5 67431.0 2254.3 1232.3 1063.1 67.5 101.7 1022.0 63677.7 9523.2 54154.5 1499.0 422.5 1076.5 1002.5Dec 70403.7 68982.9 2600.3 830.4 672.7 55.8 101.9 1769.9 64836.7 3544.6 61292.1 1545.9 425.9 1120.0 1420.9
2005Jan 72704.0 70742.7 3575.9 1964.9 1806.9 55.9 102.1 1611.0 65490.4 3511.1 61979.3 1676.3 422.4 1253.9 1961.4Feb 72350.8 70435.0 2557.8 1709.8 1551.6 55.8 102.3 848.0 66213.5 3985.1 62228.4 1663.7 422.4 1241.3 1915.8Mar 72825.2 70839.9 2890.5 1778.3 1694.5 56.5 27.3 1112.2 66175.7 4220.1 61955.7 1773.7 425.8 1348.0 1985.3
Source: Commercial Banks
PrivateTotal Central Gov't
Local Gov't Other
Business Enterprises
Individual Customers Total Public
Total Public Sector
General Government Public Non-Fin.
EnterprisesTotal
COMMERCIAL BANKS: SAVINGS DEPOSITS(G$Million)
Table 2.5
End of Period
Total Dep. Residents
& Non-Residents
Total Residents
Public Sector Private Sector Non-Bank Fin. InstitutionsForeign Sector

COMMERCIAL BANKS: TIME DEPOSITS BY MATURITY(G$ Million)
Table 2.6End Exceeding ExceedingOf Up To 3 & Up To 6 & Up To Up To Exceeding
Period 3 Months 6 Months 9 Months 12 Months 12 Months Total
1995 9532.4 3713.9 78.7 1312.4 59.4 14696.81996 16908.9 1907.6 0.2 253.5 423.4 19493.51997 17513.0 3701.5 5.9 1853.4 16.8 23090.51998 17020.6 5151.1 2.8 3655.0 19.2 25848.71999 14820.6 3906.5 1475.3 4715.0 661.7 25579.12000 16979.5 5389.5 14.0 9844.4 1021.6 33249.1
2001Mar. 16023.7 5784.5 841.3 8836.4 1201.6 32687.4Jun. 15763.1 4627.1 191.7 9685.7 1208.1 31475.7Sep. 15365.2 4685.9 145.7 11080.1 2097.9 33374.9Dec. 16307.9 4547.0 79.7 10022.0 2177.2 33133.8
2002Mar. 16513.8 4734.6 33.4 9650.0 2177.0 33108.8Jun. 16943.6 4711.5 116.6 10521.5 1693.2 33986.4Sep. 16088.7 4682.6 280.3 10879.6 1758.9 33690.1Dec. 15645.2 4609.1 318.6 11116.5 2109.1 33798.4
2003Jan. 15569.9 4782.8 221.6 10938.0 2107.8 33620.1Feb. 15161.7 4841.9 6.8 10694.4 2119.6 32824.4Mar. 15451.0 4934.5 9.7 10492.1 2045.0 32932.4Apr. 15690.2 5140.5 11.1 10518.4 2037.1 33397.4May 15983.0 4712.6 104.0 10928.8 2032.6 33760.9Jun. 15787.7 4689.7 104.3 11202.1 2020.0 33803.8Jul. 15253.0 4922.8 128.9 11900.8 2033.5 34239.1Aug. 15364.0 4826.7 129.2 11524.5 2030.2 33874.7Sep. 14915.1 4843.2 128.2 11970.8 1335.0 33192.2Oct. 14871.3 4873.0 170.3 11870.8 1343.6 33129.0Nov. 14823.7 5424.9 83.7 11598.0 1328.7 33259.0Dec. 14989.1 5502.0 71.9 11448.2 1368.3 33379.5
2004Jan. 13747.7 5947.5 53.1 13101.6 1382.1 34232.0Feb. 13714.2 5452.4 49.7 13046.5 1459.7 33722.6Mar. 13626.1 5127.8 352.4 12472.3 1424.7 33003.3Apr. 12920.0 4476.5 315.3 13582.2 1454.3 32748.2May 13067.6 3911.1 445.0 12958.9 976.5 31359.1Jun. 13592.9 3896.1 458.1 12802.6 1096.2 31845.9Jul. 14441.8 3858.9 476.3 11495.1 1076.2 31348.3Aug. 14247.8 3850.5 484.9 11745.7 1074.1 31403.0Sept. 14188.2 4127.2 181.9 11419.0 1089.9 31006.3Oct. 13260.0 5201.7 175.9 11046.0 1035.0 30718.6Nov. 13457.9 4408.9 47.2 11158.1 1004.3 30076.3Dec. 12760.7 4553.8 32.3 12359.1 814.3 30520.2
2005Jan. 12804.0 4450.3 14.1 12598.6 823.9 30690.9Feb. 12924.0 4446.9 5.0 12778.6 836.1 30990.6Mar. 11903.8 4122.1 5.8 13158.3 910.8 30100.9
Source: Commercial Banks

COMMERCIAL BANKS: DEBITS AND CREDITS ON SAVINGS ACCOUNTS(G$ Million)
Table 2.7Savings Credits Debits Net SavingsDeposits On Savings Credits (+) Deposits
Period At Beg. Acc. During Or at endOf The Period Debits (-) of
Period Period
1995 26692.3 6637.4 8134.7 -1497.3 383.6 25578.71996 32079.9 11089.7 11803.6 -713.9 306.0 31672.01997 35928.4 12691.1 11998.7 692.5 347.9 36968.71998 40108.9 11735.7 10703.1 1032.6 251.4 41392.91999 39322.6 16112.8 14675.7 1437.1 157.9 40917.62000 43787.8 10022.0 10330.3 -308.3 197.9 43677.4
2001Mar. 45093.8 11874.9 11990.1 -115.2 299.1 45277.8Jun. 46256.1 14301.4 13499.9 801.5 356.4 47414.0Sep. 46561.9 11076.3 11537.6 -461.3 318.5 46419.0Dec. 47453.2 14021.6 13014.9 1006.7 173.7 48633.5
2002Mar. 48667.1 11398.5 11502.4 -103.9 337.6 48900.8Jun. 50449.9 21690.2 21767.8 -77.6 137.8 50510.1Sep. 51768.4 14116.0 13621.4 494.5 286.0 52549.0Dec. 53913.0 17222.8 15603.1 1619.8 152.2 55684.9
2003Jan. 55684.9 20984.2 19063.6 1920.7 145.5 57751.1Feb. 57751.1 17738.5 17896.7 -158.2 145.6 57738.5Mar. 57883.4 16624.0 16957.2 -333.3 390.0 57940.2Apr. 57940.2 18320.2 18256.2 64.1 313.7 58317.9May 58317.9 19043.9 18871.5 172.4 160.9 58651.2Jun. 58651.2 18138.0 19057.6 -919.6 487.3 58219.0Jul. 58219.0 20572.2 19791.8 780.4 176.0 59175.4Aug. 59175.4 18568.1 18458.0 110.0 175.4 59460.9Sep. 59460.9 18898.0 18663.5 234.5 428.6 60124.0Oct. 60124.0 19397.1 19210.3 186.6 327.9 60638.6Nov. 60638.6 19774.2 18795.2 978.9 174.7 61792.4Dec. 61792.4 20283.0 20798.3 -515.4 248.9 61526.0
2004Jan. 61526.0 23205.6 21345.8 1859.7 107.0 63492.7Feb. 63492.7 18131.2 18437.5 -306.3 141.3 63327.7Mar. 63327.7 21987.9 21329.5 658.3 507.3 64493.4Apr. 64493.4 23633.8 25385.2 -1751.5 453.5 63195.5May 63195.5 26995.3 25329.0 1666.2 350.3 65212.0Jun. 65212.0 25970.2 25888.1 81.9 628.4 65922.5Jul. 65922.5 19470.1 20396.7 -926.7 451.6 65447.5Aug. 65447.5 19964.3 20414.7 -450.4 457.5 65454.6Sep. 65454.6 26372.8 26169.6 203.2 823.4 66481.2Oct. 66481.2 26961.2 26612.0 349.2 610.1 67440.6Nov. 67440.6 28506.2 27991.1 515.1 477.8 68433.5Dec. 68433.5 25707.5 23977.3 1730.2 240.0 70403.7
2005Jan. 70403.7 20003.3 17760.0 2243.4 57.0 72704.0Feb. 72704.0 17432.4 17901.7 -469.3 116.0 72350.8Mar. 72350.8 25518.1 25554.5 -36.4 510.8 72825.2
Source: Commercial Banks
Interest Accrued/
Credited To Acc. During The Period
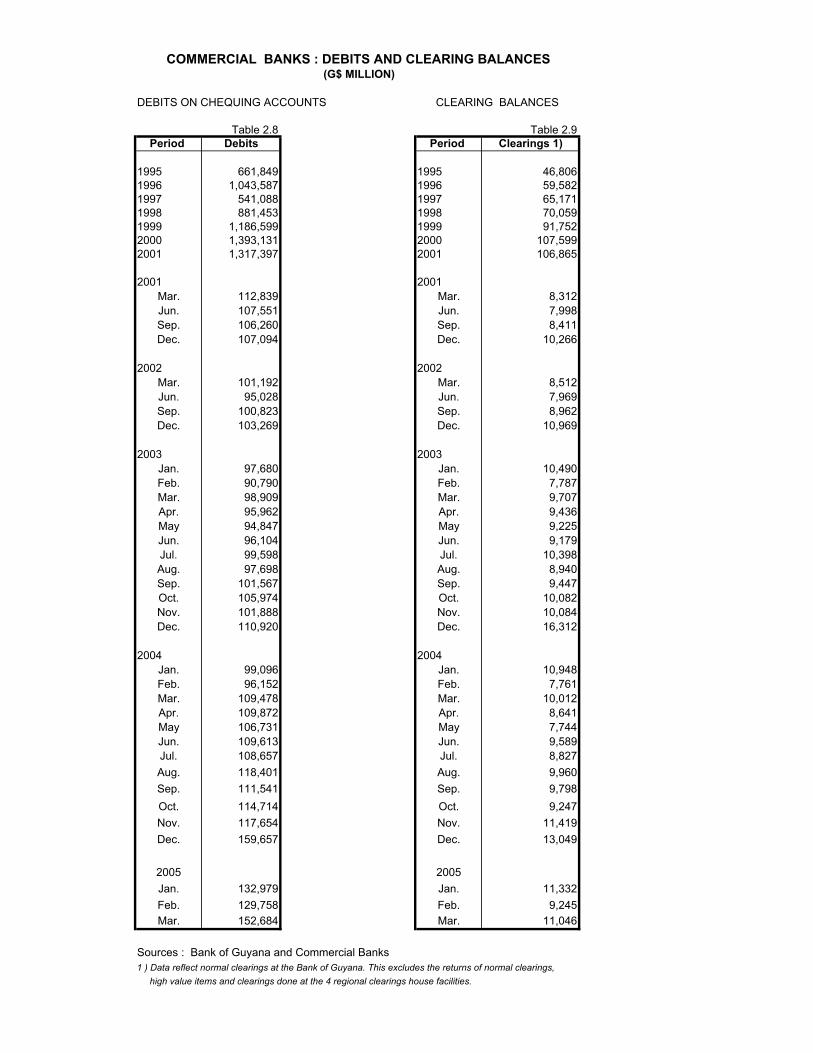
COMMERCIAL BANKS : DEBITS AND CLEARING BALANCES (G$ MILLION)
DEBITS ON CHEQUING ACCOUNTS CLEARING BALANCES
Table 2.8 Table 2.9Period Debits Period Clearings 1)
1995 661,849 1995 46,8061996 1,043,587 1996 59,5821997 541,088 1997 65,1711998 881,453 1998 70,0591999 1,186,599 1999 91,7522000 1,393,131 2000 107,5992001 1,317,397 2001 106,865
2001 2001Mar. 112,839 Mar. 8,312Jun. 107,551 Jun. 7,998Sep. 106,260 Sep. 8,411Dec. 107,094 Dec. 10,266
2002 2002Mar. 101,192 Mar. 8,512Jun. 95,028 Jun. 7,969Sep. 100,823 Sep. 8,962Dec. 103,269 Dec. 10,969
2003 2003Jan. 97,680 Jan. 10,490Feb. 90,790 Feb. 7,787Mar. 98,909 Mar. 9,707Apr. 95,962 Apr. 9,436May 94,847 May 9,225Jun. 96,104 Jun. 9,179Jul. 99,598 Jul. 10,398Aug. 97,698 Aug. 8,940Sep. 101,567 Sep. 9,447Oct. 105,974 Oct. 10,082Nov. 101,888 Nov. 10,084Dec. 110,920 Dec. 16,312
2004 2004Jan. 99,096 Jan. 10,948Feb. 96,152 Feb. 7,761Mar. 109,478 Mar. 10,012Apr. 109,872 Apr. 8,641May 106,731 May 7,744Jun. 109,613 Jun. 9,589Jul. 108,657 Jul. 8,827Aug. 118,401 Aug. 9,960Sep. 111,541 Sep. 9,798Oct. 114,714 Oct. 9,247Nov. 117,654 Nov. 11,419Dec. 159,657 Dec. 13,049
2005 2005Jan. 132,979 Jan. 11,332Feb. 129,758 Feb. 9,245Mar. 152,684 Mar. 11,046
Sources : Bank of Guyana and Commercial Banks1 ) Data reflect normal clearings at the Bank of Guyana. This excludes the returns of normal clearings, high value items and clearings done at the 4 regional clearings house facilities.
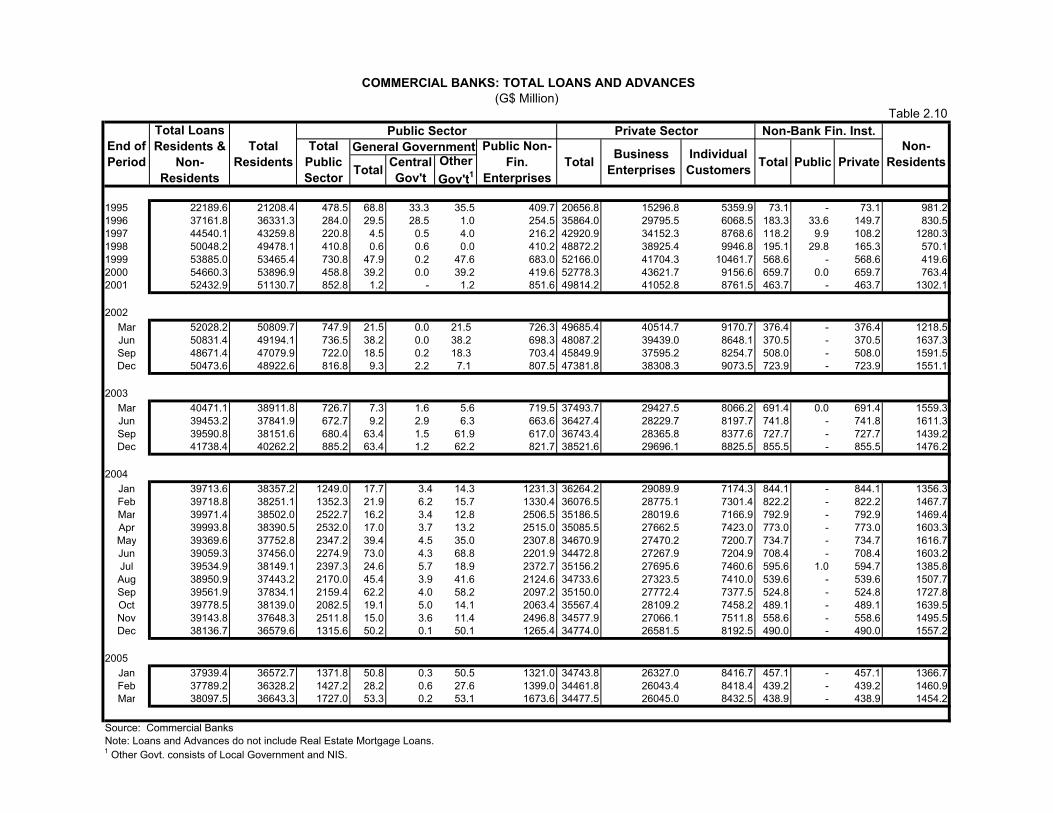
1995 22189.6 21208.4 478.5 68.8 33.3 35.5 409.7 20656.8 15296.8 5359.9 73.1 - 73.1 981.21996 37161.8 36331.3 284.0 29.5 28.5 1.0 254.5 35864.0 29795.5 6068.5 183.3 33.6 149.7 830.51997 44540.1 43259.8 220.8 4.5 0.5 4.0 216.2 42920.9 34152.3 8768.6 118.2 9.9 108.2 1280.31998 50048.2 49478.1 410.8 0.6 0.6 0.0 410.2 48872.2 38925.4 9946.8 195.1 29.8 165.3 570.11999 53885.0 53465.4 730.8 47.9 0.2 47.6 683.0 52166.0 41704.3 10461.7 568.6 - 568.6 419.62000 54660.3 53896.9 458.8 39.2 0.0 39.2 419.6 52778.3 43621.7 9156.6 659.7 0.0 659.7 763.42001 52432.9 51130.7 852.8 1.2 - 1.2 851.6 49814.2 41052.8 8761.5 463.7 - 463.7 1302.1
2002Mar 52028.2 50809.7 747.9 21.5 0.0 21.5 726.3 49685.4 40514.7 9170.7 376.4 - 376.4 1218.5Jun 50831.4 49194.1 736.5 38.2 0.0 38.2 698.3 48087.2 39439.0 8648.1 370.5 - 370.5 1637.3Sep 48671.4 47079.9 722.0 18.5 0.2 18.3 703.4 45849.9 37595.2 8254.7 508.0 - 508.0 1591.5Dec 50473.6 48922.6 816.8 9.3 2.2 7.1 807.5 47381.8 38308.3 9073.5 723.9 - 723.9 1551.1
2003Mar 40471.1 38911.8 726.7 7.3 1.6 5.6 719.5 37493.7 29427.5 8066.2 691.4 0.0 691.4 1559.3Jun 39453.2 37841.9 672.7 9.2 2.9 6.3 663.6 36427.4 28229.7 8197.7 741.8 - 741.8 1611.3Sep 39590.8 38151.6 680.4 63.4 1.5 61.9 617.0 36743.4 28365.8 8377.6 727.7 - 727.7 1439.2Dec 41738.4 40262.2 885.2 63.4 1.2 62.2 821.7 38521.6 29696.1 8825.5 855.5 - 855.5 1476.2
2004Jan 39713.6 38357.2 1249.0 17.7 3.4 14.3 1231.3 36264.2 29089.9 7174.3 844.1 - 844.1 1356.3Feb 39718.8 38251.1 1352.3 21.9 6.2 15.7 1330.4 36076.5 28775.1 7301.4 822.2 - 822.2 1467.7Mar 39971.4 38502.0 2522.7 16.2 3.4 12.8 2506.5 35186.5 28019.6 7166.9 792.9 - 792.9 1469.4Apr 39993.8 38390.5 2532.0 17.0 3.7 13.2 2515.0 35085.5 27662.5 7423.0 773.0 - 773.0 1603.3May 39369.6 37752.8 2347.2 39.4 4.5 35.0 2307.8 34670.9 27470.2 7200.7 734.7 - 734.7 1616.7Jun 39059.3 37456.0 2274.9 73.0 4.3 68.8 2201.9 34472.8 27267.9 7204.9 708.4 - 708.4 1603.2Jul 39534.9 38149.1 2397.3 24.6 5.7 18.9 2372.7 35156.2 27695.6 7460.6 595.6 1.0 594.7 1385.8Aug 38950.9 37443.2 2170.0 45.4 3.9 41.6 2124.6 34733.6 27323.5 7410.0 539.6 - 539.6 1507.7Sep 39561.9 37834.1 2159.4 62.2 4.0 58.2 2097.2 35150.0 27772.4 7377.5 524.8 - 524.8 1727.8Oct 39778.5 38139.0 2082.5 19.1 5.0 14.1 2063.4 35567.4 28109.2 7458.2 489.1 - 489.1 1639.5Nov 39143.8 37648.3 2511.8 15.0 3.6 11.4 2496.8 34577.9 27066.1 7511.8 558.6 - 558.6 1495.5Dec 38136.7 36579.6 1315.6 50.2 0.1 50.1 1265.4 34774.0 26581.5 8192.5 490.0 - 490.0 1557.2
2005Jan 37939.4 36572.7 1371.8 50.8 0.3 50.5 1321.0 34743.8 26327.0 8416.7 457.1 - 457.1 1366.7Feb 37789.2 36328.2 1427.2 28.2 0.6 27.6 1399.0 34461.8 26043.4 8418.4 439.2 - 439.2 1460.9Mar 38097.5 36643.3 1727.0 53.3 0.2 53.1 1673.6 34477.5 26045.0 8432.5 438.9 - 438.9 1454.2
Source: Commercial BanksNote: Loans and Advances do not include Real Estate Mortgage Loans.1 Other Govt. consists of Local Government and NIS.
COMMERCIAL BANKS: TOTAL LOANS AND ADVANCES(G$ Million)
Table 2.10
End of Period
Total Loans Residents &
Non-Residents
Total Residents
Public Sector Private Sector Non-Bank Fin. Inst.Non-
ResidentsTotal
Public Sector
General Government Public Non-Fin.
EnterprisesTotal PrivateTotal Central
Gov'tOther Gov't1
Business Enterprises
Individual Customers Total Public
1995 16221.1 15245.9 478.5 68.8 33.3 35.5 409.7 14694.2 10932.9 3761.3 73.1 - 73.1 975.21996 23878.1 23061.8 284.0 29.5 28.5 1.0 254.5 22618.5 18580.2 4038.3 159.4 33.6 125.8 816.31997 28700.7 28325.2 219.9 4.1 0.0 4.0 215.8 28043.3 23135.5 4907.8 62.0 9.9 52.0 375.61998 32419.5 32132.8 358.0 0.2 0.2 - 357.8 31586.9 26406.6 5180.2 188.0 29.8 158.2 286.71999 34959.1 34591.5 640.8 47.9 0.2 47.6 593.0 33929.5 27367.8 6561.7 21.2 - 21.2 367.72000 33058.4 32446.6 368.0 39.2 0.0 39.2 328.8 31888.0 26090.7 5797.4 190.6 0.0 190.6 611.82001 30014.5 29388.9 699.2 1.2 - 1.2 698.0 28648.1 24141.0 4507.1 41.6 - 41.6 625.7
2002Mar 28751.3 28183.1 589.5 21.5 0.0 21.5 568.0 27541.6 23135.7 4405.9 51.9 - 51.9 568.2Jun 28029.2 26969.6 580.5 38.2 0.0 38.2 542.3 26339.3 22576.0 3763.4 49.9 - 49.9 1059.6Sep 26579.7 25602.3 576.0 18.5 0.2 18.3 557.4 24992.7 21388.1 3604.6 33.6 - 33.6 977.4Dec 28382.0 27382.0 673.5 1.1 1.1 0.0 672.3 26450.6 22057.1 4393.5 257.9 - 257.9 1000.1
2003Mar 21766.1 20752.5 587.9 0.6 0.6 - 587.3 19919.0 15845.9 4073.1 245.6 0.0 245.6 1013.5Jun 21692.0 20620.2 488.0 1.9 1.9 - 486.1 19846.9 15517.5 4329.3 285.3 - 285.3 1071.8Sep 21253.5 20343.2 490.3 50.7 0.4 50.2 439.6 19561.7 15032.3 4529.4 291.2 - 291.2 910.3Dec 23154.6 22200.8 695.0 50.7 0.1 50.6 644.3 21202.9 16178.3 5024.6 302.9 - 302.9 953.8
2004Jan 22258.8 21426.5 1055.6 1.7 1.3 0.4 1053.9 20075.9 15357.1 4718.8 295.0 - 295.0 832.3Feb 22199.1 21258.3 1153.5 0.5 0.1 0.4 1153.0 19830.8 15073.8 4757.1 274.0 - 274.0 940.8Mar 22670.7 21718.6 2329.6 0.6 0.2 0.4 2329.0 19126.2 14342.5 4783.7 262.8 - 262.8 952.1Apr 20550.1 19455.9 2338.1 0.5 0.1 0.4 2337.5 16869.3 13953.6 2915.7 248.5 - 248.5 1094.2May 20094.4 18990.6 2146.6 16.2 0.6 15.6 2130.4 16636.2 13785.8 2850.4 207.8 - 207.8 1103.8Jun 19885.5 18790.8 2073.5 49.1 0.1 48.9 2024.4 16583.3 13732.3 2851.0 134.0 - 134.0 1094.7Jul 20272.0 19383.0 2197.0 1.8 1.8 - 2195.3 17063.2 14148.1 2915.1 122.7 1.0 121.8 889.0Aug 19663.7 18643.3 1970.6 23.5 0.4 23.1 1947.1 16598.2 13696.6 2901.6 74.5 - 74.5 1020.4Sep 20175.2 18923.8 1958.7 39.0 0.1 38.9 1919.8 16899.0 14004.4 2894.5 66.0 - 66.0 1251.5Oct 20157.9 18984.7 1887.1 1.1 1.1 0.1 1886.0 17034.2 14043.3 2990.9 63.3 - 63.3 1173.2Nov 20164.9 19127.4 2320.4 1.1 0.2 0.9 2319.4 16723.8 13684.6 3039.2 83.2 - 83.2 1037.5Dec 19732.7 18516.8 1138.2 50.2 0.1 50.1 1088.0 17210.7 14451.6 2759.2 167.9 - 167.9 1215.9
2005Jan 19151.1 18123.2 1194.4 50.8 0.3 50.5 1143.6 16789.8 14253.9 2535.9 139.1 - 139.1 1027.8Feb 19108.5 17983.5 1249.7 28.2 0.6 27.6 1221.6 16577.4 14061.1 2516.3 156.4 - 156.4 1124.9Mar 19314.8 18194.2 1549.5 53.3 0.2 53.1 1496.2 16481.4 13887.9 2593.5 163.3 - 163.3 1120.6
Source: Commercial Banks1 Other Govt. consists of Local Government and NIS.
Total Central Gov't
Other Gov't1
General GovernmentTotal
Public Sector Private Sector Non-Bank Fin. Inst.
Business Enterprises
Individual Customers
Public Non-Fin.
EnterprisesTotal
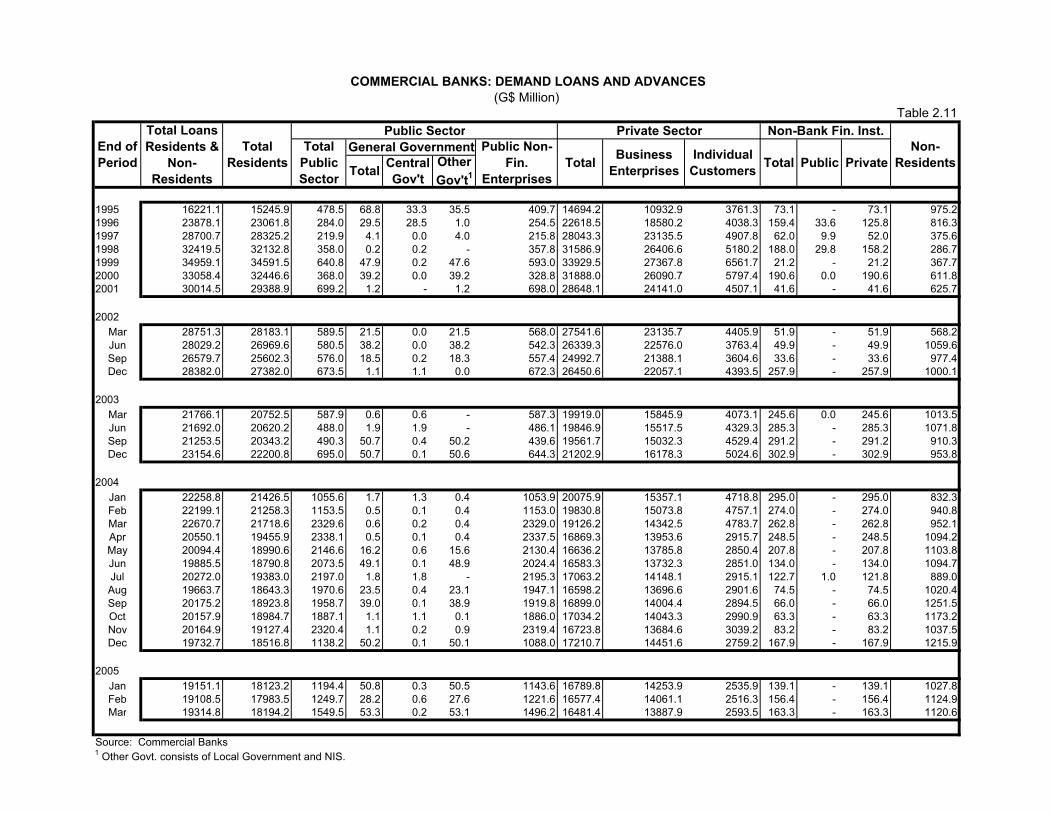
COMMERCIAL BANKS: DEMAND LOANS AND ADVANCES
Total Public Sector
(G$ Million)Table 2.11
End of Period
Total Loans Residents &
Non-Residents
Total Residents Private
Non-ResidentsPublic
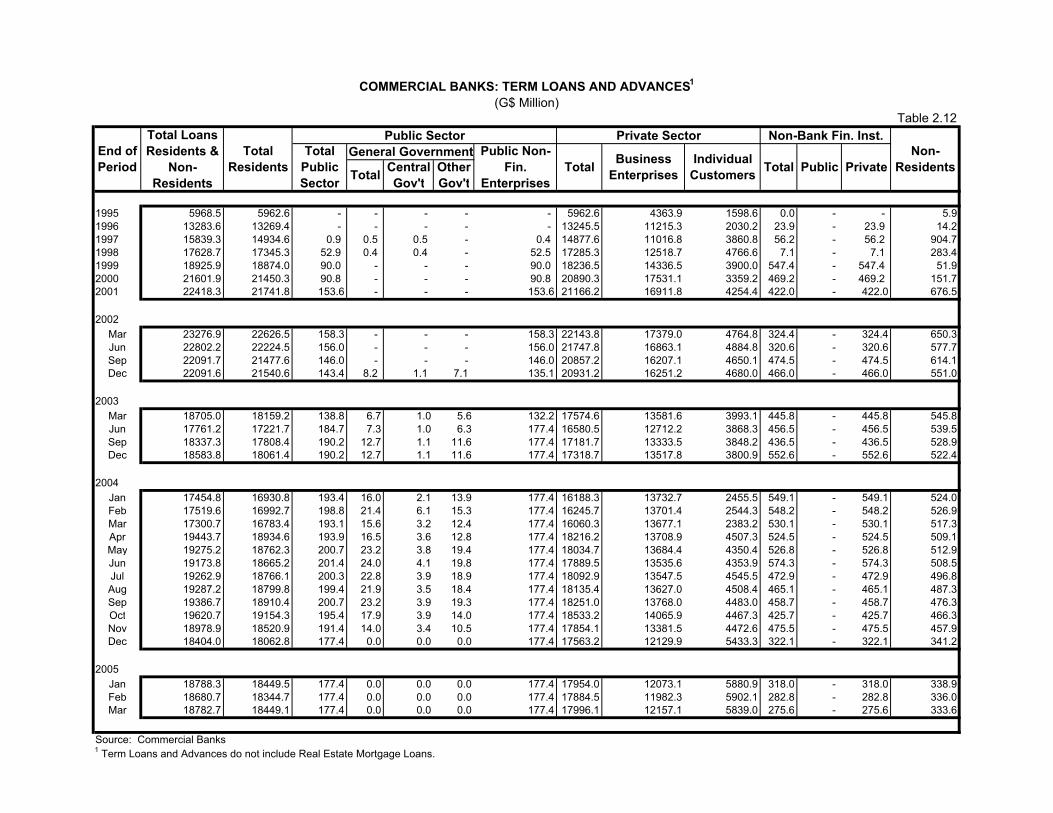
1995 5968.5 5962.6 - - - - - 5962.6 4363.9 1598.6 0.0 - - 5.91996 13283.6 13269.4 - - - - - 13245.5 11215.3 2030.2 23.9 - 23.9 14.21997 15839.3 14934.6 0.9 0.5 0.5 - 0.4 14877.6 11016.8 3860.8 56.2 - 56.2 904.71998 17628.7 17345.3 52.9 0.4 0.4 - 52.5 17285.3 12518.7 4766.6 7.1 - 7.1 283.41999 18925.9 18874.0 90.0 - - - 90.0 18236.5 14336.5 3900.0 547.4 - 547.4 51.92000 21601.9 21450.3 90.8 - - - 90.8 20890.3 17531.1 3359.2 469.2 - 469.2 151.72001 22418.3 21741.8 153.6 - - - 153.6 21166.2 16911.8 4254.4 422.0 - 422.0 676.5
2002Mar 23276.9 22626.5 158.3 - - - 158.3 22143.8 17379.0 4764.8 324.4 - 324.4 650.3Jun 22802.2 22224.5 156.0 - - - 156.0 21747.8 16863.1 4884.8 320.6 - 320.6 577.7Sep 22091.7 21477.6 146.0 - - - 146.0 20857.2 16207.1 4650.1 474.5 - 474.5 614.1Dec 22091.6 21540.6 143.4 8.2 1.1 7.1 135.1 20931.2 16251.2 4680.0 466.0 - 466.0 551.0
2003Mar 18705.0 18159.2 138.8 6.7 1.0 5.6 132.2 17574.6 13581.6 3993.1 445.8 - 445.8 545.8Jun 17761.2 17221.7 184.7 7.3 1.0 6.3 177.4 16580.5 12712.2 3868.3 456.5 - 456.5 539.5Sep 18337.3 17808.4 190.2 12.7 1.1 11.6 177.4 17181.7 13333.5 3848.2 436.5 - 436.5 528.9Dec 18583.8 18061.4 190.2 12.7 1.1 11.6 177.4 17318.7 13517.8 3800.9 552.6 - 552.6 522.4
2004Jan 17454.8 16930.8 193.4 16.0 2.1 13.9 177.4 16188.3 13732.7 2455.5 549.1 - 549.1 524.0Feb 17519.6 16992.7 198.8 21.4 6.1 15.3 177.4 16245.7 13701.4 2544.3 548.2 - 548.2 526.9Mar 17300.7 16783.4 193.1 15.6 3.2 12.4 177.4 16060.3 13677.1 2383.2 530.1 - 530.1 517.3Apr 19443.7 18934.6 193.9 16.5 3.6 12.8 177.4 18216.2 13708.9 4507.3 524.5 - 524.5 509.1May 19275.2 18762.3 200.7 23.2 3.8 19.4 177.4 18034.7 13684.4 4350.4 526.8 - 526.8 512.9Jun 19173.8 18665.2 201.4 24.0 4.1 19.8 177.4 17889.5 13535.6 4353.9 574.3 - 574.3 508.5Jul 19262.9 18766.1 200.3 22.8 3.9 18.9 177.4 18092.9 13547.5 4545.5 472.9 - 472.9 496.8Aug 19287.2 18799.8 199.4 21.9 3.5 18.4 177.4 18135.4 13627.0 4508.4 465.1 - 465.1 487.3Sep 19386.7 18910.4 200.7 23.2 3.9 19.3 177.4 18251.0 13768.0 4483.0 458.7 - 458.7 476.3Oct 19620.7 19154.3 195.4 17.9 3.9 14.0 177.4 18533.2 14065.9 4467.3 425.7 - 425.7 466.3Nov 18978.9 18520.9 191.4 14.0 3.4 10.5 177.4 17854.1 13381.5 4472.6 475.5 - 475.5 457.9Dec 18404.0 18062.8 177.4 0.0 0.0 0.0 177.4 17563.2 12129.9 5433.3 322.1 - 322.1 341.2
2005Jan 18788.3 18449.5 177.4 0.0 0.0 0.0 177.4 17954.0 12073.1 5880.9 318.0 - 318.0 338.9Feb 18680.7 18344.7 177.4 0.0 0.0 0.0 177.4 17884.5 11982.3 5902.1 282.8 - 282.8 336.0Mar 18782.7 18449.1 177.4 0.0 0.0 0.0 177.4 17996.1 12157.1 5839.0 275.6 - 275.6 333.6
Source: Commercial Banks1 Term Loans and Advances do not include Real Estate Mortgage Loans.
End of Period
Total Loans Residents &
Non-Residents
Total Residents
Public SectorGeneral Government
Other Gov'tTotal Central
Gov't
Table 2.12
COMMERCIAL BANKS: TERM LOANS AND ADVANCES1
(G$ Million)
Non-ResidentsPublicTotal
Non-Bank Fin. Inst.
Private
Private SectorTotal
Public Sector
Individual Customers
Public Non-Fin.
EnterprisesTotal Business
Enterprises
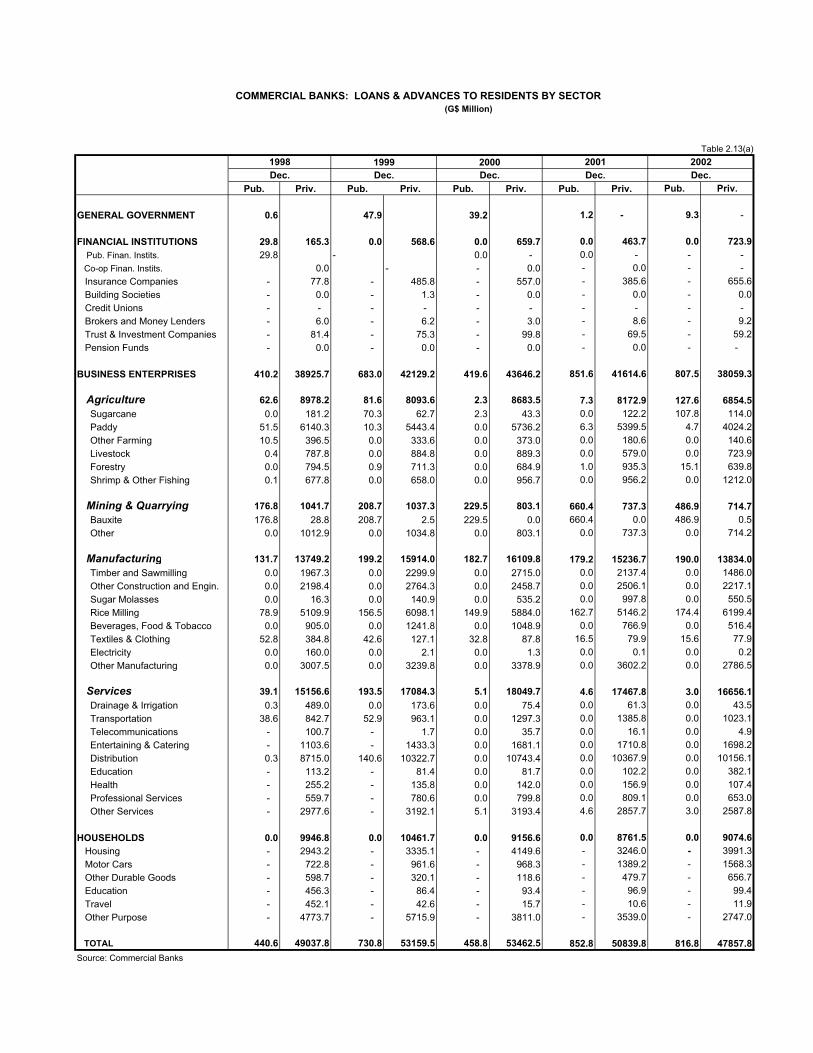
COMMERCIAL BANKS: LOANS & ADVANCES TO RESIDENTS BY SECTOR(G$ Million)
Table 2.13(a)1998 1999 2000 2001 2002Dec. Dec. Dec. Dec. Dec.
Pub. Priv. Pub. Priv. Pub. Priv. Pub. Priv. Pub. Priv.
GENERAL GOVERNMENT 0.6 47.9 39.2 1.2 - 9.3 - FINANCIAL INSTITUTIONS 29.8 165.3 0.0 568.6 0.0 659.7 0.0 463.7 0.0 723.9 Pub. Finan. Instits. 29.8 - 0.0 - 0.0 - - - Co-op Finan. Instits. 0.0 - - 0.0 - 0.0 - - Insurance Companies - 77.8 - 485.8 - 557.0 - 385.6 - 655.6 Building Societies - 0.0 - 1.3 - 0.0 - 0.0 - 0.0 Credit Unions - - - - - - - - - - Brokers and Money Lenders - 6.0 - 6.2 - 3.0 - 8.6 - 9.2 Trust & Investment Companies - 81.4 - 75.3 - 99.8 - 69.5 - 59.2 Pension Funds - 0.0 - 0.0 - 0.0 - 0.0 - -
BUSINESS ENTERPRISES 410.2 38925.7 683.0 42129.2 419.6 43646.2 851.6 41614.6 807.5 38059.3
Agriculture 62.6 8978.2 81.6 8093.6 2.3 8683.5 7.3 8172.9 127.6 6854.5 Sugarcane 0.0 181.2 70.3 62.7 2.3 43.3 0.0 122.2 107.8 114.0 Paddy 51.5 6140.3 10.3 5443.4 0.0 5736.2 6.3 5399.5 4.7 4024.2 Other Farming 10.5 396.5 0.0 333.6 0.0 373.0 0.0 180.6 0.0 140.6 Livestock 0.4 787.8 0.0 884.8 0.0 889.3 0.0 579.0 0.0 723.9 Forestry 0.0 794.5 0.9 711.3 0.0 684.9 1.0 935.3 15.1 639.8 Shrimp & Other Fishing 0.1 677.8 0.0 658.0 0.0 956.7 0.0 956.2 0.0 1212.0
Mining & Quarrying 176.8 1041.7 208.7 1037.3 229.5 803.1 660.4 737.3 486.9 714.7 Bauxite 176.8 28.8 208.7 2.5 229.5 0.0 660.4 0.0 486.9 0.5 Other 0.0 1012.9 0.0 1034.8 0.0 803.1 0.0 737.3 0.0 714.2
Manufacturing 131.7 13749.2 199.2 15914.0 182.7 16109.8 179.2 15236.7 190.0 13834.0 Timber and Sawmilling 0.0 1967.3 0.0 2299.9 0.0 2715.0 0.0 2137.4 0.0 1486.0 Other Construction and Engin. 0.0 2198.4 0.0 2764.3 0.0 2458.7 0.0 2506.1 0.0 2217.1 Sugar Molasses 0.0 16.3 0.0 140.9 0.0 535.2 0.0 997.8 0.0 550.5 Rice Milling 78.9 5109.9 156.5 6098.1 149.9 5884.0 162.7 5146.2 174.4 6199.4 Beverages, Food & Tobacco 0.0 905.0 0.0 1241.8 0.0 1048.9 0.0 766.9 0.0 516.4 Textiles & Clothing 52.8 384.8 42.6 127.1 32.8 87.8 16.5 79.9 15.6 77.9 Electricity 0.0 160.0 0.0 2.1 0.0 1.3 0.0 0.1 0.0 0.2 Other Manufacturing 0.0 3007.5 0.0 3239.8 0.0 3378.9 0.0 3602.2 0.0 2786.5
Services 39.1 15156.6 193.5 17084.3 5.1 18049.7 4.6 17467.8 3.0 16656.1 Drainage & Irrigation 0.3 489.0 0.0 173.6 0.0 75.4 0.0 61.3 0.0 43.5 Transportation 38.6 842.7 52.9 963.1 0.0 1297.3 0.0 1385.8 0.0 1023.1 Telecommunications - 100.7 - 1.7 0.0 35.7 0.0 16.1 0.0 4.9 Entertaining & Catering - 1103.6 - 1433.3 0.0 1681.1 0.0 1710.8 0.0 1698.2 Distribution 0.3 8715.0 140.6 10322.7 0.0 10743.4 0.0 10367.9 0.0 10156.1 Education - 113.2 - 81.4 0.0 81.7 0.0 102.2 0.0 382.1 Health - 255.2 - 135.8 0.0 142.0 0.0 156.9 0.0 107.4 Professional Services - 559.7 - 780.6 0.0 799.8 0.0 809.1 0.0 653.0 Other Services - 2977.6 - 3192.1 5.1 3193.4 4.6 2857.7 3.0 2587.8
HOUSEHOLDS 0.0 9946.8 0.0 10461.7 0.0 9156.6 0.0 8761.5 0.0 9074.6 Housing - 2943.2 - 3335.1 - 4149.6 - 3246.0 - 3991.3 Motor Cars - 722.8 - 961.6 - 968.3 - 1389.2 - 1568.3 Other Durable Goods - 598.7 - 320.1 - 118.6 - 479.7 - 656.7 Education - 456.3 - 86.4 - 93.4 - 96.9 - 99.4 Travel - 452.1 - 42.6 - 15.7 - 10.6 - 11.9 Other Purpose - 4773.7 - 5715.9 - 3811.0 - 3539.0 - 2747.0
TOTAL 440.6 49037.8 730.8 53159.5 458.8 53462.5 852.8 50839.8 816.8 47857.8Source: Commercial Banks
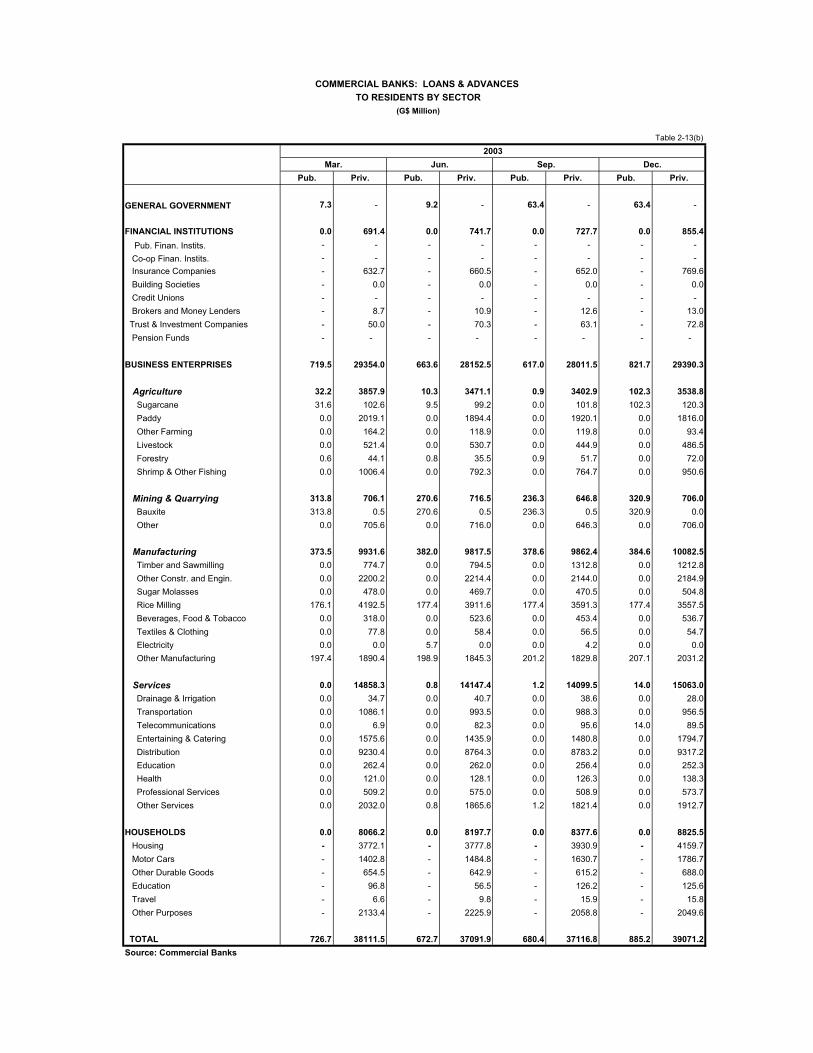
COMMERCIAL BANKS: LOANS & ADVANCES TO RESIDENTS BY SECTOR
(G$ Million)
Table 2-13(b)
Mar. Jun. Sep. Dec.Pub. Priv. Pub. Priv. Pub. Priv. Pub. Priv.
GENERAL GOVERNMENT 7.3 - 9.2 - 63.4 - 63.4 -
FINANCIAL INSTITUTIONS 0.0 691.4 0.0 741.7 0.0 727.7 0.0 855.4 Pub. Finan. Instits. - - - - - - - - Co-op Finan. Instits. - - - - - - - - Insurance Companies - 632.7 - 660.5 - 652.0 - 769.6 Building Societies - 0.0 - 0.0 - 0.0 - 0.0 Credit Unions - - - - - - - - Brokers and Money Lenders - 8.7 - 10.9 - 12.6 - 13.0 Trust & Investment Companies - 50.0 - 70.3 - 63.1 - 72.8 Pension Funds - - - - - - - -
BUSINESS ENTERPRISES 719.5 29354.0 663.6 28152.5 617.0 28011.5 821.7 29390.3 Agriculture 32.2 3857.9 10.3 3471.1 0.9 3402.9 102.3 3538.8 Sugarcane 31.6 102.6 9.5 99.2 0.0 101.8 102.3 120.3 Paddy 0.0 2019.1 0.0 1894.4 0.0 1920.1 0.0 1816.0 Other Farming 0.0 164.2 0.0 118.9 0.0 119.8 0.0 93.4 Livestock 0.0 521.4 0.0 530.7 0.0 444.9 0.0 486.5 Forestry 0.6 44.1 0.8 35.5 0.9 51.7 0.0 72.0 Shrimp & Other Fishing 0.0 1006.4 0.0 792.3 0.0 764.7 0.0 950.6
Mining & Quarrying 313.8 706.1 270.6 716.5 236.3 646.8 320.9 706.0 Bauxite 313.8 0.5 270.6 0.5 236.3 0.5 320.9 0.0 Other 0.0 705.6 0.0 716.0 0.0 646.3 0.0 706.0
Manufacturing 373.5 9931.6 382.0 9817.5 378.6 9862.4 384.6 10082.5 Timber and Sawmilling 0.0 774.7 0.0 794.5 0.0 1312.8 0.0 1212.8 Other Constr. and Engin. 0.0 2200.2 0.0 2214.4 0.0 2144.0 0.0 2184.9 Sugar Molasses 0.0 478.0 0.0 469.7 0.0 470.5 0.0 504.8 Rice Milling 176.1 4192.5 177.4 3911.6 177.4 3591.3 177.4 3557.5 Beverages, Food & Tobacco 0.0 318.0 0.0 523.6 0.0 453.4 0.0 536.7 Textiles & Clothing 0.0 77.8 0.0 58.4 0.0 56.5 0.0 54.7 Electricity 0.0 0.0 5.7 0.0 0.0 4.2 0.0 0.0 Other Manufacturing 197.4 1890.4 198.9 1845.3 201.2 1829.8 207.1 2031.2
Services 0.0 14858.3 0.8 14147.4 1.2 14099.5 14.0 15063.0 Drainage & Irrigation 0.0 34.7 0.0 40.7 0.0 38.6 0.0 28.0 Transportation 0.0 1086.1 0.0 993.5 0.0 988.3 0.0 956.5 Telecommunications 0.0 6.9 0.0 82.3 0.0 95.6 14.0 89.5 Entertaining & Catering 0.0 1575.6 0.0 1435.9 0.0 1480.8 0.0 1794.7 Distribution 0.0 9230.4 0.0 8764.3 0.0 8783.2 0.0 9317.2 Education 0.0 262.4 0.0 262.0 0.0 256.4 0.0 252.3 Health 0.0 121.0 0.0 128.1 0.0 126.3 0.0 138.3 Professional Services 0.0 509.2 0.0 575.0 0.0 508.9 0.0 573.7 Other Services 0.0 2032.0 0.8 1865.6 1.2 1821.4 0.0 1912.7
HOUSEHOLDS 0.0 8066.2 0.0 8197.7 0.0 8377.6 0.0 8825.5 Housing - 3772.1 - 3777.8 - 3930.9 - 4159.7 Motor Cars - 1402.8 - 1484.8 - 1630.7 - 1786.7 Other Durable Goods - 654.5 - 642.9 - 615.2 - 688.0 Education - 96.8 - 56.5 - 126.2 - 125.6 Travel - 6.6 - 9.8 - 15.9 - 15.8 Other Purposes - 2133.4 - 2225.9 - 2058.8 - 2049.6
TOTAL 726.7 38111.5 672.7 37091.9 680.4 37116.8 885.2 39071.2Source: Commercial Banks
2003
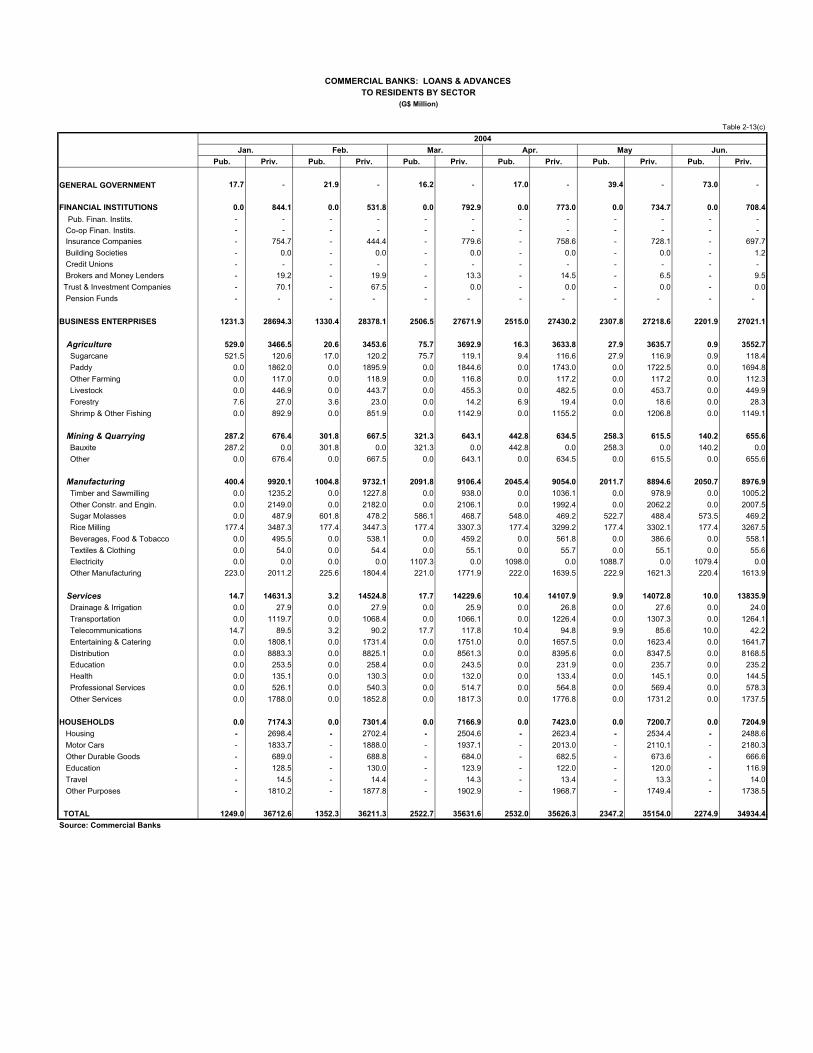
COMMERCIAL BANKS: LOANS & ADVANCES TO RESIDENTS BY SECTOR
(G$ Million)
Table 2-13(c)2004
Jan. Feb. Mar. Apr. May Jun.Pub. Priv. Pub. Priv. Pub. Priv. Pub. Priv. Pub. Priv. Pub. Priv.
GENERAL GOVERNMENT 17.7 - 21.9 - 16.2 - 17.0 - 39.4 - 73.0 -
FINANCIAL INSTITUTIONS 0.0 844.1 0.0 531.8 0.0 792.9 0.0 773.0 0.0 734.7 0.0 708.4 Pub. Finan. Instits. - - - - - - - - - - - - Co-op Finan. Instits. - - - - - - - - - - - - Insurance Companies - 754.7 - 444.4 - 779.6 - 758.6 - 728.1 - 697.7 Building Societies - 0.0 - 0.0 - 0.0 - 0.0 - 0.0 - 1.2 Credit Unions - - - - - - - - - - - - Brokers and Money Lenders - 19.2 - 19.9 - 13.3 - 14.5 - 6.5 - 9.5 Trust & Investment Companies - 70.1 - 67.5 - 0.0 - 0.0 - 0.0 - 0.0 Pension Funds - - - - - - - - - - - -
BUSINESS ENTERPRISES 1231.3 28694.3 1330.4 28378.1 2506.5 27671.9 2515.0 27430.2 2307.8 27218.6 2201.9 27021.1 Agriculture 529.0 3466.5 20.6 3453.6 75.7 3692.9 16.3 3633.8 27.9 3635.7 0.9 3552.7 Sugarcane 521.5 120.6 17.0 120.2 75.7 119.1 9.4 116.6 27.9 116.9 0.9 118.4 Paddy 0.0 1862.0 0.0 1895.9 0.0 1844.6 0.0 1743.0 0.0 1722.5 0.0 1694.8 Other Farming 0.0 117.0 0.0 118.9 0.0 116.8 0.0 117.2 0.0 117.2 0.0 112.3 Livestock 0.0 446.9 0.0 443.7 0.0 455.3 0.0 482.5 0.0 453.7 0.0 449.9 Forestry 7.6 27.0 3.6 23.0 0.0 14.2 6.9 19.4 0.0 18.6 0.0 28.3 Shrimp & Other Fishing 0.0 892.9 0.0 851.9 0.0 1142.9 0.0 1155.2 0.0 1206.8 0.0 1149.1
Mining & Quarrying 287.2 676.4 301.8 667.5 321.3 643.1 442.8 634.5 258.3 615.5 140.2 655.6 Bauxite 287.2 0.0 301.8 0.0 321.3 0.0 442.8 0.0 258.3 0.0 140.2 0.0 Other 0.0 676.4 0.0 667.5 0.0 643.1 0.0 634.5 0.0 615.5 0.0 655.6
Manufacturing 400.4 9920.1 1004.8 9732.1 2091.8 9106.4 2045.4 9054.0 2011.7 8894.6 2050.7 8976.9 Timber and Sawmilling 0.0 1235.2 0.0 1227.8 0.0 938.0 0.0 1036.1 0.0 978.9 0.0 1005.2 Other Constr. and Engin. 0.0 2149.0 0.0 2182.0 0.0 2106.1 0.0 1992.4 0.0 2062.2 0.0 2007.5 Sugar Molasses 0.0 487.9 601.8 478.2 586.1 468.7 548.0 469.2 522.7 488.4 573.5 469.2 Rice Milling 177.4 3487.3 177.4 3447.3 177.4 3307.3 177.4 3299.2 177.4 3302.1 177.4 3267.5 Beverages, Food & Tobacco 0.0 495.5 0.0 538.1 0.0 459.2 0.0 561.8 0.0 386.6 0.0 558.1 Textiles & Clothing 0.0 54.0 0.0 54.4 0.0 55.1 0.0 55.7 0.0 55.1 0.0 55.6 Electricity 0.0 0.0 0.0 0.0 1107.3 0.0 1098.0 0.0 1088.7 0.0 1079.4 0.0 Other Manufacturing 223.0 2011.2 225.6 1804.4 221.0 1771.9 222.0 1639.5 222.9 1621.3 220.4 1613.9
Services 14.7 14631.3 3.2 14524.8 17.7 14229.6 10.4 14107.9 9.9 14072.8 10.0 13835.9 Drainage & Irrigation 0.0 27.9 0.0 27.9 0.0 25.9 0.0 26.8 0.0 27.6 0.0 24.0 Transportation 0.0 1119.7 0.0 1068.4 0.0 1066.1 0.0 1226.4 0.0 1307.3 0.0 1264.1 Telecommunications 14.7 89.5 3.2 90.2 17.7 117.8 10.4 94.8 9.9 85.6 10.0 42.2 Entertaining & Catering 0.0 1808.1 0.0 1731.4 0.0 1751.0 0.0 1657.5 0.0 1623.4 0.0 1641.7 Distribution 0.0 8883.3 0.0 8825.1 0.0 8561.3 0.0 8395.6 0.0 8347.5 0.0 8168.5 Education 0.0 253.5 0.0 258.4 0.0 243.5 0.0 231.9 0.0 235.7 0.0 235.2 Health 0.0 135.1 0.0 130.3 0.0 132.0 0.0 133.4 0.0 145.1 0.0 144.5 Professional Services 0.0 526.1 0.0 540.3 0.0 514.7 0.0 564.8 0.0 569.4 0.0 578.3 Other Services 0.0 1788.0 0.0 1852.8 0.0 1817.3 0.0 1776.8 0.0 1731.2 0.0 1737.5
HOUSEHOLDS 0.0 7174.3 0.0 7301.4 0.0 7166.9 0.0 7423.0 0.0 7200.7 0.0 7204.9 Housing - 2698.4 - 2702.4 - 2504.6 - 2623.4 - 2534.4 - 2488.6 Motor Cars - 1833.7 - 1888.0 - 1937.1 - 2013.0 - 2110.1 - 2180.3 Other Durable Goods - 689.0 - 688.8 - 684.0 - 682.5 - 673.6 - 666.6 Education - 128.5 - 130.0 - 123.9 - 122.0 - 120.0 - 116.9 Travel - 14.5 - 14.4 - 14.3 - 13.4 - 13.3 - 14.0 Other Purposes - 1810.2 - 1877.8 - 1902.9 - 1968.7 - 1749.4 - 1738.5
TOTAL 1249.0 36712.6 1352.3 36211.3 2522.7 35631.6 2532.0 35626.3 2347.2 35154.0 2274.9 34934.4Source: Commercial Banks

COMMERCIAL BANKS: LOANS & ADVANCES TO RESIDENTS BY SECTOR
(G$ Million)
Table 2-13(d)
2004Jul. Aug. Sep. Oct. Nov. Dec.
Pub. Priv. Pub. Priv. Pub. Priv. Pub. Priv. Pub. Priv. Pub. Priv.
GENERAL GOVERNMENT 24.6 - 45.4 - 62.2 - 19.1 - 15.0 - 50.2 -
FINANCIAL INSTITUTIONS 1.0 594.7 0.0 539.6 0.0 524.8 0.0 489.1 0.0 558.6 0.0 490.0 Pub. Finan. Instits. 1.0 - 0.0 - 0.0 - 0.0 - 0.0 - 0.0 - Co-op Finan. Instits. - 0.0 - 0.4 - 0.0 - 0.0 - 0.0 - 0.0 Insurance Companies - 582.1 - 523.1 - 515.1 - 482.6 - 551.3 - 474.2 Building Societies - 0.0 - 0.0 - 0.0 - 0.0 - 0.0 - 0.0 Credit Unions - - - - - - - - - - - - Brokers and Money Lenders - 12.6 - 16.1 - 9.7 - 6.4 - 7.4 - 15.7 Trust & Investment Companies - 0.0 - 0.0 - 0.0 - 0.0 - 0.0 - 0.2 Pension Funds - - - - - - - - - - - -
BUSINESS ENTERPRISES 2372.7 27481.6 2124.6 27002.4 2097.2 27837.9 2063.4 28217.4 2496.8 27283.0 1265.4 26793.9 Agriculture 14.8 3449.0 10.7 3905.3 0.0 3284.1 12.5 3270.0 48.1 3303.1 0.0 3333.8 Sugarcane 1.9 119.0 5.8 119.8 0.0 170.7 12.5 150.0 48.1 166.4 0.0 28.3 Paddy 0.0 1668.8 0.0 2179.7 0.0 1653.0 0.0 1590.3 0.0 1620.8 0.0 1654.8 Other Farming 0.0 120.2 0.0 117.3 0.0 115.2 0.0 112.2 0.0 117.0 0.0 117.0 Livestock 0.0 307.5 0.0 303.7 0.0 304.9 0.0 333.5 0.0 358.5 0.0 460.7 Forestry 12.8 23.6 4.9 26.4 0.0 33.4 0.0 36.2 0.0 26.0 0.0 29.7 Shrimp & Other Fishing 0.0 1209.9 0.0 1158.5 0.0 1006.9 0.0 1047.8 0.0 1014.5 0.0 1043.4
Mining & Quarrying 283.2 709.1 355.0 672.3 293.3 668.8 144.4 665.7 429.1 307.4 60.3 409.9 Bauxite 283.2 0.0 355.0 0.0 293.3 0.0 144.4 0.0 429.1 95.2 60.3 96.0 Other 0.0 709.1 0.0 672.3 0.0 668.8 0.0 665.7 0.0 212.2 0.0 314.0
Manufacturing 2071.2 9106.1 1757.7 8764.8 1802.4 9715.9 1902.6 9992.9 2017.8 9462.5 1201.0 8566.1 Timber and Sawmilling 0.0 994.6 0.0 1000.4 0.0 1061.9 0.0 1060.1 0.0 1090.0 0.0 823.7 Other Constr. and Engin. 0.0 2149.9 0.0 2272.4 0.0 2344.6 0.0 2445.5 0.0 2369.3 0.0 2332.6 Sugar Molasses 599.0 469.4 303.2 472.8 356.8 672.2 463.3 672.3 598.3 673.0 0.0 3.5 Rice Milling 177.4 3284.3 177.4 2756.8 177.4 3131.0 177.4 3234.1 177.4 2856.9 177.4 2482.8 Beverages, Food & Tobacco 0.0 630.8 0.0 540.7 0.0 563.0 0.0 657.2 0.0 453.0 0.0 540.9 Textiles & Clothing 0.0 54.1 0.0 53.4 0.0 51.6 0.0 51.3 0.0 51.6 0.0 65.9 Electricity 1079.4 0.0 1060.8 0.0 1051.5 0.0 1051.5 0.0 1032.9 5.0 1023.6 4.9 Other Manufacturing 215.5 1523.1 216.2 1668.3 216.7 1891.6 210.5 1872.6 209.1 1963.7 0.0 2311.8
Services 3.5 14217.5 1.3 13660.0 1.5 14169.2 3.9 14288.7 1.9 14209.9 4.1 14484.0 Drainage & Irrigation 0.0 23.9 0.0 23.9 0.0 27.7 0.0 30.1 0.0 29.3 0.0 25.8 Transportation 0.0 1266.7 0.0 1237.1 0.0 1217.9 0.0 1214.0 0.0 1213.6 0.0 1144.2 Telecommunications 3.5 27.3 1.3 13.1 1.5 13.8 3.9 14.0 1.9 33.5 0.0 40.3 Entertaining & Catering 0.0 1775.7 0.0 1820.6 0.0 1956.4 0.0 1957.3 0.0 1945.6 0.0 1368.5 Distribution 0.0 8329.5 0.0 7934.5 0.0 8337.2 0.0 8501.5 0.0 8368.6 0.0 9029.8 Education 0.0 222.0 0.0 223.0 0.0 225.4 0.0 226.4 0.0 214.0 0.0 216.7 Health 0.0 149.0 0.0 148.5 0.0 147.6 0.0 150.6 0.0 144.3 0.0 148.6 Professional Services 0.0 594.6 0.0 588.9 0.0 599.9 0.0 592.3 0.0 589.5 0.0 527.7 Other Services 0.0 1828.8 0.0 1670.3 0.0 1643.3 0.0 1602.4 0.0 1671.6 4.1 1982.4
HOUSEHOLDS 0.0 7460.6 0.0 7410.0 0.0 7377.6 0.0 7458.2 0.0 7511.8 0.0 8192.5 Housing - 2540.6 - 2538.1 - 2479.7 - 2510.0 - 2444.1 - 2624.7 Motor Cars - 2214.6 - 2242.2 - 2044.9 - 2036.8 - 2038.4 - 2156.3 Other Durable Goods - 669.1 - 656.1 - 539.1 - 540.4 - 554.5 - 310.1 Education - 116.2 - 129.1 - 140.2 - 142.2 - 139.6 - 169.0 Travel - 14.0 - 16.8 - 18.4 - 17.4 - 492.5 - 33.5 Other Purposes - 1906.0 - 1827.9 - 2155.2 - 2211.5 - 1842.7 - 2898.9
TOTAL 2398.3 35536.8 2170.0 34952.0 2159.4 35740.3 2082.5 36164.6 2511.8 35353.4 1315.6 35476.4Source: Commercial Banks
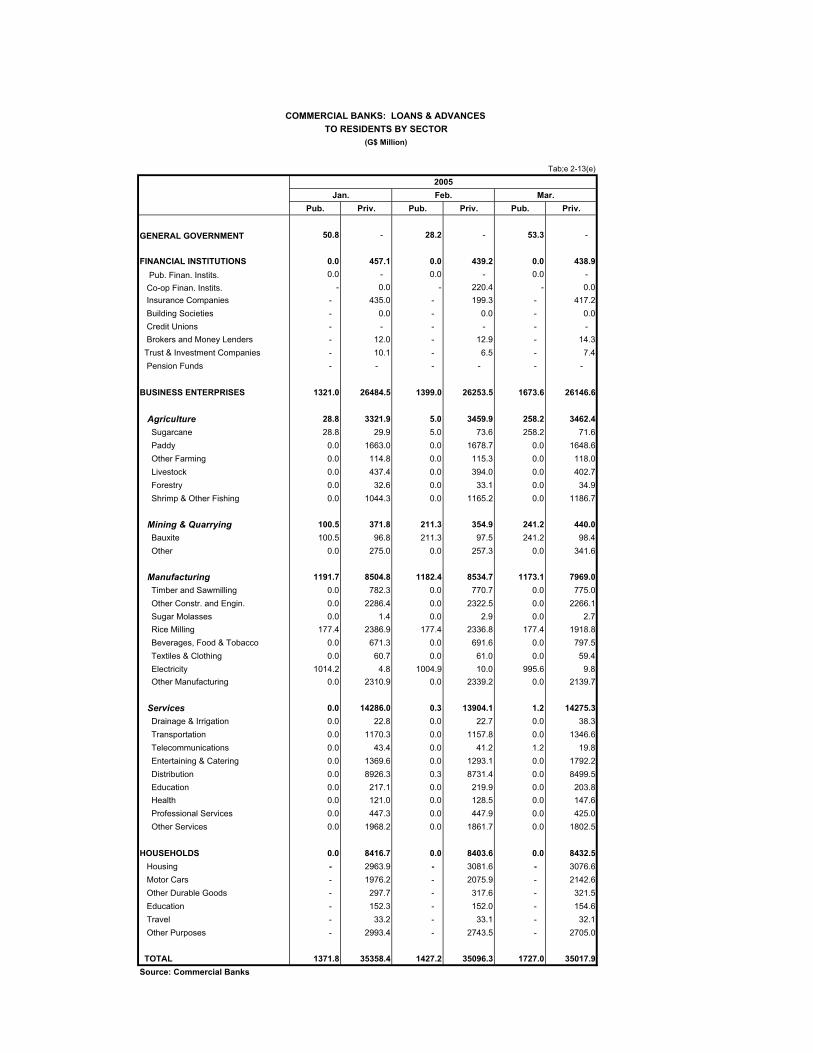
COMMERCIAL BANKS: LOANS & ADVANCES TO RESIDENTS BY SECTOR
(G$ Million)
Tab;e 2-13(e)
2005Jan. Feb. Mar.
Pub. Priv. Pub. Priv. Pub. Priv.
GENERAL GOVERNMENT 50.8 - 28.2 - 53.3 -
FINANCIAL INSTITUTIONS 0.0 457.1 0.0 439.2 0.0 438.9 Pub. Finan. Instits. 0.0 - 0.0 - 0.0 - Co-op Finan. Instits. - 0.0 - 220.4 - 0.0 Insurance Companies - 435.0 - 199.3 - 417.2 Building Societies - 0.0 - 0.0 - 0.0 Credit Unions - - - - - - Brokers and Money Lenders - 12.0 - 12.9 - 14.3 Trust & Investment Companies - 10.1 - 6.5 - 7.4 Pension Funds - - - - - -
BUSINESS ENTERPRISES 1321.0 26484.5 1399.0 26253.5 1673.6 26146.6 Agriculture 28.8 3321.9 5.0 3459.9 258.2 3462.4 Sugarcane 28.8 29.9 5.0 73.6 258.2 71.6 Paddy 0.0 1663.0 0.0 1678.7 0.0 1648.6 Other Farming 0.0 114.8 0.0 115.3 0.0 118.0 Livestock 0.0 437.4 0.0 394.0 0.0 402.7 Forestry 0.0 32.6 0.0 33.1 0.0 34.9 Shrimp & Other Fishing 0.0 1044.3 0.0 1165.2 0.0 1186.7
Mining & Quarrying 100.5 371.8 211.3 354.9 241.2 440.0 Bauxite 100.5 96.8 211.3 97.5 241.2 98.4 Other 0.0 275.0 0.0 257.3 0.0 341.6
Manufacturing 1191.7 8504.8 1182.4 8534.7 1173.1 7969.0 Timber and Sawmilling 0.0 782.3 0.0 770.7 0.0 775.0 Other Constr. and Engin. 0.0 2286.4 0.0 2322.5 0.0 2266.1 Sugar Molasses 0.0 1.4 0.0 2.9 0.0 2.7 Rice Milling 177.4 2386.9 177.4 2336.8 177.4 1918.8 Beverages, Food & Tobacco 0.0 671.3 0.0 691.6 0.0 797.5 Textiles & Clothing 0.0 60.7 0.0 61.0 0.0 59.4 Electricity 1014.2 4.8 1004.9 10.0 995.6 9.8 Other Manufacturing 0.0 2310.9 0.0 2339.2 0.0 2139.7
Services 0.0 14286.0 0.3 13904.1 1.2 14275.3 Drainage & Irrigation 0.0 22.8 0.0 22.7 0.0 38.3 Transportation 0.0 1170.3 0.0 1157.8 0.0 1346.6 Telecommunications 0.0 43.4 0.0 41.2 1.2 19.8 Entertaining & Catering 0.0 1369.6 0.0 1293.1 0.0 1792.2 Distribution 0.0 8926.3 0.3 8731.4 0.0 8499.5 Education 0.0 217.1 0.0 219.9 0.0 203.8 Health 0.0 121.0 0.0 128.5 0.0 147.6 Professional Services 0.0 447.3 0.0 447.9 0.0 425.0 Other Services 0.0 1968.2 0.0 1861.7 0.0 1802.5
HOUSEHOLDS 0.0 8416.7 0.0 8403.6 0.0 8432.5 Housing - 2963.9 - 3081.6 - 3076.6 Motor Cars - 1976.2 - 2075.9 - 2142.6 Other Durable Goods - 297.7 - 317.6 - 321.5 Education - 152.3 - 152.0 - 154.6 Travel - 33.2 - 33.1 - 32.1 Other Purposes - 2993.4 - 2743.5 - 2705.0
TOTAL 1371.8 35358.4 1427.2 35096.3 1727.0 35017.9Source: Commercial Banks
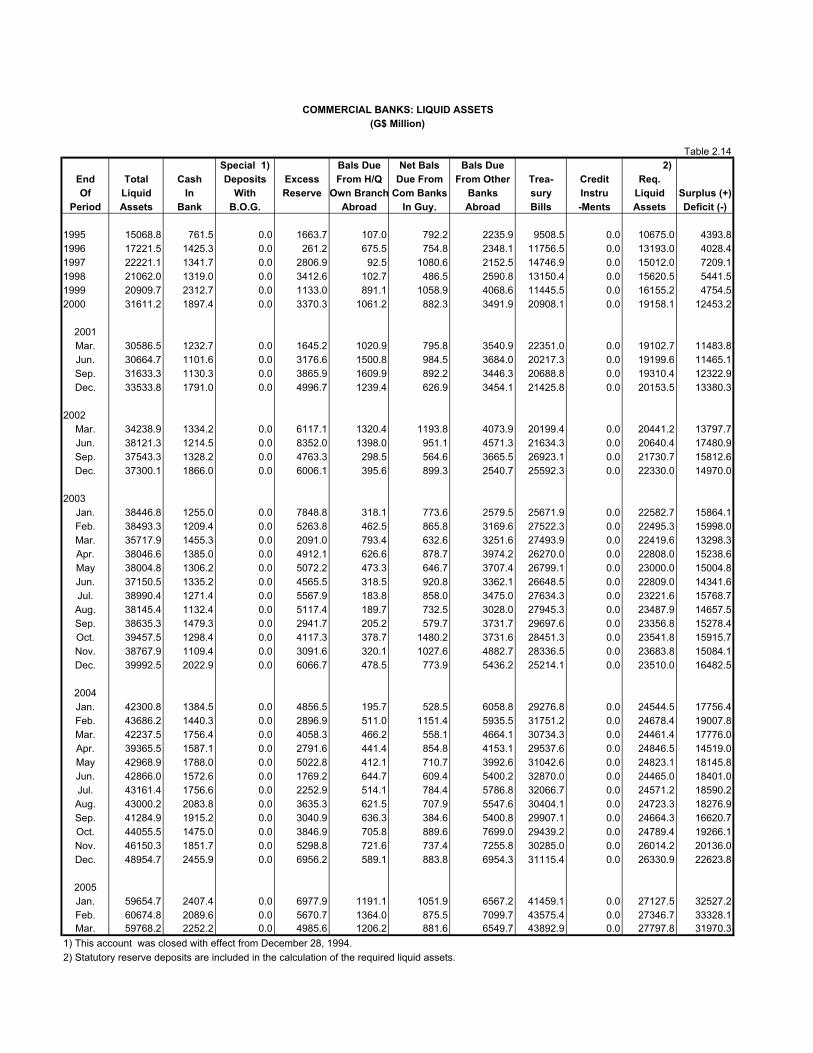
COMMERCIAL BANKS: LIQUID ASSETS(G$ Million)
Table 2.14Special 1) Bals Due Net Bals Bals Due 2)
End Total Cash Deposits Excess From H/Q Due From From Other Trea- Credit Req.Of Liquid In With Reserve Own Branch Com Banks Banks sury Instru Liquid Surplus (+)
Period Assets Bank B.O.G. Abroad In Guy. Abroad Bills -Ments Assets Deficit (-)
1995 15068.8 761.5 0.0 1663.7 107.0 792.2 2235.9 9508.5 0.0 10675.0 4393.81996 17221.5 1425.3 0.0 261.2 675.5 754.8 2348.1 11756.5 0.0 13193.0 4028.41997 22221.1 1341.7 0.0 2806.9 92.5 1080.6 2152.5 14746.9 0.0 15012.0 7209.11998 21062.0 1319.0 0.0 3412.6 102.7 486.5 2590.8 13150.4 0.0 15620.5 5441.51999 20909.7 2312.7 0.0 1133.0 891.1 1058.9 4068.6 11445.5 0.0 16155.2 4754.52000 31611.2 1897.4 0.0 3370.3 1061.2 882.3 3491.9 20908.1 0.0 19158.1 12453.2
2001Mar. 30586.5 1232.7 0.0 1645.2 1020.9 795.8 3540.9 22351.0 0.0 19102.7 11483.8Jun. 30664.7 1101.6 0.0 3176.6 1500.8 984.5 3684.0 20217.3 0.0 19199.6 11465.1Sep. 31633.3 1130.3 0.0 3865.9 1609.9 892.2 3446.3 20688.8 0.0 19310.4 12322.9Dec. 33533.8 1791.0 0.0 4996.7 1239.4 626.9 3454.1 21425.8 0.0 20153.5 13380.3
2002Mar. 34238.9 1334.2 0.0 6117.1 1320.4 1193.8 4073.9 20199.4 0.0 20441.2 13797.7Jun. 38121.3 1214.5 0.0 8352.0 1398.0 951.1 4571.3 21634.3 0.0 20640.4 17480.9Sep. 37543.3 1328.2 0.0 4763.3 298.5 564.6 3665.5 26923.1 0.0 21730.7 15812.6Dec. 37300.1 1866.0 0.0 6006.1 395.6 899.3 2540.7 25592.3 0.0 22330.0 14970.0
2003Jan. 38446.8 1255.0 0.0 7848.8 318.1 773.6 2579.5 25671.9 0.0 22582.7 15864.1Feb. 38493.3 1209.4 0.0 5263.8 462.5 865.8 3169.6 27522.3 0.0 22495.3 15998.0Mar. 35717.9 1455.3 0.0 2091.0 793.4 632.6 3251.6 27493.9 0.0 22419.6 13298.3Apr. 38046.6 1385.0 0.0 4912.1 626.6 878.7 3974.2 26270.0 0.0 22808.0 15238.6May 38004.8 1306.2 0.0 5072.2 473.3 646.7 3707.4 26799.1 0.0 23000.0 15004.8Jun. 37150.5 1335.2 0.0 4565.5 318.5 920.8 3362.1 26648.5 0.0 22809.0 14341.6Jul. 38990.4 1271.4 0.0 5567.9 183.8 858.0 3475.0 27634.3 0.0 23221.6 15768.7Aug. 38145.4 1132.4 0.0 5117.4 189.7 732.5 3028.0 27945.3 0.0 23487.9 14657.5Sep. 38635.3 1479.3 0.0 2941.7 205.2 579.7 3731.7 29697.6 0.0 23356.8 15278.4Oct. 39457.5 1298.4 0.0 4117.3 378.7 1480.2 3731.6 28451.3 0.0 23541.8 15915.7Nov. 38767.9 1109.4 0.0 3091.6 320.1 1027.6 4882.7 28336.5 0.0 23683.8 15084.1Dec. 39992.5 2022.9 0.0 6066.7 478.5 773.9 5436.2 25214.1 0.0 23510.0 16482.5
2004Jan. 42300.8 1384.5 0.0 4856.5 195.7 528.5 6058.8 29276.8 0.0 24544.5 17756.4Feb. 43686.2 1440.3 0.0 2896.9 511.0 1151.4 5935.5 31751.2 0.0 24678.4 19007.8Mar. 42237.5 1756.4 0.0 4058.3 466.2 558.1 4664.1 30734.3 0.0 24461.4 17776.0Apr. 39365.5 1587.1 0.0 2791.6 441.4 854.8 4153.1 29537.6 0.0 24846.5 14519.0May 42968.9 1788.0 0.0 5022.8 412.1 710.7 3992.6 31042.6 0.0 24823.1 18145.8Jun. 42866.0 1572.6 0.0 1769.2 644.7 609.4 5400.2 32870.0 0.0 24465.0 18401.0Jul. 43161.4 1756.6 0.0 2252.9 514.1 784.4 5786.8 32066.7 0.0 24571.2 18590.2Aug. 43000.2 2083.8 0.0 3635.3 621.5 707.9 5547.6 30404.1 0.0 24723.3 18276.9Sep. 41284.9 1915.2 0.0 3040.9 636.3 384.6 5400.8 29907.1 0.0 24664.3 16620.7Oct. 44055.5 1475.0 0.0 3846.9 705.8 889.6 7699.0 29439.2 0.0 24789.4 19266.1Nov. 46150.3 1851.7 0.0 5298.8 721.6 737.4 7255.8 30285.0 0.0 26014.2 20136.0Dec. 48954.7 2455.9 0.0 6956.2 589.1 883.8 6954.3 31115.4 0.0 26330.9 22623.8
2005Jan. 59654.7 2407.4 0.0 6977.9 1191.1 1051.9 6567.2 41459.1 0.0 27127.5 32527.2Feb. 60674.8 2089.6 0.0 5670.7 1364.0 875.5 7099.7 43575.4 0.0 27346.7 33328.1Mar. 59768.2 2252.2 0.0 4985.6 1206.2 881.6 6549.7 43892.9 0.0 27797.8 31970.3
1) This account was closed with effect from December 28, 1994.2) Statutory reserve deposits are included in the calculation of the required liquid assets.
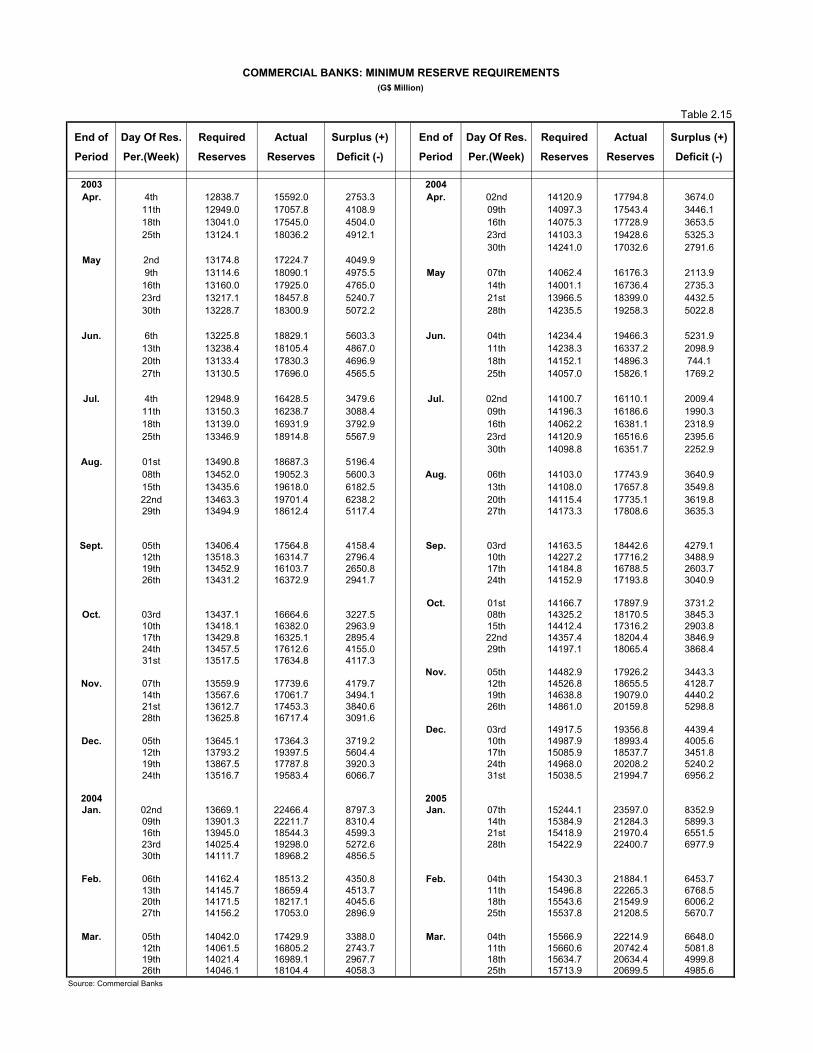
COMMERCIAL BANKS: MINIMUM RESERVE REQUIREMENTS(G$ Million)
Table 2.15
End of Day Of Res. Required Actual Surplus (+) End of Day Of Res. Required Actual Surplus (+)
Period Per.(Week) Reserves Reserves Deficit (-) Period Per.(Week) Reserves Reserves Deficit (-)
2003 2004Apr. 4th 12838.7 15592.0 2753.3 Apr. 02nd 14120.9 17794.8 3674.0
11th 12949.0 17057.8 4108.9 09th 14097.3 17543.4 3446.118th 13041.0 17545.0 4504.0 16th 14075.3 17728.9 3653.525th 13124.1 18036.2 4912.1 23rd 14103.3 19428.6 5325.3
30th 14241.0 17032.6 2791.6May 2nd 13174.8 17224.7 4049.9
9th 13114.6 18090.1 4975.5 May 07th 14062.4 16176.3 2113.916th 13160.0 17925.0 4765.0 14th 14001.1 16736.4 2735.323rd 13217.1 18457.8 5240.7 21st 13966.5 18399.0 4432.530th 13228.7 18300.9 5072.2 28th 14235.5 19258.3 5022.8
Jun. 6th 13225.8 18829.1 5603.3 Jun. 04th 14234.4 19466.3 5231.913th 13238.4 18105.4 4867.0 11th 14238.3 16337.2 2098.920th 13133.4 17830.3 4696.9 18th 14152.1 14896.3 744.127th 13130.5 17696.0 4565.5 25th 14057.0 15826.1 1769.2
Jul. 4th 12948.9 16428.5 3479.6 Jul. 02nd 14100.7 16110.1 2009.411th 13150.3 16238.7 3088.4 09th 14196.3 16186.6 1990.318th 13139.0 16931.9 3792.9 16th 14062.2 16381.1 2318.925th 13346.9 18914.8 5567.9 23rd 14120.9 16516.6 2395.6
30th 14098.8 16351.7 2252.9Aug. 01st 13490.8 18687.3 5196.4
08th 13452.0 19052.3 5600.3 Aug. 06th 14103.0 17743.9 3640.915th 13435.6 19618.0 6182.5 13th 14108.0 17657.8 3549.822nd 13463.3 19701.4 6238.2 20th 14115.4 17735.1 3619.829th 13494.9 18612.4 5117.4 27th 14173.3 17808.6 3635.3
Sept. 05th 13406.4 17564.8 4158.4 Sep. 03rd 14163.5 18442.6 4279.112th 13518.3 16314.7 2796.4 10th 14227.2 17716.2 3488.919th 13452.9 16103.7 2650.8 17th 14184.8 16788.5 2603.726th 13431.2 16372.9 2941.7 24th 14152.9 17193.8 3040.9
Oct. 01st 14166.7 17897.9 3731.2Oct. 03rd 13437.1 16664.6 3227.5 08th 14325.2 18170.5 3845.3
10th 13418.1 16382.0 2963.9 15th 14412.4 17316.2 2903.817th 13429.8 16325.1 2895.4 22nd 14357.4 18204.4 3846.924th 13457.5 17612.6 4155.0 29th 14197.1 18065.4 3868.431st 13517.5 17634.8 4117.3
Nov. 05th 14482.9 17926.2 3443.3Nov. 07th 13559.9 17739.6 4179.7 12th 14526.8 18655.5 4128.7
14th 13567.6 17061.7 3494.1 19th 14638.8 19079.0 4440.221st 13612.7 17453.3 3840.6 26th 14861.0 20159.8 5298.828th 13625.8 16717.4 3091.6
Dec. 03rd 14917.5 19356.8 4439.4Dec. 05th 13645.1 17364.3 3719.2 10th 14987.9 18993.4 4005.6
12th 13793.2 19397.5 5604.4 17th 15085.9 18537.7 3451.819th 13867.5 17787.8 3920.3 24th 14968.0 20208.2 5240.224th 13516.7 19583.4 6066.7 31st 15038.5 21994.7 6956.2
2004 2005Jan. 02nd 13669.1 22466.4 8797.3 Jan. 07th 15244.1 23597.0 8352.9
09th 13901.3 22211.7 8310.4 14th 15384.9 21284.3 5899.316th 13945.0 18544.3 4599.3 21st 15418.9 21970.4 6551.523rd 14025.4 19298.0 5272.6 28th 15422.9 22400.7 6977.930th 14111.7 18968.2 4856.5
Feb. 06th 14162.4 18513.2 4350.8 Feb. 04th 15430.3 21884.1 6453.713th 14145.7 18659.4 4513.7 11th 15496.8 22265.3 6768.520th 14171.5 18217.1 4045.6 18th 15543.6 21549.9 6006.227th 14156.2 17053.0 2896.9 25th 15537.8 21208.5 5670.7
Mar. 05th 14042.0 17429.9 3388.0 Mar. 04th 15566.9 22214.9 6648.012th 14061.5 16805.2 2743.7 11th 15660.6 20742.4 5081.819th 14021.4 16989.1 2967.7 18th 15634.7 20634.4 4999.826th 14046.1 18104.4 4058.3 25th 15713.9 20699.5 4985.6
Source: Commercial Banks
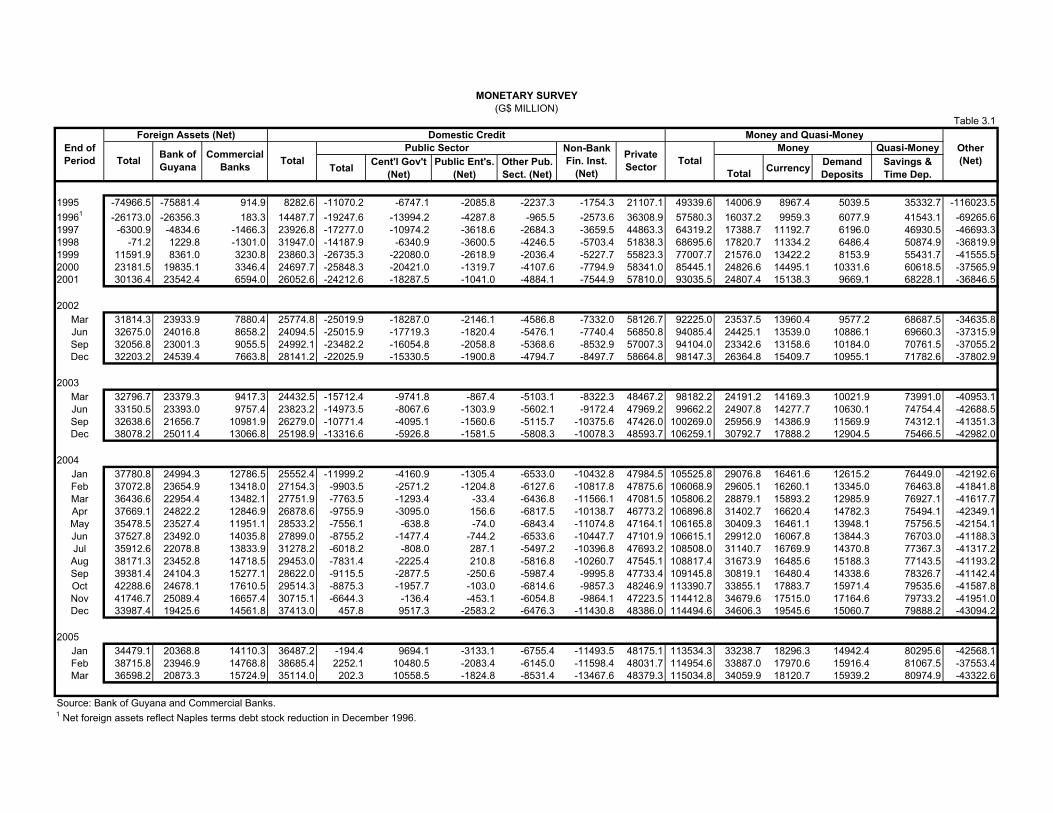
Quasi-Money
Total Cent'l Gov't (Net)
Public Ent's. (Net)
Other Pub. Sect. (Net) Total Currency Demand
DepositsSavings & Time Dep.
1995 -74966.5 -75881.4 914.9 8282.6 -11070.2 -6747.1 -2085.8 -2237.3 -1754.3 21107.1 49339.6 14006.9 8967.4 5039.5 35332.7 -116023.519961 -26173.0 -26356.3 183.3 14487.7 -19247.6 -13994.2 -4287.8 -965.5 -2573.6 36308.9 57580.3 16037.2 9959.3 6077.9 41543.1 -69265.61997 -6300.9 -4834.6 -1466.3 23926.8 -17277.0 -10974.2 -3618.6 -2684.3 -3659.5 44863.3 64319.2 17388.7 11192.7 6196.0 46930.5 -46693.31998 -71.2 1229.8 -1301.0 31947.0 -14187.9 -6340.9 -3600.5 -4246.5 -5703.4 51838.3 68695.6 17820.7 11334.2 6486.4 50874.9 -36819.91999 11591.9 8361.0 3230.8 23860.3 -26735.3 -22080.0 -2618.9 -2036.4 -5227.7 55823.3 77007.7 21576.0 13422.2 8153.9 55431.7 -41555.52000 23181.5 19835.1 3346.4 24697.7 -25848.3 -20421.0 -1319.7 -4107.6 -7794.9 58341.0 85445.1 24826.6 14495.1 10331.6 60618.5 -37565.92001 30136.4 23542.4 6594.0 26052.6 -24212.6 -18287.5 -1041.0 -4884.1 -7544.9 57810.0 93035.5 24807.4 15138.3 9669.1 68228.1 -36846.5
2002Mar 31814.3 23933.9 7880.4 25774.8 -25019.9 -18287.0 -2146.1 -4586.8 -7332.0 58126.7 92225.0 23537.5 13960.4 9577.2 68687.5 -34635.8Jun 32675.0 24016.8 8658.2 24094.5 -25015.9 -17719.3 -1820.4 -5476.1 -7740.4 56850.8 94085.4 24425.1 13539.0 10886.1 69660.3 -37315.9Sep 32056.8 23001.3 9055.5 24992.1 -23482.2 -16054.8 -2058.8 -5368.6 -8532.9 57007.3 94104.0 23342.6 13158.6 10184.0 70761.5 -37055.2Dec 32203.2 24539.4 7663.8 28141.2 -22025.9 -15330.5 -1900.8 -4794.7 -8497.7 58664.8 98147.3 26364.8 15409.7 10955.1 71782.6 -37802.9
2003Mar 32796.7 23379.3 9417.3 24432.5 -15712.4 -9741.8 -867.4 -5103.1 -8322.3 48467.2 98182.2 24191.2 14169.3 10021.9 73991.0 -40953.1Jun 33150.5 23393.0 9757.4 23823.2 -14973.5 -8067.6 -1303.9 -5602.1 -9172.4 47969.2 99662.2 24907.8 14277.7 10630.1 74754.4 -42688.5Sep 32638.6 21656.7 10981.9 26279.0 -10771.4 -4095.1 -1560.6 -5115.7 -10375.6 47426.0 100269.0 25956.9 14386.9 11569.9 74312.1 -41351.3Dec 38078.2 25011.4 13066.8 25198.9 -13316.6 -5926.8 -1581.5 -5808.3 -10078.3 48593.7 106259.1 30792.7 17888.2 12904.5 75466.5 -42982.0
2004Jan 37780.8 24994.3 12786.5 25552.4 -11999.2 -4160.9 -1305.4 -6533.0 -10432.8 47984.5 105525.8 29076.8 16461.6 12615.2 76449.0 -42192.6Feb 37072.8 23654.9 13418.0 27154.3 -9903.5 -2571.2 -1204.8 -6127.6 -10817.8 47875.6 106068.9 29605.1 16260.1 13345.0 76463.8 -41841.8Mar 36436.6 22954.4 13482.1 27751.9 -7763.5 -1293.4 -33.4 -6436.8 -11566.1 47081.5 105806.2 28879.1 15893.2 12985.9 76927.1 -41617.7Apr 37669.1 24822.2 12846.9 26878.6 -9755.9 -3095.0 156.6 -6817.5 -10138.7 46773.2 106896.8 31402.7 16620.4 14782.3 75494.1 -42349.1May 35478.5 23527.4 11951.1 28533.2 -7556.1 -638.8 -74.0 -6843.4 -11074.8 47164.1 106165.8 30409.3 16461.1 13948.1 75756.5 -42154.1Jun 37527.8 23492.0 14035.8 27899.0 -8755.2 -1477.4 -744.2 -6533.6 -10447.7 47101.9 106615.1 29912.0 16067.8 13844.3 76703.0 -41188.3Jul 35912.6 22078.8 13833.9 31278.2 -6018.2 -808.0 287.1 -5497.2 -10396.8 47693.2 108508.0 31140.7 16769.9 14370.8 77367.3 -41317.2Aug 38171.3 23452.8 14718.5 29453.0 -7831.4 -2225.4 210.8 -5816.8 -10260.7 47545.1 108817.4 31673.9 16485.6 15188.3 77143.5 -41193.2Sep 39381.4 24104.3 15277.1 28622.0 -9115.5 -2877.5 -250.6 -5987.4 -9995.8 47733.4 109145.8 30819.1 16480.4 14338.6 78326.7 -41142.4Oct 42288.6 24678.1 17610.5 29514.3 -8875.3 -1957.7 -103.0 -6814.6 -9857.3 48246.9 113390.7 33855.1 17883.7 15971.4 79535.6 -41587.8Nov 41746.7 25089.4 16657.4 30715.1 -6644.3 -136.4 -453.1 -6054.8 -9864.1 47223.5 114412.8 34679.6 17515.0 17164.6 79733.2 -41951.0Dec 33987.4 19425.6 14561.8 37413.0 457.8 9517.3 -2583.2 -6476.3 -11430.8 48386.0 114494.6 34606.3 19545.6 15060.7 79888.2 -43094.2
2005Jan 34479.1 20368.8 14110.3 36487.2 -194.4 9694.1 -3133.1 -6755.4 -11493.5 48175.1 113534.3 33238.7 18296.3 14942.4 80295.6 -42568.1Feb 38715.8 23946.9 14768.8 38685.4 2252.1 10480.5 -2083.4 -6145.0 -11598.4 48031.7 114954.6 33887.0 17970.6 15916.4 81067.5 -37553.4Mar 36598.2 20873.3 15724.9 35114.0 202.3 10558.5 -1824.8 -8531.4 -13467.6 48379.3 115034.8 34059.9 18120.7 15939.2 80974.9 -43322.6
Source: Bank of Guyana and Commercial Banks.1 Net foreign assets reflect Naples terms debt stock reduction in December 1996.
Other (Net)TotalPrivate
Sector
MONETARY SURVEY(G$ MILLION)
Table 3.1
Non-Bank Fin. Inst.
(Net)
Domestic CreditPublic Sector
TotalEnd of Period
Foreign Assets (Net)
Commercial Banks
Money and Quasi-MoneyMoneyBank of
GuyanaTotal
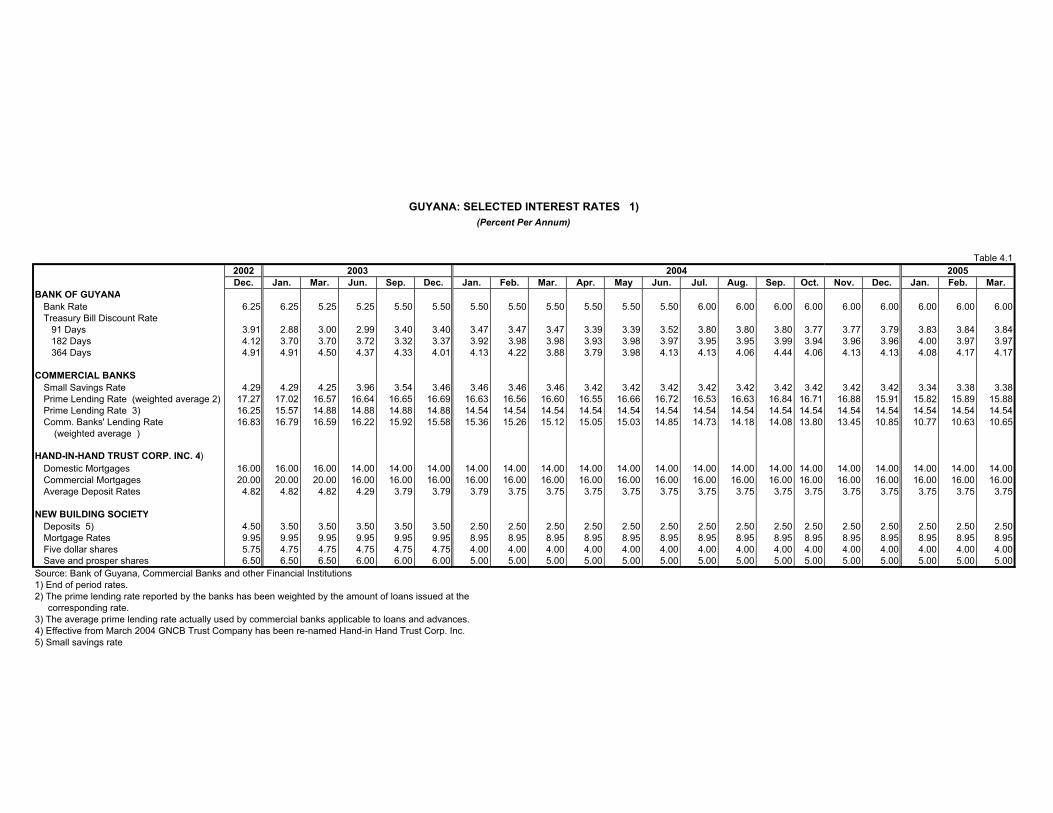
GUYANA: SELECTED INTEREST RATES 1)(Percent Per Annum)
Table 4.12002 2003 2004 2005Dec. Jan. Mar. Jun. Sep. Dec. Jan. Feb. Mar. Apr. May Jun. Jul. Aug. Sep. Oct. Nov. Dec. Jan. Feb. Mar.
BANK OF GUYANABank Rate 6.25 6.25 5.25 5.25 5.50 5.50 5.50 5.50 5.50 5.50 5.50 5.50 6.00 6.00 6.00 6.00 6.00 6.00 6.00 6.00 6.00Treasury Bill Discount Rate 91 Days 3.91 2.88 3.00 2.99 3.40 3.40 3.47 3.47 3.47 3.39 3.39 3.52 3.80 3.80 3.80 3.77 3.77 3.79 3.83 3.84 3.84 182 Days 4.12 3.70 3.70 3.72 3.32 3.37 3.92 3.98 3.98 3.93 3.98 3.97 3.95 3.95 3.99 3.94 3.96 3.96 4.00 3.97 3.97 364 Days 4.91 4.91 4.50 4.37 4.33 4.01 4.13 4.22 3.88 3.79 3.98 4.13 4.13 4.06 4.44 4.06 4.13 4.13 4.08 4.17 4.17
COMMERCIAL BANKSSmall Savings Rate 4.29 4.29 4.25 3.96 3.54 3.46 3.46 3.46 3.46 3.42 3.42 3.42 3.42 3.42 3.42 3.42 3.42 3.42 3.34 3.38 3.38Prime Lending Rate (weighted average 2) 17.27 17.02 16.57 16.64 16.65 16.69 16.63 16.56 16.60 16.55 16.66 16.72 16.53 16.63 16.84 16.71 16.88 15.91 15.82 15.89 15.88Prime Lending Rate 3) 16.25 15.57 14.88 14.88 14.88 14.88 14.54 14.54 14.54 14.54 14.54 14.54 14.54 14.54 14.54 14.54 14.54 14.54 14.54 14.54 14.54Comm. Banks' Lending Rate 16.83 16.79 16.59 16.22 15.92 15.58 15.36 15.26 15.12 15.05 15.03 14.85 14.73 14.18 14.08 13.80 13.45 10.85 10.77 10.63 10.65 (weighted average )
HAND-IN-HAND TRUST CORP. INC. 4)Domestic Mortgages 16.00 16.00 16.00 14.00 14.00 14.00 14.00 14.00 14.00 14.00 14.00 14.00 14.00 14.00 14.00 14.00 14.00 14.00 14.00 14.00 14.00Commercial Mortgages 20.00 20.00 20.00 16.00 16.00 16.00 16.00 16.00 16.00 16.00 16.00 16.00 16.00 16.00 16.00 16.00 16.00 16.00 16.00 16.00 16.00Average Deposit Rates 4.82 4.82 4.82 4.29 3.79 3.79 3.79 3.75 3.75 3.75 3.75 3.75 3.75 3.75 3.75 3.75 3.75 3.75 3.75 3.75 3.75
NEW BUILDING SOCIETYDeposits 5) 4.50 3.50 3.50 3.50 3.50 3.50 2.50 2.50 2.50 2.50 2.50 2.50 2.50 2.50 2.50 2.50 2.50 2.50 2.50 2.50 2.50Mortgage Rates 9.95 9.95 9.95 9.95 9.95 9.95 8.95 8.95 8.95 8.95 8.95 8.95 8.95 8.95 8.95 8.95 8.95 8.95 8.95 8.95 8.95Five dollar shares 5.75 4.75 4.75 4.75 4.75 4.75 4.00 4.00 4.00 4.00 4.00 4.00 4.00 4.00 4.00 4.00 4.00 4.00 4.00 4.00 4.00Save and prosper shares 6.50 6.50 6.50 6.00 6.00 6.00 5.00 5.00 5.00 5.00 5.00 5.00 5.00 5.00 5.00 5.00 5.00 5.00 5.00 5.00 5.00
Source: Bank of Guyana, Commercial Banks and other Financial Institutions1) End of period rates.2) The prime lending rate reported by the banks has been weighted by the amount of loans issued at the corresponding rate.3) The average prime lending rate actually used by commercial banks applicable to loans and advances.4) Effective from March 2004 GNCB Trust Company has been re-named Hand-in Hand Trust Corp. Inc. 5) Small savings rate
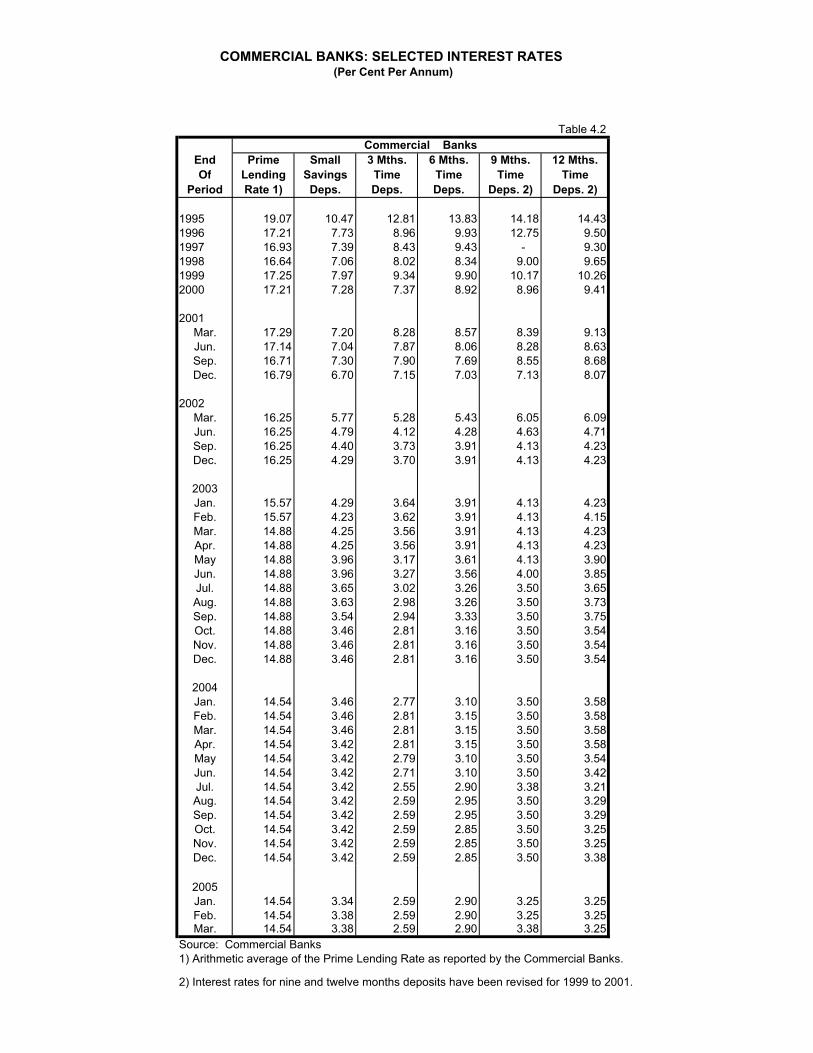
COMMERCIAL BANKS: SELECTED INTEREST RATES (Per Cent Per Annum)
Table 4.2Commercial Banks
End Prime Small 3 Mths. 6 Mths. 9 Mths. 12 Mths.Of Lending Savings Time Time Time Time
Period Rate 1) Deps. Deps. Deps. Deps. 2) Deps. 2)
1995 19.07 10.47 12.81 13.83 14.18 14.431996 17.21 7.73 8.96 9.93 12.75 9.501997 16.93 7.39 8.43 9.43 - 9.301998 16.64 7.06 8.02 8.34 9.00 9.651999 17.25 7.97 9.34 9.90 10.17 10.262000 17.21 7.28 7.37 8.92 8.96 9.41
2001Mar. 17.29 7.20 8.28 8.57 8.39 9.13Jun. 17.14 7.04 7.87 8.06 8.28 8.63Sep. 16.71 7.30 7.90 7.69 8.55 8.68Dec. 16.79 6.70 7.15 7.03 7.13 8.07
2002Mar. 16.25 5.77 5.28 5.43 6.05 6.09Jun. 16.25 4.79 4.12 4.28 4.63 4.71Sep. 16.25 4.40 3.73 3.91 4.13 4.23Dec. 16.25 4.29 3.70 3.91 4.13 4.23
2003Jan. 15.57 4.29 3.64 3.91 4.13 4.23Feb. 15.57 4.23 3.62 3.91 4.13 4.15Mar. 14.88 4.25 3.56 3.91 4.13 4.23Apr. 14.88 4.25 3.56 3.91 4.13 4.23May 14.88 3.96 3.17 3.61 4.13 3.90Jun. 14.88 3.96 3.27 3.56 4.00 3.85Jul. 14.88 3.65 3.02 3.26 3.50 3.65Aug. 14.88 3.63 2.98 3.26 3.50 3.73Sep. 14.88 3.54 2.94 3.33 3.50 3.75Oct. 14.88 3.46 2.81 3.16 3.50 3.54Nov. 14.88 3.46 2.81 3.16 3.50 3.54Dec. 14.88 3.46 2.81 3.16 3.50 3.54
2004Jan. 14.54 3.46 2.77 3.10 3.50 3.58Feb. 14.54 3.46 2.81 3.15 3.50 3.58Mar. 14.54 3.46 2.81 3.15 3.50 3.58Apr. 14.54 3.42 2.81 3.15 3.50 3.58May 14.54 3.42 2.79 3.10 3.50 3.54Jun. 14.54 3.42 2.71 3.10 3.50 3.42Jul. 14.54 3.42 2.55 2.90 3.38 3.21Aug. 14.54 3.42 2.59 2.95 3.50 3.29Sep. 14.54 3.42 2.59 2.95 3.50 3.29Oct. 14.54 3.42 2.59 2.85 3.50 3.25Nov. 14.54 3.42 2.59 2.85 3.50 3.25Dec. 14.54 3.42 2.59 2.85 3.50 3.38
2005Jan. 14.54 3.34 2.59 2.90 3.25 3.25Feb. 14.54 3.38 2.59 2.90 3.25 3.25Mar. 14.54 3.38 2.59 2.90 3.38 3.25
Source: Commercial Banks1) Arithmetic average of the Prime Lending Rate as reported by the Commercial Banks.
2) Interest rates for nine and twelve months deposits have been revised for 1999 to 2001.
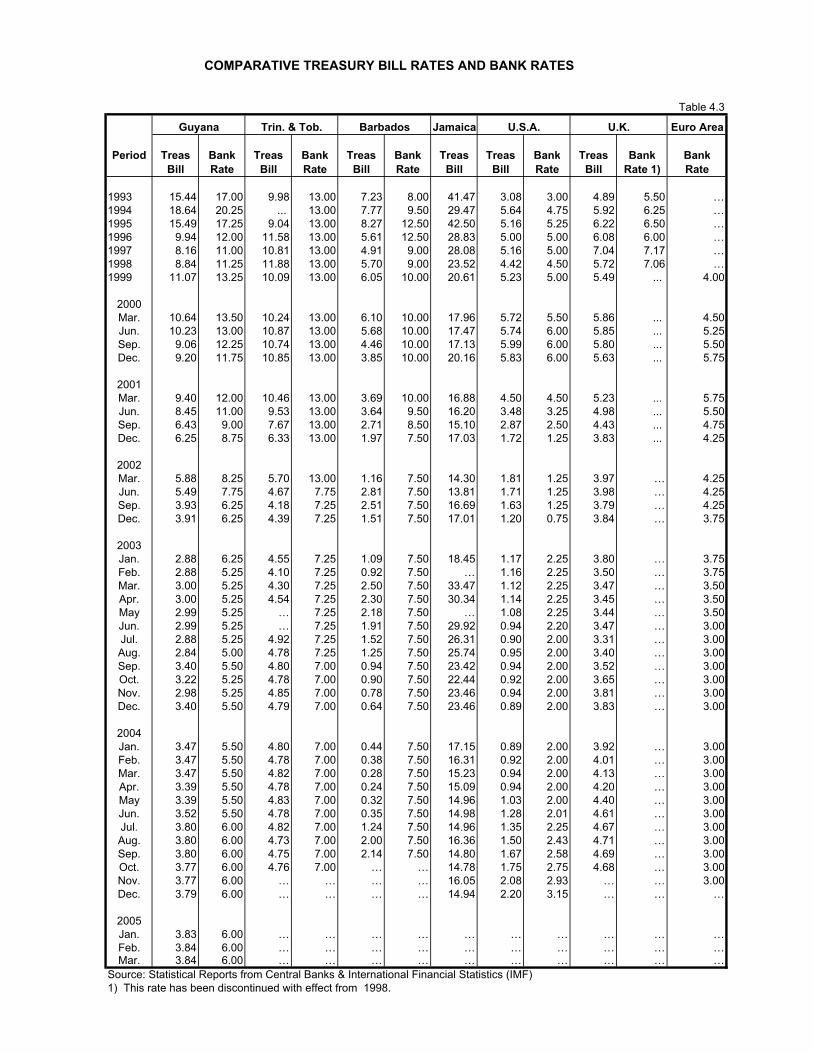
COMPARATIVE TREASURY BILL RATES AND BANK RATES
Table 4.3
Guyana Trin. & Tob. Barbados Jamaica U.S.A. U.K. Euro Area
Period Treas Bank Treas Bank Treas Bank Treas Treas Bank Treas Bank Bank Bill Rate Bill Rate Bill Rate Bill Bill Rate Bill Rate 1) Rate
1993 15.44 17.00 9.98 13.00 7.23 8.00 41.47 3.08 3.00 4.89 5.50 …1994 18.64 20.25 ... 13.00 7.77 9.50 29.47 5.64 4.75 5.92 6.25 …1995 15.49 17.25 9.04 13.00 8.27 12.50 42.50 5.16 5.25 6.22 6.50 …1996 9.94 12.00 11.58 13.00 5.61 12.50 28.83 5.00 5.00 6.08 6.00 …1997 8.16 11.00 10.81 13.00 4.91 9.00 28.08 5.16 5.00 7.04 7.17 …1998 8.84 11.25 11.88 13.00 5.70 9.00 23.52 4.42 4.50 5.72 7.06 …1999 11.07 13.25 10.09 13.00 6.05 10.00 20.61 5.23 5.00 5.49 ... 4.00
2000Mar. 10.64 13.50 10.24 13.00 6.10 10.00 17.96 5.72 5.50 5.86 ... 4.50Jun. 10.23 13.00 10.87 13.00 5.68 10.00 17.47 5.74 6.00 5.85 ... 5.25Sep. 9.06 12.25 10.74 13.00 4.46 10.00 17.13 5.99 6.00 5.80 ... 5.50Dec. 9.20 11.75 10.85 13.00 3.85 10.00 20.16 5.83 6.00 5.63 ... 5.75
2001Mar. 9.40 12.00 10.46 13.00 3.69 10.00 16.88 4.50 4.50 5.23 ... 5.75Jun. 8.45 11.00 9.53 13.00 3.64 9.50 16.20 3.48 3.25 4.98 ... 5.50Sep. 6.43 9.00 7.67 13.00 2.71 8.50 15.10 2.87 2.50 4.43 ... 4.75Dec. 6.25 8.75 6.33 13.00 1.97 7.50 17.03 1.72 1.25 3.83 ... 4.25
2002Mar. 5.88 8.25 5.70 13.00 1.16 7.50 14.30 1.81 1.25 3.97 … 4.25Jun. 5.49 7.75 4.67 7.75 2.81 7.50 13.81 1.71 1.25 3.98 … 4.25Sep. 3.93 6.25 4.18 7.25 2.51 7.50 16.69 1.63 1.25 3.79 … 4.25Dec. 3.91 6.25 4.39 7.25 1.51 7.50 17.01 1.20 0.75 3.84 … 3.75
2003Jan. 2.88 6.25 4.55 7.25 1.09 7.50 18.45 1.17 2.25 3.80 … 3.75Feb. 2.88 5.25 4.10 7.25 0.92 7.50 … 1.16 2.25 3.50 … 3.75Mar. 3.00 5.25 4.30 7.25 2.50 7.50 33.47 1.12 2.25 3.47 … 3.50Apr. 3.00 5.25 4.54 7.25 2.30 7.50 30.34 1.14 2.25 3.45 … 3.50May 2.99 5.25 … 7.25 2.18 7.50 … 1.08 2.25 3.44 … 3.50Jun. 2.99 5.25 … 7.25 1.91 7.50 29.92 0.94 2.20 3.47 … 3.00Jul. 2.88 5.25 4.92 7.25 1.52 7.50 26.31 0.90 2.00 3.31 … 3.00Aug. 2.84 5.00 4.78 7.25 1.25 7.50 25.74 0.95 2.00 3.40 … 3.00Sep. 3.40 5.50 4.80 7.00 0.94 7.50 23.42 0.94 2.00 3.52 … 3.00Oct. 3.22 5.25 4.78 7.00 0.90 7.50 22.44 0.92 2.00 3.65 … 3.00Nov. 2.98 5.25 4.85 7.00 0.78 7.50 23.46 0.94 2.00 3.81 … 3.00Dec. 3.40 5.50 4.79 7.00 0.64 7.50 23.46 0.89 2.00 3.83 … 3.00
2004Jan. 3.47 5.50 4.80 7.00 0.44 7.50 17.15 0.89 2.00 3.92 … 3.00Feb. 3.47 5.50 4.78 7.00 0.38 7.50 16.31 0.92 2.00 4.01 … 3.00Mar. 3.47 5.50 4.82 7.00 0.28 7.50 15.23 0.94 2.00 4.13 … 3.00Apr. 3.39 5.50 4.78 7.00 0.24 7.50 15.09 0.94 2.00 4.20 … 3.00May 3.39 5.50 4.83 7.00 0.32 7.50 14.96 1.03 2.00 4.40 … 3.00Jun. 3.52 5.50 4.78 7.00 0.35 7.50 14.98 1.28 2.01 4.61 … 3.00Jul. 3.80 6.00 4.82 7.00 1.24 7.50 14.96 1.35 2.25 4.67 … 3.00Aug. 3.80 6.00 4.73 7.00 2.00 7.50 16.36 1.50 2.43 4.71 … 3.00Sep. 3.80 6.00 4.75 7.00 2.14 7.50 14.80 1.67 2.58 4.69 … 3.00Oct. 3.77 6.00 4.76 7.00 … … 14.78 1.75 2.75 4.68 … 3.00Nov. 3.77 6.00 … … … … 16.05 2.08 2.93 … … 3.00Dec. 3.79 6.00 … … … … 14.94 2.20 3.15 … … …
2005Jan. 3.83 6.00 … … … … … … … … … …Feb. 3.84 6.00 … … … … … … … … … …Mar. 3.84 6.00 … … … … … … … … … …
Source: Statistical Reports from Central Banks & International Financial Statistics (IMF) 1) This rate has been discontinued with effect from 1998.

THE NEW BUILDING SOCIETY: ASSETS AND LIABILITIES(G$ Million)
Assets LiabilitiesPublic Sector Private Sector Deposits
Loans
1994 148.0 82.4 3,131.7 3,101.4 21.2 9.1 1,097.1 1,096.4 0.7 236.5 4,695.7 4,043.2 3,812.6 230.6 652.5 1995 168.1 352.6 3,234.1 3,211.2 13.8 9.1 1,862.7 1,861.4 1.3 265.8 5,883.3 5,006.2 4,766.5 239.7 877.1 1996 184.8 153.3 4,338.5 4,333.4 4.9 0.2 2,658.1 2,653.8 4.3 404.5 7,739.2 6,700.0 6,439.7 260.3 1,039.2 1997 209.4 114.7 5,054.7 5,054.7 - - 3,604.3 3,602.6 1.7 435.9 9,418.9 8,156.7 7,871.2 285.5 1,262.3 1998 277.9 66.7 5,226.1 5,226.1 - - 4,921.6 4,921.3 0.3 430.2 10,922.5 9,468.9 9,129.6 339.3 1,453.5 1999 310.3 123.9 4,705.2 4,705.2 - - 6,090.5 6,088.8 1.7 738.7 11,968.6 10,236.0 9,918.4 317.6 1,732.5 2000 355.7 885.1 5,227.1 5,227.1 - - 7,281.8 7,281.8 - 798.9 14,548.6 12,593.2 12,239.2 354.0 1,955.3
2002Mar 450.4 2,225.1 7,523.0 7,523.0 - - 8,611.9 8,611.9 - 806.4 19,616.8 17,378.3 16,960.0 418.4 2,238.5 Jun 454.4 2,142.1 7,861.8 7,861.8 - - 9,065.8 9,065.8 - 894.1 20,418.1 18,057.5 17,610.5 447.0 2,360.5 Sep 467.4 3,007.5 7,341.0 7,341.0 - - 9,422.8 9,422.8 - 804.3 21,043.1 18,616.6 18,143.7 472.9 2,426.5 Dec 497.2 2,497.1 7,862.7 7,862.7 - - 9,776.5 9,776.5 - 749.0 21,382.5 18,914.8 18,451.1 463.7 2,467.8
2003Mar 497.2 2,328.2 8,732.1 8,732.1 - - 10,020.8 10,020.8 - 773.9 22,352.1 19,747.1 19,252.4 494.8 2,605.0 Jun 502.2 2,787.9 8,605.9 8,605.9 - - 10,279.8 10,279.8 - 760.2 22,936.0 20,214.7 19,701.7 513.0 2,721.3 Sep 597.9 2,469.2 8,734.9 8,734.9 - - 10,604.9 10,604.9 - 737.9 23,144.7 20,394.4 19,873.4 521.0 2,750.3 Dec 721.9 1,686.3 9,557.9 9,557.9 - - 10,868.8 10,868.8 - 756.7 23,591.5 20,779.5 20,257.8 521.7 2,812.0
2004Jan 721.0 1,651.2 10,011.9 10,011.9 - - 10,896.2 10,896.2 - 776.8 24,057.1 21,294.1 20,759.2 535.0 2,763.0 Feb 720.1 1,517.4 10,263.3 10,263.3 - - 10,945.8 10,945.8 - 757.0 24,203.5 21,417.6 20,888.0 529.6 2,785.9 Mar 742.9 2,599.1 9,340.0 9,340.0 - - 11,030.9 11,030.9 - 822.2 24,535.0 21,582.9 21,049.9 533.0 2,952.1 Apr 742.3 1,435.1 10,554.2 10,554.2 - - 11,141.9 11,141.9 - 800.6 24,674.1 21,724.5 21,183.4 541.1 2,949.6 May 741.7 1,396.2 10,619.0 10,619.0 - - 11,271.1 11,271.1 - 937.1 24,965.2 21,988.5 21,440.8 547.7 2,976.7 Jun 748.1 1,227.4 10,730.4 10,730.4 - - 11,416.5 11,416.5 - 958.6 25,081.0 22,018.2 21,464.3 553.9 3,062.8 Jul 747.6 1,452.7 10,331.5 10,331.5 - - 11,561.7 11,561.7 - 979.6 25,073.1 22,045.2 21,515.1 530.0 3,027.9 Aug 747.0 1,494.8 10,328.5 10,328.5 - - 11,662.2 11,662.2 - 937.1 25,169.6 22,112.6 21,585.9 526.7 3,057.0 Sep 746.4 1,567.4 10,285.4 10,285.4 - - 11,846.8 11,846.8 - 968.5 25,414.5 22,301.5 21,759.8 541.7 3,112.9 Oct 745.8 1,764.3 10,026.6 10,026.6 - - 12,038.4 12,038.4 - 940.1 25,515.2 22,380.6 21,829.2 551.4 3,134.6 Nov 745.2 1,749.9 10,034.3 10,034.3 - - 12,225.6 12,225.6 - 943.7 25,698.9 22,526.9 21,988.6 538.3 3,171.9 Dec 758.2 1,732.9 9,887.2 9,887.2 - - 12,412.7 12,412.7 - 954.5 25,745.6 22,507.0 21,959.5 547.5 3,238.7
2005Jan 764.6 1,874.5 10,121.0 10,121.0 - - 12,473.1 12,473.1 - 999.8 26,232.9 22,992.3 22,439.2 553.1 3,240.6 Feb 763.9 1,768.4 10,453.2 10,453.2 - - 12,570.8 12,570.8 - 959.0 26,515.4 23,243.5 22,678.7 564.8 3,271.9 Mar 834.7 1,792.3 10,512.0 10,512.0 - - 12,685.6 12,685.6 - 962.1 26,786.7 23,385.7 22,825.6 560.2 3,401.0
Source: New Building Society
Table 5.1
Period Ended
Foreign Sector Total Gov't.
T/BillsGov't. Deb. Total
Total Assets/ Liabilities OtherTotal
DepositsShares
DepositsOther
DepositsOther
Banking System Cash &
Deposits
Local Gov't. Sec. Mortgage
LoansOther Loans
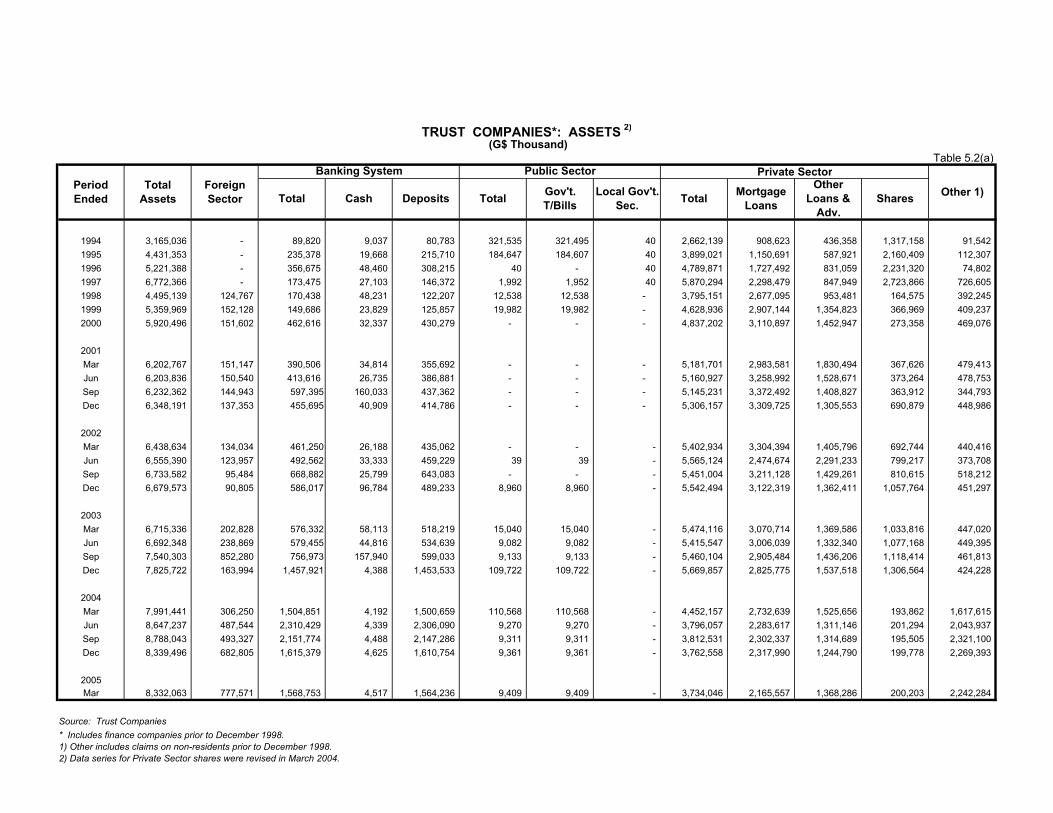
TRUST COMPANIES*: ASSETS 2)
(G$ Thousand)
Banking System Public Sector
1994 3,165,036 - 89,820 9,037 80,783 321,535 321,495 40 2,662,139 908,623 436,358 1,317,158 91,542 1995 4,431,353 - 235,378 19,668 215,710 184,647 184,607 40 3,899,021 1,150,691 587,921 2,160,409 112,307 1996 5,221,388 - 356,675 48,460 308,215 40 - 40 4,789,871 1,727,492 831,059 2,231,320 74,802 1997 6,772,366 - 173,475 27,103 146,372 1,992 1,952 40 5,870,294 2,298,479 847,949 2,723,866 726,605 1998 4,495,139 124,767 170,438 48,231 122,207 12,538 12,538 - 3,795,151 2,677,095 953,481 164,575 392,245 1999 5,359,969 152,128 149,686 23,829 125,857 19,982 19,982 - 4,628,936 2,907,144 1,354,823 366,969 409,237 2000 5,920,496 151,602 462,616 32,337 430,279 - - - 4,837,202 3,110,897 1,452,947 273,358 469,076
2001Mar 6,202,767 151,147 390,506 34,814 355,692 - - - 5,181,701 2,983,581 1,830,494 367,626 479,413 Jun 6,203,836 150,540 413,616 26,735 386,881 - - - 5,160,927 3,258,992 1,528,671 373,264 478,753 Sep 6,232,362 144,943 597,395 160,033 437,362 - - - 5,145,231 3,372,492 1,408,827 363,912 344,793 Dec 6,348,191 137,353 455,695 40,909 414,786 - - - 5,306,157 3,309,725 1,305,553 690,879 448,986
2002Mar 6,438,634 134,034 461,250 26,188 435,062 - - - 5,402,934 3,304,394 1,405,796 692,744 440,416 Jun 6,555,390 123,957 492,562 33,333 459,229 39 39 - 5,565,124 2,474,674 2,291,233 799,217 373,708 Sep 6,733,582 95,484 668,882 25,799 643,083 - - - 5,451,004 3,211,128 1,429,261 810,615 518,212 Dec 6,679,573 90,805 586,017 96,784 489,233 8,960 8,960 - 5,542,494 3,122,319 1,362,411 1,057,764 451,297
2003Mar 6,715,336 202,828 576,332 58,113 518,219 15,040 15,040 - 5,474,116 3,070,714 1,369,586 1,033,816 447,020 Jun 6,692,348 238,869 579,455 44,816 534,639 9,082 9,082 - 5,415,547 3,006,039 1,332,340 1,077,168 449,395 Sep 7,540,303 852,280 756,973 157,940 599,033 9,133 9,133 - 5,460,104 2,905,484 1,436,206 1,118,414 461,813 Dec 7,825,722 163,994 1,457,921 4,388 1,453,533 109,722 109,722 - 5,669,857 2,825,775 1,537,518 1,306,564 424,228
2004Mar 7,991,441 306,250 1,504,851 4,192 1,500,659 110,568 110,568 - 4,452,157 2,732,639 1,525,656 193,862 1,617,615 Jun 8,647,237 487,544 2,310,429 4,339 2,306,090 9,270 9,270 - 3,796,057 2,283,617 1,311,146 201,294 2,043,937 Sep 8,788,043 493,327 2,151,774 4,488 2,147,286 9,311 9,311 - 3,812,531 2,302,337 1,314,689 195,505 2,321,100 Dec 8,339,496 682,805 1,615,379 4,625 1,610,754 9,361 9,361 - 3,762,558 2,317,990 1,244,790 199,778 2,269,393
2005Mar 8,332,063 777,571 1,568,753 4,517 1,564,236 9,409 9,409 - 3,734,046 2,165,557 1,368,286 200,203 2,242,284
Source: Trust Companies * Includes finance companies prior to December 1998.1) Other includes claims on non-residents prior to December 1998.2) Data series for Private Sector shares were revised in March 2004.
Table 5.2(a)
Period Ended
Total Assets
Foreign Sector Gov't.
T/BillsMortgage
LoansTotal Cash Deposits Total
Private Sector
Other 1)Local Gov't. Sec. Total
Other Loans &
Adv.Shares
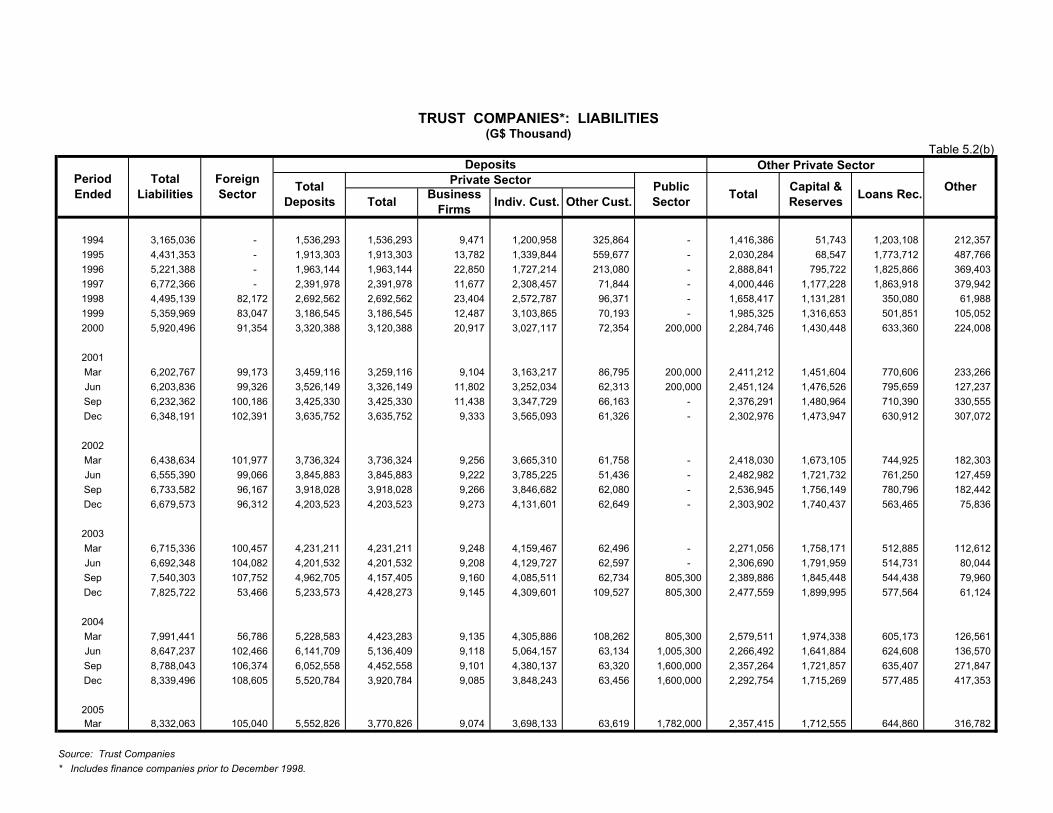
TRUST COMPANIES*: LIABILITIES(G$ Thousand)
DepositsPrivate Sector
1994 3,165,036 - 1,536,293 1,536,293 9,471 1,200,958 325,864 - 1,416,386 51,743 1,203,108 212,357 1995 4,431,353 - 1,913,303 1,913,303 13,782 1,339,844 559,677 - 2,030,284 68,547 1,773,712 487,766 1996 5,221,388 - 1,963,144 1,963,144 22,850 1,727,214 213,080 - 2,888,841 795,722 1,825,866 369,403 1997 6,772,366 - 2,391,978 2,391,978 11,677 2,308,457 71,844 - 4,000,446 1,177,228 1,863,918 379,942 1998 4,495,139 82,172 2,692,562 2,692,562 23,404 2,572,787 96,371 - 1,658,417 1,131,281 350,080 61,988 1999 5,359,969 83,047 3,186,545 3,186,545 12,487 3,103,865 70,193 - 1,985,325 1,316,653 501,851 105,052 2000 5,920,496 91,354 3,320,388 3,120,388 20,917 3,027,117 72,354 200,000 2,284,746 1,430,448 633,360 224,008
2001Mar 6,202,767 99,173 3,459,116 3,259,116 9,104 3,163,217 86,795 200,000 2,411,212 1,451,604 770,606 233,266 Jun 6,203,836 99,326 3,526,149 3,326,149 11,802 3,252,034 62,313 200,000 2,451,124 1,476,526 795,659 127,237 Sep 6,232,362 100,186 3,425,330 3,425,330 11,438 3,347,729 66,163 - 2,376,291 1,480,964 710,390 330,555 Dec 6,348,191 102,391 3,635,752 3,635,752 9,333 3,565,093 61,326 - 2,302,976 1,473,947 630,912 307,072
2002Mar 6,438,634 101,977 3,736,324 3,736,324 9,256 3,665,310 61,758 - 2,418,030 1,673,105 744,925 182,303 Jun 6,555,390 99,066 3,845,883 3,845,883 9,222 3,785,225 51,436 - 2,482,982 1,721,732 761,250 127,459 Sep 6,733,582 96,167 3,918,028 3,918,028 9,266 3,846,682 62,080 - 2,536,945 1,756,149 780,796 182,442 Dec 6,679,573 96,312 4,203,523 4,203,523 9,273 4,131,601 62,649 - 2,303,902 1,740,437 563,465 75,836
2003Mar 6,715,336 100,457 4,231,211 4,231,211 9,248 4,159,467 62,496 - 2,271,056 1,758,171 512,885 112,612 Jun 6,692,348 104,082 4,201,532 4,201,532 9,208 4,129,727 62,597 - 2,306,690 1,791,959 514,731 80,044 Sep 7,540,303 107,752 4,962,705 4,157,405 9,160 4,085,511 62,734 805,300 2,389,886 1,845,448 544,438 79,960 Dec 7,825,722 53,466 5,233,573 4,428,273 9,145 4,309,601 109,527 805,300 2,477,559 1,899,995 577,564 61,124
2004Mar 7,991,441 56,786 5,228,583 4,423,283 9,135 4,305,886 108,262 805,300 2,579,511 1,974,338 605,173 126,561 Jun 8,647,237 102,466 6,141,709 5,136,409 9,118 5,064,157 63,134 1,005,300 2,266,492 1,641,884 624,608 136,570 Sep 8,788,043 106,374 6,052,558 4,452,558 9,101 4,380,137 63,320 1,600,000 2,357,264 1,721,857 635,407 271,847 Dec 8,339,496 108,605 5,520,784 3,920,784 9,085 3,848,243 63,456 1,600,000 2,292,754 1,715,269 577,485 417,353
2005Mar 8,332,063 105,040 5,552,826 3,770,826 9,074 3,698,133 63,619 1,782,000 2,357,415 1,712,555 644,860 316,782
Source: Trust Companies* Includes finance companies prior to December 1998.
Table 5.2(b)
Period Ended
Total Liabilities
Foreign Sector Total
Deposits TotalPublic Sector
Capital & ReservesBusiness
Firms Indiv. Cust. Other Cust. Total Loans Rec.
Other Private Sector
Other
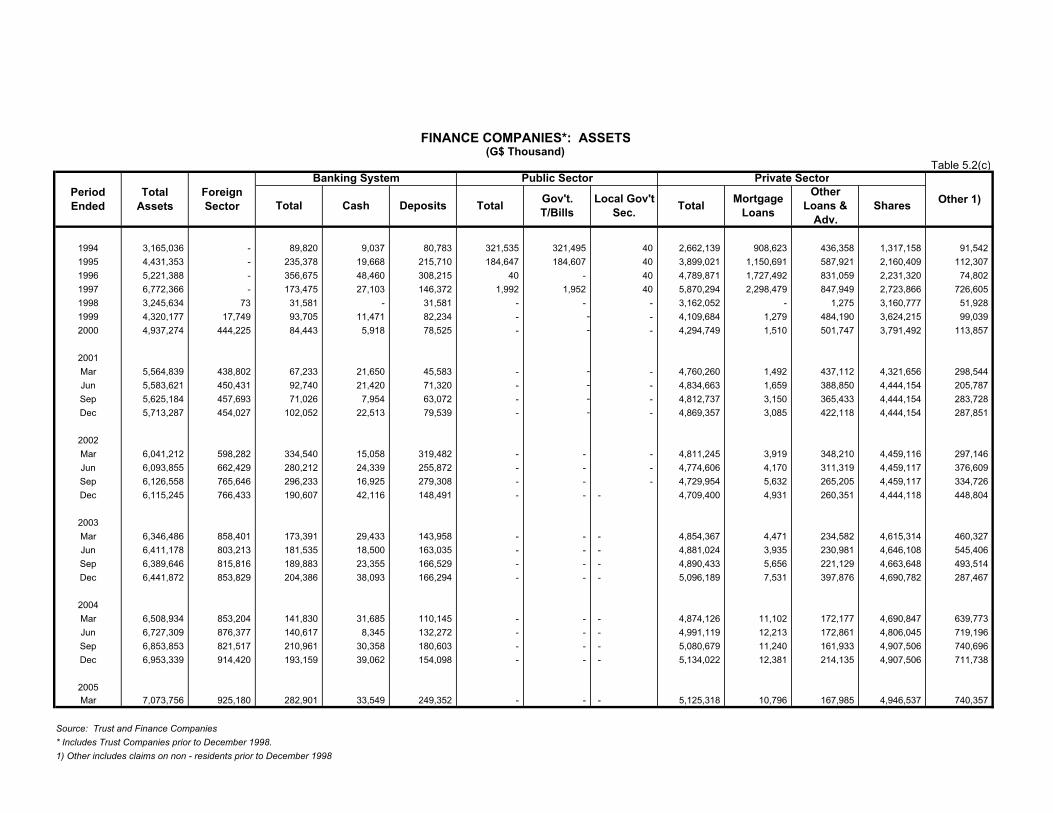
FINANCE COMPANIES*: ASSETS (G$ Thousand)
Banking System Public Sector Private Sector
1994 3,165,036 - 89,820 9,037 80,783 321,535 321,495 40 2,662,139 908,623 436,358 1,317,158 91,542 1995 4,431,353 - 235,378 19,668 215,710 184,647 184,607 40 3,899,021 1,150,691 587,921 2,160,409 112,307 1996 5,221,388 - 356,675 48,460 308,215 40 - 40 4,789,871 1,727,492 831,059 2,231,320 74,802 1997 6,772,366 - 173,475 27,103 146,372 1,992 1,952 40 5,870,294 2,298,479 847,949 2,723,866 726,605 1998 3,245,634 73 31,581 - 31,581 - - - 3,162,052 - 1,275 3,160,777 51,928 1999 4,320,177 17,749 93,705 11,471 82,234 - - - 4,109,684 1,279 484,190 3,624,215 99,039 2000 4,937,274 444,225 84,443 5,918 78,525 - - - 4,294,749 1,510 501,747 3,791,492 113,857
2001Mar 5,564,839 438,802 67,233 21,650 45,583 - - - 4,760,260 1,492 437,112 4,321,656 298,544 Jun 5,583,621 450,431 92,740 21,420 71,320 - - - 4,834,663 1,659 388,850 4,444,154 205,787 Sep 5,625,184 457,693 71,026 7,954 63,072 - - - 4,812,737 3,150 365,433 4,444,154 283,728 Dec 5,713,287 454,027 102,052 22,513 79,539 - - - 4,869,357 3,085 422,118 4,444,154 287,851
2002Mar 6,041,212 598,282 334,540 15,058 319,482 - - - 4,811,245 3,919 348,210 4,459,116 297,146 Jun 6,093,855 662,429 280,212 24,339 255,872 - - - 4,774,606 4,170 311,319 4,459,117 376,609 Sep 6,126,558 765,646 296,233 16,925 279,308 - - - 4,729,954 5,632 265,205 4,459,117 334,726 Dec 6,115,245 766,433 190,607 42,116 148,491 - - - 4,709,400 4,931 260,351 4,444,118 448,804
2003Mar 6,346,486 858,401 173,391 29,433 143,958 - - - 4,854,367 4,471 234,582 4,615,314 460,327 Jun 6,411,178 803,213 181,535 18,500 163,035 - - - 4,881,024 3,935 230,981 4,646,108 545,406 Sep 6,389,646 815,816 189,883 23,355 166,529 - - - 4,890,433 5,656 221,129 4,663,648 493,514 Dec 6,441,872 853,829 204,386 38,093 166,294 - - - 5,096,189 7,531 397,876 4,690,782 287,467
2004Mar 6,508,934 853,204 141,830 31,685 110,145 - - - 4,874,126 11,102 172,177 4,690,847 639,773 Jun 6,727,309 876,377 140,617 8,345 132,272 - - - 4,991,119 12,213 172,861 4,806,045 719,196 Sep 6,853,853 821,517 210,961 30,358 180,603 - - - 5,080,679 11,240 161,933 4,907,506 740,696 Dec 6,953,339 914,420 193,159 39,062 154,098 - - - 5,134,022 12,381 214,135 4,907,506 711,738
2005Mar 7,073,756 925,180 282,901 33,549 249,352 - - - 5,125,318 10,796 167,985 4,946,537 740,357
Source: Trust and Finance Companies* Includes Trust Companies prior to December 1998.1) Other includes claims on non - residents prior to December 1998
SharesTotal Local Gov't Sec. Total
Other Loans &
Adv.
Table 5.2(c)
Period Ended Gov't.
T/BillsMortgage
LoansOther 1)Total
AssetsForeign Sector Total Cash Deposits
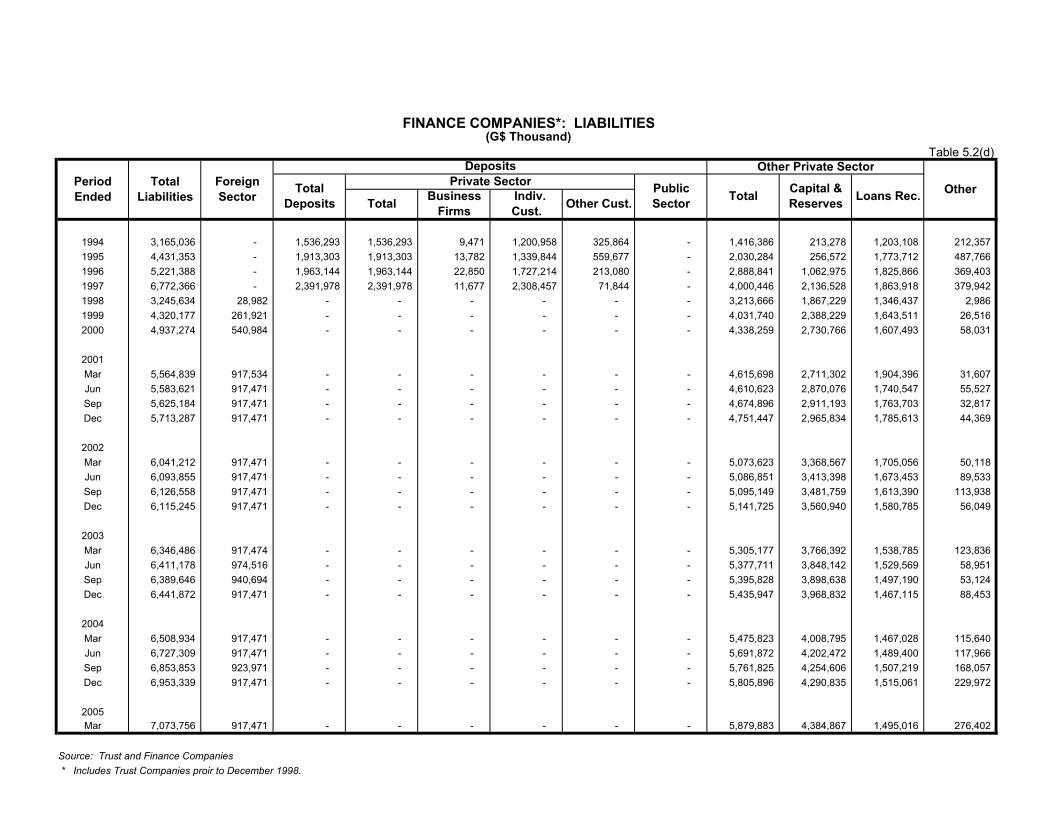
FINANCE COMPANIES*: LIABILITIES(G$ Thousand)
DepositsPrivate Sector
1994 3,165,036 - 1,536,293 1,536,293 9,471 1,200,958 325,864 - 1,416,386 213,278 1,203,108 212,357 1995 4,431,353 - 1,913,303 1,913,303 13,782 1,339,844 559,677 - 2,030,284 256,572 1,773,712 487,766 1996 5,221,388 - 1,963,144 1,963,144 22,850 1,727,214 213,080 - 2,888,841 1,062,975 1,825,866 369,403 1997 6,772,366 - 2,391,978 2,391,978 11,677 2,308,457 71,844 - 4,000,446 2,136,528 1,863,918 379,942 1998 3,245,634 28,982 - - - - - - 3,213,666 1,867,229 1,346,437 2,986 1999 4,320,177 261,921 - - - - - - 4,031,740 2,388,229 1,643,511 26,516 2000 4,937,274 540,984 - - - - - - 4,338,259 2,730,766 1,607,493 58,031
2001Mar 5,564,839 917,534 - - - - - - 4,615,698 2,711,302 1,904,396 31,607 Jun 5,583,621 917,471 - - - - - - 4,610,623 2,870,076 1,740,547 55,527 Sep 5,625,184 917,471 - - - - - - 4,674,896 2,911,193 1,763,703 32,817 Dec 5,713,287 917,471 - - - - - - 4,751,447 2,965,834 1,785,613 44,369
2002Mar 6,041,212 917,471 - - - - - - 5,073,623 3,368,567 1,705,056 50,118 Jun 6,093,855 917,471 - - - - - - 5,086,851 3,413,398 1,673,453 89,533 Sep 6,126,558 917,471 - - - - - - 5,095,149 3,481,759 1,613,390 113,938 Dec 6,115,245 917,471 - - - - - - 5,141,725 3,560,940 1,580,785 56,049
2003Mar 6,346,486 917,474 - - - - - - 5,305,177 3,766,392 1,538,785 123,836 Jun 6,411,178 974,516 - - - - - - 5,377,711 3,848,142 1,529,569 58,951 Sep 6,389,646 940,694 - - - - - - 5,395,828 3,898,638 1,497,190 53,124 Dec 6,441,872 917,471 - - - - - - 5,435,947 3,968,832 1,467,115 88,453
2004Mar 6,508,934 917,471 - - - - - - 5,475,823 4,008,795 1,467,028 115,640 Jun 6,727,309 917,471 - - - - - - 5,691,872 4,202,472 1,489,400 117,966 Sep 6,853,853 923,971 - - - - - - 5,761,825 4,254,606 1,507,219 168,057 Dec 6,953,339 917,471 - - - - - - 5,805,896 4,290,835 1,515,061 229,972
2005Mar 7,073,756 917,471 - - - - - - 5,879,883 4,384,867 1,495,016 276,402
Source: Trust and Finance Companies * Includes Trust Companies proir to December 1998.
Loans Rec.Other Cust.Public Sector Total Capital &
Reserves
Other Private Sector
Other
Table 5.2(d)
Period Ended
Total Liabilities
Foreign Sector
Total Deposits Total Business
Firms Indiv. Cust.
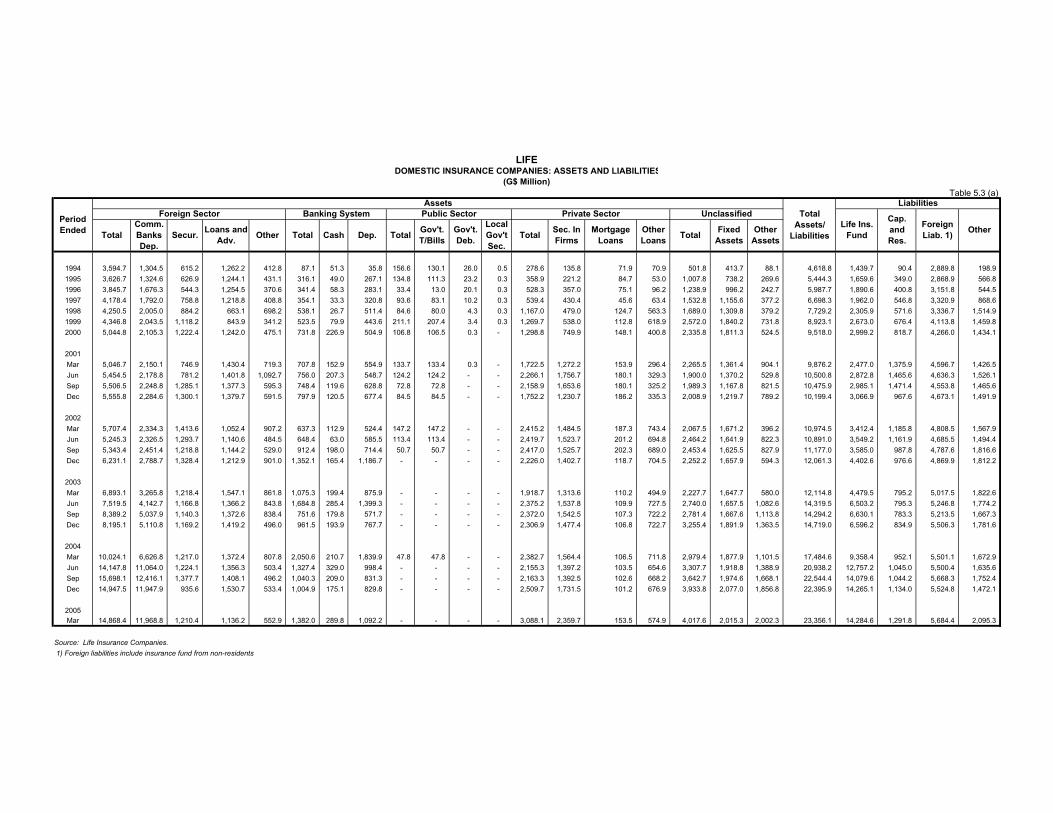
LIFEDOMESTIC INSURANCE COMPANIES: ASSETS AND LIABILITIES
(G$ Million)
Assets LiabilitiesForeign Sector Banking System Public Sector Private Sector Unclassified
1994 3,594.7 1,304.5 615.2 1,262.2 412.8 87.1 51.3 35.8 156.6 130.1 26.0 0.5 278.6 135.8 71.9 70.9 501.8 413.7 88.1 4,618.8 1,439.7 90.4 2,889.8 198.9 1995 3,626.7 1,324.6 626.9 1,244.1 431.1 316.1 49.0 267.1 134.8 111.3 23.2 0.3 358.9 221.2 84.7 53.0 1,007.8 738.2 269.6 5,444.3 1,659.6 349.0 2,868.9 566.8 1996 3,845.7 1,676.3 544.3 1,254.5 370.6 341.4 58.3 283.1 33.4 13.0 20.1 0.3 528.3 357.0 75.1 96.2 1,238.9 996.2 242.7 5,987.7 1,890.6 400.8 3,151.8 544.5 1997 4,178.4 1,792.0 758.8 1,218.8 408.8 354.1 33.3 320.8 93.6 83.1 10.2 0.3 539.4 430.4 45.6 63.4 1,532.8 1,155.6 377.2 6,698.3 1,962.0 546.8 3,320.9 868.6 1998 4,250.5 2,005.0 884.2 663.1 698.2 538.1 26.7 511.4 84.6 80.0 4.3 0.3 1,167.0 479.0 124.7 563.3 1,689.0 1,309.8 379.2 7,729.2 2,305.9 571.6 3,336.7 1,514.9 1999 4,346.8 2,043.5 1,118.2 843.9 341.2 523.5 79.9 443.6 211.1 207.4 3.4 0.3 1,269.7 538.0 112.8 618.9 2,572.0 1,840.2 731.8 8,923.1 2,673.0 676.4 4,113.8 1,459.8 2000 5,044.8 2,105.3 1,222.4 1,242.0 475.1 731.8 226.9 504.9 106.8 106.5 0.3 - 1,298.8 749.9 148.1 400.8 2,335.8 1,811.3 524.5 9,518.0 2,999.2 818.7 4,266.0 1,434.1
2001Mar 5,046.7 2,150.1 746.9 1,430.4 719.3 707.8 152.9 554.9 133.7 133.4 0.3 - 1,722.5 1,272.2 153.9 296.4 2,265.5 1,361.4 904.1 9,876.2 2,477.0 1,375.9 4,596.7 1,426.5 Jun 5,454.5 2,178.8 781.2 1,401.8 1,092.7 756.0 207.3 548.7 124.2 124.2 - - 2,266.1 1,756.7 180.1 329.3 1,900.0 1,370.2 529.8 10,500.8 2,872.8 1,465.6 4,636.3 1,526.1 Sep 5,506.5 2,248.8 1,285.1 1,377.3 595.3 748.4 119.6 628.8 72.8 72.8 - - 2,158.9 1,653.6 180.1 325.2 1,989.3 1,167.8 821.5 10,475.9 2,985.1 1,471.4 4,553.8 1,465.6 Dec 5,555.8 2,284.6 1,300.1 1,379.7 591.5 797.9 120.5 677.4 84.5 84.5 - - 1,752.2 1,230.7 186.2 335.3 2,008.9 1,219.7 789.2 10,199.4 3,066.9 967.6 4,673.1 1,491.9
2002Mar 5,707.4 2,334.3 1,413.6 1,052.4 907.2 637.3 112.9 524.4 147.2 147.2 - - 2,415.2 1,484.5 187.3 743.4 2,067.5 1,671.2 396.2 10,974.5 3,412.4 1,185.8 4,808.5 1,567.9 Jun 5,245.3 2,326.5 1,293.7 1,140.6 484.5 648.4 63.0 585.5 113.4 113.4 - - 2,419.7 1,523.7 201.2 694.8 2,464.2 1,641.9 822.3 10,891.0 3,549.2 1,161.9 4,685.5 1,494.4 Sep 5,343.4 2,451.4 1,218.8 1,144.2 529.0 912.4 198.0 714.4 50.7 50.7 - - 2,417.0 1,525.7 202.3 689.0 2,453.4 1,625.5 827.9 11,177.0 3,585.0 987.8 4,787.6 1,816.6 Dec 6,231.1 2,788.7 1,328.4 1,212.9 901.0 1,352.1 165.4 1,186.7 - - - - 2,226.0 1,402.7 118.7 704.5 2,252.2 1,657.9 594.3 12,061.3 4,402.6 976.6 4,869.9 1,812.2
2003Mar 6,893.1 3,265.8 1,218.4 1,547.1 861.8 1,075.3 199.4 875.9 - - - - 1,918.7 1,313.6 110.2 494.9 2,227.7 1,647.7 580.0 12,114.8 4,479.5 795.2 5,017.5 1,822.6 Jun 7,519.5 4,142.7 1,166.8 1,366.2 843.8 1,684.8 285.4 1,399.3 - - - - 2,375.2 1,537.8 109.9 727.5 2,740.0 1,657.5 1,082.6 14,319.5 6,503.2 795.3 5,246.8 1,774.2 Sep 8,389.2 5,037.9 1,140.3 1,372.6 838.4 751.6 179.8 571.7 - - - - 2,372.0 1,542.5 107.3 722.2 2,781.4 1,667.6 1,113.8 14,294.2 6,630.1 783.3 5,213.5 1,667.3 Dec 8,195.1 5,110.8 1,169.2 1,419.2 496.0 961.5 193.9 767.7 - - - - 2,306.9 1,477.4 106.8 722.7 3,255.4 1,891.9 1,363.5 14,719.0 6,596.2 834.9 5,506.3 1,781.6
2004Mar 10,024.1 6,626.8 1,217.0 1,372.4 807.8 2,050.6 210.7 1,839.9 47.8 47.8 - - 2,382.7 1,564.4 106.5 711.8 2,979.4 1,877.9 1,101.5 17,484.6 9,358.4 952.1 5,501.1 1,672.9 Jun 14,147.8 11,064.0 1,224.1 1,356.3 503.4 1,327.4 329.0 998.4 - - - - 2,155.3 1,397.2 103.5 654.6 3,307.7 1,918.8 1,388.9 20,938.2 12,757.2 1,045.0 5,500.4 1,635.6 Sep 15,698.1 12,416.1 1,377.7 1,408.1 496.2 1,040.3 209.0 831.3 - - - - 2,163.3 1,392.5 102.6 668.2 3,642.7 1,974.6 1,668.1 22,544.4 14,079.6 1,044.2 5,668.3 1,752.4 Dec 14,947.5 11,947.9 935.6 1,530.7 533.4 1,004.9 175.1 829.8 - - - - 2,509.7 1,731.5 101.2 676.9 3,933.8 2,077.0 1,856.8 22,395.9 14,265.1 1,134.0 5,524.8 1,472.1
2005Mar 14,868.4 11,968.8 1,210.4 1,136.2 552.9 1,382.0 289.8 1,092.2 - - - - 3,088.1 2,359.7 153.5 574.9 4,017.6 2,015.3 2,002.3 23,356.1 14,284.6 1,291.8 5,684.4 2,095.3
Source: Life Insurance Companies. 1) Foreign liabilities include insurance fund from non-residents
Comm. Banks Dep.
Loans and Adv.Total Secur. Other Total Total TotalDep.Cash Sec. In
Firms
Local Gov't Sec.
Total
Cap. and Res.
Foreign Liab. 1)Other
Assets
Total Assets/
LiabilitiesLife Ins.
Fund Other
Table 5.3 (a)
Period Ended Gov't.
T/BillsGov't. Deb.
Mortgage Loans
Other Loans
Fixed Assets
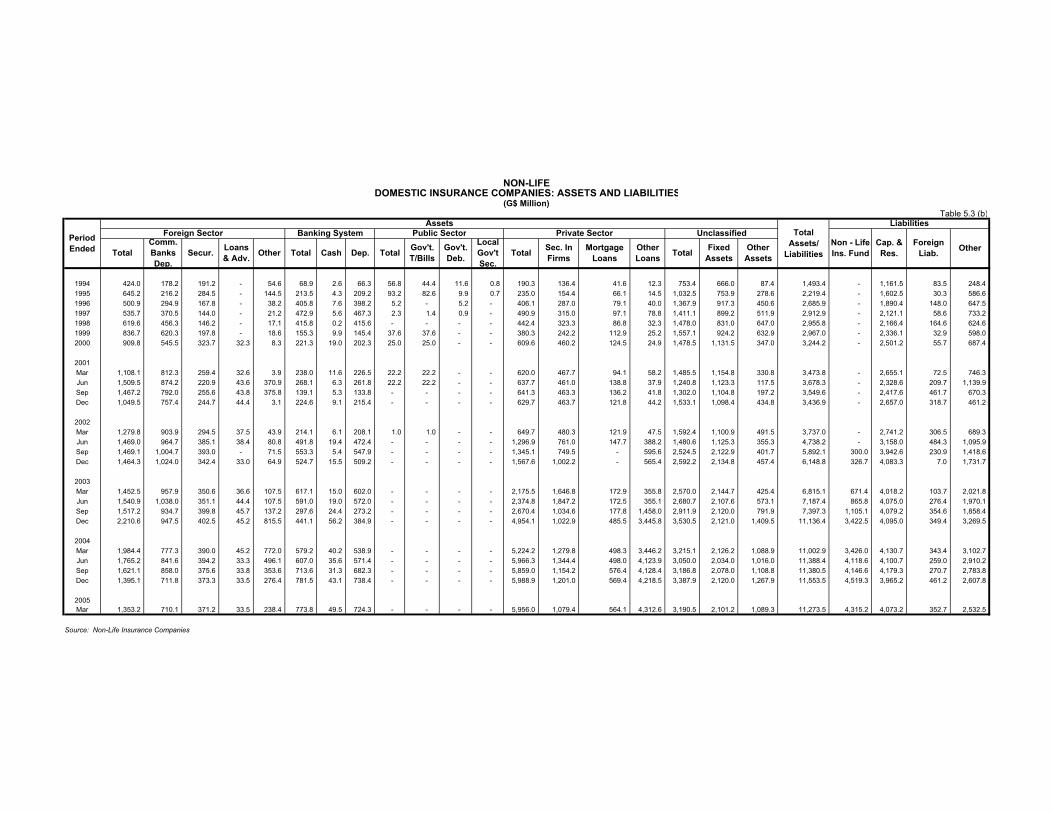
NON-LIFEDOMESTIC INSURANCE COMPANIES: ASSETS AND LIABILITIES
(G$ Million)
Assets LiabilitiesForeign Sector Banking System Public Sector Private Sector Unclassified
1994 424.0 178.2 191.2 - 54.6 68.9 2.6 66.3 56.8 44.4 11.6 0.8 190.3 136.4 41.6 12.3 753.4 666.0 87.4 1,493.4 - 1,161.5 83.5 248.4 1995 645.2 216.2 284.5 - 144.5 213.5 4.3 209.2 93.2 82.6 9.9 0.7 235.0 154.4 66.1 14.5 1,032.5 753.9 278.6 2,219.4 - 1,602.5 30.3 586.6 1996 500.9 294.9 167.8 - 38.2 405.8 7.6 398.2 5.2 - 5.2 - 406.1 287.0 79.1 40.0 1,367.9 917.3 450.6 2,685.9 - 1,890.4 148.0 647.5 1997 535.7 370.5 144.0 - 21.2 472.9 5.6 467.3 2.3 1.4 0.9 - 490.9 315.0 97.1 78.8 1,411.1 899.2 511.9 2,912.9 - 2,121.1 58.6 733.2 1998 619.6 456.3 146.2 - 17.1 415.8 0.2 415.6 - - - - 442.4 323.3 86.8 32.3 1,478.0 831.0 647.0 2,955.8 - 2,166.4 164.6 624.6 1999 836.7 620.3 197.8 - 18.6 155.3 9.9 145.4 37.6 37.6 - - 380.3 242.2 112.9 25.2 1,557.1 924.2 632.9 2,967.0 - 2,336.1 32.9 598.0 2000 909.8 545.5 323.7 32.3 8.3 221.3 19.0 202.3 25.0 25.0 - - 609.6 460.2 124.5 24.9 1,478.5 1,131.5 347.0 3,244.2 - 2,501.2 55.7 687.4
2001Mar 1,108.1 812.3 259.4 32.6 3.9 238.0 11.6 226.5 22.2 22.2 - - 620.0 467.7 94.1 58.2 1,485.5 1,154.8 330.8 3,473.8 - 2,655.1 72.5 746.3 Jun 1,509.5 874.2 220.9 43.6 370.9 268.1 6.3 261.8 22.2 22.2 - - 637.7 461.0 138.8 37.9 1,240.8 1,123.3 117.5 3,678.3 - 2,328.6 209.7 1,139.9 Sep 1,467.2 792.0 255.6 43.8 375.8 139.1 5.3 133.8 - - - - 641.3 463.3 136.2 41.8 1,302.0 1,104.8 197.2 3,549.6 - 2,417.6 461.7 670.3 Dec 1,049.5 757.4 244.7 44.4 3.1 224.6 9.1 215.4 - - - - 629.7 463.7 121.8 44.2 1,533.1 1,098.4 434.8 3,436.9 - 2,657.0 318.7 461.2
2002Mar 1,279.8 903.9 294.5 37.5 43.9 214.1 6.1 208.1 1.0 1.0 - - 649.7 480.3 121.9 47.5 1,592.4 1,100.9 491.5 3,737.0 - 2,741.2 306.5 689.3 Jun 1,469.0 964.7 385.1 38.4 80.8 491.8 19.4 472.4 - - - - 1,296.9 761.0 147.7 388.2 1,480.6 1,125.3 355.3 4,738.2 - 3,158.0 484.3 1,095.9 Sep 1,469.1 1,004.7 393.0 - 71.5 553.3 5.4 547.9 - - - - 1,345.1 749.5 - 595.6 2,524.5 2,122.9 401.7 5,892.1 300.0 3,942.6 230.9 1,418.6 Dec 1,464.3 1,024.0 342.4 33.0 64.9 524.7 15.5 509.2 - - - - 1,567.6 1,002.2 - 565.4 2,592.2 2,134.8 457.4 6,148.8 326.7 4,083.3 7.0 1,731.7
2003Mar 1,452.5 957.9 350.6 36.6 107.5 617.1 15.0 602.0 - - - - 2,175.5 1,646.8 172.9 355.8 2,570.0 2,144.7 425.4 6,815.1 671.4 4,018.2 103.7 2,021.8 Jun 1,540.9 1,038.0 351.1 44.4 107.5 591.0 19.0 572.0 - - - - 2,374.8 1,847.2 172.5 355.1 2,680.7 2,107.6 573.1 7,187.4 865.8 4,075.0 276.4 1,970.1 Sep 1,517.2 934.7 399.8 45.7 137.2 297.6 24.4 273.2 - - - - 2,670.4 1,034.6 177.8 1,458.0 2,911.9 2,120.0 791.9 7,397.3 1,105.1 4,079.2 354.6 1,858.4 Dec 2,210.6 947.5 402.5 45.2 815.5 441.1 56.2 384.9 - - - - 4,954.1 1,022.9 485.5 3,445.8 3,530.5 2,121.0 1,409.5 11,136.4 3,422.5 4,095.0 349.4 3,269.5
2004Mar 1,984.4 777.3 390.0 45.2 772.0 579.2 40.2 538.9 - - - - 5,224.2 1,279.8 498.3 3,446.2 3,215.1 2,126.2 1,088.9 11,002.9 3,426.0 4,130.7 343.4 3,102.7 Jun 1,765.2 841.6 394.2 33.3 496.1 607.0 35.6 571.4 - - - - 5,966.3 1,344.4 498.0 4,123.9 3,050.0 2,034.0 1,016.0 11,388.4 4,118.6 4,100.7 259.0 2,910.2 Sep 1,621.1 858.0 375.6 33.8 353.6 713.6 31.3 682.3 - - - - 5,859.0 1,154.2 576.4 4,128.4 3,186.8 2,078.0 1,108.8 11,380.5 4,146.6 4,179.3 270.7 2,783.8 Dec 1,395.1 711.8 373.3 33.5 276.4 781.5 43.1 738.4 - - - - 5,988.9 1,201.0 569.4 4,218.5 3,387.9 2,120.0 1,267.9 11,553.5 4,519.3 3,965.2 461.2 2,607.8
2005Mar 1,353.2 710.1 371.2 33.5 238.4 773.8 49.5 724.3 - - - - 5,956.0 1,079.4 564.1 4,312.6 3,190.5 2,101.2 1,089.3 11,273.5 4,315.2 4,073.2 352.7 2,532.5
Source: Non-Life Insurance Companies
Mortgage Loans
Table 5.3 (b)
Period Ended Total Secur. Other Total Cash Other
LoansDep.Non - Life Ins. Fund
Cap. & Res.
Foreign Liab. Other
Comm. Banks Dep.
Loans & Adv.
Local Gov't Sec.
Sec. In FirmsTotalTotal Gov't.
T/BillsGov't. Deb. Total Fixed
AssetsOther
Assets
Total Assets/
Liabilities
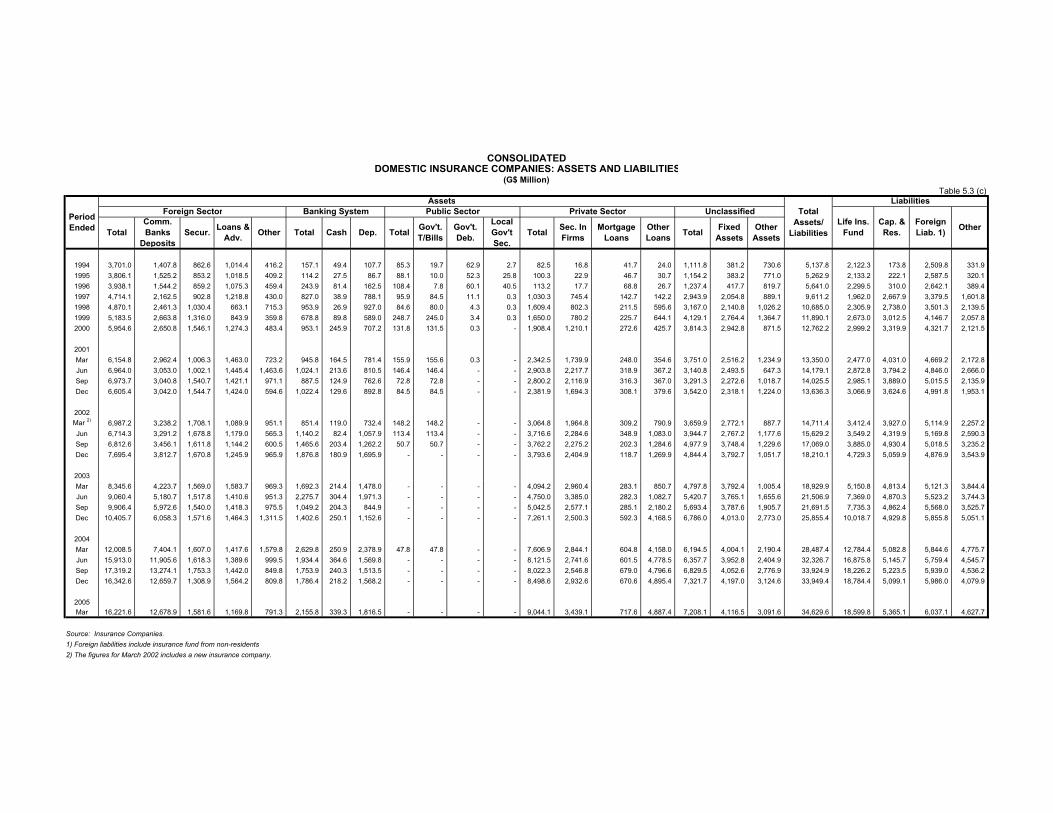
CONSOLIDATEDDOMESTIC INSURANCE COMPANIES: ASSETS AND LIABILITIES
(G$ Million)
Assets LiabilitiesForeign Sector Banking System Public Sector Private Sector Unclassified
1994 3,701.0 1,407.8 862.6 1,014.4 416.2 157.1 49.4 107.7 85.3 19.7 62.9 2.7 82.5 16.8 41.7 24.0 1,111.8 381.2 730.6 5,137.8 2,122.3 173.8 2,509.8 331.9 1995 3,806.1 1,525.2 853.2 1,018.5 409.2 114.2 27.5 86.7 88.1 10.0 52.3 25.8 100.3 22.9 46.7 30.7 1,154.2 383.2 771.0 5,262.9 2,133.2 222.1 2,587.5 320.1 1996 3,938.1 1,544.2 859.2 1,075.3 459.4 243.9 81.4 162.5 108.4 7.8 60.1 40.5 113.2 17.7 68.8 26.7 1,237.4 417.7 819.7 5,641.0 2,299.5 310.0 2,642.1 389.4 1997 4,714.1 2,162.5 902.8 1,218.8 430.0 827.0 38.9 788.1 95.9 84.5 11.1 0.3 1,030.3 745.4 142.7 142.2 2,943.9 2,054.8 889.1 9,611.2 1,962.0 2,667.9 3,379.5 1,601.8 1998 4,870.1 2,461.3 1,030.4 663.1 715.3 953.9 26.9 927.0 84.6 80.0 4.3 0.3 1,609.4 802.3 211.5 595.6 3,167.0 2,140.8 1,026.2 10,685.0 2,305.9 2,738.0 3,501.3 2,139.5 1999 5,183.5 2,663.8 1,316.0 843.9 359.8 678.8 89.8 589.0 248.7 245.0 3.4 0.3 1,650.0 780.2 225.7 644.1 4,129.1 2,764.4 1,364.7 11,890.1 2,673.0 3,012.5 4,146.7 2,057.8 2000 5,954.6 2,650.8 1,546.1 1,274.3 483.4 953.1 245.9 707.2 131.8 131.5 0.3 - 1,908.4 1,210.1 272.6 425.7 3,814.3 2,942.8 871.5 12,762.2 2,999.2 3,319.9 4,321.7 2,121.5
2001Mar 6,154.8 2,962.4 1,006.3 1,463.0 723.2 945.8 164.5 781.4 155.9 155.6 0.3 - 2,342.5 1,739.9 248.0 354.6 3,751.0 2,516.2 1,234.9 13,350.0 2,477.0 4,031.0 4,669.2 2,172.8 Jun 6,964.0 3,053.0 1,002.1 1,445.4 1,463.6 1,024.1 213.6 810.5 146.4 146.4 - - 2,903.8 2,217.7 318.9 367.2 3,140.8 2,493.5 647.3 14,179.1 2,872.8 3,794.2 4,846.0 2,666.0 Sep 6,973.7 3,040.8 1,540.7 1,421.1 971.1 887.5 124.9 762.6 72.8 72.8 - - 2,800.2 2,116.9 316.3 367.0 3,291.3 2,272.6 1,018.7 14,025.5 2,985.1 3,889.0 5,015.5 2,135.9 Dec 6,605.4 3,042.0 1,544.7 1,424.0 594.6 1,022.4 129.6 892.8 84.5 84.5 - - 2,381.9 1,694.3 308.1 379.6 3,542.0 2,318.1 1,224.0 13,636.3 3,066.9 3,624.6 4,991.8 1,953.1
2002Mar 2) 6,987.2 3,238.2 1,708.1 1,089.9 951.1 851.4 119.0 732.4 148.2 148.2 - - 3,064.8 1,964.8 309.2 790.9 3,659.9 2,772.1 887.7 14,711.4 3,412.4 3,927.0 5,114.9 2,257.2 Jun 6,714.3 3,291.2 1,678.8 1,179.0 565.3 1,140.2 82.4 1,057.9 113.4 113.4 - - 3,716.6 2,284.6 348.9 1,083.0 3,944.7 2,767.2 1,177.6 15,629.2 3,549.2 4,319.9 5,169.8 2,590.3 Sep 6,812.6 3,456.1 1,611.8 1,144.2 600.5 1,465.6 203.4 1,262.2 50.7 50.7 - - 3,762.2 2,275.2 202.3 1,284.6 4,977.9 3,748.4 1,229.6 17,069.0 3,885.0 4,930.4 5,018.5 3,235.2 Dec 7,695.4 3,812.7 1,670.8 1,245.9 965.9 1,876.8 180.9 1,695.9 - - - - 3,793.6 2,404.9 118.7 1,269.9 4,844.4 3,792.7 1,051.7 18,210.1 4,729.3 5,059.9 4,876.9 3,543.9
2003Mar 8,345.6 4,223.7 1,569.0 1,583.7 969.3 1,692.3 214.4 1,478.0 - - - - 4,094.2 2,960.4 283.1 850.7 4,797.8 3,792.4 1,005.4 18,929.9 5,150.8 4,813.4 5,121.3 3,844.4 Jun 9,060.4 5,180.7 1,517.8 1,410.6 951.3 2,275.7 304.4 1,971.3 - - - - 4,750.0 3,385.0 282.3 1,082.7 5,420.7 3,765.1 1,655.6 21,506.9 7,369.0 4,870.3 5,523.2 3,744.3 Sep 9,906.4 5,972.6 1,540.0 1,418.3 975.5 1,049.2 204.3 844.9 - - - - 5,042.5 2,577.1 285.1 2,180.2 5,693.4 3,787.6 1,905.7 21,691.5 7,735.3 4,862.4 5,568.0 3,525.7 Dec 10,405.7 6,058.3 1,571.6 1,464.3 1,311.5 1,402.6 250.1 1,152.6 - - - - 7,261.1 2,500.3 592.3 4,168.5 6,786.0 4,013.0 2,773.0 25,855.4 10,018.7 4,929.8 5,855.8 5,051.1
2004Mar 12,008.5 7,404.1 1,607.0 1,417.6 1,579.8 2,629.8 250.9 2,378.9 47.8 47.8 - - 7,606.9 2,844.1 604.8 4,158.0 6,194.5 4,004.1 2,190.4 28,487.4 12,784.4 5,082.8 5,844.6 4,775.7 Jun 15,913.0 11,905.6 1,618.3 1,389.6 999.5 1,934.4 364.6 1,569.8 - - - - 8,121.5 2,741.6 601.5 4,778.5 6,357.7 3,952.8 2,404.9 32,326.7 16,875.8 5,145.7 5,759.4 4,545.7 Sep 17,319.2 13,274.1 1,753.3 1,442.0 849.8 1,753.9 240.3 1,513.5 - - - - 8,022.3 2,546.8 679.0 4,796.6 6,829.5 4,052.6 2,776.9 33,924.9 18,226.2 5,223.5 5,939.0 4,536.2 Dec 16,342.6 12,659.7 1,308.9 1,564.2 809.8 1,786.4 218.2 1,568.2 - - - - 8,498.6 2,932.6 670.6 4,895.4 7,321.7 4,197.0 3,124.6 33,949.4 18,784.4 5,099.1 5,986.0 4,079.9
2005Mar 16,221.6 12,678.9 1,581.6 1,169.8 791.3 2,155.8 339.3 1,816.5 - - - - 9,044.1 3,439.1 717.6 4,887.4 7,208.1 4,116.5 3,091.6 34,629.6 18,599.8 5,365.1 6,037.1 4,627.7
Source: Insurance Companies.1) Foreign liabilities include insurance fund from non-residents2) The figures for March 2002 includes a new insurance company.
Other Loans Total Fixed
AssetsOther
AssetsTotal Mortgage Loans
Sec. In Firms
Local Gov't Sec.
Dep. Total Gov't. T/Bills
Gov't. Deb.Total
Comm. Banks
Deposits
Loans & Adv. Cash
Table 5.3 (c)
Period Ended
Total Assets/
LiabilitiesLife Ins.
FundCap. & Res.
Foreign Liab. 1) OtherTotal Secur. Other
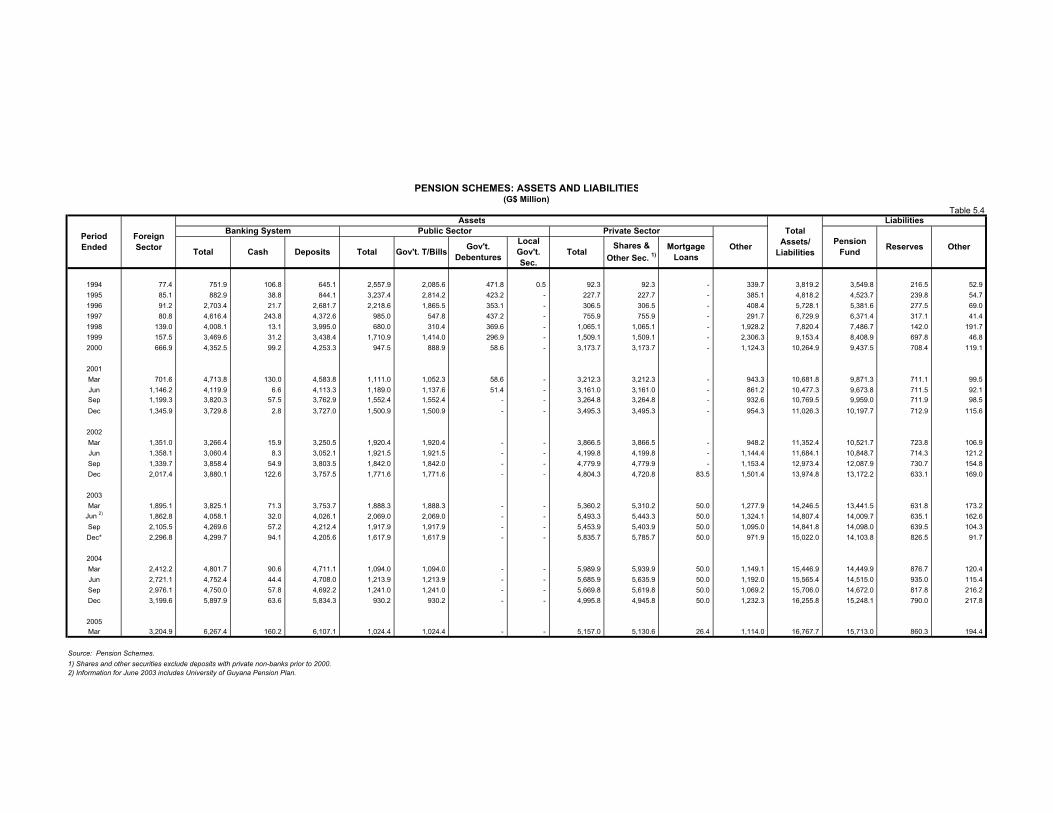
PENSION SCHEMES: ASSETS AND LIABILITIES(G$ Million)
Assets LiabilitiesBanking System Public Sector Private Sector
1994 77.4 751.9 106.8 645.1 2,557.9 2,085.6 471.8 0.5 92.3 92.3 - 339.7 3,819.2 3,549.8 216.5 52.9 1995 85.1 882.9 38.8 844.1 3,237.4 2,814.2 423.2 - 227.7 227.7 - 385.1 4,818.2 4,523.7 239.8 54.7 1996 91.2 2,703.4 21.7 2,681.7 2,218.6 1,865.5 353.1 - 306.5 306.5 - 408.4 5,728.1 5,381.6 277.5 69.0 1997 80.8 4,616.4 243.8 4,372.6 985.0 547.8 437.2 - 755.9 755.9 - 291.7 6,729.9 6,371.4 317.1 41.4 1998 139.0 4,008.1 13.1 3,995.0 680.0 310.4 369.6 - 1,065.1 1,065.1 - 1,928.2 7,820.4 7,486.7 142.0 191.7 1999 157.5 3,469.6 31.2 3,438.4 1,710.9 1,414.0 296.9 - 1,509.1 1,509.1 - 2,306.3 9,153.4 8,408.9 697.8 46.8 2000 666.9 4,352.5 99.2 4,253.3 947.5 888.9 58.6 - 3,173.7 3,173.7 - 1,124.3 10,264.9 9,437.5 708.4 119.1
2001Mar 701.6 4,713.8 130.0 4,583.8 1,111.0 1,052.3 58.6 - 3,212.3 3,212.3 - 943.3 10,681.8 9,871.3 711.1 99.5 Jun 1,146.2 4,119.9 6.6 4,113.3 1,189.0 1,137.6 51.4 - 3,161.0 3,161.0 - 861.2 10,477.3 9,673.8 711.5 92.1 Sep 1,199.3 3,820.3 57.5 3,762.9 1,552.4 1,552.4 - - 3,264.8 3,264.8 - 932.6 10,769.5 9,959.0 711.9 98.5 Dec 1,345.9 3,729.8 2.8 3,727.0 1,500.9 1,500.9 - - 3,495.3 3,495.3 - 954.3 11,026.3 10,197.7 712.9 115.6
2002Mar 1,351.0 3,266.4 15.9 3,250.5 1,920.4 1,920.4 - - 3,866.5 3,866.5 - 948.2 11,352.4 10,521.7 723.8 106.9 Jun 1,358.1 3,060.4 8.3 3,052.1 1,921.5 1,921.5 - - 4,199.8 4,199.8 - 1,144.4 11,684.1 10,848.7 714.3 121.2 Sep 1,339.7 3,858.4 54.9 3,803.5 1,842.0 1,842.0 - - 4,779.9 4,779.9 - 1,153.4 12,973.4 12,087.9 730.7 154.8 Dec 2,017.4 3,880.1 122.6 3,757.5 1,771.6 1,771.6 - - 4,804.3 4,720.8 83.5 1,501.4 13,974.8 13,172.2 633.1 169.0
2003Mar 1,895.1 3,825.1 71.3 3,753.7 1,888.3 1,888.3 - - 5,360.2 5,310.2 50.0 1,277.9 14,246.5 13,441.5 631.8 173.2
Jun 2) 1,862.8 4,058.1 32.0 4,026.1 2,069.0 2,069.0 - - 5,493.3 5,443.3 50.0 1,324.1 14,807.4 14,009.7 635.1 162.6 Sep 2,105.5 4,269.6 57.2 4,212.4 1,917.9 1,917.9 - - 5,453.9 5,403.9 50.0 1,095.0 14,841.8 14,098.0 639.5 104.3 Dec* 2,296.8 4,299.7 94.1 4,205.6 1,617.9 1,617.9 - - 5,835.7 5,785.7 50.0 971.9 15,022.0 14,103.8 826.5 91.7
2004Mar 2,412.2 4,801.7 90.6 4,711.1 1,094.0 1,094.0 - - 5,989.9 5,939.9 50.0 1,149.1 15,446.9 14,449.9 876.7 120.4 Jun 2,721.1 4,752.4 44.4 4,708.0 1,213.9 1,213.9 - - 5,685.9 5,635.9 50.0 1,192.0 15,565.4 14,515.0 935.0 115.4 Sep 2,976.1 4,750.0 57.8 4,692.2 1,241.0 1,241.0 - - 5,669.8 5,619.8 50.0 1,069.2 15,706.0 14,672.0 817.8 216.2 Dec 3,199.6 5,897.9 63.6 5,834.3 930.2 930.2 - - 4,995.8 4,945.8 50.0 1,232.3 16,255.8 15,248.1 790.0 217.8
2005Mar 3,204.9 6,267.4 160.2 6,107.1 1,024.4 1,024.4 - - 5,157.0 5,130.6 26.4 1,114.0 16,767.7 15,713.0 860.3 194.4
Source: Pension Schemes.1) Shares and other securities exclude deposits with private non-banks prior to 2000.2) Information for June 2003 includes University of Guyana Pension Plan.
Pension Fund Reserves OtherTotal Mortgage
LoansOther
Total Assets/
LiabilitiesShares &
Other Sec. 1)
Table 5.4
Period Ended
Foreign Sector Total Cash Deposits Total Gov't. T/Bills Gov't.
Debentures
Local Gov't. Sec.
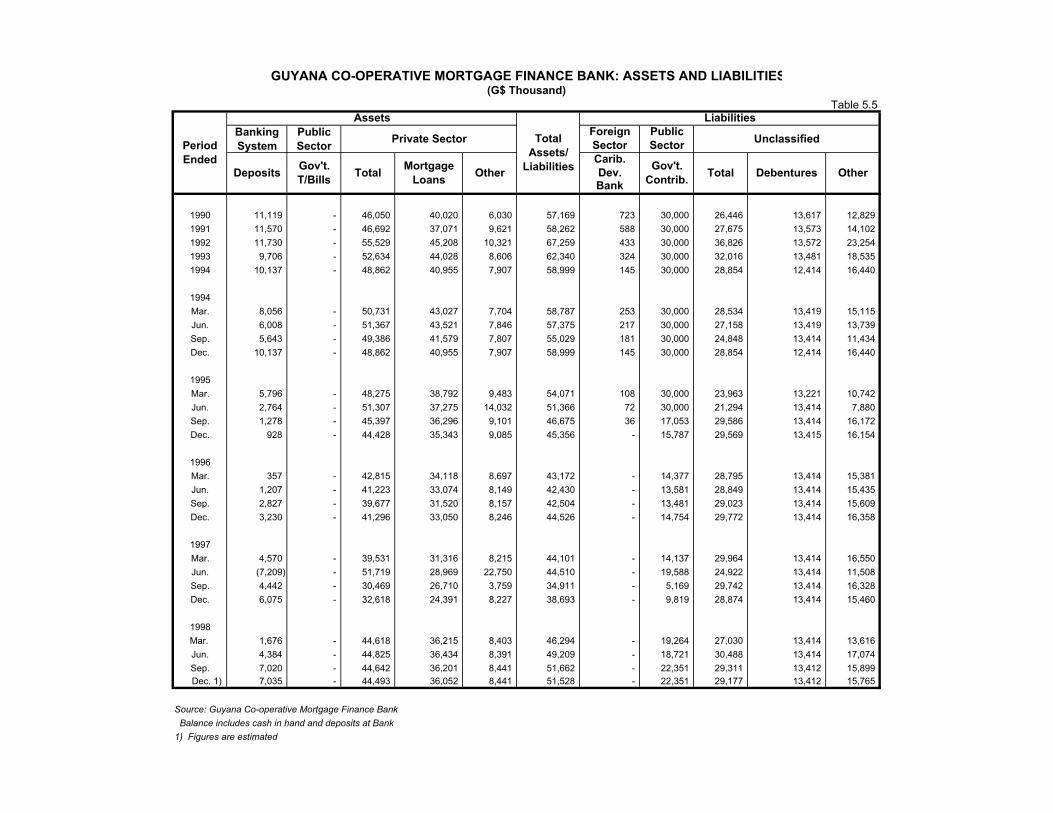
GUYANA CO-OPERATIVE MORTGAGE FINANCE BANK: ASSETS AND LIABILITIES(G$ Thousand)
Assets LiabilitiesForeign PublicSector SectorCarib.Dev.Bank
1990 11,119 - 46,050 40,020 6,030 57,169 723 30,000 26,446 13,617 12,829 1991 11,570 - 46,692 37,071 9,621 58,262 588 30,000 27,675 13,573 14,102 1992 11,730 - 55,529 45,208 10,321 67,259 433 30,000 36,826 13,572 23,254 1993 9,706 - 52,634 44,028 8,606 62,340 324 30,000 32,016 13,481 18,535 1994 10,137 - 48,862 40,955 7,907 58,999 145 30,000 28,854 12,414 16,440
1994Mar. 8,056 - 50,731 43,027 7,704 58,787 253 30,000 28,534 13,419 15,115 Jun. 6,008 - 51,367 43,521 7,846 57,375 217 30,000 27,158 13,419 13,739 Sep. 5,643 - 49,386 41,579 7,807 55,029 181 30,000 24,848 13,414 11,434 Dec. 10,137 - 48,862 40,955 7,907 58,999 145 30,000 28,854 12,414 16,440
1995Mar. 5,796 - 48,275 38,792 9,483 54,071 108 30,000 23,963 13,221 10,742 Jun. 2,764 - 51,307 37,275 14,032 51,366 72 30,000 21,294 13,414 7,880 Sep. 1,278 - 45,397 36,296 9,101 46,675 36 17,053 29,586 13,414 16,172 Dec. 928 - 44,428 35,343 9,085 45,356 - 15,787 29,569 13,415 16,154
1996Mar. 357 - 42,815 34,118 8,697 43,172 - 14,377 28,795 13,414 15,381 Jun. 1,207 - 41,223 33,074 8,149 42,430 - 13,581 28,849 13,414 15,435 Sep. 2,827 - 39,677 31,520 8,157 42,504 - 13,481 29,023 13,414 15,609 Dec. 3,230 - 41,296 33,050 8,246 44,526 - 14,754 29,772 13,414 16,358
1997Mar. 4,570 - 39,531 31,316 8,215 44,101 - 14,137 29,964 13,414 16,550 Jun. (7,209) - 51,719 28,969 22,750 44,510 - 19,588 24,922 13,414 11,508 Sep. 4,442 - 30,469 26,710 3,759 34,911 - 5,169 29,742 13,414 16,328 Dec. 6,075 - 32,618 24,391 8,227 38,693 - 9,819 28,874 13,414 15,460
1998Mar. 1,676 - 44,618 36,215 8,403 46,294 - 19,264 27,030 13,414 13,616 Jun. 4,384 - 44,825 36,434 8,391 49,209 - 18,721 30,488 13,414 17,074 Sep. 7,020 - 44,642 36,201 8,441 51,662 - 22,351 29,311 13,412 15,899
Dec. 1) 7,035 - 44,493 36,052 8,441 51,528 - 22,351 29,177 13,412 15,765
Source: Guyana Co-operative Mortgage Finance Bank Balance includes cash in hand and deposits at Bank1) Figures are estimated
Table 5.5
Period Ended
Deposits Gov't. T/Bills Total Mortgage
Loans Other
Private SectorBanking System
Public Sector Unclassified Total
Assets/ Liabilities OtherDebenturesTotalGov't.
Contrib.
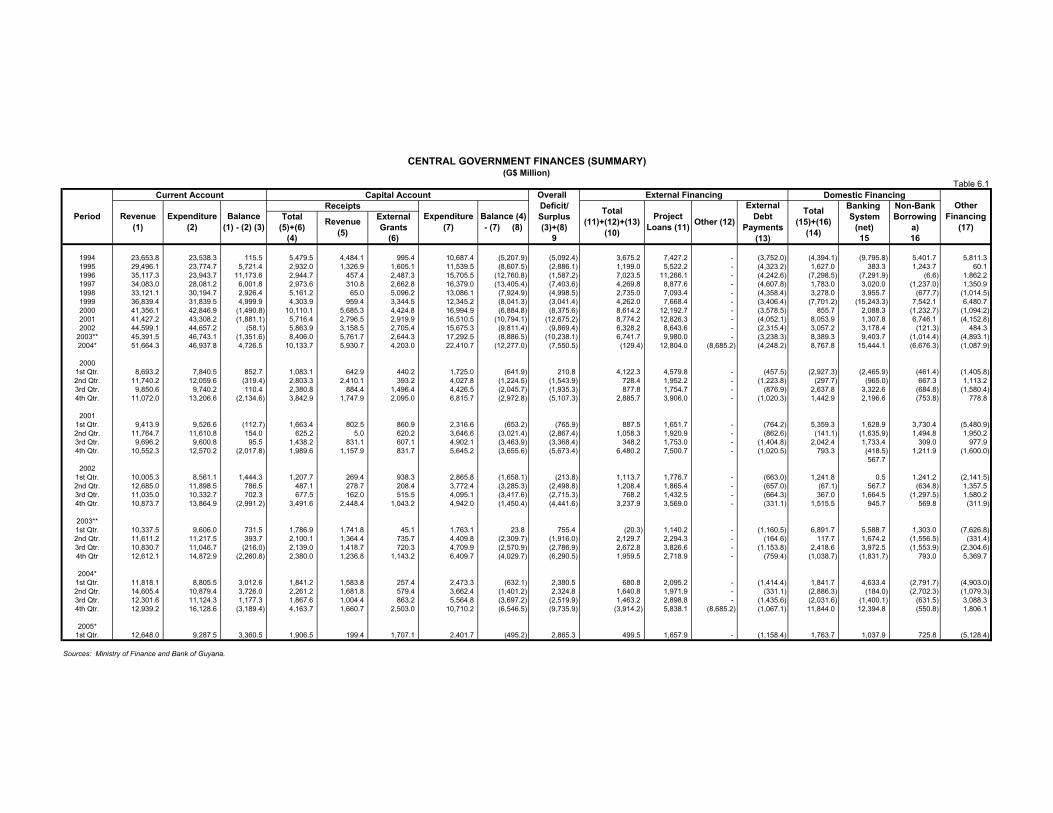
Overall External FinancingDeficit/ Banking Non-Bank
Total External Surplus System Borrowing(5)+(6) Grants (3)+(8) (net) a)
(4) (6) 9 15 16
1994 23,653.8 23,538.3 115.5 5,479.5 4,484.1 995.4 10,687.4 (5,207.9) (5,092.4) 3,675.2 7,427.2 - (3,752.0) (4,394.1) (9,795.8) 5,401.7 5,811.3 1995 29,496.1 23,774.7 5,721.4 2,932.0 1,326.9 1,605.1 11,539.5 (8,607.5) (2,886.1) 1,199.0 5,522.2 - (4,323.2) 1,627.0 383.3 1,243.7 60.1 1996 35,117.3 23,943.7 11,173.6 2,944.7 457.4 2,487.3 15,705.5 (12,760.8) (1,587.2) 7,023.5 11,266.1 - (4,242.6) (7,298.5) (7,291.9) (6.6) 1,862.2 1997 34,083.0 28,081.2 6,001.8 2,973.6 310.8 2,662.8 16,379.0 (13,405.4) (7,403.6) 4,269.8 8,877.6 - (4,607.8) 1,783.0 3,020.0 (1,237.0) 1,350.9 1998 33,121.1 30,194.7 2,926.4 5,161.2 65.0 5,096.2 13,086.1 (7,924.9) (4,998.5) 2,735.0 7,093.4 - (4,358.4) 3,278.0 3,955.7 (677.7) (1,014.5) 1999 36,839.4 31,839.5 4,999.9 4,303.9 959.4 3,344.5 12,345.2 (8,041.3) (3,041.4) 4,262.0 7,668.4 - (3,406.4) (7,701.2) (15,243.3) 7,542.1 6,480.7 2000 41,356.1 42,846.9 (1,490.8) 10,110.1 5,685.3 4,424.8 16,994.9 (6,884.8) (8,375.6) 8,614.2 12,192.7 - (3,578.5) 855.7 2,088.3 (1,232.7) (1,094.2) 2001 41,427.2 43,308.2 (1,881.1) 5,716.4 2,796.5 2,919.9 16,510.5 (10,794.1) (12,675.2) 8,774.2 12,826.3 - (4,052.1) 8,053.9 1,307.8 6,746.1 (4,152.8) 2002 44,599.1 44,657.2 (58.1) 5,863.9 3,158.5 2,705.4 15,675.3 (9,811.4) (9,869.4) 6,328.2 8,643.6 - (2,315.4) 3,057.2 3,178.4 (121.3) 484.3
2003** 45,391.5 46,743.1 (1,351.6) 8,406.0 5,761.7 2,644.3 17,292.5 (8,886.5) (10,238.1) 6,741.7 9,980.0 - (3,238.3) 8,389.3 9,403.7 (1,014.4) (4,893.1) 2004* 51,664.3 46,937.8 4,726.5 10,133.7 5,930.7 4,203.0 22,410.7 (12,277.0) (7,550.5) (129.4) 12,804.0 (8,685.2) (4,248.2) 8,767.8 15,444.1 (6,676.3) (1,087.9)
20001st Qtr. 8,693.2 7,840.5 852.7 1,083.1 642.9 440.2 1,725.0 (641.9) 210.8 4,122.3 4,579.8 - (457.5) (2,927.3) (2,465.9) (461.4) (1,405.8) 2nd Qtr. 11,740.2 12,059.6 (319.4) 2,803.3 2,410.1 393.2 4,027.8 (1,224.5) (1,543.9) 728.4 1,952.2 - (1,223.8) (297.7) (965.0) 667.3 1,113.2 3rd Qtr. 9,850.6 9,740.2 110.4 2,380.8 884.4 1,496.4 4,426.5 (2,045.7) (1,935.3) 877.8 1,754.7 - (876.9) 2,637.8 3,322.6 (684.8) (1,580.4) 4th Qtr. 11,072.0 13,206.6 (2,134.6) 3,842.9 1,747.9 2,095.0 6,815.7 (2,972.8) (5,107.3) 2,885.7 3,906.0 - (1,020.3) 1,442.9 2,196.6 (753.8) 778.8
20011st Qtr. 9,413.9 9,526.6 (112.7) 1,663.4 802.5 860.9 2,316.6 (653.2) (765.9) 887.5 1,651.7 - (764.2) 5,359.3 1,628.9 3,730.4 (5,480.9) 2nd Qtr. 11,764.7 11,610.8 154.0 625.2 5.0 620.2 3,646.6 (3,021.4) (2,867.4) 1,058.3 1,920.9 - (862.6) (141.1) (1,635.9) 1,494.8 1,950.2 3rd Qtr. 9,696.2 9,600.8 95.5 1,438.2 831.1 607.1 4,902.1 (3,463.9) (3,368.4) 348.2 1,753.0 - (1,404.8) 2,042.4 1,733.4 309.0 977.9 4th Qtr. 10,552.3 12,570.2 (2,017.8) 1,989.6 1,157.9 831.7 5,645.2 (3,655.6) (5,673.4) 6,480.2 7,500.7 - (1,020.5) 793.3 (418.5) 1,211.9 (1,600.0)
567.7 2002
1st Qtr. 10,005.3 8,561.1 1,444.3 1,207.7 269.4 938.3 2,865.8 (1,658.1) (213.8) 1,113.7 1,776.7 - (663.0) 1,241.8 0.5 1,241.2 (2,141.5) 2nd Qtr. 12,685.0 11,898.5 786.5 487.1 278.7 208.4 3,772.4 (3,285.3) (2,498.8) 1,208.4 1,865.4 - (657.0) (67.1) 567.7 (634.8) 1,357.5 3rd Qtr. 11,035.0 10,332.7 702.3 677.5 162.0 515.5 4,095.1 (3,417.6) (2,715.3) 768.2 1,432.5 - (664.3) 367.0 1,664.5 (1,297.5) 1,580.2 4th Qtr. 10,873.7 13,864.9 (2,991.2) 3,491.6 2,448.4 1,043.2 4,942.0 (1,450.4) (4,441.6) 3,237.9 3,569.0 - (331.1) 1,515.5 945.7 569.8 (311.9)
2003**1st Qtr. 10,337.5 9,606.0 731.5 1,786.9 1,741.8 45.1 1,763.1 23.8 755.4 (20.3) 1,140.2 - (1,160.5) 6,891.7 5,588.7 1,303.0 (7,626.8) 2nd Qtr. 11,611.2 11,217.5 393.7 2,100.1 1,364.4 735.7 4,409.8 (2,309.7) (1,916.0) 2,129.7 2,294.3 - (164.6) 117.7 1,674.2 (1,556.5) (331.4) 3rd Qtr. 10,830.7 11,046.7 (216.0) 2,139.0 1,418.7 720.3 4,709.9 (2,570.9) (2,786.9) 2,672.8 3,826.6 - (1,153.8) 2,418.6 3,972.5 (1,553.9) (2,304.6) 4th Qtr 12,612.1 14,872.9 (2,260.8) 2,380.0 1,236.8 1,143.2 6,409.7 (4,029.7) (6,290.5) 1,959.5 2,718.9 - (759.4) (1,038.7) (1,831.7) 793.0 5,369.7
2004*1st Qtr. 11,818.1 8,805.5 3,012.6 1,841.2 1,583.8 257.4 2,473.3 (632.1) 2,380.5 680.8 2,095.2 - (1,414.4) 1,841.7 4,633.4 (2,791.7) (4,903.0) 2nd Qtr. 14,605.4 10,879.4 3,726.0 2,261.2 1,681.8 579.4 3,662.4 (1,401.2) 2,324.8 1,640.8 1,971.9 - (331.1) (2,886.3) (184.0) (2,702.3) (1,079.3) 3rd Qtr. 12,301.6 11,124.3 1,177.3 1,867.6 1,004.4 863.2 5,564.8 (3,697.2) (2,519.9) 1,463.2 2,898.8 - (1,435.6) (2,031.6) (1,400.1) (631.5) 3,088.3 4th Qtr. 12,939.2 16,128.6 (3,189.4) 4,163.7 1,660.7 2,503.0 10,710.2 (6,546.5) (9,735.9) (3,914.2) 5,838.1 (8,685.2) (1,067.1) 11,844.0 12,394.8 (550.8) 1,806.1
2005*1st Qtr. 12,648.0 9,287.5 3,360.5 1,906.5 199.4 1,707.1 2,401.7 (495.2) 2,865.3 499.5 1,657.9 - (1,158.4) 1,763.7 1,037.9 725.8 (5,128.4)
Sources: Ministry of Finance and Bank of Guyana.
Other Financing
(17)
Domestic Financing
Project Loans (11) Other (12)
External Debt
Payments (13)
Total (15)+(16)
(14)
Expenditure (7)
Capital Account
Balance (4) - (7) (8)
Total (11)+(12)+(13)
(10)
Table 6.1
CENTRAL GOVERNMENT FINANCES (SUMMARY)(G$ Million)
Current Account
PeriodReceipts
Revenue (1)
Expenditure (2)
Balance (1) - (2) (3) Revenue
(5)
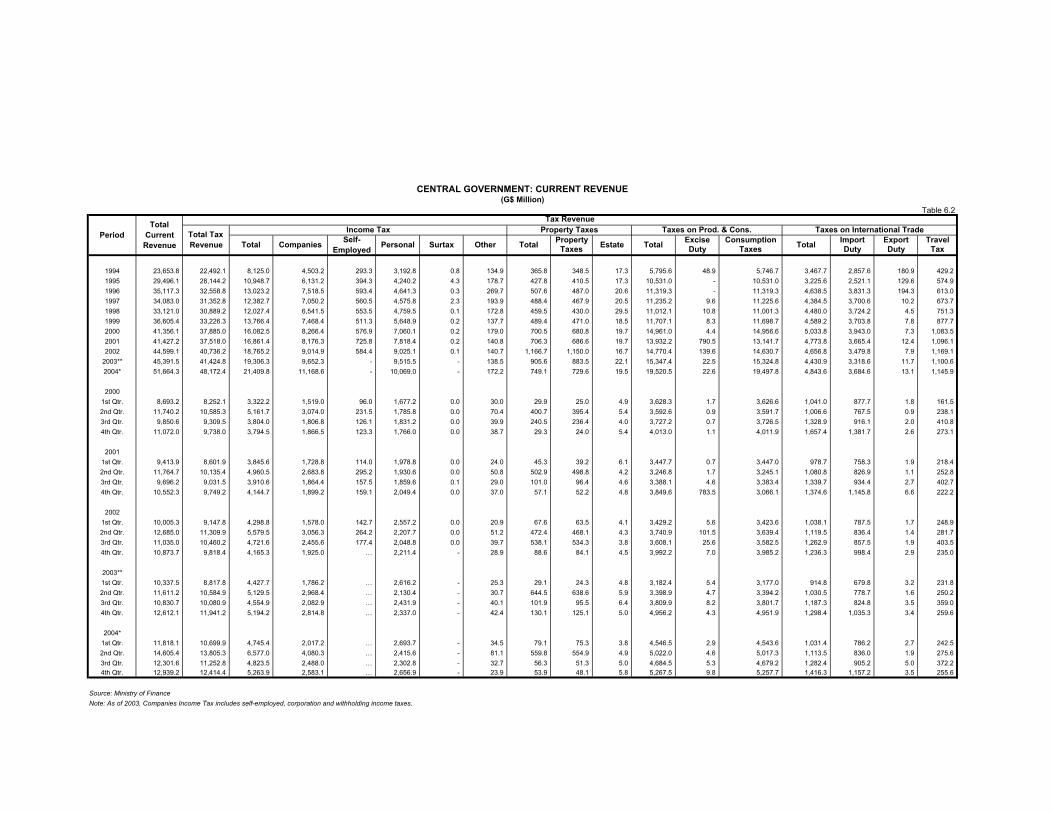
CENTRAL GOVERNMENT: CURRENT REVENUE(G$ Million)
Tax RevenueIncome Tax Property Taxes Taxes on Prod. & Cons. Taxes on International Trade
Property Excise Consumption Import Export TravelTaxes Duty Taxes Duty Duty Tax
1994 23,653.8 22,492.1 8,125.0 4,503.2 293.3 3,192.8 0.8 134.9 365.8 348.5 17.3 5,795.6 48.9 5,746.7 3,467.7 2,857.6 180.9 429.2 1995 29,496.1 28,144.2 10,948.7 6,131.2 394.3 4,240.2 4.3 178.7 427.8 410.5 17.3 10,531.0 - 10,531.0 3,225.6 2,521.1 129.6 574.9 1996 35,117.3 32,558.8 13,023.2 7,518.5 593.4 4,641.3 0.3 269.7 507.6 487.0 20.6 11,319.3 - 11,319.3 4,638.5 3,831.3 194.3 613.0 1997 34,083.0 31,352.8 12,382.7 7,050.2 560.5 4,575.8 2.3 193.9 488.4 467.9 20.5 11,235.2 9.6 11,225.6 4,384.5 3,700.6 10.2 673.7 1998 33,121.0 30,889.2 12,027.4 6,541.5 553.5 4,759.5 0.1 172.8 459.5 430.0 29.5 11,012.1 10.8 11,001.3 4,480.0 3,724.2 4.5 751.3 1999 36,605.4 33,226.3 13,766.4 7,468.4 511.3 5,648.9 0.2 137.7 489.4 471.0 18.5 11,707.1 8.3 11,698.7 4,589.2 3,703.8 7.8 877.7 2000 41,356.1 37,885.0 16,082.5 8,266.4 576.9 7,060.1 0.2 179.0 700.5 680.8 19.7 14,961.0 4.4 14,956.6 5,033.8 3,943.0 7.3 1,083.5 2001 41,427.2 37,518.0 16,861.4 8,176.3 725.8 7,818.4 0.2 140.8 706.3 686.6 19.7 13,932.2 790.5 13,141.7 4,773.8 3,665.4 12.4 1,096.1 2002 44,599.1 40,736.2 18,765.2 9,014.9 584.4 9,025.1 0.1 140.7 1,166.7 1,150.0 16.7 14,770.4 139.6 14,630.7 4,656.8 3,479.8 7.9 1,169.1
2003** 45,391.5 41,424.8 19,306.3 9,652.3 - 9,515.5 - 138.5 905.6 883.5 22.1 15,347.4 22.5 15,324.8 4,430.9 3,318.6 11.7 1,100.6 2004* 51,664.3 48,172.4 21,409.8 11,168.6 - 10,069.0 - 172.2 749.1 729.6 19.5 19,520.5 22.6 19,497.8 4,843.6 3,684.6 13.1 1,145.9
20001st Qtr. 8,693.2 8,252.1 3,322.2 1,519.0 96.0 1,677.2 0.0 30.0 29.9 25.0 4.9 3,628.3 1.7 3,626.6 1,041.0 877.7 1.8 161.5 2nd Qtr. 11,740.2 10,585.3 5,161.7 3,074.0 231.5 1,785.8 0.0 70.4 400.7 395.4 5.4 3,592.6 0.9 3,591.7 1,006.6 767.5 0.9 238.1 3rd Qtr. 9,850.6 9,309.5 3,804.0 1,806.8 126.1 1,831.2 0.0 39.9 240.5 236.4 4.0 3,727.2 0.7 3,726.5 1,328.9 916.1 2.0 410.8 4th Qtr. 11,072.0 9,738.0 3,794.5 1,866.5 123.3 1,766.0 0.0 38.7 29.3 24.0 5.4 4,013.0 1.1 4,011.9 1,657.4 1,381.7 2.6 273.1
20011st Qtr. 9,413.9 8,601.9 3,845.6 1,728.8 114.0 1,978.8 0.0 24.0 45.3 39.2 6.1 3,447.7 0.7 3,447.0 978.7 758.3 1.9 218.4 2nd Qtr. 11,764.7 10,135.4 4,960.5 2,683.8 295.2 1,930.6 0.0 50.8 502.9 498.8 4.2 3,246.8 1.7 3,245.1 1,080.8 826.9 1.1 252.8 3rd Qtr. 9,696.2 9,031.5 3,910.6 1,864.4 157.5 1,859.6 0.1 29.0 101.0 96.4 4.6 3,388.1 4.6 3,383.4 1,339.7 934.4 2.7 402.7 4th Qtr. 10,552.3 9,749.2 4,144.7 1,899.2 159.1 2,049.4 0.0 37.0 57.1 52.2 4.8 3,849.6 783.5 3,066.1 1,374.6 1,145.8 6.6 222.2
20021st Qtr. 10,005.3 9,147.8 4,298.8 1,578.0 142.7 2,557.2 0.0 20.9 67.6 63.5 4.1 3,429.2 5.6 3,423.6 1,038.1 787.5 1.7 248.9 2nd Qtr. 12,685.0 11,309.9 5,579.5 3,056.3 264.2 2,207.7 0.0 51.2 472.4 468.1 4.3 3,740.9 101.5 3,639.4 1,119.5 836.4 1.4 281.7 3rd Qtr. 11,035.0 10,460.2 4,721.6 2,455.6 177.4 2,048.8 0.0 39.7 538.1 534.3 3.8 3,608.1 25.6 3,582.5 1,262.9 857.5 1.9 403.5 4th Qtr. 10,873.7 9,818.4 4,165.3 1,925.0 … 2,211.4 - 28.9 88.6 84.1 4.5 3,992.2 7.0 3,985.2 1,236.3 998.4 2.9 235.0
2003**1st Qtr. 10,337.5 8,817.8 4,427.7 1,786.2 … 2,616.2 - 25.3 29.1 24.3 4.8 3,182.4 5.4 3,177.0 914.8 679.8 3.2 231.8 2nd Qtr. 11,611.2 10,584.9 5,129.5 2,968.4 … 2,130.4 - 30.7 644.5 638.6 5.9 3,398.9 4.7 3,394.2 1,030.5 778.7 1.6 250.2 3rd Qtr. 10,830.7 10,080.9 4,554.9 2,082.9 … 2,431.9 - 40.1 101.9 95.5 6.4 3,809.9 8.2 3,801.7 1,187.3 824.8 3.5 359.0 4th Qtr. 12,612.1 11,941.2 5,194.2 2,814.8 … 2,337.0 - 42.4 130.1 125.1 5.0 4,956.2 4.3 4,951.9 1,298.4 1,035.3 3.4 259.6
2004*1st Qtr. 11,818.1 10,699.9 4,745.4 2,017.2 … 2,693.7 - 34.5 79.1 75.3 3.8 4,546.5 2.9 4,543.6 1,031.4 786.2 2.7 242.5 2nd Qtr. 14,605.4 13,805.3 6,577.0 4,080.3 … 2,415.6 - 81.1 559.8 554.9 4.9 5,022.0 4.6 5,017.3 1,113.5 836.0 1.9 275.6 3rd Qtr. 12,301.6 11,252.8 4,823.5 2,488.0 … 2,302.8 - 32.7 56.3 51.3 5.0 4,684.5 5.3 4,679.2 1,282.4 905.2 5.0 372.2 4th Qtr. 12,939.2 12,414.4 5,263.9 2,583.1 … 2,656.9 - 23.9 53.9 48.1 5.8 5,267.5 9.8 5,257.7 1,416.3 1,157.2 3.5 255.6
Source: Ministry of FinanceNote: As of 2003, Companies Income Tax includes self-employed, corporation and withholding income taxes.
Period
Table 6.2
Total Current
RevenueTotal Tax Revenue Total Companies Self-
Employed Personal Surtax Other Total TotalEstate Total
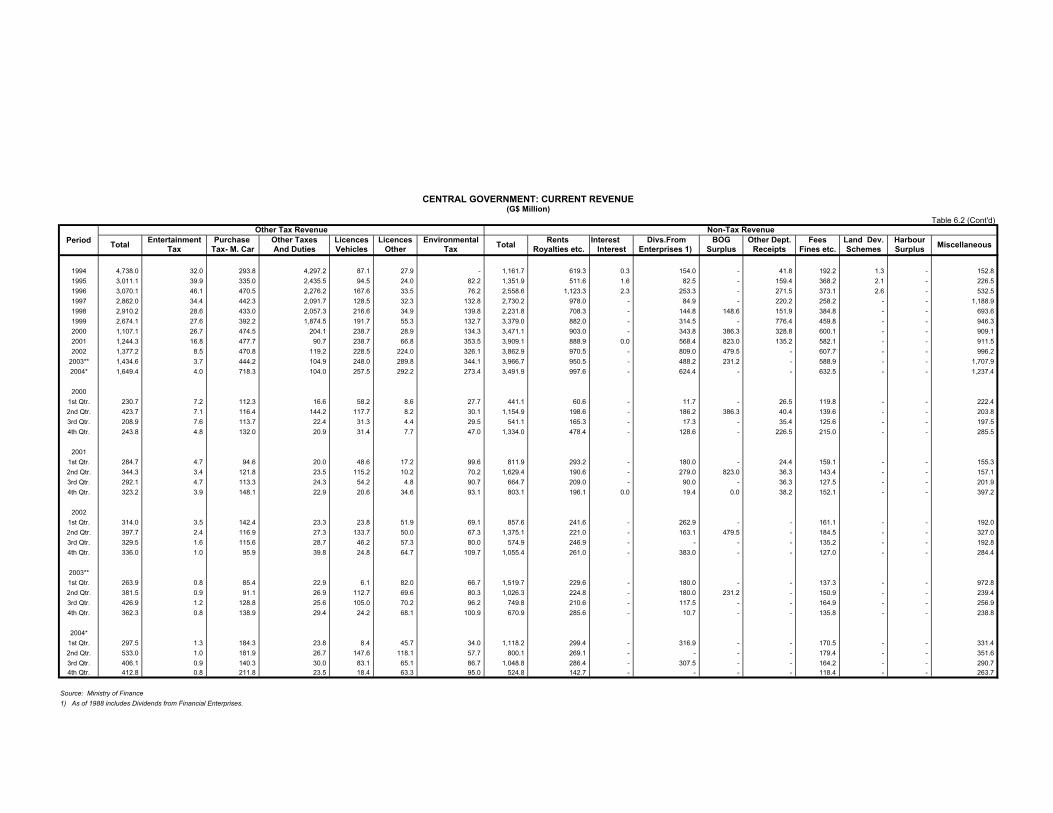
CENTRAL GOVERNMENT: CURRENT REVENUE(G$ Million)
Other Tax Revenue Non-Tax RevenueEntertainment Purchase Other Taxes Licences Licences Environmental Rents Interest Divs.From BOG Other Dept. Fees Land Dev. Harbour
Tax Tax- M. Car And Duties Vehicles Other Tax Royalties etc. Interest Enterprises 1) Surplus Receipts Fines etc. Schemes Surplus
1994 4,738.0 32.0 293.8 4,297.2 87.1 27.9 - 1,161.7 619.3 0.3 154.0 - 41.8 192.2 1.3 - 152.8 1995 3,011.1 39.9 335.0 2,435.5 94.5 24.0 82.2 1,351.9 511.6 1.6 82.5 - 159.4 368.2 2.1 - 226.5 1996 3,070.1 46.1 470.5 2,276.2 167.6 33.5 76.2 2,558.6 1,123.3 2.3 253.3 - 271.5 373.1 2.6 - 532.5 1997 2,862.0 34.4 442.3 2,091.7 128.5 32.3 132.8 2,730.2 978.0 - 84.9 - 220.2 258.2 - - 1,188.9 1998 2,910.2 28.6 433.0 2,057.3 216.6 34.9 139.8 2,231.8 708.3 - 144.8 148.6 151.9 384.8 - - 693.6 1999 2,674.1 27.6 392.2 1,874.5 191.7 55.3 132.7 3,379.0 882.0 - 314.5 - 776.4 459.8 - - 946.3 2000 1,107.1 26.7 474.5 204.1 238.7 28.9 134.3 3,471.1 903.0 - 343.8 386.3 328.8 600.1 - - 909.1 2001 1,244.3 16.8 477.7 90.7 238.7 66.8 353.5 3,909.1 888.9 0.0 568.4 823.0 135.2 582.1 - - 911.5 2002 1,377.2 8.5 470.8 119.2 228.5 224.0 326.1 3,862.9 970.5 - 809.0 479.5 - 607.7 - - 996.2
2003** 1,434.6 3.7 444.2 104.9 248.0 289.8 344.1 3,966.7 950.5 - 488.2 231.2 - 588.9 - - 1,707.9 2004* 1,649.4 4.0 718.3 104.0 257.5 292.2 273.4 3,491.9 997.6 - 624.4 - - 632.5 - - 1,237.4
20001st Qtr. 230.7 7.2 112.3 16.6 58.2 8.6 27.7 441.1 60.6 - 11.7 - 26.5 119.8 - - 222.4 2nd Qtr. 423.7 7.1 116.4 144.2 117.7 8.2 30.1 1,154.9 198.6 - 186.2 386.3 40.4 139.6 - - 203.8 3rd Qtr. 208.9 7.6 113.7 22.4 31.3 4.4 29.5 541.1 165.3 - 17.3 - 35.4 125.6 - - 197.5 4th Qtr. 243.8 4.8 132.0 20.9 31.4 7.7 47.0 1,334.0 478.4 - 128.6 - 226.5 215.0 - - 285.5
20011st Qtr. 284.7 4.7 94.6 20.0 48.6 17.2 99.6 811.9 293.2 - 180.0 - 24.4 159.1 - - 155.3 2nd Qtr. 344.3 3.4 121.8 23.5 115.2 10.2 70.2 1,629.4 190.6 - 279.0 823.0 36.3 143.4 - - 157.1 3rd Qtr. 292.1 4.7 113.3 24.3 54.2 4.8 90.7 664.7 209.0 - 90.0 - 36.3 127.5 - - 201.9 4th Qtr. 323.2 3.9 148.1 22.9 20.6 34.6 93.1 803.1 196.1 0.0 19.4 0.0 38.2 152.1 - - 397.2
20021st Qtr. 314.0 3.5 142.4 23.3 23.8 51.9 69.1 857.6 241.6 - 262.9 - - 161.1 - - 192.0 2nd Qtr. 397.7 2.4 116.9 27.3 133.7 50.0 67.3 1,375.1 221.0 - 163.1 479.5 - 184.5 - - 327.0 3rd Qtr. 329.5 1.6 115.6 28.7 46.2 57.3 80.0 574.9 246.9 - - - - 135.2 - - 192.8 4th Qtr. 336.0 1.0 95.9 39.8 24.8 64.7 109.7 1,055.4 261.0 - 383.0 - - 127.0 - - 284.4
2003**1st Qtr. 263.9 0.8 85.4 22.9 6.1 82.0 66.7 1,519.7 229.6 - 180.0 - - 137.3 - - 972.8 2nd Qtr. 381.5 0.9 91.1 26.9 112.7 69.6 80.3 1,026.3 224.8 - 180.0 231.2 - 150.9 - - 239.4 3rd Qtr. 426.9 1.2 128.8 25.6 105.0 70.2 96.2 749.8 210.6 - 117.5 - - 164.9 - - 256.9 4th Qtr. 362.3 0.8 138.9 29.4 24.2 68.1 100.9 670.9 285.6 - 10.7 - - 135.8 - - 238.8
2004*1st Qtr. 297.5 1.3 184.3 23.8 8.4 45.7 34.0 1,118.2 299.4 - 316.9 - - 170.5 - - 331.4 2nd Qtr. 533.0 1.0 181.9 26.7 147.6 118.1 57.7 800.1 269.1 - - - - 179.4 - - 351.6 3rd Qtr. 406.1 0.9 140.3 30.0 83.1 65.1 86.7 1,048.8 286.4 - 307.5 - - 164.2 - - 290.7 4th Qtr. 412.8 0.8 211.8 23.5 18.4 63.3 95.0 524.8 142.7 - - - - 118.4 - - 263.7
Source: Ministry of Finance 1) As of 1988 includes Dividends from Financial Enterprises.
Miscellaneous
Table 6.2 (Cont'd)
Period Total Total
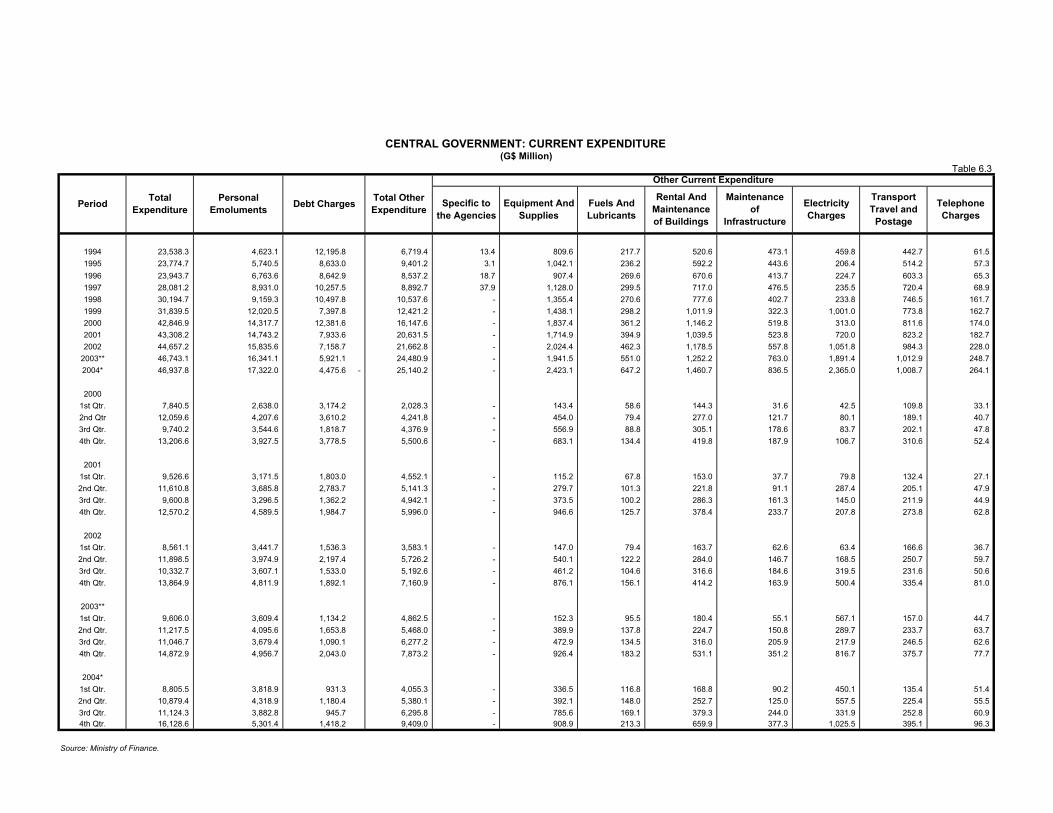
CENTRAL GOVERNMENT: CURRENT EXPENDITURE(G$ Million)
Other Current Expenditure
1994 23,538.3 4,623.1 12,195.8 6,719.4 13.4 809.6 217.7 520.6 473.1 459.8 442.7 61.5 1995 23,774.7 5,740.5 8,633.0 9,401.2 3.1 1,042.1 236.2 592.2 443.6 206.4 514.2 57.3 1996 23,943.7 6,763.6 8,642.9 8,537.2 18.7 907.4 269.6 670.6 413.7 224.7 603.3 65.3 1997 28,081.2 8,931.0 10,257.5 8,892.7 37.9 1,128.0 299.5 717.0 476.5 235.5 720.4 68.9 1998 30,194.7 9,159.3 10,497.8 10,537.6 - 1,355.4 270.6 777.6 402.7 233.8 746.5 161.7 1999 31,839.5 12,020.5 7,397.8 12,421.2 - 1,438.1 298.2 1,011.9 322.3 1,001.0 773.8 162.7 2000 42,846.9 14,317.7 12,381.6 16,147.6 - 1,837.4 361.2 1,146.2 519.8 313.0 811.6 174.0 2001 43,308.2 14,743.2 7,933.6 20,631.5 - 1,714.9 394.9 1,039.5 523.8 720.0 823.2 182.7 2002 44,657.2 15,835.6 7,158.7 21,662.8 - 2,024.4 462.3 1,178.5 557.8 1,051.8 984.3 228.0
2003** 46,743.1 16,341.1 5,921.1 24,480.9 - 1,941.5 551.0 1,252.2 763.0 1,891.4 1,012.9 248.7 2004* 46,937.8 17,322.0 4,475.6 - 25,140.2 - 2,423.1 647.2 1,460.7 836.5 2,365.0 1,008.7 264.1
20001st Qtr. 7,840.5 2,638.0 3,174.2 2,028.3 - 143.4 58.6 144.3 31.6 42.5 109.8 33.1 2nd Qtr 12,059.6 4,207.6 3,610.2 4,241.8 - 454.0 79.4 277.0 121.7 80.1 189.1 40.7 3rd Qtr. 9,740.2 3,544.6 1,818.7 4,376.9 - 556.9 88.8 305.1 178.6 83.7 202.1 47.8 4th Qtr. 13,206.6 3,927.5 3,778.5 5,500.6 - 683.1 134.4 419.8 187.9 106.7 310.6 52.4
20011st Qtr. 9,526.6 3,171.5 1,803.0 4,552.1 - 115.2 67.8 153.0 37.7 79.8 132.4 27.1 2nd Qtr. 11,610.8 3,685.8 2,783.7 5,141.3 - 279.7 101.3 221.8 91.1 287.4 205.1 47.9 3rd Qtr. 9,600.8 3,296.5 1,362.2 4,942.1 - 373.5 100.2 286.3 161.3 145.0 211.9 44.9 4th Qtr. 12,570.2 4,589.5 1,984.7 5,996.0 - 946.6 125.7 378.4 233.7 207.8 273.8 62.8
20021st Qtr. 8,561.1 3,441.7 1,536.3 3,583.1 - 147.0 79.4 163.7 62.6 63.4 166.6 36.7 2nd Qtr. 11,898.5 3,974.9 2,197.4 5,726.2 - 540.1 122.2 284.0 146.7 168.5 250.7 59.7 3rd Qtr. 10,332.7 3,607.1 1,533.0 5,192.6 - 461.2 104.6 316.6 184.6 319.5 231.6 50.6 4th Qtr. 13,864.9 4,811.9 1,892.1 7,160.9 - 876.1 156.1 414.2 163.9 500.4 335.4 81.0
2003**1st Qtr. 9,606.0 3,609.4 1,134.2 4,862.5 - 152.3 95.5 180.4 55.1 567.1 157.0 44.7 2nd Qtr. 11,217.5 4,095.6 1,653.8 5,468.0 - 389.9 137.8 224.7 150.8 289.7 233.7 63.7 3rd Qtr. 11,046.7 3,679.4 1,090.1 6,277.2 - 472.9 134.5 316.0 205.9 217.9 246.5 62.6 4th Qtr. 14,872.9 4,956.7 2,043.0 7,873.2 - 926.4 183.2 531.1 351.2 816.7 375.7 77.7
2004*1st Qtr. 8,805.5 3,818.9 931.3 4,055.3 - 336.5 116.8 168.8 90.2 450.1 135.4 51.4 2nd Qtr. 10,879.4 4,318.9 1,180.4 5,380.1 - 392.1 148.0 252.7 125.0 557.5 225.4 55.5 3rd Qtr. 11,124.3 3,882.8 945.7 6,295.8 - 785.6 169.1 379.3 244.0 331.9 252.8 60.9 4th Qtr. 16,128.6 5,301.4 1,418.2 9,409.0 - 908.9 213.3 659.9 377.3 1,025.5 395.1 96.3
Source: Ministry of Finance.
Debt Charges
Table 6.3
Equipment And Supplies
Fuels And Lubricants
Rental And Maintenance of Buildings
Maintenance of
Infrastructure
Total Other ExpenditurePeriod Total
ExpenditurePersonal
EmolumentsSpecific to
the AgenciesElectricity Charges
Transport Travel and
Postage
Telephone Charges
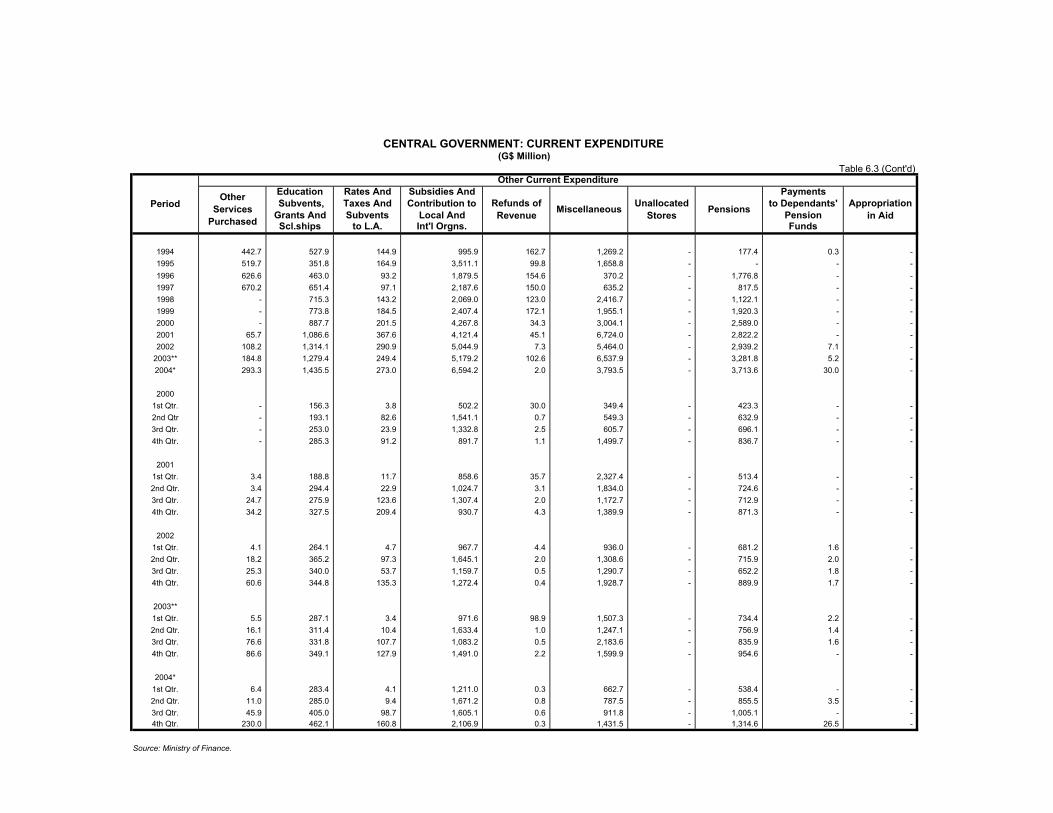
CENTRAL GOVERNMENT: CURRENT EXPENDITURE(G$ Million)
Other Current ExpenditureEducation Rates And Subsidies And Payments Subvents, Taxes And Contribution to to Dependants'Grants And Subvents Local And PensionScl.ships to L.A. Int'l Orgns. Funds
1994 442.7 527.9 144.9 995.9 162.7 1,269.2 - 177.4 0.3 - 1995 519.7 351.8 164.9 3,511.1 99.8 1,658.8 - - - - 1996 626.6 463.0 93.2 1,879.5 154.6 370.2 - 1,776.8 - - 1997 670.2 651.4 97.1 2,187.6 150.0 635.2 - 817.5 - - 1998 - 715.3 143.2 2,069.0 123.0 2,416.7 - 1,122.1 - - 1999 - 773.8 184.5 2,407.4 172.1 1,955.1 - 1,920.3 - - 2000 - 887.7 201.5 4,267.8 34.3 3,004.1 - 2,589.0 - - 2001 65.7 1,086.6 367.6 4,121.4 45.1 6,724.0 - 2,822.2 - - 2002 108.2 1,314.1 290.9 5,044.9 7.3 5,464.0 - 2,939.2 7.1 -
2003** 184.8 1,279.4 249.4 5,179.2 102.6 6,537.9 - 3,281.8 5.2 - 2004* 293.3 1,435.5 273.0 6,594.2 2.0 3,793.5 - 3,713.6 30.0 -
20001st Qtr. - 156.3 3.8 502.2 30.0 349.4 - 423.3 - - 2nd Qtr - 193.1 82.6 1,541.1 0.7 549.3 - 632.9 - - 3rd Qtr. - 253.0 23.9 1,332.8 2.5 605.7 - 696.1 - - 4th Qtr. - 285.3 91.2 891.7 1.1 1,499.7 - 836.7 - -
20011st Qtr. 3.4 188.8 11.7 858.6 35.7 2,327.4 - 513.4 - - 2nd Qtr. 3.4 294.4 22.9 1,024.7 3.1 1,834.0 - 724.6 - - 3rd Qtr. 24.7 275.9 123.6 1,307.4 2.0 1,172.7 - 712.9 - - 4th Qtr. 34.2 327.5 209.4 930.7 4.3 1,389.9 - 871.3 - -
20021st Qtr. 4.1 264.1 4.7 967.7 4.4 936.0 - 681.2 1.6 - 2nd Qtr. 18.2 365.2 97.3 1,645.1 2.0 1,308.6 - 715.9 2.0 - 3rd Qtr. 25.3 340.0 53.7 1,159.7 0.5 1,290.7 - 652.2 1.8 - 4th Qtr. 60.6 344.8 135.3 1,272.4 0.4 1,928.7 - 889.9 1.7 -
2003**1st Qtr. 5.5 287.1 3.4 971.6 98.9 1,507.3 - 734.4 2.2 - 2nd Qtr. 16.1 311.4 10.4 1,633.4 1.0 1,247.1 - 756.9 1.4 - 3rd Qtr. 76.6 331.8 107.7 1,083.2 0.5 2,183.6 - 835.9 1.6 - 4th Qtr. 86.6 349.1 127.9 1,491.0 2.2 1,599.9 - 954.6 - -
2004*1st Qtr. 6.4 283.4 4.1 1,211.0 0.3 662.7 - 538.4 - - 2nd Qtr. 11.0 285.0 9.4 1,671.2 0.8 787.5 - 855.5 3.5 - 3rd Qtr. 45.9 405.0 98.7 1,605.1 0.6 911.8 - 1,005.1 - - 4th Qtr. 230.0 462.1 160.8 2,106.9 0.3 1,431.5 - 1,314.6 26.5 -
Source: Ministry of Finance.
Table 6.3 (Cont'd)
PeriodOther
Services Purchased
Refunds of Revenue Miscellaneous Unallocated
Stores Pensions Appropriation in Aid
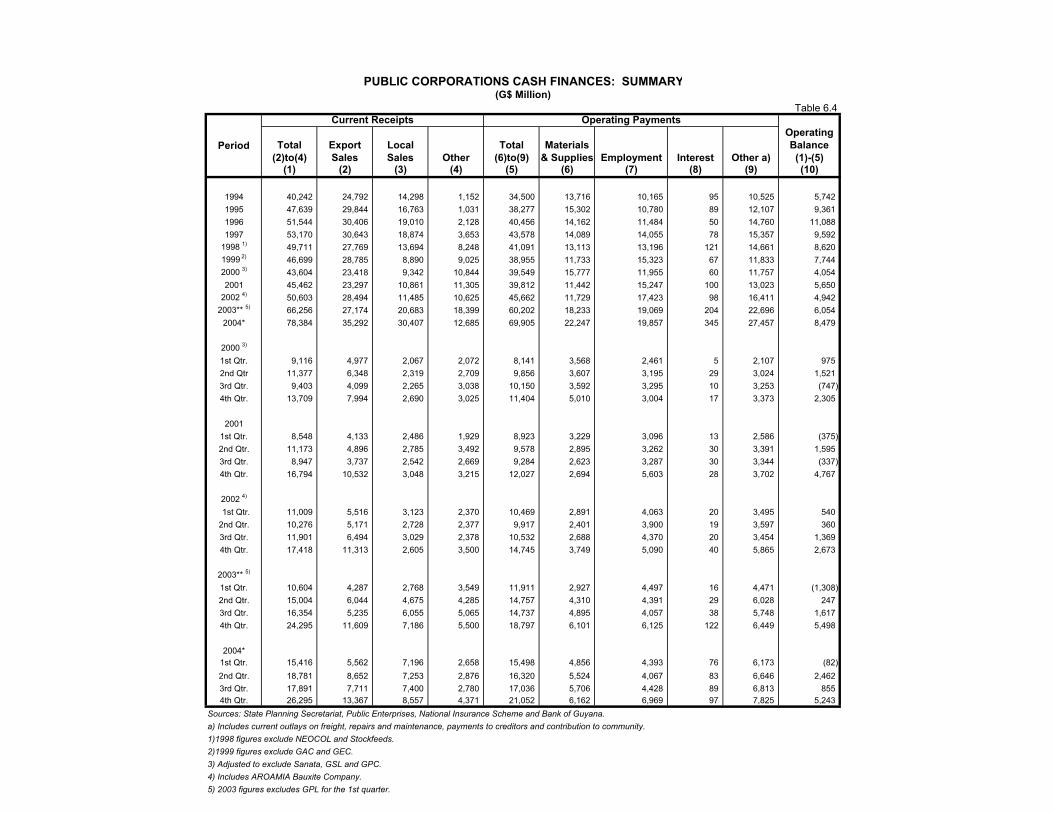
PUBLIC CORPORATIONS CASH FINANCES: SUMMARY(G$ Million)
Current Receipts Operating PaymentsOperating
Total Export Local Total Materials Balance(2)to(4) Sales Sales Other (6)to(9) & Supplies Employment Interest Other a) (1)-(5)
(1) (2) (3) (4) (5) (6) (7) (8) (9) (10)
1994 40,242 24,792 14,298 1,152 34,500 13,716 10,165 95 10,525 5,742 1995 47,639 29,844 16,763 1,031 38,277 15,302 10,780 89 12,107 9,361 1996 51,544 30,406 19,010 2,128 40,456 14,162 11,484 50 14,760 11,088 1997 53,170 30,643 18,874 3,653 43,578 14,089 14,055 78 15,357 9,592
1998 1) 49,711 27,769 13,694 8,248 41,091 13,113 13,196 121 14,661 8,620 1999 2) 46,699 28,785 8,890 9,025 38,955 11,733 15,323 67 11,833 7,744 2000 3) 43,604 23,418 9,342 10,844 39,549 15,777 11,955 60 11,757 4,054 2001 45,462 23,297 10,861 11,305 39,812 11,442 15,247 100 13,023 5,650
2002 4) 50,603 28,494 11,485 10,625 45,662 11,729 17,423 98 16,411 4,942 2003** 5) 66,256 27,174 20,683 18,399 60,202 18,233 19,069 204 22,696 6,054
2004* 78,384 35,292 30,407 12,685 69,905 22,247 19,857 345 27,457 8,479
2000 3)
1st Qtr. 9,116 4,977 2,067 2,072 8,141 3,568 2,461 5 2,107 975 2nd Qtr 11,377 6,348 2,319 2,709 9,856 3,607 3,195 29 3,024 1,521 3rd Qtr. 9,403 4,099 2,265 3,038 10,150 3,592 3,295 10 3,253 (747) 4th Qtr. 13,709 7,994 2,690 3,025 11,404 5,010 3,004 17 3,373 2,305
20011st Qtr. 8,548 4,133 2,486 1,929 8,923 3,229 3,096 13 2,586 (375) 2nd Qtr. 11,173 4,896 2,785 3,492 9,578 2,895 3,262 30 3,391 1,595 3rd Qtr. 8,947 3,737 2,542 2,669 9,284 2,623 3,287 30 3,344 (337) 4th Qtr. 16,794 10,532 3,048 3,215 12,027 2,694 5,603 28 3,702 4,767
2002 4)
1st Qtr. 11,009 5,516 3,123 2,370 10,469 2,891 4,063 20 3,495 540 2nd Qtr. 10,276 5,171 2,728 2,377 9,917 2,401 3,900 19 3,597 360 3rd Qtr. 11,901 6,494 3,029 2,378 10,532 2,688 4,370 20 3,454 1,369 4th Qtr. 17,418 11,313 2,605 3,500 14,745 3,749 5,090 40 5,865 2,673
2003** 5)
1st Qtr. 10,604 4,287 2,768 3,549 11,911 2,927 4,497 16 4,471 (1,308) 2nd Qtr. 15,004 6,044 4,675 4,285 14,757 4,310 4,391 29 6,028 247 3rd Qtr. 16,354 5,235 6,055 5,065 14,737 4,895 4,057 38 5,748 1,617 4th Qtr. 24,295 11,609 7,186 5,500 18,797 6,101 6,125 122 6,449 5,498
2004*1st Qtr. 15,416 5,562 7,196 2,658 15,498 4,856 4,393 76 6,173 (82) 2nd Qtr. 18,781 8,652 7,253 2,876 16,320 5,524 4,067 83 6,646 2,462 3rd Qtr. 17,891 7,711 7,400 2,780 17,036 5,706 4,428 89 6,813 855 4th Qtr. 26,295 13,367 8,557 4,371 21,052 6,162 6,969 97 7,825 5,243
Sources: State Planning Secretariat, Public Enterprises, National Insurance Scheme and Bank of Guyana.a) Includes current outlays on freight, repairs and maintenance, payments to creditors and contribution to community.1)1998 figures exclude NEOCOL and Stockfeeds.2)1999 figures exclude GAC and GEC.3) Adjusted to exclude Sanata, GSL and GPC.4) Includes AROAMIA Bauxite Company.5) 2003 figures excludes GPL for the 1st quarter.
Period
Table 6.4
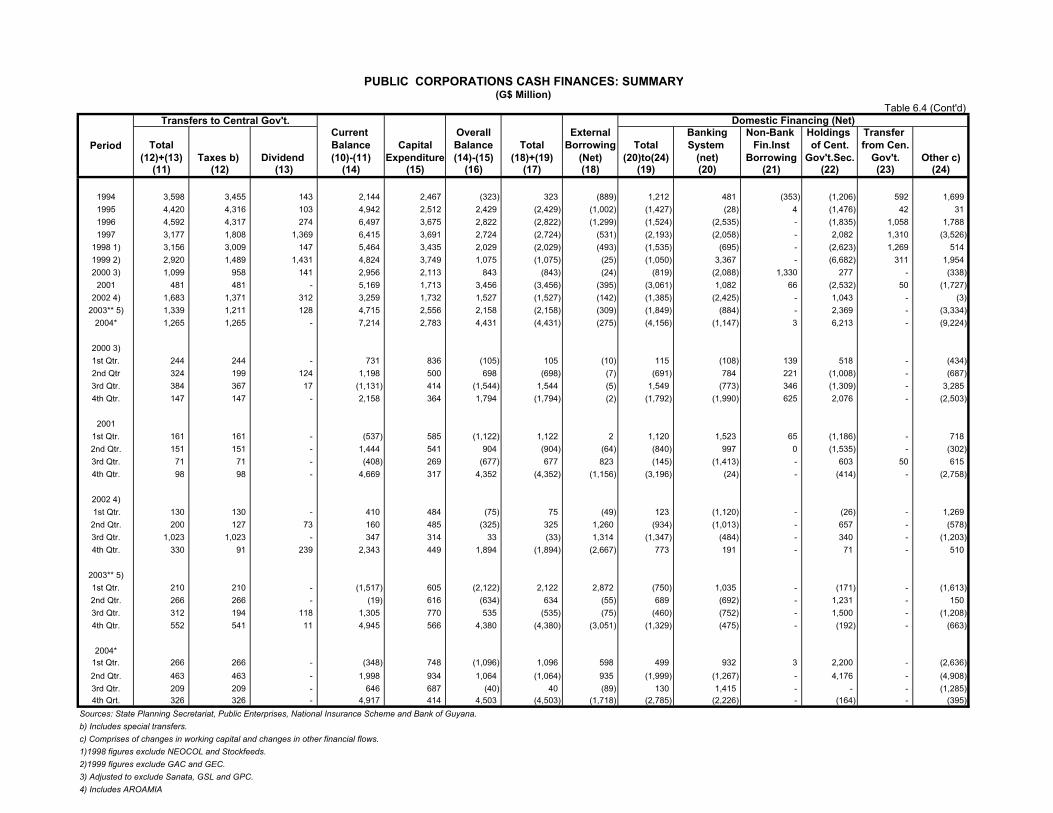
PUBLIC CORPORATIONS CASH FINANCES: SUMMARY(G$ Million)
Transfers to Central Gov't.Current Overall External Banking Non-Bank Holdings Transfer
Total Balance Capital Balance Total Borrowing Total System Fin.Inst of Cent. from Cen.(12)+(13) Taxes b) Dividend (10)-(11) Expenditure (14)-(15) (18)+(19) (Net) (20)to(24) (net) Borrowing Gov't.Sec. Gov't. Other c)
(11) (12) (13) (14) (15) (16) (17) (18) (19) (20) (21) (22) (23) (24)
1994 3,598 3,455 143 2,144 2,467 (323) 323 (889) 1,212 481 (353) (1,206) 592 1,699 1995 4,420 4,316 103 4,942 2,512 2,429 (2,429) (1,002) (1,427) (28) 4 (1,476) 42 31 1996 4,592 4,317 274 6,497 3,675 2,822 (2,822) (1,299) (1,524) (2,535) - (1,835) 1,058 1,788 1997 3,177 1,808 1,369 6,415 3,691 2,724 (2,724) (531) (2,193) (2,058) - 2,082 1,310 (3,526)
1998 1) 3,156 3,009 147 5,464 3,435 2,029 (2,029) (493) (1,535) (695) - (2,623) 1,269 514 1999 2) 2,920 1,489 1,431 4,824 3,749 1,075 (1,075) (25) (1,050) 3,367 - (6,682) 311 1,954 2000 3) 1,099 958 141 2,956 2,113 843 (843) (24) (819) (2,088) 1,330 277 - (338)
2001 481 481 - 5,169 1,713 3,456 (3,456) (395) (3,061) 1,082 66 (2,532) 50 (1,727) 2002 4) 1,683 1,371 312 3,259 1,732 1,527 (1,527) (142) (1,385) (2,425) - 1,043 - (3)
2003** 5) 1,339 1,211 128 4,715 2,556 2,158 (2,158) (309) (1,849) (884) - 2,369 - (3,334) 2004* 1,265 1,265 - 7,214 2,783 4,431 (4,431) (275) (4,156) (1,147) 3 6,213 - (9,224)
2000 3)1st Qtr. 244 244 - 731 836 (105) 105 (10) 115 (108) 139 518 - (434) 2nd Qtr 324 199 124 1,198 500 698 (698) (7) (691) 784 221 (1,008) - (687) 3rd Qtr. 384 367 17 (1,131) 414 (1,544) 1,544 (5) 1,549 (773) 346 (1,309) - 3,285 4th Qtr. 147 147 - 2,158 364 1,794 (1,794) (2) (1,792) (1,990) 625 2,076 - (2,503)
20011st Qtr. 161 161 - (537) 585 (1,122) 1,122 2 1,120 1,523 65 (1,186) - 718 2nd Qtr. 151 151 - 1,444 541 904 (904) (64) (840) 997 0 (1,535) - (302) 3rd Qtr. 71 71 - (408) 269 (677) 677 823 (145) (1,413) - 603 50 615 4th Qtr. 98 98 - 4,669 317 4,352 (4,352) (1,156) (3,196) (24) - (414) - (2,758)
2002 4) 1st Qtr. 130 130 - 410 484 (75) 75 (49) 123 (1,120) - (26) - 1,269 2nd Qtr. 200 127 73 160 485 (325) 325 1,260 (934) (1,013) - 657 - (578) 3rd Qtr. 1,023 1,023 - 347 314 33 (33) 1,314 (1,347) (484) - 340 - (1,203) 4th Qtr. 330 91 239 2,343 449 1,894 (1,894) (2,667) 773 191 - 71 - 510
2003** 5)1st Qtr. 210 210 - (1,517) 605 (2,122) 2,122 2,872 (750) 1,035 - (171) - (1,613) 2nd Qtr. 266 266 - (19) 616 (634) 634 (55) 689 (692) - 1,231 - 150 3rd Qtr. 312 194 118 1,305 770 535 (535) (75) (460) (752) - 1,500 - (1,208) 4th Qtr. 552 541 11 4,945 566 4,380 (4,380) (3,051) (1,329) (475) - (192) - (663)
2004*1st Qtr. 266 266 - (348) 748 (1,096) 1,096 598 499 932 3 2,200 - (2,636) 2nd Qtr. 463 463 - 1,998 934 1,064 (1,064) 935 (1,999) (1,267) - 4,176 - (4,908) 3rd Qtr. 209 209 - 646 687 (40) 40 (89) 130 1,415 - - - (1,285) 4th Qrt. 326 326 - 4,917 414 4,503 (4,503) (1,718) (2,785) (2,226) - (164) - (395)
Sources: State Planning Secretariat, Public Enterprises, National Insurance Scheme and Bank of Guyana.b) Includes special transfers.c) Comprises of changes in working capital and changes in other financial flows.1)1998 figures exclude NEOCOL and Stockfeeds.2)1999 figures exclude GAC and GEC.3) Adjusted to exclude Sanata, GSL and GPC.4) Includes AROAMIA
Table 6.4 (Cont'd)
Period
Domestic Financing (Net)
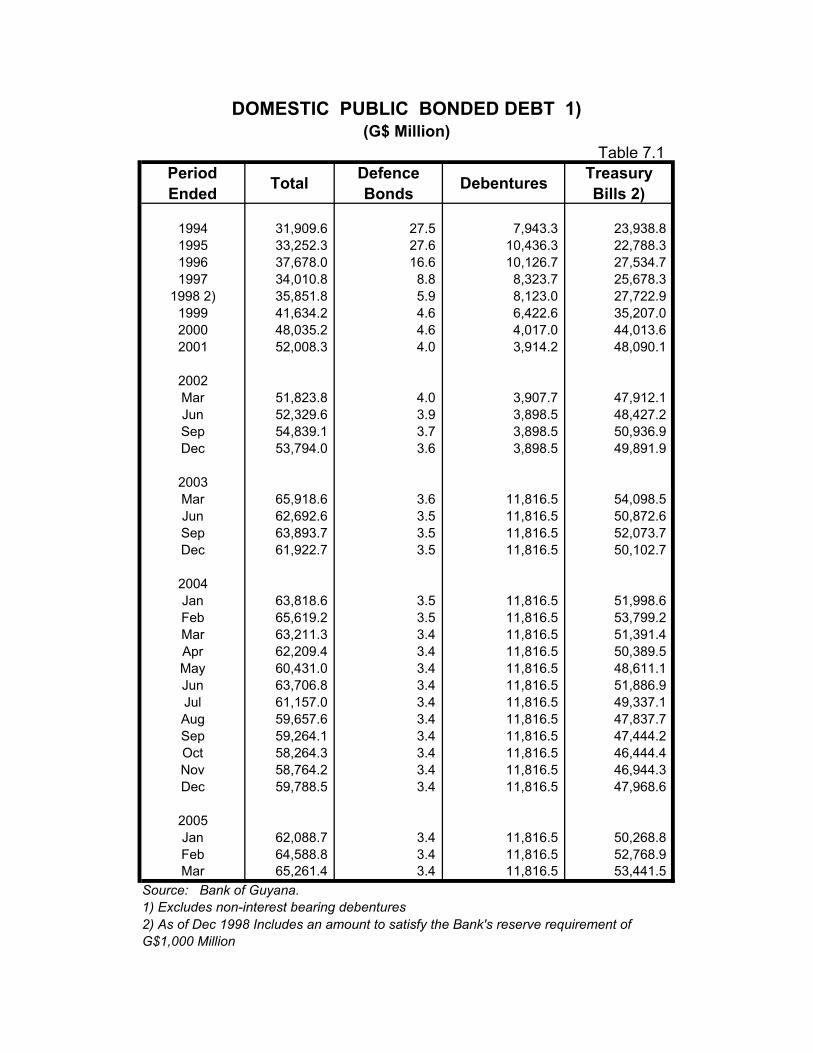
1994 31,909.6 27.5 7,943.3 23,938.81995 33,252.3 27.6 10,436.3 22,788.31996 37,678.0 16.6 10,126.7 27,534.71997 34,010.8 8.8 8,323.7 25,678.3
1998 2) 35,851.8 5.9 8,123.0 27,722.91999 41,634.2 4.6 6,422.6 35,207.02000 48,035.2 4.6 4,017.0 44,013.62001 52,008.3 4.0 3,914.2 48,090.1
2002Mar 51,823.8 4.0 3,907.7 47,912.1Jun 52,329.6 3.9 3,898.5 48,427.2Sep 54,839.1 3.7 3,898.5 50,936.9Dec 53,794.0 3.6 3,898.5 49,891.9
2003Mar 65,918.6 3.6 11,816.5 54,098.5Jun 62,692.6 3.5 11,816.5 50,872.6Sep 63,893.7 3.5 11,816.5 52,073.7Dec 61,922.7 3.5 11,816.5 50,102.7
2004Jan 63,818.6 3.5 11,816.5 51,998.6Feb 65,619.2 3.5 11,816.5 53,799.2Mar 63,211.3 3.4 11,816.5 51,391.4Apr 62,209.4 3.4 11,816.5 50,389.5May 60,431.0 3.4 11,816.5 48,611.1Jun 63,706.8 3.4 11,816.5 51,886.9Jul 61,157.0 3.4 11,816.5 49,337.1Aug 59,657.6 3.4 11,816.5 47,837.7Sep 59,264.1 3.4 11,816.5 47,444.2Oct 58,264.3 3.4 11,816.5 46,444.4Nov 58,764.2 3.4 11,816.5 46,944.3Dec 59,788.5 3.4 11,816.5 47,968.6
2005Jan 62,088.7 3.4 11,816.5 50,268.8Feb 64,588.8 3.4 11,816.5 52,768.9Mar 65,261.4 3.4 11,816.5 53,441.5
Source: Bank of Guyana.1) Excludes non-interest bearing debentures2) As of Dec 1998 Includes an amount to satisfy the Bank's reserve requirement of G$1,000 Million
DOMESTIC PUBLIC BONDED DEBT 1)(G$ Million)
Table 7.1 Period Ended Total Defence
Bonds Debentures Treasury Bills 2)
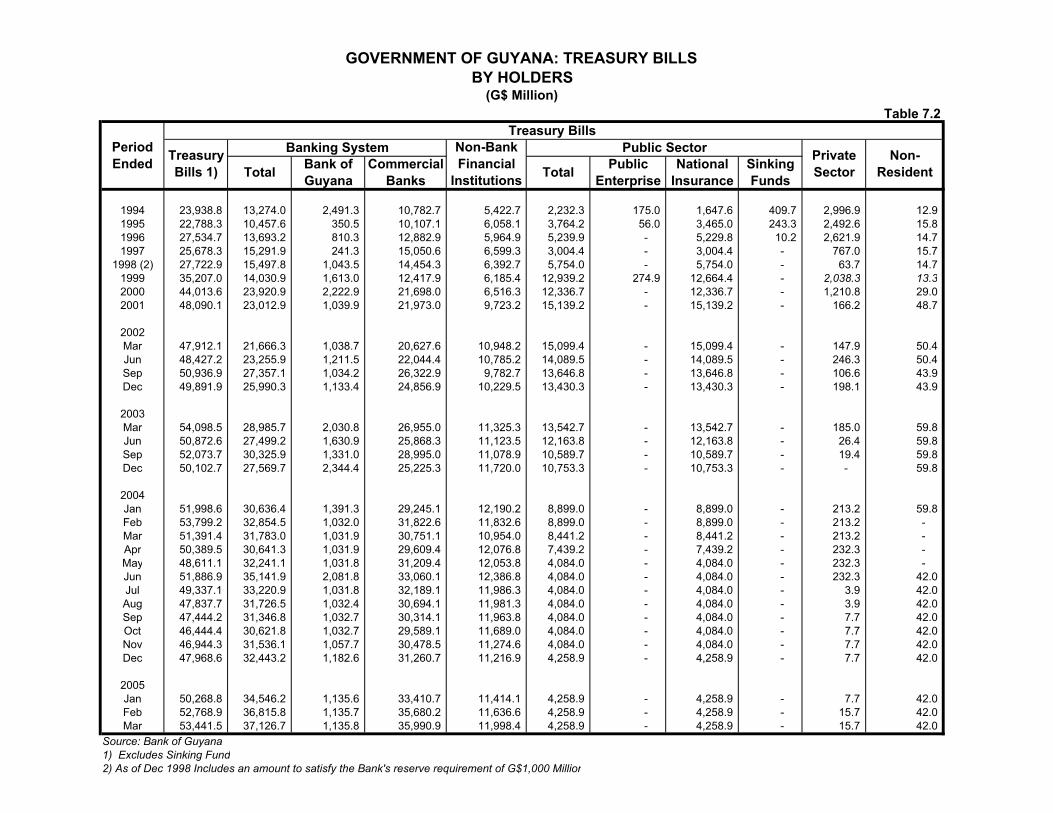
GOVERNMENT OF GUYANA: TREASURY BILLS BY HOLDERS
(G$ Million)
Treasury Bills Banking System Public Sector
1994 23,938.8 13,274.0 2,491.3 10,782.7 5,422.7 2,232.3 175.0 1,647.6 409.7 2,996.9 12.9 1995 22,788.3 10,457.6 350.5 10,107.1 6,058.1 3,764.2 56.0 3,465.0 243.3 2,492.6 15.8 1996 27,534.7 13,693.2 810.3 12,882.9 5,964.9 5,239.9 - 5,229.8 10.2 2,621.9 14.7 1997 25,678.3 15,291.9 241.3 15,050.6 6,599.3 3,004.4 - 3,004.4 - 767.0 15.7
1998 (2) 27,722.9 15,497.8 1,043.5 14,454.3 6,392.7 5,754.0 - 5,754.0 - 63.7 14.7 1999 35,207.0 14,030.9 1,613.0 12,417.9 6,185.4 12,939.2 274.9 12,664.4 - 2,038.3 13.3 2000 44,013.6 23,920.9 2,222.9 21,698.0 6,516.3 12,336.7 - 12,336.7 - 1,210.8 29.0 2001 48,090.1 23,012.9 1,039.9 21,973.0 9,723.2 15,139.2 - 15,139.2 - 166.2 48.7
2002Mar 47,912.1 21,666.3 1,038.7 20,627.6 10,948.2 15,099.4 - 15,099.4 - 147.9 50.4 Jun 48,427.2 23,255.9 1,211.5 22,044.4 10,785.2 14,089.5 - 14,089.5 - 246.3 50.4 Sep 50,936.9 27,357.1 1,034.2 26,322.9 9,782.7 13,646.8 - 13,646.8 - 106.6 43.9 Dec 49,891.9 25,990.3 1,133.4 24,856.9 10,229.5 13,430.3 - 13,430.3 - 198.1 43.9
2003Mar 54,098.5 28,985.7 2,030.8 26,955.0 11,325.3 13,542.7 - 13,542.7 - 185.0 59.8 Jun 50,872.6 27,499.2 1,630.9 25,868.3 11,123.5 12,163.8 - 12,163.8 - 26.4 59.8 Sep 52,073.7 30,325.9 1,331.0 28,995.0 11,078.9 10,589.7 - 10,589.7 - 19.4 59.8 Dec 50,102.7 27,569.7 2,344.4 25,225.3 11,720.0 10,753.3 - 10,753.3 - - 59.8
2004Jan 51,998.6 30,636.4 1,391.3 29,245.1 12,190.2 8,899.0 - 8,899.0 - 213.2 59.8 Feb 53,799.2 32,854.5 1,032.0 31,822.6 11,832.6 8,899.0 - 8,899.0 - 213.2 - Mar 51,391.4 31,783.0 1,031.9 30,751.1 10,954.0 8,441.2 - 8,441.2 - 213.2 - Apr 50,389.5 30,641.3 1,031.9 29,609.4 12,076.8 7,439.2 - 7,439.2 - 232.3 - May 48,611.1 32,241.1 1,031.8 31,209.4 12,053.8 4,084.0 - 4,084.0 - 232.3 - Jun 51,886.9 35,141.9 2,081.8 33,060.1 12,386.8 4,084.0 - 4,084.0 - 232.3 42.0 Jul 49,337.1 33,220.9 1,031.8 32,189.1 11,986.3 4,084.0 - 4,084.0 - 3.9 42.0 Aug 47,837.7 31,726.5 1,032.4 30,694.1 11,981.3 4,084.0 - 4,084.0 - 3.9 42.0 Sep 47,444.2 31,346.8 1,032.7 30,314.1 11,963.8 4,084.0 - 4,084.0 - 7.7 42.0 Oct 46,444.4 30,621.8 1,032.7 29,589.1 11,689.0 4,084.0 - 4,084.0 - 7.7 42.0 Nov 46,944.3 31,536.1 1,057.7 30,478.5 11,274.6 4,084.0 - 4,084.0 - 7.7 42.0 Dec 47,968.6 32,443.2 1,182.6 31,260.7 11,216.9 4,258.9 - 4,258.9 - 7.7 42.0
2005Jan 50,268.8 34,546.2 1,135.6 33,410.7 11,414.1 4,258.9 - 4,258.9 - 7.7 42.0 Feb 52,768.9 36,815.8 1,135.7 35,680.2 11,636.6 4,258.9 - 4,258.9 - 15.7 42.0 Mar 53,441.5 37,126.7 1,135.8 35,990.9 11,998.4 4,258.9 - 4,258.9 - 15.7 42.0
Source: Bank of Guyana1) Excludes Sinking Fund2) As of Dec 1998 Includes an amount to satisfy the Bank's reserve requirement of G$1,000 Million
Table 7.2
Period Ended Treasury
Bills 1) Total Bank of Guyana
Commercial Banks
Non-Bank Financial
Institutions
Private Sector
Non-ResidentTotal Public
EnterpriseNational
Insurance Sinking Funds
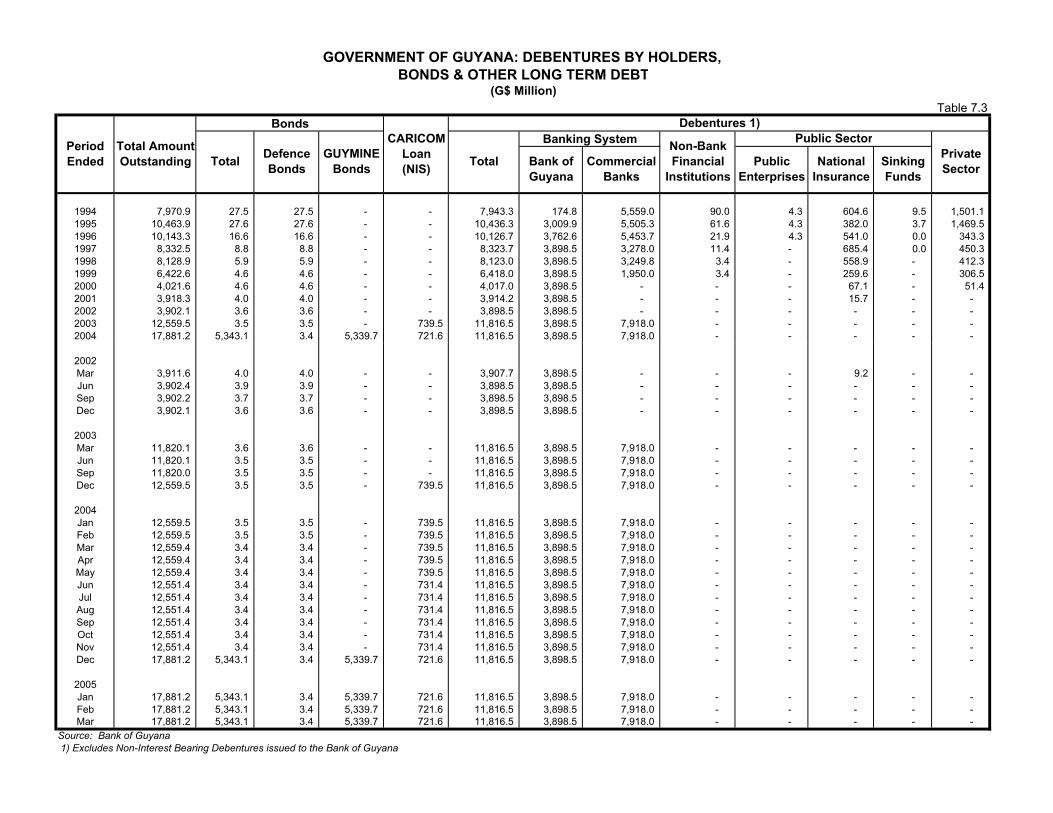
GOVERNMENT OF GUYANA: DEBENTURES BY HOLDERS, BONDS & OTHER LONG TERM DEBT
(G$ Million)
Debentures 1)Public Sector
1994 7,970.9 27.5 27.5 - - 7,943.3 174.8 5,559.0 90.0 4.3 604.6 9.5 1,501.1 1995 10,463.9 27.6 27.6 - - 10,436.3 3,009.9 5,505.3 61.6 4.3 382.0 3.7 1,469.5 1996 10,143.3 16.6 16.6 - - 10,126.7 3,762.6 5,453.7 21.9 4.3 541.0 0.0 343.3 1997 8,332.5 8.8 8.8 - - 8,323.7 3,898.5 3,278.0 11.4 - 685.4 0.0 450.3 1998 8,128.9 5.9 5.9 - - 8,123.0 3,898.5 3,249.8 3.4 - 558.9 - 412.3 1999 6,422.6 4.6 4.6 - - 6,418.0 3,898.5 1,950.0 3.4 - 259.6 - 306.5 2000 4,021.6 4.6 4.6 - - 4,017.0 3,898.5 - - - 67.1 - 51.4 2001 3,918.3 4.0 4.0 - - 3,914.2 3,898.5 - - - 15.7 - - 2002 3,902.1 3.6 3.6 - - 3,898.5 3,898.5 - - - - - - 2003 12,559.5 3.5 3.5 - 739.5 11,816.5 3,898.5 7,918.0 - - - - - 2004 17,881.2 5,343.1 3.4 5,339.7 721.6 11,816.5 3,898.5 7,918.0 - - - - -
2002Mar 3,911.6 4.0 4.0 - - 3,907.7 3,898.5 - - - 9.2 - - Jun 3,902.4 3.9 3.9 - - 3,898.5 3,898.5 - - - - - - Sep 3,902.2 3.7 3.7 - - 3,898.5 3,898.5 - - - - - - Dec 3,902.1 3.6 3.6 - - 3,898.5 3,898.5 - - - - - -
2003Mar 11,820.1 3.6 3.6 - - 11,816.5 3,898.5 7,918.0 - - - - - Jun 11,820.1 3.5 3.5 - - 11,816.5 3,898.5 7,918.0 - - - - - Sep 11,820.0 3.5 3.5 - - 11,816.5 3,898.5 7,918.0 - - - - - Dec 12,559.5 3.5 3.5 - 739.5 11,816.5 3,898.5 7,918.0 - - - - -
2004Jan 12,559.5 3.5 3.5 - 739.5 11,816.5 3,898.5 7,918.0 - - - - - Feb 12,559.5 3.5 3.5 - 739.5 11,816.5 3,898.5 7,918.0 - - - - - Mar 12,559.4 3.4 3.4 - 739.5 11,816.5 3,898.5 7,918.0 - - - - - Apr 12,559.4 3.4 3.4 - 739.5 11,816.5 3,898.5 7,918.0 - - - - - May 12,559.4 3.4 3.4 - 739.5 11,816.5 3,898.5 7,918.0 - - - - - Jun 12,551.4 3.4 3.4 - 731.4 11,816.5 3,898.5 7,918.0 - - - - - Jul 12,551.4 3.4 3.4 - 731.4 11,816.5 3,898.5 7,918.0 - - - - - Aug 12,551.4 3.4 3.4 - 731.4 11,816.5 3,898.5 7,918.0 - - - - - Sep 12,551.4 3.4 3.4 - 731.4 11,816.5 3,898.5 7,918.0 - - - - - Oct 12,551.4 3.4 3.4 - 731.4 11,816.5 3,898.5 7,918.0 - - - - - Nov 12,551.4 3.4 3.4 - 731.4 11,816.5 3,898.5 7,918.0 - - - - - Dec 17,881.2 5,343.1 3.4 5,339.7 721.6 11,816.5 3,898.5 7,918.0 - - - - -
2005Jan 17,881.2 5,343.1 3.4 5,339.7 721.6 11,816.5 3,898.5 7,918.0 - - - - - Feb 17,881.2 5,343.1 3.4 5,339.7 721.6 11,816.5 3,898.5 7,918.0 - - - - - Mar 17,881.2 5,343.1 3.4 5,339.7 721.6 11,816.5 3,898.5 7,918.0 - - - - -
Source: Bank of Guyana 1) Excludes Non-Interest Bearing Debentures issued to the Bank of Guyana
BondsTable 7.3
Period Ended
Total Amount Outstanding Total Defence
BondsGUYMINE
Bonds
CARICOM Loan (NIS) Total
Banking System
National Insurance
Sinking Funds
Private SectorBank of
GuyanaCommercial
Banks
Non-Bank Financial
InstitutionsPublic
Enterprises
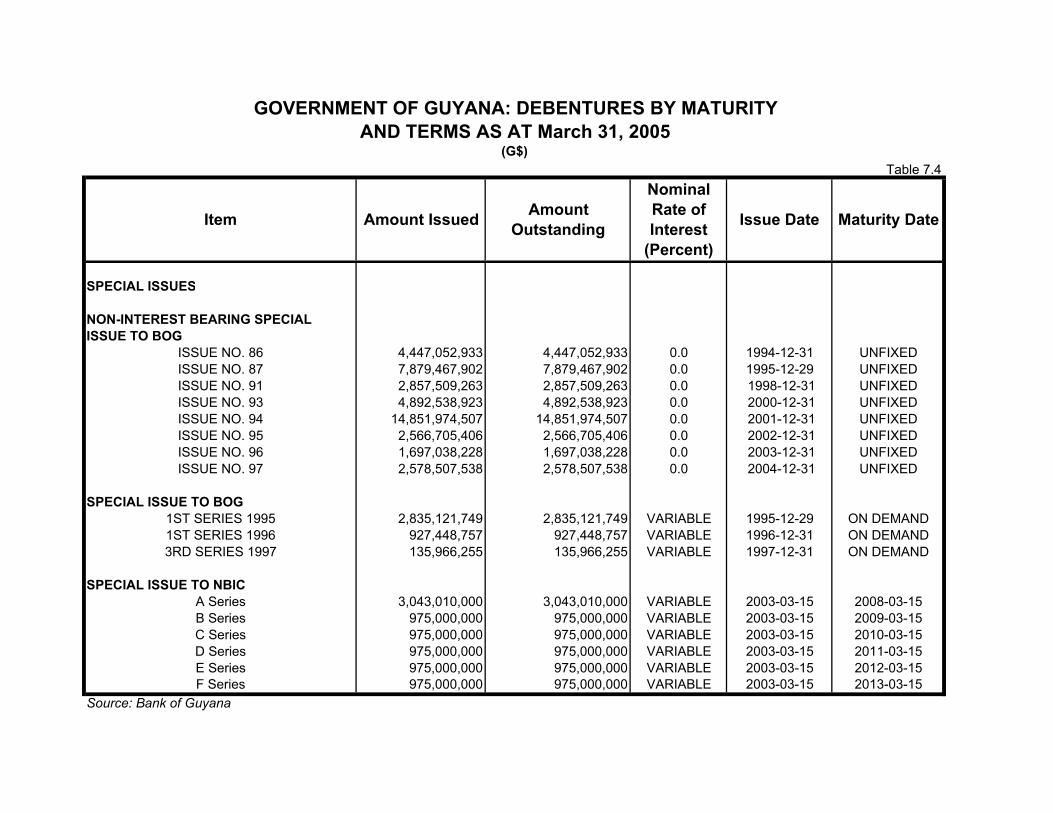
GOVERNMENT OF GUYANA: DEBENTURES BY MATURITYAND TERMS AS AT March 31, 2005
(G$)
SPECIAL ISSUES NON-INTEREST BEARING SPECIAL ISSUE TO BOG
ISSUE NO. 86 4,447,052,933 4,447,052,933 0.0 1994-12-31 UNFIXEDISSUE NO. 87 7,879,467,902 7,879,467,902 0.0 1995-12-29 UNFIXEDISSUE NO. 91 2,857,509,263 2,857,509,263 0.0 1998-12-31 UNFIXEDISSUE NO. 93 4,892,538,923 4,892,538,923 0.0 2000-12-31 UNFIXEDISSUE NO. 94 14,851,974,507 14,851,974,507 0.0 2001-12-31 UNFIXEDISSUE NO. 95 2,566,705,406 2,566,705,406 0.0 2002-12-31 UNFIXEDISSUE NO. 96 1,697,038,228 1,697,038,228 0.0 2003-12-31 UNFIXEDISSUE NO. 97 2,578,507,538 2,578,507,538 0.0 2004-12-31 UNFIXED
SPECIAL ISSUE TO BOG1ST SERIES 1995 2,835,121,749 2,835,121,749 VARIABLE 1995-12-29 ON DEMAND1ST SERIES 1996 927,448,757 927,448,757 VARIABLE 1996-12-31 ON DEMAND3RD SERIES 1997 135,966,255 135,966,255 VARIABLE 1997-12-31 ON DEMAND
SPECIAL ISSUE TO NBICA Series 3,043,010,000 3,043,010,000 VARIABLE 2003-03-15 2008-03-15B Series 975,000,000 975,000,000 VARIABLE 2003-03-15 2009-03-15C Series 975,000,000 975,000,000 VARIABLE 2003-03-15 2010-03-15D Series 975,000,000 975,000,000 VARIABLE 2003-03-15 2011-03-15E Series 975,000,000 975,000,000 VARIABLE 2003-03-15 2012-03-15F Series 975,000,000 975,000,000 VARIABLE 2003-03-15 2013-03-15
Source: Bank of Guyana
Table 7.4
Item Amount Issued Amount Outstanding
Nominal Rate of Interest
(Percent)
Issue Date Maturity Date
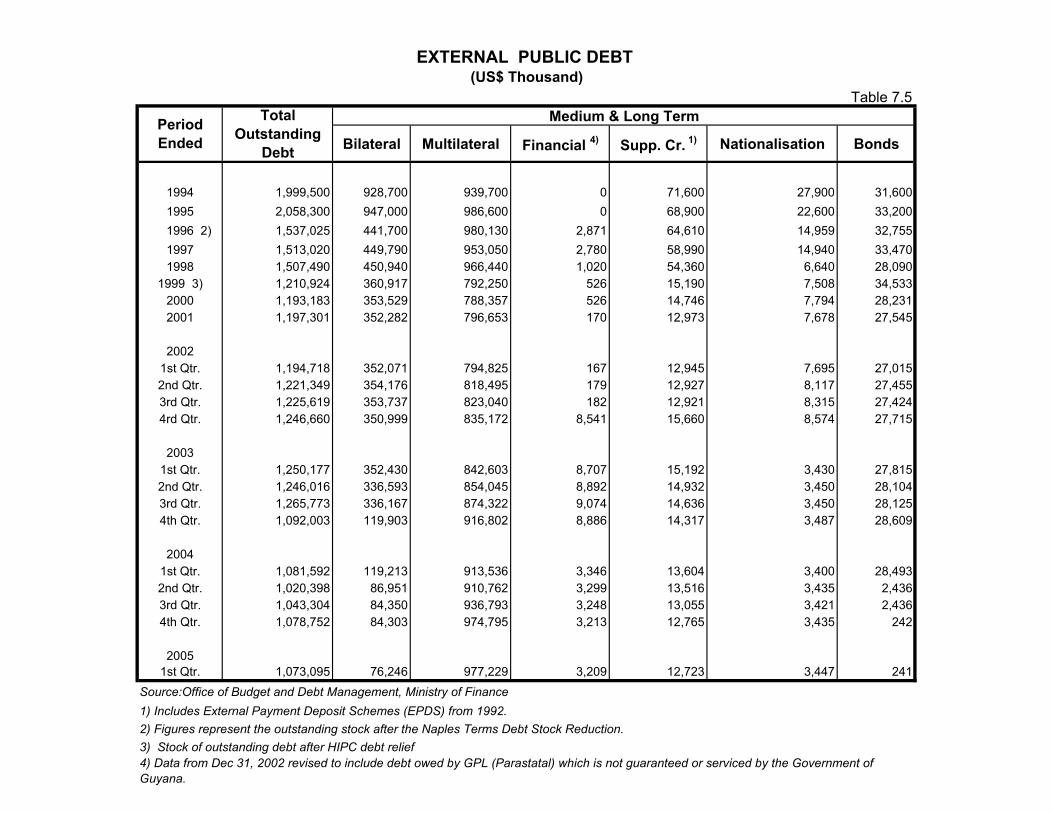
EXTERNAL PUBLIC DEBT (US$ Thousand)
Bilateral Multilateral Financial 4) Supp. Cr. 1) Nationalisation Bonds
1994 1,999,500 928,700 939,700 0 71,600 27,900 31,6001995 2,058,300 947,000 986,600 0 68,900 22,600 33,200
1996 2) 1,537,025 441,700 980,130 2,871 64,610 14,959 32,7551997 1,513,020 449,790 953,050 2,780 58,990 14,940 33,4701998 1,507,490 450,940 966,440 1,020 54,360 6,640 28,090
1999 3) 1,210,924 360,917 792,250 526 15,190 7,508 34,5332000 1,193,183 353,529 788,357 526 14,746 7,794 28,2312001 1,197,301 352,282 796,653 170 12,973 7,678 27,545
20021st Qtr. 1,194,718 352,071 794,825 167 12,945 7,695 27,0152nd Qtr. 1,221,349 354,176 818,495 179 12,927 8,117 27,4553rd Qtr. 1,225,619 353,737 823,040 182 12,921 8,315 27,4244rd Qtr. 1,246,660 350,999 835,172 8,541 15,660 8,574 27,715
20031st Qtr. 1,250,177 352,430 842,603 8,707 15,192 3,430 27,8152nd Qtr. 1,246,016 336,593 854,045 8,892 14,932 3,450 28,1043rd Qtr. 1,265,773 336,167 874,322 9,074 14,636 3,450 28,1254th Qtr. 1,092,003 119,903 916,802 8,886 14,317 3,487 28,609
20041st Qtr. 1,081,592 119,213 913,536 3,346 13,604 3,400 28,4932nd Qtr. 1,020,398 86,951 910,762 3,299 13,516 3,435 2,4363rd Qtr. 1,043,304 84,350 936,793 3,248 13,055 3,421 2,4364th Qtr. 1,078,752 84,303 974,795 3,213 12,765 3,435 242
20051st Qtr. 1,073,095 76,246 977,229 3,209 12,723 3,447 241
Source:Office of Budget and Debt Management, Ministry of Finance1) Includes External Payment Deposit Schemes (EPDS) from 1992.2) Figures represent the outstanding stock after the Naples Terms Debt Stock Reduction.3) Stock of outstanding debt after HIPC debt relief4) Data from Dec 31, 2002 revised to include debt owed by GPL (Parastatal) which is not guaranteed or serviced by the Government of Guyana.
Period Ended
Total Outstanding
Debt
Medium & Long TermTable 7.5
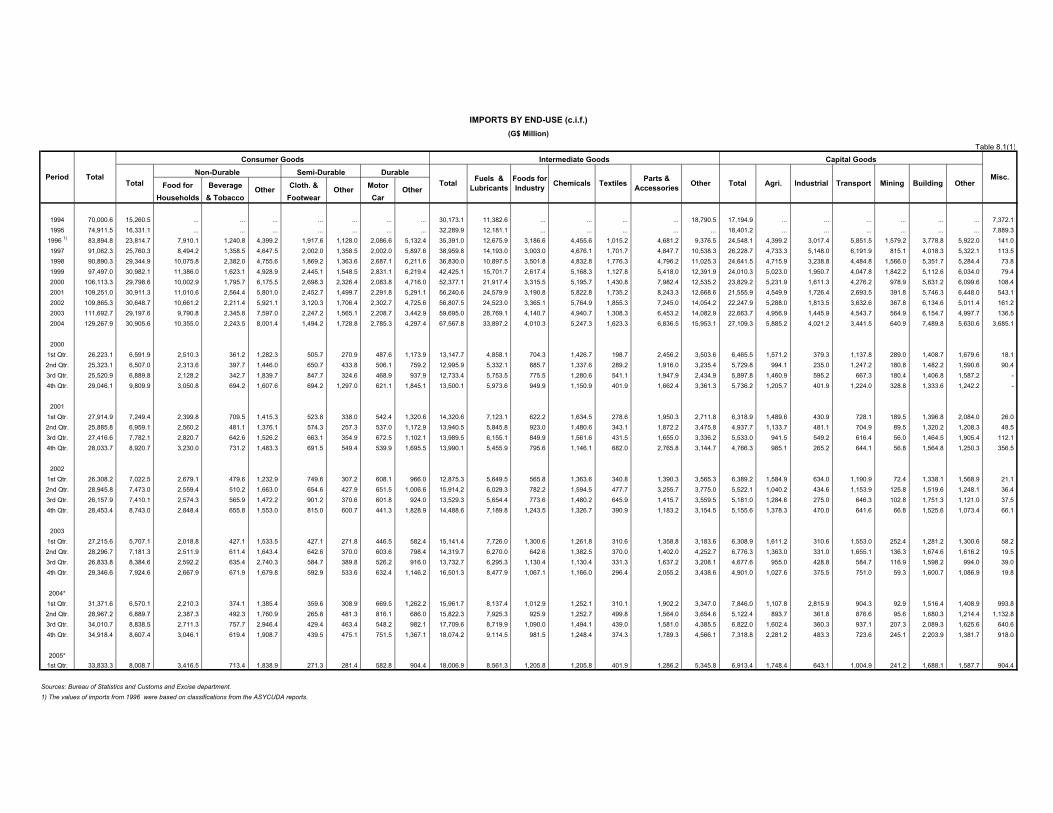
IMPORTS BY END-USE (c.i.f.)(G$ Million)
Consumer Goods Intermediate Goods Capital GoodsNon-Durable Semi-Durable Durable
Food for Beverage Cloth. & MotorHouseholds & Tobacco Footwear Car
1994 70,000.6 15,260.5 ... ... ... ... ... ... ... 30,173.1 11,382.6 ... ... ... ... 18,790.5 17,194.9 ... ... ... ... ... ... 7,372.1 1995 74,911.5 16,331.1 ... ... ... ... ... ... ... 32,289.9 12,181.1 ... ... ... ... ... 18,401.2 ... ... ... ... ... ... 7,889.3
1996 1) 83,894.8 23,814.7 7,910.1 1,240.8 4,399.2 1,917.6 1,128.0 2,086.6 5,132.4 35,391.0 12,675.9 3,186.6 4,455.6 1,015.2 4,681.2 9,376.5 24,548.1 4,399.2 3,017.4 5,851.5 1,579.2 3,778.8 5,922.0 141.0 1997 91,062.3 25,760.3 8,494.2 1,358.5 4,647.5 2,002.0 1,358.5 2,002.0 5,897.6 38,959.8 14,193.0 3,003.0 4,676.1 1,701.7 4,847.7 10,538.3 26,228.7 4,733.3 5,148.0 6,191.9 815.1 4,018.3 5,322.1 113.5 1998 90,890.3 29,344.9 10,075.8 2,382.0 4,755.6 1,869.2 1,363.6 2,687.1 6,211.6 36,830.0 10,897.5 3,501.8 4,832.8 1,776.3 4,796.2 11,025.3 24,641.5 4,715.9 3,238.8 4,484.8 1,566.0 5,351.7 5,284.4 73.8 1999 97,497.0 30,982.1 11,386.0 1,623.1 4,928.9 2,445.1 1,548.5 2,831.1 6,219.4 42,425.1 15,701.7 2,617.4 5,168.3 1,127.8 5,418.0 12,391.9 24,010.3 5,023.0 1,950.7 4,047.8 1,842.2 5,112.6 6,034.0 79.4 2000 106,113.3 29,798.6 10,002.9 1,795.7 6,175.5 2,698.3 2,326.4 2,083.8 4,716.0 52,377.1 21,917.4 3,315.5 5,195.7 1,430.8 7,982.4 12,535.2 23,829.2 5,231.9 1,611.3 4,276.2 978.9 5,631.2 6,099.6 108.4 2001 109,251.0 30,911.3 11,010.6 2,564.4 5,801.0 2,452.7 1,499.7 2,291.8 5,291.1 56,240.6 24,579.9 3,190.8 5,822.8 1,735.2 8,243.3 12,668.6 21,555.9 4,549.9 1,726.4 2,693.5 391.8 5,746.3 6,448.0 543.1 2002 109,865.3 30,648.7 10,661.2 2,211.4 5,921.1 3,120.3 1,706.4 2,302.7 4,725.6 56,807.5 24,523.0 3,365.1 5,764.9 1,855.3 7,245.0 14,054.2 22,247.9 5,288.0 1,813.5 3,632.6 367.8 6,134.6 5,011.4 161.2 2003 111,692.7 29,197.6 9,790.8 2,345.8 7,597.0 2,247.2 1,565.1 2,208.7 3,442.9 59,695.0 28,769.1 4,140.7 4,940.7 1,308.3 6,453.2 14,082.9 22,663.7 4,956.9 1,445.9 4,543.7 564.9 6,154.7 4,997.7 136.5 2004 129,267.9 30,905.6 10,355.0 2,243.5 8,001.4 1,494.2 1,728.8 2,785.3 4,297.4 67,567.8 33,897.2 4,010.3 5,247.3 1,623.3 6,836.5 15,953.1 27,109.3 5,885.2 4,021.2 3,441.5 640.9 7,489.8 5,630.6 3,685.1
20001st Qtr. 26,223.1 6,591.9 2,510.3 361.2 1,282.3 505.7 270.9 487.6 1,173.9 13,147.7 4,858.1 704.3 1,426.7 198.7 2,456.2 3,503.6 6,465.5 1,571.2 379.3 1,137.8 289.0 1,408.7 1,679.6 18.1 2nd Qtr. 25,323.1 6,507.0 2,313.6 397.7 1,446.0 650.7 433.8 506.1 759.2 12,995.9 5,332.1 885.7 1,337.6 289.2 1,916.0 3,235.4 5,729.8 994.1 235.0 1,247.2 180.8 1,482.2 1,590.6 90.4 3rd Qtr. 25,520.9 6,889.8 2,128.2 342.7 1,839.7 847.7 324.6 468.9 937.9 12,733.4 5,753.5 775.5 1,280.6 541.1 1,947.9 2,434.9 5,897.8 1,460.9 595.2 667.3 180.4 1,406.8 1,587.2 - 4th Qtr. 29,046.1 9,809.9 3,050.8 694.2 1,607.6 694.2 1,297.0 621.1 1,845.1 13,500.1 5,973.6 949.9 1,150.9 401.9 1,662.4 3,361.3 5,736.2 1,205.7 401.9 1,224.0 328.8 1,333.6 1,242.2 -
20011st Qtr. 27,914.9 7,249.4 2,399.8 709.5 1,415.3 523.8 338.0 542.4 1,320.6 14,320.6 7,123.1 622.2 1,634.5 278.6 1,950.3 2,711.8 6,318.9 1,489.6 430.9 728.1 189.5 1,396.8 2,084.0 26.0 2nd Qtr. 25,885.8 6,959.1 2,560.2 481.1 1,376.1 574.3 257.3 537.0 1,172.9 13,940.5 5,845.8 923.0 1,480.6 343.1 1,872.2 3,475.8 4,937.7 1,133.7 481.1 704.9 89.5 1,320.2 1,208.3 48.5 3rd Qtr. 27,416.6 7,782.1 2,820.7 642.6 1,526.2 663.1 354.9 672.5 1,102.1 13,989.5 6,155.1 849.9 1,561.6 431.5 1,655.0 3,336.2 5,533.0 941.5 549.2 616.4 56.0 1,464.5 1,905.4 112.1 4th Qtr. 28,033.7 8,920.7 3,230.0 731.2 1,483.3 691.5 549.4 539.9 1,695.5 13,990.1 5,455.9 795.6 1,146.1 682.0 2,765.8 3,144.7 4,766.3 985.1 265.2 644.1 56.8 1,564.8 1,250.3 356.5
20021st Qtr. 26,308.2 7,022.5 2,679.1 479.6 1,232.9 749.6 307.2 608.1 966.0 12,875.3 5,649.5 565.8 1,363.6 340.8 1,390.3 3,565.3 6,389.2 1,584.9 634.0 1,190.9 72.4 1,338.1 1,568.9 21.1 2nd Qtr. 28,945.8 7,473.0 2,559.4 510.2 1,663.0 654.6 427.9 651.5 1,006.6 15,914.2 6,029.3 782.2 1,594.5 477.7 3,255.7 3,775.0 5,522.1 1,040.2 434.6 1,153.9 125.8 1,519.6 1,248.1 36.4 3rd Qtr. 26,157.9 7,410.1 2,574.3 565.9 1,472.2 901.2 370.6 601.8 924.0 13,529.3 5,654.4 773.6 1,480.2 645.9 1,415.7 3,559.5 5,181.0 1,284.6 275.0 646.3 102.8 1,751.3 1,121.0 37.5 4th Qtr. 28,453.4 8,743.0 2,848.4 655.8 1,553.0 815.0 600.7 441.3 1,828.9 14,488.6 7,189.8 1,243.5 1,326.7 390.9 1,183.2 3,154.5 5,155.6 1,378.3 470.0 641.6 66.8 1,525.6 1,073.4 66.1
20031st Qtr. 27,215.6 5,707.1 2,018.8 427.1 1,533.5 427.1 271.8 446.5 582.4 15,141.4 7,726.0 1,300.6 1,261.8 310.6 1,358.8 3,183.6 6,308.9 1,611.2 310.6 1,553.0 252.4 1,281.2 1,300.6 58.2 2nd Qtr. 28,296.7 7,181.3 2,511.9 611.4 1,643.4 642.6 370.0 603.6 798.4 14,319.7 6,270.0 642.6 1,382.5 370.0 1,402.0 4,252.7 6,776.3 1,363.0 331.0 1,655.1 136.3 1,674.6 1,616.2 19.5 3rd Qtr. 26,833.8 8,384.6 2,592.2 635.4 2,740.3 584.7 389.8 526.2 916.0 13,732.7 6,295.3 1,130.4 1,130.4 331.3 1,637.2 3,208.1 4,677.6 955.0 428.8 584.7 116.9 1,598.2 994.0 39.0 4th Qtr. 29,346.6 7,924.6 2,667.9 671.9 1,679.8 592.9 533.6 632.4 1,146.2 16,501.3 8,477.9 1,067.1 1,166.0 296.4 2,055.2 3,438.6 4,901.0 1,027.6 375.5 751.0 59.3 1,600.7 1,086.9 19.8
2004*1st Qtr. 31,371.6 6,570.1 2,210.3 374.1 1,385.4 359.6 308.9 669.5 1,262.2 15,961.7 8,137.4 1,012.9 1,252.1 310.1 1,902.2 3,347.0 7,846.0 1,107.8 2,815.9 904.3 92.9 1,516.4 1,408.9 993.8 2nd Qtr. 28,967.2 6,889.7 2,387.3 492.3 1,760.9 265.8 481.3 816.1 686.0 15,822.3 7,925.3 925.9 1,252.7 499.8 1,564.0 3,654.6 5,122.4 893.7 361.8 876.6 95.6 1,680.3 1,214.4 1,132.8 3rd Qtr. 34,010.7 8,838.5 2,711.3 757.7 2,946.4 429.4 463.4 548.2 982.1 17,709.6 8,719.9 1,090.0 1,494.1 439.0 1,581.0 4,385.5 6,822.0 1,602.4 360.3 937.1 207.3 2,089.3 1,625.6 640.6 4th Qtr. 34,918.4 8,607.4 3,046.1 619.4 1,908.7 439.5 475.1 751.5 1,367.1 18,074.2 9,114.5 981.5 1,248.4 374.3 1,789.3 4,566.1 7,318.8 2,281.2 483.3 723.6 245.1 2,203.9 1,381.7 918.0
2005*1st Qtr. 33,833.3 8,008.7 3,416.5 713.4 1,838.9 271.3 281.4 582.8 904.4 18,006.9 8,561.3 1,205.8 1,205.8 401.9 1,286.2 5,345.8 6,913.4 1,748.4 643.1 1,004.9 241.2 1,688.1 1,587.7 904.4
Sources: Bureau of Statistics and Customs and Excise department.1) The values of imports from 1996 were based on classifications from the ASYCUDA reports.
Table 8.1(1)
OtherChemicals TextilesOther
Parts & Accessories
Foods for Industry
Fuels & LubricantsOther
TotalMisc.
OtherBuildingMiningTransportIndustrialAgri.TotalPeriod Total
TotalOther
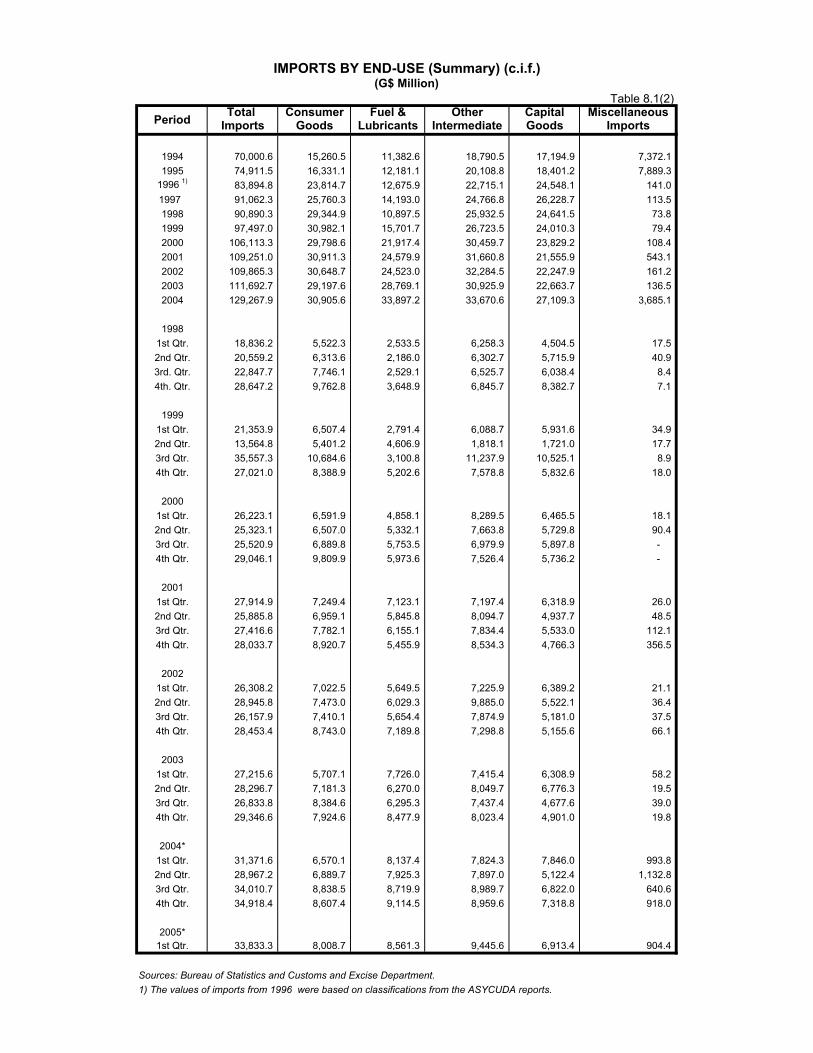
IMPORTS BY END-USE (Summary) (c.i.f.)(G$ Million)
Total Consumer Fuel & Other Capital MiscellaneousImports Goods Lubricants Intermediate Goods Imports
1994 70,000.6 15,260.5 11,382.6 18,790.5 17,194.9 7,372.1 1995 74,911.5 16,331.1 12,181.1 20,108.8 18,401.2 7,889.3
1996 1) 83,894.8 23,814.7 12,675.9 22,715.1 24,548.1 141.0 1997 91,062.3 25,760.3 14,193.0 24,766.8 26,228.7 113.5 1998 90,890.3 29,344.9 10,897.5 25,932.5 24,641.5 73.8 1999 97,497.0 30,982.1 15,701.7 26,723.5 24,010.3 79.4 2000 106,113.3 29,798.6 21,917.4 30,459.7 23,829.2 108.4 2001 109,251.0 30,911.3 24,579.9 31,660.8 21,555.9 543.1 2002 109,865.3 30,648.7 24,523.0 32,284.5 22,247.9 161.2 2003 111,692.7 29,197.6 28,769.1 30,925.9 22,663.7 136.5 2004 129,267.9 30,905.6 33,897.2 33,670.6 27,109.3 3,685.1
19981st Qtr. 18,836.2 5,522.3 2,533.5 6,258.3 4,504.5 17.5 2nd Qtr. 20,559.2 6,313.6 2,186.0 6,302.7 5,715.9 40.9 3rd. Qtr. 22,847.7 7,746.1 2,529.1 6,525.7 6,038.4 8.4 4th. Qtr. 28,647.2 9,762.8 3,648.9 6,845.7 8,382.7 7.1
19991st Qtr. 21,353.9 6,507.4 2,791.4 6,088.7 5,931.6 34.9 2nd Qtr. 13,564.8 5,401.2 4,606.9 1,818.1 1,721.0 17.7 3rd Qtr. 35,557.3 10,684.6 3,100.8 11,237.9 10,525.1 8.9 4th Qtr. 27,021.0 8,388.9 5,202.6 7,578.8 5,832.6 18.0
20001st Qtr. 26,223.1 6,591.9 4,858.1 8,289.5 6,465.5 18.1 2nd Qtr. 25,323.1 6,507.0 5,332.1 7,663.8 5,729.8 90.4 3rd Qtr. 25,520.9 6,889.8 5,753.5 6,979.9 5,897.8 - 4th Qtr. 29,046.1 9,809.9 5,973.6 7,526.4 5,736.2 -
20011st Qtr. 27,914.9 7,249.4 7,123.1 7,197.4 6,318.9 26.0 2nd Qtr. 25,885.8 6,959.1 5,845.8 8,094.7 4,937.7 48.5 3rd Qtr. 27,416.6 7,782.1 6,155.1 7,834.4 5,533.0 112.1 4th Qtr. 28,033.7 8,920.7 5,455.9 8,534.3 4,766.3 356.5
20021st Qtr. 26,308.2 7,022.5 5,649.5 7,225.9 6,389.2 21.1 2nd Qtr. 28,945.8 7,473.0 6,029.3 9,885.0 5,522.1 36.4 3rd Qtr. 26,157.9 7,410.1 5,654.4 7,874.9 5,181.0 37.5 4th Qtr. 28,453.4 8,743.0 7,189.8 7,298.8 5,155.6 66.1
20031st Qtr. 27,215.6 5,707.1 7,726.0 7,415.4 6,308.9 58.2 2nd Qtr. 28,296.7 7,181.3 6,270.0 8,049.7 6,776.3 19.5 3rd Qtr. 26,833.8 8,384.6 6,295.3 7,437.4 4,677.6 39.0 4th Qtr. 29,346.6 7,924.6 8,477.9 8,023.4 4,901.0 19.8
2004*1st Qtr. 31,371.6 6,570.1 8,137.4 7,824.3 7,846.0 993.8 2nd Qtr. 28,967.2 6,889.7 7,925.3 7,897.0 5,122.4 1,132.8 3rd Qtr. 34,010.7 8,838.5 8,719.9 8,989.7 6,822.0 640.6 4th Qtr. 34,918.4 8,607.4 9,114.5 8,959.6 7,318.8 918.0
2005*1st Qtr. 33,833.3 8,008.7 8,561.3 9,445.6 6,913.4 904.4
Sources: Bureau of Statistics and Customs and Excise Department.1) The values of imports from 1996 were based on classifications from the ASYCUDA reports.
Table 8.1(2)
Period
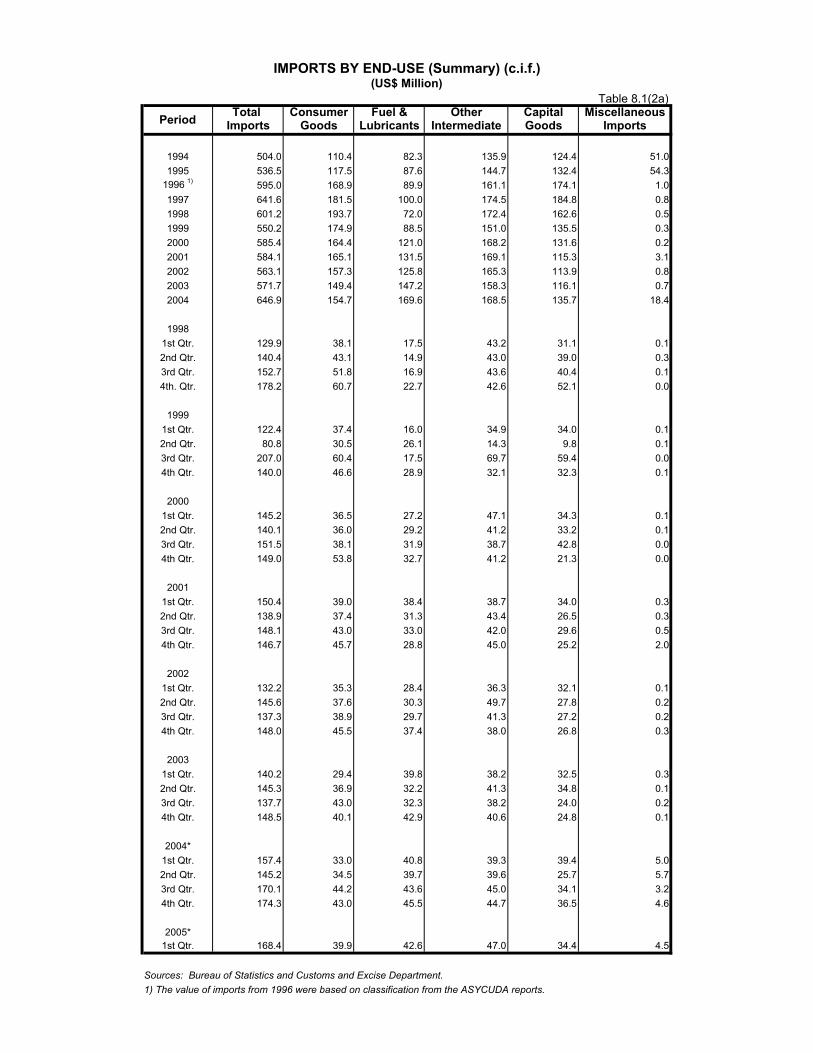
IMPORTS BY END-USE (Summary) (c.i.f.)(US$ Million)
Total Consumer Fuel & Other Capital MiscellaneousImports Goods Lubricants Intermediate Goods Imports
1994 504.0 110.4 82.3 135.9 124.4 51.01995 536.5 117.5 87.6 144.7 132.4 54.3
1996 1) 595.0 168.9 89.9 161.1 174.1 1.01997 641.6 181.5 100.0 174.5 184.8 0.81998 601.2 193.7 72.0 172.4 162.6 0.51999 550.2 174.9 88.5 151.0 135.5 0.32000 585.4 164.4 121.0 168.2 131.6 0.22001 584.1 165.1 131.5 169.1 115.3 3.12002 563.1 157.3 125.8 165.3 113.9 0.82003 571.7 149.4 147.2 158.3 116.1 0.72004 646.9 154.7 169.6 168.5 135.7 18.4
19981st Qtr. 129.9 38.1 17.5 43.2 31.1 0.12nd Qtr. 140.4 43.1 14.9 43.0 39.0 0.33rd Qtr. 152.7 51.8 16.9 43.6 40.4 0.14th. Qtr. 178.2 60.7 22.7 42.6 52.1 0.0
19991st Qtr. 122.4 37.4 16.0 34.9 34.0 0.12nd Qtr. 80.8 30.5 26.1 14.3 9.8 0.13rd Qtr. 207.0 60.4 17.5 69.7 59.4 0.04th Qtr. 140.0 46.6 28.9 32.1 32.3 0.1
20001st Qtr. 145.2 36.5 27.2 47.1 34.3 0.12nd Qtr. 140.1 36.0 29.2 41.2 33.2 0.13rd Qtr. 151.5 38.1 31.9 38.7 42.8 0.04th Qtr. 149.0 53.8 32.7 41.2 21.3 0.0
20011st Qtr. 150.4 39.0 38.4 38.7 34.0 0.32nd Qtr. 138.9 37.4 31.3 43.4 26.5 0.33rd Qtr. 148.1 43.0 33.0 42.0 29.6 0.54th Qtr. 146.7 45.7 28.8 45.0 25.2 2.0
20021st Qtr. 132.2 35.3 28.4 36.3 32.1 0.12nd Qtr. 145.6 37.6 30.3 49.7 27.8 0.23rd Qtr. 137.3 38.9 29.7 41.3 27.2 0.24th Qtr. 148.0 45.5 37.4 38.0 26.8 0.3
20031st Qtr. 140.2 29.4 39.8 38.2 32.5 0.32nd Qtr. 145.3 36.9 32.2 41.3 34.8 0.13rd Qtr. 137.7 43.0 32.3 38.2 24.0 0.24th Qtr. 148.5 40.1 42.9 40.6 24.8 0.1
2004*1st Qtr. 157.4 33.0 40.8 39.3 39.4 5.02nd Qtr. 145.2 34.5 39.7 39.6 25.7 5.73rd Qtr. 170.1 44.2 43.6 45.0 34.1 3.24th Qtr. 174.3 43.0 45.5 44.7 36.5 4.6
2005*1st Qtr. 168.4 39.9 42.6 47.0 34.4 4.5
Sources: Bureau of Statistics and Customs and Excise Department.1) The value of imports from 1996 were based on classification from the ASYCUDA reports.
Table 8.1(2a)
Period
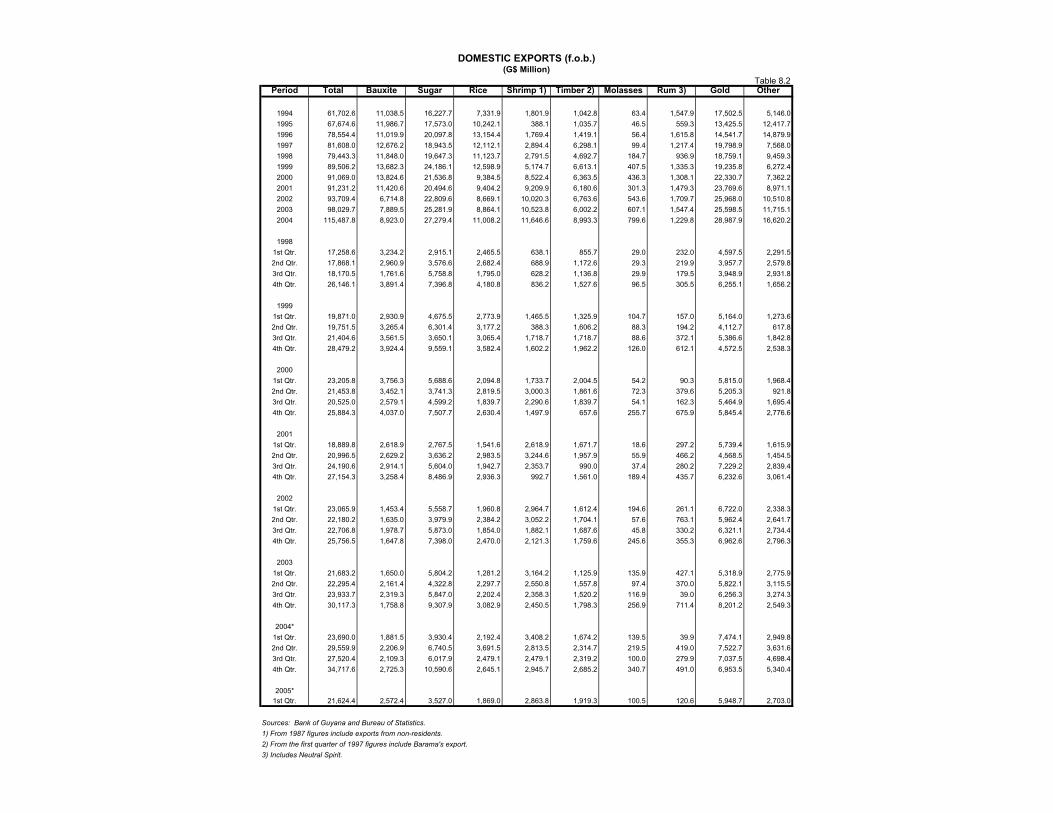
DOMESTIC EXPORTS (f.o.b.)(G$ Million)
Period Total Bauxite Sugar Rice Shrimp 1) Timber 2) Molasses Rum 3) Gold Other
1994 61,702.6 11,038.5 16,227.7 7,331.9 1,801.9 1,042.8 63.4 1,547.9 17,502.5 5,146.01995 67,674.6 11,986.7 17,573.0 10,242.1 388.1 1,035.7 46.5 559.3 13,425.5 12,417.71996 78,554.4 11,019.9 20,097.8 13,154.4 1,769.4 1,419.1 56.4 1,615.8 14,541.7 14,879.91997 81,608.0 12,676.2 18,943.5 12,112.1 2,894.4 6,298.1 99.4 1,217.4 19,798.9 7,568.01998 79,443.3 11,848.0 19,647.3 11,123.7 2,791.5 4,692.7 184.7 936.9 18,759.1 9,459.31999 89,506.2 13,682.3 24,186.1 12,598.9 5,174.7 6,613.1 407.5 1,335.3 19,235.8 6,272.42000 91,069.0 13,824.6 21,536.8 9,384.5 8,522.4 6,363.5 436.3 1,308.1 22,330.7 7,362.22001 91,231.2 11,420.6 20,494.6 9,404.2 9,209.9 6,180.6 301.3 1,479.3 23,769.6 8,971.12002 93,709.4 6,714.8 22,809.6 8,669.1 10,020.3 6,763.6 543.6 1,709.7 25,968.0 10,510.82003 98,029.7 7,889.5 25,281.9 8,864.1 10,523.8 6,002.2 607.1 1,547.4 25,598.5 11,715.12004 115,487.8 8,923.0 27,279.4 11,008.2 11,646.6 8,993.3 799.6 1,229.8 28,987.9 16,620.2
19981st Qtr. 17,258.6 3,234.2 2,915.1 2,465.5 638.1 855.7 29.0 232.0 4,597.5 2,291.52nd Qtr. 17,868.1 2,960.9 3,576.6 2,682.4 688.9 1,172.6 29.3 219.9 3,957.7 2,579.83rd Qtr. 18,170.5 1,761.6 5,758.8 1,795.0 628.2 1,136.8 29.9 179.5 3,948.9 2,931.84th Qtr. 26,146.1 3,891.4 7,396.8 4,180.8 836.2 1,527.6 96.5 305.5 6,255.1 1,656.2
19991st Qtr. 19,871.0 2,930.9 4,675.5 2,773.9 1,465.5 1,325.9 104.7 157.0 5,164.0 1,273.62nd Qtr. 19,751.5 3,265.4 6,301.4 3,177.2 388.3 1,606.2 88.3 194.2 4,112.7 617.83rd Qtr. 21,404.6 3,561.5 3,650.1 3,065.4 1,718.7 1,718.7 88.6 372.1 5,386.6 1,842.84th Qtr. 28,479.2 3,924.4 9,559.1 3,582.4 1,602.2 1,962.2 126.0 612.1 4,572.5 2,538.3
20001st Qtr. 23,205.8 3,756.3 5,688.6 2,094.8 1,733.7 2,004.5 54.2 90.3 5,815.0 1,968.42nd Qtr. 21,453.8 3,452.1 3,741.3 2,819.5 3,000.3 1,861.6 72.3 379.6 5,205.3 921.83rd Qtr. 20,525.0 2,579.1 4,599.2 1,839.7 2,290.6 1,839.7 54.1 162.3 5,464.9 1,695.44th Qtr. 25,884.3 4,037.0 7,507.7 2,630.4 1,497.9 657.6 255.7 675.9 5,845.4 2,776.6
20011st Qtr. 18,889.8 2,618.9 2,767.5 1,541.6 2,618.9 1,671.7 18.6 297.2 5,739.4 1,615.92nd Qtr. 20,996.5 2,629.2 3,636.2 2,983.5 3,244.6 1,957.9 55.9 466.2 4,568.5 1,454.53rd Qtr. 24,190.6 2,914.1 5,604.0 1,942.7 2,353.7 990.0 37.4 280.2 7,229.2 2,839.44th Qtr. 27,154.3 3,258.4 8,486.9 2,936.3 992.7 1,561.0 189.4 435.7 6,232.6 3,061.4
20021st Qtr. 23,065.9 1,453.4 5,558.7 1,960.8 2,964.7 1,612.4 194.6 261.1 6,722.0 2,338.32nd Qtr. 22,180.2 1,635.0 3,979.9 2,384.2 3,052.2 1,704.1 57.6 763.1 5,962.4 2,641.73rd Qtr. 22,706.8 1,978.7 5,873.0 1,854.0 1,882.1 1,687.6 45.8 330.2 6,321.1 2,734.44th Qtr. 25,756.5 1,647.8 7,398.0 2,470.0 2,121.3 1,759.6 245.6 355.3 6,962.6 2,796.3
20031st Qtr. 21,683.2 1,650.0 5,804.2 1,281.2 3,164.2 1,125.9 135.9 427.1 5,318.9 2,775.92nd Qtr. 22,295.4 2,161.4 4,322.8 2,297.7 2,550.8 1,557.8 97.4 370.0 5,822.1 3,115.53rd Qtr. 23,933.7 2,319.3 5,847.0 2,202.4 2,358.3 1,520.2 116.9 39.0 6,256.3 3,274.34th Qtr. 30,117.3 1,758.8 9,307.9 3,082.9 2,450.5 1,798.3 256.9 711.4 8,201.2 2,549.3
2004*1st Qtr. 23,690.0 1,881.5 3,930.4 2,192.4 3,408.2 1,674.2 139.5 39.9 7,474.1 2,949.82nd Qtr. 29,559.9 2,206.9 6,740.5 3,691.5 2,813.5 2,314.7 219.5 419.0 7,522.7 3,631.63rd Qtr. 27,520.4 2,109.3 6,017.9 2,479.1 2,479.1 2,319.2 100.0 279.9 7,037.5 4,698.44th Qtr. 34,717.6 2,725.3 10,590.6 2,645.1 2,945.7 2,685.2 340.7 491.0 6,953.5 5,340.4
2005*1st Qtr. 21,624.4 2,572.4 3,527.0 1,869.0 2,863.8 1,919.3 100.5 120.6 5,948.7 2,703.0
Sources: Bank of Guyana and Bureau of Statistics.1) From 1987 figures include exports from non-residents. 2) From the first quarter of 1997 figures include Barama's export.3) Includes Neutral Spirit.
Table 8.2
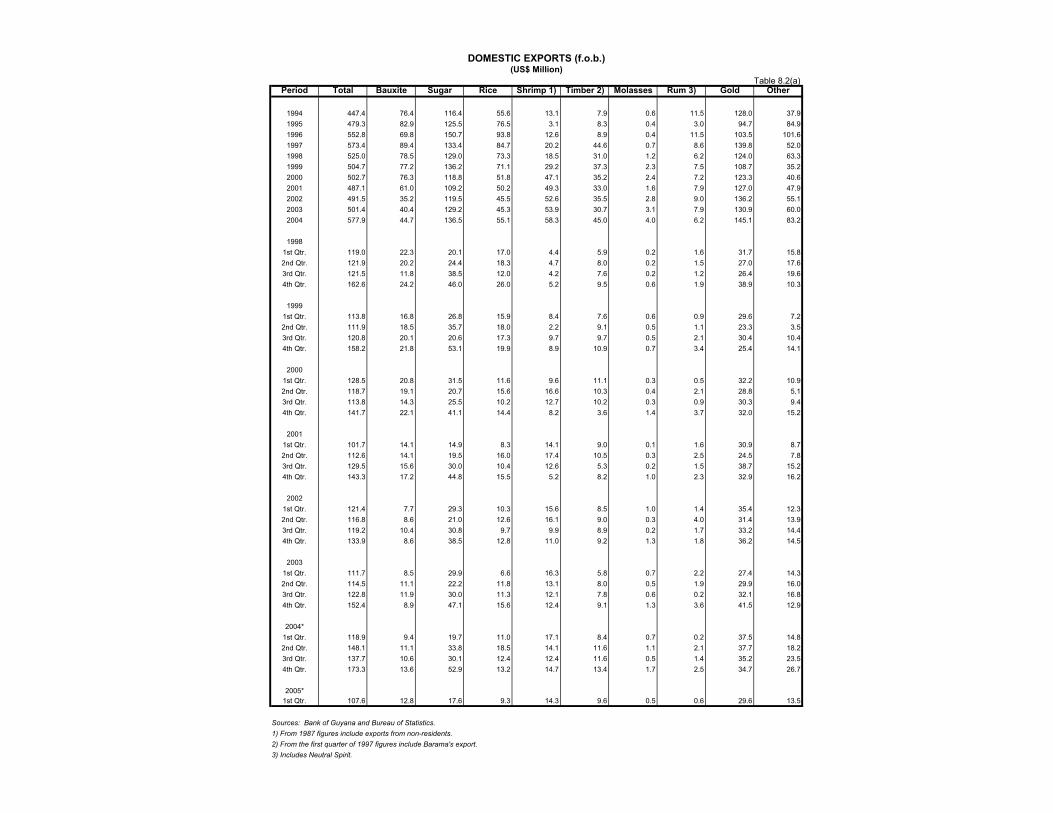
DOMESTIC EXPORTS (f.o.b.)(US$ Million)
Period Total Bauxite Sugar Rice Shrimp 1) Timber 2) Molasses Rum 3) Gold Other
1994 447.4 76.4 116.4 55.6 13.1 7.9 0.6 11.5 128.0 37.91995 479.3 82.9 125.5 76.5 3.1 8.3 0.4 3.0 94.7 84.91996 552.8 69.8 150.7 93.8 12.6 8.9 0.4 11.5 103.5 101.61997 573.4 89.4 133.4 84.7 20.2 44.6 0.7 8.6 139.8 52.01998 525.0 78.5 129.0 73.3 18.5 31.0 1.2 6.2 124.0 63.31999 504.7 77.2 136.2 71.1 29.2 37.3 2.3 7.5 108.7 35.22000 502.7 76.3 118.8 51.8 47.1 35.2 2.4 7.2 123.3 40.62001 487.1 61.0 109.2 50.2 49.3 33.0 1.6 7.9 127.0 47.92002 491.5 35.2 119.5 45.5 52.6 35.5 2.8 9.0 136.2 55.12003 501.4 40.4 129.2 45.3 53.9 30.7 3.1 7.9 130.9 60.02004 577.9 44.7 136.5 55.1 58.3 45.0 4.0 6.2 145.1 83.2
19981st Qtr. 119.0 22.3 20.1 17.0 4.4 5.9 0.2 1.6 31.7 15.82nd Qtr. 121.9 20.2 24.4 18.3 4.7 8.0 0.2 1.5 27.0 17.63rd Qtr. 121.5 11.8 38.5 12.0 4.2 7.6 0.2 1.2 26.4 19.64th Qtr. 162.6 24.2 46.0 26.0 5.2 9.5 0.6 1.9 38.9 10.3
19991st Qtr. 113.8 16.8 26.8 15.9 8.4 7.6 0.6 0.9 29.6 7.22nd Qtr. 111.9 18.5 35.7 18.0 2.2 9.1 0.5 1.1 23.3 3.53rd Qtr. 120.8 20.1 20.6 17.3 9.7 9.7 0.5 2.1 30.4 10.44th Qtr. 158.2 21.8 53.1 19.9 8.9 10.9 0.7 3.4 25.4 14.1
20001st Qtr. 128.5 20.8 31.5 11.6 9.6 11.1 0.3 0.5 32.2 10.92nd Qtr. 118.7 19.1 20.7 15.6 16.6 10.3 0.4 2.1 28.8 5.13rd Qtr. 113.8 14.3 25.5 10.2 12.7 10.2 0.3 0.9 30.3 9.44th Qtr. 141.7 22.1 41.1 14.4 8.2 3.6 1.4 3.7 32.0 15.2
20011st Qtr. 101.7 14.1 14.9 8.3 14.1 9.0 0.1 1.6 30.9 8.72nd Qtr. 112.6 14.1 19.5 16.0 17.4 10.5 0.3 2.5 24.5 7.83rd Qtr. 129.5 15.6 30.0 10.4 12.6 5.3 0.2 1.5 38.7 15.24th Qtr. 143.3 17.2 44.8 15.5 5.2 8.2 1.0 2.3 32.9 16.2
20021st Qtr. 121.4 7.7 29.3 10.3 15.6 8.5 1.0 1.4 35.4 12.32nd Qtr. 116.8 8.6 21.0 12.6 16.1 9.0 0.3 4.0 31.4 13.93rd Qtr. 119.2 10.4 30.8 9.7 9.9 8.9 0.2 1.7 33.2 14.44th Qtr. 133.9 8.6 38.5 12.8 11.0 9.2 1.3 1.8 36.2 14.5
20031st Qtr. 111.7 8.5 29.9 6.6 16.3 5.8 0.7 2.2 27.4 14.32nd Qtr. 114.5 11.1 22.2 11.8 13.1 8.0 0.5 1.9 29.9 16.03rd Qtr. 122.8 11.9 30.0 11.3 12.1 7.8 0.6 0.2 32.1 16.84th Qtr. 152.4 8.9 47.1 15.6 12.4 9.1 1.3 3.6 41.5 12.9
2004*1st Qtr. 118.9 9.4 19.7 11.0 17.1 8.4 0.7 0.2 37.5 14.82nd Qtr. 148.1 11.1 33.8 18.5 14.1 11.6 1.1 2.1 37.7 18.23rd Qtr. 137.7 10.6 30.1 12.4 12.4 11.6 0.5 1.4 35.2 23.54th Qtr. 173.3 13.6 52.9 13.2 14.7 13.4 1.7 2.5 34.7 26.7
2005*1st Qtr. 107.6 12.8 17.6 9.3 14.3 9.6 0.5 0.6 29.6 13.5
Sources: Bank of Guyana and Bureau of Statistics. 1) From 1987 figures include exports from non-residents.2) From the first quarter of 1997 figures include Barama's export.3) Includes Neutral Spirit.
Table 8.2(a)
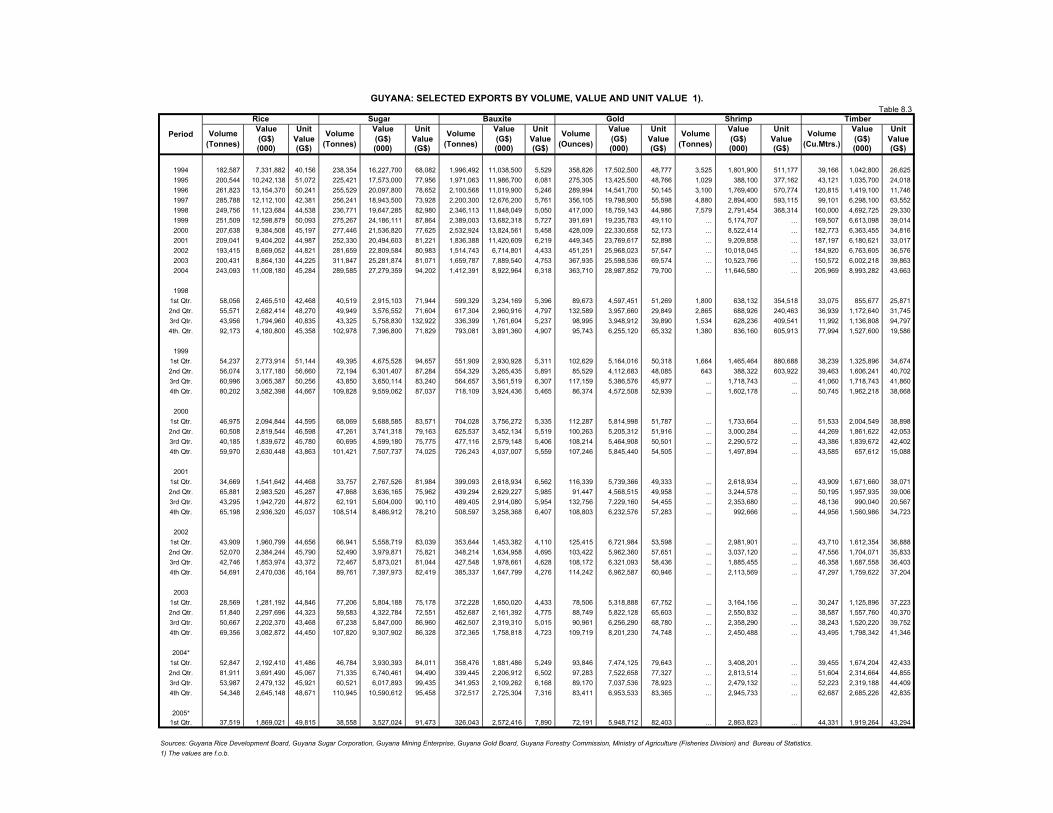
GUYANA: SELECTED EXPORTS BY VOLUME, VALUE AND UNIT VALUE 1).
Rice Sugar Bauxite Gold Shrimp TimberValue Unit Value Unit Value Unit Value Unit Value Unit Value Unit(G$) Value (G$) Value (G$) Value (G$) Value (G$) Value (G$) Value(000) (G$) (000) (G$) (000) (G$) (000) (G$) (000) (G$) (000) (G$)
1994 182,587 7,331,882 40,156 238,354 16,227,700 68,082 1,996,492 11,038,500 5,529 358,826 17,502,500 48,777 3,525 1,801,900 511,177 39,166 1,042,800 26,625 1995 200,544 10,242,138 51,072 225,421 17,573,000 77,956 1,971,063 11,986,700 6,081 275,305 13,425,500 48,766 1,029 388,100 377,162 43,121 1,035,700 24,018 1996 261,823 13,154,370 50,241 255,529 20,097,800 78,652 2,100,568 11,019,900 5,246 289,994 14,541,700 50,145 3,100 1,769,400 570,774 120,815 1,419,100 11,746 1997 285,788 12,112,100 42,381 256,241 18,943,500 73,928 2,200,300 12,676,200 5,761 356,105 19,798,900 55,598 4,880 2,894,400 593,115 99,101 6,298,100 63,552 1998 249,756 11,123,684 44,538 236,771 19,647,285 82,980 2,346,113 11,848,049 5,050 417,000 18,759,143 44,986 7,579 2,791,454 368,314 160,000 4,692,725 29,330 1999 251,509 12,598,879 50,093 275,267 24,186,111 87,864 2,389,003 13,682,318 5,727 391,691 19,235,783 49,110 … 5,174,707 … 169,507 6,613,098 39,014 2000 207,638 9,384,508 45,197 277,446 21,536,820 77,625 2,532,924 13,824,561 5,458 428,009 22,330,658 52,173 … 8,522,414 … 182,773 6,363,455 34,816 2001 209,041 9,404,202 44,987 252,330 20,494,603 81,221 1,836,388 11,420,609 6,219 449,345 23,769,617 52,898 … 9,209,858 … 187,197 6,180,621 33,017 2002 193,415 8,669,052 44,821 281,659 22,809,584 80,983 1,514,743 6,714,801 4,433 451,251 25,968,023 57,547 … 10,018,045 … 184,920 6,763,605 36,576 2003 200,431 8,864,130 44,225 311,847 25,281,874 81,071 1,659,787 7,889,540 4,753 367,935 25,598,536 69,574 … 10,523,766 … 150,572 6,002,218 39,863 2004 243,093 11,008,180 45,284 289,585 27,279,359 94,202 1,412,391 8,922,964 6,318 363,710 28,987,852 79,700 … 11,646,580 … 205,969 8,993,282 43,663
19981st Qtr. 58,056 2,465,510 42,468 40,519 2,915,103 71,944 599,329 3,234,169 5,396 89,673 4,597,451 51,269 1,800 638,132 354,518 33,075 855,677 25,871 2nd Qtr. 55,571 2,682,414 48,270 49,949 3,576,552 71,604 617,304 2,960,916 4,797 132,589 3,957,660 29,849 2,865 688,926 240,463 36,939 1,172,640 31,745 3rd Qtr. 43,956 1,794,960 40,835 43,325 5,758,830 132,922 336,399 1,761,604 5,237 98,995 3,948,912 39,890 1,534 628,236 409,541 11,992 1,136,808 94,797 4th. Qtr. 92,173 4,180,800 45,358 102,978 7,396,800 71,829 793,081 3,891,360 4,907 95,743 6,255,120 65,332 1,380 836,160 605,913 77,994 1,527,600 19,586
19991st Qtr. 54,237 2,773,914 51,144 49,395 4,675,528 94,657 551,909 2,930,928 5,311 102,629 5,164,016 50,318 1,664 1,465,464 880,688 38,239 1,325,896 34,674 2nd Qtr. 56,074 3,177,180 56,660 72,194 6,301,407 87,284 554,329 3,265,435 5,891 85,529 4,112,683 48,085 643 388,322 603,922 39,463 1,606,241 40,702 3rd Qtr. 60,996 3,065,387 50,256 43,850 3,650,114 83,240 564,657 3,561,519 6,307 117,159 5,386,576 45,977 ... 1,718,743 ... 41,060 1,718,743 41,860 4th Qtr. 80,202 3,582,398 44,667 109,828 9,559,062 87,037 718,109 3,924,436 5,465 86,374 4,572,508 52,939 ... 1,602,178 ... 50,745 1,962,218 38,668
20001st Qtr. 46,975 2,094,844 44,595 68,069 5,688,585 83,571 704,028 3,756,272 5,335 112,287 5,814,998 51,787 ... 1,733,664 ... 51,533 2,004,549 38,898 2nd Qtr. 60,508 2,819,544 46,598 47,261 3,741,318 79,163 625,537 3,452,134 5,519 100,263 5,205,312 51,916 ... 3,000,284 ... 44,269 1,861,622 42,053 3rd Qtr. 40,185 1,839,672 45,780 60,695 4,599,180 75,775 477,116 2,579,148 5,406 108,214 5,464,908 50,501 ... 2,290,572 ... 43,386 1,839,672 42,402 4th Qtr. 59,970 2,630,448 43,863 101,421 7,507,737 74,025 726,243 4,037,007 5,559 107,246 5,845,440 54,505 ... 1,497,894 ... 43,585 657,612 15,088
20011st Qtr. 34,669 1,541,642 44,468 33,757 2,767,526 81,984 399,093 2,618,934 6,562 116,339 5,739,366 49,333 ... 2,618,934 ... 43,909 1,671,660 38,071 2nd Qtr. 65,881 2,983,520 45,287 47,868 3,636,165 75,962 439,294 2,629,227 5,985 91,447 4,568,515 49,958 ... 3,244,578 ... 50,195 1,957,935 39,006 3rd Qtr. 43,295 1,942,720 44,872 62,191 5,604,000 90,110 489,405 2,914,080 5,954 132,756 7,229,160 54,455 ... 2,353,680 ... 48,136 990,040 20,567 4th Qtr. 65,198 2,936,320 45,037 108,514 8,486,912 78,210 508,597 3,258,368 6,407 108,803 6,232,576 57,283 ... 992,666 ... 44,956 1,560,986 34,723
20021st Qtr. 43,909 1,960,799 44,656 66,941 5,558,719 83,039 353,644 1,453,382 4,110 125,415 6,721,984 53,598 ... 2,981,901 ... 43,710 1,612,354 36,888 2nd Qtr. 52,070 2,384,244 45,790 52,490 3,979,871 75,821 348,214 1,634,958 4,695 103,422 5,962,360 57,651 ... 3,037,120 ... 47,556 1,704,071 35,833 3rd Qtr. 42,746 1,853,974 43,372 72,467 5,873,021 81,044 427,548 1,978,661 4,628 108,172 6,321,093 58,436 ... 1,885,455 ... 46,358 1,687,558 36,403 4th Qtr. 54,691 2,470,036 45,164 89,761 7,397,973 82,419 385,337 1,647,799 4,276 114,242 6,962,587 60,946 ... 2,113,569 ... 47,297 1,759,622 37,204
20031st Qtr. 28,569 1,281,192 44,846 77,206 5,804,188 75,178 372,228 1,650,020 4,433 78,506 5,318,888 67,752 ... 3,164,156 ... 30,247 1,125,896 37,223 2nd Qtr. 51,840 2,297,696 44,323 59,583 4,322,784 72,551 452,687 2,161,392 4,775 88,749 5,822,128 65,603 ... 2,550,832 ... 38,587 1,557,760 40,370 3rd Qtr. 50,667 2,202,370 43,468 67,238 5,847,000 86,960 462,507 2,319,310 5,015 90,961 6,256,290 68,780 … 2,358,290 … 38,243 1,520,220 39,752 4th Qtr. 69,356 3,082,872 44,450 107,820 9,307,902 86,328 372,365 1,758,818 4,723 109,719 8,201,230 74,748 … 2,450,488 … 43,495 1,798,342 41,346
2004*1st Qtr. 52,847 2,192,410 41,486 46,784 3,930,393 84,011 358,476 1,881,486 5,249 93,846 7,474,125 79,643 … 3,408,201 … 39,455 1,674,204 42,433 2nd Qtr. 81,911 3,691,490 45,067 71,335 6,740,461 94,490 339,445 2,206,912 6,502 97,283 7,522,658 77,327 … 2,813,514 … 51,604 2,314,664 44,855 3rd Qtr. 53,987 2,479,132 45,921 60,521 6,017,893 99,435 341,953 2,109,262 6,168 89,170 7,037,536 78,923 … 2,479,132 … 52,223 2,319,188 44,409 4th Qtr. 54,348 2,645,148 48,671 110,945 10,590,612 95,458 372,517 2,725,304 7,316 83,411 6,953,533 83,365 … 2,945,733 … 62,687 2,685,226 42,835
2005*1st Qtr. 37,519 1,869,021 49,815 38,558 3,527,024 91,473 326,043 2,572,416 7,890 72,191 5,948,712 82,403 … 2,863,823 … 44,331 1,919,264 43,294
Sources: Guyana Rice Development Board, Guyana Sugar Corporation, Guyana Mining Enterprise, Guyana Gold Board, Guyana Forestry Commission, Ministry of Agriculture (Fisheries Division) and Bureau of Statistics.1) The values are f.o.b.
Table 8.3
Volume (Tonnes)
Period Volume (Tonnes)
Volume (Tonnes)
Volume (Ounces)
Volume (Cu.Mtrs.)
Volume (Tonnes)
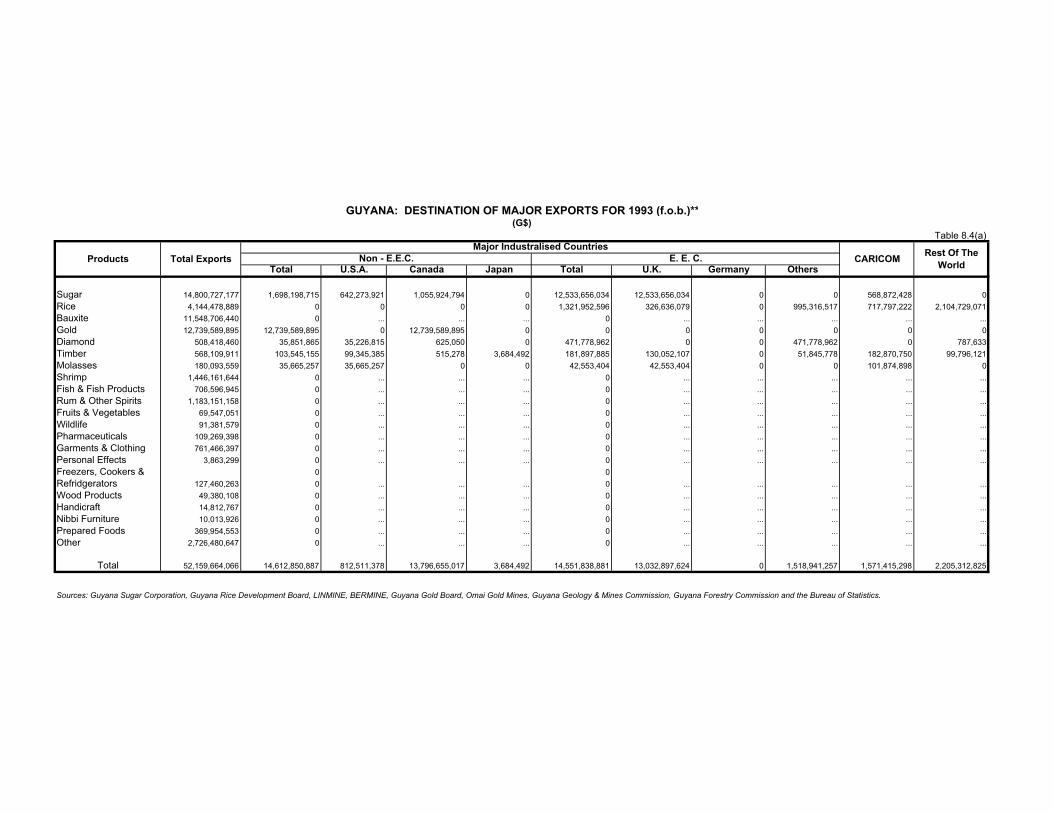
GUYANA: DESTINATION OF MAJOR EXPORTS FOR 1993 (f.o.b.)**(G$)
Major Industralised CountriesNon - E.E.C. E. E. C.
Total U.S.A. Canada Japan Total U.K. Germany Others
Sugar 14,800,727,177 1,698,198,715 642,273,921 1,055,924,794 0 12,533,656,034 12,533,656,034 0 0 568,872,428 0Rice 4,144,478,889 0 0 0 0 1,321,952,596 326,636,079 0 995,316,517 717,797,222 2,104,729,071Bauxite 11,548,706,440 0 ... ... ... 0 ... ... ... ... ...Gold 12,739,589,895 12,739,589,895 0 12,739,589,895 0 0 0 0 0 0 0Diamond 508,418,460 35,851,865 35,226,815 625,050 0 471,778,962 0 0 471,778,962 0 787,633Timber 568,109,911 103,545,155 99,345,385 515,278 3,684,492 181,897,885 130,052,107 0 51,845,778 182,870,750 99,796,121Molasses 180,093,559 35,665,257 35,665,257 0 0 42,553,404 42,553,404 0 0 101,874,898 0Shrimp 1,446,161,644 0 ... ... ... 0 ... ... ... ... ...Fish & Fish Products 706,596,945 0 ... ... ... 0 ... ... ... ... ...Rum & Other Spirits 1,183,151,158 0 ... ... ... 0 ... ... ... ... ...Fruits & Vegetables 69,547,051 0 ... ... ... 0 ... ... ... ... ...Wildlife 91,381,579 0 ... ... ... 0 ... ... ... ... ...Pharmaceuticals 109,269,398 0 ... ... ... 0 ... ... ... ... ...Garments & Clothing 761,466,397 0 ... ... ... 0 ... ... ... ... ...Personal Effects 3,863,299 0 ... ... ... 0 ... ... ... ... ...Freezers, Cookers & 0 0Refridgerators 127,460,263 0 ... ... ... 0 ... ... ... ... ...Wood Products 49,380,108 0 ... ... ... 0 ... ... ... ... ...Handicraft 14,812,767 0 ... ... ... 0 ... ... ... ... ...Nibbi Furniture 10,013,926 0 ... ... ... 0 ... ... ... ... ...Prepared Foods 369,954,553 0 ... ... ... 0 ... ... ... ... ...Other 2,726,480,647 0 ... ... ... 0 ... ... ... ... ...
Total 52,159,664,066 14,612,850,887 812,511,378 13,796,655,017 3,684,492 14,551,838,881 13,032,897,624 0 1,518,941,257 1,571,415,298 2,205,312,825
Table 8.4(a)
Sources: Guyana Sugar Corporation, Guyana Rice Development Board, LINMINE, BERMINE, Guyana Gold Board, Omai Gold Mines, Guyana Geology & Mines Commission, Guyana Forestry Commission and the Bureau of Statistics.
Products Total Exports CARICOM Rest Of The World
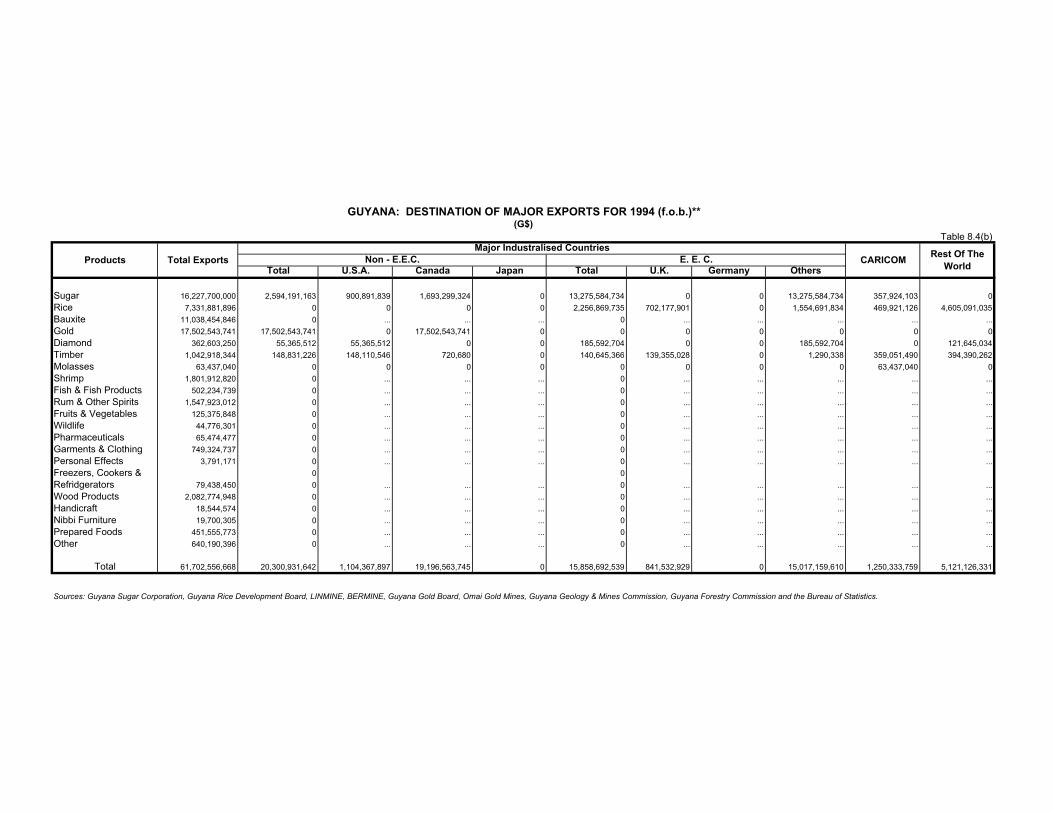
GUYANA: DESTINATION OF MAJOR EXPORTS FOR 1994 (f.o.b.)**(G$)
Major Industralised CountriesNon - E.E.C. E. E. C.
Total U.S.A. Canada Japan Total U.K. Germany Others
Sugar 16,227,700,000 2,594,191,163 900,891,839 1,693,299,324 0 13,275,584,734 0 0 13,275,584,734 357,924,103 0Rice 7,331,881,896 0 0 0 0 2,256,869,735 702,177,901 0 1,554,691,834 469,921,126 4,605,091,035Bauxite 11,038,454,846 0 ... ... ... 0 ... ... ... ... ...Gold 17,502,543,741 17,502,543,741 0 17,502,543,741 0 0 0 0 0 0 0Diamond 362,603,250 55,365,512 55,365,512 0 0 185,592,704 0 0 185,592,704 0 121,645,034Timber 1,042,918,344 148,831,226 148,110,546 720,680 0 140,645,366 139,355,028 0 1,290,338 359,051,490 394,390,262Molasses 63,437,040 0 0 0 0 0 0 0 0 63,437,040 0Shrimp 1,801,912,820 0 ... ... ... 0 ... ... ... ... ...Fish & Fish Products 502,234,739 0 ... ... ... 0 ... ... ... ... ...Rum & Other Spirits 1,547,923,012 0 ... ... ... 0 ... ... ... ... ...Fruits & Vegetables 125,375,848 0 ... ... ... 0 ... ... ... ... ...Wildlife 44,776,301 0 ... ... ... 0 ... ... ... ... ...Pharmaceuticals 65,474,477 0 ... ... ... 0 ... ... ... ... ...Garments & Clothing 749,324,737 0 ... ... ... 0 ... ... ... ... ...Personal Effects 3,791,171 0 ... ... ... 0 ... ... ... ... ...Freezers, Cookers & 0 0Refridgerators 79,438,450 0 ... ... ... 0 ... ... ... ... ...Wood Products 2,082,774,948 0 ... ... ... 0 ... ... ... ... ...Handicraft 18,544,574 0 ... ... ... 0 ... ... ... ... ...Nibbi Furniture 19,700,305 0 ... ... ... 0 ... ... ... ... ...Prepared Foods 451,555,773 0 ... ... ... 0 ... ... ... ... ...Other 640,190,396 0 ... ... ... 0 ... ... ... ... ...
Total 61,702,556,668 20,300,931,642 1,104,367,897 19,196,563,745 0 15,858,692,539 841,532,929 0 15,017,159,610 1,250,333,759 5,121,126,331
Sources: Guyana Sugar Corporation, Guyana Rice Development Board, LINMINE, BERMINE, Guyana Gold Board, Omai Gold Mines, Guyana Geology & Mines Commission, Guyana Forestry Commission and the Bureau of Statistics.
Table 8.4(b)
Products Total Exports CARICOM Rest Of The World

GUYANA: DESTINATION OF MAJOR EXPORTS FOR 1995 (f.o.b.)**(G$)
MAJOR INDUSTRALISED COUNTRIESNon - E.E.C. E.E.C.
Total U.S.A. Canada SPA Total U.K. Germany Others
Sugar 17,573,000,000 2,358,113,432 345,626,816 ... 2,012,486,615 13,135,301,508 ... ... 13,135,301,508 868,364,781 1,211,220,278Rice 10,242,138,000 0 ... ... ... 0 ... ... ... 1,243,915,426 8,998,222,574Bauxite 11,986,700,000 0 ... ... ... 0 ... ... ... ... ...Gold 13,425,500,991 9,699,849,168 ... 9,699,849,168 ... 364,560,000 ... ... 364,560,000 ... 3,725,651,823Diamond 434,000,000 0 ... ... ... 0 ... ... ... 608,020,000 69,440,000Timber 1,035,700,000 0 ... ... ... 0 ... ... ... ... 805,980,000Molasses 46,500,000 0 ... ... ... 0 ... ... ... ... ...Shrimp 388,100,000 0 ... ... ... 0 ... ... ... ... ...Fish & Fish Products 927,898,000 0 ... ... ... 0 ... ... ... ... ...Rum & Other Spirits 473,381,000 0 ... ... ... 0 ... ... ... ... ...Fruits & Vegetables 124,959,000 0 ... ... ... 0 ... ... ... ... ...Wildlife 49,983,600 0 ... ... ... 0 ... ... ... ... ...Pharmaceuticals 192,399,600 0 ... ... ... 0 ... ... ... ... ...Garments & Clothing 0 ... ... ... 0 ... ... ... ... ...Personal Effects 2,277,000 0 ... ... ... 0 ... ... ... ... ...Freezers, Cookers & 0 0Refridgerators 79,267,200 0 ... ... ... 0 ... ... ... ... ...Wood Products 219,627,000 0 ... ... ... 0 ... ... ... ... ...Handicraft 16,863,600 0 ... ... ... 0 ... ... ... ... ...Nibbi Furniture 15,483,000 0 ... ... ... 0 ... ... ... ... ...Prepared Foods 475,341,000 0 ... ... ... 0 ... ... ... ... ...Other 9,965,481,009 0 ... ... ... 0 ... ... ... ... ...
Total 67,674,600,000 12,057,962,600 345,626,816 9,699,849,168 2,012,486,615 13,499,861,508 0 0 13,499,861,508 2,720,300,207 14,810,514,675
Sources: Guyana Sugar Corporation, Guyana Rice Development Board, LINMINE, BERMINE, Guyana Gold Board, Omai Gold Mines, Guyana Geology & Mines Commission, Guyana Forestry Commission and the Bureau of Statistics.
Table 8.4(c)
Products Total Exports CARICOM Rest Of The World
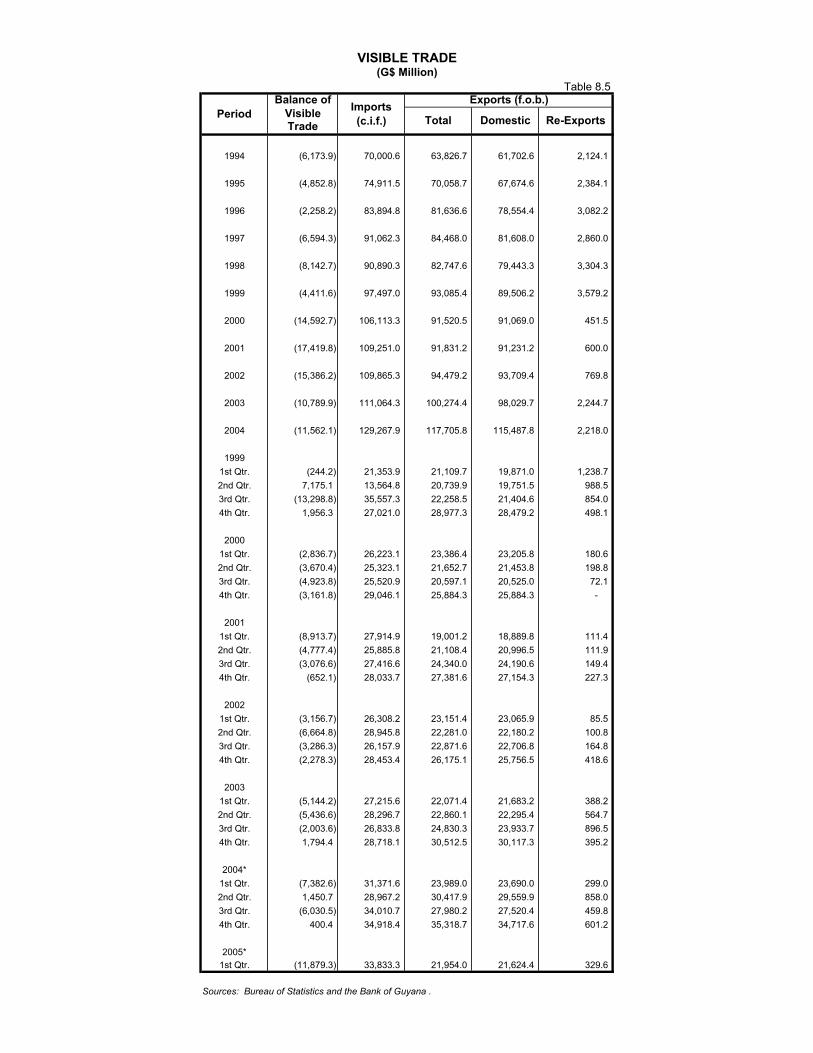
VISIBLE TRADE(G$ Million)
Balance of Exports (f.o.b.)VisibleTrade
1994 (6,173.9) 70,000.6 63,826.7 61,702.6 2,124.1
1995 (4,852.8) 74,911.5 70,058.7 67,674.6 2,384.1
1996 (2,258.2) 83,894.8 81,636.6 78,554.4 3,082.2
1997 (6,594.3) 91,062.3 84,468.0 81,608.0 2,860.0
1998 (8,142.7) 90,890.3 82,747.6 79,443.3 3,304.3
1999 (4,411.6) 97,497.0 93,085.4 89,506.2 3,579.2
2000 (14,592.7) 106,113.3 91,520.5 91,069.0 451.5
2001 (17,419.8) 109,251.0 91,831.2 91,231.2 600.0
2002 (15,386.2) 109,865.3 94,479.2 93,709.4 769.8
2003 (10,789.9) 111,064.3 100,274.4 98,029.7 2,244.7
2004 (11,562.1) 129,267.9 117,705.8 115,487.8 2,218.0
19991st Qtr. (244.2) 21,353.9 21,109.7 19,871.0 1,238.7 2nd Qtr. 7,175.1 13,564.8 20,739.9 19,751.5 988.5 3rd Qtr. (13,298.8) 35,557.3 22,258.5 21,404.6 854.0 4th Qtr. 1,956.3 27,021.0 28,977.3 28,479.2 498.1
20001st Qtr. (2,836.7) 26,223.1 23,386.4 23,205.8 180.6 2nd Qtr. (3,670.4) 25,323.1 21,652.7 21,453.8 198.8 3rd Qtr. (4,923.8) 25,520.9 20,597.1 20,525.0 72.1 4th Qtr. (3,161.8) 29,046.1 25,884.3 25,884.3 -
20011st Qtr. (8,913.7) 27,914.9 19,001.2 18,889.8 111.4 2nd Qtr. (4,777.4) 25,885.8 21,108.4 20,996.5 111.9 3rd Qtr. (3,076.6) 27,416.6 24,340.0 24,190.6 149.4 4th Qtr. (652.1) 28,033.7 27,381.6 27,154.3 227.3
20021st Qtr. (3,156.7) 26,308.2 23,151.4 23,065.9 85.5 2nd Qtr. (6,664.8) 28,945.8 22,281.0 22,180.2 100.8 3rd Qtr. (3,286.3) 26,157.9 22,871.6 22,706.8 164.8 4th Qtr. (2,278.3) 28,453.4 26,175.1 25,756.5 418.6
20031st Qtr. (5,144.2) 27,215.6 22,071.4 21,683.2 388.2 2nd Qtr. (5,436.6) 28,296.7 22,860.1 22,295.4 564.7 3rd Qtr. (2,003.6) 26,833.8 24,830.3 23,933.7 896.5 4th Qtr. 1,794.4 28,718.1 30,512.5 30,117.3 395.2
2004*1st Qtr. (7,382.6) 31,371.6 23,989.0 23,690.0 299.0 2nd Qtr. 1,450.7 28,967.2 30,417.9 29,559.9 858.0 3rd Qtr. (6,030.5) 34,010.7 27,980.2 27,520.4 459.8 4th Qtr. 400.4 34,918.4 35,318.7 34,717.6 601.2
2005*1st Qtr. (11,879.3) 33,833.3 21,954.0 21,624.4 329.6
Sources: Bureau of Statistics and the Bank of Guyana .
Table 8.5
Period Imports (c.i.f.) Total Domestic Re-Exports
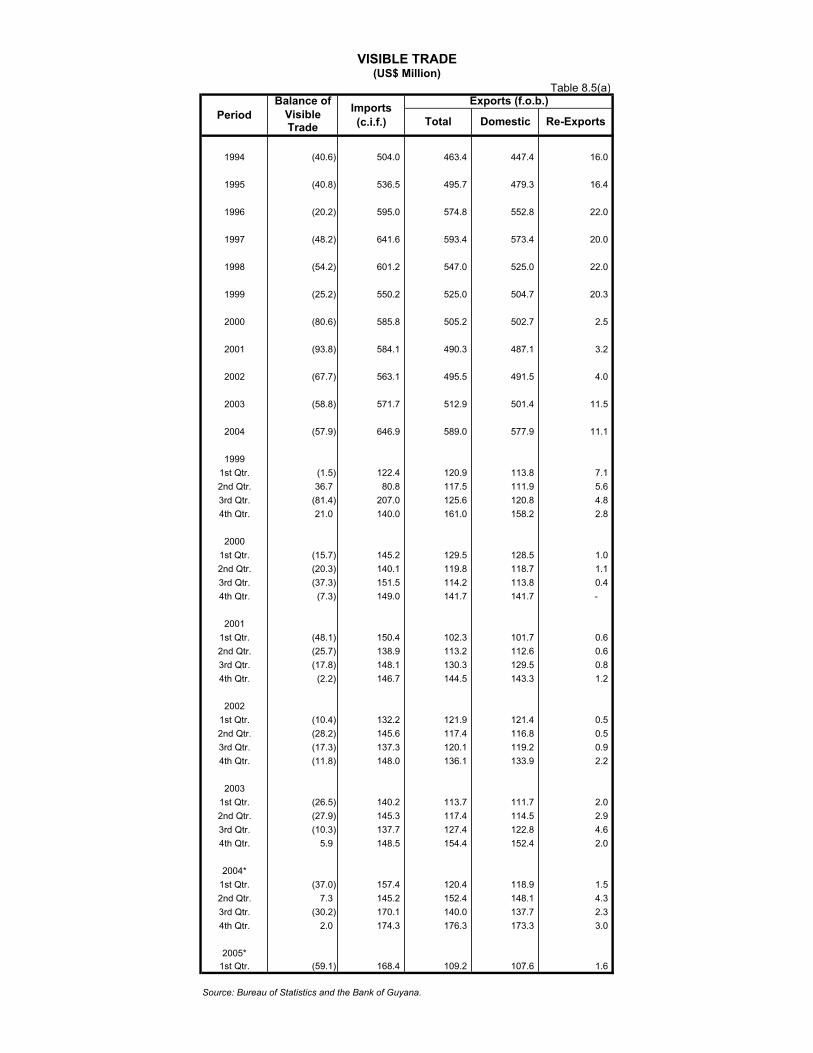
VISIBLE TRADE(US$ Million)
Balance of Exports (f.o.b.)VisibleTrade
1994 (40.6) 504.0 463.4 447.4 16.0
1995 (40.8) 536.5 495.7 479.3 16.4
1996 (20.2) 595.0 574.8 552.8 22.0
1997 (48.2) 641.6 593.4 573.4 20.0
1998 (54.2) 601.2 547.0 525.0 22.0
1999 (25.2) 550.2 525.0 504.7 20.3
2000 (80.6) 585.8 505.2 502.7 2.5
2001 (93.8) 584.1 490.3 487.1 3.2
2002 (67.7) 563.1 495.5 491.5 4.0
2003 (58.8) 571.7 512.9 501.4 11.5
2004 (57.9) 646.9 589.0 577.9 11.1
19991st Qtr. (1.5) 122.4 120.9 113.8 7.1 2nd Qtr. 36.7 80.8 117.5 111.9 5.6 3rd Qtr. (81.4) 207.0 125.6 120.8 4.8 4th Qtr. 21.0 140.0 161.0 158.2 2.8
20001st Qtr. (15.7) 145.2 129.5 128.5 1.0 2nd Qtr. (20.3) 140.1 119.8 118.7 1.1 3rd Qtr. (37.3) 151.5 114.2 113.8 0.4 4th Qtr. (7.3) 149.0 141.7 141.7 -
20011st Qtr. (48.1) 150.4 102.3 101.7 0.6 2nd Qtr. (25.7) 138.9 113.2 112.6 0.6 3rd Qtr. (17.8) 148.1 130.3 129.5 0.8 4th Qtr. (2.2) 146.7 144.5 143.3 1.2
20021st Qtr. (10.4) 132.2 121.9 121.4 0.5 2nd Qtr. (28.2) 145.6 117.4 116.8 0.5 3rd Qtr. (17.3) 137.3 120.1 119.2 0.9 4th Qtr. (11.8) 148.0 136.1 133.9 2.2
20031st Qtr. (26.5) 140.2 113.7 111.7 2.0 2nd Qtr. (27.9) 145.3 117.4 114.5 2.9 3rd Qtr. (10.3) 137.7 127.4 122.8 4.6 4th Qtr. 5.9 148.5 154.4 152.4 2.0
2004*1st Qtr. (37.0) 157.4 120.4 118.9 1.5 2nd Qtr. 7.3 145.2 152.4 148.1 4.3 3rd Qtr. (30.2) 170.1 140.0 137.7 2.3 4th Qtr. 2.0 174.3 176.3 173.3 3.0
2005*1st Qtr. (59.1) 168.4 109.2 107.6 1.6
Source: Bureau of Statistics and the Bank of Guyana.
Re-Exports
Table 8.5(a)
Period Imports (c.i.f.) Total Domestic
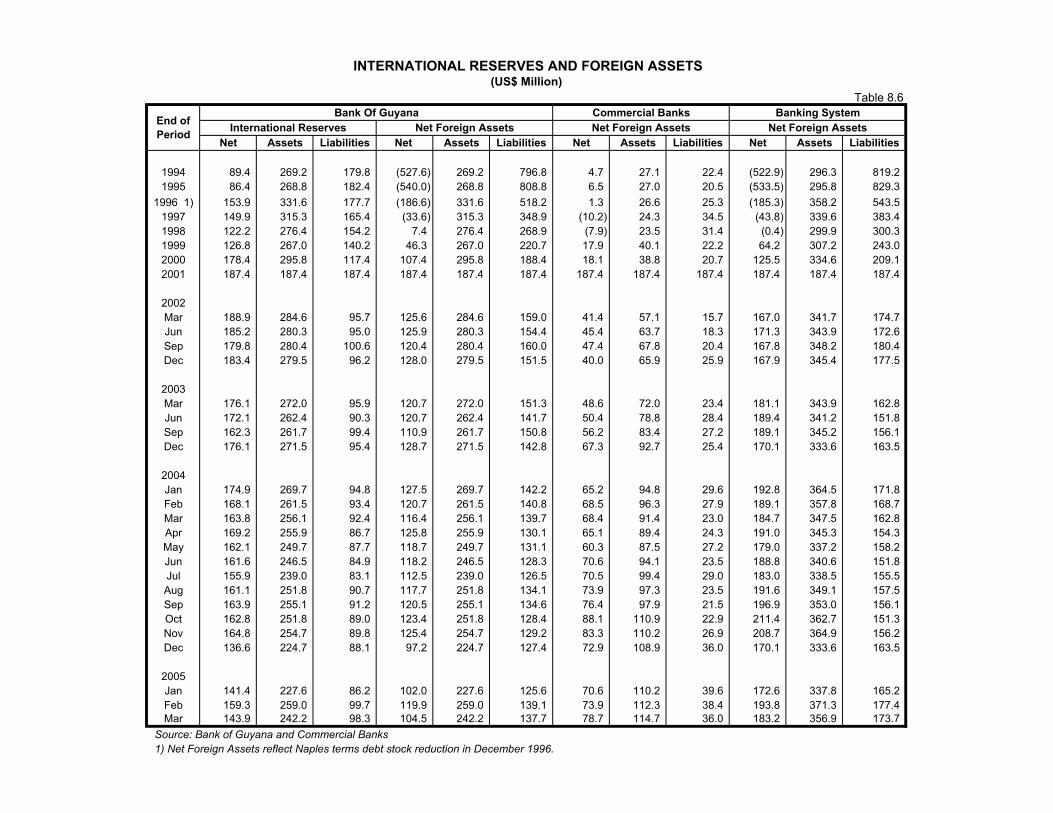
INTERNATIONAL RESERVES AND FOREIGN ASSETS(US$ Million)
Bank Of Guyana Commercial Banks Banking SystemInternational Reserves Net Foreign Assets Net Foreign Assets Net Foreign Assets
Net Assets Liabilities Net Assets Liabilities Net Assets Liabilities Net Assets Liabilities
1994 89.4 269.2 179.8 (527.6) 269.2 796.8 4.7 27.1 22.4 (522.9) 296.3 819.2 1995 86.4 268.8 182.4 (540.0) 268.8 808.8 6.5 27.0 20.5 (533.5) 295.8 829.3
1996 1) 153.9 331.6 177.7 (186.6) 331.6 518.2 1.3 26.6 25.3 (185.3) 358.2 543.5 1997 149.9 315.3 165.4 (33.6) 315.3 348.9 (10.2) 24.3 34.5 (43.8) 339.6 383.4 1998 122.2 276.4 154.2 7.4 276.4 268.9 (7.9) 23.5 31.4 (0.4) 299.9 300.3 1999 126.8 267.0 140.2 46.3 267.0 220.7 17.9 40.1 22.2 64.2 307.2 243.0 2000 178.4 295.8 117.4 107.4 295.8 188.4 18.1 38.8 20.7 125.5 334.6 209.1 2001 187.4 187.4 187.4 187.4 187.4 187.4 187.4 187.4 187.4 187.4 187.4 187.4
2002Mar 188.9 284.6 95.7 125.6 284.6 159.0 41.4 57.1 15.7 167.0 341.7 174.7 Jun 185.2 280.3 95.0 125.9 280.3 154.4 45.4 63.7 18.3 171.3 343.9 172.6 Sep 179.8 280.4 100.6 120.4 280.4 160.0 47.4 67.8 20.4 167.8 348.2 180.4 Dec 183.4 279.5 96.2 128.0 279.5 151.5 40.0 65.9 25.9 167.9 345.4 177.5
2003Mar 176.1 272.0 95.9 120.7 272.0 151.3 48.6 72.0 23.4 181.1 343.9 162.8 Jun 172.1 262.4 90.3 120.7 262.4 141.7 50.4 78.8 28.4 189.4 341.2 151.8 Sep 162.3 261.7 99.4 110.9 261.7 150.8 56.2 83.4 27.2 189.1 345.2 156.1 Dec 176.1 271.5 95.4 128.7 271.5 142.8 67.3 92.7 25.4 170.1 333.6 163.5
2004Jan 174.9 269.7 94.8 127.5 269.7 142.2 65.2 94.8 29.6 192.8 364.5 171.8 Feb 168.1 261.5 93.4 120.7 261.5 140.8 68.5 96.3 27.9 189.1 357.8 168.7 Mar 163.8 256.1 92.4 116.4 256.1 139.7 68.4 91.4 23.0 184.7 347.5 162.8 Apr 169.2 255.9 86.7 125.8 255.9 130.1 65.1 89.4 24.3 191.0 345.3 154.3 May 162.1 249.7 87.7 118.7 249.7 131.1 60.3 87.5 27.2 179.0 337.2 158.2 Jun 161.6 246.5 84.9 118.2 246.5 128.3 70.6 94.1 23.5 188.8 340.6 151.8 Jul 155.9 239.0 83.1 112.5 239.0 126.5 70.5 99.4 29.0 183.0 338.5 155.5 Aug 161.1 251.8 90.7 117.7 251.8 134.1 73.9 97.3 23.5 191.6 349.1 157.5 Sep 163.9 255.1 91.2 120.5 255.1 134.6 76.4 97.9 21.5 196.9 353.0 156.1 Oct 162.8 251.8 89.0 123.4 251.8 128.4 88.1 110.9 22.9 211.4 362.7 151.3 Nov 164.8 254.7 89.8 125.4 254.7 129.2 83.3 110.2 26.9 208.7 364.9 156.2 Dec 136.6 224.7 88.1 97.2 224.7 127.4 72.9 108.9 36.0 170.1 333.6 163.5
2005Jan 141.4 227.6 86.2 102.0 227.6 125.6 70.6 110.2 39.6 172.6 337.8 165.2 Feb 159.3 259.0 99.7 119.9 259.0 139.1 73.9 112.3 38.4 193.8 371.3 177.4 Mar 143.9 242.2 98.3 104.5 242.2 137.7 78.7 114.7 36.0 183.2 356.9 173.7
Source: Bank of Guyana and Commercial Banks 1) Net Foreign Assets reflect Naples terms debt stock reduction in December 1996.
Table 8.6
End of Period
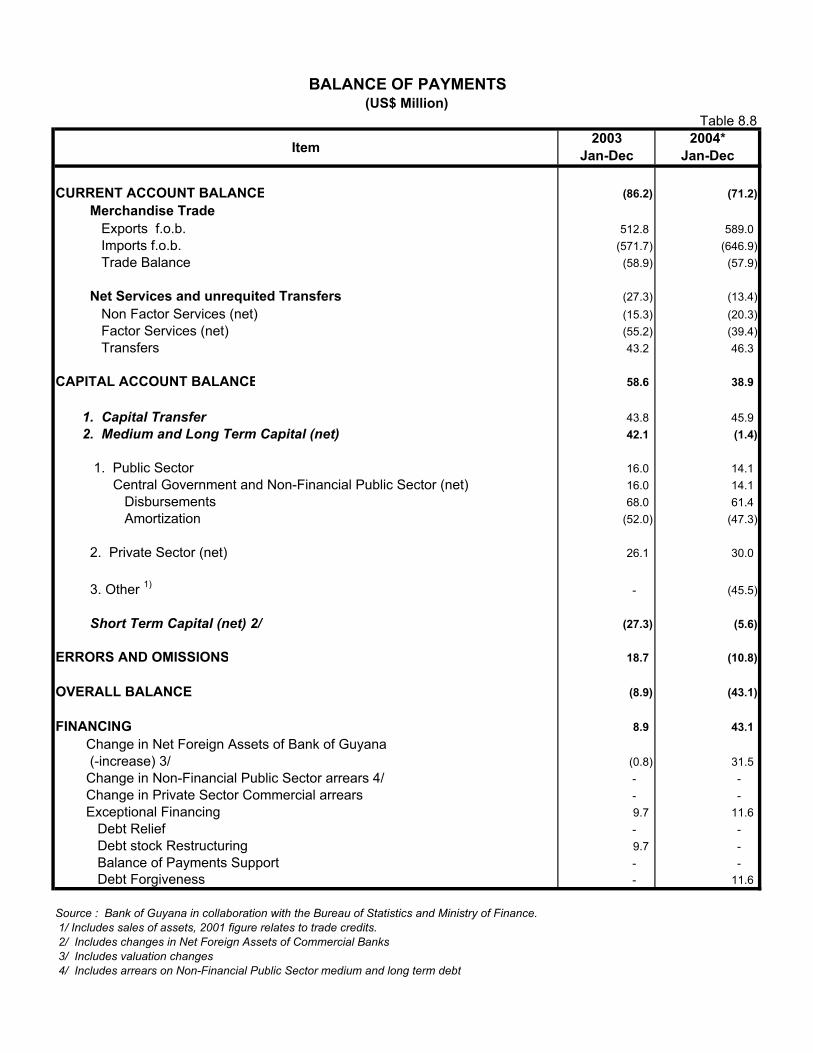
2003 2004*Jan-Dec Jan-Dec
CURRENT ACCOUNT BALANCE (86.2) (71.2) Merchandise Trade Exports f.o.b. 512.8 589.0 Imports f.o.b. (571.7) (646.9) Trade Balance (58.9) (57.9)
Net Services and unrequited Transfers (27.3) (13.4) Non Factor Services (net) (15.3) (20.3) Factor Services (net) (55.2) (39.4) Transfers 43.2 46.3
CAPITAL ACCOUNT BALANCE 58.6 38.9
1. Capital Transfer 43.8 45.9 2. Medium and Long Term Capital (net) 42.1 (1.4)
1. Public Sector 16.0 14.1 Central Government and Non-Financial Public Sector (net) 16.0 14.1
Disbursements 68.0 61.4 Amortization (52.0) (47.3)
2. Private Sector (net) 26.1 30.0
3. Other 1) - (45.5)
Short Term Capital (net) 2/ (27.3) (5.6)
ERRORS AND OMISSIONS 18.7 (10.8)
OVERALL BALANCE (8.9) (43.1)
FINANCING 8.9 43.1 Change in Net Foreign Assets of Bank of Guyana (-increase) 3/ (0.8) 31.5 Change in Non-Financial Public Sector arrears 4/ - - Change in Private Sector Commercial arrears - - Exceptional Financing 9.7 11.6 Debt Relief - - Debt stock Restructuring 9.7 - Balance of Payments Support - - Debt Forgiveness - 11.6
Source : Bank of Guyana in collaboration with the Bureau of Statistics and Ministry of Finance. 1/ Includes sales of assets, 2001 figure relates to trade credits. 2/ Includes changes in Net Foreign Assets of Commercial Banks 3/ Includes valuation changes 4/ Includes arrears on Non-Financial Public Sector medium and long term debt
Table 8.8
Item
BALANCE OF PAYMENTS(US$ Million)
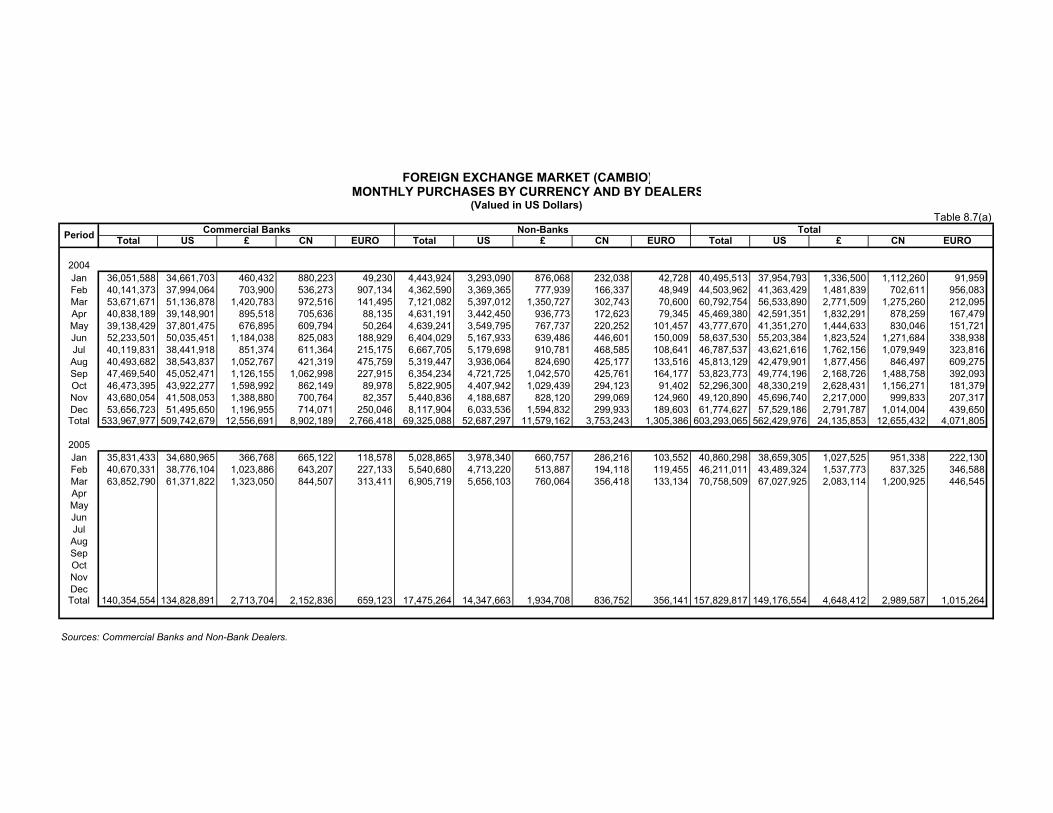
Total US £ CN EURO Total US £ CN EURO Total US £ CN EURO
2004Jan 36,051,588 34,661,703 460,432 880,223 49,230 4,443,924 3,293,090 876,068 232,038 42,728 40,495,513 37,954,793 1,336,500 1,112,260 91,959Feb 40,141,373 37,994,064 703,900 536,273 907,134 4,362,590 3,369,365 777,939 166,337 48,949 44,503,962 41,363,429 1,481,839 702,611 956,083Mar 53,671,671 51,136,878 1,420,783 972,516 141,495 7,121,082 5,397,012 1,350,727 302,743 70,600 60,792,754 56,533,890 2,771,509 1,275,260 212,095Apr 40,838,189 39,148,901 895,518 705,636 88,135 4,631,191 3,442,450 936,773 172,623 79,345 45,469,380 42,591,351 1,832,291 878,259 167,479May 39,138,429 37,801,475 676,895 609,794 50,264 4,639,241 3,549,795 767,737 220,252 101,457 43,777,670 41,351,270 1,444,633 830,046 151,721Jun 52,233,501 50,035,451 1,184,038 825,083 188,929 6,404,029 5,167,933 639,486 446,601 150,009 58,637,530 55,203,384 1,823,524 1,271,684 338,938Jul 40,119,831 38,441,918 851,374 611,364 215,175 6,667,705 5,179,698 910,781 468,585 108,641 46,787,537 43,621,616 1,762,156 1,079,949 323,816Aug 40,493,682 38,543,837 1,052,767 421,319 475,759 5,319,447 3,936,064 824,690 425,177 133,516 45,813,129 42,479,901 1,877,456 846,497 609,275Sep 47,469,540 45,052,471 1,126,155 1,062,998 227,915 6,354,234 4,721,725 1,042,570 425,761 164,177 53,823,773 49,774,196 2,168,726 1,488,758 392,093Oct 46,473,395 43,922,277 1,598,992 862,149 89,978 5,822,905 4,407,942 1,029,439 294,123 91,402 52,296,300 48,330,219 2,628,431 1,156,271 181,379Nov 43,680,054 41,508,053 1,388,880 700,764 82,357 5,440,836 4,188,687 828,120 299,069 124,960 49,120,890 45,696,740 2,217,000 999,833 207,317Dec 53,656,723 51,495,650 1,196,955 714,071 250,046 8,117,904 6,033,536 1,594,832 299,933 189,603 61,774,627 57,529,186 2,791,787 1,014,004 439,650Total 533,967,977 509,742,679 12,556,691 8,902,189 2,766,418 69,325,088 52,687,297 11,579,162 3,753,243 1,305,386 603,293,065 562,429,976 24,135,853 12,655,432 4,071,805
2005Jan 35,831,433 34,680,965 366,768 665,122 118,578 5,028,865 3,978,340 660,757 286,216 103,552 40,860,298 38,659,305 1,027,525 951,338 222,130Feb 40,670,331 38,776,104 1,023,886 643,207 227,133 5,540,680 4,713,220 513,887 194,118 119,455 46,211,011 43,489,324 1,537,773 837,325 346,588Mar 63,852,790 61,371,822 1,323,050 844,507 313,411 6,905,719 5,656,103 760,064 356,418 133,134 70,758,509 67,027,925 2,083,114 1,200,925 446,545AprMayJunJulAugSepOctNovDecTotal 140,354,554 134,828,891 2,713,704 2,152,836 659,123 17,475,264 14,347,663 1,934,708 836,752 356,141 157,829,817 149,176,554 4,648,412 2,989,587 1,015,264
Sources: Commercial Banks and Non-Bank Dealers.
Period TotalCommercial Banks Non-Banks
FOREIGN EXCHANGE MARKET (CAMBIO)MONTHLY PURCHASES BY CURRENCY AND BY DEALERS
(Valued in US Dollars)Table 8.7(a)
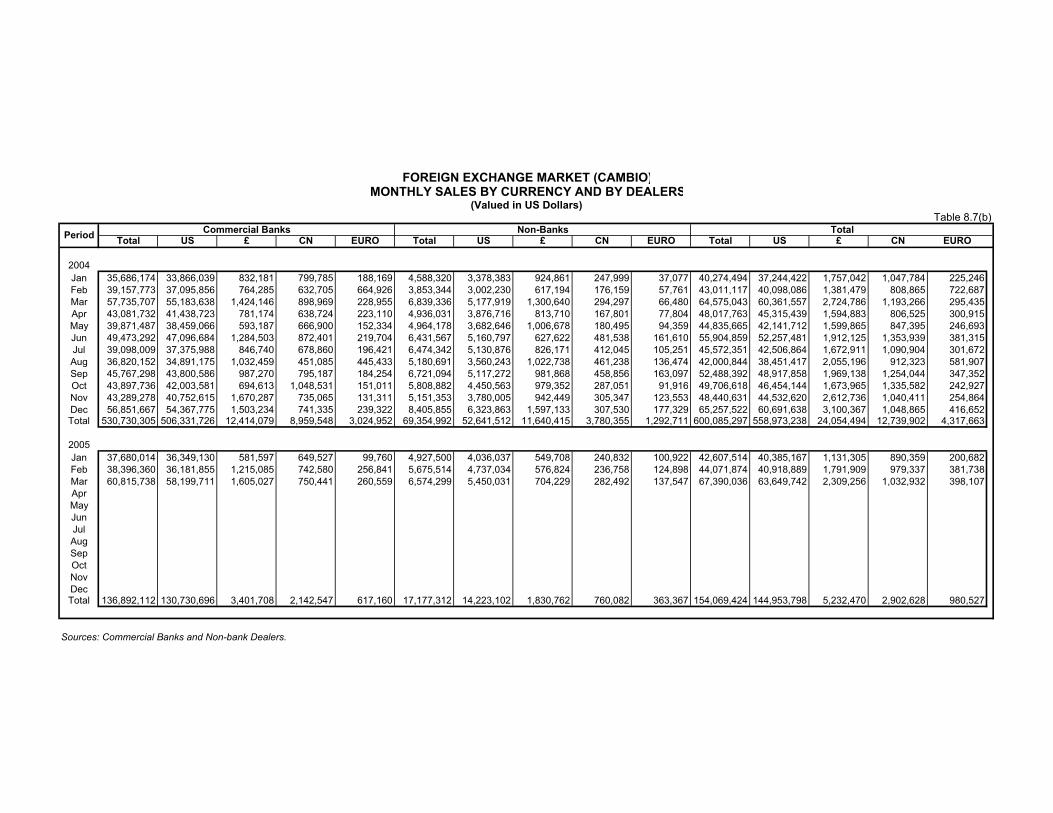
Total US £ CN EURO Total US £ CN EURO Total US £ CN EURO
2004Jan 35,686,174 33,866,039 832,181 799,785 188,169 4,588,320 3,378,383 924,861 247,999 37,077 40,274,494 37,244,422 1,757,042 1,047,784 225,246Feb 39,157,773 37,095,856 764,285 632,705 664,926 3,853,344 3,002,230 617,194 176,159 57,761 43,011,117 40,098,086 1,381,479 808,865 722,687Mar 57,735,707 55,183,638 1,424,146 898,969 228,955 6,839,336 5,177,919 1,300,640 294,297 66,480 64,575,043 60,361,557 2,724,786 1,193,266 295,435Apr 43,081,732 41,438,723 781,174 638,724 223,110 4,936,031 3,876,716 813,710 167,801 77,804 48,017,763 45,315,439 1,594,883 806,525 300,915May 39,871,487 38,459,066 593,187 666,900 152,334 4,964,178 3,682,646 1,006,678 180,495 94,359 44,835,665 42,141,712 1,599,865 847,395 246,693Jun 49,473,292 47,096,684 1,284,503 872,401 219,704 6,431,567 5,160,797 627,622 481,538 161,610 55,904,859 52,257,481 1,912,125 1,353,939 381,315Jul 39,098,009 37,375,988 846,740 678,860 196,421 6,474,342 5,130,876 826,171 412,045 105,251 45,572,351 42,506,864 1,672,911 1,090,904 301,672Aug 36,820,152 34,891,175 1,032,459 451,085 445,433 5,180,691 3,560,243 1,022,738 461,238 136,474 42,000,844 38,451,417 2,055,196 912,323 581,907Sep 45,767,298 43,800,586 987,270 795,187 184,254 6,721,094 5,117,272 981,868 458,856 163,097 52,488,392 48,917,858 1,969,138 1,254,044 347,352Oct 43,897,736 42,003,581 694,613 1,048,531 151,011 5,808,882 4,450,563 979,352 287,051 91,916 49,706,618 46,454,144 1,673,965 1,335,582 242,927Nov 43,289,278 40,752,615 1,670,287 735,065 131,311 5,151,353 3,780,005 942,449 305,347 123,553 48,440,631 44,532,620 2,612,736 1,040,411 254,864Dec 56,851,667 54,367,775 1,503,234 741,335 239,322 8,405,855 6,323,863 1,597,133 307,530 177,329 65,257,522 60,691,638 3,100,367 1,048,865 416,652Total 530,730,305 506,331,726 12,414,079 8,959,548 3,024,952 69,354,992 52,641,512 11,640,415 3,780,355 1,292,711 600,085,297 558,973,238 24,054,494 12,739,902 4,317,663
2005Jan 37,680,014 36,349,130 581,597 649,527 99,760 4,927,500 4,036,037 549,708 240,832 100,922 42,607,514 40,385,167 1,131,305 890,359 200,682Feb 38,396,360 36,181,855 1,215,085 742,580 256,841 5,675,514 4,737,034 576,824 236,758 124,898 44,071,874 40,918,889 1,791,909 979,337 381,738Mar 60,815,738 58,199,711 1,605,027 750,441 260,559 6,574,299 5,450,031 704,229 282,492 137,547 67,390,036 63,649,742 2,309,256 1,032,932 398,107AprMayJunJulAugSepOctNovDecTotal 136,892,112 130,730,696 3,401,708 2,142,547 617,160 17,177,312 14,223,102 1,830,762 760,082 363,367 154,069,424 144,953,798 5,232,470 2,902,628 980,527
Sources: Commercial Banks and Non-bank Dealers.
Period Commercial Banks Non-Banks Total
FOREIGN EXCHANGE MARKET (CAMBIO)MONTHLY SALES BY CURRENCY AND BY DEALERS
(Valued in US Dollars)Table 8.7(b)
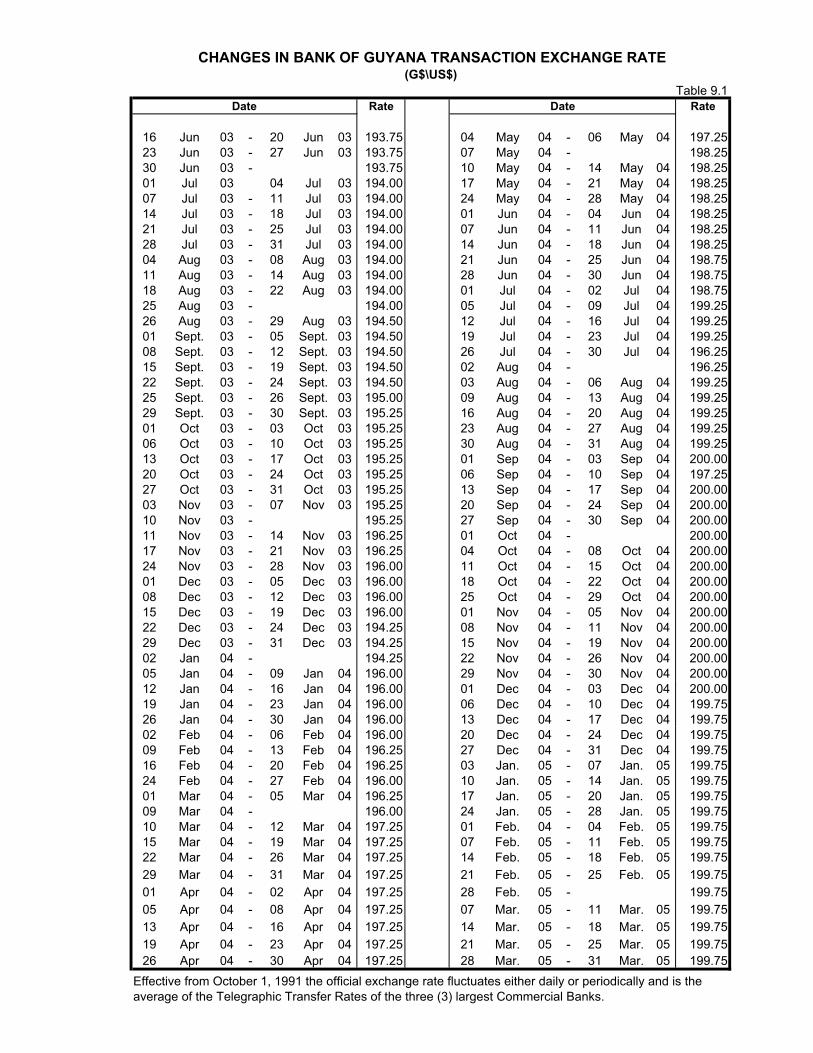
Rate Rate
16 Jun 03 - 20 Jun 03 193.75 04 May 04 - 06 May 04 197.2523 Jun 03 - 27 Jun 03 193.75 07 May 04 - 198.2530 Jun 03 - 193.75 10 May 04 - 14 May 04 198.2501 Jul 03 04 Jul 03 194.00 17 May 04 - 21 May 04 198.2507 Jul 03 - 11 Jul 03 194.00 24 May 04 - 28 May 04 198.2514 Jul 03 - 18 Jul 03 194.00 01 Jun 04 - 04 Jun 04 198.2521 Jul 03 - 25 Jul 03 194.00 07 Jun 04 - 11 Jun 04 198.2528 Jul 03 - 31 Jul 03 194.00 14 Jun 04 - 18 Jun 04 198.2504 Aug 03 - 08 Aug 03 194.00 21 Jun 04 - 25 Jun 04 198.7511 Aug 03 - 14 Aug 03 194.00 28 Jun 04 - 30 Jun 04 198.7518 Aug 03 - 22 Aug 03 194.00 01 Jul 04 - 02 Jul 04 198.7525 Aug 03 - 194.00 05 Jul 04 - 09 Jul 04 199.2526 Aug 03 - 29 Aug 03 194.50 12 Jul 04 - 16 Jul 04 199.2501 Sept. 03 - 05 Sept. 03 194.50 19 Jul 04 - 23 Jul 04 199.2508 Sept. 03 - 12 Sept. 03 194.50 26 Jul 04 - 30 Jul 04 196.2515 Sept. 03 - 19 Sept. 03 194.50 02 Aug 04 - 196.2522 Sept. 03 - 24 Sept. 03 194.50 03 Aug 04 - 06 Aug 04 199.2525 Sept. 03 - 26 Sept. 03 195.00 09 Aug 04 - 13 Aug 04 199.2529 Sept. 03 - 30 Sept. 03 195.25 16 Aug 04 - 20 Aug 04 199.2501 Oct 03 - 03 Oct 03 195.25 23 Aug 04 - 27 Aug 04 199.2506 Oct 03 - 10 Oct 03 195.25 30 Aug 04 - 31 Aug 04 199.2513 Oct 03 - 17 Oct 03 195.25 01 Sep 04 - 03 Sep 04 200.0020 Oct 03 - 24 Oct 03 195.25 06 Sep 04 - 10 Sep 04 197.2527 Oct 03 - 31 Oct 03 195.25 13 Sep 04 - 17 Sep 04 200.0003 Nov 03 - 07 Nov 03 195.25 20 Sep 04 - 24 Sep 04 200.0010 Nov 03 - 195.25 27 Sep 04 - 30 Sep 04 200.0011 Nov 03 - 14 Nov 03 196.25 01 Oct 04 - 200.0017 Nov 03 - 21 Nov 03 196.25 04 Oct 04 - 08 Oct 04 200.0024 Nov 03 - 28 Nov 03 196.00 11 Oct 04 - 15 Oct 04 200.0001 Dec 03 - 05 Dec 03 196.00 18 Oct 04 - 22 Oct 04 200.0008 Dec 03 - 12 Dec 03 196.00 25 Oct 04 - 29 Oct 04 200.0015 Dec 03 - 19 Dec 03 196.00 01 Nov 04 - 05 Nov 04 200.0022 Dec 03 - 24 Dec 03 194.25 08 Nov 04 - 11 Nov 04 200.0029 Dec 03 - 31 Dec 03 194.25 15 Nov 04 - 19 Nov 04 200.0002 Jan 04 - 194.25 22 Nov 04 - 26 Nov 04 200.0005 Jan 04 - 09 Jan 04 196.00 29 Nov 04 - 30 Nov 04 200.0012 Jan 04 - 16 Jan 04 196.00 01 Dec 04 - 03 Dec 04 200.0019 Jan 04 - 23 Jan 04 196.00 06 Dec 04 - 10 Dec 04 199.7526 Jan 04 - 30 Jan 04 196.00 13 Dec 04 - 17 Dec 04 199.7502 Feb 04 - 06 Feb 04 196.00 20 Dec 04 - 24 Dec 04 199.7509 Feb 04 - 13 Feb 04 196.25 27 Dec 04 - 31 Dec 04 199.7516 Feb 04 - 20 Feb 04 196.25 03 Jan. 05 - 07 Jan. 05 199.7524 Feb 04 - 27 Feb 04 196.00 10 Jan. 05 - 14 Jan. 05 199.7501 Mar 04 - 05 Mar 04 196.25 17 Jan. 05 - 20 Jan. 05 199.7509 Mar 04 - 196.00 24 Jan. 05 - 28 Jan. 05 199.7510 Mar 04 - 12 Mar 04 197.25 01 Feb. 04 - 04 Feb. 05 199.7515 Mar 04 - 19 Mar 04 197.25 07 Feb. 05 - 11 Feb. 05 199.7522 Mar 04 - 26 Mar 04 197.25 14 Feb. 05 - 18 Feb. 05 199.7529 Mar 04 - 31 Mar 04 197.25 21 Feb. 05 - 25 Feb. 05 199.7501 Apr 04 - 02 Apr 04 197.25 28 Feb. 05 - 199.7505 Apr 04 - 08 Apr 04 197.25 07 Mar. 05 - 11 Mar. 05 199.7513 Apr 04 - 16 Apr 04 197.25 14 Mar. 05 - 18 Mar. 05 199.7519 Apr 04 - 23 Apr 04 197.25 21 Mar. 05 - 25 Mar. 05 199.7526 Apr 04 - 30 Apr 04 197.25 28 Mar. 05 - 31 Mar. 05 199.75
Effective from October 1, 1991 the official exchange rate fluctuates either daily or periodically and is the average of the Telegraphic Transfer Rates of the three (3) largest Commercial Banks.
CHANGES IN BANK OF GUYANA TRANSACTION EXCHANGE RATE(G$\US$)
Table 9.1Date Date
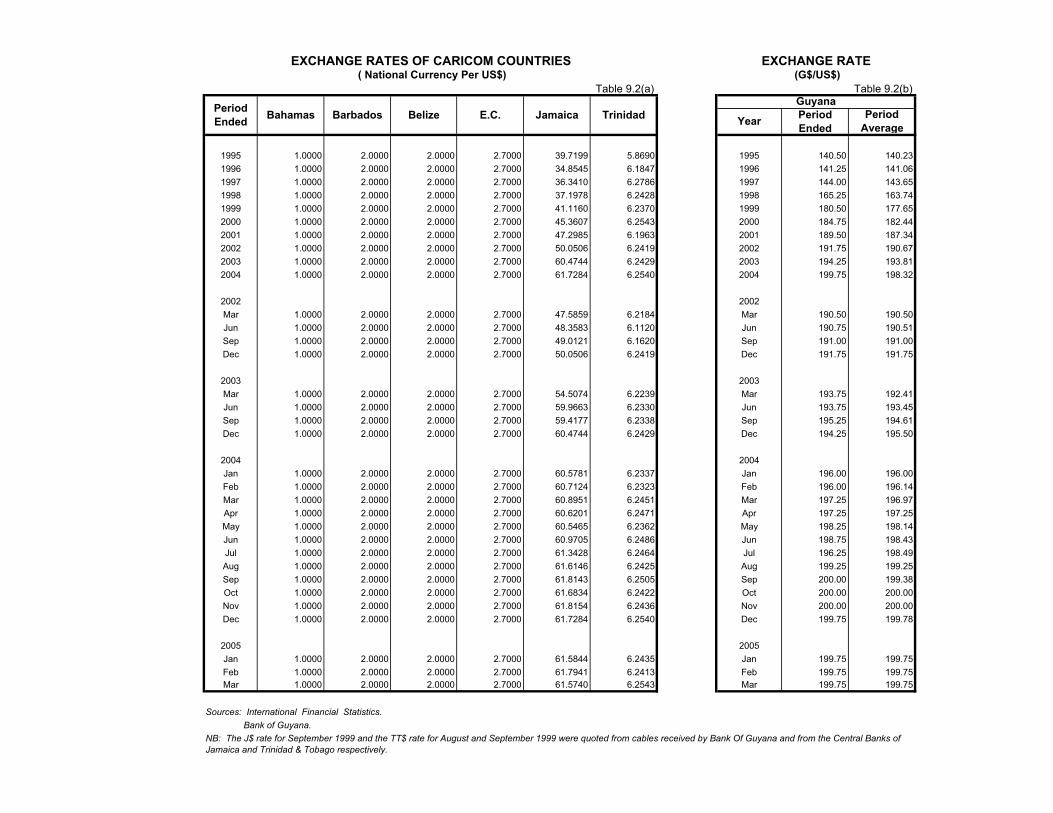
EXCHANGE RATES OF CARICOM COUNTRIES EXCHANGE RATE( National Currency Per US$) (G$/US$)
Guyana
1995 1.0000 2.0000 2.0000 2.7000 39.7199 5.8690 1995 140.50 140.231996 1.0000 2.0000 2.0000 2.7000 34.8545 6.1847 1996 141.25 141.061997 1.0000 2.0000 2.0000 2.7000 36.3410 6.2786 1997 144.00 143.651998 1.0000 2.0000 2.0000 2.7000 37.1978 6.2428 1998 165.25 163.741999 1.0000 2.0000 2.0000 2.7000 41.1160 6.2370 1999 180.50 177.652000 1.0000 2.0000 2.0000 2.7000 45.3607 6.2543 2000 184.75 182.442001 1.0000 2.0000 2.0000 2.7000 47.2985 6.1963 2001 189.50 187.342002 1.0000 2.0000 2.0000 2.7000 50.0506 6.2419 2002 191.75 190.672003 1.0000 2.0000 2.0000 2.7000 60.4744 6.2429 2003 194.25 193.812004 1.0000 2.0000 2.0000 2.7000 61.7284 6.2540 2004 199.75 198.32
2002 2002Mar 1.0000 2.0000 2.0000 2.7000 47.5859 6.2184 Mar 190.50 190.50Jun 1.0000 2.0000 2.0000 2.7000 48.3583 6.1120 Jun 190.75 190.51Sep 1.0000 2.0000 2.0000 2.7000 49.0121 6.1620 Sep 191.00 191.00Dec 1.0000 2.0000 2.0000 2.7000 50.0506 6.2419 Dec 191.75 191.75
2003 2003Mar 1.0000 2.0000 2.0000 2.7000 54.5074 6.2239 Mar 193.75 192.41Jun 1.0000 2.0000 2.0000 2.7000 59.9663 6.2330 Jun 193.75 193.45Sep 1.0000 2.0000 2.0000 2.7000 59.4177 6.2338 Sep 195.25 194.61Dec 1.0000 2.0000 2.0000 2.7000 60.4744 6.2429 Dec 194.25 195.50
2004 2004Jan 1.0000 2.0000 2.0000 2.7000 60.5781 6.2337 Jan 196.00 196.00Feb 1.0000 2.0000 2.0000 2.7000 60.7124 6.2323 Feb 196.00 196.14Mar 1.0000 2.0000 2.0000 2.7000 60.8951 6.2451 Mar 197.25 196.97Apr 1.0000 2.0000 2.0000 2.7000 60.6201 6.2471 Apr 197.25 197.25May 1.0000 2.0000 2.0000 2.7000 60.5465 6.2362 May 198.25 198.14Jun 1.0000 2.0000 2.0000 2.7000 60.9705 6.2486 Jun 198.75 198.43Jul 1.0000 2.0000 2.0000 2.7000 61.3428 6.2464 Jul 196.25 198.49Aug 1.0000 2.0000 2.0000 2.7000 61.6146 6.2425 Aug 199.25 199.25Sep 1.0000 2.0000 2.0000 2.7000 61.8143 6.2505 Sep 200.00 199.38Oct 1.0000 2.0000 2.0000 2.7000 61.6834 6.2422 Oct 200.00 200.00Nov 1.0000 2.0000 2.0000 2.7000 61.8154 6.2436 Nov 200.00 200.00Dec 1.0000 2.0000 2.0000 2.7000 61.7284 6.2540 Dec 199.75 199.78
2005 2005Jan 1.0000 2.0000 2.0000 2.7000 61.5844 6.2435 Jan 199.75 199.75Feb 1.0000 2.0000 2.0000 2.7000 61.7941 6.2413 Feb 199.75 199.75Mar 1.0000 2.0000 2.0000 2.7000 61.5740 6.2543 Mar 199.75 199.75
Sources: International Financial Statistics. Bank of Guyana.
Table 9.2(a) Table 9.2(b)
NB: The J$ rate for September 1999 and the TT$ rate for August and September 1999 were quoted from cables received by Bank Of Guyana and from the Central Banks of Jamaica and Trinidad & Tobago respectively.
Bahamas BarbadosPeriod Ended Belize E.C. Jamaica Trinidad Year Period
EndedPeriod
Average
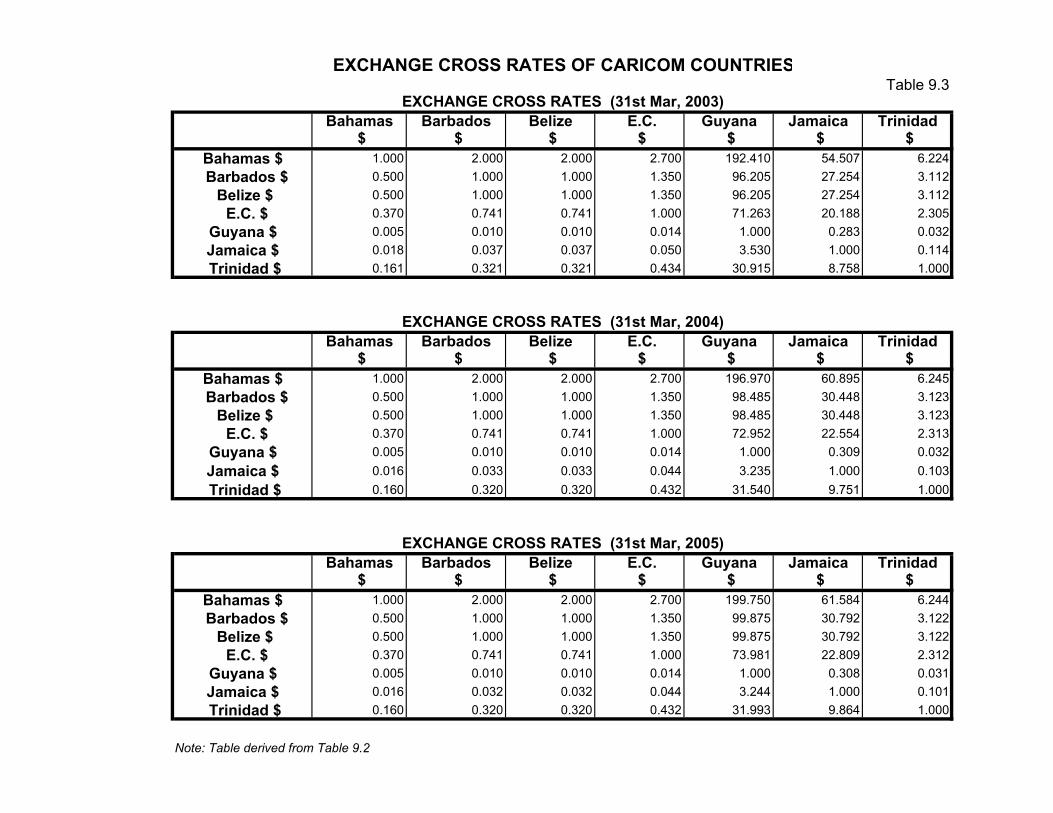
EXCHANGE CROSS RATES OF CARICOM COUNTRIES
EXCHANGE CROSS RATES (31st Mar, 2003)Bahamas Barbados Belize E.C. Guyana Jamaica Trinidad
$ $ $ $ $ $ $ Bahamas $ 1.000 2.000 2.000 2.700 192.410 54.507 6.224 Barbados $ 0.500 1.000 1.000 1.350 96.205 27.254 3.112
Belize $ 0.500 1.000 1.000 1.350 96.205 27.254 3.112 E.C. $ 0.370 0.741 0.741 1.000 71.263 20.188 2.305
Guyana $ 0.005 0.010 0.010 0.014 1.000 0.283 0.032 Jamaica $ 0.018 0.037 0.037 0.050 3.530 1.000 0.114 Trinidad $ 0.161 0.321 0.321 0.434 30.915 8.758 1.000
EXCHANGE CROSS RATES (31st Mar, 2004)Bahamas Barbados Belize E.C. Guyana Jamaica Trinidad
$ $ $ $ $ $ $ Bahamas $ 1.000 2.000 2.000 2.700 196.970 60.895 6.245 Barbados $ 0.500 1.000 1.000 1.350 98.485 30.448 3.123
Belize $ 0.500 1.000 1.000 1.350 98.485 30.448 3.123 E.C. $ 0.370 0.741 0.741 1.000 72.952 22.554 2.313
Guyana $ 0.005 0.010 0.010 0.014 1.000 0.309 0.032 Jamaica $ 0.016 0.033 0.033 0.044 3.235 1.000 0.103 Trinidad $ 0.160 0.320 0.320 0.432 31.540 9.751 1.000
EXCHANGE CROSS RATES (31st Mar, 2005)Bahamas Barbados Belize E.C. Guyana Jamaica Trinidad
$ $ $ $ $ $ $ Bahamas $ 1.000 2.000 2.000 2.700 199.750 61.584 6.244 Barbados $ 0.500 1.000 1.000 1.350 99.875 30.792 3.122
Belize $ 0.500 1.000 1.000 1.350 99.875 30.792 3.122 E.C. $ 0.370 0.741 0.741 1.000 73.981 22.809 2.312
Guyana $ 0.005 0.010 0.010 0.014 1.000 0.308 0.031 Jamaica $ 0.016 0.032 0.032 0.044 3.244 1.000 0.101 Trinidad $ 0.160 0.320 0.320 0.432 31.993 9.864 1.000
Note: Table derived from Table 9.2
Table 9.3
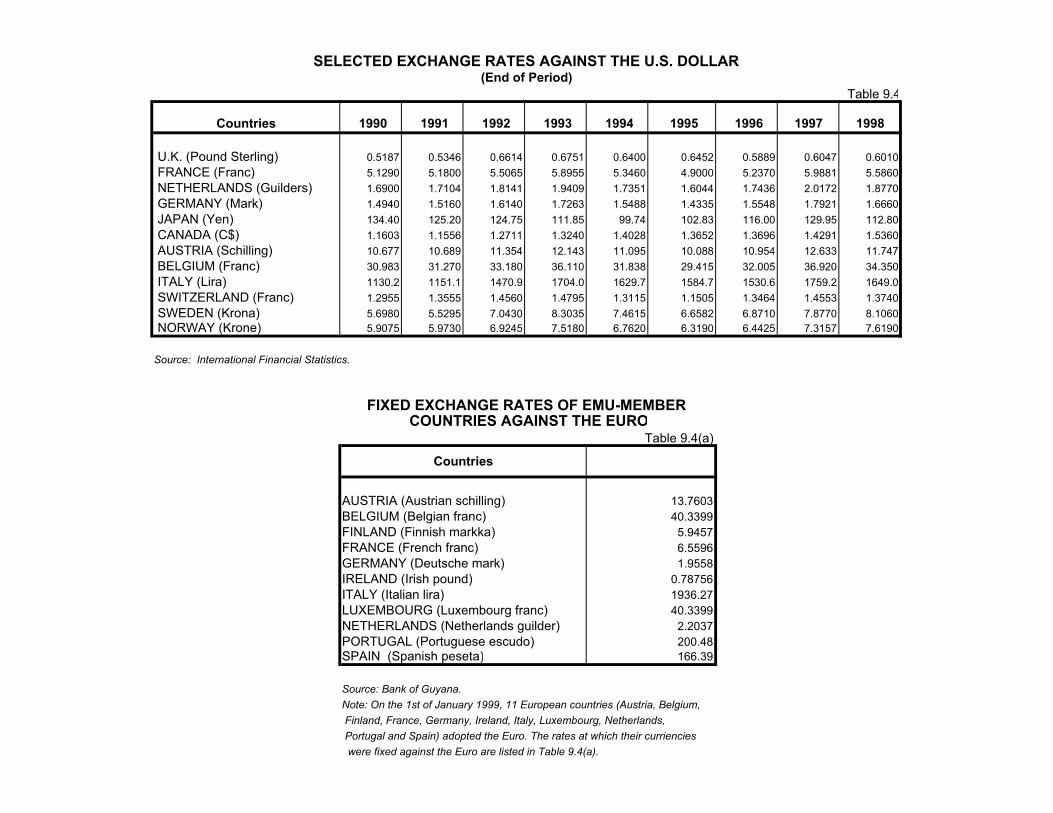
SELECTED EXCHANGE RATES AGAINST THE U.S. DOLLAR (End of Period)
Countries 1990 1991 1992 1993 1994 1995 1996 1997 1998
U.K. (Pound Sterling) 0.5187 0.5346 0.6614 0.6751 0.6400 0.6452 0.5889 0.6047 0.6010 FRANCE (Franc) 5.1290 5.1800 5.5065 5.8955 5.3460 4.9000 5.2370 5.9881 5.5860 NETHERLANDS (Guilders) 1.6900 1.7104 1.8141 1.9409 1.7351 1.6044 1.7436 2.0172 1.8770 GERMANY (Mark) 1.4940 1.5160 1.6140 1.7263 1.5488 1.4335 1.5548 1.7921 1.6660 JAPAN (Yen) 134.40 125.20 124.75 111.85 99.74 102.83 116.00 129.95 112.80 CANADA (C$) 1.1603 1.1556 1.2711 1.3240 1.4028 1.3652 1.3696 1.4291 1.5360 AUSTRIA (Schilling) 10.677 10.689 11.354 12.143 11.095 10.088 10.954 12.633 11.747 BELGIUM (Franc) 30.983 31.270 33.180 36.110 31.838 29.415 32.005 36.920 34.350 ITALY (Lira) 1130.2 1151.1 1470.9 1704.0 1629.7 1584.7 1530.6 1759.2 1649.0 SWITZERLAND (Franc) 1.2955 1.3555 1.4560 1.4795 1.3115 1.1505 1.3464 1.4553 1.3740 SWEDEN (Krona) 5.6980 5.5295 7.0430 8.3035 7.4615 6.6582 6.8710 7.8770 8.1060 NORWAY (Krone) 5.9075 5.9730 6.9245 7.5180 6.7620 6.3190 6.4425 7.3157 7.6190
Source: International Financial Statistics.
FIXED EXCHANGE RATES OF EMU-MEMBER COUNTRIES AGAINST THE EURO
AUSTRIA (Austrian schilling) 13.7603BELGIUM (Belgian franc) 40.3399FINLAND (Finnish markka) 5.9457FRANCE (French franc) 6.5596GERMANY (Deutsche mark) 1.9558IRELAND (Irish pound) 0.78756ITALY (Italian lira) 1936.27LUXEMBOURG (Luxembourg franc) 40.3399NETHERLANDS (Netherlands guilder) 2.2037PORTUGAL (Portuguese escudo) 200.48SPAIN (Spanish peseta) 166.39
Source: Bank of Guyana.Note: On the 1st of January 1999, 11 European countries (Austria, Belgium, Finland, France, Germany, Ireland, Italy, Luxembourg, Netherlands, Portugal and Spain) adopted the Euro. The rates at which their curriencies were fixed against the Euro are listed in Table 9.4(a).
Table 9.4
Table 9.4(a)
Countries

SELECTED EXCHANGE RATES AGAINST THE U.S. DOLLAR
2002 2003Dec Dec Mar Jun Sep Dec Jan Feb Mar Apr May Jun Jul Aug Sep Oct Nov Dec
CANADA (Canadian dollar) 1.5926 1.5796 1.4693 1.3553 1.3504 1.2924 1.3264 1.3401 1.3105 1.3707 1.3658 1.3404 1.3292 1.3167 1.2639 1.2207 1.1850 1.2036EURO 1.1347 0.9536 0.9179 0.8751 0.8582 0.7918 0.8075 0.8053 0.8181 0.8370 0.8166 0.8227 0.8306 0.8257 0.8059 0.7851 0.752 0.734JAPAN (Japanese yen) 131.80 119.90 120.15 119.85 111.20 107.10 105.97 109.00 104.30 110.20 110.50 108.38 112.08 109.65 111.00 106.13 103.18 104.12SWEDEN (Swedish krona) 10.6675 8.8250 8.5050 8.0025 7.6625 7.1947 7.4241 7.4340 7.5737 7.6574 7.4515 7.5237 7.6715 7.5355 7.3002 7.1076 6.7121 6.615UNITED KINGDOM (Pound sterling) 0.6895 0.6204 0.6330 0.6060 0.5975 0.5603 0.5522 0.5408 0.5451 0.5640 0.5450 0.5520 0.5507 0.5578 0.5559 0.5459 0.524 0.518
Source: International Financial Statistics.
COMMODITY PRICES
2002 2003Dec Dec Mar Jun Sep Dec Jan Feb Mar Apr May Jun Jul Aug Sep Oct Nov Dec
GOLD (US$/fine ounce) United Kingdom (London) 275.84 332.04 340.60 356.40 379.00 407.00 413.80 404.90 406.70 403.30 383.80 392.40 398.10 400.50 405.30 420.50 439.40 442.10
ALUMINIUM (US $/MT) 1)
All origins (London) 1348.72 1375.86 1386.55 1410.54 1416.60 1557.80 1608.90 1685.20 1657.40 1731.70 1625.30 1682.00 1707.90 1692.10 1731.00 1830.40 1817.40 1852.90
Sugar (US cents/pound) EEC Import Price 23.86 26.30 26.25 27.55 26.69 29.01 30.19 30.97 30.31 29.93 29.65 30.31 30.54 30.18 29.73 29.95 30.78 31.98
US import price 21.44 22.04 22.26 21.63 21.17 20.40 20.58 20.65 21.13 21.05 20.75 20.03 20.36 20.10 20.78 20.43 20.45 20.55
International sugar agreement price 7.41 7.51 7.84 6.40 6.27 6.34 6.03 5.87 6.50 6.86 6.62 7.51 8.17 7.88 8.76 8.96 … …
OIL (US$/brl.) U.K. Brent 18.60 28.52 30.34 27.55 27.10 29.88 31.18 30.87 33.80 33.36 37.92 35.19 38.37 43.14 43.38 49.77 41.09 41.38
Rice (US$/metric ton) Thailand (Bangkok) 179.38 185.27 196.95 203.67 202.86 197.00 207.45 213.25 240.35 253.41 251.57 244.23 240.32 252.55 252.00 253.52 262.32 278.43
Timber (US$/cubic metre) Hardwood logs (Malaysia, Sarawak) 139.91 183.37 184.15 182.70 187.15 196.40 199.10 199.00 195.20 198.00 188.40 198.60 200.50 198.70 199.30 198.00 202.10 191.88
Coconut oil (US $/MT) 1)
Philippines (New York) 341.43 485.27 438.10 462.38 430.50 583.04 579.09 645.00 691.30 740.91 711.90 660.00 652.73 630.68 660.00 641.19 … …
Source: International Financial Statistics.1) Aluminum and Coconut oil will be reported in US$ per metric tonne.
2004
2004
(End of Period)
Commodity (Units) 2001
Countries 2001Table 9.5
Table 9.5(a)
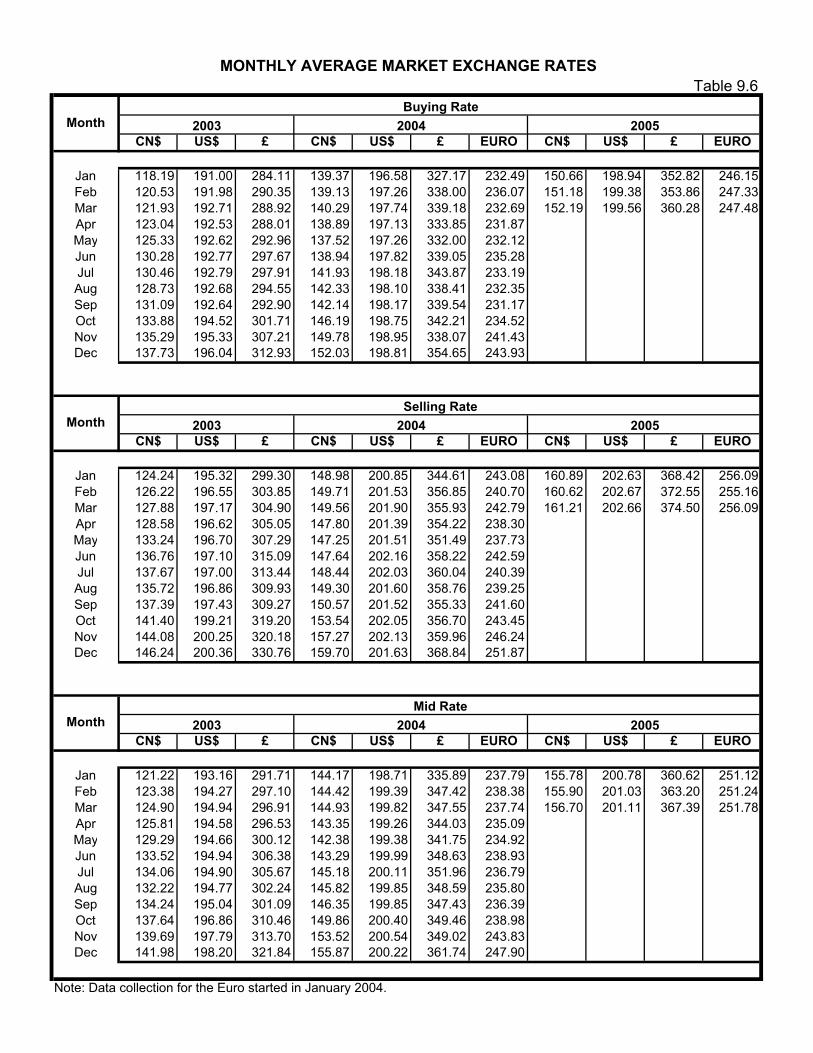
CN$ US$ £ CN$ US$ £ EURO CN$ US$ £ EURO
Jan 118.19 191.00 284.11 139.37 196.58 327.17 232.49 150.66 198.94 352.82 246.15Feb 120.53 191.98 290.35 139.13 197.26 338.00 236.07 151.18 199.38 353.86 247.33Mar 121.93 192.71 288.92 140.29 197.74 339.18 232.69 152.19 199.56 360.28 247.48Apr 123.04 192.53 288.01 138.89 197.13 333.85 231.87 #DIV/0! #DIV/0! #DIV/0! #DIV/0!May 125.33 192.62 292.96 137.52 197.26 332.00 232.12 137.52 197.26 332.00 232.12Jun 130.28 192.77 297.67 138.94 197.82 339.05 235.28 138.94 197.82 339.05 235.28Jul 130.46 192.79 297.91 141.93 198.18 343.87 233.19 141.93 198.18 343.87 233.19Aug 128.73 192.68 294.55 142.33 198.10 338.41 232.35 142.33 198.10 338.41 232.35Sep 131.09 192.64 292.90 142.14 198.17 339.54 231.17 142.14 198.17 339.54 231.17Oct 133.88 194.52 301.71 146.19 198.75 342.21 234.52 146.19 198.75 342.21 234.52Nov 135.29 195.33 307.21 149.78 198.95 338.07 241.43 149.78 198.95 338.07 241.43Dec 137.73 196.04 312.93 152.03 198.81 354.65 243.93 152.03 198.81 354.65 243.93
CN$ US$ £ CN$ US$ £ EURO CN$ US$ £ EURO
Jan 124.24 195.32 299.30 148.98 200.85 344.61 243.08 160.89 202.63 368.42 256.09Feb 126.22 196.55 303.85 149.71 201.53 356.85 240.70 160.62 202.67 372.55 255.16Mar 127.88 197.17 304.90 149.56 201.90 355.93 242.79 161.21 202.66 374.50 256.09Apr 128.58 196.62 305.05 147.80 201.39 354.22 238.30 #DIV/0! #DIV/0! #DIV/0! #DIV/0!May 133.24 196.70 307.29 147.25 201.51 351.49 237.73 147.25 201.51 351.49 237.73Jun 136.76 197.10 315.09 147.64 202.16 358.22 242.59 147.64 202.16 358.22 242.59Jul 137.67 197.00 313.44 148.44 202.03 360.04 240.39 148.44 202.03 360.04 240.39Aug 135.72 196.86 309.93 149.30 201.60 358.76 239.25 149.30 201.60 358.76 239.25Sep 137.39 197.43 309.27 150.57 201.52 355.33 241.60 150.57 201.52 355.33 241.60Oct 141.40 199.21 319.20 153.54 202.05 356.70 243.45 153.54 202.05 356.70 243.45Nov 144.08 200.25 320.18 157.27 202.13 359.96 246.24 157.27 202.13 359.96 246.24Dec 146.24 200.36 330.76 159.70 201.63 368.84 251.87 159.70 201.63 368.84 251.87
CN$ US$ £ CN$ US$ £ EURO CN$ US$ £ EURO
Jan 121.22 193.16 291.71 144.17 198.71 335.89 237.79 155.78 200.78 360.62 251.12Feb 123.38 194.27 297.10 144.42 199.39 347.42 238.38 155.90 201.03 363.20 251.24Mar 124.90 194.94 296.91 144.93 199.82 347.55 237.74 156.70 201.11 367.39 251.78Apr 125.81 194.58 296.53 143.35 199.26 344.03 235.09 #DIV/0! #DIV/0! #DIV/0! #DIV/0!May 129.29 194.66 300.12 142.38 199.38 341.75 234.92 142.38 199.38 341.75 234.92Jun 133.52 194.94 306.38 143.29 199.99 348.63 238.93 143.29 199.99 348.63 238.93Jul 134.06 194.90 305.67 145.18 200.11 351.96 236.79 145.18 200.11 351.96 236.79Aug 132.22 194.77 302.24 145.82 199.85 348.59 235.80 145.82 199.85 348.59 235.80Sep 134.24 195.04 301.09 146.35 199.85 347.43 236.39 146.35 199.85 347.43 236.39Oct 137.64 196.86 310.46 149.86 200.40 349.46 238.98 149.86 200.40 349.46 238.98Nov 139.69 197.79 313.70 153.52 200.54 349.02 243.83 153.52 200.54 349.02 243.83Dec 141.98 198.20 321.84 155.87 200.22 361.74 247.90 155.87 200.22 361.74 247.90
Note: Data collection for the Euro started in January 2004.
Mid Rate
Month
Month
Month 2003 2004 2005
20052003 2004
Table 9.6MONTHLY AVERAGE MARKET EXCHANGE RATES
2003 2004
Buying Rate
Selling Rate2005
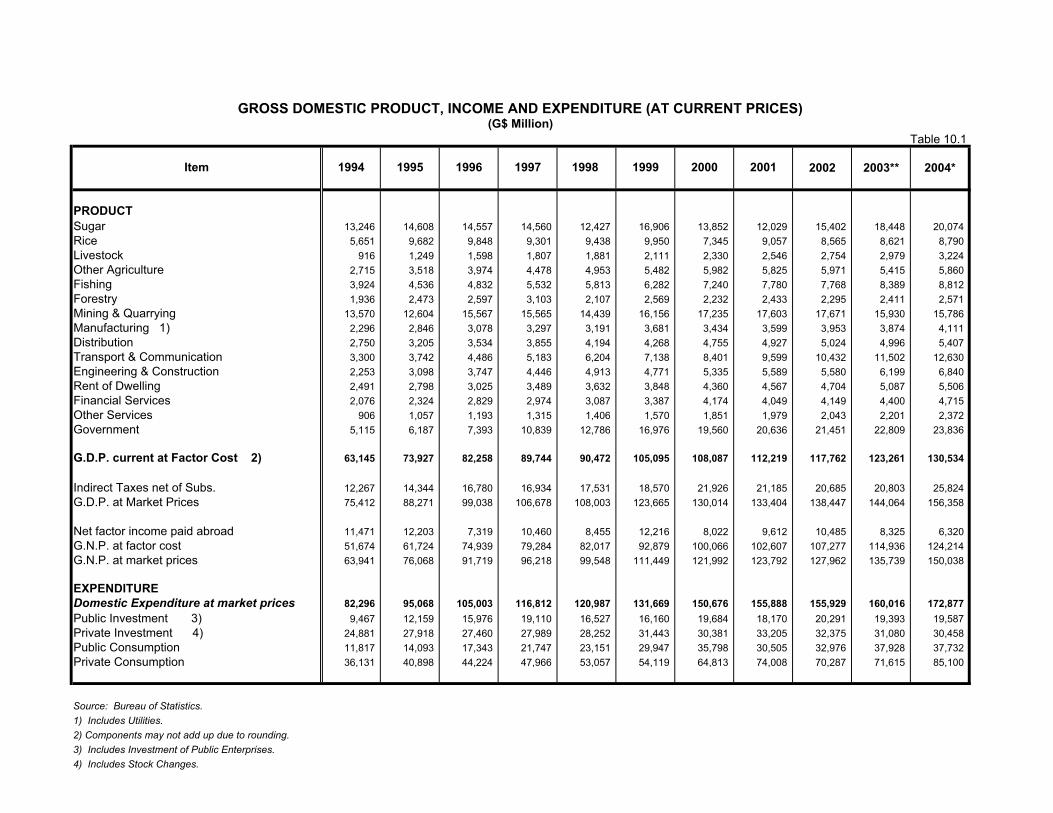
GROSS DOMESTIC PRODUCT, INCOME AND EXPENDITURE (AT CURRENT PRICES)(G$ Million)
Item 1994 1995 1996 1997 1998 1999 2000 2001
PRODUCTSugar 13,246 14,608 14,557 14,560 12,427 16,906 13,852 12,029 15,402 18,448 20,074 Rice 5,651 9,682 9,848 9,301 9,438 9,950 7,345 9,057 8,565 8,621 8,790 Livestock 916 1,249 1,598 1,807 1,881 2,111 2,330 2,546 2,754 2,979 3,224 Other Agriculture 2,715 3,518 3,974 4,478 4,953 5,482 5,982 5,825 5,971 5,415 5,860 Fishing 3,924 4,536 4,832 5,532 5,813 6,282 7,240 7,780 7,768 8,389 8,812 Forestry 1,936 2,473 2,597 3,103 2,107 2,569 2,232 2,433 2,295 2,411 2,571 Mining & Quarrying 13,570 12,604 15,567 15,565 14,439 16,156 17,235 17,603 17,671 15,930 15,786 Manufacturing 1) 2,296 2,846 3,078 3,297 3,191 3,681 3,434 3,599 3,953 3,874 4,111 Distribution 2,750 3,205 3,534 3,855 4,194 4,268 4,755 4,927 5,024 4,996 5,407 Transport & Communication 3,300 3,742 4,486 5,183 6,204 7,138 8,401 9,599 10,432 11,502 12,630 Engineering & Construction 2,253 3,098 3,747 4,446 4,913 4,771 5,335 5,589 5,580 6,199 6,840 Rent of Dwelling 2,491 2,798 3,025 3,489 3,632 3,848 4,360 4,567 4,704 5,087 5,506 Financial Services 2,076 2,324 2,829 2,974 3,087 3,387 4,174 4,049 4,149 4,400 4,715 Other Services 906 1,057 1,193 1,315 1,406 1,570 1,851 1,979 2,043 2,201 2,372 Government 5,115 6,187 7,393 10,839 12,786 16,976 19,560 20,636 21,451 22,809 23,836
G.D.P. current at Factor Cost 2) 63,145 73,927 82,258 89,744 90,472 105,095 108,087 112,219 117,762 123,261 130,534
Indirect Taxes net of Subs. 12,267 14,344 16,780 16,934 17,531 18,570 21,926 21,185 20,685 20,803 25,824 G.D.P. at Market Prices 75,412 88,271 99,038 106,678 108,003 123,665 130,014 133,404 138,447 144,064 156,358
Net factor income paid abroad 11,471 12,203 7,319 10,460 8,455 12,216 8,022 9,612 10,485 8,325 6,320 G.N.P. at factor cost 51,674 61,724 74,939 79,284 82,017 92,879 100,066 102,607 107,277 114,936 124,214 G.N.P. at market prices 63,941 76,068 91,719 96,218 99,548 111,449 121,992 123,792 127,962 135,739 150,038
EXPENDITUREDomestic Expenditure at market prices 82,296 95,068 105,003 116,812 120,987 131,669 150,676 155,888 155,929 160,016 172,877 Public Investment 3) 9,467 12,159 15,976 19,110 16,527 16,160 19,684 18,170 20,291 19,393 19,587 Private Investment 4) 24,881 27,918 27,460 27,989 28,252 31,443 30,381 33,205 32,375 31,080 30,458 Public Consumption 11,817 14,093 17,343 21,747 23,151 29,947 35,798 30,505 32,976 37,928 37,732 Private Consumption 36,131 40,898 44,224 47,966 53,057 54,119 64,813 74,008 70,287 71,615 85,100
Source: Bureau of Statistics.1) Includes Utilities.2) Components may not add up due to rounding.3) Includes Investment of Public Enterprises.4) Includes Stock Changes.
Table 10.1
2002 2004*2003**
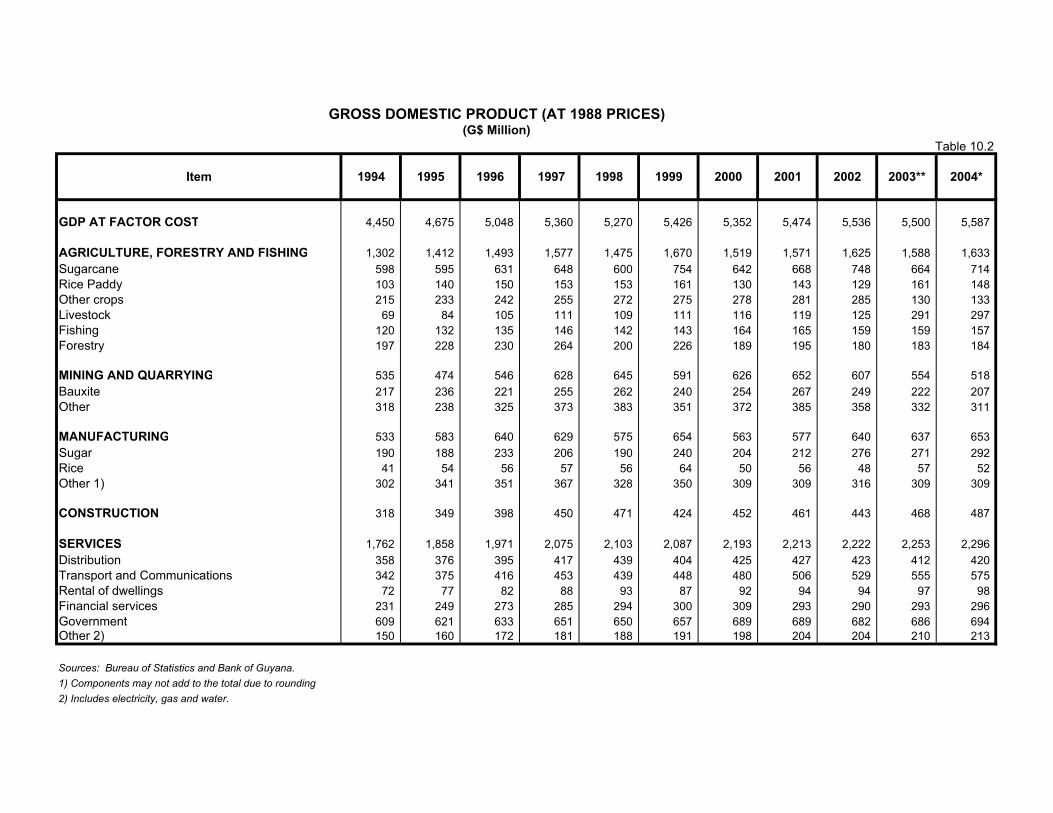
GROSS DOMESTIC PRODUCT (AT 1988 PRICES)(G$ Million)
GDP AT FACTOR COST 4,450 4,675 5,048 5,360 5,270 5,426 5,352 5,474 5,536 5,500 5,587
AGRICULTURE, FORESTRY AND FISHING 1,302 1,412 1,493 1,577 1,475 1,670 1,519 1,571 1,625 1,588 1,633 Sugarcane 598 595 631 648 600 754 642 668 748 664 714 Rice Paddy 103 140 150 153 153 161 130 143 129 161 148 Other crops 215 233 242 255 272 275 278 281 285 130 133 Livestock 69 84 105 111 109 111 116 119 125 291 297 Fishing 120 132 135 146 142 143 164 165 159 159 157 Forestry 197 228 230 264 200 226 189 195 180 183 184
MINING AND QUARRYING 535 474 546 628 645 591 626 652 607 554 518 Bauxite 217 236 221 255 262 240 254 267 249 222 207 Other 318 238 325 373 383 351 372 385 358 332 311
MANUFACTURING 533 583 640 629 575 654 563 577 640 637 653 Sugar 190 188 233 206 190 240 204 212 276 271 292 Rice 41 54 56 57 56 64 50 56 48 57 52 Other 1) 302 341 351 367 328 350 309 309 316 309 309
CONSTRUCTION 318 349 398 450 471 424 452 461 443 468 487
SERVICES 1,762 1,858 1,971 2,075 2,103 2,087 2,193 2,213 2,222 2,253 2,296 Distribution 358 376 395 417 439 404 425 427 423 412 420 Transport and Communications 342 375 416 453 439 448 480 506 529 555 575 Rental of dwellings 72 77 82 88 93 87 92 94 94 97 98 Financial services 231 249 273 285 294 300 309 293 290 293 296 Government 609 621 633 651 650 657 689 689 682 686 694 Other 2) 150 160 172 181 188 191 198 204 204 210 213
Sources: Bureau of Statistics and Bank of Guyana.1) Components may not add to the total due to rounding2) Includes electricity, gas and water.
Table 10.2
Item 1994 1995 1996 1997 1998 1999 2004*2000 2001 2002 2003**
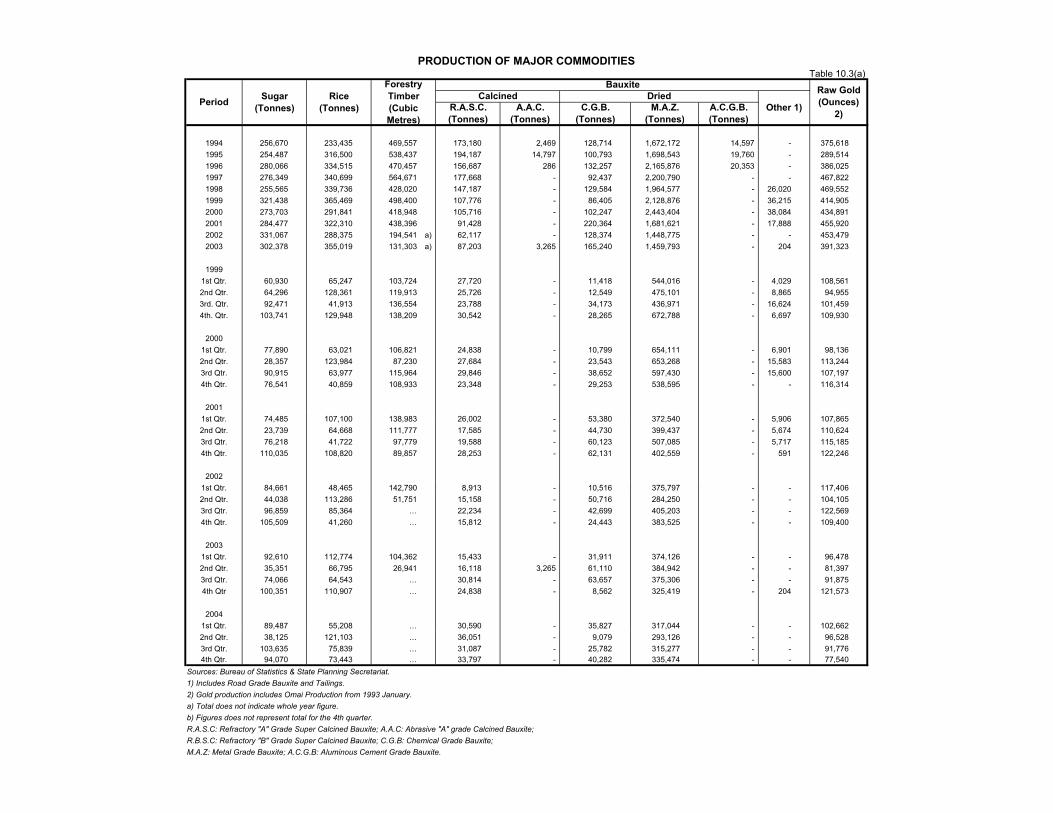
PRODUCTION OF MAJOR COMMODITIES
BauxiteCalcined Dried
1994 256,670 233,435 469,557 173,180 2,469 128,714 1,672,172 14,597 - 375,618 1995 254,487 316,500 538,437 194,187 14,797 100,793 1,698,543 19,760 - 289,514 1996 280,066 334,515 470,457 156,687 286 132,257 2,165,876 20,353 - 386,025 1997 276,349 340,699 564,671 177,668 - 92,437 2,200,790 - - 467,822 1998 255,565 339,736 428,020 147,187 - 129,584 1,964,577 - 26,020 469,552 1999 321,438 365,469 498,400 107,776 - 86,405 2,128,876 - 36,215 414,905 2000 273,703 291,841 418,948 105,716 - 102,247 2,443,404 - 38,084 434,891 2001 284,477 322,310 438,396 91,428 - 220,364 1,681,621 - 17,888 455,920 2002 331,067 288,375 194,541 a) 62,117 - 128,374 1,448,775 - - 453,479 2003 302,378 355,019 131,303 a) 87,203 3,265 165,240 1,459,793 - 204 391,323
19991st Qtr. 60,930 65,247 103,724 27,720 - 11,418 544,016 - 4,029 108,561 2nd Qtr. 64,296 128,361 119,913 25,726 - 12,549 475,101 - 8,865 94,955 3rd. Qtr. 92,471 41,913 136,554 23,788 - 34,173 436,971 - 16,624 101,459 4th. Qtr. 103,741 129,948 138,209 30,542 - 28,265 672,788 - 6,697 109,930
20001st Qtr. 77,890 63,021 106,821 24,838 - 10,799 654,111 - 6,901 98,136 2nd Qtr. 28,357 123,984 87,230 27,684 - 23,543 653,268 - 15,583 113,244 3rd Qtr. 90,915 63,977 115,964 29,846 - 38,652 597,430 - 15,600 107,197 4th Qtr. 76,541 40,859 108,933 23,348 - 29,253 538,595 - - 116,314
20011st Qtr. 74,485 107,100 138,983 26,002 - 53,380 372,540 - 5,906 107,865 2nd Qtr. 23,739 64,668 111,777 17,585 - 44,730 399,437 - 5,674 110,624 3rd Qtr. 76,218 41,722 97,779 19,588 - 60,123 507,085 - 5,717 115,185 4th Qtr. 110,035 108,820 89,857 28,253 - 62,131 402,559 - 591 122,246
20021st Qtr. 84,661 48,465 142,790 8,913 - 10,516 375,797 - - 117,406 2nd Qtr. 44,038 113,286 51,751 15,158 - 50,716 284,250 - - 104,105 3rd Qtr. 96,859 85,364 … 22,234 - 42,699 405,203 - - 122,569 4th Qtr. 105,509 41,260 … 15,812 - 24,443 383,525 - - 109,400
20031st Qtr. 92,610 112,774 104,362 15,433 - 31,911 374,126 - - 96,478 2nd Qtr. 35,351 66,795 26,941 16,118 3,265 61,110 384,942 - - 81,397 3rd Qtr. 74,066 64,543 … 30,814 - 63,657 375,306 - - 91,875 4th Qtr 100,351 110,907 … 24,838 - 8,562 325,419 - 204 121,573
20041st Qtr. 89,487 55,208 … 30,590 - 35,827 317,044 - - 102,662 2nd Qtr. 38,125 121,103 … 36,051 - 9,079 293,126 - - 96,528 3rd Qtr. 103,635 75,839 … 31,087 - 25,782 315,277 - - 91,776 4th Qtr. 94,070 73,443 … 33,797 - 40,282 335,474 - - 77,540
Sources: Bureau of Statistics & State Planning Secretariat.1) Includes Road Grade Bauxite and Tailings.2) Gold production includes Omai Production from 1993 January.a) Total does not indicate whole year figure.b) Figures does not represent total for the 4th quarter.R.A.S.C: Refractory "A" Grade Super Calcined Bauxite; A.A.C: Abrasive "A" grade Calcined Bauxite;R.B.S.C: Refractory "B" Grade Super Calcined Bauxite; C.G.B: Chemical Grade Bauxite;M.A.Z: Metal Grade Bauxite; A.C.G.B: Aluminous Cement Grade Bauxite.
Other 1)
Table 10.3(a)
Period Sugar (Tonnes)
Rice (Tonnes)
Raw Gold (Ounces)
2)
Forestry Timber (Cubic Metres)
A.A.C. (Tonnes)
R.A.S.C. (Tonnes)
C.G.B. (Tonnes)
M.A.Z. (Tonnes)
A.C.G.B. (Tonnes)
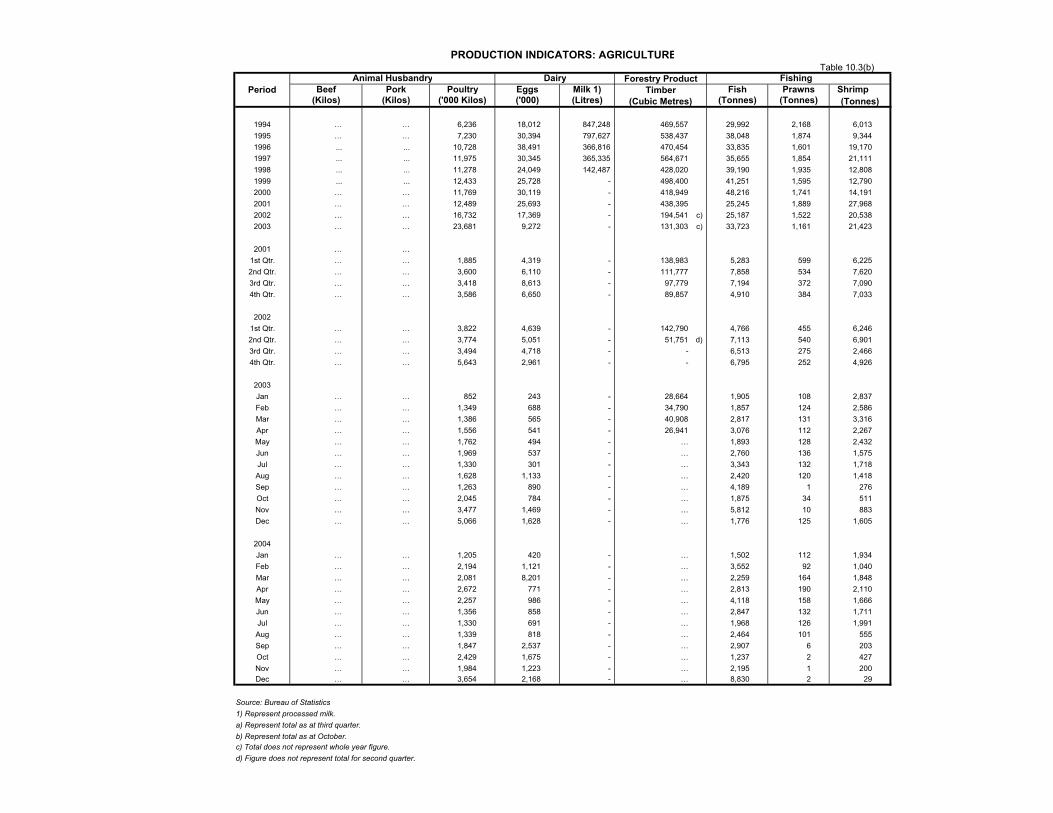
PRODUCTION INDICATORS: AGRICULTURE
Animal Husbandry Dairy Fishing Beef Pork Poultry Eggs Milk 1) Fish Prawns Shrimp
(Kilos) (Kilos) ('000 Kilos) ('000) (Litres) (Tonnes) (Tonnes)
1994 … … 6,236 18,012 847,248 469,557 29,992 2,168 6,013 1995 … … 7,230 30,394 797,627 538,437 38,048 1,874 9,344 1996 ... ... 10,728 38,491 366,816 470,454 33,835 1,601 19,170 1997 ... ... 11,975 30,345 365,335 564,671 35,655 1,854 21,111 1998 ... ... 11,278 24,049 142,487 428,020 39,190 1,935 12,808 1999 ... ... 12,433 25,728 - 498,400 41,251 1,595 12,790 2000 … … 11,769 30,119 - 418,949 48,216 1,741 14,191 2001 … … 12,489 25,693 - 438,395 25,245 1,889 27,968 2002 … … 16,732 17,369 - 194,541 c) 25,187 1,522 20,538 2003 … … 23,681 9,272 - 131,303 c) 33,723 1,161 21,423
2001 … …1st Qtr. … … 1,885 4,319 - 138,983 5,283 599 6,225 2nd Qtr. … … 3,600 6,110 - 111,777 7,858 534 7,620 3rd Qtr. … … 3,418 8,613 - 97,779 7,194 372 7,090 4th Qtr. … … 3,586 6,650 - 89,857 4,910 384 7,033
20021st Qtr. … … 3,822 4,639 - 142,790 4,766 455 6,246 2nd Qtr. … … 3,774 5,051 - 51,751 d) 7,113 540 6,901 3rd Qtr. … … 3,494 4,718 - - 6,513 275 2,466 4th Qtr. … … 5,643 2,961 - - 6,795 252 4,926
2003Jan … … 852 243 - 28,664 1,905 108 2,837 Feb … … 1,349 688 - 34,790 1,857 124 2,586 Mar … … 1,386 565 - 40,908 2,817 131 3,316 Apr … … 1,556 541 - 26,941 3,076 112 2,267 May … … 1,762 494 - … 1,893 128 2,432 Jun … … 1,969 537 - … 2,760 136 1,575 Jul … … 1,330 301 - … 3,343 132 1,718 Aug … … 1,628 1,133 - … 2,420 120 1,418 Sep … … 1,263 890 - … 4,189 1 276 Oct … … 2,045 784 - … 1,875 34 511 Nov … … 3,477 1,469 - … 5,812 10 883 Dec … … 5,066 1,628 - … 1,776 125 1,605
2004Jan … … 1,205 420 - … 1,502 112 1,934 Feb … … 2,194 1,121 - … 3,552 92 1,040 Mar … … 2,081 8,201 - … 2,259 164 1,848 Apr … … 2,672 771 - … 2,813 190 2,110 May … … 2,257 986 - … 4,118 158 1,666 Jun … … 1,356 858 - … 2,847 132 1,711 Jul … … 1,330 691 - … 1,968 126 1,991 Aug … … 1,339 818 - … 2,464 101 555 Sep … … 1,847 2,537 - … 2,907 6 203 Oct … … 2,429 1,675 - … 1,237 2 427 Nov … … 1,984 1,223 - … 2,195 1 200 Dec … … 3,654 2,168 - … 8,830 2 29
Source: Bureau of Statistics1) Represent processed milk.a) Represent total as at third quarter. b) Represent total as at October. c) Total does not represent whole year figure. d) Figure does not represent total for second quarter.
Table 10.3(b)
PeriodForestry Product
Timber(Cubic Metres) (Tonnes)
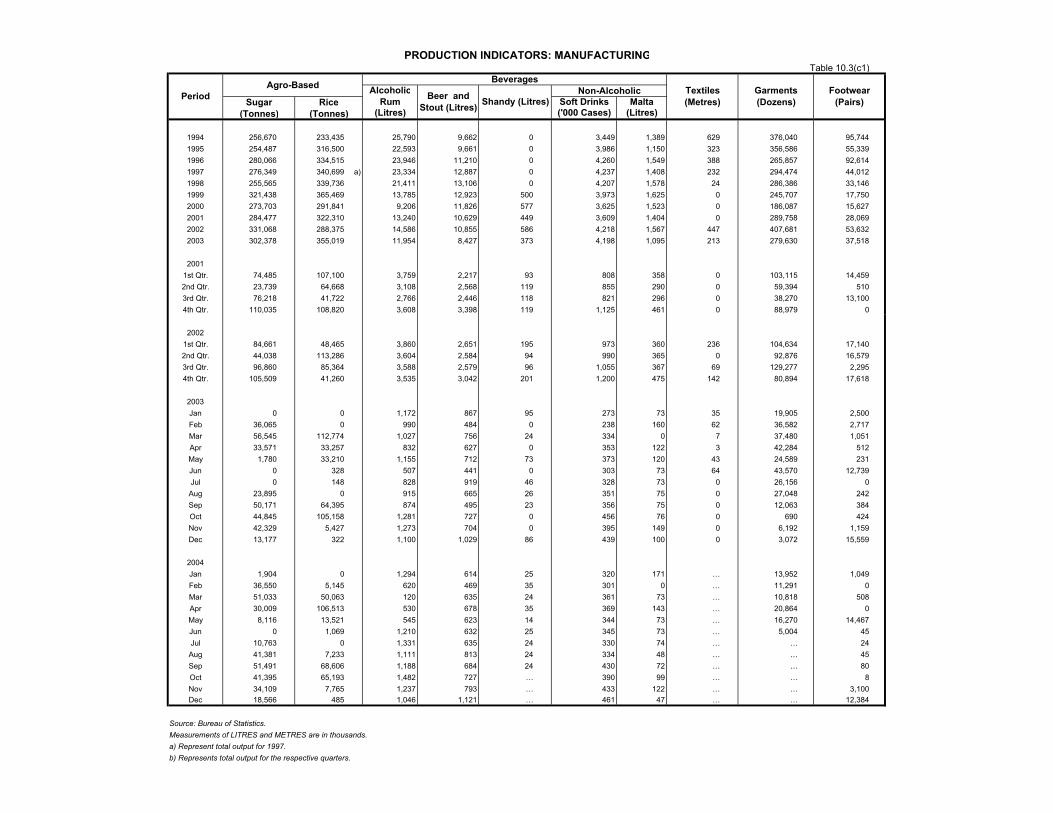
PRODUCTION INDICATORS: MANUFACTURING
AlcoholicRum Soft Drinks Malta
(Litres) ('000 Cases) (Litres)
1994 256,670 233,435 25,790 9,662 0 3,449 1,389 629 376,040 95,7441995 254,487 316,500 22,593 9,661 0 3,986 1,150 323 356,586 55,3391996 280,066 334,515 23,946 11,210 0 4,260 1,549 388 265,857 92,6141997 276,349 340,699 a) 23,334 12,887 0 4,237 1,408 232 294,474 44,0121998 255,565 339,736 21,411 13,106 0 4,207 1,578 24 286,386 33,1461999 321,438 365,469 13,785 12,923 500 3,973 1,625 0 245,707 17,7502000 273,703 291,841 9,206 11,826 577 3,625 1,523 0 186,087 15,6272001 284,477 322,310 13,240 10,629 449 3,609 1,404 0 289,758 28,0692002 331,068 288,375 14,586 10,855 586 4,218 1,567 447 407,681 53,6322003 302,378 355,019 11,954 8,427 373 4,198 1,095 213 279,630 37,518
20011st Qtr. 74,485 107,100 3,759 2,217 93 808 358 0 103,115 14,4592nd Qtr. 23,739 64,668 3,108 2,568 119 855 290 0 59,394 5103rd Qtr. 76,218 41,722 2,766 2,446 118 821 296 0 38,270 13,1004th Qtr. 110,035 108,820 3,608 3,398 119 1,125 461 0 88,979 0
20021st Qtr. 84,661 48,465 3,860 2,651 195 973 360 236 104,634 17,1402nd Qtr. 44,038 113,286 3,604 2,584 94 990 365 0 92,876 16,5793rd Qtr. 96,860 85,364 3,588 2,579 96 1,055 367 69 129,277 2,2954th Qtr. 105,509 41,260 3,535 3,042 201 1,200 475 142 80,894 17,618
2003Jan 0 0 1,172 867 95 273 73 35 19,905 2,500Feb 36,065 0 990 484 0 238 160 62 36,582 2,717Mar 56,545 112,774 1,027 756 24 334 0 7 37,480 1,051Apr 33,571 33,257 832 627 0 353 122 3 42,284 512May 1,780 33,210 1,155 712 73 373 120 43 24,589 231Jun 0 328 507 441 0 303 73 64 43,570 12,739Jul 0 148 828 919 46 328 73 0 26,156 0Aug 23,895 0 915 665 26 351 75 0 27,048 242Sep 50,171 64,395 874 495 23 356 75 0 12,063 384Oct 44,845 105,158 1,281 727 0 456 76 0 690 424Nov 42,329 5,427 1,273 704 0 395 149 0 6,192 1,159Dec 13,177 322 1,100 1,029 86 439 100 0 3,072 15,559
2004Jan 1,904 0 1,294 614 25 320 171 … 13,952 1,049Feb 36,550 5,145 620 469 35 301 0 … 11,291 0Mar 51,033 50,063 120 635 24 361 73 … 10,818 508Apr 30,009 106,513 530 678 35 369 143 … 20,864 0May 8,116 13,521 545 623 14 344 73 … 16,270 14,467Jun 0 1,069 1,210 632 25 345 73 … 5,004 45Jul 10,763 0 1,331 635 24 330 74 … … 24Aug 41,381 7,233 1,111 813 24 334 48 … … 45Sep 51,491 68,606 1,188 684 24 430 72 … … 80Oct 41,395 65,193 1,482 727 … 390 99 … … 8Nov 34,109 7,765 1,237 793 … 433 122 … … 3,100Dec 18,566 485 1,046 1,121 … 461 47 … … 12,384
Source: Bureau of Statistics.Measurements of LITRES and METRES are in thousands.a) Represent total output for 1997.b) Represents total output for the respective quarters.
Garments (Dozens)
Footwear (Pairs)Shandy (Litres)
Textiles (Metres)
Table 10.3(c1)
PeriodAgro-Based
Rice(Tonnes)
Beer and Stout (Litres)
BeveragesNon-Alcoholic
Sugar(Tonnes)
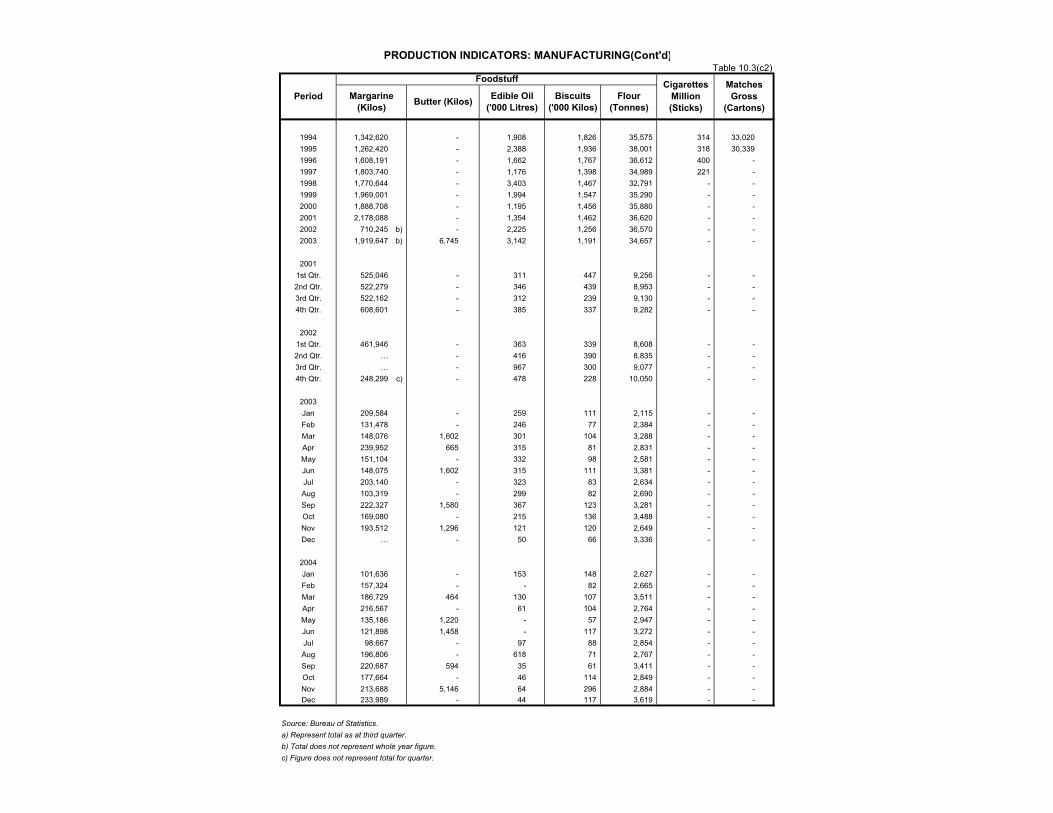
PRODUCTION INDICATORS: MANUFACTURING(Cont'd)
Foodstuff
1994 1,342,620 - 1,908 1,826 35,575 314 33,020 1995 1,262,420 - 2,388 1,936 38,001 318 30,339 1996 1,608,191 - 1,662 1,767 36,612 400 - 1997 1,803,740 - 1,176 1,398 34,989 221 - 1998 1,770,644 - 3,403 1,467 32,791 - - 1999 1,969,001 - 1,994 1,547 35,290 - - 2000 1,888,708 - 1,195 1,456 35,880 - - 2001 2,178,088 - 1,354 1,462 36,620 - - 2002 710,245 b) - 2,225 1,256 36,570 - - 2003 1,919,647 b) 6,745 3,142 1,191 34,657 - -
20011st Qtr. 525,046 - 311 447 9,256 - - 2nd Qtr. 522,279 - 346 439 8,953 - - 3rd Qtr. 522,162 - 312 239 9,130 - - 4th Qtr. 608,601 - 385 337 9,282 - -
20021st Qtr. 461,946 - 363 339 8,608 - - 2nd Qtr. … - 416 390 8,835 - - 3rd Qtr. … - 967 300 9,077 - - 4th Qtr. 248,299 c) - 478 228 10,050 - -
2003Jan 209,584 - 259 111 2,115 - - Feb 131,478 - 246 77 2,384 - - Mar 148,076 1,602 301 104 3,288 - - Apr 239,952 665 315 81 2,831 - - May 151,104 - 332 98 2,581 - - Jun 148,075 1,602 315 111 3,381 - - Jul 203,140 - 323 83 2,634 - - Aug 103,319 - 299 82 2,690 - - Sep 222,327 1,580 367 123 3,281 - - Oct 169,080 - 215 136 3,488 - - Nov 193,512 1,296 121 120 2,649 - - Dec … - 50 66 3,336 - -
2004Jan 101,636 - 153 148 2,627 - - Feb 157,324 - - 82 2,665 - - Mar 186,729 464 130 107 3,511 - - Apr 216,567 - 61 104 2,764 - - May 135,186 1,220 - 57 2,947 - - Jun 121,898 1,458 - 117 3,272 - - Jul 98,667 - 97 88 2,854 - - Aug 196,806 - 618 71 2,767 - - Sep 220,687 594 35 61 3,411 - - Oct 177,664 - 46 114 2,849 - - Nov 213,688 5,146 64 296 2,884 - - Dec 233,989 - 44 117 3,619 - -
Source: Bureau of Statistics.a) Represent total as at third quarter.b) Total does not represent whole year figure.c) Figure does not represent total for quarter.
Table 10.3(c2)
Period Edible Oil ('000 Litres)
Biscuits ('000 Kilos)
Flour (Tonnes)
Cigarettes Million (Sticks)
Matches Gross
(Cartons)Margarine
(Kilos) Butter (Kilos)
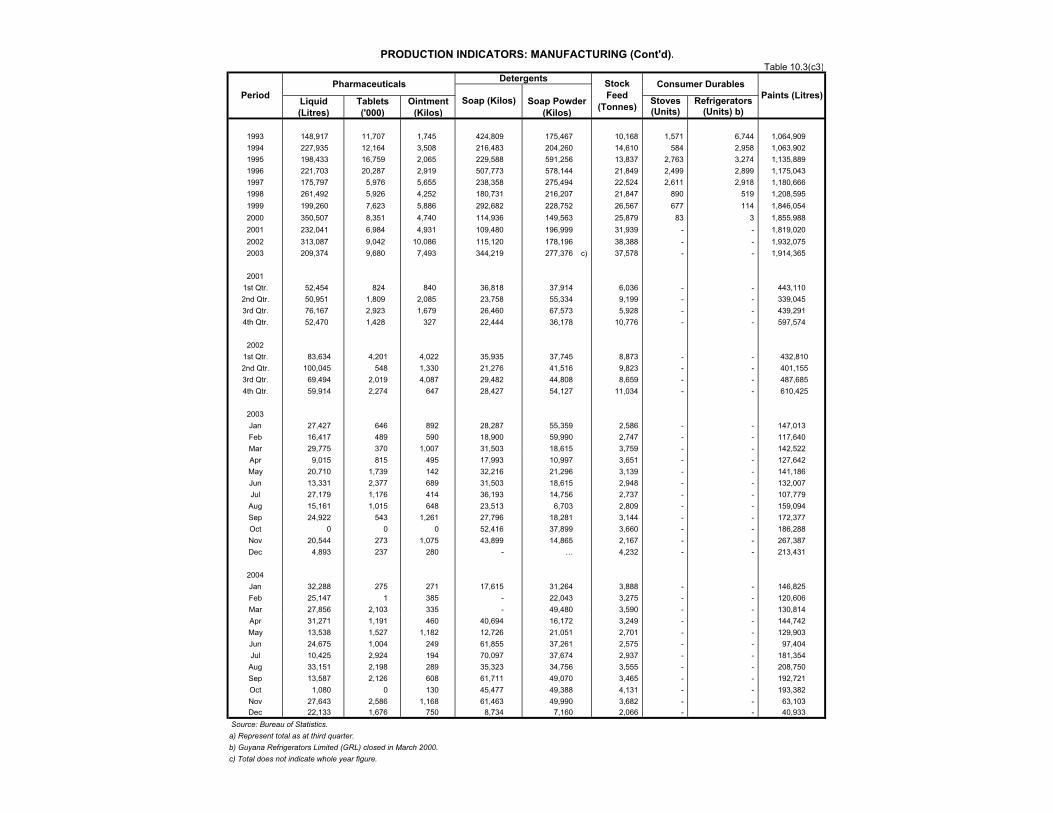
PRODUCTION INDICATORS: MANUFACTURING (Cont'd).
Stoves Refrigerators(Units) (Units) b)
1993 148,917 11,707 1,745 424,809 175,467 10,168 1,571 6,744 1,064,909 1994 227,935 12,164 3,508 216,483 204,260 14,610 584 2,958 1,063,902 1995 198,433 16,759 2,065 229,588 591,256 13,837 2,763 3,274 1,135,889 1996 221,703 20,287 2,919 507,773 578,144 21,849 2,499 2,899 1,175,043 1997 175,797 5,976 5,655 238,358 275,494 22,524 2,611 2,918 1,180,666 1998 261,492 5,926 4,252 180,731 216,207 21,847 890 519 1,208,595 1999 199,260 7,623 5,886 292,682 228,752 26,567 677 114 1,846,054 2000 350,507 8,351 4,740 114,936 149,563 25,879 83 3 1,855,988 2001 232,041 6,984 4,931 109,480 196,999 31,939 - - 1,819,020 2002 313,087 9,042 10,086 115,120 178,196 38,388 - - 1,932,075 2003 209,374 9,680 7,493 344,219 277,376 c) 37,578 - - 1,914,365
20011st Qtr. 52,454 824 840 36,818 37,914 6,036 - - 443,110 2nd Qtr. 50,951 1,809 2,085 23,758 55,334 9,199 - - 339,045 3rd Qtr. 76,167 2,923 1,679 26,460 67,573 5,928 - - 439,291 4th Qtr. 52,470 1,428 327 22,444 36,178 10,776 - - 597,574
20021st Qtr. 83,634 4,201 4,022 35,935 37,745 8,873 - - 432,8102nd Qtr. 100,045 548 1,330 21,276 41,516 9,823 - - 401,1553rd Qtr. 69,494 2,019 4,087 29,482 44,808 8,659 - - 487,6854th Qtr. 59,914 2,274 647 28,427 54,127 11,034 - - 610,425
2003Jan 27,427 646 892 28,287 55,359 2,586 - - 147,013 Feb 16,417 489 590 18,900 59,990 2,747 - - 117,640 Mar 29,775 370 1,007 31,503 18,615 3,759 - - 142,522 Apr 9,015 815 495 17,993 10,997 3,651 - - 127,642 May 20,710 1,739 142 32,216 21,296 3,139 - - 141,186 Jun 13,331 2,377 689 31,503 18,615 2,948 - - 132,007 Jul 27,179 1,176 414 36,193 14,756 2,737 - - 107,779 Aug 15,161 1,015 648 23,513 6,703 2,809 - - 159,094 Sep 24,922 543 1,261 27,796 18,281 3,144 - - 172,377 Oct 0 0 0 52,416 37,899 3,660 - - 186,288 Nov 20,544 273 1,075 43,899 14,865 2,167 - - 267,387 Dec 4,893 237 280 - … 4,232 - - 213,431
2004Jan 32,288 275 271 17,615 31,264 3,888 - - 146,825 Feb 25,147 1 385 - 22,043 3,275 - - 120,606 Mar 27,856 2,103 335 - 49,480 3,590 - - 130,814 Apr 31,271 1,191 460 40,694 16,172 3,249 - - 144,742 May 13,538 1,527 1,182 12,726 21,051 2,701 - - 129,903 Jun 24,675 1,004 249 61,855 37,261 2,575 - - 97,404 Jul 10,425 2,924 194 70,097 37,674 2,937 - - 181,354 Aug 33,151 2,198 289 35,323 34,756 3,555 - - 208,750 Sep 13,587 2,126 608 61,711 49,070 3,465 - - 192,721 Oct 1,080 0 130 45,477 49,388 4,131 - - 193,382 Nov 27,643 2,586 1,168 61,463 49,990 3,682 - - 63,103 Dec 22,133 1,676 750 8,734 7,160 2,066 - - 40,933
Source: Bureau of Statistics.a) Represent total as at third quarter.b) Guyana Refrigerators Limited (GRL) closed in March 2000.c) Total does not indicate whole year figure.
(Kilos)
Stock Feed
(Tonnes)
Detergents
Soap (Kilos) Soap Powder (Kilos)
Table 10.3(c3)
PharmaceuticalsPeriod Liquid
(Litres) ('000)Tablets
Consumer DurablesPaints (Litres)Ointment
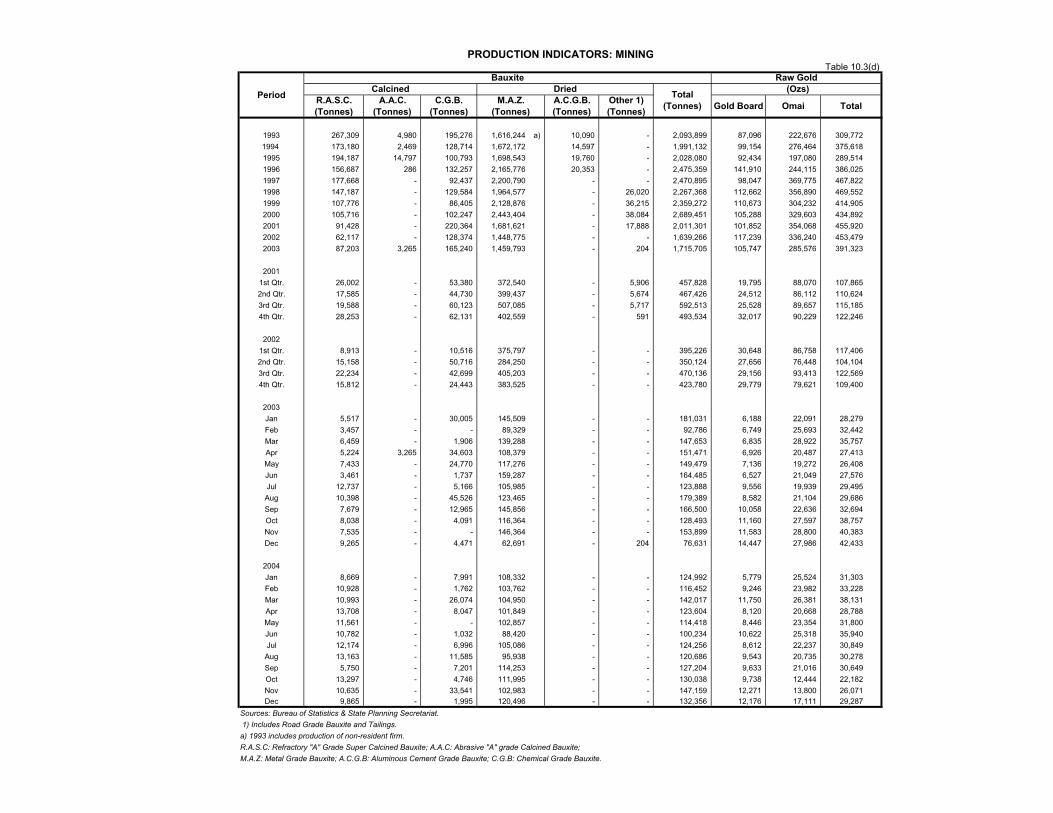
PRODUCTION INDICATORS: MINING
Bauxite Raw GoldCalcined Dried (Ozs)
1993 267,309 4,980 195,276 1,616,244 a) 10,090 - 2,093,899 87,096 222,676 309,772 1994 173,180 2,469 128,714 1,672,172 14,597 - 1,991,132 99,154 276,464 375,618 1995 194,187 14,797 100,793 1,698,543 19,760 - 2,028,080 92,434 197,080 289,514 1996 156,687 286 132,257 2,165,776 20,353 - 2,475,359 141,910 244,115 386,025 1997 177,668 - 92,437 2,200,790 - - 2,470,895 98,047 369,775 467,822 1998 147,187 - 129,584 1,964,577 - 26,020 2,267,368 112,662 356,890 469,552 1999 107,776 - 86,405 2,128,876 - 36,215 2,359,272 110,673 304,232 414,905 2000 105,716 - 102,247 2,443,404 - 38,084 2,689,451 105,288 329,603 434,892 2001 91,428 - 220,364 1,681,621 - 17,888 2,011,301 101,852 354,068 455,920 2002 62,117 - 128,374 1,448,775 - - 1,639,266 117,239 336,240 453,479 2003 87,203 3,265 165,240 1,459,793 - 204 1,715,705 105,747 285,576 391,323
20011st Qtr. 26,002 - 53,380 372,540 - 5,906 457,828 19,795 88,070 107,865 2nd Qtr. 17,585 - 44,730 399,437 - 5,674 467,426 24,512 86,112 110,624 3rd Qtr. 19,588 - 60,123 507,085 - 5,717 592,513 25,528 89,657 115,185 4th Qtr. 28,253 - 62,131 402,559 - 591 493,534 32,017 90,229 122,246
20021st Qtr. 8,913 - 10,516 375,797 - - 395,226 30,648 86,758 117,406 2nd Qtr. 15,158 - 50,716 284,250 - - 350,124 27,656 76,448 104,104 3rd Qtr. 22,234 - 42,699 405,203 - - 470,136 29,156 93,413 122,569 4th Qtr. 15,812 - 24,443 383,525 - - 423,780 29,779 79,621 109,400
2003Jan 5,517 - 30,005 145,509 - - 181,031 6,188 22,091 28,279 Feb 3,457 - - 89,329 - - 92,786 6,749 25,693 32,442 Mar 6,459 - 1,906 139,288 - - 147,653 6,835 28,922 35,757 Apr 5,224 3,265 34,603 108,379 - - 151,471 6,926 20,487 27,413 May 7,433 - 24,770 117,276 - - 149,479 7,136 19,272 26,408 Jun 3,461 - 1,737 159,287 - - 164,485 6,527 21,049 27,576 Jul 12,737 - 5,166 105,985 - - 123,888 9,556 19,939 29,495 Aug 10,398 - 45,526 123,465 - - 179,389 8,582 21,104 29,686 Sep 7,679 - 12,965 145,856 - - 166,500 10,058 22,636 32,694 Oct 8,038 - 4,091 116,364 - - 128,493 11,160 27,597 38,757 Nov 7,535 - - 146,364 - - 153,899 11,583 28,800 40,383 Dec 9,265 - 4,471 62,691 - 204 76,631 14,447 27,986 42,433
2004Jan 8,669 - 7,991 108,332 - - 124,992 5,779 25,524 31,303 Feb 10,928 - 1,762 103,762 - - 116,452 9,246 23,982 33,228 Mar 10,993 - 26,074 104,950 - - 142,017 11,750 26,381 38,131 Apr 13,708 - 8,047 101,849 - - 123,604 8,120 20,668 28,788 May 11,561 - - 102,857 - - 114,418 8,446 23,354 31,800 Jun 10,782 - 1,032 88,420 - - 100,234 10,622 25,318 35,940 Jul 12,174 - 6,996 105,086 - - 124,256 8,612 22,237 30,849 Aug 13,163 - 11,585 95,938 - - 120,686 9,543 20,735 30,278 Sep 5,750 - 7,201 114,253 - - 127,204 9,633 21,016 30,649 Oct 13,297 - 4,746 111,995 - - 130,038 9,738 12,444 22,182 Nov 10,635 - 33,541 102,983 - - 147,159 12,271 13,800 26,071 Dec 9,865 - 1,995 120,496 - - 132,356 12,176 17,111 29,287
Sources: Bureau of Statistics & State Planning Secretariat. 1) Includes Road Grade Bauxite and Tailings.a) 1993 includes production of non-resident firm.R.A.S.C: Refractory "A" Grade Super Calcined Bauxite; A.A.C: Abrasive "A" grade Calcined Bauxite;M.A.Z: Metal Grade Bauxite; A.C.G.B: Aluminous Cement Grade Bauxite; C.G.B: Chemical Grade Bauxite.
M.A.Z. (Tonnes)
R.A.S.C. (Tonnes)
A.A.C. (Tonnes)
C.G.B. (Tonnes)
Table 10.3(d)
PeriodOmai Total
Total (Tonnes) Gold BoardOther 1)
(Tonnes)A.C.G.B. (Tonnes)
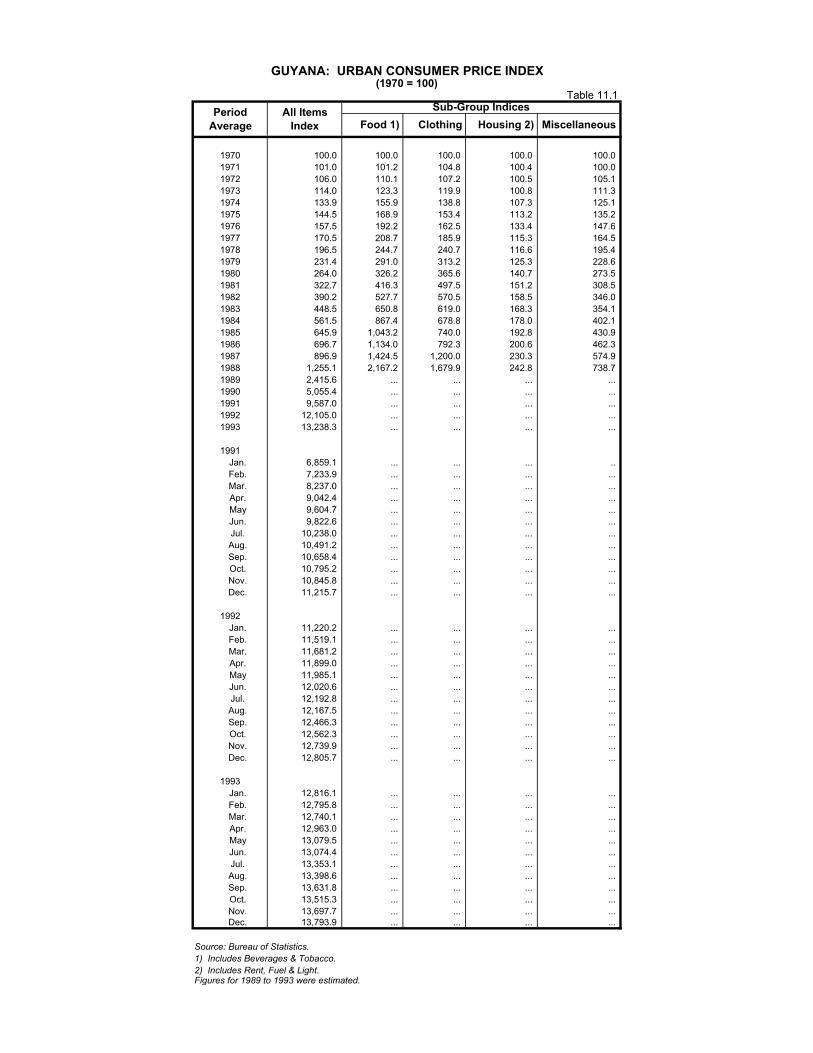
GUYANA: URBAN CONSUMER PRICE INDEX(1970 = 100)
Sub-Group Indices
1970 100.0 100.0 100.0 100.0 100.0 1971 101.0 101.2 104.8 100.4 100.0 1972 106.0 110.1 107.2 100.5 105.1 1973 114.0 123.3 119.9 100.8 111.3 1974 133.9 155.9 138.8 107.3 125.1 1975 144.5 168.9 153.4 113.2 135.2 1976 157.5 192.2 162.5 133.4 147.6 1977 170.5 208.7 185.9 115.3 164.5 1978 196.5 244.7 240.7 116.6 195.4 1979 231.4 291.0 313.2 125.3 228.6 1980 264.0 326.2 365.6 140.7 273.5 1981 322.7 416.3 497.5 151.2 308.5 1982 390.2 527.7 570.5 158.5 346.0 1983 448.5 650.8 619.0 168.3 354.1 1984 561.5 867.4 678.8 178.0 402.1 1985 645.9 1,043.2 740.0 192.8 430.9 1986 696.7 1,134.0 792.3 200.6 462.3 1987 896.9 1,424.5 1,200.0 230.3 574.9 1988 1,255.1 2,167.2 1,679.9 242.8 738.7 1989 2,415.6 ... ... ... ...1990 5,055.4 ... ... ... ...1991 9,587.0 ... ... ... ...1992 12,105.0 ... ... ... ...1993 13,238.3 ... ... ... ...
1991 Jan. 6,859.1 ... ... ... .. Feb. 7,233.9 ... ... ... ... Mar. 8,237.0 ... ... ... ... Apr. 9,042.4 ... ... ... ... May 9,604.7 ... ... ... ... Jun. 9,822.6 ... ... ... ... Jul. 10,238.0 ... ... ... ... Aug. 10,491.2 ... ... ... ... Sep. 10,658.4 ... ... ... ... Oct. 10,795.2 ... ... ... ... Nov. 10,845.8 ... ... ... ... Dec. 11,215.7 ... ... ... ...
1992
Jan. 11,220.2 ... ... ... ... Feb. 11,519.1 ... ... ... ... Mar. 11,681.2 ... ... ... ... Apr. 11,899.0 ... ... ... ... May 11,985.1 ... ... ... ... Jun. 12,020.6 ... ... ... ... Jul. 12,192.8 ... ... ... ... Aug. 12,167.5 ... ... ... ... Sep. 12,466.3 ... ... ... ... Oct. 12,562.3 ... ... ... ... Nov. 12,739.9 ... ... ... ... Dec. 12,805.7 ... ... ... ...
1993 Jan. 12,816.1 ... ... ... ... Feb. 12,795.8 ... ... ... ... Mar. 12,740.1 ... ... ... ... Apr. 12,963.0 ... ... ... ... May 13,079.5 ... ... ... ... Jun. 13,074.4 ... ... ... ... Jul. 13,353.1 ... ... ... ... Aug. 13,398.6 ... ... ... ... Sep. 13,631.8 ... ... ... ... Oct. 13,515.3 ... ... ... ... Nov. 13,697.7 ... ... ... ... Dec. 13,793.9 ... ... ... ...
Source: Bureau of Statistics.1) Includes Beverages & Tobacco.2) Includes Rent, Fuel & Light.Figures for 1989 to 1993 were estimated.
Table 11.1
Food 1) Clothing Housing 2) MiscellaneousAll Items
IndexPeriod
Average
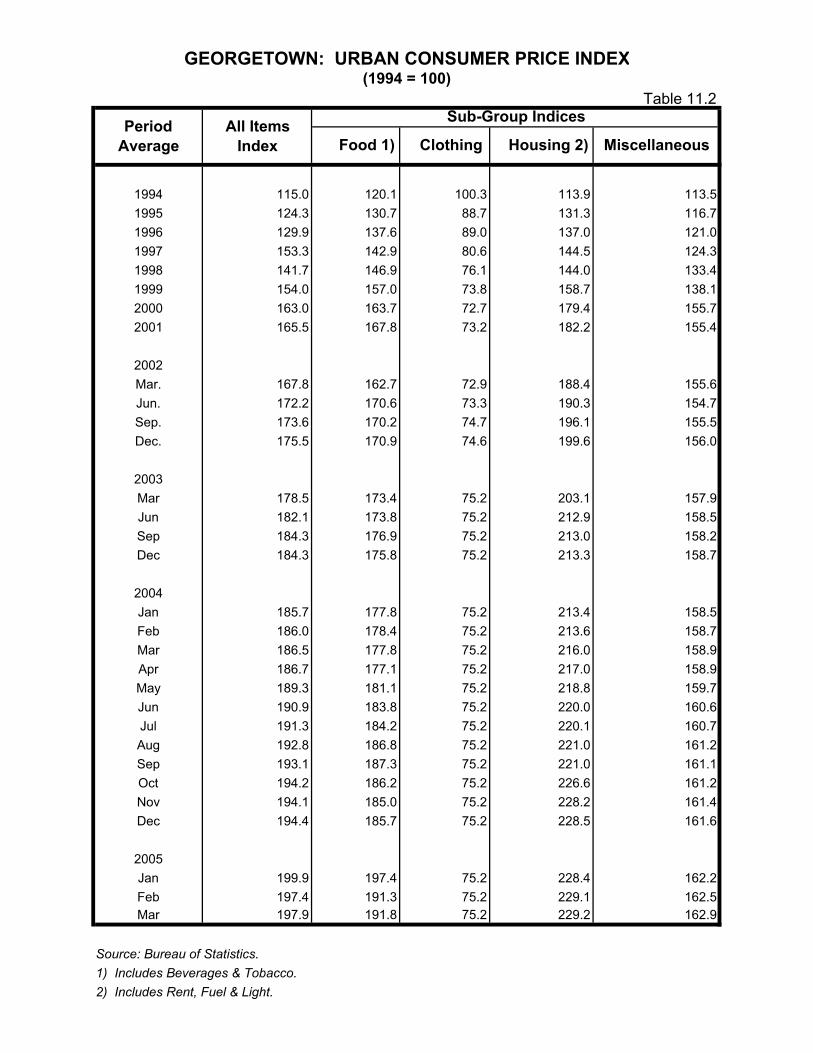
GEORGETOWN: URBAN CONSUMER PRICE INDEX(1994 = 100)
Sub-Group Indices
1994 115.0 120.1 100.3 113.9 113.51995 124.3 130.7 88.7 131.3 116.71996 129.9 137.6 89.0 137.0 121.01997 153.3 142.9 80.6 144.5 124.31998 141.7 146.9 76.1 144.0 133.41999 154.0 157.0 73.8 158.7 138.12000 163.0 163.7 72.7 179.4 155.72001 165.5 167.8 73.2 182.2 155.4
2002Mar. 167.8 162.7 72.9 188.4 155.6Jun. 172.2 170.6 73.3 190.3 154.7Sep. 173.6 170.2 74.7 196.1 155.5Dec. 175.5 170.9 74.6 199.6 156.0
2003Mar 178.5 173.4 75.2 203.1 157.9Jun 182.1 173.8 75.2 212.9 158.5Sep 184.3 176.9 75.2 213.0 158.2Dec 184.3 175.8 75.2 213.3 158.7
2004Jan 185.7 177.8 75.2 213.4 158.5Feb 186.0 178.4 75.2 213.6 158.7Mar 186.5 177.8 75.2 216.0 158.9Apr 186.7 177.1 75.2 217.0 158.9May 189.3 181.1 75.2 218.8 159.7Jun 190.9 183.8 75.2 220.0 160.6Jul 191.3 184.2 75.2 220.1 160.7Aug 192.8 186.8 75.2 221.0 161.2Sep 193.1 187.3 75.2 221.0 161.1Oct 194.2 186.2 75.2 226.6 161.2Nov 194.1 185.0 75.2 228.2 161.4Dec 194.4 185.7 75.2 228.5 161.6
2005Jan 199.9 197.4 75.2 228.4 162.2Feb 197.4 191.3 75.2 229.1 162.5Mar 197.9 191.8 75.2 229.2 162.9
Source: Bureau of Statistics.1) Includes Beverages & Tobacco.2) Includes Rent, Fuel & Light.
Table 11.2
Period Average
All Items Index Food 1) Clothing Housing 2) Miscellaneous

CARICOM COUNTRIES: CONSUMER PRICE INDICES
1993 81.7 71.5 91.7 99.71994 94.8 92.7 96.4 101.41995 102.0 112.9 ... 104.01996 108.8 131.2 105.3 103.71997 113.3 144.0 109.0 107.81998 118.2 155.5 ... 109.41999 128.4 166.1 119.6 112.62000 135.9 176.2 126.3 116.92001 138.0 191.6 … 115.4
2002Mar. 139.9 192.7 … …Jun. 143.6 195.9 … …Sep. 144.8 200.5 134.9 …Dec. 146.3 205.5 136.0 117.3
2003Mar 148.8 204.6 136.4 118.0Jun 151.8 216.9 138.4 118.9Sep 153.7 226.8 138.9 118.6Dec 153.7 234.4 … 117.6
2004Jan 154.8 237.2 … …Feb 155.1 237.7 … …Mar 155.5 … … …Apr 155.7 … … …May 157.8 … … …Jun 159.2 … … …Jul 159.5 … … …Aug 160.8 … … …Sep 161.0 … … …Oct 161.9 … … …Nov 161.9 … … …Dec 162.1 … … …
2005Jan 166.7 … … …Feb 164.6 … … …Mar 165.0 … … …
Sources : IMF International Financial Statistics; 1) Bureau of Statistics and Bank of Guyana. Base year was shifted from 1990 to 1995.
Barbados (1995 = 100)
Table 11.3
Period Average
Guyana (Urban) 1)
(1995 = 100)
Jamaica (1995 = 100)
Trinidad (1995 = 100)
I. GENERAL NOTES
Symbols Used
... Indicates that data are not available;
- Indicates that the figure is zero or less than half the final digit shown or that the item
does not exist;
- Used between two period (eg 1989/90 or July-September) to indicate the years or
months covered including the beginning and the ending year or month as the case may
be;
/ Used between years (eg 1989/90) to indicate a crop year or fiscal year.
� Means incomplete data due probably to under-reporting or partial response by
respondents.
* Means preliminary figures.
** Means revised figures.
In some cases, the individual items do not always sum up to the totals due to rounding.
With effect from December 2002, the assets and liabilities of the banking system
include accrued interest.
Acknowledgement
The Bank of Guyana wishes to express its appreciation of the assistance received from
the Ministry of Finance, State Planning Secretariat, Commercial Banks, Bureau of
Statistics, some Public Corporations and other Private Sector agencies in the
compilation of the data.

1
II. NOTES TO THE TABLES
TABLE 1.1: Bank of Guyana: Assets
Foreign Assets
Balances with Foreign Banks: Deposits of the Central Bank with Foreign Banks. The data
also include holdings of foreign notes and gold.
Gold Tranche with the I.M.F.: One quarter of Guyana's subscription to the International
Monetary Fund (I.M.F.) quota, which is made in gold and/or convertible currencies.
Holdings of Special Drawing Rights: Unused portion of the Special Drawing Rights
(S.D.R.s) allocated by the I.M.F.
Money Market Securities: Holdings of short-and long-term debt instruments of foreign
governments and the International Bank for Reconstruction and Development (I.B.R.D.)
recorded at cost.
Claims on the Central Government: Holdings of the Government of Guyana Treasury Bills,
Debentures valued at cost and Advances from the Bank of Guyana. The Bank of Guyana Act
No. 19 of 1998 section 46 has since removed the possibility of advances to Government since
it restricted the Central Bank from extending credit directly or indirectly to the Government
form that date.
Advances to Commercial Banks: Short term credit to commercial banks.
Other Assets: Include fixed assets such as land and buildings, furniture and equipment.
Cheques in the process of collection, notes and coins issued by the British Caribbean Currency
Board, non-interest-bearing debentures, and other miscellaneous assets are also included.
TABLE 1.2: Bank of Guyana: Liabilities
Currency Issue: Notes and coins issued by the Bank.
Value of notes issued for October 1999 and August 2000 does not correspond with figures in
table 1.3 due to an accounting discrepancy.
Government Deposits: Current account deposits of the Central Government which includes
sterilised amount from open market type operation with effect from 1994.
Deposits of International Organisations: Obligations to the I.M.F.; local currency component
of the subscription to the I.M.F. quota; deposits of the I.B.R.D, the Caribbean Development
Bank (C.D.B.) and foreign central banks. Other foreign liabilities of the Bank of Guyana are
also included.
Bank Deposits-EPDs: Guyana dollar deposits with the Bank of Guyana made by Commercial
Banks on behalf of their customers pending foreign exchange releases to meet foreign
2
obligations which fell into arrears prior to 1990. This scheme was discontinued for foreign
obligations after 1990.
Bank Deposits-Other: Commercial banks' interest earning deposits and statutory reserve
deposits with Bank of Guyana are recorded here. With effect from December 1994, special
interest earning deposits of the Commercial Banks were discontinued in favour of
unremunerated required free reserves. The removal of remuneration for these deposits
coincided with the issue of three-year debentures to sterilise the prevailing excess liquidity
levels of banks.
Other Deposits: Includes deposits of National Insurance Scheme (N.I.S.), LivestockDevelopment Fund, Guyana Pension Scheme, Mayor and City Council, Sinking Funds,Guyana Co-operative Agricultural and Industrial Development Bank, Export DevelopmentFund No. 1, Guyana/Libya Agricultural Development Company Limited, and Guyana/LibyanFishing Company among others.
Authorised Share Capital: The enactment of the Bank of Guyana Act No. 19 of 1998provided for the increase in the capital for the Bank as part of the reform process.
Other Reserves: These reserves include General, Revaluation and Contingency Reserves.
Allocation of S.D.R.'s: Liability accruing from the SDRs allocated to Guyana, which arevalued at the equivalent of Guyana dollar amount converted through the S.D.R./U.S. dollarcross rate.
Other Liabilities: Include provision for accrued expenses, items in transit; revaluationaccounts; and miscellaneous items.
TABLE 1.3: Bank of Guyana: Currency Notes Issue
Total issue of less withdrawal of mutilated or spoiled legal tender notes. In December 1996,the Bank of Guyana introduced a G$1,000 as part of its currency reform process. This wasfollowed by the removal from the legal tender of the G$10, G$5, and G$1 notes with effectfrom January 1997 and their conversion to coins the new legal tender until June 30, 1997.
TABLE 1.4: Bank of Guyana: Coins Issue
Total issue of less withdrawals of defaced legal tender coins. The Bank of Guyana as part ofits currency reform programme introduced with effect from January 1, 1997, G$10, G$5, G$1coins as legal tender and removed from the specie the use of cents.
TABLE 2.1(a): Commercial Banks: Assets
Balances due from Banks abroad: Deposits of commercial banks with non-resident foreignbanks included head offices and branches.
Loans to Non-Residents: Commercial Bank lending to non-resident customers.Due to re-classification at a commercial bank, figures for Private Sector and Non-Residentloans have been revised from December 2000 to May 2002. In keeping with the MonetaryFinancial Statistics Manual (MFSM), figures for loans to Non – Residents, Private sector andpublic financial enterprises include accrued interest with effect from December 2002.
Other Foreign Assets: Include foreign currency holdings and all other claims on non-residentsby commercial banks. Due to reclassification at a commercial bank figures for Public SectorOther and Foreign Sector Other were revised from September 2002 to February 2003.
3
Securities: the total volume of Central Government Treasury Bills recorded at cost anddebentures held by commercial banks. In keeping with the Monetary Financial Statisticsmanual (MFSM), figures for Securities include accrued interest from Dec. 2002.
Loans: Central Government borrowing from the Commercial Banks. See note above underloans to non-residents.
Public Enterprises: Loans and advances extended by Commercial Banks to public financialbusiness enterprises. Public non-financial enterprises are defined as enterprises in whichGovernment owns above 50 per cent of the share capital. See note above under loans to non–residents.
Other: Commercial Banks’ claims on Local Government and the National Insurance Scheme.See note above under loans to non-residents
Non-Bank Financial Institutions: Loans issued to public and private non-bank financialinstitutions by commercials Banks’. See note above under loans to non-residents
Private Sector: Lending through loans and advances to private non-financial businessenterprises and individual customers. See note above under loans to non-residents.The decline in Private Sector Loans and advances resulted partly from a reclassification ofsome loans at one commercial bank. See note above under loans to non-residents.The acquisition Guyana National Co-operative Bank (GNCB)’s asset net of loan valuedG$8,473.0 million by the National Bank of Industry and Commerce Limited on March 15th,2003 resulted in the decline in Private Sector Loans and Advances during March 2003.
Deposits with Bank of Guyana: Include statutory reserve deposits and interest earningdeposits of the Commercial Banks. Effective December 28, 1994, interest-earning depositsdiscontinued.
External Payment Deposits (E.P.D): Guyana dollar deposits with the Bank of Guyana madeby Commercial Banks on behalf of their customers, pending foreign exchange releases to meetexternal obligations.
Currency: Commercial Banks' holdings of local notes and coins.
Other Assets: Include balances due from other Commercial Banks, Real estate mortgageloans, fixed assets such as land and building, furniture, equipment and other miscellaneousassets.
TABLE 2.1(b): Commercial Banks: Liabilities, Capital and Reserves
Balances due to Other Banks abroad: Foreign claims made on local commercial banks byHead Offices and other banks abroad.
Non-Resident Deposits: Total deposits made by non-resident customers with commercialbanks. In keeping with the Monetary Financial Statistics Manual (MFSM), figures for depositsto non-residents, Private sector and public financial enterprises include accrued interest witheffect from December 2002.
Other: Include all other foreign claims on Commercial Banks.
Central Government Deposits: Total demand, time and savings deposits made by the CentralGovernment with Commercial Banks. See note above under deposits to non-residents.
4
Public Enterprise Deposits: Total demand, time and savings deposits made by public non-financial enterprises with the Commercial Banks. Due to the sale of Aroaima BauxiteCompany to the government and a reclassification of its accounts from the private to publicsector, figures from January 2002 to April 2002 have been revised. See note above underdeposits to non-residents.
Other Public Deposits: Include total deposits of Local Government and National InsuranceScheme. See note above under deposits to non-residents.
Non-Bank Financial Institutions Deposits: Consist of total deposits made by Public andPrivate Financial Institutions. See note above under deposits to non-residents.
Private Sector Deposits: Include total demand, time and savings deposits of Private non-financial Business Enterprises and individual customers. See note above under PublicEnterprises Deposits. See note above under deposits to non-residents.
External Payment Deposits: Comprise customers' deposits (public and private sector) withcommercial banks on account of External Liabilities prior to 1990 and awaiting foreignexchange releases from the BOG.
Bank of Guyana: Commercial Bank short-term borrowing from the Bank of Guyana.
Other Liabilities: Other liabilities of the Commercial Banks include manager's cheques,acceptances, provision for taxes and other miscellaneous liabilities.
Capital and Reserve: the acquisition Guyana National Co-operative Bank (GNCB)’s assetsnet of loans valued G$8,473.0 million by the National Bank of Industry and CommerceLimited on March 15th, 2003 resulted n the decline in the capital and reserve of the bankingsystem during March 2003.
TABLE 2.2: Commercial Banks: Total DepositsTotal demand, savings and time deposits of residents and non-residents excluding inter-bankdeposits are presented. Foreign currencies denominated deposits are also included here. Seenote under Public Enterprises Deposits for Tables 2.1 (b) above. See note under Non –Resident Deposits for Table 2.1(b) above.
TABLE 2.3: Commercial Banks: Demand DepositsCurrent account deposits of residents and non-residents; inter-bank deposits are excluded. Seenote under Public Enterprises Deposits for Tables 2.1 (b) above.
TABLE 2.4: Commercial Banks: Time DepositsFixed deposits of residents and non-residents with a minimum withdrawal notice of threemonths; exclude inter-bank deposits. See note under non-resident deposits for Table 2.1(b)above.
TABLE 2.5: Commercial Banks: Savings DepositsDeposits with minimum withdrawal notice of one day; exclude inter-bank deposits. See noteunder Public Enterprises Deposits for Tables 2.1 (b) above. See note non-resident deposits forTable 2.1(b) above.
TABLE 2.6: Commercial Banks: Time Deposits by MaturityIncludes deposits of both residents and non-residents.
TABLE 2.7: Commercial Banks: Savings DepositsIncludes deposits by both residents and non-residents. Ending balance on savings accounts forNovember 2002 do not equate to the opening balance for December 2002 due to the additionof accrued interest to the December 2002 opening balance. The ending balance for February
5
2003 saving accounts differs from the opening balance for March 2003 due to thereclassification from the demand and time account to saving accounts.
TABLE 2.9: Commercial Banks: Clearing BalancesComprise total amount of cheques cleared by and debited to the accounts of the CommercialBanks. A National Clearing House was established at the Bank of Guyana during 1998whereby large (in excess of G$500,000) and small valued cheques are cleared. Data recordedafter 1998 in this table reflect the value of small valued cheques cleared over the reportingperiod, which is consistent with prior years data.
TABLE 2.10: Commercial Banks: Total Loans and AdvancesThe data include loans and advances to residents and non-residents. Real estate mortgage loansand inter-bank loans are excluded. The total of loans and advances to the private sector differsfrom total credit to the private sector in Table 3.1(Monetary Survey). The totals for credit tothe private sector in Table 3.1 include local securities, other credit instruments and real estatemortgage loans. See note under Loans to Non-Residents for Table 2.1 (a) above. See noteunder Private Sector for Table 2.1(a) above.
TABLE 2.11: Commercial Banks: Demand Loans and Advances
The data cover lending for short periods including overnight loans to residents and non-residents and exclude inter-bank loans. See Note under loans on non-resident for Table 2.1(a)above. See note under Private Sector for Table 2.1(a) above.
TABLE 2.12: Commercial Banks: Term Loans and Advances
The Loans and advances are for longer periods extended to residents and non-residents; inter-bank lending is excluded. See note under Private Sector for Table 2.1(a) above. See note underloans to non-residents for Table 2.1(a) above. See note under loans Private Sector for Table2.1(a) above.
TABLE 2.13: Commercial Banks: Loans and Advances to Residents by Sector
The data provided record balances at the end of the respective period and therefore indicatesthe indebtedness of the respective industries at the end of the reporting period. The value ofcredit obtained by each industry for a given period can be obtained by taking the differencebetween the balances at the end of the desired period and that immediately preceding. Thebalances in this table exclude inter-bank loans, real estate mortgage loans, local securities andother credit instruments. It should be noted that gross indebtedness of the sugar and riceindustry can be obtained by adding the balances of sugar cane and sugar and molassesmanufacturing of sugar, and paddy and rice milling for rice respectively. See note under Loansto Non-Residents for Table 2.1 (a) above. See note under Private Sector for Table 2.1(a) above.
TABLE 2.14: Commercial Banks: Liquid Assets
The liquid assets comprise Bank of Guyana notes and coins, foreign currency held by banks,(special interest-earning) deposits held at the Bank of Guyana (BOG), balances due from othercommercial banks - both local and foreign, Government of Guyana treasury bills. Specialdeposits are stated according to Bank of Guyana records. The special reserves deposits (SDRs)established in 1969, discontinued in 1994 as the Bank of Guyana sought to develop its capacityto manage the excess reserves of the bank more effectively. Approximately, 75-80 per cent ofthe SDRs were absorbed through a sale of three year, variable rate, fixed date debenture to theCommercial Banks.
Prior to March 1989, the legally required level of liquid assets to be held by the CommercialBanks against their deposit liabilities was calculated as the sum of 20 percent of demandliabilities and 15 percent of time liabilities. During the period March 31, 1989 to May 15, 1991the determination of the required liquid assets held by the banks was based on actual holdingson specified dates.
6
Accordingly, from March 31, 1989 to June 30, 1990 required liquid assets were stipulated asthe actual holdings on March 15, 1989. Between July 30, 1990 and February 19, 1991 therequired liquid assets was based on the assets held by the banks on September 30, 1989.Further, between February 20, 1991 and May 14, 1991 the required balances were set as at theend of July 30, 1990.
With effect from May 15, 1991, however, the basis for calculating required liquid assets waschanged to 25 percent of demand liabilities and 20 percent of time liabilities.
Further, amendments to the liquid asset requirements became effective on 26th, October 1998.The liquid assets based period as been redefined as the Monday for Friday workweekimmediately proceeding the liquid asset maintenance period. The liquid asset requirement isdetermined by applying the prescribed percentages to the weekly average of the daily liabilitiesbalances at the close of business of each of the five days of the liquid asset base period.Figures for Treasury Bills were reclassify from December 2000 to December 2002.
TABLE 2.15: Commercial Banks: Minimum Reserve Requirements
Prior to May 16, 1991, the minimum required reserves of the Commercial Banks werecalculated as 6 percent of demand liabilities and 4 percent of time liabilities. There percentageswere changed with effect from May 16, 1991, to 11 percent of demand liabilities and 9 percentof time liabilities. Commencing April 7, 1994, the minimum required reserves of theCommercial Banks were again revised to the sum of 16 percent of demand liabilities and 14percent of time liabilities.On June 29, 1998, in addition to commercial banks, other licensed financial institutions wererequired to maintain balances with the Central Bank against their deposits and other liabilities.Further, the required reserve period has been changed on Monday to Friday workweek insteadof the Wednesday to Thursday week used previously. The required reserve period has beenreferred to as the reserve base period. The week following the current reserve base period, i.e.the reserve maintenance period is also based on the Monday to Friday workweek. The depositsand other liabilities to which the required reserve ratio(s) are applied are referred to as thereserve base. During the reserve maintenance period, all licensed financial institutions subjectto reserve requirement are required to maintain reserves against the relevant deposit and otherliabilities.Effective February 1, 1999, the required reserve ratio applicable to all liabilities of licensedfinancial institutions was lowered to twelve per cent (12 %). The first reserve base period forwhich the revised requirements became relevant was the 1st to 5th February 1999 while thereserve maintenance period was the 8th to 12th February 1999. However, reserve balances forthe non-bank licensed financial institutions are excluded from table 2.15.
TABLE 3.1: Monetary Survey
A consolidation of the balance sheets of the Bank of Guyana and commercial banks.
Foreign Assets (net)
Bank of Guyana: Gross foreign assets less gross foreign liabilities.
Commercial banks: Gross foreign assets less gross foreign liabilities. See note under Loansto Non-Residents for Table 2.1 (a) above.
Domestic Credit
Government (net): Gross lending to Central Government by the banking system (a sum of
Holdings of debentures, bonds, Treasury bills and loans and advances less total deposits of theCentral Government).
7
Public Enterprise (net): Gross borrowing by non-financial public enterprises from thebanking system less their deposits. See note under Public Enterprises Deposits for Table 2.1(b) above.
Other Public Sector (net): Gross borrowing from the banking system by local authorities andmunicipalities less their total deposits and other public sector funds. See note under loans tonon-residents for Table 2.1(b) above.
Non-Bank Financial Institution (net): Gross borrowing from the banking system by the non-bank financial intermediaries with the banking system less their deposits. See note under loansto non-residents for Table 2.1(b) above.
Private Sector: Gross borrowing from the banking system. See note under Loans to Non-Residents for Table 2.1 (a) above. See note under Private Sector for Table 2.1(a) above.
Money and Quasi-Money
Money: Currency outside banks plus private sector demand deposits, managers' cheques andacceptances. See note under Public Enterprises Deposits for Table 2.1 (b) above
Currency: Currency issue (Table 1.2) less currency holdings by Commercial Banks (Table2.1(a)).
Quasi-money: Time and savings deposits held by the private sector See note under PublicEnterprises Deposits for Table 2.1 (b) above.
Demand deposits: Balances of the private sector including managers' cheques andacceptances. See note under Public Enterprises Deposits for Table 2.1 (b) above.
Savings and Time deposits: Balances held by private sector. See note under Loans to Non-Residents for Table 2.1 (a) above.
Other (net): Includes the net sum of all assets and liabilities of the Bank of Guyana and theCommercial Banks not shown elsewhere.
TABLE 4.1: Guyana: Selected Interest Rates
Interest rates at Commercial banks and non-bank financial institutions on loans and deposits.The small savings rate represents an arithmetic average of savings deposit rates as reported bythe Commercial Banks. Treasury bill rates for all maturities reflect rates at the end of thereporting period. Special deposits have been discontinued with effect from December 1994.NBS deposit rate for September, October and December 2001 have been revised. Smallsavings rate for November 2001 has been revised. The rates for the Five Dollar Shares, Saveand Prosper Shares and the Deposits for NBS have been revised for July 2002. The averageDeposit rates for GNCB Trust Company has been revised for the period of September 2002.
TABLE 4.2: Commercial Banks: Selected Interest Rates
Arithmetic average of interest rates as reported by the Commercial Banks.
TABLE 4.3: Comparative Treasury Bills Rates And Bank Rates
The average discount rate on three month Treasury Bills for the U.K., U.S.A., Barbados,Trinidad, Guyana and Jamaica. The U.K. and U.S. rates are the average discount rates at thelast tender in each month. The rates for the CARICOM territories are those rates of monthlytender held towards the end of the month. Treasury Bills rates for Barbados for 2001 have beenrevised.
8
TABLE 5.1: The New Building Society: Assets and Liabilities
Assets
Foreign Assets: Includes holdings of foreign securities.
Cash and Deposits: Holdings of till cash and total deposits (demand, time and savings) atcommercial banks.
Government of Guyana Treasury Bills: Holdings of Treasury Bills recorded at book value.
Government of Guyana Securities: Holdings of debentures and defence bonds at book value.
Government of Guyana Debentures: Holdings of debentures at book value.
Local Authorities Securities: Bonds at book value.
Liabilities
Share deposits: A total of Five Dollar and Save and Prosper Share deposits.
Other Deposits: Fixed term deposits.
TABLE 5.2(a): Trust Companies: Assets
Prior to December 1998 data reflect the operation of Trust and Finance Companies. EffectiveDecember 1998 finance companies have been excluded from database. Trust Companies thusreflect the consolidated operation of Trust Company (Guyana) Limited, Globe TrustInvestment Company and Guyana National Co-operative Trust Company.
Cash: Currency in the till plus balances on cash management current accounts at commercialbanks. The figures in brackets result from overdrawn cash management accounts.
Deposits: Balances of savings and time deposits at commercial banks.
Government of Guyana Treasury Bills: Recorded at book value.
Local Government Securities: Recorded at book value.
TABLE 5.2(b): Trust Companies: Liabilities
Deposits - Business Firms: Balances held by private sector businesses.
Deposits - Individual Customers: Balances held by private individuals.
Deposits - Other customers: Balances held by other private sector agencies including non-profit organizations.
TABLE 5.2(c): Finance Companies: Assets
Prior to December 1998 data reflect the operation of Trust and Finance Companies. EffectiveDecember 1998 Trust companies have been excluded from database. Finance Companies thusreflect the consolidated operation of Secure International Finance Company, Beharry StockBrokers Limited and one merchant bank.
9
Cash: Currency in the till plus balances on cash management current accounts atcommercial banks. The figures in brackets result from overdrawn cash managementaccounts.
Deposits: Balances of savings and time deposits at commercial banks.
Government of Guyana Treasury Bills: Recorded at book value.
Local Government Securities: Recorded at book value.
TABLE 5.2(d): Finance Companies: LiabilitiesDeposits - Business Firms: Balances held by private sector businesses.
Deposits - Individual Customers: Balances held by private individuals.
Deposits - Other customers: Balances held by other private sector agencies including non-profit organizations.
TABLE 5.3: Domestic Life Insurance Companies: Assets and LiabilitiesThe data cover four insurance companies: Demerara Mutual Life Assurance Company,Guyana and Trinidad Mutual Life Insurance Company; Hand-in-Hand Mutual Life InsuranceCompany; North American Life Insurance Company Limited, and Clico Life and GeneralInsurance Company (S.A.) Guyana.
Assets
Foreign Commercial Bank Deposits: Deposits held in Foreign Commercial Banks.
Foreign Securities: Holdings of the government of the United Kingdom and CARICOMcountries and other foreign securities.
Other Foreign Assets: Balances due from reinsurance abroad, and other foreignmiscellaneous assets.
Government of Guyana Debentures: Holdings are recorded at book value.
Local Government Securities: Holdings are recorded at book value.
Securities in Firms: Holdings of commercial bills, shares and other securities recorded atbook value.
Liabilities
Life Insurance Fund: Insurance premia received.
Foreign Liabilities: Claims by non-residents, balances due to insurance companies abroad,non-resident life insurance funds and other miscellaneous liabilities.

10
TABLE 5.4 Pension Schemes: Assets and Liabilities
Assets
Foreign Sector: Includes foreign deposits and foreign securities.
Government of Guyana Treasury Bills: Holdings recorded at book value.
Government of Guyana Debentures: Holdings are recorded at book value.
Local Government Securities: Holdings of Local Government Securities recorded at bookvalue.
Liabilities
Pension Fund: Receipts from the twenty pension funds in Guyana which submit returns tothe Bank of Guyana.
TABLE 5.5 Guyana Co-operative Mortgage Finance Bank: Assets and Liabilities
Assets
Deposits: Balances of savings and time deposits at commercial banks.
Government Treasury Bills: Recorded at book value.
Liabilities
Caribbean Development Bank: Loans received/receivable from the Caribbean DevelopmentBank.Government Contribution: Receipts from Government to finance budgetary shortfalls andother outlays.
Debentures: Receipts from the sale of own debentures to the public.
TABLE 6.1: Central Government Finances: Summary
Current Revenue: The data include collection of taxes, other charges and fees. The data arerecorded on a cash basis.
Current Expenditure: The data include interest payment, interest charges and otherexpenditure. Repayment of Principal is not included. The data are recorded on a cash basis.
Current Surplus/Deficit: Current revenue less current expenditure.
Capital Receipts: These include proceeds from sale of assets and external grants.
Capital Expenditure: Investment expenditure; the data also include net transfers and lendingto the public enterprises for financing development projects.
Overall Surplus/Deficit: The total of current revenue and capital receipts less the total ofcurrent and capital expenditure.

11
Borrowing from abroad:
Net short term: Gross borrowing with a maturity of up to 1 year less repayment of principal.
Long terms net borrowing: Gross borrowing with a maturity of over 1 year less repaymentof principal.
Domestic Borrowing:
Borrowing from the banking system (net): The banking system holdings of Governmentdebentures, bonds, Treasury bills and loans and advances less Government deposits.
Non-bank borrowing: Borrowing outside the banking system. Short-term (net) includesTreasury bill holdings less redemptions and local suppliers credits. Long-term (net)borrowing comprises holdings of debentures and development bonds less redemptions.Holdings of debentures and Treasury Bills by sinking funds are excluded.
Other financing: Comprises mainly accumulated arrears on external debt repayment,rescheduling of debt and financing from counterpart funds.
TABLE 6.4: Public Corporations Finances: SummaryThe table summarises the financial operations of the public corporations and companies. Alldata from 1990 are based on cash flow statements. Prior to 1990 the data were on an accrualbasis.
TABLE 7.1 Domestic Public DebtComprises Government of Guyana Defence Bonds; Debentures; and Treasury Bills. Bankingsystem loans, advances and holdings by Sinking Funds are excluded. The data are recordedat face value.Defence Bonds: These are long term non-interest bearing savings certificates issued by theGovernment of Guyana. Data are at face value.
Government of Guyana Debentures: These are long term government securities withmaturities of over one year. Non-interest bearing debentures held by the Bank of Guyana areexcluded. Data are at face value.
Government of Guyana Treasury Bills: These are short term government securities withmaturities of ninety-one (91) days. Data are recorded at face value.
TABLE 7.2: Government of Guyana Treasury Bills by Holders and Defence BondsThe holdings Treasury Bills and short-term Defence Bonds are recorded at face value. Consequently, figures in this table will differ from those reported in the balance sheets of theBank of Guyana, Commercial Banks and non-bank financial institutions which are recordedat book value.
Other Financial Institutions: Consist of the non bank financial institutions viz:- buildingsocieties, Insurance Companies, Pension funds and Development Banks.
Public Sector: Include public enterprises, national insurance scheme, other funds andSinking funds.
Private Sector: Excludes Financial institutions.
12
Non-residents: Include foreign controlled firms domiciled in Guyana, foreign missions andorganisations.
TABLE 7.3 Government of Guyana: Debentures by Holders and Defence BondsThe holdings of Debentures and long-term Defence Bonds are at face value. These are longterm government securities with maturities of over one year. Non-interest bearing debenturesheld by the Bank of Guyana are excluded.
TABLE 7.4 Government of Guyana: Debentures By Maturities and Terms Data include all fixed Date,Equated Annuity and Special issues; at face value.
Fixed Date Debentures: These debentures have fixed dates for payments of principal andinterest.
Equated Annuity: Interest on this category of debentures is paid equally on a half yearlybasis.
Special Issues: Comprise Fixed date and Equated Annuity debentures issued to Bank ofGuyana and the National Insurance Scheme.In 1994 the Central Bank absorbed between 75to 80 per cent of the excess reserves of the banking system through a forced sale of a longterm (3 years) variable rate fixed date debenture.The interest was calculated at a rate of pointfive per cent (0.5 per cent) per annum above the regular three month treasury bill yield rateaveraged over the calender months prior to the interest due date.
TABLE 7.5: External Public Debt
The data comprise the stock of Central Government and Government guaranteed debtoutstanding.Bank of Guyana external debt is excluded.Bilateral debt: Debt contracted with foreign governments.
Multilateral debt: Debt contracted with international lending institutions such as the WorldBank, the Inter-American Development Bank, the Caribbean Development Bank and theEuropean Investment Bank but excludes amounts owed to the I.M.F.
Financial Institutions Debt: These debts include borrowing from foreign commercial banksand specialized official lending agencies.
Suppliers Credit: Obligations to suppliers for deferred payment after delivery of goodsand/or services.
Nationalization Debt: Amounts owing to foreigners in compensation for nationalised assets.
TABLES 8.1(1): Imports by End-UseThe data are compiled on a free on board basis (f.o.b.) based on customs returns.
TABLE 8.2 Domestic ExportsThe data are compiled on a free on board basis (f.o.b.) as recorded on customs returns. Figures (f.o.b.) for sugar, bauxite, rice, rum, shrimp and molasses are, however, collecteddirectly from the exporting agencies and compiled by the Bank of Guyana.
13
TABLE 8.6: International Reserves and Foreign Assets
International Reserves
Bank of Guyana Foreign Assets: Data include gold holdings, balances with foreign banks,foreign notes, foreign cash in the process of collection, gold tranche with I.M.F., S.D.R.holdings and money market securities.
Bank of Guyana Foreign Liabilities: Data include total short-term current liabilities, shortterm liabilities in arrears and total medium term liabilities in arrears. The liabilities includeinterest obligations. Rescheduled short-term liabilities are excluded.
Foreign Assets
Bank of Guyana Foreign Assets: The composition of the assets is identical to that ofInternational Reserves foreign assets above.
Bank of Guyana Foreign Liabilities: Data include all short-term liabilities (current, arrearsand rescheduled) and all medium term liabilities (current arrears and rescheduled). Theliabilities include interest obligations.
Commercial Banks Foreign Assets: Data include foreign currencies in banks, net balancesdue from Head Offices and other branches abroad, balances due from other banks abroad,foreign treasury bills and securities and credit to non-residents.
Commercial Banks Foreign Liabilities: Data include net balances due to Head Offices andother branches abroad, balances due to other banks abroad and deposits of non-residents. Seenote under Loans to Non-Residents for Table 2.1 (a) above.
TABLE 8.8 Balance of Payments
ExportsThe data are compiled on a free-on-broad (f.o.b.) basis as recorded on customs returns. Datafor products including sugar, rice, bauxite, rum, shrimp and molasses are collected directlyfrom the exporting agencies and compiled by the Bank of Guyana. The conversion rate is anaverage rate for the period for the United States dollar against the Guyana dollar.
ImportsThe data are compiled on a cost-insurance-freight (c.i.f) basis on customs returns. For fueland lubricants the data are collected from the National Energy Authority. The conversion rateis the average period rate for the United States dollar against the Guyana dollar.
The Merchandise Trade:The trade data in this table do not agree with those of tables 8.1(a) to 8.5(a) due mainly tovaluation differences.
TABLE 9.1 Changes in Bank of Guyana Transaction Exchange Rate
The Guyana dollar was fixed in Pound Sterling at the rate of £1 to G$4.80 until October of1975 when it was linked to the US$ at the rate of US$1 to G$2.55.
On June 2, 1981, the Guyana dollar was pegged to a composite basket of currenciesconsisting of the United States dollar, Pound Sterling, Deutsche Mark, Trinidad and Tobago
14
dollar and the Japanese Yen. The exchange rate was fixed at US$1 to G$3.00. The USdollar was the intervention currency used to determine the exchange rate.
From January 11, 1984 the composite basket of currencies was adjusted to include the PoundSterling, Deutsche Mark, Japanese Yen, French Franc and the Netherlands Guilder. The USdollar, although not part of the revised basket, remained as the intervention currency.The United States dollar/Guyana dollar exchange rate was announced weekly. From October,1984 until January 1987, the exchange rate was maintained in the range of G$4.15 to G$4.40per US dollar.
Effective January 19, 1987 the Guyana dollar was devalued to G$10.00 per US$1.00,effective from April 3, 1989 the Guyana dollar was devalued moving the exchange rate toG$33 to US$1. On June 15, 1990 the Guyana dollar was devalued from G$33 per US$ toG$45 per US$. Transactions for this rate were confined to payments in respect of oil importsand external debt services and proceeds from sugar and rice exports.
On February 21, 1991 the Guyana dollar was devalued from G$45 to US$1 to G$101.75thereby unifying the official exchange rate with the market determined rate prevailing at thatdate. The US dollar continued to be the intervention currency. From February 25, 1991 theexchange rate was fixed on a weekly basis. During the period February to September, 1991,the exchange rate was determined by the previous week free market average rate of thecommercial banks and non-bank dealers.
From October 1991 the average weighted daily exchange rate of telegraphic transfers for thethree largest commercial banks was utilised to determine the exchange rate for the Bank ofGuyana daily transactions.
Table 9.2(b) Exchange Rate (G$/US$)
The Period End and Period Average Exchange Rates relate to the Bank of Guyana
Transactions Rate.
Table 9.6 Monthly Average Market Exchange Rate
On March 13, 1990 the authorities established the cambio system for foreign currencytransactions. Under the system, transactions in the cambio market were conducted freelywith licensed dealers (banks and non-banks) setting the rate at which foreign exchange couldbe bought and sold. The rates are referred to as the market exchange rates.
The buying rate is an unweighted average of the purchase rates of all licensed foreignexchange dealers for the month.
The selling rate is an unweighted average of the sales rates of all the licensed foreignexchange dealers for the month.
The mid-rate is the average of the buying and selling rates of all the licensed foreignexchange dealers.
The rates are based on transaction in foreign notes only.
BANK OF GUYANA
P.O. Box 1003Georgetown,
Guyana.
Cable Address: CENTRAL BANK, Georgetown.
Telephone: 226-3256-9Telex: GY 2267Telefax: 592-227-2965Website: www.bankofguyana.org.gy
Any comments or queries?Kindly contact the Director of Research, Bank of Guyana
e-mail: [email protected]


