Embed Size (px)
Citation preview
Measurement 47 (2014) 919–928Author's Personal Copy
Contents lists available at ScienceDirect
Measurement
journal homepage: www.elsevier .com/ locate/measurement
Stationary wavelet transform and single differentiator baseddecaying DC-offset filtering in post fault measurements
0263-2241/$ - see front matter Crown Copyright � 2013 Published by Elsevier Ltd. All rights reserved.http://dx.doi.org/10.1016/j.measurement.2013.10.022
⇑ Corresponding author. Tel.: +27 827870251; fax: +27 123824964.E-mail addresses: [email protected] (A.A. Yusuff), [email protected]
(A.A. Jimoh), [email protected] (J.L. Munda).
A.A. Yusuff, A.A. Jimoh ⇑, J.L. MundaDepartment of Electrical Engineering, Faculty of Engineering and the Built Environment, Tshwane University of Technology, Private Bag X680,Staatsartillerie Road, Pretoria West, Pretoria 0001, South Africa
a r t i c l e i n f o
Article history:Received 10 January 2013Received in revised form 24 June 2013Accepted 10 October 2013Available online 23 October 2013
Keywords:Decaying DC offsetStationary wavelet transformWavelets packet decompositionPhasor estimation
a b s t r a c t
This paper presents a novel scheme for removing a decaying DC-offset from both currentand voltage measurements irrespective of the time constant.The technique is based on sta-tionary wavelet transform (SWT) cascaded with a differentiator. The performance of thescheme on two study cases is investigated; the statistical performance in relation to noiseon a hypothetical signal, and a modeled segment of a utility network in South Africa. Theproposed scheme is practically applied by testing it on a real life data obtained fromEskom’s network. The result shows that the scheme is robust, and that it can removeany DC-offset. The output of the scheme can be used for fault detection, classificationand location.
Crown Copyright � 2013 Published by Elsevier Ltd. All rights reserved.
1. Introduction
In power system transmission line protection, most re-lays use the system frequency component in voltage andcurrent to estimate appropriate phasors for impedance cal-culation, every other frequencies or harmonics are treatedas noise. Although it is possible to remove all harmonicshigher than the system frequency, by using various kindof low pass filters, however during faults, except in fewcases the fault current will always have a decaying DC off-set, which could be up to 20% of the steady state currentvalue. Various digital filtering techniques are used inextracting the fundamental frequency component.
Various approaches have been put forward to minimizethe influence of the decaying DC component on phasor. In[1], a cosine filter was used in estimating both direct andquadrature components of a phasor. Digital mimic filteringschemes [2] has also been used extensively for the removalof a decaying DC offset. In this scheme, a preset value is cho-sen between 30 ms and 50 ms which is the range of EHV
transmission line time constant, and the amplitude of thedecaying DC offset is estimated. As long as there is nomismatch between the preset time constant and the actualtime constant of the network, the scheme can totallyremove the decaying DC offset. But in reality, since the timeconstant is dependent on the fault location and the networkoperating condition which are random variables, when thepreset time constant is appreciably different from the net-work time constant, the error in the phasor estimate isappreciable. In [3], an adaptive mimic scheme was usedto circumvent the deficiencies in using a pre-set timeconstant and the scheme produces a very accurate resultirrespective of the time constant and the amplitude of thedecaying DC offset. A few other techniques that have beenused are Least Error Squares (LES) schemes [4,5], Kalmanfiltering techniques [6], as well as implementations in[7–13].
In recent times, time-scale and time–frequency signaldecomposition techniques are used in the analysis andstructural description of signals. The advances in computerhardware, software and mixed-domain signal transformsover the last decade has necessitated the need to reworkthe conventional approach to signals filtering and decom-position. These techniques expose Fourier transform
920 A.A. Yusuff et al. / Measurement 47 (2014) 919–928Author's Personal Copy
limitations, and point to techniques that are impossibleusing the Fourier tools. However, the computational bur-den of mixed domain signal filtering and decompositionis larger compared to its frequency domain counterparts.Unlike 4 decades ago, when computational power was amajor problem in implementing algorithms, in the recenttime computational power is now cheap, hence theremight be a need to venture into untrodden path in filtering,provided we will get a better result in terms of time re-sponse albeit with more computational power.
Hilbert–Huang Transform (HHT) based on EmpiricalMode Decomposition (EMD) has been used to decomposenon-stationary signals into a number of Intrinsic ModeFunctions (IMFs), and subsequently Hilbert transform isused to calculate the instantaneous frequency andinstantaneous amplitude of the IMFs [14–16]. Howeverthe major challenge of EMD is the inability to separatemodes whose instantaneous frequencies simultaneouslylie with an octave. In order to circumvent this deficiency,the use of masking was proposed in [17], while Olhedeand Walden proposed a method based on wavelet packetdecomposition to get the Hilbert spectrum on thenarrow-band decomposition of the signal, with an appre-ciable performance compared to EMD based techniques[18,19].
Fig. 1. Stationary wavelet tra
Fig. 2. The propos
Wavelets transform is a time scale technique that hasbeen used extensively in multi resolution analysis ofnon-stationary signals. A typical example of its use in pha-sor amplitude estimation is given in [20–22]. However, thisclaims were debunked by Brahma and Kavasseri in [23].They observed that the signal used in [20] is not realisticin power system, and that the assumptions of complete re-moval of decaying dc offset by a band pass anti aliasing fil-ter in [22] or High pass 4th order Butterworth filter in [21]introduced unnecessary delays, without any appreciableperformance justification. Stationary wavelet transform(SWT) was used in [24] for filtering and feature extractionof post fault measurements on power transmission lines.
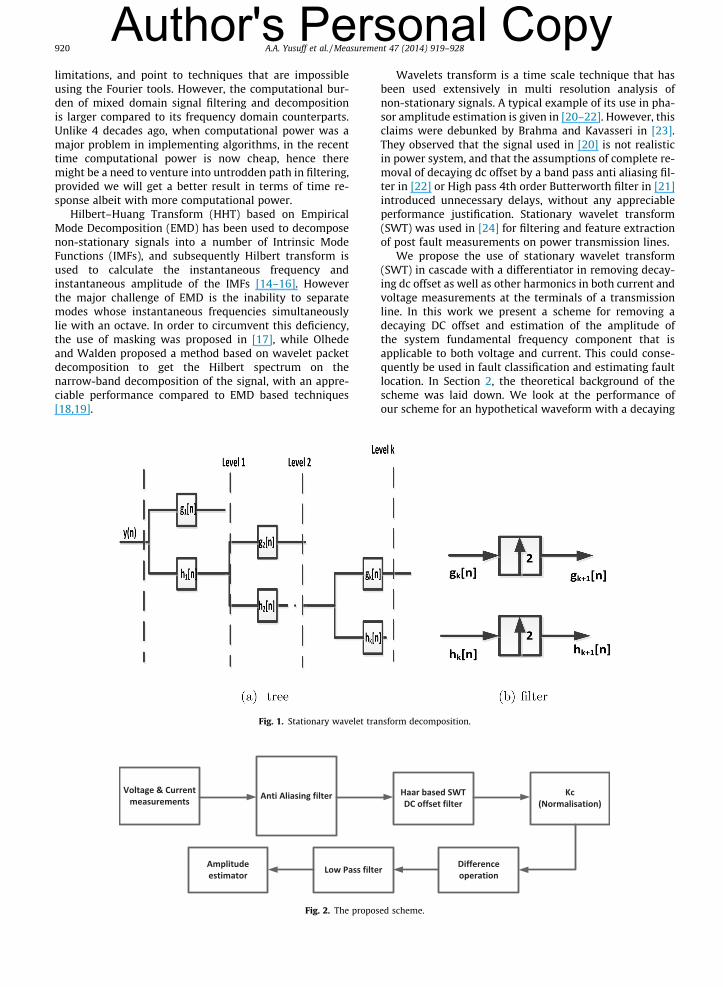
We propose the use of stationary wavelet transform(SWT) in cascade with a differentiator in removing decay-ing dc offset as well as other harmonics in both current andvoltage measurements at the terminals of a transmissionline. In this work we present a scheme for removing adecaying DC offset and estimation of the amplitude ofthe system fundamental frequency component that isapplicable to both voltage and current. This could conse-quently be used in fault classification and estimating faultlocation. In Section 2, the theoretical background of thescheme was laid down. We look at the performance ofour scheme for an hypothetical waveform with a decaying
nsform decomposition.
ed scheme.
A.A. Yusuff et al. / Measurement 47 (2014) 919–928 921Author's Personal Copy
dc offset as well as noise level varying from 20 dB to 80 dB,in Section 3. In Section 4, we show the application of ourscheme, to a segment of a power utility network in SouthAfrica (Eskom) by simulating a phase to ground fault. Inaddition, the performance of the scheme is checked on areal life data from a digital fault recorder (DFR). And con-clusions are made in Section 5.
0 0.05 0.1 0.15 0.2 0.25 0.3−100
−50
0
50
100
150
200
time
Am
plit
ud
e
signal
0 0.05 0.1 0.15 0.2 0.25 0.3−150
−100
−50
0
50
100
150
time
Am
plit
ud
e
det level 3
0 0.05 0.1 0.15 0.2 0.25 0.30
100
200
300
400
500
600
time
Am
plit
ud
e
app level 5
Fig. 3. Stationary wavelet tra
2. Stationary wavelet transform
Stationary wavelet transform, unlike discrete wavelettransform (DWT) is time invariant caused by decimation[25]. It has been used in denoising, singularity detection[26], sharp transient detection [27] as well as HVDC lineprotection [28].
0 0.05 0.1 0.15 0.2 0.25 0.3−100
−80
−60
−40
−20
0
20
40
time
Am
plit
ud
e
det level 2
0 0.05 0.1 0.15 0.2 0.25 0.3−300
−200
−100
0
100
200
300
time
Am
plit
ud
e
det level 4
0 0.05 0.1 0.15 0.2 0.25 0.3−500
−400
−300
−200
−100
0
100
200
300
400
time
Am
plit
ud
e
det level 5
nsform decomposition.
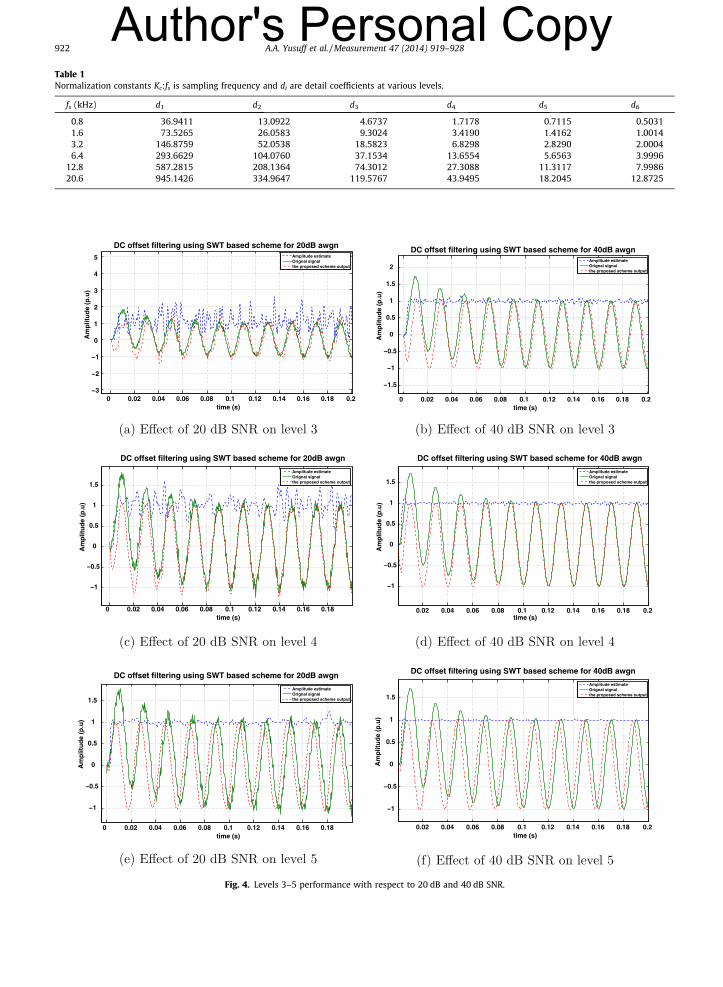
Table 1Normalization constants Kc:fs is sampling frequency and di are detail coefficients at various levels.
fs (kHz) d1 d2 d3 d4 d5 d6
0.8 36.9411 13.0922 4.6737 1.7178 0.7115 0.50311.6 73.5265 26.0583 9.3024 3.4190 1.4162 1.00143.2 146.8759 52.0538 18.5823 6.8298 2.8290 2.00046.4 293.6629 104.0760 37.1534 13.6554 5.6563 3.9996
12.8 587.2815 208.1364 74.3012 27.3088 11.3117 7.998620.6 945.1426 334.9647 119.5767 43.9495 18.2045 12.8725
0 0.02 0.04 0.06 0.08 0.1 0.12 0.14 0.16 0.18 0.2−3
−2
−1
0
1
2
3
4
5
DC offset filtering using SWT based scheme for 20dB awgn
time (s)
Am
plit
ud
e (p
.u)
Amplitude estimateOrignal signalthe proposed scheme output
0 0.02 0.04 0.06 0.08 0.1 0.12 0.14 0.16 0.18 0.2
−1.5
−1
−0.5
0
0.5
1
1.5
2
DC offset filtering using SWT based scheme for 40dB awgn
time (s)
Am
plit
ud
e (p
.u)
Amplitude estimateOrignal signalthe proposed scheme output
0 0.02 0.04 0.06 0.08 0.1 0.12 0.14 0.16 0.18
−1
−0.5
0
0.5
1
1.5
DC offset filtering using SWT based scheme for 20dB awgn
time (s)
Am
plit
ud
e (p
.u)
Amplitude estimateOrignal signalthe proposed scheme output
0.02 0.04 0.06 0.08 0.1 0.12 0.14 0.16 0.18 0.2
−1
−0.5
0
0.5
1
1.5
DC offset filtering using SWT based scheme for 40dB awgn
time (s)
Am
plit
ud
e (p
.u)
Amplitude estimateOrignal signalthe proposed scheme output
Fig. 4. Levels 3–5 performance with respect to 20 dB and 40 dB SNR.
922 A.A. Yusuff et al. / Measurement 47 (2014) 919–928Author's Personal Copy
0 0.5 1 1.5 2 2.50
10
20
30
40
50
60
70
80
0.8 0.9 1 1.1 1.20
50
100
150
0.99 0.995 10
20
40
60
80
100
120
140
0.5 1 1.50
20
40
60
80
100
120
0.95 1 1.05 1.10
20
40
60
80
100
120
140
0.99 0.995 10
20
40
60
80
100
120
140
0.8 0.9 1 1.1 1.20
20
40
60
80
100
0.98 0.985 0.99 0.995 1 1.005 1.010
10
20
30
40
50
60
70
0.99 0.995 1 1.0050
50
100
150
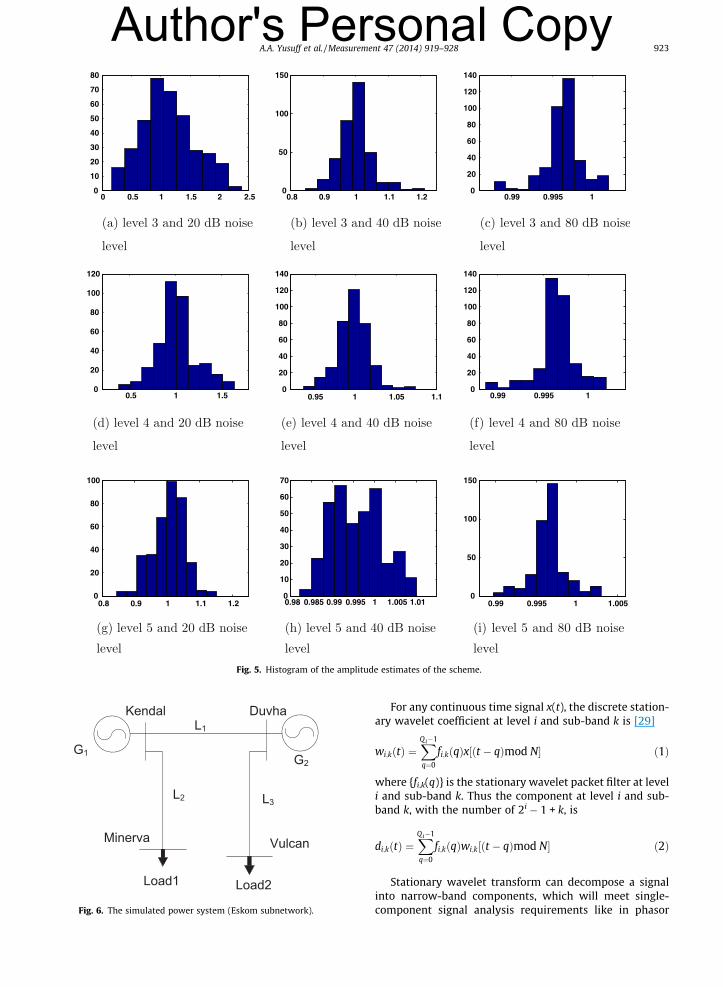
Fig. 5. Histogram of the amplitude estimates of the scheme.
L1
L2 L3
Kendal
Minerva
Duvha
Vulcan
G1 G2
Load1 Load2
Fig. 6. The simulated power system (Eskom subnetwork).
A.A. Yusuff et al. / Measurement 47 (2014) 919–928 923Author's Personal Copy
For any continuous time signal x(t), the discrete station-ary wavelet coefficient at level i and sub-band k is [29]
wi;kðtÞ ¼XQi�1
q¼0
fi;kðqÞx½ðt � qÞmod N� ð1Þ
where {fi,k(q)} is the stationary wavelet packet filter at leveli and sub-band k. Thus the component at level i and sub-band k, with the number of 2i � 1 + k, is
di;kðtÞ ¼XQi�1
q¼0
fi;kðqÞwi;k½ðt � qÞmod N� ð2Þ
Stationary wavelet transform can decompose a signalinto narrow-band components, which will meet single-component signal analysis requirements like in phasor
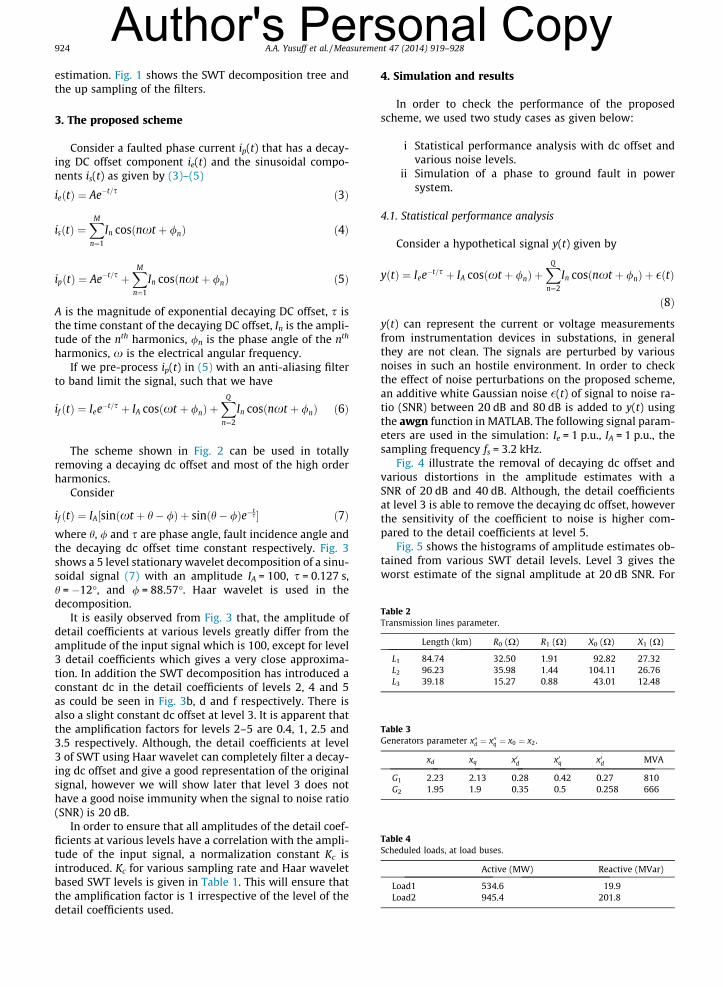
Table 2Transmission lines parameter.
Length (km) R0 (X) R1 (X) X0 (X) X1 (X)
L1 84.74 32.50 1.91 92.82 27.32L2 96.23 35.98 1.44 104.11 26.76L3 39.18 15.27 0.88 43.01 12.48
Table 3Generators parameter x00d ¼ x00q ¼ x0 ¼ x2.
xd xq x0d x0q x0d MVA
G1 2.23 2.13 0.28 0.42 0.27 810G2 1.95 1.9 0.35 0.5 0.258 666
Table 4Scheduled loads, at load buses.
Active (MW) Reactive (MVar)
Load1 534.6 19.9Load2 945.4 201.8
924 A.A. Yusuff et al. / Measurement 47 (2014) 919–928Author's Personal Copy
estimation. Fig. 1 shows the SWT decomposition tree andthe up sampling of the filters.
3. The proposed scheme
Consider a faulted phase current ip(t) that has a decay-ing DC offset component ie(t) and the sinusoidal compo-nents is(t) as given by (3)–(5)
ieðtÞ ¼ Ae�t=s ð3Þ
isðtÞ ¼XM
n¼1
In cosðnxt þ /nÞ ð4Þ
ipðtÞ ¼ Ae�t=s þXM
n¼1
In cosðnxt þ /nÞ ð5Þ
A is the magnitude of exponential decaying DC offset, s isthe time constant of the decaying DC offset, In is the ampli-tude of the nth harmonics, /n is the phase angle of the nth
harmonics, x is the electrical angular frequency.If we pre-process ip(t) in (5) with an anti-aliasing filter
to band limit the signal, such that we have
if ðtÞ ¼ Iee�t=s þ IA cosðxt þ /nÞ þXQ
n¼2
In cosðnxt þ /nÞ ð6Þ
The scheme shown in Fig. 2 can be used in totallyremoving a decaying dc offset and most of the high orderharmonics.
Consider
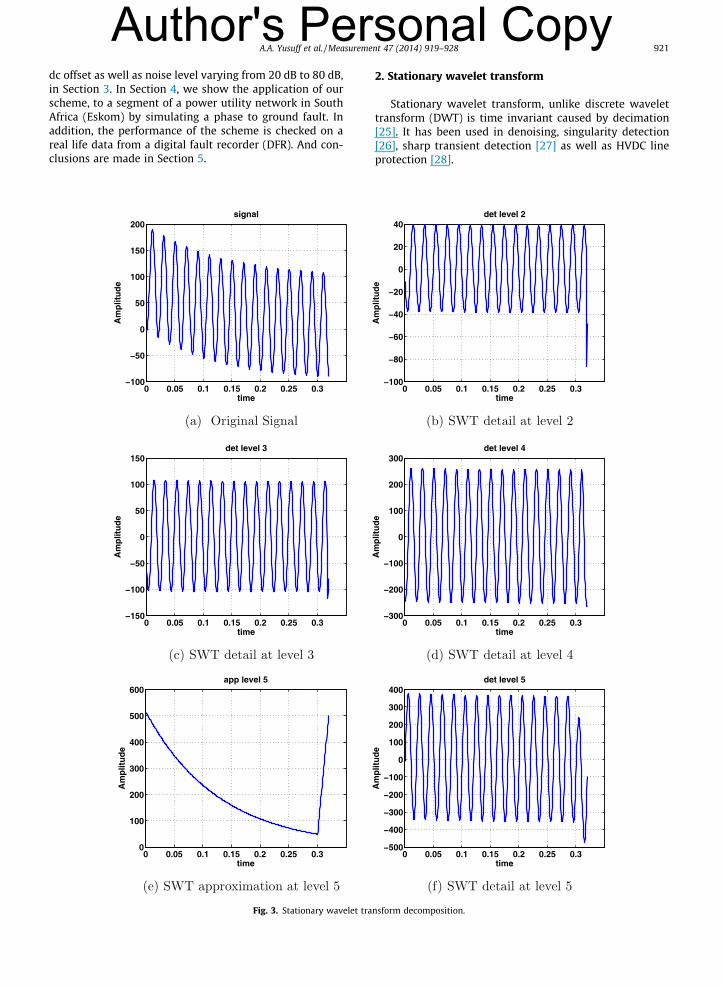
if ðtÞ ¼ IA½sinðxt þ h� /Þ þ sinðh� /Þe�ts� ð7Þ
where h, / and s are phase angle, fault incidence angle andthe decaying dc offset time constant respectively. Fig. 3shows a 5 level stationary wavelet decomposition of a sinu-soidal signal (7) with an amplitude IA = 100, s = 0.127 s,h = �12�, and / = 88.57�. Haar wavelet is used in thedecomposition.
It is easily observed from Fig. 3 that, the amplitude ofdetail coefficients at various levels greatly differ from theamplitude of the input signal which is 100, except for level3 detail coefficients which gives a very close approxima-tion. In addition the SWT decomposition has introduced aconstant dc in the detail coefficients of levels 2, 4 and 5as could be seen in Fig. 3b, d and f respectively. There isalso a slight constant dc offset at level 3. It is apparent thatthe amplification factors for levels 2–5 are 0.4, 1, 2.5 and3.5 respectively. Although, the detail coefficients at level3 of SWT using Haar wavelet can completely filter a decay-ing dc offset and give a good representation of the originalsignal, however we will show later that level 3 does nothave a good noise immunity when the signal to noise ratio(SNR) is 20 dB.
In order to ensure that all amplitudes of the detail coef-ficients at various levels have a correlation with the ampli-tude of the input signal, a normalization constant Kc isintroduced. Kc for various sampling rate and Haar waveletbased SWT levels is given in Table 1. This will ensure thatthe amplification factor is 1 irrespective of the level of thedetail coefficients used.
4. Simulation and results
In order to check the performance of the proposedscheme, we used two study cases as given below:
i Statistical performance analysis with dc offset andvarious noise levels.
ii Simulation of a phase to ground fault in powersystem.
4.1. Statistical performance analysis
Consider a hypothetical signal y(t) given by
yðtÞ ¼ Iee�t=s þ IA cosðxt þ /nÞ þXQ
n¼2
In cosðnxt þ /nÞ þ �ðtÞ
ð8Þ
y(t) can represent the current or voltage measurementsfrom instrumentation devices in substations, in generalthey are not clean. The signals are perturbed by variousnoises in such an hostile environment. In order to checkthe effect of noise perturbations on the proposed scheme,an additive white Gaussian noise �(t) of signal to noise ra-tio (SNR) between 20 dB and 80 dB is added to y(t) usingthe awgn function in MATLAB. The following signal param-eters are used in the simulation: Ie = 1 p.u., IA = 1 p.u., thesampling frequency fs = 3.2 kHz.
Fig. 4 illustrate the removal of decaying dc offset andvarious distortions in the amplitude estimates with aSNR of 20 dB and 40 dB. Although, the detail coefficientsat level 3 is able to remove the decaying dc offset, howeverthe sensitivity of the coefficient to noise is higher com-pared to the detail coefficients at level 5.
Fig. 5 shows the histograms of amplitude estimates ob-tained from various SWT detail levels. Level 3 gives theworst estimate of the signal amplitude at 20 dB SNR. For
A.A. Yusuff et al. / Measurement 47 (2014) 919–928 925Author's Personal Copy
a waveform having 1 as the amplitude, and a decaying dcoffset, the amplitude estimate by using level 3 detail coef-ficients is between 0.4 and 2.5 for a noise level of 20 dBSNR, see Fig. 5a. However for the same noise level, theSWT detail level 5 gives amplitude estimate whose valueslie between 0.9 and 1.1 as can be seen in Fig. 5g.
If the noise level is around 40 dB SNR, we have ampli-tude estimates of 0.85–1.2, 0.95–1.05 and 0.985–1.01 forSWT detail levels 3–5 respectively. The practical implica-tion of this is that the accuracy of the amplitude estimates
1.9 1.92 1.94 1.96 1.98
−1
−0.5
0
0.5
1
1.5
time (s)
Am
plit
ud
e (p
.u)
Voltage amplitude estimation
Amplitude estimateproposed schemefaulted voltage waveform
1.88 1.9 1.92 1.94 1.96 1.98
−1
−0.5
0
0.5
1
1.5
2
time (s)
Am
plit
ud
e (p
.u)
Voltage amplitude estimation
Amplitude estimateproposed schemefaulted voltage waveform
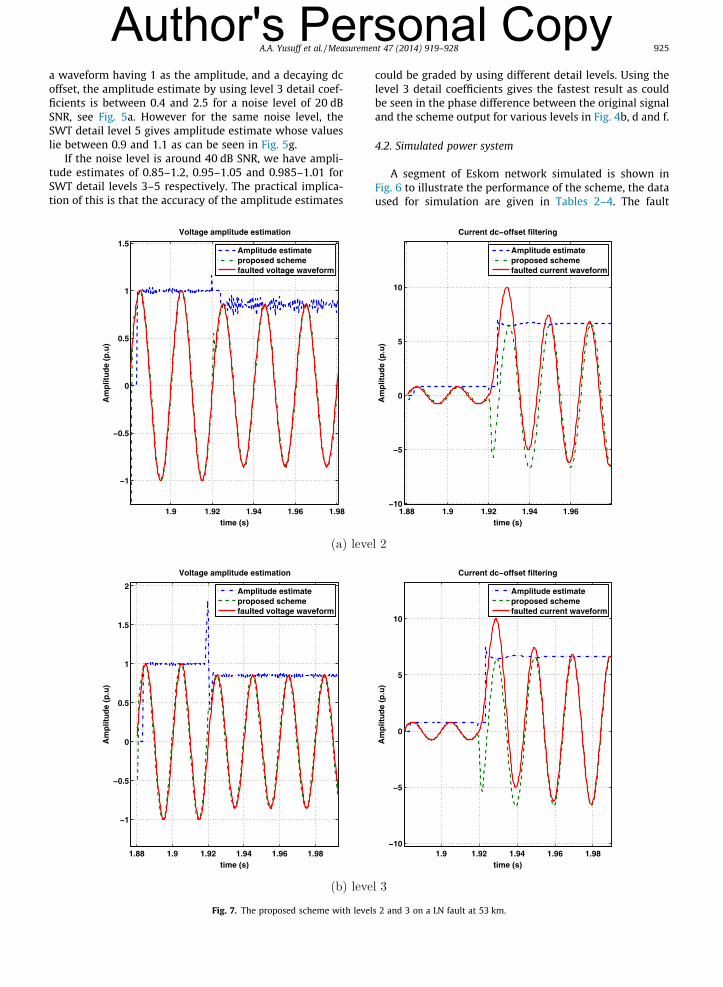
Fig. 7. The proposed scheme with level
could be graded by using different detail levels. Using thelevel 3 detail coefficients gives the fastest result as couldbe seen in the phase difference between the original signaland the scheme output for various levels in Fig. 4b, d and f.
4.2. Simulated power system
A segment of Eskom network simulated is shown inFig. 6 to illustrate the performance of the scheme, the dataused for simulation are given in Tables 2–4. The fault
1.88 1.9 1.92 1.94 1.96−10
−5
0
5
10
time (s)
Am
plit
ud
e (p
.u)
Current dc−offset filtering
Amplitude estimateproposed schemefaulted current waveform
1.9 1.92 1.94 1.96 1.98−10
−5
0
5
10
time (s)
Am
plit
ud
e (p
.u)
Current dc−offset filtering
Amplitude estimateproposed schemefaulted current waveform
s 2 and 3 on a LN fault at 53 km.

1.88 1.9 1.92 1.94 1.96 1.98
−1
−0.5
0
0.5
1
time (s)
Am
plitu
de (p
.u)
Voltage amplitude estimation
Amplitude estimateproposed schemefaulted voltage waveform
1.88 1.9 1.92 1.94 1.96 1.98−15
−10
−5
0
5
10
15
time (s)
Am
plitu
de (p
.u)
Current dc−offset filtering
Amplitude estimateproposed schemefaulted current waveform
1.9 1.92 1.94 1.96 1.98
−1
−0.5
0
0.5
1
1.5
time (s)
Am
plitu
de (p
.u)
Voltage amplitude estimation
Amplitude estimateproposed schemefaulted voltage waveform
1.88 1.9 1.92 1.94 1.96 1.98
−5
0
5
10
15
time (s)
Am
plitu
de (p
.u)
Current dc−offset filtering
Amplitude estimateproposed schemefaulted current waveform
Fig. 8. The proposed scheme with levels 4 and 5 on a LN fault at 53 km.
926 A.A. Yusuff et al. / Measurement 47 (2014) 919–928Author's Personal Copy
current at Kendal bus is first preprocessed through an anti-aliasing filter, a 2nd order Butterworth filter with cutofffrequency of 200 Hz was used for the anti-aliasing. Theoutput of the anti-aliasing filter was then fed into the pro-posed scheme as shown in Fig. 2.
The outputs of the scheme for a line to neutral fault onthe simulated power system are shown in Figs. 7 and 8.Fig. 7a has the fastest response in terms of the time lag be-tween the actual simulated measurements and the schemeoutput as could be seen in the current and the voltage plot.But this is at the expense of noise immunity and the over
shoot in the voltage amplitude estimates. The time lag isclearly evident SWT detail coefficients at level 5 inFig. 8b, however there is no overshoot in the voltage ampli-tude estimate, and it seems to have a better noise immu-nity compared to the other levels.
4.3. A phase to ground fault current from digital fault recorder(DFR) in Eskom
Eskom has DFRs installed on most of their transmissionlines to record disturbances. These records are used for
0.4 0.5 0.6 0.7 0.8 0.9 1 1.1−8000
−6000
−4000
−2000
0
2000
4000
6000
8000
Am
plit
ud
e (A
)
time (s)
Record from a DFR
0.54 0.56 0.58 0.6 0.62 0.64 0.66 0.68−700
−600
−500
−400
−300
−200
−100
0
100
200
300
Am
plit
ud
e (A
)
time (s)
Record from a DFR
0.92 0.93 0.94 0.95 0.96 0.97 0.98 0.99 1 1.01 1.02−8000
−6000
−4000
−2000
0
2000
4000
6000
8000
Am
plit
ud
e (A
)
time (s)
Plot of fault current with fault location 53.5 kmiaibic
0.93 0.94 0.95 0.96 0.97 0.98 0.99 1 1.01 1.02
−8000
−6000
−4000
−2000
0
2000
4000
6000
8000
10000Plot of fault voltage with fault location 53.5 km
time (s)
Am
plit
ud
e (A
)
swt iaswt ib swt iciaibic
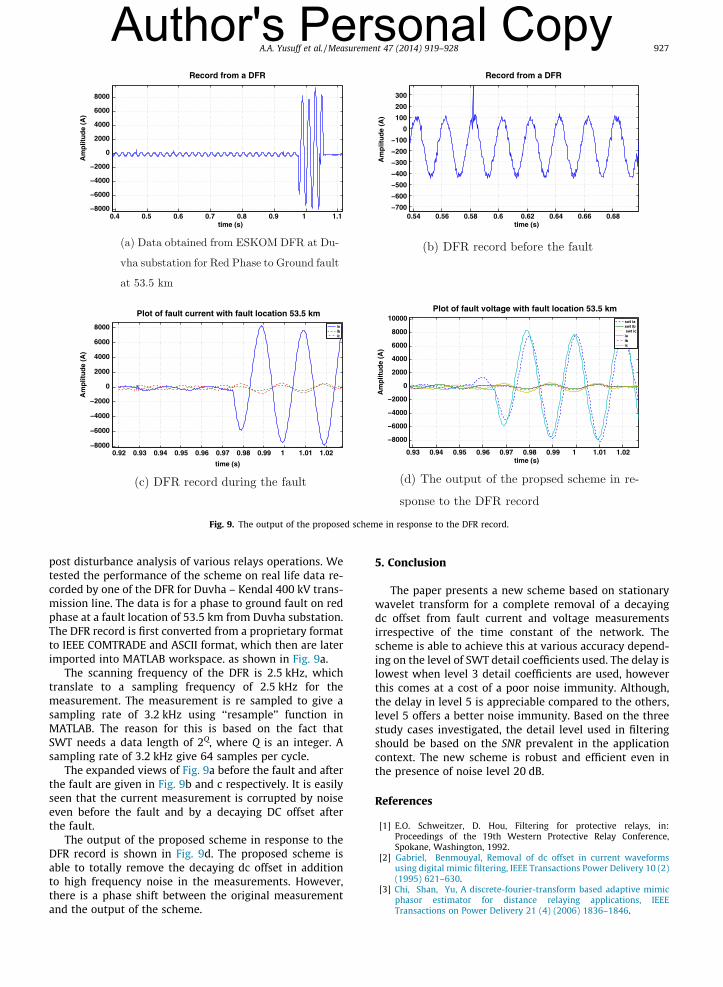
Fig. 9. The output of the proposed scheme in response to the DFR record.
A.A. Yusuff et al. / Measurement 47 (2014) 919–928 927Author's Personal Copy
post disturbance analysis of various relays operations. Wetested the performance of the scheme on real life data re-corded by one of the DFR for Duvha – Kendal 400 kV trans-mission line. The data is for a phase to ground fault on redphase at a fault location of 53.5 km from Duvha substation.The DFR record is first converted from a proprietary formatto IEEE COMTRADE and ASCII format, which then are laterimported into MATLAB workspace. as shown in Fig. 9a.
The scanning frequency of the DFR is 2.5 kHz, whichtranslate to a sampling frequency of 2.5 kHz for themeasurement. The measurement is re sampled to give asampling rate of 3.2 kHz using ‘‘resample’’ function inMATLAB. The reason for this is based on the fact thatSWT needs a data length of 2Q, where Q is an integer. Asampling rate of 3.2 kHz give 64 samples per cycle.
The expanded views of Fig. 9a before the fault and afterthe fault are given in Fig. 9b and c respectively. It is easilyseen that the current measurement is corrupted by noiseeven before the fault and by a decaying DC offset afterthe fault.
The output of the proposed scheme in response to theDFR record is shown in Fig. 9d. The proposed scheme isable to totally remove the decaying dc offset in additionto high frequency noise in the measurements. However,there is a phase shift between the original measurementand the output of the scheme.
5. Conclusion
The paper presents a new scheme based on stationarywavelet transform for a complete removal of a decayingdc offset from fault current and voltage measurementsirrespective of the time constant of the network. Thescheme is able to achieve this at various accuracy depend-ing on the level of SWT detail coefficients used. The delay islowest when level 3 detail coefficients are used, howeverthis comes at a cost of a poor noise immunity. Although,the delay in level 5 is appreciable compared to the others,level 5 offers a better noise immunity. Based on the threestudy cases investigated, the detail level used in filteringshould be based on the SNR prevalent in the applicationcontext. The new scheme is robust and efficient even inthe presence of noise level 20 dB.
References
[1] E.O. Schweitzer, D. Hou, Filtering for protective relays, in:Proceedings of the 19th Western Protective Relay Conference,Spokane, Washington, 1992.
[2] Gabriel, Benmouyal, Removal of dc offset in current waveformsusing digital mimic filtering, IEEE Transactions Power Delivery 10 (2)(1995) 621–630.
[3] Chi, Shan, Yu, A discrete-fourier-transform based adaptive mimicphasor estimator for distance relaying applications, IEEETransactions on Power Delivery 21 (4) (2006) 1836–1846.
928 A.A. Yusuff et al. / Measurement 47 (2014) 919–928Author's Personal Copy
[4] M.S. Sachdev, M.A. Baribeau, A new algorithm for digital impedancerelays, IEEE Transactions on Power Apparatus and Systems 98 (1979)2232–2240.
[5] M.S. Sachdev, M. Nagpal, A recursive least error squares algorithmfor power system relaying and measurement application, IEEETransactions on Power Delivery 6 (3) (1991) 1008–1015.
[6] A.A. Girgis, R.G. Brown, Application of Kalman filtering in computerrelaying, IEEE Transactions on Power Apparatus and Systems 100 (7)(1981) 3387–3397.
[7] S.G. Srivani, K.P Vittal, On line fault detection and an adaptivealgorithm to fast distance relaying, in: Joint International Conferenceon Power System Technology and IEEE Power India Conference,2008, POWERCON 2008, New Delhi, 12–15 October 2008, pp. 1–7.
[8] Kleber M. Silva, Washington L.A. Neves, Benemar A. Souza, Distanceprotection using a wavelet-based filtering algorithm, Electric PowerSystems Research 80 (2010) 84–90.
[9] Tarlochan S. Sidhu, Xudong Zhang, Vinayagam Balamourougan, Anew half-cycle phasor estimation algorithm, IEEE Transactions onPower Delivery 20 (2) (2005) 1299–1305.
[10] J.F. Minambres Arguelles, M.A. Zorrozua Arrieta, J. LazaroDominquez, B. Larrea Jaurrieta, M. Sanchez Benito, A new methodfor decaying dc offset removal for digital protective relays, ElectricPower Systems Research 76 (2006) 194–199.
[11] Dong-Gyu Lee, Ye-Jun Oh, Sang-Hee Kang, Byung M. Han, Distancerelaying algorithm using a dft-based modified phasor estimationmethod, in: IEEE Bucharest Tech Conference, IEEE, BucharestRomania, 2009, pp. 1–6.
[12] Jorge Lazaro Domnguez, Jos Flix Minambres Argelles, Miguel AngelZorrozua Arrieta, Begona Larrea Jaurrieta, Maribel Sanchez Benito,Zugazaga Inigo Antiza, New quick-convergence invariant digitalfilter for phasor estimation, Electric Power Systems Research 79(2009) 705–713.
[13] Ching-Shan Chen, Chih-Wen Liu, Joe-Air Jiang, Application ofcombined adaptive fourier filtering technique and fault detector tofast distance protection, IEEE Transactions on Power Delivery 21(2006) 619–626.
[14] N.E. Huang, Z. Shen, S.R. Long, S.R. Long, M.C. Wu, H.H. Shilh, Q.Zheng, N.C. Yen, C.C. Tung, H.H. Liu, The empirical modedecomposition and the hilbert spectrum for nonlinear and non-stationary time series analysis, Proceedings of the Royal Society ofLondon, Series A 454 (1998) 903–995.
[15] J.K. Wu, B.T. He, Y. Hu, D.S. Luo, Y. Liang, A novel method for removalof dc component in non-sinusoidal signals of power systems, in:IEEE PES, Power Systems Conference and Exposition, 2004.
[16] P. Flandrin, G. Rilling, P. Goncalves, Empirical mode decompositionas a filter bank, IEEE Signal Processing Letters 11 (2) (2004) 112–114.
[17] R.R. Deering, J.K. Kaiser, The use of masking signals to improveempirical mode decomposition, IEEE International Conference onAcostics and Speach Signal Processing 4 (2005) 485–488.
[18] S. Olhede, A.T. Walden, The hilbert spectrum via wavelet projections,Proceedings of the Royal Society of London, Series A 460 (2004) 955–975.
[19] S. Olhede, A.T. Walden, A generalized demodulation approach totime-frequency projections for multicomponent signals, Proceedingsof the Royal Society of London, Series A 461 (2005) 2159–2179.
[20] Chi kong Wong, Leng tak Leong, Chu san Lei, Jing tao Wu, Ying duoHam, A novel algorithm for phasor calculation based on waveletanalysis, in: Proc IEEE Power Engineering Society Summer Meeting,vol. 3, 2001, pp. 1500–1503.
[21] F. Liang, B. Jeyasurya, Transmission line distance protection usingwavelet transform algorithm, IEEE Transactions on Power Delivery19 (2) (2004) 545–553.
[22] A.H. Osman, O.P. Malik, Transmission line distance protection basedon wavelet transform, IEEE Transactions on Power Delivery 19 (2)(2004) 515–523.
[23] S.M. Brahma, R.G. Kavasseri, Investigating the performance ofdiscrete wavelet transform for phasor estimation in digital relays,in: Power and Energy Society General Meeting – Conversion andDelivery of Electrical Energy in the 21st Century, 2008, IEEE, 2008,pp. 1–6.
[24] A.A. Yusuff, Ultra fast fault feature extraction and diagnosis in powertransmission lines, PhD thesis, Department of ELectrical Engineering,Tshwane University of Technology, 2012.
[25] S. Mallat, W.L. Wang, Singularity detection and processing, IEEETransactions on Information Theory 38 (2) (1992) 617–643.
[26] C.K. Jung, J. B Lee, X. H Wang, Y. H SOng, A study of the fault locationalgorithm on underground power system, IEEE Power Engineeringsociety General Meeting 1 (2005) 763–769.
[27] A.H. Osman, Transmission line protection technique based onwavelet transform, PhD thesis, Department of ELectrical andComputer science Engineering, the University of Calgary, 2003.
[28] X. Liu, A.H. Osman, O.P. Malik, Stationary wavelet transform basedhvdc line protection, in: 39th American Power Symposium, 2007.
[29] Y. Hua, Liu, G. Z. Zhao, Power system fault detection based onstationary wavelet packet transform and hilbert transform, in:Congress on Image and Signal Processing, 2008, CISP ’08, Sanya,China, 2008, pp. 307–310.


