Embed Size (px)
Citation preview
STABILIZATION OF SUBGRADE SOILS
By
KHAN MD.
A ThesisSubmitted to the Department of Civil Engineering,Bangladesh University of Engineering & Technology. Dhakain partial fulfillment of the requirements for the degree of
MASTER OF ENGINEERING (CIVIL)
1111111111111111111111111111111111#83250#
June 1991
-b24.1~\991AI{R
STABILIZATION OF SUBGRADE SOILS
A Project ReportBy
KHAN MD~ AKRAM HOSSAIN
Approved as to style and content by:
~(Dr. Muhammad Zakaria)Associate Professor,Dept. of Civil Engineering,BUET, Dhal<a.
~(Dr. Alamgir M. Hoque)Professor and Head,Dept. of Civil Engineering,BUET, Dhaka.
&t'(Dr. Md. Zoynul Abedin)Associate Professor,Dept. of civil Engineering,BUET, Dhaka.
June, 1991
Chairman
Member
Member
i
ABSTRACT
Two subgrade soils wero stabilized using Portland Cement and limeadmixtures. The whole research worl< was conducted for the purposeof evaluating tho subgrade strength and the cost effectiveness ofstabilizer usage.
With the variation of cement and lime, from 2 percent to 10percent, stabilized samples were prepared at their maximum drydensities and optimum moisture contents. They were cured andtested for evaluating durability, volume and moisture changecharacteristics, unconfined compressive strength and CaliforniaBearing Ratio (CBR).
The results obtained show that cement treated soils satisfy thedurability criteria recommended by the Portland CementAssociation (PCA) at about 2 percent and 7 percent cement contentrespectively. Both the soils fail to satisfy the unconfinedcompressive strength criteria of PCA for cement content at whichthe durability criteria is satisfied. Unconfined compressivestrengths of lime treated soils increase due to addition of lime.
The CBR value increases at an increasing rate for higher cementcontents. This value increases slightly after addition of lime.
A correlation between Dynamic Cone Penetrometer (DCP) and CBR wasdeveloped in order to provide a quick evaluation technique ofcompacted subgrade.
It is found that the construction of pavement on a stabilizedsubgrade will be economical than that on an untreated subgrade.
ii
ACKNOWLEDGEMENT
The author expresses his deep gratitude to Dr. Md. Zakaria,Associate Professor of Civil Engineering, BUET under whoseguidance this research was carried out. His personal interest,advice and constructive criticism have been invaluable and madethis work possible.
The author is highly obliged to Dr. Alamgir Mujibul Hoque,Professor and Head of Civil Engineering Department, BUEt for hisinspiration in completing this thesis.
The author expresses his heartfull gratitude to Dr. Md. ZoynulAbedin, Associate Professor of Civil Engineering Department, BUETfor his valuable advice during the research work.
Thanks are due to Mr. Monirul Islam, Asstt. Engineer, RoadResearch Laboratory, Dhaka; Mr. Bipra Das Rajbongshi, Mr. AbdulWahed, Housing & Building Research Institute, Dhaka and Mr.Shahiduzzaman, Laboratory in-Charge Bangladesh ConsultantLimited for their valuable suggestions in completing the projectwork.
The author also tenders his thanks to Mr. Mallick, Mr. Sukur Aliof Transportation Laboratory, BUEt and Mr. Habibur Rahman, Mr.Alimuddin of Geotechnical Engineering Laboratory, BUET for theirhelp in various stages fo laboratory investigation.
Finally, thanks are due to Mr. Md. Abdul Malek for typing neatlyand Mr. Mizan for drawing the figures of the thesis.
CONTENTS
ABSTRACTACKNOWLEDGEMENTSLIST OF FIGURESLIST OF TABLESABBREBIATIONS
CHAPTER 1 INTRODUCTION1.1 General1.2 Soil Stabilization Techniques1.3 Soil-Cement Stabilization1.4 Soil-Lime Stabilization1.5 Need for Soil Stabilization for
Road Construction in Bangladesh1.6 Objective of the Research
Pagei
ii
iiiiv
v
1
1
2
5
6
7
8
2.1 General2.2 Basic Principles of Soil-Cement
Stabilizationl2.3 Basic Principles of Soil-Lime
Stabilization2.4 Characteristics and Composition of
Admixtures
CHAPTER 2 LITERATURE REVIEW
2.4.1 Portland Cement Type-I2.4.2 Air-Slaked Lime
1010
10
13
14
1416
2.5 Properties of Cement Stabilized SoilMixtures2.5.1 Compresive Strength2.5.2 Durability
171719
2.5.3 Volume and Moisture Change2.5.4 Plasticity
2.5.5 Moisture Density Relation
2.5.6 Strength in Terms of CBR Value
2.6 Properties of Lime-Treated Soil Mixture
2.6.1 Compressive Strength2.6.2 Durability
2.6.3 Plasticity
2.6.4 Moisture Density Relation
2.6.5 Bearing Strength by CBR Value
2.7 Dynamic Cone Penetrometer Value andRelationship with CBR
2.8 Summary of the Literature Review
Page
21
22
2324
2626
27
28
2929
30
33
3.1 Introduction
3.3 Materials
3.2 The Test Program
CHAPTER 3
CHAPTER 4
THE RESEARCH SCHEME
3.3.1 Soils
3.3.2 Cement
LABORATORY INVESTIGATION
35
35
35
36
36
36
414.1 Introduction 41
4.2 Test for Index Properties 41
4.3 Moisture Density Relation 42
4.4 Unconfined Compressive Strength Test 44
4.5 Durability Test (Wetting and Drying Test) 46
4.6 California Bearing Ratio Test 48
4.7 Dynamic Cone Penetrometer TestPage
49
5.1 Introduction
CHAPTER 5 RESULTS AND DISCUSSIONS 5151
5.2 Wetting and Drying Test
5.2.1 Minimum Cement Content5.2.2 Moisture Change
5.2.3 Volume Change
5.3 Unconfined Compressive Strength
5.3.1 Cement Treated Mixture
5.3.2 Lime Treated Mixture5.4 Plasticity Indices
5.4.1 Cement Treated Mixture
5.4.2 Lime Treated Mixture
5.5 Strength in Terms of CBR Value
5.5.1 Cement Treated Mixture
5.5.2 Lime Stabilized Mixture
5.6 Evaluation of Subgrade by DCP Value
5.7 Comparison of Cost
5.8 Implementation of the Study
51
51
53
5557
57
63
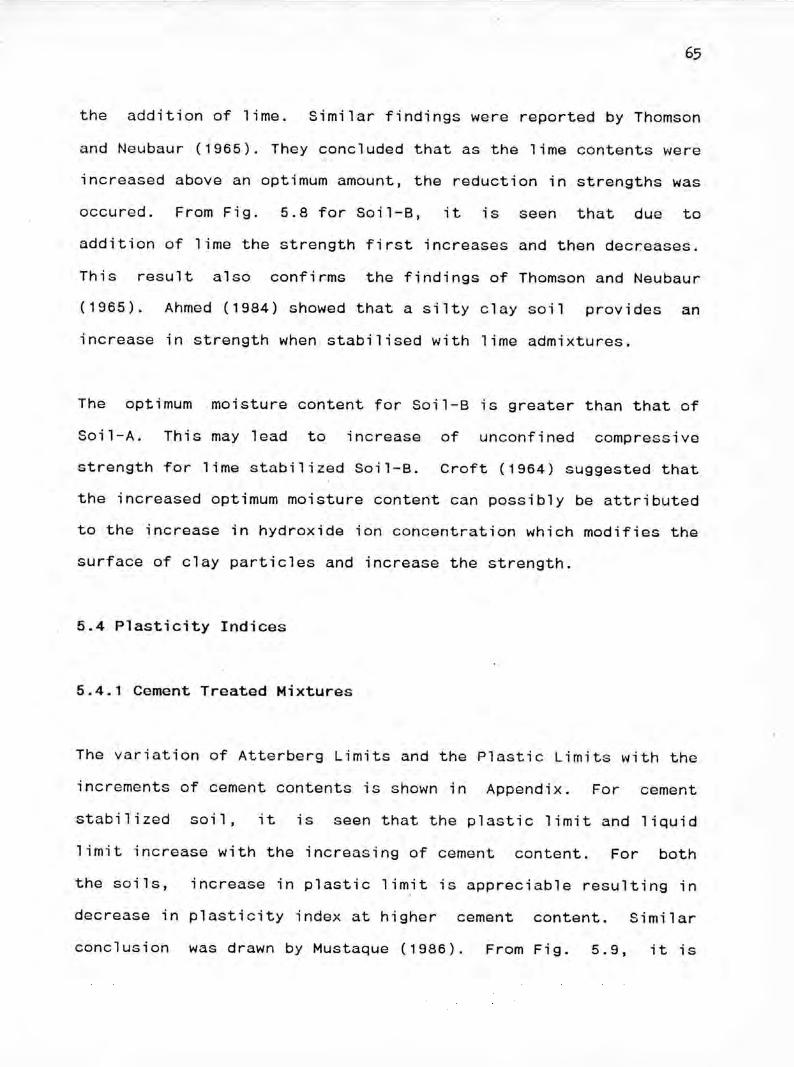
65
65
67
67
67
70
73
7581
6.1 Conclusions
6.2 Recommendation for Further Study
CHAPTER 6 CONCLUSIONS AND RECOMMENDATION FORFUTURE RESEARCH 82
82
83
REFERENCES
APPENDIX
85
89
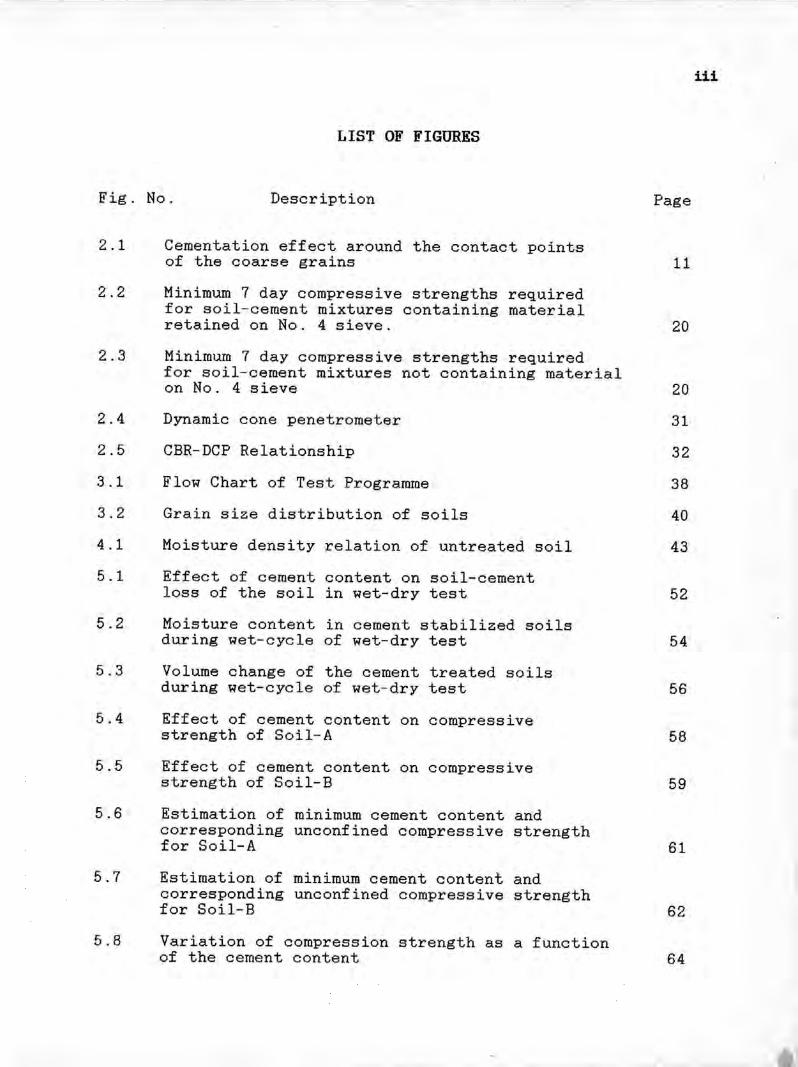
Fig. No.
LIST OF FIGURES
Description Page
iii
2.1
2.2
2.3
2.4
2.5
3.1
3.2
4.1
5.1
5.2
5.3
5.4
5.5
5.6
5.7
5.8
Cementation effect around the contact pointsof the coarse grains
Minimum 7 day compressive strengths requiredfor soil-cement mixtures containing materialretained on NO.4 sieve.
Minimum 7 day compressive strengths requiredfor soil-cement mixtures not containing materialon NO.4 sieve
Dynamic cone penetrometer
CBR-DCP Relationship
Flow Chart of Test Programme
Grain size distribution of soils
Moisture density relation of untreated soil
Effect of cement content on soil-cementloss of the soil in wet-dry test
Moisture content in cement stabilized soilsduring wet-cycle of wet-dry test
Volume change of the cement treated soilsduring wet-cycle of wet-dry test
Effect of cement content on compressivestrength of Soil-A
Effect of cement content on compressivestrength of Soil-B
Estimation of minimum cement content andcorresponding unconfined compressive strengthfor Soil-A
Estimation of minimum cement content andcorresponding unconfined compressive strengthfor Soil-B
Variation of compression strength as a functionof the cement content
11
20
2031
32
38
40
43
52
54
56
58
59
61
62
64
iv
Fig. No. Description Page
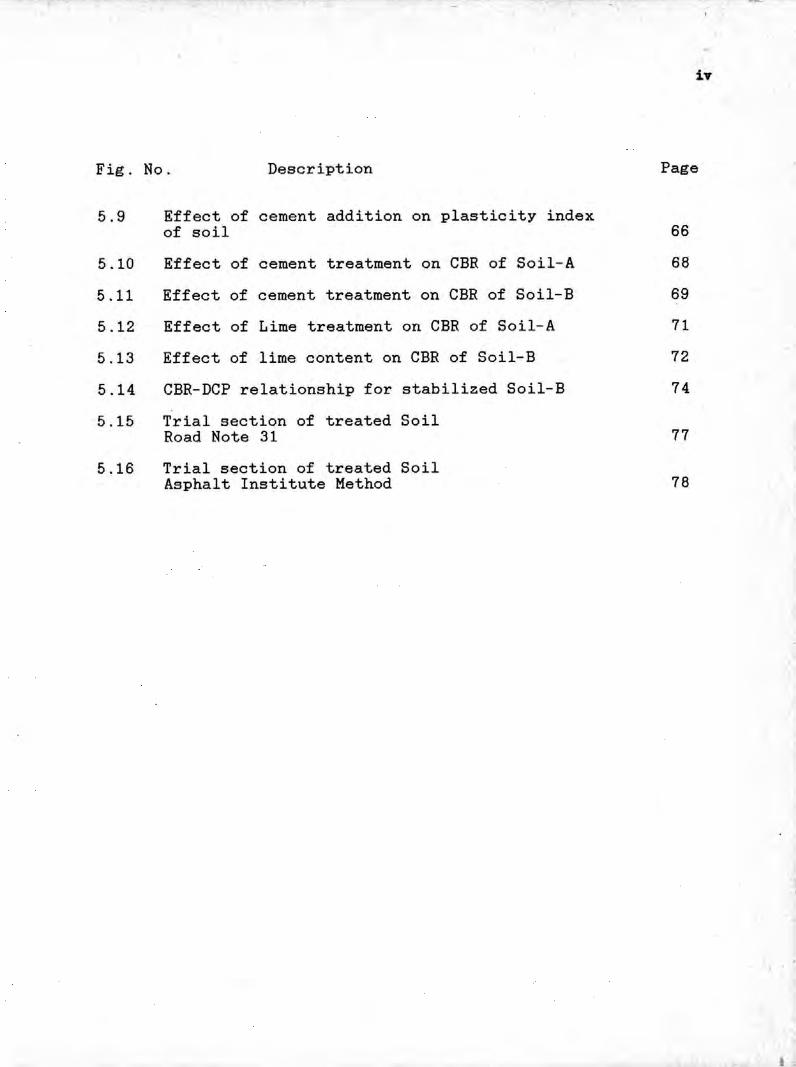
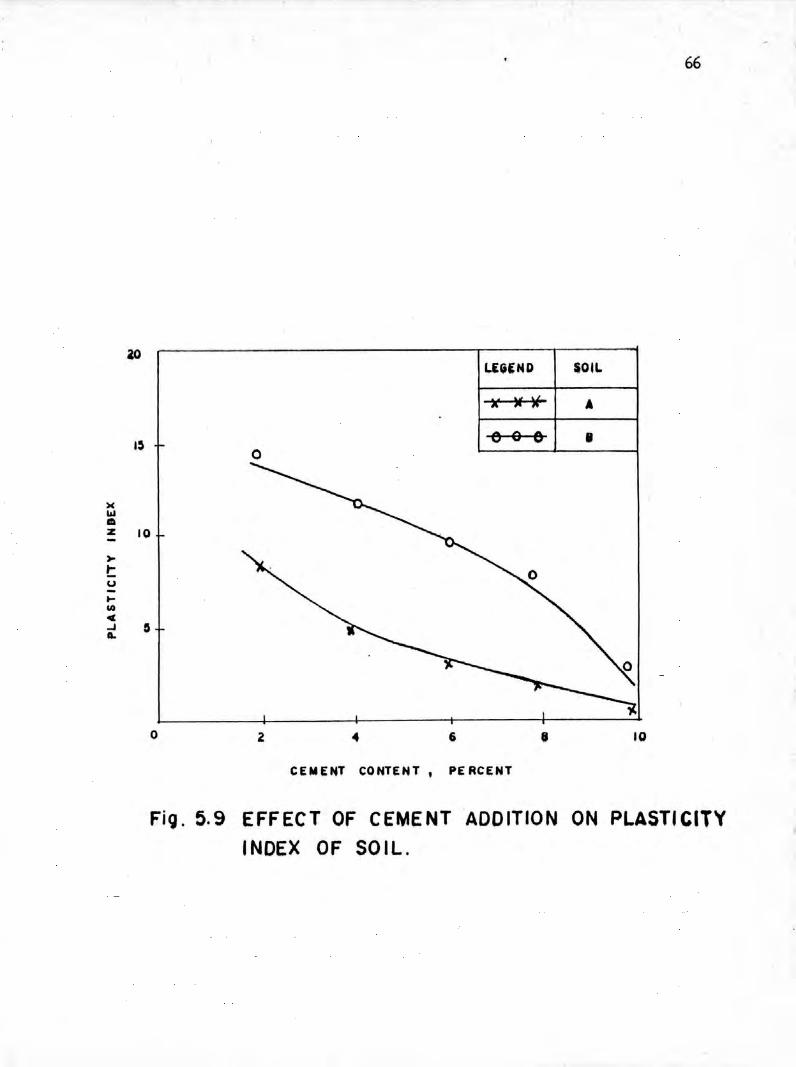
5.9 Effect of cement addition on plasticity indexof soil 66
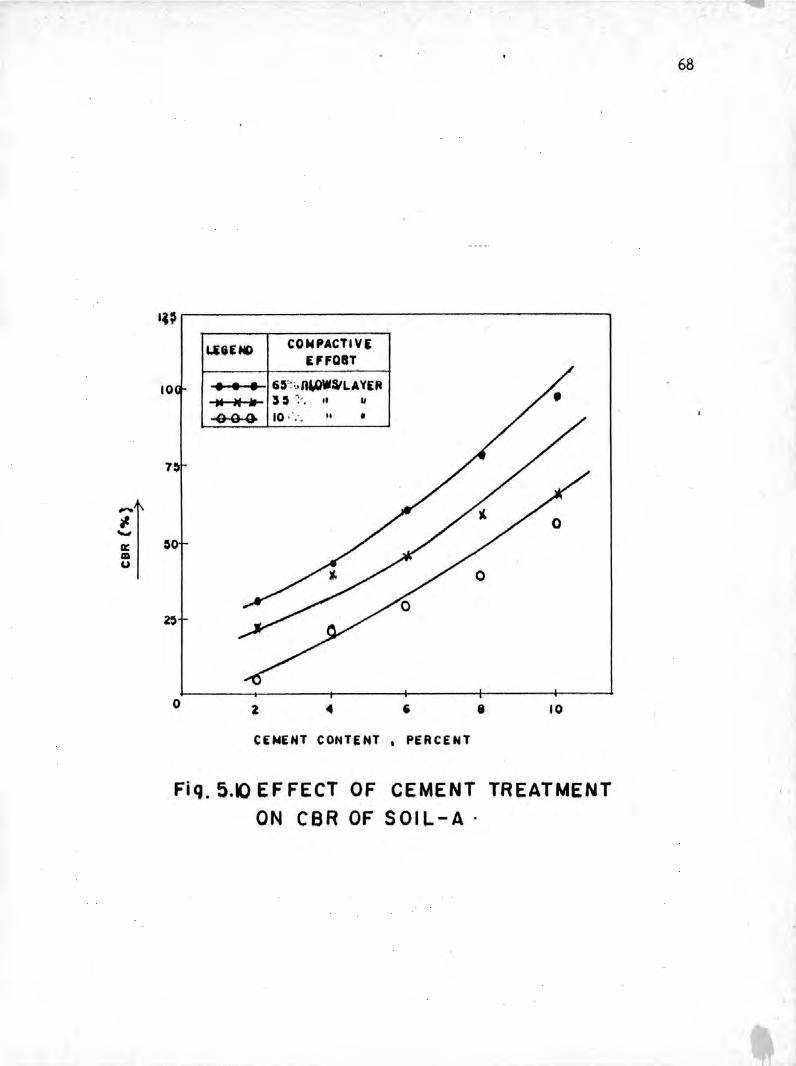
5.10 Effect of cement treatment on CBR of Soil-A 685.11 Effect of cement treatment on CBR of Soil-B 695.12 Effect of Lime treatment on CBR of Soil-A 715.13 Effect of lime content on CBR of Soil-B 725.14 CBR-DCP relationship for stabilized Soil-B 745.15 Trial section of treated Soil
Road Note 31 775.16 Trial section of treated Soil
Asphalt Institute Method 78
, .
I
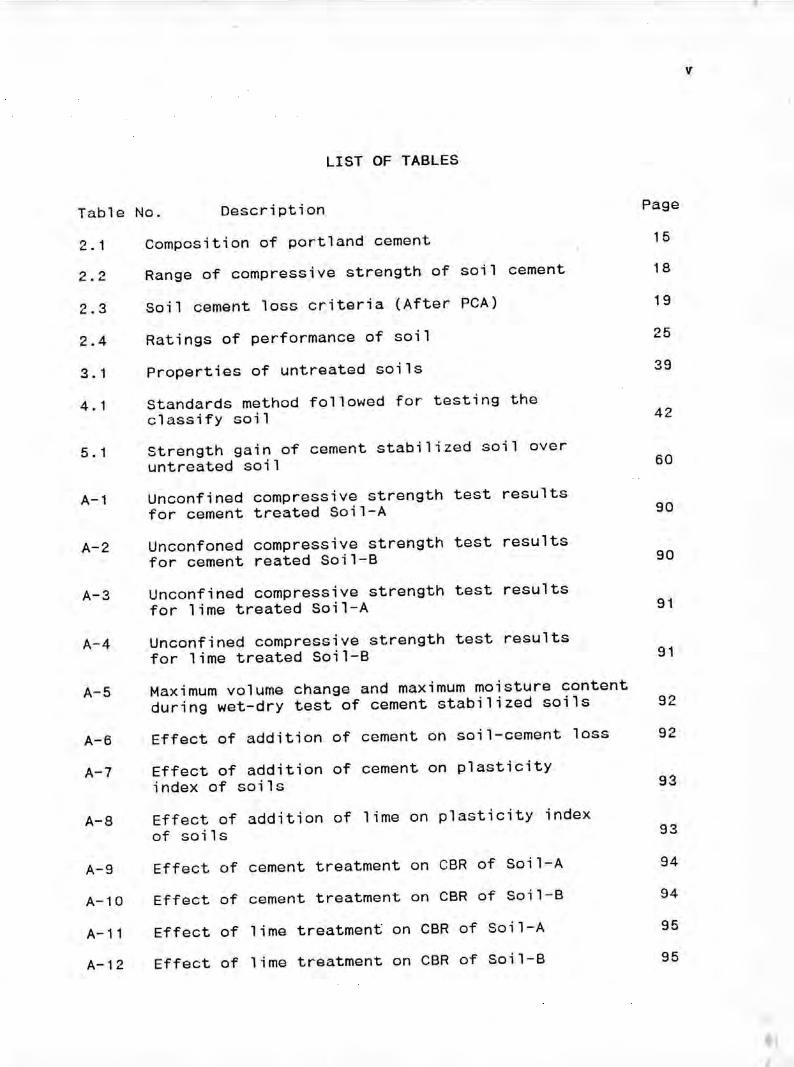
Table No. Description
LIST OF TABLES
Page
v
2. 1
.., ..,•....•...2.3
2.4
3.1
4.1
5. 1
A-1
A-2
A-3
A-4
A-5
A-6A-7
A-8
A-9A-10
A-11
A-12
Composition of portland cementRange of compressive strength of soil cement
Soil cement loss criteria (After PCA)
Ratings of performance of soil
Properties of untreated soils
Standards method followed for testing theclassify soilStrength gain of cement stabilized soil overuntreated soilUnconfined compressive strength test resultsfor cement treated Soil-AUnconfoned compressive strength test resultsfor cement reated Soil-BUnconfined compressive strength test resultsfor lime treated Soil-A
Unconfined compressive strength test resultsfor lime treated Soil-BMaximum volume change and maximum moisture contentduring wet-dry test of cement stabilized soils
Effect of addition of cement on soil-cement loss
Effect of addition of cement on plasticityindex of soilsEffect of addition of lime on plasticity indexof soilsEffect of cement treatment on CBR of Soil-A
Effect of cement treatment on CBR of Soil-B
Effect of lime treatment on CBR of Soil-A
Effect of lime treatment on CBR of 50il-B
15
18
19
25
39
42
60
90
90
91
91
92
92
93
93
94
94
95
95
vi
Table No. Description Page
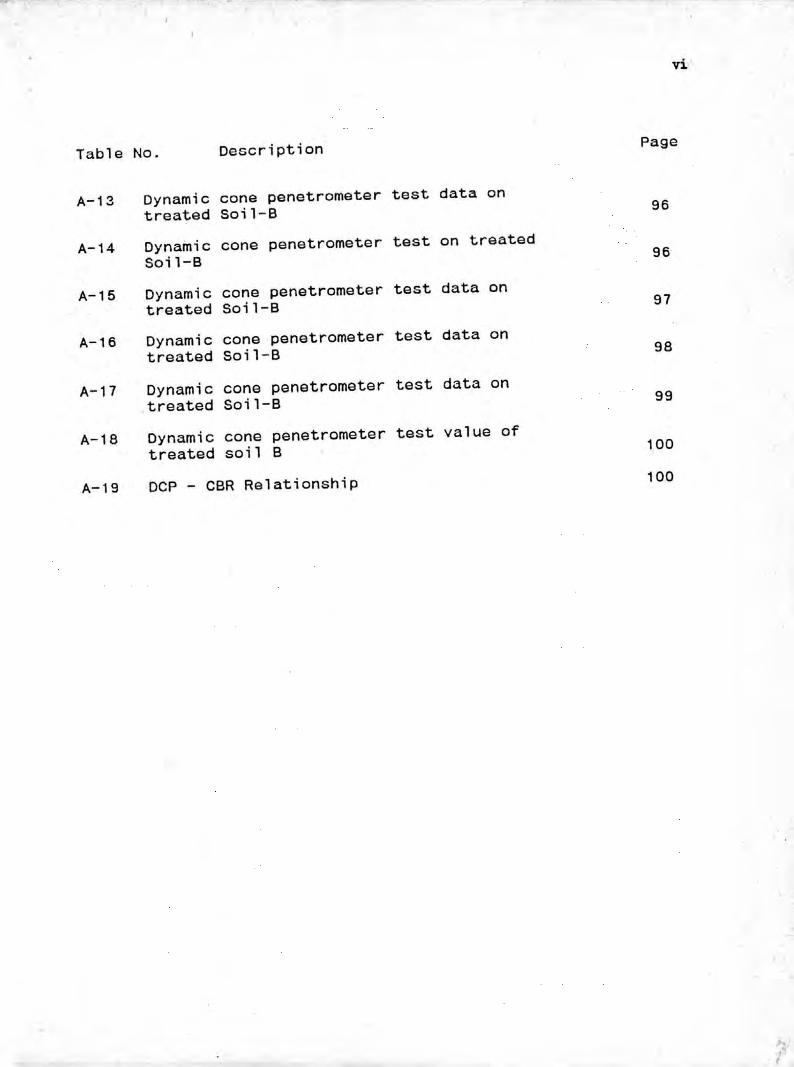
A-13 Dynamic cone penetrometer test data ontreated Soi l-B 96
A-14 Dynainic cone penetrometer test on treatedSoi l-B 96
A-15 Dynamic cone penetrometer test data ontreated Soil-B 97
A-16 Dynamic cone penetrometer test data ontreated Soil-B 98
A-17 Dynamic cone penetrometer test data on.treated Soi l-B 99
A-18 Dynamic cone penetrometer test value oftreated soil B 100
A-19 DCP - CBR Relationship 100
ABBREBIATIONS
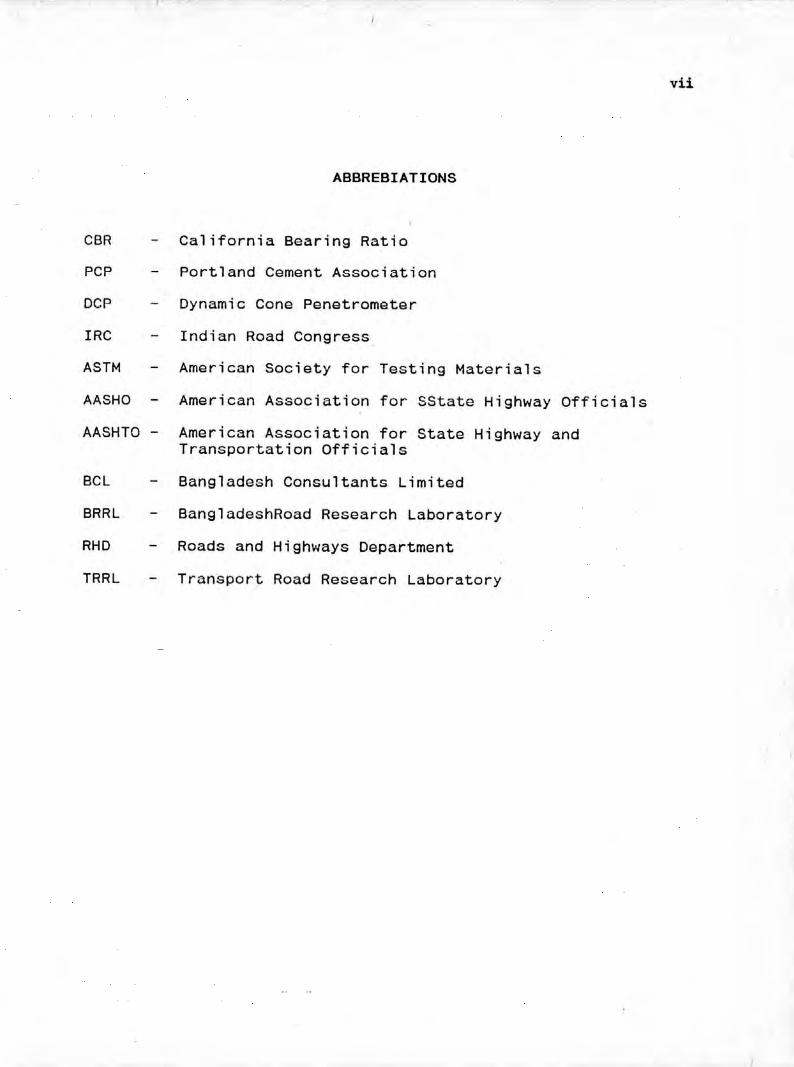
CBR California Bearing RatioPCP Portland Cement AssociationDCP Dynamic Cone PenetrometerIRC Indian Road CongressASTM American Society for Testing MaterialsAASHO American Association for SState Highway OfficialsAASHTO - American Association for State Highway and
Transportation OfficialsBCL Bangladesh Consultants LimitedBRRL BangladeshRoad Research LaboratoryRHO Roads and Highways DepartmentTRRL Transport Road Research Laboratory
vii
1
CHAPTER 1INTRODUCTION
1.1 General
A soil exhibiting a marked and sustained resistance todeformation under repeated or continuing load application,whether in dry or wet state, is said to be a stable soil. When aless stable soil is treated to improve its strength and itsresistance to change in volume and moisture content, it is saidto be stabilized. Thus stabilization infers improvement in bothstrength and durability. In its earlier usage, the ,termstabilization used to signify improvement in a qualitative senseonly. More recently stabilization has become associated withquantitative values of strength and durability, which are relatedto performance. These quantitative values are expressed in termsof compressive strength, shearing strength or some measure ofload bearing value. These in turn indicate the load bearingquality of the stabilized construction. Again the durabilityindicates its resistance to freezing and thawing and wetting anddrying.
Stabilization as used in road construction is a method ofprocessing available materials for the production of low-costroads. In this type of design and construction, emphasis isusually placed upon the effective utilization of local materials
2
with a view to decreasing the construction cost. In some areas
naturally occuring soils require a minimum of processing for
successful stabilization, while in other places the natural soils
are of unfavorable character and require modification through the
use of suitable stabilizer such as cement, lime, bitumen etc.
According to Winterkorn (1975), soil stabilization is a
collective term for any physical, chemical or biological methods,
employed to improve certain properties of a natural soil to make
it serve adequately for an intended engineering purpose.
1.2 Soil Stabilization Techniques
There are several methods of soil stabilization in use. The
degree of improvement of in situ soil may differ within a
particular method and also between the other methods. The reason
behind is that soils exist in a broad range of types and
different soils react differently to a stabilizer.
The available important methods are:
i) Mechanical stabilization
ii) Cement stabilization
iii) Lime stabilization
iv) Bitumen stabilization
v) Electro-osmosis
3
vi) Thermal stabilizationvii) Chemical stabilization.
Mechanical stabilization is sometimes termed as granularstabilization. In this process, gradation of soil-aggregatemixture is the only factor which controls the stability of theresulting construction. The basic principles involved inmechanical stabilization are 'proportioning' and 'compaction'.Stability and strength of granular materials having negligiblefines when mixed with clay and compacted, can be improved by thistechnique. Similarly, the stability of the clayey soil can beimproved by mixing a proper proportion of granular materials init.
Cement stabilization has been used successfully to stabilizegranular soils, sands, silts and medium plastic clays. Details ofcement stabilization will be discussed later.
Lime stabilization has been in use to stabilize clayey soils.Lime depends for its action on pozzolanic materials in the soils.These normally consist of clay minerals and amorphous compounds.Lack of these materials in pure sands and granular soil, makeslime stabilization ineffective for them. Addition of lime to asoil generally results in decreased soil density, changedplasticity properties and increased soil strength. This method isdiscussed latter.
4
Bitumen when mixed with soil imparts binding property and makesit waterproof. Water proofing property imparted to the soil helpsin retaining its strength even in the presence of water. In thecase of fine grained soil, bituminous materials seal the voidsbetween the small soil clods and keep soil away from coming indirect contact with water and thus inherent properties of thesoil are retained. In the case of soils like sand and gravel,individual particles get coated with a very thin film ofbituminous materials and thus impart binding property in thesoil.
The electrical stabilization technique is also known as electro-osmosis. The process involves sending a direct electric currentthrough a saturated soil. This flow of current results inmovement of water towards the cathode end from where it is pumpedout. Thus the soil is consolidated with decrease in volume. Thisconsolidation increases the strength of the soil appreciably.
By thermal treatment, soil can be stabilized for expeditingconstruction facility. A reliable temporary expedient tofacilitate construction of open and underground excavation isstabilizing the soil by freezing the pore water. When a clayeysoil is heated, there is a progressive hardening. The resultanteffect is improvement of certain properties of soil likeplasticity index, swelling properties, strength compressibilityand durability. The method is uneconomical for stabilizing in-situ soils.
By chemical grouting,silts. Groute fillstabilized material.
5
it is possible to stabilize fine sands andthe pores of these soils resulting in
1.3 Soil-Cement Stabilization
Soil-cement stabilization is the process in which cement is usedas an admixture. The strength of the soil is increased and itbecomes resistant to softening by water. This improvement in thequality and bearing capacity of the soil at a reasonable costmake it more desirable and efficient in comparision to othermethods of stabilization.
Though history of stabilization using admixture dates back toearly civilization of Mesopotamia and Babylon and more recentRoman civilization, in modern times, it was in South Carolina,USA in the 1935, that a highway engineer innovated this method ofstabilization. Since then about 50 millions sq. yds. of soil-cement pavement including roads, runways, car-parks and similarconstruction have been made in U.S.A. alone. Soil-cementconstruction in Britain exceeded 6,60,000 sq. yds. in 1950, halfof which had been constructed since the second World war. Theseinclude building blocks, foundation for houses, housing roads andsub-base of major roads (Road Research Laboratory, 1952). Todaysoil-cement stabilization is used in many developed anddeveloping countries in the tropical and arctic regions of theworld (Kezdi, 1979).
6
Cement stabilized soil road has always been a topic of discussion
in road construction system but tried limitedly in practice in
this country to check its suitability in adaptation and
performance.
1.4 Soil-Lime Stabilization
Lime stabilization has been successfully used to stabilise clayey
soils. The clay minerals carry a negative charge on the surface
which has adsorbed cations of sodium, magnesium, potassium or
hydrogen, and to a large extent responsible for imparting
plasticity to the soil sample. Lime brings changes in the
plasticity properties of a soil, it increases soil contact bonds
and hence the strength.
In India, many masonry dams were constructed by using lime-surki-
mortar, which was a mixture of lime, burnt clay and sand. Many of
these old structures have been giving satisfactory service even
to this days (IRC, 1976).
In spite of man s early used of lime as a stabilizing material,
the scientific knowledge regarding the use of lime-soil as a
significant engineering practices is only of recent origin. The
pioneering work in this connection was done in the U.S.A. (IRC,1976).
7
1.5 Need of Soil Stabilization for Road Construction in
Bangladesh
Flood plain occupies roughly seventy percent of the total land
area in Bangladesh (Bangladesh Transport Survey 1974). The flood
plain deposits are of recent origin. These deposits consist of
soils of alternate repeated layers of clays, silt and sands.
Major portion of this deposit is inundated by seasonal flooding
every year. As a result, the sub-soil becomes soft and has low
density and shear strength. Presence of ground water table close
to the surface in other times of the year except flood time also
contributes to lower the density and bearing value of the sub-
soil. Due to low topography, during road construction in most of
the land surface, earth fillings are necessary. Fill soils aregenerally excavated from nearby borrow pits. Most fill soils have
inadequate shear strength to support the traffic loads applied on
them. Also, prolonged rainfall seriously impairs the stability of
these soils. In order to serve adequately, it is essential to
improve their strength characteristics.
The conventional practice of constructing earth roads in rural
areas is to dump the loose soil over the road formation and to
render a nominal compaction. This road is subsequently exposed to
rain and monsoon flood. This together with inadequate compaction
seriously impair the durability of earth roads.
8
For uplifting rual masses, communication is a must. If the rural
masses are to join the main stream of the more previleged
urbanities, the most essential pre-requisite would be to provide
an adequate network of roads. With limitations, it is essentil
that roads are to be constructed in stages. The way is to befound out to proivide low cost roads in rural areas.
Soil is normlly the foundation material for any road, if the load
bearing capacity of soil is improved by any suitable means then a
lower thickness of road structure is needed, and eventually road
construction would be economical. Cement and lime treatments of
the in-situ soil are some of the effective methods to cope withthe above problem.
1.6 Objective of the Research
Cement stabilized soil road has always been a topic of discussion
throughout the world, but a very little effort was exercised in
practice in Bangladesh to check its suitability in adaptation and
performance characteristics. Stabilization of subgrade soil is
not in practice in our country. Review of literatures shows a
deficiency of knowledge with regard to the application of
stabilization technique in this country. The objectives of the
research therefore as follows:
i) to find out the effect of stabilizer such as cement and lime
in order to have an improved subgrade.
ii) to develop a quick evalaution techniques of compacted
sUbgrade.
iii) to have comparative economic analysis of pavement using
untreated and treated subgrade soils.
9
10
CHAPTER 2LITERATURE REVIEW
2.1 General
-The properties of the stabilized soils are influenced by a numberof important factors, such as mineralogy of the soil, quality andamount of admixtures, soil properties, compactive effort,condition following addition of admixture and curing period. Inthis chapter, a brief review is made on the mechanism of cementand lime stabilization, important aspects of properties ofstabilizsed soil, factors influencing the mechanism of
stabilization and probable effect of stabilization on theproperties of soil. A summary at the end of the chapter briefsthe detailed discussion of the chapter.
2.2 Basic Principles of Soil-Cement Stabilization
Addition of inorganic stabilizers like cement and lime have twofold effect on soil-acceleration of flocculation and promotion ofchemical bonding. Due to flocculation, the clay particles areelectrically attracted and aggregated with each other. Thisresults in an increase in the effective size of the clayaggregation (Jha, 1977). Ingles (1968) asserted that suchaggregation converts clay into the mechanical equivalent of a
11
fine silt. Also a strong chemical bonding force develops between
the individual particles in such aggregation. The chemical
bonding depends upon the type of stabilizer employed.
When water is added to cement the major hydration products are
basic calcium silicate hydrates, calcium aluminate hydrates, andhydrated lime. The first two of these products constitute
cementitious compounds, while the lime is deposited as a separate
crystaline solid phase. They are also responsible for strength
gain of soil-cement mix (O'Flaherty, 1974).
The interaction between cement and soil differs somewhat for the
two principal types of soil, granular and cohesive.
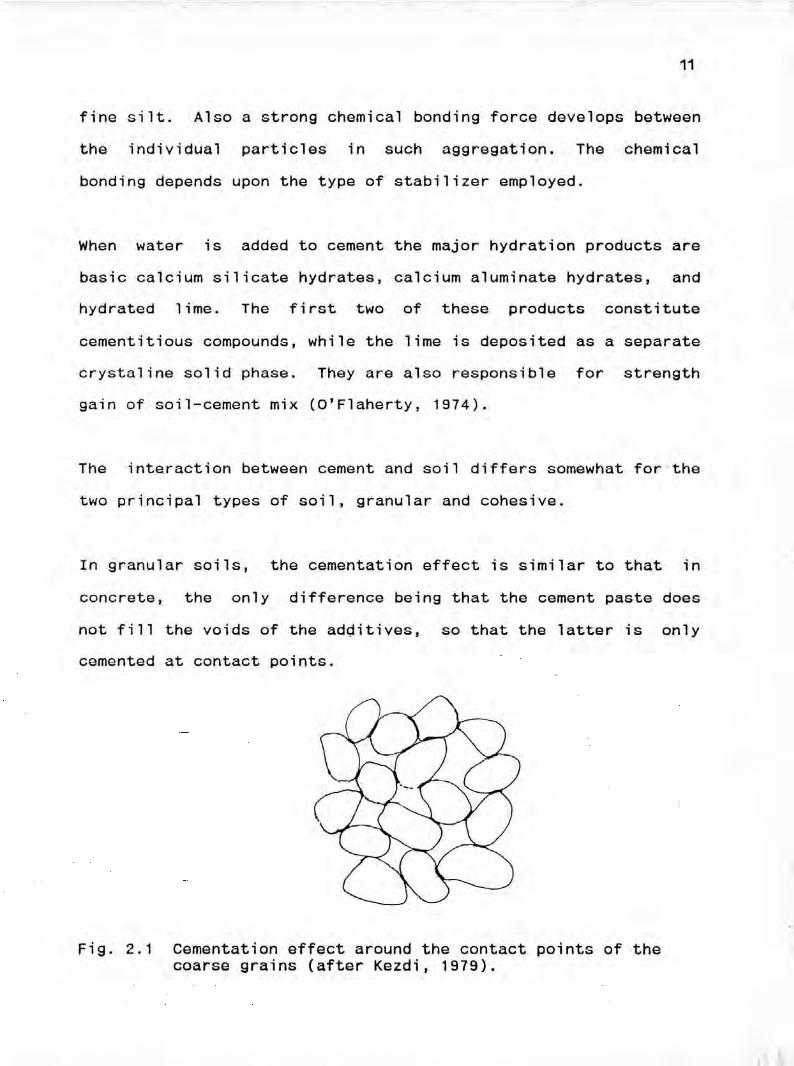
In granular soils, the cementation effect is similar to that in
concrete, the only difference being that the cement paste does
not fill the voids of the additives, so that the latter is onlycemented at contact points.
Fig. 2.1 Cementation effect around the contact points of thecoarse grains (after Kezdi, 1979).
12
Thus no continuous matrix is formed and the fracture type dependson whether the interparticle bond or the natural strength of the
particles themselves is stronger. The better graded the grain
distribution of a soil, the smaller the voids and the greater the
number and the larger the interparticle contact surfaces, the
stronger the effect of cementation (Kezdi, 1979).
In fine grained silts and clays, the cement stabilization creates
rather strong bonds between the various mineral substances and
form a matrix which efficiently encloses the non-bonded soil
particles. This matrix develops a cellular structure on whose
strength that of the entire construction depends. This happens
due to the fact that t~e strength of the clay particles within
the matrix is rather low. Since this matrix pins the particles,
the cement reduces plasticity and increases shear strength. The
chemical surface effect of the cement reduces the water affinity
of the clay and in turn, ,the water retention capacity of the
clay. Together with a strength increase, this results in theenclosure of the larger unstabilized grain aggregates which,
therefore, cannot expand and will have improved durability. The
cement clay interaction is significantly affected by the
interaction of lime, produced during hydration of Portland Cement
and the clay minerals.
13
2.3 Soil-Lime Stabilization
Addition of lime of soil changes the plasticity properties ofsoil. Calcium ions reduce plasticity of cohesive soils so thatthey become more friable and more easily worked. Changes in grainsize distribution are observed almost immediately following theaddition of lime to a clayey soil. The major change occurs withinthe first hour. The new grains produced as a result of limetreatment are mostly silt or sand sized though these arerelatively weakly bonded. Aggregation is caused by addition of 1or 2 percent lime. This reaction is due to alteration of thewater film surrounding the clay minerals. The strength of thelinkage between two clay minerals is dependent on the charge,size, and hydration of attracted ions. The lime is divalent andserves to bind the soil particles close together. This in turndecreases plasticity and results in a more open and granularstructure (Sharma, 1985).
Lime results in decreased soil density. The moisture contentneeded to achieve maximum density for a given compactive effortusually increases sometime rather significantly. Lime in excessof about 5 percent by weight of soil I generally produces littleadditional increase in optimum moisture content.
Lime increases soil strength due to reaction of lime with soilcomponents to form new chemicals. The two principal components ofsoil which react with lime are alumina and silica. This reaction
14
known as pozzolanic action is a long term one and results in a
slower long-term cementation of compacted soil lime mixtures.This reaction is somewhat similar to hydration of cement. Soillime mixes show increased strength over relative long periods of
time. This slow setting provides more flexibility in rqadconstruction (Sharma, 1985).
Lime mixed with fine grained cohesive soils causes cationexchange, flocculation, agglomeration of the sailor all of
these, and thus a lime modified soil layer is created. These
immediate reactions produce an improvement in workability and an
increase in stability (Thomson, 1970).
2.4 Characteristics and Composition of Admixtures.
In this research, Portland Cement Type - I and quick lime wereused as admixtures.
2.4.1 Portland Cement Type - I
Type I is designated as Ordinary Portland Cement for use ingeneral construction.
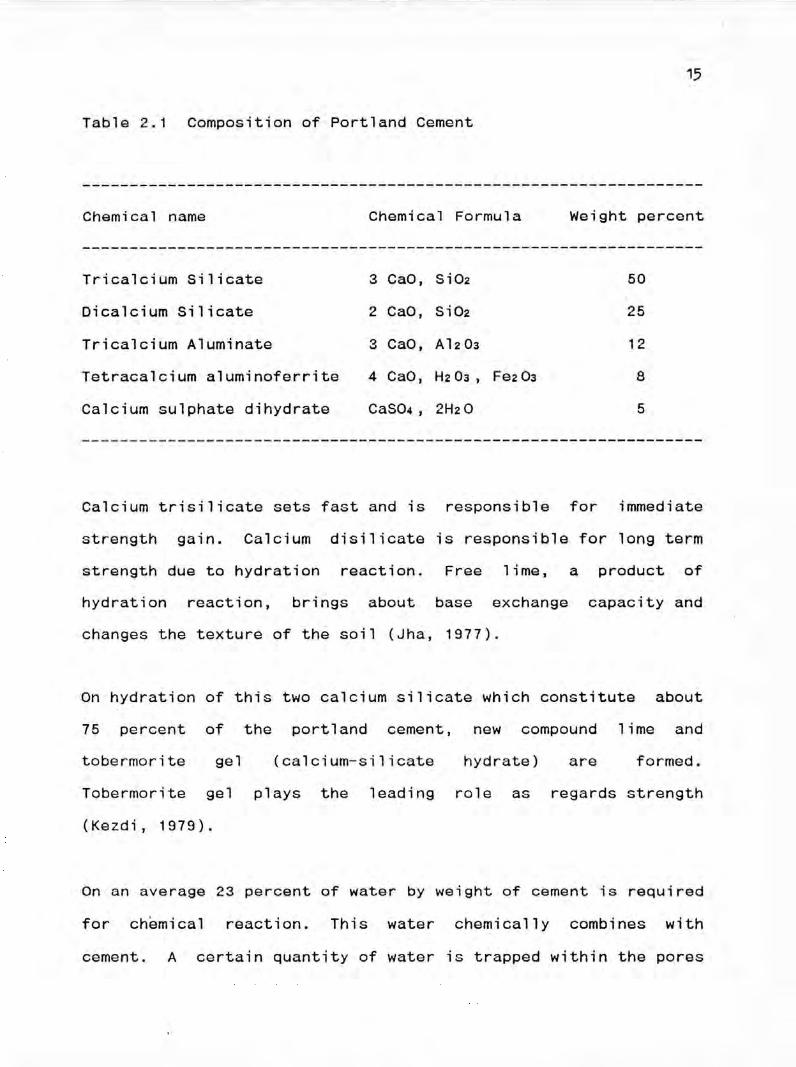
Composition of ordinary portland cement according to Mindness andYoung (1981) is shown in Table 2.1
15
Table 2.1 Composition of Portland Cement
Chemical name Chemical Formula Weight percent
Tricalcium Silicate 3 CaO, siOz 50Dicalcium Silicate ') CaO, SiOz 25'-
Tricalcium Aluminate 3 CaO, A lz03 12Tetracalcium aluminoferrite 4 CaO, Hz03 , Fez03 8
Calcium sulphate dihydrate CaS04 , 2HzO 5
Calcium trisilicate sets fast and is responsible for immediatestrength gain. Calcium disilicate is responsible for long termstrength due to hydration reaction. Free lime, a product ofhydration reaction, brings about base exchange capacity andchanges the texture of the soil (Jha, 1977).
On hydration of this two calcium silicate which constitute about75 percent of the portland cement, new compound lime andtobermorite gel (calcium-silicate hydrate) are formed.Tobermorite gel plays the leading role as regards strength(Kezdi, 1979).
On an average 23 percent of water by weight of cement is requiredfor chemical reaction. This water chemically combines withcement. A certain quantity of water is trapped within the pores
16
of tobermorite gel. It has been estimated that about 15 percentwatar by waight of camant ie raquirad to fill up tho gal-parae.Therefore, a total 38 percent of water is required for thecomplete chemical reactions and for occupying the space withingel pores (Shetty, 1982).
2.4.2 Air Slaked Lime
According to the ASTM-C-51-47, lime is defined as a general termwhich includes the various chemical and physical forms of quicklime, hydrated lime, and hydraulic lime. It may be high-calcium,magnesium or dolomitic. The quick lime is a calcined lime stone,the major part of which is calcium oxide or calcium oxide inassociation with magnesium oxide, capable of slal<ing with water.Air slaked lime is the product containing various properties ofthe oxides, hydroxides, and carbonates of calcium and magnesiumwhich results from the exposure of quick lime to the air insufficient quantity to show physical signs of hydration(difficult to determine visually in pulverized quick lime).
The calcined lime-stones contain the oxides of calcium andmagnesium in varying proportions. These oxides show a greataffinity for water. The chemical reaction is
CaO + H20 = Ca(OH)2
17
Kulkarni (1977) showed that for every 56 parts of calcium oxide,
18 prts of water by weight combine to form 74 parts of calcium
hydroxide. He also pointed out that for the hydration of lime, 47
percent of water by weight of lime was required.
2.5 Properties of Cement Stabilized Soil Mixtures
The properties of soil-cement mixtures vary with several factors
that is soil type, cement content, degree of compaction, degree
of pulverisation of soil, mixing methods and environmental
condition. Because of the variations in properties due to these
factors, it is not possible to list specific values
representative of the several properties. However, since moisture
content, compaction energy, amount of additives and conditions of
curing are closely controlled in accordance with standard
methods, it is possible to present laboratory values of the
several properties for different soils. Accordingly, the strength
characteristics, durability, volume and moisture change
characteristics, plasticity, moisture-density relationship of thetreated soil will be discussed in a limited range in thefollowing articles.
2.5.1 Compressive Strength
Evaluation of stabilized soil with admixture like cement iswidely made with the help of compressive strength of stabilized
mix. It serves as an indicator of the degree of reaction of the
18
soil-cement water mixture as well as an indicator of setting time
and 'rate of hardening'. For normally reacting granular soils, it
serves as a criterion for determining cement requirements for the
construction of soil-cement. In Britain, usual practice is tospecify the desired stabilities of most soil-cement mix in termsof minimum unconfined compressive strengths (Mustaque, 1986). The
most recent specification for soil-cement require a minimum 7 day
value of 400 psi for moist-cured cylindrical specimens having a
height/diameter ratio of 2:1 and 500 psi for cubical specimens
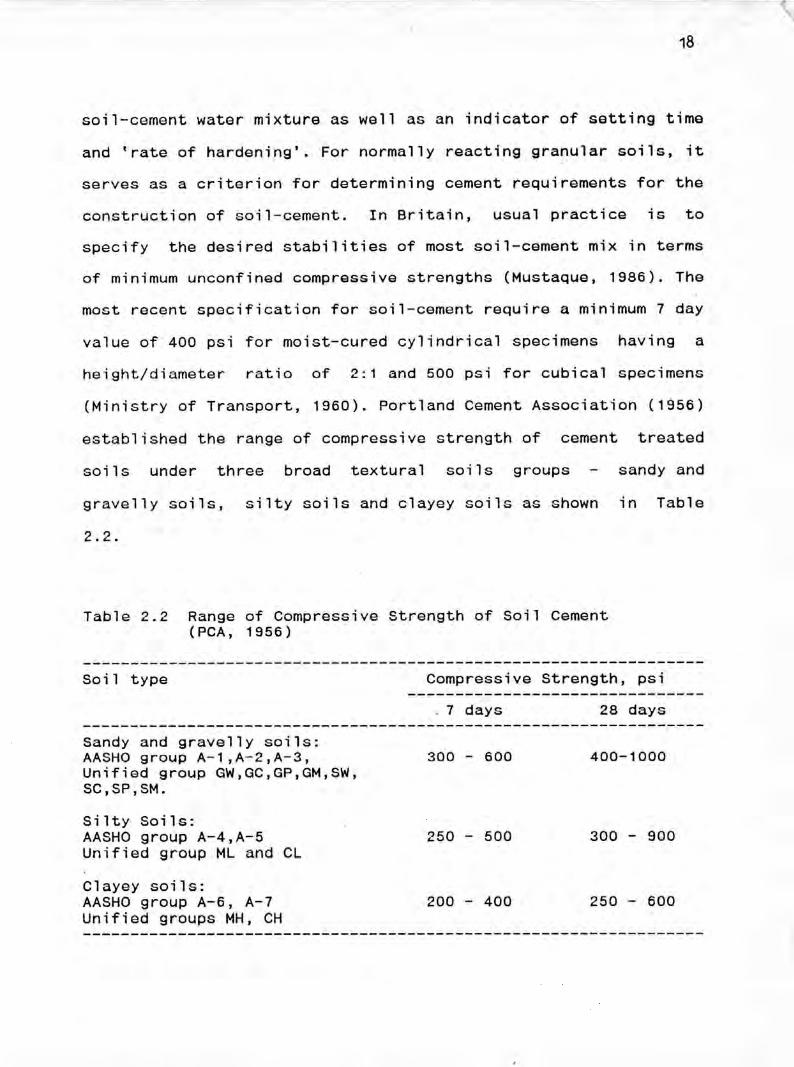
(Ministry of Transport, 1960). Portland Cement Association (1956)
established the range of compressive strength of cement treated
soils under three broad textural soils groups sandy and
gravelly soils, silty soils and clayey soils as shown in Table
2.2.
Table " "L..L. Range of Compressive Strength of Soil Cement(PCA,1956)
Soil type Compressive Strength, psi
Sandy and gravelly soils:AASHO group A-1,A-2,A-3,Unified group GW,GC,GP,GM,SW,SC,SP,SM.
Si lty Soi ls:AASHO group A-4,A-5Unified group ML and CL
Clayey soils:AASHO group A-6, A-7Unified groups MH, CH
.7 days
300 - 600
250 - 500
200 - 400
28 days
400-1000
300 - 900
250 - 600
19
Balmer (1958) and Christensen (1969) found that addition ofcement increases both the angle of friction and the cohesion. Atlower cement contents, the strength increase is mainly due toincrease in angle of internal friction whereas the same at highercement content is due to increase in cohesion. However, the rateof increase of cohesion and internal friction depends on soiltype and curing period.
2.5.2 Durability
Durability of soil-cement mixture is its resistance to repeateddrying and wetting or freezing and thawing.
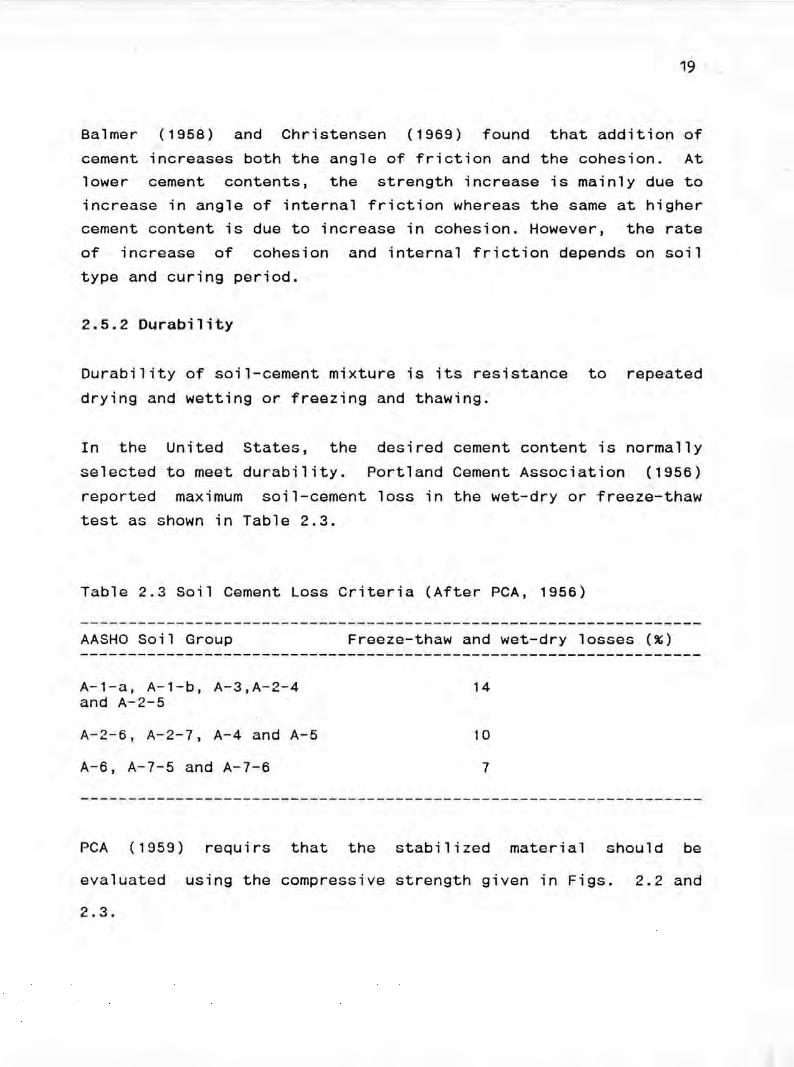
In the United States, the desired cement content is normallyselected to meet durability. Portland Cement Association (1956)reported maximum soil-cement loss in the wet-dry or freeze-thawtest as shown in Table 2.3.
Table 2.3 Soil Cement Loss Criteria (After PCA, 1956)
AASHO Soil Group
A-1-a, A-l-b, A-3,A-2-4and A-2-5
A-2-6, A-2-7, A-4 and A-5
A-6, A-7-5 and A-7-6
Freeze-thaw and wet-dry losses (%)
14
10
7
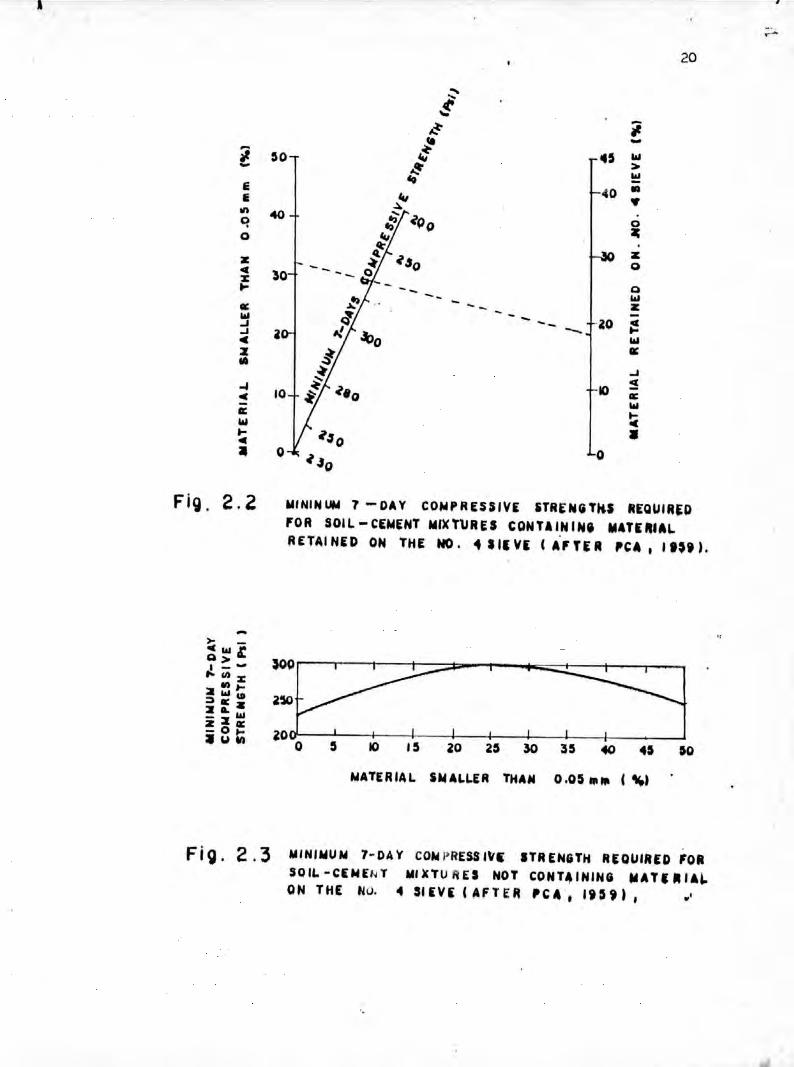
PCA (1959) requirs that the stabilized material should be
evaluated using the compressive strength given in Figs. 2.2 and
2.3.
• _ ....-
20
~-45 III
>wlQ
••03;z0
10
o
QIIIZ
_~O t!IIIII:
--
o
10
IiIionqo
II:III..J..JC:z14
Fi~. 2.2 "'NINUM 7 -DAY CONPRESS'V£ iTRENGTkl REQUIREDfOR SOIL-CEMENT WIX'rlJRES CONTlINIHi MATUIALRETAI NED ON THE NO ••• III V£ (Af nR I'CA I lUi),
:::::3::E::'lO I
o 5 10 15 20 25 30 35 40 45 50
NATER'AL 5MALLER THAH 0.05 "'''' ( •••)
Fig. 2.3 "'N'''UN 7-DAY CONI>RESSI\'E STRENGTH REQUIRED FORSOll-CENEI,T "'XTURES NOT CONTAINING MAT£"'''I-ON THE Nu. 4 SIEVi (AFTER 'CA I li5i) I wI
21
Kemahliglu et al (1967) concluded that a minimum compressive
strength requirement would not necessarily result in the most
economical cement requirement due to the fact that different
soil-cement mixtures exhibit different strengths at similar
degree of durability. Interesting conclusion by them was the
minimum compressive strength required for various AASHTO soil
groups to meet PCA criteria when applied through wet-dry test
(i.e. satisfying maximum soil-cement loss criteria of PCA) is not
a constant but probably varies as a function of other parameters(physical and chemical properties).
Mustaque (1986) showed that the local silty soils satisfied the
durability criteria recommended by the Portland Cement
Association (PCA) at about 8 percent cement contents.
2.5.3 Volume and Moisture Change
The volume and moisture change of soil-cement mixtures are of
particular importance with respect to pavement cracking.
Cracking formation is a natural characteristics of soil-cement
mixes whose tendency to crack is related to strength, although
this relation is not yet fully understood.
Apart from fractures due to loading, cracks are caused by volumechanges which may be due to three effects: water content,
temperature changes and freezing. If a cohesive soil is treated
with cement, then the shrinkage due to water content variation of
22
the soil-cement thus obtained will certainly be less than that of
the original soil. Shrinkage decreases with increased cement
content, owing to the development of a soil-cement matrix
(Willis, 1947 and Jones, 1958). With the increase in cement
content, the soil-cement matrix assumes more stable
configureation resulting in decreased shrinkage. If on the
otherhand, cement is added to a soil which is not liable to
volume change by itself, the volume change of the product will be
greater. This happens because of the shrinkage during the cement
hydration (Kezdi, 1979).
The volume change of soil cement is determined by the usual
wetting and drying test methods through direct volume measurement
or linear measurement of height. Cement addition has been seen to
reduce the specific volume variation upto 33 or even 50 percent.
Another reason for the volume change of cement soils is
temperature variation. According to measurements performed in
India, the thermal expansion co-efficient depends on the cement
content and density (Kezdi, 1979).
2.5.4 Plasticity
If a plastic soil is treated with cement, its plasticity indexdecreases. This effect is reflected by the different types of
failure encountered in such cases. Felt (1953) showed that
plasticity index of the granular soil decreases when treated with
23
cement.
For cement stab1ized soil, it is seen that the plastic limit and
liquid limit increases with icnreasing cement content. But
increase in plastic limit is appreciable resulting in decrease in
plasticity index at higher cement content (Mustaque, 1986).
Redus (1958) found that with increase in cement content and for
longer curing period, plasticity index reduces. Ahmed (1984) also
showed that for sandy soil and silty clay plastic limit increases
on addition of cement.
2.5.5 Moisture - Density Relation
The optimum moisture content and maximum dry density influence
the compaction characteristics of cement treated soils.Generally, for cement treated soils, these two data can be said
to vary slightly from those obtained from untreated soils.
However, there is exception of this behaviour (Mustaque, 1986).
With the addition of cement, maximum dry density of sand
increases. Little or no change is observed for light to medium
clays, but decrease in density may occur in silts. Decrease in
optimum moisture content occur for clays and it increases for the
silts but little or no change takes place for sands and san~y
soils. Mustaque (1986) showed that for silty soil denE1ty
decreased with increasing cement content. He a1~v found for an A-
24
4 silty soil that density decrdased upto 4% cement content and
after that, almost no ch~:lge occured. For sandy silt, there had
been decrea~~d in density with the increase in cement content
from 1/2 f-drcent upto 10 percent by Ahmed (1984).
2.5.6 Strength in Terms of CBR Value
The California Bearing Ratio abbreviated as CBR is the most
widely used method of evaluation of subgrade. The method was
first developed by California Division of Highways and then
adopted and modified by U.S. Corps of Engineers, in 1961. TheAmerican Association of State Highway and TransprotationOfficials, AASHTO accepted this test in 1963 with designation T
193 - 63 for determining the bearing values of subgrade soils and
some sub-base and base course materials containing only a small
amount of material retained on the 3/4 inch sieve.
The CBR value is an important parrameter for evaluating the
subgrade and bases. It is used to rate the performance of soils
primarily for use as bases and sUbgrades beneath pavements of
roads and airfields. The Table 2.4 gives typical ratings (AASHTO,
1966).
25
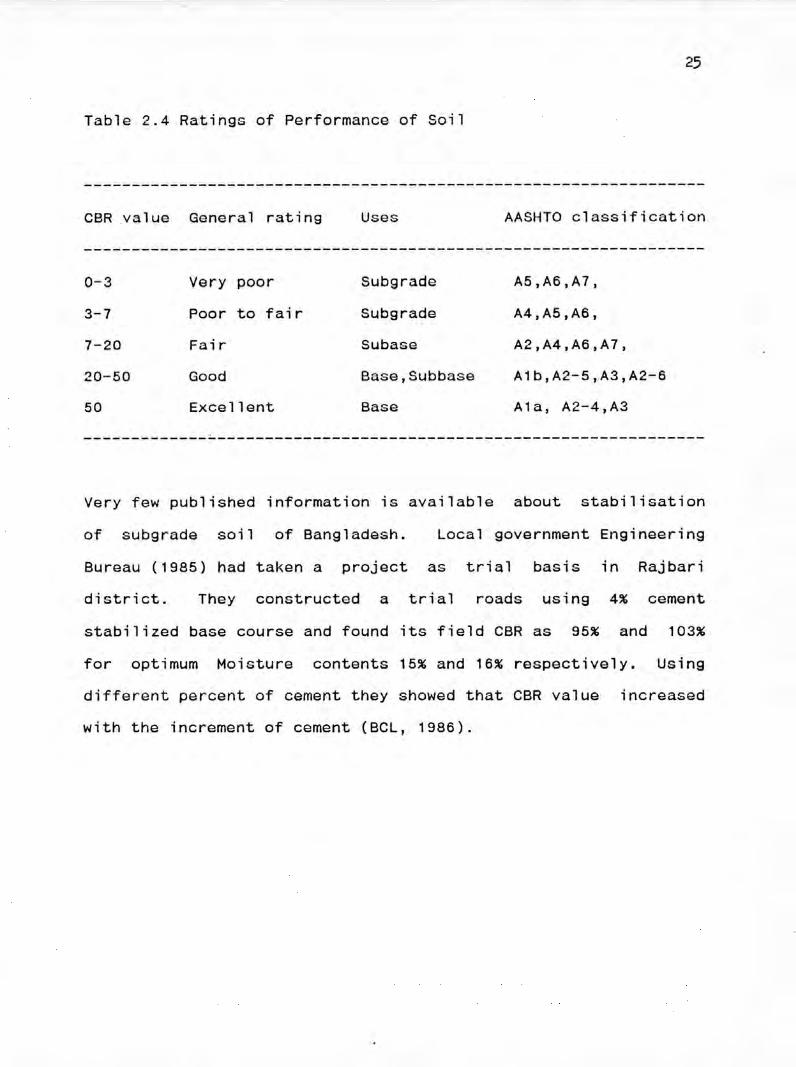
Table 2.4 Ratings of Performance of Soil
CBR value General rating Uses AASHTO classification
0-3 Very poor Subgrade A5,A6,A7,
3-7 Poor to fair Subgrade A4,A5,A6,
7-20 Fair Subase A2,A4,A6,A7,
20-50 Good Base,Subbase A1b,A2-5,A3,A2-6
50 Excellent Base A1a, A2-4,A3
Very few published information is available about stabilisation
of subgrade soil of Bangladesh. local government Engineering
Bureau (1985) had taken a project as trial basis in Rajbari
district. They constructed a trial roads using 4% cement
stabilized base course and found its field CBR as 95% and 103%
for optimum Moisture contents 15% and 16% respectively. Using
different percent of cement they showed that CBR value increased
with the increment of cement (BCl, 1986).
26
2.6 Properties of Lime-treated Soil Mixture
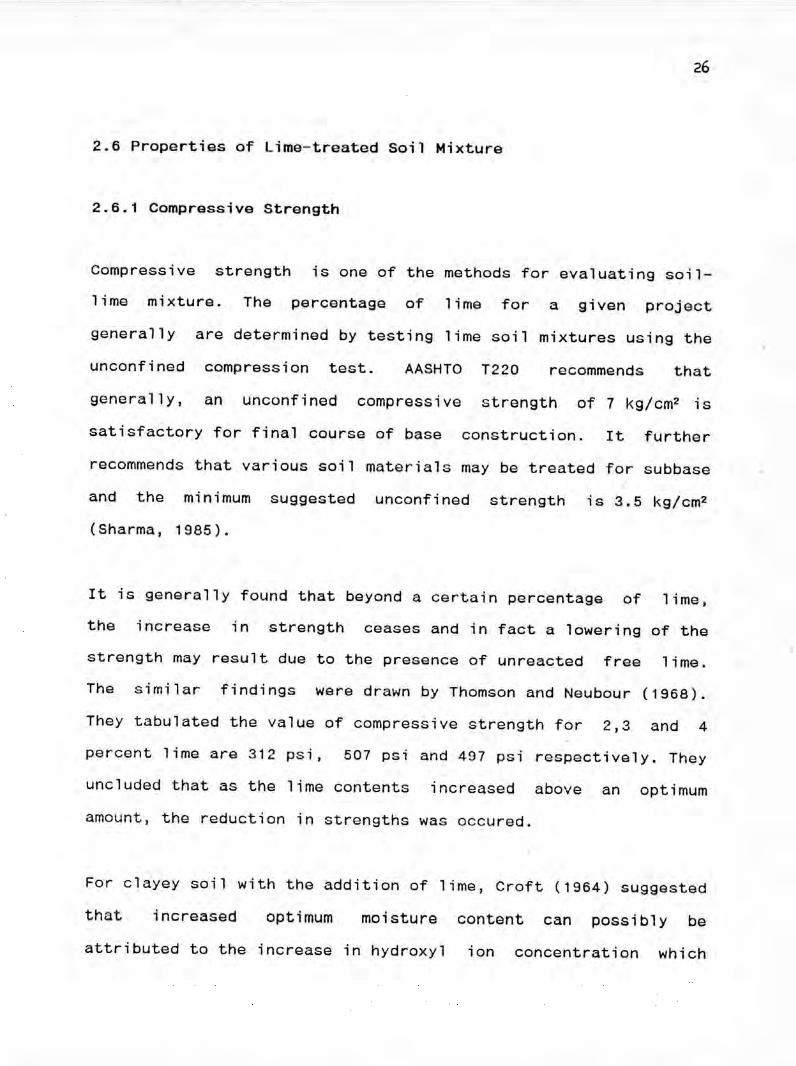
2.6.1 Compressive Strength
Compressive strength is one of the methods for evaluating soil-
lime mixture. The percentage of lime for a given project
generally are determined by testing lime soil mixtures using theunconfined compression test. AASHTO T220 recommends thatgenerally, an unconfined compressive strength of 7 kg/cm2 is
satisfactory for final course of base construction. It further
recommends that various soil materials may be treated for subbase
and the minimum suggested unconfined strength is 3.5 kg/cm2(Sharma, 1985).
It is generally found that beyond a certain percentage of lime,
the increase in strength ceases and in fact a lowering of thestrength may result due to the presence of unreacted free lime.
The similar findings were drawn by Thomson and Neubour (1968).
They tabulated the value of compressive strength for 2,3 and 4
percent lime are 312 psi, 507 psi and 497 psi respectively. They
uncluded that as the lime contents increased above an optimum
amount, the reduction in strengths was occured.
For clayey soil with the addition of lime, Croft (1964) suggestedthat increased optimum moisture content can possibly beattributed to the increase in hydroxyl ion concentration which
modifies
strength.
27
the surface of clay particles and increases the
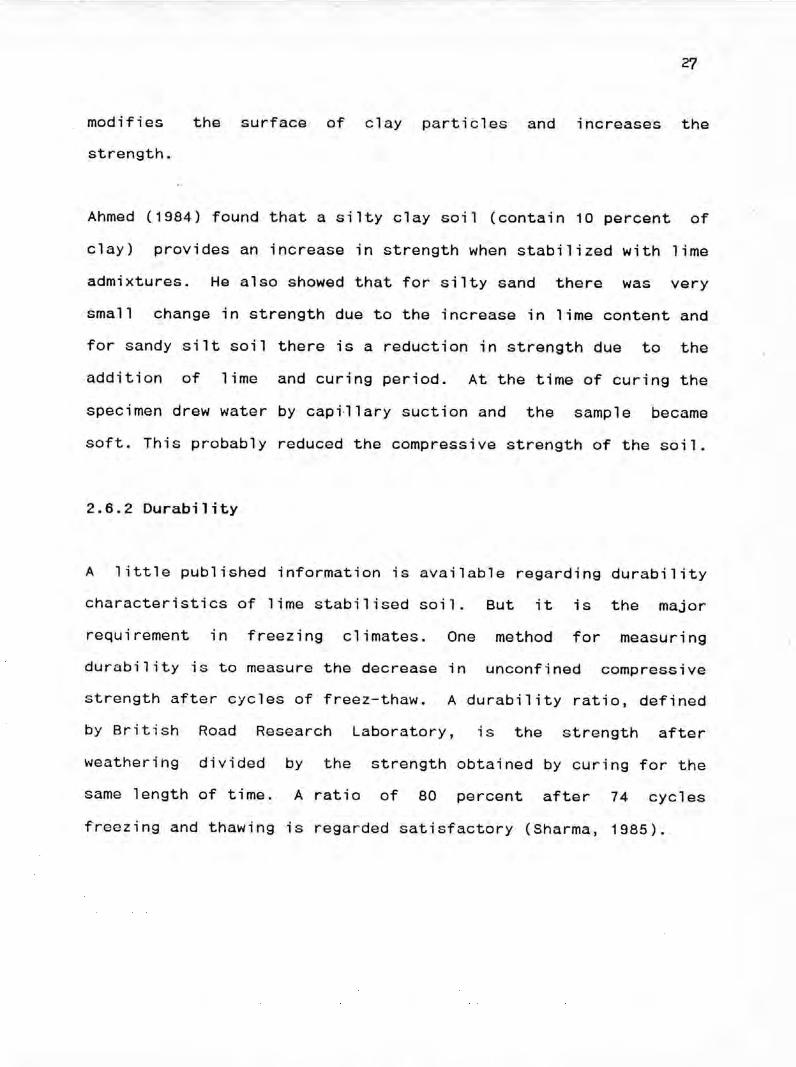
Ahmed (1984) found that a silty clay soil (contain 10 percent of
clay) provides an increase in strength when stabilized with lime
admixtures. He also showed that for silty sand there was very
small change in strength due to the increase in lime content and
for sandy silt soil there is a reduction in strength due to the
addition of lime and curing period. At the time of curing the
specimen drew water by capillary suction and the sample became
soft. This probably reduced the compressive strength of the soil.
2.6.2 Durability
A little published information is available regarding durability
characteristics of lime stabilised soil. But it is the major
requirement in freezing climates. One method for measuring
durability is to measure the decrease in unconfined compressive
strength after cycles of freez-thaw. A durability ratio, defined
by British Road Research Laboratory, is the strength after
weathering divided by the strength obtained by curing for the
same length of time. A ratio of 80 percent after 74 cycles
freezing and thawing is regarded satisfactory (Sharma, 1985).
28
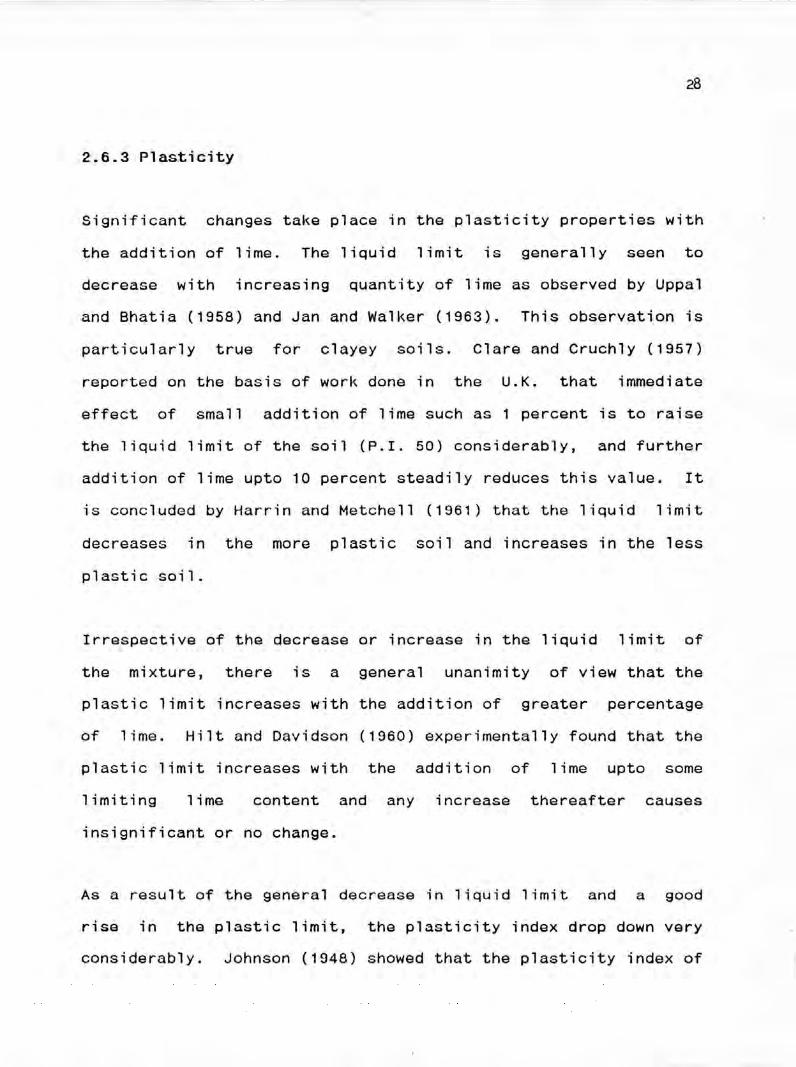
2.6.3 Plasticity
Significant changes take place in the plasticity properties withthe addition of lime. The liquid limit is generally seen todecrease with increasing quantity of lime as observed by Uppaland Bhatia (1958) and Jan and Walker (1963). This observation isparticularly true for clayey soils. Clare and Cruch1y (1957)reported on the basis of work done in the U.K. that immediateeffect of small addition of lime such as 1 percent is to raisethe liquid limit of the soil (P.I. 50) considerably, and furtheraddition of lime upto 10 percent steadily reduces this value. Itis concluded by Harrin and Metche11 (1961) that the liquid limitdecreases in the more plastic soil and increases in the lessplastic soil.
Irrespective of the decrease or increase in the liquid limit ofthe mixture, there is a general unanimity of view that theplastic limit increases with the addition of greater percentageof lime. Hilt and Davidson (1960) experimentally found that theplastic limit increases with the addition of lime upto somelimiting lime content and any increase thereafter causesinsignificant or no change.
As a result of the general decrease in liquid limit and a goodrise in the plastic limit, the plasticity index drop down veryconsiderably. Johnson (1948) showed that the plasticity index of
29
highly plastic clays is reduced considerably with only a small
amount of lime, where as the less plastic soils are slightly
reduced by the addition of even large amount of lime.
2.6.4 Moisture-Density Relation
It has been generally found that lime-soil mixture has a lower
standard miximum dry density than the raw soil without lime. Laddand et al (1960) showed that as the lime content increases, the
density tends to fall. The reduction in density is probably due
to the flocculated particles present in the lime soil mixture.
Andrews and O'Flaherty (1968) showed that with a sandy type of
soil, if a semi-hydrated lime is added, the maximum dry weight
can actually increase as a result of the additive. Another trend
that can be found is the increase in the optimum moisture content
of the soil with addition of lime was shown by Croft (1964). The
increased optimum content can possibly be attributed to the
increase in CH-ion concentration which modifies the surface of
clay particles and increases the water associated by them.
2.6.5 Bearing Strengths by CBR Value
Lime treatment of a wide range of typical fine grained Illinoissoils compacted at their optimum water contents showed that CBR
value was increased due to increment of lime (Thomson and
Beubaur, 1968). Arman and Munfakh (1968) found that the CBR value
for inorganic soils increased due to the addition of lime upto
lime fixation point and then decreased.
No published information is available regarding this test result
of lime stabilized soil of this country.
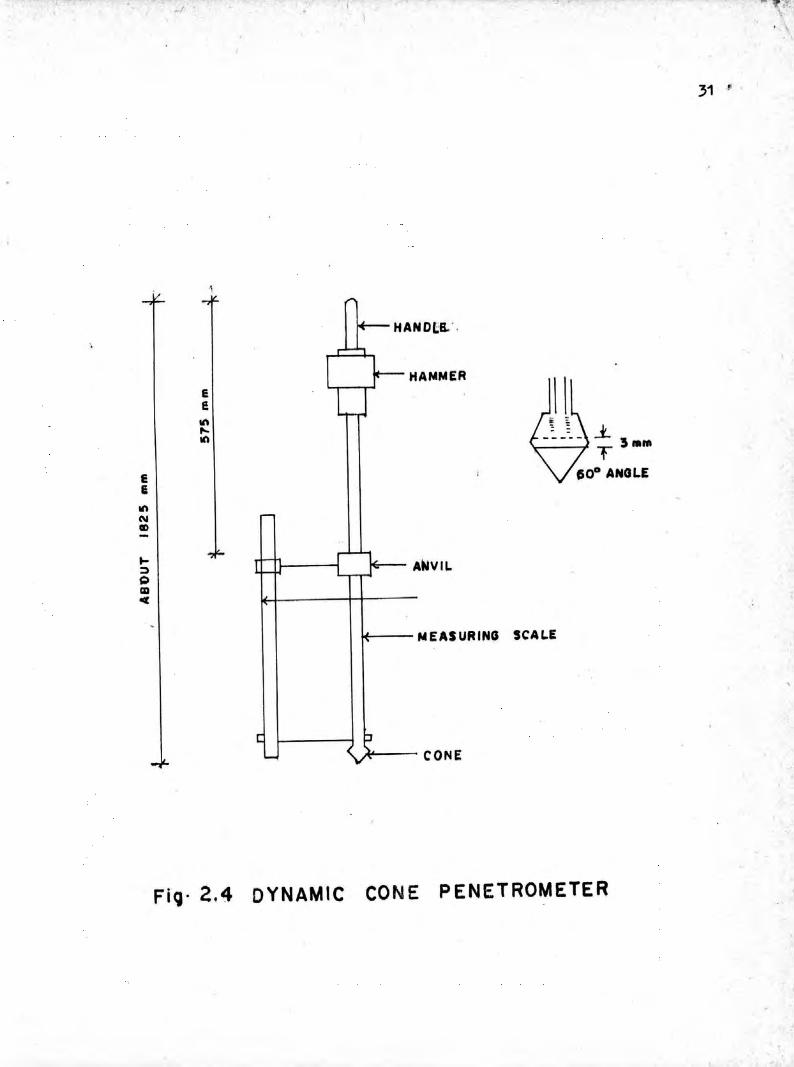
2.7 Dynamic Cone Penetrometer Value and its Relationship with CBR
The dynamic Cone penetrometer abbreviated as DCP is a simple
equipment which can be used for evaluating the strength of
pavement structure and for controlling the quality of work. It
can also be used to design the new road pavements.
A typical diamgram of the dynamic cone penetrometer is shown in
Fig. 2.4. In order to obtain the pavement thickness it is
necessary to find the strength of the subgrade. The DCP of the
subgrade should be found in the worst condition, that is soaked
condition, during the wet season. If it is necessary to determine
the DCP in the dry season then an area of subgrade should besoaked by ponding for at least a week before the OCP is taken(BRRL, 1985).
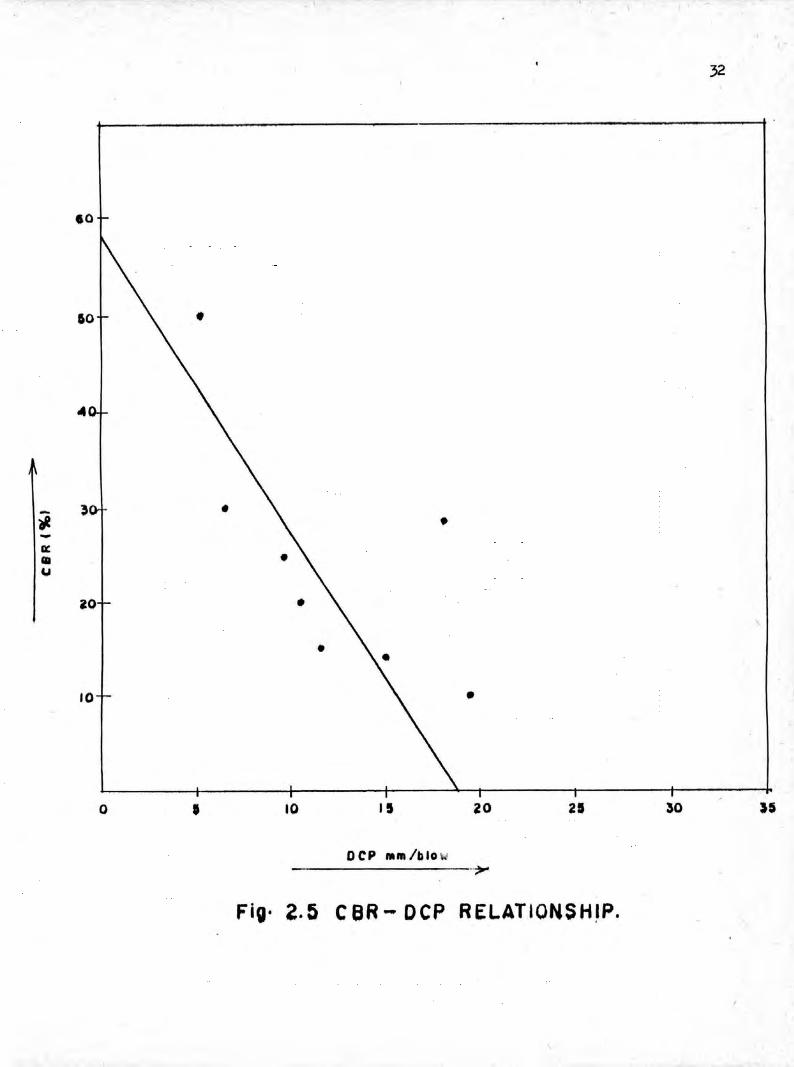
A corelation can be establized between the laboratory DCP and CBR
value. During the construction period, the field DCP can be
measured sand its corresponding CBR value is evaluated from the
correlation. A relationship between DCP and CBR of subgrade soil
was developed by Bangladesh Road Research Laboratory (BRRL, 1985)
which is shown in Fig. 2.5.
---------_~/-----------.-------------------~~'r~y
31 •
HAMMEReeItl••• ..1.Itl T 3 ••111
e 600 ANGLEEItlNCD-~ ANVIL::I
"CD<Cl:
MEASURING SCALE
CONE
FiQ,2.4 DYNAMIC CONE PENETROMETER
60
10
10
DCP IIIm/blo\.'----------->-
Fig. 2.5 C BR - DCP RElATIONSH'P.
32
33
2.8 Summary of the Literature Review
From above literature review the important points may besummarized below:
i) Cement can be used successfully for stabilizing sands andsilty soils whereas for increasing clay content in the soilexcessive cement is warranted.
ii) Silty clay soil provides an increase in strength whenstabilized with lime admixture.
iii) Different soil~cement mixtures at the similar degree ofdurability may exhibit different strengths.
iv) In cement treated soil mixtures, the plasticity indexreduces with increase in cement content. Lime treatment issuitable for plastic soil.
v) California Bearing Ratio (CBR) value of soil cement mixtureincreases as the cement content and compactive effortincreases.
vi) For lime treated soils california bearing ratio generally
increases due to the addition of lime upto a limit and thendecreases.
vii) Dynamic Cone Penetrometer value is important for evaluating
the subgrade, subbase and base courses.
CHAPTER 3
THE RESEARCH SCHEME
3.1 Introduction
For efficient and economic application of stabilization technique
it is essential to understand the basic mechanism of the process.
The broad objective of this research is to experimentally review
various aspects of soil-cement and soil-lime stabilization of two
selected subgrade soils.
3.2 The Test Programme
The whole research was divided into the fo~lowing phases:
i) In first phase, index properties of the soil samples weredetermined in order to classify them.
ii) In the 2nd phase, the moisture density relationship of the
soils were established. Then durability and strength of
stabilized soil were evaluated by wetting drying test,
unconfined compressive strength test and California Bearing
Ratio Test.
iii) In the third phase, dynamic cone penetrometer test was
36
conducted on stabilized soil to have a relationship between
DCP and CBR.
iv) In the final phase, a cost analysis was developed on treated
and untreated subgrade soil.
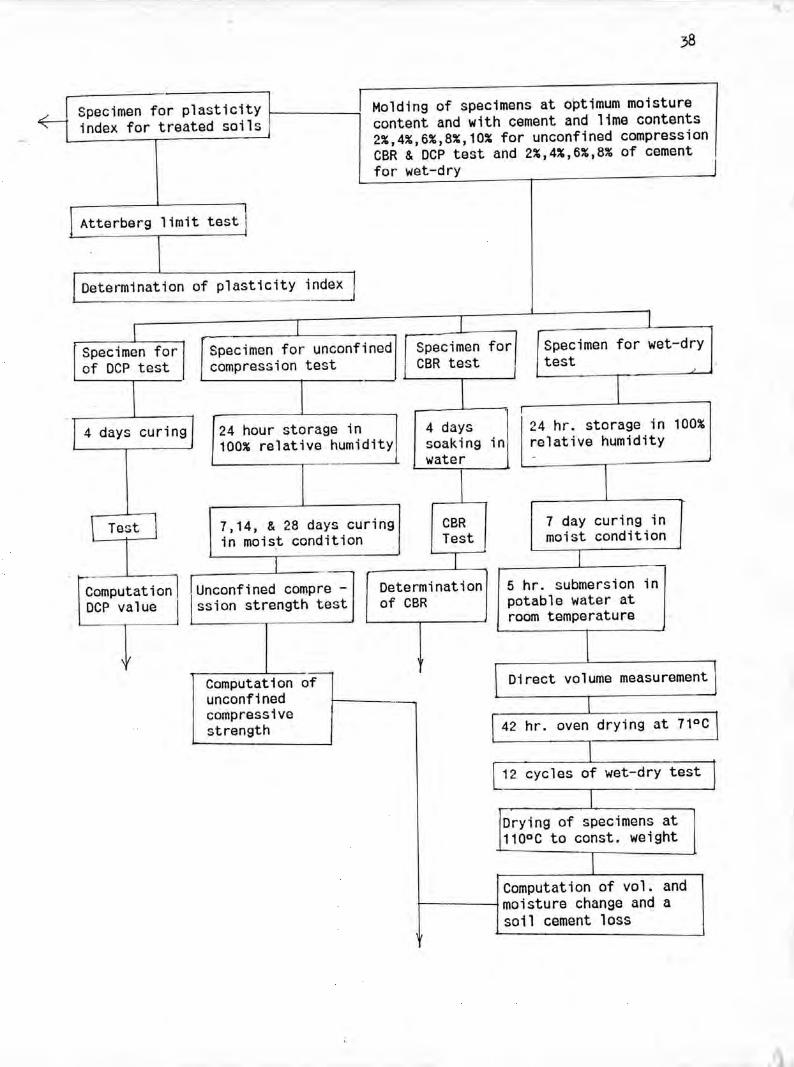
The experimental program followed is illustrated by a flow chart
as shown in Fig. 3.1.
3.3 Materials
3.3.1 Soils
In this research, two soil samples were collected from flood
protection embankment of Greater Dhaka city and Dhaka Aricha
Highway. Both the samples have low CBR values. The soils were
designaated as follows:
Soil A - Collected from Embankment at Katasur, Mohammadpur,
Dhaka.
Soil B - Collected from Chandgaon on Dhaka - Aricha Highway 13
miles away from Zero point, Dhaka.
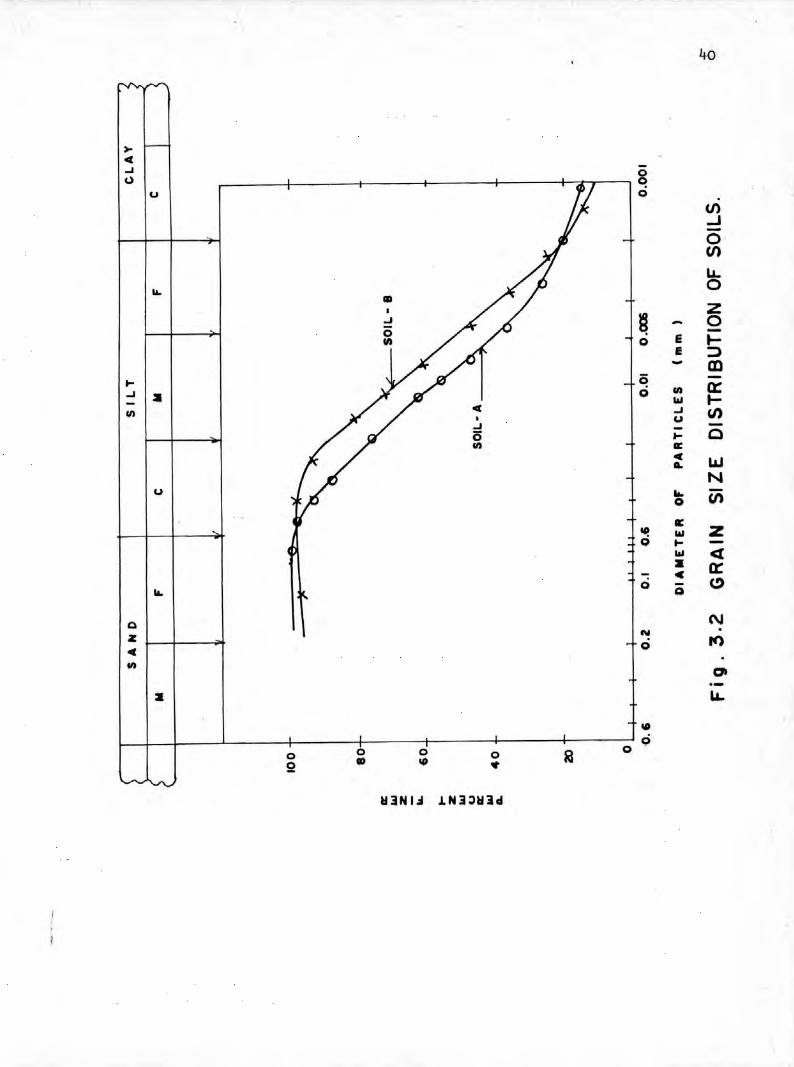
The properties of untreated soils are presented in Table 3.1 and
grain size distribution curves are shown in Fig. 3.2.
37
3.3.2 Cement
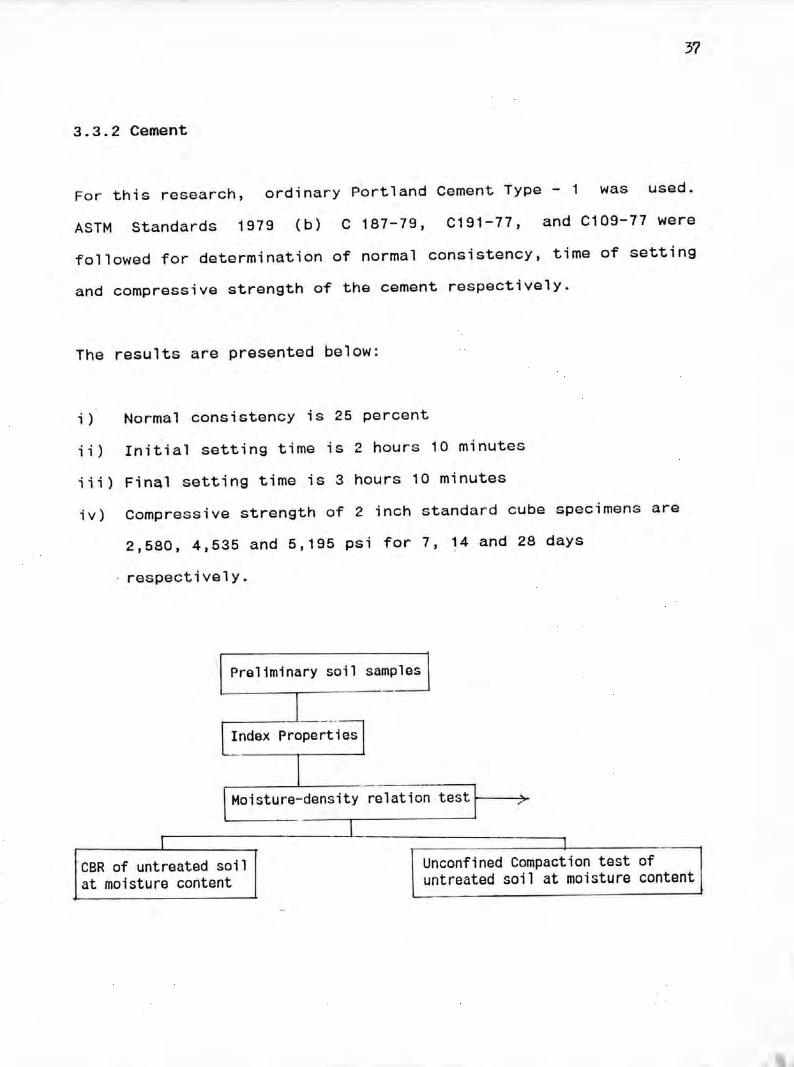
For this research, ordinary Portland Cement Type - 1 was used.ASTM Standards 1979 (b) C 187-79, C191-77, and C109-77 werefollowed for determination of normal consistency, time of settingand compressive strength of the cement respectively.
The results are presented below:
i) Normal consistency is 25 percentii) Initial setting time is 2 hours 10 minutesiii) Final setting time is 3 hours 10 minutesiv) compressive strength of 2 inch standard cube specimens are
2,580, 4,535 and 5,195 psi for 7, 14 and 28 daysrespectively.
Preliminary soil samples
J _L=.ndex
Moisture-density-;:~lation~--------7
r-,--------:=I-CBR of untreated soilat moisture content
Unconfined Compaction test ofuntreated soil at moisture content
ISpecimen for plasticity Iindex for treated soils
Atterberg limit test
Determination of plasticity index
Molding of specimens at optimum moisturecontent and with cement and lime contents2%,4%,6%,8%,10% for unconfined compressionCBR & DCP test and 2%,4%,6%,8% of cementfor wet-dry
24 hr. storage in 100%relative humidity
Specimen forof DCP test
Specimen for unconfined!compression test
24 hour storage in100% relative humidity
Specimen forCBR test
4 dayssoaking inwater
Specimentest for wet-d~y I
7,14, & 28 days curingin moist condition
CBRTest
7 day curing inmoist condition
ComputationDCP value
",co,fi,ed com.ce - Ission strength test
Computation ofunconfinedcompressivestrength
Determinationof CBR
5 hr. submersion inpotable water atroom temperature
Direct volume measureme~
[42 hr. oven drying at 71~
L-.~----12 cycles of wet-dry test IDrying of specimens at110°C to const. weight
Computation of vol. andmoisture change and asoil cement loss
39
Develop a CBR- Conclusion about volume and moisture change characteristics,DCP relationship strength and durability to stabilized soil
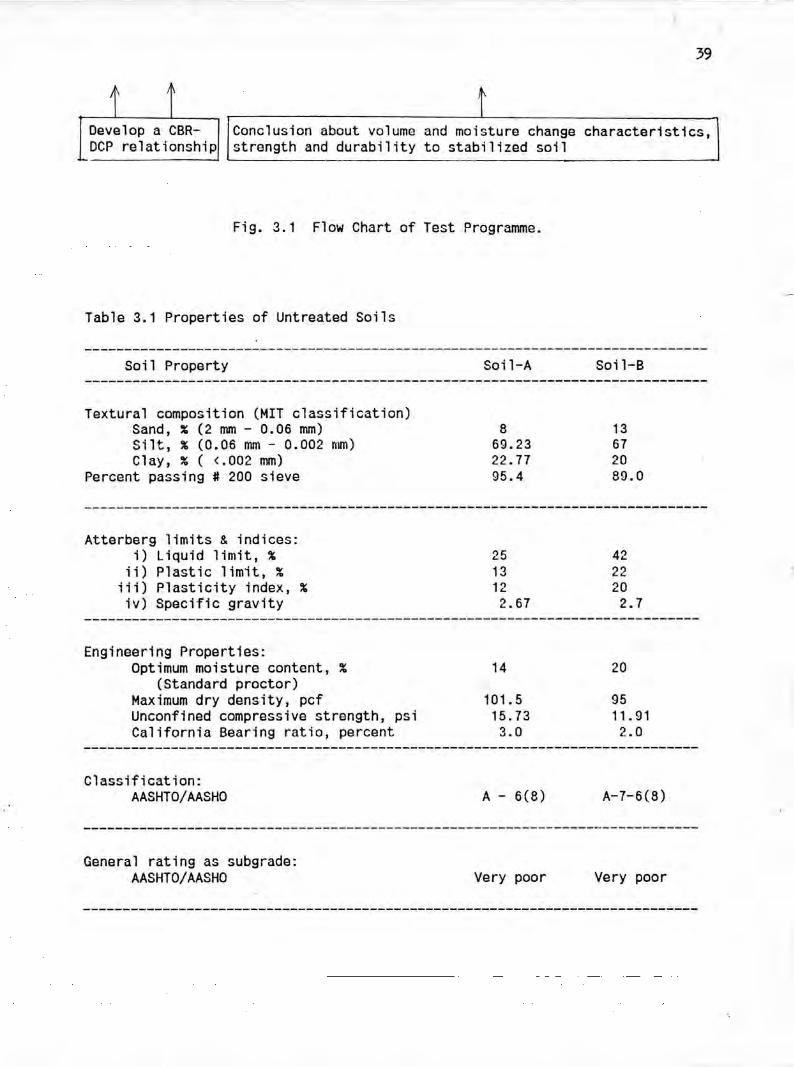
Fig. 3.1 Flow Chart of Test Programme.
Table 3.1 Properties of Untreated Soils
Soil Property
Textural composition (MIT classification)Sand, % (2 mm - 0.06 mm)Silt, % (0.06 mm - 0.002 TrIm)Clay, % ( <.002 mm)
Percent passing # 200 sieve
Atterberg limits & indices:i) Liquid limit, %
ii) Plastic limit, %iii) Plasticity index, %iv) Specific gravity
Engineering Properties:Optimum moisture content, %
(Standard proctor)Maximum dry density, pcfUnconfined compressive strength, psiCalifornia Bearing ratio, percent
Classification:AASHTOjAASHO
General rating as subgrade:AASHTOjAASHO
Soil-A
869.2322.7795.4
2513122.67
14
101. 515.733.0
A - 6(8)
Very poor
Soil-B
13672089.0
4222202.7
20
9511.912.0
A-7-6(8)
Very poor
40
>-c(
..I0
0C!
u 0(J)...I
0(/')
1.1-0
~z0
0 e ~e :JCD
~ C! -..I :I 0 III a::
ILl ~III ..J (J)
U -~ 0a::c(
LLIIL
Nu Vi•••0
a::141 ILl Z0 ~ -
ILl <[:I a::c
••• 00
C)
0 Nz N .c(
0...,
III01
:I u..141
ci0 0 0 0 0
QCD 141 .,.
tUN 1.:1 .LN3:ltl3d
41
CHAPTER 4
LABORATORY INVESTIGATION
4.1 Introduction
The investigation in the laboratory were conducted in accordance
with the programme outlined in Art. 3.2. The details of the
experimental procedure are discussed in this chapter.
4.2 Test for Index Properties
Test for index properties of the soils were determined according
to procedures specified by the American Association of State
Highway and Transportation Officials (AASHTO) and the American
Society for Testing Material (ASTM). Table 4.1 shows the standardmethods followed:
42
Table 4.1 Standards Method followed for Testing toClassify Soil
-----------------------------------------------------------------Property of Soil AASHTO standard followed-----------------------------------------------------------------Liquid limitPlastic limit and plasticity indexGrain size distributionAmount of materials finer thannO.200 sieve
T89T90T88
T11-----------------------------------------------------------------
In addition AASHTO T100 was followed for determination ofspecific gravities of the soils.
The soils were then classified according to AASHTO M145 49standard. The test results along with their classification andgrain size distribution are presented in Table 3.1 and Fig. 3.2.
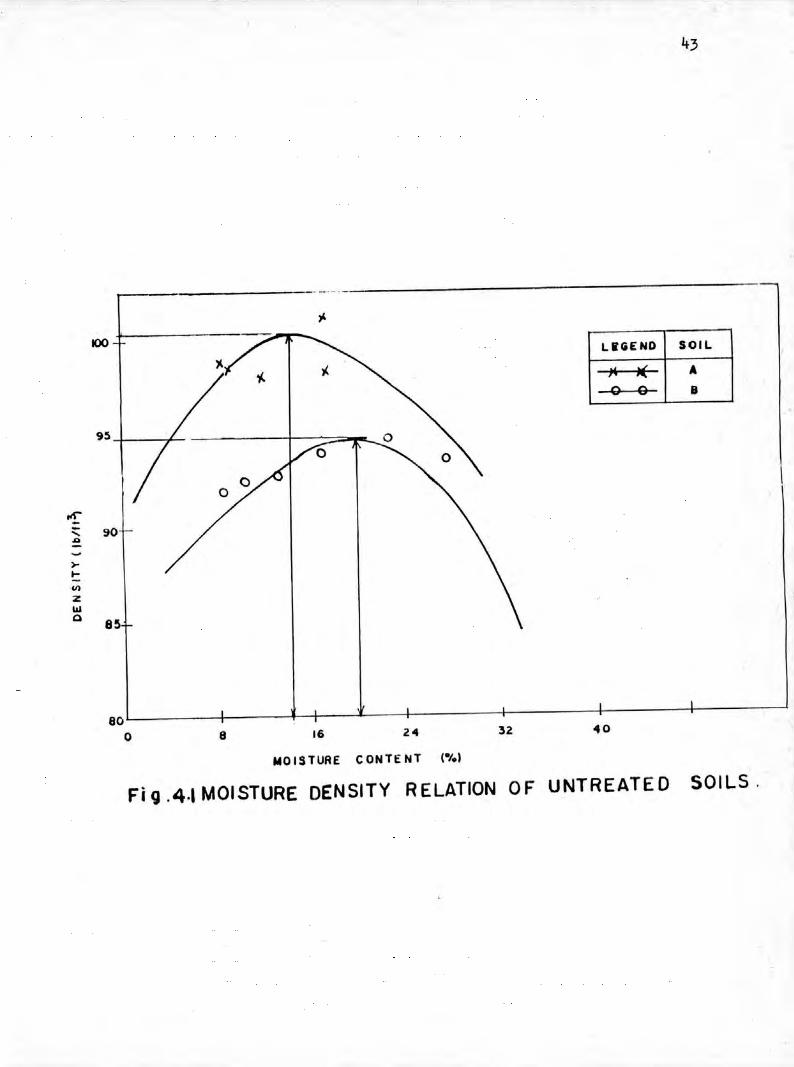
4.3 Moisture - Density Relation
Moisture - density relationships for the soils were determinedaccording to AASHTO method T99. For compaction of the soils,cylindrical mold of 4 inch diameter and 4.6 inch height was used.
>-•...UI
ZUIQ
80o 8 16 24 32
43
LICiENO SOIL,. J( A
0 0 B
40
MOISTURE CONTENT (.1.1
Fi 9 .4.1 MOISTURE DENSITY RELATION OF UNTREATED SOILS.
44
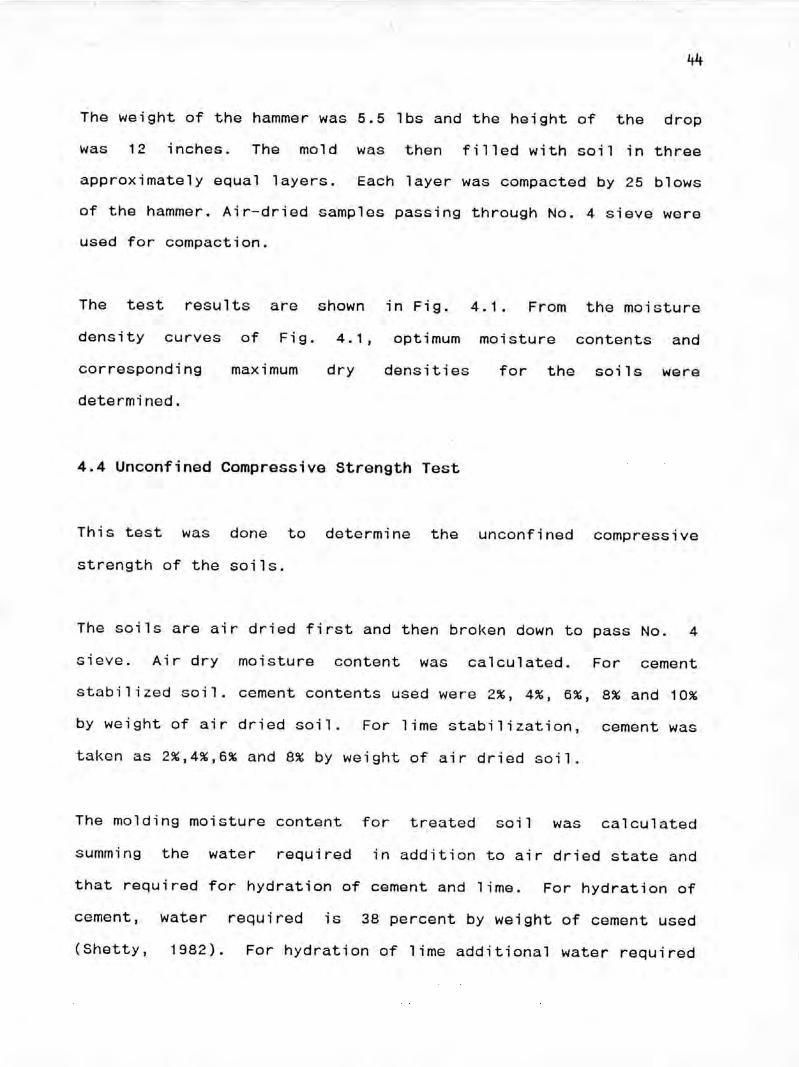
The weight of the hammer was 5.5 lbs and the height of the drop
was 12 inches. The mold was then filled with soil in threeapproximately equal layers. Each layer was compacted by 25 blows
of the hammer. Air-dried samples passing through NO.4 sieve wereused for compaction.
The test results are shown in Fig. 4.1. From the moisture
density curves of Fig. 4.1, optimum moisture contents and
corresponding maximum dry densities for the soils weredetermined.
4.4 Unconfined Compressive Strength Test
This test was done to determine the unconfined compressive
strength of the soils.
The soils are air dried first and then broken down to pass No. 4
sieve. Air dry moisture content was calculated. For cement
stabilized soil. cement contents used were 2%, 4%, 6%, 8% and 10%
by weight of air dried soil. For lime stabilization, cement was
taken as 2%,4%,6% and 8% by weight of air dried soil.
The molding moisture content for treated soil was calculated
summing the water required in addition to air dried state and
that required for hydration of cement and lime. For hydration of
cement, water required is 38 percent by weight of cement used
(Shetty, 1982). For hydration of lime additional water required
is 47%. For each batch, 8 1bs of soil samples were taken and
mixed manually with the required amount of moisture and
admixture. Immediately after mixing, the mixture was compacted
following AASHTO standard T99. After compaction, density was
determined by weighing the mold with the compacted soil. This is
the molding density. For molding moisture content determination,
around 50 gms of sample from the mixture was taken. The compacted
sample was then extracted from the mold by a jack. For each
compacted sample. 3 cylindrical samples of 1.4 inch diameter and
2.8 inch height were trimmed off by a piano wire.
These samples were then transferred to a dessicator to store in
moist environment for 24 hours and then cured for 7,14 and 28
days. Curing was done by placing the samples on a filter paper
placed on the porous plate in the dessicator. Water was added so
that the filter paper became saturated and water level was always
maintained just in touch with the filter. It was expected that
the samples would draw water from the dessicator by capillaryrise and got cured.
The unconfined compressive strengths for 7,14 and 28 days were
then determined following ASTM standard 02166 - 66 (1972).
Moisture contents at failure also d~termined. The results areshown and discussed in the 5th chapter.
4.5 Durability Test (Wetting and Drying Test)
This test is aimed at testing the reaction of the stabilized soilto the effect of repeated drying and wetting.
The samples were prepared by compaction following AASHO Method
T99. Dimensions of the samples tested were identical to those of
the standard proctor molds. The air dried soils were passed
through No. 4 sieve. Air dry moisture contents was calcualted.
For cement stabilized samples, cement contents of percentages of
2,4,6 and 8 by weight of air dried soil were used.
In order to attain the required moisture content, the water
required in addition to air dried state and for hydration was
calculated. 8 lbs of soil sample were taken and the required
amount of water and admixture were added. The mixture was
compacted according to AASHO standard T99 except that the surfaceof each compacted layer was roughened prior to the application ofthe next by scratching a square grid lines 8 inch wide and 1/8
inch deep having approximately 1/4 inch spacing. During
compaction the water content of a representative sample was
determined. After compaction, the mold was weighed for
determination of density. The compacted sample was then extractedfrom the mold by an extruder.
Each test required two samples: One for testing the volume and
moisture change. While the second was used for soil-cement loss
determination. The ready made samples were weighed and stored for
24 hours in humid surrounding. Then the samples were cured for 7
days in dessicator, keeping the samples over a filter paper just
touching the water below. Weight and dimensions are checked in
curing period. Following 7 day treatment, the samples were
submerged in tap water for 5 hours at room temperature, leaving a
water layer of 1 inch above them. After removal the weight and
dimensions of specimen no. 1 were checked, then both samples were
placed into an oven at 71°C for 42 hours. This was followed byanother weight check, then specimen no. 2 was brushed by standard
ASTM brush by eighteen to twenty strokes on sides and four oneach end. Finally a third weighing was performed to determine theweight loss. The operations enumerated represent a single
durability or wetting - drying test cycle, 12 cycles for eachsample performed.
Therefore, volume and moisture change were calculated as a
percentage of original volume and moisture content. The soil-
cement loss was expressed as a percentage of the original oven
dry weight.
The results of the wet - dry test for soil-cement have been shown
and discussed in the 5th Chapter.
48
4.6 California Bearing Ratio Test
CBR test is a penetration test wherein, a standardized piston,
having an end area of 3 sq. inch is caused to penetrate the
sample at a standard rate of 0.05 inch per minute. The unit load
required to penetrate the sample at 0.1 inch and 0.2 inch
penetration is then compared with a value of 1000 lb per sq. inchand 1500 lb per sq. inch respectively required to effect the samepenetration in standard crushed rock. For design purpose the CBR
value of the subgrade, base or subbase course at worst condition
is required which can be obtained by testing the sample, afterbeing saturated.
California Bearing Ratio (CBR) test was performed according to
AASHO T193 and ASTM 01883 - 73. With the variation of cement and
lime from 2 percent to 10 percent, samples were prepared at their
optimum moisture contents. Molds were compacted by 5.5 lbs hammer
applying 65, 35 and 10 blows per layer. For each type of
compactive effort three samples were taken for testing. The
samples were cured in water for 4 days keeping a surcharge weight
of 10 lbs on the top of,the mold. During soaking, the 'water level
in the mold and the soaking tank was maintained approximately 1.0inch Qbove the top of the specimen. After being saturated, thepenetration test was done. Due to swelling of the specimen, the
top surface may be loose to some extent. Therefore the strees-
strain curve obtained from the penetration test some times become
upward which required correction by moving it to the right. By
CBR value it means corrected value when this correction has beenapplied to the curve.
The test results are shown in Chapter 5.
4.7 Dynamic Cone Penetrometer Test
The dynamic cone penetrometer used for this investigation was
described in literature review having the vertical steel rod 16
mm diameter instead of 10 mm diameter as specified by BRRL
(1985). In use the cone at the bottom of the rod is placed on the
bed under test and the hammer is lifted to the stop at the top of
the handle and allowed to fall freely a fixed distance onto the
anvil in the middle of the rod. This drives the cone into the
sample and its depth of penetration is read on the measuringscale. This process is repeated until the cone has penetrated the
full depth of the sample. The rate of penetration in millimetresper below is termed as the DCP value.
The samples prepared for this test were identical to those of CBR
test. The DCP apparatus was placed on the CBR mould and initial
reading from the scale was recorded. Then the cone was driven
into the mould by allowing the hammer to fall freely. During the
process the depth of penetration was recorded for each below. The
penetration in mm per below was considered as the DCP value.
Three operators were required to work the dynamic cone
penetrometer, one to hold the instrument vertically, a second to
lift the hammer and a third to control the procedure and recordthe penetration.
The test result are shown in Chapter 5.
51
CHAPTER 5
RESULTS AND DISCUSSIONS
5.1 Introduction
In this chapter, test results are presented and discussed in
details." These results would demonstrate the effect of admixture
on the plasticity. durability. strength, volume and moisture
change characteristics of the stabilized soils. The quick
evaluation technique of compacted subgrade is also discussed. A
comprative cost analysis of pavement using untreated and treated
subgrade soil is also presented in this chapter.
5.2 Wetting and Drying Test
The results of the wetting and drying test are presented in the
following articles:
5.2.1 Minimum Cement Content
Minimum cement content required for soil-cement mixture was
ascertained from the results of the wet-dry test as per PCA
recommendation.
52
I~LEi£ND lOlL
I
A
PCA
-0 -'- <>--~- - I( _.
•..zw~ 10wA.
o 4 10
C~MENT CONTENT. 'iRCiNT
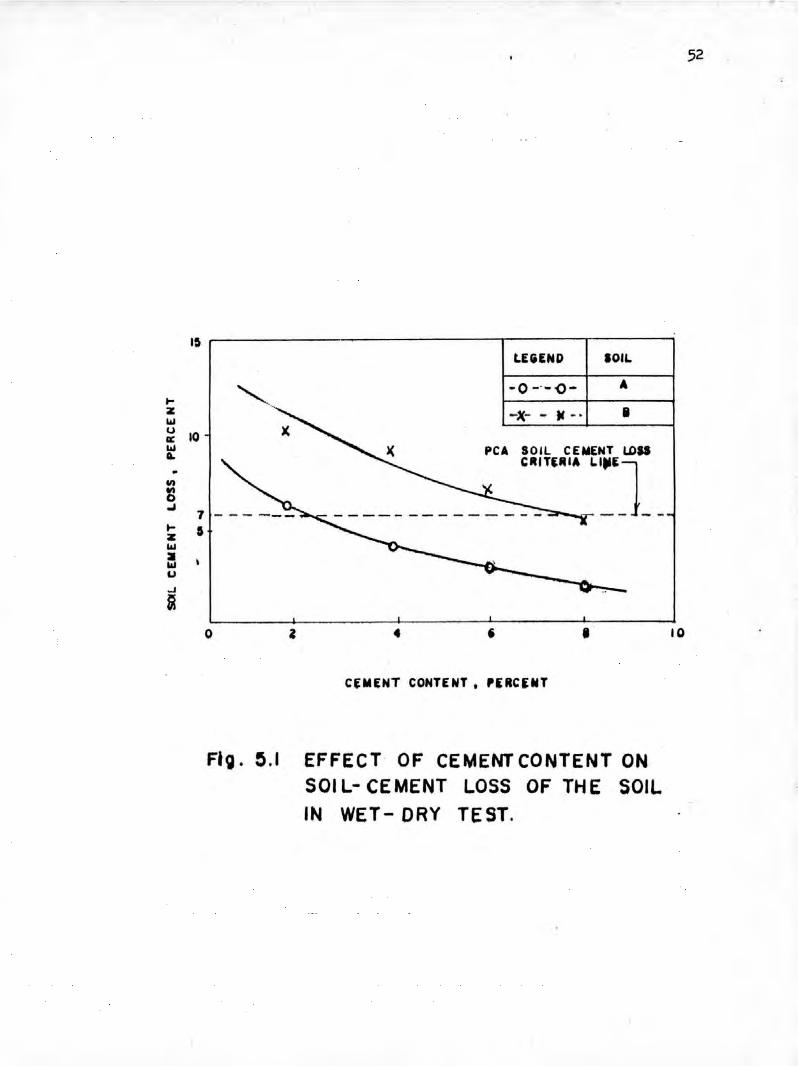
FlO. ~.I EFFECT OF CEMENT CONTENT ON501 L- CE MENT LOSS OF TH E SOILIN WET- DRY TEST.
53
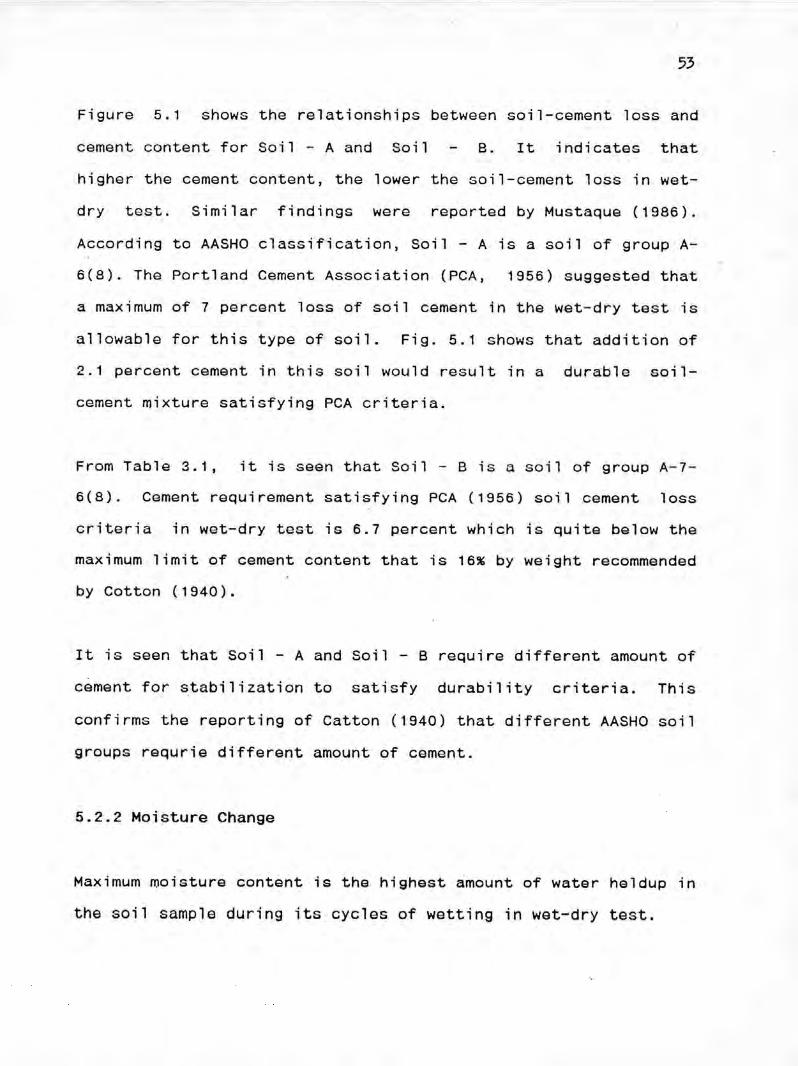
Figure 5.1 shows the relationships between soil-cement loss andcement content for Soil - A and Soil B. It indicates thathigher the cement content, the lower the soil-cement loss in wet-dry test. Similar findings were reported by Mustaque (1986).According to AASHO classification, Soil - A is a soil of group A-6(8). The Portland Cement Association (PCA, 1956) suggested thata maximum of 7 percent loss of soil cement in the wet-dry test isallowable for this type of soil. Fig. 5.1 shows that addition of2.1 percent cement in this soil would result in a durable soil-cement mixture satisfying PCA criteria.
From Table 3.1, it is seen that Soil - B is a soil of group A-7-6(8). Cement requirement satisfying PCA (1956) soil cement losscriteria in wet-dry test is 6.7 percent which is quite below themaximum limit of cement content that is 16% by weight recommendedby Cotton (1940).
It is seen that Soil - A and Soil - B require different amount ofcement for stabilization to satisfy durability criteria. Thisconfirms the reporting of Catton (1940) that different AASHO soilgroups requrie different amount of cement.
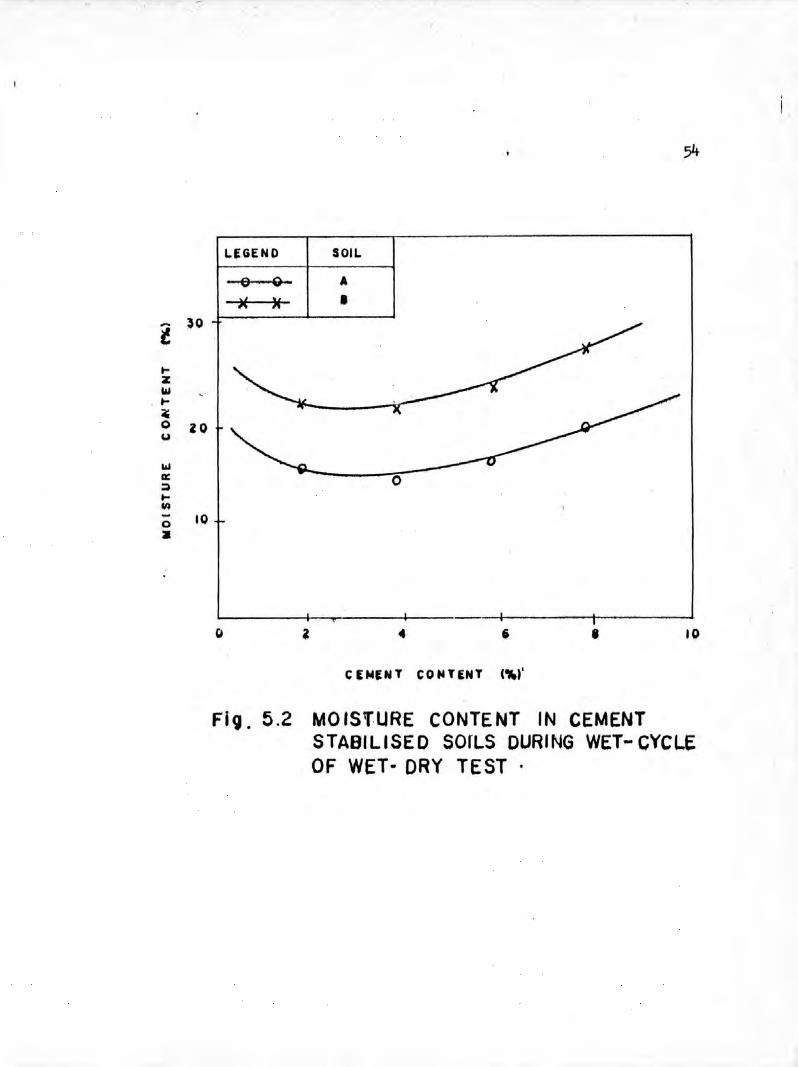
5.2.2 Moisture Change
Maximum moisture content is the highest amount of water heldup inthe soil sample during its cycles of wetting in wet-dry test.
LEGEND SOIL
0 G A
>< )( •t )0
I-Z
'".1-~0 ZOu
'"DC 0;)
I-III- 100
••
I
4 i 10
C EMENTeo •• TEN T I"'"
Fig. 5.2 MOISrURE CONTENT IN CEMENTSTABILISED SDrLS DURING WET- CYCLEOF WET- DRY TEST'
55
Fig. 5.2 shows the maximum moisture contents for Soil A and B
against cement contents. It is seen that moisture content
increases for higher cement. Similar results were reported by
Mustaque (1986). It is seen that the maximum moisture content in
wet dry test occurs for 8 percent cement contents for soil A andB which are 18.57 and 20.72 percent respectively (Appendix A-5).On the otherhand, moisture content at failure of unconfined
compressive strength of the above soils are 27.35 and 27.70
percent respectively. Soil confirms the result of Mostaque (1986)
where he showed that moisture contents at failure in unconfined
compressive strength were well above the maximum moisture content
in wet-dry test which also confirmed that the strength test
result were representative for a situation when road subgrade or
sub-base were completely submerged.
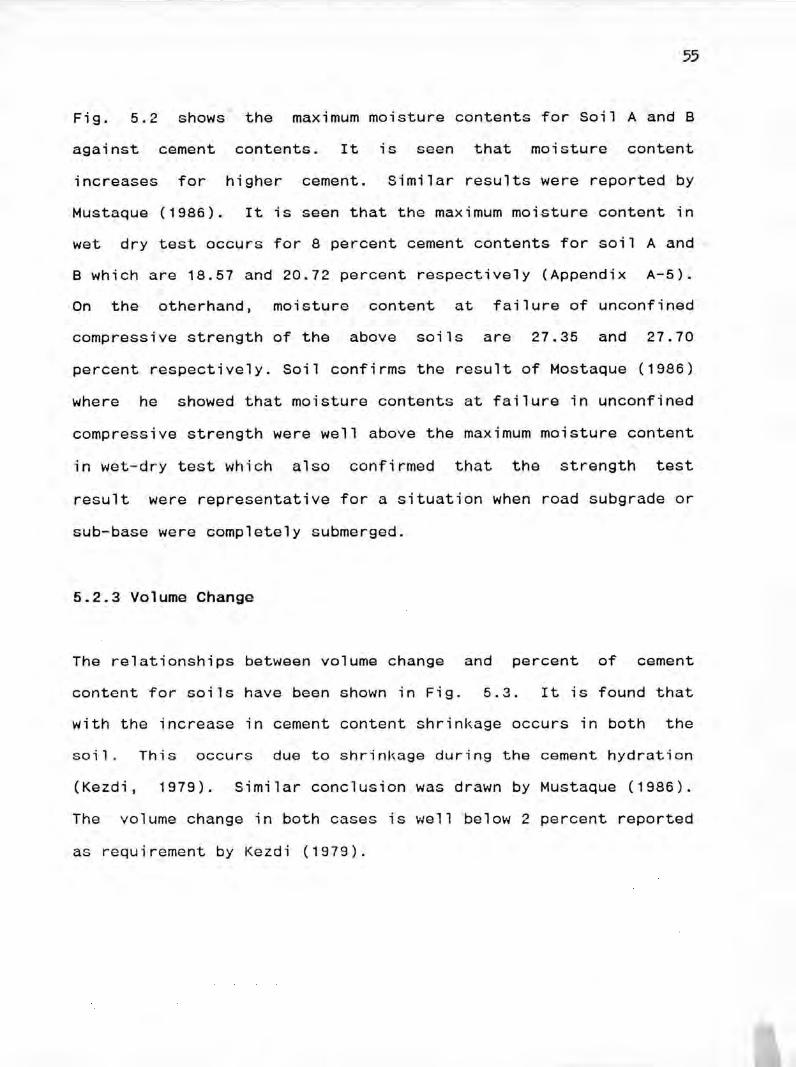
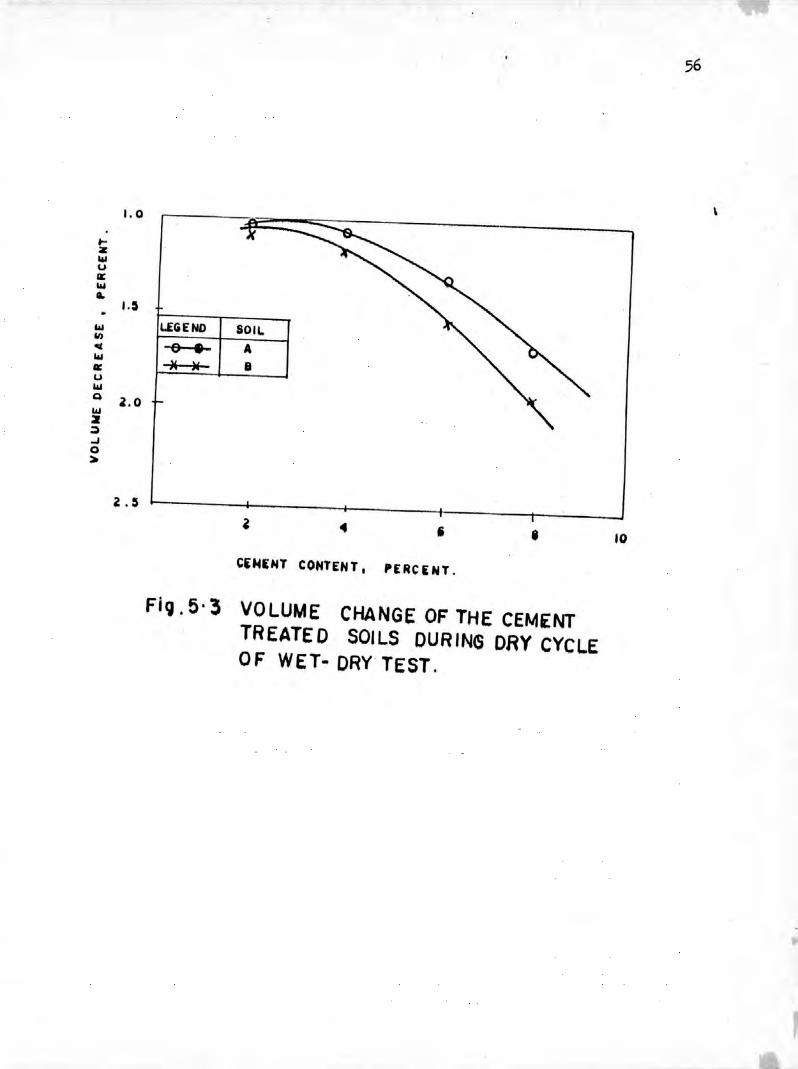
5.2.3 Volume Change
The relationships between volume change and percent of cement
content for soils have been shown in Fig. 5.3. It is found that
with the increase in cement content shrinkage occurs in both thesoil. This occurs due to shrinkage during the cement hydration
(Kezdi, 1979). Similar conclusion was drawn by Mustaque (1986).
The volume change in both cases is well below 2 percent reported
as requirement by Kezdi (1979).
56
\1.0
•..z••••UII:
••••0-
I.~
•••• LEGEND SOILIII
40( e II•••• )4 ~ BII:u••••Q l.O••••zj..JQ:.
2.~~ 4 i , '0CiNf;HT CONTENT I PERCUH.
Fi9. 5. 3 VOLUME CHANGE OF THE CEMENTTREATED SOILS DURING DRY CYCLEOF WET- DRY TEST.
57
5.3 Unconfined Compressive Strength
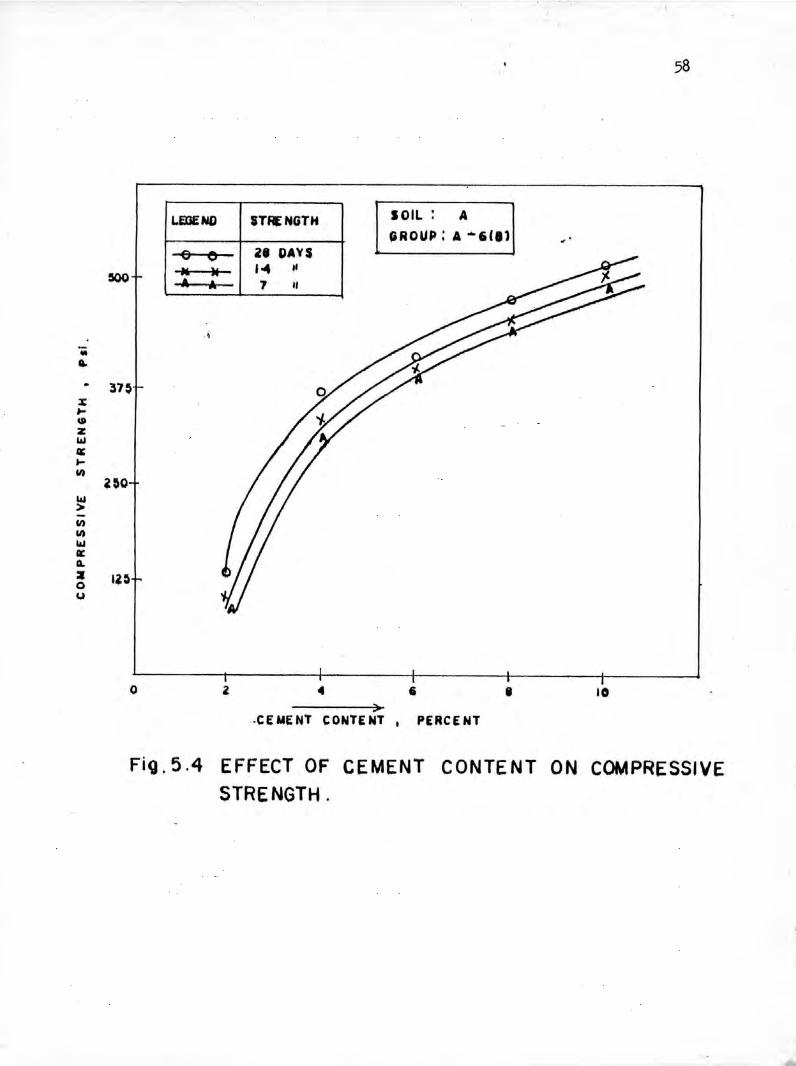
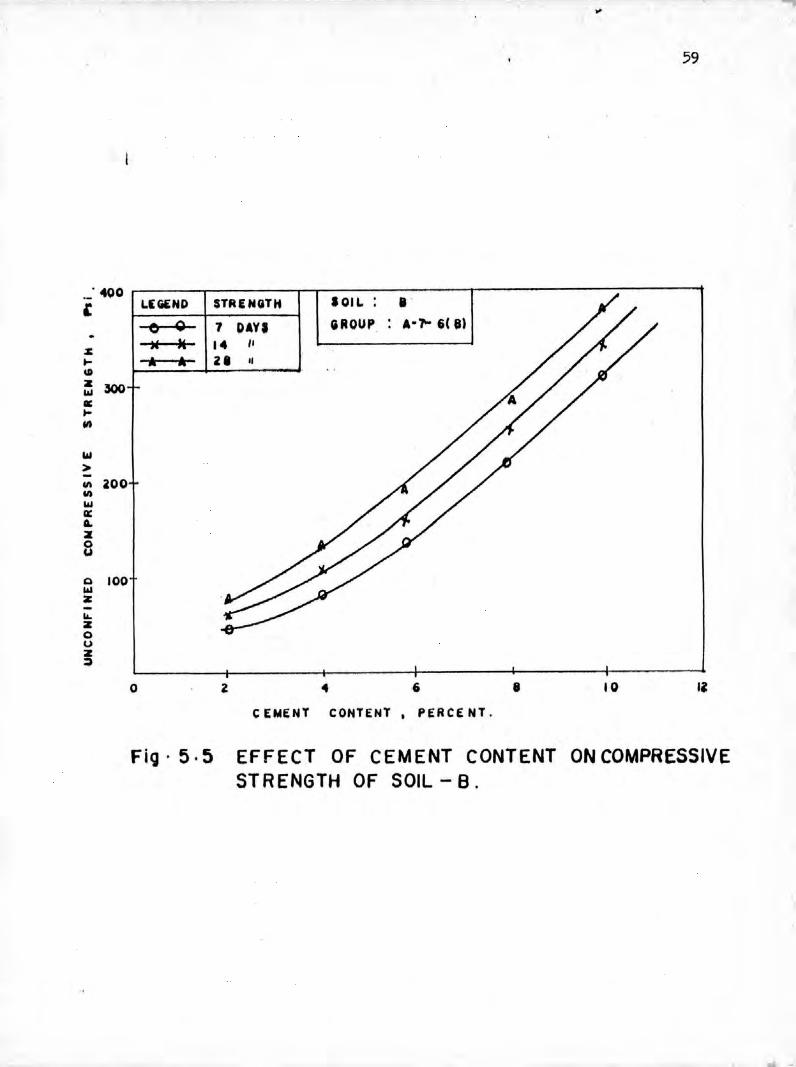
5.3.1 The relationship between unconfined
and cement content cured for 7 days,
presented in Fig. 5.4 and 5.5.
compressive strength
14 days and 28 days are
Here it is seen that the increasing of cement content and curing
period, the compressive strength increases. The results confirm
the experimental findings of Leadbrand (1955) where he showed
that the soil-cement continues to increase in strength with age.
Ramaswamy et al (1984) showed for silty soils in Singapore that
with increasing cement content and curing period, cement
stabilized soil continuos to increase in strength with age. Ahmod
(1984) showed for a silty clay of Bangladesh that addition of
cement from 2% to 15% by weight, strength increased appreciably.
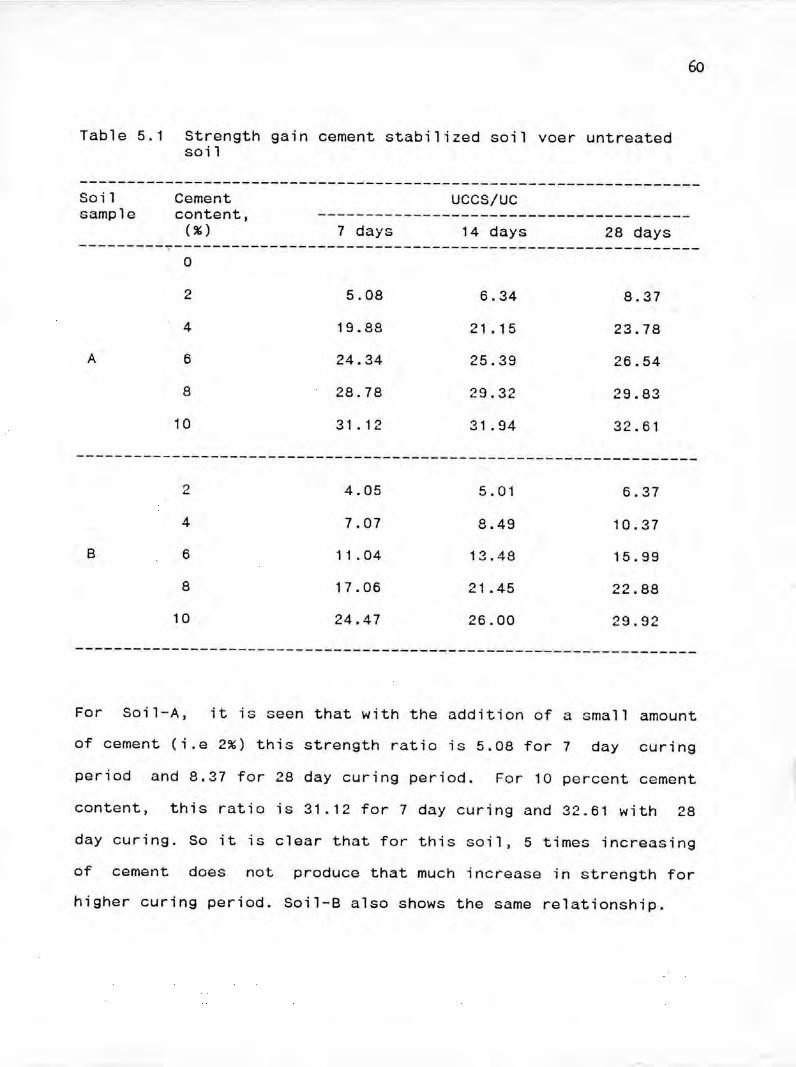
Table 5.1 shows the ratio of unconfined compressive strength of
cement stabilized (UCCS) Soil-A and Soil-8 at 7, 14 and 28 days
to that of untreated soils (ue) respectively.
o e 28 DAVS,,~ ,... "A A 7"
••Q.
37~:I:~(J)
Z&.l
II:~III 2~O&.l>-IIIIII&.lII:Q.
z ll~0(J
LfDEND STRfNGTH SOIL: A
GROUP: A -6111
58
>.CEMENT CONTENT I PERCENT
o 2 •• •• 10
FiC;).5.4 EFFECT OF CEMENT CONTENT ON COMPRESSIVESTRENGTH.
•..
59
._' 4QO'OIL : IL LI£<i£ND STR£NQTH
Q 1 DAY' GROUP . A-"" i( 810)I H 14 /1
%I- " " 21 01IIIZ 300wlIl:I-III
W>-III 200II)
WlIl:lL:z0u
Q 100wz-"-Z0uZ~
0 2 4 6 8 10 Il
CEMENT CONTENT • PERCE NT .
Fig' 5.5 EFFECT OF CEMENT CONTENT ON COMPRESSIVESTRENGTH OF SOIL - 8.
60
Table 5.1 Strength gain cement stabilized soil voer untreatedsoi 1
-----------------------------------------------------------------Soilsample
Cementcontent,(%) 7 days
UCCS/UC
14 days 28 days-----------------------------------------------------------------
0
2 5.08 6.34 8.374 19.88 21.15 23.78
A 6 24.34 25.39 26.548 28.78 29.32 29.83
10 31.12 31 .94 32.61-----------------------------------------------------------------
B
2
4
6
8
10
4.05
7.07
11 .04
17.06
24.47
5.01
8.49
13.48
21 .45
26.00
6.37
10.37
15.99
22.88
29.92-----------------------------------------------------------------
For Soil-A, it is seen that with the addition of a small amountof cement (i.e 2%) this strength ratio ;s 5.08 for 7 day curing
period and 8.37 for 28 day curing period. For 10 percent cement
content, this ratio is 31.12 for 7 day curing and 32.61 with 28
day curing. So it is clear that for this soil, 5 times increasing
of cement does not produce that much increase in strength forhigher curing period. Soil-B also shows the same relationship.
10
864\2
SOIL CEMENT lOSSCRITERI A LIHE]------ ---
5004\00300200
SOIL : A
GROUP: A-6(Bl
100
2!-
o
•..8%C
kI~>II:l 6
'lI.
•••Z
~ I
; "IkI(,)
COMPRESSIVE STRENGTH. Psi. 1%1 SOIL CEMENT LOSS
Fig. 5.6 ESTIMATION OF MINIMUM CEMENT CONTENT AND CORRESPONDINGUNCONFINED COWPRESSIVE STRENGTH.
0'\->
•..ZIII•..Zou
•..ZIIIZIII(.J
t
10
II
6
4
z
SOIL eGROUP: "-7-&(8)
SOIL CENENT LOSS CR ITERIALINE.,____ ::tIf _
i1<
x
o 100 zoo 300 400 z 4 •• II 10
CONPRESSIVE STRENGTH, Pli • f'lr.) SOIL-CENENT LOSS
Fi9.5.7 ESTIMATION OF MrNIMUM CEMENT CONTENT AND CORRESPONDINGCOMPRES 51VE 5TR EN GTH.
C1\I\J
63
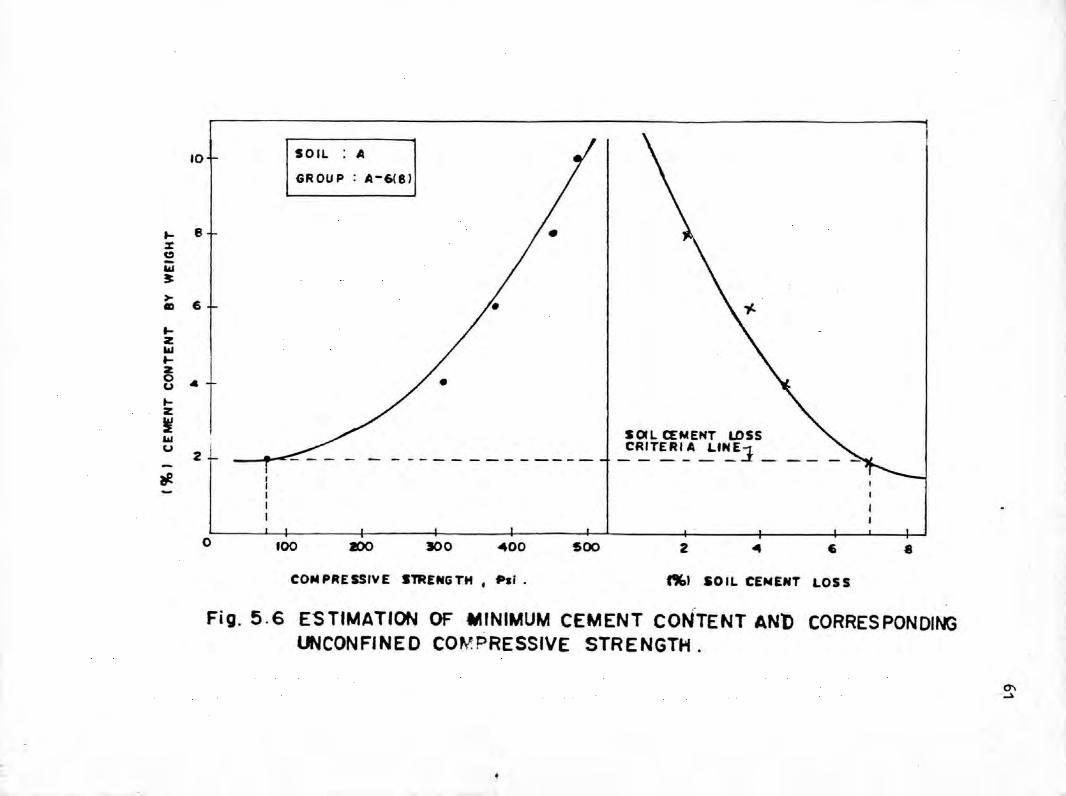
It is observed that for Soil-A strength values are greater thanthose for Soil-B at similar cements and curing periods. Fromtextural composition as shown in Table 3.1 it is seen that Soil-Acontains 8% fine sand, 69.23% silt and 22.77% clay, and 50il-Bcontains 13 fine sand, 67% silt and 20% clay. Presence of clay ingreater proportion in Soil-A may contribute to ~cs higherstrength development compared to Soil-B. Similar flndings werereported by early researchers, Mustaque (1986) and Ahmed (1984).
Figure 5.6 shows that the 7 ~dY unconfined compressive strengthof Soil-A for 2.0% CemE'~ltcontent at which the PCA criteria ofsoil CemE'~It.loss is satisfied as shown in Art. 5.2.1 is only 65
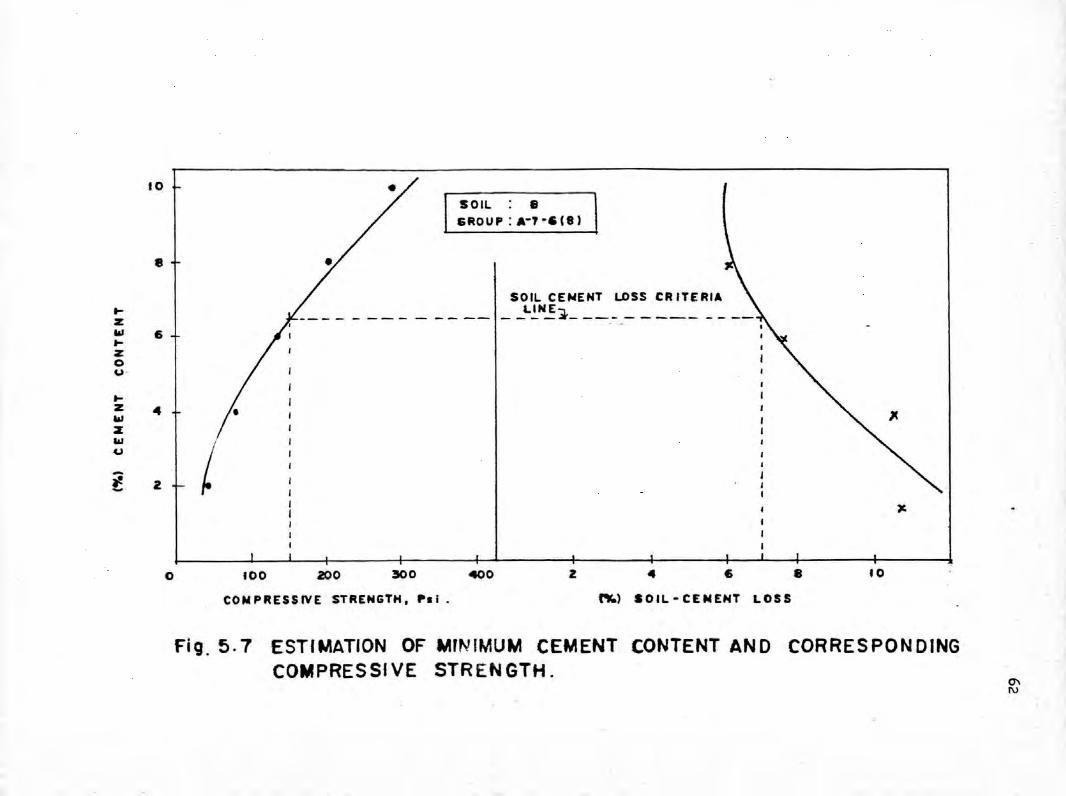
psi. F~om Fig. 5.7 for Soil-B, that unconfined compressivestrength is 150 psi for 6.7% cement content at which the PCAcriteria is satisfied as shown in Art. 5.2.1. Thus the unconfinedcompressive strengths for the soil-A is much below the range ofstrength mentioned in Table 2.0 by PCA. But if we use 4% cementcontent, then the 7 day strength satisfied the PCA criteria. ForSoil-B, addition of 7% cement gives the strength which is closerto the strength by PCA (Table 2.0).
5.3.2 Unconfined Compressive Strength for Soil-Lime
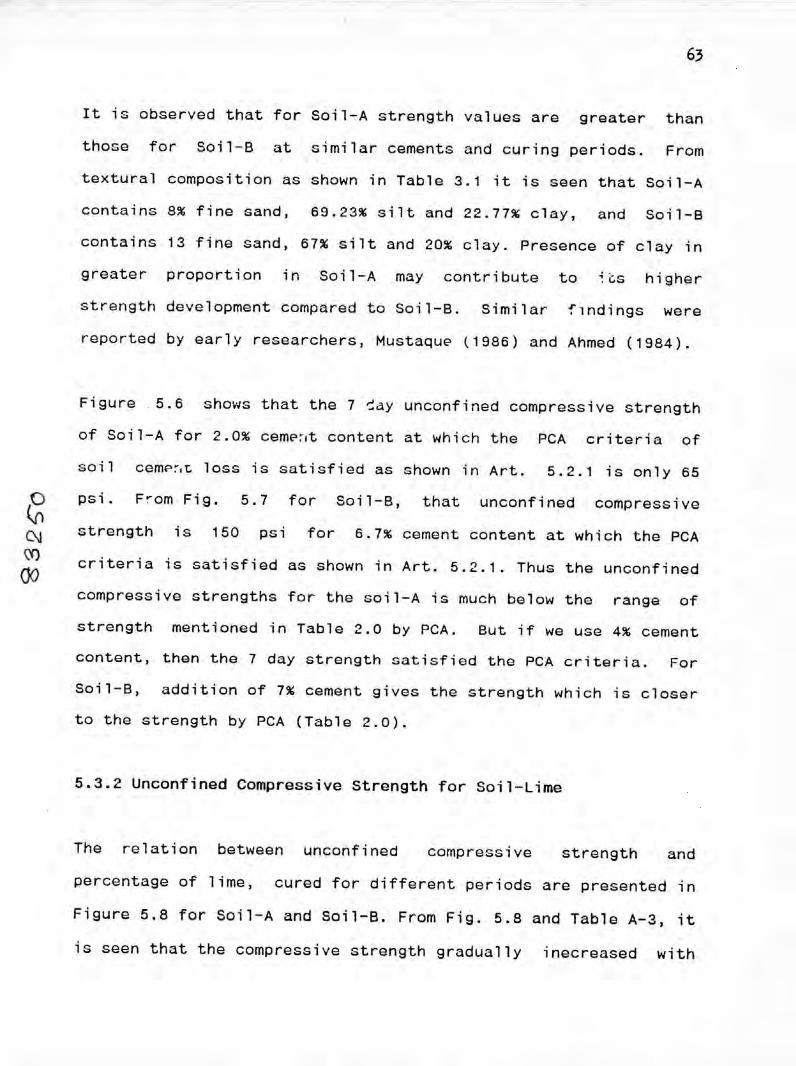
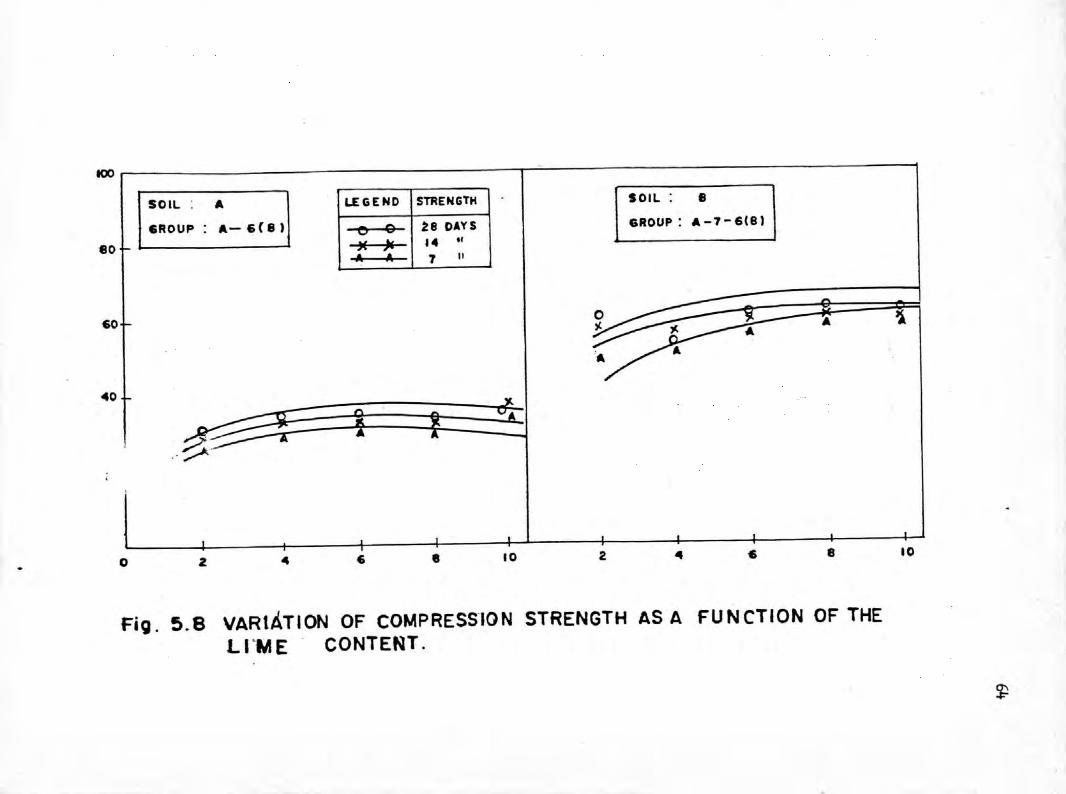
The relation between unconfined compressive strength andpercentage of lime, cured for different periods are presented inFigure 5.8 for Soil-A and Soil-B. From Fig. 5.8 and Table A-3, itis seen that the compressive strength gradually inecreased with
tOO
eo
60
SOIL: A
6ROUP A-6(8)
LEGEND STRENGTH
e 0 28 DAYS
)( )c 14 "It • 7 II
SOIL: fl
GROUP: A-7-6(8)
'1
40
o 2 •• 6 8 10 2 ~ 6 8 10
Fig. 5.8 VARtATION OF COMPRESSION STRENGTH AS A FUNCTION OF THELfME CONTENT.
~
65
the addition of lime. Similar findings were reported by Thomsonand Neubaur (1965). They concluded that as the lime contents wereincreased above an optimum amount, the reduction in strengths wasoccured. From Fig. 5.8 for Soi1-B, it is seen that due toaddition of lime the strength first increases and then decr.eases.This result also confirms the findings of Thomson and Neubaur(1965). Ahmed (1984) showed that a silty clay soil provides anincrease in strength when stabilised with lime admixtures.
The optimum moisture content for Soil-B is greater than that ofSoil-A. This may lead to increase of unconfined compressivestrength for lime stabilized Soil-B. Croft (1964) suggested thatthe increased optimum moisture content can possibly be attributedto the increase in hydroxide ion concentration which modifies thesurface of clay particles and increase the strength.
5.4 Plasticity Indices
5.4.1 Cement Treated Mixtures
The variation of Atterberg Limits and the Plastic Limits with theincrements of cement contents is shown in Appendix. For cementstabilized soil, it is seen that the plastic limit and liquidlimit increase with the increasing of cement content. For boththe soils, increase in plastic limit is appreciable resulting indecrease in plasticity index at higher cement content. Similarconclusion was drawn by Mustaque (1986). From Fig. 5.9, it is
20LEliE N D lOll
)( )f)t- A
I~e 0 e I
0
66
)(
IAlIIIZ 10->-tu-...loOol...J :lQ.
o 2 4 6 8 10
CEMENT CONTENT I PERCENT
Fi<J.5.9 EFFECT OF CEMENT ADDITION ON PLASTICITY
INDEX OF SOIL.
67
seen for both the soils that the plasticity index decreases asthe cement content increases. Similar findings were reported byRedus (1958).
5.4.2 Lime Treated Mixture
The effect of addition of lime on plasticity index of soils ispresented in Table A-8. From the table it is seen that afteraddition of 4 and 6 percent lime to Soil-A and Soil-8respectively, the soils become non-plastic. As the Soil-B is morepalstic than Soil-A, it needs mora lime to be non-plastic.Thomson and Neubaner (1969) carried out an experiment on twosoils. They found that A-7(2) and A-6(10) soils became non-plastic after addition of lime 2% and 6% respectively. It isobserved for both the soils that plastic limit increases with theaddition of lime. Similar findings were reported by Hilt andDavidson (1960). Liquid limit for Soil-A and Soil-8 increaseswith the increment of lime content. But this result does notconform with the findings of Uppal and Bhatia (1958). they foundthat liquid limit decreased with increasing quantity of lime.
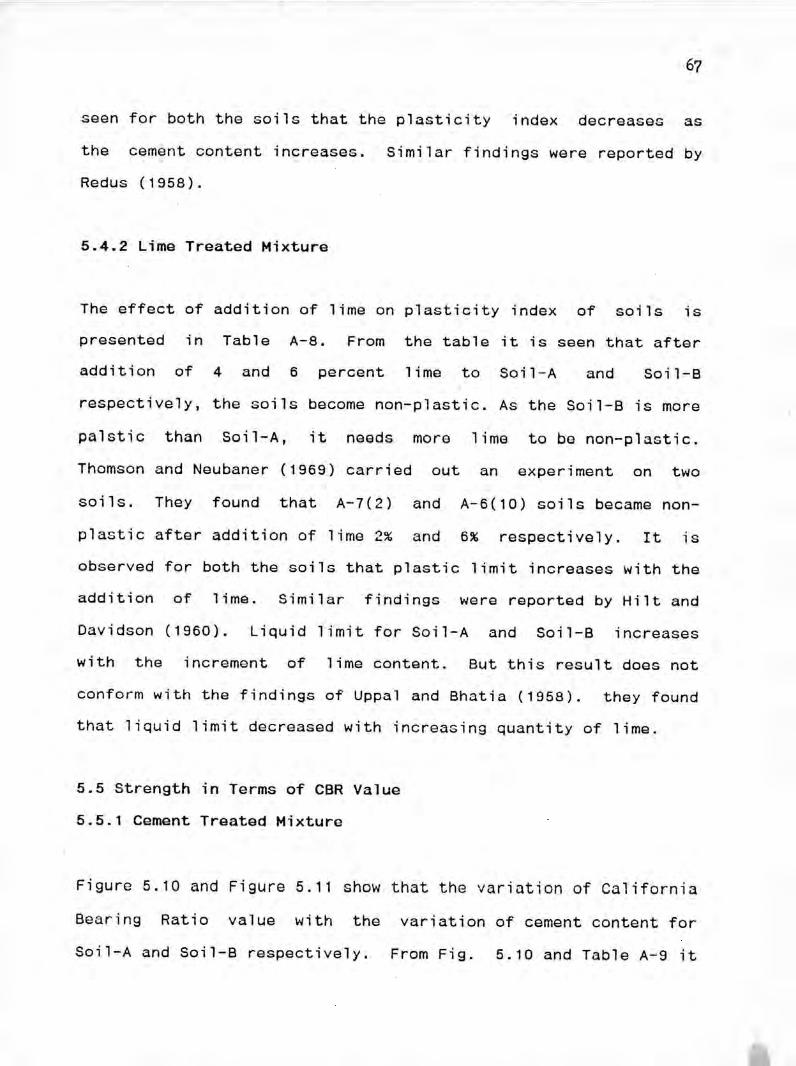
5.5 Strength in Terms of CBR Value5.5.1 Cement Treated Mixture
Figure 5.10 and Figure 5.11 show that the variation of CaliforniaBearing Ratio value with the variation of cement content forSoil-A and Soil-B respectively. From Fig. 5.10 and Table A-9 it
68
:10
108,42
LUEHO COWPACTIVE[HOST
• • • 6:1':"'I1f,QWIVLA'iEfi
•• H ill ,~:'. "u
GOG 10' ':. II •
o
7
CEWENT CONTENT • PEfiCENT
Fiq. 5.0 EF FECT OF CEMENT TREATMENTON CSR OF SOIL-A'
II::IIIU
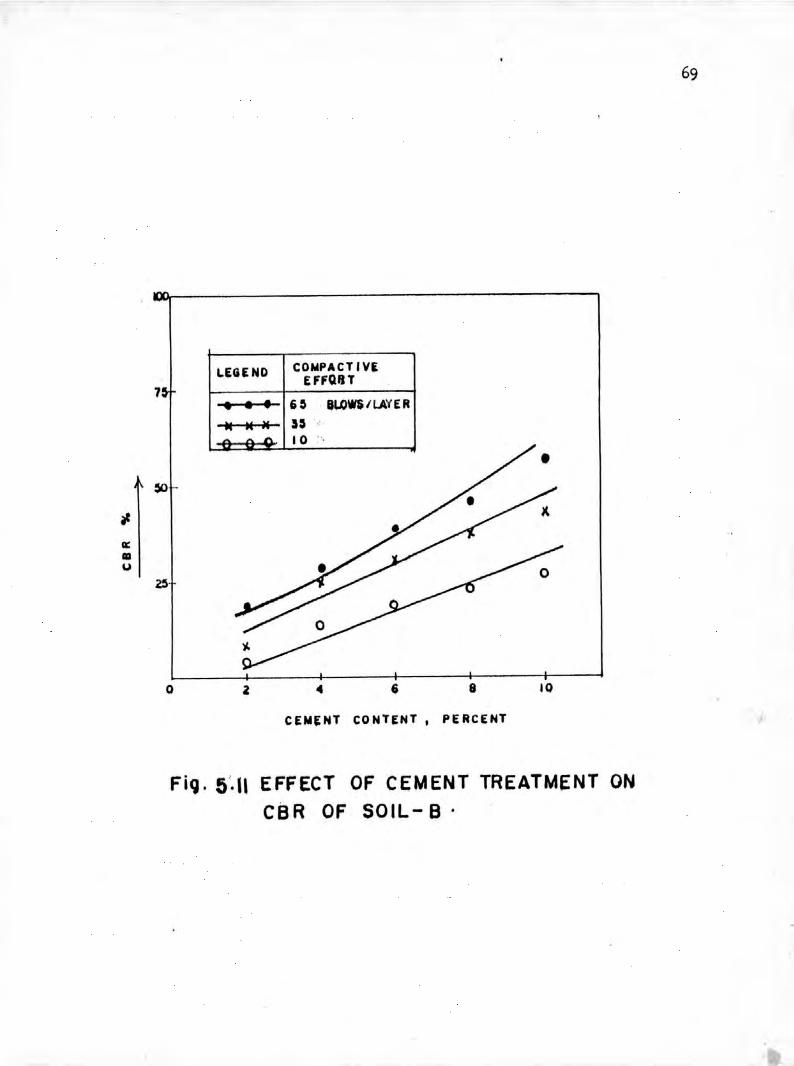
7
o
I.EG E NO CONPACTIVEEFFORT
• • • 6~ BLOW$/Ul,'( E R
•• M H S:l- •... 10
••CENEtH CONTENT, PERCENT
69
FiC). 5'." EFFECT OF CEMENT TREATMENT ONCBR OF SOIL- B .
70
-is seen that the higher percent of cement content increases theCBR values at an increasing rate. Similar findings were reported
by Bangladesh Consultant Limited (1986). The CBR value also
depends on the compaction. It increases with the increasing of
compactive effort. The CBR value of stabilized soil having 2
percent cement content at which the durability criteria is
satisfied is 3.1.
From literature review, we find that this value belongs to
general rating "good" when used as subgrade, base, subbases. Fig.
5.11 also shows the increment of CBR value with the increment of
cement content. For Soil-B the CBR values are lower than that of
Soil-A. BCL (1986) reported that for the addition of 4 percent
cement on two soils having 15 percent and 16 percent optimum
moisture contents, the latter one gave the greater CBR value.
This is contrary of this research. The Soil-B having greateroptimum moisture contents 20 percent than that of Soil-A when
stabilised with 4 percent cement results lower CBR value than
Soil-A.
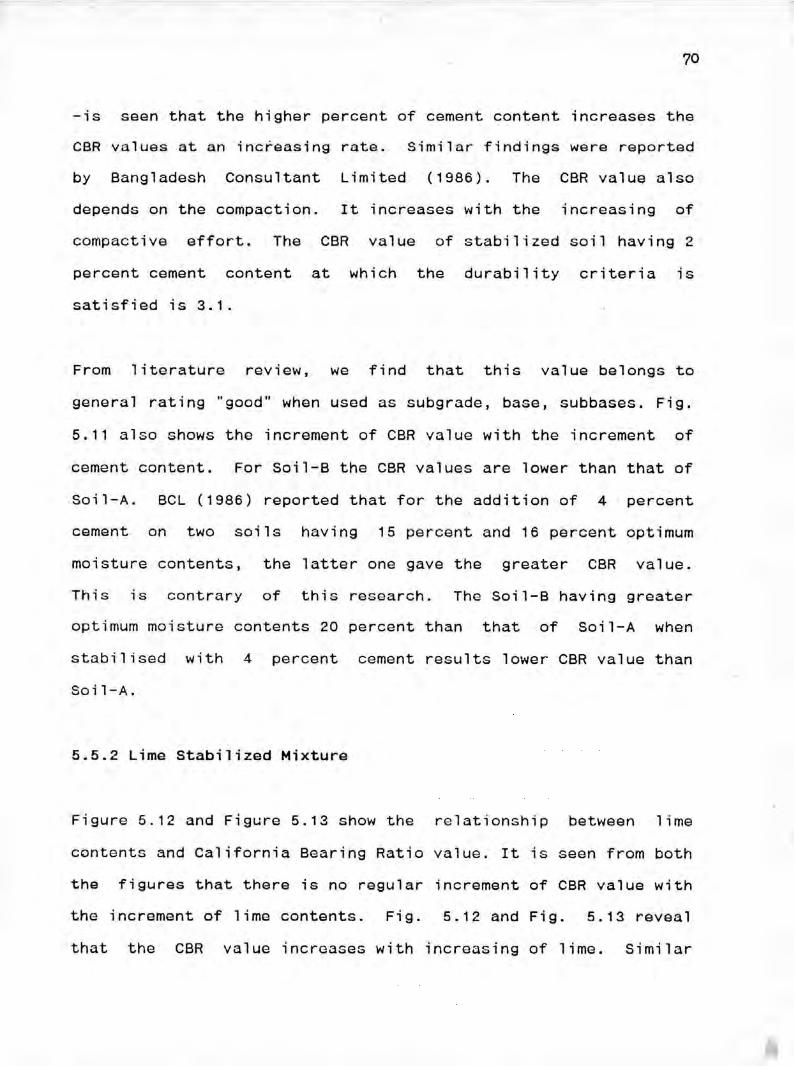
5.5.2 Lime Stabilized Mixture
Figure 5.12 and Figure 5.13 show the relationship between lime
contents and California Bearing Ratio value. It is seen from both
the figures that there is no regular increment of CBR value with
the increment of lime contents. Fig. 5.12 and Fig. 5.13 reveal
that the CBR value incroases with increasing of lime. Similar
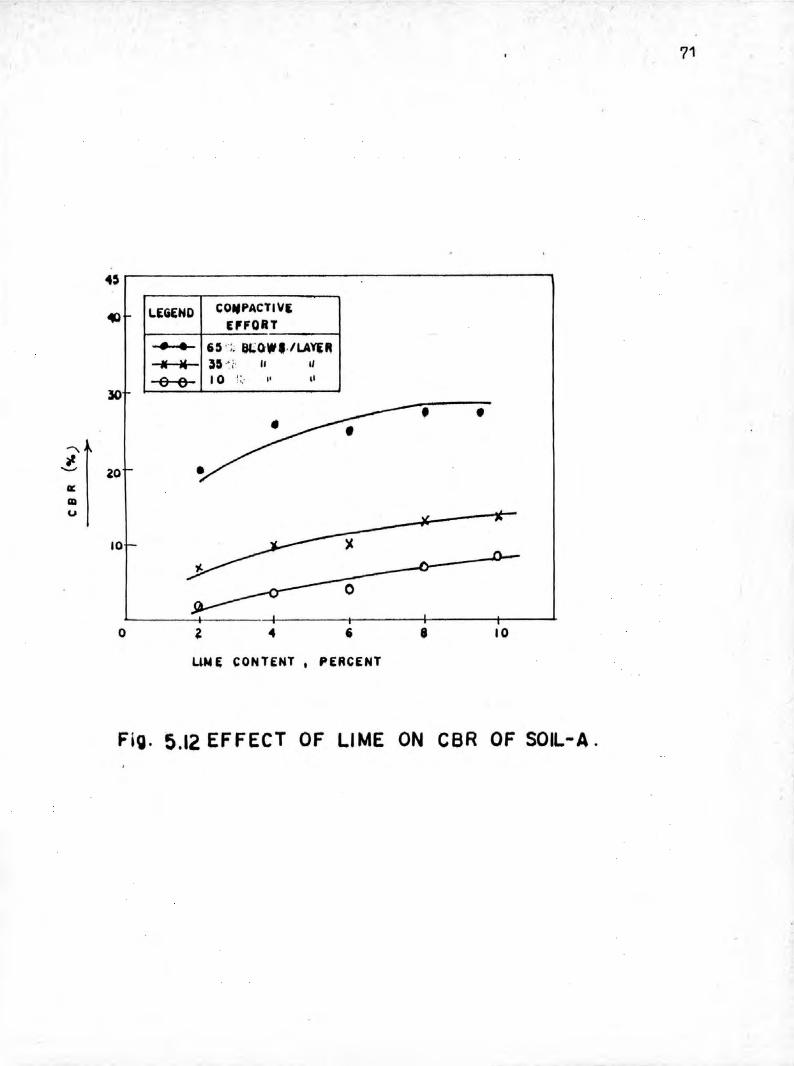
71
LEGEND CO"PACTI ViEfFORT
• • 6:1 ';; BLO.',/LAYU
" 14 3:1' i " II
0 0 10,.
I'
":,:
108o
• •---~--...... 20II::II:lU :X
10
UNE CONTENT. PERCENT
Fig. 5.12 EFFECT OF LIME ON CBR OF SOIL-A.
L~6END COMPACTI VEIF'ORT
40 • • • ,,:. BL'*'/LAYER~ ~ ~ SO " " " II
e 0 0 10 . ':> .. " ••
lC
.72
0::IIIU
10
0
0 0~O
0 2 •• 6 8 10
LIME CONTENT. PERCENT
Fig. 5.13 EFFECT OF LIME TREATMENT ON CSR .OF SOIL B.
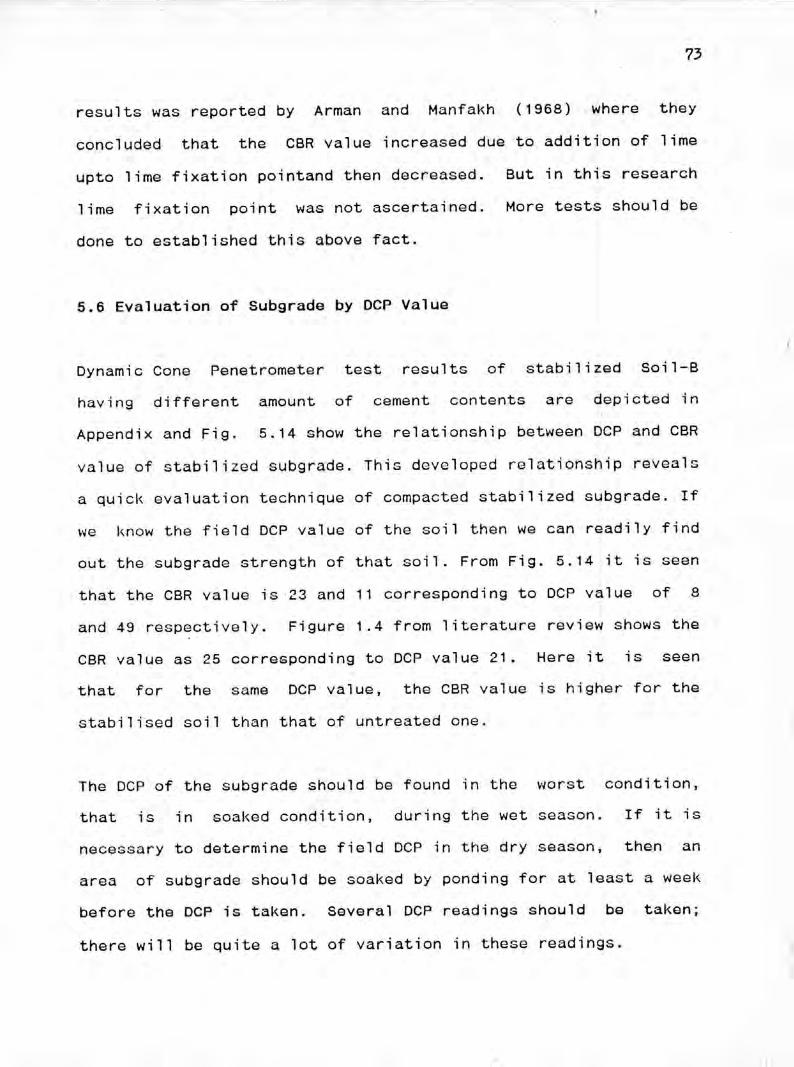
. .73
results was reported by Arman and Manfakh (1968) where theyconcluded that the CBR value increased due to addition of limeupto lime fixation pointand then decreased. But in this researchlime fixation point was not ascertained. More tests should bedone to established this above fact.
5.6 Evaluation of 8ubgrade by OCP Value
Oynamic Cone Penetrometer test results of stabilized 80il-Bhaving different amount of cement contents are depicted inAppendix and Fig. 5.14 show the relationship between OCP and CBRvalue of stabilized subgrade. This developed relationship revealsa quick evaluation technique of compacted stabilized subgrade. Ifwe know the field OCP value of the soil then we can readily findout the subgrade strength of that soil. From Fig. 5.14 it is seenthat the CBR value is 23 and 11 corresponding to OCP value of 8and 49 respectively. Figure 1.4 from literature review shows theCBR value as 25 corresponding to OCP value 21. Here it is seenthat for the same OCP value, the CBR value is higher for thestabilised soil than that of untreated one.
The DCP of the subgrade should be found in the worst condition,that is in soaked condition, during the wet season. If it isnecessary to determine the field OCP in the dry season, then anarea of subgrade should be soaked by ponding for at least a weekbefore the OCP is taken. Several DCP readings should be taken;there will be quite a lot of variation in these readings.
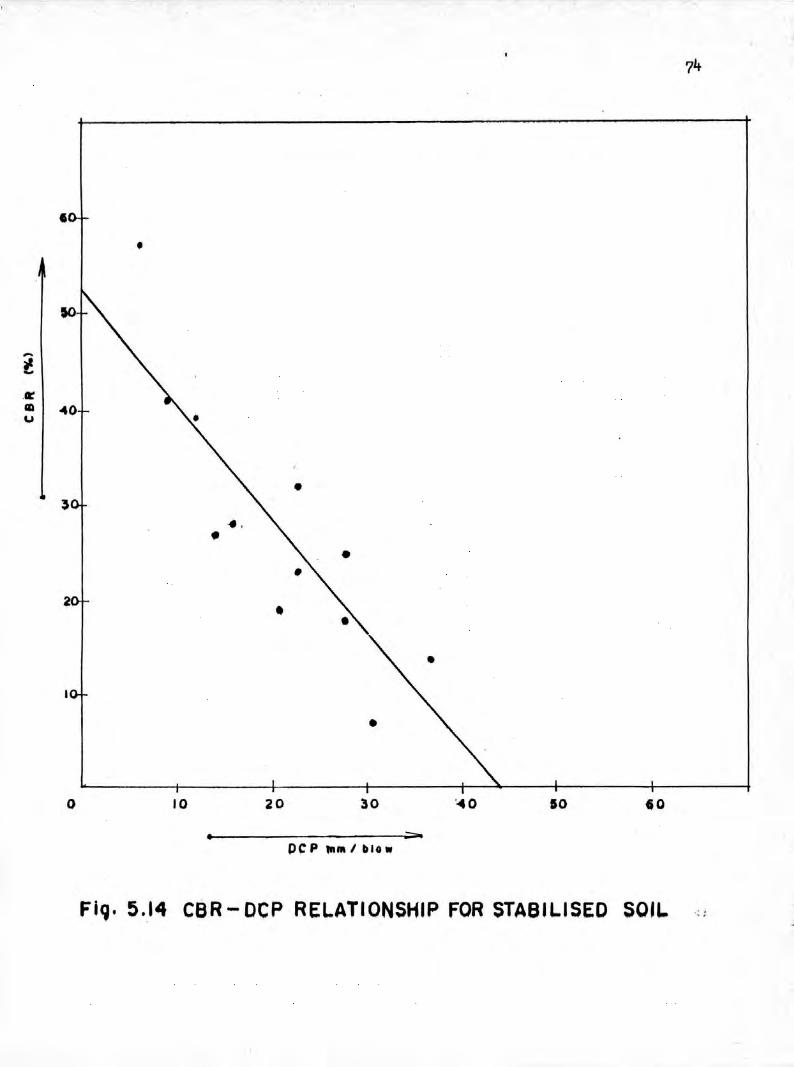
II:'IIIU
6
2
o
•
10
•
20 30
DC P "'1111biO.
'-40 50 GO
FIQ.5.14 CBR-OCP RELATIONSHIP FOR STABILISED SOil.,
From Fig. 5.14 it is seen that there
correlation between DCP and CBR values ofwhich is represented as
CBR = 52 - 1.18 DCP
75
is a negative linear
this investigation
with a co-efficient of correlation 92 for standard deviation 14.
Bangladesh Road Research laboratory (1985) reported a linear
correlation for untreated soil which showed that
CBR = 58 - 3.05 DCP
So it is possible to correlate the findings of more CBR and DCP
test to have a more accurate linear equation.
5.7 Comparison of Cost
The economic analysis is done according to Roads & Highways
Department Schedule (RHO, 1990) and BCl schedule assuming a
section of length 100 metre, width 10 metre and having 150 mm
compacted subgrade. The trial design of pavement is done
according to Road Note 31 (TRRl, 1977) and Asphalt Institute
Method (Wright & Paquette, 1979). The trial design was done
according to following conditions:
A) Road Note 31Commercial vehicles = 300/dayGrowth rate = 6%Cumulative no. of vehicles = 0.78 millionDesign life = 10 years
76
CBR - ?- ...,
The thicknesses of pavement structure becomesUntreated(CBR=3)
Treated with 2%Cement(CBR=31)
Subbase = 340 mm (13" )Base = 150 mm ( 6" )
Surfacing = 50 mm ( 2" )
Base = 150 mm ( 6 " )
Surfacing = 50 mm ( 2" )
B) Asphalt Institute Method:Initial daily traffic = 300/day% heavy trucks = 16Design 1ife = 10 yearsGrowth rate = 6%
Thickness:Untreated: Base = 150 mm (6")
C f' 50 mm (Lo"")uur aClng =Treated Base = 75 mm (3")
Surfacing = 50 mm (2")
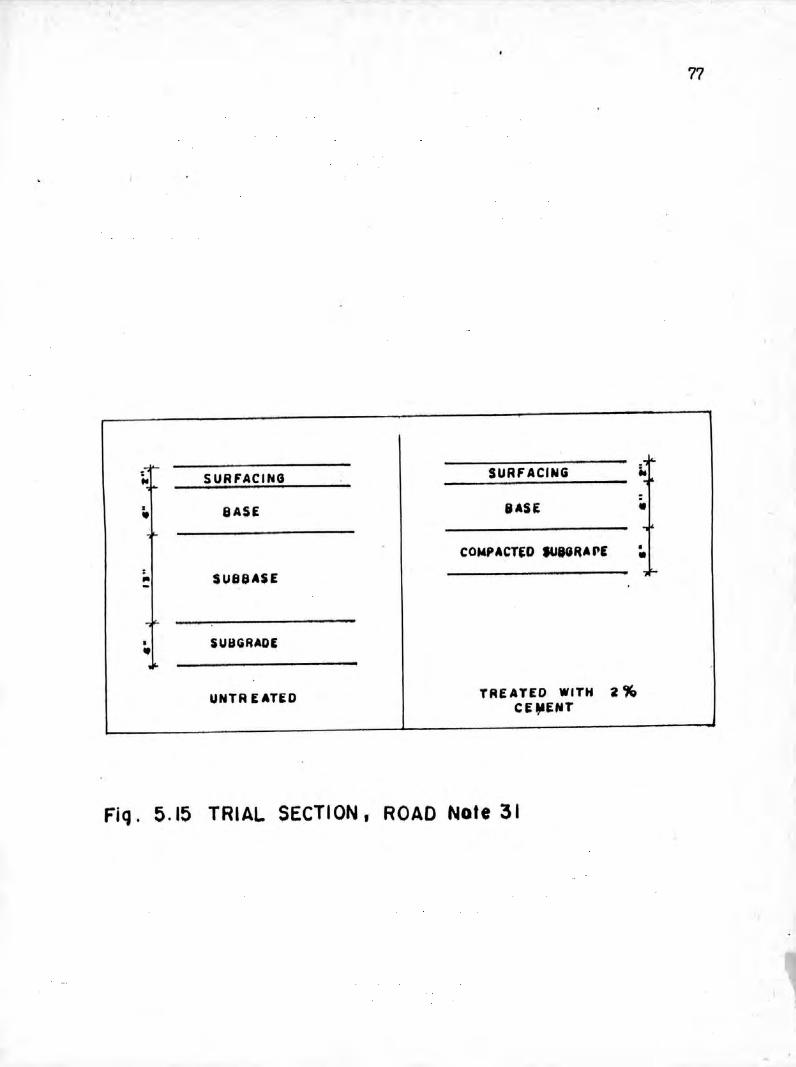
- •.... .' r'-: SURFACING SURFACING ~."I--• BASE SASE •"~ -
COMPACT~O IUIGRAP~ •"
•• SUBBASE ,'--~l<-
• SUaGRAOE••I<-
UNTR fATED TREATED WITH 2'IQCE~ENT
Fiq. 5.15 TRIAL SECTION, ROAD Note 31
77
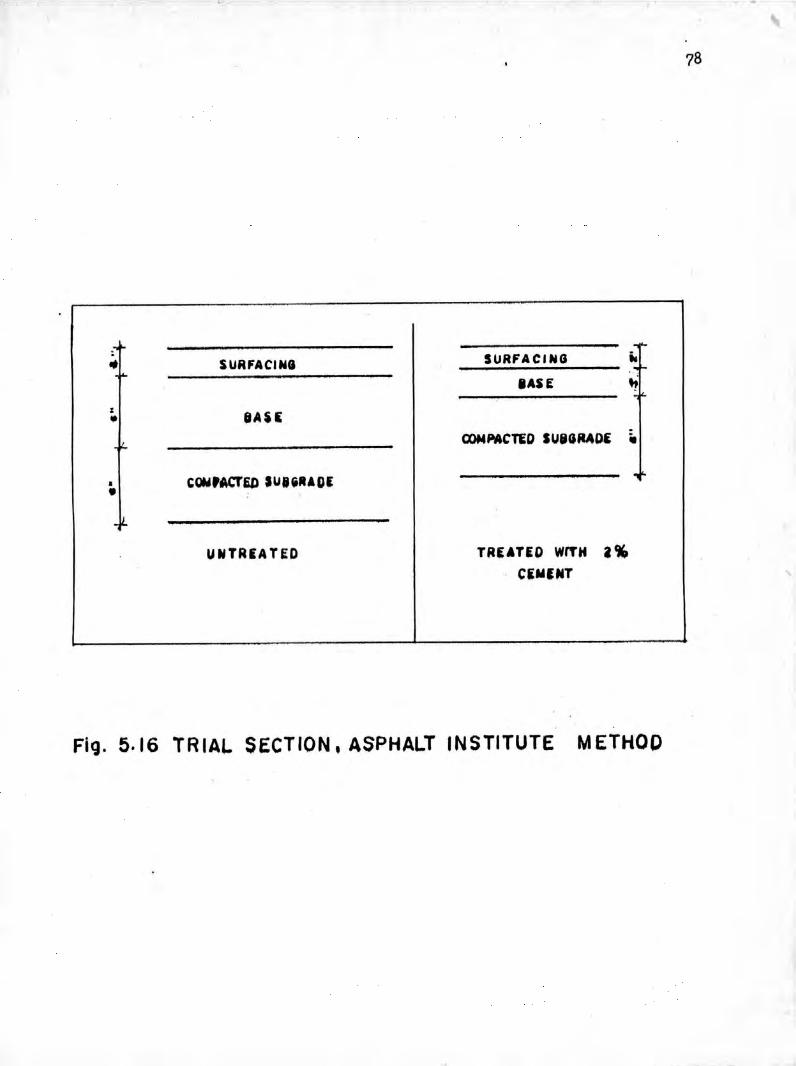
,-. ~I'-
•• SURFACING SURFACING •••.. . ~f-
11"5£ .;:..:.
: ltU i•i.. CONPAC~D SUiGRAO£ •
• COW'ltcrw SUiiIlAO£ "•~..
U~TRiATED TRf:ATED WITH a~CiNlNT
Fig. 5.16 TRIAL SECTION. ASPHALT INSTITUTE METHOO
78
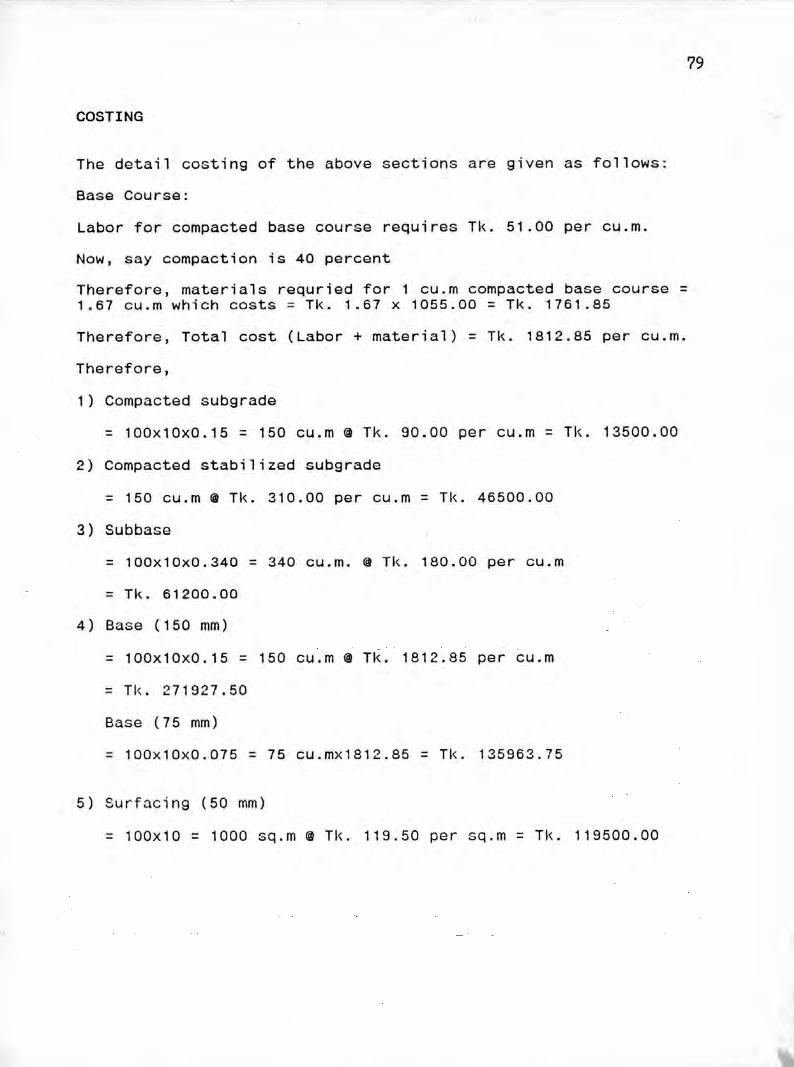
COSTING
The detail costing of the above sections are given as follows:
Base Course:
Labor for compacted base course requires Tk. 51.00 per cU.m.
Now, say compaction is 40 percent
79
Therefore, materials requried for 1 cU.m compacted base course =1.67 cU.m which costs = Tk. 1.67 x 1055.00 = Tk. 1761.85
Therefore, Total cost (Labor + material) = Tk. 1812.85 per cU.m.
Therefore,
1) Compacted subgrade
= 100x10xO.15 = 150 cU.m @ Tk. 90.00 per cU.m = Tk. 13500.00
2) Compacted stabilized subgrade
= 150 cU.m @ Tk. 310.00 per cU.m = Tk. 46500.00
3) Subbase= 100x10xO.340 = 340 cu.m. @ Tk. 180.00 per cU.m
= Tk. 61200.00
4) Base (150 mm)
= 100x10xO.15 = 150 cU.m @ Tk. 1812.85 per cU.m
= Tl(. 271927.50Base (75 mm)
= 100x10xO.075 = 75 cU.mx1812.85 = Tk. 135963.75
5) Surf~cing (50 mm)
= 100x10 = 1000 sq.m @ Tk. 119.50 per sq.m = Tk. 119500.00
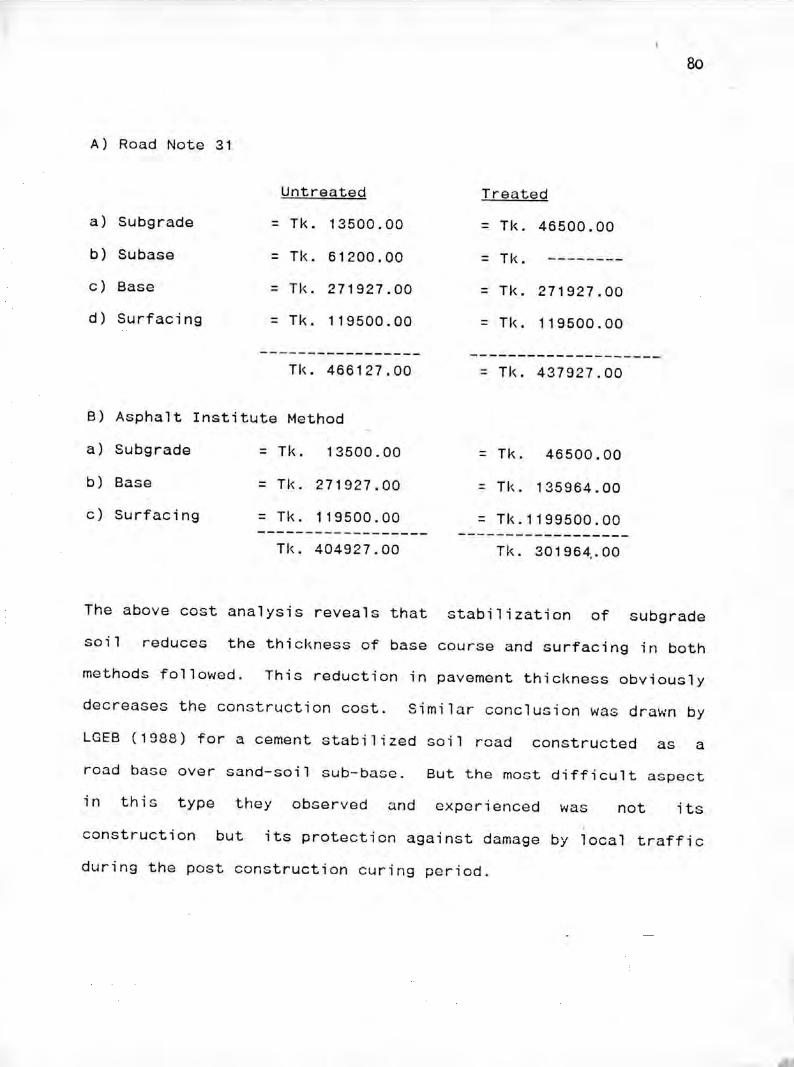
80
A) Road Note 31
Untreated Treateda) Subgrade = Tic 13500.00 = TI<. 46500.00b) Subase = TI<. 61200.00 = TI<. --------
c) Base = Tk. 271927.00 = Tic 271927.00d) Surfacing = Tic 119500.00 = Tic 119500.00
----------------- --------------------TI<. 466127.00 = Tic 437927.00
B) Asphalt Institute Methoda) Subgrade = Tic 13500.00 = Tic 46500.00b) Base = TI<. 271927.00 = TI<. 135964.00c) Surfacing = Tic 119500.00 = TI<.1199500.00------------------ ------------------
TI<. 404927.00 Tic 301964..00
The above cost analysis reveals that stabilization of subgradesoil reduces the thickness of base course and surfacing in bothmethods followed. This reduction in pavement thickness obviouslydecreases the construction cost. Similar conclusion was drawn byLOEB (1988) for a cement stabilized soil road constructed as aroad base over sand-soil sub-base. But the most difficult aspectin this type they observed and exporienced was not itsconstruction but its protection against damage by local trafficduring the post construction curing period.
81
The cost analysis also points out that the saving of constructioncost for stabilization over untreated condition using Road Note31 and Asphalt Institute Method are respectively 6 percent and 25percent.
5.8 Implementation of the Study
The conventional methods for construction of road pavementstructure in Bangladesh is quite expensive both from constructionand maintenance point of view. In most developing countries likeBangladesh there is a continuous increase in the cost ofconstruction materials. The main parameters those influence theconstruction of low cost roads are the cost and availability ofsuitable materials. Soil is normally the foundation material forany road and is available in Bangladesh.
If the load bearing capacity of the subgrade soil is improved bystabilization, then a lower thickness of road structure is neededand eventually road construction would be economical as shown inarticle 5.7.
82
CHAPTER 6CONCLUSIONS AND RECOMMENDATION FOR FUTURE RESEARCH
6.1 Conclusions
The important findings and conclusions drawn on the variousaspects of this research may be summarized with this limitedstudy as follows:
1. The two subgrade soils satisfy the durability criteriarecommended by the Portland Cement Association (PCA) at about2 percent and 7 percent cement contents.
2. The silty clay soils fail to satisfy the minimum unconfinedcompressive strength criteria of PCA for cement content atwhich the durability criteria is satisfied. For the type ofsoils used, higher cement content would be required' tosatisfy the strength criteria. However the soils showedappreciable strength gain over untreated soil with additionof only 2 percent cement by weight.
3. The unconfined compressive strengths of lime treated soilsincrease due to the addition of lime.
83
4. Curing period and proportion of cement and lime significantlyinfluence the strength characteristics of soil-cement andsoil-lime mixtures.
5. Due to the addition of lime, the subgrade soils become nonplastic. This treatment is suitable for highly plastic soils.
6. There is a sharp increase of CBR value after addition of 2percent cement over untreated soil. The value then increaseat an increasing rate for higher cement content. The CBRvalue increases slightly after addition of lime.
7. Development of DCP CBR relationship provides a quickevaluation technique of compacted subgrade.
8. The construction of pavement on a stabilized subgrade iseconomical than that of an untreated subgrade.
6.2 Recommendation for Further Study
New studies are required for investigation various aspects ofsoil-cement and soil-lime stablization which cannot be coveredfully in this research. These may be listed as below:
84
1. Only two silty clay soil samples were used in this study. Soconclusions based on relatively little data need more studyto be confirmed. Also, other types of soil must beinvestigated on treatment with cement and lime.
"L. • In this research, investigation were carried out in thelaboratory. Field tests and trial constructions are to bestudied to check the suitability and adaptation in
performanceBangladesh.
of this method in road construction of
3. Permeability characteristics, consolidation characteristicsand erosion resistance of stabilised mix need to be evaluatedto get a through knowledge of moisture change, volume change,and durability of stabilized construction.
85
REFERENCES1. Jha, J. and Sinha, S.K. (1977); Construction and Foundation
Engineering Handbook, Khanna Publishers, New Delhi.
2. Ingles, D.G. (1968): "Soil Chemistry RelevantEngineering Behavior of Soils", Soil MechanicsTopi6s Edited by I.K, Lee.
to theSelected
3. O"Flaherty, C.A. (174); Highway Engineering Vol. 2, EdwardArnold Publishers, Great Britain.
4. Kezdi, A. (1979): Stabilized Earth Roads, Elsvier ResearchBoard, Washington D.C.
5. Sharma, S.K. (1985); Principles, Practice and Design ofHighway Engineering, S. Chand & Company Ltd., New Delhi.
6. Thomson, M.R. (970): Lime Reactivity of Illiois Soils.Jour. Soil Mech. and Found., Divi, Proct, ASCE, Vol. 92. No.SM 5.
7. Snetty, M. S. (1982): Concrete Technology, S. Chand CompanyLtd., New Delhi.
8. ASTM (1979a): Annual Book of ASTM (American Society forTesting Materials) Standards, Part 19, Stones, Soil andRock.
9. ASTM (1979b): Annual Book of ASTM Standards, Part 13,Cement, Lime, Ceiling and Walls.
86
10. Mustaque A (1986): Stabilization of Local Alluvial Soils,with Cement and Cement Rice Hush", M.Sc.Engg. Thesis, Dept.of CE, BUET, Dhaka.
11. Balmer, G.G. (1958): "Shear Strength and Elastic Properties9bl~o5~~Cement Mixtures under Triaxial Loading", ASTM Proc.
12. Christensen, A.P. (1969): Specification for Road and BridgeWorks, London, H. M.S.U.
13. Ministry of Transport (U>K) (1969): Specification for Roadand Bridge Works, London, H. M.S.U.
14. Portland Cement Association (PCA) (1956): Soil-CementConstruction Handbook, Chicago, Illinois, USA.
15. Portland Cement Association (PCA) (1959): Soil-CementLaboratory Handbook, Chicago, Illinois, USA.
16. Kemahlioglu, A., Higgns, C.M. and Adam, V. (1967): "A rapidmethod for Soil-Cement design; Louisiana Slope ValueMethod", Highway Research Record 198, Highway ResearchBoard, Washington D.C.
17. Redus, J .F . (1958): "Study of Soil-Cement Base Course on\Military Airfields", Paper Presented at the 37th Annual
Meeting of the Highway Research Board.
18. Ahmed N.U . (1984): "Geotechnical PropertiesLocal Soils Stabilized with Lime and Cement",Thesis, Dept. of Civil Engg., BUET, Dhaka.
of SelectedM.Sc. Engg.
87
19. AASHO (1966): American Association of State HighwayOfficials Standard Specifications for Highway Materials andMethods of Sampling and Testing Part II, WashingtonD.C., U.S.A.
20. LGEB (1985); Road Construction Trial Project, Faridpur.
21. Croft, J .B> (1964): "The Process Involved in the LimeStabilization of Clay Soils", Proceedings of the AustralianRoad Research Board, Vol. 2, Part 2, Melbourne.
22. Uppal, H.L. and Bhatia, H.S. (1958): "Stabilization of BlackCotton SoiHor Use in Road Construction" RR Bulletin No.5,IRC, New Delhi.
23. Jan, M.A. and Walker, R.D. (1963): "Effect of Lime, Moistureand Compaction of a Clay Soil", Highway R, Reocrd, No. 29,Highway R. Board, Washinton.
24. Clare, K.E. and Pollard, A.E. (953): "The Process Involvedin the Lime Stabilization of Clay Soils", Proc. of theAustralian Road Research Board, Vol. 2, Part - 2, Melbourne.
25. Hilt, e.H. and Davidson, D.T. (1960): Lime Fixation inClayey Soils", Bulletin 262, Highway Research Board, W.S.
26. Johnson, A.H. (948): "Lab. Exp. with Lime Soil Mixture",Proceedings, 38th Annual Meeting Highway Research Board,W.S.
27. Ladd, e.e, Moh. Z.e. and Lamb T.W. (960): "Recent Soil,Lime Research at the Massachussetts I of T" Bullatin 262,Highway Research Board, Washington D.C.
88
28. Andrews, D.C. and O'Flaterty, C.A. (1968): "Lime Type andQuality in Relation to the Stabilization of Soils withGradation and Clay Minerals", Australian Road ResearchBoard, Proceedings, of the Conference, Melbourne.
Properties of UncuredProceedings of theStabilization, Vol. 2,
29. Neubauer, e.H. and Thomson, M.R. (1968): "StabilityLime Treated Fine Grained Soils",
Committee on Lime and Lime FlyashPart-1, Washington.
30. Arman Ara and Manfal<h, G.A (1968) "Lime stabilisation ofOrganic Soils", -- Proceedings on the 30th Annual Conventionof or Highway Engineering Sponsored by Lime and Lime FlyashStabilization Committee.
31. Bangladesh road Researdh Laboratory (1985) a Booklet onDynamic Cone Penetrometer Test, Dhaka ..
32. Roads and Hihghways Department (1990): Schedule of Rates forRoad and Bridge Works.
33. Transport and Road Research Laboratory (1977): A Guide tothe Structural Design of Bituminous Surface Roads inTropical and Subtropical Countries, Minsitry of Transport,Road Note No. 31 , 3rd Edition, U.K.
34 Wright, A. Paul and Paquette, J. Rander (1979): "HighwayEngineering Ae" 4th Edition. U.K.
35. Catton, M.D. (1940): "Researfh on the Physical Relations ofSoil and Soil-Cement Mixtures", .Proc. Highway ResearchBoard, Vol. 20, pp. 821 - 855.
36. Bangladesh Transport Survey (1974): Geology of Bangladesh.

APPENDIX
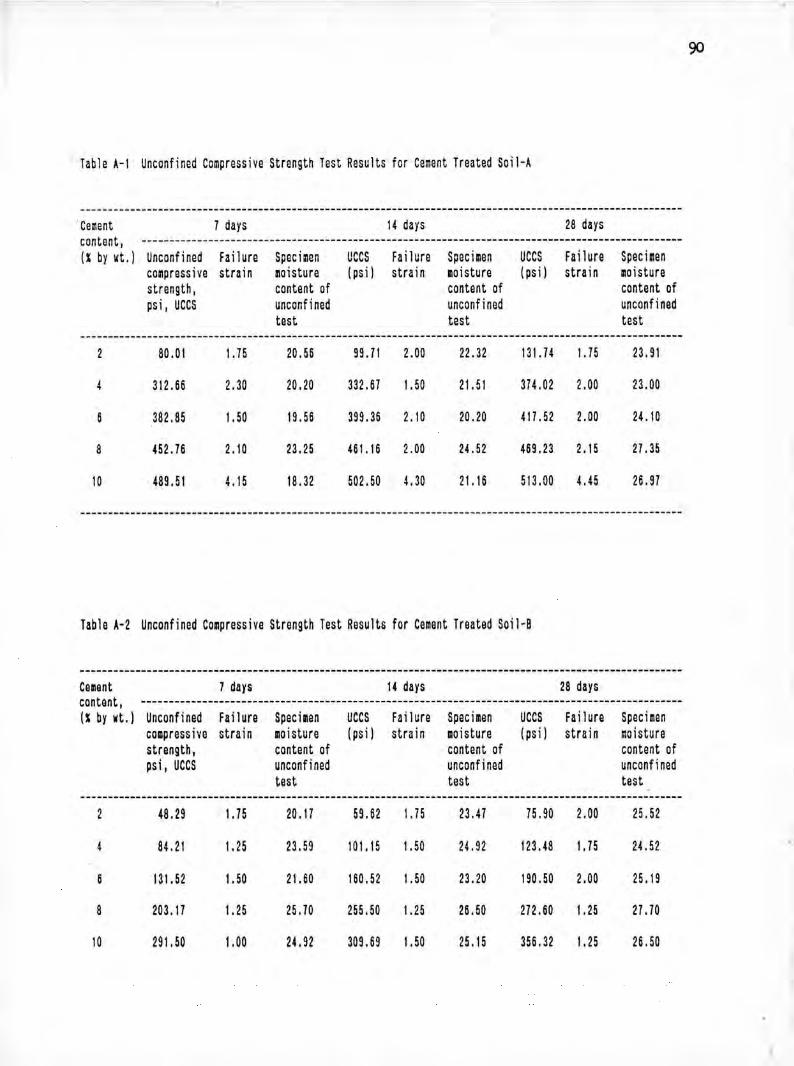
Table A-1 Unconfined Compressive Strength Test Results for Cement Treated Soil-A
------------------------------------------------------------------------------------------------------------.Cement 7 days 14 days 28 dayscontent, -------------------------------------------------------------------------------------------------(X by ~t.) Unconfined Failure Specimen UCCS Failure Specimen UCCS Failure Specimen
compressive strain moisture (psi) strain moisture (psi) strain moisturestrength, content of content of content ofpsi, UCCS unconfined unconfined unconfined
test test test------------------------.-.---------------------------.-------------.---------------------------------------
80.01 1.75 20.56 99.71 2.00 22.32 131.74 1.75 23.91
4 312.66 2.30 20.20 332.67 1.50 21.51 374.02 2.00 23.00
382.85 1.50 19.56 399.36 2.10 20.20 417.52 2.00 24.10
8 m.76 2.10 23.25 461.16 2.00 24.52 469.23 2.15 27.35
10 489.51 4.15 18.32 502.50 4.30 21. 16 513.00 4,45 26.97
Table A-2 Unconfined Compressive Strength Test Results for Cement Treated Soil-8
-----------------------------.--------------------------------------------.---------------------------------Cement 7 days 14 days 28 dayscontent, --------------------------------------------------------------------------------------._--------.(Xbywt.) Unconfined Failure Specimen UCCS Failure Specimen UCCS Failure Specimen
compressive strain moisture (psi) strain moisture (psi) strain moisturestrength, content of content of content ofps i, UCCS unconfined unconfined unconfined
test test test------------------------------------------------------------------------------------------.-----------------
48.29 1.75 20.17 59.62 1.75 23.47 75,90 2.00 25.52
84.21 1.25 23.59 101.15 1.50 24.92 123.48 1.75 24.52
6 131.52 1.50 21.60 160.52 1.50 23.20 190.50 2.00 25.19
8 203.17 1.25 25.70 255.50 1.25 26.50 272.60 1.25 27.70
10 291.50 1.00 24.92 309.69 1.50 25.15 356.32 1.25 26.50
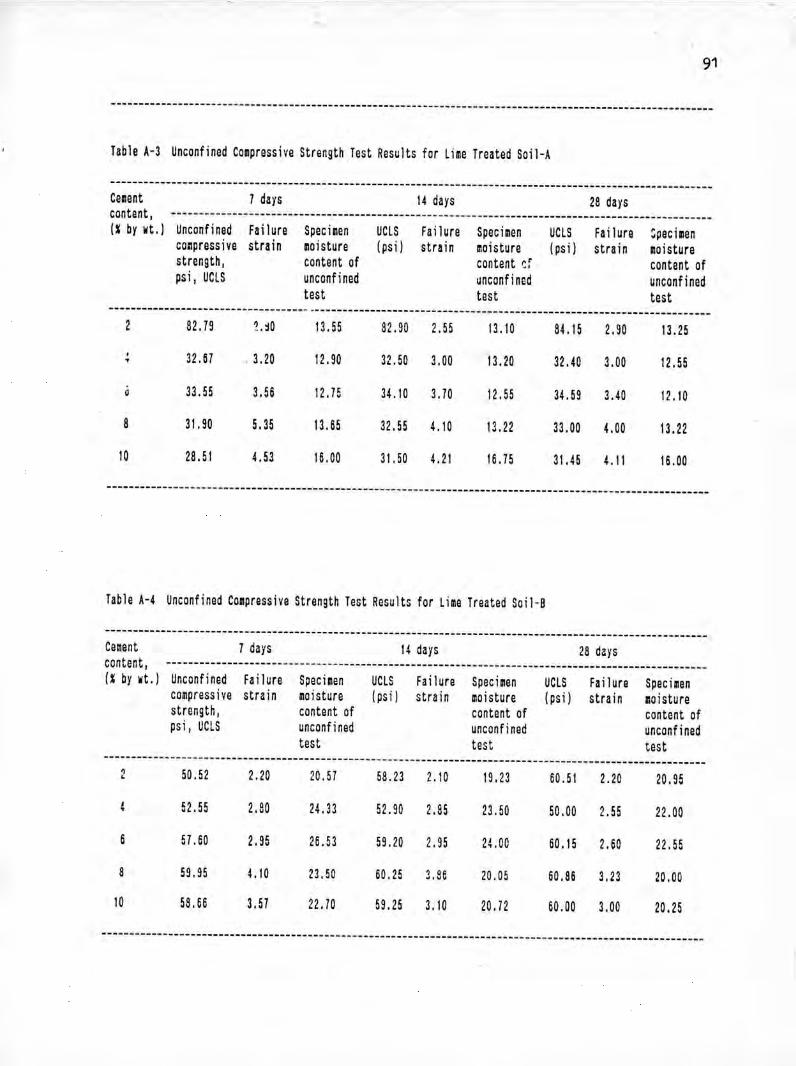
91
------------------------------------------------------------------------------------------------------------
Table A-3 Unconfined Compressive Strength Test Results for Lime Treated Soil-A
------------------------------------------------------------------------------------------------------------CeMnt 7 days 14 days 28 dayscontent, -------------------------------------------------------------------------------------------------Ix by wt.) Unconfined Failure Specimen UCLS Failure Specimen UCLS Failure :pecimencompressive strain moisture (ps i) strain moisture (ps i) strain moisturestrength, content of content ~; content ofpsi I UCLS unconfined unconfined unconfined
test test test-----------------------------------~ .-----------------------------------------------------------------------82.79 ~.~O 13.55 82.90 2.55 13.10 84.15 2.90 13.25
. 32,57 . 3.20 12.90 32.50 3.00 13.20 32.40 3.00 12.55.33,55 3.55 12.75 34.tO 3.70 12.55 34059 3.40 12.10
8 31.90 5.35 13.55 32.55 4.10 13.22 33.00 4.00 13.2210 28.51 4053 15.00 31.50 4.21 15.75 31.45 4.11 15.00
------------------------------------------------------------------------------------------------------------
Table A-4 Unconfined Compressive Strength Test Results for Lime Treated SoiJ-8
------------------------------------------------------------------------------------------------------------Cement 7 days 14 days 28 dayscontent, -------------------------------------------------------------------------------------------------(X bi'wt. ) Unconfined Failure Specimen UCLS Failure Specimen UCLS Failure Specimencompressive strain moisture (psil strain moisture (ps i) strain moisturestrength, content of content of content ofpsi, UCLS unconfined unconfined unconfined
test test test------------------------------------------------------------------------------------------------------------50.52 2.20 20.57 58.23 2.10 19.23 50.51 2.20 20.9552.55 2.80 24.33 52.90 2.85 23.50 50.00 2.55 22.00
5 57.60 2.95 26.53 59.20 2.95 24.00 60.15 2.50 22.558 59.95 4,10 23.50 50.25 3.86 20.05 50.86 3.23 20.0010 58.66 3.57 22.70 59.25 3.10 20.72 50.00 3.00 20.25
------------------------------------------------------------------------------------------------------------
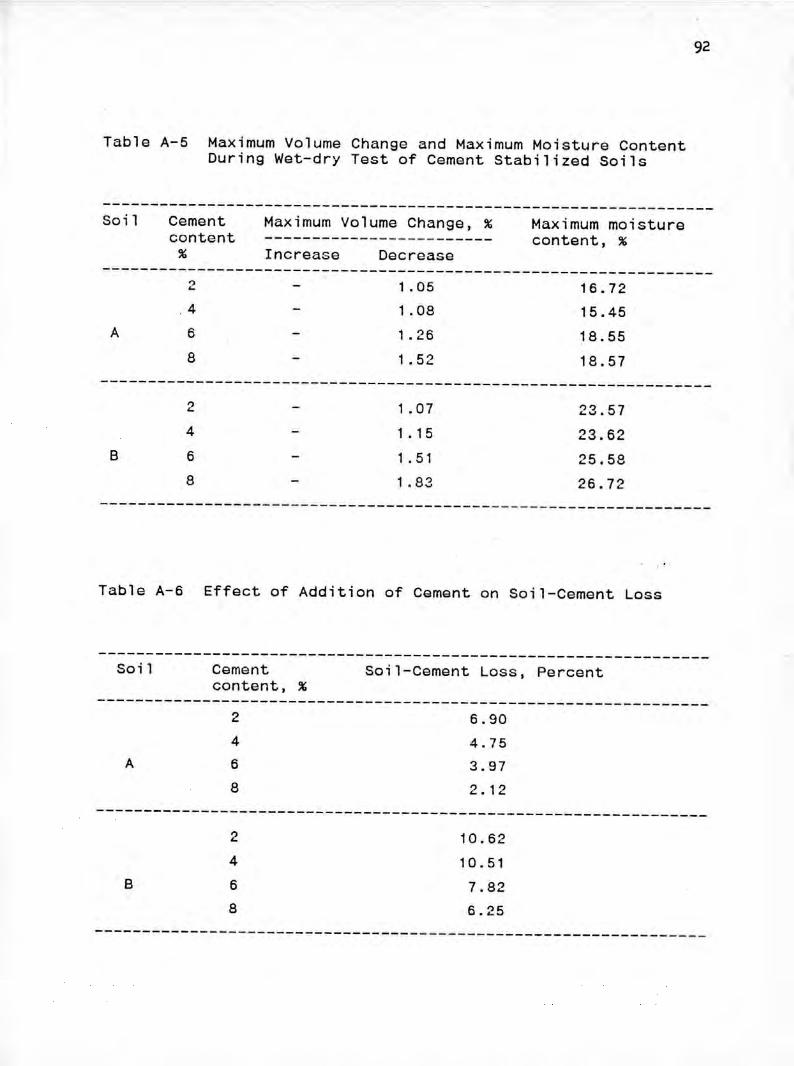
92
Table A-5 Maximum Volume Change and Maximum Moisture ContentDuring Wet-dry Test of Cement Stabilized Soils
----------------------------------------------------------------Maximum Volume Change, %Soil Cement
content% Increase Decrease
Maximum moisturecontent, %
----------------------------------------------------------------,., 1.05 16.72...4 1.08 15.45
A 6 1.26 18.558 1.52 18.57
----------------------------------------------------------------2 1.07 23.574 1.15 23.62
B 6 1.51 25.588 1.83 26.72
----------------------------------------------------------------
Table A-6 Effect of Addition of Cement on Soil-Cement Loss
----------------------------------------------------------------Soil Cemont
content, %Soil-Cement Loss, Percent
----------------------------------------------------------------,., 6.90•..4 4.75
A 6 3.978 2. 12
----------------------------------------------------------------
B
2
4
6
8
10.6210.517.826.25
----------------------------------------------------------------
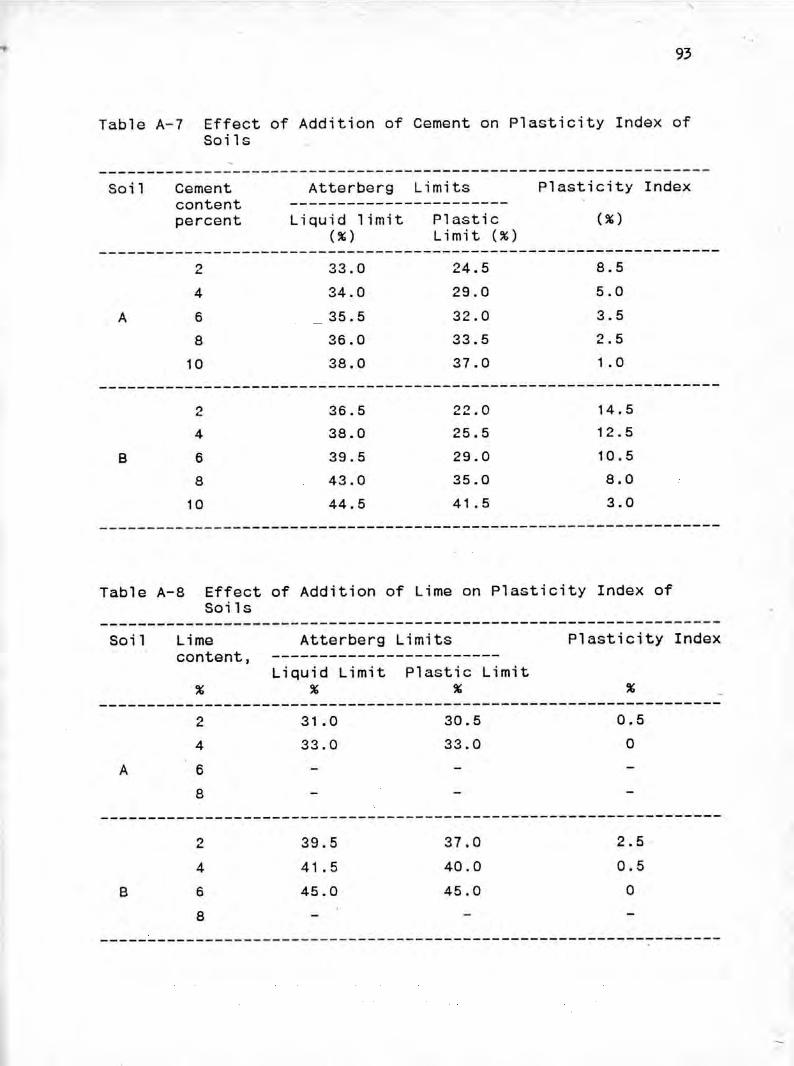
..
Table A-7
93
Effect of Addition of Cement on Plasticity Index ofSoils
----------------------------------------------------------------Atterberg LimitsSoil Cement
contentpercent Liquid limit
(%)PlasticLimit (%)
Plasticity Index(%)
-----------------------------------------------------------------') 33.0 24.5 8.5r...
4 34.0 29.0 5.0A 6 35.5 32.0 3.5
8 36.0 33.5 2.510 38.0 37.0 1.0
-----------------------------------------------------------------') 36.5 22.0 14.5•..4 38.0 25.5 12.5
B 6 39.5 29.0 10.58 43.0 35.0 8.010 44.5 41.5 3.0
-----------------------------------------------------------------
Table A-8 Effect of Addition of Lime on Plasticity Index ofSoils
-----------------------------------------------------------------Soi 1 Lime
content,%
Atterberg LimitsLiquid Limit Plastic Limit
% %
Plasticity Index
%-----------------------------------------------------------------
') 31 .0 30.5 0.5r...
4 33.0 33.0 0A 6
8-----------------------------------------------------------------
') 39.5 37.0 2.5r...
4 41 .5 40.0 0.5B 6 45.0 45.0 0
8-----------------------------------------------------------------
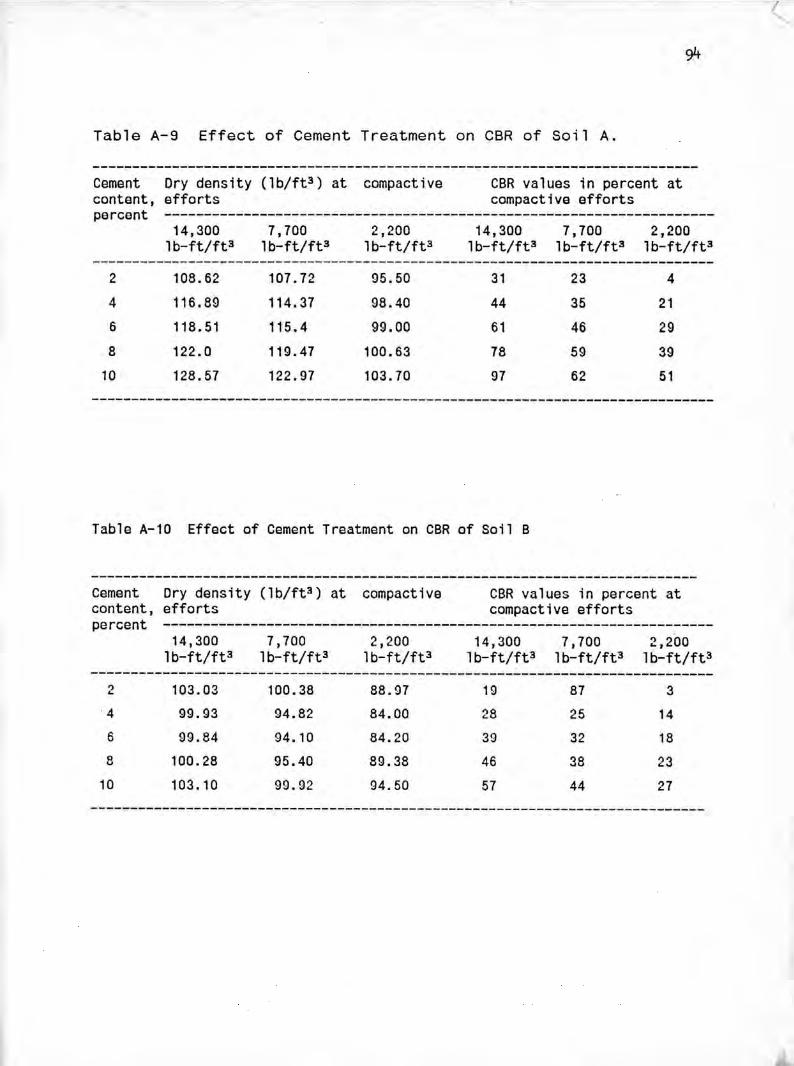
Table A-9 Effect of Cement Treatment on CBR of Soil A.
Cement Dry density (lb/ft3) at compactive CBR values in percent atcontent, efforts compactive effortspercont ---------------------------------------------------------------------
/
14,300lb-ft/ft3
7,7001b-ft/ft3
2,200lb-ft/ft3
14,300 7,700 2,200lb-ft/ft3 lb-ft/ft3 lb-ft/ft3
2 108.62 107.72 95.50 31 23 44 116.89 114.37 98.40 44 35 216 118.51 115.4 99.00 61 46 29B 122.0 119.47 100.63 78 59 3910 128.57 122.97 103.70 97 62 51
Table A-1o Effect of Cement Treatment on CBR of Soil B
Cement Dry density (lb/ft3) at compactive CBR values in percent atcontent, efforts compactive effortspercent ---------------------------------------------------------------------
14,300lb-ft/ft3
7,700lb-ft/ft3
2,200lb-ft/ft3
14,300lb-ft/ft3
7,700lb-ft/ft3
2,200lb-ft/ft3
2 103.03 100.38 88.97 19 87 34 99.93 94.82 84.00 28 25 146 99.84 94.10 84.20 39 32 180 100.28 95.40 89.38 46 38 23u
10 103.10 99.92 94.50 57 44 27
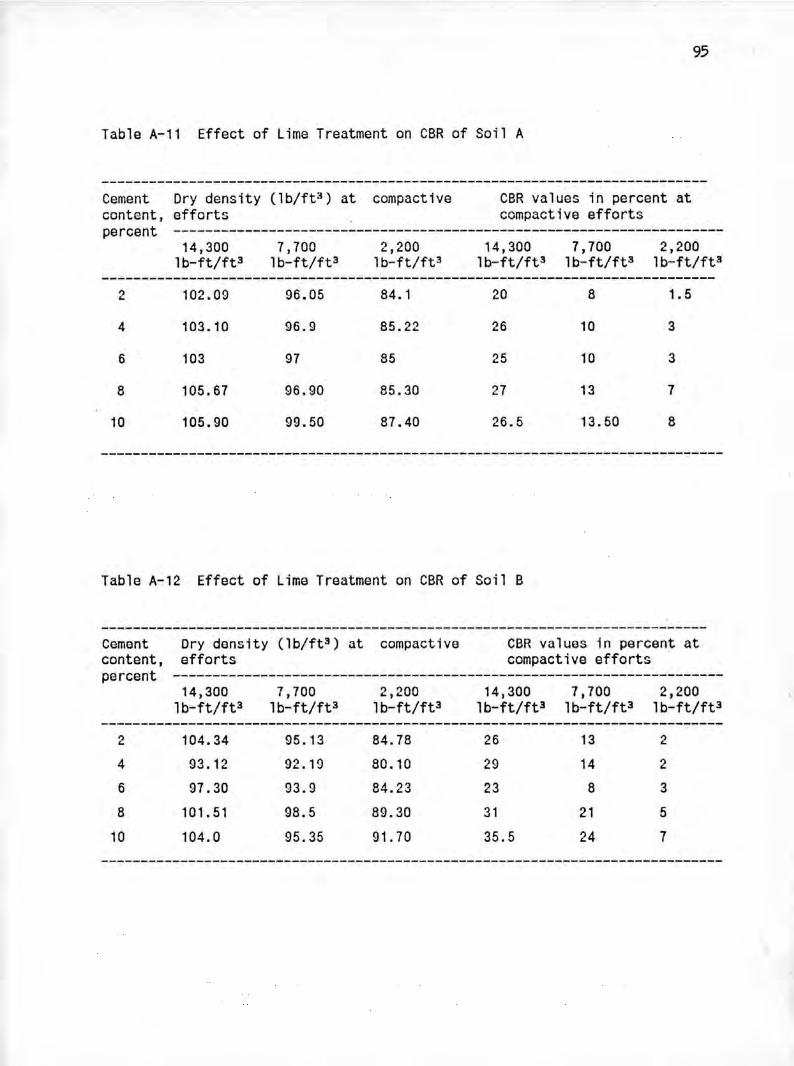
95
Table A-11 Effect of Lime Treatment on CBR of Soil A
Cement Dry density (lb/ft3) at compactive CBR values in percent atcontent, efforts compactive effortspercent ---------------------------------------------------------------------
14,3001b-ft/ft3
7,700lb-ft/ft3
2,200lb-ft/ft3
14,300 7,700 2,200lb-ft/ft3 lb-ft/ft3 lb-ft/ft3
2
4
6
8
10
102.09
103.10
103
105.67
105.90
96.05
96.9
97
96.90
99.50
84.1
85.22
85
85.30
87.40
20
26
25
27
26.5
8
10
10
13
13.50
1.5
3
3
7
8
Table A-12 Effect of Lime Treatment on CBR of Soil B
Dry donsity (lb/ft3) at compactiveefforts
CBR values in percent atcompactive efforts
Cementcontent,percent
14,300lb-ft/ft3
7,700lb-ft/ft3
2,2001b-ft/ft3
14,300lb-ft/ftJ
7,700lb-ft/ft3
2,200lb-ft/ft3
2 104.34 95.13 84.78 26 13 ..,•.4 93.12 92.10 80.10 29 14 26 97.30 93.9 84.23 23 8 38 101.51 98.5 89.30 31 21 510 104.0 95.35 91.70 35.5 24 7
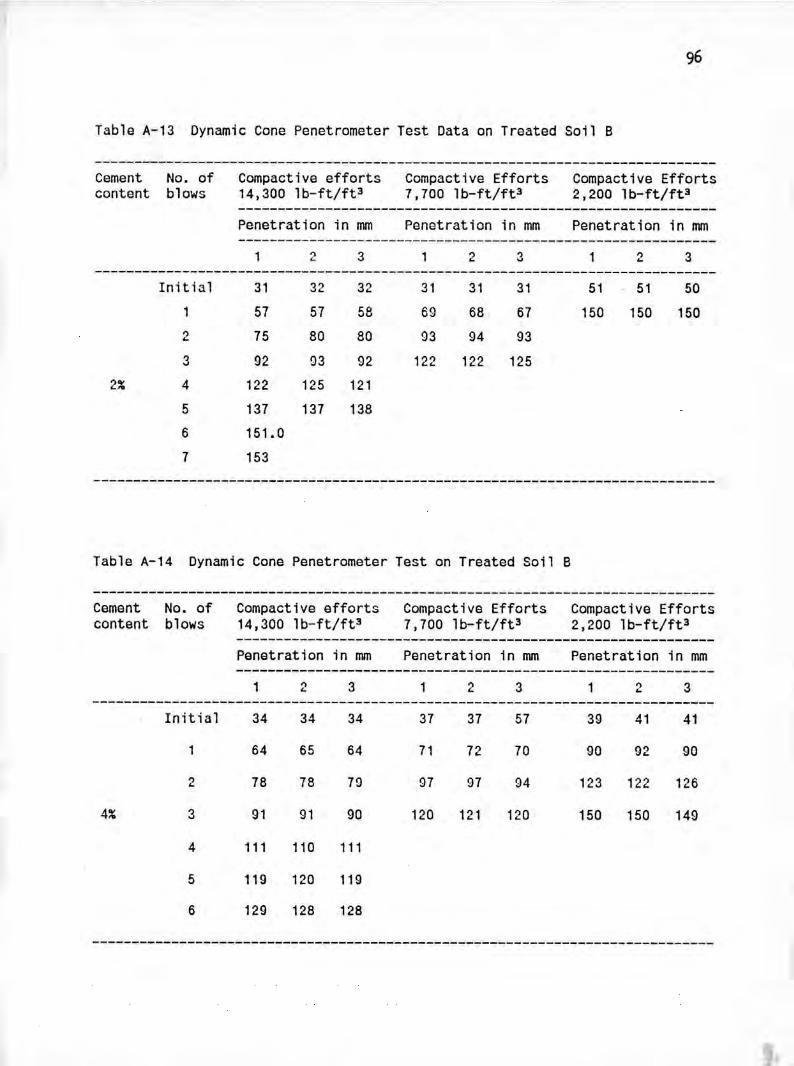
96
Table A-13 Dynamic Cone Penetrometer Test Data on Treated Soil B
Cement No. of Compactive effortscontent blows 14,300 lb-ft/ft3
Penetration in mm
Compactive Efforts7,700 1b-ft/ft3
Penetration in mm
Compactive Efforts2,200 lb-ft/ft3
Penetration in mm3 2 3 2 3
Initial 31 32 32 31 31 31 51 51 5057 57 58 69 68 67 150 150 150
2 75 80 80 93 94 933 92 93 92 122 1"" 125....
"'" 4 122 125 121..'"5 137 137 1386 151.07 153
Table A-14 Dynamic Cone Penetrometer Test on Treated Soil B
Cement No. of Compactive effortscontent blows 14,300 lb-ft/ft3
Penetration in mm
Compactive Efforts7,700 1b-ft/ft3
Penetration in mm
Compactive Efforts2,200 1b-ft/ft3
Penetration in mm
1 .., 3 .., 3 .., 3.. .. ..------------------------------------------------------------------------------Init ial 34 34 34 37 37 57 39 41 41
64 65 64 71 72 70 90 92 90
" 78 78 7'J 'J7 'J7 'J4 123 122 126..4% ') 91 91 90 120 121 120 150 150 149'"
4 111 110 111
5 11'J 120 1196 129 128 128
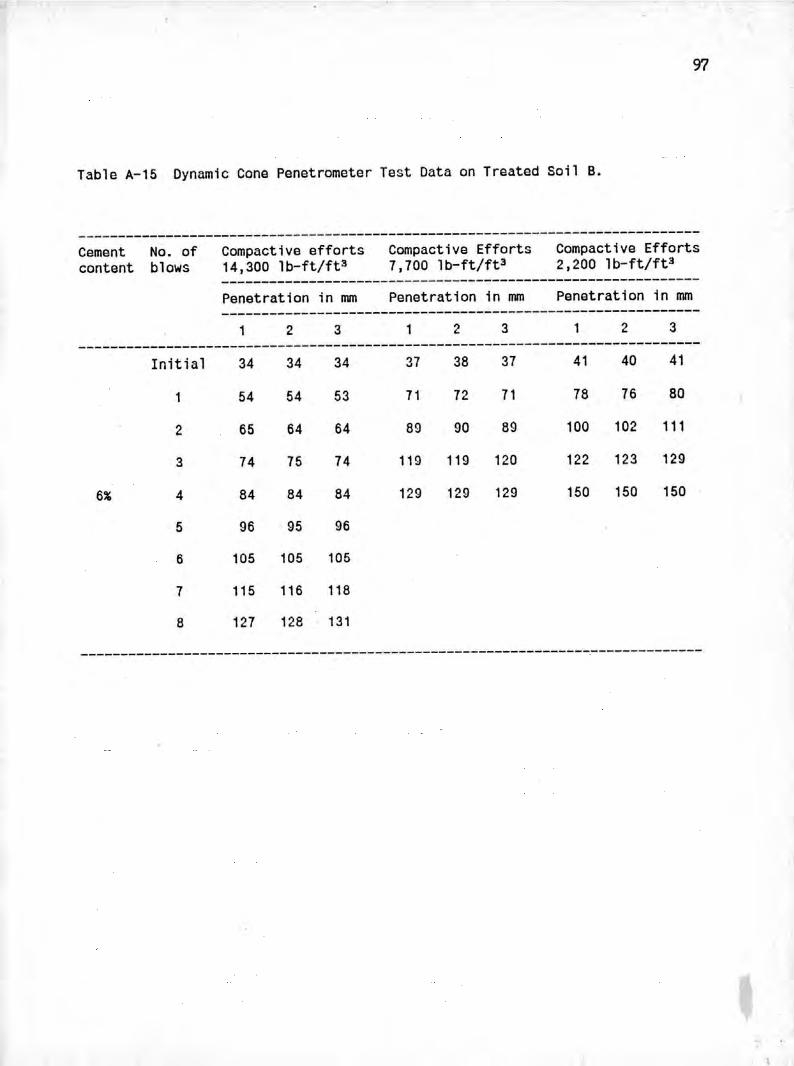
97
Table A-15 Dynamic Cone Penetrometer Test Data on Treated Soil B.
------------------------------------------------------------------------------Cement No. of Compactive effortscontent blows 14,300 lb-ft/ft3
Compactive Efforts7,700 1b-ft/ft3
Compactive Efforts2,200 lb-ft/ft3
------------------------------------------------------------Penetration in mm Penetration in mm Penetration in mm------------------------------------------------------------
1 2 3 1 2 3 1 2 3------------------------------------------------------------------------------
Initial 34 34 34 37 38 37 41 40 41
54 54 53 71 72 71 78 76 80
2 65 64 64 89 90 89 100 102 111
3 74 75 74 119 119 120 122 123 129
6% 4 84 84 84 129 129 129 150 150 150
5 96 95 96
6 105 105 105
7 115 116 118
8 127 128 131------------------------------------------------------------------------------
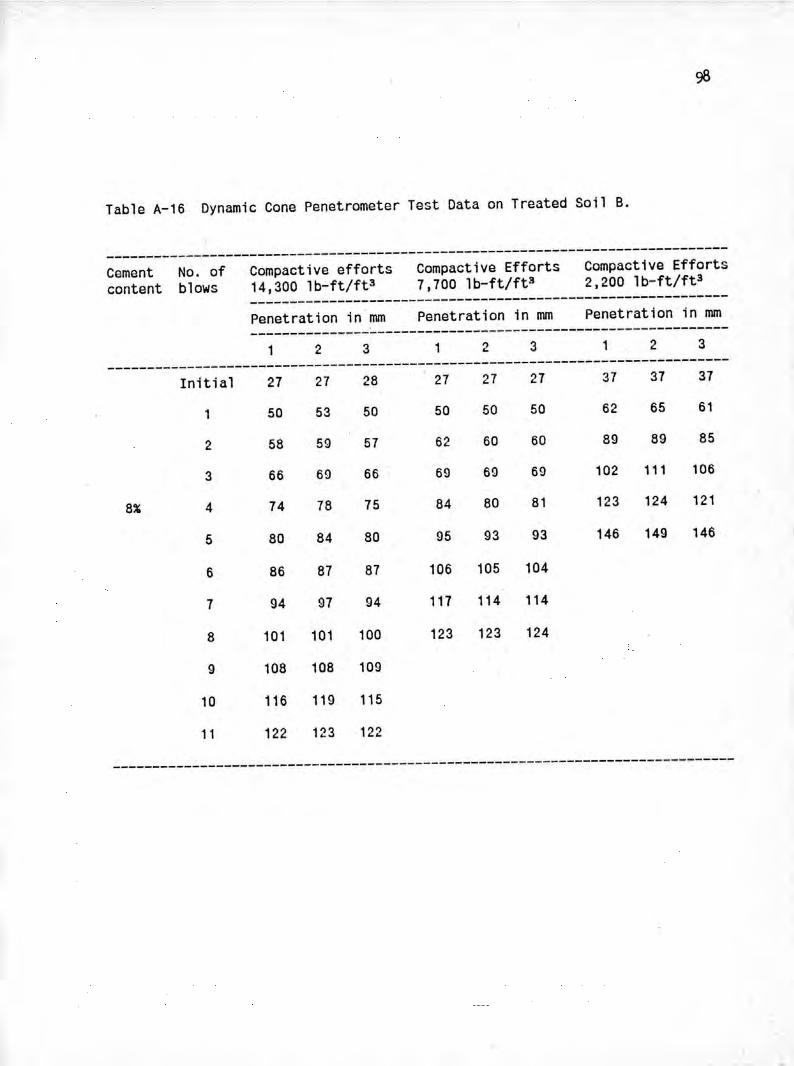
Table A-16 Dynamic Cone Penetrometer Test Data on Treated Soil B.
------------------------------------------------------------------------------Cement No. of Compactive efforts Compactive Efforts Compactive Effortscontent blows 14,300 1b-ft/ft3 7,700 lb-ft/ft3 2,200 1b-ft/ft3
------------------------------------------------------------Penetration in mm Penetration in mm Penetration in mm------------------------------------------------------------
1 2 3 1 2 3 1 " 3'-------------------------------------------------------------------------------Initial 27 27 28 27 27 27 37 37 37
50 53 50 50 50 50 62 65 61
2 58 59 57 62 60 60 89 89 85
3 66 69 66 69 69 69 102 111 106
8% 4 74 78 75 84 80 81 123 124 121
5 80 84 80 95 93 93 146 149 146
6 86 87 87 106 105 104
7 94 97 94 117 114 114
8 101 101 100 123 123 124
9 108 108 109
10 116 119 115
11 122 123 122------------------------------------------------------------------------------
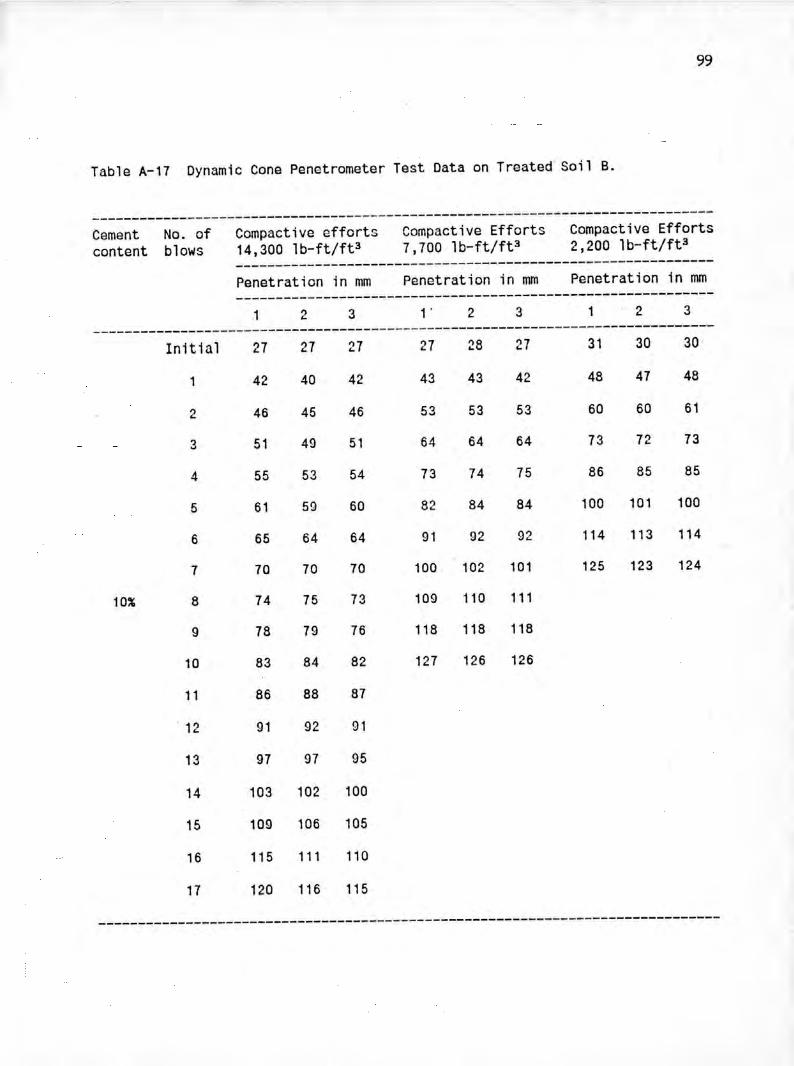
99
Table A-17 Dynamic Cone Penetrometer Test Data on Treated Soil B.
------------------------------------------------------------------------------Cement No. of Compactive effortscontent blows 14,300 lb-ft/ft3
Compactive Efforts7,700 lb-ft/ft3
Compactive Efforts2,200 1b-ft/ft3
------------------------------------------------------------Penetration in mm Penetration in mm Penetration in mm------------------------------------------------------------
2 3 2 3 2 3------------------------------------------------------------------------------
Initial 2742
27
40
27
42
27
43
2843
27
42
31
48
30
47
30
48
10%
2
3
4
5
6
7
8
9
10
46
51
55
61
65
70
7478
83
45
49
53
59
64
70
7579
84
46
51
54
60
64
70
7376
82
53 53 5364 64 64
73 74 75
82 84 8491 92 92
100 102 101109 110 111118 118 118
127 126 126
60 60 6173 72 73
86 85 85
100 101 100
114 113 114125 123 124
11 86 88 87
12 91 92 91
13 97 97 95
14 103 102 100
15 109 106 105
16 115 111 110
17 120 116 115------------------------------------------------------------------------------
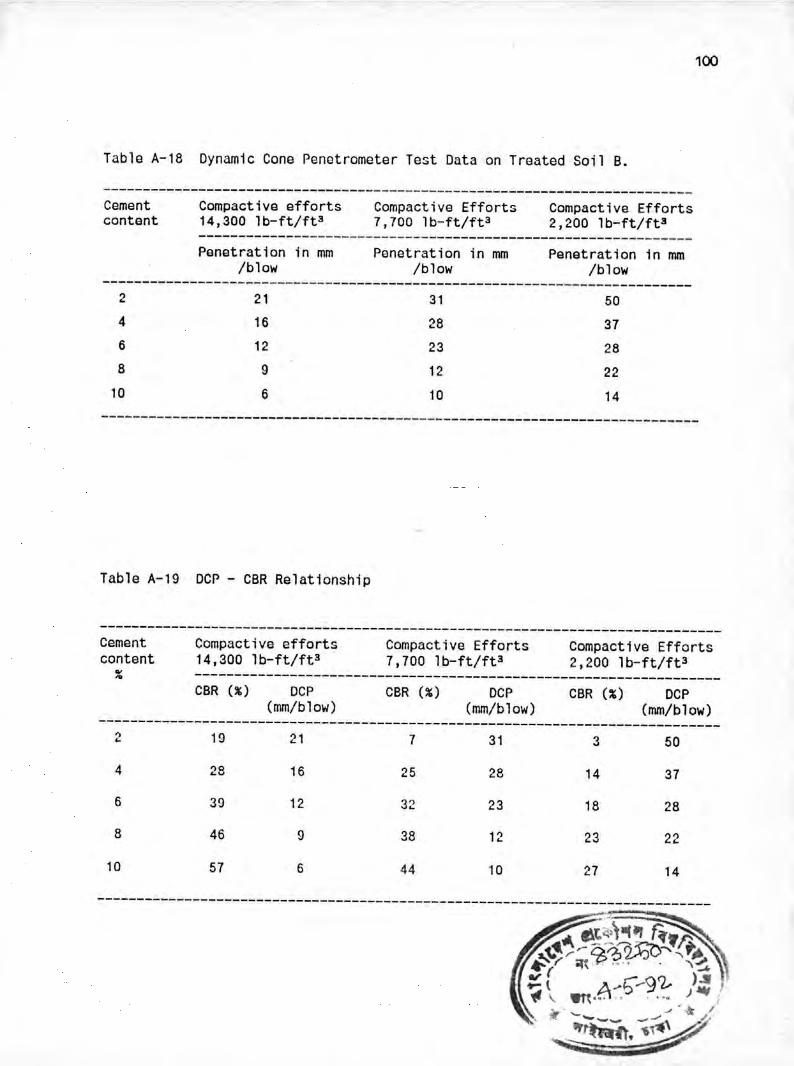
100
Table A-18 Dynamic Cone Penotrometer Test Data on Treated Soil B.
--------------------------------------------------------------------------Cementcontent
Compactive efforts14,300 lb-ft/ft3
Compactive Efforts7,700 1b-ft/ft3
Compactive Efforts2,200 lb-ft/ft3--------------------------------------------------------------
Penetration in mm/blow
Penetration in mm/blow
Penetration in mm/blow--------------------------------------------------------------------------
'l 21 31 50•.4 16 'lQ 37•.u
6 12 23 288 9 12 2210 6 10 14
---------------------------------------------------------------------------
Table A-19 DCP - CBR Relationship
------------------------------------------------------------------------------Cementcontent
Compactive efforts14,300 lb-ft/ft3
Compactive Efforts7,700 1b-ft/ft3
Compactive Efforts2,200 1b-ft/fP------------------------------------------------------------------
CBR (%) OCP(mm/blow)
CBR (%) DCP(mm/blow)
CBR (%) DCP(mm/blow)------------------------------------------------------------------------------
2
4
6
8
10
19
28
39
46
57
21
16
12
9
6
7
25
38
44
31
28
23
12
10
3
14
18
23
27
50
37
28
22
14
-----------------------------------------------------------------------------

![[IJETA-V3I2P12]:Nazia Azim, Adnan Khan, Fazlullah Khan, Abdul Majid, Syed Roohullah Jan, Muhammad Tahir](https://img.dokumen.tips/doc/110x75/635a5d1d9d85dc43cb06f0ae/ijeta-v3i2p12nazia-azim-adnan-khan-fazlullah-khan-abdul-majid-syed-roohullah.jpg)


![[IJCST-V4I2P46]:Muhammad Safdar,Izaz Ahmad Khan, Fazlullah Khan, Farman Ullah, Syed Roohullah Jan](https://img.dokumen.tips/doc/110x75/6359e3b0e1cb36a96f0b0942/ijcst-v4i2p46muhammad-safdarizaz-ahmad-khan-fazlullah-khan-farman-ullah-syed.jpg)