Embed Size (px)
Citation preview
CHARACTERIZATION AND DIVERSITY ANALYSIS OF THE OLEIFEROUS Brassica species
MD
MD. HARUN-UR-RASHID
REGISTRATION NO. 26269/00554
A Thesis Submitted to the Faculty of Agriculture,
Sher-e-Bangla Agricultural University, Dhaka, in partial fulfillment of the requirements
for the degree of
MASTER OF SCIENCE
IN
GENETICS AND PLANT BREEDING SEMESTER: JULY-DECEMBER'07
Approved by:
(7
(Dr. Md. Shahidur Rashid Bhuiyan) Professor
Supervisor
(Dr. Md. All Akbar) Ex-PSO
Oil Seeds Research Centre, BARI, Gazipur Co-supervisor
(Firoz Mahmud) Chairman
Examination Committee
UDr. Md. Shahidur Rashid Bhuiyan
Professor
Department of Genetics and Plant Breeding Sher-e-Bangla Agricultural University
Sher-e-Bangla Nagar, Dhaka-1207 Bangladesh
Ref: . Date:
CERTIFICATE
This is to certify that thesis entitkd, "CHARACTERIZATION AND DIVERSITY
ANALYSIS OF THE OLEIFEROUS Brassica species" submitted to the Faculty of
.Agriculture, Sher-e-Bangla Agricultural University, lThaka, in partial fulfillment of the
requirements for the degree of MASTER OF SCIENCE in GENETICS AND PLANT
BREEDING, embodies the result of a jnece of bona fide research work carried out by MD.
HARUN-UR-RASHID, Registration No. 26269/00554 tinder my supeivision and gtiidance. No
part of the thesis has been submitted for any other degree or diploma.
I further certify that such help or source of information, as has been availed of during
the course of this investigation has duly been acknowkdged.
Dated: December, 2007
(Dr. Md. Shahidur Rashid Bhuiyan) Place: Dhaka, Bangladesh
Professor
Supervisor
SOME COMMONLY USED ABBREVIATIONS
Abbreviations Full word % = Percent
= Degree Celsius AEZ Agro-Ecological Zone Agric. = Agriculture Agril. = Agricultural Agron. = Agronomy BA = Bangladesh Agricultural Research Institute BBS = Bangladesh l3ureau olStatistics BD = Bangladesh BSMRAU = Bangabundhu Sheikh Mujibur Raharnan Agricultural University CEC = Cation Exchange Capacity cm = Centi-meter CV% = I'ercentage of Coeflicient of Variation cv. = Cultivar (s) DAS = Days A 11cr Sowing dl = Degrees of Freedom DM = Dn' Matter [C = Emulsifiable Concentrate ci at = And others etc. = Etcetera
C -
4 - 'I'L. ..A .... ----- --- !L.I .l,a .tJl li_I &t4 lUll UI a ll U." tJt.tVL..l) Lfl U UI." 111111 al.......... j5UU
parents FAO = Food and Agricultural Organization g = Gram (s) 6 = Genotype (IN. = Genotype Number III = Harvest Index hr. = Hour(s) IARI = Indian Agricultural Research Institute ICARDA = International Centre for Agricultural Research in Dry Areas
j. = Journal kg = kilogram (s) m = Meter M. = Muriate of Potash m2 = Square meter MOA = Ministry of Agriculture NARS = National Agricultural Research Institute No. = Number NS = Ne Signiflcvt ppm = Pads Per Million K = Residual effect RCBD = Randomized Complete Block Design Ekes. = Research
SAU = Sher-e-I3angla Agricultural University Sci. = Science SE = Standard Error
Triple Super Phosphate 1'onnes per hectare
Univ. = University var. = Variety
rt.i L.WA E#I.J#neI
First of all, the author would like to express his sukt-iah (Alhamdulillah) to the Almighty Allah for
his ever- end blessing for the successful accomplishment of this work.
The author sincerely desires to express his deepest sense of gratitude, respect1 profound
appreciation and indebtedness to his research supervisor, Dr. Md. Shahidur Rashid Bhuiyan,
Professor, l)eparrment of Genetics and Plant lreeding, Sher-e-Bangla Agricultural University,
Dhaka for his kind and scholastic guidance, untiring effort, valuable suggestions, inspiration, co-
operation and constructive criticisms throughout the entire period of the research work and the
preparation of the manuscript of this thesis.
The author expresses heartfelt gratitude and indebtedness to his co- supervisor, Dr. Md. Mi Aklyw,
Ex-PSO, Oil Seeds Research Centre, BAR!, Gazipur for his co-operation, criticisms on the
manuscript and helpful suggestions for the successful completion of the research work.
The author expresses his deepest respect and boundless gratitude to Firoz Mab.mud, Associate
Professor and Chairman, Department of Genetics and Plant Breeding, Sher-e-Bangla Agricultural
University, Dhaka for his sympathetic co-operation and inspiration throughout the research work.
The author is thankful to Professor Molummad Ilossain Bhuiyan, Co-ordinator (CASR) for
providing necessary facilities and conductive atmosphere to accomplish his research work.
Special thanks and indebtedness are also due to all the respective teachen of the F)eparrincnr of
Genetics and Plant Breeding, Sher-e-langla Agricultural University, Dhaka for their valuable
teaching, sympathetic co-operation and inspiration throughout the period of the study.
The author expends his thanks to all the staff of the Department of Genetics and Plant Breeding,
SAU, Dhaka for their help and co-operation during the research work.
The author also likes to give thanks to all of his friends for their support and inspiration
throughout his study period in SAU, Dhaka.
Finally, the author express his deepest sense of gratitude and feeling to his beloved father, mother,
brother, uncle and other relatives for their blessings, encouragements, sacrifices, affectionate
feelings, dedicated efforts to reach the author to this level.
Dated: December, 2007. The author
Nd. HctiOa. RciAA Place: Dhaka, Bangladesh. (Md. Harun- Ur-Rashid)
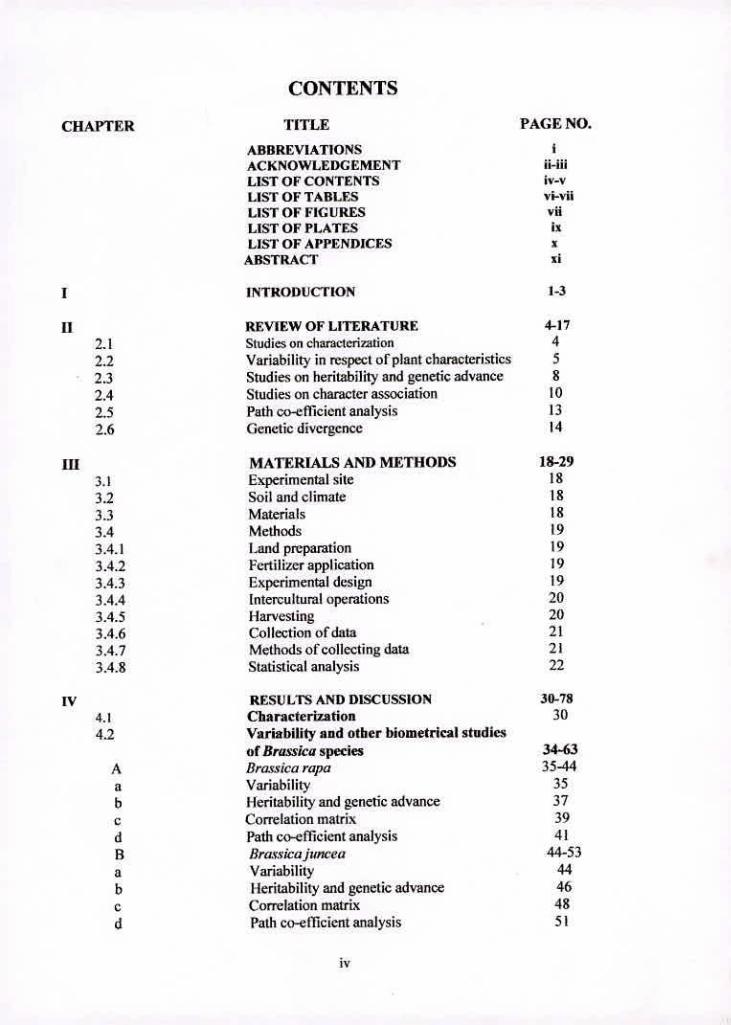
CONTENTS
CHAPTER TITLE PACE NO.
ABBREVIATIONS ACKNOWLEDGEMENT u-ui LIST OF CONTENTS iv-v LIST OF TABLES vi-vil LIST OF FIGURES vii LIST OF PLATES Ix LIST OF APPENDICES x ABSTRACT
INTRODUCTION 1-3
H REVIEW OF LITERATURE 4-37 2.1 Studies on characterization 4 2.2 Variability in respect olplant characteristics 5
2.3 Studies on heritability and genetic advance 8 2.4 Studies on character association 10 2.5 Path co-efficient analysis 13 2.6 Genetic divergence 14
III MATERIALS AND METHODS 18-29 3.3 Experimental site 18 3.2 Soil and climate IS 3.3 Materials 18 3.4 Methods 19 3.4.1 l.and preparation 19 3.4.2 Fertilizer application 19 3.4.3 Experimental design 19 3.4.4 Intercultural operations 20 3.4.5 Harvesting 20 3.4.6 Collection of data 21 3.4.7 Methods of collecting data 21 3.4.8 Statistical analysis 22
IV RESULTS AND DISCUSSION 30-78 4.1 Characterization 30 4.2 Variability and other biometrical studies
of Brassica species 34-63 A Bracsica rapa 35-44 a Variability 35 b Heritability and genetic advance 37 c Correlation matrix 39 d Path co-efficient analysis 41 13 Bratvicajuncca 44-53 a Variability 44 b Heritability and genetic advance 46 c Correlation matrix 48 ci Path co-efficient analysis SI
iv
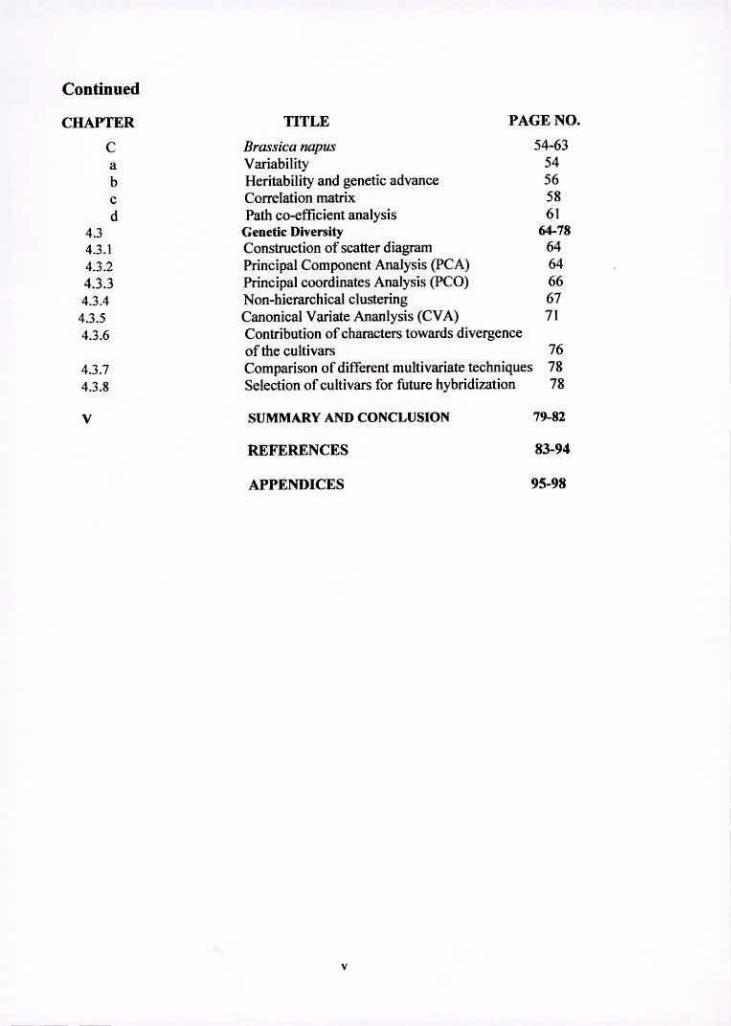
Continued
CHAVTER TITLE PAGE NO.
C Bracsica napus 54-63
a Variability 54
b Heritability and genetic advance 56
e Correlation matrix 58
d Path co-efficient analysis 61 4.3 Genetic Diversity 64-18 4.3.1 Construction of scatter diagram 64
43.2 Principal Component Analysis (PCA) 64
4.3.3 Principal coordinates Analysis (PCO) 66 4.3.4 Non-hierarchical clustering 67
4.3.5 Canonical Variate Ananlysis (CVA) 71
4.3.6 Contribution of characters towards divergence of the cultivars 76
4.3.7 Comparison of different muitivariate techniques 78
4.3.8 Selection of cultivars for future hybridization 78
V SUMMARY AND CONCLUSION 79-82
REFERENCES 83-94
APPENDICES
95-98
V
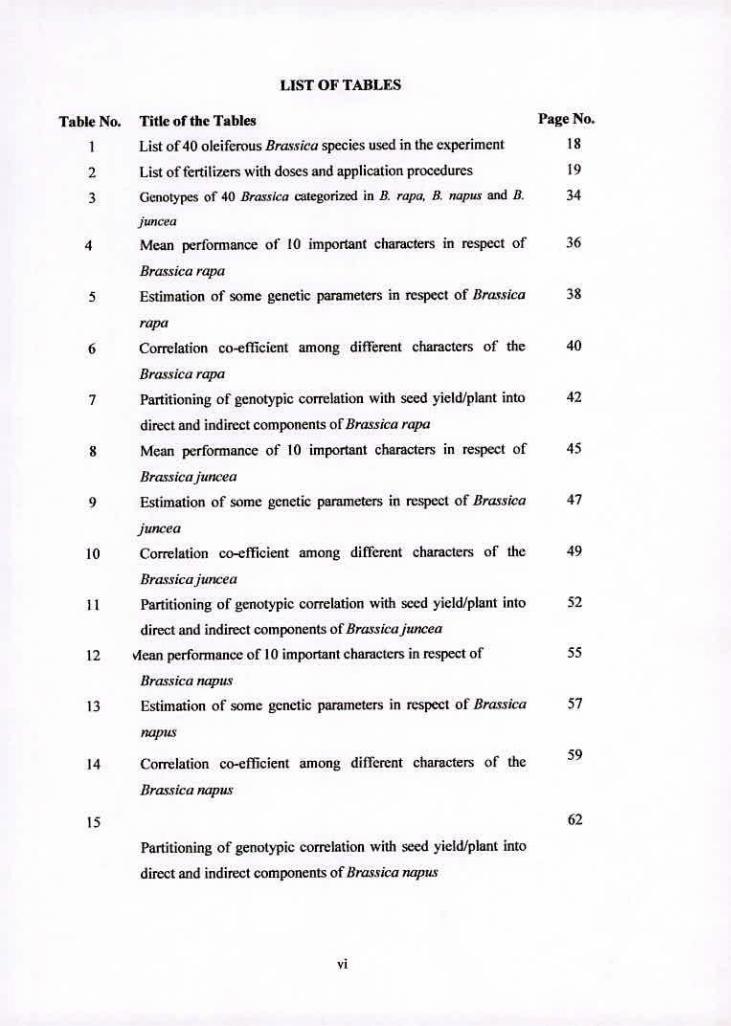
LIST OF TABLES
Table No. Title of the Tables Page No.
1 List of 40 oleiferous Brassica species used in the experiment 18
2 List of fertilizers with doses and application procedures 19
3 Genotypes of 40 Brassica categorized in B. rapa, B. napus and B. 34
juncea
4 Mean performance of tO important characters in respect of 36
Brassica rapa
5 Estimation of some genetic parameters in respect of Bratcica 38
rapa
6 Correlation co-efficient among different characters of the 40
Brassica rapa
7 Partitioning of genotypic correlation with seed yield/plant into 42
direct and indirect components of Brassica rapa
8 Mean performance of tO important characters in respect of 45
Brassicajuncea
9 Estimation of some genetic parameters in respect of Brassica 47
juncea
10 Correlation co-efficient among different characters of the 49
Bracsicajuncea
11 Partitioning of genotypic correlation with seed yield/plant into 52
direct and indirect components of Brasskajwicea
12 vlean performance of 10 important characters in respect of 55
Brassica flUJNLS
13 Estimation of some genetic parameters in respect of Brassica 57
napus
14 Correlation co-efficient among different characters of the 59
Brassica napus
15 62
Partitioning of genotypic correlation with seed yield/plant into
direct and indirect components of Brassica napzt
VI
Continued
Page No.
66
Table No. Tifie of the Tables
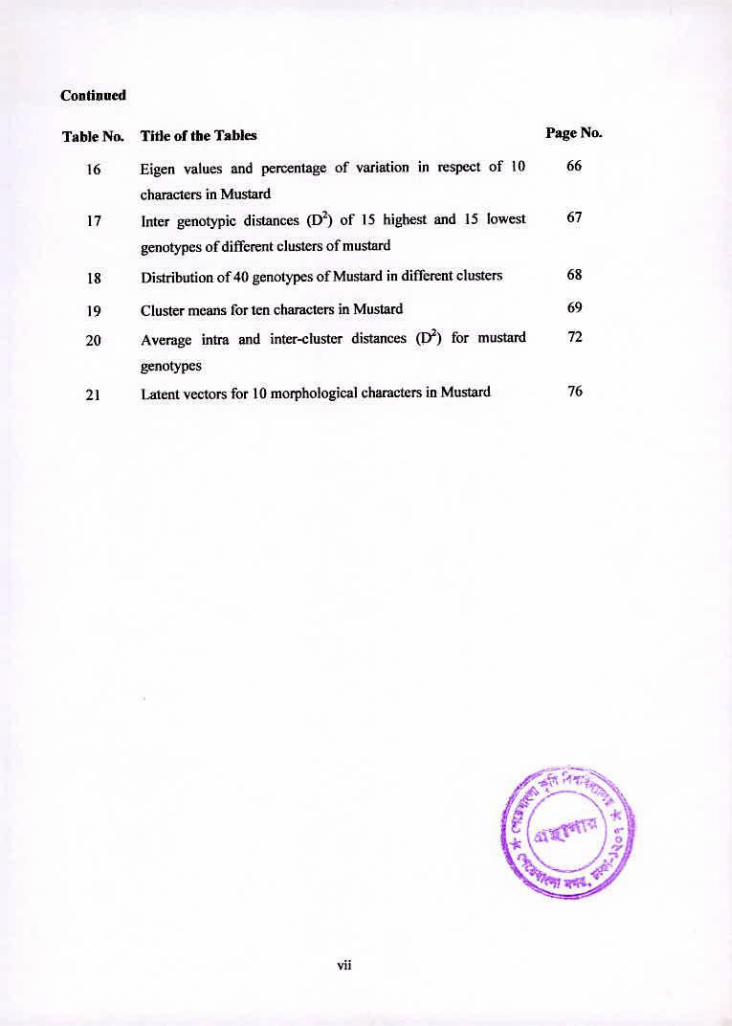
16 Eigen values and percentage of variation in respect of 10
characters in Mustard
17 Inter genotypic distances ([)2) of IS highest and 15 lowest
genotypes of different clusters of mustard
18 Distribution of 40 genotypes of Mustard in different clusters
19 Cluster means for ten characters in Mustard
20 Avenge intra and inter-cluster distances (1)2) for mustard
genotypes
21 Latent vectors for 10 morphological characters in Mustard
67
68
69
72
76
vi!
LIST OF FIGuRES
Figure Title of the figures Page
No. No.
Scatter diagram of mustard genotypes based on their principal component 65
scores
2 Diagram showing inter-cluster (outside the circle) and intra-cluster (inside 72
the circle) distances of mustard genotypes
3 Scatter diagram with clustering pattern of forty Mustard germplasms 75
vi"
LIST OF PLATES
Plate Title of the Plates Page
No. No.
I Photographs showing the distinguishing characters among /3. napus, B. rapa 31
and B. juncea leaves
2 Photographs showing the distinguishing characters among B. napus. B. rapa 32
and Iijuncea inflorescence
3 Photograph showing the distinguishing characters among B. napus, B. rapa 33
and B. juncea leaves
4 Photograph showing the distinguishing characters among B. napus. B. rapa 33
and B. juncea siliquac
Photograph showing differcnce in morphological characters among B.juncea, 73 5
B. napus and B. rapa
6 Photograph showing difference in morphological characters between B. napus 73
and LI. rapa
7 Photograph showing the different flowering time between B. napus and B. 77
rapa
8 Photograph showing the early, mid and late flowering germplasms of B. napus 77
lx
LIST OF APPENDICES
APPENDIX NO. TITLE OF APPENDICES PAGE NO.
I Monthly average of Temperature, Relative humidity, 95
Total rainfall and Sunshine hour cithe experiment site
during the period from January'05 to February'06
II Analysis of variances of 20 important characters in 96
respect of Brassica napus
Ill Analysis of variances of 20 important characters in 97
respect of Brassicajuncea
LV Analysis of variances of 10 important characters in 98
respect of Brassica rapa
'C
CHARACTERIZATION AND DIVERSITY ANALYSIS OF THE
OLEIFEROUS Brassica species
ABSTRACT
BY
MD. HARUN-UR-RASIHO
An experiment was carried out with 40 oleiferous Brassica species to evaluate the performance
for seed yield and yield components, characterization, variability, correlation, path co-efficient
analysis and genetic divergence. The genotypes showed wide variation for morphological
characteristics and thus were categorized under three cultivated species- B. rapa, B. napus and B.
juncea. Significant variation was observed among the genotypes tested. Considering genetic
parameters. high CCV value was observed for plant height, number of siliquae/plant, days to
50% Ilowering and days to maturity. High heritability values along with high genetic advance in
percentage of mean were obtained for si(iqua length, number of seeds/siliqua, number of primary
branches/plant and number of secondary branches/plant. Correlation studies revealed highly
significant positive association of yield/plant with number of primary branches/plant, number of
secondary branches/plant, number of seeds/siliqua and number of siliquac/plant. Path analysis
showed that yield/plant had the highest direct effect on days to maturity, number of seeds/siliqua,
number of siliqune/plant and number of primary branches/plant and number of secondary
branches/plant. I)iversity was estimated by cluster distance and genotypes were grouped into six
clusters. Principal component analysis, cluster analysis and canonical variate analysis exhibited
similar results. Cluster II had the maximum 10 and cluster I and III had the minimum 5 number
of genotypes. The highest intra-cluster distance was observed in cluster V. The highest inter-
cluster distance was observed between cluster I and VI and the lowest was between the cluster Ill
and V. The characters for number of secondary branches/plant, number of siliquae/plant and
yield/plant contributed maximum divergence. Considering diversity pattern, genetic status and
other agronomic performances 14 materials viz. BD-6948 and SAUYC from cluster I: BD-9063,
BD-9064 and BD-9071 from cluster II; LID-9068 and BD-9077 from cluster Ill; BD-9078, BL)-
9106 and RD-6949 from cluster IV; BD-9079 and BD-9081 from cluster V and 13D-9100 and
BD-7812 from cluster VI, could be used as superior parents for mustard and rape improvement
programme.
xi
Chapter 1
INTRODUCTION
Brassica is an important genus of plant kingdom consisting of over 3200 species with highly
diverse morphology. Brassica has great economic and commercial value and play a major role in
feeding the world population. They ranged from nutritious vegetables, oils, condiments and
animal feeds. Vegetable oils and fats (lipids) constitute an important component of human diet,
ranking third after cereals and animal products and in addition, oils of plant origin are
nutritionally superior to that of animal origin (Singh. 2000). Vegetable oils are used mostly for
edible purposes and a part finds industrial applications. Oil cakes are used as manures and good
source of protein in animal feed.
According to FAO (2005), oleiferous Brassica hold the second position in the world oilseeds in
respect of production and about 16% of the world's oilseed is obtained from this crop. In
Bangladesh rapeseed and mustard of Brassica is the major source of edible oil and more than
210.57 thousand metric ton of rape and mustard produced from total 279.23 thousand hectares of
cultivable land in the year 2003-04 (BBS, 2005). Its average yield per hectare was only 733 Kg
in Bangladesh compared to the world average of 1,575 Kg (FAO. 2005). Almost two-third of the
edible oil consumed annually in Bangladesh is imported and foreign exchange spent for this was
about 690 million US dollar (BBS, 2004). The per capita consumption of edible oil in the
country is comparatively low, only 10-12 glhead/day against the optimum requirement of
35g/head/day.
The genus Bra.swica has generally been divided into three groups, namely rapcseed, mustard and
cole. Out of the oil bearing plants Brassica rape includes the diploid B. rapa, turnip rape (AA.
I
2n=20) and amphidiploids B. napus L., rape (AACC, 2n38) while the mustard component
includes the amphidiploids B. /uncea Czern and Coss as Indian mustard (AABB. 2n36) and B.
carinata brown as Abyssinian mustard (BBCC, 2n34) respectively (Yarnell, 1956). The
gcnomic constitutions of the three elemental species are B. rapa (AA, 2n20), B. oleracea (CC.
2nr18) and B. nigra (BB, 2n16). The amphidiploids species of B. napus (AACC, 2n=38). B.
juncca (AABB, 2n=36) and B. car/noW (88CC, 2n34) has been derived by genomic
reconibination of the diploid elemental species. U (1935) diagrammatically illustrated the
interrelationships between the three diploids and their allotetraploids by the so called U-triangle.
In the oleiferous Brass/ca group, a considerable variation of genetic nature exists among
different species and varieties within each species in respect of different morpho-physiological
characters (Malik etal. 1995; Nanda et at. 1995; Kakroo and Kumar, 1991; Singh et at. 1991).
Among different Brass/ca species, the diploid species Brassica rapa L. var. toria and sarson
(brown/yellow) and B. juncea L. are widely cultivated in Bangladesh. Resides, several non
pungent allotetraploid varieties of rapesced B. napus L. have recently been developed by
Bangladesh Agricultural Research Institute (BARI) and Bangladesh Institute of Nuclear
Agriculture (BINA). These varieties are physiologically more productive with higher oil content
(42-44%) and tolerant to stresses like Alternaria blight disease and water-logged conditions.
The country is facing increasing deficiency in oilseed production and consequently, import cost
is increasing. The causes for the low yield are also due to low yield potential of the varieties,
insufficient precipitation when the crops are cultivated under rainfed conditions and the primitive
crop management practices. Moreover, area of oilseed crops including mustard and rapeseed is
also decreasing. On the other hand, high population growth rate is also increasing pressure on per
capita consumption rate of oils.
Thus to nourish the people of our country adequately, we should develop varieties with higher
seed yield with more oil percentage in seed and tolerant to biotie and abiotic stresses. According
to Burton (1952), for the improvement of any character through breeding, it is essential to know
the extent of variability present in that species, nature of association among the characters and
the contribution of different characters towards seed yield. The efficiency of a plant breeding
nrnc,ran,,nrd denpnk in, thr nrnnl ml ,,,>n,Me ,:*rh,h1 il,, ,w . ii ,,,ti.rs iw hn,a.' tnnnlm a ni .ni - o
breeder can create variability in the target population so as to perform elThctive selection. The
germplasms were received from the gene bank of Bangladesh Agricultural Research Institute
(BARI). Gazipur without having the information about the species as well as for their identifying
characteristics. So, it is an opportunity to categorize the germplasm morphologieally under
different species for future utilization.
The present study was undertaken with 40 oleiferous Brassica species to determine the
importance of the genotypes from breeding point of view. 1-lowever, the objectives of the study
'fl-Ic-
I. To characterize the oleiferous Brassica species.
To estimate the nature and magnitude of genetic variations among the olcifcrous
Brassica germplasms in respect of different morphological characters.
To determine the nature of association, direct and indirect relationship between yield
and yield contributing characters and relative contribution of each character towards
seed yield in Brassica through the correlation coefficient and the path coefficient
analysis.
To assess the genetic diversity among the olciferous Brassica sp. for identi:ing the
genetically divergent parents to utilize them in the future breeding programme.
-
3
Chapter 11
REVIEW OF LITERATURE
Brassica species have received much attention by a large number researcher on various aspects
of its production and utilization. Many smdics on the variability, interrelationship, path co-
efficient analysis, heritability and genetic advance have been carried out in many countries of the
world. Therefore, it is the subject of the present research work to review the important research
work relevant to the present study, which are stated below-
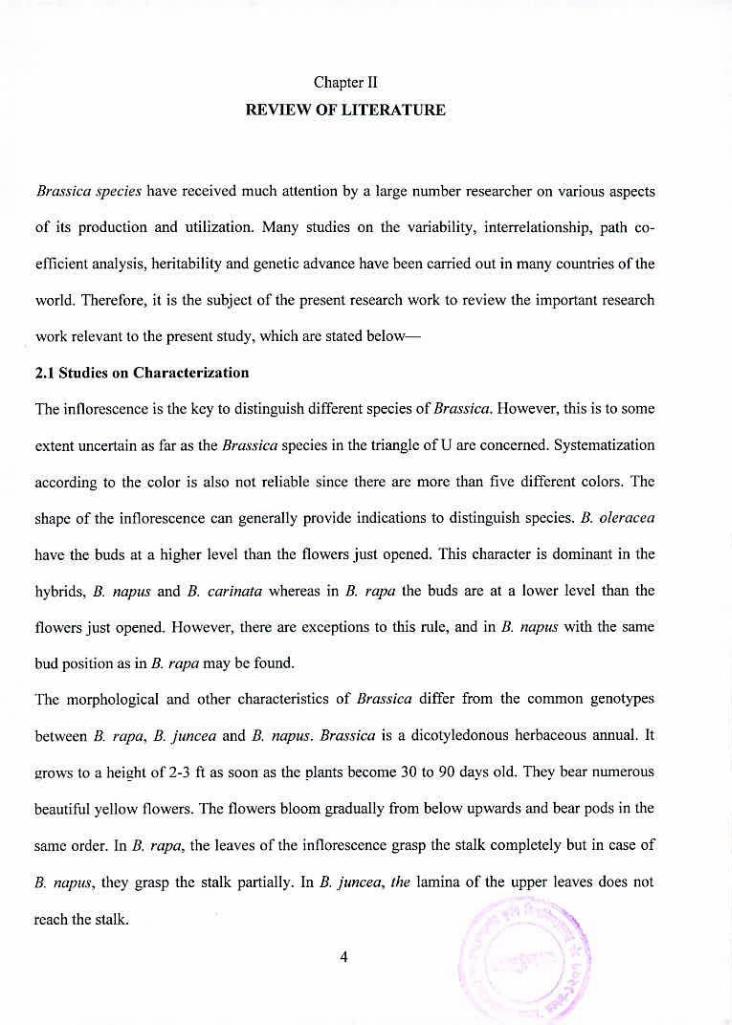
2.1 Studies on Characterization
The inilorescence is the key to distinguish different species of Brassica. However, this is to some
extent uncertain as far as the Brassica species in the triangle of U are concerned. Systematization
according to the color is also not reliable since there are more than five different colors. The
shape of the inflorescence can generally provide indications to distinguish species. B. oleracea
have the buds at a higher level than the flowers just opened. This character is dominant in the
hybrids. B. napus and B. carinata whereas in B. rapa the buds are at a lower level than the
flowers just opened. 1-lowever. (here are exceptions to this nile, and in B. napus with the sante
bud position as in B. rapa may be found.
The morphological and other characteristics of Brassica differ from the common genotypes
between B. rapa. B. juncea and B. izapits. Brassica is a dicotyledonous herbaceous annual. It
urows to a heiL'ht of' 2-3 ft as soon as the plants become 30 to 90 days old. They hear numerous
beataiful yellow flowers. The flowers bloom gradually from below upwards and bear pods in the
same order. In B. rapa, the leaves of the iniloreseence grasp the stalk completely but in case of
B. napu.s, they grasp the stalk partially. In B. Juncea, the lamina of the upper leaves does not
reach the stalk.
4
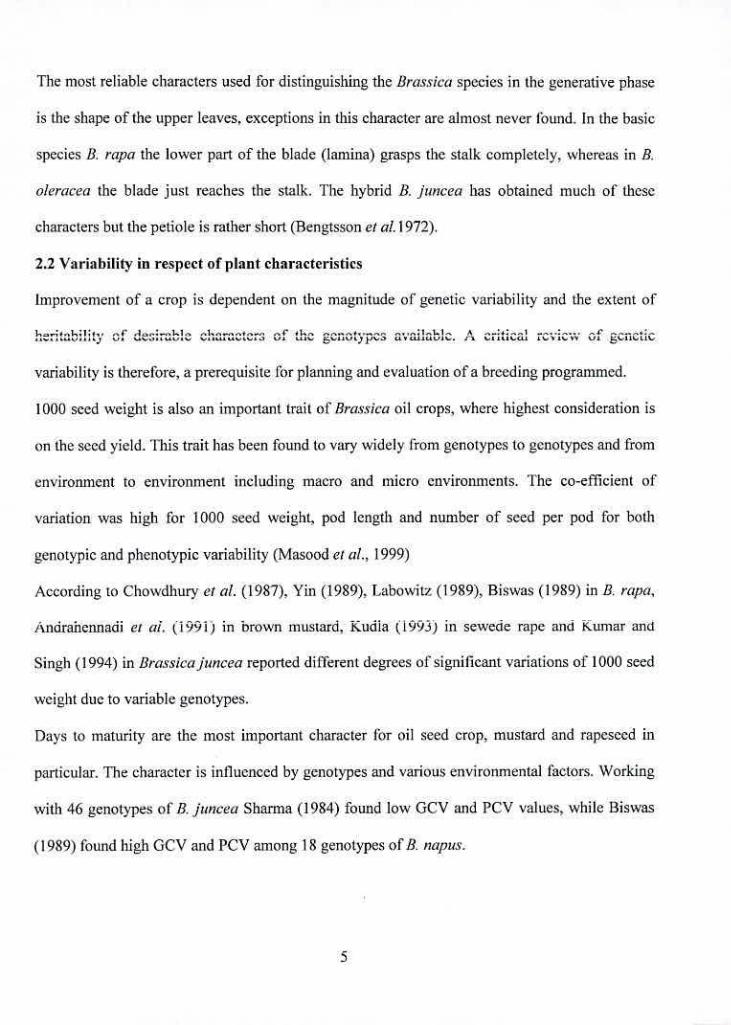
The most reliable characters used for distinguishing the Brassica species in the generative phase
is the shape of the upper leaves, exceptions in this character are almost never found. In the basic
species B. rapa the lower part of the bladc (lantina) grasps the stalk completely, whereas in B.
oicracc'a the blade just reaches the stalk. The hybrid B. juncea has obtained much of these
characters but the petiole is rather short (Bengtsson ci aL 1972).
2.2 Variability in respect of plant characteristics
Improvement of a crop is dependent on the magnitude of genetic variability and the extent of
...f11^
A ..:.-...
Ifl)
,. .5 1S t4L S'""'J fJ¼.aVC*iSU¼,. I .I Lt4tL S S VY '/2 4ILI
variability is therefore, a prerequisite lhr planning and evaluation of a breeding programmed.
1000 seed weight is also an important trait of Brassica oil crops., where highest consideration is
on the seed yield. This trait has been found to vary widely from genotypes to genotypes and from
environment to environment including macro and micro environments. The co-efficient of
variation was high for 1000 seed weight, pod length and number of seed per pod for both
genotypie and phenotypic variability (Masood etal., 1999)
According to Chowdhury ci al. (1987), Yin (1989). i,abowitz (1989), Biswas (1989) in B. rapa.
/ndrahennadi ci al. (1991) in brown mustard, Kudia (1993) in sewede rape and Kuniar and
Singh (1994) in Brassicajuncea reported different degrees of signilieant variations of 1000 seed
weight due to variable genotypes.
Days to maturity are the most important character 14w oil seed crop, mustard and rapeseed in
particular. The character is influenced by genotypes and various environmental ictors. Vorking
with 46 genotypes ci' B. juncea Sharma (1984) found low GCV and PCV values, while Biswas
(1989) found high GCV and PCV among 18 genotypes of B. napus.
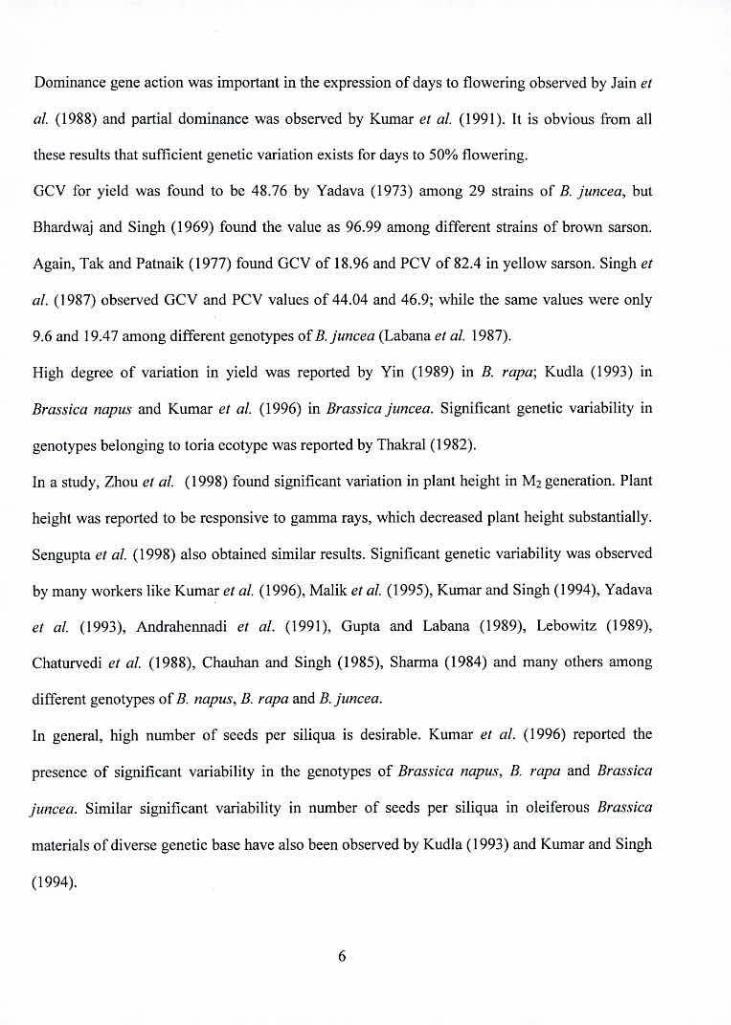
Dominance gene action was important in the expression of days to flowering observed by Jain es
al. (1988) and partial dominance was observed by Kumar et al. (1991). It is obvious &om all
these results that sufficient genetic variation exists for days to 50% flowering.
GCV for yield was found to be 48.76 by Yadava (1973) among 29 strains of B. juncea. but
Bhardwaj and Singh (1969) found the value as 96.99 among different strains of brown sarson.
Again, Tak and Patnaik (1977) found GCV of 18.96 and PCV of 82.4 in yellow sarson. Singh et
at. (1987) observed GCV and PC\' values of 44.04 and 46.9; while the same values were only
9.6 and 19.47 among different genotypes of B. juncea (Labana ci at 1987).
High degree of variation in yield was reported by Yin (1989) in R. rapa; Kudla (1993) in
Brassica napus and Kumar ci at (1996) in J3rassicajuncea. Signilicant genetic variability in
genotypes belonging to toria ecotype was reported by Thakral (1982).
In a study, Zhou ci at (1998) found significant variation in plant height in M2 generation. Plant
height was reported to he responsive to gamma rays, which decreased plant height substantially.
Sengupta ci at (1998) also obtained similar results. Significant genetic variability was observed
by many workers like Kumar ci at (1996). Malik et at (1995). Kumar and Singh (1994), Yadava
ci al. (1993). Andrahennadi ci ci. (1991). Gupta and Labana (1989), Lebowitz (1989),
Chaturvedi ci at (1988). Chauhan and Singh (1985), Shanna (1984) and many others among
different genotypes of B. izapus. B. rapa and B.juncca.
in general, high number of seeds per siliqua is desirable. Kumar ci at (1996) reported the
presence of significant variability in the genotypes of Brassica napux, B. rapa and Brassica
juncea. Similar significant variability in number of seeds per siliqua in oleitèrous Brassica
materials of diverse genetic base have also been observed by Kudla (1993) and Kumar and Singh
(1994).
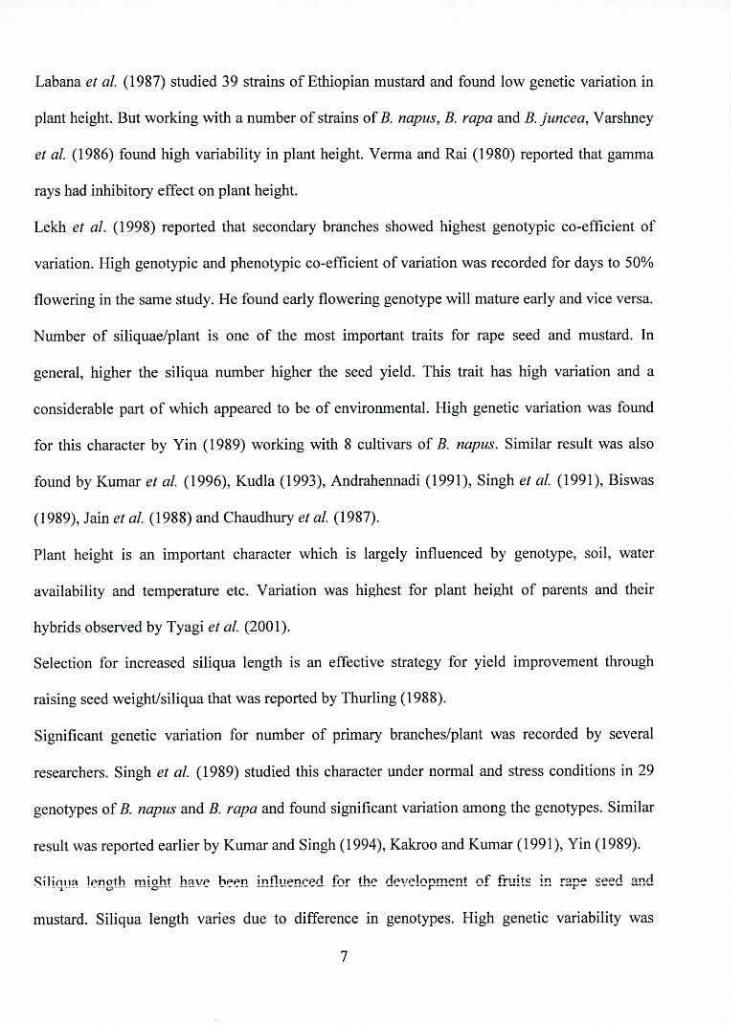
Labana et at (1987) studied 39 strains of Ethiopian mustard and found low genetic variation in
plant height. But working with a number of strains of B. napus, B. rapa and B. juncea, Varsimey
ci al. (1986) found high variability in plant height. Verma and Rai (1980) reported that gamma
rays had inhibitory effect on plant height.
Lekh ci al. (1998) reported that secondary branches showed highest genotvpic co-el heient of
variation. I ugh genotypic and phenotypic co-efficient of variation was recorded for days to 50%
flowering in the same study. He found early flowering genotype will mature early and vice versa.
Number of siliquae/plant is one of the most important traits for rape seed and mustard. In
general, higher the siliqua number higher the seed yield. This trait has high variation and a
considerable part of which appeared to be of environmental. I ugh genetic variation was found
for this character by Yin (1989) working with $ cultivars of B. napus. Similar result was also
found by Kumar ci at (1996), Kudla (1993). Andrahennadi (1991). Singh ci at (1991), Biswas
(1989). Jain ci at (1988) and Chaudhurv ei at (1987).
Plant height is an important character which is largely influenced by genotype, soil, water
availability and temperature etc. Variation was highest for plant height of parents and their
hybrids observed by Tyagi ci at (2001).
Selection for increased siliqua length is an effective strategy for yield improvement through
raising seed weightisiliqua that was reported by Thurting (1988).
Significant genetic variation for number of primary branches/plant was recorded by several
researchers. Singh et at (1989) sitidied this character under normal and stress conditions in 29
genotypes of B. napus and B. rapci and found significant variation among the genotypes. Similar
result was reported earlier by Kumar and Singh (1994), Kakroo and Kumar (1991), Yin (1989).
Siliniva lenc,tli mioht hnve heen infl,inrM (hr the ,levolnnmrnt nf fri,itc in ron .:i.1I nn,l -C ............... - . .-
mustard. Siliqua length varies due to difference in genotypes. High genetic variability was
7
observed by Olsson (1990) in this character. Lehowitz (1989) studied B. rapa population for
siliqua length and found similar results.
Singh ci at (1991) studied different morpho-physiological characters of 29 genotypes of B.
napus and B. rapz. They found significant genetic variability in days to 50% flowering.
Working on genetic variability, heritability and genetic advance of seed yield and its components
in Indian mustard Katiyar ci all (1974) reported that high genetic co-efficients of variation were
observed for seed yield/plant. days to first flowering and plant height, whereas low values were
observed for other characters like days to maturity and number of primary branches.
2.3 Studies on heritability and genetic advance
The heritability variation can he estimated with greater degree of accuracy when heritability in
conjunction with genetic advance as percentage of mean (genetic gain) is studied. Johnson ci al.
(1955) suggested the necessity of estimating genetic advance along with heritability in orders to
draw a more reliable conclusion in a selection programme.
Chowdhury (1970) studied variability and correlations in some varieties of brown sarson and
reported high heritability was associated with high pod length. number of seeds per siliqua and
1000 seed weight.
Heritability in the broad sense and genetic advance were high for plant height and maturity
among the nine characters studied in 29 varieties Brassica sp. (Yadava, 1973).
Iligh heritability with high genetic advance for flowering time, number of primary
branches/plant and plant height was observed by Wan and flu (1983). Low heritability of yield
was reported by many researches like Malik ci all (1995). Kumar c/aL (1988), Li ci at (1989),
etc. But Singh (1986) found high heritability for this trait. Low to medium heritability of siliqua
length was observed by Kakroo and Kumar (1991). Sharma (1997) and Yadava cecil. (1996).
In a study of 46 genotypes of B. juncea, Sharma (1984) observed high heritability for plant
height. days to flowering and low heritability for days to maturity. 1k also found low genetic
advance for days to maturity and high genetic advance for yield/plant. In another study of 179
genotypes of Indian mustard Singh ci al. (1987) observed high heritability for yield/plant and
low heritability for number of primary braneheslplaflt.
Katiyar ci at (1974) studied heritability and expected genetic advance in some varieties of
Indian mustard B. juncea (L) Czern and Coss. Heritability value were high for yield per plant,
plant height , days to first flowering and number of primary branches, moderate for the days to
maturity but low for the number of secondary branches. High genetic advance was found for
plant height. days to first flowering and yield per plant, where as low value was observed for
number of primary branches.
Singh (1986) studied 22 genotypes of B. napus. B. rape: and B. juncea and observed high
heritability and genetic advance in seed yield. 1000 seed weight and number of seeds/siliqua.
Vershney et al. (1986) found high heritability and high genetic advance for plant height in all
three species; but high heritability and genetic advance were found for number of siliquae/plant
only in B. rapa and in B. juncea. He reported high heritability and genetic advance in seed yield.
1000 seed weight and number of seeds/siliqua in B. napux.
\Vorking with 104 mutants of Indian mustard in B. juncea (Linn.) Czern and Coss Tabana ci at
(1980) found that plant height and number of seeds/siliqua were highly heritable where as siliqua
length, number of primary branches/plant and seed yield per plant were less heritable. The yield
variation is thus principally pouring to the environmental influence, for which selection would
not be more practicable for plant height and number of seeds/siliqua. This confirmed the finding
of Chaudhari and Prasad (1968). In the same experiment the GA was highest for plant height
followed by number of seeds/siliqua and seed yield/plant.
9
Working with 30 varieties of B. rapa, Chandola ci al. (1977) found high genetic advance for
plant height. Paul ci aL (1976) observed in his study that a good genetic advance was expected
front a selection index comprising seed yield, number of seeds/siliqua, number of siliquae/plant
and number of primary branches/plant.
\Vorking with different strains of B. napux Malik ci al. (1995) observed very high broad sense
heritability (h2b >90%) for number of primary branches per plant and days to 50% flowering and
low heritability (h2b=<50%) for number of siliqua/plant, number of seeds/siliqua, plant height
and seed yield. But Singh etal. (1991) found high heritability tbr all these character studied with
B. napus. Li ci al. (1989) also observed similar results in studied with B. napus.
Yadava ci al. (1996) studied 34 diallel analysis (excluding reciprocals). They found that both
additive and dominance genetic component were important for seed yield and yield cnmpnnenr
in B. rapcz var. toria. They reported higher heritability for days to maturity and 1000 seed weight.
2.4 Studies on Character Association
Correlation coefficients among different characters are important in breeding programme. Many
workers have reported their studies on correlation among characters of Brassica sp. Some of this
inlbrmation is reviewed here.
1000 seed weight was Ibund to positively associate with days to 50% flowering and days to 80%
maturity by Yadava ci al. (1978) and Chowdhury ci al. (1987) in B. juncea but Shivahare et al.
..,,I eI001\t.-....-..4...,.....2. ........ KI.,.......1..... & - S4èA4 iI t4• \IIJfJ L'JIA¼4 It54• ' , II¼.tL&tJhI. & fl..t4LI V. AJ&& ¼4tL&VII VI I iJtFV fl..Aj
weight with plant height, number of primary branches/plant and number of siliquae/plant was
also reported by Chowdhury et al. (1987) and Yadava ci al. (1978). Positive correlation with
flowering time, days to maturity and 1000 seed weight was observed by Yadava etal. (1978) and
Singh etal. (1987).
10
1000 seed weight was positively and significantly correlated with seed yield/plant and number of
siliquac/plant but negatively and significantly correlated with siliqua length and number of
seeds/siliqua in B. rapa (Nasim cial. 1994).
Days to maturity showed non significant correlation with seed yield both at phenotypic and
genotypie levels. Number of branches/plant and number of siliquac/plant showed significant
negative correlation with number of seeds/siliqua and 1000 seed weight. This indicates
genotypes having high number of branches as well as siliquac reduced the number of
seeds/siliqua and seed size (Malek et at 2000).
In B. rapa Singh etal. (1987), in B. juncea Chowdhury ci al. (1987). Lebowitz (1989) and Lodhi
etal. (1979) reported that the siliqua length was positively correlated with both 1000 seed weight
and number of seedsfsiliqua. (lay and Fhurling (1989) reported the inheritance of siliqua length
among several lines of B. napus and suggested that lines with the longest siliqua gencrally gave
significantly higher yield than those with short siliqua.
In B. juncea seed yield showed significant positive association with number ol primary branches,
number of secondary branches, plant height and days to maturity both at the gcnotypic and
phcnotypic levels (Srivastava etal. 1983).
In rapeseed (B. nqms), positive correlation between yield and yield components were generally
found (Campbell and Kondra. 1978). Ramanujam and Rai (1963) found significant positive
correlations between all the yield components and yield in B. rapci cv. yellow sarson. Similar
results were reported by Zuberi and Ahmcd (1973) for B. rapa cv. toria and by Thurling (1974)
for three B. rapa and three B. nap us cultivars.
Increasing the number of branches is a mean of increasing yield, since the number of primary
and secondary branches have a significant positive correlation with seed yield (Singh c/at 1991;
Kaiiyar and Singh. 1974).
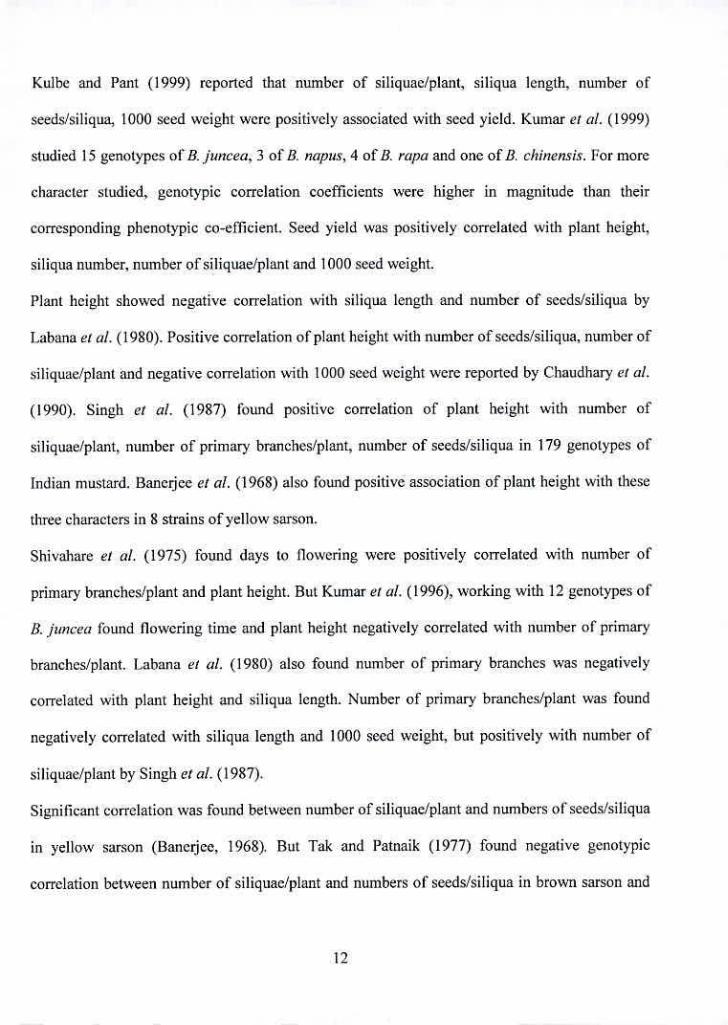
Kulbe and Pant (1999) reported that number of siliquae/plant, siliqua length, number of
seeds/siliqua, 1000 seed weight were positively associated with seed yield. Kumar et aL (1999)
studied 1 5 genotypes of B. juncea, 3 of B. napus. 4 of B. rapa and one of B. chinensis. For more
character studied, genotypic correlation coefficients were higher in magnitude than their
corresponding phenotypic co-efficient. Seed yield was positively correlated with plant height,
siliqua number, number of siliquae/plant and 1000 seed weight.
Plant height showed negative correlation with siliqua length and number of seeds/siliqua by
Labana ci al. (1980). Positive correlation of plant height with number of seeds/siliqua, number of
siliquae/plant and negative correlation with 1000 seed weight were reported by Chaudhary ci al.
(1990). Singh ci al. (1987) found positive correlation of plant height with number of
siliquae/plant, number of primary branches/plant, number of seeds/siliqua in 179 genotypes of
Indian mustard. Banerjee cial. (1968) also found positive association of plant height with these
three characters in 8 strains of yellow sarson.
Shivahare el al. (1975) found days to Ilowering were positively correlated with number of
primary branches/plant and plant height. But Kumar ci al. (1996), working with 12 genotypes of
B. juncea found flowering time and plant height negatively correlated with number of primary
branches/plant. Lahana ci tiL (1980) also found number of primary branches was negatively
correlated with plant height and siliqua length. Number of primary branches/plant was found
negatively correlated with siliqua length and 1000 seed weight, but positively with number of
siliquae/plant by Singh etal. (1987).
Significant correlation was found between number of siliquae/plant and numbers of seeds. ./siliqua
in yellow sarson (l3anerjce, 1968). But Tak and Patnaik (1977) found negative genotypie
correlation between number of siliquae/plant and numbers of seeds/siliqua in brown sarson and
12
toria varieties of B. rapa. On the contrary. Das ci a?. (1984) reported number of siliquae/plant
showed significant and positive correlation with number olseeds/siliqua and 1000 seed weight.
Significant partial correlation of number of secondary and tertiary racernes with seed yield
indicated that branching was an important contributor to yield, independent of its association
with plant size. Plants with high yields were also characterized by early maturity and early
flowering (Thurlinsz and Das. 1980).
Yield is a highly complex and variable character and the genes for yield per seed do not exist
(Gralius. 1959). 1herefore, direct selection for yield is not very effective. In selection for yield,
recourse has then to be made to indirect selection.
2.5 Path co-efficient Analysis
Partitioning the correlation co-efficient into components of direct and indirect effects is
necessary because correlation co-eflicients alone do not give a complete picture of the causal
basis of association. It is established that as the number of contributing characters increased, the
indirect association becomes more complex and important. Under such circumstances, path
coefficient analysis is an effective tool in assigning the direct and indirect effects of different
yield contributing characters.
Character association and path coefficient analysis were used to determine relationships between
growth and yield parameters in 28 lines of yellow and brown sarson (B. rapti) by Saini and
Sharma. 1995. Results revealed that seeds/siliqua and 1000 seed weight had direct positive effect
on yield.
Kumar ci al. (1984); observed negative indirect effect of days to flowering via plant height and
siitqua 'engin on yicw in ThjUflCCa. Singn ci at. cioij; atso rouno negative direct eriect of tncsc
traits, but Dhillon ci al. (1990) observed highest positive direct effect of plant height on seed
yield/plant. Chaudhary ci al. (1990); found. days to 50% flowering and plant height contributed
13
to plant yield indirectly. Shabana ci al. (1990); Found the highest direct effect of number of
sJzic.Iuae'piarn on seed yieid/piaiit.
The restilts of several experiments conducted by Das and Rahrnan (1989) in B. rapc:, Ghosh and
Chatarzcc (1998) in B. juacca, Mishra dot (1987) in B. rapa. Alarn et at (1986) in B. juncea,
Singh et at (1987) in B. juncea. Chen ci cit (1983) in B. napus, Srivastava ci at (1983) in B.
juncea and Yadava ci al. (1 982) in B. rcipa revealed that plant height, days to maturity, 1000
seed weight, siliquae/plant and seeds/siliqua had positive direct effect and indirect effect on
yield. But Varshney (1986), working with several strains of B. rapc: found the negative direct
effect of plant height, siliqua/plant. seeds/siliqua and 1000 seed weight on yield.
While working with 20 genotypes of winter swede rape, Kudla (1993) found that 1000 seed
weight had positive direct effect on yield. Gupta et al. (1987); observed that the direct effect of
primary branching and 1000 seed weight on seed yield.
Working with several strains of B. .hzn'c: Kakroo and Kurnar (1991), found that 1000 seed
weight had positive direct effect, but days to 50% flowering and primary branches had negative
indirect effect via seeds/siliqua on seed yield. But Chauhan and Singh (1985), observed high
positive direct effect of days to 50% flowering, plant height, primary branching, number of
siliquae/plant, number of seeds/siliqua on yield. Kumar ci al. (1988); observed the indirect
positive effect of days to 50% flowering on yield. Again, Han (1990), working with B. izapus,
observed negative direct effect of number of siliquae/plant, siliqua length and positive direct
effect on number of seeds/siliqua and plant height on yield.
2.6 Genetic Divergence
Genetic divergence means the nature and degree of variability existing among the genotypes
under studies, which are measured by range, mean, standard deviation, variance, standard error.
coefficient of variation etc.
14
48 lines among 118 geographically diverse lines of mustard was selected Gupta ci al. (1987)
following preliminary multiple regression analysis. Based on seed yield and components, the
lines were grown into 5 clusters, with no correlation between geographical and genetic diversity.
An investigation was carried out by Sen ci al. (2002) to assess genetic divergence, morphological
and quality attributes in 12 accessions of each of three Brassica species viz; B. juncea, B. napus
and B. carinasa. The inter species variation was higher than inter variety variability. The range of
,nrli,tnn univ kiuhawt ., P i,,nro,. rt-.11.'.n,.'A k, P •tflnifl' •flhl Il ,flP;fl,I,fl -.....-...o..-.J_.. .
Analyzing the data on pod/yield and 12 related traits, Reddy ci al. (1987) found that 20
germplasms of groundnut, investigated for two years divided into six clusters in both the years.
They also observed that genetic diversity was not related to geographical distribution.
Forty four genotypes of toria were evaluated by Mitra and Saini (1998) collected from different
ceo-geographical areas for yield and various components during rabi 1991-92. On the basis of D2
analysis, the 43 genotypes were grouped into 7 clusters. No evidence was obtained for any
correlation between genetic divergence and geographical diversity. Siliqua in the main shoot and
bccdb pet billiqua weic We iiiajur eutiftibulors to genetic divergence.
Islam (1995) studied genetic divergence among 90 genotypes of groundnut using D2 and
principal components analysis and grouped the varieties into 5 clusters. The inter-cluster
distances were larger than the intra-eluster distance suggesting wider genetic diversity among the
genotypes of different bifoups.
Mukivariate analysis using Mahalanobis D2 statistic to group 83 genotypes on the basis of
yield/plant and six other agronomic characters of hunch groundnut by Nadaf ci al. (1986). They
Ibund nine clusters, which were not related to the grouping formed by geographical origin. They
also observed that variation in pod yield accounted for 88% of the total variation between
clusters but number of developed pods, days to 50% flowering and 1000 seed weight were
important in accounting for divergence with clusters.
Nineteen genotypes (crosses and parents) of Indian mustard (B. juncea) grown at Ranchi during
the winter season under rainfed conditions. Genotypes were grouped into 3 cluster based on
analysis was studied by Mahto (1996).
Nineteen genotypes of rape mustard (B. rapcz) were studied by Jagadev et al. (1991) which were
grown during the winter season. They studied different characters and analyzed the variance
using [lie 132
shiiisk. Genotypes were grouped inio S dusters. Seed weight, days to niaturity and
seed yield were the largest contributors to 02 values.
Shanmugam and Rangasarny (1982) observed that the characters yield per plant and pod per
plant contributed considerably towards diversity in black gram. Again the same authors in 1982
assigned 45 genotypes of black gram of ten clusters by analyzing data on yield and nine yield
components using Mahalanobis's D2 statistic and stated that geographical diversity was not the
only factor for determining genetic diversity. The clustering pattern more or less confirmed the
canonical (vector) analysis. They Ibund that yield per plant contributed most too genetic
divergence. Furthermore. Sindhu etal. (1989), investigated diversity in 20 strains of black gram
from different agro-eeological zones of India using Mahalanobis's D 2 statistic. They observed no
parallelism between geographical and genetic diversity.
The clustering and ordination methods used often cannot deal explicitly with the computational
consequences of large data sets with incomplete infomiation. However, it is shown that the
ordination technique of principal component analysis and the mixture maximum likelihood
method of clustering can be employed to achieve such analysis (Harch et ciL 1999). Genotypes
within the cluster are having a smaller D2 value among themselves than those from group
belonging to two different clusters. On the other hand, the inter-cluster distance is the criterion
16
used for selecting genotypes as parent for hybridization. The genotypes those in clusters with
maximum inter cluster distance are genetically more divergent. Variation within the cluster is
measured by inter-cluster distance.
The genetic diversity in rapeseed and mustard using 02 analysis of 42 genotypes was evaliialM
by Islam and Islam (2000). The genotypes were felt into four clusters. The inter-cluster distances
were larger than the intra-cluster distances. The characters contributed maximum in divergence
analysis is days to 50% flowering, plant height, primary branches/plant and number of
siliquae/plant.
Uddin (1994) reported from an experiment on genetic divergence among 34 genotypes of
mustard were estimated using 02 and principal component analysis. The genotypes felt into four
clusters. The inter-cluster distances were larger than the intra-cluster distances suggesting wider
,hO *........ 0'" fl 4) '41 •4 ni j 4O 'JS ¼4I41t4 ' 5 .JL4JJO.
17
Chapter I I I Materials and Methods
3.1 Experimental site
The present research work was carried Out in the experimental farm. Shcr-c-Bzrngla Agricultural
University (SAU), Dhaka during November 2005-March 2006. The location of the site is 23° 74
N latitude and 900 35' U longitude with an elevation of 8.2 meter from sea level.
3.2 Soil and climate
The soil of the experimental plots was clay loam; land was medium high with medium fertility
level. The site was suited in the subtropical climate zone; wet summer and dry winter is the
general climatic feature of' this region. Meteorological data on rainfall, temperature, relative
humidity from January'05 to February'06 were obtained from the Department of Meteorological
centre. Dhaka- 1207. Bangladesh (Appendix I).
3.3 Materials
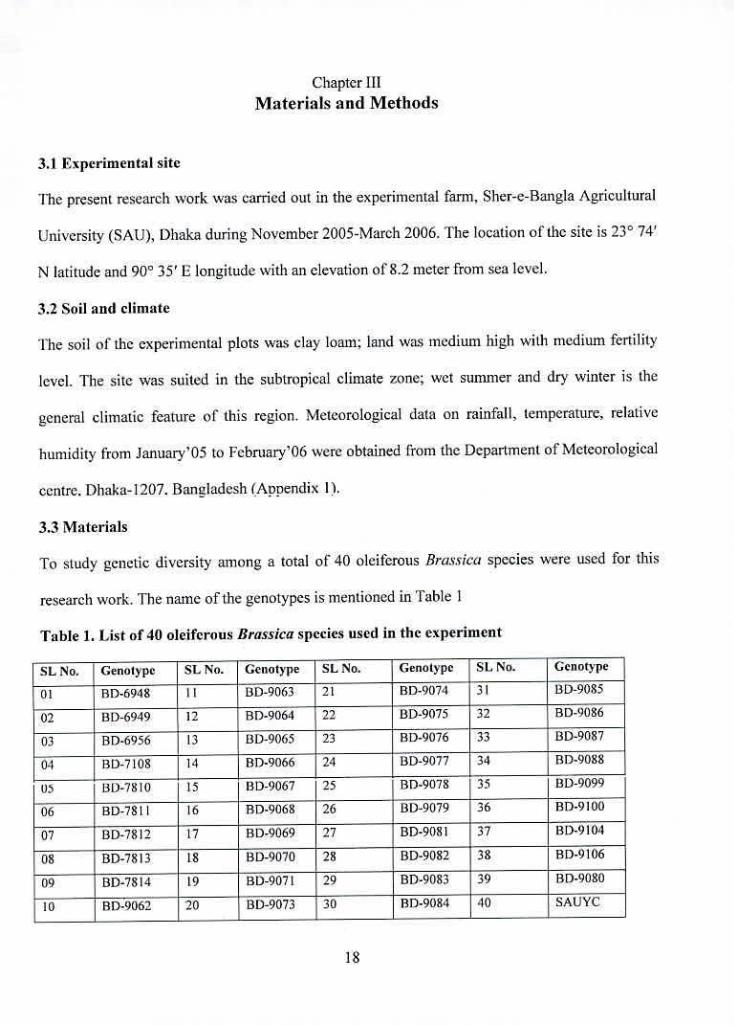
To study genetic diversity among a total of 40 olciferous Rrassica species were used for this
research work. The name of the genotypes is mentioned in Table I
Table 1. List of 40 oleifcrous Brassica species used in the experiment
SL No. (
Genotype SL No. Genotype SL No. Genotype SI No. Genotype
01 80-6948 II üb-9063 21 80-9074 31 130.9085
02 130-6949 12 80-9064 22 80-9075 32 RD-9086
03 RD.6956 13 1313-9065 23 130-9076 33 80-9087
04
05
130-7108
50-7810
14
15
130-9066
130.9067
24
25
t3D-9077
80-9078
34
35
80-9088
1313-9099
OT 80-7811 16 BD-9068 26 t30-9079 36 130-9100
07 f
130-7812 17 BD-9069 27 130-9081 37 130-9104
08 f
BD-7813 18 130-9070 28 BD-9082 38 130.9106
09 130-7814 19 130-9071 29 BD-9083 39 130-9080
1 10 80-9062 20 13D-9073 30 130-9084 40 SAUYC
3.4 Methods
The following methods have been Ibllowed to carry out the experiment:
3.4.1 Land preparation
The experimental plot was prepared by several ploughing and cross ploughing followed by
laddering and harrowing with power tiller and country plough to bring about good tilth. Weeds
and other stubbles were removed carefully from the experimental plot and leveled properly.
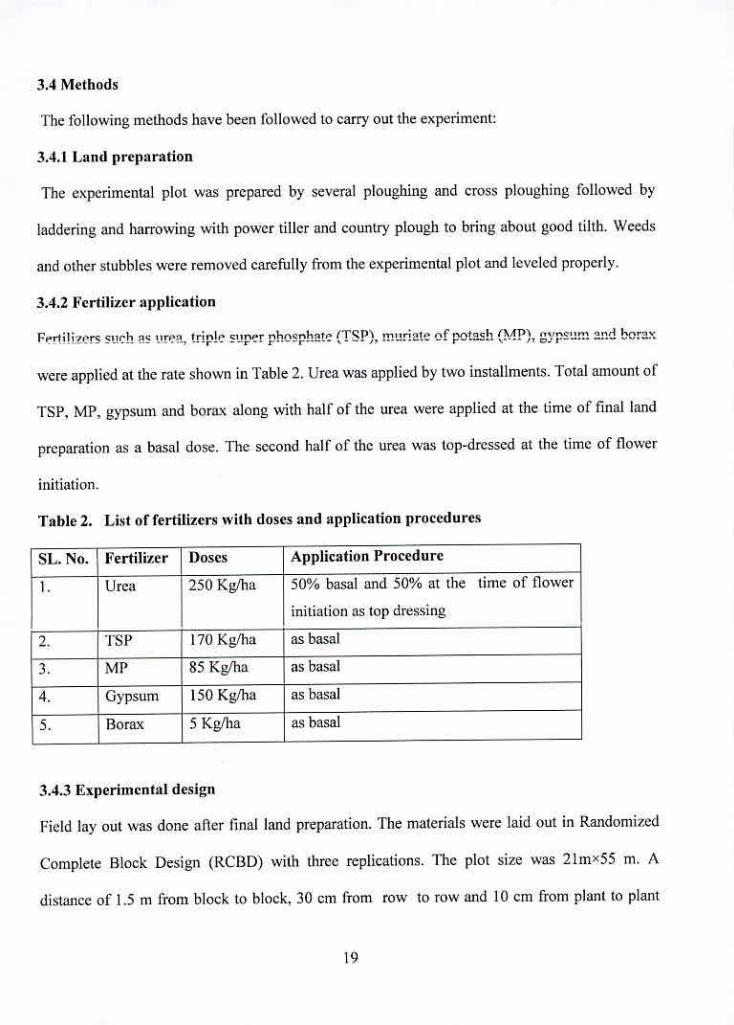
3.4.2 Fertilizer application
Fe,iiTi,r'rc pirli (M"P\ nrpn trifle diner nhn.nhnt,' SP' mi,rinlo nf nntc .,nei.n n ,d knr'iv - --r. .......r------ (T j --r I,
/o -nJ
were applied at the rate shown in Table 2. Urea was applied by two installments. Total amount of
TSP. MP. gypsum and borax along with half of the urea were applied at the time of final land
preparation as a basal dose. The second half of the urea was top-dressed at the time of flower
initiation.
Table 2. List of fertilizers with doses and application procedures
SL. No. Fertilizer Doses Application Procedure
Urea 250 Kg/ha 50% basal and 50% at the time of flower
initiation as top dressing
TSP }170 Kg/ha as basal
MP 85 Kg/ha as basal
Gypsum ISO Kg/ha as basal
Borax 5 Kg/ha as basal
3.4.3 Experimental design
Field lay out was done aller final land preparation. The materials were laid out in Randomized
Complete Block Design (RCI3D) with three replications. The plot size was 21mx55 m. A
distance of 1.5 in from block to block, 30 cm from row to row and 10 cm from plant to plant
19
was maintained. Seeds were sown in tines in the experimental plots on 16 November, 2005. The
seeds were placed at about 1.5 cm depth in the soil.
3.4.4 Intercultural operations
Intercultural operations. such as weeding, thinning, irrigation, pest management, etc. were done
uniformly in all the plots. One post sowing irrigation was given by sprinkler after sowing of
seeds to bring proper moisture condition of the soil to ensure uniform germination of the seeds.
A good drainage system was maintained for immediate release of rainwater from the
experimental plot during the growing period. The first weeding was done after 15 days of
sowing. l)uring the same time, thinning was done for maintaining a distance of 10 cm from plant
to plant in rows of 30 cm. apart. Second weeding was done after 35 days of sowing. The crop
was protected from the attack of aphids by spraying Malathion-57 FC@ 2 nil/litre of water. The
genotypes differed widely for days of flowering. The insecticide was applied for the first time
approximately before one week of flower initiation and it was applied for another two times at
an interval of 15 days. To protect the crop from the Alternaria Icaf spot. Rovral-50 \VP was
sprayed at the rate of 2g11 water at 50% flowering stage for the first time and it was again applied
for two times at an interval of 15 days. Both the insecticide and fungicide were applied in the
evening.
3.4.5 Harvesting
Harvesting was started from 15 February, 2006 depending upon the maturity. When 80% of the
plants showed symptoms of maturity i.e. straw colour of siliquae, leaves, stem and desirable seed
colour in the matured siliquae, the crop was assessed to attain maturity. At maturity, ten plants
were selected at random from all lines in each plot. The sample plants were harvested by
uprooting and then they were tagged properly. Data were recorded on different parameters from
these plants.
20
3.4.6 Collection of data
For studying different genetic parameters and inter-relationships ten characters were taken into
consideration.
3.4.7 Methods of data collection
I. Days to 50% flowering: Difference between the date of sowing to the date of 50% flowering
of an entry was counted as days to 50% flowering
Plant height (cm): It was measured in cm. from the base of the plant to the tip of the longest
inflorescenee. Data were taken atier harvesting.
Number of primary branches/plant: The total number of branches arisen from the main
stern of a plant was counted as the number of primary branches per plant.
Number of secondary branches/plant: The total number oihranches arisen from the primary
branch of a plant was counted as the number of secondary branches per plant.
Siliqua length (cm): For this character measurement was taken in cm front the base to the tip
of a siliqua without beak from the five representative siliquac.
Number of siliquac/plant: Total number of siliquac of each plant was counted and
considered as the number of siliquae/plant.
Number of sccds/siliqua: Well filled seeds were counted from five representative siliquae,
which was considered as the number of seeds/siliqua.
1000 seeds weight (g): Weight in grams of randomly counted thousand seeds of each entry
was recorded.
Seed yield/plant (g): All the seeds produced by a representative plant was weighed in g and
considered as the seed yieldiplant.
Days to maturity: Number of days required from sowing to siliquac maturity ol R0% plant-,
of each genotype.
21
3.4.8 Statistical analysis
The data were analyzed for different components. Phenotypic and genotypic variance was
estimated by Ihe Ihnniila iiced by lnhnsnn in a! (1955) Heritability and geneti' advance were
measured using the formula given by Singh and Chaudhary (1985) and Allard (1960). Genotypic
and phenotypic co-efficient of variation were calculated by the formula of Burton (1952). Simple
correlation coefficient was obtained using the Formula suggested by Clarke (1973); Singh and
Chaudhary (1985); and path co-efficient analysis was done following the method outlined by
Dewey and Lu (1959).
i) Estimation of genotypic and phenotypic variances: Genotypic and phenotypic variances
were estimated according to the formula of Johnson etal. (1955).
- 2 MSG-MSE Genotypic variance, b g =
r
Where. MSG = Mean sum of square for genotypes
MSE = Mean sum of square for error, and
r = Number oireplication
Phenotypic variance, 62p = 62g 1-
Where, 6 2 g = Genotypic variance,
= Environmental variance = Mean square of error
ii) Estimation of genotypic and phenotypic co-efficient of variation: Genotypic and
phenotypic co-efficient of variation were calculated by the following formula (Burton, 1952).
óx 100 GCV= ---------------
PCV =
22
Where. ücv = Genotypie co-efficient of variation
PCV = Phenotypic co-efficient of variation
= Genotypic standard deviation
Phenotypic standard deviation
= Population mean
Estimation of heritability: Broad sense heritability was estimated by the lormula suggested
by Singli and Chaudhary (1985).
h21, (%) = ---i- x IOU
Where, 112b = I leritability in broad sense.
628 = Genotypie variance
62,, = Phenotypie variance
Estimation of genetic advance: The following formula was used to estimate the expected
genetic advance for different characters under selection as suggested by Allard (1960).
32g GA= -------
82 ,
Where. GA = Genetic advance
82g = Genotypie variance
= Phenotypie variance
= Phcnotypic standard deviation
K = Selection differential which is equal to 2.06 at 5% selection
intensity
Estimation of genetic advance in percentage of mean: Genetic advance in percentage of
mean was calculated by the following formula given by Comstock and Robinson (1952).
Genetic advance Genetic Advance in percentage of mean
lOO
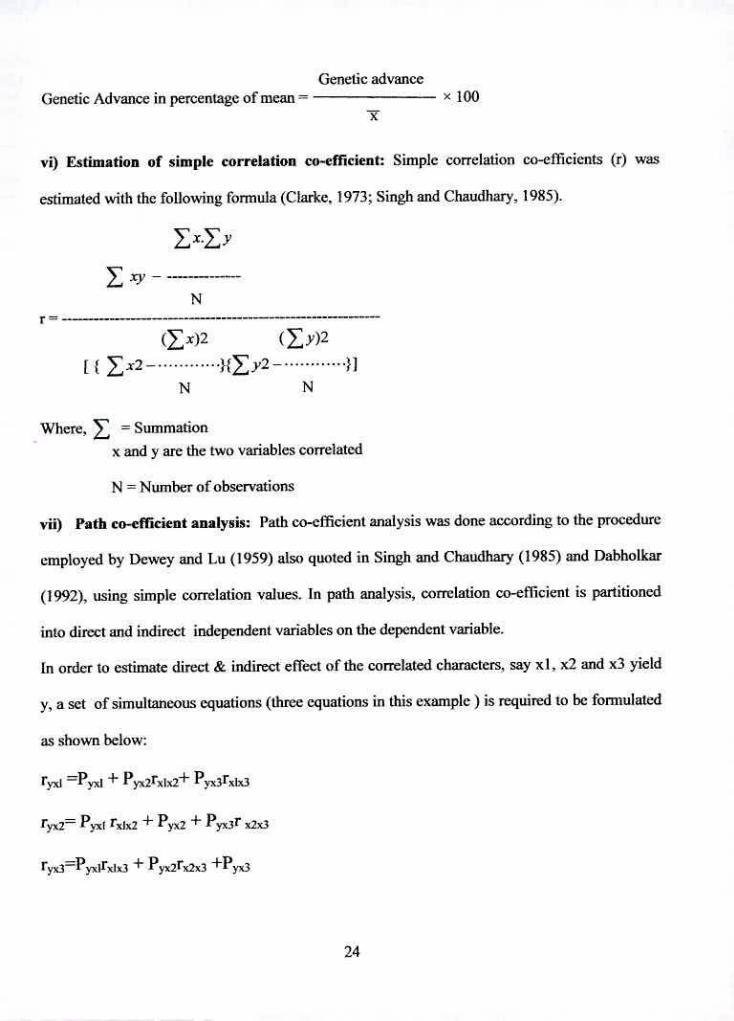
Estimation of simple correlation co-efficient: Simple correlation co-ellicients (r) was
estimated with the following formula (Clarke. 1973; Singh and Chaudhary, 1985).
N ---------
(Ex)2 (y)2
[C E2- H N N
Where. Z = Summation x and y are the two variables correlated
N = Number of observations
Path co-efficient analysis; Path co-efficient analysis was done according to the procedure
employed by Dewey and Lu (1959) also quoted in Singh and Chaudhary (1985) and Dabholkar
(1992), using simple correlation values. In path analysis, correlation co-efficient is partitioned
into direct and indirect independent variables on the dependent variable.
In order to estimate direct & indirect effect of the correlated characters, say xl, x2 and x3 yield
a set of simultaneous equations (three equations in this example) is required to be formulated
as shown below:
rd + P, 2r,2+ P3r
r2= P),,([ rXIX2 + P2 + P,., 3r ,
+ Pyx2rx2x3 +P,.,
24
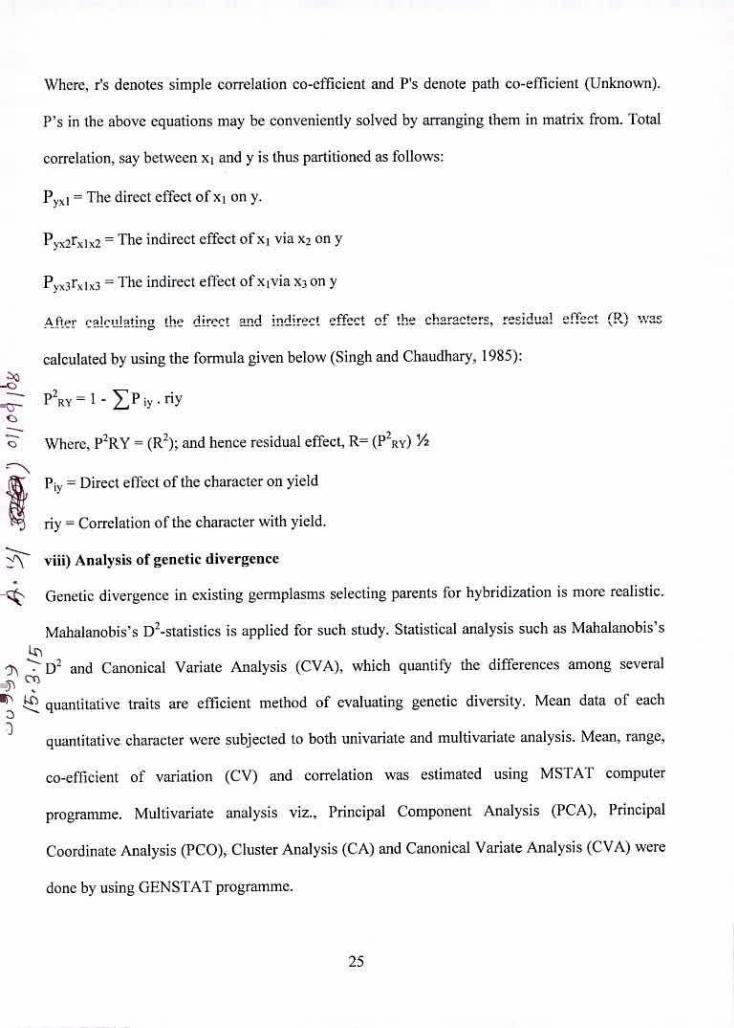
Where, r's denotes simple correlation co-efficient and P's denote path co-efficient (Unknown).
P's in the above equations may be conveniently solved by arranging them in matrix from. Total
correlation, say between x1 and y is thus partitioned as follows:
= The direct effect oIx1 on y.
= The indirect effect of x1 via x2 on
= The indirect effect ofx1 via x3 on y
A flpr r-nlrnlnttnq ii,.' ,lirrrr nnA ;n,I;r.ri effert nf dia rhnr,rte'rc ,•crl..'l olt,r4 (Ifl C
- ---------- ..-- -----------------------------
calculated by using the formula given below (Singh and Chaudhary. 1985):
-c P2gylPk..riy
Where, P2 RY = (R2); and hence residual effect, R (P2gy) ½
Piv = Direct effect of the character on yield
ny = Correlation of the character with yield.
viii) Analysis of genetic divergence
' Genetic divergence in existing germplasms selecting parents for hybridization is more realistic.
Mahalanohis's D2-statistics is applied for such study. Statistical analysis such as Mahalanobis's
Ln D2 and Canonical Variate Analysis (CVA), which quantify the differences among several
V quantitative traits are efficient method of evaluating genetic diversity. Mean data of each
quantitative character were subjected to both univaniate and multivariate analysis. Mean, range4
co-efficient of variation (CV) and correlation was estimated using MSTNF computer
programme. Multivariate analysis viz., Principal Component Analysis (PCA), Principal
Coordinate Analysis (PCO), Cluster Analysis (CA) and Canonical Variate Analysis (CVA) were
done by using GF.NSTAT programme.
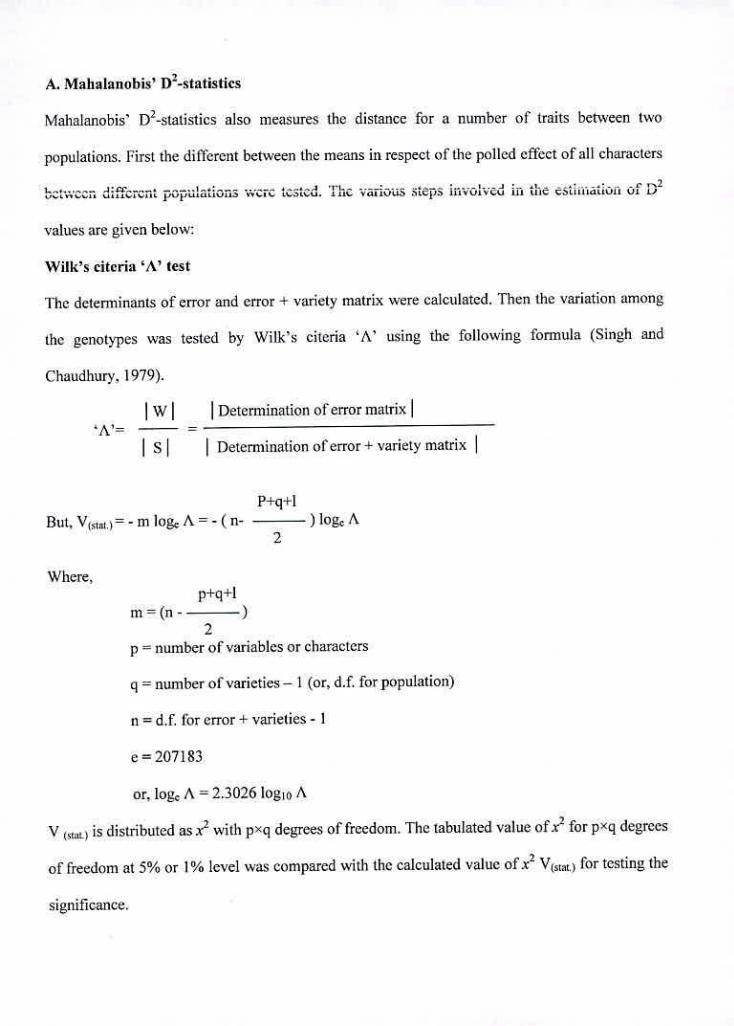
A. Mahalanobis' D2-statisties
Mahalanobis' D2-statistics also measures the distance for a number of traits between two
populations. First the dilThrent between the means in respect of the polled effect of all characters
n, vat IVU.) : . .I -- -----A.- - --- - i - ---2
.L -I --- ..C .1) 'i
.s.vus vCU Ill IIIC CSLii Q l Lc,atLU. S
11 Iit lUll I_il LI
values are given below:
Wilk's citeria 'A' test
The determinants of error and error ± variety matrix were calculated. Then the variation among
the genotypes was tested by Wilk's citeria 'A' using the following formula (Singh and
Chaudhury, 1979).
Determination of error matrix =
I SI
I Determination ol error + variety matrix I
P +q + But. V 521 , = - nt loge A = - ( n- ) loge A
2
Where. p+q±l
) 2
p = number of variables or characters
q = number of varieties - I (or, d.ff for population)
n = d.f. for error + varieties -
e207183
or. 1og A = 2.3026 logw A
V (sit) is distributed as? with pxq degrees of freedom. The tabulated value of? for pxq degrees
of freedom at 5% or 1% level was compared with the calculated value of x2 V($131.) for testing the
significance.
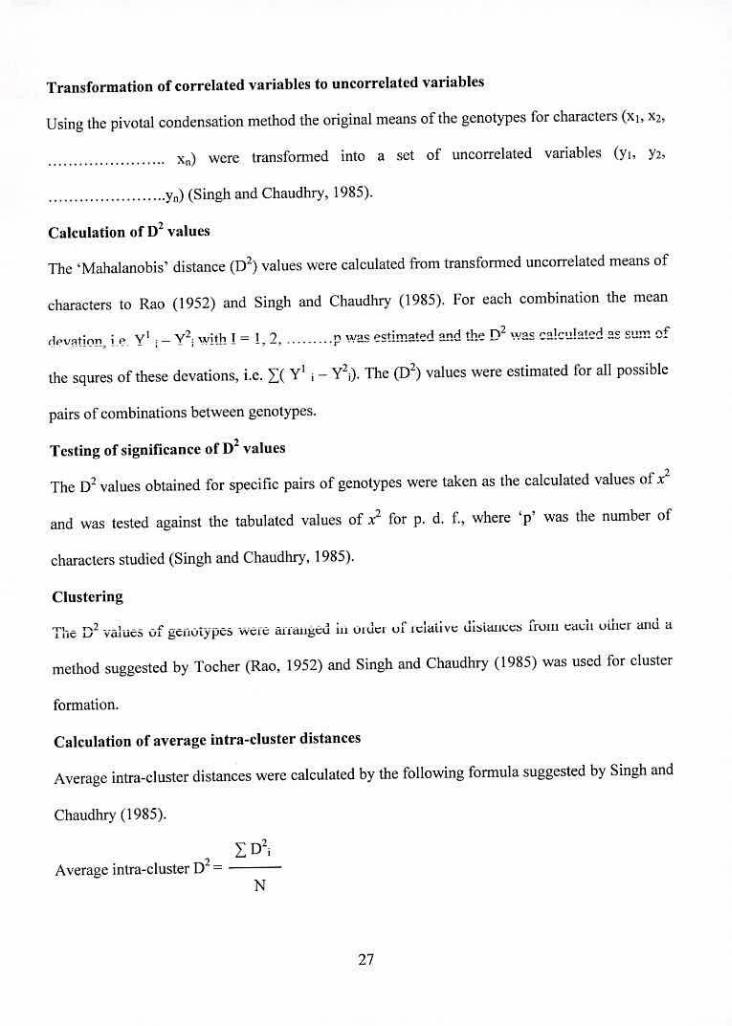
Transformation of correlated variables to uncorrelated variables
Using the pivotal condensation method the original means of the genotypes for characters (x1, xz,
.............. x1) were transformed into a set of uncorrelated variables (yi. Y2.
..............y1) (Singh and Chaudhry, 1985).
Calculation of D2 values
The 'Mahalanobis' distance (132) values were calculated from transformed uncorrelated means of
characters to Rao (1952) and Singh and Chaudhry (1985). For each combination the mean
Irvntinn i p - Y2 with 1 = 1.2..........p was estimated and the I)? was calcu!ated as sum of
the squres of these devations, i.e. >( Y' i - Y21). The (D2) values were estimated for all possible
pairs of combinations between genotypes.
Testing of significance of U2 values
The D2 values obtained for specific pairs of genotypes were taken as the calculated values of x2
and was tested against the tabulated values of x2 for p. d. 1, where p' was the number of
characters studied (Singh and Chaudhry. 1985).
Clustering
'I._ fl2.._l ------------------------------- . I r I . r . 1
I tIC IJ YCIIUCI UI CIIVtypC WCLC aitajicu in ucuel- ut iciative uistunce irum cacti ouler and a
method suggested by Tocher (Rao. 1952) and Singh and Chaudhry (1985) was used for cluster
formation.
Calculation of average intra-duster distances
Average intra-cluster distances were calculated by the following formula suggested by Singh and
Chaudhry (1985).
Average intra-eluster 1)2 =
N
27
Where.
= Sum of distances between all possible combinations (n) of genotypes
included in a cluster
n= Number of all possible combinations between the populations in a cluster.
Calculation of average inter-cluster distances
Average inter-cluster distances were calculated by the following formula suggested by Singh and
Chaudhry (1985).
Average inter-cluster D2 = n,Xn3
Where,
D2 j = Sum of distances between all possible combinations of the populations
in cluster i and]
n— Number of popuiations in duster i
nj= Number of populations in cluster j
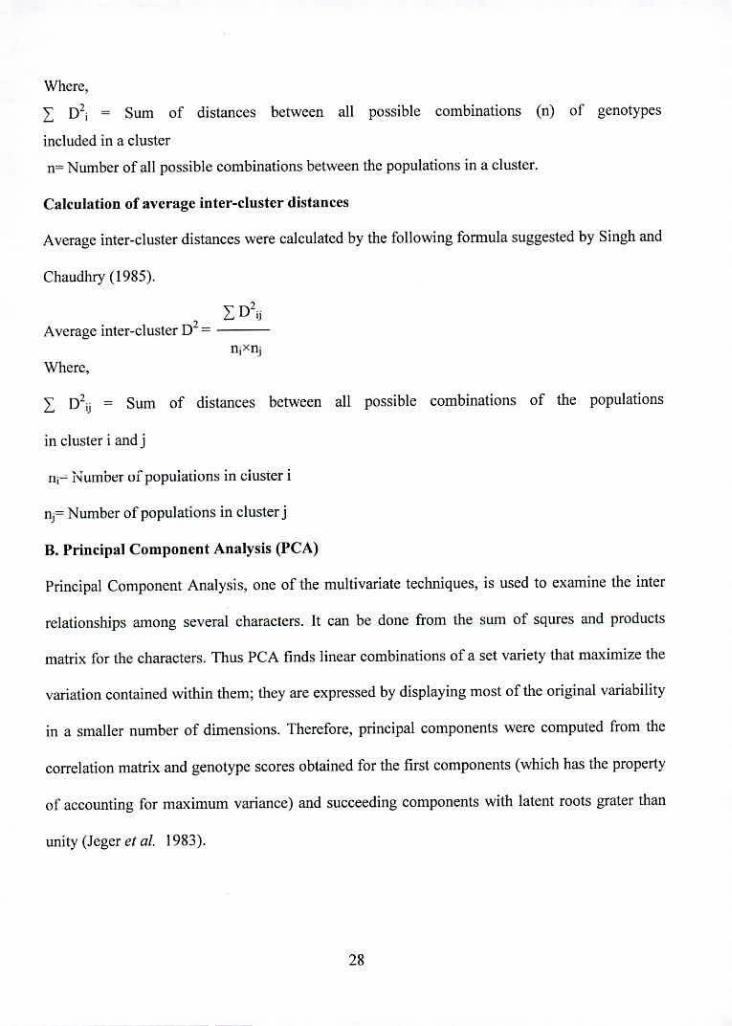
B. Principal Component Analysis (PCA)
Principal Component Analysis. one of the multivariate techniques, is used to examine the inter
relationships among several characters. It can he done from the sum of squres and products
matrix for the characters. Thus PCA finds linear combinations of a set variety that maximize the
variation contained within them; they are expressed by displaying most of the original variability
in a smaller number of dimensions. •l'herefore, principal components were computed from the
correlation matrix and genotype scores obtained for the first components (which has the property
ol accounting for maximum variance) and succeeding components with latent roots grater than
unity (Jeger etal. 1983).
C. Principal Coordinate Analysis (PCO)
Principal Coordinate Analysis is equivalent to PCA but it is used to calculate inter unit distances.
Through the use of all dimensions of? it gives the minimum distance between each pair of the N
points using similarity matrix (Digby et at 1989).
U. Canonical Variate Analysis (CVA)
Canonical Variate Analysis, complementary to U2 statistic, is a sort of niultivariate analysis
where canonical vectors and roots representing different axes of differentiation and the amount
of variation accounted for by each of such axes respectively and derived. Canonical Variate
Analysis computed linear combination o( original variability that maximized the ratio between
ground and within variations, thereby giving functions of the original variables that coutd he
used to discriminate between the groups. Thus in this analysis, a series of orthogonal
transformation was done sequentially for maximizing the ratio of the groups to within group
variations.
29
Chapter IV
RESULTS AND DISCUSSIONS
4.1 Characterization
In this experiment, all of the genotypes were categorized on the basis of the morphological
characteristics of the species Brassica rapa. B. juncea and B. napus. Among the 40 gcrmplasms.
19 gemiplasms were categorized as B. rapa, IS gerrnplasms B. napus and rest 6 gcrmplasms B.
juncea (Table 3).
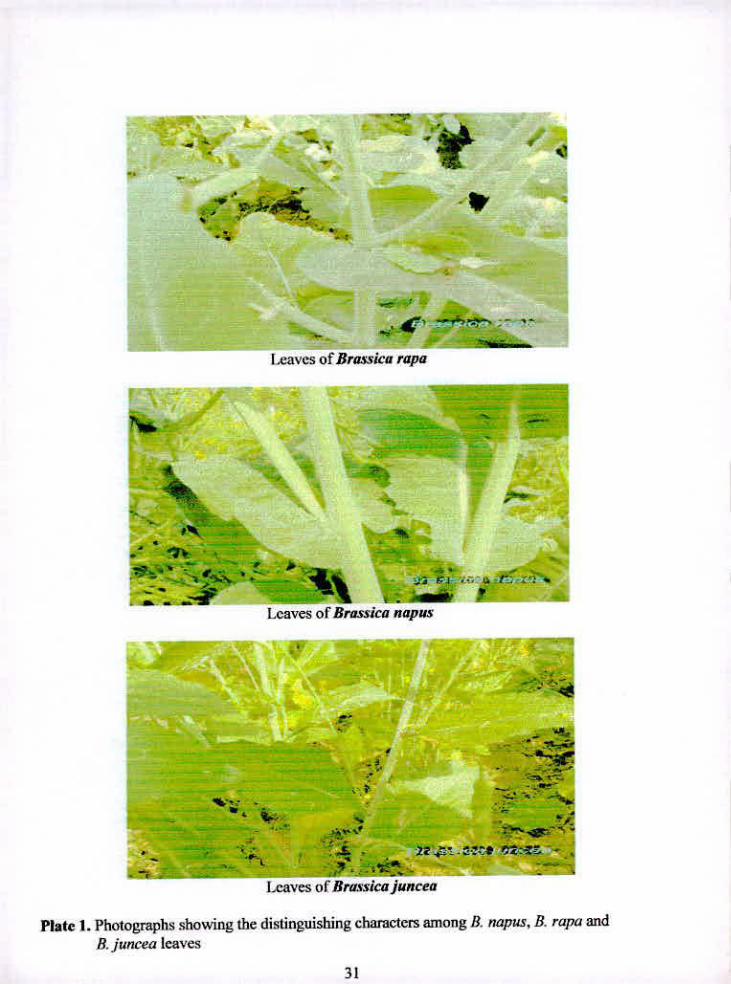
The inflorescence was the key to distinguish different species of Brassica. The shape of the
intlorescence can generally be provided indications to distinguish species. B. oleracea had the
buds at a higher level than the flowers just opened. This character was dominant in the hybrids.
B. napus and B. carinata whereas in B. rapa the buds were at a lower level than the flowers just
opened. However, there were exceptions to this rule, and in B. napus with the same bud position
as in B. rapa might be found.
The morphological and other characteristics of Brassica differ from the common genotypes
between B. rapa, B. jw:cea and B. napus. Brassica was a dicotyledonous herhaceous annual. It
grew to a height of 2-3 Ii as soon as the plants became 30 to 90 days old. They bore numerous
beautiful yellow flowers. The flowers bloomed gradually from below upwards and bore pods in
the same order. In B. rapa, the leaves of the infloreseenee grasped the stalk completely but in
case of B. napus, they grasped the stalk partially. In B. juncea the lamina of the tipper leaves did
not reach the stalk.
The most reliable characters used for distinguishing the Brassica species in the generative phase
was the shape of the tipper leaves, exceptions in this character were almost never found. In the
species B. rapa the lower part of the blade (lamina) grasped the stalk completely, whereas
10
-t i:ty F 03
H- - L - - I.eaves of Brasska rape
_ -
1 -- H -
9'
--%% Leaves of Brassica napus
-
r
\4.. 22 st.•t t)t:t -
* - - --. . I •,,
Leaves of Bra.ssicajuncea
Plate 1. Photographs showing the distinguishing characters among B. napus, B. rapa and B. juncea leaves
31
-.,t.r ia_o. •.r
- - t
- —
- —
41
Inflorescence of B. napes
bm- - Inflorescence of B. jwwea
6rr. -n•.
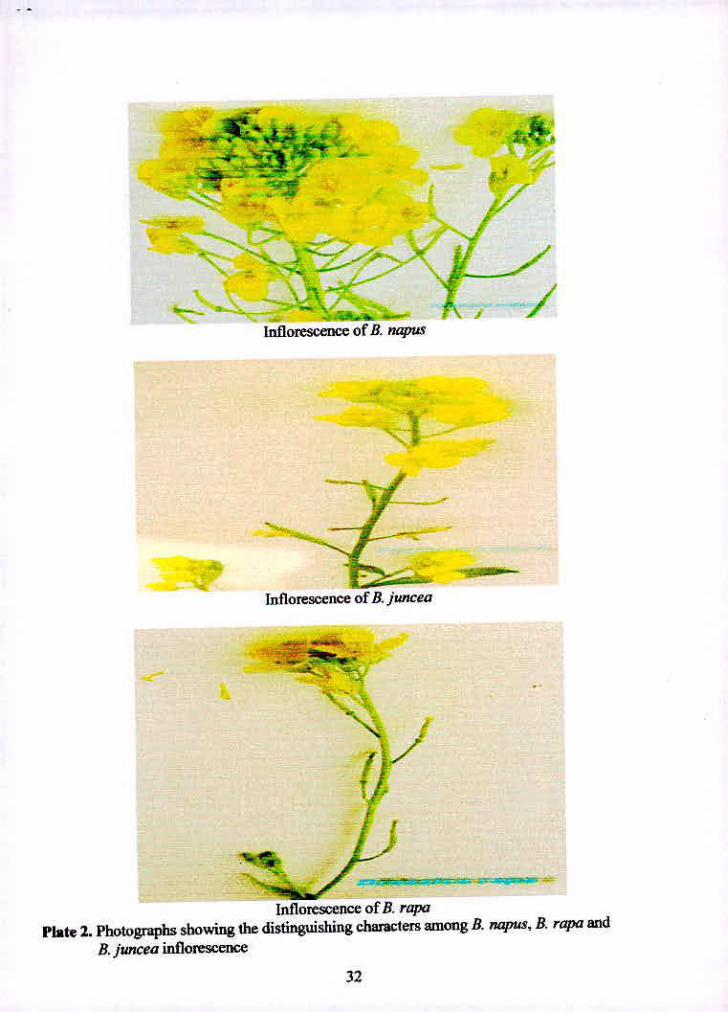
Inflorescence of B. rapa Plate 2. Photographs showing the distinguishing characters among B. napus, B. rapa and
B. juncea inflorescence
32
A11 [1 YIP
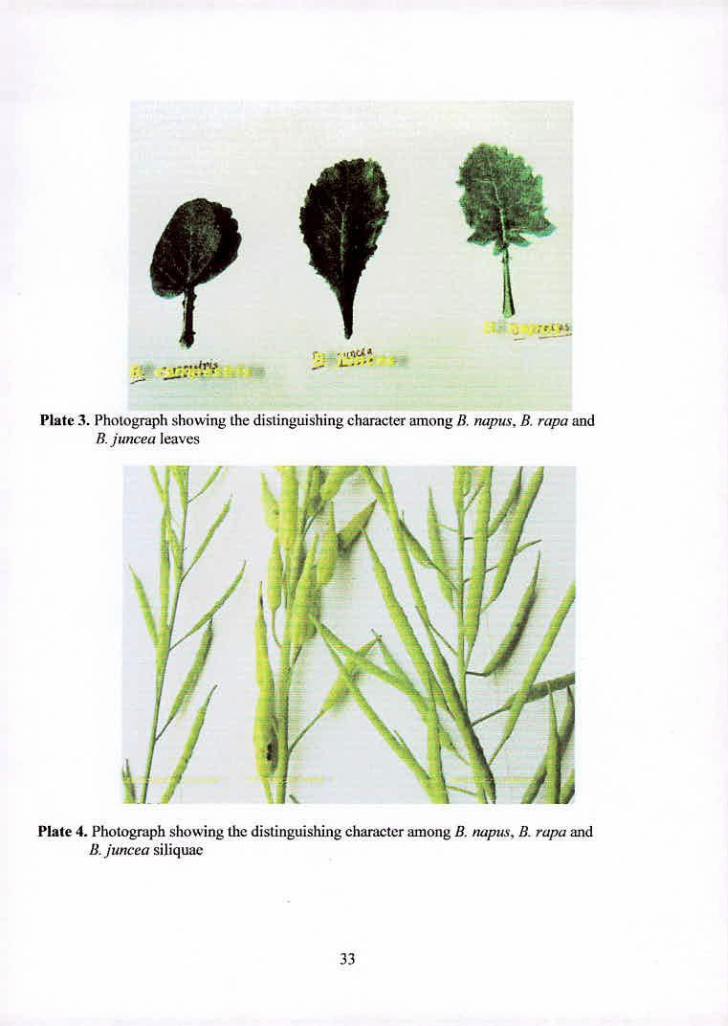
Plate 3. Photograph showing the distinguishing character among B. napus. B. rapa and B. juncea leaves
Plate 4. Photograph showing the distinguishing character among B. napus, B. rapa and B. juncea siliquac
33
in B. oleracea the blade just reached the stalk. The hybrid B. juncea had obtained much of these
characters but the petiole was rather short (Bengtsson el at., 1972).
The flowering habit of B. napsis and B. juncea was such that the open flowers appeared below
the (lower buds but the situation was reversed in case of B. rapa, i.e. the fresh open flowers
appeared above the flower buds. A distinguish characters among B. ncwus.B. rana and B. Juncea
are presented in plate 1. plate 2. plate 3 & plate 4.
Table 3. Genotypes of 40 Brass/ca categorized in B. rapa, B. napus and B. juncea
B. rapa B. napus B. juncea
13D-9062 130-9065 13D-7 108
130-9063 RD-9070 BD-9066 BD-9064 BD-9076 BD-9069 BD-9067 130-9077 BD-9086 RD-9068 13D-9078 BD-9088 130-9071 60-9099 130-6948 130-9073 I BD-9 100 ED-9074 13D-9 104 13D-9075 BD-9 106 JJD-9079 BD-6949 13fl-9080 130-7810 BD-9081 B1)-7811 131)-9082 BD-78 12
130-7813 __ IJD-9084 BD-7814 BD-9085_________________ 00-9087
SItU YC 13D-6956
4.2 Variability and other biometrical studies of Bra.ssica species
Ten characters of Brass/ca sp. such as plant height, number of primary branches/plant, number of
secondary branches/plant, length of siliqua, number of seeds/siliqua, number of siliquac/plant, 1000 seed
weight, yield/plant, days to 50% flowering and days to maturity were studied in 40 germplasms. There
.74
wcic gizifleaxii dilfejeitees aziiwig die iiiaieriak for all We ntorpiio-phygioiogicai traits studied
(Appendix H, Ill. IV and V).
A. Brassica rapti
a. Variability
From the mean value it was found that the tallest plant was SAUYC (100.89 cm) while the
shortest plant was BD-9075 (45.15 cm) in Table 4.
The highest number of primary branches/plant was recorded in SAUYC (10.83) and the lowest
number of primary branches/plant (4.29) was recorded in BD-9075. On the other hand, highest
number of secondary branches/plant (9.2) was recorded in 130-9062 while BD-6956 had no
secondary branches/plant at all.
Length of siliqua was observed highest (3.35cm) and highest number of siliquae/plant (167.71)
was in SAUYC. On the other hand, lowest length of siliqua (2.38cm) and lowest number of
siliquae/plant (26.26) was found in BD-9075. Maximum number of seeds/siliqua (17.34) was
also recorded in SAUYC and the minimum number of secds/siliqua (10.37) was recorded in 130-
9079 followed by BD-9075 (10.67).
Days to 50% flowering was observed late in 110-6956 (40 days) and early in 130-9083 (26 days).
Late maturity (82 days) was observed in BD-9075 and early maturity (72.66 days) was observed
in RD-9085.
Highest 1000 seed weight 3.21g was recorded in BD-9068 while the lowest 1000 seed weight
1.19g was found in 130-9080. Yield/plant 3.49g was recorded highest in SAUYC and the lowest
yield/plant 0.58g was recorded in RD-9080.
35
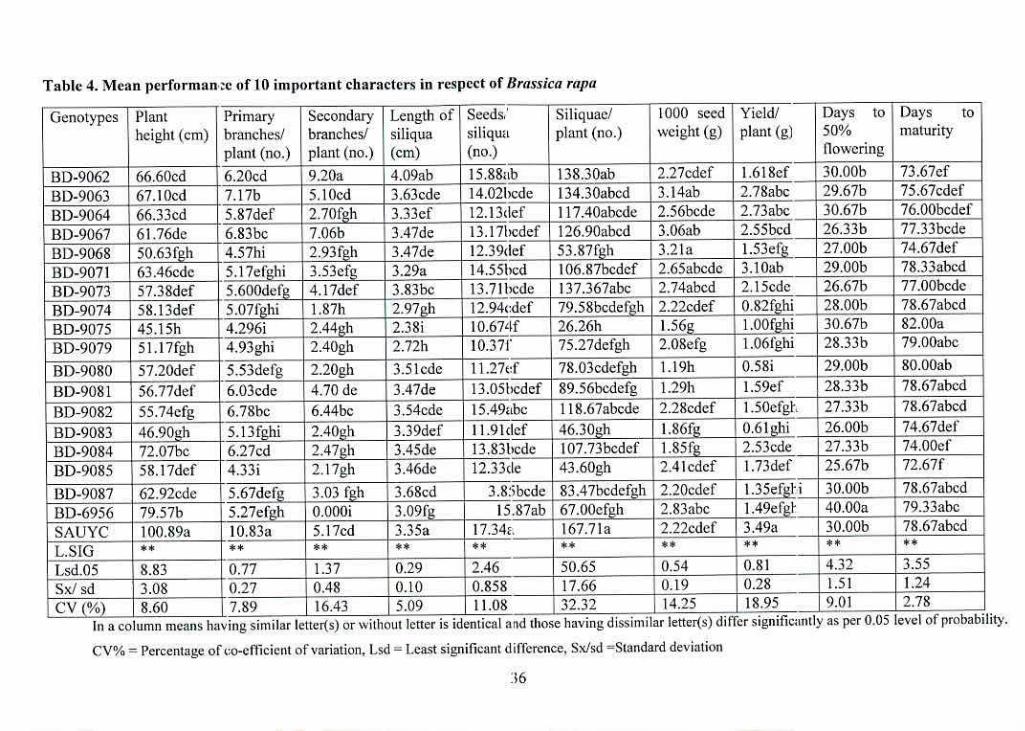
Table 4. Mean performan:e of 10 important characters in respect of !Jrassica rap:
Genotypes Plant height (cm)
Primary branches/
Secondary branchesI
Length ofsiliqua
- ,- siliqua
Siliquae/ plant (no.)
1000 seed weight (g)
Yield/ - plant (g)
Days to 50%
Days to maturity
plant (no.) plant (no.) (cm) (no.) flowering
BD-9062 66.60cd 6.20cd 9.20a 4.09ab 15.88th j138.30th 2.27edef 1.618ef 30.001' 73.67ef
BD-9063 67.1Oed 7.17b 5.1Oed 3.63ede 14.O21)cde 134.30abed 3.14ah 2.78abc - 29.67b 75.67cdeF
13D-9064 66.33cd 5.87def 2.701gb 3.33ef 1 12.I3def I
117.40ahcde 2.56bcde 2.73abc 30.67b 76.00bcdef
IID-9067 61.76dc 6.83bc I 7.06b I 3.47de 13,17hcdef 126.90abcd 3.O6ah 2.55bcd 26.33b 77.33bcde
13D-9068 50.63fgh 4.57h1 I 2.931gb 3.47de I2.39def .87Ig1 3.21a 1.53el'g 27.00b 74.67def_
13D-9071 BD-9073
63.46cde 57.38def
5.i7efg 5.600defg
3.53efg 3.29a 4.I7def 3.83hc I
14.55hcd 13.7 ibcde
106.87hcdef 137.367abc
2.65ahede 2.74abcd
3.10th - 29.00b 2.15ede - 26.67b
78.33ahcd 77.00bcde
BD-9074 58.13def 5.07fghi 1.87h 2.97gb 12.94cdef 79.58bcdefgh 2.22edef 0.82fhi 28.00h 78.67abcd
BD-9075 45.15h 4.296i -. 2.44gb 2.38i ____ 10.674 26.26h 1.56g 1.00fghi 30.67b 82.00a
13D-9079
BD-9080
51.17fgh
57.20def
4.93gh1
5.53defg
2.40gh 2.72h
2.20gb 3.5lcde
10.371
Ii .27cf
efgh
t78.03cdefgh 2.ORefg
1. 19h
L0ófghi 28.33b
0.581 29.00b
79.00ahe
80.00ab
13D-9081 56.77def 6.03cde 4.70 de 3.47de 13.O5hcdef cdefg 1.2% 1.59e1_- 28.33b 78.67abcd
BD-9082 55.74efg 6.78hc 6.44bc 3.54cde 15.49ahc 1 18.b7abcde 2.28edef 1.50cfgP. 27.33h 78.67abcd
BD-9083 13D-9084
46.90gb 5.I3fghi 2.40gb
72.07be 6.27cd 2.47gb 3.39def 3.45de
I I.9ldef 13.83bcdc
4&30gh 107.73bedef
1.86fg 1.S5fg
I 0.61hi_ 26.00b 74.67de1 2.53cde 27.33b 74.00ef
BD-9085 58.17def 4.331 2.17gb 3.46de 12.33de 43.60h 2.41cdef 1.73de1 25.67b - 72.671
13D-9087 BD-6956 SAUYC
6292edc 567ddg 1303 1gb 79.57b 5.27efgh 0.0001 100.89a 10.83a 5.l7ed
368cd 3.09f_ 3.35a
L.S1G
38bcde 15.S7ab
I7.34.
S347hedefgh 67.00efgh 167.71a
22Ocdef 2.83abc 2.22cdef
I35efgi 3000b L4ceigF 40.00a 3.49a - 30.00b
7867ahcd 79.33ahc 78.67abcd
Lsd.05 8.83 0.77 1 1.37 i 0.29 2.46 50.65 0.54 I 0.81 4.32 3.55
Sx/sd 3.08 0.27 1 0.48 1 0.10 0.858 1 17.66 10.19 10.28 11.51 1.24
CV (%) &60 I 7.89 116.43 15.09 11.08 132.32 I_14.25 L8.95 J9.01 _____ 2.78 -
CV% = Percentage of co-efficient of variation. Lsd l.east significant difference, Sx/sd =Standard deviation
lnacolumn means having similar letter(s) or without letter is identical and those having disshnilar letter(s) differ significantly as per 0.05 level of probability.
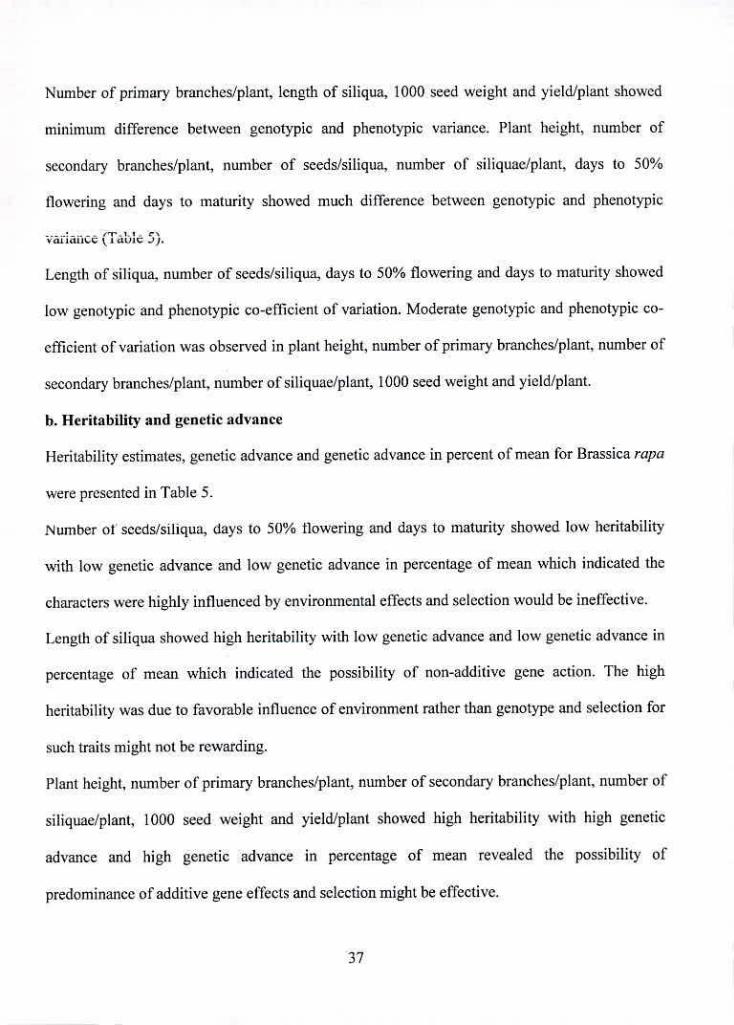
Number of primary branches/plant, length of siliqua, 1000 seed weight and yield/plant showed
minimum difference between genotypic and phenotypic variance. Plant height, number of
secondary branches/plant, number of seeds/siliqua, number of siliquac/plant, days to 50%
flowering and days to maturity showed much difference between genotypic and phenotypic ---
vat 1dhIC IclijiC J).
Length of siliqua. number of seeds/siliqua, days to 50% flowering and days to maturity showed
low genotypic and phenotypic co-efficient of variation. Moderate genotypic and phenotypic co-
efficient of variation was observed in plant height, number of primary branches/plant, number of
secondary branches/plant. number of siliquae/plant, 1000 seed weight and yield/plant.
b. Heritability and genetic advance
Heritability estimates, genetic advance and genetic advance in percent of mean for l3rassica rapa
were presented in Table 5.
Number of secds/siliqua, days to 50% flowering and days to maturity showed low heritability
with low genetic advance and low genetic advance in percentage of mean which indicated the
characters were highly influenced by environmental effects and selection would be ineffective.
Length of siliqua showed high heritability with low genetic advance and low genetic advance in
percentage of mean which indicated the possibility of non-additive gene action. The high
heritability was due to favorable influence of environment rather than genotype and selection for
such traits might not be rewarding.
Plain height, number of primary branches/plant, number of secondary branches/plant, number of
siliquae/plant. 1000 seed weight and yield/plant showed high heritability with high genetic
advance and high genetic advance in percentage of mean revealed the possibility of
predominance of additive gene effects and selection might be effective.
37
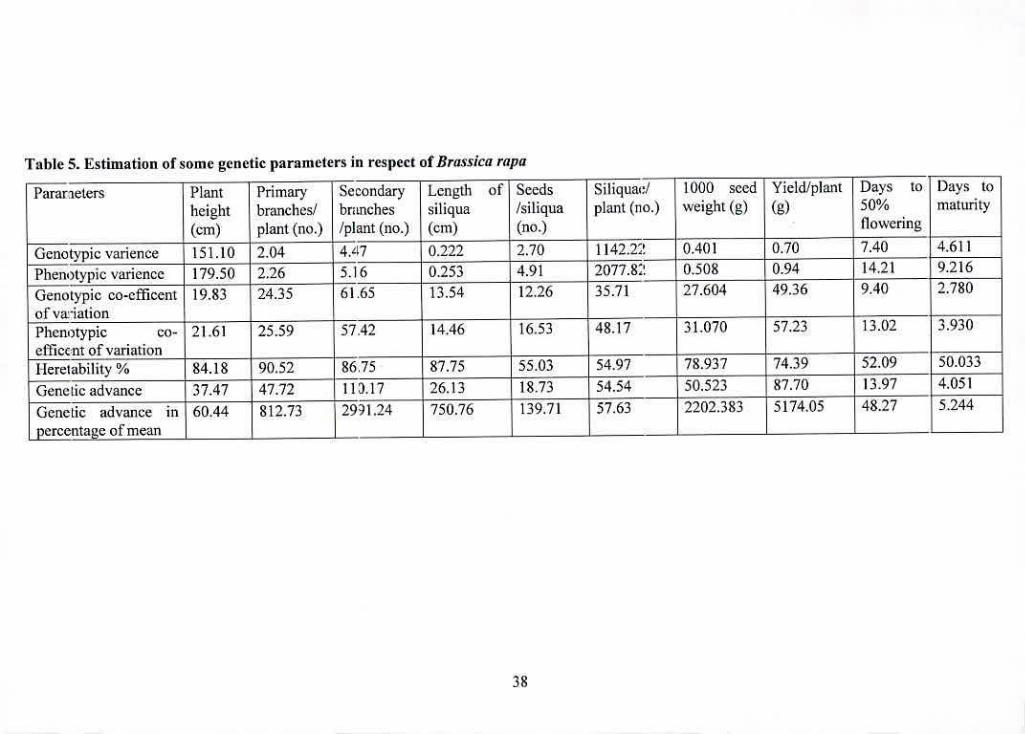
Table S. Estimation of some genetic parameters in respect of Brassica rapa
Paraneters Plant height (em)
Primary branehcs/ plant (no.)
Secondary branches /plant (no.)
Length of!
siliqua (cm)
Seeds /siliqua (no.)
Siliquac/ plant (no.)
1000 seed weight (g)
Yield/plant (g)
Days to 50% flowering
Days to maturity
Genotypic varience 151.10 2.04 447 0.222 2.70 114222. 0.401 0.70 7.40 4.611
Phenotypic varience 179.50 2.26 5.16 0.253 4.91 2077.81 0.508 0.94 14.21 9.216
Genotypie co-effleent of vaHation
19.83 24.35 61.65 13.54 12.26 35.71 27.604 49.36 9.40 2.780
Phenotypic co-
efficcnt of variation
_
21.61 25.59 _______
57.42 14.46 16.53 48.17 31.070 57.23 13.02 3.930
Fleretability % 84.18 ___
90.52 86.75 87.75 55.03 54.97 78.937 74.39 52.09 50.033
Genetic advance 37.47 47.72 119.17 26.13 18.73 54.54 50.523 87.70 13.97 4.051
Genetic advance in ~La e of mean
60.44 812.73 2991.24 750.76 139.71 57.63 2202.383 5174.05 48.27 5.244
38
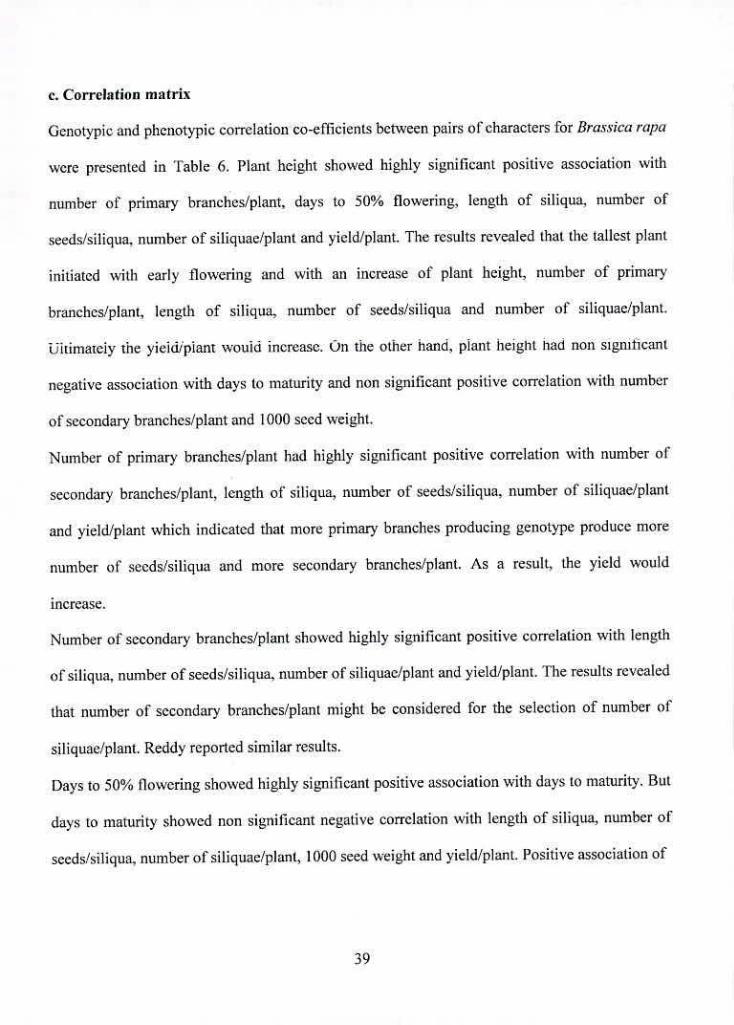
c. Correlation matrix
Genotypic and phenotypic correlation co-efficients between pairs of characters for Brassica rapa
were presented in 'fable 6. Plant height showed highly significant positive association with
number of primary branches/plant, days to 50% flowering, length of siliqua, number of
.seeds/siliqua. number of siliquae/plant and yield/plant. The results revealed that the tallest plant
initiated with early flowering and with an increase of plant height, number of primary
branches/plant, length of siliqua, number of seeds/siliqua and number of siliquae/planL
i5itimaleiy the yield/plant would increase. On the other hand, plant height had non significant
negative association with days to maturity and non significant positive correlation with number
of secondary branches/plant and 1000 seed weight.
Number of primary branches/plant had highly significant positive correlation with number of
secondary branches/plant, length of siliqua, number of seeds/siliqua, number of siliquae/plant
and yield/plant which indicated that more primary branches producing genotype produce more
number of seeds/siliqua and more secondary branches/plant. As a result, the yield would
increase.
Number of secondary branches/plant showed highly significant positive correlation with length
of siliqua, number of seeds/siliqua number of siliquae/plant and yield/plant. The results revealed
that number of secondary branches/plant might be considered for the selection of number of
sil iquae/plant. Reddy reported similar results.
Days to 50% flowering showed highly significant positive association with days to maturity. But
days to maturity showed non significant negative correlation with length of siliqua, number of
seeds/siliqua. number oisiliquae/plant 1000 seed weight and yield/plant. Positive association of
39
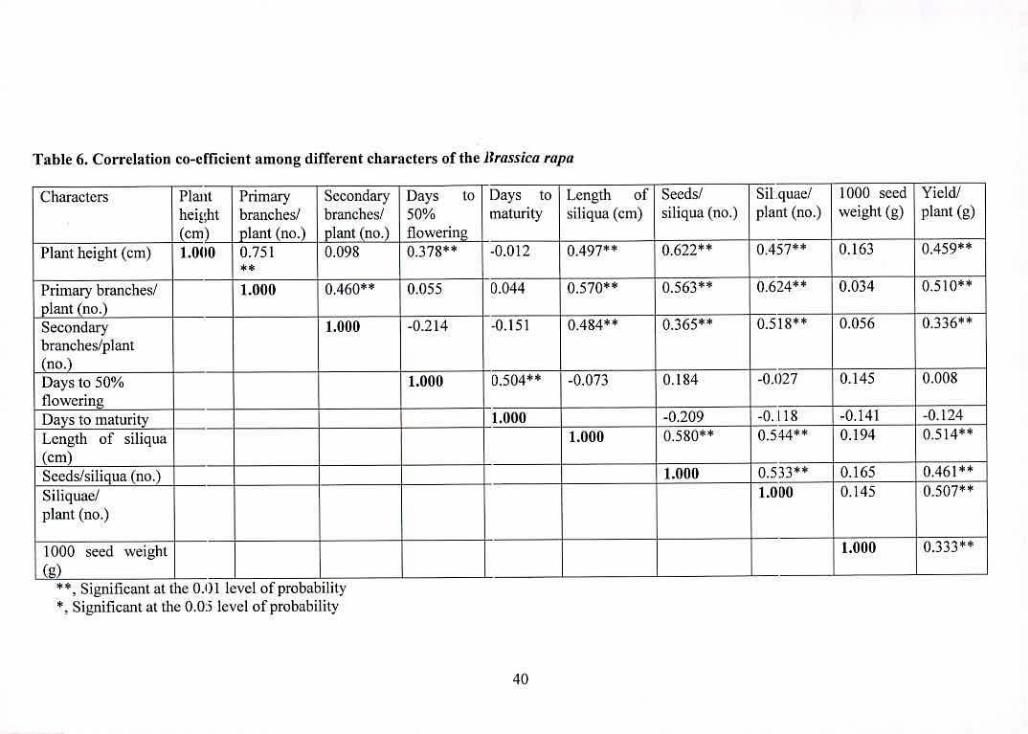
Table 6. Correlation co-efficient among different characters of the Jirassica npa
Characters Plant Primary Secondary Days to Days to Length of Secds/ Sit quad 1000 seed Yield/
height branches! branches! 50% maturity siliqua (cm) siliqua (no.) plant (no.) weight (g) plant (g)
(cm) plant (no.) plant (no.) flowering -________ Plant height (cm) 1.0(U) 0.751
*4 0.098 0.378*4 -0.012 0.497*4 0.622 0.457 0.163 0459**
Primary branches! 1.000 0.460 0.055 0.044 0.570 0.563 0.6244* 0.034 0.510*4
plaiit(no.)______ ______ Secondary 1.000 -0.214 -0.151 0.4844* 0.365 0.518 0.056 0.336
branches/plant (no.) Days to 50% 1.000 0.504 -0.073 0.184 -0.027 0.145 0.008
flowering Days to maturity 1.000 -0.209 -0.118 -0.141 -0.124
Length of siliqua 1.009 0.580 0.544*4 0.194 0.514
(cm) Secds/siliqua(no.) 1.000 0.533 0.165 0.461
Silique/ 1.000 0.145 0.507
plant (no.)
1000 seed weight - 1.000 0333t*
(g) Significant at the 0.01 level of probability
Significant at the 0.03 level of probability
40
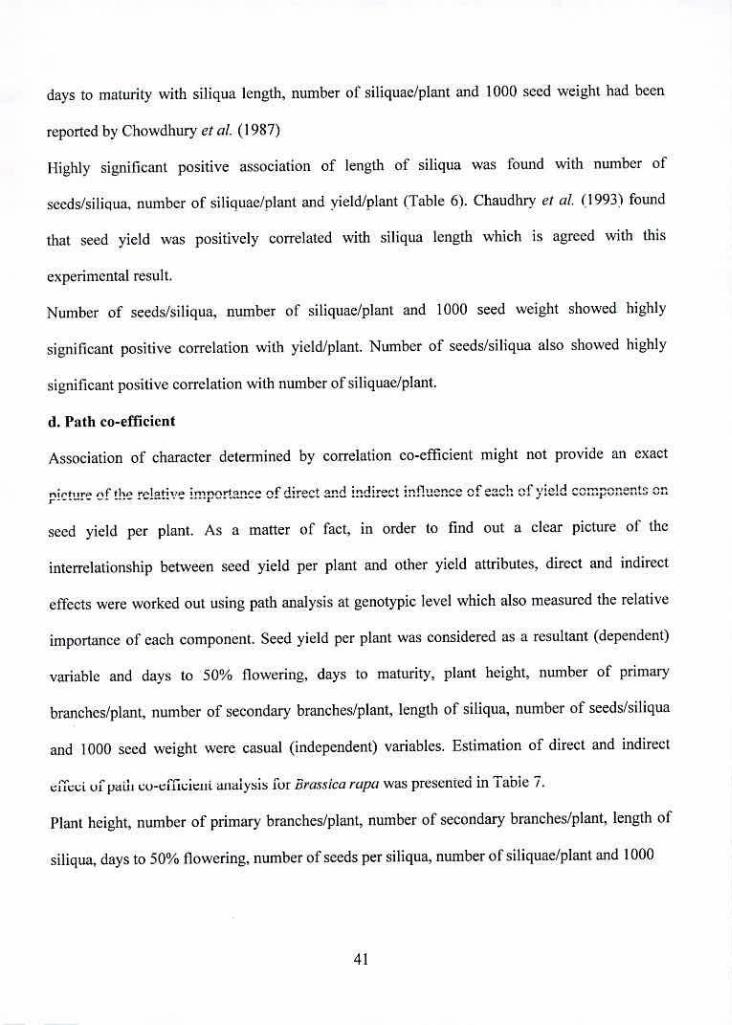
days to maturity with siliqua length, number of siliquae/plant and 1000 seed weight had been
reported by Chowdhury ci at (1987)
Flighty significant positive association of length of siliqua was found with number of
seeds/siliqua, number of siliquae/lant and yield/plant (Table 6). Chaudhry ci at (1993) found
that seed yield was positively correlated with siliqua length which is agreed with this
experimental result.
Number of seeds/siliqua, number of siLiquae/plant and 1000 seed weight showed highly
significant positive correlation with yield/plant. Number of seeds/siliqua also showed highly
significant positive correlation with number of siliquae/plant.
d. Path co-efficient
Association of character determined by correlation co-efficient might not provide an exact
n;rtnr. ,F ii,e' rrl,thna ;n,nni-lnnre €d' d;ra-t ,nA ;,,a;r,,', nhl,.nnrnr.fane'l. •l' ,ialr4 -r.n,nr.nan . - .--*..--- "...--. .....
seed yield per plant. As a matter of fact, in order to find out a clear picture of the
interrelationship between seed yield per plant and other yield attributes, direct and indirect
effects were worked out using path analysis at genotypic level which also measured the relative
importance of each component. Seed yield per plant was considered as a resultant (dependent)
variable and days to 50% flowering, days to maturity, plant height, number of primary
branches/plant. number of secondary branches/plant, length of siliqua, number of seeds/siliqua
and 1000 seed weight were casual (independent) variables. Estimation of direct and indirect
eiTcei ufpaUi eo-effleiezii wiaysis fur Brass/ca rapti was presented in Table 7.
PIanL height, number of primary branches/plant, number of secondary branches/plant, length of
siliqua, days to 50% flowering, number of seeds per siliqua, number of siliquae/plant and 1000
UI
'fable?. Partitioning of genotypic correlation with seed yield/plant into direct and indiri,ct components of lirassica rapa
Characters Plant height
Primary branchesf
Secondary brnehes/
Days to 50%
Days to maturity
requ~tlj,(c of q m)
Seeds! siliqua (no.)
Siliquae/ plant (no.)
1000 seed Yield! weight (g) plant (g)
(cm) plant (no.) pnt (no.) flowering _______ ________-
Plant height (cm) 0.130 0.109 2.613 -0.038 -4.884 8.055 5.399 7.938 4.151 0.459
Primary branches! 9.779 0.145 I___
0.012 -5.522 1.790 9.238 4.887 0.108 8.659 0.51
rnno.) ____-__ _______ __
Sccondary 1.276 2.666 2.149 -6.146 7.844 0.032 8.997 1.426 0.336
br3nehes/ plant (in.) ________ ___________ ___________ __________ _____________
Days to 50% 4.922 7.996 -5.706 -0.100 2.051 -1.183 1.597 -4.689 3.693 8.00
flowering Days to maturity -1.563
__
6.397 -4.026 -0.051 4.609 -4.036 - -1.814 -2.049 -3.591 -0.124
Ungth of siliqua 6.471 8.287 1.290 7.329 -1.013 0.162 5.035 9.449 4.941 0.514
(cm)
Sccds/siliqua (no.) 8.099 8.185 9.731 * -1.847 -8.506 - 9.400 8.680 9.258 4.202 0.461
Siliquae 5.951 9.072 1.381 2.711 -4.803 - 8.817 4.627 0.174 3.693 0.507
plant (no.) 1
1000 seed weight 2.123 4.943 1.493 -1.456 -5.739 - 3.144 1.432 2.519 0.255 0.333
(g) _________ ________ ________ __________ _________
Rsidual effect: 0.566
42
seed weight showed positive direct effects and days to maturity showed negative direct effect on
yield/plant. FIa.n (1990) working with Brassica napus, observed negative direct effect of number
of siliquac/plant and positive direct effect of number of seeds/siliqua and plant height on seed
yield.
Plant height showed positive indirect effects on number of primary branches/plant, number of
secondary branches/plant. length of siliqua, number of seeds per siliqua, number of siliquae/plant
and 1000 seed weight.
Path analysis showed that number of primary branches/plant showed positive indirect effect on
plant height, number of secondary branches/plant, days to maturity, length of siliqua, number of
seeds/siliqua, number of siliquae/plant and 1000 seed weight.
Number of secondary branches/plant had positive indirect effects on plant height. number of
primary branches/plant, days to 50% flowering, length of siliqua, number of seeds/siliqua.
number of siliquae/plant and 1000 seed weight (Table 7).
It was found that days to 50% flowering had positive indirect effects on plant height. number of
primary branches/plant, days to maturity, number of seeds/siliqua and 1000 seed weight. On the
other hand, days to maturity had positive indirect effect on number of primary branches/plant.
Chauhan and Singh (1985) observed positive direct effect on days to 50% flowering, plant
height, primary branching, number of siliquae/plant, number of seeds/siliqua on yield.
Length of siliqua had positive indirect effect on plant height, number of primary branches/plant,
number of secondary branches/plant. days to 50% flowering, number of seeds/siliqua, number of
siliquac/plant and 1000 seed weight. Kumar a at (1984) and Chen et al. (1983) found negative
effect in plant height, days to maturity and siliqua length.
43
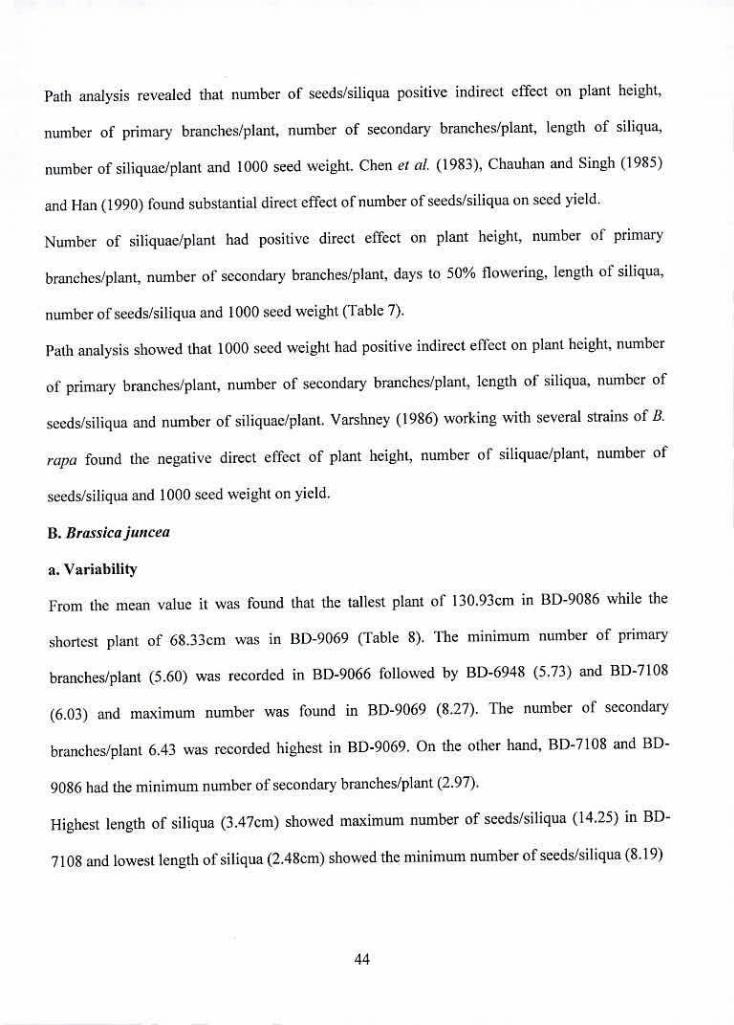
Path analysis revealed that number of seeds/siliqua positive indirect effect on plant height,
number of primary branches/plant, number of secondary branches/plant, length of siliqua,
number of siliquae/plant and 1000 seed weight. Chen et aL (1983). Chauhan and Singh (1985)
and Han (1990) found substantial direct effect of number of seeds/siliqua on seed yield.
Number of siliquac/plant had positive direct effect on plant height, number of primary
branches/plant. number of' secondary branches/plant, days to 50% flowering, length of siliqua,
number of seeds/siliqua and 1000 seed weight (Table 7).
Path analysis showed that 1000 seed weight had positive indirect effect on plant height, number
of primary branches/plant. number of secondary branches/plant, length of siliqua, number of
seeds/siliqua and number of siliquae/plant. Varshney (1986) working with several strains of B.
rajia found the negative direct effect of plant height, number of siliquac/plant, number of
seeds/siliqua and 1000 seed weight on yield.
B. Brassicajuizeca
a. Variability
From the mean value it was found that the tallest plant of 130.93cm in 13D-9086 while the
shortest plant of 68.33cm was in l3D-9069 (Table 8). The minimum number of primary
branches/plant (5.60) was recorded in BD-9066 followed by BD-6948 (5.73) and BD-7108
(6.03) and maximum number was Ihund in BD-9069 (8.27). The number of secondary
branches/plant 6.43 was recorded highest in BD-9069. On the other hand, BD-7108 and BD-
9086 had the minimum number of secondary branches/plant (2.97).
Highest length of siliqua (3.47cm) showed maximum number of seeds/siliqua (14.25) in BD-
7108 and lowest length of siliqua (2.48cm) showed the minimum number of seeds/siliqua (8.19)
LEI
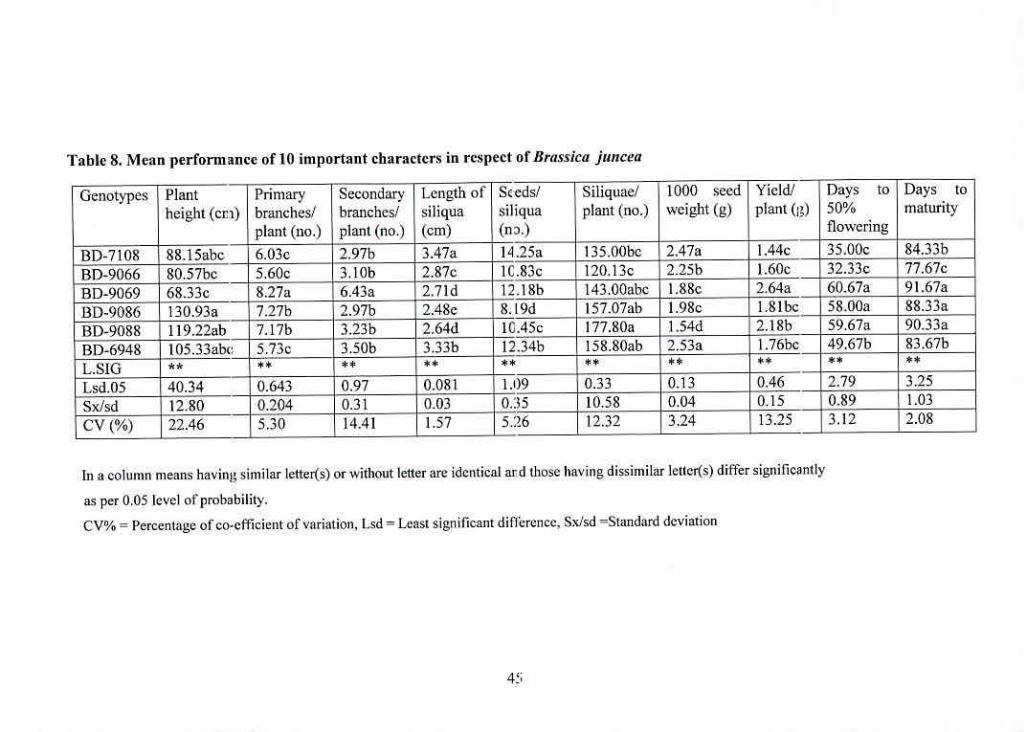
Table 8. Mean performance of 10 important characters in respect of Brassica juncea
Genotypes Plant - height (en)
Primary branches!
Secondary branches/
Length of siliqua
Sceds/ siliqua
Siliquae/ '1000 plant (no.)
seed weight (g)
Yield! plant (g)
Days to 50%
Days to maturity
plant (no.) plant (no.) (cm) (nD.) - flowering
130-7108 88.15abc - 6.03c 2.97b 3.47a 14.25a 135.00bc 2.47a - 1.44c 35.00c 84.33b
BD-9066 I 80.57bc 5.60c 3.1Ob 2.87c IC.83c 120.13c 2.25h 1.60c - 32.33c 77.67e
BD-9069 -
1 68.33c - 8.27a 6.43a 2.71d 12.18b 143.00abc 1.88c 2.64a - 60.67a i 91.67a
!3D-9086 130.93a 7.27h I 2.97b 2.48e 1, 8.19d 157.07ab 1.98c 1.81bc 58.00a 88.33a
BD-9088 119.22ab 7.17b 3.23b 2.64d IC.45c l77.SOa 1.54d 2.18b 59.6Th 90.33a
105.33abc 5.73c 3.50b 3.33b 12.34b 158.80ab 2.53a 1.76bc 49.67b 83.67b BD-69!d L.S1G ** ** I ** ** **
Lsd.05 40.34 - 0.643 10.97 0.081 1.09 0.33 0.13 0.46 - 2.79 3.25
Sxlsd CV (%)
12.80 22.46
1 0.204 5.30
0.31 14.41
0.03 1.57
0.35 526
10.58 1132
0.04 3.24
0.15 13.25
1 0.89
J 312 1 1.03
2.08
In a column means having similar letter(s) or without letter arc identical ard those having dissimilar letter(s) differ significantly
as per 0.05 level of probability.
CV% = Percentage of coefflcient of variation. Lsd = Least significant difkrenee. Sx/sd "Standard deviation
45
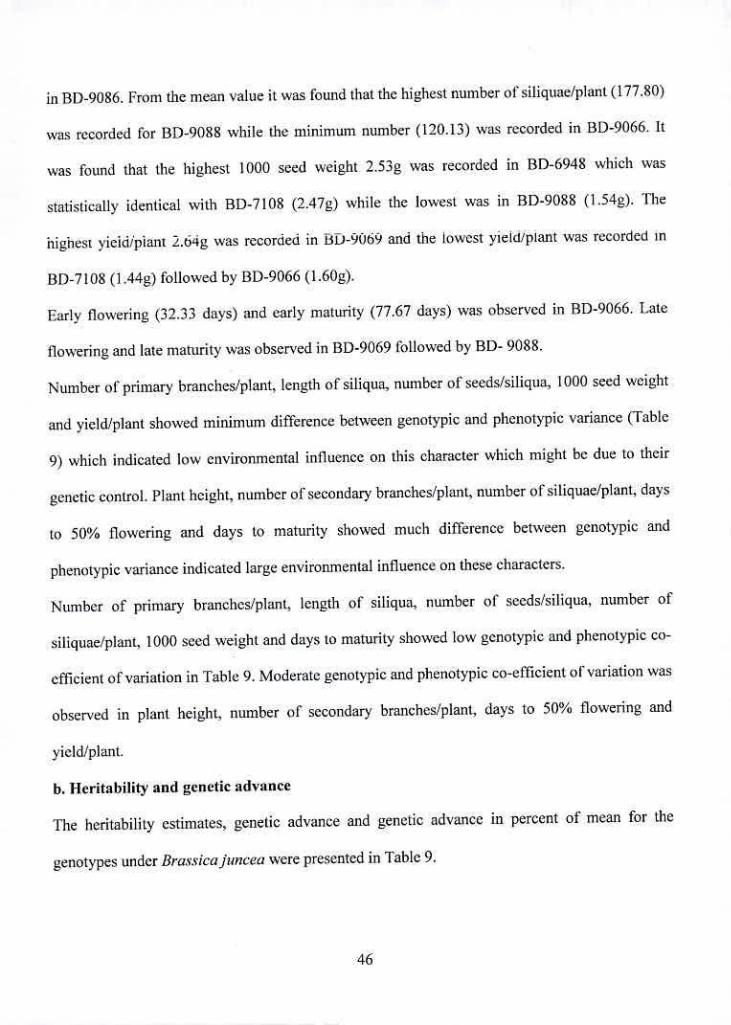
in BD-9086. From the mean value it was found that the highest number ol siliquae/plant (177.80)
was recorded for BD-9088 while the minimum number (120.13) was recorded in BD-9066. It
was found that the highest 1000 seed weight 2.53g was recorded in l3D-6948 which was
statistically identical with BD-7108 (2.47g) while the lowest was in BD-9088 (1.54g). The
highest yield/plant 2.64- was recorded in bD-9069 and the lowest yield/plant was recorded in
BD-7108(1.44g)f011oWed by BD-9066(1.60g).
Early flowering (32.33 days) and early maturity (77.67 days) was observed in RD-9066. Late
flowering and late maturity was observed in BD-9069 Ihilowed by BD- 9088.
Number of primary branches/plant, length of siliqua, number of seedsisiliqua, 1000 seed weight
and yield/plant showed minimum difference between genotypic and phenotypic variance (Table
9) which indicated low environmental influence on this character which might be due to their
genetic control. Plant height, number of secondary branches/planL number of siliquae/plant, days
to 50% flowering and days to maturity showed much difference between genotypic and
phenotypic variance indicated large environmental influence on these characters.
Number of primary branches/plant, length of siliqua, number of seeds/siliqua, number of
siliquae/plant, 1000 seed weight and days to maturity showed low genotypic and phenotypic co-
efficient of variation in Table 9. Moderate genotypic and phenotypic co-efficient of variation was
observed in plant height, number of secondary branches/plant, days to 50% flowering and
yield/plant.
b. Heritability and genetic advance
The heritability estimates, genetic advance and genetic advance in percent of mean for the
genotypes under Bracsicajuncec: were presented in Table 9.
46
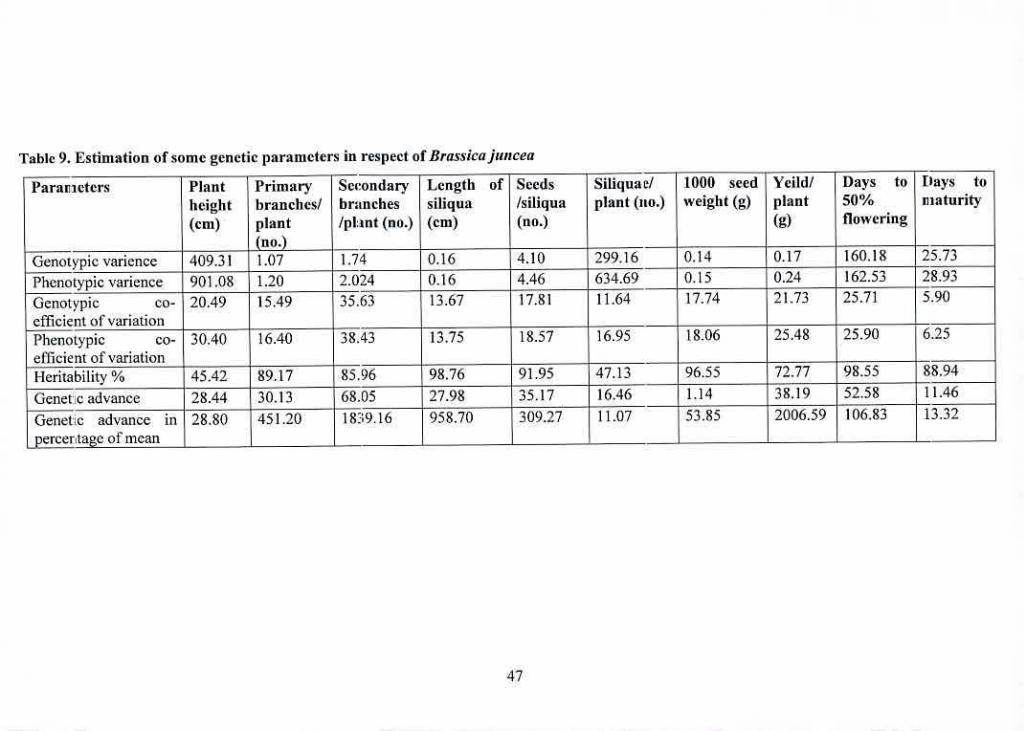
Table 9. Estimation of some genetic parameters in respect of Brassicajuncea
Paraneters Plant Primary Secondary Length of Seeds Siliquae/ 1000 seed YeiIdf Days to flays to
height branchesl branches siliqua /siliqua plant (no.) weight (g) plant 50% maturity
(em) plant /pl:int (no.) (em) (no.) (g) flowering
(no.) Genotypicvarience 409.31 1.07 1.74 0.16 4.10 299.16 0.14 0.17 160.18 25.73
Phenotypic varience 901.08 1.20 2.024 - 0.16 4.46 634.69 0.15 0.24 162.53 28.93
Genotypic co- 20.49 15.49 35.53 13.67 17.8) 11.64 17.74 21.73 25.71 5.90
efficient of variation Phenotypic Co. 30.40
_____ 16.40
________ 38.43 13.75 18.57 16.95 18.06 25.48 25.90 6.25
efficient of variation Heritability% 45.42 89.17 85.96 98.76 91.95 47.13 96.55 72.77 98.55 8.94
Genete advance 28.44 30.13 68.05 27.98 35.17 16.46 1.14 38.19 52.58 413.32 1.46
Genetc advance in 28.80 451.20 1839.16 958.70 309.27 11.07 53.85 2006.59 106.83
percertage of mean _______ ___________ _________ _______
47
Plant height, number of siliquae/plant showed low heritability with low genetic advance and low
genetic advance in percentage of mean which indicated the characters were highly influenced by
environmental effects and selection would be ineffective (Table 9). Length of siliqua, 1000 seed
weight and days to maturity showed high heritability with low genetic advance and low genetic
advance in percentage of mean which indicated the possibility of non-additive gene action. The
high heritability was due to favorable influence of environment rather than genotype and
selection for such traits might not be rewarding.
Number of primary branches/plant, number of primary branches/plant, number of seeds/siliqua
days to 50% flowering and yield/plant showed high heritability with high genetic advance and
high genetic advance in percentage of mean revealed the possibility of predominance of additive
gene effects and selection might be effective.
c. Correlation matrix
(3enotypic and phenotypic correlation co-eflieients between pairs of characters for Brassica
juncea in the presented study were presented in Table 10.
Plant height showed highly significant positive association with number of siliquae/plant. The
results revealed that the tallest plant initiated with an increase of number of siliquac/plant. On the
other hand, plant height had non significant negative association with number of primary
branches/plant. length of siliqua, number of seeds/siliqua, 1000 seed weight and yield/plant and
non significant positive correlation with days to 50% flowering and days to maturity. Positive
correlation of plant height with number of seeds/siliqua, number of siliquae/plant and negative
correlation with 1000 seed weight were reported by Chowdhury et a,. (1987). The present
findings are partially agreed with Chowdhury ci aL (1987).
48
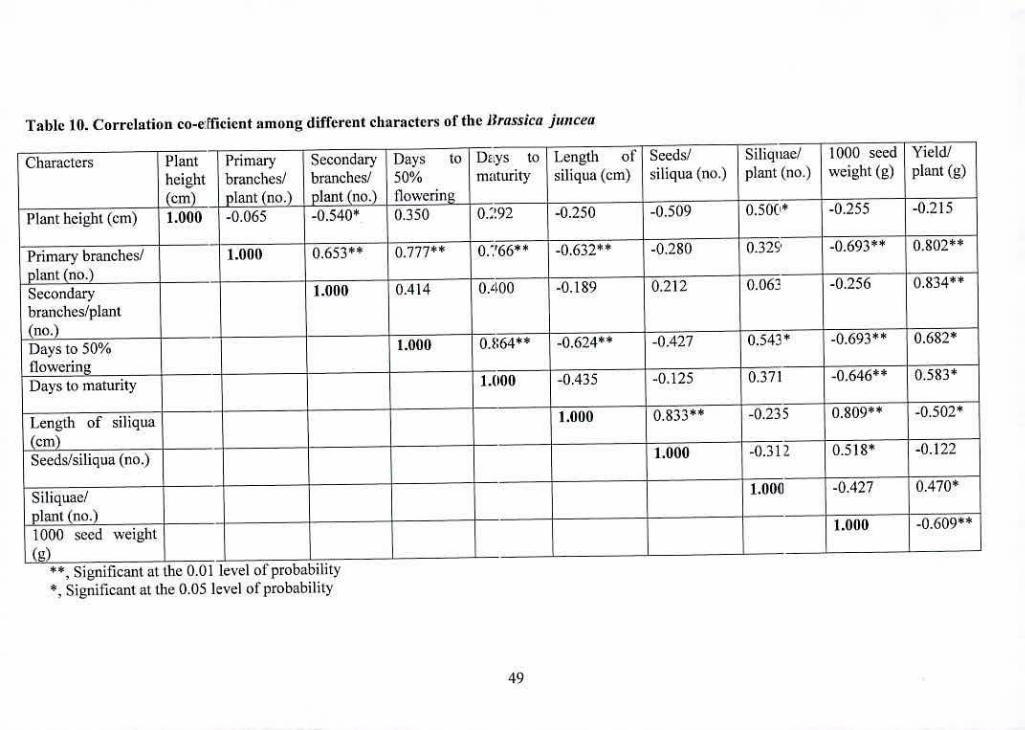
Table 10. Correlation co-efficient among different characters of the Brassica juncea
Characters Plant - Primary Secondary Days to D2.ys to Length of Seeds! Siliqitac! 1000 seed Yield/
height branches! branches! 50% maturity siliqua (cm) siliqua (no.) plant (no.) weight (g) plant (g)
pj plant (no.) plant (p) Qerin' - ______
Plant height (cm) 1.000 -0.065 .0.540* 0.350 0.292 -0.250 -0.509 0.500 -0.255 -0.215
Primary branches! - 1.009 0.653 0.777 0266** 0.632** -0.280 0.329 0.802
plant (no.) Secondary 1.009
__________ 0.414 0.400 -0.189 0.212
__________ 0.063 -0.256 Ø•334**
branches!plant (no.) Days to 50% - 1.000 0M64** M.624** -0.427
______________ 0.543k .0.693** 0.682k
flowering Days to maturity 1.000 -0.435 -0.125 0.371 -0.646 0.583*
Length of siliqua - - 1.000 0.833** -0.235 0.809 .0.502*
(cm) Seeds/siliqua(no.)
_______ ____ ________ ________ 1.000 -0.312
_______ 0.518* -0.122
Siliquae! - - 1.000 -0.427 0.470*
plant (no.) 1.000 0.609 ** 1000 seed weight (g)
. Significant at the 0.01 level of probability *, Significant at the 0.05 level of probability
49
Number of primary branches/plant had highly significant positive correlation with number of
secondary branches/plant, days to 50% flowering, days to maturity and yield/plant which
indicated that more primary branches producing genotype produced more seed yield. But length
of siliqua and thousand seed weight showed significant negative correlation with number of
primary branches/plant. Iteddy (1991) found the similar findings and Singh et at (1969) found
dissimilar findings in his experiment.
Number of secondary branches/plant showed highly significant positive correlation with
yield/plant. The results revealed that number secondary branches/plant might be considered for
the selection of yield/plant. On the other hand. days to 50% flowering, days to maturity, number
of seedsisiliqua and number of siliquae/plant showed non-significant positive correlation with
number of secondary branches/plant.
fl.nvc In fl0/ flnwerino cbnwenl ioniliri,t nndth'e n nrtnn with itau_J_._..c ts, n._•i•ct.rIr n,,mhai ,r —_ ..
siliquae/plant and yield/plant. Days to maturity showed significant positive correlation with
Yield/plant and highly significant negative correlation with thousand seed weight (Table 10).
Positive association of days to maturity with siliqua length, number of siliquae/plant and
thousand seed weight had been reported by Chowdhury ci al. (1987).
llighly significant positive association found length of siliqua with number of seeds/siliqua and
1000 seed weight and significant negative correlation with yield/plant. Chaudhry ci al. (1993)
found that seed yield was positively correlated with siliqua length which is disagreed with this
Cxpei......a_I ------ I LI ICIIIØJ I c:,u £ t.
Number of seeds/siliqua showed significant positive correlation with thousand seed weight and
number of siliquae/plant had significant positive association with yield/plant. 1000 seed weight
showed highly significant negative correlation with yield/plant.
50
d. Path co-efficient
Estimation of direct and indirect effect of path co-efficient analysis for Brassica juncea was
presented in Table II.
Number of primary branches/plant, number of secondary branches/plant, days to 50% flowering,
days to maturity and number of siliquae/plant showed positive direct effect and plant height,
length of siliqua. number of seeds/siliqua and 1000 seed weight showed negative direct effect on
yield/plant. Han (1990) working with Brassica na,us. observed negative direct effect of number
of siliquae/plant and positive direct effect of number of seeds/siliqua and plant height on seed
yield.
Plant height had negative indirect effects on secondary branches/plant, days to maturity, number
of seeds/siliqua and 1000 seed weight. On the contrary plant height had positive indirect effects
on primary branches/plant, days to 50% flowering, length of siliqua and number of
siliquac/plant.
Path analysis showed that number of primary branches/plant had negative indirect effect on days
to maturity, number of seeds/siliqua and thousand seed weight and positive indirect effect on
plant height, number of secondary branches/plant, days to 50% flowering, length of siliqua and
number of siliquae/plant.
Number of secondary branches/plant had positive indirect effects on plant height, days to 50%
flowering, length of siliqua. number of seeds/siliqua and number of siliquac/plant. On the other
hand, number of secondary branches/plant had negative indirect contribution on number of
primary branches/plant, days to maturity and thousand seed weight.
51
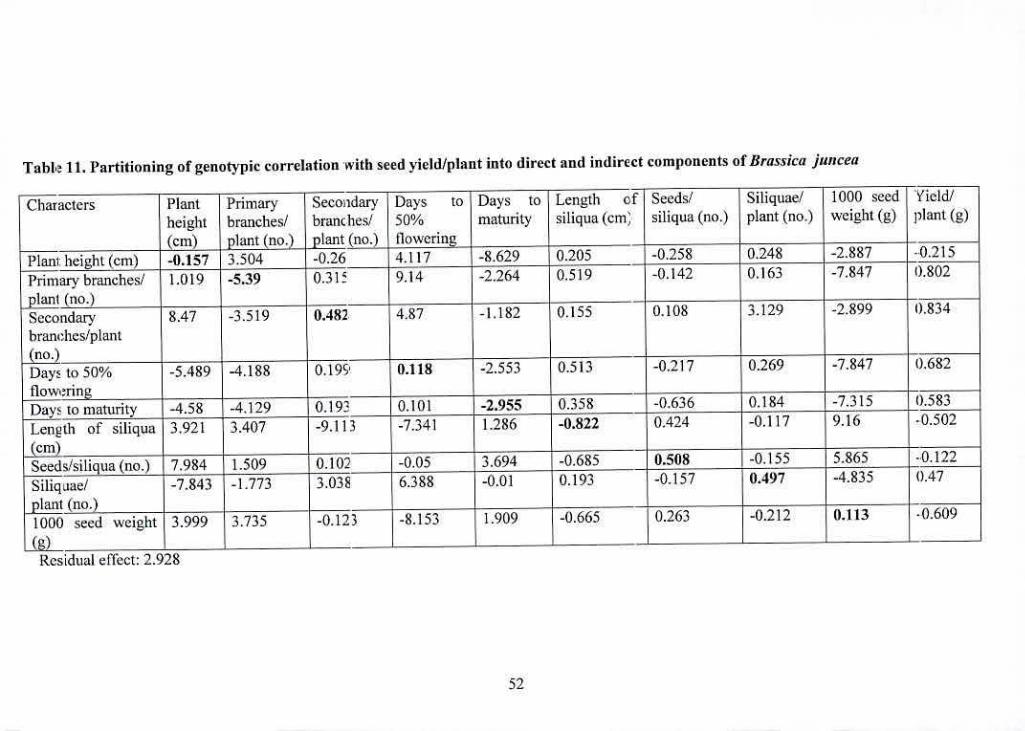
Table 11. Partitioning of genotypic correlation with seed yield/plant into direct and indirect components of Brassica juncea
Characters Plant Primary Secondary Days to Days to Length of Seeds! Siliquae/ 1000 seed Yieldl
height branches! branchesi 50% maturity siliqua (cm siliqua (no.) plant (no.) weight (g) plant (g)
(cm) plant (no) plant (no.) flowering __________- ___________ __________ _________ - Plant height (cm) -0.157 3.504 4.117 8.629 0.205 -0.258 0.248 -1887 1
Primarvbranches/ 1.019 -5.39 O.31 9.14 -2.264 0.519 -0.142 0.163 -7.847 0.802
planl(rio.) _________ Secondary 8.47 -3.519 0.482. 4.87 -1.182 0.155 0.108 3.129 -2.899 0.834
branches/plant
Day5 to 50% -5.489 -4.188 0.195 (no.)
0.118 -2.553 0.513 -0.217 0.269 -7.847 0.682
flow.ring Days to maturity Length of siliqua
_______ -4.58 3.921
-4.129 3.407
0.193 -9.113
0.101 -7341
-2.955 1.28=-0.8j-2-
0.358 -0.636 0.424
0.184 -0.117
-7.315 9.16
0.583 .0.502
Seeds/siliqua(no.) 7.984 1.509 0.102 -0.05 3.694 -0.685 - 0.508 ____
-0.155 5.865 . :0122
Siliquae/ -7.843 -1.773 3.038 6.388 -0.01 0.193 -0.157 0.497 -4.835 0.47
plant (no.) 1000 seed weight 3.999 3.735 -0.123 -8.153 1.909 -0.665 0.263 -0.212 0.113 0.609
(g) . _________ _________.__________ - Residual effect: 2.928
52
Path analysis revealed that days to 50% flowering had positive indirect effects on number of
secondary branches/plant, length of siliqua and number of siliquae/plant. Chauhan and Singh
(1985) observed high positive direct effect of days to 50% flowering, plant height, primary
branching, number oI'siliquae/plant, number of seeds/siliqua on yield.
Days to maturity showed positive indirect contribution on number of secondary branches/plant,
days to 50% flowering, length of siliqua and number of siliquae/plant. Rahman ci al. (1983)
found that days to maturity had indirect negative effect on number of primary branches/plant,
number of siliquae/plant and 1000 seed weight, although considerable indirect positive effect on
plant height along with minimum positive indirect effect on siliqua length and number of
seeds/siliqua counter balanced the effect of the negative forces.
Length of siliqua had positive indirect contribution on plant height, number of primary
branches/plant, days to maturity, number of seeds/siliqua and 1000 seed weight. Kumar et at
(1984) and Chen ci at (1983) Ihund negative effect in plant height, days to maturity and siliqua
length.
Path analysis revealed that number of seeds/siliqua had positive indirect effect on plant height,
number of primary branches/plant, number of secondary branches/plant, days to maturity and
1000 seed weight ('I'able II). Chen ci at (1983), Chauhan and Singh (1985) and Han (1990)
found substantial direct effect of number of seeds/siliqua on seed yield.
Number of siliquae/plant had positive indirect effect on number of secondary branches/plant,
days to 50% flowering and length of siliqua. 1000 seed weight had positive indirect effect on
plant height, number of primary branches/plant, days to maturity and number of seeds/siliqua.
Varshney (1986) working with several strains of B. rapa found the negative direct effect of plant
height, number of siliquae/plant, number of seeds/siliqua and 1000 seed weight on yield.
53
C. Brassica napus
a. Variability
From the mean value it was found that the tallest plant of 105.10 cm was observed in BD-9 100
while the shortest plant of 50.27 cm was observed in BD-9077 (Table 12). The maximum
number of primary branches/plant (8.57) and number of secondary branches/plant (3.9) were
recorded in 13D-9104 and the minimum number of primary branches/plant 3.83 was recorded in
flfl-9077. On the other hand. RD-906S and Rfl-7910 h?d no sec4)11cIry hrnnrhpc at. a!!.
Length of siliqua is an important yield contributing character. Length of siliqua was observed
highest in BD-9 106 (5.90cm) and lowest in BD-9078 (2.93cm). The variation was large for the
character number of seeds/siliqua. Maximum number of seeds/siliqua (24.87) was recorded in
13D-9065 which was statistically identical with BD-9106 (22.51) and the minimum 9.22 was
recorded in 13D-9100. The highest 1000 seed weight 3.21g was found in BD-7813 followed by
RD-6949 (3.18g) and 13D-781 I (3.14g) while the lowest 1000 seed weight 2.14g was found in
RD-9 304 which was statistically identical with BD-9078 (2.17g).
.L............ C .J:c.....................'ri.
LdaI 5#...l VOl LCtLlLflh VV%.I. %JU3'.4 V.%1 IUL 11W t*t)CL UI all iqun pCi jfla'it III ¼11 I ICI Cut gelluLypes. I It
highest number of siliquae/plant (97.20) was recorded for BD-9099 which was statistically
identical with BD-9 106 while the minimum number 23.10 was recorded for BD-78 II which was
statistically identical with BD-7814 (24.36), BD-7813 (25.27) and BD-7812 (25.43).Early
flowering (29.33 days) and early maturity (80.67 days) was observed in l3D-9070.While late
flowering was found in 130-7830 (64.33 days) followed by BD-781 1 (64 days) and 130-7813
(63.67 days) respectively and late maturity 95 days was observed in 130-9100 and BD- 7811.
The highest yield/plant 2.1 3g was recorded in BD-9078 and the lowest yield/plant 0.60g was
recorded in B0-iSi3.
54
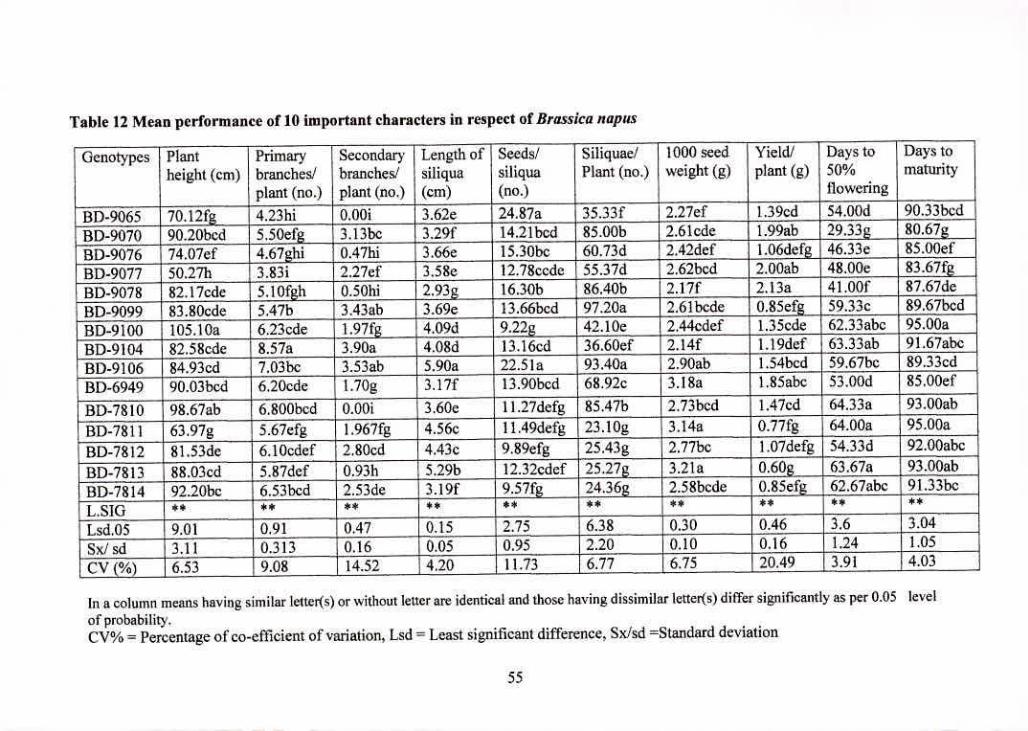
Table 12 Mean performance of 10 important characters in respect of Brasska napus
I Genotypes Plant height (cm)
_______
Primary branches! plant (no.)
Secondary branches/ plant (no.)
Length of siliqua (cm)
Seeds/ siliqua (no.)
Siliquae/ Plant (no.)
1000 seed weight (g)
Yield! plant (g)
Days to 50%
flowering
Days to maturity
13D-9065 4.23hi 0.00i 3.62e 24.87a 35.331 2.27ef 1.39cd 54.00d 90.33bcd
BD-9070 I 90.20bcd 5.50efg 3.I3bc 3.291 14.21bcd 85.00b 2.61cde 1.99ab 29.33g 80.679
BD-9076 74.07c1 4.67ghi 0.47hi L3.66c 15.30bc 60.73d 2.42def i.Oódefg 46.33e 85.00ef
BD-9077 50.27h 3.831 2.27ef 3.58e 12.78ccde 55.37d 2.62bcd 2.00ab 48M0e 83.67fg
BD-9078 82.17cde 5.1ofgh 0.50hi 2.93g 16.30b 86.40b 2.1717 2.13a - 41.001' 87.67de
BD-9099 83.80cde 5.47b j3.43ab I 3.69e 13.66bcd 97.20a 1 2.61bcde 0.85efg_ 59.33c 89.67bcd
BD-9100 105.1Oa 6.23cde 1.97fg I 4.09d 9.22g 42.10e 2.44cdef 1.35cde 62.33abc 95.00a
BD-9104 82.58ede 8.57a 3.90a 4.08d 13.16cd 36.60ef 2.141 1.19def 63.33ab 91.67abc
BD-9106 84.93cd 7,03bc 3.53ab 5.90a 22.51a 93.40a 2.90ab 1.54bcd 59.67bc 89.33cd
BD-6949 90.03bcd 6.20cde 1.70g 3.17f 13.90bcd 68.92c 3.18a 1.85abc 53.00d 85.00eV
BD-7810 98.67ab 6.800bcd 0.00i 3.60e 11.27defg 85.47b 2.73bed 1.47cd 64.33a 93.00ab
BD-78 11 63,97g 5.67efg 1 .9671g 4.56c II .49defg 23.1 Og 3. 14a 0.77fg 64.00a 95.00a
BD-7812 81.53de 6.I0cdef 2.80cd 4.43c 9.89efg 25.43g 2.77bc 1.07defg 54.33d 92.00abc
BD-7813 88.03cd 5.87def 0.93h 5.29b 12.32edef 25.279 3.21a 0.60g_ 63.67a 93.00ah
BD-7814 92.20hc 6.53bcd 2.53de 3.191 9.57fg 24.36g 2.58bcde 0.85ef_ 62.67abc 91.33bc
L.SIG ** ** I st 4*
Lsd.05 9.01 0.91 0.47 0.15 2.75 6.38 0.30 0.46 .6
T3.91
3.04
Sx/sd 3.11 0.313 10.16 0.05 0.95 2.20 0.10 0.16 .24 1.05
CV (%) 6.53 1 9.08 ]_14.52 J 4.20 11.73 6.77 16.75 20.49 4.03
In a column means having similar letter(s) or without letter are identical and those having dissimilar letter(s) differ significantly as per 0.05 level of probability. CV% = Percentage of co-efficient of variation, Lsd = Least significant difference, Sx!sd =Standard deviation
55
The phenotypic variance was considerably higher than the genotypic variance for all the
characters studied (Fable 13). Deshmukh el al. (1986) also reported that phenotypic co-efficient
of variation was higher than the genotypic co-efficient of variation. Least difference between
phenotypic variance and genotypic variance were observed in number of primary branches/plant,
number of secondary branches/plant, length of siliqua, number of seeds/siliqua, 1000 seed
weight, days to maturity and yield/plant which indicated low environmental influence on this
character which might he due to their genetic control. Relatively high phenotypic variation was
observed in plant hcighl (207.10cm), days to 50% flowering (106.67days) and number of
siliquae/plant (786.62) which indicated large environmental influence on these characters.
Characters like 1000 seed weight and days to maturity showed low genotypic and phenotypic co-
efficient of variation indicated that the genotype has considerable variation for these traits.
Moderate genotypic and phenotypic co-efficient of variation was observed in plant height,
number of primary branches/plant, length of siliqua, number of seeds/siliqua. number of
siliqua/plant, yield/plant and days to 50% flowering which indicated moderate variability were
present among the genotype for these characters. Number of secondary branches/plant showed
high Lenotypic and phenotypic co-efficient of variation (67.00%) ind (6R cr/n) rccpeeiivrly
indicated that the genotype were highly variable for this trait.
b. Heritability and genetic advance
The heritability estimates, genetic advance and genetic advance in percent of mean Ibr the
genotypes under Brassica iiapzes were presented in Table 13.
Plant height. 1000 seed weight, days to 50% flowering and days to maturity showed high
heritability with low genetic advance and genetic advance in percentage of mean which indicated
56
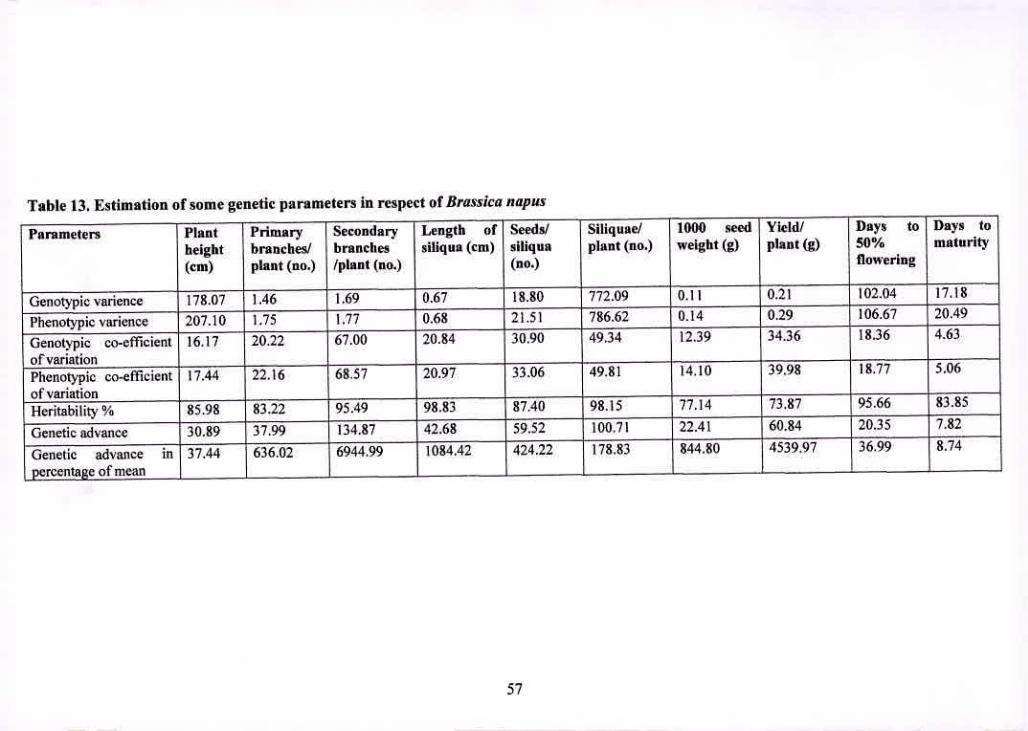
Table 13. Estimation of some genetic parameters in respect of Brassica napus
Parameters Plant Primary Secondary Length of Seeds/ Siliqune) 1000 seed YIeldf Days to Days to
height branchcs/ branches siliqua (cm) siliqua plant (no.) weight (g) plant (g) 50% maturity
(cm) plant (no.) (plant (no.) (no.) flowering
Genotypie varience 178.07 1.46 1.69 0.67 18.80 772.09 0.11 0.21 102.04 17,18
Phenotypic varienec 207.10 1.75 1.77 0.68 21.51 786.62 0.14 0.29 106.67 20.49
Genotypic co-efficient 16.17 20.22 67.00 20.84 30.90 49.34 12.39 34.36 18.36 4.63
of variation Phenotypic co-efficient 17.44
_________ 22.16 68.57
_____________ 20.97 33.06 49.81 14.10 39.98 18.77 5.06
of variation Heritability % 85.98 83.22 95.49 98.83 87.40 98.15 77.14 73.87 95.66 83.85
Genetic advance 30.89 37.99 134.87 42.68 59.52 100.71 22.41 60.84 20.35 7.82
Genetic advance in 37.44 636.02 6944.99 1084.42 424.22 178.83 844.80 4539.97 36.99 8.74
percentage of mean __ ___
57
the possibility of non-additive gene action. ilic high heritability was due to favourable influence
of environment rather than genotype and selection for such traits might not he rewarding.
Number of primary branches/plant, length of siliqua, number of seeds/siliqua, number of
siiiquae/piam and yieidipiant showed high heritability with high genetic advance and high
genetic advance in percentage of mean revealed the possibility of predominance of additive gene
effects and selection might be effective.
c. Correlation matrix
(ienotypie and phenotypic correlation co-efficients between pairs of characters for J3rassica
napus were presented in Table 14.
It is evident that in majority of the cases, the genotypic correlation co-efficients were higher than
the corresponding phenotypic correlation co-efficients. This indicated that a strong inherent
association between the characters studied and suppressive effect of the environment modified
the phenotypic expression of these characters by reducing phenotypic correlation values. In few
cases, phenotypic correlation were same with or higher than their corresponding genotypie
correlation co-efficients suggesting that both environmental and gcnotypic correlation in these
case acted in the same direction and finally maximized their expression at phenotypic level.
Plant height showed highly significant positive association with number of primary
branches/plant. Singh ci al. (1987) found similar results. The results revealed that the tallest plant
initiated with an increase of number of primary branches/plant. On the other hand, plant height
had non significant negative association with number of seeds/siliqua and yieldlplant and non
significant positive correlation with number of secondary branches/plant, days to 50% flowering,
days to maturity, Length of siliqua, number of siliquae/plant and 1000 seed weight. Positive
58
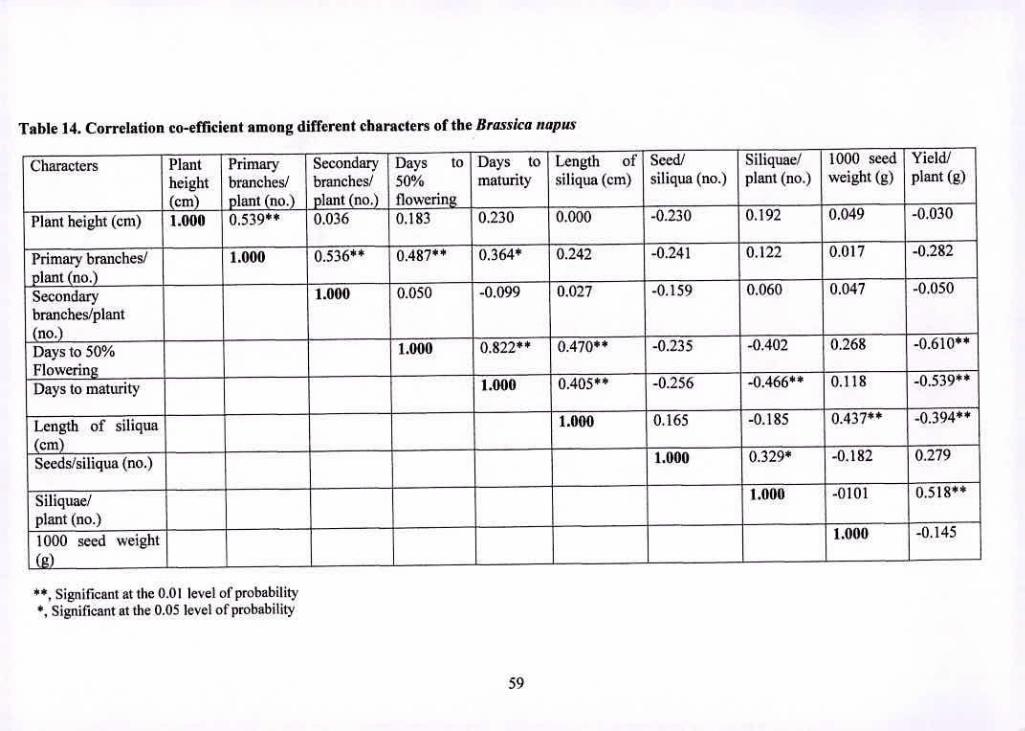
Table 14. Correlation co-efficient among different characters of the Jirassica napus
Characters Plant Primary Secondary Days to Days to Length of Seed! Siliquae/ 1000 seed Yield/
height branches/ branches/ 50% maturity siliqua (cm) siliqua (no.) plant (no.) weight (g) plant (g)
(cm) plant (no.) plant (no.) flowering_ Plant height (cm) 1.000 0.539 0.036 0.183 0.230 0.000 -0.230 0.192 0.049 -0.030
Primary branches/ 1.000 0.536" • 0.487" 0.364' 0.242 -0.241 0.122 0.017 -0.282
plant(no.) ___________ ___________ _________ _________ ________ Secondary 1.000 0.050 -0.099 0.027 -0.159 0.060 0.047 -0.050
branches/plant
Days to 50% 1.000 0.822' 0.470" -0.235 -0.402 0.268 .0.610**
Flowering Days to maturity 1.000 0.405" -0.256 0.466** 0.118 -0.539"
Length of siliqua 1.000 0.165 -0.185 0.437" .0.394"
(cm) Seeds/siliqua (no.) 1.000 0.329* -0.182 0.279
Siliquae/ 1.000 -0101 0.518"
plant (no.) 1000 seed weight (g)
1.000 -0.145
**, Significant at the 0.01 level of probability , Significant at the 0.05 level of probability
59
correlation of plant height with number or seeds/siliqua. number of siliquae/plant and negative
correlation with 1000 seed weight were reported by Chowdhury ci cii. (1987).
Number of primary branches/plant had highly significant positive correlation with number of
secondary branches/plant, days to 50% flowering and days to maturity. But number of primary
branches/plant had non significant positive correlation with length of siliqua, number of
siliquae/plant and 1000 seed weight. Rcddy (1991) found the similar findings and Singh ci cii.
(1969) found dissimilar findings in their experiment.
Number of secondary branches/plant showed non significant negative correlation with days to
maturity, number or seeds/siliqua, and yield/plant (Table 14). The result did not agree with
Katiyar and Singh (1974). On the other hand, days to 50% flowering, length of siliqua, number
of siliquae/plant and 1000 seed weight showed non significant positive correlation with number
of secondary branches/plant. The results revealed that number of secondary branches/plant might
not be considered for the selection of yield/plant.
Days to 50% flowering showed highly significant positive association with days to maturity,
length of siliqua and highly significant negative association with yield/plant. The result revealed
that early flowering type genotype might be selected for length of siliqua/plant. On the other
hand. days to maturity showed highly significant positive correlation with length of siliqua.
Highly significant positive association of length of siliqua was found with thousand seed weight
and highly significant negative association with yield/plant. Chaudhury ci aL (1993) found that
seed yield was positively correlated with siliqua length which was disagreed with this
experimental result.
Number of seeds/siliqua showed highly significant positive correlation with number of
siliquae/plant and number of siliquae/plant showed highly significant positive association with
yield/plant. 1000 seed weight showed negative non significant correlation with yield/plant.
d. Path co-efficient
Estimation of direct and indirect effect of path co-efficient analysis for lirassica napus were
presented in Table 15. Number of seeds per siliqua and number of siliquae/plant showed positive
direct effect and plant height, number of primary branches/plant, number of secondary
branches/plant, days to 50% flowering, days to maturity, length of siliqua and 1000 seed weight
showed negative direct effect on yield/plant.
Plant height showed negative indirect effect on number of secondary branches/plant, days to
50% flowering. days to maturity. On the contrary plant height had positive indirect effect on
number of primary branches/plant, length of siliqua, number of seeds per siliqua, number of
siliquae/plant and 1000 seed weight. Han (1990) working with Brassica napus, observed
negative direct effect on number of siliquae/plant and positive direct effect of number of
seeds/siliqua and plant height on seed yield. The findings of above researchers partially agreed to
the present findings.
Number of primary branches/plant had positive indirect effect on length of siliqua, number of
seedsisiliqua, number of siliquae/plant and 1000 seed weight. Kakroo and Kumar (1991) found
that 1000 seed weight had positive direct effect but number of primary branches/plant had
negative indirect effect on seed yield.
Number of secondary branches/plant had positive indirect effects through number of primary
branches/plant, days to maturity, length of siliqua, number of seeds/siliqua. number of
siliquae/plant and 1000 seed weight.
61
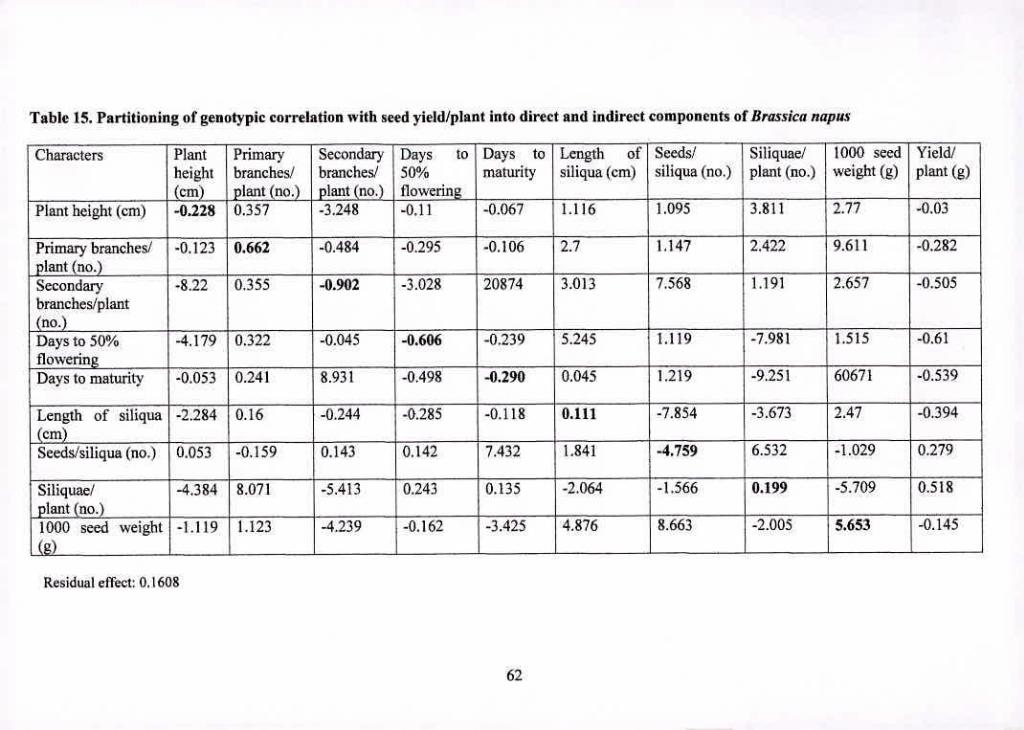
Table 15. Partitioning of genotypic correlation with seed yield/plant into direct and indirect components of Brassica napus
Characters Plant Primary Secondary Days to Days to Length of Seeds/ Siliquae/ 1000 seed Yield/ height branches! branches! 50% maturity siliqua (cm) siliqua (no.) plant (no.) weight (g) plant (g) () plant (no.) plant (no.) flowering
Plantheight(em) -0.228 0.357 -3.248 -0.11 -0.067 1.116 1.095 3.811 2.77 -0.03
Primary branches! -0.123 0.662 -0.484 -0.295 -0.106 2.7 1.147 2.422 9.611 -0.282 plant (no.) Secondary -8.22 0.355 -0.902 -3.028 20874 3.013 7.568 1.191 2457 -0.505 branches/plant (no.) Days to 50% -4.179 0.322 -0.045 -0.606 -0.239 5.245 1.119 -7.981 1.515 -0.61 flowering Days to maturity -0.053 0.241 8.931 -0.498 -0.290 0.045 1.219 -9.251 60671 -0.539
Length of siliqua -2.284 0.16 -0.244 -0.285 -0.118 0.111 -7.854 -3.673 2.47 -0.394 (cm) ___________ __________ ____________ ____________ ___________ ___________ Seeds/siliqua(no.) 0.053 -0.159 0.143 0.142 7.432 1.841 4.759 6.532 -1.029 0.279
Siliquae/ -4.384 8.071 -5.413 0.243 0.135 -2.064 -1.566 0.199 -5.709 0.518 plant(no.) _________ ___________ ___________ __________ ________ 1000 seed weight (g)
-1.119 1.123 -4.239 -0.162 -3.425 _________
4.876 ___________
8.663 ___________
-2.005 __________
5,653 __________
-0.145 ________
Residual effect: 0.1608
62
Path analysis revealed that days to 50% flowering had positive indirect effects on number of
primary branches/plant, length of siliqua. number of seeds/siliqua and 1000 seed weight (Table
15). Chauhan and Singh (1985) observed high positive direct effect on days to 50% flowering,
plant height, primary branching, number of siliquae/plant, number of seeds/siliqua on yield.
Days to maturity showed positive indirect effect on number of primary branches/plant, number
of secondary branches/plant, length of siliqua. number of seeds/siliqua and 1000 seed weight.
itat c.II ,n,r
L uyb to. i
.j.ia.tu.....
iiaj an
. tiu
It iect Icuat ye ci iect 031 number 01iaij L 0J) IJUU II u
primary branches/plant, number of siliquae/plant and 1000 seed weight, although considerable
indirect positive effect on plant height along with minimum positive indirect effect on siliqua
length and number of seeds/siliqua.
Length of siliqua had positive indirect effect on primary branches/plant and 1000 seed weight
(Table 15). Kumar ci at (1984) and Chen el al. (1983) found negative effect on plant height,
days to maturity and siliqua length.
Number of seeds/siliqua had positive indirect effect on plant height, number of secondary
branches/plant, days to 50% flowering, days of maturity, length of siliqua and number of
siliquac/plant. Chen ci ci. (1983), Chauhan and Singh (1985) and I-lan (1990) found substantial
direct effect of number of seeds/siliqua on seed yield.
Number of siliquae/plant had positive indirect effects on number of primary branches/plant, days
to 50% flowering and days to maturity. 1000 seed weight had positive indirect ciTed on primary
branches/plant, length of siliqua and number of seedslsiliqua. Varshney (1986) working with
several strains of B. rapa found the negative direct effect of plant height, siliqua/plant,
seeds/siliqua and 1000 seed weight on yield.
63
4.3 Genetic Diversity
Diversity is the function of parent selection and also heterosis. The availability of transgressive
segregants in a breeding programme depends upon the divergence of the parents. Thus. the
accurate information on the nature and degree of diversity of the parents is the pre-requisite of an
effect breeding programme. The knowledge of genotypie variation within genotypes in relation
to morphology. phenology and yield would help to screen better genotypes for hybridization
programme.
4.3.1 Construction of scatter diagram
Based on the values of principal component scores 2 and I obtained from the principal
component analysis, a two dimensional (Z1 -72) scatter diagram was constructed, using
component score 1 as X-axis and component score 7 as Y-iyiz which k prts?nh.'d in flgure 1.
The positions of the genotypes in the scatter diagram were random, which indicated the
considerable diversity among the genotypes. The scatter diagram gives a brief idea of the pattern
of diversity among the genotypes include in a cluster. Some distantly located genotypes of
different clusters were the genotypes number 9, 16, 15, 19, 38, 39. 40, 37, 35, 36, 26,30,29 and
so on.
4.3.2 Principal Component Analysis (PCA)
Principal Components were computed from the correlation matrix and genotype scores obtained
/...k:.j. L...A ------- -- ----- C--------------------------- ss.o uJ4lp)ls¼.asL II%IIII UUU Vt QLVWLLlIl 1IJL 111AtIIIuIII val •dtItC) ditU
succeeding components with latent roots greater than the unity (Jeger et at, 1983). Contributions
of the different morphological characters towards divergence were discussed from the latent
vectors of the first two principal components.
ME
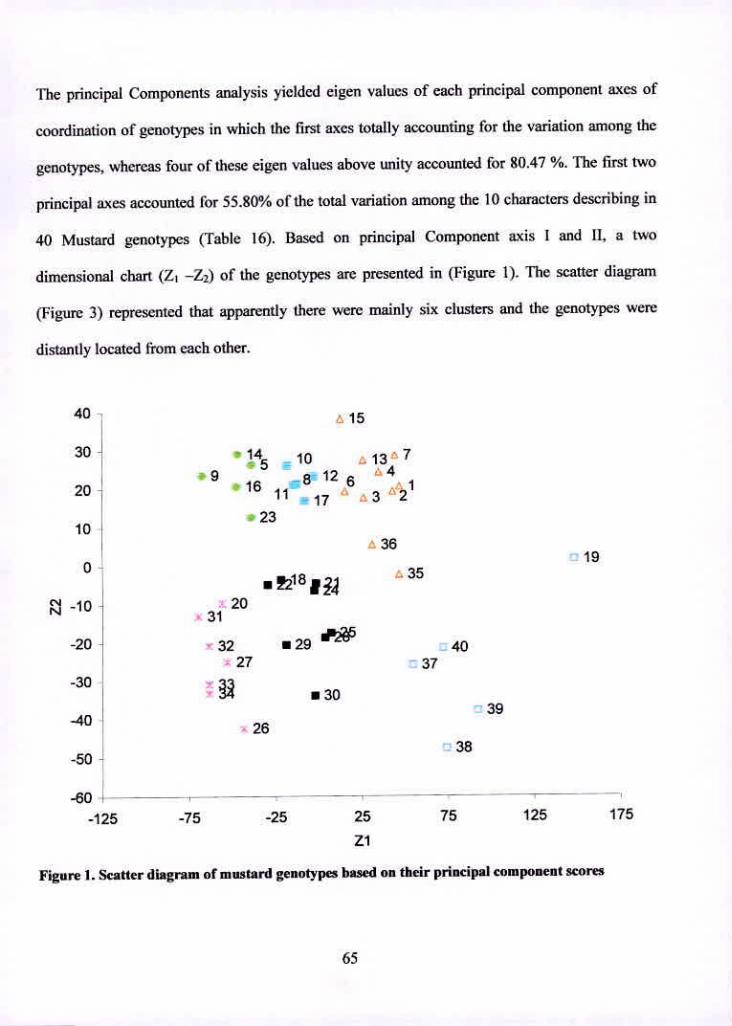
The principal Components analysis yielded eigen values of each principal component axes of
coordination of genotypes in which the first axes totally accounting for the variation among the
genotypes, whereas four of these eigen values above unity accounted for 80.47 %. The first two
principal axes accounted for 55.80% of the total variation among the 10 characters describing in
40 Mustard genotypes (Table 16). Based on principal Component axis I and II, a two
dimensional chart (Zi -22) of the genotypes are presented in (Figure 1). The scatter diagram
(Figure 3) represented that apparently there were mainly six clusters and the genotypes were
distantly located from each other.
40 15
30j 14 10 I
16 812e 1 20 17 32
23 10
36
0 35
-10 31 20
1::
32 •29 37
40 27
a30
-40• 26 38
-50
-60 - - - -- - - -125 -75 -25 25 75 125 175
zi
Figure 1. Scatter diagram of mustard genotypes based on their principal component scores
19
39
65
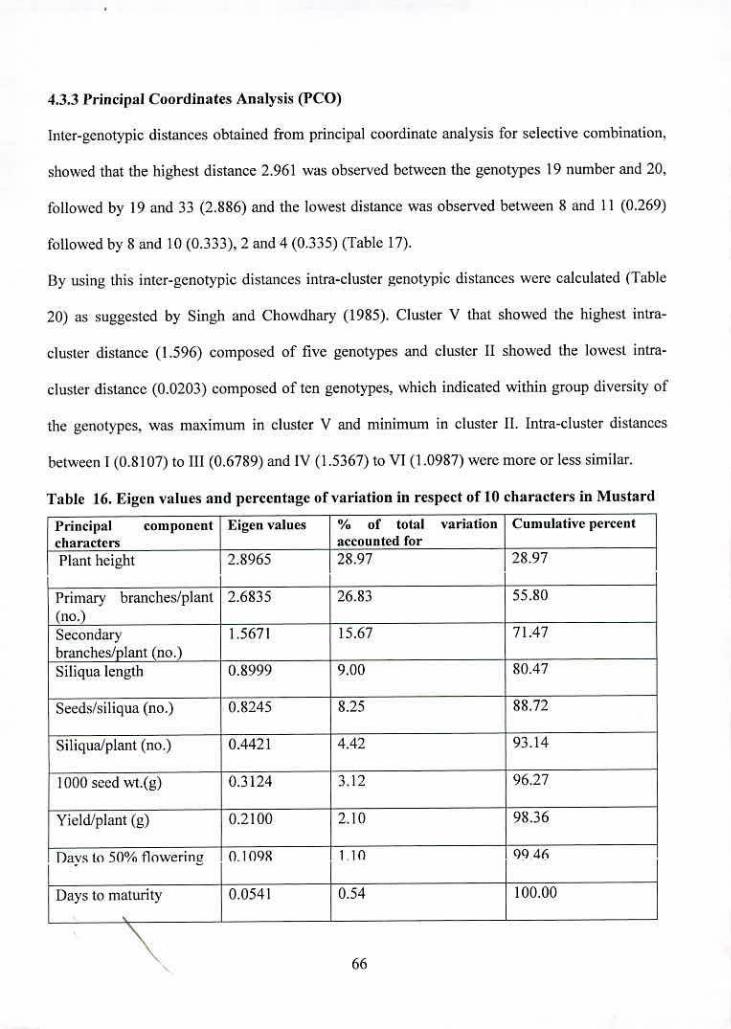
4.3.3 Principal Coordinates Analysis (PCO)
Inter-genotypic distances obtained from principal coordinate analysis for selective combination.
showed that the highest distance 2.961 was observed between the genotypes 19 number and 20,
followed by 19 and 33(2.886) and the lowest distance was observed between 8 and 11(0.269)
followed by 8 and 10 (0.333), 2 and 4(0.335) (Table 17).
By using this inter-genotypic distances intra-cluster genotypic distances were calculated (Table
20) as suggested by Singh and Chowdhary (1985). Cluster V that showed the highest intra-
cluster distance (1.596) composed of five genotypes and cluster II showed the lowest intra-
cluster distance (0.0203) composed of ten genotypes, which indicated within group diversity of
the genotypes. was maximum in cluster V and minimum in cluster It. Intra-cluster distances
between 1(0.8107) to III (0.6789) and IV (1.5367) to VI (1.0987) were more or less similar.
Table 16. Eigcn values and percentage of variation in respect of 10 characters in Mustard
Principal component characters
Eigen values % of total variation accounted for
Cumulative percent
Plant height 2.8965 28.97 28.97
Primary branches/plant 2.6835 (no.)
26.83 55.80
Secondary branches/plant (no.)
1.5671 15.67 ______________
71.47
Siliqua length 0.8999 9.00 80.47
Seeds/siliqua (no.) 0.8245 8.25 88.72
Silicjualplant (no.) 0.4421 4.42 93.14
1000 seed wt.(g) 0.3124 3.12 96.27
YieldJplant (g) 0.2100 2.10 98.36
Days to 50% flowering 0.1099 i 10 90 46
Days to maturity 0.0541 0.54 100.00
66
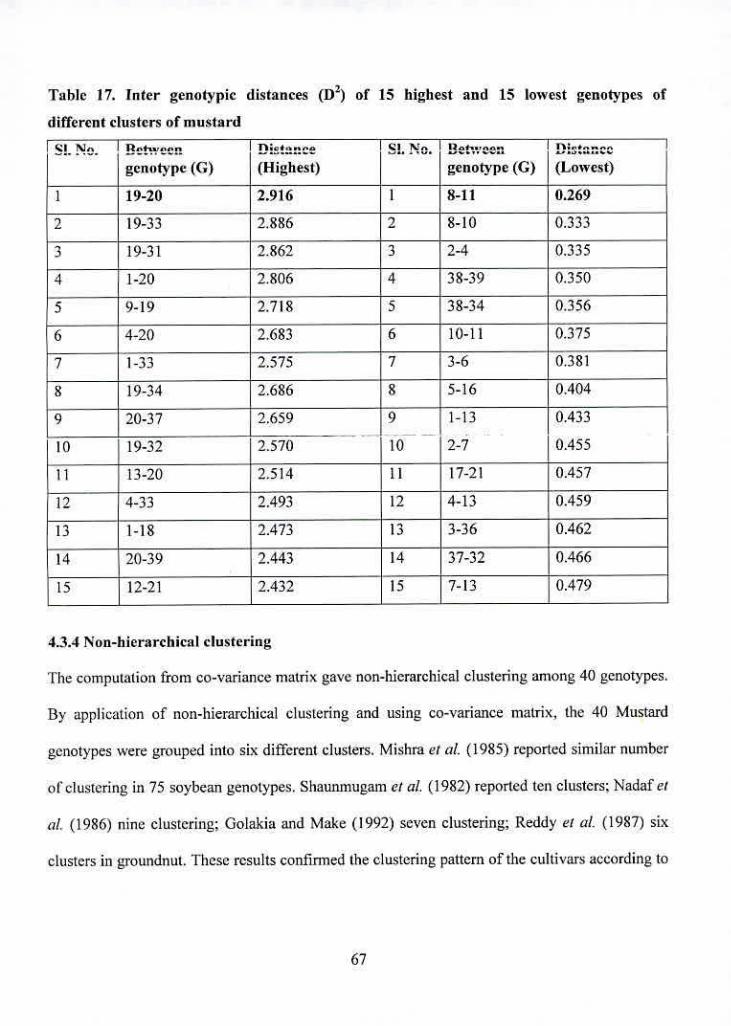
Table 17. Inter genotypic distances (02) of 15 highest and 15 lowest genotypes of
different clusters of mustard
S!. Ne. genotype (C)
Distance (Highest)
S!. No. !3etwcen genotype (C)
------------ Dis:cnce F
(Lowest)
19-20 2.916 I 8-11 0.269
2 19-33 2.886 2 8-10 0.333
3 19-31 2.862 3 2-4 0.335
4 1-20 2.806 4 38-39 0.350
5 9-19 2.718 5 38-34 0.356
6 4-20 2.683 6 10-11 0.375
7 1-33 2.575 7 3-6 0.381
8 19-34 2.686 8 5-16 0.404
9 20-37 2.659
2.570 - j 9
10
J113
2-7
0.433
0.455 10 19-32
11 13-20 2.514 11 17-21 0.457
12 4-33 2.493 12 4-13 0.459
13 1-18 2.473 13 3-36 0.462
14 20-39 2.443 14 37-32 0.466
15 12-21 2.432 15 7-13 0.479
4.3.4 Non-hierarchical clustering
The computation from co-variance matrix gave non-hierarchical clustering among 40 genotypes.
By application of non-hierarchical clustering and using co-variance matrix. the 40 Mustard
genotypes were grouped into six different clusters. Mishra cial. (1985) rcported similar number
otelustering in 75 soybean genotypes. Shaunmugam cial. (1982) reported ten clusters: Nadaf ci
at (1986) nine clustering; Golalcia and Make (1992) seven clustering; Reddy ci at (1987) six
clusters in groundnut. These results confirmed the clustering pattern of the cultivars according to
67
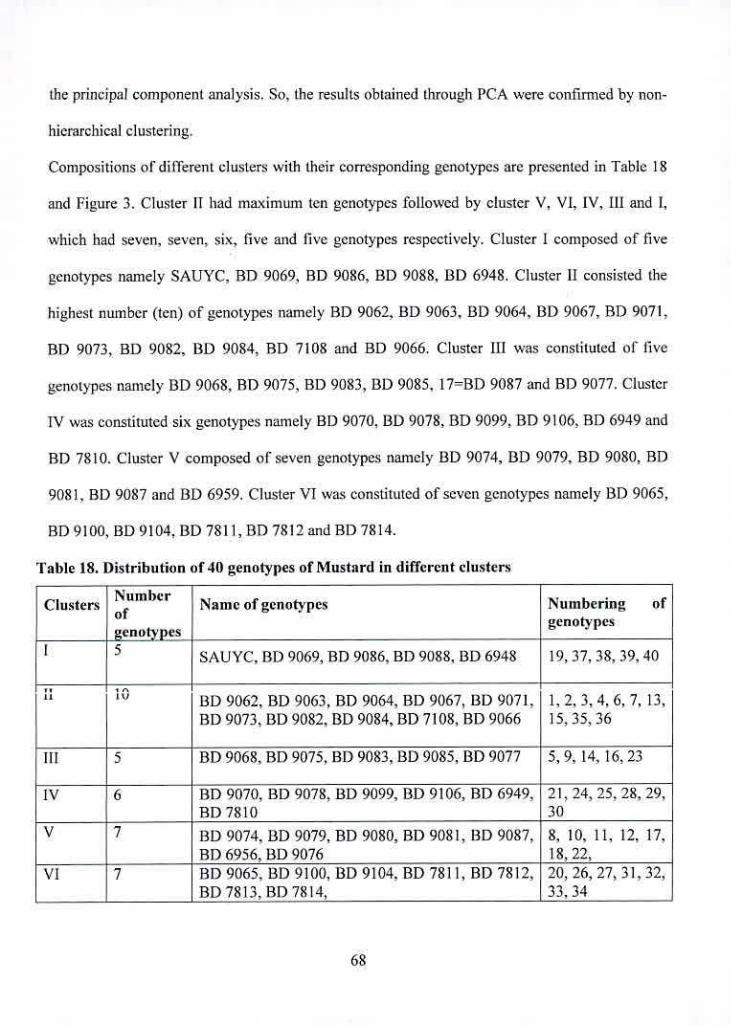
the principal component analysis. So. the results obtained through PCA were confirmed by non-
hierarchical clustering.
Compositions of different clusters with their corresponding genotypes are presented in Table 18
and Figure 3. Cluster II had maximum ten genotypes followed by cluster V. VI, 1". III and 1,
which had seven, seven, six, live and live genotypes respectively. Cluster I composed of five
genotypes namely SAUYC. RD 9069, RD 9086, BD 9088, 130 6948. Cluster II consisted the
highest number (ten) of genotypes namely RD 9062. BD 9063, BD 9064. BD 9067, BD 9071,
RD 9073. BD 9082, RD 9084, BD 7108 and BD 9066. Cluster III was constituted of live
genotypes namely BD 9068, RD 9075, RD 9083, BD 9085. 17131) 9087 and RD 9077. Cluster
TV was constituted six genotypes namely HI) 9070. BD 9078. RD 9099, RD 9106. RI) 6949 and
RD 7810. Cluster V composed of seven genotypes namely 130 9074. BD 9079. RD 9080, RD
9081. RD 9087 and 131) 6959. Cluster VI was constituted of seven genotypes namely BD 9065,
RD 9100, BD 9104, RD 7811, RD 7812 and BD 7814.
'fable 18. Distribution of 40 genotypes of Mustard indifferent clusters
Clusters Number Of
Name of genotypes t\umbcrrng of
gcnotyp es genotypes
SAUYC. RD 9069, RD 9086, BD 9088, BD 6948 19, 37, 38, 39,40
Ll 130 9062. BD 9063, RD 9064, 80 9067, 131) 9071. 1,2, 3,4.6. 7, 13, 81)9073,1109082. RD 9084, RD 7108, RD 9066 15,35,36
III 5 RD 9068, RD 9075, RI) 9083, 131) 9085, RD 9077 5,9, 14. 16,23
IV 6 RD 9070, 130 9078, 130 9099, BD 9106, RD 6949, 21, 24, 25, 28, 29. RD 7810 1 30
V 7 130 9074. BD 9079, RD 9080, RD 9081, 130 9087, 8, 10, II, 12, 17. RI) 6956, BD 9076 18, 22,
VI 7 RD 9065, 131) 9100, RD 9104. BD 7811, RD 7812, 20, 26, 27, 31. 32, RD 7813, RD 7814, 33,34
68
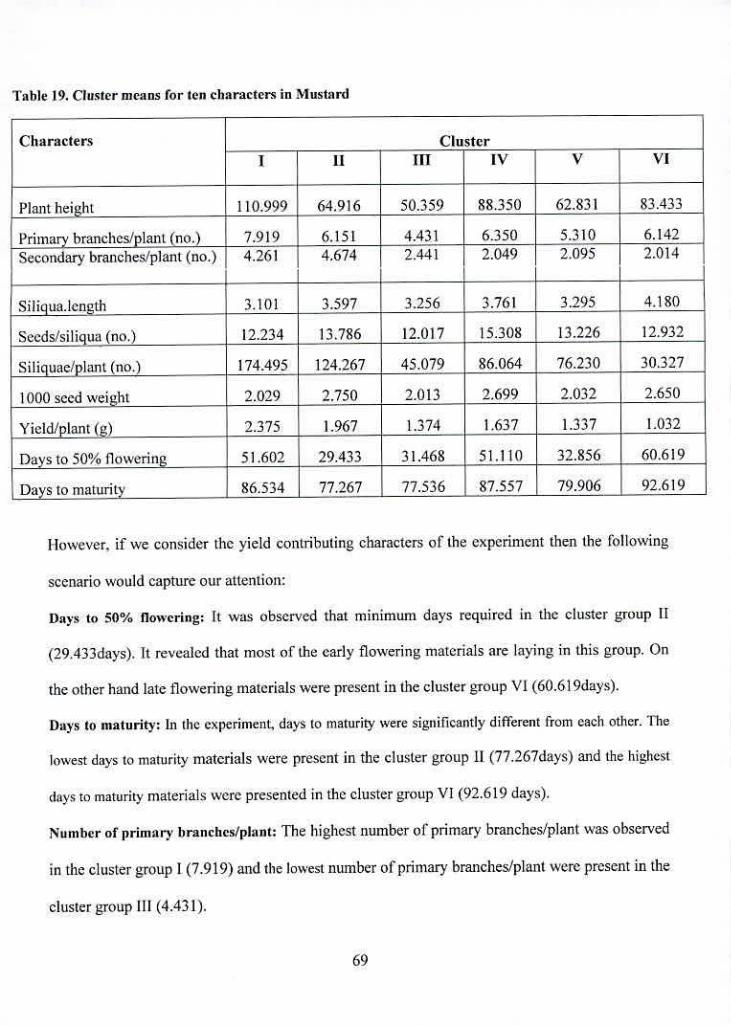
Table 19. Cluster means for ten characters in Mustard
Characters Cluster I 11 lIT! IV V VI
Plant height 110.999 64.916 50.359 88.350 62.83 I 83.433
Primary branches/plant (no.) 7.919 6.151 4.431 6.350 5.310 6.142
Secondary branches/plant (no.) 4.261 4.674 2.441 2.049 2.095 2.014
Siligua.lcngth 3.101 3.597 3.256 3.761 3.295 4.180
Sceds/siliqun (no.) 12.234 13.786 12.017 15.308 13.226 12.932
Siliquae/plant (no.) 174.495 124.267 45.079 86.064 76.230 30.327
1000 seed weight 2.029 2.750 2.013 2.699 2.032 2.650
Yicld/plant(g) 2.375 F1,967 1.374 1.637 1.337 1.032
Days to 50% flowering 51.602 29.433 31.468 51.110 32.856 60.619
Days to maturity 86.534 J 77.267 77.536 87.557 79.906 92.619
Flowever. if we consider the yield contributing characters of the experiment then the thllowing
scenario would capture our attention:
Days to 50% flowering: It was observed that minimum days required in the cluster group 11
(29.433days). It revealed that most of the early flowering materials are laying in this group. On
the other hand late flowering materials were present in the cluster group Vi (60.61 9days).
Days to maturity: In the experiment, days to maturity were significantly different from each other. The
lowest days to maturity materials were present in the cluster group II (77.267days) and the highest
days to maturity materials were presented in the cluster group VI (92.619 days).
Number of primary branches/plant: The highest number of primary branches/plant was observed
in the cluster group 1(7.919) and the lowest number of primary branches/plant were present in the
cluster group 111(4.431).
WE
Number of secondary branches/plant: It was observed that the highest number of secondary
rayi n'l....i ....... IflUt- L.'Lt S CUJU II. I II I¼Sb1 L IItSIItL)& L1S .LUItUQlJ
branches/plant was in the cluster group Ill. IV. V. VI.
Length of siliqua: It was found that most of the materials were laying in this group. The highest
length of siliqua was observed in the cluster group VI (4.180cm).
Number of seeds/siliqua: This was a yield contributing character. The highest value was observed
in the cluster group IV (15.308) and the second highest value was observed in the cluster group
V (13.226). The other cluster groups were similar.
Number of siliquac/plant: The highest number of siliquac/plant was observed in the cluster group I
(174.495) and the lowest number of siiiquaeiplant was present in the cluster group VI (3U.32/).
1000 seed weight: 1000 seed weight was observed same in all the cluster groups.
Yield/plant: The highest mean was observed in the cluster group I (2.375g) and the other cluster
groups were similar.
According to the above discussion it could be recommended that the materials present in the
cluster II were early maturing and simultaneously high yielding as other yield contributing
characters were also high in this group.From the class mean values it was observed that all the
cluster mean values for number of primary branches/plant, number of secondary branches/plant,
length of siliqua, number of secds/siliqua, 1000 seed weight, yield/plant were more or less similar.
The maximum range of variability was observed for the characters plant height (50.359-
110.999cm), days to 50% flowering (29.433-60.6 19 days) and days to maturity (77.267-92.619
days) among all the studied characters in six clusters.
Cluster IV and VI include mainly late flowering and late maturing genotypes with low yield, but
they were highly heterogeneous in nature. The high yielding lines belonged to early flowering
70
and early maturing groups, II and Ill. To develop high yielding varieties/lines, genotypes of
groups could be used in hybridization programme.
4.33 Canonical Variate Analysis (CVA)
Canonical Variate Analysis was performed to compute the inter-cluster Mahalanobis's values.
Statistical distances represent the index of genetic diversity among the clusters. The average intra
and inter-cluster distance (D2) values were presented in Table 20. Results indicated that the
highest inter-cluster distance was observed between I and VI (12.443), lollowed by I and Ill
(11.719). 11 and VI (9.402), 11 and V (9.272), I and IV (7.835) and land 11(6.531). The lowest
inter-cluster distance was observed between the cluster Ill and V (2.513) followed by IV and V
(3.332) and II and V (4.016), whereas a similar type of distance was found between!! and IV
(5.297), V and VI (5.796) and II and 111 (5.909), suggesting a close relationship among those
clusters (Figure 3). The inter-cluster distances were larger than the intra-cluster distances
suggesting wider genetic diversity among the genotypes of different groups (Table 17 and Figure
2). Islam (1995) obtained larger inter-cluster distances than the intra-cluster distances in a
multivariatc analysis.
I lowever. the maximum inter-cluster distance was recorded between clusters I and VI Ibliowed
by between I and III. Genotypes from these clusters can be used in hybridization programme.
The intra-cluster divergence varied from 0.0203 to 1.596, maximum for cluster V, which was
comprised of five genotypes of diverse origin, while the minimum distance was observed in
cluster II that comprised ten genotypes.
Results obtained from different multivariate techniques were superimposed in figure 2 from
which it may be concluded that all the techniques gave more or less similar results and one
technique supplemented and confirmed the results of another one
71
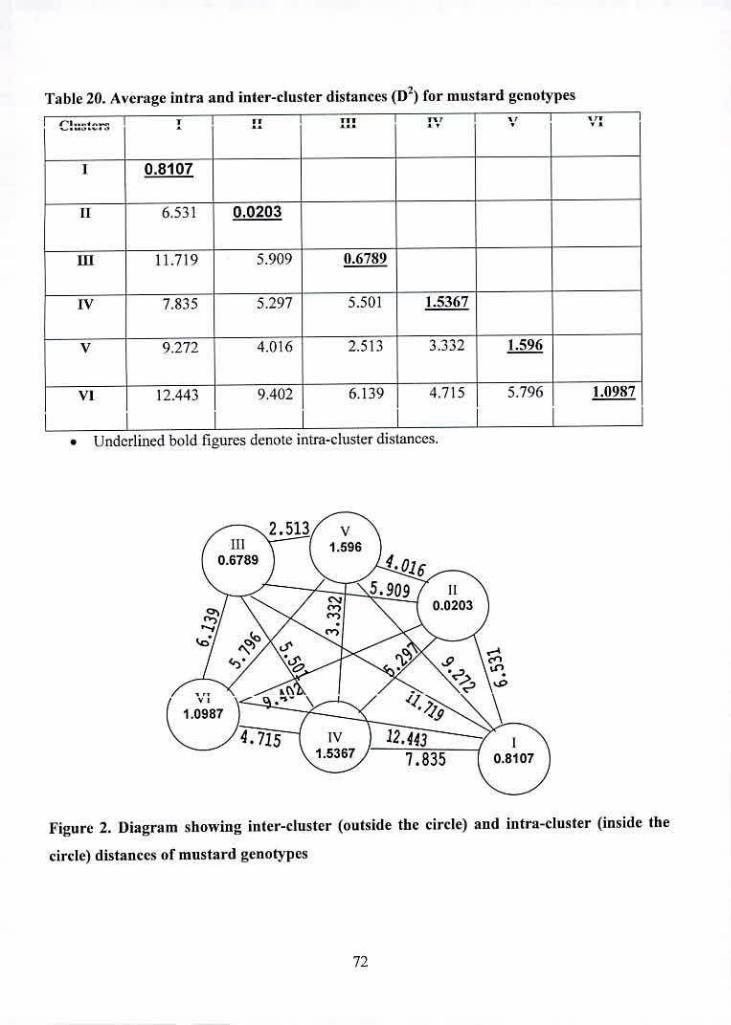
Table 20. Average intra and inter-cluster distances (D2) for mustard genotypes
1 0.8107
11 6.531 0.0203
111 11.719 5.909 0.6789
IV 7.835 5.297 5.501 1.5367
V 9.272 4.016 2.513 3.332 1.596
Vi 12.443 9.402 6.139 4.715 5.796 1.0987
. Underlined bold figures denote intra-cluster distances.
V -N 2.513( 1.596
0.6789
II 0.0203
Vt
1.0987 iv _________________________________________________________
7.835 0.8107
Figure 2. Diagram showing inter-cluster (outside the circle) and intra-cluster (inside the
circle) distances of mustard genotypes
72
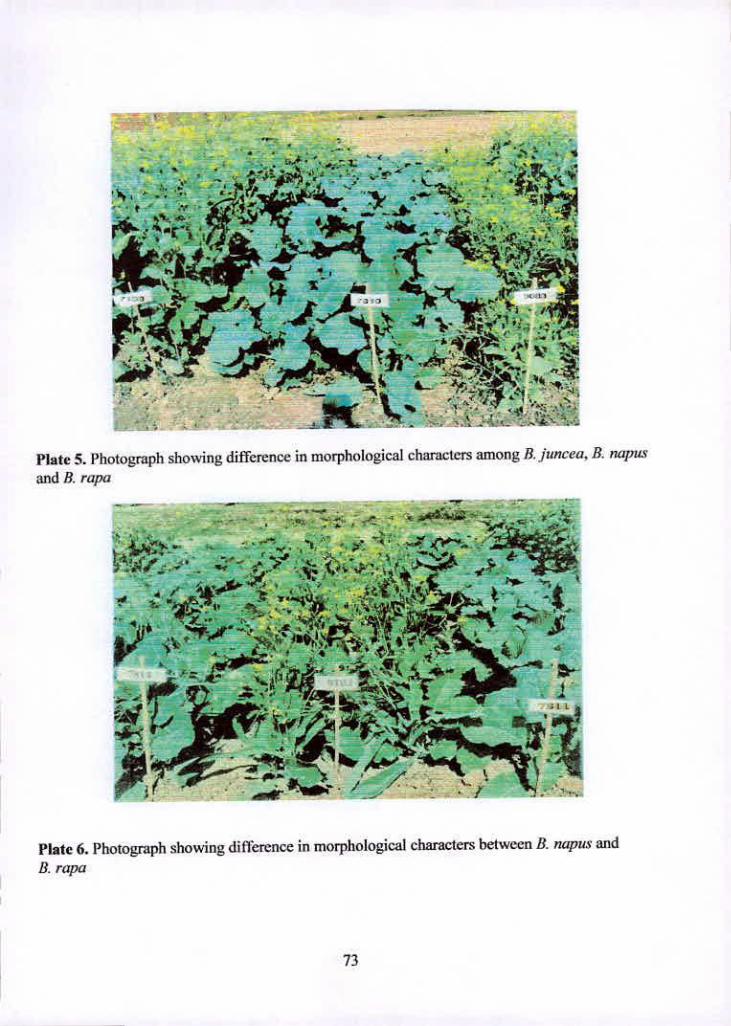
:
-. tI
..
• • ._-s. -.
t • .Ii a::
...:
44 .•t.& ,.
LM \'Ib.
Plate 5. Photograph showing difference in morphological characters among B. juncea. B. napus
and B. rapa
V.
- /volt. - l.a.. ',-
.1' 4* LflSi
1
Plate 6. Photograph showing difference in morphological characters between B. napus and
B. rapa
'ii
The clustering pattern of the genotypes revealed that varieties/lines originating from the same
places did not form a single cluster because of direct selection pressure. This indicated that
geographic diversity was not related to genetic diversity that might be due to continuous
exchange of genetic materials among the countries of the world. Same results have been reported
I,..h4.W,.-.J .,..4 A.,.4/1()C\. A..A...Afl .....
"5L%t tIS5sSS 'fl A & t £ tLLS&5J U aana. t_ I JUT) III L'S V VY U 1SIL'3t0.IU, I dt4 CI LU. I 707) '
sunflower; Verma (1970) in groundnut and soybean.lt had been observed that geographic
diversity was not always related to genetic diversity and therefore, it was not adequate as an
index of genetic diversity. Murty and Arunehalam (1966) studied that genetic drift and selection
in different environment could cause greater diversity than geographic distance.Furtherrnore,
there was a free exchange of seed material among different region, as a consequence, the
characters constellation that might be associated with particular region in nature, lose their
individually under human interference, and however, in some cases effect of geographic origin
influenced clustering that was ivhy geographic distribution was not the sole criterion of genetic
diversity.
The free clustering of the genotypes suggested dependence upon the directional selection
pressure applied for realizing maximum yield in different regions; the nicely evolved
homeostatic devices would favor constancy of the associated characters would thus
indiscriminate clustering. This would be suggested that it was not necessary to chose diverse
parents for diverse geographic regions for hybridization.
74
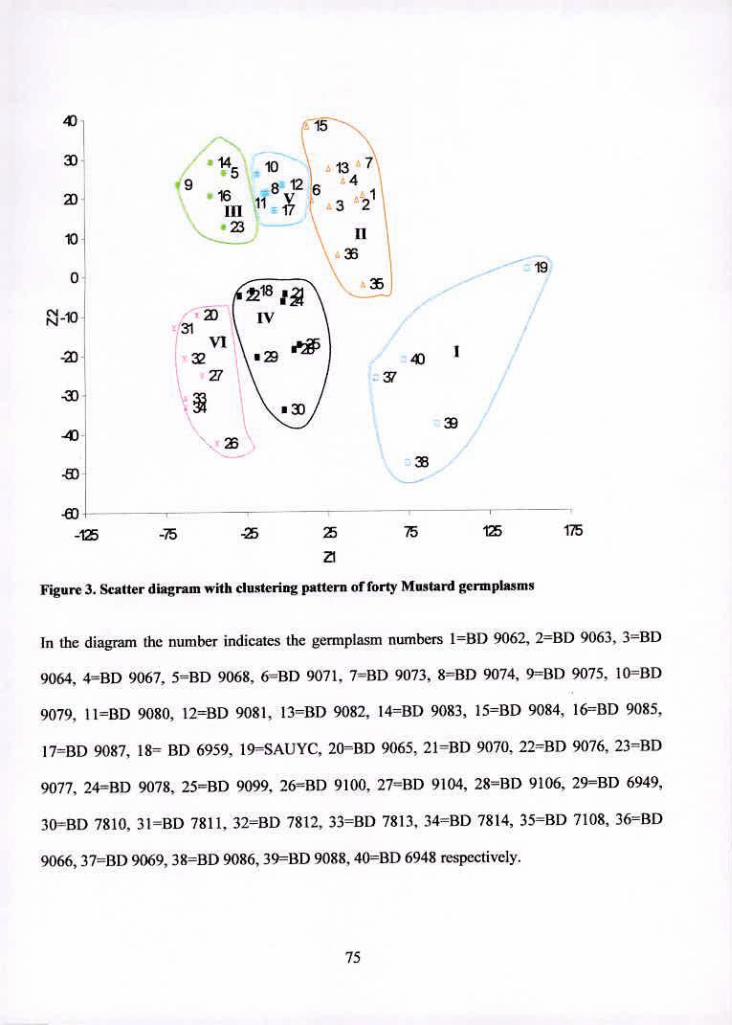
40 15
3) 145 10 13
16 811 .326 321
III 17
10 23 11
35
iv \ 31 V1\
:2 v29 1 / 37
-43 3
-60
-13 -75 - 3 75 13 175
a Figure 3. Scatter diagram with clustering pattern of forty Mustard gcnnplasms
In the diagram the number indicates the germplasm numbers IBD 9062, 2BD 9063, 3BD
9064, 4=BD 9067. 5=BD 9068, 6=BD 9071. 7=13D 9073, 8='BD 9074, 9=I3D 9075. I0=BD
9079, II =131) 9080, 12=131) 9081, 1 3=B1) 9082, 1 4=BD 9083, 1 5=BD 9084, 1 6=BD 9085,
I 7=BD 9087, 18= BD 6959, 1 9=SAUYC, 20Bi) 9065, 21BD 9070, 22'131) 9076, 23BD
9077, 24=BD 9078, 25=13D 9099. 26=BD 9100. 27=BD 9104, 28=BD 9106. 29=BD 6949,
30=BD 7810, 31=BD 7811, 32=BD 7812, 33=131) 7813, 34=BD 7814, 35=BD 7108, 36=BD
9066, 378D 9069. 38131) 9086, 39BD 9088, 40BD 6948 respectively.
FA
'A.:
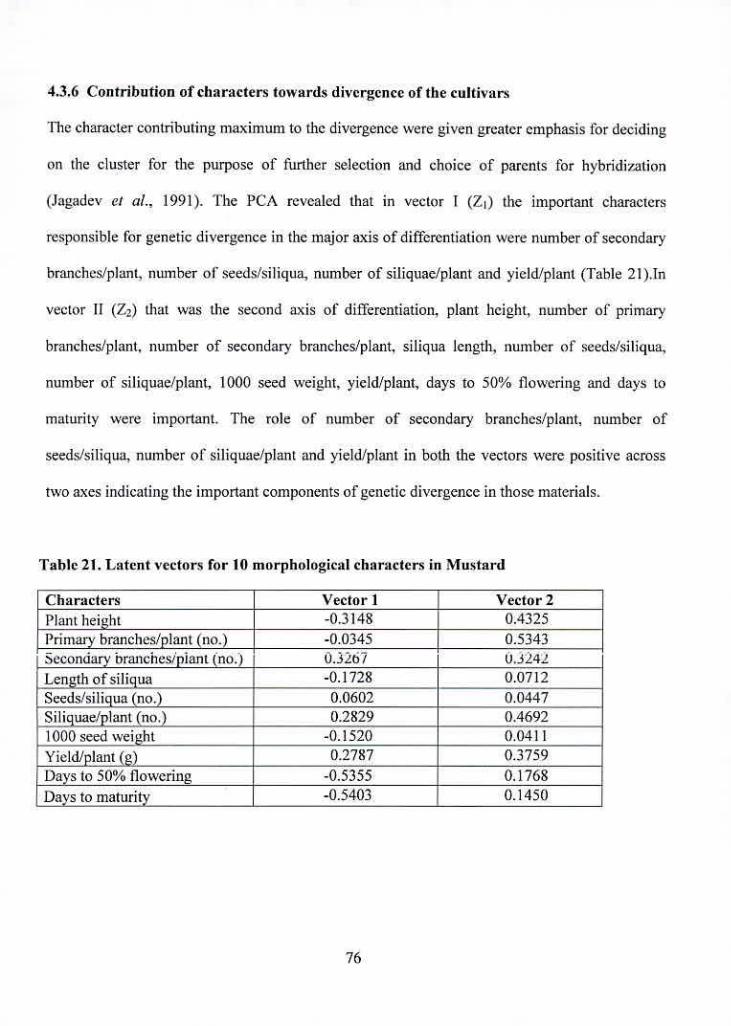
4.3.6 Contribution of characters towards divergence of the cultivars
The character contributing maximum to the divergence were given greater emphasis lbr deciding
on the cluster for the purpose of further selection and choice of parents for hybridization
(Jagadev cx al.. 1991). The PCA revealed that in vector I (Z) the important characters
responsible for genetic divergence in the major axis of differentiation were number of secondary
branches/plant, number of seeds/siliqua, number of siliquae/plant and yield/plant (Table 21).ln
vector 11 (Z2) that was the second axis of differentiation, plant height, number of primary
branches/plant. number of secondary branches/plant. siliqua length, number of' seeds/siliqua,
number of siliquae/plant, 1000 seed weight, yield/plant, days to 50% flowering and days to
maturity were important. The role of number of secondary branches/plant, number of
seeds/siliqua. number of siliquae/plant and yield/plant in both the vectors were positive across
two axes indicating the important components of genetic divergence in those materials.
Table 21. Latent vectors for ID morphological characters in Mustard
Characters Vector I Vector 2
Plant height -0.3148 0A325
Primary branches/plant (no.) -0.0345 0.5343 Secondary branches/plant (no.) 0.32o1 0.3242
Lcn.athofsHiqua -0.1728 0.0712
Seeds/siligua (no.) 0.0602 0.0447 Siliquae/pjant(tcL) 0.2829 0.4692
1000 seed weight -0.1520 0.0411
Yicldlplant (g) 0.2787 0.3759
Days to 50% flowering -0.5355 0.1768
Days to maturity -0.5403 1 0.1450 I
76
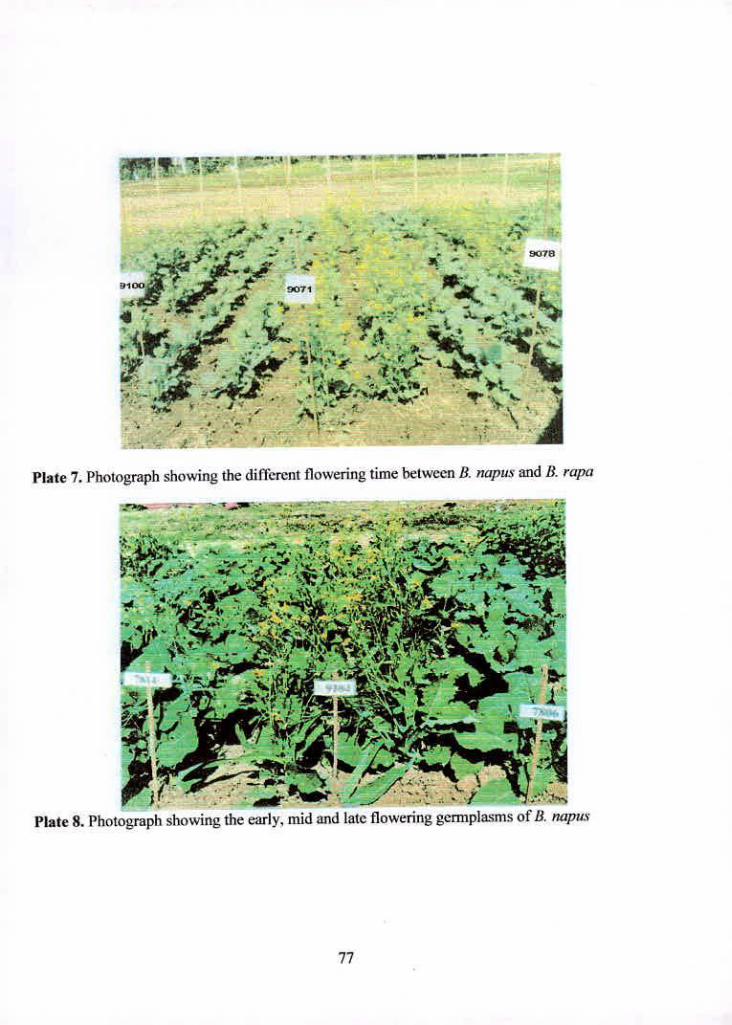
1..
i, -••' ,. ., - n._ -e — -
F
' sine
-C' -
10
0071
It
- %nko~
,-t t -I •'
-- i.
Plate 7. Photograph showing the different flowering time between B. napus and B. rapt:
I-.
-;-
-a -Sf
-- ar es.
r t.- -- .ew. >- •:.--!
PlateS. Photograph showing the early, mid and late flowering germpla.sms of B. napus
77
4.3.7 Comparison of different multivariate techniques
The clustering pattern of D2 analysis through non-hierarchical clustering had taken care of
simultaneous variation in all the characters under study. However, the distribution of genotypes
in diflèrent clusters of the D2 analysis had followed more or less similar trend of the 71 and 72
vector of the principal component analysis. The D2 and principal component analysis were found
to be alternative methods in giving the information regarding the clustering pattern of genotypes.
However, the principal component analysis provided the information regarding the contribution
of characters cowards divergence of Mustard.
4.3.8 Selection of cultivars for future hybridization
Genotypically distant parents were able to produce higher heterosis (Falconer. 1960 Moll ci (i!.,
1962; Ramanua.m cial., 1974; Chauhan and Singh, 1982; Arunachalam ci at, 1981; (ihaderi ci
at, 1984: Mian and Bhal. 1989). Beside this. Arunaehalam ci at (1981). reported in groundnut
that the higher heterosis for yield and its components could be obtained from the crosses between
the intermediate divergent parents than extreme ones. Mian and BahI (1 989) also reported the
sante in chick pea that medium divergent genotypes showed higher heterosis in crosses for
different yield contributing characters. Srivastava and Arunachalam (1977) reported in triticale
that very high or very low parental divergent failed result in heterosis.
Considering this idea and other agronomic performances, the genotypes 13D-6948 and SAUYC.
from cluster I; BD-9063. RD-9064 and 13D-9071, from cluster Il; B1)-9068 and 13D-9077 from
eI',cu'r 111 flfl..01Y72 IltI..C)Ifl( 'nrl Rfl..,c040 ('rn.n rI.ielar IV. flflOfllO nnA flfl OhtQl C,.n.w. ...
cluster V and BD-9100 and BD-7812 from cluster VI were selected as promising gcrmplasnis.
78
h
Chapter V
SUMMARY AND CONCLUSION
The 40 genotypes were used to show variation, heritability, genetic advance and genetic advance
in percentage of mean, genetic diversity, character associations, and direct and indirect effect of
dillérent traits on yield. All the genotypes varied significantly with each other for all the studied
character-, indicated the presence of considerably variations among the genotypes studied.
In B. ?IOUX RD-78 10 was late flowering and 13D-9 100 was late maturing type genotype while
BD-9070 was early flowering and early maturing type. 00-9100 was the tallest plant, whereas
BD-9077 was the shortest plant and produced lowest number of primary branches/plant. BD-
9104 produced highest number of primary and secondary branches/plant while 13D-9065 and
13D-7810 had no secondary branches/plant. BD-9099 showed highest number of siliquae/plant
and BD-78 11 showed lowest. BD-9065 produced highest number of seeds/siliqua and BD-9 100
produced lowest number. The length of siliqua was highest and lowest in the genotype 13D-9 106
and 130-9078 considerably. Highest 1000 seed weight was recorded in BD-7813 while lowest in
130-9104. 130-9078 produced highest yield/plant whereas lowest was produced by BD-78 B.
The phenotypic variance for all the characters was considerably higher than the genotypic
variance. Number of primary branches/plant, number of secondary branches/plant, length of
siliqua. 1000 seed weight and yield/plant showed minimum difference between genotypie and
phenotypic variance which indicated low environmental influence on this character which might
be due to their genetic control. Plant height. number of primary branches/plant, length of siliqua,
1000 seed weight. days to 50% flowering and days to maturity showed low genotypie and
phenotypic co-efficient of variation.
79
Number of secondary branches/plant and number of siliquac/plant showed high heritability
coupled with high genetic advance and very high genetic advance in percentage of mean, where
as plant height, number of primary branches/plant, length of siliqua, number of seeds/siliqua and
yield/plant showed high heritability with moderate genetic advance and genetic advance in
percentage of mean that revealed the possibility of predominance of additive gene action in the
inheritance of this character therefore, the characters could be improved through selection
process.
Correlation revealed that yield/plant had sigiiilicant positive association with number of
siliquae/plant. Path analysis revealed that number of seeds/siliqua and number of siliquae/plant
showed positive direct effect on yield/plant.
In B. juncea, BD-9069 was late flowering and late maturing type while BD-9066 was early
flowering and 13D-9086 was early maturing type. BD-91 00 was the tallest type plant, whereas
13D-9069 was the shortest type plant and produced highest number of primary and secondary
branches/plant. BD-9066 produced lowest number of primary branches/plant while BD-9086 and
BD-7 108 had lowest number of secondary branches/plant. 13D-9088 showed highest number of
siliquae/plant and BD-9066 showed lowest in number. BD-7108 produced highest number of
seeds/siliqua and BD-9086 produced lowest number. The length of siliqua was highest in BD-
7109 and lnwrct in Rfl-90R6 Highest 1000 seed weight was recorded in BD-694? whik lowest
in RD-9088. BD-9069 produced highest yield/plant whereas lowest was produced by RD-7 108.
Number of primary branches/plant, length of siliqua, number of seeds/siliqua, 1000 seed weight
and yield/plant showed minimum difference between genotypic and phenotypie variance.
Number of primary branches/plant, length of siliqua, number of seeds/siliqua, number of
siliquae/plant. 1000 seed weight and days to maturity showed low gcnotypic and phenotypic co-
0
efficient of variation. High heritability coupled with high genetic advance and genetic advance in
percentage of mean was recorded for the character number of secondary branches/plant.
Correlation co-efficient revealed that yield/plant had significant positive association with number
of primary branches/plant. number of secondary branches/plant, days to 50% flowering. days to
maturity and number of siliquae/plant. Path analysis revealed that number of primary
branches/plant, number of secondary branches/plant, days to 50% flowenng, days to maturity
and number of siliquae/plant showed positive direct effect and plant height, length of siliqua,
number of seeds/siliqua and 1000 seed weight showed negative direct effect on yield/plant.
In B. rispa. BD-9075 was late flowering and late maturing while BI)-9085 was early flowering
and early maturing. SAUYC was the tallest type plant, whereas BD-9075 was the shortest.
SAUYC produced highest number of primary branches/plant and 130-9075 produced lowest.
Highest number of secondary branches/plant was obsened in l31)-9062 while BD-6956 had no
secondary branches/plant. SAUYC showed highest number of siliquae/plant and BD-9075
showed lowest. SAUYC produced highest number of seeds/siliqua and BD-9079 produced
lowest number. The length of siliqua was highest and lowest in SAUYC and 130-9075
respcetively. Highest 1000 seed weight was recorded in BD-9068 while lowest in BD-9081.
SAUYC produced highest yield/plant whereas lowest was produced by 130-9084.
Number of primary branches/plant, length of siliqua. 1000 seed weight and yield/plant showed
minimum dillèrence between genotypic and phenotypie variance. Length of siliqua, number of
seeds/siliqua, days to 50% Ilowering and days to maturity showed low genotypic and phenotypic
coefficient of variation. High heritability coupled with high genetic advance and genetic advance
in percentage of mean was recorded for the character of number of secondary branches/plant,
1000 seed weight and yield/plant.
FX
Correlation revealed that yield/plant had significant positive association with plant height,
number of primary branches/plant, number of secondary branches/plant, length of siliqua,
seeds/siliqua and number of siliquae/plant. Path analysis revealed that plant height, number of
primary branches/plain, number of secondary branches/plant, length of siliqua, days to 50%
Ilowering, number of seeds per siliqua, number of siliquae/plant and 1000 seed weight showed
positive direct effects on yield/plant.
Significant difference among the clusters was observed through multivariate analysis, Cluster
analysis and Canonical variate analysis. As per PCA, D2 and Cluster analysis, the genotypes
were grouped into six different clusters. The highest inter-cluster distance was observed between
I and VI and the lowest inter-cluster distance was observed between III and V. The highest and
lowest intra-cluster distances were observed in cluster V and I! respectively. Genotypes included
in cluster V were important for number of secondary branches/plant whereas plant height,
number of primary branches/plant, siliqua length, number of seeds/siliqua. number of
siliquae/plant. 1000 seed weight, yield/plant, days to 50% flowering and days to maturity were
remarkable feature for cluster II. Considering diversity pattern, genetic status and other
agronomic performances, 13D-6948 and SAUYC, from cluster I; 13D-9063, BD-9064 and BD-
9071, from cluster 11; BD-9068 and BD-9077 from cluster III; BD-9078, BD-9106 and BD-6949
from cluster IV; IID-9079 and Bl)-9081 from cluster V and BI)-9 100 and BD-7812 from cluster
VI might he considered better parents for efficient hybridization programme. Involvement of
such diverse genotypes in crossing programme may produce desirable segregants. So. divergent
genotypes are recommended to use as parent in hybridization programme. Results of present
study revealed that the characters: number of secondary branches/plant, number of siliquae/plant
and yield/plant contributed maximum divergence among the mustard genotypes.
REFERENCES
Alam, M.S., Rahman. A.R.M.S. and Khair, A.13.M.A. (1986). Genetic variability and
character association in groundnut Arachis hypogaca L.). Bangladesh J.4gric.
10(4): 9-16.
Allard. R.W. (1960). Principles of Plant Breeding. John Willey and Sons. Inc. New York.
p. 36.
Anand. I.J. and Rawat, D.S. (1984). Genetic Diversity, combining ability and heterosis in
brown mustard. Indiana'. Gene!. 44: 226-234.
Andrahennadi, C.P., Wecrasena, L. A. and Abcryrantne, M.D.R.S. (1991). Evaluation of
brown mustard germplasms in Srilanka. Cruciferac Newsletter. 14(15): 62-63.
Anonymous, 2003. A guide book on production of oil crops in Bangladesh. Department
of Agricultural Extension. Ministry of Agriculture. Govt. of the Pcopl&s Republic
of Bangladesh and FAO/UNDP project BGD/79/034. Strengthening the
Agricultural Extension Service, Khamarbari, Farmgate, Dhaka.
Arunachalam, V. (1981). Heterosis for characters governed by two genes in relation to
genetic divergence and specific combining ability in groundnut (Arac/us hypogaca
L) Eup/zylica. 33: 33-39.
Arunac'naiam. V. and Amrithacievarathinam, A. (1981). An analysis of character
association in three varietals form of B. campesiris L. GeneL Agri. 31(2): 171-I80.
Azad. M.A.K. and 1-larnid, M.A. (2000). Genetic variability, character association and
path analysis in groundnut (Arachis hypugea L.). Thu/i Agric.Sci. 33(3-4): 153-
157.
Baneijec, 1-1.1.. Rhattachaijee, II. and Das, M. (1968). A note on the relationship between
growth and yield of the yellow sarson var. Pram. Indian J. Agron., 13: 203-204.
BBS. (2005). Monthly Statistical Pollution of Bangladesh Bureau of Statistics (August).
Administration and MIS wing, Bangladesh Secretariat, Dhaka. p. 280.
BBS. (2004). Statistical yearbook of Bangladesh. Bangladesh Bureau of Statistics.
Statistic Division, Ministry of Planning, Govt. of the People's Republic of
Bangladesh. p. 96.
83
J3engtsson. P.P., Basu, M.S. and Reddi, P.S. (1972). Genetic variability, character
association and path coefficient of quantitative traits of groundnut. India,? .1. Agric.
41(2): 215-284.
l3hardwaj. R.P. and Singh. R.R. (1969). Morphological and genetic variability in brown
sarson (lirassica cwnpestrtc var. Brown sarson). Madras J. Agric. 56(1): 28-31.
Biswas. K.P. (1989). Performance evaluation of 18 genotype of oleiferous Brassica.
Proceedings of the 4th Annual Bangladesh Sci. Conf. p. 70.
Burton. G.W. (1952). Quantitative inheritance in grass pea. Proc. 6 ° Grassl. Cong. I:
277-283.
Campbell, D.C. and Kondra, Z.P. (1978). A genetic study of growth characters and yield
characters of rape. Euphyilca. 27: 177-183.
Campbell, D.C. and Kondra. 7..P. (1978). Relationship among growth patterns, yield
components and yield of rapeseed. Can. .1. PL Sc!. 58: 87-93.
Chandola. R.F., Dixit. P.K.. Sharina. K.N.. Saena. O.K. (1977). Variability in B. Juncea
under three environments. Indian I. Agric. Sc!. 47(9): 680-683.
Chaturvedi. OS.. Singh. B.B. and Chauhan, Y.S. (1988). Physiological analysis of yield
in Indian mustard wider irrigated condition. Indian J. P1. physlo. 31(l): 38-44.
Chaudhari. L.B. and Prasad. B. (1968). Genetic variation and heritability of quantitative
characters in Indian mustard. Indian J. Agric. Sc!. 38(5): 820-825.
Chaudhury, 13.1).. Thakural. S.K., Singh, D.P. and Singh, P. (1987). Genetics of yield and
its components in Indian mustard. Narenda Deva J Agril. Res. 3(l):37-43.
Chaudhury, PlC., Singh, P. and Kumar. A. (1990). Association and lnterdcpendence of
morpho-physiological characters under moisture stress in Bra.isica. Belirage Zar
Tropic/zen Landuirtshaji. 18(1): 43-47.
Chauhan. J. and Singh. P. (1985). Association of some morpho-physiological
determinants with seed yield in toria (B. ca;npesirtc L. var. Toria). Jndian I. Agric.
Sci, 55(3): 42-43.
Chauhan. V.S. and Singh, P.K. (1982). Correlation and Path analysis in lentil. Len.t 9:
19-22.
84
Chay, P. and Ihurling. N. (1989). Identification of Genus controlling siliqua length in
spring rapeseed and their utilization for yield improvement. Pt Breed. 103(1): 54-
62.
Chen. C.. liwu, K.K.. flu. C.P. and Lin. M.S. (1983). Selection criteria for yield
improvement in rape. I. Agri. Asso. China. 124: 63-73.
Chowdhury, M.A.Z.. Mia, M.F.C., Afjal. M.A. and All, M.M. (1970). Comparative study
ofD2 and metroglyph analysis in groundnut. ThailandJ. Agric Sd. 31(3): 436-443.
Comstock, K. and Robinson. P.R. (1952). Estimation of genetic advance. Indian,!. 1k/i.
6(2): 171-174.
Dabholkar. A.R. (1992). Elements of l3iornetrieal Genetics. Concept publishing, New
Dhelhi, India.
Das, M.L. and Rahman. A. (1994). Evaluation of mutants of rapeseed lbr earliness, seed
yield and response to change environments in M2 generation. Bangladesh .1.
Nuclear Agric. 10: 75-80.
Das, M.L. and Rahman, A. (1989). Correlated response and path analysis in mustards (13.
cainpestris). Bangladesh.!. Sd. Res. 7(1): 37- 41.
Das. M.L. and Rahman, A., Khan, M.H.R. and Miah. A.J. (1984). Correlation and path
coefficient studies in soybean. Bangladesh .1. )3ot. 13(1): 1-5.
Das, M.L., Malek. M.A. and Rahnian. A. (1999). Performance of gamma irradiated NI5
mutants of rapeseed in different locations of Bangladesh. Bangladesh.!. Agri. 24(1):
115- 119.
Das, M.L., Rahman. A., Malek, M.A. and Pathan, A.J. (1995). Stability and fatty acid
analysis for selecting promising mutants of rapeseed. Bangladesh .1. Nuclear Agri.
Degby, P., Galway. N and Lame, P. (1989). Gcnstat 5A second course. Oxford Science
Publications. Oxford. pp. 103-108.
Deshzrnikh. S.N.. Basu, M.S. and Reddi, P.S. (1986). Genetic variability, character
association and path coefficient of quantitative traits in Virginia bunch varieties of
groundnut. Inthan J. Agric. Sci.56( 12): 816-821.
Dewey. D.R. and Lu. K.H. (1959). A correlation and paib ene.ffirient annIvsi of
components of crested wheat grass seed production. Agron. 1. 51 : 515-518.
85
Dhillon. S.S., Labana, K.S. and Ahuja. K.L. (1990). Character association analysis in
Indian mustard. .1. Res. 27(3): 385-388.
Falconer, D.S. (1960). Introduction to quantitative genetics. Oliver and Bond. London.
pp. 304-JOS.
FAO. (2005). Production Year Book, Food and Agricultural Organization of United
Nations, Rome 00108, Italy. Vol. 57. pp. 115-133.
Ohaderi, A.. Shishegar, N4., Regai, A. and Ehdaie, B. (1984). Multivariate analysis of
genetic diversity for yield and its components in mungbcan. J. American Soc. Hon.
Sci. I 04(6):728-732.
Ohosh, R.K. (1998). Path analysis of important growth functions of Indian mustard.
Indian. I. Agron. ('rop Sci. 160(2): 116-121.
Ohosh. R.K. and Chatterjee, B.N. (1988). Path analysis of important growth functions of
Indian mustard. J. Agron. C'ropSci. 160(2): 112-118.
Golakia, P.R. and Makne. V.G. (1991). Genetic diversity in Spanish bunch groundnut. J.
Maharas(ra Agric. Univ. 16(3): 3 37-339.
Golakia. P.R. and Makne. V.G. (1992). D2 analysis in Virginia runner groundnut
genotypes. Indian J. Genes. 55(3): 252-256.
Cirafius. J.F. (1959). Ileterosis in barley. Agron. J. 51: 515-518.
Grosse, C. and Cieisler. G. (1988). Variability in the physiological yield characteristics
and assortment of water rape cultivars yield components. Mil:cilzrngen der pflangen
haurissensclzaflen, 1: 67-69.
Gupta, M.L.. Labana. K.S. and Badwal. S.S. (1987). Correlation and path coefficient of
metric traits contributing towards oil yield in Indian mustard. International rapeseed
congress. Poznan. Poland. p. 107.
(Eupta, sic. and Labana. K.S. (1939). Iriple test cross analysis for some
physiomorphological trait in oil yield in Indian mustard. Proceedings of the 71hi
International Rapeseed Congress. Poland. May 1987. pp. 11-14.
Ilan. J.X. (1990). Genetic analysis of oil content in rape Bra.csica napus. Oil crops of
China. 2: 1-6.
86
Harch, 13.11, Basford. K.E., Delacy, I.H. and Lawrence. P.K. (1999). The analysis of
large scale data taken from the wild groundnut Arachis hypogaea L.) germplasms
collection. Fyphyska. 105(2): 73-82.
Islam, M.S. (1995). Genetic divergence in groundnut (Arachis hypogaea L.). M. S. thesis,
BSMRAU, Gazipur.
Islam, M.S. and Islam, M.O. (2000). Genetic diversity in rapesced and mustard (Brassica
sp.). Bangladeshi. Pt Breed. Gene:. 13(2): 25-30.
iagadev, P.N., Samal. K.M. and Lenka. L. (1991). Genetic divergence in rape mustard.
Indian .1. Gene!. 1'!. Breed 51: 465-466.
Jam, AK., Tiwaari, A.S. and Kushwah. V.S. (1988). Genetics of quantitative traits in
Indian mustard. indian J. Gene!. P1. Breed. 48(2): 117-119.
Jatasra. D.S. and Paroda. R.S. (1978). Genetic divergence in wheat under different
environmental conditions. cereal Res. Q,?n?n. 6: 307-31 7.
Jeger, M.1., Garethojones. D. and Griffith, F. (1983). Components of partial resistance of
wheat seedlings ol septoria nod rum. Euphy:ica. 32: 575-584.
Johnson: Herbert, XV.; Robinson. H.F. and Comstoek, R.E. (1955). Estimates of genetic
and environmental variability in soyaheans. Agron. .1. 47: 314-318.
Kakroo, P. and Kumar. S. (1991). Genetic determination of seed yield through it's
components in Indian mustard. JndianJ. Gene!. Pt. Breed 51(2): 82.
Katiyar. A.P. and Singh. B. (1974). Inter-relationship among yield and its components in
Indian mustard. Indian J. Agric. Sd. 44: 287-290.
Katiyar, B.S.. Lee, J. I. and Chae. Y.A. (1974). Genetic sthdies on some agronomic
characters in rapeseed. Korean I. Breed. 21(1): 22-27.
Katule, 13.K., Patil. F.B. and Thombre. M.V. (1991). Genetic divergence in semi-
spreading groundnut. .1. Mctharaslra Agric. Univ. 16(3): 450.
Kaul, A. K. and Das. M. L. (1986). Oilseeds in Bangladesh. Bangladesh-Canada Agric.
Sector Tcam-MOA. Bangladesh. p. 323.
Khera, M. K. and Singh, P. (1988). Sensitivity and performance of some Jirassica napu.c
genotypes in stress and non-stress environments. ('rop Improv. 15(2): 209-211.
Khulbe. R.K. and Pant. D.P. (1999). Correlation and path coefficient analysis nf yield and
its components in Indian mustard. Crop Rat 1/isar. 17(3): 371-375
87
Koiaiah, K.C., Rao. C. P., Reddy. N.S. and Sharma. Y.R.B. (1986). Mahatonobis's &
and metroglyph analysis in mid-duration genotypes of rice. Indian J. Genes. 56(3):
151-156.
Kudla. M. (1993). Comperative analysis of winter swede rape genotypes. I3iulciyn
Jnstyiutu Ilodowli Roslin. 90(1): 99-107.
Kumar. C.1i.M.V., Arunachalarn. V. and Rao, P.S.K. (1996). Tdeotype and relationship
between morpho-physiological characters and yield in Indian mustard (B. juncea).
Indian .1. Agric. Sd. 66(1): 14-17.
Kumar, N., Bisht. J.K. and Joshi. M.C. (1988). Correlation and discriminant function
analysis in Indian mustard. Indian J. Agric. Sd. 58(1): 51-52.
Kumar. P., Yadava, T.P. and Yadav, A.K. (1984). Association of seed yield and its
component traits in the F2 generation of Indian mustard. Indian J. Agric. Sd. 54(5):
604-607.
Kumar, P., Yadava, T.P. and Yadava, A.K. (1991). Association of seed yield and its
component traits in the 12 generation of Indian mustard. Indian J. Agril. Sci. 61(7):
604-607.
Kuniar, S., Sangwan. R.S. and Yadava. I.S. (1999). Path coefficient analysis in Brassica
species under rainIèd conditions. cruc?ferae Ne;i'sletftr. 24: 59-60.
Kumar, V. and Singh. D. (1994). Genetics of yield and its components in Indian mustard
(Brass ku juncea L. Czern and Coss). (Trop Rn. 7(2): 243-246.
Labana. K.S., Ahuja, K.L. and Banga, S.S. (1987). Evaluation of some Ethiopian mustard
(l3rassica carl/zulu) genotype tinder Indian conditions. In 7111 International rapesced
congress. Poznan, Poland. p.1 15.
Labana, K.S., Chaurasia. B.D. and Singh. B. (1980). Genetic variability and inter-
character associations in the mutants of Indian mustard. Indian J. Agric Sd. 50(1):
803-806.
Lebowitz. R.J. (1989). Image analysis rneasurcnients and repeatability estimates of
siliqua morphological traits in B. campestris L. Euphytica. 43(1-2): 113-116.
Lckh, R.. Han, S., Singh, V.P.. Raj, L. and Singh, II. (1998). Variability studies in
rapeseed and mustard. Ann. AgriL Rn. 19(l): 87-88. yt0 /
i.t.t
88
Li. J. N., Qin, J. and Tang, Z.L. 1989. Analysis of variability of some genetic parameters
in segregating hybrid generations aiR. napus. Heriditus Bei/ing. 11(6): 4-7.
Lodhi, OP., Sineb. R.K. and Sharrna. S.C. (1979). Correlated response in brown sarson.
Indian .i. Genes. 39: 373-377.
Mahatanobis. P.C. 1936. On the generalized distance in statistics. Indian Proc. NaIL Inst.
Sci. 2: 49-55.
Mahto. N.R. (1996). Diversity in Indian mustard. Indian J. Agron. 45(l): 95-98.
Malek. M.A.. Das, M.L. and Rahman, A. (2000). Genetic variability, character
association and path analysis in rapeseed. Bangladesh I Agrk. Sci. 27(l): 25-59.
'A U,. r (•' I! _..JC....1- '1C'flC r • • iI I I I
LYInIIK, v ., oIiiLl. ax. aJlu C!iIII, Li. \I 77)). ..jviic UCUOLI ut secu ytetu tuati Quid uesitaOic
characters in rapesceci. Analysis 13/ol. (I.udhiana). 11(1/2): 94-97.
Masood, '1'.. Gilani, M.M. and Khan. F.A. (1999). Patti analysis of the major yield and
quality characters in Brass/ca cainpestri.....'In!. Pt Sci. 9(4): 69-72.
Mian, M. A. K. and BahI, P. N. (1989). Genetic divergence and hybrid perk rmance in
chickpea. Indian I (lenet. 49(l): 119-129.
Mishra. R. and Rac. S.K. (1990). Comparative study of D2 and nietroglyph analysis in
chickpea (Cicer ariet/nuns L.). Legume Res. 13(1): 25-35.
Mishra, R.M.. Kouth, G.K. and Bilaiya. S.K. (1987). 02 and metrogyiph analysis in
soybean. .1. Oitceed.vRes. 4(l): 103-107.
Mitra, S.K. and Saini. S.A. (1998). D2 and metroglyph analysis in mustard. Indian 3.
Gene!. 50(1): 120-125.
Moll, R.H.. Salbwana. W.S. and Robinson. H.F. (1962). Ueterosis and genetic diversity
in variety crosses in maize. C.'rnp Sd. 2: 197-198.
Murty. B.R. and Anand. U. (1966). Combining ability and genetic diversity in some
varieties/lines of Lignum itsitatissiui?il!??. Indian .1. Gene!. 26: 21-36.
Murty. B.R. and Arunachalarn, V. (1966). The nature and genetic divergence in relation
to breeding system in crop plants. Indian]. Gene!. 26: 188-198.
Nadaf. H. L., Habib, A.F. and Goud, J.V. (1986). Analysis of genetic divergence in
bunch groundnut.]. Ui/seeds Res. 3(l): 37-45.
89
Nanda. R.. l3hargava. S.C. and Tomar, D.P.S. (1995). Rate and duration of siliqua and
seed filling and their rotation to seed yield in Brassica species. Indian J. Agric. Sci.
64(4): 227-232.
Nasim. M., Rahman, L.. Quddus. M.A. and Shah-E-Alam, M. (1994). Correlation and
-.. &. •'•t•••.•'•••'• '. tfl•.
Nayar. 0. G. and George. K. P. (1969). Radiation induced tall mutant in Sesamurn
orientate L. Proc. .Syinp. Radiation and Radionictric Substances in Mutation
Breeding, DAE. Bombay. pp. 404-409.
Olsson. G. (1990). Rape yield-production components. Sversk Fortidning. 59(9): 194-
197. Cited from PL Br. Abs. 61(5): 588, 1991.
Panse V.G. (1957). Genetics of quantitative characters in relation to plant breeding.
Indian .J. Gene:. P1. Breed. 17: 318-328.
PateLM.Z., Reddy. M.V. Rana. B.S. and Reddy, B.J. (1989). Genetic divergence in
safflower. Indian .1. Gene!. 49(1): 188-198.
Paul, N.K., Joarder. 0.1. and Eunus. A.M. (1976). Genotypie and phenotypic variability
and correlation studies in B. juncea L. Zeitschrjfl fur pfiazenzuchtung. 77(2): 145-
154.
Ramanujam. S. and Rai. B. (1963). Analysis of yield components in Brassica cwnpestris
var. yellow sarson. Indian I. Gene!. 23: 3121-319.
Ramanujarn, S.. Tiwary, A.S. and Mehra, R.B. (1974). Genetic divergence and hybrid
performance in mungbean. Theor. App!. Gene!. 44(5): 211-214.
Rao, C.R. (1952). Advance Statistical Methods in Biometrical Research. John Wiley and
Sons. New York.
Reddy, V.R.G., Singh, B.N. and Rai. B. (1987). Analysis of genetic divergence in
spreading varieties of groundnut. Crop Itnprov. 14(2): 149-152.
Sachan. K.S. and Sharna, I.R. 1971. Muitivariate analysis of genetic divergence in
tomato. Indian,! Gene!. 31: 86-93.
Saini. H.C. and Sharnia. R.P. (1995). Model plant architecture through association and
path coefficient analysis in Indian eolza. Indiani. Agric. Rn. 29(3): 109-I 15.
Sandu. N.R. and Gupta. P.K. (1996). Genetic divergence in Brassica sp. Indian J. Agron.
62(2): 73-76.
90
Sengupta. U.K., Pal, M. and Jam, V. (1992). Influence of cnhanced UV radiation on
mustard cultivar response. Indian J. 1'!. Physiol. 3(3): 188-193.
Shabana, R., Shrief. S.A. and Gcister. U. (1990). Correlation and path analysis for some
new release spring rapeseed eultivars grown under different competitive systems. I.
Agron. Crop ScL 65(2-3): 138-143.
Shanmugarn A.S. and Rangasamy, S.R.S. (1982). Multivariate Analysis of genetic
divergence in black gram [Vigna mungo (L) Flepper]. Madras Agric. .1. 69(11):
701-706.
Sharma, S.K. (1984). Variation and correlation studies in Indian mustard (B. juncea).
Indian]. Agric Sd. 54(2): 146-147.
Shen, J.X., Fu. '1.D.. Yang. U.S., Shen. J.X., Eu, T.D. and Yang, U.S. (2002). 1-leterosis
of double low self incompatibility in oilseed rape (Brassica napus L.). AgriL Sd.
China. 7(1): 732-737.
Shivahare, M.D.. Singh, A.B., Chauhan. Y.S. and Singh, P. (1975). Path coefficient
analysis of yield component in Indian mustard. Jndianf. Agric Sd. 45(9): 422-425.
Sindhu, J.S., jThmed, S.. Singh, M.B. and Singh, K.P. (1989). Multivariate analysis in
blackgram [ Vigna inungo (L.)]. Legume Rex. 12(1): 35-37.
Singh B.D. (1990). Plant Breeding in Biometrical Teeniques. In.Plant Breeding. Kalyani
Publishers. pp. 100-125.
Singh. B.D. (2000). Plant Breeding. Kalyani Publishers, New Delhi. pp. 574-597.
Sinsih H. (192ó) (lenetic vnriahi1ily, heritability nnd lroiight. !nd!L:e' analysis in BraIca
species.]. Oitcecds Rn. 3(2): 170-177.
Singh. P. (1983). Studies on genetic variability and diversity of rice. Madras Agric. J
70(7): 436-440.
Singh, R.K. and Chaudhary. B.D. (1985). Biometrical methods in quantitative genetic
analysis. Kalyani Publishers, New Delhi, India. p. 56.
Singh, R.P., Khera, M.K. and Gupta. V.P. (1991). Variability and correlation studies for
oil and seed yield in gobhi sarson. Crop Impro'. 18(2): 99-102.
Singh, R.P.. Malik. B.P.S. and Singh, D.P. (1987). Variation for morphological
characters in genotypes of Indian mustard. Indian J Agric. Sd. 57(4): 225-230.
91
Singh, R.P.. Singh. D.P. and Chaudhry, B.D. (1989). Morpho-physiological variation in
Indian mustard. Annals Blot 3(I): 26-31.
Singh, R.S., Singh, P. and Dlxii, R.K. (1987). Combining ability analysis of yield and
developmental traits in Indian canola (Brassica campestris U var. yellow sarson
pram). Farm .ScL J. 2(2): 170-174.
Srivastava P.P. Salara. B.S. and Gowda, M.V.C. (1983). Variability and correlation
studies in groundnut (Arachis hypogaea). Crop Jmprov. 25(l): 1 22-123.
Srivastava. P.I.S. and Anmachalarn. V. (1977). Flcterosis as a function of genetic
divergence in triticale. Z. Pflanzenzuchtg. 79: 269-275.
Tak, G.M. (1976). Correlation and path analysis of the yield component in the three
lorms of Brassica campestris L. Crop lmpror. 3(2): 43-52.
Talc G.M. and Patnaik, M.C. (1977). Genetic variation and heritability on the 3 forms of
Brassica campesiris. Indian J. Agrit Res. 11(2): 89-93.
Thakral, N.K. (1982). To study the association of some morphophysiological attributes
with yield in toria. Thesis Abstract. 8(11): 66-67.
Thurling. N. (1988). An evalution of an index method of selection for high yield in turnip
rape, B. campesiris L. spp. Euphytica. 23(2): 321-331.
Thurling, N. (1974). An evalution of an index method olselection for high yield in turnip
rape. B. canzpeStris L. .cpp. Euphytica. 23(2): 321-331.
Thurling, N. and Das. L.D.V. (1980). The relationship between pre-anthesis development
and seed yield of spring rape (Brassica napus L). ilust.). AgrEe. Res. 31: 25-36.
Tyagi, M.K., Chauhan. J.S.. Kumar. P.R. and Singh, K.H. (2001). Estimation of heterosis
in Indian mustard. Annals Agri. Rio. Res. 6(20): 193-200.
Uddin, M. J. (1994). Genetic divergence in mustard. Bangladesh J. Plant Breed. Gene:.
7(2): 23-27.
Varshney. S.K., Rai, B. and Singh, B. (1986). Component analysis of harvest index in
Brassica oilseecls. Indian J. Agric. Res. 20(3): 129-134.
Ventatramana. P.. Sheriff, R.A. and Janakiraman, N. (2001). Assessment of groundnut
germplasrns and isolation of elite genotypes for improvement. I. Soils Crops. 11(2):
156-160.
92
Verma, M.M. (1970). Adoption and genetic diversity in some populations of soybean
(Glycine m(L L. Menu). Phd. Thesis IARI New Delhi. in: Shanmugam.. A.S. and
S.R.S. RargasamY. (1982). GCTICI1C Diversity for quantitative character in green
gram ( Vigna radiata I . \Vitezek). Madras Agric. J. 69(10): 631-636.
Vcrma. V.D. and Rai, B. (1980). Die Mzuaiion Theorie. Vol. 1, XII, 6485, 8PL, Vol. Ii,
XIV, 7525. 4PL. Leipzig. Vshakurnari, R.M., Subramanian. M. and Subramanian. (1991). Studies on coefficient of
variation and heritable components of some quantitative characters of brinal.
Indian .J. 1-lorL 48(1): 75-78.
Wan. Y.L. and Flu. G.C. (1983). Studies on heritability, genetic correlations and genetic
advances of the mor characters in rape. Chinese oil crops. 1: 1-7.
Yadava. C.K. (1983). Studies on genetics of yield and its components in Indian mustard
(Brassicafuflceo L. Czcrn & Coss). Jndianf. Agric Sd. 49(2): 186-187.
Yadava, O.P., Yadav. T.P. and Kumar, P. (1996).Combimng ability studies for seed
yield. its components characters and oil content in Indian mustard (Brassicafuncea
U Czcrn and Coss.). J. Oil Seed Res. 9(1): 14-20.
Yadava. T.P. (1973). Variability and correlation studies in Brassicajuflcea L. Czern and
coss. Madras 4gric. J. 60: 1508-1511. (1982). Association of pod yield with some
Yadava, T.P.. Kumar, P. and fhakral. S.K.S
characters in groundnut. 1-laryana. Agric. Univ .1. Res. 14(1): 75-88.
Yadava, T.P., Kuumar. P., Raj, L. and Thakural, N.K. (1997). A study of heterosis in
toria (Brassica campestris var. toria). Cruciferac Newsletter. 19: 101-102.
Yadava, T.P., Parkash, K..thakial, S.K. and Yadav, A.K. (1985). Genetic divergence, its
relationship with heterosis and character association among seed yield and its
components traits in Indian mustard. J. Oilseedi Res. 2(2): 163-173.
Yadava, fl) Yadav. A.K. and Singh. H. (1978). A concept of Plant ideotype in Indian
mustard (B. juncea L. Czem and Coss). 5th International Rapeseed Conf., June,
1978. p. 7. Yadava, V.P., Singh, H. and Singh, D. (1993). Gene action for seed yield and its
attributes under two environments in Indian mustard. Crop Research. 6(1): 168-
172.
93
Yadeva, A.K., Vemja, A.K.. Siugh, D.N. and Singh, S.K. (1996). Path coefficient
analysis in Indian mustard (Brassicajuncea L. czem and eoss).J. Rev. Birsa. AgriL
Univ. 8(2): 135-137.
Yarnell, S.H. (1956). Cytogenetics of vegetable crops. Crucjfers Dot. Rev. 22(2): 81-166.
Yin. J.C. (1989). Analysis on ecological, physiological and production characteristics of
high quality rapeseed cultivars. Ac/a Agric. Shanghai. 5(4): 25-32.
Zhau, Y.M. and Liu, H.L. (1987). Canonical correlation analysis between characters in B.
napus. Cru ferae Newsletter. 12: 42-43.
Zhou, YJvl., Tan, Y.L., Liu, M., Wei. Z.L., Yao, L. and Shi, S.W. (1998). Studies on
irradiation induced mutation in rapesced (B. napus L.). chinese .i. Oil cropc Sd.
20(4): 1-5.
tuocn, ivi.!. and itnmco. S.V. (19/3). ueneue sway oc yicia and some of its components
in Drassica cainpestris var. loria. C7rop Sd. 13: 13-15.
94
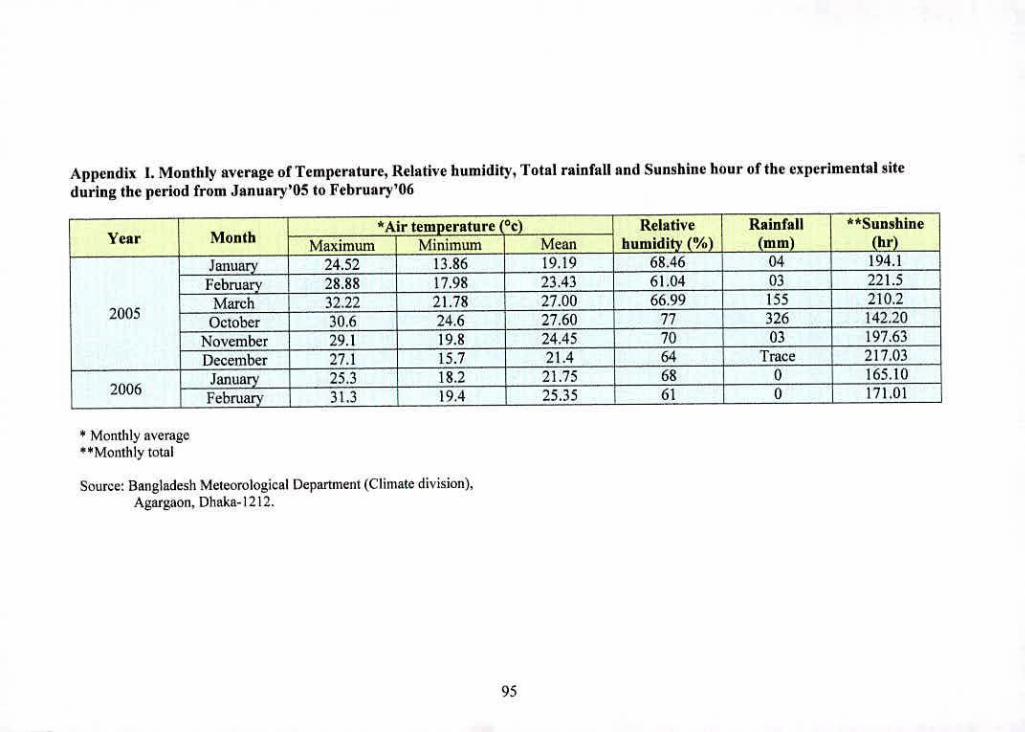
Appendix 1. Monthly average of Temperature, Relative humidity, Total rainfall and Sunshine hour of the experimental site during the period from January'05 to February'06
Year Month *Air temperature (°c) Relative
I humidity (%) Rainfall [
(mm) I **Sunshine
(hr) Maximum Minimum Mean January 24.52 13.86 19.19 68.46 04 194.1
February 28.88 17.98 23.43 61.04 03 221.5
March 32.22 21.78 27.00 66.99 155 210.2 2005 October 30.6 24.6 27.60 77 326 142.20
November 29.1 19.8 24.45 70 03 197.63
December 27.1 15.7 21.4 64 Trace 1 217.03
January 25.3 18.2 21.75 68 0 I 165.10 2006 February 31.3 19.4 25.35 61 0 )_171.01
* Monthly average **Monthly total
Source: Bangladesh Meteorological Department (Climate division), Agargaon. Dhaka- 1212.
95
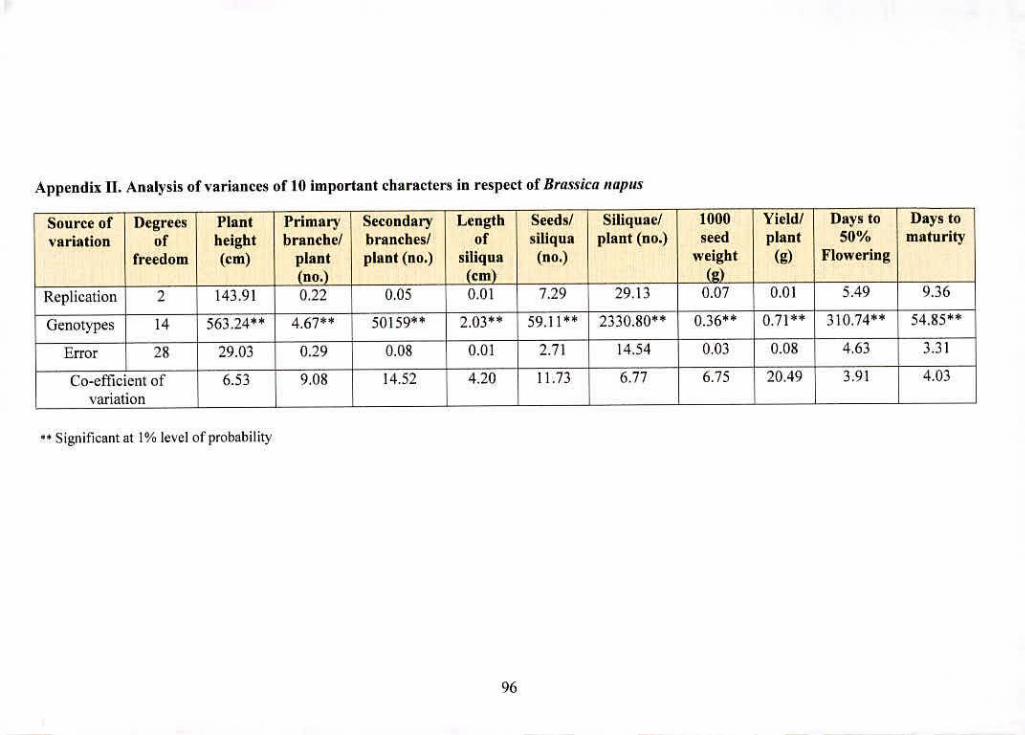
Appendix II. Analysis of variances of 10 important characters in respect of Brassica napus
Source of Degrees Plant Primary Secondary Length Seeds/ Siliquae/ 1000 YicIdI Days to oays to 1
variation of height branchc/ branches/ of siliqua plant (no.) seed plant 50% maturity
freedom (cm) plant plant (no.) siliqua (no.) weight (g) Flowering (no.) (cm) (g
Replication 2 143.91 0.22 0.05 0.01 7.29 29.13 0.07 0.03 5.49 9.36
I Genotypes 14 563.24** 4.67** 50159 2.03** 59.11 2330.80** 0.36 0• 71** 310.74** 5435**
Error 28 29.03 0.29 0.08 0.01 2.71 14.54 0.03 0.08 4.63 3.31
Co-efficient of 6.53 9,08 14.52 4.20 11.73 6.77 6.75 20.49 3.91 4.03
variation
a Significant at 1% level of probability
96
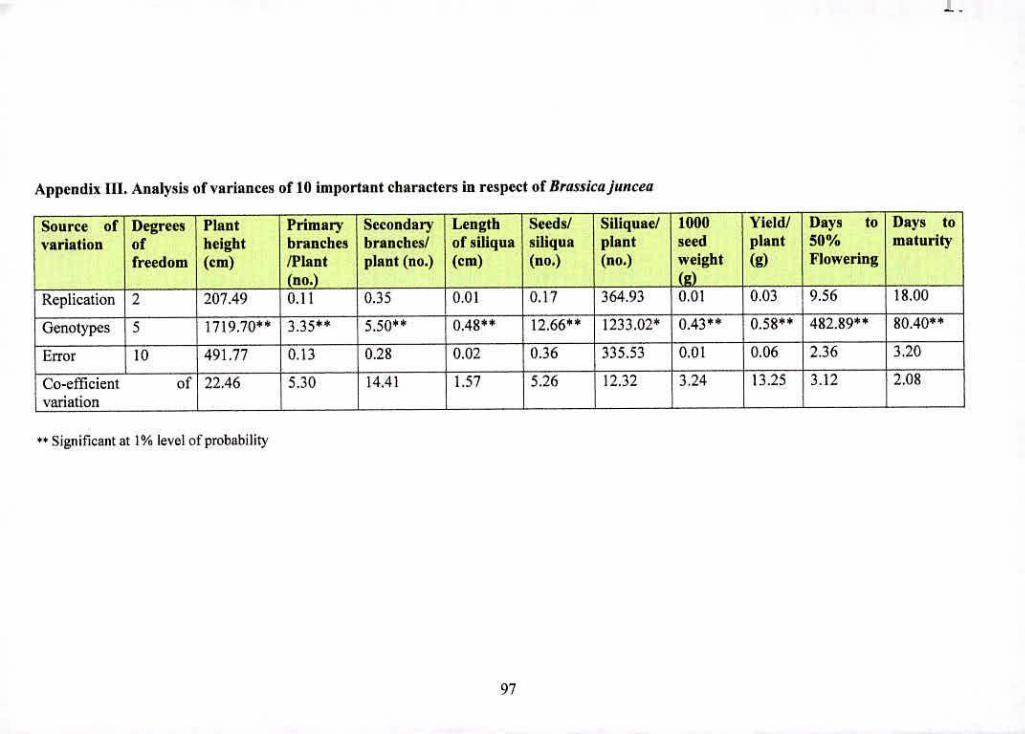
Appendix 111. Analysis of variances of 10 important characters in respect of Brassicajuncea
Source of Degrees Plant Primary Secondary Length Seeds/ Siliquae/ 1000 Yield/ Days to Days to
variation of height branches branches/ 1 of siliqua siliqua plant seed plant 50% maturity
freedom (cm) fPlant plant (no.) (cm) (no.) (no.) weight (g) Flowering (no.)
Replication 2 207.49 0.11 0.35 0.01 0.17 364.93 0.01 0.03 1 9.56 18.00
Genotypes 5 1719.70*0 3•3500 5.50*0 Ø•4** 12.660* 1233.02* 0.43*0 0.58k 482.89*0 80.40*0
Error To 1491.77 0.13 .28 0.02 0.36 335.53 0.01 0.06 2.36 3.20
Co-efficient of 22.46 5.30 4.41 Fl 1.57 5.26 12.32 3.24 13.25 3.12 2.08
variation ________ _________
Significant at 1% level of probability
97
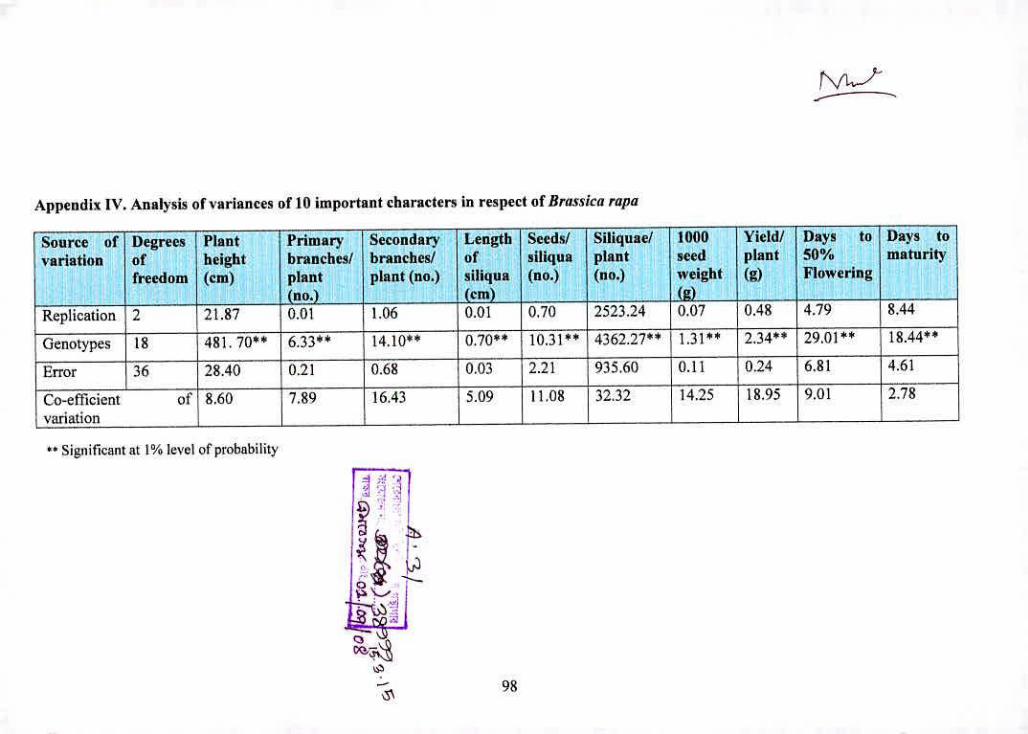
Appendix IV. Analysis of variances of 10 important characters in respect of Brussica rapa
[Iurce of Degrees Plant Primary Secondary Length Seeds! Siliquae/ 1000 Yield/ Days to Days to
variation of height branches/ branches/ of siliqua plant seed plant 50% maturity
freedom (cm) plant plant (no.) siliqua (no.) (no.) I weight (g) Flowering
(no.) (cm) _______ (g)
Replication 2 21.87 0.01 1.06 0.01 0.70 2523.24 0.07 0.48 4.79 8.44
Genotypes IS 481.70 6.33 14.10 0.70 10.31** 4362.27** 1.31** 2.34** 29.01** 18.44
Error 36 28.40 0.21 0.68 0.03 12.21 1935.60 0.11 0.24 6.81 4.61
Co-efficient of 8.60 7.89 16.43 5.09 1 11.08 32.32 14.25 18.95 9.01 2.78
variation ________ ________ ___________
"Significant at 1% level of probability
- 98 '5'


