Embed Size (px)
Citation preview

DOI: 10.1111/j.1472-4642.2007.00369.x © 2007 The Authors
714
Journal compilation © 2007 Blackwell Publishing Ltd www.blackwellpublishing.com/ddi
Diversity and Distributions, (Diversity Distrib.)
(2007)
13
, 714–724
BIODIVERSITYRESEARCH
ABSTRACT
We investigate patterns of species richness of squamates (lizards, snakes, andamphisbaenians) in the Brazilian Cerrado, identifying areas of particularly highrichness, and testing predictions of large-scale richness hypotheses by analysing therelationship between species richness and environmental climatic variables. We usedpoint localities from museum collections to produce maps of the predicted distribu-tions for 237 Cerrado squamate species, using niche-modelling techniques. Wesuperimposed distributions of all species on a composite map, depicting richnessacross the ecosystem. Then, we performed a multiple regression analysis usingeigenvector-based spatial filtering (Principal Coordinate of Neighbour Matrices) toassess environmental–climatic variables that are best predictors of species richness.We found that the environmental–climatic and spatial filters multiple regressionmodel explained 78% of the variation in Cerrado squamate richness (
r
2
= 0.78;
F
= 32.66;
P
< 0.01). Best predictors of species richness were: annual precipitation,precipitation seasonality, altitude, net primary productivity, and precipitation duringthe driest quarter. A model selection approach revealed that several mechanismsrelated to the different diversity hypothesis might work together to explain richnessvariation in the Cerrado. Areas of higher species richness in Cerrado were locatedmainly in the south-west, north, extreme east, and scattered areas in the north-westportions of the biome. Partitioning of energy among species, habitat differentiation,and tolerance to variable environments may be the primary ecological factors deter-mining variation in squamate richness across the Cerrado. High richness areas innorthern Cerrado, predicted by our models, are still poorly sampled, and biologicalsurveys are warranted in that region. The south-western region of the Cerradoexhibits high species richness and is also undergoing high levels of deforestation.Therefore, maintenance of existing reserves, establishment of ecological corridorsamong reserves, and creation of new reserves are urgently needed to ensure conser-vation of species in these areas.
Keywords
Conservation, niche modelling, reptiles, richness gradients, spatial statistics,
species distribution.
INTRODUCTION
The Cerrado is the second largest biome in South America,
originally occupying about 20% of Brazil’s land surface (Ab’Saber,
1977; Ratter
et al
., 1997; Silva & Bates, 2002). It is located mainly
in central Brazil and shares contact zones with almost all other
Brazilian biomes. The Cerrado consists of savanna vegetation
distributed in a gradient from open grassland to forested sites
with closed canopy (Eiten, 1972). A recent overview of the Cerrado
fauna and flora is available in Oliveira & Marquis (2002).
Along with 34 other ecosystems, the Cerrado is considered a
global biodiversity ‘hotspot’, as defined by diversity, endemism,
and human threats (Myers, 2003; Mittermeier
et al
., 2005).
A recent estimate based on satellite remote sensing shows that
approximately 55% of the Cerrado’s original vegetation has been
removed, and the annual deforestation rate is higher than that in
the Amazon (Machado
et al
., 2004b). If the current destruction
rate is not reversed, no natural areas will remain in the Cerrado
by 2030 (Machado
et al
., 2004b). Agriculture and cattle farming,
the major economic activities in Brazil, are the main threats to
1
Sam Noble Oklahoma Museum of Natural
History and Department of Zoology, University
of Oklahoma, 2401 Chautauqua Avenue,
Norman, Oklahoma 73072, USA,
2
Conservation
International–Brazil, Cerrado-Pantanal
Program, SAUS, Qd. 3, Lt. 2, Bl. C, Ed.
Business Point, Salas 713-722, 70070-934
Brasília, DF, Brazil,
3
Departamento de Zoologia,
Universidade de Brasília, CEP 70910-900,
Brasília, DF, Brazil
*Correspondence: Gabriel C. Costa, Sam Noble Oklahoma Museum of Natural History and Department of Zoology, University of Oklahoma, 2401 Chautauqua Avenue, Norman, Oklahoma 73072, USA. E-mail: [email protected]
Blackwell Publishing Ltd
Squamate richness in the Brazilian Cerrado and its environmental–climatic associations
Gabriel C. Costa
1
*, Cristiano Nogueira
2
, Ricardo B. Machado
2
and
Guarino R. Colli
3

Cerrado squamate richness
© 2007 The Authors
Diversity and Distributions
,
13
, 714–724, Journal compilation © 2007 Blackwell Publishing Ltd
715
Cerrado, and the pace of deforestation is not likely to change in
the near future (Klink & Moreira, 2002; Klink & Machado, 2005).
Hence, Cerrado conservationists face the challenge of preserving
the maximum amount of biodiversity using an ever-decreasing
available space. Immediate action is needed because every year
vast areas of the Cerrado are lost (Machado
et al
., 2004b).
Despite its great diversity, endemism, and level of deforesta-
tion, less than 3% of the Cerrado’s land area is protected in
reserves (Machado
et al
., 2004a; Rylands
et al
., 2007). To identify
priority areas for conservation, detailed information on species
distributions is necessary. Vast areas of Cerrado are still poorly
sampled (Silva, 1995; Ratter
et al
., 1997; Aguiar, 2000; Felfili
et al
., 2004), and biological surveys require significant invest-
ments of both time and money. Unfortunately, the speed at
which the Cerrado is being destroyed does not allow sufficient
time to adequately survey the entire region.
Recently, new advances in geographical information systems
(GIS) allow modelling of species distributions based on attributes
of the environment that should be correlated with species niche
requirements (Peterson, 2001; Guisan & Thuiller, 2005). These
models identify previously unsampled locations where the species
have a high probability of occurrence because the environment is
similar to conditions at known occurrence localities. These
techniques do not account for species interactions or historical
factors, they combine spatially explicit factors to yield potential
geographical distributions of species (Araujo & Guisan, 2006).
These methods have been successfully applied to several animal
groups in different ecosystems, including butterflies in Finland
(Luoto
et al
., 2002), birds in North America (Peterson, 2001),
and lizards in Madagascar (Raxworthy
et al
., 2003). A recent
study comparing different methods for predicting species distri-
butions using presence-only data concluded that overall, these
techniques produce good results (Elith
et al
., 2006).
Additionally, niche modelling can be used to generate distribution
maps for several species, which can be superimposed to generate
maps showing gradients in species richness. The occurrence and
determinants of large-scale patterns of species richness are fun-
damental questions in ecology that are still far from being resolved
(Ricklefs, 2004). Several hypotheses exist to explain such pat-
terns, some of which relate richness to particular environmental–
climatic parameters (see Table 1 for a list of current hypotheses
and how they relate to environmental–climatic variables). For
example, the ‘available energy hypothesis’ states that energy par-
titioning among species is the most important factor limiting
species richness (Wright, 1983). According to the predictions
of this hypothesis, richness should be highly correlated with
temperature, precipitation, and potential evapotranspiration
because higher available energy can support more species (Fraser
& Currie, 1996; Moser
et al
., 2005).
The goal of our study is twofold. First, we use niche-modelling
techniques along a large data set on Cerrado squamate (lizards,
snakes, and amphisbaenians) occurrences to produce distribution
maps for all Cerrado species. Then, we superimpose these maps
to make a single map, depicting patterns of squamate species
richness across the biome. After that, we analysed the richness
map generated using multiple regression and spatial analysis
techniques to determine which environmental–climatic variables
exert a greater influence on species richness, and use model selec-
tion to evaluate which hypothesis best explains species richness
gradients in the Brazilian Cerrado.
Second, we provide biological information to support conser-
vation decisions. Using the richness map produced, we identify
areas of high richness within the Cerrado. Although we used only
squamate reptiles, previous works have shown that richness
across large geographical scales is correlated among several dif-
ferent animal groups (Lamoreux
et al
., 2006); thus, patterns that
Table 1 General hypotheses explaining species richness patterns, environmental characteristics traditionally used to test these hypotheses, and variables used in this paper in the regression models to access the importance of each hypothesis for Cerrado squamates. Adapted from: (Moser et al., 2005).
Hypothesis Argument Factor used to test In this paper
Available
energy*
Partitioning of energy among species
limits richness
Temperature, potential evapotranspiration,
and precipitation
Annual precipitation, net primary
productivity
Environmental
stress†
Fewer species are physiologically equipped
to tolerate harsh environments
Minimum values of temperature
and potential evapotranspiration
Precipitation of driest quarter, mean
temperature of driest quarter
Environmental
favourableness‡
Better life conditions promote higher
species numbers
Maximum values of temperature
and potential evapotranspiration
Mean temperature of warmest quarter,
precipitation of warmest quarter
Environmental
stability§
Fewer species are physiologically equipped
to tolerate variable environments
Annual variation in temperature Temperature seasonality, temperature
annual range, precipitation seasonality
Environmental
heterogeneity¶
Habitat differentiation and resource
partitioning facilitate coexistence and
enhance species richness
Topographical, spatial climatic,
edaphic, and land-use heterogeneity
Altitude, terrain declivity
*(Wright, 1983).†(Fraser & Currie, 1996).‡(Pianka, 1966; Richerson & Lum, 1980).§(Pianka, 1966; Fraser & Currie, 1996).¶(Richerson & Lum, 1980).

G. C. Costa
et al.
© 2007 The Authors
716
Diversity and Distributions
,
13
, 714–724, Journal compilation © 2007 Blackwell Publishing Ltd
emerge from this analysis can be extrapolated for other animal
groups in Cerrado. This analysis will provide substantial data for
further studies on identifying priority areas for conservation.
METHODS
Data collection
We collected locality data for squamate species occurring in the
Cerrado from museums, literature, and fieldwork, and created a
database with species names, localities, and geographical coordin-
ates. The database consists of records from the major collections
for Cerrado squamates: Coleção Herpetológica da Universidade
de Brasília (CHUNB), Museu de Zoologia da Universidade de
São Paulo (MZUSP), and Instituto Butantan (IB). When avail-
able, we used geographical coordinates from museum databases
or published studies, and in other instances, we approximated
point localities from locality descriptions using georeferencing
techniques and gazetteers (NGA, 2005).
In the analysis, we used only those species that had at least one
data point within the Cerrado biome. However, for species
whose distributions spanned multiple biomes, we also included
data points outside the Cerrado, because characteristics of these
points can help identify suitable regions for species occurrence
within Cerrado. At the time of the analysis the database showed a
total of 237 species as occurring in the Cerrado (Appendix A).
Niche modelling
For each of the 237 species, we produced predicted distribution
maps, using the software
®. This software uses the
GARP algorithm (Genetic Algorithm for Rule-set Prediction),
which includes several distinct algorithms in an iterative, artifi-
cial intelligence approach based on species presence data points
(Stockwell & Peters, 1999).
® software generates
each species’ predicted distribution based on characteristics of
environmental–climatic variables for localities in which a given
species has been previously collected. We used a total of 22 vari-
ables (see Appendix S1 in Supplementary Material). Variables
were downloaded from the Worldclim project (Hijmans
et al
.,
2005). Details, descriptions, and files for download are available
free on-line at: http://www.worldclim.org/.
We used the following options while running the software:
optimization parameters — 20 runs, 0.001 convergence limit, and
1000 maximum interactions; rule types — atomic, range, negated
range, and logistic regression; best subset active, 5% omission
error, 40% commission error, and 50% of points for training;
omission measure = extrinsic, and omission threshold = hard;
10 models under hard omission threshold.
The output of
® consists of Arc/Info grid maps
with ‘zeros’, where the species do not occur, and ‘ones’, where the
species are predicted to occur. We used as the estimation of the
distribution of each species, the area covered by the coincidence
of at least seven out of the 10 models in the best subset selection
(optimum models considering omission/commission relation-
ships; Anderson
et al
., 2003). This approach is called ensemble
forecasting and has been recently reviewed by Araujo & New
(2007). By doing that and by setting the commission error to
40%, we believe we added a component of conservatism in the
predictions of GARP that otherwise could extrapolate too much
in the direction of areas too far from where the species have pre-
viously been collected. After producing such maps using the
same criteria for all 237 species, we overlaid the distributions of
all species into a composite map using the software
™.
This final map consisted of a grid where the value of each cell was
the predicted number of species (species richness), calculated by
summing the number of overlaid corresponding cells with posi-
tive occurrence results.
Multiple regression
We performed a multiple regression analysis to evaluate which
environmental–climatic variables are the best predictors of squa-
mate richness. We selected 300 random points in the Cerrado
region using a filter option in the software
(Eastman, 2003). Values of richness (dependent variable) and
environmental variables (independent variables) for the selected
points were used to build a matrix. We did not use all environ-
mental variables used to run GARP, because including many
highly correlated variables in a multiple regression creates several
theoretical and statistical problems, especially in the estimation
of partial regression coefficients (Tabachnick & Fidell, 2000). We
selected variables that were previously identified as influencing
species richness patterns and were not highly correlated (
r
< 0.9)
(Table 1, Appendix B). We added to the regression the variable net
primary productivity downloaded from the Atlas of Biosphere
website: http://www.sage.wisc.edu/atlas. This variable has been
previously suggested to have influence in species richness
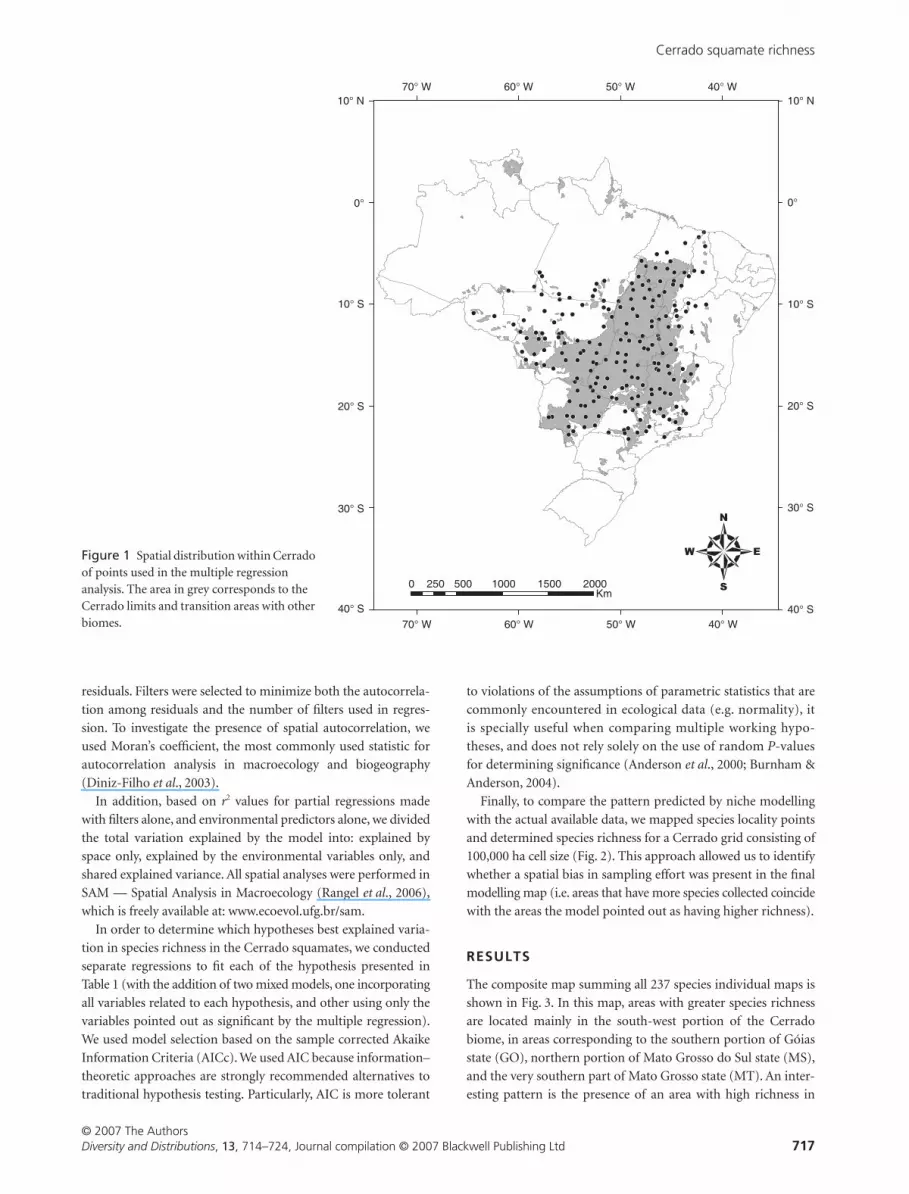
(Table 1). We performed an exploratory analysis of the data
matrix where we identified and eliminated univariate and multi-
variate outliers. The spatial distribution of points used in the
analysis can be seen in Fig. 1.
Ecologists have long recognized that macroecological and
biodiversity data show strong spatial patterns, which are driven by
structured biological processes and therefore are usually spatially
autocorrelated (Legendre, 1993; Diniz-Filho
et al
., 2003). Spatial
autocorrelation occurs when variable values at a certain distance
apart are more (positive autocorrelation) or less similar (negative
autocorrelation) than expected by chance (Legendre, 1993). Failure
to account for spatial autocorrelation in multiple regression
analysis results in inflation of type I error (Legendre, 1993; Diniz-
Filho
et al
., 2003). To alleviate this problem, we used spatial filters
obtained by Principal Coordinates Neighbour Matrices (PCNM).
This method partitions variation between spatial and environ-
mental components, and works well at different spatial scales
(Borcard & Legendre, 2002; Borcard
et al
., 2004; Diniz-Filho &
Bini, 2005). In the analysis, we treated the filters as candidate
predictor variables, along with other environmental predictors.
Using this approach, the effects of environmental predictors are
evaluated as partial effects, taking space into account explicitly
(Rangel
et al
., 2006). We selected filters in an iterative process, by
examining the pattern of spatial autocorrelation of regression
Cerrado squamate richness
© 2007 The Authors
Diversity and Distributions
,
13
, 714–724, Journal compilation © 2007 Blackwell Publishing Ltd
717
residuals. Filters were selected to minimize both the autocorrela-
tion among residuals and the number of filters used in regres-
sion. To investigate the presence of spatial autocorrelation, we
used Moran’s coefficient, the most commonly used statistic for
autocorrelation analysis in macroecology and biogeography
(Diniz-Filho
et al
., 2003).
In addition, based on
r
2
values for partial regressions made
with filters alone, and environmental predictors alone, we divided
the total variation explained by the model into: explained by
space only, explained by the environmental variables only, and
shared explained variance. All spatial analyses were performed in
SAM — Spatial Analysis in Macroecology (Rangel
et al
., 2006),
which is freely available at: www.ecoevol.ufg.br/sam.
In order to determine which hypotheses best explained varia-
tion in species richness in the Cerrado squamates, we conducted
separate regressions to fit each of the hypothesis presented in
Table 1 (with the addition of two mixed models, one incorporating
all variables related to each hypothesis, and other using only the
variables pointed out as significant by the multiple regression).
We used model selection based on the sample corrected Akaike
Information Criteria (AICc). We used AIC because information–
theoretic approaches are strongly recommended alternatives to
traditional hypothesis testing. Particularly, AIC is more tolerant
to violations of the assumptions of parametric statistics that are
commonly encountered in ecological data (e.g. normality), it
is specially useful when comparing multiple working hypo-
theses, and does not rely solely on the use of random
P
-values
for determining significance (Anderson
et al
., 2000; Burnham &
Anderson, 2004).
Finally, to compare the pattern predicted by niche modelling
with the actual available data, we mapped species locality points
and determined species richness for a Cerrado grid consisting of
100,000 ha cell size (Fig. 2). This approach allowed us to identify
whether a spatial bias in sampling effort was present in the final
modelling map (i.e. areas that have more species collected coincide
with the areas the model pointed out as having higher richness).
RESULTS
The composite map summing all 237 species individual maps is
shown in Fig. 3. In this map, areas with greater species richness
are located mainly in the south-west portion of the Cerrado
biome, in areas corresponding to the southern portion of Góias
state (GO), northern portion of Mato Grosso do Sul state (MS),
and the very southern part of Mato Grosso state (MT). An inter-
esting pattern is the presence of an area with high richness in
Figure 1 Spatial distribution within Cerrado of points used in the multiple regression analysis. The area in grey corresponds to the Cerrado limits and transition areas with other biomes.

G. C. Costa
et al.
© 2007 The Authors
718
Diversity and Distributions
,
13
, 714–724, Journal compilation © 2007 Blackwell Publishing Ltd
northern Cerrado, corresponding to the border between the
states of Tocantins (TO) and Maranhão (MA). In addition, areas
of high richness exist in the extreme west portion of Cerrado in
Minas Gerais state (MG) and scattered areas in Mato Grosso and
Rondônia (RO) states (Fig. 3).
Mapping of raw data shows a slight sampling bias towards the
south-eastern portion of Cerrado, where the largest biological
collections (MZUSP and IB) are located (Fig. 2a). However, the
results of our modelling are not highly influenced by this bias,
since areas with the greatest diversity in Cerrado do not overlay
completely with this pattern. In addition, high richness areas
were found by the modelling in regions where the sampling
effort was extremely poor, such as the northern portion of
Cerrado (Fig. 2b).
In the iterative process of filter selection for the multiple
regression analysis, nine eigenvector spatial filters (PCNM) were
sufficient to remove most spatial autocorrelation in regression
residuals (Fig. 4). An examination of the spatial correlogram
based on Moran’s coefficient of the dependent variable (species
richness) and regression residuals confirmed this pattern
(Fig. 4). Addition of more filters did not significantly reduce
autocorrelation in the residuals; therefore, we used only the best
nine filters to minimize the number of independent variables.
The climatic–environmental and spatial filters (PCNM) mul-
tiple regression model explained 78% of the variation in Cerrado
squamate richness (
r
2
= 0.78;
F
= 32.66;
P
< 0.01). The partial
regression approach revealed that the variance explained by
space alone was 37%, the variance explained by the environmen-
tal variables alone was 12%, and the shared explained variance
was 28%.
Based on the analysis including both the climatic–environmental
variables and the PCNM spatial filters, annual precipitation,
precipitation seasonality, altitude, net primary productivity, and
precipitation of the driest quarter were the best predictors of
species richness (Table 2). Using spatial filters in this analysis
Figure 2 Number of species per unit area (cell) based on museum collections. The grid corresponds to the approximate area of the Cerrado biome. The area of each cell is 100,000 ha (a) Number of species based on the raw data. Blank cells have no specimen based on the major Cerrado collections; (b) Number of species based on the niche modelling of 237 species.
Table 2 Partial regression coefficients of the multiple regression model (b), t statistics, and associated P-values for species richness of Brazilian Cerrado squamates regressed against environmental variables. Spatial structure was accounted for in the multiple regression by adding nine eigenvector filters produced with the method of Principal Coordinates of Neighbour Matrices (PCNM). Filters were omitted from table.
Variables b t P
Annual precipitation –0.04 –5.08 < 0.01
Precipitation seasonality –1.23 –4.75 < 0.01
Altitude 0.03 3.28 < 0.01
Precipitation of driest quarter –0.28 –2.93 < 0.01
Net primary productivity 23.6 2.52 0.01
Mean temperature of driest quarter 0.92 2.39 0.02
Temperature annual range 0.21 2.04 0.04
Precipitation of warmest quarter 0.02 1.87 0.06
Terrain declivity 0.11 1.32 0.20
Mean temperature of warmest quarter –0.20 –0.45 0.65
Temperature seasonality 0.004 0.425 0.67

Cerrado squamate richness
© 2007 The Authors
Diversity and Distributions
,
13
, 714–724, Journal compilation © 2007 Blackwell Publishing Ltd
719
ensured that environmental variables were evaluated while
taking into account spatial autocorrelation.
The model with the lowest AICc was the mixed model
contained all variables related to several different hypotheses
(Table 3). All other models had considerable less support (
∆
AICc
Figure 3 Raster grid of Cerrado squamate species richness based on the sum of 237 individual species maps.
Figure 4 Moran’s index correlogram for squamate species richness and the residuals of multiple regression with environmental predictors.
Table 3 Summary of the model selection procedure. The model with the lowest corrected Akaike Information Criterion (AICc) value is the most parsimonious one among the fitted models and is selected (marked in bold). ∆AICc is the difference in AICc to the selected model. Wi is the Akaike weight and it indicates the relative support a given model has when compared with the other models. K is the number of parameters of the model (no. of variables + intercept).
Model AICc ∆AICc K Wi
Available energy 1290.74 65.56 3 0.00
Environmental favourableness 1301.10 75.92 3 0.00
Environmental heterogeneity 1289.53 64.35 3 0.00
Environmental stability 1256.76 31.58 3 0.00
Environmental stress 1293.06 67.88 3 0.00
*Mixed model 1225.18 0.00 12 1.00
†Only significant 1262.44 37.26 8 0.00
*All 11 variables used in the multiple regression.
†Only the significant variables (P < 0.05) from the multiple regression.

G. C. Costa
et al.
© 2007 The Authors
720
Diversity and Distributions
,
13
, 714–724, Journal compilation © 2007 Blackwell Publishing Ltd
> 10 and low values of Akaike weight, see Burnham & Anderson
(2004)). These results suggest that an interaction of factors
related to the different hypotheses may be the best explanation for
the variation on squamates species richness in the Cerrado.
DISCUSSION
Our results based on the multiple regression, and the model
selection suggest that several mechanisms related to the different
diversity hypothesis might work together to explain richness
variation in the Cerrado. Annual precipitation was the most
important climatic variable predicting Cerrado squamate richness
supporting the species–energy hypothesis. Several studies on dif-
ferent organisms and at different geographical scales have found
that species richness was correlated with available energy (Hawkins
et al
., 2003; Currie
et al
., 2004). Results of our study join the body
of literature that corroborates the species–energy hypothesis.
The species–energy hypothesis posits that the amount of
energy available and energy partitioning among species limit
species richness (Wright, 1983). A mechanism explaining how
diversity gradients are produced based on energy is lacking but
several hypotheses exist (Clarke & Gaston, 2006). Exciting recent
studies suggest that variation in temperature results in variation
in DNA substitution rates and, may influence rates of evolution
(Wright
et al
., 2003; Allen & Gillooly, 2006; Allen
et al
., 2006).
Although this mechanism may be operating on a global scale,
whether it is important at smaller geographical scales such as the
Cerrado region remains undetermined.
The environmental stability hypothesis posits that physiological
tolerances of species to variable environments may limit species
richness leading to higher diversity in more stable environments
(Pianka, 1966; Currie, 1991). Although the rationale behind the
hypothesis seems reasonable, recent studies failed to support this
hypothesis (Velho
et al
., 2004; Mora & Robertson, 2005). We
found supporting evidence for the environmental stability
hypothesis in that precipitation seasonality was the second best
climatic variable in predicting squamate richness. The Cerrado is
a highly seasonal environment with two well-defined seasons,
one dry and cold, and the other wet and warm. This seasonality
may influence variation in species richness because some species
may not be able to physiologically tolerate the harsh dry season,
and/or areas with less severe conditions may be colonized by
species that primarily occur in other biomes, such as the
Amazon forest.
Altitude was important in predicting Cerrado squamate species
richness. Correlations of species richness with altitude suggest
that the environmental heterogeneity hypothesis, which posits
that habitat differentiation and resource partitioning facilitate
coexistence and enhance species richness (Richerson & Lum,
1980), may play a role in large-scale patterns of species richness.
Relationships of species richness to topographical and environ-
mental heterogeneity have been shown previously, especially at
smaller spatial scales (Bohning-Gaese, 1997; Cleary
et al
., 2005;
Triantis
et al
., 2005). In addition, some studies supporting the
species–energy hypothesis have also found a significant effect of
topography or landscape heterogeneity as in South American
birds (Diniz-Filho & Bini, 2005) and plants (Lavers & Field,
2006).
Altitude may have had an historical influence on the distribu-
tion and composition of Cerrado fauna and flora (da Silva, 1996;
Meio
et al
., 2003; Colli, 2005). In birds Amazonian elements are
restricted to gallery forests at lower altitude, whereas Atlantic
elements are found in higher altitudes (Silva, 1996). The same
pattern is repeated for trees and shrubs species (Meio
et al
.,
2003). A crucial event responsible for current patterns of species
distribution of Cerrado squamates was the uplift of the Central
Brazilian Plateau in the Tertiary (Colli, 2005), again evidencing
the importance of altitude and topography.
The above hypotheses are not mutually exclusive and, based
on results of the model selection, which pointed out that the best
model to explain species richness is a combination of the differ-
ent hypothesis, we advance the idea that partitioning of energy
among species, habitat differentiation, and tolerance to variable
environments are the primary ecological factors determining
variation in squamate richness across Cerrado. Other studies in
the literature also suggested that a combination of different
hypotheses may best explain species richness patterns (Bohning-
Gaese, 1997; Hurlbert, 2004; Diniz-Filho & Bini, 2005). Additional
studies that examine richness at different spatial scales are neces-
sary, as well as studies that explore other factors known to affect
species richness, such as historical factors (e.g. geographical
barrier and/or effect of regional pool of species) and ecological
interactions such as competition and predation. The Cerrado is a
highly heterogeneous landscape, composed of a mosaic of
edaphic conditions and different vegetation types, and it would
be constructive to investigate how finer-scale environmental and
landscape variables affect species richness. For instance, Nogueira
et al
. (2005) studied a lizard assemblage in the central Cerrado
and found that richness is higher in the open landscape when
compared with forested habitats.
Deforestation of Cerrado has accelerated during the past
20 years, and landcover has shifted greatly towards planted pas-
tures and agriculture (Klink & Moreira, 2002; Klink & Machado,
2005). The central portion of Cerrado and areas of the southern
portion of Góias state (GO) and northern portion of Mato
Grosso do Sul state (MS), all of which coincide with large patches
of high squamate richness (Fig. 3), are of particular concern
because these areas have been largely converted into pasture
and agriculture (Silva
et al
., 2006). Due to its fragmentation,
maintenance and protection of current reserves, establishment
of ecological corridors among existing reserves, and creation of
new reserves, are urgently needed to ensure the conservation of
squamate richness in these regions.
The northern portion of Cerrado also exhibited high richness
of squamate species. Luckily, most of the remaining pristine
native Cerrado areas are located in this region. Recent infrastruc-
ture development is changing this situation, and large portions
of native vegetation are being replaced by soybean plantation.
However, these areas remain poorly sampled (Fig. 2a). Lack of
sampling is a major issue in the Neotropics and particularly in
the Cerrado. Bini
et al
. (2006) modelled range distributions of
Cerrado amphibian species based on habitat suitability and

Cerrado squamate richness
© 2007 The Authors
Diversity and Distributions
,
13
, 714–724, Journal compilation © 2007 Blackwell Publishing Ltd
721
number of inventories, and reached similar conclusions to this
study regarding the importance for conservation of the northern
areas of the Cerrado. Consequently, priorities for this region
should begin with biological surveys, followed by the creation of
new reserves where deemed necessary.
Overall, the level of deforestation and threats to Cerrado bio-
diversity are so alarming that any action towards conservation is
important. Because both time and monetary resources are limited,
decisions often must be based on available data. Thus it is crucial
to maximize utility of these data. However, results of species
niche modelling studies cannot be considered unequivocally
true, and repeated verification based on fieldwork is necessary to
ensure that proper decisions are being made. Biodiversity data,
in the form of compilations of revised point-localities, are crucial
for interpreting richness patterns and are highly informative to
conservation. In addition, niche-based models cannot account
for factors that may have limited species distributions histori-
cally, such as geographical barriers, resulting in speciation events.
In Madagascar, niche models predicted occurrence of known
species, but fieldwork revealed that closely related and ecologi-
cally similar undescribed species lived in the predicted areas
(Raxworthy
et al
., 2003).
To complement and add utility of the information provided by
our study, additional studies on the geographical patterns of
endemism in Cerrado species and the temporal and spatial pattern
of deforestation are needed. Analysing patterns of species richness
and endemism and correlating them with patterns of deforestation
and human occupation can help define conservation strategies
and minimize conflicts between development and conservation
(Whittaker
et al
., 2005; Diniz-Filho
et al
., 2006). Our results are
an initial step towards the development of a large comprehensive
data set on richness, endemism, and patterns of deforestation
that will provide the necessary information to support conserva-
tion decisions for the Cerrado.
ACKNOWLEDGEMENTS
We thank C. Wolfe, D. Shepard, and two anonymous reviewers for
comments and suggestions on earlier versions of the manuscript.
This work was submitted in partial fulfilment of the PhD degree
at the University of Oklahoma to GCC. We thank T. Rashed,
L. Vitt, J. Caldwell, J. Kelly, and M. Kaspari for serving on GCC
doctoral committee and providing suggestions to the manuscript.
We also thank Thiago F.L.V.B. Rangel for advice on how to use the
PCNM spatial filters in SAM, and Ingo Schlupp for advice on the
model selection approach. This work was supported by a CAPES/
Fulbright PhD fellowship to GCC, and by a research fellowship
(#302343/88-1) from Couselho Nacional de Desenvolvimento
Científico e Tecnológico–CNP
9
to GRC. FAPESP and Conserva-
tion International provided funds to CN for the compilation of
Cerrado Squamate Reptiles point locality database. We thank the
curators and staff of CHUNB, MZUSP, and IB for allowing the
examination of specimens housed at these institutions. Portions
of this research were supported by a National Science Foundation
grant to Laurie J. Vitt and Janalee P. Caldwell (DEB-0415430).
Any opinions, findings, and conclusions or recommendations
expressed in this material are those of the author(s) and do not
necessarily reflect the views of the National Science Foundation.
REFERENCES
Ab’Saber, A.N. (1977) Os domínios morfoclimáticos da América
do Sul. Primeira aproximação.
Geomorfologia
,
52
, 1–21.
Aguiar, L. (2000) Comunidades de morcegos do Cerrado no
Brasil Central. Tese de Doutorado. Universidade de Brasília,
Brasília, DF, Brazil.
Allen, A.P. & Gillooly, J.F. (2006) Assessing latitudinal gradients
in speciation rates and biodiversity at the global scale.
Ecology
Letters
,
9
, 947–954.
Allen, A.P., Gillooly, J.F., Savages, V.M. & Brown, J.H. (2006)
Kinetic effects of temperature on rates of genetic divergence
and speciation.
Proceedings of the National Academy of Sciences
USA
,
103
, 9130–9135.
Anderson, D.R., Burnham, K.P. & Thompson, W.L. (2000) Null
hypothesis testing: Problems, prevalence, and an alternative.
Journal of Wildlife Management
,
64
, 912–923.
Anderson, R.P., Lew, D. & Peterson, A.T. (2003) Evaluating pre-
dictive models of species’ distributions: criteria for selecting
optimal models.
Ecological Modelling
,
162
, 211–232.
Araujo, M.B. & Guisan, A. (2006) Five (or so) challenges for
species distribution modelling.
Journal of Biogeography
,
33,
1677–1688.
Araujo, M.B. & New, M. (2007) Ensemble forecasting of species
distributions. Trends in Ecology & Evolution, 22, 42–47.
Bini, L.M., Diniz-Filho, J.A.F., Rangel, T., Bastos, R.P. & Pinto, M.P.
(2006) Challenging Wallacean and Linnean shortfalls: know-
ledge gradients and conservation planning in a biodiversity
hotspot. Diversity and Distributions, 12, 475–482.
Bohning-Gaese, K. (1997) Determinants of avian species richness
at different spatial scales. Journal of Biogeography, 24, 49–60.
Borcard, D. & Legendre, P. (2002) All-scale spatial analysis of
ecological data by means of principal coordinates of neighbour
matrices. Ecological Modelling, 153, 51–68.
Borcard, D., Legendre, P., Avois-Jacquet, C. & Tuomisto, H.
(2004) Dissecting the spatial structure of ecological data at
multiple scales. Ecology, 85, 1826–1832.
Burnham, K.P. & Anderson, D.R. (2004) Multimodel inference
— understanding AIC and BIC in model selection. Sociological
Methods and Research, 33, 261–304.
Clarke, A. & Gaston, K.J. (2006) Climate, energy and diversity.
Proceedings of the Royal Society of London Series B, Biological
Sciences, 273, 2257–2266.
Cleary, D.F.R., Genner, M.J., Boyle, T.J.B., Setyawati, T., Angraeti, C.D.
& Menken, S.B.J. (2005) Associations of bird species richness
and community composition with local and landscape-scale envi-
ronmental factors in Borneo. Landscape Ecology, 20, 989–1001.
Colli, G.R. (2005) As origens e a diversificação da herpetofauna
do Cerrado. Biodiversidade, ecologia e conservação do cerrado
(ed. by A. Scariot, J. C. Souza-Silva and J.M. Felfili), pp. 247–
264. Brasília, DF, Brazil.
Currie, D.J. (1991) Energy and large-scale patterns of animal-species
and plant-species richness. The American Naturalist, 137, 27–49.

G. C. Costa et al.
© 2007 The Authors722 Diversity and Distributions, 13, 714–724, Journal compilation © 2007 Blackwell Publishing Ltd
Currie, D.J., Mittelbach, G.G., Cornell, H.V., Field, R., Guegan, J.F.,
Hawkins, B.A., Kaufman, D.M., Kerr, J.T., Oberdorff, T.,
O’Brien, E. & Turner, J.R.G. (2004) Predictions and tests of
climate-based hypotheses of broad-scale variation in taxo-
nomic richness. Ecology Letters, 7, 1121–1134.
Diniz-Filho, J.A.F. & Bini, L.M. (2005) Modelling geographical
patterns in species richness using eigenvector-based spatial
filters. Global Ecology and Biogeography, 14, 177–185.
Diniz-Filho, J.A.F., Bini, L.M. & Hawkins, B.A. (2003) Spatial
autocorrelation and red herrings in geographical ecology.
Global Ecology and Biogeography, 12, 53–64.
Diniz-Filho, J.A.F., Bini, L.M., Pinto, M.P., Rangel, T., Carvalho, P.
& Bastos, R.P. (2006) Anuran species richness, complemen-
tarity and conservation conflicts in Brazilian Cerrado. Acta
Oecologica-International Journal of Ecology, 29, 9–15.
Eastman, J. (2003) IDRISI Kilimanjaro — Guide to GIS and image
processing. Clark Labs — Clark University, Worcester, Massa-
chusetts.
Eiten, G. (1972) The Cerrado vegetation of Brazil. The Botanical
Review, 38, 201–341.
Elith, J., Graham, C.H., Anderson, R.P., Dudik, M., Ferrier, S.,
Guisan, A., Hijmans, R.J., Huettmann, F., Leathwick, J.R.,
Lehmann, A., Li, J., Lohmann, L.G., Loiselle, B.A., Manion, G.,
Moritz, C., Nakamura, M., Nakazawa, Y., Overton, J.M., Peterson,
A.T., Phillips, S.J., Richardson, K., Scachetti-Pereira, R., Schapire,
R.E., Soberon, J., Williams, S., Wisz, M.S. & Zimmermann,
N.E. (2006) Novel methods improve prediction of species’
distributions from occurrence data. Ecography, 29, 129–151.
Felfili, J.M., Junior, M.C.D., Sevilha, A.C., Fagg, C.W.,
Walter, B.M.T., Nogueira, P.E. & Rezende, A.V. (2004) Diver-
sity, floristic and structural patterns of cerrado vegetation in
Central Brazil. Plant Ecology, 175, 37–46.
Fraser, R.H. & Currie, D.J. (1996) The species richness-energy
hypothesis in a system where historical factors are thought to
prevail: coral reefs. The American Naturalist, 148, 138–159.
Guisan, A. & Thuiller, W. (2005) Predicting species distribution:
offering more than simple habitat models. Ecology Letters, 8,
993–1009.
Hawkins, B.A., Field, R., Cornell, H.V., Currie, D.J., Guegan, J.F.,
Kaufman, D.M., Kerr, J.T., Mittelbach, G.G., Oberdorff, T.,
O’Brien, E.M., Porter, E.E. & Turner, J.R.G. (2003) Energy,
water, and broad-scale geographic patterns of species richness.
Ecology, 84, 3105–3117.
Hijmans, R.J., Cameron, S.E., Parra, J.L., Jones, P.G. & Jarvis, A.
(2005) Very high resolution interpolated climate surfaces for
global land areas. International Journal of Climatology, 25,
1965–1978.
Hurlbert, A.H. (2004) Species-energy relationships and habitat
complexity in bird communities. Ecology Letters, 7, 714–720.
Klink, C.A. & Machado, R.B. (2005) Conservation of the Brazilian
Cerrado. Conservation Biology, 19, 707–713.
Klink, C.A. & Moreira, A.G. (2002) Past and current human
occupation, and land use. The cerrados of Brazil: ecology and
natural history of a Neotropical savanna (ed. by P.S. Oliveira
and R.J. Marquis), pp. 69–88. Columbia University Press, New
York, New York.
Lamoreux, J.F., Morrison, J.C., Ricketts, T.H., Olson, D.M.,
Dinerstein, E., McKnight, M.W. & Shugart, H.H. (2006)
Global tests of biodiversity concordance and the importance
of endemism. Nature, 440, 212–214.
Lavers, C. & Field, R. (2006) A resource-based conceptual model
of plant diversity that reassesses causality in the productivity-
diversity relationship. Global Ecology and Biogeography, 15,
213–224.
Legendre, P. (1993) Spatial autocorrelation — trouble or new
paradigm. Ecology, 74, 1659–1673.
Luoto, M., Kuussaari, M. & Toivonen, T. (2002) Modelling
butterfly distribution based on remote sensing data. Journal of
Biogeography, 29, 1027–1037.
Machado, R.B., Aguiar, L., Ramos Neto, M., Rodrigues, F., Hass, A.
& Aquino, F. (2004a) Atlas das unidades de conservação feder-
ais do Brasil. Metalivros, São Paulo, Brazil.
Machado, R.B., Ramos Neto, M.B., Pereira, P.G.P., Caldas, E.F.,
Gonçalves, D.A., Santos, N.S., Tabor, K. & Steininger, M.
(2004b) Estimativas de perda da área do Cerrado brasileiro.
Conservation International, Brasilia, DF, Brazil.
Meió, B.B., Freitas, C.V., Jatobá, L., Silva, M.E.F., Ribeiro, J.F. &
Henriques, R.P.B. (2003) Influência da flora da floresta
Amazônica e Atlântica na vegetação do cerrado sensu stricto.
Revista Brasileira de Botânica, 26, 437–444.
Mittermeier, R.A., Gil, P.R., Hoffman, M., Pilgrim, J., Brooks,
T.G.M.C.J., L. & Fonseca, G.A.B. (2005) Hotspots revisited:
earth’s biologically richest and most endangered terrestrial
ecoregions, 2nd edn. Conservation International, Arlington,
Virginia.
Mora, C. & Robertson, D.R. (2005) Causes of latitudinal gradi-
ents in species richness: a test with fishes of the tropical Eastern
Pacific. Ecology, 86, 1771–1782.
Moser, D., Dullinger, S., Englisch, T., Niklfeld, H., Plutzar, C.,
Sauberer, N., Zechmeister, H.G. & Grabherr, G. (2005) Envi-
ronmental determinants of vascular plant species richness in
the Austrian Alps. Journal of Biogeography, 32, 1117–1127.
Myers, N. (2003) Biodiversity hotspots revisited. Bioscience, 53,
916–917.
NGA (2005) Name files of selected countries — Geonet names
server. Available at: http://earth-info.nga.mil/gns/html/
cntry_files.html.
Nogueira, C., Valdujo, P.H. & Franca, F.G.R. (2005) Habitat
variation and lizard diversity in a Cerrado area of Central
Brazil. Studies on Neotropical Fauna and Environment, 40,
105–112.
Oliveira, P.S. & Marquis, R.J. (2002) The cerrados of Brazil:
ecology and natural history of a Neotropical savanna, edn.
Columbia University Press, New York, New York.
Peterson, A.T. (2001) Predicting species’ geographic distributions
based on ecological niche modeling. Condor, 103, 599–605.
Pianka, E.R. (1966) Latitudinal gradients in species diversity: a
review of concepts. The American Naturalist, 100, 33–46.
Rangel, T.F.L.V.B., Diniz-Filho, J.A.F. & Bini, L.M. (2006) Towards
an integrated computational tool for spatial analysis in macro-
ecology and biogeography. Global Ecology and Biogeography,
15, 321–327.
Cerrado squamate richness
© 2007 The AuthorsDiversity and Distributions, 13, 714–724, Journal compilation © 2007 Blackwell Publishing Ltd 723
Ratter, J., Ribeiro, J. & Bridgewater, S. (1997) The Brazilian
Cerrado vegetation and threats to its biodiversity. Annals of
Botany, 80, 223–230.
Raxworthy, C.J., Martinez-Meyer, E., Horning, N., Nussbaum, R.A.,
Schneider, G.E., Ortega-Huerta, M.A. & Peterson, A.T. (2003)
Predicting distributions of known and unknown reptile species
in Madagascar. Nature, 426, 837–841.
Richerson, P.J. & Lum, K. (1980) Patterns of plant-species diver-
sity in California — Relation to weather and topography. The
American Naturalist, 116, 504–536.
Ricklefs, R.E. (2004) A comprehensive framework for global
patterns in biodiversity. Ecology Letters, 7, 1–15.
Rylands, A.B., Fonseca, M.T., Machado, R.B. & Cavalcanti, R.B.
(2007) Brazil. The state of the world’s protected areas (ed. by
C.S. Spalding and M. Jenkins). United Nations Environment
Programme (UNEP) and World Conservation Monitoring
Center (WCMC), Cambridge, UK.
Silva, J.M.C. (1995) Birds of the Cerrado region, South America.
Steenstrupia, 21, 69–92.
Silva, J.M.C. (1996) Distribution of Amazonian and Atlantic
birds in gallery forests of the Cerrado region, South America.
Ornitologia Neotropical, 7, 1–18.
Silva, J.M.C. & Bates, J.M. (2002) Biogeographic patterns and
conservation in the South American Cerrado: a tropical
savanna hotspot. Bioscience, 52, 225–233.
Silva, J.F., Farinas, M.R., Felfili, J.M. & Klink, C.A. (2006) Spatial
heterogeneity, land use and conservation in the cerrado region
of Brazil. Journal of Biogeography, 33, 536–548.
Stockwell, D. & Peters, D. (1999) The GARP modelling system:
problems and solutions to automated spatial prediction.
International Journal of Geographical Information Science, 13,
143–158.
Tabachnick, B.G. & Fidell, L.S. (2000) Using multivariate statistics,
4th edn. Allyn and Bacon, Boston, Massachusetts.
Triantis, K.A., Mylonas, M., Weiser, M.D., Lika, K. & Vardinoy-
annis, K. (2005) Species richness, environmental heterogeneity
and area: a case study based on land snails in Skyros archipel-
ago (Aegean Sea, Greece). Journal of Biogeography, 32, 1727–
1735.
Velho, L.F.M., Bini, L.M. & Lansac-Toha, F.A. (2004) Testate
amoeba (Rhizopoda) diversity in plankton of the Upper
Parana River floodplain, Brazil. Hydrobiologia, 523, 103–111.
Whittaker, R.J., Araujo, M.B., Paul, J., Ladle, R.J., Watson, J.E.M.
& Willis, K.J. (2005) Conservation biogeography: assessment
and prospect. Diversity and Distributions, 11, 3–23.
Wright, D.H. (1983) Species–energy theory — an extension of
species–area theory. Oikos, 41, 496–506.
Wright, S.D., Gray, R.D. & Gardner, R.C. (2003) Energy and the
rate of evolution: inferences from plant rDNA substitution
rates in the western Pacific. Evolution, 57, 2893–2898.
SUPPLEMENTARY MATERIAL
The following supplementary material is available for this article:
Appendix S1 List of variables used in the desktopGarp environ-
mental data base.
This material is available as part of the online article from:
http://www.blackwell-synergy.com/doi/abs/10.1111/
j.1472-4642.2007.00369.x
(This link will take you to the article abstract).
Please note: Blackwell Publishing are not responsible for the
content or functionality of any supplementary materials supplied
by the authors. Any queries (other than missing material) should
be directed to the corresponding author for the article.

G. C. Costa et al.
© 2007 The Authors724 Diversity and Distributions, 13, 714–724, Journal compilation © 2007 Blackwell Publishing Ltd
Appendix A
List of the 237 species used in the analysis.
Appendix B
Correlation matrix of the variables selected for the multiple regression analysis. The variables were selected in a way to minimize the correlation among each other and to relate to different hypothesis to explain patterns of species richness.
Ameiva ameiva, Amphisbaena alba, A. anaemariae, A. camura, A. crisae, A. fuliginosa, A. leeseri, A. mensae, A. mertensi, A. miringoera, A. neglecta, A.
sanctaeritae, A. silvestrii, A. talisiae, A. vermicularis, Anilius scytale, Anisolepis grillii, Anolis chrysolepis, Anolis meridionalis, Anops bilabialatus, A. albicollaris,
Apostolepis ammodytes, A. assimilis, A. cearensis, A. cerradoensis, A. cf. longicaudata, A. christineae, A. dimidiata, A. flavotorquata, A. goiasensis, A.
intermedia, A. lineata, A. longicaudata, A. nigroterminata, A. sp., A. polylepis, A. vittata, Atractus albuquerquei, A. latifrons, A. pantostictus, Bachia bresslaui,
B. cacerensis, Boa constrictor, Boiruna maculata, Bothrops alternatus, B. itapetiningae, B. lutzi, B. mattogrossensis, B. moojeni, B. neuwiedi, B. pauloensis,
Bothrops sp., Briba brasiliana, Bronia bedai, B. kraoh, B. saxosa, Cercolophia roberti, C. steindachneri, Cercosaura albostrigatus, C. ocellata, C. parkeri,
C. schreibersii, Chironius bicarinatus, C. exoletus, C. flavolineatus, C. laurenti, C. quadricarinatus, C. scurrulus, C. laevicollis, C. multiventris, Clelia bicolor,
C. clelia, C. plumbea, C. quimi, C. rustica, Cnemidophorus aff. parecis, C. mumbuca, C. gr. ocellifer, C. parecis, Coleodactylus brachystoma, C. meridionalis,
Colobosaura modesta, Corallus hortulanus, Crotalus durissus, Dipsas indica, Dracaena paraguayensis, Drymarchon corais, Drymoluber brazili, Taeniophallus
occipitalis, Enyalius bilineatus, E. brasiliensis, E. catenatus, Epicrates cenchria, Erythrolamprus aesculapii, Eunectes murinus, E. notaeus, Gomesophis
brasiliensis, Gonatodes humeralis, Gymnodactylus amarali, G. guttulatus, Helicops angulatus, H. gomesi, H. infrataeniatus, H. leopardinus, H. modestus,
H. polylepis, H. trivittatus, Hemidactylus mabouya, Heterodactylus lundii, Hoplocercus spinosus, Hydrodynastes bicinctus, H. gigas, Iguana iguana, Imantodes
cenchoa, Kentropyx aff. paulensis, K. calcarata, K. paulensis, K. vanzoi, K. viridistriga, Leposternon infraorbitale, L. microcephalum, L. polystegum, Leptodeira
annulata, Leptophis ahaetulla, Leptotyphlops brasiliensis, L. dimidiatus, L. koppesi, Liophis almadensis, L. dilepis, L. frenatus, L. jaegeri, L. maryellenae,
L. meridionalis, L. miliaris, L. paucidens, L. poecilogyrus, L. reginae, L. taeniogaster, L. typhlus, Liotyphlops beui, L. schubarti, L. ternetzii, Lygodactylus wetzeli,
Lystrophis matogrossensis, L. nattereri, Mabuya dorsivittata, M. frenata, M. guaporicola, M. heathi, M. nigropunctata, Mastigodryas bifossatus, M. boddaerti,
Micrablepharus atticolus, M. maximiliani, Micrurus brasiliensis, M. aff. ibiboboca, M. frontalis, M. lemniscatus, M. spixii, M. surinamensis, M. tricolor,
Ophiodes fragilis, O. ‘striatus’, Ophiodes sp. 1, Ophiodes sp. 2, Oxybelis aeneus, O. fulgidus, Oxyrhopus guibei, O. petola, O. rhombifer, O. trigeminus, Phalotris
concolor, P. labiomaculatus, P. lativittatus, P. mertensi, P. multipunctatus, P. nasutus, P. tricolor, Philodryas aestiva, P. livida, P. mattogrossensis, P. nattereri,
P. olfersii, P. patagoniensis, P. psammophidea, P. viridissima, Phimophis guerini, P iglesiasi, Phyllopezus pollicaris, Polychrus acutirostris, P. marmoratus,
Psedablabes agassizii, Pseudoboa coronata, P. neuwiedii, P. nigra, Pseudoeryx plicatilis, Pseustes sulphureus, Psomophis genimaculatus, P. joberti, Rhachidelus
brazili, Sibynomorphus mikanii, S. turgidus, S. ventrimaculatus, Simophis rhinostoma, S. leucocephalus, S. longicaudatus, S. worontzowi, Spilotes pullatus,
Stenocercus quinarius, Stenocercus aff. tricristatus, Stenocercus caducus, S. dumerilii, Tantilla boipiranga, T. melanocephala, Teius teyou, Thamnodynastes
chaquensis, T. hypoconia, T. rutilus, Tropidurus etheridgei, T. guarani, T. hispidus, T. insulanus, T. itambere, T. montanus, T. oreadicus, T. semitaeniatus,
T. torquatus, Tupinambis duseni, T. merianae, T. quadrilineatus, T. teguixin, Typhlops brongersmianus, Vanzosaura rubricauda, Waglerophis merremii,
Xenodon rhabdocephalus, X. severus, Xenopholis undulatus.
Variables ALT BIO4 BIO7 BIO9 BIO10 BIO12 BIO15 BIO17 BIO18 DECL NPP
ALT — 0.44** 0.18* –0.72** –0.84** –0.28** 0.19** –0.10 0.37** 0.21** 0.22**
BIO4 — 0.40** –0.86** –0.56** –0.40** –0.38** 0.57** 0.60** 0.11 0.29**
BIO7 — –0.49** –0.38** 0.08 –0.17* 0.14* 0.52** 0.01 0.30**
BIO9 — 0.89** 0.24** 0.25** –0.41** –0.71** –0.15* –0.48**
BIO10 — 0.07 0.05 –0.18* –0.61** –0.17* –0.52**
BIO12 — –0.28** 0.16* 0.23** –0.18** 0.44**
BIO15 — –0.90** –0.37** 0.01 –0.28**
BIO17 — 0.43** 0.00 0.34**
BIO18 — –0.09 0.55**
DECL — 0.05
NPP —
**Correlation is significant at the 0.01 level.
*Correlation is significant at the 0.05 level.


