Embed Size (px)
Citation preview

ISSN 1063�780X, Plasma Physics Reports, 2010, Vol. 36, No. 12, pp. 1040–1064. © Pleiades Publishing, Ltd., 2010.Original Russian Text © N.A. Dyatko, Yu.Z. Ionikh, A.V. Meshchanov, A.P. Napartovich, K.A. Barzilovich, 2010, published in Fizika Plazmy, 2010, Vol. 36, No. 12, pp. 1104–1129.
1040
1. INTRODUCTION
It is well known that an admixture of a moleculargas to a noble gas can substantially change the electri�cal and spectral characteristics of a glow discharge.The degree and way of these changes depend on thedischarge conditions: the sort of noble gas, sort andpercentage of the admixture, gas pressure, etc. Here,we restrict ourselves to the analysis of the present stateof the art in studying nonconstricted (diffuse) dis�charges.
For glow discharges operating in pure noble gases,the main ionization mechanism is stepwise ionization(except for the case of very low pressures and cur�rents). A small admixture of a molecular gas(~0.001%) to He or Ne can lead to a reduction in boththe breakdown voltage and the discharge operatingvoltage (see, e.g., [1–3] and references therein). Thiseffect is partially due to the ionization energy of theadmixture molecule being lower than that of He andNe atoms, but is mainly caused by the processes ofPenning ionization, He* + M → He + M(+) + e andNe* + M → Ne + M(+) + e, because the energy of thelower metastable states of He* (19.8 eV) and Ne*(16.6 eV) is higher than the ionization energy of anymolecular admixture.
As the concentration of the molecular admixtureincreases, the situation becomes more complicated,because the admixture begins to appreciably affect the
electron energy balance in the plasma, due to whichelectron energy losses caused by the excitation ofvibrational and lower electronic levels of moleculesincrease. This effect results in an increase in the volt�age required to sustain the discharge. On the otherhand, an increase in the admixture concentrationgives rise to an additional ionization mechanismrelated directly to molecules (without involving meta�stable atoms of the noble gas), which can lead to areduction in the discharge operating voltage. Theresulting change in the discharge characteristicsdepends on the experimental conditions, such as thesort of molecular gas and the gas pressure. For exam�ple, the reduced electric field E/N (where E is theelectric field strength and N is the number density ofatoms or molecules) in the positive column of the dis�charge operating in a He:CO mixture in a tube ofradius R = 1.75 cm at a pressure of 1–10 Torr growsmonotonically as the CO content increases from 0.1 to10% [4].
In an Ar:N2 mixture, the mechanism of Penningionization is absent, because the energy of the lowermetastable levels of argon atoms (11.6 eV) is lowerthan the ionization energy of nitrogen molecules(15.58 eV). Moreover, in this case, nitrogen cannot beregarded as an easily ionized additive, because the ion�ization energy of Ar atoms (15.76 eV) is close to that ofN2 molecules. It is also well known that, for the same
LOW�TEMPERATUREPLASMA
Specific Features of the Current–Voltage Characteristics of Diffuse Glow Discharges in Ar:N2 Mixtures
N. A. Dyatkoa, Yu. Z. Ionikhb, A. V. Meshchanovb, A. P. Napartovicha, and K. A. Barzilovichb
a Troitsk Institute for Innovation and Fusion Research, Troitsk, Moscow oblast, 142190 Russiab St. Petersburg State University, Universitetskaya nab. 7/9, St. Petersburg, 199034 Russia
Received May 13, 2010
Abstract—The characteristics of diffuse glow discharges in pure argon and the Ar + 1%N2 mixture at pres�sures of 2–80 Torr were studied experimentally and numerically. The discharge operated in a molybdenum�glass tube with an inner diameter of 2.8 cm and interelectrode distance of 75 cm. The current–voltage char�acteristic of the discharge and the populations of the N2(B3
Πg) and N2(C3Πu) states were measured. It is
shown that, at relatively low pressures (P < 10 Torr), the current–voltage characteristic of a discharge in theargon–nitrogen mixture lies higher than that in pure argon. In contrast, at higher pressures (P > 15 Torr), thecurrent�voltage characteristic of a discharge in the mixture lies lower than that in pure argon. As the pressureincreases, the effect of the reduction in the discharge voltage becomes more pronounced. A self�consistentzero�dimensional kinetic model is developed that allows one to calculate the characteristics of the positivecolumn of a discharge in pure argon and Ar:N2 mixtures under the conditions of high vibrational excitationof nitrogen. A detailed description of the model is presented, and the calculated results are compared withexperimental data. The model adequately reproduces the observed change in the current�voltage character�istic in Ar and the Ar + 1%N2 mixture with increasing gas pressure. It is shown that the main ionization mech�anism in the Ar + 1%N2 mixture at moderate pressures is the associative ionization of excited nitrogen atoms.
DOI: 10.1134/S1063780X10120056

PLASMA PHYSICS REPORTS Vol. 36 No. 12 2010
SPECIFIC FEATURES OF THE CURRENT–VOLTAGE CHARACTERISTICS 1041
gas pressure in the discharge tube and the same dis�charge current, the voltage (or the electric field in thepositive column) required to sustain a dc diffuse glowdischarge in pure argon is much lower than that inpure nitrogen [5]. Taking into account these circum�stances, it would be expected that, when nitrogen isadded into argon, the electric field in the positive col�umn would increase monotonically with increasingnitrogen concentration. Indeed, this is the case at rel�atively low pressures (1–2 Torr for a tube radius of R ~1–2 cm; see, e.g., [4, 6]). However, at intermediatepressures (e.g., at 40 Torr), the following unexpectedeffect was observed: a small additive of nitrogen (0.1–1%) to argon resulted in a sharp decrease in the dis�charge voltage. This phenomenon was discovered inexperiments with partially constricted discharges inAr:N2 mixtures [7, 8].
The characteristics of glow discharges in noblegases with a nitrogen additive at moderate pressureswere experimentally studied by Kenty in 1962 [9].Although, in that paper, the characteristics of dis�charges operating in gas mixtures and pure noble gaswere not compared, the author noted (with a referenceto his unpublished work) that “in the case of Xe, … thevoltages are several to many times higher than if N2 ispresent.” In [10], the radial profile of the gas temper�ature in a glow discharge operating at intermediatepressure in pure argon and argon with a nitrogen addi�tive was measured, and, in [11], the passage of a shockwave through the discharge under these conditions wasinvestigated. It was noted in those papers that, for thesame current, the discharge voltage in the mixture waslower than that in pure argon; however, no specialstudies of this effect were performed.
In other available papers concerning dc glow dis�charges in mixtures of noble gases with nitrogen, theexperiments were performed either at low pressures ofthe gas mixture (Ar:N2 [4, 6, 12] or Ne:N2 [13]), whenthis effect was absent, or in the afterglow stage [14].
It should also be noted that there are a number ofexperimental and theoretical works concerning dis�charges in Ar:N2 [15–20] and He:N2 [21] mixtures, inwhich other types of discharge (such as RF [15, 19,21], microwave [16, 17], barrier [20], and pulsed [18]discharges) were investigated. In those studies, dis�charges operating at either low pressures [15–18, 21]or pressures close to atmospheric [19, 20] were consid�ered. In some papers [14, 15], the vibrational temper�ature of nitrogen was estimated. It was shown that, thevibrational temperature of nitrogen molecules in dis�charges operating in both Ar:N2 [15] and Ne:N2 [13]mixtures increases with decreasing nitrogen concen�tration.
A large number of theoretical studies were devotedto simulations of discharges in pure nitrogen and purenoble gases. As regards simulations of discharges in themixtures considered in the present paper, there areonly a few papers in which the kinetics of noble gas
atoms and nitrogen molecules (see, e.g., [16, 17]) wasconsidered in detail. Moreover, the conditions consid�ered in those studies (low�pressure RF and microwavedischarges) differ from those in which the effect of asharp decrease in the discharge voltage upon addingnitrogen to argon was observed [7, 8].
In the present work, the characteristics of dc diffuseglow discharges operating in pure argon and argon–nitrogen mixtures (specifically, an Ar + 1%N2 mix�ture) at pressures of 2–80 Torr were studied bothexperimentally and theoretically. The pressure rangeunder study was chosen to include both limiting cases:the low�pressure range, in which an admixture ofnitrogen to argon raises the current–voltage charac�teristic, and the range of moderate pressures at whichthe discharge voltage in the mixture is substantiallylower than that in pure argon. The main objective ofour study was to investigate ionization mechanismsresponsible for the observed effects in argon–nitrogenmixtures. Preliminary results of these studies werereported in [22].
2. EXPERIMENT
The experimental setup was basically similar to thatdescribed in [8, 23]. The discharge was excited in acylindrical molybdenum�glass tube with an innerdiameter of 2R = 2.8 cm. The cylindrical tantalumelectrodes were placed in the end spheres and installedat a distance of L = 75 cm from one another. The gasmixture (argon + nitrogen, the content of otheradmixtures being <10–3%) was supplied to the dis�charge tube from a steel cylinder through glass trapsand a copper capillary cooled with liquid nitrogen.The gas circulation rate through the tube was~100 sccm, the residence time of the gas mixture inthe tube being ~1 min. The gas pressure was varied in
the range P = 1–80 Torr. A dc source with =10 kV and Imax = 100 mA was used to sustain the dis�charge. The discharge current was varied by varyingthe power supply voltage Vs or the ballast resistance Rb.
Both electric and spectroscopic measurementswere performed. The current–voltage characteristic ofthe discharge was measured using a PCSU 1000 two�channel digital oscilloscope or an ADC card. For thispurpose, the discharge current I and discharge voltageU were measured for a given value of Rb and differentvalues of the supply voltage Vs.
The optical characteristics of the positive columnof the discharge were measured using a spectrometerconsisting of an Acton SP�2358 monochromator witha 1200�grooves/mm diffraction grating and aHamamatsu R928 photomultiplier. The dischargeradiation was focused by the optical system onto thespectrometer slit, which was oriented perpendicular tothe discharge axis. In front of the discharge tube, a3�mm�wide slit diaphragm was installed in parallel tothe discharge axis. Thus, the recorded radiation was
maxsV

1042
PLASMA PHYSICS REPORTS Vol. 36 No. 12 2010
DYATKO et al.
averaged over the tube diameter. The relative spectralsensitivity of the recording system was determinedusing a calibrated tungsten lamp. Absolute calibrationwas performed using the 0–2 band of the second pos�itive system (the C3Πu → B3Πg transition) of nitrogen.For this purpose, conditions were determined at whichthese bands were excited due to energy transfer fromthe Ar(3Р2) metastable level [24]. The relative contri�bution of this process to the excitation of the C3Πu
(v' = 0) level was determined by studying the decay ofthis level in the discharge afterglow. In parallel, theconcentration of Ar(3Р2) atoms was measured by the“mirror behind the tube” method from the absorptionof the spectral line. Since the rate constant of excita�tion transfer for the Ar(3Р2) → C3Πu (v' = 0) transitionis known [24], these measurements allowed us to per�form absolute calibration of the spectrometer.
The densities of molecules in the B3Πg and C3Πu
states were measured. In the former case, radiation of
the first positive system (the B3Πg → A3 transitions)from the v' = 2–7 (Δv = 2) and v' = 1, 2 (Δv = 1) lev�els was used (the bands from the v' = 0 level could notbe recorded by the photomultiplier). In the latter case,radiation of the second positive system (the C3Πu →B3Πg transitions) from the v' = 0–4 (Δv = –2) levelswas used. Below, we present the data on the moleculardensities obtained by summing over the v' = 0–4vibrational levels of the C3Πu state and v' = 1–7 vibra�tional levels of the B3Πg state. The first of these sumsyields the total density of molecules in the C3Πg state,while the second sum provides a lower estimate of thedensity of molecules in the B3Πg state. We failed tomore precisely determine the latter density by extrap�olating the dependence of the density on the numberof the vibrational level, because this dependence wasnonmonotonic. Additional uncertainty is introducedby averaging over the tube radius, because the radialprofile of the density of excited molecules is unknown.It should be noted that the design of the discharge tubewas intended for electric, rather than optical, mea�surements. We plan to perform spectroscopic studiesof the discharge in a tube with a quartz end window;this will allow us to perform measurements along theaxis of the positive column and study molecules in the
A3 metastable state.Figure 1 shows the measured current–voltage
characteristics of glow discharges in pure argon andthe Ar + 1% N2 mixture at different gas pressures. Itcan be seen from Fig. 1a that, at the pressure P =2 Torr, addition of nitrogen to argon substantiallyraises the current–voltage characteristic. In contrast,for P = 40 Torr (Fig. 1c), the current–voltage charac�teristic in the mixture lies much lower than that in pureargon (for I ≤ 23 mA, when the discharge in argonoperates in the diffuse form). As the current increases(I > 23 mA), the positive column of the discharge in
+
Σu
+
Σu
argon becomes constricted in a jump�like manner[23]; this effect is not considered in the present study.At intermediate pressures, e.g., for P = 10 Torr (Fig.1b), the current–voltage characteristics in the mixtureand pure argon differ insignificantly, especially at low(~10 mA) discharge currents.
Comparison of the current–voltage characteristicsmeasured for P = 40 and 80 Torr (see Figs. 1c, 1d)shows that the effect of a reduction in the dischargevoltage after nitrogen is added to argon becomes morepronounced with increasing pressure. Figure 2 showshow the discharge voltage varies with increasing pres�sure at a fixed discharge current. In pure argon, thedischarge voltage grows faster with increasing pressurethan in the Ar + 1% N2 mixture. The pressure at whichthe discharge voltages in pure argon and the mixturebecome equal depends on the discharge current. It fol�lows from Fig. 2 that, for I = 10 mA, the dischargevoltages become equal at Р ≈ 13 Torr, while for I =20 mA, this occurs at Р ≈ 16 Torr.
We also note that, for Р = 40 Torr and I = 10 mA,the discharge voltage in pure argon is higher than thatin the mixture by nearly a factor of 1.5 (by a factor of 2for Р = 80 Torr). Since the discharge voltage is sub�stantially higher than the cathode voltage drop (~100–200 V [5]), the 1.5� to 2�fold reduction in U impliesthat the electric field strength and, accordingly, theparameter E/N in the positive column decrease bynearly the same factor. The reduction in E/N at thetube axis should be even larger, taking into accountthat, for the same current, the gas temperature in thedischarge in the Ar:N2 mixture is lower than that in thedischarge in pure argon because of the lower energyW = IE deposited in the discharge. Obviously, such astrong change in E/N can occur only if the set of theprocesses determining the density of charged particleschanges radically. Since the recombination and diffu�sion rates of charged particles depend on E/N muchweaker than the rates of ionization and electronicexcitation, it is the ionization mechanism that shouldchange radically.
For Р ≤ 20 Torr and relatively low currents (I <5 mA), the current–voltage characteristic of the dis�charge in the argon�nitrogen mixture is nonmono�tonic. That such a nonmonotonic dependence isrelated to the processes occurring in the positive col�umn of the discharge is also confirmed by the similarbehavior of the intensities of the bands of the secondpositive system (see Fig. 3b).
Measurements of optical radiation emitted acrossthe discharge show the presence of regular and irregu�lar moving striations. For a pressure of 2 Torr, the stri�ations were observed at currents of I > 5 mA; for Р =5 Torr, at I < 15 mA; for Р = 10 Torr, at I < 10 mA; andfor Р = 20 Torr, at I < 2 mA. For Р = 40 Torr, onlyirregular striations were observed in the range I <1.5 mA. In this work, no special studies of the nature

PLASMA PHYSICS REPORTS Vol. 36 No. 12 2010
SPECIFIC FEATURES OF THE CURRENT–VOLTAGE CHARACTERISTICS 1043
of these striations and their parameters were per�formed.
The results of spectroscopic measurements are pre�sented in Fig. 3. The above�mentioned nonmonotonicdependence of the density of molecules in the C3Πu
state on the current can be seen at Р = 5–20 Torr andlow discharge currents. Note that, for molecules in theB3Πg state, such a nonmonotonic dependence isabsent. As compared to the current–voltage charac�teristic, the region in which the dependence is non�monotonic is somewhat shifted toward lower currentsand the lower boundary of the pressure range in whichsuch a dependence is observed is shifted toward higherpressures. As will be seen from out further analysis, themechanism for the excitation of the C3Πu state israther complicated and differs from that for the exci�tation of the B3Πg state. Therefore, it is not excludedthat the specific shape of the curves in Fig. 3b is relatedto the nonmonotonic behavior of E/N in the dis�
charge. However, to study this issue comprehensively,a more detailed analysis is required.
We also note that the populations of the N2(B3Πg)and N2(C3Πu) states decrease with increasing pressure(and, accordingly, density of nitrogen molecules in themixture). The density of N2(C3Πu) decreases mostabruptly as the pressure increases from 2 to 5 Torr.Probably this is related to the fact that the reducedelectric field in the discharge plasma decreases withincreasing pressure. For example, at currents of I =10–20 mA, the discharge voltages in the mixture arealmost the same at pressures of 2 and 5 Torr (seeFig. 2). This means that, for Р = 5 Torr, the value ofE/N is lower by a factor of 2 than that for Р = 2 Torr.Such a significant reduction in E/N leads to a sharpdecrease in the rates of electron�impact excitation ofthe electronic states of molecules and atoms. Probably,in this case, the mechanism for populating theN2(B3Πg) and N2(C3Πu) states also changes.
1400
1200
1000
800
600
400
200
0
(a)
3000
0
(c)
1500
0
(b)
6000
0
(d)
1000
500
605040302010I, mA
605040302010I, mA
5000
4000
3000
2000
1000
2500
2000
1500
1000
500
P = 40 TorrP = 2 Torr
P = 80 TorrP = 10 Torr
Ar
Ar + 1%N2
Ar
Ar + 1%N2
Ar
Ar + 1%N2
Ar
Ar + 1%N2
U, V U, V
Fig. 1. Current–voltage characteristic of discharges in pure argon and the Ar + 1% N2 mixture for different gas pressures: P =(a) 2, (b) 10, (c) 40, and (d) 80 Torr.

1044
PLASMA PHYSICS REPORTS Vol. 36 No. 12 2010
DYATKO et al.
3. THEORY
3.1. Preliminary Remarks
Let us note some specific features of the kinetics ofcharged and excited particles in the Ar + 1% N2 mix�ture at moderate pressures. The estimates presentedbelow are similar to those made for the Ar + 0.075%N2 mixture in [8]. For definiteness, we consider theresults of measurements for a pressure of 40 Torr. Thecorresponding current–voltage characteristic isshown in Fig. 1c. It follows from this figure that, forI = 10 mA, the discharge voltage is U ≈ 1300 V. Simpleestimates show that, under these conditions, the gastemperature at the tube axis is Tg ~ 400 K. Then,assuming that the cathode voltage drop is 120 V andthe length of the positive column is 75 cm, we find thatthe reduced electric field at the axis of the positive col�umn is E/N ≈ 1.6 Td.
Figure 4 illustrates the electron energy balance cal�culated for the unexcited Ar + 1%N2 mixture. Thecross sections for electron scattering from argon atomsand nitrogen molecules are taken from [23] and [25],respectively. The method for solving the Boltzmannkinetic equation for electrons is described in [25]. Itfollows from Fig. 4 that, for E/N = 1.6 Td, almost allthe deposited power (~97%) is spent on the excitationof vibrational levels of nitrogen. For the given condi�tions (the low concentration of N2 molecules), thispower reaches a fairly high value of ~(2–3) ×10⎯18 W/molecule; therefore, it can be expected thatthe degree of vibrational excitation is rather high.
Superelastic collisions of electrons with vibra�tionally excited molecules can appreciably affect theshape of the electron energy distribution function(EEDF) and other plasma characteristics. To illustrate
this, Fig. 5 shows the spherically symmetric part of theEEDFs in Ar + 1%N2 mixture, calculated for E/N =1.6 Td and different values of the vibrational tempera�ture of molecular nitrogen with the above processestaken into account. The calculations were performedunder the assumption that the distribution of nitrogenmolecules over vibrational levels is Boltzmannian witha given vibrational temperature T
v. For comparison,
Fig. 5 also shows the EEDF in pure argon. For thegiven conditions, the EEDF is non�Maxwellian inboth pure argon and the Ar:N2 mixture. As the vibra�tional temperature increases, the EEDF in the mix�ture approaches that in pure argon.
The calculated electron drift velocity We and effec�tive electron temperature Te = 2um/3 (where um is the
4000
3000
2000
1000
0
U, V
101100 102
P, Torr
I = 20 mA
I = 10 mA
Ar
Ar + 1%N2
Fig. 2. Discharge voltage as a function of the gas pressurefor discharge currents of I = 10 and 20 mA.
(a)
(b)
0 10 20 30 40 50I, mA
10
8
6
4
2
P = 2 Torr
510
2040
[C3Πu], 107 сm–3
0
25
20
15
10
5
[B3Πg], 1010 сm–3
P = 2 Torr
510
20
40
Fig. 3. Populations of the (a) N2(B3Πg, v = 1–7) and
(b) N2(C3Πu) states measured in the positive column of a
discharge in the Ar + 1% N2 mixture. The numerals by thecurves show the gas pressure.

PLASMA PHYSICS REPORTS Vol. 36 No. 12 2010
SPECIFIC FEATURES OF THE CURRENT–VOLTAGE CHARACTERISTICS 1045
mean electron energy) in pure argon and the Ar +1%N2 mixture for different values of T
v (for the mix�
ture) are shown in Figs. 6 and 7, respectively. The elec�tron drift velocity as a function of E/N in the mixtureincludes a descending segment in the range E/N ≈3.5–10 Td (for T
v = 300 K). Such a shape of the
dependence We(E/N) is typical of mixtures of heavynoble with molecular gases (see references in [26]).This effect is known in the literature as the negativedifferential conductivity of plasma; in a non�self�sus�tained discharge, it can result in oscillations of the dis�charge current [27]. Note that, as the nitrogen vibra�tional temperature increases, the descending segmentin the dependence We(E/N) becomes less pronouncedand the calculated value of the electron drift velocityapproaches that in pure argon. The effective electrontemperature in the mixture (see Fig. 7) increases withincreasing T
v, because the electron heating power
increases due to superelastic collisions of electronswith vibrationally excited molecules. This effect is themost pronounced at low E/N values, when the energydeposited in the discharge via these processes is com�parable with the energy deposited by the electric field.
3.2. Description of the Kinetic Model
To reveal the ionization mechanism in a dc glowdischarge in Ar:N2 mixtures, we developed a zero�dimensional model in which the equations describingthe kinetics of the excited states of Ar atoms (fourlower levels and three effective higher levels), vibra�
tional kinetics of nitrogen molecules in the ground
state N2(X1 , v) (45 vibrational levels), kinetics of
the electronic states of N2 (N2(A3 ), N2(B3Πg),
N2(B'3 ), N2(a'1 ), N2(a1Πg), N2(w1Δu), andN2(C3Πu)), kinetics of the electronic states of N atoms(N(4S), N(2D), and N(2P)), charge particle kinetics
(electrons and Ar+, , N+, , , and ions);the Boltzmann equation for electrons (with allowancefor electron–electron collisions and collisions withexcited atoms and molecules); and the equation forthe electric circuit are solved self�consistently. The gastemperature at the tube axis was estimated from theexperimental data and used as the parameter of themodel. The model allows one to self�consistently cal�culate the electric field in the discharge plasma, thedischarge current, the electron densities, the ion com�position, the nitrogen atom density, and the popula�tions of the excited states of atoms and molecules forgiven parameters of the problem (the gas mixturecomposition, the pressure and temperature of the gasmixture, the radius of the discharge tube, the inter�electrode distance, the ballast resistance in the dis�charge circuit, and the applied voltage). The results ofcalculations performed for different applied voltagesare represented as dependences of plasma parameterson the discharge current. The model is applicable toboth pure argon and argon–nitrogen mixtures.
3.2.1. Argon. The diagram of the electronic levelsof Ar atoms taken into account in the model is shown
+
Σg
Σu−
Σu−
Σu
+Ar2+N2
+N3+N4
100
80
60
40
20
0 2 4 6 8 10 12 14 16 18 20E/N, Td
Energy fraction, %
1
2
3
4
Fig. 4. Electron energy balance in the Ar + 1% N2 mixture(the gas is assumed to be unexcited): (1) fraction of theenergy scattered in elastic collisions and spent on the exci�tation of rotational levels, (2) fraction of the energy spenton the excitation of vibrational levels, (3) fraction of theenergy spent on the excitation of electronic states of nitro�gen, and (4) fraction of the energy spent on the excitationof electronic states of argon.
100
10–1
10–2
EEDF, eV–3/2
0 1 2 3 4 5 6u, eV
1
2
34
5
Fig. 5. EEDFs in pure argon (dashed line) and the Ar + 1%N2 mixture for E/N = 1.6 Td and different vibrational tem�peratures of nitrogen, calculated under the assumption ofthe Boltzmann distribution of molecules over vibrationallevels: T
v = (1) 300, (2) 3000, (3) 6000, (4) 12000, and
(5) 18000 K.

1046
PLASMA PHYSICS REPORTS Vol. 36 No. 12 2010
DYATKO et al.
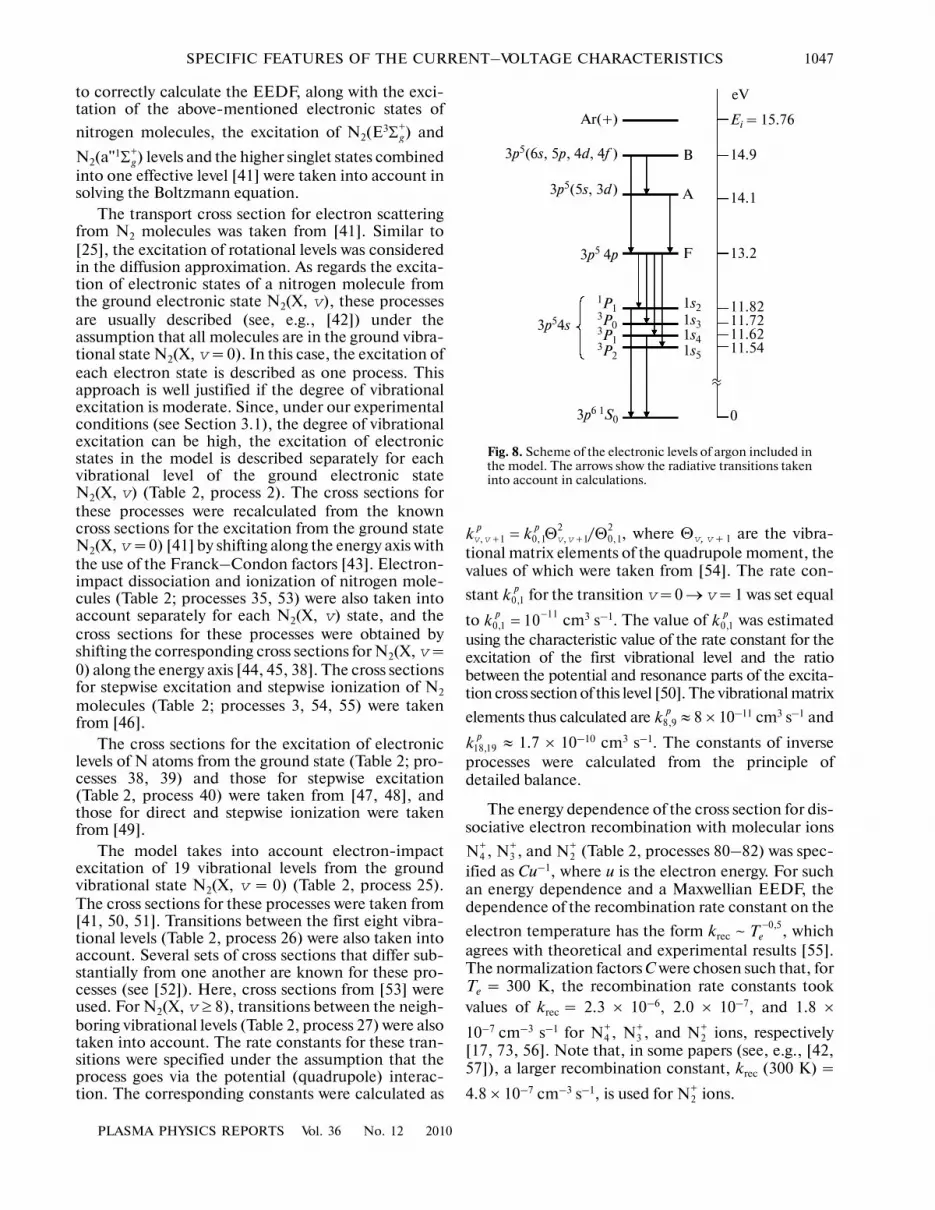
in Fig. 8, and the processes included in the kineticmodel for pure argon are given in Table 1. In this study,we used almost the same set of processes as in [23].The choice of cross sections for electron scattering byargon atoms and rates constants of different processeswas commented in detail in [23]; therefore, here, weonly list the processes taken into account and their rateconstants (see Table 1). Note that the model thor�oughly takes into account the kinetics of four lowerelectronic levels; two of them (1s3 and 1s5) are meta�stable and the other two (1s2 and 1s4) are resonance.The higher levels are combined into three effectivestates (F, A, and B), which include (according to therecommendations given in [28]) the 3p54p levels (stateF, 13.2 eV), 3p5(5s, 3d) levels (state A, 14.1 eV), and3p5(6s, 5p, 4d, 4f) levels (state B, 14.9 eV). Radiativedecay of the 1s4 and 1s2 resonance states was consid�
ered in the effective lifetime approximation [28], =AΘ, where A is the probability of spontaneous emis�sion and Θ is the probability of a photon escaping fromthe discharge region (the trapping of radiation wasthus taken into account). For our experimental condi�tions, the values of Θ were calculated using formulasfrom [28] and the data on the probabilities of sponta�neous emission were taken from [24]. Table 1 (pro�
cesses no. 19) gives the estimated values of .
3.2.2. Argon–nitrogen mixture. The processesincluded in the kinetic model for an argon–nitrogenmixture (in addition to the processes listed in Table 1)are given in Table 2. For brevity, in Table 2 and below
−
τeff1
−
τeff1
in the text, the following notation is used for the elec�
tronic states of nitrogen molecules: N2(X1 , v) ≡
N2(X, v), N2(A3 ) ≡ N2(A), N2(B3Πg) ≡ N2(B),
N2(B'3 ) ≡ N2(B'), N2(a'1 ) ≡ N2(a'), N2(a1Πg) ≡N2(a), N2(w1Δu) ≡ N2(w), N2(C3Πu) ≡ N2(C). If it isnot necessary to distinguish between different vibra�tional levels, then the N2(X, v) state is replaced withN2(X). If the electronic states are unimportant, thenthe notation N2 is used. The following notation is usedfor the electronic levels of N atoms: the ground stateN(4S) ≡ N(S), the lower metastable level (2.38 eV)N(2D) ≡ N(D), and the next metastable level (3.57 eV)N(2P) ≡ N(P). If it is not necessary to distinguishbetween different electronic levels, then the notationN is used.
3.2.3. Electron kinetics and choice of cross sec�tions. The EEDF was calculated by numerically solv�ing the time�independent homogeneous Boltzmannequation (with the use of the so�called two�termexpansion for the electron velocity distribution). Thefollowing processes were taken into account: elasticelectron scattering by N2 molecules and Ar atoms,excitation of rotational and vibrational levels of N2
molecules, excitation of electronic levels (includingstepwise excitation) of Ar and N atoms and N2 mole�cules, electron�impact dissociation of N2 molecules,inelastic collisions, and electron–electron collisions.The cross sections for inelastic collisions were calcu�lated from the principle of detailed balance. In order
+
Σg+
Σu−
Σu+
Σu
2.5
2.0
1.5
1.0
0.5
0 108642 18161412 20E/N, Td
We, 106 сm/s
1
2
3
4
5
Fig. 6. Electron drift velocity in pure argon (dashed line)and the Ar + 1% N2 mixture for different vibrational tem�peratures of nitrogen, calculated under the assumption ofthe Boltzmann distribution of molecules over vibrationallevels: T
v = (1) 300, (2) 3000, (3) 6000, (4) 12 000, and (5)
18 000 K.
4
0 108642 18161412 20E/N, Td
Te = 2/3 um, 104 K
1
2
3
4 5
3
2
1
Fig. 7. Effective electron temperature Te = 2um/3 (whereum is the mean electron energy) in pure argon (dashed line)and the Ar + 1% N2 mixture for different vibrational tem�peratures of nitrogen, calculated under the assumption ofthe Boltzmann distribution of molecules over vibrationallevels: T
v = (1) 300, (2) 3000, (3) 6000, (4) 12 000, and (5)
18 000 K.
PLASMA PHYSICS REPORTS Vol. 36 No. 12 2010
SPECIFIC FEATURES OF THE CURRENT–VOLTAGE CHARACTERISTICS 1047
Ar(+)
3p5(6s, 5p, 4d, 4f )
3p5(5s, 3d)
3p5 4p
3p54s
3p6 1S0
eV
Ei = 15.76
14.1
14.9
13.2
11.8211.7211.6211.54
0
B
A
F
1s21s31s41s5
1P13P03P13P2
Fig. 8. Scheme of the electronic levels of argon included inthe model. The arrows show the radiative transitions takeninto account in calculations.
to correctly calculate the EEDF, along with the exci�tation of the above�mentioned electronic states of
nitrogen molecules, the excitation of N2(E3 ) and
N2(a''1 ) levels and the higher singlet states combinedinto one effective level [41] were taken into account insolving the Boltzmann equation.
The transport cross section for electron scatteringfrom N2 molecules was taken from [41]. Similar to[25], the excitation of rotational levels was consideredin the diffusion approximation. As regards the excita�tion of electronic states of a nitrogen molecule fromthe ground electronic state N2(X, v), these processesare usually described (see, e.g., [42]) under theassumption that all molecules are in the ground vibra�tional state N2(X, v = 0). In this case, the excitation ofeach electron state is described as one process. Thisapproach is well justified if the degree of vibrationalexcitation is moderate. Since, under our experimentalconditions (see Section 3.1), the degree of vibrationalexcitation can be high, the excitation of electronicstates in the model is described separately for eachvibrational level of the ground electronic stateN2(X, v) (Table 2, process 2). The cross sections forthese processes were recalculated from the knowncross sections for the excitation from the ground stateN2(X, v = 0) [41] by shifting along the energy axis withthe use of the Franck–Condon factors [43]. Electron�impact dissociation and ionization of nitrogen mole�cules (Table 2; processes 35, 53) were also taken intoaccount separately for each N2(X, v) state, and thecross sections for these processes were obtained byshifting the corresponding cross sections for N2(X, v =0) along the energy axis [44, 45, 38]. The cross sectionsfor stepwise excitation and stepwise ionization of N2
molecules (Table 2; processes 3, 54, 55) were takenfrom [46].
The cross sections for the excitation of electroniclevels of N atoms from the ground state (Table 2; pro�cesses 38, 39) and those for stepwise excitation(Table 2, process 40) were taken from [47, 48], andthose for direct and stepwise ionization were takenfrom [49].
The model takes into account electron�impactexcitation of 19 vibrational levels from the groundvibrational state N2(X, v = 0) (Table 2, process 25).The cross sections for these processes were taken from[41, 50, 51]. Transitions between the first eight vibra�tional levels (Table 2, process 26) were also taken intoaccount. Several sets of cross sections that differ sub�stantially from one another are known for these pro�cesses (see [52]). Here, cross sections from [53] wereused. For N2(X, v ≥ 8), transitions between the neigh�boring vibrational levels (Table 2, process 27) were alsotaken into account. The rate constants for these tran�sitions were specified under the assumption that theprocess goes via the potential (quadrupole) interac�tion. The corresponding constants were calculated as
+
Σg+
Σg
, where Θv, v + 1 are the vibra�
tional matrix elements of the quadrupole moment, thevalues of which were taken from [54]. The rate con�
stant for the transition v = 0 → v = 1 was set equal
to cm3 s–1. The value of was estimatedusing the characteristic value of the rate constant for theexcitation of the first vibrational level and the ratiobetween the potential and resonance parts of the excita�tion cross section of this level [50]. The vibrational matrix
elements thus calculated are ≈ 8 × 10–11 cm3 s–1 and
≈ 1.7 × 10⁻¹⁰ cm3 s–1. The constants of inverseprocesses were calculated from the principle ofdetailed balance.
The energy dependence of the cross section for dis�sociative electron recombination with molecular ions
, , and (Table 2, processes 80–82) was spec�ified as Сu–1, where u is the electron energy. For suchan energy dependence and a Maxwellian EEDF, thedependence of the recombination rate constant on the
electron temperature has the form krec ~ , whichagrees with theoretical and experimental results [55].The normalization factors С were chosen such that, forTe = 300 K, the recombination rate constants tookvalues of krec = 2.3 × 10⁻⁶, 2.0 × 10⁻⁷, and 1.8 ×
10⎯7 cm–3 s–1 for , , and ions, respectively[17, 73, 56]. Note that, in some papers (see, e.g., [42,57]), a larger recombination constant, krec (300 K) =
4.8 × 10⁻⁷ cm–3 s–1, is used for ions.
+ += Θ Θ/2 2
, 1 0,1 , 1 0,1p pk kv v v v
0,1pk
−
=
110,1 10pk 0,1
pk
8,9pk
18,19pk
+N4+N3
+N2
−0,5eT
+N4+N3
+N2
+N2

1048
PLASMA PHYSICS REPORTS Vol. 36 No. 12 2010
DYATKO et al.
Table 1. Processes included in the model for pure argon
No. Process k (cm6 s–1, cm3 s–1, s–1) Reference
1 Elastic electron scattering Boltzmann equation* [29]Excitation from the ground state
2 Ar + e Ar(i) + e, i = 1s5, 1s4, 1s3, 1s2, F, A, B Boltzmann equation [30]Ionization from the ground state
3 Ar + e Ar+ + e + e Boltzmann equation [31]Electron�impact mixing
4 Ar(i) + e Ar(j) + e, i, j = 1s5, 1s4, 1s3, 1s2 f(Te) [32]Mixing by atoms
5 Ar(1s5) + Ar Ar(1s4) + Ar 2.3 × 10⁻¹⁵ cm3 s–1 [33, 34]6 Ar(1s3) + Ar Ar(1s4) + Ar 4.3 × 10⁻¹⁵ cm3 s–1 [33, 34]
Stepwise excitation7 Ar(i) + e Ar(F) + e, i = 1s5, 1s4, 1s3, 1s2 Boltzmann equation See [23]8 Ar(F) + e Ar(j) + e, j = A, B Boltzmann equation See [23]9 Ar(A) + e Ar(B) + e Boltzmann equation See [23]
Stepwise ionization10 Ar(i) + e Ar+ + e + e, i = 1s5, 1s4, 1s3, 1s2, F, A, B Boltzmann equation [35, 23]
Chemionization11 Ar(i) + Ar(j) Ar+ + Ar + e, i, j = 1s5, 1s4, 1s3, 1s2 1.2 × 10⁻⁹ cm3 s–1 [36, 37, 23]
Ion conversion
12 Ar + Ar+ + Ar + Ar 2.3 × 10⁻³¹(300/Tg)0.67 cm6 s–1** [38]
Dissociative recombination
13 + e Ar(А) + Ar Boltzmann equation See [23]
Ion dissociation
14 + e Ar+ + Ar + e Boltzmann equation [39]
Three�body recombination
15 Ar+ + e + Ar Ar + Ar 2.3 × 10⁻²²/ cm6 s–1 [24]
Dimer production
16 Ar* + Ar + Ar + Ar 1.4 × 10⁻³²(300/Tg)0.5 cm6 s–1 [33, 23]
Dimer ionization
17 + e + e + e Boltzmann equation [40, 23]
Dimer emission
18 Ar2 + hν 106 s–1 [40, 23]
Emission19 Ar(1s4, 1s2) Ar + hν
(Trapping of radiation is taken into account)5 × 10⁴ s–1, 2.5 × 10⁵ s–1 See the text
20 Ar(F) Ar(1s5, 1s4, 1s3, 1s2) + hν 1. 6 × 10⁷, 9.3 × 10⁶, 3.0 × 10⁶, 8.5 × 10⁶ s–1 See [23]21 Ar(A) Ar(F) + hν 1.56 × 10⁷ s–1 See [23]22 Ar(B) Ar(A) + hν 8.6 × 10⁶ s–1 See [23]23 Ar(B) Ar(F) + hν 9.1 × 10⁵ s–1 See [23]24 Ar(B) Ar(1s5, 1s4, 1s3, 1s2) + hν 1. 8 × 10⁵, 1.2 × 10⁵, 3.7 × 10⁴, 9.3 × 10⁴ s–1 See [23]
Diffusion onto the tube wall25 Ar(1s5, 1s3) wall Ar See the text
Ambipolar diffusion onto the tube wall
26 e, Ar+, wall See the text
*The rate constant is found by solving the Boltzmann equation for EEDF.**Here and in Table 2, the gas temperature Tg is in kelvins.
Ar2+
Ar2+
Ar2+
Tg2.5
Ar2*
Ar2* Ar2
+
Ar2*
Ar2+

PLASMA PHYSICS REPORTS Vol. 36 No. 12 2010
SPECIFIC FEATURES OF THE CURRENT–VOLTAGE CHARACTERISTICS 1049
Table 2. Processes included in the model for an argon–nitrogen mixture (in addition to the processes in pure argon, listed in Table 1)
No. Process k (cm6 s–1, cm3 s–1, s–1) Reference
1 Elastic electron scattering and excitation of vibrational levels Boltzmann equation [41, 25]Kinetics of N2 electronic states
2 N2(X, v = i) + e N2 (*) + e, i = 1, ..., 20* – A, B, B', a, a', w, C
Boltzmann equation See the text
3 N2(A) + e N2 (*) + e, * – B, a, a', C, Boltzmann equation [46]4 N2(B) N2 (A) + hν 2 × 10⁵ s–1 [42, 60]5 N2(C) N2 (B) + hν 2.7 × 10⁷ s–1 [42, 61]6 N2(a) N2 (X, v = 0) + hν 1.8 × 10⁴ s–1 [42, 62]7 N2(a) N2 (a') + hν 1.9 × 10² s–1 [42, 63]8 N2(w) N2 (a) + hν 6.5 × 10² s–1 [42, 64]9 N2(B') N2 (B) + hν [42], see the text
10 N2 (*) wall N2 (X, v = 0), * – A, a, a', w Diffusion [65], see the text11 N2(B) + N2 N2 (A) + N2 3 × 10–11 cm3 s–1 [42, 66]12 N2(B) + N2 N2 (X, v = 0) + N2 1.5 × 10⁻¹² cm3 s–1 [42, 67]13 N2(a') + N2 N2 (B) + N2 1.9 × 10⁻¹³ cm3 s–1 [42, 57, 67]14 N2(a) + N2 N2 (a') + N2 2 × 10–11 cm3 s–1 [42, 62]15 N2(A) + N2(A) N2 (C) + N2 (X, v = 0) 1.5 × 10⁻¹⁰ cm3 s–1 [42, 68]16 N2(A) + N2(A) N2 (B) + N2 (X, v = 0) 7.7 × 10⁻¹¹ cm3 s–1 [42, 69]17 N2(A) + N2(X, 5 ≤ v ≤ 14) N2 (B) + N2 (X, v = 0) 2 × 10–11 cm3 s–1 [42], see the text18 N2(X, v ≥ 16) + N2(X, v ≥ 16) N2 (a') + N2 (X, v = 0) 2.5 × 10⁻¹⁵ cm3 s–1 [70]19 N2(B) + Ar N2 (A) + Ar 3 × 10–13 cm3 s–1 [16]20 N2(w) + Ar N2 (a) + Ar 5 × 10–13 cm3 s–1 [16]21 N2(a') + Ar N2 (B) + Ar 10–14 cm3 s–1 [16]22 N2(a) + Ar N2 (a') + Ar 10–12 cm3 s–1 [16]23 N2(X) + Ar(*) N2 (C) + Ar, * – 1s5, 1s4, 1s3, 1s2 2.9 × 10⁻¹¹ cm3 s–1 [24]24 N2(X) + Ar(*) N2 (B) + Ar, * – 1s5, 1s4, 1s3, 1s2 6 × 10–12 cm3 s–1 [24]
Vibrational kinetics25 N2(X, v = 0) + e N2 (X, v = i) + e, 1 ≤ j ≤ 19 Boltzmann equation [41, 50, 51]26 N2(X, v = i) + e N2 (X, v = j) + e, i = 1–7, i < j ≤ 8 Boltzmann equation [49], see the text27 N2(X, v = i) + e N2 (v = i + 1) + e, i = 8–19 See the text28 N2(X, v = i) + N2(X, v = j) N2(X, v = i – 1) + N2(X, v = j + 1) V–V [71]29 N2(X, v = i) + N N2(X, v = j) + N V–T [73]29 N2(X, v = i) + N2 N2(X, v = i – 1) + N2 V–T See the text30 N2(X, v = i) + Ar N2(X, v = i – 1) + Ar V–T See the text31 N2(X, v = 45) + N2 N(S) + N(S) + N2 See the text32 N2(X, v = 45) + Ar N(S) + N(S) + Ar See the text34 N2(X, v = i) wall N2(X, v = i – 1) See the text
Kinetics of N atoms35 N2(X, v = i) + e N(S) + N(S) + e, i = 1, ..., 20 Boltzmann equation See the text36 N2(A) + N2(X, 14 ≤ v ≤ 19) N2 (B, v ≥ 13) + N2 (X, v = 0)
N(S) + N(S) + N2 (X, v = 0)See the text
37 N2(X, 10 < v < 25) + N2(X, 10 < v < 25) N + N + N2(X) See the text38 N(S) + e N(D) + e Boltzmann equation [47, 48]39 N(S) + e N(P) + e Boltzmann equation [47, 48]40 N(D) + e N(P) + e Boltzmann equation [47, 48]41 N + N + N2 N2(B) + N2 8.3 × 10⁻³⁴exp(500/Tg) [80]42 N + N + Ar N2(B) + Ar 0.3 × 8.3 × 10–34exp(500/Tg) [17]43 N(S) wall 0.5N2(X, v = 0) See the text44 N(P) + N2 N(D) + N2 2 × 10–18 cm3 s–1 [79]45 N(P) + N2 N(S) + N2 6.0 × 10⁻¹⁴ cm3 s–1 [84]46 N(D) + N2 N(S) + N2 10–13 × exp(–510/Tg) [79]47 N(P) + N N(S) + N 1.8 × 10⁻¹² cm3 s–1 [79]48 N(P) + Ar N(D) + Ar 7 × 10–16 cm3 s–1 [79]

1050
PLASMA PHYSICS REPORTS Vol. 36 No. 12 2010
DYATKO et al.
Table 2. (Contd.)
No. Process k (cm6 s–1, cm3 s–1, s–1) Reference
49 N(D) + Ar N(S) + Ar 2 × 10–16 cm3 s–1 [79]50 N(D, P) wall N(S) See the text51 N(S) + N2(A) N(P) + N2(X, 6 ≤ v ≤ 9) 4 × 10–11(300/Tg)
2/3 [17]52 N(P) + N2(X, ϖ ≥ 10) N(S) + N2(A) 10–10exp(–1300/Tg) [17, 79]
Ion–electron kinetics
53 N2(X, v = i) + e + e + e, i = 1, ..., 20 Boltzmann equation See the text
54 N2(A) + e + e + e Boltzmann equation [46]
55 N2(a') + e + e + e Boltzmann equation [46]
56 N(S) + e N+ + e + e Boltzmann equation [49]57 N(D) + e N+ + e + e Boltzmann equation [49]58 N(P) + e N+ + e + e Boltzmann equation [49]
59 N2(A) + N2(a') + e 10–11 cm3 s–1 [42]
60 N2(a') + N2(a') + e 5 × 10–11 cm3 s–1 [42]
61 N(D) + N(P) + e 10–12 cm3 s–1 [87]
62 N(P) + N(P) + e 2 × 10–11 cm3 s–1 [81]
63 Ar+ + N2(X, v) Ar + (0.12–7.6) × 10–10 cm3 s–1 [89]
64 Ar + (v') Ar+ + N2(X, v) ~4 × 10⁻¹⁰ cm3 s–1 [90]
65 + N N+ + N2(X, v = 0) 2.4 × 10⁻¹⁵ Tg, cm3 s–1 [79]
66 + N N+ + N2(X, v = 0) + N2(X, v = 0) 10–11 cm3 s–1 [79]
67 Ar+ + N N+ + Ar 10–12 cm3 s–1 [79]
68 + N N+ + Ar + Ar 10–11 cm3 s–1 See the text
69 + N2(X) + N2 + N2 6.8 × 10⁻²⁹(300/Tg)1.64 [91]
70 + N2 + N2(X) + N2 2.1 × 10⁻¹⁶exp(Tg/121) [73, 79]
71 + N2(X) + Ar + Ar 1.9 × 10⁻²⁹ cm6 s–1 [92], see the text
72 + Ar + N2(X, v = 0) + Ar 2.1 × 10⁻¹⁶exp(Tg/121) By analogy with no. 70
73 + N + N2 + N2 0.9 × 10⁻²⁹exp(400/Tg) [79]
74 + N + Ar + Ar 0.9 × 10⁻²⁹exp(400/Tg) By analogy with no. 73
75 N+ + N2(X) + N2 + N2 0.9 × 10⁻²⁹exp(400/Tg) [79]
76 N+ + N2(X) + Ar + Ar 0.9 × 10⁻²⁹exp(400/Tg) By analogy with no. 75
77 N+ + N + N2 + N2 10–29 cm6 s–1 [92], see the text
78 N+ + N + Ar + Ar 10–29 cm6 s–1 [92], see the text
79 + N + N2(X, v = 0) 6.6 × 10⁻¹¹ cm3 s–1 [79]
80 + e N2(X, v = 0) + N2(X, v = 0) Boltzmann equation See the text
81 + e N2(X, v = 0) + N(S) Boltzmann equation See the text
82 + e N(S) + N(D, P) Boltzmann equation See the text
83 tube wall N2(X, v = 0) + N2(X, v = 0) Ambipolar diffusion See the text
84 tube wall N2(X, v = 0) + N(S) Ambipolar diffusion See the text
85 tube wall N2(X, v = 0) Ambipolar diffusion See the text
86 N+ tube wall N(S) Ambipolar diffusion See the text
N2+
N2+
N2+
N4+
N4+
N2+
N2+
N2+
N2+
N2+
N4+
Ar2+
N2+
N4+
N4+
N2+
N2+
N4+
N4+
N2+
N2+
N3+
N2+
N3+
N3+
N3+
N2+
N2+
N3+
N2+
N4+
N3+
N2+
N4+
N3+
N2+

PLASMA PHYSICS REPORTS Vol. 36 No. 12 2010
SPECIFIC FEATURES OF THE CURRENT–VOLTAGE CHARACTERISTICS 1051
The kinetic and transport coefficients for electronswere calculated by numerically solving the Boltzmannequation for the EEDF [25, 58] in the local approach.The applicability of this approach at low pressures is notquite obvious. For example, it was stated in [59] that,for PR < 5–10 cm Torr (where R is the tube radius), thelocal EEDF for argon (i.e., that calculated in the localapproach) differed substantially from the nonlocal one.For our conditions, we have PR ≈ 3 cm Torr for thelowest pressure of 2 Torr. Probably, in this case, quali�tative, rather than quantitative, agreement betweenthe calculated and experimental results should beexpected.
3.2.4. Kinetics of the electronic states of nitrogenmolecules. The processes of this kind (Table 2, pro�cesses 2–24) and their rate constants were taken intoaccount by analogy with [42, 16, 17]. Let us note spe�cific features of these processes. The kinetics of theN2(B') level is described by two processes: electron�impact excitation and radiative transition from theground state to the N2(B) state, i.e., this process is anadditional channel for populating the N2(B) state. It isassumed that, if the N2(B) state is quenched in colli�sions with nitrogen molecules, then the N2(А) state ispopulated in most (95%) cases and only a small frac�tion (5%) of the reaction products occur in the groundelectronic state (see [42]). The model includes theprocesses of quenching of the electronic states of N2
molecules by argon atoms (Table 2, processes 19–22)and the processes of quenching of the excited Ar atomsby nitrogen molecules (Table 2; processes 23, 24),which lead to the population of the N2(С) and par�tially N2(B) states. In addition, the model also takesinto account excitation of the N2(a') state in collisionsbetween vibrationally excited molecules (see [70]),
N2(X, v ≥ 16) + N2(X, v ≥ 16) → N2 (a') + N2 (X). (1)
The rates of the diffusion losses of electronicallyexcited nitrogen molecules and excited nitrogen andargon atoms on the tube wall were calculated using theformulas
(2)
where D0 is the diffusion coefficient for normal condi�tions (P = 760 Torr and Tg = 273 K). Since reliabledata on the diffusion coefficients of excited nitrogenmolecules in argon are lacking, we used the diffusioncoefficients for unexcited molecules [65], D0 =0.17 cm2/s and α = 1.75. The data on the diffusion ofnitrogen atoms in argon are also absent; therefore, weused the known values of D0 and α for oxygen atoms inargon [65], D0 = 0.23 cm2/s and α = 1.84. The data onthe diffusion of metastable argon atoms in argon were
α
ν = Λ =Λ
⎛ ⎞= ⎜ ⎟⎝ ⎠
dif / сm /s
K
Torr
22
0
, 2.4, [ ]
[ ]760 ,[ ] 273
g
D R D
TD
P
taken from [65], D0 = 0.084 cm2/s and α = 1.5. It wasassumed that, colliding with the tube wall, electroni�cally excited molecules and atoms are quenched to theground state.
3.2.5. Vibrational kinetics. The kinetics of vibra�tional levels of nitrogen molecules (Table 2, pro�cesses 25–34) includes electron�impact excitationand deexcitation (see above), V–V exchange, V–Trelaxation on N2 molecules and Ar and N atoms, andquenching of vibrational excitation of molecules incollisions with the tube wall. The rate constants of V–V exchange were taken from [71], and the rate con�stants of V–T relaxation on N atoms were calculatedusing expressions from [73],
(3)
where Ev is the vibrational energy of the vth level in
kelvins, k0 = 4 × 10⁻¹⁰ (Tg/300)0.5 cm3/s, Ea = 7280 K,and β = 0.065. Due to chemical interaction of Natoms with N2 molecules, multiquantum relaxationtakes place. According to theoretical results (see [73]),the main relaxation channel is transitions into one tofive vibrational levels below; therefore, it was proposedin [73] to use Δvm = 5. In this case, the probabilities ofprocesses with different values of Δv are assumed to bethe same.
As regards the processes of V–T relaxation on N2
molecules, their rate constants are very small (see,e.g., [73, 76, 77]). If the degree of nitrogen dissocia�tion is not too small (>10–4), then these processes areof minor importance as compared to the processes ofV–T relaxation on N atoms. The rate constants forV⎯T relaxation on argon atoms [72] are much smallerthan those for V–T relaxation on nitrogen molecules;therefore, for our conditions, these processes can beignored. Similar to [16, 42], it is assumed that, collid�ing with other molecules, vibrationally excitedN2(X, v = 45) molecules dissociate.
The quenching rate of vibrationally excited mole�cules in their collisions with the tube wall was esti�mated using the formula [74]
(4)
−Δ
⎧ ≤ ≤ Δ⎪⎪⎪
> Δ Δ ≤ Δ⎨Δ⎪⎪ > Δ Δ > Δ⎪⎩
⎧ ⎛ ⎞β− + β ≤⎜ ⎟⎪= ⎝ ⎠⎨⎪ β >⎩
�
,
0
0
1 , 1
1 , ,
0, , ,
exp ,
, ,
m
m mm
m m
aa
g g
a
k
k k
E Ek E E
T Tk
k E E
v
v v v v
v
v
v
v
v v
v
v v v v
v
v v v v
−
⎛ ⎞− εΛν = +⎜ ⎟ε⎝ ⎠
vib 12
dif2
,RD
v
vv

1052
PLASMA PHYSICS REPORTS Vol. 36 No. 12 2010
DYATKO et al.
which takes into account both the time during whichmolecules diffuse toward the wall and the probabilityof collisional quenching. Here, is the thermal veloc�ity of nitrogen molecules and ε
v is the accommodation
coefficient, which is equal to 0.002 for molybdenumglass [75]. It is assumed that, in this quenching pro�cess, the molecule “loses” one vibrational quantum.
The degree of vibrational excitation of moleculesdepends on the rates of V–V exchange (νVV), V–Trelaxation (νVT), quenching of vibrationally excited
molecules on the tube wall ( ), and electron�impact
mixing of vibrational levels ( ) (processes N2(v = i) +е ↔ N2(v = j) + е). We estimated these rates for a dis�charge in the Ar + 1%N2 mixture at a pressure of P =40 Torr and discharge current of I = 10 mA. In thiscase, the reduced electric field is E/N ≈ 1.6 Td (seeabove) and the electron density at the tube axis is ne ~(1.5–4) × 1010 cm–3, depending on the drift velocityused for estimations (see Fig. 6). The density of nitro�gen atoms was assumed to be [N] ~ 1014 cm–3, whichcorresponded to ~1% degree of dissociation.
The V–T relaxation rate on nitrogen atomsincreases nearly exponentially with increasing v andmakes νVT ~ 0.1 s–1 for v = 10 and νVT ~ 8 s–1 for v =20. The quenching rate of vibrational excitation on the
tube wall is ~ 8 s–1. The rate of electron�impactmixing of the first eight vibrational levels (the set ofcross sections used here includes cross sections for
transitions between eight lower levels) is ~ 20–200 s–1. The rate of V–V exchange for these lower lev�els is νVV ~ 200–300 s–1 (it is assumed that the popula�tion of vibrational levels corresponds to the Boltz�mann distribution with a temperature of T
v = 6000 K).
It follows from these estimates that the followinginequalities are satisfied for the lower vibrational lev�
els: νVT, ≤ νVV. This means that the popula�tions of the lower vibrational levels are substantiallydetermined by electron�impact mixing. Since theelectron temperature under our experimental condi�tions is fairly high (see Fig. 7), it can be expected thatthe degree of vibrational excitation is also high.
3.2.6. Kinetics of N atoms. This part of the kineticmodel (Table 2, processes 35–52) includes the pro�cesses of atom production; electron�impact excitationand deexcitation of the N(D) and N(P) states; popu�lation of the N(P) state in collisions with nitrogenmolecules in the N2(A) state; quenching of excitedatoms in collisions with atoms, molecules, and thetube wall; and recombination in triple collisions andcollisions with the tube wall.
Various mechanisms of dissociation of nitrogenmolecules were mainly studied as applied to dischargesin pure nitrogen. It is commonly accepted that, atmoderate pressures, molecules dissociate via processesinvolving electrons or/and vibrationally excited mole�
v
νdifvib
νvibe
νvibdif
νvibe
νvibdif � ν
vibe
cules, rather than by direct electron impact (see, e.g.,[78]). One of the most probable processes of this kindis excitation of the N2(B, v ≥ 13) predissociation state[79],
(5)
In [78], the following process was also considered:
(6)
where v and v' are chosen such that the total energy islarger than the dissociation energy. In [78], calcula�tions were performed both with and without allowancefor processes (6). The best agreement with experimen�tal data on the density of N atoms was obtained whenthe following rate constants were used for processes (5)and (6): k5 = 4.5 × 10⁻¹¹exp(–1765/Tg) cm3 s–1 andk6 = 3.5 × 10⁻¹⁵ cm3 s–1. In this case, processes (6)contribute appreciably to dissociation only at low cur�rents. If only process (5) with the rate constant k5 =6.5 × 10⁻¹¹exp(–1765/Tg) cm3 s–1 is used in calcula�tions, the density of N atoms is somewhat underesti�mated at low currents. It was assumed in [78] that therecombination rate of N atoms on the tube was pro�portional to their density (see below). According to[78], it can be accepted that, at temperatures of350⎯500 K, the typical (average) rate constant of pro�cess (5) is k5 ~ 10–12 cm3 s–1.
As regards losses of nitrogen atoms on the tubewall, this problem was also studied mainly as appliedto discharges in pure nitrogen at relatively low pres�sures. Thus, it was noted in [79] that, for degrees ofnitrogen dissociation lower than 3%, P = 1.5–10 Torr,and Tg = 300–390 K, the measured values of therecombination rate of atoms on a molybdenum�glasssurface can be represented as
(7)
where [N] and [N2] are the densities of N atoms andN2 molecules, respectively. According to formula (7),the recombination rate of atoms on a glass surface isproportional to the atomic density squared. In thiscase, the process of recombination can be formallywritten as N + N → N2; then, the corresponding rate
constant is = (2/R) × 1.1 × 10³/[N2] cm3 s–1. Esti�mate (7) was obtained for low pressures at which thetime of atomic diffusion onto the wall is shorter thanthe time of heterogeneous recombination. At higherpressures, the effective recombination rate of atoms onthe tube wall should be calculated with allowance fordiffusion,
. (8)
( ) ( ) ( )
( ) ( )
+ ≤ ≤ → ≥
+ → + +
N A N X N B
N X N N N X 2 2 2
2 2
,14 19 , 13
.
v v
( )
( ) ( )
< <
+ < < → + +
N X
N X N N N X 2
2 2
,10 25
,10 ' 25 ,
v
v
− −
×�recN сm s N
22 1 3
2
[ ][ ] 1.1 10 ,[ ]
NQ
recNk
− −
⎛ ⎞ ⎛ ⎞ν = + +⎜ ⎟ ⎜ ⎟
ν ν ν⎝ ⎠ ⎝ ⎠
1 1effrec N N N N
dif rec dif rec
= N
1 1 1 1[ ]k

PLASMA PHYSICS REPORTS Vol. 36 No. 12 2010
SPECIFIC FEATURES OF THE CURRENT–VOLTAGE CHARACTERISTICS 1053
In [82], it was concluded that the loss rate of nitro�gen atoms in a discharge in a molybdenum�glass tubeat pressures of P = 0.5–4 Torr is described by a first�order process with respect to the density of N atomsand that the probability of this process is γ ≈ 0.002. Inthis case, the recombination rate on the tube wall canbe calculated using a formula similar to formula (4). Insimulations of a discharge in nitrogen [16, 42, 78], it isusually assumed that the rate of this process is propor�tional to the density of N atoms and the correspondingprobability is specified.
For an Ar:N2 mixture, the situation is even moreuncertain, because the ratio between the adsorptionprobabilities of N2 molecules and Ar atoms on theactive surface sites are unknown. If, e.g., these proba�bilities are equal, then [N2] in formula (7) shouldapparently be replaced with [N2] + [Ar] (see [79]),
. (9)
In view of the large uncertainty in the processes ofnitrogen atom production and mechanisms of theirrecombination on the tube wall, we performed severalvariants of calculations for the following values of thedissociation rate constants and different mechanismsof nitrogen atom recombination on the tube wall:
(i) k5 = 10–12 cm3 s–1, k6 = 0, first�order recombi�nation with respect to [N], and γ = 0.002;
(ii) k5 = 4.5 × 10⁻¹¹exp(–1765/Tg) cm3 s–1, k6 =3.5 × 10⁻¹⁵ cm3 s–1, and first�order recombination withrespect to [N];
(iii) k5 = 6.5 × 10⁻¹¹exp(–1765/Tg) cm3 s–1, k6 = 0,and first�order recombination with respect to [N];
(iv) k5 = 6.5 × 10⁻¹¹exp(–1765/Tg) cm3 s–1, k6 = 0,and second�order recombination with respect to [N](formulas (7), (8)); and
(v) k5 = 6.5 × 10⁻¹¹exp(–1765/Tg) cm3 s–1, k6 = 0,and second�order recombination with respect to [N](formulas (8), (9)).
These variants will further be referred to as variants1, 2, 3, 4, and 5, respectively.
The processes of three�particle recombination of Natoms lead to the production of electronically excitednitrogen molecules. Different electronic states of theresulting molecules were considered in the literature:N2(X) and N2(А) [57]; N2(B) and N2(a) [17]; N2(X),N2(A), N2(B), and N2(C) [56]; and N2(A) and N2(B)[81]. Here, we assume that molecules are produced inthe N2(B) state.
The quenching rate constants of the N(D) andN(P) states in collisions with Ar atoms and thequenching rate of the N(P) state by N atoms weretaken from [79]. The quenching rate constant of theN(P) state in collisions with N2 molecules used in [79](2 × 10–18 cm–3 s–1) seems to be underestimated,
− −
×
+
�
Nrec
N сm s
Ar N
22 1 3
2
[ ][ ] 1.1 10[ ] [ ]
Q
because, in some other papers (see [83]), much highervalues of this rate constant were adopted. For example,according to measurements performed in [84], thevalue of this rate constant (at a gas temperature of400 K) is 6 × 10–14 cm–3 s–1. Since, under our experi�mental conditions, the gas temperature at the tube axiscan reach 500 K, we used this value in calculations.The values of the quenching rate constants of theN(D) state by N2 molecules obtained by differentauthors agree satisfactory with one another (see [83,85]).
Under certain conditions (see [81]), the followingprocesses can contribute decisively to the populationof the N(P) state:
N(S) + N2(A) → N(P) + N2(X, 6 ≤ v ≤ 9). (10)
The rate constants of these processes were taken thesame as in [17]. The inverse reactions were also takeninto account,
N(P) + N2(X, v ≥ 10) → N(S) + N2(A). (11)
The rate constants for these reactions were taken from[79]. The rate constants were assumed to be indepen�dent of the number of the vibrational level. The totalquenching rate of the N(P) state in these reactionsdepends on the total density of N2(X, v ≥ 10). It wasassumed in calculations that the process goes for20 ≥ v ≥ 10.
3.2.7. Electron–ion kinetics. Along with the pro�cesses of direct and stepwise electron�impact ioniza�tion, the model also includes the reactions of associa�tive ionization of electronically excited molecules andatoms (Table 2, processes 59–62),
N2(A) + N2(a') → + e, (12)
N2(a') + N2(a') → + e, (13)
N(D) + N(P) → + e, (14)
N(P) + N(P) → + e. (15)
It follows from energy considerations that reaction (13)can go via not only the associative channel, but alsothe Penning channel,
N2(a') + N2(a') → + N2 + e. (16)
A similar channel is also possible for reaction (12),but only for vibrationally excited molecules (theenergy threshold is ≈1.0 eV). The question of whichchannel is more preferable has not practically beendiscussed yet. In [86], the relative role of the associa�tive and Penning processes was considered as applied
to N2(X, v) + N2(a''1 ) collisions; however, nounambiguous answer was obtained. The rate constantsof reactions (12) and (13) used in different studies dif�fer by one to two orders of magnitude (see [42]). Wechose the values of these constants in accordance withrecommendations made in [42].
+N4
+N4
+N2
+N2
+N2
+
Σg

1054
PLASMA PHYSICS REPORTS Vol. 36 No. 12 2010
DYATKO et al.
The rate constant of process (14) is known onlyapproximately. Estimates of this constant [87] fromthe principle of detailed balance yield a value of≤10⎯12 cm–3 s–1, which is lower by one order of magni�tude than the estimate given in [88]. In our calcula�tions, we used data from [87]. It was shown in [81] thatthe use of process (15) in the model of the afterglownitrogen plasma allows one to adequately describespecific features of the experimentally observedplasma decay dynamics. According to estimates [81],the rate constant of this process is 2 × 10–11 cm–3 s–1; itis this value that was used in our model.
The kinetic model for an argon–nitrogen mixtureincludes five ion species; accordingly, there are a largenumber of processes involving these ions, such ascharge transfer, conversion, and dissociation (Table 2,processes 63–79). The ionization energy of Ar atoms(15.76 eV) and N2 molecules (15.58 eV) almost coin�cide; therefore, charge�transfer processes go in bothdirections (Table 2; processes 63, 64) with close rateconstants. In [89], the rate constants for the charge�transfer reaction of Ar+ ions with N2(X, v) moleculeswere given for different vibrational numbers v. For v =0–3, these constants are 0.12 × 10⁻¹⁰, 3 × 10⁻¹⁰, 7.6 ×10⁻¹⁰, and 7.6 × 10⁻¹⁰ cm3 s–1, respectively. For v > 3,the following value of the rate constant was used: 7.6 ×10⁻¹⁰ cm3 s–1. The rate constant of the inverse reaction
depends on the vibrational state of a (v') ion.According to [90], this constant is small for v' = 0 anddepends weakly on v' for v' > 0.
The ionization energy of nitrogen atoms is rela�tively low (14.53 eV); therefore, charge�transfer pro�cesses involving these atoms take place (Table 2, pro�cesses 65–68). The rate constant for the charge�trans�fer reaction of Ar+ ions with N atoms (10⎯12 cm3 s–1)was taken from [79]. For the rate constant for the
charge�transfer reaction of ions with N atoms, alarger value of 10–11 cm3 s–1 was used.
The rate constants for ion conversion and dissocia�tion (Table 2, processes 69–79) are mainly known forreactions involving nitrogen atoms and nitrogen mol�ecules. The rate constants for processes involvingargon atoms were assumed to be the same as for similarreactions involving nitrogen or by analogy with theknown processes in which the third particle is a He orNe atom [92] (Table 2; processes 71, 77, 78).
At low pressures, the main channel for the loss ofcharged particles is their diffusion onto the tube wall.In the zero�dimensional model, this process is usuallycharacterized by the rate of ambipolar diffusion. In ageneral case, if there are several ion species in the dis�charge plasma, then the diffusion drift of charged par�ticles is not reduced to the simple regime of ambipolardiffusion [93]. In order to describe the diffusion driftof ions and electrons in the framework of our zero�dimensional model, the following simplifications weremade: the radial profiles of the ion densities were
+N2
+Ar2
assumed to be the same and the electron mobility wasassumed to be constant along the tube radius. In thiscase, the coefficient of ambipolar diffusion for elec�trons is described by the expression
(17)
and that for ions is described by the expression
. (18)
The corresponding rates of the electron and ion drifttoward the tube wall are
, . (19)
In formulas (17)–(19), Dea, De, μe, ne, and νea are thecoefficient of ambipolar diffusion, coefficient of freediffusion, mobility, density, and rate of ambipolar dif�fusion of electrons, respectively, and Dia, μi, ni, and νia
are the coefficient of ambipolar diffusion, mobility,density, and rate of ambipolar diffusion of ions of theith species, respectively. The plasma is assumed to bequasineutral, i.e., . Expressions (17)–(19)can easily be obtained using the standard procedurefor deriving the coefficients of ambipolar diffusion(see, e.g., [5]). The diffusion coefficient and mobilityof electrons were calculated by numerically solving theBoltzmann equation for the EEDF.
The mobilities of Ar+ and ions in argon were
taken from [65], and the mobility of ions in argon,from [94]. Since we failed to find data on the mobility
of N+, , and ions in argon, their values weretaken to be the same as in nitrogen [95]. For most ions,there is no data on the dependence of their mobility onthe gas temperature (for a constant density of argonatoms). The dependence of the mobility of Ar+ ions inargon on the gas temperature was given in [96].According to [96], as the temperature increases from300 to 600 K, the mobility decreases by only 20%.Since, for our conditions, high gas temperatures areachieved at moderate pressures, at which the processof ambipolar diffusion plays a minor role, the depen�dence of the ion mobility on the gas temperature wasnot taken into account in calculations.
3.2.8. Electric�circuit equation. The equation forthe electric circuit was written as
(Vs – Vc – EL)/Rb = eneWe(S/2.3), (20)
where ne is the electron density at the tube axis, Vc isthe cathode voltage drop, and S is the tube cross�sec�tional area. The value of Vc was assumed to be inde�pendent of the pressure and current and was takenequal to 120 V. The coefficient 2.3 assumes a Bessel�type radial profile of the electron density.
≈ μ
μ
∑ , e iea i
e ei
D nDn
≈ μ
μ
eia i
e
DD
ν =Λ
2ea
eaD
ν =Λ
2ia
iaD
=∑e iin n
+Ar2+N2
+N3+N4

PLASMA PHYSICS REPORTS Vol. 36 No. 12 2010
SPECIFIC FEATURES OF THE CURRENT–VOLTAGE CHARACTERISTICS 1055
It should be noted that the use of the equation forthe electric circuit in form (20) implies that the densi�ties of different plasma components calculated in theframework of our zero�dimensional model correspondto their densities at the axis of the discharge tube.
3.2.9. Gas temperature at the tube axis. As wasnoted above, the gas temperature was used as a param�eter of our model. For given values of the gas pressureand discharge current, the temperature was estimatedas follows. From the measured current–voltage char�acteristic, we calculated the electric field in theplasma, E ≈ (U(I) – Vc)/L, and the power depositedper unit length of the discharge, Q = IE. A fraction ofthe deposited energy is carried away from the plasmavolume (radiation of atoms and molecules and drift ofions, electrons, and excited particles toward the tubewall) and the rest energy is spent on gas heating. Theratio of these fractions depends on the gas pressure anddischarge current. According to estimates based onour preliminary calculations carried out for moderatepressures, the deposited energy is almost entirely spenton gas heating (≥90% in the argon–nitrogen mixtureand ≥95% in pure argon at P = 40 Torr and I = 20 mA).For P = 2 Torr, ~40% of the deposited energy is spenton gas heating.
Then, a one�dimensional (along the tube radius)time�independent thermal balance equation with agiven heat source was solved numerically and theradial profile of the gas temperature was calculated. Itwas assumed that the radial profile of the depositedenergy was Besselian and the wall temperature was300 K. The dependence of the thermal conductivity ofargon on the gas temperature was taken from [65]. Thevalue of the gas temperature at the tube axis thusobtained was used in our zero�dimensional model.The calculated dependence of the gas temperature atthe tube axis on the discharge current for our experi�mental conditions is shown in Fig. 9.
The gas temperature in a glow discharge under theconditions close to our experimental conditions wasmeasured in [10] (Ar, Ar + 1%N2, pressure of 50 Torr,tube diameter of 3.8 cm, and currents of 5–50 mA). Inthat paper, the gas temperature was also estimatedusing the procedure described above. It was shown thatthe calculated values of the gas temperature agreedquite well with the measured values. Therefore, it canbe expected that the temperature values presented inFig. 9 also agree satisfactorily with the gas temperatureat the axis of the discharge tube.
3.3. Numerical Results and Discussion
Figure 10 shows the calculated values of the electricfield in the positive columns of glow discharges in pureargon and the Ar + 1% N2 mixture as functions of thedischarge current for different gas pressures. In orderto not overload the figure, the results obtained for vari�ant 3 are not shown. For pressures of P = 2 and 80 Torr,
these results are close to the results obtained for vari�ant 1, and, for P = 40 Torr and I > 10 mA, they areclose to the results obtained for variant 4. For I ≤ 5 mA,we failed to obtain a steady�state solution for variant 3(see below). For comparison Fig. 10 also shows thevalues of E obtained from the measured current–volt�age characteristics (it was assumed that the cathodevoltage drop was 120 V, independently of the pressureand current).
It follows from Fig. 10 that the calculated values ofE in pure argon agree fairly well with the measuredones for both low pressures (2 Torr) and moderatepressures (40 and 80 Torr). For the Ar + 1% N2 mix�ture and Р = 80 Torr, the calculated and experimentalresults agree satisfactorily for all variants under con�sideration. For P = 40 Torr, such agreement isobserved for all variants, except for variant 5; the val�ues of Е calculated for this variant are appreciablylower than the measured ones. For P = 2 Torr, the cal�culated and measured values of the electric field agreefor I > 5 mA. For I < 5 mA, the calculated values of Еare much larger than the measured ones and the bestagreement with experiment is achieved for calculationvariant 5.
Comparison of the experimental data with theresults obtained in different variants does not allow usto reliably conclude which of these variants is prefera�ble. Note that, in our calculations (unlike [78]), theintroduction of an additional source of N atoms (pro�cesses (6)) is not of fundamental importance. Asregards recombination of nitrogen atoms on the tube
wall, the question of the preferable expression for remains open, because, for Р = 2 Torr, variant 5 pro�vides the best agreement with the experiment, while
recNQ
0 5 10 15 20I, mA
700
650
600
550
500
450
400
350
300
Tg, K
Ar
Ar + 1%N2
2 Torr
40 Torr
80 Torr
Fig. 9. Gas temperature at the axis of the discharge tube asa function of the discharge current, calculated for ourexperimental conditions.

1056
PLASMA PHYSICS REPORTS Vol. 36 No. 12 2010
DYATKO et al.
for Р = 40 Torr, in contrast, agreement achieved in thisvariant is the worst. Of course, it is not excluded thatthe recombination mechanism depends on the gaspressure in such a way that, at low pressures, recombi�nation is a second�order process with respect to [N](formula (9)), whereas at moderate pressures, it is afirst�order process.
On the whole, the model adequately reproducesthe observed dependence of the current–voltage char�acteristic on the gas pressure: at low gas pressures, theelectric field in a discharge in the Ar + 1%N2 mixtureis higher than in pure argon, whereas at moderatepressures, it is appreciably lower than in pure argon. Inorder to reveal the ionization mechanisms in a glowdischarge in the Ar + 1% N2 mixture, we thoroughlyanalyzed the solutions obtained. Table 3 presents thecalculated values of the reduced electric field in thepositive column of the discharge.
It follows from Table 3 that, at currents of 2–20 mAthe value of E/N in discharges in the argon–nitrogenmixture varies within the ranges of 1.6–2.1 Td for P =40 and 80 Torr and 10.9–22.5 Td for P = 2 Torr. Anal�ysis of these values and the dependence of the electrondrift velocity on E/N (see Fig. 6) shows that, in theformer and latter ranges of E/N, the drift velocityincreases with increasing reduced electric field for allvalues of the vibrational temperature used in our cal�culations. The former range corresponds to driftvelocities on the left of the local maximum ofWe(E/N), while the latter range corresponds to driftvelocities on the right of the local minimum ofWe(E/N). The fact that the drift velocity in theseranges is an ascending function of the reduced electricfield makes it possible to obtain stable steady�statesolutions. Note that there are conditions for whichsuch solutions cannot be obtained. For example, invariant 3, for a pressure of P = 40 Torr and I < 5 mA,calculations yield undamped oscillations of the elec�tric field, electron density, and other plasma parame�ters. In other variants, oscillations occur in the rangeof low currents (<1 mA) at P = 40 Torr. A similar effectalso takes place at lower pressures. Probably this isrelated to the fact that, under these conditions, steady�state solutions correspond to E/N from the range inwhich the drift velocity We(E/N) decreases withincreasing reduced electric field (see Fig. 6). Suchsolutions are unstable. In numerical calculations, thismanifests itself in the oscillations of the plasmaparameters.
According to our calculations, in a discharge inpure argon, electrons are mainly produced via step�wise ionization from the lower electronic states andare lost due to ambipolar diffusion (at Р = 2 Torr) orambipolar diffusion and dissociative recombination
with ions (at Р = 40 Torr). This fact is well known;therefore, we will not consider the results obtained forpure argon in more detail.
Ar2+
0
(c)
155 2010I, mА
80
P = 80 TorrAr
Ar + 1%N2
70
60
50
40
30
20
10
(b)40
P = 40 TorrAr
Ar + 1%N2
(a)14
P = 2 Torr
Ar
Ar + 1%N2
35
30
25
20
15
10
5
0
12
10
8
6
4
2
0
E, V/cm
Fig. 10. Calculated (curves) and measured (symbols)dependences of the electric field in the positive columns ofdischarges in pure argon and the Ar + 1% N2 mixture onthe discharge current for P = (a) 2, (b) 40, and (c) 80 Torr.The results calculated for the argon–nitrogen mixture invariants 1, 2, 4, and 5 are shown by the solid, dotted,dashed and dashed�and�dotted curves, respectively. Theresults calculated in variant 3 are not shown (see the text).

PLASMA PHYSICS REPORTS Vol. 36 No. 12 2010
SPECIFIC FEATURES OF THE CURRENT–VOLTAGE CHARACTERISTICS 1057
As regards discharges in the Ar + 1% N2 mixture,let us first consider the calculated results obtained formoderate pressures (e.g., for Р = 40 Torr, variant 1). Aswas expected, the high degree of vibrational excitationof nitrogen is achieved in the discharge (see Fig. 11).The vibrational temperature Т
v (v = 0, 1) calculated
using the populations of two lower vibrational levelsincreases with increasing current and, for I = 20 mA,reaches a value of 12 300 K.
The calculations show that, for our conditions,electrons are largely produced via associative ioniza�tion of excited nitrogen atoms (processes (14), (15)).Therefore, in order to reveal the contributions of dif�ferent processes to the ionization balance and the pro�duction and loss of nitrogen atoms, we analyzed thesolutions obtained. The results of this analysis are pre�sented in Table 4. The calculated populations of differ�ent electronic states of atoms and molecules and thedensities of charged particles are shown in Figs. 12 and13 as functions of the discharge current.
It can be seen from Table 4 that, for a current of I =20 mA, ionization is almost entirely (97%) provided byprocesses (14) and (15), whereas electrons are lost due
to recombination with ions (70%) and ambipolardiffusion (18%). As the current decreases to 2 mA, thecontribution of processes (14) and (15) to electronproduction decreases to 71%, while the contributionof associative ionization of excited molecules (pro�cesses (12), (13)) increases appreciably (to 29%). Inthis case, the contribution of dissociative recombina�tion to electron losses decreases to 34% due to a
decrease in the density of ions (see Fig. 13).
Nitrogen atoms are mainly produced via the exci�tation of nitrogen molecules into the predissociationstate N2 (B, v ≥ 13) (process (5)) and are lost due totheir recombination on the tube wall. These two pro�cesses balance one another with good accuracy (seeTable 4). Other processes involving N(S) atoms are theexcitation and quenching of the N(D, P) states, i.e.,the processes in which atoms are not produced or lost.The degree of nitrogen dissociation is 1.6% for I =20 mA and 0.3% for I = 2 mA.
The N(D) state is populated by electron impactfrom the ground state and due to quenching of the
Ar2+
+Ar2
N(P) state in collisions with Ar atoms. The contribu�tion of the former process increases with increasingcurrent. The N(D) state is depopulated due toquenching in collisions with Ar atoms and N2 mole�cules. One of the main channels for populating theN(P) state is excitation from the ground state N(S) incollisions with excited N2(A) molecules (process (10)).For I = 20 mA, this process is balanced with goodaccuracy by inverse process (11); in this case, the fol�lowing processes play an important role: electron�impact population of the N(P) state (23%) andquenching of the N(P) state in collisions with Aratoms and N2 molecules. For I = 2 mA, process (10) isdominating (96%) and the N(P) state is deexcited viaprocesses (11) and due to quenching by Ar atoms andN2 molecules.
We note that the N2(a') state is mainly populatedin collisions of vibrationally excited molecules (pro�cess (1)) and is depopulated via quenching in colli�sions with Ar atoms (Table 2, process 21). It can beseen from Fig. 12 that, as the discharge current
Table 3. Calculated values of the reduced electric field E/N [Td] (variant 1)
Р = 2 Torr Р = 40 Torr Р = 80 Torr
I, mA Ar Ar + 1% N2 Ar Ar + 1% N2 Ar Ar + 1% N2
2 7.5 22.5 3.9 2.1
5 7.4 15.8 3.7 1.8 3.9 1.76
10 7.2 14.2 3.5 1.7 3.7 1.75
20 6.6 10.9 3.3 1.6 3.5 1.74
100
10–1
10–2
10–3
20151050 40353025v
N2(X, v)/N2(X, 0)
I = 2 mА, Tv = 5100 K
I = 5 mA, Tv = 7250 K
I = 10 mA, Tv = 9800 K
I = 20 mA, Tv = 12300 K
Fig. 11. Calculated distribution of nitrogen molecules overvibrational levels in the plasma of a glow discharge in theAr + 1% N2 mixture for P = 40 Torr (variant 1).

1058
PLASMA PHYSICS REPORTS Vol. 36 No. 12 2010
DYATKO et al.
decreases, the densities of molecules in the N2(a') andN2(А) states decrease more slowly than the densities ofatoms in the N(D) and N(P) states. This is why thecontribution of associative ionization of excited mole�cules (processes (12), (13)) to the ionization balanceincreases with decreasing discharge current (seeTable 4). Using the results of the above analysis, thefaster decrease in the densities of atoms in the N(D)and N(P) states can be qualitatively explained as fol�lows. The production of nitrogen atoms in the groundstate N(S) (process (5)) and molecules in the N2(a')state (process (1)) are second�order processes withrespect to the density of electronically or vibrationally
excited nitrogen molecules (~[ ]2), whereas their
loss rates are independent of [ ]. Therefore, the[N(S)] and [N2(a')] densities in the discharge plasma
are proportional to ~ [ ]2 and nearly equallydecrease with decreasing current (see Fig. 12). Theexcitation rate of the N(P) state is proportional to
N2*
N2*
N2*
[N(S)][ ] ~ [ ]3 and [N(S)]ne ~ [ ]2ne. Thedepopulation rate of this state depends weakly on
[ ]; therefore, as the current decreases, the [N(P)]density decreases faster than [N(S)] and accordingly,[N2(a')]. Similar considerations also apply to the pop�ulation of the N(D) state. In this case, the [N(D)]density decreases with decreasing current even faster,because the depopulation rate of this state is indepen�
dent of [ ] and depends weakly on ne.
Although associative ionization (processes (14),
(15)) leads to the production of ions, the most
abundant ions in the discharge plasma are ions
(see Fig. 13). This is because ions undergo chargetransfer with Ar atoms (Table 2, process 64) and the
Ar+ ions thus produced are converted rapidly into
ions (Table 1, process 12). The density of ions inthe plasma is fairly high due to the production of N+
N2* N2* N2*
N2*
N2*
+N2+Ar2
+N2
+Ar2+N3
Table 4. Calculated (variant 1) relative contributions (%) of different processes to the production of electrons and nitrogen atomsand their loss (sign “minus”) in the plasma of a glow discharge in the Ar + 1% N2 mixture for P = 40 Torr (only the most impor�tant processes are listed; therefore, the sums can be smaller than 100%)
Processes Current Processes Current
Electrons 2 mA 20 mA Atoms N(S) 2 mA 20 mA
N(P) + N(P) + e 60 62 N2(A) + N2(X, 14 ≤ v ≤ 19) N2(B,v ≥ 13) + N2 (X) 2N(S) + N2 (X)
32 11
N(D) + N(P) + e 11 35 N2(X, v = 10–20) + N(P) N2(A) +N(S)
25 43
N2(A) + N2(a') + e 20 2 N(P) + N2 N(S) + N2 11 4
N2(a') + N2(a') + e 9 1 N(D) + N2 N(S) + N2 14 23
+ e Ar(A) + Ar –34 –70 N(D) + Ar N(S) + Ar 13 14
Ambipolar diffusion –56 –18 Recombination of N(S) on the wall –32 –10
N3+ + e N2+ N –3 –7 N(S) + N2(A) N(P) + N2(X, 6 ≤ v ≤ 9) –52 –43
N4+ + e N2+ N2
–6 –5 N(S) + e N(D) + e –15 –42
Atoms N(P) Atoms N(D)
N(S) + N2(A) N(P) +N2(X, 6 ≤ v ≤ 9)
96 77 N(S) + e N(D) + e 54 89
N(S) + e N(P) + e 4 10 N(P) + Ar N(D) + Ar 45 10
N(D) + e N(P) + e 0 13 N(P) + N(S) N(D) + N(S) 1 1
N2(X, v = 10–20) + N(P) N2(A) + N(S)
–47 –78 N(D) + N2 N(S) + N2 –50 –49
N(P) + N2 N(S) + N2 –20 –7 N(D) + Ar N(S) + Ar –47 –29
N(P) + Ar N(D) + Ar –24 –8 N(D) N(S) (quenching on the wall) –3 –5
N(P) + Ar N(S) + Ar –7 –2 N(D) + e N(P) + e 0 –16
N2+
N2+
N4+
N4+
Ar2+

PLASMA PHYSICS REPORTS Vol. 36 No. 12 2010
SPECIFIC FEATURES OF THE CURRENT–VOLTAGE CHARACTERISTICS 1059
ions via charge transfer of ions with N atoms(Table 2, process 68) and their subsequent conversion
into ions in three�body collisions with nitrogenmolecules (Table 2, processes 75, 76). The density of
ions is relatively low; however, it decreases moreslowly with decreasing current than the densities ofother ions. This is because the role of associative disso�ciation of excited molecules in the electron produc�tion increases with decreasing current (see Table 4)
and ions are produced in these processes.
As was noted above, calculation variants 2–4 yieldfield values close to those obtained in variant 1 (seeFig. 10b). This is related, in particular, to the fact that,in all these variants, the rates of heterogeneous recom�bination are rather close to one another. In variant 5,in which active sites on the tube surface are occupiednot only by nitrogen molecules, but also argon atoms,the rate of heterogeneous recombination decreasesappreciably. Since, for our conditions (Р = 40 Torr, seeabove), the loss of N atoms is determined by heteroge�neous recombination, the density of N atoms in thedischarge plasma increases. This leads to an increasein the ionization rate due to associative ionization ofexcited nitrogen atoms and, accordingly, a reductionin the electric field required for discharge operation.Similar situation takes place for a discharge operatingat a pressure of Р = 80 Torr (see Fig. 10c).
As the gas pressure decreases, the rate of ambipolardiffusion of electrons and ions increases. In this case,the reduced electric field E/N in the plasma increases,because, in order to preserve ionization balance in thedischarge plasma, it is necessary that the ionization
+Ar2
+N3
+N4
+N4
rate be sufficiently high. As E/N increases, the fractionof energy spent on the excitation of vibrational levelsof nitrogen molecules decreases, whereas the fractionof energy spent on the excitation of electronic states ofnitrogen molecules and argon atoms increases (seeFig. 4). For example, for E/N = 20 Td, more than one�half of the energy deposited in the discharge is spenton the excitation of electronic levels of argon. In thiscase, ionization processes involving argon atoms con�tribute substantially to electron production.
Table 5 shows the relative contributions of differentprocesses to electron production in the plasma of aglow discharge in the Ar + 1%N2 mixture at a pressureof Р = 2 Torr. It can be seen that, for a discharge cur�rent of 2 mA, 60% of the ionization rate is provided byargon atoms (due to direct and stepwise ionization andchemionization), the contribution from direct elec�tron�impact ionization being the largest. In this case,the value of E/N in a discharge operating in theargon–nitrogen mixture is much larger than that in adischarge excited in pure argon (22.5 and 7.5 Td,respectively; see Table 3). This is related, in particular,to the fact that, in this mixture, excited argon atoms areefficiently quenched by nitrogen molecules (Table 2;processes 23, 24). The remaining 40% of electrons areproduced via processes (12) and (13) (31%), processes(15) (7%), and stepwise ionization of excited mole�cules (2%). As the current increases, the value of E/Nin the discharge plasma decreases (see Table 3), thefraction of energy spent on the excitation of electroniclevels of argon decreases and the contribution of argonto ionization decreases (48% for 20 mA, see Table 5).The contribution of processes (12) and (13) remainspractically unchanged (30%), and the relative contri�
1014
1013
1012
1011
1010
N, сm–3
0 5 10 15 20I, mА
N(S)
N(D) N2(A)
N(P)
N2(a')
Fig. 12. Calculated populations of the electronic statesof N atoms and N2 molecules in the Ar +1% N2 plasmaas functions of the discharge current for P = 40 Torr(variant 1).
1011
109
108
107
106
N, сm–3
0 5 10 15 20I, mА
Ar2(+)
N3(+)1010
ne
Ar(+)
N4(+)
N(+)
N2(+)
Fig. 13. Calculated electron and ion densities in the Ar +1% N2 plasma as functions of the discharge current for P =40 Torr (variant 1).

1060
PLASMA PHYSICS REPORTS Vol. 36 No. 12 2010
DYATKO et al.
bution of associative ionization of excited nitrogenatoms increases appreciably (20%) mainly due to pro�cess (15). It can be seen from Fig. 14 that the densitiesof nitrogen atoms in the N(P) and N(D) statesincrease faster with increasing current than the densityof nitrogen molecules in the N2(A) state.
In contrast to the case of Р = 40 Torr, the mainsource of N(S) atoms at low pressures is electronimpact dissociation of N2 molecules, whereas the con�
tribution of processes (5) is as low as 15%. For a cur�rent of 2 mA, nitrogen atoms in the N(S) state aremainly lost due to their recombination on the tubewall, while for 20 mA, ionization processes (N(S) →
N(D, P) → ) also contribute considerably (~45%)to these losses. The degree of nitrogen dissociation is0.26% for I = 2 mA and ≈2% for I = 20 mA. Nitrogenatoms in the N(P) state are produced via processes(10) and are lost due to quenching on the tube wall andin collisions with nitrogen molecules and argon atoms.For I = 20 mA, ionization processes (15) contributeappreciably to the loss of nitrogen atoms in the N(P)state.
At low pressures, the degree of vibrational excita�tion of nitrogen molecules is lower than that at P =40 Torr. In this case, the vibrational temperature Т
v
(v = 0, 1) increases from 2900 to 8000 K as the cur�rent increases from 2 to 20 mA. According to calcula�tions, at low pressures, the interaction of vibrationallyexcited molecules with electronically excited mole�cules (see, e.g., Table 2, process 17) and electron�impact excitation (and deexcitation) of N2(A) andother states from different N2(X, v) states play animportant role in the formation of the vibrational dis�tribution function.
For Р = 2 Torr, the ion composition in the dis�charge plasma (see Fig. 15) differs radically from thatfor Р = 40 Torr. The most abundant ions are Ar+ and
, i.e., the same ions as those produced in the ioniza�
tion processes (see Table 5). ions are also producedin the ionization processes (see Table 5), but their den�sity is relatively low, because they undergo chargetransfer with Ar atoms. In this case, the inverse pro�cess, namely, charge transfer of Ar+ ions with N2 mol�ecules, also takes place; however, since the density ofAr atoms is higher than that of N2 molecules, the equi�librium is shifted toward the production of Ar+. The
main channel for the loss of Ar+ and ions is ambi�polar diffusion. The conversion rate of Ar+ at low pres�
sures is low; therefore, the density of ions is lowerby 1–1.5 orders of magnitude than the density ofAr+ ions.
Since, at low currents, nitrogen atoms are mainlylost due to heterogeneous recombination (see above),the density of N atoms increases with decreasingrecombination rate (variant 5). In this case, processes(14) and (15) contribute substantially to electron pro�duction, due to which the electric field in the plasmadecreases appreciably (see Fig. 10a). At high currents(I = 20 mA), a decrease in the electric field (variant 5)is not so pronounced, because, in this case, N atomsare lost not only via heterogeneous recombination,but, to a large extent, due to ionization of excitedatoms.
+N2
+N4+N2
+N4
+Ar2
Table 5. Calculated (variant 1) relative contributions (%)of different processes to the production of electrons and theirloss (sign “minus”) in the plasma of a glow discharge in theAr + 1% N2 mixture for P = 2 Torr
ProcessesCurrent
2 mA 20 mA
Ar + e Ar+ + e + e 29 9
Ar* + e Ar+ + e + e 19 35
Ar* + Ar* Ar+ + Ar + e 12 4
N2(A, a') + e + e + e 2 2
N2(A) + N2(a') + e 22 14
N2(a') + N2(a') + e 9 16
N(D) + N(P) + e 0 2
N(P) + N(P) + e 7 18
Ambipolar diffusion –99 –92
+ e N2(X) + N2(X) –1 –8
N2+
N4+
N4+
N2+
N2+
N4+
1013
1011
N, сm–3
0 5 10 15 20I, mА
N(D)
1012
N(P)
N(S)
N2(A)
N2(a')
Fig. 14. Calculated populations of the electronic statesof N atoms and N2 molecules in the Ar +1% N2 plasmaas functions of the discharge current for P = 2 Torr(variant 1).

PLASMA PHYSICS REPORTS Vol. 36 No. 12 2010
SPECIFIC FEATURES OF THE CURRENT–VOLTAGE CHARACTERISTICS 1061
Figure 16 shows the calculated populations of theN2(B) and N2(C) states as functions of the dischargecurrent for Р = 2 and 40 Torr. For comparison, theresults of measurements are also shown. It can be seenthat, as the pressure increases, the calculated popula�tion of the N2(B) state varies insignificantly, while thepopulation of the N2(C) state decreases by 1–1.5orders of magnitude, which agrees qualitatively withthe experimental data. The calculated populations arelarger in absolute value than the measured ones, espe�cially for the N2(C) state. Probably, this is because thecalculated values of the densities of different plasmacomponents refer to the tube axis (see Section 3.2),whereas the measured populations of the N2(B) andN2(C) states were averaged over the tube diameter (seeSection 2). If the radial profile of the population is,e.g., Besselian, then its value at the tube axis is largerby a factor of ~1.6 than the population averaged overthe diameter. In fact, the radial profiles of the popula�tions of excited particles can be even sharper. For
example, for P = 40 Torr, in the current range understudy, the N2(C) state is mainly populated in mutualcollisions of nitrogen molecules in the N2(А) state anddepopulated via radiation (see Table 6). Therefore, wehave [N2(C)] ~ [N2(А)]2; hence, in this case, the radialprofile of [N2(C)] should be sharper than that of[N2(А)]. Moreover, at high currents, the gas tempera�ture at the tube axis is appreciably higher than that atthe wall. Accordingly, the value of the parameter E/Ndecreases substantially from the tube axis toward thewall, which also results in the narrowing of the radialprofiles of charged and excited particles.
At Р = 2 Torr, mechanisms for populating theN2(C) state are more diverse (see Table 6). For I =2 mA, the contribution from the quenching of excitedargon atoms on nitrogen molecules is comparable withthe contribution from mutual collisions betweenN2(А) molecules. As the current increased, the contri�bution of stepwise electron�impact excitation from theN2(А) state increases.
1011
109
108
107
106
N, сm–3
0 5 10 15 20I, mА
Ar2(+)
N3(+)
1010
ne
Ar(+)
N4(+)
N(+)N2(+)
Fig. 15. Calculated electron and ion densities in the Ar +1% N2 plasma as functions of the discharge current for P =2 Torr (variant 1).
1011
109
108
107
106
N, сm–3
0 5 10 15 20I, mА
Ar2(+)
N3(+)1010
ne
Ar(+)
N4(+)
N(+)
N2(+)
N2(B)
N2(C)
Calculation, 2 TorrExperiment, 2 TorrCalculation, 40 TorrExperiment, 40 Torr
Fig. 16. Comparison of the calculated (variant 1) and mea�sured populations of the N2(B) and N2(C) states in theplasma of a glow discharge in the Ar + 1% N2 mixture.
Table 6. Calculated (variant 1) relative contributions (%) of different processes to the excitation and deexcitation (sign “minus”)of the N2(C) state in the plasma of a glow discharge in the Ar+1% N2 mixture (only the most important processes are listed)
P = 2 Torr P = 40 Torr
2 mA 20 mA 2 mA 20 mA
Ar* + N2(X) Ar + N2(C) 41 18 2 5
N2(A) + N2(A) N2(X) + N2(C) 46 41 94 88
N2(A) + e N2(C) + e 7 37 3 7
N2(X) + e N2(C) + e 6 4 1 0
N2(C) N2(B) + hν –100 –100 –100 –100

1062
PLASMA PHYSICS REPORTS Vol. 36 No. 12 2010
DYATKO et al.
4. CONCLUSIONS
The characteristics of diffuse glow discharges inargon and the Ar + 1%N2 mixture at pressures 2–80 Torr have been studied experimentally and numer�ically. The discharge operated in a molybdenum�glasstube with an inner diameter of 2.8 cm. The current–voltage characteristics of the discharge and the popu�lations of the N2(В) and N2(С) states have been mea�sured. It is shown that, at relatively low pressures (P <10 Torr), the current–voltage characteristic of a dis�charge in the argon–nitrogen mixture lies higher thanthat in pure argon. In contrast, at higher pressures (P >15 Torr), the current–voltage characteristic of a dis�charge in the mixture lies lower than that in pureargon. As the pressure increases, the effect of thereduction in the discharge voltage becomes more pro�nounced. For P = 80 Torr and discharge currents ofI ~ 10 mA, the discharge voltage (as well as thereduced electric field) in the mixture is lower by nearlya factor of 2 than that in argon.
It is found that, for Р ≤ 20 Torr and relatively lowcurrents (<5 mA), the current–voltage characteristicof a discharge in the mixture is nonmonotonic. Theradiation intensity in the bands of the second positivesystem of nitrogen as a function of the discharge cur�rent behaves in a similar manner. In this work, no spe�cial attention has been paid to this effect; however,there is indirect evidence that these nonmonotonicdependences are caused by processes occurring in thepositive column of the discharge.
A self�consistent zero�dimensional kinetic modelhas been developed that allows one to calculate thecharacteristics of the positive column of a discharge inpure argon and argon–nitrogen mixtures under theconditions of high vibrational excitation of nitrogen.The characteristics of the discharge plasma have beencalculated for our experimental conditions. Themodel adequately reproduces the observed effect: atlow gas pressures, the electric field in a discharge in theAr + 1%N2 mixture is higher than in pure argon,whereas at moderate pressures, it is appreciably lowerthan in argon. The calculated values of the electricfield agree satisfactorily with the measured ones.
Calculations incorporating different mechanismsof heterogeneous recombination of nitrogen atoms inthe Ar + 1%N2 mixture have been performed using thedeveloped kinetic model. The results of calculationsdo not allow us to reliably conclude which mechanismof heterogeneous recombination (the first�order or thesecond�order with respect to the density of N atoms)prevails in the discharge.
Analysis of the calculated results has made it possi�ble to reveal the ionization mechanisms responsiblefor the reduction in the discharge voltage in the Ar +1%N2 mixture at moderate pressures as compared tothat in pure argon. It is found that ionization is mainlyprovided by associative ionization of excited nitrogen
atoms (processes (14), (15)). At low currents, associa�tive ionization of electronically excited nitrogen mol�ecules (processes (12), (13)) also appreciably contrib�utes to ionization. It is shown that, at moderate pres�sures, the degree of vibrational excitation of nitrogen isfairly high and the processes involving vibrationallyexcited molecules substantially contribute to the pro�duction of N atoms (process (5)) and N2(a') molecules(process (1)).
At low pressures, electrons in a discharge in theAr + 1%N2 mixture are produced due to both ioniza�tion of argon atoms (direct and stepwise electron�impact ionization and chemionization) and processes(12) and (13). The relative contributions of these pro�cesses depend on the discharge current. In this case,the value of E/N in a discharge in the mixture is appre�ciably higher than that in pure argon. This is related, inparticular, to the fact that, in the mixture, excitedargon atoms are efficiently quenched by nitrogen mol�ecules.
The calculated populations of the N2(B) and N2(C)states have been compared with the experimental data.According to calculations, as the pressure increasesfrom 2 to 40 Torr, the population of the N2(B) statevaries more slightly than the population of the N2(C)state, which agrees with the experimental data. Thecalculated populations are larger in absolute valuethan the measured ones. Probably, this is because thecalculated populations refer to the tube axis, whereasthe measured populations are averaged over the tubediameter.
ACKNOWLEDGMENTS
We are grateful to S.Ya. Umanskii for valuable con�sultations on the processes of quenching of excitedatoms and molecules and N.A. Popov for helpful dis�cussions of the dissociation and ionization mecha�nisms in discharges in nitrogen. This work was sup�ported by the Russian Foundation for Basic Research,project no. 09�02�01255.
REFERENCES
1. T. Martens, A. Bogaerts, W. J. M. Brok, and J. V. Dijk,Appl. Phys. Lett. 92, 041 504 (2008).
2. Y. Wang and D. Wang, Phys. Plasmas 12, 023 503(2005).
3. N. Sasaki, M. Shoji, and Y. Uchida, IEEJ Trans. FM127, 714 (2007).
4. Yu. Z. Ionikh and N. V. Chernysheva, in Encyclopediaof Low�Temperature Plasma, Ed. by V. E. Fortov (Fiz�matlit, Moscow, 2008), Ser. B, Vol. III�2, p. 452 [inRussian].
5. Yu. P. Raizer, Gas Discharge Physics (Nauka, Moscow,1987; Springer�Verlag, Berlin, 1991).
6. T. Kimura, K. Akatsuka, and K. Ohe, J. Phys. D 27,1664 (1994).

PLASMA PHYSICS REPORTS Vol. 36 No. 12 2010
SPECIFIC FEATURES OF THE CURRENT–VOLTAGE CHARACTERISTICS 1063
7. N. A. Dyatko, Y. Z. Ionikh, A. V. Meshchanov, et al., inProceedings of the XIX European Sectional Conferenceon Atomic and Molecular Physics of Ionized Gases, Gran�ada, 2008, Poster 2.36.
8. Yu. Z. Ionikh, A. V. Meshchanov, F. B. Petrov, et al.,Fiz. Plazmy 34, 938 (2008) [Plasma Phys. Rep. 34, 867(2008)].
9. C. Kenty, Phys. Rev. 126, 1235 (1962).10. A. P. Yalin, Y. Z. Ionikh, and R. B. Miles, Appl. Opt. 41,
3753 (2002).11. S. O. Macheret, Y. Z. Ionikh, N. V. Chernysheva, et al.,
Phys. Fluids 13, 2693 (2001).12. V. Linss, H. Kupfer, S. Peter, and F. Richter, J. Phys. D
37, 1935 (2004).13. N. Sasaki, Y. Uchida, and M. Shoji, in Proceedings of
the XVI European Sectional Conference on Atomic andMolecular Physics of Ionized Gases, Grenoble, 2002,Vol. 2, p. 217.
14. J. F. Loiseau, P. Pignolet, and B. Held, J. Phys. D 25,745 (1992).
15. N. Britun, M. Gaillard, A. Ricard, et al., J. Phys. D 40,1022 (2007).
16. P. A. Sa and J. Loureiro, J. Phys. D 30, 2320 (1997).17. J. Henriques, E. Tatarova, F. M. Dias, and C. M. Fer�
reira, J. Appl. Phys. 103, 103 304 (2008).18. G. P. Jackson and F. L. King, Spectrochim. Acta B 58,
185 (2003).19. M. Moravej, X. Yang, M. Barankin, et al., Plasma
Sources Sci. Technol. 15, 204 (2006).20. K. H. Becker, N. M. Masoud, K. E. Martus, and
K. H. Schoenbach, Eur. Phys. J. D 35, 279 (2005).21. P. F. Ambrico, R. Bektursunova, G. Dilecce, and
S. De Benedictis, Plasma Sources Sci. Technol. 14, 676(2005).
22. N. A. Dyatko, Y. Z. Ionikh, A. V. Meshchanov, et al., inProceedings of the VI International Conference onPlasma Physics and Plasma Technology, Minsk, 2009,Vol. 1, p. 19.
23. N. A. Dyatko, Y. Z. Ionikh, I. V. Kochetov, et al., J.Phys. D 41, 055 204 (2008).
24. Handbook of Constants for Elementary Atomic, Ionic,Electronic, and Photonic Processes, Ed. by A. G. Zhig�linskiі (PGU, St. Petersburg, 1994) [in Russian].
25. N. A. Dyatko, I. V. Kochetov, and A. P. Napartovich,Fiz. Plazmy 18, 888 (1992) [Sov. J. Plasma Phys. 18,462 (1992)].
26. N. L. Aleksandrov, A. V. Dem’yanov, I. V. Kochetov,and A. P. Napartovich, Fiz. Plazmy 23, 658 (1997)[Plasma Phys. Rep. 23, 610 (1997)].
27. G. B. Lopantseva, A. F. Pal’, A. F. Perevoznov, et al.,Fiz. Plazmy 5, 1370 (1979) [Sov. J. Plasma Phys. 5, 767(1979)].
28. L. M. Biberman, V. S. Vorob’ev, and I. T. Yakubov,Kinetics of Nonequilibrium Low�Temperature Plasmas(Nauka, Moscow, 1982; Consultants Bureau, NewYork, 1987).
29. J. L. Pack, R. E. Voshall, A. V. Phelps, and L. E. Kline,J. Appl. Phys. 71, 5363 (1992).
30. A. Yanguas�Gil, J. Cotrino, and L. L. Alves, J. Phys. D38, 1588 (2005).
31. D. Rapp and P. Englander�Golden, J. Chem. Phys. 43,1464 (1965).
32. V. M. Donnelly, J. Phys. D 37, R217 (2004).33. N. A. Dyatko, Yu. Z. Ionikh, A. V. Meshchanov, and
A. P. Napartovich, Fiz. Plazmy 31, 939 (2005) [PlasmaPhys. Rep. 31, 871 (2005)].
34. K. Tachibana, Phys. Rev. A 34, 1007 (1986).35. H. A. Hyman, Phys. Rev. A 20, 855 (1979).36. N. B. Kolokolov, in Plasma Chemistry, Ed. by
B. M. Smirnov (Énergoatomizdat, Moscow, 1985),Vol. 12, p. 56 [in Russian].
37. N. V. Kolokolov and A. B. Blagoev, Usp. Fiz. Nauk 163(3), 55 (1993) [Phys. Usp. 36, 152 (1993)].
38. W. F. Lui and D. C. Conway, J. Chem. Phys. 62, 3070(1975).
39. V. S. Marchenko, Zh. Éksp. Teor. Fiz. 85, 500 (1983)[Sov. Phys. JETP 58, 292 (1983)].
40. S. Neeser, T. Kunz, and H. Langhoff, J. Phys. D 30,1489 (1997).
41. A. V. Phelps and L. C. Pitchford, Report No. 26 (Uni�versity of Colorado, Boulder, CO, 1985).
42. V. Guerra and J. Loureiro, Plasma Sources Sci. Tech�nol. 6, 361 (1997).
43. N. E. Kuz’menko, L. A. Kuznetsova, and Yu. Ya. Kuzy�akov, Frank–Condon Factors of Diatomic Molecules(Izd�vo MGU, Moscow, 1984), p. 249 [in Russian].
44. Y. Itikawa, J. Phys. Chem. Ref. Data 35, 31 (2006).45. P. C. Cosby, J. Chem. Phys. 98, 9544 (1993).46. J. Bacri and A. Medani, Physica C 112C, 101 (1982).47. R. J. W. Henry, P. G. Burke, and A. L. Sinfailam, Phys.
Rev. 178, 218 (1969).48. K. A. Berrington, P. G. Burke, and W. D. Robb, J. Phys.
B 8, 2500 (1975).49. Y.�K. Kimand and J.�P. Desclaux, Phys. Rev. A 66,
012708 (2002).50. M. Allan, J. Phys. B 18, 4511 (1985).51. L. A. Morgan, J. Phys. B 19, L439 (1986).52. N. A. Dyatko, I. V. Kochetov, and A. P. Napartovich,
Fiz. Plazmy 28, 1046 (2002) [Plasma Phys. Rep. 28,965 (2002)].
53. A. A. Mihajlov, V. D. Stojanovi , and Z. Lj. Petrovi , J.Phys. D 32, 2620 (1999).
54. D. C. CartWright and T. H. Dunning, Jr., J. Phys. B 7,1776 (1974).
55. M. A. Biondi, in Principles of Laser Plasmas, Ed. byG. Bekefi (Wiley, New York, 1976; Énergoizdat, Mos�cow, 1982).
56. Yu. A. Lebedev and I. L. Epstein, Fiz. Plazmy 33, 68(2007) [Plasma Phys. Rep. 33, 63 (2007)].
57. I. A. Kossyi, A. Yu. Kostinsky, A. A. Matveyev, andV. P. Silakov, Plasma Sources Sci. Technol. 1, 207(1992).
58. N. A. Dyatko, I. V. Kochetov, A. P. Napartovich, andM. D. Taran, Preprint No. 3842/12 (Kurchatov. Inst.,Moscow, 1983).
59. E. A. Bogdanov, A. A. Kudryavtsev, L. D. Tsendin,et al., Zh. Tekh. Fiz. 74 (7), 44 (2004) [Tech. Phys. 49,849 (2004)].
60. L. G. Piper, J. Chem. Phys. 91, 864 (1989).
c c
1064
PLASMA PHYSICS REPORTS Vol. 36 No. 12 2010
DYATKO et al.
61. A. Lofthus and P. H. Krupenie, J. Phys. Chem. Ref.Data 6, 113 (1977).
62. W. J. Marinelli, W. J. Kessler, B. D. Green, andW. A. M. Blumberg, J. Chem. Phys. 90, 2167 (1989).
63. R. S. Freund, J. Chem. Phys. 56, 4344 (1972).
64. M. E. Fraser, W. T. Rawlins, and S. M. Miller, J. Chem.Phys. 88, 538 (1988).
65. Tables of Physical Quantities, Ed. by I. K. Kikoin.(Atomizdat, Moscow, 1976) [in Russian].
66. L. G. Piper, J. Chem. Phys. 97, 270 (1992).
67. L. G. Piper, J. Chem. Phys. 87, 1625 (1987).
68. L. G. Piper, J. Chem. Phys. 88, 231 (1988).
69. L. G. Piper, J. Chem. Phys. 88, 6911 (1988).
70. A. V. Berdyshev, A. S. Golovin, A. V. Gurashvili, et al.,Fiz. Plazmy 15, 335 (1989) [Sov. J. Plasma Phys. 15,195 (1989)].
71. Yu. S. Akishev, A. V. Dem’yanov, I. V. Kochetov, et al.,Teplofiz. Vys. Temp. 20, 818 (1982).
72. Handbook of Physicochemical Processes in Gas Dynam�ics Ed. by G. G. Chernyі and S. A. Losev (Izd. Mosk.Gos. Univ., Moscow, 1995), Vol. 1 [in Russian].
73. M. Capitelli, C. M. Ferreira, B. F. Gordiets, andA. I. Osipov, Plasma Kinetics in Atmospheric Gases(Springer�Verlag, Berlin, 2000).
74. Yu. Z. Ionikh, Opt. Spektrosk. 51, 76 (1981) [Opt.Spectrosc. 51, 39 (1981)].
75. Yu. M. Gershenzon, V. B. Rozenshteіn, and S. Ya. Uman�skiі, in Plasma Chemistry, Ed. by B. M. Smirnov (Atom�izdat, Moscow, 1977), Vol. 4, p. 61 [in Russian].
76. A. Kurnosov, A. Napartovich, S. Shnyrev, and M. Cac�ciatore, J. Phys. Chem. A 111, 7057 (2007).
77. M. Cacciatore, A. Kurnosov, and A. Napartovich,J. Chem. Phys. 123, 174 315 (2005).
78. V. Guerra, E. Galiaskarov, and J. Loureiro, Chem.Phys. Lett. 371, 576 (2003).
79. D. I. Slovetskii, Mechanisms of Chemical Reactions inNonequilibrium Plasmas (Nauka, Moscow, 1980) [inRussian].
80. O. É. Krivonosova, S. A. Losev, V. P. Nalivaіko, et al., inPlasma Chemistry, Ed. by B. M. Smirnov (Énergoat�omizdat, Moscow, 1987), Vol. 14, p. 3 [in Russian].
81. N. A. Popov, Fiz. Plazmy 35, 482 (2009) [Plasma Phys.Rep. 35, 436 (2009)].
82. I. N. Brovikova and É. G. Galiaskarov, Teplofiz. Vys.Temp. 39, 873 (2001) [High Temp. 39, 809 (2001)].
83. J. T. Herron, J. Phys. Chem. Ref. Data 28, 1453 (1999).84. C. Lin and F. Kaufman, J. Chem. Phys. 55, 3760
(1971).85. F. E. Niles, J. Chem. Phys. 52, 408 (1970).86. L. S. Polak, P. A. Sergeev, and D. I. Slovetskii, in Plas�
machemical Reactions and Processes, Ed. by L. S. Polak(Nauka, Moscow, 1977), p. 81 [in Russian].
87. A. Kh. Mnatskanyan and G. V. Naidis, in PlasmaChemistry, Ed. by B. M. Smirnov (Énergoatomizdat,Moscow, 1987), Vol. 14, p. 227 [in Russian].
88. M. G. Berdichevskii and V. V. Marusin, Izv. Sib. Otd.Akad. Nauk SSSR 8 (2), 72 (1979).
89. A. A. Viggiano and R. A. Morris, J. Chem. Phys. 59,3526 (1993).
90. S. Kato, J. A. de Gouw, C.�D. Lin, et al., Chem. Phys.Lett. 256, 305 (1996).
91. H. Böhringer and F. Arnold, J. Chem. Phys. 77, 5534(1982).
92. L. I. Virin, G. V. Dzhagatsranyan, G. V. Karachevtsev,V. K. Potapov, and V. L. Tal’roze, Ion–Molecule Reac�tions in Gases (Nauka, Moscow, 1979) [in Russian].
93. V. A. Rozhanskii and L. D. Tsendin, Collisional Pro�cesses in Partially Ionized Plasma (Énergoatomizdat,Moscow, 1988) [in Russian].
94. Handbook of Physical Quantities, Ed. by I. S. Grigorievand E. Z. Meilikhov (Énergoatomizdat, Moscow, 1991;CRC, Boca Raton, 1997).
95. E. W. McDaniel and E. A. Mason, The Mobility andDiffusion of Ions in Gases (Wiley, New York, 1973; Mir,Moscow, 1976).
96. L. M. Chanin and M. A. Biondi, Phys. Rev. 106, 473(1957).
Translated by É.G. Baldina


