Embed Size (px)
Citation preview

P-8244-1/1
Simulation of Electron Kinetics in Gas Discharges
by
Vladimir Kolobov and Robert Arslanbekov
2005 Workshop on Nonlocal, Collisionless Electron Transport in Plasmas
Princeton, NJAugust 4, 2005

P-8244-1/2
Outline
• An overview of basic models for simuIations of electron
kinetics in gas discharges
• Examples of simulations using CFD-ACE+
• Inductively Coupled Plasmas
• Capacitively Coupled Plasmas
• Direct current glow discharges with different electrodes
• Physical phenomena in Positive Column of rare gases
• Ionization Waves (Striations) in rare gases
• Simulations using UFS collisionless effects with Vlasov & PIC
codes

P-8244-1/3
From Boltzmann to FPE for electrons
Hierarchy of transport models for electronsTwo-terms Spherical Harmonics Expansion
),,().,().,( 10 tvv
tvft rfvrvrf ⋅+=
vf
mefv
t
fSmev
vvv
tf
Bm ∂∂
−∇−=×++∂∂
=⎟⎠⎞
⎜⎝⎛ ⋅
∂∂
++∂∂
0011
1
0012
210 ][
31)(div
3Eωfff
fEf
ν
mnenvn
tn
BmEωvvv
−−∇=×++∂∂ )
31()( 2ν
momentum equation with a scalar pressure term
Limitation: in this approximation, the mean electron velocity is a local function of the electric field.

P-8244-1/4
FPE for Electrons in Collisional Plasmas
SufDfV
ufDCfYf
uf
u
uff
tf
ETee vvv
v
00
000
0
00
0
=⎥⎦
⎤⎢⎣
⎡∂∂
++⎟⎠⎞
⎜⎝⎛
∂∂
++⎟⎠⎞
⎜⎝⎛ ∇+
∂∂
∇⋅∇∂∂
−⎥⎦
⎤⎢⎣
⎡⎟⎠⎞
⎜⎝⎛
∂∂
∇+∇⋅∇−∂∂
φφχ
φχ
(a)
(b) (c) (d) (e) (f)
a) Transport in Configuration Spaceb) Heating/Cooling by the Electrostatic Field c) Coulomb Collisionsd) Quasi-elastic Collisions e) Heating by alternating electromagnetic fieldsf) Inelastic Collisions

P-8244-1/5
Total Energy as Independent Variable
( )tu ,rr
φε −=( ) ( )
vSufvDfvV
ufDCfY
fvft
vft
ETee =⎥⎦
⎤⎢⎣
⎡∂∂
++⎟⎠⎞
⎜⎝⎛
∂∂
+∂∂
−∇⋅∇−∂∂
∂∂
−∂∂
ε
χε
φ
• using total energy as independent variable eliminates complicated cross-terms in FPE and facilitates numerical solution
• the price for this simplification is more complicated boundary conditions for the trapped electrons which have to be defined onthe surface of zero kinetic energy
• the energy range may substantially increase to reflect the entire range of variation in computational domain
( )t,rr
φε −=
( )t,rr
φ

P-8244-1/6
Direct Current Glow Discharges

P-8244-1/7
SPICE circuit
R
plasmaV
1 2
0 0
C
SPICE .cir file
dielectric
met
al, g
roun
ded
met
al, p
ower
ed
axis x
r
2D discharge geometry: R = 1.5 cm and L = 1 cm
Ar gas at pressures of 3 and 6 Torr
Discharge current I = 1µA-1A, voltage U = 200-400 V

P-8244-1/8
Current Voltage CharacteristicsDirect Current (DC) glow discharges have been studied for over acentury. These discharges exist in different modes (Townsend, subnormal, normal, abnormal, etc). The transition between these modes is accompanied by redistribution of electric fields and spatial parameters of the plasma.
R.Arslanbekov & V.Kolobov, J. Phys. D 36, (2003)

P-8244-1/9
Subnormal Oscillations

P-8244-1/10
Simulations of positive column in rare gases
Electron density, temperature & potential profiles: Ar, 1 mA
⊗ Ez = 6.9, 6.2, 12.1, 31.3, 64.9, and 131.7 V/cm for p = 1, 5, 10, 25, 50 and 100 Torr.
♦ Electron density profiles resemble a Bessel distribution♦ Electron temperature profiles become more flat as pressure increases. ♦ potential well depth increases with pressure

P-8244-1/11
Simulations of positive column in rare gases
Density of excited species: Ar, 1 mA
♦ non-monotonic distribution is more pronounced for Ar* than for Arr*
♦ at pressures < 5 Torr and > 50 Torr, the density maximum is on axis potential well depth increases with pressure
P-8244-1/12
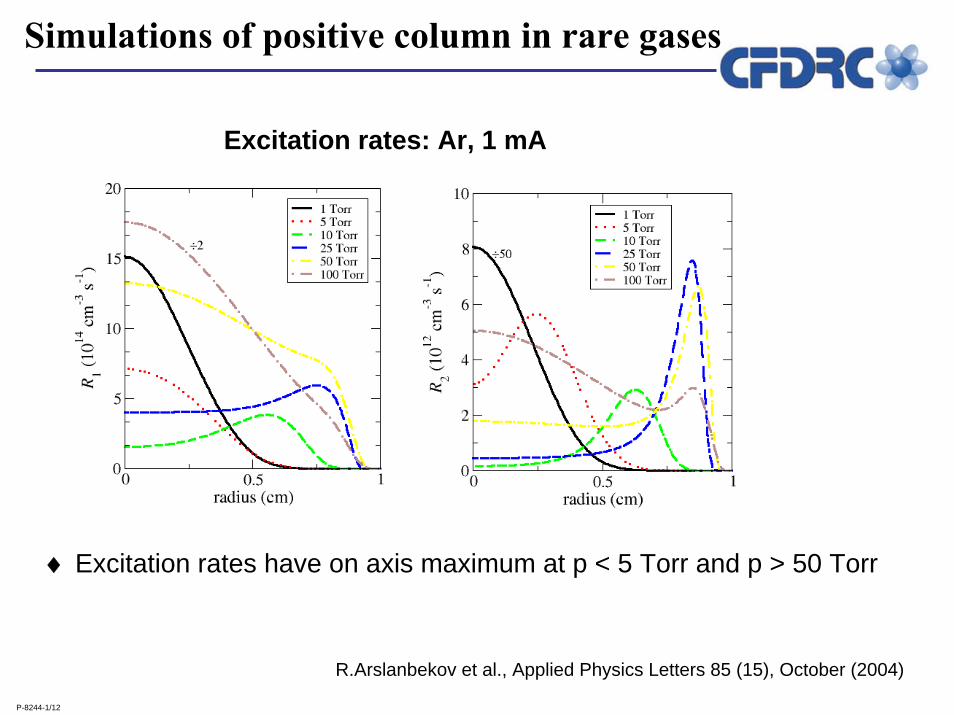
Simulations of positive column in rare gases
Excitation rates: Ar, 1 mA
♦ Excitation rates have on axis maximum at p < 5 Torr and p > 50 Torr
R.Arslanbekov et al., Applied Physics Letters 85 (15), October (2004)

P-8244-1/13
Moving Striations in Rare Gases

P-8244-1/14
Striations = Ionization Waves
• Striations have been studied for more than a century. They were observed at pressures 10-3-103 Torr and currents 10-4-10 A in almost all gases• Striations as a test bead for advanced plasma models: accuracy of kinetic models of gas discharges can be checked versus experimental observations accumulated over a century of studies• Striations as a research tool: detailed information about the high energy part of the EEDF can be obtained, cross section set can be verified• Striations as nonlinear systems: ideal object for studies of nonlinear phenomena and self-organization.
Standing striations in Hydrogen
p=0.66 Torr, i=17 mA, R=2.5 cm
p=0.3 Torr, i=80 mA, R=2.75 cm
cathode is on the left

P-8244-1/15
Different States of PC in Neon
•Curve 1: Low Current Boundary
•Curve 2: High Current (Pupp’s) Boundary
•Curve 3: Low Pressure Boundary
•Area II: Current Constriction
•Area IV: Optical Constriction
•Area III: regular or chaotic striations (depending on tube length)
•Area V: Kinetic Striations (P, R, S types)
•Area VI: Hydrodynamic striations: ωk=const
Symbols denote experimental data for different R

P-8244-1/16
2D Simulations of Striations in Argon
• 2 Torr, 100 mA, cylindrical tube of length L = 20 cm and radius R = 1 cm, cathode on the left, anode on the right. The tube wall is dielectric. Simulation takes about 30 hours on a 1 GHz computer.
• Negative-glow region near the cathode with a large plasma density,about 3-4 striations excited along the tube.
• Striations are self-excited; they initially appear near the cathode and propagate towards the anode, group velocity is directed from cathode to anode. The phase velocity is directed from the anode to the cathode (“backward waves”)

P-8244-1/17
Moving Striations in Dynamics

P-8244-1/18
Distributions of Various Parameters

P-8244-1/19
Inductively Coupled Plasmas

P-8244-1/20
An Overview of Hybrid Discharge Model
Deterministic Boltzmann solver for electrons based on two-term SHE, coupled to continuum ICP model
Implicit Poisson solver and non-uniform mesh resolving sheath regions
Drift-diffusion or momentum equation for ions
Continuum model for neutral species, gas phase and surface reactions
Gas heating (in the entire reactor) with temperature jump conditions at plasma boundaries
Continuum gas flow model with slip wall boundary conditions, maintaining constant gas pressure in the reactor
Maxwell solver for vector magnetic potential in time and frequency domains

P-8244-1/21
Chemistry & Cross Section Data
Reaction mechanism and electron collision cross section data are from Vasenkov & Kushner, Phys. Rev. E 66, 66411 (2002)
Ar* denotes Ar(4s) with excitation threshold 11.6 eVAr** denotes Ar(4p)

P-8244-1/22
The simulated Osram Sylvania ICP
• Faraday shield eliminates capacitive coupling in the plasma
• Spatially resolved experimental EEPF measurements are performed on the axis of the reactor and at r=4 cm
450 KHz, 10 mTorrInduced Electric Field
Electrostatic Potential

P-8244-1/23
Effect of Ion Inertia
ICP in Argon, 0.3 mTorr, 100W
Solving momentum equations for ions allows simulations of plasma sources at very low gas pressures
Ion inertia becomes crucial at gas pressures below 10 mTorr
1 mTorr, 6.8 MHz
using non-uniform mesh allows us to resolve the sheathstructure near the walls

P-8244-1/24
1 mT, Without Gas Heating
Electron (left) and metastable atom densities
Electron temperature (left) and electrostatic potential (right)
EEPF depends solely on total electron energy,no explicit dependence on spatial position

P-8244-1/25
10mT, 6.8 MHzElectron temperature (left) and electrostatic potential (right)
107
108
109
1010
1011
0 5 10 15 20 25
2
20
40
75
101
eepf
(eV -3
/2 cm
-3 )
electron energy (eV)
6.78 MHz, 10 mT, 100 W, r = 4 cm
z (mm)
without gas heating

P-8244-1/26
100mT, 6.8 MHz
108
109
1010
1011
1012
0 5 10 15
2
20
40
75
101
eepf
(eV
-3/2
cm -3
)
electron energy (eV)
6.78 MHz, 100 mT, 100 W, r = 4 cm
z (mm)
no gas heating

P-8244-1/27
Time-resolved ICP Simulations
Motivation:
• Time (RF cycle) resolved data are important for insight into ICP reactor operation. For example, recent time resolved light emission data show interesting behavior in (2D) space and time
Simulation reactor and operation conditions:
• Osram-Sylvania ICP reactor: Ar gas, 10 mTorr
• RF frequency from 450 kHz to 13.6 MHz. Simulations are presented for frequency of 450 kHz.
• Coil currents up to 200 A and RF powers 50 – 400 W

P-8244-1/28
Pulsed ICP Simulations
• Osram-Sylvania ICP reactor: Ar gas, 10 mTorr, 6.8 MHz• Pulsed (square) coil current: 50-400 A
• Pulse length: 30 and 50 µs
• Repetition rate : 100 µs
• fluid model for heavy particles (ions and neutrals)
• Boltzmann solver (2D space and 1D energy) for electrons. Total energy formulation is used.
• 5-step mechanism with Ar ions and metastables.
• simulations take 1-2 days of computational time on 1 GHz processor

P-8244-1/29
50 µs pulse, low coil current: time evolution
Electron temperature, reactor centerElectron density, reactor center
• small “ripples” on Te are numerical due to finite energy resolution in the Boltzmann solver
• I=100A, low current operation: plasma does not reach steady state during active phase

P-8244-1/30
50 µs pulse, low coil current: power on
RF Power deposition Electron density Electron temperature
EEDF at 3 locations along axis at r=4 cm
Electric potential• EEDF body is Maxwellian• EEDF is enriched by fast
electrons near coils (green line)• EEDF is depleted for energies
larger first excitation potential

P-8244-1/31
50 µs pulse, low coil current: power off
Electron density Electron temperature Electric potential
EEDF @ different locations
• EEDF body is Maxwellian in afterglow
• EEDF is depleted at energies higher wall potential (~4.5 V)
• There is a well pronounced peak @ ~12eV due to fast electron production in collisions of slow electrons with metastables

P-8244-1/32
Summary for ICP Simulations
Hybrid kinetic/fluid simulation of ICP in Argon have performed in a wide range of discharge conditions to investigate the importance of different model assumptions on plasma properties
The key features of the model include:
deterministic Boltzmann solver for electronsnon-uniform grid to resolve potential drops in the sheathsion inertia effects gas heating with velocity slip and temperature jumps at the wallsgas flow to maintain constant pressure in the reactor
Known limitations of the electron kinetic model:
no magnetic field effect on electron kineticsno stochastic heating and anomalous skin effect

P-8244-1/33
Kinetic simulations of capacitively coupled plasmas with external circuit

P-8244-1/34
Ar, 400 mTorr, 400 V
higher pressures ⇒ the plasma density profile is broader
The average electron temperature decreases from the plasma center towards the RF sheathes, and then increases in the sheathes
The temporal evolution of the EDF is small during one RF cycle

P-8244-1/35
Ar, 100 mTorr, 300 V
nonlocal Boltzmann equation for electrons
The low-energy peak of the EDF is responsible for the <u> profile: low <u> in center is indication of nonlocal regime
The bulk EDF shows almost no time evolution, the high energy tail oscillates significantly

P-8244-1/36
Results for CH4 CCP Discharges
Discharge gap 3 cm, gas pressure 140 mTorr, RF voltages 50-400 V
Compare results with Ivanov et al paper
54-step reaction mechanism with 33 species
[1] V. Ivanov, O. Proshina, T. Rakhimova, A.Rakhimov, D. Herrebout and A. Bogaerts, “Comparison of a one-dimensional particle-in-cell–Monte Carlo model and a one-dimensional fluid model for a CH4/H2 capacitively coupled radio frequency discharge,” J. Appl. Phys. 91, 6296 (2002).

P-8244-1/37
CH4 , 140 mTorr, 400 V
The calculated EEDF has a low-energy peak formed by electrons trapped in the ambipolar potential well.
The low-energy peak of the EEDF is more pronounced in Ivanov et al, which is most likely to be due to the absence of electron-electron collisions in the model in Ivanov et al.

P-8244-1/38
Unified Flow Solver
CouplingAlgorithm
BoltzmannEquation
DomainDecomposition
Continuum KineticSchemes
Direct SimulationMonte-Carlo
(DSMC)
Direct NumericalSolution
Direct Numerical Solutionof the Boltzmann equation is preferable to DSMC for
coupling kinetic and continuum models
Unified Flow Solver with AMAR
• Cartesian mesh with embedded solid boundaries
• Tree based adaptation of the mesh to the solution and geometry
• Automatic switching based on a continuum breakdown criteria

P-8244-1/39
Unified Flow Solver
low pressure high pressuredensity
Kinetic region

P-8244-1/40
UFS extensions for plasma simulations
• We have added to UFS a Poisson solver that has the automatic mesh refinement etc. The figure below shows the solutions of the Poisson equation with a fixed BC at the left boundary = 100 V, and the rest BCs are zero BCs
• We have implemented a simple plasma model, which includes Poisson equation + 3-momentum equations for electrons + 1st momentum for ions:
- ions are assumed to be frozen. - energy equation for electrons is not solved: constant Te = 1 eV is assumed and
ionization is calculated as a function of local E/N.

P-8244-1/41
Simulations of collisionless effects
• Vlasov equation is solved numerically
• Simple model of collisionless sheath is considered: electric field is
• Particles are injected from one (left) side with a given distribution
function:
Electrons: half-Gaussian, n=1 and T=1,
Ions: Maxwellian (Gaussian) shifted by Bohm velocity
( ) ( )( , )
0 ( )A x s x s t
E x tx s t
− <⎧= ⎨ <⎩
( , ) 0xx
f f eE x t fvt x m v
∂ ∂ ∂+ − =
∂ ∂ ∂
0 0( ) cos( )s t s s tω= −

P-8244-1/42
Electron distribution in the sheath: 0.1ν =
density vs time
x = 15, inside the sheath
Distribution function f(vx,vy,t)
Grid adaptation in physical space based on density gradient

P-8244-1/43
Frequency dependence of electron distribution function
1ν =
0.1ν =
0.01ν =
0x = 25x =
( )( , )
0m
a x s x ssE x t
x s
⎧ − <⎪= ⎨⎪ <⎩
23; 3ms a= =

P-8244-1/44
Electron distribution function (continued)
0.1ν =
0.01ν =
25x =
0.001ν =
( )( , )
0m
a x s x ssE x t
x s
⎧ − <⎪= ⎨⎪ <⎩
23; 1ms a= =

P-8244-1/45
Ion distributions in the sheath0x =1ν =
0.1ν =
0.01ν =

P-8244-1/46
Summary and outlook
• CFD-ACE+PLASMA has been used for simulations of different plasma devices and processes. The Plasma Technologies Branch at CFDRC continues to develop advanced plasma models and customize CFD-ACE for user’s needs
• There are several limitations of the physical model and numerical algorithms implemented in CFD-ACE
• Rarefied Gas Dynamics effects can not be calculated• Solution Adaptive Grid capabilities • Collisionless phenomena and fast plasma processes related to electron inertia effects can not be simulated• Rarefied Gas Dynamics
• We have started R&D work to expand our Unified Flow Solver for Plasma Simulations

P-8244-1/47
Acknowledgements
• Drs N.Zhou, A.Vasenkov, D.Sengupta at CFDRC
• Drs A.Kudriavtsev, E.Bogdanov & Mr E.Toinov at St Petersburg University, and Prof Lev Tsendin at St Petersburg Technical Uni.
• Prof Mark Kushner at the University of Illinois• Prof Mounir Laroussi at the Old Dominion University
• National Science Foundation• Air Force Office of Scientific Research• The Next Step to Market Program of the US Dept. of Commerce• The SABIT Program of the US Dept. of Commerce• A number of industrial companies supported plasma development at CFDRC

P-8244-1/48
0
1
2
3
4
5
0 20 40 60 80 100
volts
z (mm)
Te
Vs
6.78 MHz, 10 mT, 100 W, r = 4 cm
1010
1011
1012
0 20 40 60 80 100
plas
ma
dens
ity (c
m-3
)
z (mm)
6.78 MHz, 10 mT, 100 W, r = 4 cm
10mT, 6.8 MHz
P-8244-1/49
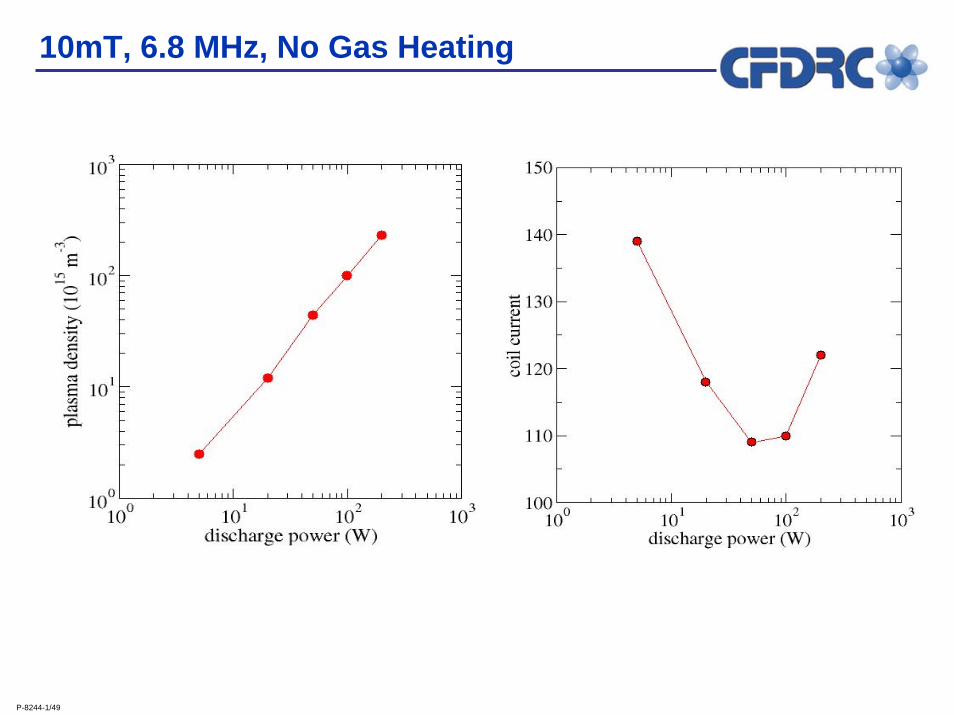
10mT, 6.8 MHz, No Gas Heating

P-8244-1/50
0
1
2
3
4
5
0 20 40 60 80 100
volts
z (mm)
Te
Vs
6.78 MHz, 100 mT, 100 W, r = 4 cm
1011
1012
1013
0 20 40 60 80 100
plas
ma
dens
ity (c
m-3
)
z (mm)
6.78 MHz, 100 mT, 100 W, r = 4 cm
100mT, 6.8 MHz
P-8244-1/51
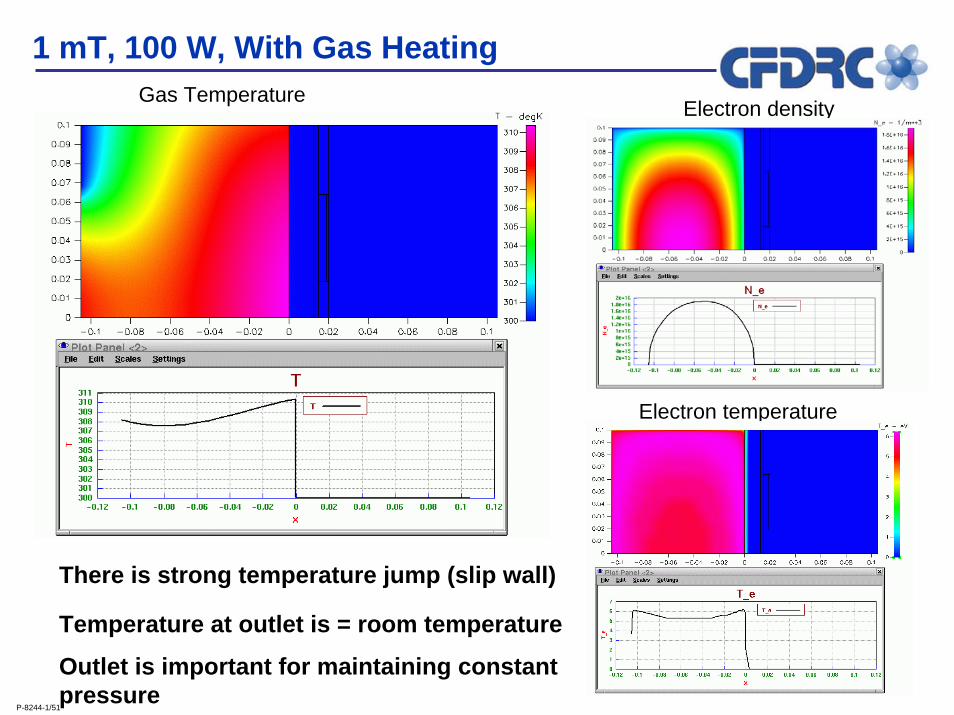
1 mT, 100 W, With Gas Heating
Electron temperature
Electron densityGas Temperature
There is strong temperature jump (slip wall)
Temperature at outlet is = room temperature
Outlet is important for maintaining constantpressure

P-8244-1/52
10 mT, 100 W, With Gas Heating
Electron densityGas Temperature
Electron temperature
Temperature jump is smaller than @ 1mTorr
Temperature at outlet is room temperature

P-8244-1/53
100 mT, 200 W, With Gas Heating
Electron temperature
Temperature jump is small at this pressure
Electron densityGas Temperature

P-8244-1/54
Summary of Results with Gas Heating
Gas heating is maximum at higher pressures
Electron density agrees rather well with experiments
Plasma potential is larger at lower pressures

P-8244-1/55
Time-resolved ICP Simulations: Model
• fluid model for heavy particles (ions and neutrals)
• Boltzmann solver (2D space and 1D energy) for electrons. Total energy formulation is used. Instantaneous RF heating (energy diffusion coefficient) is used in order to resolve electron kinetics during RF cycle
• Electromagnetic Module both in frequency and time domains
• 5-step mechanism with Ar ions and metastables.
• simulations take 1-2 days of computational time on 1 GHz processor

P-8244-1/56
Boltzmann Equation with Time-Dependent RF Heating
( ) ( ) ee T Ef ff f f Y Cf D V f D vS
t t u uφυ υ χ υ υ
ε ε∂ ∂ ∂ ∂ ⎡ ∂ ∂ ⎤⎛ ⎞− − ∇⋅ ∇ − + + + =⎜ ⎟⎢ ⎥∂ ∂ ∂ ∂ ∂ ∂⎝ ⎠⎣ ⎦
a) Transientb) Convection due to time-varying
electrostatic potentialc) Transport in configuration spaced) Coulomb collisionse) Quasi-elastic collisionsf) Heating by alternating electromagnetic
fieldsg) Inelastic Collisions
(a) (b) (c) (d) (e) (f)
( )t,ru φ−=ε
(g)
Energy Diffusion CoefficientDue to instantaneous RF field:
( )
2 2
2
( )1 1 cos(2 ) sin(2 )61
rfE
E rD t tυ ωω ω
ν νω ν⎡ ⎤= + +⎢ ⎥⎣ ⎦+
( )rfE r - amplitude of RF field (real+imaginary)Total Energy Formulation

P-8244-1/57
Time resolved ICP: time evolutions
Electron temperature, reactor centerElectron density, reactor center
Electron density, near coil Electron temperature, near coil
• modulation of ne and Te takes place at second harmonic of main frequency 450 kHz

P-8244-1/58
Time resolved ICP: EEDFs
reactor center near coil
• modulation of EEDF mainly in the tail portion• modulation of EEDF stronger near coils

P-8244-1/59
Time resolved ICP: 2D instantaneous profiles in RF cycle
Electron temperatureElectron density
RF powerElectrostatic potential
• modulation of electrostatic potential follows that of Te

P-8244-1/60
Modeling of DC Micro Discharges
Used in various applications such as MEMS technology
p=1-10 Torr, U =300-500V, d = 1-10mm
gas air, pure nitrogen
Experimental results ⇒
modeling shows similar picture
4 Torr, 450 V, N21.2 Torr, 450 V, N2
electron density
6 Torr, 450 V, N2

P-8244-1/61
Micro Discharge: Calculation of the EDF
average electron energy
predicted EDF shows typical behavior in DC glow discharge tail of EDF formed by progeny electrons ejected from cathode
C.G.Wilson et al., J. Appl. Phys. 94, 2845 (2003)
body of EDF formed by elastically scattered electrons

P-8244-1/62
DC Discharge with Ring Anode
Experiment by K.Schoenbach et al.PSST 13, 177 (2004)
Simulations by E.Toinov using CFD-ACE
U=279V, I=4mA U= 381V, I=19mA
Xenon, P=100Torr, Gap=250micron, R=375micronInitial voltage =400V, gas heating, Gamma=0.002
Experimentally observed cathode spots arranged in concentric circles have been obtained in two-dimensional simulations of high-pressure DC micro discharges with ring anode in Xenon

P-8244-1/63
Plasma Display Simulations
This technology has the following features:1. Ultra-lightweight, flexible screen
size & shape 2. High luminous efficiency 3. Low-cost production
Fujitsu Unveils New Type of Plasma Technology for 100-Inch-Plus Flat-Screen Displays
CFD-ACE+ simulations by E.Toinov
Discharge conditions: Helium, P=400torr, Pulse 6kV/50ns, R=0.5mm

P-8244-1/64
What have we learned ?
• Positive Column is the most studied object in gas discharge physics. It is unexpected to find a new physical effect in such a system
• We have first discovered a paradoxial non-monotonic distribution of excitation rates and excited species densities in simulations
• This effect has been later understood and confirmed by theoretical analysis and there is some experimental evidence
• Further experimental studies are required to observe this effect in real systems
• The effect has its origin in the kinetics of electrons and gives another evidence of the importance of electron kinetics in gas discharges
• Simulations become a predictive tool for studies of plasma systems

P-8244-1/65
Dielectric Barrier Discharges

P-8244-1/66
Plasma Optimization for Efficient Generation of UV Radiation and Active Radicals
Total emitted UV power versus pulse frequency. The pulse width is 500ns, background gas N2, applied voltage 9kV, and gap distance 1.7mm.
Pulsed power DBD in atmospheric pressure:.pulse frequency is 1kHz, the pulse width is 400ns, and the amplitude is 8kV (experiments by M.Laroussi)
The goal of this project is to optimize the pulsed-power atmospheric pressure non-equilibrium plasma sources for efficient generation of UV radiation and active radicals using a combination of experimental studies and advanced plasma simulations to explore whether the added complexity of fast risetime pulsed circuits has a payoff in terms of UV radiation output and overall chemical-processing efficiency
Measured current and voltage curves without (left) and with (right) the presence of plasma.
0 2 4 6 8 10 120
4
8
12
16
20
UV
Pow
er(m
W)
Frequency(kHz)
Background Gas: N2Voltage: 9kVGap Distance: 1.7mm
M.Laroussi et al., J. Appl. Phys. 96, 3028 (2004)

P-8244-1/67
Plasma Optimization for Efficient Generation of UV Radiation and Active Radicals
Discharge voltage and current for 9 kV, 500ns pulses
Electron density and temperature during active pulse of DBD plasma with 9 kV pulses
Simulations of pulsed DBD in He-N2-Air Mixtures

P-8244-1/68
Simulation of pulsed dielectric barrier discharge xenon excimer lamp
Excimer lamps are efficient sources of non-coherent ultraviolet (UV) or vacuum ultraviolet (VUV) radiation generated by rare gasdimers and rare gas halides.
The dielectric barrier discharges (DBD) are ideally suited to induce excimer formation
To understand qualitatively the increased efficiency in the pulsed operating regime, a comprehensive numerical model of pulsed DBD for excimer lamps has been developed
Breakdown stage
Spatial distributions of electron and ion densities and electricfield at different times during gas breakdown stage
E.Bogdanov et al., J. Phys. D 37, October (2004)

P-8244-1/69
Simulation of pulsed dielectric barrier discharge xenon excimer lamp
Plasma decay during the afterglow defines the breakdown dynamics which depends significantly on whether the gas is initially ionized or not. .
High over-voltages applied on non-ionized gas result in streamers, whereas the discharge development of initially ionized gas can take place under uniform conditions.
It is hence very important to model correctly the whole discharge pulse including both the breakdown and the afterglow stages.
Afterglow stage
Spatial distributions of electron and ion densities and electrostatic potential at different times in the afterglow.
It is seen that plasma remains quasi-neutral during the afterglow stage (ion and electron densities have the same values) with except of the sheath areas.
E.Bogdanov et al., J. Phys. D 37, October (2004)

P-8244-1/70
Conclusions about DBD simulations
• Simulations helped us to understand the important features of DBD operation in pulsed power regime and clarify optimization scenarios for improvements of plasma sources for generation of active radicals and UV output.
• Two distinct stages. In the first, fast stage, the power deposition takes place over a short time period of the order of several 10s ns. This phase is the most crucial for DBD optimization. By tailoring the electron spectrum one can affect the efficiency.
• The “afterglow” stage defines the plasma composition, determines how the next current pulse will occur.
• Simulations have confirmed that electron emission at dielectric surfaces plays minor role in the discharge dynamics - distinguish it from traditional (slow) breakdown that occurs in DBDs driven by low frequency RF sources

P-8244-1/71
Conclusions
• CFD-ACE+PLASMA has reached the state of maturity and has been used for simulations of different plasma devices and processes
• The Plasma Technologies Branch at CFDRC continues to develop advanced plasma models and customize CFD-ACE for user’s needs
• Potential Research and Development areas include (but not limited to)• Radiation Transport in Plasma Sources• Microwave Plasmas• Multi Scale Simulations for Nano-Technologies• Rarefied Gas Dynamics

P-8244-1/72
FPE & its Numerical Solution
[ ] SfVufDu
uuffD
tf
uurr =⎟⎟⎠
⎞⎜⎜⎝
⎛⎥⎦⎤
⎢⎣⎡ +
∂∂
∂∂
++∇⋅∇+∂∂ )(
)(1 χ
χV
ur FF +=∂
∂
tf
Operator splitting technique
tf
f∂
∂−+= ur FF)(Rintroduce a residual function and use the iterative method
To find the value of fn+1 for the next iteration, we first solve for f* in physical space
)R(F)1(1 )(r
nij ff
t=′⎟
⎠⎞
⎜⎝⎛ +−∆
βδθ fff n ′+= α)(*
Then we solve for f** in the energy space
)R(F)1(1 ***u ff
t ij =⎟⎠⎞
⎜⎝⎛ +−∆
βδθ ***)1( fff n α+=+
Here α is a linear relaxation parameter (0<α <1), and β is the inertial relaxation parameter

P-8244-1/73
Visualization of Simulation Data
)exp()2zcos()
2ycos()
2xcos(),,,( uuzyxf απππ
−=
4D box: 0<x<1, 0<y<1, 0<z<1, 0<u<101)( =uχ 1=rD 0=rV 10=uD 0=uV 0=S
)2zcos()
2ycos()
2xcos()0,,,( πππ
==uzyxfboundary conditions
at u=10fuf α−=∂∂
at x=0, y=0, z=0,
at x=1, y=1, or z=1.
0=∂∂nf
0),,,( =uzyxf
103
2πα =

P-8244-1/74
Structure of Plasma Simulators
Coupling electron kinetics and electro-magnetics
• Having solved FPE for electron energy distribution function, we calculate macroscopic properties of electrons (mobility and diffusion coefficients) and rates of electron induced chemical reactions
• We solve the electron density balance together with the kinetic equation using the electron production rate and electron flux provided by the kinetic module.
• The electron number density calculated in such a way is used in Poisson and Maxwell equations for calculation of electrostatic and electromagnetic fields.
0f

P-8244-1/75
Choosing the right physical model
•Fluid models:Conservation of density, momentum and energy for electrons, ions and neutral species
•Kinetic models:Solving Boltzmann equation for the particle distribution function
•Hybrid models:Fluid model for heavy species and kinetic model for electrons
ICPCCP
DC
MEMS
ECR
DisplaysL = λε
L = λ

P-8244-1/76
He, 100 mTorr, 200 V
predicted current density is about 0.8 mA/cm2 for these conditions
The central electron density predicted by CFD-ACE+Plasma is about 5.6×108 cm-
3.data in Ref. [1]: electron density varies from 4.5×108 cm-3 to 1.6×109 cm-3 for
different models
Te varies from 2.4 to 6.7 eV in Ref. [1]. CFD-ACE+Plasma predicts the (effective) electron temperature of 5.5 eV.

P-8244-1/77
EEDF Maxwellization & Reaction Rates
• EEDF Maxwellization due to Coulomb collisions among electrons results in a strong dependence of inelastic collision rates on electron density• This effect is most pronounced for the elastic energy balance of electrons

P-8244-1/78
50 µs pulse, high coil current: time evolution
Electron temperature, reactor centerElectron density, reactor center
• small “ripples” on Te are numerical due to finite energy resolution in the Boltzmann solver
• high current operation: plasma reaches steady state during active phase

P-8244-1/79
30 µs pulse, low coil current: time evolution
Electron temperature, reactor centerElectron density, reactor center
• small “ripples” on Te are numerical due to finite energy resolution in the Boltzmann solver
• short-length pulse operation: plasma does not reach steady state during active phase

P-8244-1/80
Non-monotonic excitation profiles explained
PC was simulated in a wide range of pressures (0.1-100 Torr) and currents µA-0.1A in Ar and He gases
♦The predicted flux of electrons shown schematically by arrows is directed towards the discharge center. The electron flux to boundary 2 (where u = u*) defines the rates of inelastic processes. ♦ The increased radial flux of electrons at this boundary is responsible for the enhancement of inelastic collision rates at the discharge periphery.
R.Arslanbekov et al., Applied Physics Letters 85 (15), October (2004)

P-8244-1/81
140 mTorr and 50 V RF voltage
electron temperature profile is drastically different from that obtained in the high current density case (with 400 V RF voltage)
discharge current density predicted by CFD-ACE+Plasma is about 0.25 mA/cm2 (0.22 mA/cm2 inIvanov et al.).
charged-particle’s profiles, as well as the (effective) electron temperature profiles are close to those obtained in Ivanov et al.

P-8244-1/82
CH4 , 140 mTorr, 400 V RF
current density predicted by CFD-ACE+Plasma is about 2 mA/cm2, which agrees well with that of 2.2 mA/cm2 obtained in Ivanov et al
the charged-particle’s profiles, as well as the (effective) electron temperature profiles are close to those obtained in Ivanov et al
the electron energy profiles feature a strong dip in the plasma center due to the cold peak on the EDF.
The electron density predicted by CFD-ACE+Plasma is lower than in Ivanov et al (~1010 cm-
3 vs ~3×1010 cm-3), which most likely due to different ion mobilities used in the two codes.


