Embed Size (px)
Citation preview
www.elsevier.com/locate/ynimg
NeuroImage 28 (2005) 205 – 215
Hemodynamic and metabolic responses to activation, deactivation
and epileptic discharges
Bojana Stefanovic,* Jan M. Warnking, Eliane Kobayashi, Andrew P. Bagshaw, Colin Hawco,
Francois Dubeau, Jean Gotman, and G. Bruce Pike
Montreal Neurological Institute, 3801 University Street, Montreal, QC, Canada H3A 2B4
Received 2 February 2005; revised 24 March 2005; accepted 19 May 2005
Available online 5 July 2005
To investigate the coupling between the hemodynamic and metabolic
changes following functional brain activation as well as interictal
epileptiform discharges (IEDs), blood oxygenation level dependent
(BOLD), perfusion and oxygen consumption responses to a unilateral
distal motor task and interictal epileptiform discharges (IEDs) were
examined via continuous EEG-fMRI. Seven epilepsy patients per-
formed a periodic (1 Hz) right-hand pinch grip using ¨8% of their
maximum voluntary contraction, a paradigm previously shown to
produce contralateral M1 neuronal excitation and ipsilateral M1
neuronal inhibition. A multi-slice interleaved pulsed arterial spin
labeling and T2*-weighted gradient echo sequence was employed to
quantify cerebral blood flow (CBF) and BOLD changes. EEG was
recorded throughout the imaging session and reviewed to identify the
IEDs. During the motor task, BOLD, CBF and cerebral metabolic rate
of oxygen consumption (CMRO2) signals increased in the contra- and
decreased in the ipsilateral primary motor cortex. The relative changes
in CMRO2and CBF were linearly related, with a slope of 0.46 T 0.05.
The ratio of contra- to ipsilateral CBF changes was smaller in the
present group of epilepsy patients than in the healthy subjects
examined previously. IEDs produced both increases and decreases in
BOLD and CBF signals. In the two case studies for which the
estimation criteria were met, the coupling ratio between IED-induced
CMRO2and CBF changes was estimated at 0.48 T 0.17. These findings
provide evidence for a preserved coupling between hemodynamic and
metabolic changes in response to both functional activation and, for the
two case studies available, in response to interictal epileptiform activity.
D 2005 Elsevier Inc. All rights reserved.
Keywords: EEG-fMRI; Epilepsy; Negative BOLD; Perfusion; Oxygen
consumption
Introduction
Although the relationship between ictal and interictal epileptic
activity is not entirely understood (Badier and Chauvel, 1985,
1995; Alarcon et al., 1994; de Curtis and Avanzini, 2001; Avoli,
1053-8119/$ - see front matter D 2005 Elsevier Inc. All rights reserved.
doi:10.1016/j.neuroimage.2005.05.038
* Corresponding author. Fax: +1 514 398 2975.
E-mail address: [email protected] (B. Stefanovic).
Available online on ScienceDirect (www.sciencedirect.com).
2001; Janszky et al., 2001), interictal epileptiform discharges
(IEDs) represent a very specific marker of epilepsy, the delineation
of the irritative zone (Rosenow and Luders, 2001) being of
particular interest for presurgical evaluations of epileptic patients
(Penfield and Jasper, 1954; Kanner et al., 1995; McKhann et al.,
2000). Interictal activity has traditionally been studied with
electroencephalography (EEG), IEDs producing pronounced and
stereotyped electroencephalographic trace deviations. Although
ictal activity is generally associated with increased metabolism and
perfusion (Duncan, 1997), no consistent changes in cerebral
metabolic rate of glucose consumption (CMRGlc) or cerebral blood
flow (CBF) in response to interictal epileptiform activity have been
demonstrated (Theodore et al., 1985; Ochs et al., 1987). This has
often been ascribed to the poor sensitivity of the methods
employed, e.g., low statistical power and poor temporal resolution
of positron emission tomography (PET) studies, the latter leading
to amalgamation of different states within each measurement
(Duncan, 1997; Sperling and Skolnick, 1995).
In the last decade, functional magnetic resonance imaging
(fMRI) has been deployed in conjunction with EEG (Ives et al.,
1993; Huang-Hellinger et al., 1995; Warach et al., 1996) to
improve the EEG-based localization of the irritative zone and
enable investigation of the hemodynamic and metabolic correlates
of IEDs with high spatial and temporal resolution (Seeck et al.,
1998; Krakow et al., 1999; Patel et al., 1999; Lazeyras et al., 2000;
Jager et al., 2002; Al-Asmi et al., 2003). However, full use of the
information afforded from fMRI BOLD data in the combined
EEG-fMRI investigations is predicated on the understanding of the
physiological changes determining the BOLD response, which are
incompletely understood even in normal functional brain activa-
tion. Detailed investigation of the BOLD response to IEDs has
only recently begun (Lemieux et al., 2001; Benar et al., 2002;
Bagshaw et al., 2004; Aghakhani et al., 2004). Regional negative
BOLD responses to IEDs have been observed (Salek-Haddadi
et al., 2003b; Archer et al., 2003a,b; Bagshaw et al., 2004;
Aghakhani et al., 2004), but their origins are presently unknown.
In contrast to focal epilepsies where an uncoupling between
CBF and CMRGlc has been suggested (Gaillard et al., 1995; Fink
et al., 1996; Breier et al., 1997; Bruehl et al., 1998) (and disputed

B. Stefanovic et al. / NeuroImage 28 (2005) 205–215206
(Franck et al., 1989; Kuhl et al., 1980)), the diffuse neuro-
physiological abnormalities assumed to exist in patients with
idiopathic generalized epilepsy (IGE) are commonly believed not
to influence the nature of the coupling between metabolic and
hemodynamic changes, and hence the interpretation of BOLD
fMRI response. While the neurovascular coupling in IGE has
largely been unexplored, it may, in principle, still be compromised
(as it is in partial epilepsies) even in the interictal state as a result of
pharmacological interventions (Theodore et al., 1989; Leiderman
et al., 1991), the cumulative effect of seizures, an IED-instigated
rise in extracellular potassium (Jensen and Yaari, 1997), pH
changes in the course of after-potentials hyperpolarization (de
Curtis et al., 1998) and compromised functioning of astrocytes
(Grisar et al., 1999), potential mediators of neurovascular coupling
(Salek-Haddadi et al., 2003a).
In the present study, we set out to investigate the coupling
between perfusion and oxygen consumption changes in a group of
epilepsy patients, in response to both a motor task and IEDs.
Although no direct measurements of this coupling have thus far
been made, it is critical for the interpretation of the BOLD fMRI
studies in epilepsy. The selected motor task, involving a low-force
phasic pinch grip, is known to produce neuronal deactivation (and
correspondingly, a negative BOLD response) in the ipsilateral
primary motor cortex in addition to neuronal activation (producing
a BOLD signal increase) of the contralateral primary motor cortex
(Boroojerdi et al., 1996; Netz et al., 1995; Gerloff et al., 1998;
Liepert et al., 2001; Ferbert et al., 1992; Hamzei et al., 2002). In a
recent study of healthy young adults performing this task, we
found the same coupling between changes in oxygen consumption
and flow in response to both neuronal activation and deactivation
(Stefanovic et al., 2004). In view of the present understanding of
IGE, we hypothesized that these patients would exhibit normal
coupling between hemodynamic and metabolic responses follow-
ing neuronal activation or deactivation, with a consistent relation-
ship between CMRO2and CBF changes underlying both positive
and negative steady-state BOLD signal changes. Furthermore, the
relatively small perturbations in neuronal state elicited by IEDs
were expected to fall within the normal operating range of the
neuronal circuitry: the spike-induced flow and oxygen consump-
tion changes were thus anticipated to follow those observed during
physiologic stimulation.
Here, we report on the relationship between blood flow and
oxygen consumption in regions of sustained BOLD and CBF
signal increases, in the contralateral primary motor cortex (M1),
and their decreases, in the ipsilateral M1, in response to the motor
task previously employed in a study of healthy volunteers.
Furthermore, the hemodynamic and metabolic responses induced
by interictal epileptiform activity were quantified. The present
findings elucidate the nature of the metabolic and vascular
responses to normal neuronal activation, deactivation and IEDs
in the brain of patients with epilepsy.
Methods
Overall, the BOLD and CBF responses were simultaneously
measured in a group of epilepsy patients exhibiting generalized
IEDs who performed a motor task known to produce neuronal
activation in the contra- and deactivation in the ipsilateral primary
motor cortex. The electroencephalogram was recorded simulta-
neously with the fMRI to identify the occurrences of the IEDs and
thus allow the quantification of BOLD and CBF responses to IEDs.
The concomitant changes in oxygen consumption were estimated
via the deoxyhemoglobin dilution model (Davis et al., 1998; Hoge
et al., 1999) in conjunction with BOLD and CBF data obtained
during the administration of hypercapnia.
Motor task
The motor task employed was identical to that described in an
earlier study of 8 healthy adults (Stefanovic et al., 2004). Briefly,
the maximum voluntary contraction of the right-handed pinch grip
was measured for each patient. The patients were then trained to
perform the pinch grip at a frequency of 1 Hz, on each grip
pressing a water-filled ball with the thumb and the index finger of
the right hand. The recording and analysis of the exerted pressure
was performed in real time and an auditory feedback provided to
the patient: a low frequency tone indicated that the force applied
was in the desired range, namely within 20% of the target level. A
high frequency tone accompanied too strong a force, and no tone
was played out when insufficient force was exerted. To minimize
habituation, the target level was randomized on each pinch grip and
varied between 6 and 10% of the patient’s maximum voluntary
contraction.
Hypercapnic modulation
Mild hypercapnia was induced through administration of
mixtures of carbon dioxide and air through a non-rebreathing face
mask (Hudson RCI, Model 1069, Temecula, CA). At baseline, the
subjects were inhaling medical air (21% O2, balance N2), supplied
at 16 L/min. During hyper-capnic perturbations, a premixed
preparation of 10% CO2, 21% O2 and balance N2 (BOC Canada
Ltd., Montreal, Quebec, Canada) was combined with medical air in
a Y-connector. Three levels of hypercapnia were administered, with
CO2 concentration of 4, 6, and 8%, respectively. At each level, the
gas flow rates were adjusted to maintain a total flow rate of 16 L/
min. End-tidal CO2 was measured via a nasal cannula with
monitoring aspirator (Normocap 200, Datex Inc., Plymouth, ME)
and increased an average 17 T 4 mm Hg (or 59 T 21%) during
inhalation of the highest CO2 concentration mixture. Subjects were
asked to breathe at a constant rate, and their respiratory rate was
monitored via the capnometer.
Patients
Seven patients (6 females and 1 male; average age 40 T 6 years)
participated in the study. They were selected from a database of 91
epileptic patients (of which 25 had IGE) who had undergone
combined EEG-fMRI monitoring at the Montreal Neurological
Institute. The patients were selected based on a strong IED-induced
negative BOLD response (at least one cluster of �20 voxels with
peak t value ��5) and overall cooperativity in the prior (no more
than 30 months earlier) scanning session, as well as willingness to
participate. The exclusion criteria comprised a history of asthma or
past neurosurgical interventions. Six of the seven patients were
clinically diagnosed with IGE and the remaining one with
parietooccipital epilepsy. The top portion of Table 1 summarizes
the clinical characteristics of each patient. Informed consent was
obtained from each subject prior to the scanning session, the
experimental protocol having been approved by the Research
Ethics Board of the Montreal Neurological Institute.
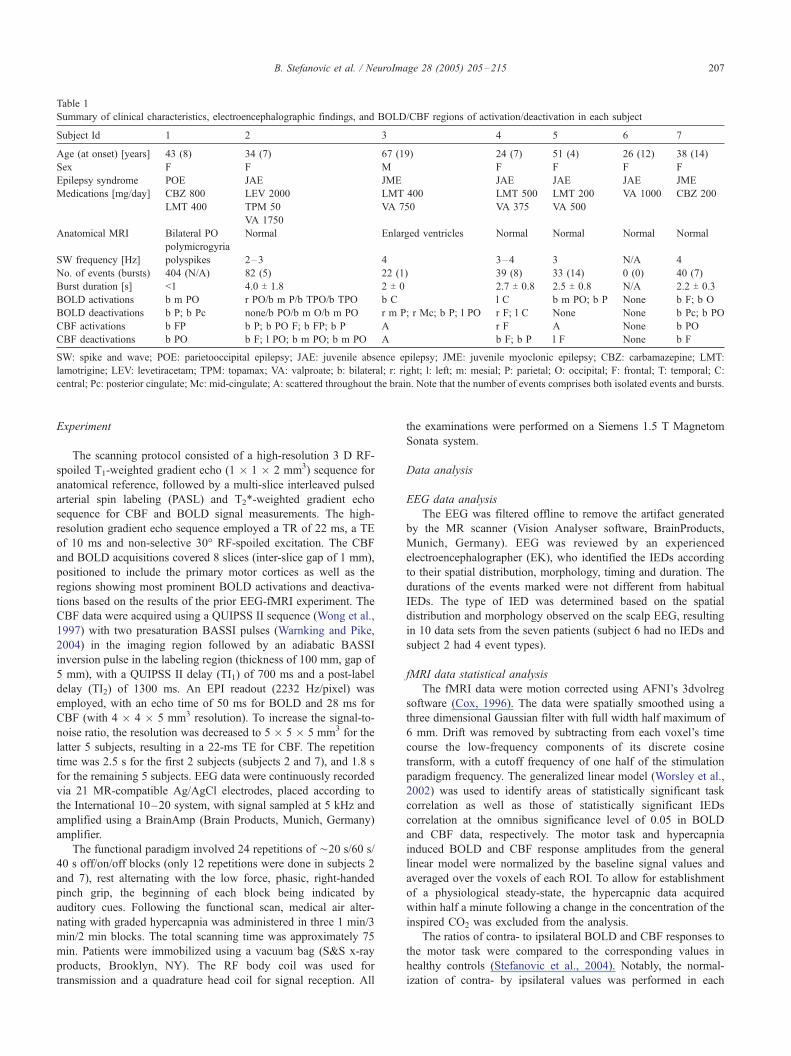
Table 1
Summary of clinical characteristics, electroencephalographic findings, and BOLD/CBF regions of activation/deactivation in each subject
Subject Id 1 2 3 4 5 6 7
Age (at onset) [years] 43 (8) 34 (7) 67 (19) 24 (7) 51 (4) 26 (12) 38 (14)
Sex F F M F F F F
Epilepsy syndrome POE JAE JME JAE JAE JAE JME
Medications [mg/day] CBZ 800 LEV 2000 LMT 400 LMT 500 LMT 200 VA 1000 CBZ 200
LMT 400 TPM 50 VA 750 VA 375 VA 500
VA 1750
Anatomical MRI Bilateral PO
polymicrogyria
Normal Enlarged ventricles Normal Normal Normal Normal
SW frequency [Hz] polyspikes 2–3 4 3–4 3 N/A 4
No. of events (bursts) 404 (N/A) 82 (5) 22 (1) 39 (8) 33 (14) 0 (0) 40 (7)
Burst duration [s] <1 4.0 T 1.8 2 T 0 2.7 T 0.8 2.5 T 0.8 N/A 2.2 T 0.3
BOLD activations b m PO r PO/b m P/b TPO/b TPO b C l C b m PO; b P None b F; b O
BOLD deactivations b P; b Pc none/b PO/b m O/b m PO r m P; r Mc; b P; l PO r F; l C None None b Pc; b PO
CBF activations b FP b P; b PO F; b FP; b P A r F A None b PO
CBF deactivations b PO b F; l PO; b m PO; b m PO A b F; b P l F None b F
SW: spike and wave; POE: parietooccipital epilepsy; JAE: juvenile absence epilepsy; JME: juvenile myoclonic epilepsy; CBZ: carbamazepine; LMT:
lamotrigine; LEV: levetiracetam; TPM: topamax; VA: valproate; b: bilateral; r: right; l: left; m: mesial; P: parietal; O: occipital; F: frontal; T: temporal; C:
central; Pc: posterior cingulate; Mc: mid-cingulate; A: scattered throughout the brain. Note that the number of events comprises both isolated events and bursts.
B. Stefanovic et al. / NeuroImage 28 (2005) 205–215 207
Experiment
The scanning protocol consisted of a high-resolution 3 D RF-
spoiled T1-weighted gradient echo (1 � 1 � 2 mm3) sequence for
anatomical reference, followed by a multi-slice interleaved pulsed
arterial spin labeling (PASL) and T2*-weighted gradient echo
sequence for CBF and BOLD signal measurements. The high-
resolution gradient echo sequence employed a TR of 22 ms, a TE
of 10 ms and non-selective 30- RF-spoiled excitation. The CBF
and BOLD acquisitions covered 8 slices (inter-slice gap of 1 mm),
positioned to include the primary motor cortices as well as the
regions showing most prominent BOLD activations and deactiva-
tions based on the results of the prior EEG-fMRI experiment. The
CBF data were acquired using a QUIPSS II sequence (Wong et al.,
1997) with two presaturation BASSI pulses (Warnking and Pike,
2004) in the imaging region followed by an adiabatic BASSI
inversion pulse in the labeling region (thickness of 100 mm, gap of
5 mm), with a QUIPSS II delay (TI1) of 700 ms and a post-label
delay (TI2) of 1300 ms. An EPI readout (2232 Hz/pixel) was
employed, with an echo time of 50 ms for BOLD and 28 ms for
CBF (with 4 � 4 � 5 mm3 resolution). To increase the signal-to-
noise ratio, the resolution was decreased to 5 � 5 � 5 mm3 for the
latter 5 subjects, resulting in a 22-ms TE for CBF. The repetition
time was 2.5 s for the first 2 subjects (subjects 2 and 7), and 1.8 s
for the remaining 5 subjects. EEG data were continuously recorded
via 21 MR-compatible Ag/AgCl electrodes, placed according to
the International 10–20 system, with signal sampled at 5 kHz and
amplified using a BrainAmp (Brain Products, Munich, Germany)
amplifier.
The functional paradigm involved 24 repetitions of ¨20 s/60 s/
40 s off/on/off blocks (only 12 repetitions were done in subjects 2
and 7), rest alternating with the low force, phasic, right-handed
pinch grip, the beginning of each block being indicated by
auditory cues. Following the functional scan, medical air alter-
nating with graded hypercapnia was administered in three 1 min/3
min/2 min blocks. The total scanning time was approximately 75
min. Patients were immobilized using a vacuum bag (S&S x-ray
products, Brooklyn, NY). The RF body coil was used for
transmission and a quadrature head coil for signal reception. All
the examinations were performed on a Siemens 1.5 T Magnetom
Sonata system.
Data analysis
EEG data analysis
The EEG was filtered offline to remove the artifact generated
by the MR scanner (Vision Analyser software, BrainProducts,
Munich, Germany). EEG was reviewed by an experienced
electroencephalographer (EK), who identified the IEDs according
to their spatial distribution, morphology, timing and duration. The
durations of the events marked were not different from habitual
IEDs. The type of IED was determined based on the spatial
distribution and morphology observed on the scalp EEG, resulting
in 10 data sets from the seven patients (subject 6 had no IEDs and
subject 2 had 4 event types).
fMRI data statistical analysis
The fMRI data were motion corrected using AFNI’s 3dvolreg
software (Cox, 1996). The data were spatially smoothed using a
three dimensional Gaussian filter with full width half maximum of
6 mm. Drift was removed by subtracting from each voxel’s time
course the low-frequency components of its discrete cosine
transform, with a cutoff frequency of one half of the stimulation
paradigm frequency. The generalized linear model (Worsley et al.,
2002) was used to identify areas of statistically significant task
correlation as well as those of statistically significant IEDs
correlation at the omnibus significance level of 0.05 in BOLD
and CBF data, respectively. The motor task and hypercapnia
induced BOLD and CBF response amplitudes from the general
linear model were normalized by the baseline signal values and
averaged over the voxels of each ROI. To allow for establishment
of a physiological steady-state, the hypercapnic data acquired
within half a minute following a change in the concentration of the
inspired CO2 was excluded from the analysis.
The ratios of contra- to ipsilateral BOLD and CBF responses to
the motor task were compared to the corresponding values in
healthy controls (Stefanovic et al., 2004). Notably, the normal-
ization of contra- by ipsilateral values was performed in each

B. Stefanovic et al. / NeuroImage 28 (2005) 205–215208
subject prior to the comparison in view of the potential confounding
effects of the antiepileptic medications on the global resting flow
(Gaillard et al., 1996) and the known large inter-subject variability
in CBF responses to motor activation in healthy subjects.
With respect to the IED events, each data set was analyzed with
four impulse response functions, modeled as monophasic, single
gamma functions, peaking 3, 5, 7 and 9 s following the event to
allow for some variation in the latency of the response while
retaining information about its expected shape (Buckner, 1998;
Bagshaw et al., 2004). The full width at half maximum of the
gamma functions was 5.2 s; the duration of the burst was input
when modeling the response. Composite statistical maps were
created by taking the maximum value from the four analyses at
each voxel, as described by Bagshaw et al. (2005).
IED response estimation
The regions of interest for IED response estimation were chosen
as the clusters in BOLD/CBF t value maps showing statistically
significant correlation with the IED events and having at least 5
and no more than 20 voxels (i.e., with a volume, V, 0.625 cc � V �2.5 cc). The IED responses were then estimated by fitting the fMRI
signal within each region of interest (ROI) using a Fourier basis set
(Josephs et al., 1997; Kang et al., 2003). Only data from those
BOLD/CBF ROI pairs whose centers of mass were within 5 mm of
each other were considered for CMRO2estimation, described
below. Within each subject, the peak BOLD/CBF changes from all
regions of interest satisfying this criterion were averaged before the
CMRO2estimation was done.
CMRO2estimation
The hypercapnic data were averaged across all subjects, at each
level of hypercapnia and a common maximum achievable BOLD
signal change (M) was estimated by linear fitting of the trans-
formed and averaged CBF data vs. averaged BOLD data to the
deoxyhemoglobin dilution model (Davis et al., 1998; Hoge et al.,
1999):
DBOLD
BOLD0
¼ M 1� CBF
CBF0
�� a�h��: ð1Þ
We thus assumed no effect of the mild hypercapnia elicited in
this experiment on the rate of oxygen consumption. The a and h
Fig. 1. Regions of interest based on t value maps thresholding for BOLD (a) and C
are overlaid on the average of all subjects anatomical scans in the Talairach spac
were set to 0.38 and 1.5, respectively (Grubb et al., 1974;
Boxerman et al., 1995). The individual motor task-induced CMRO2
changes were next calculated using the M (and its associated
standard error) from Eq. (1) in combination with the measured
BOLD and CBF data during the functional run, as follows (Davis
et al., 1998; Hoge et al., 1999):
CMRO2
CMRO2j0
¼ 1�DBOLDBOLD0
��M
1A
0@
1h
CBF
CBF0
�� 1� ah
: ð2Þ
Therefore, the errors in the M estimate from the linear fitting of
the transformed and averaged CBF hypercapnia data to averaged
BOLD hypercapnia data were propagated into the errors on the
calculated activation-induced CMRO2changes. Finally, a single
straight line was fit to the noisy CMRO2, noisy CBF data pairs from
both contra- and ipsilateral ROIs of all subjects to obtain an
optimal estimate of the CMRO2/CBF coupling ratio for the motor
task. The same analysis was performed for the peak BOLD and
CBF changes from IED-elicited responses to estimate CMRO2
change as well as the CMRO2/CBF coupling ratio following IEDs.
The quality of each fit was assessed by v2 analysis, with the v2
probability reported as q (Press et al., 1992).
Results
Motor task-induced responses
Task-induced increases in BOLD signal were observed,
contralaterally, in the primary sensorimotor cortex (SM1), premo-
tor cortex (PMC), supplementary motor area (SMA), as well as a
part of the posterior parietal association cortex (PPC) flanking the
postcentral sulcus. Ipsilaterally, BOLD signal increased in the
secondary areas (namely, PMC, SMA and PPC), but decreased in
the primary sensorimotor cortex. Fig. 1 shows a slice of BOLD and
CBF ROIs, summed over all subjects after registration (Collins et
al., 1994) with the Montreal Neurological Institute template brain
(Evans et al., 1993). The (x, y, z) coordinates (in mm) of the center
of mass of the t value based primary motor cortex ROIs
transformed into the Talairach space and summed over all subjects
were (�35, �24, 54) for contralateral BOLD, (36, �23, 55) for
BF (b), transformed into the Talairach space and summed over all subjects,
e. The contralateral ROIs are displayed in red and the ipsilateral in green.

B. Stefanovic et al. / NeuroImage 28 (2005) 205–215 209
ipsilateral BOLD, (�37, �22, 53) for contralateral CBF, and (35,
�24, 54) for ipsilateral CBF.
A typical set of BOLD signal and CBF time courses, in both
contra- and ipsilateral M1-ROIs of a subject, is shown in Fig. 2.
Fig. 3 displays all measured BOLD and CBF data pairs, for
hypercapnic perturbation and motor task, as well as the calculated
iso-CMRO2contours. In 5 out of 7 subjects, the magnitude of CBF
and BOLD signal changes were larger in the contra- than in the
ipsilateral ROI.
The maximum achievable BOLD signal increase (M), obtained
by linear fitting of the average hypercapnia data across all subjects,
was 0.046 T 0.013, corresponding to aDR2* of�0.9 T 0.2 s1. The v2
analysis indicated a good fit ( q = 0.39) (Press et al., 1992). The
calculated CMRO2and the corresponding measured CBF changes,
for each subject, are displayed in Fig. 4. The slope of the straight line
fit to these data yielded a CMRO2/CBF coupling ratio of 0.46 T 0.05
(with q of 0.92 indicating an excellent fit (Press et al., 1992)).
Comparison with controls
The data of Fig. 3 has been replotted in Fig. 5, in conjunction
with the corresponding data from our previous study, which
Fig. 2. Time courses of contralateral (positive) BOLD (a) and CBF (b), as well as ip
standard errors are shown as dashed lines. All time course data have been low pas
24 sessions.
employed the same motor paradigm in a group of healthy subjects
(Stefanovic et al., 2004). Notably, the ratio of contra- to ipsilateral
CBF responses is significantly (P ¨ 0.017) smaller in epileptic
patients (2.2 T 1.3) than in healthy subjects (4.2 T 2.3). Average
contra- and ipsilateral CBF responses across subjects are shown in
Fig. 6. A very similar level of deactivation-induced percent CBF
decrease is seen in the two groups, in contrast to a smaller
excitation-induced percent CBF increase in the epilepsy patients.
The same trend of lower contra-to ipsilateral BOLD responses in
epileptic patients relative to controls is observed (2.7 T 2.5 vs. 3.7 T2.1), though it does not reach significance (P ¨ 0.21).
IED-induced responses
Six out of seven patients exhibited epileptiform activity in the
course of the scanning session (cf. Table 1 for the summary of EEG
findings). In each of these subjects, the interictal epileptiform
discharges induced both increases and decreases in BOLD and
CBF signals, as summarized in Table 1. Only two of the six
subjects exhibited sufficiently co-localized (i.e., at most 5 mm
separation between their respective ROI centers of mass, as
described in Methods) statistically significant changes in both
silateral (negative) BOLD (c) and CBF (d) percent changes in subject 1. The
s filtered with a Hanning window (FWHM = 20 s) prior to averaging across

Fig. 3. The percent changes in BOLD and CBF signals in the ipsilateral
ROIs (green circles) and contralateral ROIs (red triangles) for each subject.
The average hypercapnia data (black squares) are displayed along with the
corresponding fit (indicated by crosses), representing the baseline iso-
CMRO2contour. The estimate of the maximum achievable BOLD signal
change was substituted into the equation [13] of the deoxyhemoglobin
dilution model (Hoge et al., 1999) to generate non-baseline iso-CMRO2
contours (shown as solid black curves), at 10% intervals. The shaded area
corresponds to the shaded region of Fig. 4.
Fig. 5. The percent changes in BOLD and CBF signals induced by the
motor task in the ipsilateral ROIs (green circles: epilepsy patients; blue
circles: healthy subjects) and contralateral ROIs (red triangles: epilepsy
patients; magenta triangles: healthy subjects).
B. Stefanovic et al. / NeuroImage 28 (2005) 205–215210
BOLD and CBF. These included right parietal and right cuneus
regions in subject 1; and bilateral frontal, left occipital, bilateral
precentral, left precuneus and right cuneus regions in subject 7.
The two BOLD/CBF ROI pairs in subject 1 and 13 BOLD/CBF
ROI pairs in subject 7 met the above criteria. Sample t value maps
from subject 1 are shown in Fig. 7. As described in Methods,
BOLD and CBF data were averaged across the ROIs of each
subject prior to the calculation of CMRO2changes. The optimal
linear fit between the resulting CMRO2estimates and CBF data in
the ROIs of these two subjects is displayed in Fig. 8. The slope of
the straight line fit to these data yielded a CMRO2/CBF coupling
Fig. 4. The oxygen consumption changes corresponding to each subject’s
perfusion changes induced by the motor task in the ipsilateral ROIs (green
circles) and contralateral ROIs (red triangles). The optimal straight line fit
(q = 0.92) to these data is shown superimposed, yielding a coupling ratio of
0.46 T 0.05. The shaded region represents the standard error in the linear fit.
ratio of 0.48 T 0.17 (with q of 0.80 indicating a very good fit (Press
et al., 1992)).
Discussion
The present experiments provide, for the first time, a complete
set of BOLD, CBF and CMRO2measurements following functional
activation, deactivation and IEDs in epilepsy patients. They
demonstrate a preserved coupling between perfusion and oxygen
consumption changes in epilepsy patients. As was the case for the
healthy volunteers, the CMRO2/CBF relationship was consistent
between regions of positive and negative BOLD responses to a
motor task (with DCMRO2/DCBF of 0.46 T 0.05). For the regions
that showed statistically significant IED-induced changes in both
BOLD and CBF (thus allowing for CMRO2estimation), a similar
CMRO2/CBF coupling ratio, of 0.48 T 0.17, was estimated. Overall,
these findings are consistent with the general notion of epilepsy as
Fig. 6. The average, motor task induced, percent changes in CBF signal in
ipsi- and contralateral ROIs of healthy subjects (C) and epileptic patients (E).

Fig. 7. Sample BOLD (left) and CBF (right) t value maps in a subject (Subject Id. 1), overlaid on the corresponding anatomical slices. The regions of positive
responses are shown in the top row; the regions of negative responses, in the bottom row. The centers of mass for the overlapping regions are shown with a
cross hair.
Fig. 8. The oxygen consumption changes corresponding to across ROI
average IED-induced perfusion and BOLD changes in subjects 1 and 7. The
averages for ROIs showing IED-induced signal decreases are shown as
green circles; the averages for ROIs showing IED-induced signal increases,
as red triangles. The optimal straight line fit (q = 0.80) to these data is
shown superimposed, yielding a coupling ratio of 0.48 T 0.17. The shaded
region represents the standard error in the linear fit.
B. Stefanovic et al. / NeuroImage 28 (2005) 205–215 211
a disorder of neuronal excitability, involving neuronal disinhibition
and hyperexcitability.
While neuronal hyperexcitability is thought to characterize
most epilepsy syndromes, the pathophysiology of these diseases is
still incompletely understood. The role of genetics in idiopathic
generalized epilepsy has long been suspected (Metrakos and
Metrakos, 1961) and a number of different IGE subsyndromes
have recently been associated with distinct mutations in GABAA
receptor sub-units (Macdonald et al., 2004; Gutierrez-Delicado and
Serratosa, 2004). Although IGE patients have normal structural
MRI, regional decreases in their N-acetyl aspartate levels have
been reported (Savic et al., 2004), suggesting a heterogeneous,
diffuse neuronal abnormality. The average resting metabolism and
flow in IGE patients are largely unremarkable (Duncan, 1997;
Theodore et al., 1985; Ochs et al., 1987; Kapucu et al., 2003;
Devous et al., 1990), in sharp contrast to the hypometabolism and
hypoperfusion frequently observed in the area of the epileptogenic
focus, its immediate surround or elsewhere in the brain of patients
with localization-related epilepsies (Kuhl et al., 1980; Engel et al.,
1982; Lee et al., 1986; Franck et al., 1986; Kim et al., 2001). While
initial seizures in serial seizure animal models were accompanied
by the expected increases in cerebral blood volume, arterial blood
pressure, cortical oxygen tension and cytochrome oxidase pressure,
one or more of these variables failed to rise in response to
B. Stefanovic et al. / NeuroImage 28 (2005) 205–215212
subsequent seizures, testifying to a gradual breakdown of neuro-
vascular coupling in these patients (Kreisman et al., 1981, 1983).
Similarly, in a near-infrared spectroscopy study of pediatric
epileptic seizures, an early CBV increase gradually changed to a
CBV decrease in the course of the seizure in a patient with tonic
status epilepticus (Haginoya et al., 2002). In line with the present
findings, these data suggest a preserved interictal neurovascular
coupling that is progressively compromised in the course of either
sustained or highly repetitive ictal events.
Each patient in this study was taking one or more antiepileptic
drugs (AEDs), which were reported to reduce baseline CMRGlc and
CBF (Theodore et al., 1989; Leiderman et al., 1991; Spanaki et al.,
1999; Gaillard et al., 1996). A reason for these reductions may lie
in the decreased metabolic requirements following the enhance-
ment of cerebral inhibitory neurotransmission (Theodore, 1988). In
view of the effect of valproate on brain and CSF GABA levels
(Loscher, 1979, 1981), it is important to note that increased CSF
GABA (which is linearly related to brain GABA (Palfreyman et al.,
1983; Petroff et al., 1996)), following administration of the GABA
agonist muscimol, was found to affect both blood flow and glucose
consumption as to maintain a normal relationship between the two
(Kelly and McCulloch, 1983). While the medications might have
shifted the absolute global flow and metabolism in these subjects,
there is no evidence in support of their influence on the relationship
between metabolic and hemodynamic responses to changes in
neuronal activity. Furthermore, we do not expect any spatial
variation of their effects across homologous brain regions—
namely, primary motor cortices—of interest for our functional
paradigm.
While fMRI BOLD studies of physiological brain activation are
often done in surgical epileptic candidates to map the eloquent
cortex (Deblieck et al., 2003; Diehl et al., 2003; Huettel et al.,
2004; Szaflarski et al., 2004), there are no studies making
simultaneous measurements of activation-induced BOLD, CBF
and CMRO2changes in epilepsy patients, likely due to the
complexity and limited SNR of such measurements. The slope of
0.46 T 0.05 of the best line fit to both contra- and ipsilateral M1
CMRO2vs. CBF percent signal changes found here is in excellent
agreement with the value of 0.44 T 0.04 we reported in an earlier
study of healthy volunteers performing the same motor task. It is
also in reasonable agreement (given the paradigm differences and
the expected intersubject variability) with the ratios reported by our
and other groups for the contralateral primary motor cortex
activation in studies of BOLD signal increases, with the average
of 0.35 T 0.03 found in this lab (Atkinson et al., 2000) and 0.33 T0.06 reported by Kastrup (Kastrup et al., 2002).
The ratio of the changes in perfusion—between the contrala-
teral region of neuronal activation and homologous ipsilateral
region of neuronal deactivation—was decreased in the epileptic
patients compared to the corresponding value in healthy subjects
studied previously. This significant difference in the CBF ratios
resulted from a decrease in the activation-induced CBF increases,
with a preserved range of deactivation-induced CBF decreases. In
view of the diffuse cortical hyperexcitability presumed to exist in
these patients and the suggested dominant contribution of
presynaptic potentials to the total metabolic demands of neuronal
activity (Logothetis et al., 2001), it is tempting to speculate that the
relative metabolic cost of neuronal activation with respect to
neuronal deactivation may be diminished in these patients when
compared to healthy volunteers, though the neuronal excitability
(and hence the energetic cost of the activation) may well be
influenced by AEDs (Tassinari et al., 2003). The dissociation of the
effects of the underlying pathology from those of the medications
is, however, presently unavailable.
In contrast to the sustained after-depolarizations and multiple
spike discharges characteristic of the ictal state (Matsumoto and
Ajmone Marsan, 1964a), IEDs are associated with a paroxysmal
depolarization shift of the resting neuronal membrane potential,
bursts of action potentials and ensuing hyperpolarization and hence
inhibition (Matsumoto and Ajmone Marsan, 1964b). In view of
this pronounced difference in the electrophysiological signature of
the two states, the CBF and CMRO2changes induced by interictal
discharges are expected to be far less conspicuous than their ictal
counterparts (Prevett et al., 1995; Engel et al., 1985; Theodore et
al., 1985). Likely due to the limited sensitivity of the methods in
combination with the sparcity of the interictal discharges in most
patients, there are few reports of metabolic and hemodynamic
changes induced by IEDs in epilepsy patients. No effect of the
spike and wave activity on the CMRGlc was observed in a PET
study of a group of generalized epilepsy patients, though there was
a slight trend toward CMRGlc increases in IGE patients (Ochs et al.,
1987). In a PET study of a reflex epilepsy patient, a 34.6% increase
in CBF and 13% increase in CMRGlc were measured in a region
concordant with the site of maximal ictal EEG abnormality, as
determined by implanted electrodes (Bittar et al., 1999). In a group
of patients with photosensitive epilepsy, a significant blood flow
increase was measured in the hypothalamus during a photo-
paroxysmal response (da Silva et al., 1999). In the caudate nucleus,
the CBF increase instigated by the intermittent photic stimulation
was abolished during the photoparoxysmal response (da Silva et
al., 1999).
Both widespread positive and negative BOLD responses to
IEDs have been reported in a number of EEG-fMRI studies (Salek-
Haddadi et al., 2003b; Archer et al., 2003a,b; Bagshaw et al., 2004;
Aghakhani et al., 2004). In the present study, we also observed
regions of both BOLD and CBF increases and decreases. Since
BOLD signal has a complex dependence on a number of
physiological parameters (Davis et al., 1998; Hoge et al., 1999),
we also estimated the corresponding oxygen consumption changes,
to obtain a more direct marker of the underlying metabolic costs.
Due to a combination of factors—the limited PASL contrast-to-
noise ratio at 1.5 T; few, transient IED events (compared to e.g.,
numerous repetitions of the block motor paradigm employed when
estimating the DCMRO2following neuronal activation/deactiva-
tion); and the stringent requirement for the overlap of BOLD/CBF
ROIs (to ensure robust, colocalized BOLD and CBF measure-
ments), the set of data available for quantification of oxygen
consumption changes in response to IEDs was severely curtailed.
A total of only 15 ROIs (showing statistically significant signal
changes)—from 2 patients—were sufficiently overlapped to allow
the estimation of the corresponding oxygen consumption. In these
2 case studies, BOLD changes were invariably accompanied by
CBF changes of the same sign, with the estimated DCMRO2/DCBF
coupling ratio of 0.48 T 0.17, thus very close to the one observed
for the functional activation in these patients as well as the one
obtained in healthy volunteers (Stefanovic et al., 2004). Nonethe-
less, the paucity of data available for this estimation, in com-
bination with the large variability of both epileptic syndromes and
the nature and dosage of medications customarily prescribed in its
treatment preclude any general conclusions about the hemody-
namic and metabolic responses to IEDs to be made from the
present results.
B. Stefanovic et al. / NeuroImage 28 (2005) 205–215 213
While these data suggest that IED-induced negative BOLD
responses may arise from the larger flow relative to oxygen
consumption decreases, as observed for motor task-induced
negative BOLD responses in healthy volunteers (Stefanovic et
al., 2004), other explanations of negative BOLD phenomena are
still possible. This is particularly true of epileptogenic zones in
focal epilepsies and responses to ictal activity, where neurovascular
coupling may well be compromised, as suggested earlier. Never-
theless, it is tempting to apply Gloor’s account of the spike and
wave phenomenon (Gloor, 1978), thus hypothesizing that the
presently measured negative CBF and BOLD responses result from
the net deactivation of the region due to a locally predominant
cortical inhibition relative to excitation. This also allows for the
existence of regions showing no BOLD response, due to a balance
between changes in local excitation and inhibition, integrated over
the interval determined by the effective BOLD temporal resolution,
as proposed earlier (Archer et al., 2003a). Finally, the metabolic
costs of IEDs and hence the ensuing CMRO2response and,
indirectly, BOLD response are likely affected by the relative
contributions of changes in synchronicity vs. synaptic activity to
the generation of IEDs (Salek-Haddadi et al., 2003b).
Conclusion
We observed normal hemodynamic responses to hypercapnic
perturbation in a group of epilepsy patients with generalized IEDs.
A consistent linear relationship between oxygen consumption and
perfusion changes during motor task performance in regions of
sustained positive as well as negative BOLD response was found.
The slope of the linear fit to CMRO2vs. CBF changes from both
ipsi- and contralateral ROIs was 0.46 T 0.05, in close agreement
with the coupling ratio found in an earlier study of healthy
volunteers. On the other hand, a decreased ratio of the magnitude
of contra- to ipsilateral flow changes was observed in the patient
group. Interictal epileptiform discharges produced a similar
coupling, with DCMRO2/DCBF of 0.48 T 0.17. The current
findings suggest a preserved coupling between metabolic and
hemodynamic processes underlying BOLD increases and
decreases in epileptic patients, in response to both normal
functional activation and IEDs and provide no evidence for a
disturbance in the interictal cerebral vascular responses in this
disorder.
Acknowledgments
This work was supported by the Natural Sciences and
Engineering Research Council of Canada and the Canadian
Institutes of Health Research.
References
Aghakhani, Y., Bagshaw, A.P., Benar, C.G., Hawco, C., Andermann, F.,
Dubeau, F., Gotman, J., 2004. fMRI activation during spike and wave
discharges in idiopathic generalized epilepsy. Brain 127, 1127–1144.
Alarcon, G., Guy, C.N., Binnie, C.D., Walker, S.R., Elwes, R.D., Polkey,
C.E., 1994. Intracerebral propagation of interictal activity in partial
epilepsy: implications for source localisation. J. Neurol., Neurosurg.
Psychiatry 57 (4), 435–449.
Al-Asmi, A., Benar, C.G., Gross, D.W., Khani, Y.A., Andermann, F., Pike,
G.B., Dubeau, F., Gotman, J., 2003. fMRI activation in continuous and
spike-triggered EEG-fMRI studies of epileptic spikes. Epilepsia 44 (10),
1328–1339.
Archer, J.S., Abbott, D.F., Waites, A.B., Jackson, G.D., 2003a. fMRI
‘‘deactivation’’ of the posterior cingulate during generalized spike and
wave. NeuroImage 20 (4), 1915–1922.
Archer, J.S., Briellman, R.S., Abbott, D.F., Syngeniotis, A., Wellard, R.M.,
Jackson, G.D., 2003b. Benign epilepsy with centro-temporal spikes:
spike triggered fMRI shows somato-sensory cortex activity. Epilepsia
44 (2), 200–204.
Atkinson, J.D., Hoge, R.D., Gill, B., Sadikot, A.F., Pike, G.B., 2000.
BOLD, CBF, and CMRO2in the human primary motor cortex.
Proceedings of the Sixth International Conference on Functional
Mapping of the Human Brain, San Antonio, Elsevier, p. S803.
Avoli, M., 2001. Do interictal discharges promote or control seizures?
Experimental evidence from an in vitro model of epileptiform
discharge. Epilepsia 42S3, 2–4.
Badier, J., Chauvel, P., 1985. Electroencephalographic spiking activity, drug
levels, and seizure occurrence in epileptic patients. Ann. Neurol. 17 (6),
597–603.
Badier, J., Chauvel, P., 1995. Spatio-temporal characteristics of paroxysmal
interictal events in human temporal lobe epilepsy. J. Physiol. (Paris) 89
(4–6), 255–264.
Bagshaw, A.P., Aghakhani, Y., Benar, C.G., Kobayashi, E., Hawco, C.,
Dubeau, F., Pike, G.B., Gotman, J., 2004. EEG-fMRI of focal epileptic
spikes: analysis with multiple haemodynamic functions and comparison
with Gadolinium-enhanced MR angiograms. Hum. Brain Mapp. 22 (3),
179–192.
Bagshaw, A.P., Hawco, C., Benar, C.G., Kobayashi, E., Aghakhani, Y.,
Dubeau, F., Pike, G.B., Gotman, J., 2005. Analysis of the EEG-fMRI
response to prolonged bursts of interictal epileptiform activity. Neuro-
Image 24 (4), 1099–1112.
Benar, C.G., Gross, D.W., Wang, Y., Petre, V., Pike, G.B., Dubeau, F.,
Gotman, J., 2002. The BOLD response to interictal epileptiform
discharges. NeuroImage 17 (3), 1182–1192.
Bittar, R.G., Andermann, F., Olivier, A., Dubeau, F., Dumoulin, S.O., Pike,
G.B., Reutens, D.C., 1999. Interictal spikes increase cerebral glucose
metabolism and blood flow: a PET study. Epilepsia 40 (2), 170–178.
Boroojerdi, B., Diefenbach, K., Ferbert, A., 1996. Transcallosal inhibition
in cortical and subcortical cerebral vascular lesions. J. Neurol. Sci. 144,
160–170.
Boxerman, J.L., Bandettini, P.A., Kwong, K.K., Baker, J.R., Davis, T.L.,
Rosen, B.R., Weisskoff, R.M., 1995. The intravascular contribution to
fMRI signal change: Monte Carlo modeling and diffusion-weighted
studies in vivo. Magn. Reson. Med. 34 (1), 4–10 Jul.).
Breier, J.I., Mullani, N.A., Thomas, A.B., Wheless, J.W., Plenger, P.M.,
Gould, K.L., Papanicolaou, A., Willmore, L.J., 1997. Effects of
duration of epilepsy on the uncoupling of metabolism and blood flow
in complex partial seizures. Neurology 48 (4), 1047–1053.
Bruehl, C., Hagemann, G., Witte, O.W., 1998. Uncoupling of blood flow
and metabolism in focal epilepsy. Epilepsia 39 (12), 1235–1242.
Buckner, R.L., 1998. Event-related fMRI and the hemodynamic response.
Hum. Brain Mapp. 6 (5–6), 373–377.
Collins, D.L., Neelin, P., Peters, T.M., Evans, A.C., 1994. Automatic 3 D
intersubject registration of MR volumetric data in standardized
Talairach space. J. Comput. Assist. Tomogr. 18 (2), 192–205.
Cox, R.J., 1996. AFNI: software for analysis and visualization of functional
magnetic resonance neuroimages. Comput. Biomed. Res. 29, 162–173.
da Silva, E.A., Muller, R.A., Chugani, D.C., Shah, J., Shah, A., Watson, C.,
Chugani, H.T., 1999. Brain activation during intermittent photic
stimulation: a [15O]-water PET study on photosensitive epilepsy.
Epilepsia 40 (S4), 17–22.
Davis, T., Kwong, K., Weisskoff, R., Rosen, B., 1998. Calibrated functional
MRI: mapping the dynamics of oxidative metabolism. Proc. Natl. Acad.
Sci. U. S. A. 95, 1834–1839.
de Curtis, M., Avanzini, G., 2001. Interictal spikes in focal epileptogenesis.
Prog. Neurobiol. 63 (5), 541–567.
B. Stefanovic et al. / NeuroImage 28 (2005) 205–215214
de Curtis, M., Manfridi, A., Biella, G., 1998. Activity-dependent pH shifts
and periodic recurrence of spontaneous interictal spikes in a model of
focal epileptogenesis. J. Neurosci. 18 (18), 7543–7551.
Deblieck, C., Pesenti, G., Scifo, P., Fazio, F., Bricolo, E., Russo, G.L.,
Scialfa, G., Cossu, M., Bottini, G., Paulesu, E., 2003. Preserved
functional competence of perilesional areas in drug-resistant epilepsy
with lesion in supplementary motor cortex: fMRI and neuropsycho-
logical observations. NeuroImage 20 (4), 2225–2234.
Devous, M.D., Leroy, R.F., Homan, R.W., 1990. Single photon emission
computed tomography in epilepsy. Semin. Nucl. Med. 20 (4), 325–341.
Diehl, B., Salek-Haddadi, A., Fish, D.R., Lemieux, L., 2003. Mapping of
spikes, slow waves, and motor tasks in a patient with malformation of
cortical development using simultaneous EEG and fMRI. Magn. Reson.
Imaging 21 (10), 1167–1173.
Duncan, J.S., 1997. Imaging and epilepsy. Brain 120 (Pt. 2), 339–377
Feb.).
Engel, J., Kuhl, D.E., Phelps, M.E., Mazziotta, J.C., 1982. Interictal
cerebral glucose metabolism in partial epilepsy and its relation to EEG
changes. Ann. Neurol. 12 (6), 510–517.
Engel, J., Lubens, P., Kuhl, D.E., Phelps, M.E., 1985. Local cerebral
metabolic rate for glucose during petit mal absences. Ann. Neurol. 17
(2), 121–128.
Evans, A.C., Collins, D.L., Mills, S.R., Brown, E.D., Kelly, R.L., Peters,
T.M., 1993. 3D statistical neuroanatomical models from 305 MRI
volumes. Proceedings of IEEE-Nuclear Science Symposium and
Medical Imaging Conference, pp. 1813–1817.
Ferbert, A., Rothwell, J.C., Day, B.L., Colebatch, J.G., Marsden, C.D.,
1992. Interhemispheric inhibition of the human motor cortex. J. Physiol.
453 (1), 525–546.
Fink, G.R., Pawlik, G., Stefan, H., Pietrzyk, U., Wienhard, K., Heiss, W.D.,
1996. Temporal lobe epilepsy: evidence for interictal uncoupling of
blood flow and glucose metabolism in temporomesial structures.
J. Neurol. Sci. 137 (1), 28–34.
Franck, G., Sadzot, B., Salmon, E., Depresseux, J.C., Grisar, T., Peters,
J.M., Guillaume, M., Quaglia, L., Delfiore, G., Lamotte, D., 1986.
Regional cerebral blood flow and metabolic rates in human focal
epilepsy and status epilepticus. Adv. Neurol. 44, 935–948.
Franck, G., Salmon, E., Sadzot, B., Maquet, P., 1989. Epilepsy: the use of
oxygen-15-labeled gases. Semin. Neurol. 9 (4), 307–316.
Gaillard, W.D., Fazilat, S., White, S., Malow, B., Sato, S., Reeves, P.,
Herscovitch, P., Theodore, W.H., 1995. Interictal metabolism and blood
flow are uncoupled in temporal lobe cortex of patients with complex
partial epilepsy. Neurology 45 (10), 1841–1847.
Gaillard, W.D., Zeffiro, T., Fazilat, S., DeCarli, C., Theodore, W.H., 1996.
Effect of valproate on cerebral metabolism and blood flow: an 18F-2-
deoxyglucose and 15O water positron emission tomography study.
Epilepsia 37 (6), 515–521.
Gerloff, C., Cohen, L.G., Floeter, M.K., Chen, R., Corwell, B., Hallett, M.,
1998. Inhibitory influence of the ipsilateral motor cortex on responses to
stimulation of the human cortex and pyramidal tract. J. Physiol. 510 (1),
249–259.
Gloor, P., 1978. Generalized epilepsy with bilateral synchronous spike and
wave discharge. New findings concerning its physiological mechanisms.
Electroencephalogr. Clin. Neurophysiol., Suppl. 34, 245–249.
Grisar, T., Lakaye, B., Thomas, E., Bettendorf, L., Minet, A., 1999. The
molecular neuron–glia couple and epileptogenesis. Adv. Neurol. 79,
591–602.
Grubb, R., Phelps, M., Eichling, J., 1974. The effects of vascular changes in
PaCO2on cerebral blood volume, blood flow and vascular mean transit
time. Stroke 5, 630–639.
Gutierrez-Delicado, E., Serratosa, J.M., 2004. Genetics of the epilepsies.
Curr. Opin. Neurol. 17 (2), 147–153 Apr.).
Haginoya, K., Munakata, M., Kato, R., Yokoyama, H., Ishizuka, M.,
Iinuma, K., 2002. Ictal cerebral haemodynamics of childhood epilepsy
measured with near-infrared spectrophotometry. Brain 125, 1960–1971.
Hamzei, F., Dettmers, C., Rzanny, R., Liepert, J., Buechel, C., Weiller, C.,
2002. Reduction of excitability (‘‘inhibition’’) in the ipsilateral primary
motor cortex is mirrored by fMRI signal decreases. NeuroImage 17,
490–496.
Hoge, R.D., Atkinson, J., Gill, B., Crelier, G., Marrett, S., Pike, G.,
1999. Investigation of BOLD signal dependence on CBF and CMRO2:
the deoxyhemoglobin dilution model. Magn. Reson. Med. 42 (5),
849–863.
Huang-Hellinger, F.R., Breiter, H.C., McCormack, G., Cohen, M.S.,
Kwong, K.K., Sutton, J.P., Savoy, R.L., Weiskoff, R.M., Davis, T.L.,
Baker, J.R., Belliveau, J.W., Rosen, B.R., 1995. Simultaneous func-
tional magnetic resonance imaging and electrophysiological recording.
Hum. Brain Mapp. 3, 13–23.
Huettel, S.A., McKeown, M.J., Song, A.W., Hart, S., Spencer, D.D.,
Allison, T., McCarthy, G., 2004. Linking hemodynamic and electro-
physiological measures of brain activity: evidence from functional MRI
and intracranial field potentials. Cereb. Cortex 14 (2), 165–173.
Ives, J.R., Warach, S., Schmitt, F., Edelman, R.R., Schomer, D.L., 1993.
Monitoring the patient’s EEG during echo planar MRI. Electro-
encephalogr. Clin. Neurophysiol. 87 (6), 417–420.
Jager, L., Werhahn, K.J., Hoffmann, A., Berthold, S., Scholz, V., Weber, J.,
Noachtar, S., Reiser, M., 2002. Focal epileptiform activity in the brain:
detection with spike-related functional MR imaging—Preliminary
results. Radiology 223 (3), 860–869.
Janszky, J., Fogarasi, A., Jokeit, H., Schulz, R., Hoppe, M., Ebner, A.,
2001. Spatiotemporal relationship between seizure activity and interictal
spikes in temporal lobe epilepsy. Epilepsy Res. 47 (3), 179–188.
Jensen, M.S., Yaari, Y., 1997. Role of intrinsic burst firing, potassium
accumulation, and electrical coupling in the elevated potassium model
of hippocampal epilepsy. J. Neurophysiol. 77 (3), 1224–1233.
Josephs, O., Turner, R., Friston, K., 1997. Event-related fMRI. Hum. Brain
Mapp. 5, 1–7.
Kang, J.K., Benar, C.G., Al-Asmi, A., Khani, Y.A., Pike, G.B., Dubeau, F.,
Gotman, J., 2003. Using patient-specific hemodynamic response
functions in combined EEG-fMRI studies in epilepsy. NeuroImage 20
(2), 1162–1170.
Kanner, A.M., Kaydanova, Y., de Toledo-Morrell, L., Morrell, F., Smith,
M.C., Bergen, D., Pierre-Louis, S.J., Ristanovic, R., 1995. Tailored
anterior temporal lobectomy. Relation between extent of resection of
mesial structures and postsurgical seizure outcome. Arch. Neurol. 52
(2), 173–178.
Kapucu, L.O., Serdaroglu, A., Okuyaz, C., Kose, G., Gucuyener, K.,
2003. Brain single photon emission computed tomographic evaluation
of patients with childhood absence epilepsy. J. Child. Neurol. 18 (8),
542–548.
Kastrup, A., Krueger, G., Neumann-Haefelin, T., Glover, G., Moseley,
M.E., 2002. Changes of cerebral blood flow, oxygenation and oxidative
metabolism during graded motor activation. NeuroImage 15, 74–82.
Kelly, P.A., McCulloch, J., 1983. The effects of the GABAergic agonist
muscimol upon the relationship between local cerebral blood flow and
glucose utilization. Brain Res. 258 (2), 338–342.
Kim, S.-K., Lee, D.S., Lee, S.K., Kim, Y.K., Kang, K.W., Chung, C.K.,
Chung, J.-K., Myung, C.L., 2001. Diagnostic performance of
[18F]FDG-PET and ictal [99mTc]-HMPAO SPECT in occipital lobe
epilepsy. Epilepsia 42 (12), 1531–1540.
Krakow, K., Woermann, F.G., Symms, M.R., Allen, P.J., Lemieux, L.,
Barker, G.J., Duncan, J.S., Fish, D.R., 1999. EEG-triggered functional
MRI of interictal epileptiform activity in patients with partial seizures.
Brain 122, 1679–1688.
Kreisman, N.R., LaManna, J.C., Rosenthal, M., Sick, T.J., 1981. Oxidative
metabolic responses with recurrent seizures in rat cerebral cortex: role
of systemic factors. Brain Res. 218 (1–2), 175–188.
Kreisman, N.R., Rosenthal, M., Sick, T.J., LaManna, J.C., 1983. Oxidative
metabolic responses during recurrent seizures are independent of
convulsant, anesthetic, or species. Neurology 33 (7), 861–867.
Kuhl, D.E., Engel, J., Phelps, M.E., Selin, C., 1980. Epileptic patterns of
local cerebral metabolism and perfusion in humans determined by
emission computed tomography of 18 FDG and 13N-H3. Ann. Neurol.
8 (4), 348–360.

B. Stefanovic et al. / NeuroImage 28 (2005) 205–215 215
Lazeyras, F., Blanke, O., Perrig, S., Zimine, I., Golay, X., Delavelle, J.,
Michel, C.M., de Tribolet, N., Villemure, J.G., Seeck, M., 2000. EEG-
triggered functional MRI in patients with pharmacoresistant epilepsy.
J. Magn. Reson. Imaging 12 (1), 177–185.
Lee, B.I., Markand, O.N., Siddiqui, A.R., Park, H.M., Mock, B., Wellman,
H.H., Worth, R.M., Edwards, M.K., 1986. Single photon emission
computed tomography (SPECT) brain imaging using N,N,NV-trimethyl-
NV-(2 hydroxy-3-methyl-5-123I-iodobenzyl)-1,3-propanediamine 2 HCl
(HIPDM): intractable complex partial seizures. Neurology 36 (11),
1471–1477.
Leiderman, D.B., Balish, M., Bromfield, E.B., Theodore, W.H., 1991.
Effect of valproate on human cerebral glucose metabolism. Epilepsia 32
(3), 417–422.
Lemieux, L., Salek-Haddadi, A., Josephs, O., Allen, P., Toms, N., Scott, C.,
Krakow, K., Turner, R., Fish, D.R., 2001. Event-related fMRI with
simultaneous and continuous EEG: description of the method and initial
case report. NeuroImage 14 (3), 780–787.
Liepert, J., Dettmers, C., Terborg, C., Weiller, C., 2001. Inhibition of
ipsilateral motor cortex during phasic generation of low force. Clin.
Neurophysiol. 112, 114–121.
Logothetis, N., Pauls, J., Augath, M., Trinath, T., Oeltermann, A., 2001.
Neurophysiological investigation of the basis of the fMRI signal. Nature
412, 150–157.
Loscher, W., 1979. GABA in plasma and cerebrospinal fluid of different
species. Effects of gamma-acetylenic GABA, gamma-vinyl GABA and
sodium valproate. J. Neurochem. 32 (5), 1587–1591.
Loscher, W., 1981. Valproate induced changes in GABA metabolism at the
subcellular level. Biochem. Pharmacol. 30 (11), 1364–1366.
Macdonald, R.L., Gallagher, M.J., Feng, H.J., Kang, J., 2004.
GABA(A) receptor epilepsy mutations. Biochem. Pharmacol. 68
(8), 1497–1506.
Matsumoto, H., Ajmone Marsan, C., 1964a. Cortical cellular phenomena in
experimental epilepsy: ictal manifestations. Exp. Neurol. 25, 305–326.
Matsumoto, H., Ajmone Marsan, C., 1964b. Cortical cellular phenomena
in experimental epilepsy: interictal manifestations. Exp. Neurol. 80,
286–304.
McKhann, G.M., Schoenfeld-McNeill, J., Born, D.E., Haglund, M.M.,
Ojemann, G.A., 2000. Intraoperative hippocampal electrocorticography
to predict the extent of hippocampal resection in temporal lobe epilepsy
surgery. J. Neurosurg. 93 (1), 44–52.
Metrakos, K., Metrakos, J.D., 1961. Genetics of convulsive disorders:
II. Genetic and electroencephalographic studies in centrencephalic
epilepsy. Neurology 11, 474–483.
Netz, J., Ziemann, U., Hoemberg, V., 1995. Hemispheric asymmetry of
transcallosal inhibition in man. Exp. Brain Res. 104, 527–533.
Ochs, R.F., Gloor, P., Tyler, J.L., Wolfson, T., Worsley, K., Andermann, F.,
Diksic, M., Meyer, E., Evans, A., 1987. Effect of generalized spike-and-
wave discharge on glucose metabolism measured by positron emission
tomography. Ann. Neurol. 21 (5), 458–464.
Palfreyman, M.G., Huot, S., Grove, J., 1983. Total GABA and homo-
carnosine in CSF as indices of brain GABA concentrations. Neurosci.
Lett. 35 (2), 161–166.
Patel, M.R., Blum, A., Pearlman, J.D., Yousuf, N., Ives, J.R., Saeteng, S.,
Schomer, D.L., Edelman, R.R., 1999. Echo-planar functional MR
imaging of epilepsy with concurrent EEG monitoring. Am. J. Neuro-
radiol. 20 (10), 1916–1919.
Penfield, W., Jasper, H., 1954. Epilepsy and the Functional Anatomy of the
Human Brain. Little, Brown and Company, Boston, MA.
Petroff, O.A., Rothman, D.L., Behar, K.L., Collins, T.L., Mattson, R.H.,
1996. Human brain GABA levels rise rapidly after initiation of
vigabatrin therapy. Neurology 47 (6), 1567–1571.
Press, W.H., Teukolsky, S.A., Vetterling, W.T., Flannery, B.P., 1992.
Numerical Recipes in C: The Art of Scientific Computing, 2nd edition.
Cambridge University Press, New York, pp. 666–670 (Chapt. 15).
Prevett, M.C., Duncan, J.S., Jones, T., Fish, D.R., Brooks, D.J., 1995.
Demonstration of thalamic activation during typical absence seizures
using H2(15)O and PET. Neurology 45 (7), 1396–1402.
Rosenow, F., Luders, H., 2001. Presurgical evaluation of epilepsy. Epilepsia
42 (12), 1515–1522.
Salek-Haddadi, A., Friston, K.J., Lemieux, L., Fish, D.R., 2003a. Studying
spontaneous EEG activity with fMRI. Brain Res. Rev. 43 (1), 110–133.
Salek-Haddadi, A., Lemieux, L., Merschhemke, M., Friston, K.J., Duncan,
J.S., Fish, D.R., 2003b. Functional magnetic resonance imaging of
human absence seizures. Ann. Neurol. 53 (5), 663–667.
Savic, I., Osterman, Y., Helms, G., 2004. MRS shows syndrome diffe-
rentiated metabolite changes in human-generalized epilepsies. Neuro-
Image 21 (1), 163–172.
Seeck, M., Lazeyras, F., Michel, C.M., Blanke, O., Gericke, C.A., Ives, J.,
Delavelle, J., Golay, X., Haenggeli, C.A., de Tribolet, N., Landis, T.,
1998. Non-invasive epileptic focus localization using EEG-triggered
functional MRI and electromagnetic tomography. Electroencephalogr.
Clin. Neurophysiol. 106, 508–512.
Spanaki, M.V., Siegel, H., Kopylev, L., Fazilat, S., Dean, A., Liow, K., Ben-
Menachem, E., Gaillard, W.D., Theodore, W.H., 1999. The effect of
vigabatrin (gamma-vinyl GABA) on cerebral blood flow and metabo-
lism. Neurology 53 (7), 1518–1522.
Sperling, M.R., Skolnick, B.E., 1995. Cerebral blood flow during spike-
wave discharges. Epilepsia 36 (2), 156–163.
Stefanovic, B., Warnking, J.M., Pike, G.B., 2004. Hemodynamic and
metabolic responses to neuronal inhibition. NeuroImage 22 (2),
771–778.
Szaflarski, J.P., Holland, S.K., Schmithorst, V.J., Dunn, R.S., Privitera,
M.D., 2004. High-resolution functional MRI at 3 T in healthy and
epilepsy subjects: hippocampal activation with picture encoding task.
Epilepsy Behav. 5 (2), 244–252.
Tassinari, C.A., Cincotta, M., Zaccara, G., Michelucci, R., 2003. Trans-
cranial magnetic stimulation and epilepsy. Clin. Neurophysiol. 114 (5),
777–798.
Theodore, W.H., 1988. Antiepileptic drugs and cerebral glucose metabo-
lism. Epilepsia 29S2, S48–S55.
Theodore, W.H., Brooks, R., Margolin, R., Patronas, N., Sato, S., Porter,
R.J., Mansi, L., Bairamian, D., DiChiro, G., 1985. Positron emission
tomography in generalized seizures. Neurology 35 (5), 684–690.
Theodore, W.H., Bromfield, E., Onorati, L., 1989. The effect of
carbamazepine on cerebral glucose metabolism. Ann. Neurol. 25 (5),
516–520.
Warach, S., Ives, J.R., Schlaug, G., Patel, M.R., Darby, D.G., Thangaraj, V.,
Edelman, R.R., Schomer, D.L., 1996. EEG-triggered echo-planar
functional MRI in epilepsy. Neurology 47 (1), 89–93.
Warnking, J.M., Pike, G.B., 2004. Bandwidth-modulated adiabatic RF
pulses for uniform selective saturation and inversion. Magn. Reson.
Med. 52 (5), 1190–1199.
Wong, E., Buxton, R., Frank, L., 1997. Implementation of quantitative
perfusion imaging techniques for functional brain mapping using pulsed
arterial spin labeling. NMR Biomed. 10, 237–249.
Worsley, K., Liao, C., Aston, J., Petre, V., Duncan, G., Morales, F., Evans,
A., 2002. A general statistical analysis for fMRI data. NeuroImage 15,
1–15.


