Embed Size (px)
Citation preview
PLEASE SCROLL DOWN FOR ARTICLE
This article was downloaded by: [TÜBİTAK EKUAL]On: 17 December 2009Access details: Access Details: [subscription number 772815469]Publisher Taylor & FrancisInforma Ltd Registered in England and Wales Registered Number: 1072954 Registered office: Mortimer House, 37-41 Mortimer Street, London W1T 3JH, UK
Environmental ForensicsPublication details, including instructions for authors and subscription information:http://www.informaworld.com/smpp/title~content=t713770863
Sources and Wet Deposition Fluxes of Polycyclic Aromatic Hydrocarbons(PAHs) in an Urban Site 1000 Meters High in Central Anatolia (Turkey)Eftade O. Gaga a; Gürdal Tuncel b; Semra G. Tuncel a
a Department of Chemistry, Middle East Technical University, Ankara, Turkey b Department ofEnvironmental Engineering, Middle East Technical University, Ankara, Turkey
First published on: 16 December 2009
To cite this Article Gaga, Eftade O., Tuncel, Gürdal and Tuncel, Semra G.(2009) 'Sources and Wet Deposition Fluxes ofPolycyclic Aromatic Hydrocarbons (PAHs) in an Urban Site 1000 Meters High in Central Anatolia (Turkey)',Environmental Forensics, 10: 4, 286 — 298, First published on: 16 December 2009 (iFirst)To link to this Article: DOI: 10.1080/15275920903347594URL: http://dx.doi.org/10.1080/15275920903347594
Full terms and conditions of use: http://www.informaworld.com/terms-and-conditions-of-access.pdf
This article may be used for research, teaching and private study purposes. Any substantial orsystematic reproduction, re-distribution, re-selling, loan or sub-licensing, systematic supply ordistribution in any form to anyone is expressly forbidden.
The publisher does not give any warranty express or implied or make any representation that the contentswill be complete or accurate or up to date. The accuracy of any instructions, formulae and drug dosesshould be independently verified with primary sources. The publisher shall not be liable for any loss,actions, claims, proceedings, demand or costs or damages whatsoever or howsoever caused arising directlyor indirectly in connection with or arising out of the use of this material.
Environmental Forensics, 10:286–298, 2009Copyright C© Taylor & Francis Group, LLCISSN: 1527–5922 print / 1527–5930 onlineDOI: 10.1080/15275920903347594
Sources and Wet Deposition Fluxes of Polycyclic AromaticHydrocarbons (PAHs) in an Urban Site 1000 Meters Highin Central Anatolia (Turkey)
Eftade O. Gaga,1 Gurdal Tuncel,2 and Semra G. Tuncel1
1Department of Chemistry, Middle East Technical University, Ankara, Turkey2Department of Environmental Engineering, Middle East Technical University, Ankara, Turkey
Wet-only precipitation samples were collected using an Andersen wet only sampler (Andersen Samplers, Inc., Atlanta, GA, USA),between December 2000 and June 2002, in Ankara, Turkey. Polycyclic aromatic hydrocarbons (PAHs) were first pre-concentratedusing solid phase (SPE) and ultrasonic extraction procedures. They were then analyzed using gas chromatography–mass spectrom-etry (GC–MS). Phenanthrene (Phe), fluoranthene (Flt), benzo (b+k) fluoranthene (B (b+k) F) and pyrene (Pyr) were the majorcomponents of
∑14PAH concentrations during both winter and summer seasons. Concentrations of PAHs did not show a sta-
tistically significant relation with meteorological parameters, such as mixing height, wind speed, and wind direction. However,they showed a strong linear relation with the ventilation coefficient (VC), signifying the importance of local sources on measuredPAH concentrations. Concentrations of PAHs in winter season were higher than their corresponding concentrations in summerseason due to seasonal variations in meteorology and emissions. Sources of PAHs in rainwater were apportioned using principalcomponent analysis. Three factors with eigenvalues > 1.0 were extracted. The two factors that explained the largest fraction ofsystem variance represented coal and gas combustion whereas the third factor represented motor vehicles. Half of the rain eventsaccounted for approximately 90% of the wet deposition fluxes of PAHs, demonstrating the highly episodic nature of wet PAHdeposition.
Keywords: polycyclic aromatic hydrocarbons (PAHs), deposition, flux, ventilation coefficient, rain water
Polycyclic aromatic hydrocarbons (PAHs) have attracted atten-tion in recent decades due to their toxic and carcinogenic effectsand their persistence in the environment. Metabolites of somehigh molecular weight PAHs, such as benzo (a) anthracene,chrysene, benzo (b+k) fluoranthene and benzo (a) pyrene, werereported to be mutagens for fish, mammals and humans (Parket al., 2001; Zedeck, 1980).
PAHs are produced by incomplete combustion or pyrolysisof organic material such as oil, petroleum gas, coal and wood(Chang et al., 2006). Major anthropogenic PAH sources includemotor vehicle exhaust, industrial processes, natural gas, do-mestic heating systems and incinerators (Mastral et al., 2003;Grynkiewicz et al., 2002). A large fraction of PAHs is initiallyin the gas phase and then they are adsorbed to existing particles.The PAHs with lower molecular weight are more volatile. Forthis reason, light PAHs occur largely in the gas phase. In con-trast, heavy PAHs are associated with particles (Ollivon et al.,2002; Manoli et al., 2000). Light PAHs are also less carcino-
Received October 31, 2008; accepted July 4, 2009.Address correspondence to Eftade O. Gaga, Department of Envi-
ronmental Engineering, Anadolu University, Eskisehir 26555, Turkey.E-mail: [email protected]
genic than heavier PAHs (Chang et al., 2006). In rainwater, lowmolecular weight PAHs occur in the dissolved and heavy PAHsin particulate fractions of rain (Garban et al., 2002; Ollivon et al.,2002; Park et al., 2002; Pekey at al., 2007; Golomb et al., 2001;Motelay-Massei et al., 2007; Manoli et al., 2000; Azimi et al.,2005).
Concentrations of 16 PAH compounds were measured insoluble and insoluble fractions of 62 wet-only rain samplescollected in Ankara between December 2000 and June 2002.Wet only samples refers collection of only wet deposition (rain,snow) samples, excluding dry deposition.
Ankara is the capital of Turkey with approximately 4,660,000inhabitants with limited industrial activity. The city sufferedfrom heavy air pollution due to coal combustion for space heat-ing until the 1990s (Yatin et al., 2000). Although use of naturalgas gradually replaced use of coal and oil in some districts ofthe city after the 1990s, coal has been widely used for domes-tic heating in some districts of Ankara. Drinking water wassupplied from few dams in Ankara and atmospheric input viawet and dry deposition affects the water quality. Due to theircarcinogenic and toxicological properties, it is also importantto calculate wet deposition fluxes of PAHs in water resources.In this manuscript, sources responsible for the observed PAHlevels in rain and factors that affect their temporal variations
286
Downloaded By: [TÜBTAK EKUAL] At: 13:46 17 December 2009
Polycyclic Aromatic Hydrocarbons 287
are discussed. Effect of meteorological parameters on rainwaterPAH concentrations were also investigated in detail.
Materials and Methods
Sampling
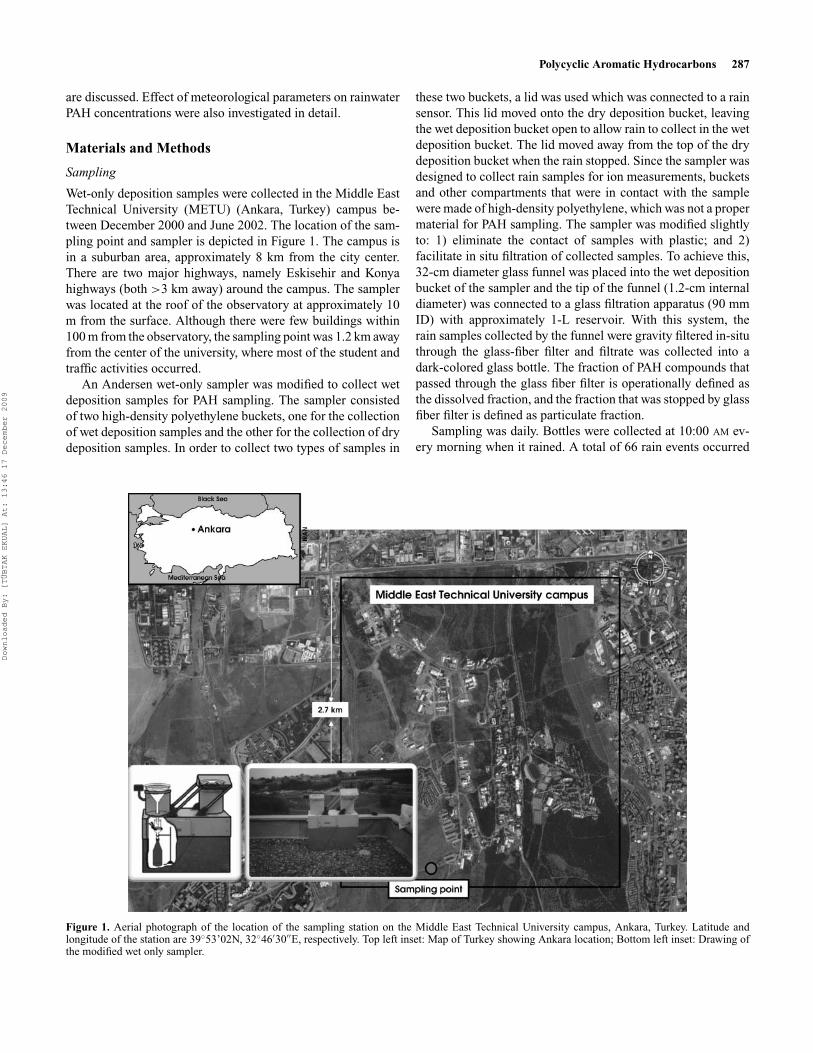
Wet-only deposition samples were collected in the Middle EastTechnical University (METU) (Ankara, Turkey) campus be-tween December 2000 and June 2002. The location of the sam-pling point and sampler is depicted in Figure 1. The campus isin a suburban area, approximately 8 km from the city center.There are two major highways, namely Eskisehir and Konyahighways (both >3 km away) around the campus. The samplerwas located at the roof of the observatory at approximately 10m from the surface. Although there were few buildings within100 m from the observatory, the sampling point was 1.2 km awayfrom the center of the university, where most of the student andtraffic activities occurred.
An Andersen wet-only sampler was modified to collect wetdeposition samples for PAH sampling. The sampler consistedof two high-density polyethylene buckets, one for the collectionof wet deposition samples and the other for the collection of drydeposition samples. In order to collect two types of samples in
these two buckets, a lid was used which was connected to a rainsensor. This lid moved onto the dry deposition bucket, leavingthe wet deposition bucket open to allow rain to collect in the wetdeposition bucket. The lid moved away from the top of the drydeposition bucket when the rain stopped. Since the sampler wasdesigned to collect rain samples for ion measurements, bucketsand other compartments that were in contact with the samplewere made of high-density polyethylene, which was not a propermaterial for PAH sampling. The sampler was modified slightlyto: 1) eliminate the contact of samples with plastic; and 2)facilitate in situ filtration of collected samples. To achieve this,32-cm diameter glass funnel was placed into the wet depositionbucket of the sampler and the tip of the funnel (1.2-cm internaldiameter) was connected to a glass filtration apparatus (90 mmID) with approximately 1-L reservoir. With this system, therain samples collected by the funnel were gravity filtered in-situthrough the glass-fiber filter and filtrate was collected into adark-colored glass bottle. The fraction of PAH compounds thatpassed through the glass fiber filter is operationally defined asthe dissolved fraction, and the fraction that was stopped by glassfiber filter is defined as particulate fraction.
Sampling was daily. Bottles were collected at 10:00 AM ev-ery morning when it rained. A total of 66 rain events occurred
Figure 1. Aerial photograph of the location of the sampling station on the Middle East Technical University campus, Ankara, Turkey. Latitude andlongitude of the station are 39◦53’02N, 32◦46′30′′E, respectively. Top left inset: Map of Turkey showing Ankara location; Bottom left inset: Drawing ofthe modified wet only sampler.
Downloaded By: [TÜBTAK EKUAL] At: 13:46 17 December 2009
288 Gaga et al.
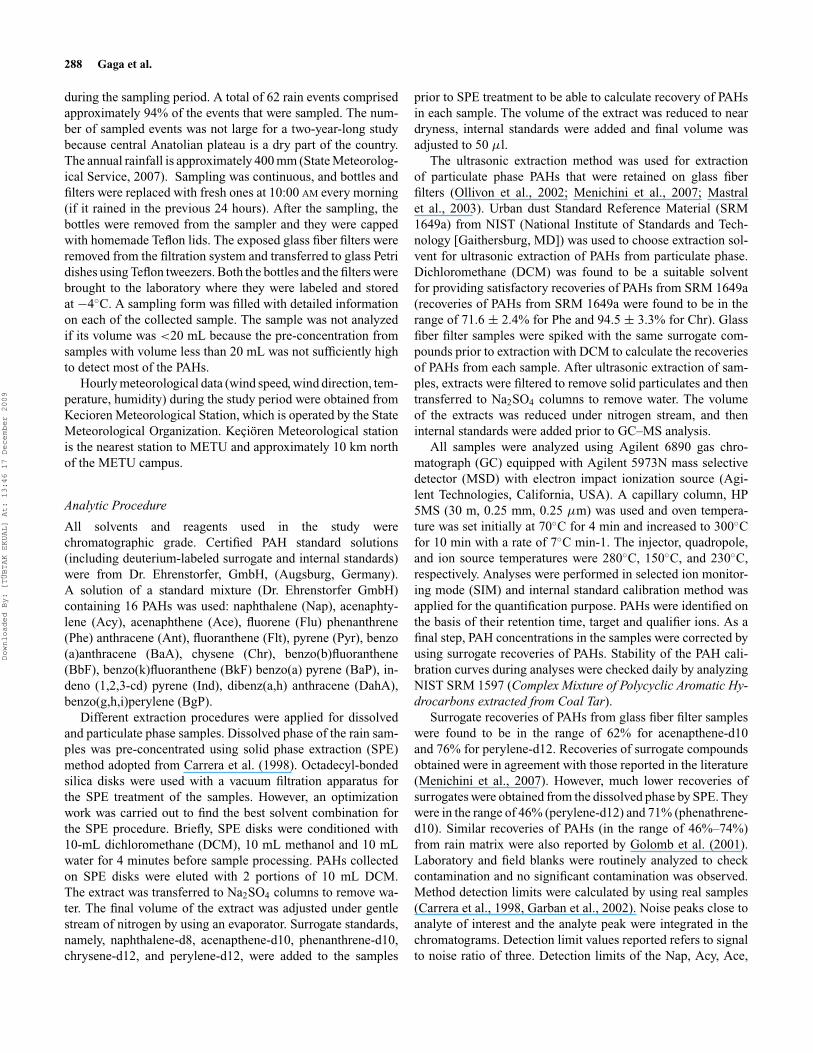
during the sampling period. A total of 62 rain events comprisedapproximately 94% of the events that were sampled. The num-ber of sampled events was not large for a two-year-long studybecause central Anatolian plateau is a dry part of the country.The annual rainfall is approximately 400 mm (State Meteorolog-ical Service, 2007). Sampling was continuous, and bottles andfilters were replaced with fresh ones at 10:00 AM every morning(if it rained in the previous 24 hours). After the sampling, thebottles were removed from the sampler and they were cappedwith homemade Teflon lids. The exposed glass fiber filters wereremoved from the filtration system and transferred to glass Petridishes using Teflon tweezers. Both the bottles and the filters werebrought to the laboratory where they were labeled and storedat −4◦C. A sampling form was filled with detailed informationon each of the collected sample. The sample was not analyzedif its volume was <20 mL because the pre-concentration fromsamples with volume less than 20 mL was not sufficiently highto detect most of the PAHs.
Hourly meteorological data (wind speed, wind direction, tem-perature, humidity) during the study period were obtained fromKecioren Meteorological Station, which is operated by the StateMeteorological Organization. Kecioren Meteorological stationis the nearest station to METU and approximately 10 km northof the METU campus.
Analytic Procedure
All solvents and reagents used in the study werechromatographic grade. Certified PAH standard solutions(including deuterium-labeled surrogate and internal standards)were from Dr. Ehrenstorfer, GmbH, (Augsburg, Germany).A solution of a standard mixture (Dr. Ehrenstorfer GmbH)containing 16 PAHs was used: naphthalene (Nap), acenaphty-lene (Acy), acenaphthene (Ace), fluorene (Flu) phenanthrene(Phe) anthracene (Ant), fluoranthene (Flt), pyrene (Pyr), benzo(a)anthracene (BaA), chysene (Chr), benzo(b)fluoranthene(BbF), benzo(k)fluoranthene (BkF) benzo(a) pyrene (BaP), in-deno (1,2,3-cd) pyrene (Ind), dibenz(a,h) anthracene (DahA),benzo(g,h,i)perylene (BgP).
Different extraction procedures were applied for dissolvedand particulate phase samples. Dissolved phase of the rain sam-ples was pre-concentrated using solid phase extraction (SPE)method adopted from Carrera et al. (1998). Octadecyl-bondedsilica disks were used with a vacuum filtration apparatus forthe SPE treatment of the samples. However, an optimizationwork was carried out to find the best solvent combination forthe SPE procedure. Briefly, SPE disks were conditioned with10-mL dichloromethane (DCM), 10 mL methanol and 10 mLwater for 4 minutes before sample processing. PAHs collectedon SPE disks were eluted with 2 portions of 10 mL DCM.The extract was transferred to Na2SO4 columns to remove wa-ter. The final volume of the extract was adjusted under gentlestream of nitrogen by using an evaporator. Surrogate standards,namely, naphthalene-d8, acenapthene-d10, phenanthrene-d10,chrysene-d12, and perylene-d12, were added to the samples
prior to SPE treatment to be able to calculate recovery of PAHsin each sample. The volume of the extract was reduced to neardryness, internal standards were added and final volume wasadjusted to 50 µl.
The ultrasonic extraction method was used for extractionof particulate phase PAHs that were retained on glass fiberfilters (Ollivon et al., 2002; Menichini et al., 2007; Mastralet al., 2003). Urban dust Standard Reference Material (SRM1649a) from NIST (National Institute of Standards and Tech-nology [Gaithersburg, MD]) was used to choose extraction sol-vent for ultrasonic extraction of PAHs from particulate phase.Dichloromethane (DCM) was found to be a suitable solventfor providing satisfactory recoveries of PAHs from SRM 1649a(recoveries of PAHs from SRM 1649a were found to be in therange of 71.6 ± 2.4% for Phe and 94.5 ± 3.3% for Chr). Glassfiber filter samples were spiked with the same surrogate com-pounds prior to extraction with DCM to calculate the recoveriesof PAHs from each sample. After ultrasonic extraction of sam-ples, extracts were filtered to remove solid particulates and thentransferred to Na2SO4 columns to remove water. The volumeof the extracts was reduced under nitrogen stream, and theninternal standards were added prior to GC–MS analysis.
All samples were analyzed using Agilent 6890 gas chro-matograph (GC) equipped with Agilent 5973N mass selectivedetector (MSD) with electron impact ionization source (Agi-lent Technologies, California, USA). A capillary column, HP5MS (30 m, 0.25 mm, 0.25 µm) was used and oven tempera-ture was set initially at 70◦C for 4 min and increased to 300◦Cfor 10 min with a rate of 7◦C min-1. The injector, quadropole,and ion source temperatures were 280◦C, 150◦C, and 230◦C,respectively. Analyses were performed in selected ion monitor-ing mode (SIM) and internal standard calibration method wasapplied for the quantification purpose. PAHs were identified onthe basis of their retention time, target and qualifier ions. As afinal step, PAH concentrations in the samples were corrected byusing surrogate recoveries of PAHs. Stability of the PAH cali-bration curves during analyses were checked daily by analyzingNIST SRM 1597 (Complex Mixture of Polycyclic Aromatic Hy-drocarbons extracted from Coal Tar).
Surrogate recoveries of PAHs from glass fiber filter sampleswere found to be in the range of 62% for acenapthene-d10and 76% for perylene-d12. Recoveries of surrogate compoundsobtained were in agreement with those reported in the literature(Menichini et al., 2007). However, much lower recoveries ofsurrogates were obtained from the dissolved phase by SPE. Theywere in the range of 46% (perylene-d12) and 71% (phenathrene-d10). Similar recoveries of PAHs (in the range of 46%–74%)from rain matrix were also reported by Golomb et al. (2001).Laboratory and field blanks were routinely analyzed to checkcontamination and no significant contamination was observed.Method detection limits were calculated by using real samples(Carrera et al., 1998, Garban et al., 2002). Noise peaks close toanalyte of interest and the analyte peak were integrated in thechromatograms. Detection limit values reported refers to signalto noise ratio of three. Detection limits of the Nap, Acy, Ace,
Downloaded By: [TÜBTAK EKUAL] At: 13:46 17 December 2009
Polycyclic Aromatic Hydrocarbons 289
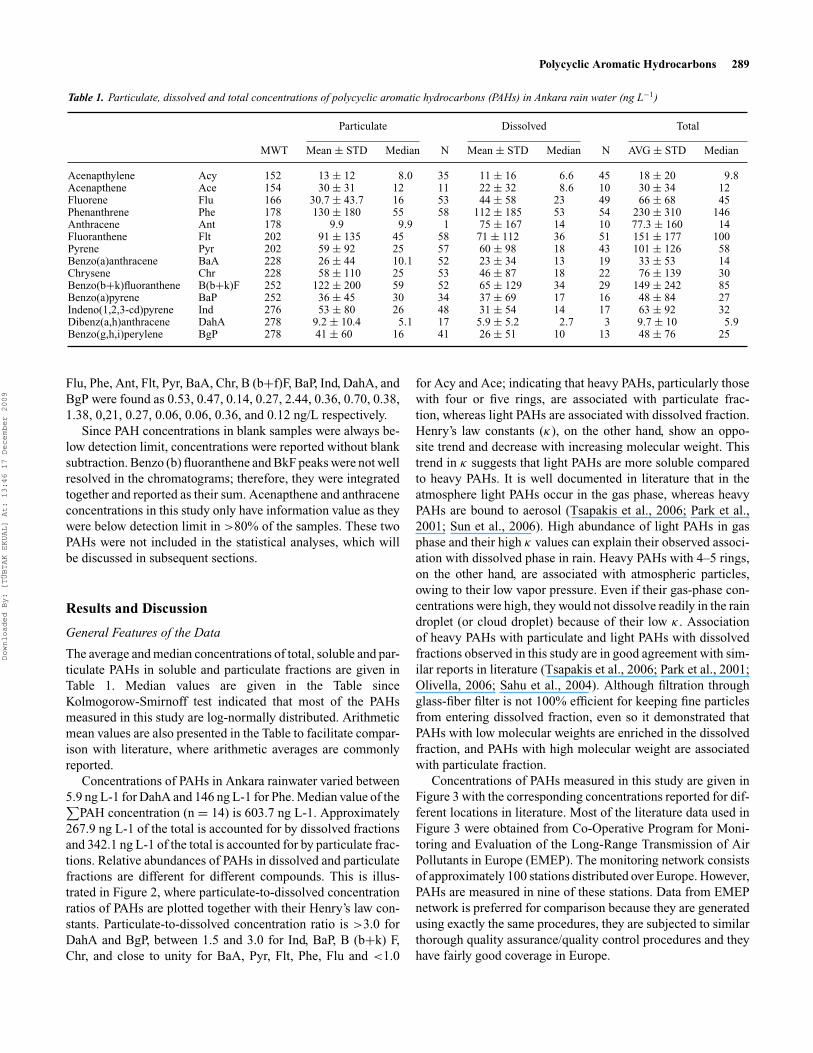
Table 1. Particulate, dissolved and total concentrations of polycyclic aromatic hydrocarbons (PAHs) in Ankara rain water (ng L−1)
Particulate Dissolved Total
MWT Mean ± STD Median N Mean ± STD Median N AVG ± STD Median
Acenapthylene Acy 152 13 ± 12 8.0 35 11 ± 16 6.6 45 18 ± 20 9.8Acenapthene Ace 154 30 ± 31 12 11 22 ± 32 8.6 10 30 ± 34 12Fluorene Flu 166 30.7 ± 43.7 16 53 44 ± 58 23 49 66 ± 68 45Phenanthrene Phe 178 130 ± 180 55 58 112 ± 185 53 54 230 ± 310 146Anthracene Ant 178 9.9 9.9 1 75 ± 167 14 10 77.3 ± 160 14Fluoranthene Flt 202 91 ± 135 45 58 71 ± 112 36 51 151 ± 177 100Pyrene Pyr 202 59 ± 92 25 57 60 ± 98 18 43 101 ± 126 58Benzo(a)anthracene BaA 228 26 ± 44 10.1 52 23 ± 34 13 19 33 ± 53 14Chrysene Chr 228 58 ± 110 25 53 46 ± 87 18 22 76 ± 139 30Benzo(b+k)fluoranthene B(b+k)F 252 122 ± 200 59 52 65 ± 129 34 29 149 ± 242 85Benzo(a)pyrene BaP 252 36 ± 45 30 34 37 ± 69 17 16 48 ± 84 27Indeno(1,2,3-cd)pyrene Ind 276 53 ± 80 26 48 31 ± 54 14 17 63 ± 92 32Dibenz(a,h)anthracene DahA 278 9.2 ± 10.4 5.1 17 5.9 ± 5.2 2.7 3 9.7 ± 10 5.9Benzo(g,h,i)perylene BgP 278 41 ± 60 16 41 26 ± 51 10 13 48 ± 76 25
Flu, Phe, Ant, Flt, Pyr, BaA, Chr, B (b+f)F, BaP, Ind, DahA, andBgP were found as 0.53, 0.47, 0.14, 0.27, 2.44, 0.36, 0.70, 0.38,1.38, 0,21, 0.27, 0.06, 0.06, 0.36, and 0.12 ng/L respectively.
Since PAH concentrations in blank samples were always be-low detection limit, concentrations were reported without blanksubtraction. Benzo (b) fluoranthene and BkF peaks were not wellresolved in the chromatograms; therefore, they were integratedtogether and reported as their sum. Acenapthene and anthraceneconcentrations in this study only have information value as theywere below detection limit in >80% of the samples. These twoPAHs were not included in the statistical analyses, which willbe discussed in subsequent sections.
Results and Discussion
General Features of the Data
The average and median concentrations of total, soluble and par-ticulate PAHs in soluble and particulate fractions are given inTable 1. Median values are given in the Table sinceKolmogorow-Smirnoff test indicated that most of the PAHsmeasured in this study are log-normally distributed. Arithmeticmean values are also presented in the Table to facilitate compar-ison with literature, where arithmetic averages are commonlyreported.
Concentrations of PAHs in Ankara rainwater varied between5.9 ng L-1 for DahA and 146 ng L-1 for Phe. Median value of the∑
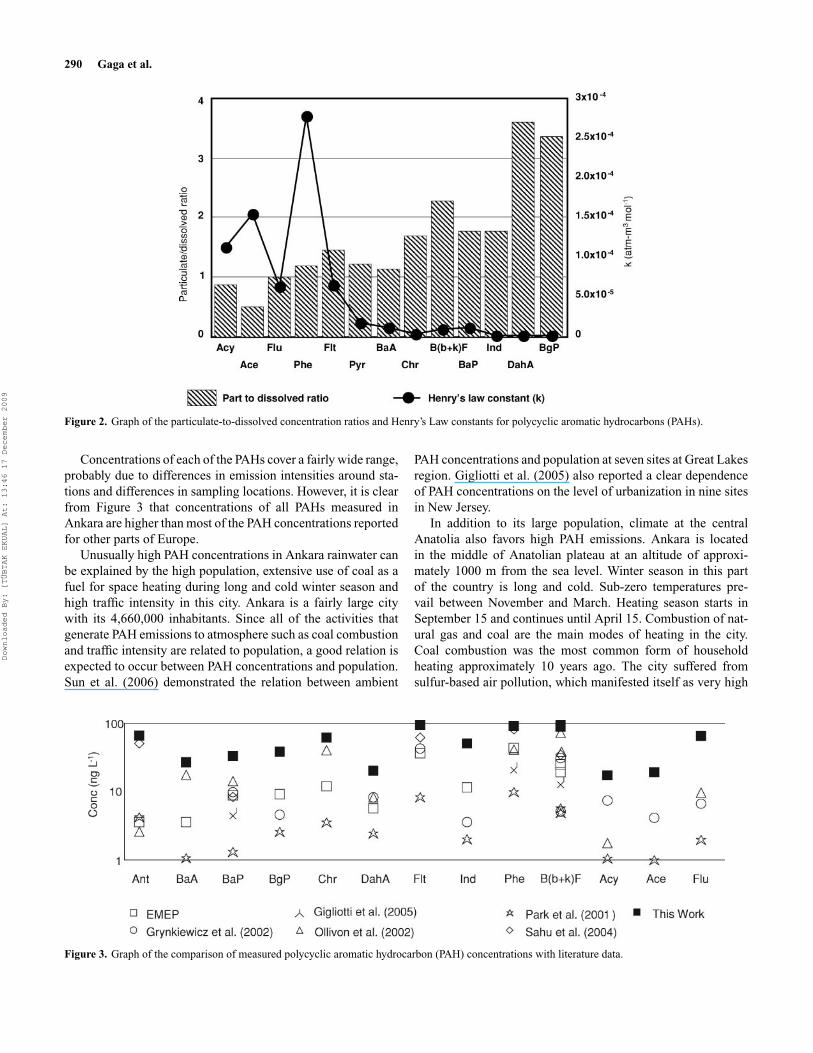
PAH concentration (n = 14) is 603.7 ng L-1. Approximately267.9 ng L-1 of the total is accounted for by dissolved fractionsand 342.1 ng L-1 of the total is accounted for by particulate frac-tions. Relative abundances of PAHs in dissolved and particulatefractions are different for different compounds. This is illus-trated in Figure 2, where particulate-to-dissolved concentrationratios of PAHs are plotted together with their Henry’s law con-stants. Particulate-to-dissolved concentration ratio is >3.0 forDahA and BgP, between 1.5 and 3.0 for Ind, BaP, B (b+k) F,Chr, and close to unity for BaA, Pyr, Flt, Phe, Flu and <1.0
for Acy and Ace; indicating that heavy PAHs, particularly thosewith four or five rings, are associated with particulate frac-tion, whereas light PAHs are associated with dissolved fraction.Henry’s law constants (κ), on the other hand, show an oppo-site trend and decrease with increasing molecular weight. Thistrend in κ suggests that light PAHs are more soluble comparedto heavy PAHs. It is well documented in literature that in theatmosphere light PAHs occur in the gas phase, whereas heavyPAHs are bound to aerosol (Tsapakis et al., 2006; Park et al.,2001; Sun et al., 2006). High abundance of light PAHs in gasphase and their high κ values can explain their observed associ-ation with dissolved phase in rain. Heavy PAHs with 4–5 rings,on the other hand, are associated with atmospheric particles,owing to their low vapor pressure. Even if their gas-phase con-centrations were high, they would not dissolve readily in the raindroplet (or cloud droplet) because of their low κ . Associationof heavy PAHs with particulate and light PAHs with dissolvedfractions observed in this study are in good agreement with sim-ilar reports in literature (Tsapakis et al., 2006; Park et al., 2001;Olivella, 2006; Sahu et al., 2004). Although filtration throughglass-fiber filter is not 100% efficient for keeping fine particlesfrom entering dissolved fraction, even so it demonstrated thatPAHs with low molecular weights are enriched in the dissolvedfraction, and PAHs with high molecular weight are associatedwith particulate fraction.
Concentrations of PAHs measured in this study are given inFigure 3 with the corresponding concentrations reported for dif-ferent locations in literature. Most of the literature data used inFigure 3 were obtained from Co-Operative Program for Moni-toring and Evaluation of the Long-Range Transmission of AirPollutants in Europe (EMEP). The monitoring network consistsof approximately 100 stations distributed over Europe. However,PAHs are measured in nine of these stations. Data from EMEPnetwork is preferred for comparison because they are generatedusing exactly the same procedures, they are subjected to similarthorough quality assurance/quality control procedures and theyhave fairly good coverage in Europe.
Downloaded By: [TÜBTAK EKUAL] At: 13:46 17 December 2009
290 Gaga et al.
Figure 2. Graph of the particulate-to-dissolved concentration ratios and Henry’s Law constants for polycyclic aromatic hydrocarbons (PAHs).
Concentrations of each of the PAHs cover a fairly wide range,probably due to differences in emission intensities around sta-tions and differences in sampling locations. However, it is clearfrom Figure 3 that concentrations of all PAHs measured inAnkara are higher than most of the PAH concentrations reportedfor other parts of Europe.
Unusually high PAH concentrations in Ankara rainwater canbe explained by the high population, extensive use of coal as afuel for space heating during long and cold winter season andhigh traffic intensity in this city. Ankara is a fairly large citywith its 4,660,000 inhabitants. Since all of the activities thatgenerate PAH emissions to atmosphere such as coal combustionand traffic intensity are related to population, a good relation isexpected to occur between PAH concentrations and population.Sun et al. (2006) demonstrated the relation between ambient
PAH concentrations and population at seven sites at Great Lakesregion. Gigliotti et al. (2005) also reported a clear dependenceof PAH concentrations on the level of urbanization in nine sitesin New Jersey.
In addition to its large population, climate at the centralAnatolia also favors high PAH emissions. Ankara is locatedin the middle of Anatolian plateau at an altitude of approxi-mately 1000 m from the sea level. Winter season in this partof the country is long and cold. Sub-zero temperatures pre-vail between November and March. Heating season starts inSeptember 15 and continues until April 15. Combustion of nat-ural gas and coal are the main modes of heating in the city.Coal combustion was the most common form of householdheating approximately 10 years ago. The city suffered fromsulfur-based air pollution, which manifested itself as very high
Figure 3. Graph of the comparison of measured polycyclic aromatic hydrocarbon (PAH) concentrations with literature data.
Downloaded By: [TÜBTAK EKUAL] At: 13:46 17 December 2009
Polycyclic Aromatic Hydrocarbons 291
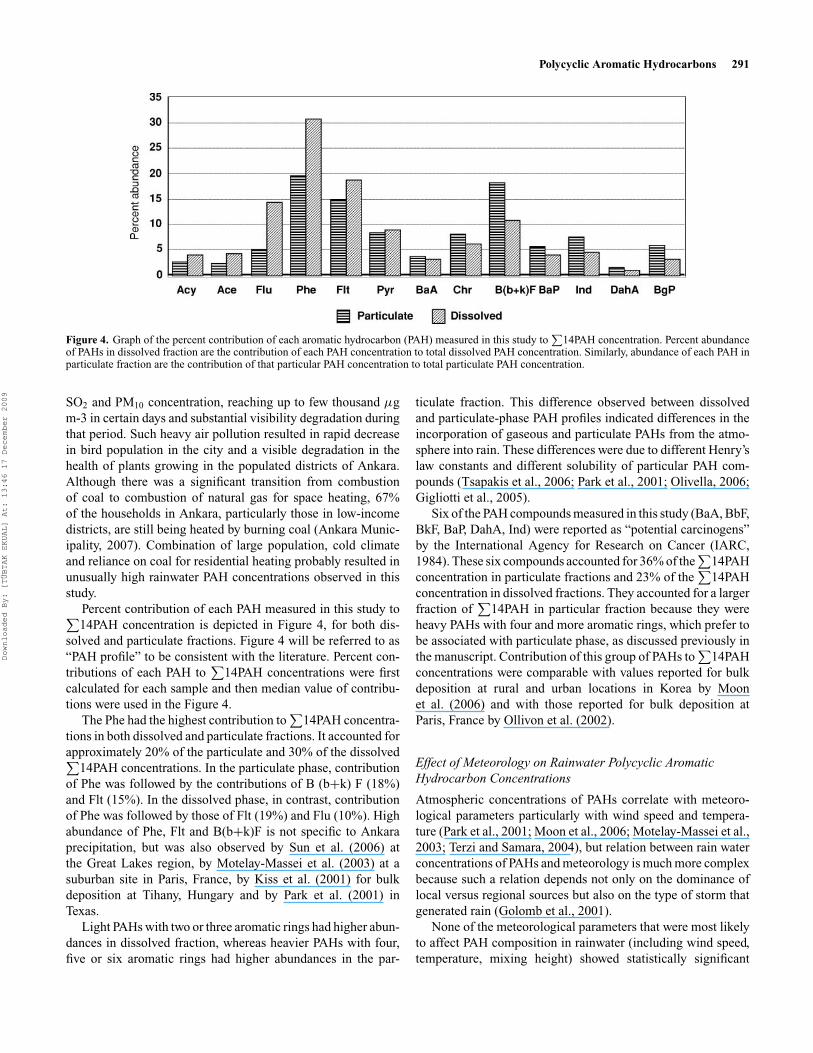
Figure 4. Graph of the percent contribution of each aromatic hydrocarbon (PAH) measured in this study to∑
14PAH concentration. Percent abundanceof PAHs in dissolved fraction are the contribution of each PAH concentration to total dissolved PAH concentration. Similarly, abundance of each PAH inparticulate fraction are the contribution of that particular PAH concentration to total particulate PAH concentration.
SO2 and PM10 concentration, reaching up to few thousand µgm-3 in certain days and substantial visibility degradation duringthat period. Such heavy air pollution resulted in rapid decreasein bird population in the city and a visible degradation in thehealth of plants growing in the populated districts of Ankara.Although there was a significant transition from combustionof coal to combustion of natural gas for space heating, 67%of the households in Ankara, particularly those in low-incomedistricts, are still being heated by burning coal (Ankara Munic-ipality, 2007). Combination of large population, cold climateand reliance on coal for residential heating probably resulted inunusually high rainwater PAH concentrations observed in thisstudy.
Percent contribution of each PAH measured in this study to∑14PAH concentration is depicted in Figure 4, for both dis-
solved and particulate fractions. Figure 4 will be referred to as“PAH profile” to be consistent with the literature. Percent con-tributions of each PAH to
∑14PAH concentrations were first
calculated for each sample and then median value of contribu-tions were used in the Figure 4.
The Phe had the highest contribution to∑
14PAH concentra-tions in both dissolved and particulate fractions. It accounted forapproximately 20% of the particulate and 30% of the dissolved∑
14PAH concentrations. In the particulate phase, contributionof Phe was followed by the contributions of B (b+k) F (18%)and Flt (15%). In the dissolved phase, in contrast, contributionof Phe was followed by those of Flt (19%) and Flu (10%). Highabundance of Phe, Flt and B(b+k)F is not specific to Ankaraprecipitation, but was also observed by Sun et al. (2006) atthe Great Lakes region, by Motelay-Massei et al. (2003) at asuburban site in Paris, France, by Kiss et al. (2001) for bulkdeposition at Tihany, Hungary and by Park et al. (2001) inTexas.
Light PAHs with two or three aromatic rings had higher abun-dances in dissolved fraction, whereas heavier PAHs with four,five or six aromatic rings had higher abundances in the par-
ticulate fraction. This difference observed between dissolvedand particulate-phase PAH profiles indicated differences in theincorporation of gaseous and particulate PAHs from the atmo-sphere into rain. These differences were due to different Henry’slaw constants and different solubility of particular PAH com-pounds (Tsapakis et al., 2006; Park et al., 2001; Olivella, 2006;Gigliotti et al., 2005).
Six of the PAH compounds measured in this study (BaA, BbF,BkF, BaP, DahA, Ind) were reported as “potential carcinogens”by the International Agency for Research on Cancer (IARC,1984). These six compounds accounted for 36% of the
∑14PAH
concentration in particulate fractions and 23% of the∑
14PAHconcentration in dissolved fractions. They accounted for a largerfraction of
∑14PAH in particular fraction because they were
heavy PAHs with four and more aromatic rings, which prefer tobe associated with particulate phase, as discussed previously inthe manuscript. Contribution of this group of PAHs to
∑14PAH
concentrations were comparable with values reported for bulkdeposition at rural and urban locations in Korea by Moonet al. (2006) and with those reported for bulk deposition atParis, France by Ollivon et al. (2002).
Effect of Meteorology on Rainwater Polycyclic AromaticHydrocarbon Concentrations
Atmospheric concentrations of PAHs correlate with meteoro-logical parameters particularly with wind speed and tempera-ture (Park et al., 2001; Moon et al., 2006; Motelay-Massei et al.,2003; Terzi and Samara, 2004), but relation between rain waterconcentrations of PAHs and meteorology is much more complexbecause such a relation depends not only on the dominance oflocal versus regional sources but also on the type of storm thatgenerated rain (Golomb et al., 2001).
None of the meteorological parameters that were most likelyto affect PAH composition in rainwater (including wind speed,temperature, mixing height) showed statistically significant
Downloaded By: [TÜBTAK EKUAL] At: 13:46 17 December 2009
292 Gaga et al.
(>95% confidence) relation with measured PAH concentrations.However, PAH concentrations showed strong correlation withthe ventilation coefficient (VC). The VC is the product of windspeed and mixing height, which is the height of the verticalvolume of air where pollutants can mix and disperse above theearth’s surface (Godish, 2004). The VC was demonstrated tobe a good indicator of assimilation capacity of the atmosphere(Goyal et al., 2006; Krishna et al., 2004; Gupta et al., 2003).In Ankara, ventilation coefficient was shown to be negativelyand strongly related with the city pollution index (Genc, 2005).Ventilation coefficient was also reported to be a better indicatorfor the meteorological conditions that result in accumulation ordispersion of pollutants than both wind speed and mixing heightalone (Genc, 2005). A detailed discussion on the relation be-tween VC and concentrations of PAHs measured in this study isgiven later in the manuscript.
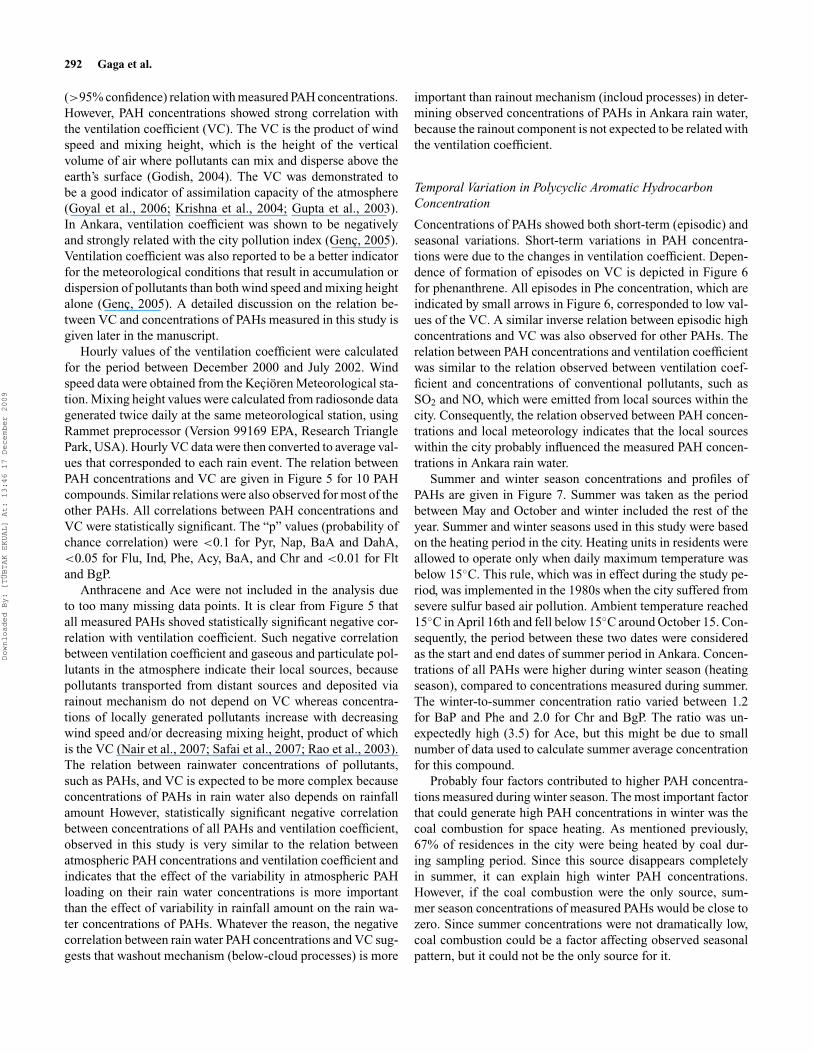
Hourly values of the ventilation coefficient were calculatedfor the period between December 2000 and July 2002. Windspeed data were obtained from the Kecioren Meteorological sta-tion. Mixing height values were calculated from radiosonde datagenerated twice daily at the same meteorological station, usingRammet preprocessor (Version 99169 EPA, Research TrianglePark, USA). Hourly VC data were then converted to average val-ues that corresponded to each rain event. The relation betweenPAH concentrations and VC are given in Figure 5 for 10 PAHcompounds. Similar relations were also observed for most of theother PAHs. All correlations between PAH concentrations andVC were statistically significant. The “p” values (probability ofchance correlation) were <0.1 for Pyr, Nap, BaA and DahA,<0.05 for Flu, Ind, Phe, Acy, BaA, and Chr and <0.01 for Fltand BgP.
Anthracene and Ace were not included in the analysis dueto too many missing data points. It is clear from Figure 5 thatall measured PAHs shoved statistically significant negative cor-relation with ventilation coefficient. Such negative correlationbetween ventilation coefficient and gaseous and particulate pol-lutants in the atmosphere indicate their local sources, becausepollutants transported from distant sources and deposited viarainout mechanism do not depend on VC whereas concentra-tions of locally generated pollutants increase with decreasingwind speed and/or decreasing mixing height, product of whichis the VC (Nair et al., 2007; Safai et al., 2007; Rao et al., 2003).The relation between rainwater concentrations of pollutants,such as PAHs, and VC is expected to be more complex becauseconcentrations of PAHs in rain water also depends on rainfallamount However, statistically significant negative correlationbetween concentrations of all PAHs and ventilation coefficient,observed in this study is very similar to the relation betweenatmospheric PAH concentrations and ventilation coefficient andindicates that the effect of the variability in atmospheric PAHloading on their rain water concentrations is more importantthan the effect of variability in rainfall amount on the rain wa-ter concentrations of PAHs. Whatever the reason, the negativecorrelation between rain water PAH concentrations and VC sug-gests that washout mechanism (below-cloud processes) is more
important than rainout mechanism (incloud processes) in deter-mining observed concentrations of PAHs in Ankara rain water,because the rainout component is not expected to be related withthe ventilation coefficient.
Temporal Variation in Polycyclic Aromatic HydrocarbonConcentration
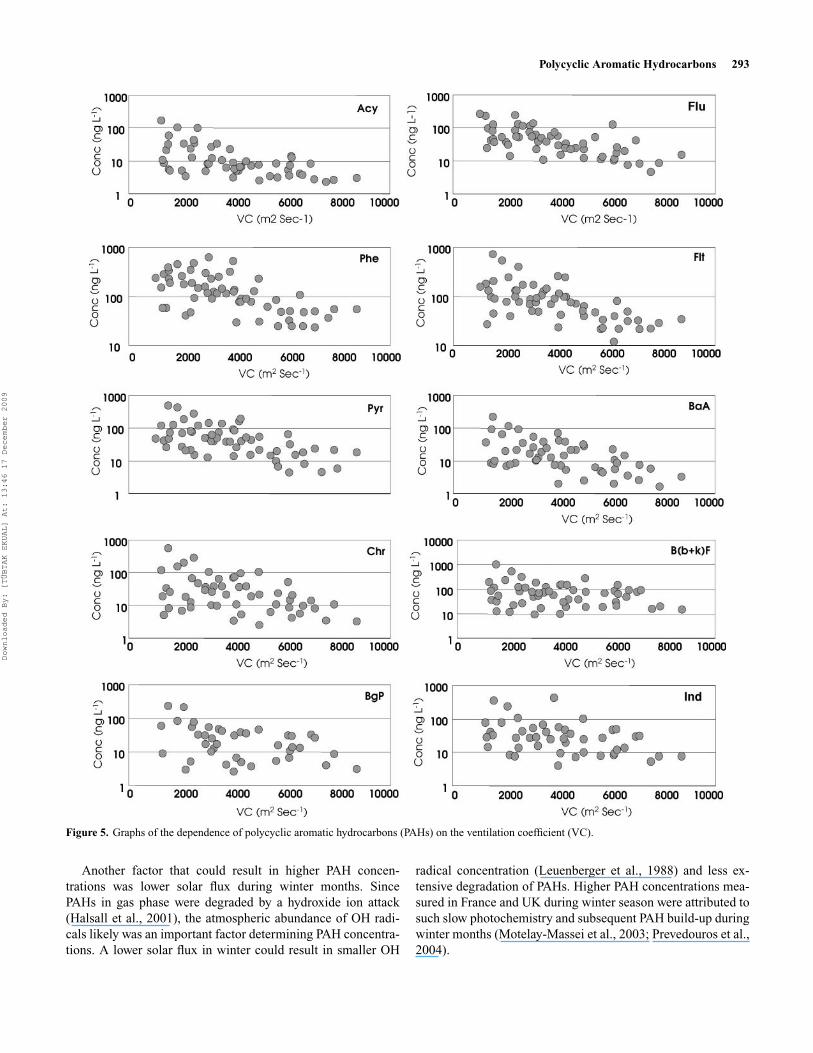
Concentrations of PAHs showed both short-term (episodic) andseasonal variations. Short-term variations in PAH concentra-tions were due to the changes in ventilation coefficient. Depen-dence of formation of episodes on VC is depicted in Figure 6for phenanthrene. All episodes in Phe concentration, which areindicated by small arrows in Figure 6, corresponded to low val-ues of the VC. A similar inverse relation between episodic highconcentrations and VC was also observed for other PAHs. Therelation between PAH concentrations and ventilation coefficientwas similar to the relation observed between ventilation coef-ficient and concentrations of conventional pollutants, such asSO2 and NO, which were emitted from local sources within thecity. Consequently, the relation observed between PAH concen-trations and local meteorology indicates that the local sourceswithin the city probably influenced the measured PAH concen-trations in Ankara rain water.
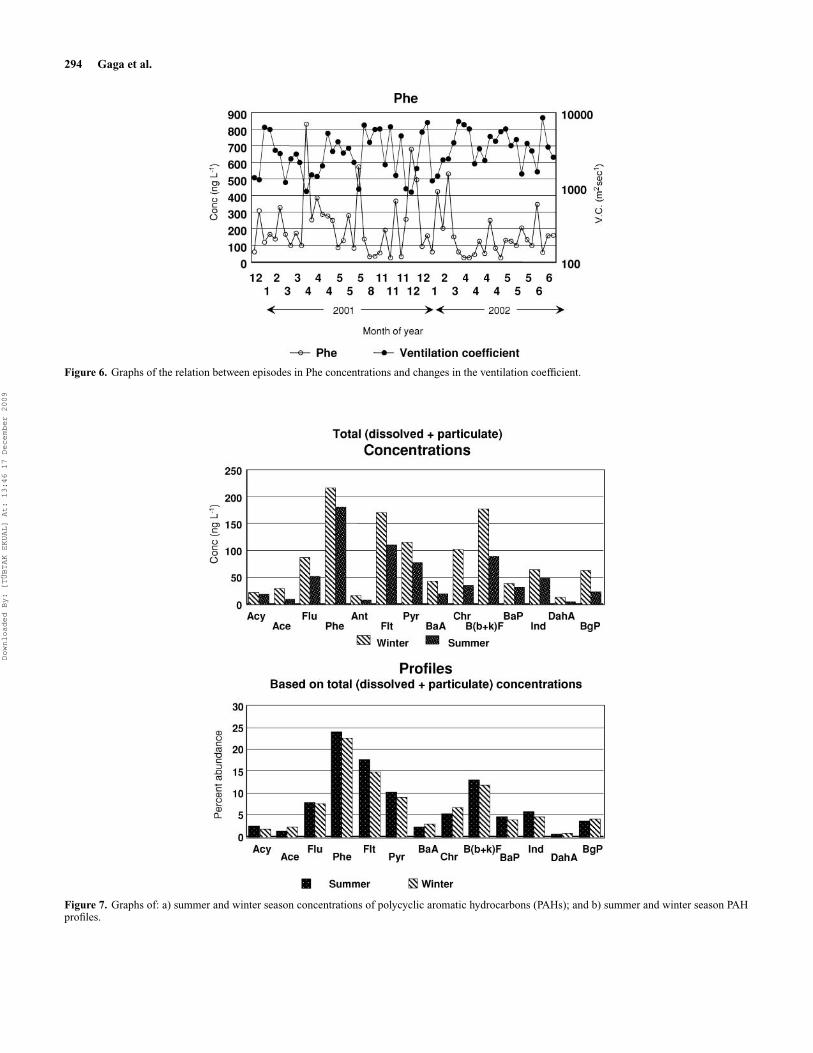
Summer and winter season concentrations and profiles ofPAHs are given in Figure 7. Summer was taken as the periodbetween May and October and winter included the rest of theyear. Summer and winter seasons used in this study were basedon the heating period in the city. Heating units in residents wereallowed to operate only when daily maximum temperature wasbelow 15◦C. This rule, which was in effect during the study pe-riod, was implemented in the 1980s when the city suffered fromsevere sulfur based air pollution. Ambient temperature reached15◦C in April 16th and fell below 15◦C around October 15. Con-sequently, the period between these two dates were consideredas the start and end dates of summer period in Ankara. Concen-trations of all PAHs were higher during winter season (heatingseason), compared to concentrations measured during summer.The winter-to-summer concentration ratio varied between 1.2for BaP and Phe and 2.0 for Chr and BgP. The ratio was un-expectedly high (3.5) for Ace, but this might be due to smallnumber of data used to calculate summer average concentrationfor this compound.
Probably four factors contributed to higher PAH concentra-tions measured during winter season. The most important factorthat could generate high PAH concentrations in winter was thecoal combustion for space heating. As mentioned previously,67% of residences in the city were being heated by coal dur-ing sampling period. Since this source disappears completelyin summer, it can explain high winter PAH concentrations.However, if the coal combustion were the only source, sum-mer season concentrations of measured PAHs would be close tozero. Since summer concentrations were not dramatically low,coal combustion could be a factor affecting observed seasonalpattern, but it could not be the only source for it.
Downloaded By: [TÜBTAK EKUAL] At: 13:46 17 December 2009
Polycyclic Aromatic Hydrocarbons 293
Figure 5. Graphs of the dependence of polycyclic aromatic hydrocarbons (PAHs) on the ventilation coefficient (VC).
Another factor that could result in higher PAH concen-trations was lower solar flux during winter months. SincePAHs in gas phase were degraded by a hydroxide ion attack(Halsall et al., 2001), the atmospheric abundance of OH radi-cals likely was an important factor determining PAH concentra-tions. A lower solar flux in winter could result in smaller OH
radical concentration (Leuenberger et al., 1988) and less ex-tensive degradation of PAHs. Higher PAH concentrations mea-sured in France and UK during winter season were attributed tosuch slow photochemistry and subsequent PAH build-up duringwinter months (Motelay-Massei et al., 2003; Prevedouros et al.,2004).
Downloaded By: [TÜBTAK EKUAL] At: 13:46 17 December 2009
294 Gaga et al.
Figure 6. Graphs of the relation between episodes in Phe concentrations and changes in the ventilation coefficient.
Figure 7. Graphs of: a) summer and winter season concentrations of polycyclic aromatic hydrocarbons (PAHs); and b) summer and winter season PAHprofiles.
Downloaded By: [TÜBTAK EKUAL] At: 13:46 17 December 2009
Polycyclic Aromatic Hydrocarbons 295
The third factor is meteorology, which alone could enhancePAH concentrations in winter. The inverse dependence of PAHconcentrations on ventilation coefficient was demonstrated inthe previous section. In the year 2001, the ventilation coeffi-cients were approximately a factor of 2.7 lower in winter seasonthan in summer, owing to lower mixing height during winter.Such seasonal variation in ventilation coefficient could resultin higher PAH concentrations in winter season. Seasonal varia-tions in meteorology were suggested to be an important reasonfor high winter concentrations of various pollutants in Ankara(Yatın et al., 2000; Genc, 2005) and elsewhere (Czuczwa et al.,1988, Manoli et al., 2000). However, it should be noted thatthe influence of meteorology would be the same for all PAHs.Different winter-to-summer concentration ratios observed fordifferent PAH compounds suggest that meteorology could beone of the factors, but not the sole factor.
Finally, PAH concentrations could be higher during winterseason due to seasonal changes in traffic intensity. Traffic countsin Ankara demonstrated that the number of cars in traffic is ap-proximately 20% lower in summer season, which was attributedto migration of residents to coastal areas for summer vacation(Kuntasal, 2005; Genc, 2005). Season-dependent variation intraffic intensity would reduce motor vehicle-related PAH emis-sions and could contribute to observed seasonal trend in PAHconcentrations. However, seasonal differences observed in con-centrations of all PAHs were higher than 20%, suggesting thathigher traffic intensity in winter could contribute to the observedtrend in PAH concentrations, but it cannot be the only reasonfor it.
The discussion of the observed seasonal trend in PAH con-centrations and possible sources suggested that all of the fourfactors discussed previously probably contributed to higher PAHconcentrations observed during winter months. Relative signif-icance of these potential sources will be discussed in the subse-quent sections.
Summer and winter PAH profiles are depicted in Figure 7b.Unlike concentrations, PAH profiles (percent contributions ofeach PAH compound to total PAH) did not show a significantdifference (with 95% confidence interval) between summer andwinter seasons. Winter-to-summer ratio in percent contributionsof PAHs change between 0.7 and 1.3. This uniformity indicatedthat although concentrations of PAHs were significantly differ-ent between summer and winter seasons, relative contributionsof sources responsible for their observed concentrations did notchange between seasons. Winter and summer profiles has to becompared cautiously, because although we have plenty of sam-ples for winter season, summer PAH profile was based on smallnumber of samples.
Factor Analysis
Factor analysis (FA) with Varimax rotation was applied to PAHconcentration data set to apportion the measured PAH con-centrations to their sources. Missing data for any compounddue to values that were below detection limit were replaced
Table 2. Varimax Rotated Factor Matrix (Factor loadings < 0.2 are notincluded).
Compound Factor 1 Factor 2 Factor 3
Acy 0.39 0.68BaA 0.52 0.73BaP 0.81B(b+k)F 0.79 0.31BgP 0.84Chr 0.80 0.45Flt 0.28 0.79 0.30Ind 0.84Phe 0.8Pyr 0.54 0.53Eigen value 4.35 1.8 1.07Explained variance 43.5 18.1 10.7Total variance 72.3
by the 1/2 detection limit of that PAH compound (Harrisonet al., 1996). Anthracene and Ace, which had missing datapoints in >15% of the samples, were not included in theFA exercise.
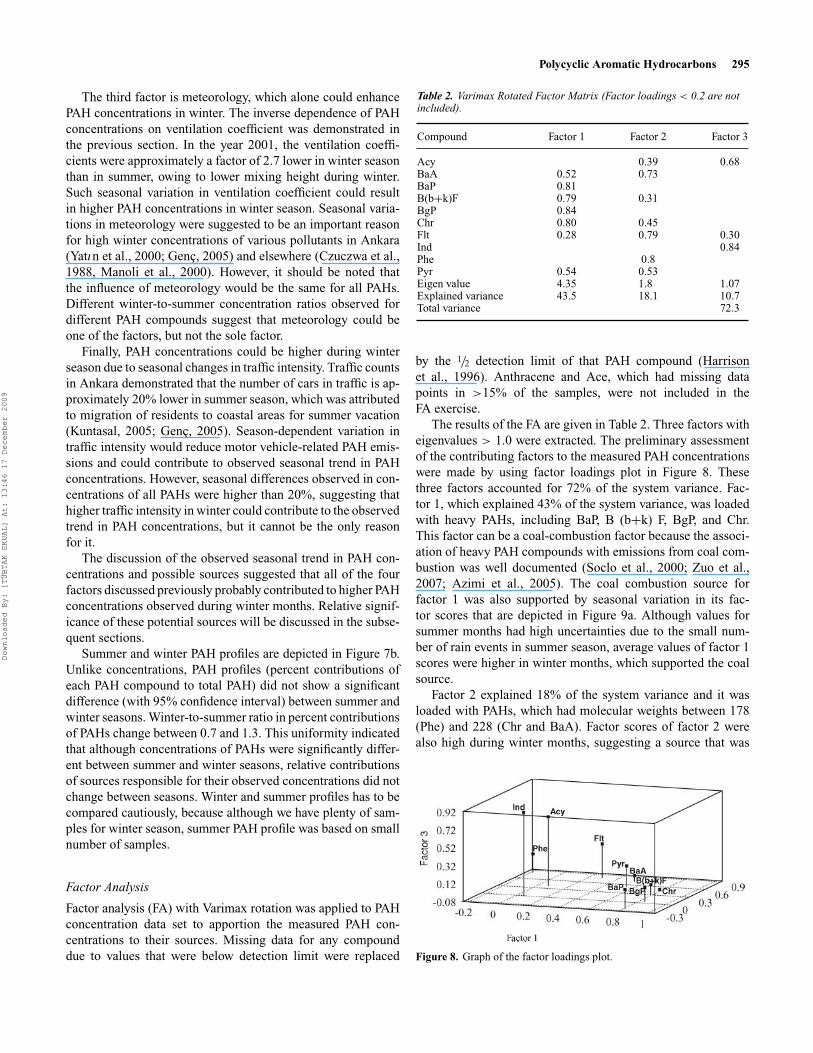
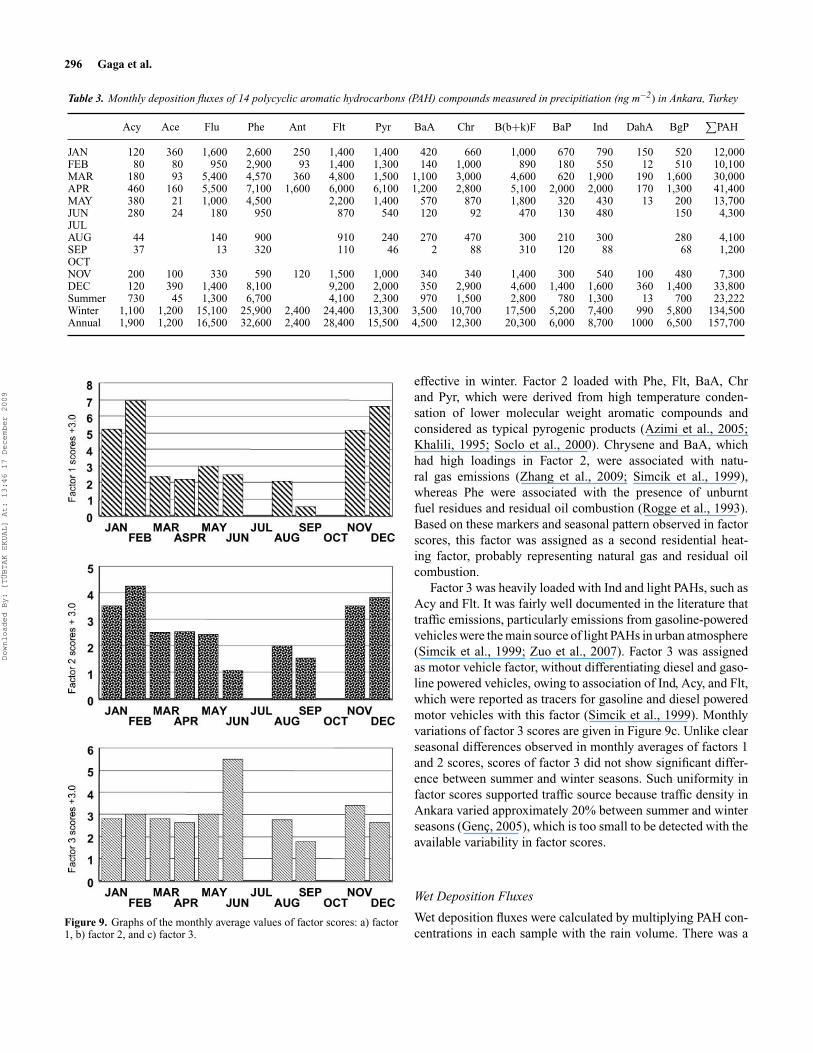
The results of the FA are given in Table 2. Three factors witheigenvalues > 1.0 were extracted. The preliminary assessmentof the contributing factors to the measured PAH concentrationswere made by using factor loadings plot in Figure 8. Thesethree factors accounted for 72% of the system variance. Fac-tor 1, which explained 43% of the system variance, was loadedwith heavy PAHs, including BaP, B (b+k) F, BgP, and Chr.This factor can be a coal-combustion factor because the associ-ation of heavy PAH compounds with emissions from coal com-bustion was well documented (Soclo et al., 2000; Zuo et al.,2007; Azimi et al., 2005). The coal combustion source forfactor 1 was also supported by seasonal variation in its fac-tor scores that are depicted in Figure 9a. Although values forsummer months had high uncertainties due to the small num-ber of rain events in summer season, average values of factor 1scores were higher in winter months, which supported the coalsource.
Factor 2 explained 18% of the system variance and it wasloaded with PAHs, which had molecular weights between 178(Phe) and 228 (Chr and BaA). Factor scores of factor 2 werealso high during winter months, suggesting a source that was
Figure 8. Graph of the factor loadings plot.
Downloaded By: [TÜBTAK EKUAL] At: 13:46 17 December 2009
296 Gaga et al.
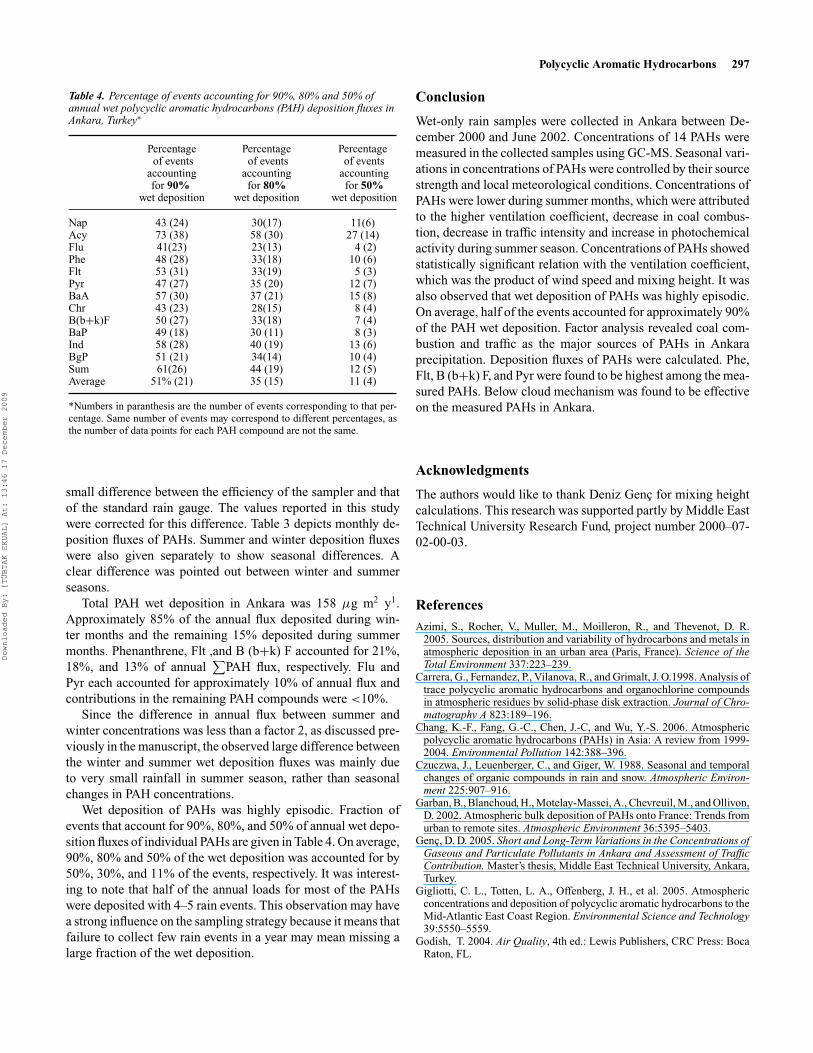
Table 3. Monthly deposition fluxes of 14 polycyclic aromatic hydrocarbons (PAH) compounds measured in precipitiation (ng m−2) in Ankara, Turkey
Acy Ace Flu Phe Ant Flt Pyr BaA Chr B(b+k)F BaP Ind DahA BgP∑
PAH
JAN 120 360 1,600 2,600 250 1,400 1,400 420 660 1,000 670 790 150 520 12,000FEB 80 80 950 2,900 93 1,400 1,300 140 1,000 890 180 550 12 510 10,100MAR 180 93 5,400 4,570 360 4,800 1,500 1,100 3,000 4,600 620 1,900 190 1,600 30,000APR 460 160 5,500 7,100 1,600 6,000 6,100 1,200 2,800 5,100 2,000 2,000 170 1,300 41,400MAY 380 21 1,000 4,500 2,200 1,400 570 870 1,800 320 430 13 200 13,700JUN 280 24 180 950 870 540 120 92 470 130 480 150 4,300JULAUG 44 140 900 910 240 270 470 300 210 300 280 4,100SEP 37 13 320 110 46 2 88 310 120 88 68 1,200OCTNOV 200 100 330 590 120 1,500 1,000 340 340 1,400 300 540 100 480 7,300DEC 120 390 1,400 8,100 9,200 2,000 350 2,900 4,600 1,400 1,600 360 1,400 33,800Summer 730 45 1,300 6,700 4,100 2,300 970 1,500 2,800 780 1,300 13 700 23,222Winter 1,100 1,200 15,100 25,900 2,400 24,400 13,300 3,500 10,700 17,500 5,200 7,400 990 5,800 134,500Annual 1,900 1,200 16,500 32,600 2,400 28,400 15,500 4,500 12,300 20,300 6,000 8,700 1000 6,500 157,700
Figure 9. Graphs of the monthly average values of factor scores: a) factor1, b) factor 2, and c) factor 3.
effective in winter. Factor 2 loaded with Phe, Flt, BaA, Chrand Pyr, which were derived from high temperature conden-sation of lower molecular weight aromatic compounds andconsidered as typical pyrogenic products (Azimi et al., 2005;Khalili, 1995; Soclo et al., 2000). Chrysene and BaA, whichhad high loadings in Factor 2, were associated with natu-ral gas emissions (Zhang et al., 2009; Simcik et al., 1999),whereas Phe were associated with the presence of unburntfuel residues and residual oil combustion (Rogge et al., 1993).Based on these markers and seasonal pattern observed in factorscores, this factor was assigned as a second residential heat-ing factor, probably representing natural gas and residual oilcombustion.
Factor 3 was heavily loaded with Ind and light PAHs, such asAcy and Flt. It was fairly well documented in the literature thattraffic emissions, particularly emissions from gasoline-poweredvehicles were the main source of light PAHs in urban atmosphere(Simcik et al., 1999; Zuo et al., 2007). Factor 3 was assignedas motor vehicle factor, without differentiating diesel and gaso-line powered vehicles, owing to association of Ind, Acy, and Flt,which were reported as tracers for gasoline and diesel poweredmotor vehicles with this factor (Simcik et al., 1999). Monthlyvariations of factor 3 scores are given in Figure 9c. Unlike clearseasonal differences observed in monthly averages of factors 1and 2 scores, scores of factor 3 did not show significant differ-ence between summer and winter seasons. Such uniformity infactor scores supported traffic source because traffic density inAnkara varied approximately 20% between summer and winterseasons (Genc, 2005), which is too small to be detected with theavailable variability in factor scores.
Wet Deposition Fluxes
Wet deposition fluxes were calculated by multiplying PAH con-centrations in each sample with the rain volume. There was a
Downloaded By: [TÜBTAK EKUAL] At: 13:46 17 December 2009
Polycyclic Aromatic Hydrocarbons 297
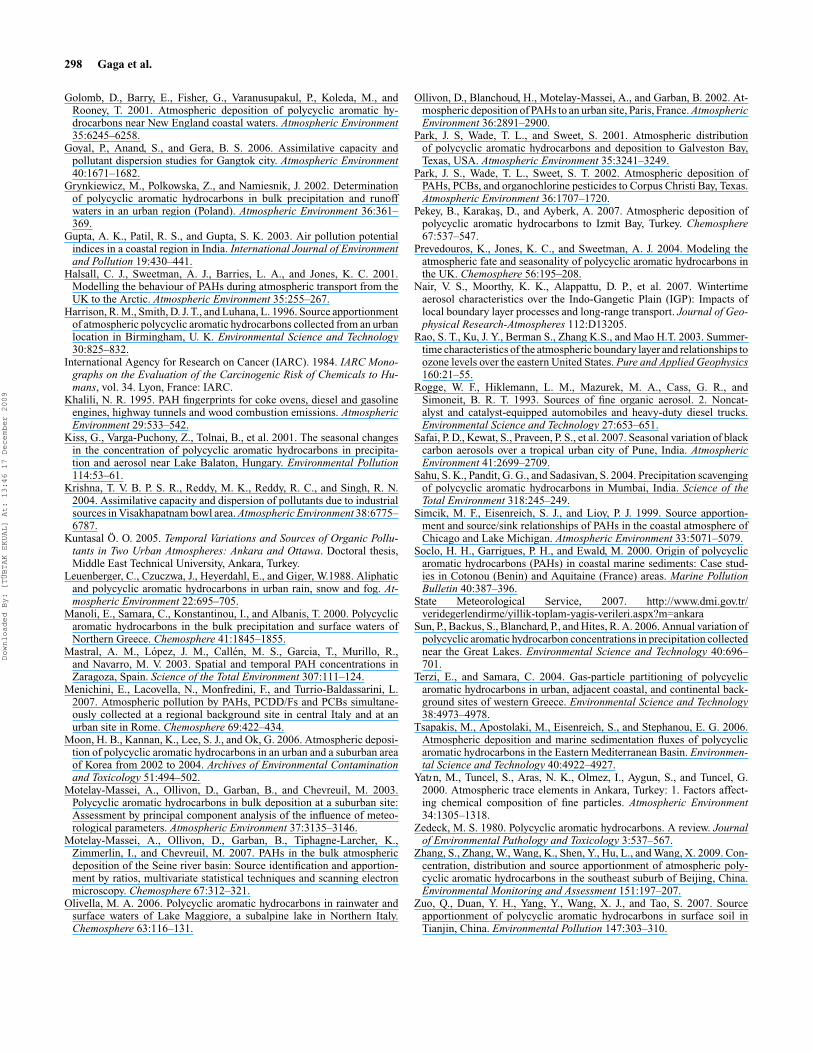
Table 4. Percentage of events accounting for 90%, 80% and 50% ofannual wet polycyclic aromatic hydrocarbons (PAH) deposition fluxes inAnkara, Turkey∗
Percentageof events
accountingfor 90%
wet deposition
Percentageof events
accountingfor 80%
wet deposition
Percentageof events
accountingfor 50%
wet deposition
Nap 43 (24) 30(17) 11(6)Acy 73 (38) 58 (30) 27 (14)Flu 41(23) 23(13) 4 (2)Phe 48 (28) 33(18) 10 (6)Flt 53 (31) 33(19) 5 (3)Pyr 47 (27) 35 (20) 12 (7)BaA 57 (30) 37 (21) 15 (8)Chr 43 (23) 28(15) 8 (4)B(b+k)F 50 (27) 33(18) 7 (4)BaP 49 (18) 30 (11) 8 (3)Ind 58 (28) 40 (19) 13 (6)BgP 51 (21) 34(14) 10 (4)Sum 61(26) 44 (19) 12 (5)Average 51% (21) 35 (15) 11 (4)
*Numbers in paranthesis are the number of events corresponding to that per-centage. Same number of events may correspond to different percentages, asthe number of data points for each PAH compound are not the same.
small difference between the efficiency of the sampler and thatof the standard rain gauge. The values reported in this studywere corrected for this difference. Table 3 depicts monthly de-position fluxes of PAHs. Summer and winter deposition fluxeswere also given separately to show seasonal differences. Aclear difference was pointed out between winter and summerseasons.
Total PAH wet deposition in Ankara was 158 µg m2 y1.Approximately 85% of the annual flux deposited during win-ter months and the remaining 15% deposited during summermonths. Phenanthrene, Flt ,and B (b+k) F accounted for 21%,18%, and 13% of annual
∑PAH flux, respectively. Flu and
Pyr each accounted for approximately 10% of annual flux andcontributions in the remaining PAH compounds were <10%.
Since the difference in annual flux between summer andwinter concentrations was less than a factor 2, as discussed pre-viously in the manuscript, the observed large difference betweenthe winter and summer wet deposition fluxes was mainly dueto very small rainfall in summer season, rather than seasonalchanges in PAH concentrations.
Wet deposition of PAHs was highly episodic. Fraction ofevents that account for 90%, 80%, and 50% of annual wet depo-sition fluxes of individual PAHs are given in Table 4. On average,90%, 80% and 50% of the wet deposition was accounted for by50%, 30%, and 11% of the events, respectively. It was interest-ing to note that half of the annual loads for most of the PAHswere deposited with 4–5 rain events. This observation may havea strong influence on the sampling strategy because it means thatfailure to collect few rain events in a year may mean missing alarge fraction of the wet deposition.
Conclusion
Wet-only rain samples were collected in Ankara between De-cember 2000 and June 2002. Concentrations of 14 PAHs weremeasured in the collected samples using GC-MS. Seasonal vari-ations in concentrations of PAHs were controlled by their sourcestrength and local meteorological conditions. Concentrations ofPAHs were lower during summer months, which were attributedto the higher ventilation coefficient, decrease in coal combus-tion, decrease in traffic intensity and increase in photochemicalactivity during summer season. Concentrations of PAHs showedstatistically significant relation with the ventilation coefficient,which was the product of wind speed and mixing height. It wasalso observed that wet deposition of PAHs was highly episodic.On average, half of the events accounted for approximately 90%of the PAH wet deposition. Factor analysis revealed coal com-bustion and traffic as the major sources of PAHs in Ankaraprecipitation. Deposition fluxes of PAHs were calculated. Phe,Flt, B (b+k) F, and Pyr were found to be highest among the mea-sured PAHs. Below cloud mechanism was found to be effectiveon the measured PAHs in Ankara.
Acknowledgments
The authors would like to thank Deniz Genc for mixing heightcalculations. This research was supported partly by Middle EastTechnical University Research Fund, project number 2000–07-02-00-03.
References
Azimi, S., Rocher, V., Muller, M., Moilleron, R., and Thevenot, D. R.2005. Sources, distribution and variability of hydrocarbons and metals inatmospheric deposition in an urban area (Paris, France). Science of theTotal Environment 337:223–239.
Carrera, G., Fernandez, P., Vilanova, R., and Grimalt, J. O.1998. Analysis oftrace polycyclic aromatic hydrocarbons and organochlorine compoundsin atmospheric residues by solid-phase disk extraction. Journal of Chro-matography A 823:189–196.
Chang, K.-F., Fang, G.-C., Chen, J.-C, and Wu, Y.-S. 2006. Atmosphericpolycyclic aromatic hydrocarbons (PAHs) in Asia: A review from 1999-2004. Environmental Pollution 142:388–396.
Czuczwa, J., Leuenberger, C., and Giger, W. 1988. Seasonal and temporalchanges of organic compounds in rain and snow. Atmospheric Environ-ment 225:907–916.
Garban, B., Blanchoud, H., Motelay-Massei, A., Chevreuil, M., and Ollivon,D. 2002. Atmospheric bulk deposition of PAHs onto France: Trends fromurban to remote sites. Atmospheric Environment 36:5395–5403.
Genc, D. D. 2005. Short and Long-Term Variations in the Concentrations ofGaseous and Particulate Pollutants in Ankara and Assessment of TrafficContribution. Master’s thesis, Middle East Technical University, Ankara,Turkey.
Gigliotti, C. L., Totten, L. A., Offenberg, J. H., et al. 2005. Atmosphericconcentrations and deposition of polycyclic aromatic hydrocarbons to theMid-Atlantic East Coast Region. Environmental Science and Technology39:5550–5559.
Godish, T. 2004. Air Quality, 4th ed.: Lewis Publishers, CRC Press: BocaRaton, FL.
Downloaded By: [TÜBTAK EKUAL] At: 13:46 17 December 2009
298 Gaga et al.
Golomb, D., Barry, E., Fisher, G., Varanusupakul, P., Koleda, M., andRooney, T. 2001. Atmospheric deposition of polycyclic aromatic hy-drocarbons near New England coastal waters. Atmospheric Environment35:6245–6258.
Goyal, P., Anand, S., and Gera, B. S. 2006. Assimilative capacity andpollutant dispersion studies for Gangtok city. Atmospheric Environment40:1671–1682.
Grynkiewicz, M., Polkowska, Z., and Namiesnik, J. 2002. Determinationof polycyclic aromatic hydrocarbons in bulk precipitation and runoffwaters in an urban region (Poland). Atmospheric Environment 36:361–369.
Gupta, A. K., Patil, R. S., and Gupta, S. K. 2003. Air pollution potentialindices in a coastal region in India. International Journal of Environmentand Pollution 19:430–441.
Halsall, C. J., Sweetman, A. J., Barries, L. A., and Jones, K. C. 2001.Modelling the behaviour of PAHs during atmospheric transport from theUK to the Arctic. Atmospheric Environment 35:255–267.
Harrison, R. M., Smith, D. J. T., and Luhana, L. 1996. Source apportionmentof atmospheric polycyclic aromatic hydrocarbons collected from an urbanlocation in Birmingham, U. K. Environmental Science and Technology30:825–832.
International Agency for Research on Cancer (IARC). 1984. IARC Mono-graphs on the Evaluation of the Carcinogenic Risk of Chemicals to Hu-mans, vol. 34. Lyon, France: IARC.
Khalili, N. R. 1995. PAH fingerprints for coke ovens, diesel and gasolineengines, highway tunnels and wood combustion emissions. AtmosphericEnvironment 29:533–542.
Kiss, G., Varga-Puchony, Z., Tolnai, B., et al. 2001. The seasonal changesin the concentration of polycyclic aromatic hydrocarbons in precipita-tion and aerosol near Lake Balaton, Hungary. Environmental Pollution114:53–61.
Krishna, T. V. B. P. S. R., Reddy, M. K., Reddy, R. C., and Singh, R. N.2004. Assimilative capacity and dispersion of pollutants due to industrialsources in Visakhapatnam bowl area. Atmospheric Environment 38:6775–6787.
Kuntasal O. O. 2005. Temporal Variations and Sources of Organic Pollu-tants in Two Urban Atmospheres: Ankara and Ottawa. Doctoral thesis,Middle East Technical University, Ankara, Turkey.
Leuenberger, C., Czuczwa, J., Heyerdahl, E., and Giger, W.1988. Aliphaticand polycyclic aromatic hydrocarbons in urban rain, snow and fog. At-mospheric Environment 22:695–705.
Manoli, E., Samara, C., Konstantinou, I., and Albanis, T. 2000. Polycyclicaromatic hydrocarbons in the bulk precipitation and surface waters ofNorthern Greece. Chemosphere 41:1845–1855.
Mastral, A. M., Lopez, J. M., Callen, M. S., Garcia, T., Murillo, R.,and Navarro, M. V. 2003. Spatial and temporal PAH concentrations inZaragoza, Spain. Science of the Total Environment 307:111–124.
Menichini, E., Lacovella, N., Monfredini, F., and Turrio-Baldassarini, L.2007. Atmospheric pollution by PAHs, PCDD/Fs and PCBs simultane-ously collected at a regional background site in central Italy and at anurban site in Rome. Chemosphere 69:422–434.
Moon, H. B., Kannan, K., Lee, S. J., and Ok, G. 2006. Atmospheric deposi-tion of polycyclic aromatic hydrocarbons in an urban and a suburban areaof Korea from 2002 to 2004. Archives of Environmental Contaminationand Toxicology 51:494–502.
Motelay-Massei, A., Ollivon, D., Garban, B., and Chevreuil, M. 2003.Polycyclic aromatic hydrocarbons in bulk deposition at a suburban site:Assessment by principal component analysis of the influence of meteo-rological parameters. Atmospheric Environment 37:3135–3146.
Motelay-Massei, A., Ollivon, D., Garban, B., Tiphagne-Larcher, K.,Zimmerlin, I., and Chevreuil, M. 2007. PAHs in the bulk atmosphericdeposition of the Seine river basin: Source identification and apportion-ment by ratios, multivariate statistical techniques and scanning electronmicroscopy. Chemosphere 67:312–321.
Olivella, M. A. 2006. Polycyclic aromatic hydrocarbons in rainwater andsurface waters of Lake Maggiore, a subalpine lake in Northern Italy.Chemosphere 63:116–131.
Ollivon, D., Blanchoud, H., Motelay-Massei, A., and Garban, B. 2002. At-mospheric deposition of PAHs to an urban site, Paris, France. AtmosphericEnvironment 36:2891–2900.
Park, J. S, Wade, T. L., and Sweet, S. 2001. Atmospheric distributionof polycyclic aromatic hydrocarbons and deposition to Galveston Bay,Texas, USA. Atmospheric Environment 35:3241–3249.
Park, J. S., Wade, T. L., Sweet, S. T. 2002. Atmospheric deposition ofPAHs, PCBs, and organochlorine pesticides to Corpus Christi Bay, Texas.Atmospheric Environment 36:1707–1720.
Pekey, B., Karakas, D., and Ayberk, A. 2007. Atmospheric deposition ofpolycyclic aromatic hydrocarbons to Izmit Bay, Turkey. Chemosphere67:537–547.
Prevedouros, K., Jones, K. C., and Sweetman, A. J. 2004. Modeling theatmospheric fate and seasonality of polycyclic aromatic hydrocarbons inthe UK. Chemosphere 56:195–208.
Nair, V. S., Moorthy, K. K., Alappattu, D. P., et al. 2007. Wintertimeaerosol characteristics over the Indo-Gangetic Plain (IGP): Impacts oflocal boundary layer processes and long-range transport. Journal of Geo-physical Research-Atmospheres 112:D13205.
Rao, S. T., Ku, J. Y., Berman S., Zhang K.S., and Mao H.T. 2003. Summer-time characteristics of the atmospheric boundary layer and relationships toozone levels over the eastern United States. Pure and Applied Geophysics160:21–55.
Rogge, W. F., Hiklemann, L. M., Mazurek, M. A., Cass, G. R., andSimoneit, B. R. T. 1993. Sources of fine organic aerosol. 2. Noncat-alyst and catalyst-equipped automobiles and heavy-duty diesel trucks.Environmental Science and Technology 27:653–651.
Safai, P. D., Kewat, S., Praveen, P. S., et al. 2007. Seasonal variation of blackcarbon aerosols over a tropical urban city of Pune, India. AtmosphericEnvironment 41:2699–2709.
Sahu, S. K., Pandit, G. G., and Sadasivan, S. 2004. Precipitation scavengingof polycyclic aromatic hydrocarbons in Mumbai, India. Science of theTotal Environment 318:245–249.
Simcik, M. F., Eisenreich, S. J., and Lioy, P. J. 1999. Source apportion-ment and source/sink relationships of PAHs in the coastal atmosphere ofChicago and Lake Michigan. Atmospheric Environment 33:5071–5079.
Soclo, H. H., Garrigues, P. H., and Ewald, M. 2000. Origin of polycyclicaromatic hydrocarbons (PAHs) in coastal marine sediments: Case stud-ies in Cotonou (Benin) and Aquitaine (France) areas. Marine PollutionBulletin 40:387–396.
State Meteorological Service, 2007. http://www.dmi.gov.tr/veridegerlendirme/yillik-toplam-yagis-verileri.aspx?m=ankara
Sun, P., Backus, S., Blanchard, P., and Hites, R. A. 2006. Annual variation ofpolycyclic aromatic hydrocarbon concentrations in precipitation collectednear the Great Lakes. Environmental Science and Technology 40:696–701.
Terzi, E., and Samara, C. 2004. Gas-particle partitioning of polycyclicaromatic hydrocarbons in urban, adjacent coastal, and continental back-ground sites of western Greece. Environmental Science and Technology38:4973–4978.
Tsapakis, M., Apostolaki, M., Eisenreich, S., and Stephanou, E. G. 2006.Atmospheric deposition and marine sedimentation fluxes of polycyclicaromatic hydrocarbons in the Eastern Mediterranean Basin. Environmen-tal Science and Technology 40:4922–4927.
Yatın, M., Tuncel, S., Aras, N. K., Olmez, I., Aygun, S., and Tuncel, G.2000. Atmospheric trace elements in Ankara, Turkey: 1. Factors affect-ing chemical composition of fine particles. Atmospheric Environment34:1305–1318.
Zedeck, M. S. 1980. Polycyclic aromatic hydrocarbons. A review. Journalof Environmental Pathology and Toxicology 3:537–567.
Zhang, S., Zhang, W., Wang, K., Shen, Y., Hu, L., and Wang, X. 2009. Con-centration, distribution and source apportionment of atmospheric poly-cyclic aromatic hydrocarbons in the southeast suburb of Beijing, China.Environmental Monitoring and Assessment 151:197–207.
Zuo, Q., Duan, Y. H., Yang, Y., Wang, X. J., and Tao, S. 2007. Sourceapportionment of polycyclic aromatic hydrocarbons in surface soil inTianjin, China. Environmental Pollution 147:303–310.
Downloaded By: [TÜBTAK EKUAL] At: 13:46 17 December 2009