Embed Size (px)
Citation preview


1Socio Economic Outlook 2015
Section I REINVENTING TELANGANA

2Socio Economic Outlook 2015

3Socio Economic Outlook 2015
THE FIRST STEPS
The birth of Telangana as the 29th State of the Indian Republic marks both a beginning and an end. It was the end of a prolonged struggle of six decades by the people of Telangana to carve out a separate political and cultural identity for themselves. It was also the beginning of a process of reinventing a new identity, policies and programmes to address the special needs of the area and to suit the genius of the people of Telangana. Many of the Government schemes designed in the past suffered from an inherent bias, and hence needed a correction through a conscious process of reorientation and reformulation. This was the biggest challenge that confronted the Government of the new State. These sentiments were echoed by Sri Eatala Rajender, Hon’ble Finance Minister, in the maiden budget speech on November 5, 2014, in the following words:
“Our State of Telangana is the result of a prolonged struggle by two generations of people over six decades, during which many have lost whatever little they had and some even their lives. We salute them all and also place on record the critical contribution made by the Hon’ble Chief Minister Sri.K.Chandrasekhar Rao, who successfully led all sections of people in carving out separate Telangana State.”
“This context commands the Government to ensure judicious use of resources for fulfi lling the hopes and aspirations of not only the present but also future generations. Accordingly, the Government has presented the budget keeping in view the importance of ensuring a bright future for the people of Telangana.”
“We are aware of the opportunities lost and problems accumulated as a result of deliberate neglect of Telangana.The immense task before the Government is not only correcting the historic wrongs but also quickly imparting social and economic justice for the vast majority of the people.”
“Telangana has suffered on all fronts. With the realisation of separate Statehood, people have realised the fruits of self-rule. Though we have direct control over the affairs of the State, a number of indirect forces are bent on creating hurdles in our efforts to develop the State.”
“The Government is committed and determined that with the active support of people, all the hurdles in the path of development will be overcome. I am confi dent that the spirit and dedication with which separate Statehood has been achieved will continue to drive the State towards realising the goal of ‘Bangaru Telangana.’’
“For reconstructing the State, we need to reinvent and reorient Telangana. As everyone will appreciate, there are no easy solutions or short cuts. Serious and concerted action is needed to address the past neglect.”
The Budget presented in November, 2014 was not merely a statement of accounts. It was an endeavour to
1.1Chapter
“A journey of thousand steps begins with a step...”
- Israelmore Ayivor, Shaping the Dream

4Socio Economic Outlook 2015
chart the path of development to be pursued by Telangana in different sectors in order to optimise its growth potential and also to address the felt needs of the people. For every sector, attempts were made to identify Telangana-specifi c issues/problems which needed to be addressed marking a conscious departure from the past. In the last few months, signifi cant fi rst steps have been taken in various fi elds which have started yielding results. This document attempts to analyse the impact of some of these new schemes and identifi es the required next steps. The challenge is to sustain the new schemes and to ensure that the benefi ts reach the targeted persons/groups. The dynamics of policy making need to place people at the centre of the planning process and the Government of Telangana stands committed towards this end. As Sri K. Chandrashekar Rao, Hon’ble Chief Minister said, “I fi rmly believe that growth, and even legitimacy, has no meaning if the deprived sections of the society are left behind. We fully share the concerns that inclusive growth should not only ensure a broad based fl ow of benefi ts and economic opportunities, but also encompass empowerment and participation. The initiatives taken by the Government since the formation of the State in June this year have entirely been guided by these compelling imperatives.”
Progress and analysis of policy announcements and programmes launched can be termed as the fi rst steps in reinventing Telangana. These programmes and policy announcements serve as useful pointers of the vision and the milestones on the road to progress and realisation of ‘Bangaru Telangana’. The new vision can be broadly summarised as “progress with distributive justice”. For the new leadership, progress is not mere material progress, as indicated by the GDP, but a sustained improvement in the wellbeing of the people, including the economic, social and cultural dimensions. Further, this progress and development should be sustainable in that it should not reduce the capacity of the State to meet the needs of its future generations. This new vision of the State leadership is embodied in the various new initiatives and policy announcements made since the formation of the new Government in the State. A brief review of these developments and policy initiatives will be of relevance in this context.
As per the advanced estimates, the Gross State Domestic Product (GSDP) growth of the State during 2014-15 is estimated at 5.3%, as compared to the growth rate of 4.8% recorded in 2013-14, at constant prices of 2004-05. This marks a reversal of the declining trend registered during the past three years. Though agricultural growth suffered a decline during the last year due to adverse seasonal conditions, allied sectors like livestock, forestry and fi sheries sectors have shown positive growth rates of 6.5, 2.7 and 11.4%, respectively. A substantial increase in industrial growth rate of 4.1% and a healthy service sector growth rate of 9.7% has made a major contribution to the increase in the overall GSDP growth of the State.
A signifi cant point to be noted is the total GSDP of the State at the current prices has crossed the Rs. 4 lakh crore mark. This positive growth in GSDP has increased the per capita income in the State during 2014-15 (current prices) to Rs.1,03,889 compared to Rs. 95,361 recorded during 2013-14. This is substantially higher than the all India per capita income of Rs. 88,533.
In line with the new vision for reinventing Telangana and considering the needs and aspirations of the people of Telangana, the Government has formulated several welfare schemes, with a special focus on the disadvantaged sections like SC,ST,BC and minorities of the society.
One of the most important welfare initiatives of the Government is the ‘Aasara’ pension scheme introduced last year, covering the poor and vulnerable population like widows, weavers, toddy tappers, old aged people and AIDS patients. Under this scheme, a monthly pension of Rs. 1,000 per month is disbursed to ensure the minimum dignity of livelihood of these vulnerable groups. Similar welfare measures are announced for beedi workers for extending a fi nancial assistance to the tune of Rs.1000 per month to every eligible worker. Power loom weavers are another economically distressed group who have been extended a special loan waiver scheme.

5Socio Economic Outlook 2015
Another signifi cant welfare scheme of the new Government is the land purchase scheme that provides 3 acres of agricultural land to landless SC women, along with the provision for creation of irrigation facilities, lifting devices, land development and other agricultural inputs for their sustained livelihood.
Marriage of a daughter is a major event as well as a cause for indebtedness in many families, particularly the poor. In order to help SC and ST families during weddings and save them from indebtedness, the ‘Kalyana Lakshmi Scheme’ has been introduced under which SC and ST families are extended a fi nancial assistance of Rs.51,000 for each SC and ST girl at the time of her marriage. Similar assistance is also given to families of minorities including Muslims, Christians and Sikhs under the ‘Shadi Mubarak Scheme’ at the time of their daughter’s marriage.
For the people with disabilities, who constitute 2.97% of the population, a monthly pension of Rs. 1,500 is extended. Similarly, pension to old aged artists is also enhanced to Rs.1,500 per month.
Women constitute nearly 50% of our State’s population and their welfare and security is of prime importance for progress and development. Considering the importance of nutrition for pregnant and lactating women, the Government has recently launched the ‘Arogya Laxmi’ programme, to provide one full nutritious meal every day to women through Anganwadi centres.
In order to provide food security and adequate nutrition to the poor families in the State, the Government has enhanced the quantum of subsidised rice supply. An eligible person will receive 6 kgs per month at the rate of Rs.1 per kg, without any limit on the number of members in the family, with effect from 1st January, 2015. The eligibility limit has also been enhanced from family annual income of Rs.60,000 to Rs.1.50 lakhs in rural areas and Rs.75,000 to Rs.2.00 lakhs in urban areas.
The new Government is also committed to meet the housing needs of the poor with provision of two bed room houses with a hall, kitchen, bathroom and a lavatory at a unit cost of Rs.3.5 lakhs.
Recognising the contributions made by the Government employees, the Government has announced a liberal increase in their salaries with 43% fi tment and has issued health cards for cashless treatment in designated hospitals.
Similarly, journalists and lawyers have also been recognised for their contributions in the struggle and have been suitably rewarded.
Education and health are critical social sectors without which economic and social development cannot be achieved. The Government is committed to overhauling and strengthening the public education system from KG to PG in a phased and systematic manner. The Government is also committed to the revival of public health systems and to make them affordable and reliable for the common man. Adequate investments will be made in these two important sectors to educate the people and promote their health and wellbeing in order to make them contribute to the realisation of the goal of ‘Bangaru Telangana’.
Agriculture, though declining in terms of its share in the State income, is nevertheless critical for sustained economic and social development as majorities of State population reside in rural areas and depend on agriculture and allied sector activities for their livelihood and food security. However, this sector is currently facing severe challenges due to declining land productivity, shortage of water, unremunerative prices, high cost of cultivation and climate change. As part of reinventing Telangana, agriculture needs to be rejuvenated and made remunerative to arrest rural distress and farmer suicides. The announcement of farm loan waiver up to one lakh rupees comes as an immediate response to address farmer distress. Further, in order to ensure remunerative prices to farmers for their produce, a market intervention fund of Rs. 400 crores is also set up.

6Socio Economic Outlook 2015
As a long term measure to reinvent agriculture, ‘Mission Kakatiya’ a major fl agship programme, is launched by the new Government wherein traditional tanks and minor irrigation sources will be revived to benefi t agriculture and drinking water sectors. This will be done by improving the surface as well as ground water availability for extending the coverage of irrigated agriculture in the state.
In order to make farming profi table by diversifi cation and value addition, the Government is focusing on seed production to promote the state as ‘Seed Bowl’, horticulture development using green house technology and other modern farming techniques. The Government is also emphasising on the consolidation of holdings to a minimum economic size to ensure farm viability. The Government is extending support to dairy and fi sheries sectors also in the State. Dairy farmers who supply milk to Government Dairy Federation get an additional amount of Rs.4 per litre. With the revival of tanks and minor irrigation sources, inland fi sheries are expected to expand in the State. In order to encourage farm mechanisation, reduction of cost of cultivation and improvement of farm productivity, the Government has reduced the tax on tractors and trailers.
Development of social and economic infrastructure is a prerequisite for faster economic growth and development. The Government is determined to address this critical need and accordingly key investments are planned in this sector.
Drinking Water is a basic need which has to be provided to every citizen at an affordable cost. To achieve this, the Government has decided to earmark 10% of water in irrigation projects for drinking water and launch the ‘Telangana Drinking Water Supply Project’ to provide protected and piped drinking water to every household in the State by linking all the projects and habitations through a network of pipelines. The Government has earmarked an amount of Rs.40,000 crore for this and is proposed to implement this over the next three to four years.
Energy is a key input for industrialisation and overall development. After bifurcation of the State is facing a severe shortage of power due to inadequate investments in the past. The Government has taken several measures to overcome this gap and is planning to add 20,000 MW of power generation in the next fi ve years, while making all efforts to purchase power from the neighbouring states and national level sources to meet the current needs. Simultaneously, emphasis is given to renewable sources of energy, particularly on solar power generation in the State.
Considering the importance of road network in the economic and social development, much emphasis is laid on enlarging and strengthening the road network. Necessary investments will be made in this sector for improvement of road connectivity. The State is also actively pursuing to expand the rail network to facilitate faster economic development. Hyderabad Metrorail Project, which is in an advanced stage of completion, is also likely to improve the infrastructure effi ciency in the metro regions.
Industrialisation holds the key for achieving higher growth trajectory and employment generation. Realising this, the new Government has laid adequate emphasis on rapid industrialisation in the State. The State is already the favoured destination for many investors from India and abroad due to its natural resources, availability of skilled manpower and technological base. In order to capitalise on these advantages, the new leadership is taking several steps to improve the investment climate in the State.
The Government has unveiled the new ‘Industrial Policy Framework, 2014’ with a vision for industrialisation of Telangana, christened as ‘Research to Innovation; Innovation to Industry; Industry to Prosperity’. The industrial policy framework will be driven by the slogan of ‘In Telangana-Innovate, Incubate, Incorporate’. The policy framework intends to provide a business regulatory environment where doing business would be easy. Innovation and technology will drive the industries of the Telangana State.

7Socio Economic Outlook 2015
For fast tracking the approvals, a Chasing Cell is being established with the task of monitoring industrial approvals. A land bank with over 2 lakh acres of Government land suitable for industries is also being planned for promoting industrial development in the State. Seeing the improved investment climate in the State, several private sector majors from India and abroad have come forward to invest in Telangana.
Industrialisation in the services sector, where the state has an advantage, is likely to get a boost with the approval of the Government of India for establishment of Information Technology and Investment Region (ITIR). Another major national project which has been taken up in Telangana is the National Investment and Manufacturing Zone (NIMZ) in Medak district for promoting manufacturing in the State. To disperse the industrial development in the state a Textile Park is being planned to be set up at Warangal. The Government is also planning several other initiatives for improvement of infrastructure in and around Hyderabad to retain its attractiveness to global investors. Efforts are also on to make Hyderabad a safer, smarter and a slum free city. Security systems are being strengthened by improving the mobility of police and installation of CCTV surveillance systems in the areas covered under Hyderabad and Cyberabad city police commissionerates. Hyderabad Metro Rail, once operational, will further improve the infrastructure effi ciency in the city and the neighbourhood areas.
To promote green cover and protect biodiversity, the new leadership has envisaged an ambitious programme named ‘Telangana Ku Haritha Haram’for improvement of green cover to reach the targeted 33% of the total green cover area and enrichment of the biodiversity of the State through a massive plantation of 230 crore trees over the next three to four years. The scheme is sought to be implemented through a multi-pronged approach consisting of rejuvenating degraded forests, ensuring better protection to the existing forests, intensive soil and moisture conservation measures and social forestry.
Reinventing Telangana has an important socio-cultural dimension. In the combined State, Telangana culture and traditions have been relatively neglected and its richness underplayed. For rejuvenation of Telangana culture and values, the new leadership under the stewardship of Hon’ble Chief Minister is laying huge emphasis on revival of rich culture and traditions of Telangana. As a fi rst step in this direction, the Government has declared ‘Bathukamma’ and ‘Bonalu’ as State festivals and is celeberating these with pomp and pride. As part of this effort ‘Telangana Kala Bharati’ at Hyderabad and ‘Kaloji Kala Kendram’ at Warangal are proposed to be set up. To utilise the services of Telangana artists for spreading awareness of State Government programmes, ‘Telangana Samskruthika Sarathi’ has been set up.
Tourism has the potential to expose the cultural heritage and ecological sites to tourists from within and outside the State in addition to earning revenue and promoting employment. All the cultural, religious and natural locations are given a facelift to promote tourism. Necessary investments are made in infrastructure development in tourist destinations and circuits. Cleaning of Hussain Sagar Lake is another ambitious project of the State Government to improve the environs and protect the precious water body from pollution and misuse. Investments are planned to clean the lake on priority. This will also boost the tourist potential of the lake.
In order to promote spiritual and cultural heritage, Yadagirigutta, a holy place near Hyderabad and much revered in Telangana State is being developed as a global religious centre. The State Government has also allocated necessary funds for celebration of ‘Godavari Pushkaralu’ to be celeberated in the current year.
The Government is planning to revise the business rules and procedures to make administration effi cient and people-centric. Use of technology will also help the Government in all these endeavours and in realising the vision of the State leadership.

8Socio Economic Outlook 2015
In the following sections, a detailed sector-wise review of developments and policy initiatives has been made and the progress analysed. A complete and comprehensive analysis is diffi cult at this stage as the implementation period has been short since the formation of the State and announcement of the fi rst budget. Ground level data on implementation of various schemes has started fl owing from the fi eld only recently. The structure of the report is as follows:
The introductory section outlines the need for reinventing Telangana and the broad contours of the fi rst steps taken by the Government towards this end. The second part of the section provides an overview of the socio-economic profi le of Telangana State and analyses the growth trajectory of the recent past, with details of sector-wise contributions to the GSDP. The second section focuses attention on agriculture and allied sectors and highlights the new initiatives and policy interventions to address the specifi c needs of the Telangana farmers. The need for environmental protection and extension of green cover is also examined in last chapter of this section. The third section gives an account of various welfare measures initiated by the Government to benefi t vulnerable groups in different parts of the States and their respective needs. The impact of these schemes to achieve the objective to ensure minimum human dignity and improved living conditions for all is also examined. Social sector spending by different departments is also analysed in this section. The fourth section focuses on economic infrastructure, industrial promotion and the services sector which contributes signifi cantly to the GSDP. The new Industrial policy launched by the State to attract investments and the policy initiative to ensure ease of doing business is also highlighted in this section. The fl agship programmes of the State under ‘Mission Kakatiya’ and ‘Telangana Drinking Water Supply Project’ are also covered in this section. The report concludes with a section on the initiatives planned to transform Hyderabad as a Global city. The last part of the report incorporates detailed statistical profi le of Telangana State pertaining to different sectors and schemes.
“The fi rst step is the hardest in every journey of dreams...”
-Moffat Machingura, Life Capsules
Independence Day celebrations at Golconda Fort

9Socio Economic Outlook 2015
SOCIO-ECONOMIC PROFILE OF TELANGANA & GROWTH TRAJECTORY 1.2
The new State of Telangana, with a geographical area of 1,14,840 sq. kilometers and having a population of 3,51,93,978 (2011 census), is the twelfth largest State in terms of both area and the size of population in the country. The State is bordered by Maharashtra and Chhattisgarh in the north, Karnataka in the west and Andhra Pradesh in the south and the east. The State is strategically located in the Deccan plateau in a semi arid region. The climate is predominantly hot and dry.
Two major perennial rivers, the Krishna and the Godavari passing through the State. The catchment area of the Godavari lying in the State is 79% and that of the Krishna is 68.5%. Despite large proportion of the catchment of these major rivers lying in the State, the present utilisation of these river waters in the State is low because of the neglect of the region in the erstwhile State of Andhra Pradesh. The demographic, social and economic profi le of the State is presented below.
Population
The population of the State is predominantly rural with 61.33% of people residing in rural areas and the remaining 38.67% of people residing in urban areas. While the growth of total population in the State has moderated to 13.58% in the decade 2001 to 2011 from 18.77% in the preceding decade, the growth of the urban population has been witnessing a signifi cant increase. Urban population in the State grew by 38.12% in the decade 2001 to 2011 as compared with 25.13% in the preceding decade. In sharp contrast, rural popu-lation in the State grew by a modest 2.13% as per the 2011 census. The growth of urban population is mainly on account of migration from Seemandhra region of the erstwhile State of Andhra Pradesh and partly on account of migration from within the State and other parts of the country. The capital city of Hyderabad, which is entirely urban, accounts for over 29% of the State’s total urban population (2011). The rapid growth of urban population and its concentration mostly in the Hyderabad metropolitan area has stretched the ur-ban infrastructure to the hilt.
Density of Population
The density of population in the State ranges from the lowest of 170 per sq. kilometer in Adilabad district to the highest of 18,172 per sq. kilometers in Hyderabad district. The districts of Adilabad, Khammam and Mahabubnagar have lower density of population of 170, 175 and 220 per sq. kilometer respectively, as com-pared with the State average of 307 per sq. kilometer.
Sex Ratio of Population
The sex ratio of the State, defi ned as the number of females per 1,000 males at 988 is higher than the na-tional average of 943 in 2011. One distinguishing feature is that the sex ratio in the districts of Nizamabad, Adilabad, Karimnagar and Khammam is over 1,000. The sex ratio in the State has been witnessing an im-provement from 967 in 1991 to 971 in 2001 and further to 988 in 2011. Despite a favourable sex ratio of the total population, the sex ratio of children in the age group of 0-6 years is a matter of concern. The sex ratio

10Socio Economic Outlook 2015
of children declined from 957 in 2001 to 933 in 2011. The sex ratio of the SC population at 1,008 in 2011 is much higher than the state average of 988. With the exception of the districts of Rangareddy, Hyderabad and Mahabubnagar, in all the remaining seven districts of the State, the sex ratio of SC population is higher than 1000. The sex ratio of ST population at 980 is marginally lower than the state average but it is much higher in Adilabad (1003), Nizamabad (1017) and Khammam (1022).
Social Composition of Population
The population of the State consists predominantly of backward classes and people belonging to the lower rung of the social ladder. Of the total population of the State, scheduled castes constitute 15.44% and the scheduled tribes 9.34%. The percentage of scheduled tribes population is higher than the national average of 8.60%. There has been a signifi cant increase in the percentage of tribal population in total population from 2.81% in 1961 to 8.19% in 1981 and further to 9.34% in 2011. The increase is mainly on account of the inclusion of certain castes under the category of scheduled tribes.
Nearly 80% of the State’s population consists of backward classes including SCs, STs, minorities and other backward classes. The higher percentage of backward classes in total population casts a greater responsibility on the State Government in terms of empowering and assisting them to come up to the level of other castes. Details regarding population density, sex ratio and percentage of SC and ST population are presented below
Table 1: Composition of State Population
Sl. No.
DistrictPopulation density
per Sq. km.Sex Ratio
% of SC population
% of ST population
1 Mahabubnagar 220 977 17.49 8.992 Rangareddy 707 961 12.31 4.133 Hyderabad 18,172 954 6.29 1.244 Medak 313 992 17.73 5.575 Nizamabad 321 1,040 14.54 7.566 Adilabad 170 1,001 17.82 18.097 Karimnagar 319 1,008 18.8 2.838 Warangal 273 997 17.54 15.119 Khammam 175 1,011 16.55 27.3710 Nalgonda 245 983 18.27 11.3 Telangana State 306 988 15.44 9.34
All India 382 943 16.64 8.62
Source: Census of India, 2011
Intensive Household Survey(Samagra Kutumba Survey), 2014
The Government has taken up Intensive Household Survey (Samagra Kutumba Survey), 2014 that was com-pleted in a day i.e. on 19.08.2014 all throughout the state. This was is a unique exercise for data collection in the country. The objective is to have a single robust database of all the households of the State, by which the Government of Telangana can build effective developmental programs to target the individual needs by identifying deserving benefi ciaries.
The survey encompasses both rural and urban household data, inclusive of data on family details, housing status, family member’s details, disability, chronic diseases, land and livestock details etc. 3,85,892 enumerators were engaged for this survey and the entire survey was done voluntarily. The district wise details of households is Presented below.

11Socio Economic Outlook 2015
Table 2: District wise Households and Population. (in Lakhs)
Sl. No. District Households Population1 Mahbubnagar 9.67 42.842 Rangareddy 16.56 61.373 Hyderabad 9.77 37.944 Medak 8.52 30.935 Nizamabad 6.97 24.676 Adilabad 8.17 28.257 Karimnagar 12.02 38.388. Warangal 10.91 36.479. Khammam 8.31 26.2310. Nalgonda 11.03 35.95
Total 101.83 363.03Average Household size 3.56Total number of households as per Census-2011 : 83.58 lakhsThe development Departments of the State are using the database in extending Government fl agship pro-grammes like pensions, food security etc.
Literacy
The literacy rate in the State at 66.46% is lower than the national average of 72.99%. It is a matter of concern that the literacy rate is lower than those in some of the lower income States like Odisha, Chhattisgarh and Madhya Pradesh. The literacy rate in the State varies from 55.04% in Mahbubnagar to 83.25% in Hydera-bad. There are also huge differences in the literacy rates of males and females. While the male literacy rate is 74.95%, the female literacy rate is much lower at 57.92%. The literacy rates among the SCs and STs is 58.90 and 49.51%, respectively. Improving the literacy rate in general and that of the SCs and STs in particular is a major challenge before the State Government. Status of literacy in the State is presented below.
Table 3: District-wise, Category-wise Literacy Rates-2011
Sl. No.
District Total Males Females Urban Rural SCs STs
1 Mahabubnagar 55.04 65.21 44.72 77.96 50.92 47.72 42.29
2 Rangareddy 75.87 82.11 69.4 82.31 60.6 64.72 56.05
3 Hyderabad 83.25 86.99 79.35 83.25 -- 77.28 69.34
4 Medak 61.42 71.43 51.37 78.57 56 53.42 44.73
5 Nizamabad 61.25 71.47 51.54 77.22 56.5 52.88 45.92
6 Adilabad 61.01 70.81 51.31 75.63 55.29 58.46 51.35
7 Karimnagar 64.15 73.65 54.79 77.77 59.61 58.84 51.49
8 Warangal 65.11 74.58 55.69 81.03 58.83 61.79 48.45
9 Khammam 64.81 72.3 57.44 81.26 59.75 62.9 51.59
10 Nalgonda 64.2 74.1 54.19 81.69 60.07 60.75 48.08
State Average 66.46 74.95 57.92 81.09 57.25 58.9 49.51
Source: Census of India, 2011

12Socio Economic Outlook 2015
District -wise Literacy Rates in Telangana State
Source: Census of India, 2011
Another feature on the literacy front is the high dropout rate in the State, particularly among the SC and ST students in classes I to X. The dropout rates are 40.3% for SC students and as high as 62.8% among the ST students.
Health Indicators
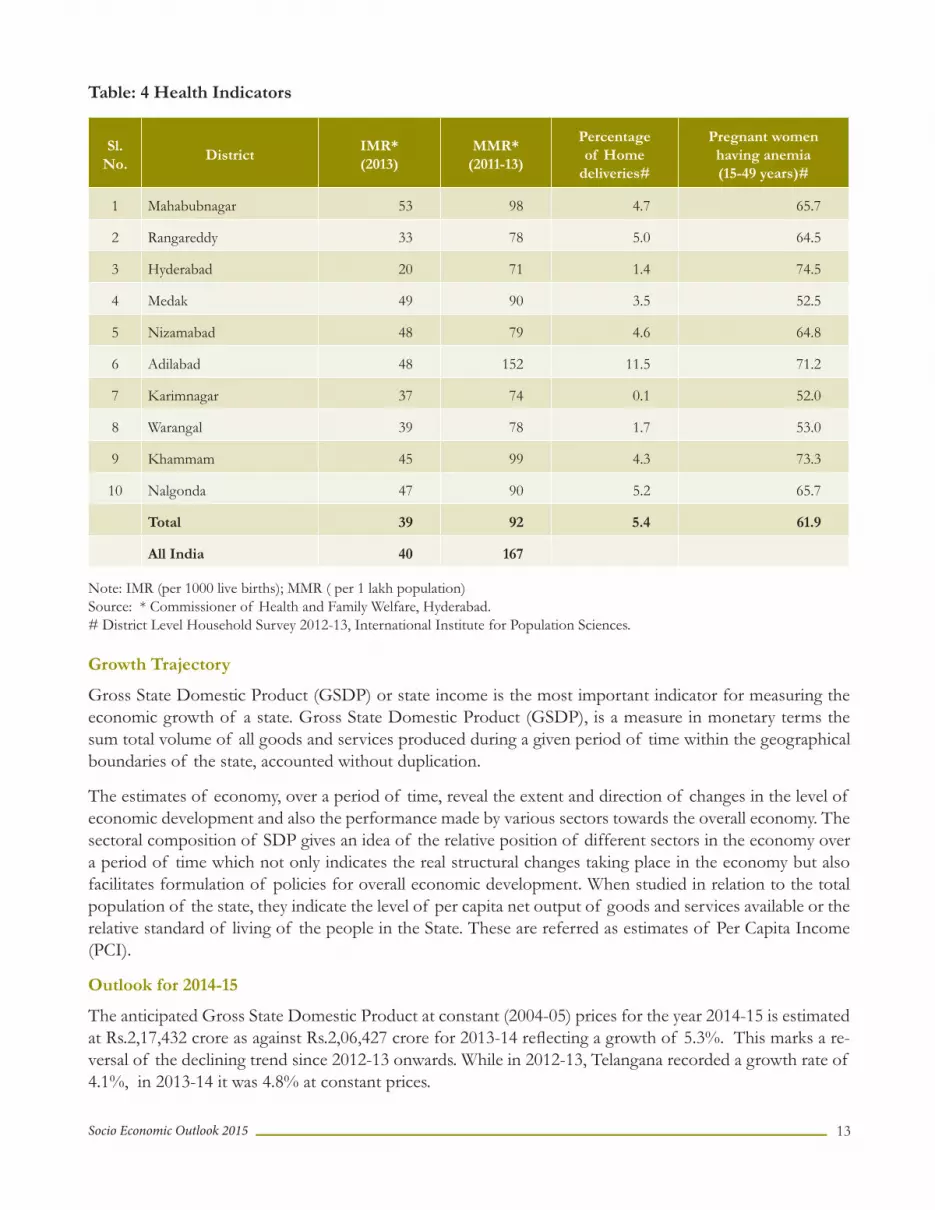
A number of health indicators in Telangana need to be addressed for improvement. In six out of ten districts of the State, the infant mortality rate (IMR) is found to be much higher than the national average of 40. The maternal mortality rate (MMR) at 152 is very high in the district of Adilabad as compared with the national average of 167. The percentage of home deliveries at 11.5 percent as per District Level Household Survey (2012-13) conducted by the International Institute for Population Sciences, Mumbai is found to be very high in the backward district of Adilabad. District-wise selected health indicators are presented below.
13Socio Economic Outlook 2015
Table: 4 Health Indicators
Sl. No.
DistrictIMR*(2013)
MMR* (2011-13)
Percentage of Home
deliveries#
Pregnant women having anemia (15-49 years)#
1 Mahabubnagar 53 98 4.7 65.7
2 Rangareddy 33 78 5.0 64.5
3 Hyderabad 20 71 1.4 74.5
4 Medak 49 90 3.5 52.5
5 Nizamabad 48 79 4.6 64.8
6 Adilabad 48 152 11.5 71.2
7 Karimnagar 37 74 0.1 52.0
8 Warangal 39 78 1.7 53.0
9 Khammam 45 99 4.3 73.3
10 Nalgonda 47 90 5.2 65.7
Total 39 92 5.4 61.9
All India 40 167
Note: IMR (per 1000 live births); MMR ( per 1 lakh population)Source: * Commissioner of Health and Family Welfare, Hyderabad.# District Level Household Survey 2012-13, International Institute for Population Sciences.
Growth Trajectory
Gross State Domestic Product (GSDP) or state income is the most important indicator for measuring the economic growth of a state. Gross State Domestic Product (GSDP), is a measure in monetary terms the sum total volume of all goods and services produced during a given period of time within the geographical boundaries of the state, accounted without duplication.
The estimates of economy, over a period of time, reveal the extent and direction of changes in the level of economic development and also the performance made by various sectors towards the overall economy. The sectoral composition of SDP gives an idea of the relative position of different sectors in the economy over a period of time which not only indicates the real structural changes taking place in the economy but also facilitates formulation of policies for overall economic development. When studied in relation to the total population of the state, they indicate the level of per capita net output of goods and services available or the relative standard of living of the people in the State. These are referred as estimates of Per Capita Income (PCI).
Outlook for 2014-15
The anticipated Gross State Domestic Product at constant (2004-05) prices for the year 2014-15 is estimated at Rs.2,17,432 crore as against Rs.2,06,427 crore for 2013-14 refl ecting a growth of 5.3%. This marks a re-versal of the declining trend since 2012-13 onwards. While in 2012-13, Telangana recorded a growth rate of 4.1%, in 2013-14 it was 4.8% at constant prices.

14Socio Economic Outlook 2015
Annual Growth Rates of Gross State Domestic Product at Constant (2004-05) Prices
15.9
11.6
10.6
13.4
1.1
18
8.7
4.1
4.8 5.3
0
2
4
6
8
10
12
14
16
18
20
2005-06 2006-07 2007-08 2008-09 2009-10 2010-11 2011-12(TRE)
2012-13(SRE)
2013-14(FRE)
2014-15(AE)
TRE:Third Revised Estimates,SRE:Second Revised Estimates,FRE:First Revised Estimates,AE:Advance Estimates
The state GSDP at constant (2004-05) prices recorded double digit growth from 2005-06 to 2008-09 and 2010-11, there after it is experiencing steep downward trend in subsequent years with a low growth of 1.1 percent in 2009-10.
The GSDP at current prices for the year 2014-15 is estimated at Rs. 4,30,599 crore as against Rs. 3,91,751 crore for 2013-14 with a growth rate of 9.9 per cent. GSDP of the State at Current and Constant (2004-05) Prices is shown below:
Table 5: GSDP of Telangana State at Current and Constant (2004-05) Prices
Year
Current Prices Constant (2004-05) Prices
GSDP (Rs.Crore)Percentage variation
over previous yearGSDP (Rs.Crore)
Percentage variation over previous year
2004-05 89,946 - 89,946 -
2005-06 1,08,335 20.4 1,04,233 15.9
2006-07 1,26,971 17.2 1,16,343 11.6
2007-08 1,52,452 20.1 1,28,618 10.6
2008-09 1,89,382 24.2 1,45,902 13.4
2009-10 2,03,508 7.5 1,47,577 1.1
2010-11 2,63,898 29.7 1,74,185 18.0
2011-12(TRE) 3,05,622 15.8 1,89,269 8.7
2012-13(SRE) 3,47,082 13.6 1,97,056 4.1
2013-14(FRE) 3,91,751 12.9 2,06,427 4.8
2014-15(AE) 4,30,599 9.9 2,17,432 5.3
TRE: Third Revised Estimates, SRE:Second Revised Estimates, FRE:First Revised Estimates,AE:Advance Estimates

15Socio Economic Outlook 2015
89946 108335 126971152452
189382 203508
263898305622
347082391751
430599
89946 104233 116343 128618 145902 147577174185 189269 197056 206427 217432
0
50000
100000
150000
200000
250000
300000
350000
400000
450000
500000
2004
-05
2005
-06
2006
-07
2007
-08
2008
-09
2009
-10
2010
-11
2011
-12(
TRE)
2012
-13(
SRE)
2013
-14(
FRE)
2014
-15(
AE)
GSDP at current prices GSDP at Constant (2004-05) PricesRs
. Cro
re
Source: Directorate of Economics and Statistics, Hyderabad.
Sectoral Growth Trends
While the growth rate of GSDP denotes the performance of State economy, the sectoral performance refl ects the change in the magnitude and composition of GSDP of the State economy over time. The change in the relative sectoral shares in GSDP manifests the structural change in the economy. The economy has been classifi ed as Agriculture, Industry and Services. The Agriculture Sector consists of agriculture, livestock, forestry and fi sheries. The Industry Sector consists of mining and quarrying, manufacturing, electricity, gas and water supply and construction sectors. The Services Sector consists of trade, hotels and restaurants; transport by other means and storage; railways; communications; banking and insurance; real estate, ownership of dwellings and business services; public administration and other services.The sectoral analysis reveals that during the year 2014-15, the growth rate of GSDP is highest in services sector with 9.7% followed by Industry sector with a growth of 4.1% and agriculture sector expected a negative growth of (-)10.3%. The growth estimate of 5.3% would have been better, but for the negative growth of -10.3% recorded in agriculture and allied sector, attributed mainly to the adverse seasonal conditions. Agriculture per se was badly hit due to this and recorded negative growth of -21.3%, which was partially compensated by the positive growth trends in Lfi vestock (6.5%), Forestry & Logging (2.7%) and Fisheries (11.4%).Consequently, the contribution of Agriculture sector declined to 12.8% from 15.1% in the previous year. The contribution of Industry sector is estimated to be 24.3% without much variation compared to the past year and the Services sector is estimated to contribute a higher percent of 62.9%, as against 60.3% in 2013-14. The percentage contribution of various sectors of the GSDP at current and constant (2004-05) prices for the year 2014-15 are as shown below:
12.8
24.362.9
GSDP at Constant (2004-05) Prices for the year 2014-15
Agriculture Industry Services
17.9
25.057.1
GSDP at Current Prices for the year 2014-15
Agriculture Industry Services
Source: Directorate of Economics and Statistics, Hyderabad.

16Socio Economic Outlook 2015
The structural composition of the state economy witnessed signifi cant changes during the last decade. During the period form 2005-06 to 2014-15, Agriculture sector recorded highest growth rate of 25.2 percent in 2005-06 , the Services sectors with 18.3 percent in 2010-11 and Industry sector with 17.1 percent in 2006-07.
Within in the Agriculture sector, the only Livestock sector show positive growth rate, while other three sub-sectors have registered a mixed growth over the years.
Within the services sector, transport by other means and storage; communications; banking and insurance; real estate, ownership of dwellings and business services and other services , have registered a positive growth, while trade, hotels and restaurants; railways and public administration have shown mixed growth over the years. Within the industry sector also, all the sub-sectors have registered mixed trend of growth during the period 2005-06 to 2014-15.
The sector wise growth rates of GSDP at constant (2004-05) prices from 2005-06 to 2014-15 are shown in the chart given below:
Sector-wise Growth Rates of GSDP at Constant (2004-05) Prices
2005-06 2006-07 2007-08 2008-09 2009-10 2010-11 2011-12(TRE)
2012-13(SRE)
2013-14(FRE)
2014-15(AE)
Agriculture Sector 25.2 -0.5 16.3 6.0 -12.5 19.4 -0.4 11.5 8.4 -10.3Industry Sector 13.8 17.1 6.4 16.0 2.3 16.8 5.7 -4.1 0.1 4.1Services Sector 13.9 13.2 10.9 14.6 4.8 18.3 12.5 6.3 5.9 9.7
-15.0-10.0-5.00.05.0
10.015.020.025.030.0
Gro
wth
Rate
Agriculture Sector Industry Sector Services Sector
TRE: Third Revised Estimates, SRE: Second Revised Estimates, FRE: First Revised Estimates, AE: Advance EstimatesSource: Directorate of Economics and Statistics, Hyderabad.
Structure of the Economy
The composition of GSDP is changing signifi cantly over the years. The Agriculture sector is largely depending on the vagaries of seasonal conditions and receipt of rainfall. At current prices, the share of Agriculture sector in GSDP is ranging from 16.5 percent and 20.6 percent during the period from 2005-06 to 2014-15.
The State witnessed the falling share of agriculture sector in overall GSDP as well as fl uctuating trend of growth rates for last few years. Agriculture sector experienced a decelerating trend in the State in recent years, but it continues to remain a priority sector for the State because of its high potential of employment generation, food security, inclusiveness and sustainability of growth as 55.7 percent of the workforce draws its sustenance fully or partially from agriculture in the State.

17Socio Economic Outlook 2015
The declining share of agriculture sector in state GSDP is consistent with normal development path of any economy but fast agricultural growth remains vital for creation of employment, generation of incomes and ultimately providing food security to all. This is to be juxtaposed by the shifting composition of GSDP from agriculture led to industry led and service led economy in recent decade. The decline in the share of agricultural sector is almost compensated by the services sector, which increased its share from 51% to 57% during said period. The share of Industry sector is hovering between 25% and 30% during the period from 2004-05 to 2014-15. The sector wise shares of the GSDP at constant (2004-05) prices and current prices is depicted in the following Charts.
Dynamics of sector-wise percentage composition of GSDP at Constant (2004-05) Prices
17.9
19.4
17.3
18.2
17.0
14.7
14.8
13.6
14.6
15.1
12.8
28.3
27.8
29.1
28.0
28.7
29.0
28.7
27.9
25.7
24.6
24.3
53.8
52.9
53.6
53.8
54.4
56.3
56.5
58.5
59.7
60.3
62.9
0.0
20.0
40.0
60.0
80.0
100.0
120.0
2004
-05
2005
-06
2006
-07
2007
-08
2008
-09
2009
-10
2010
-11
2011
-12 (
TRE)
2012
-13 (
SRE)
2013
-14 (
FRE)
2014
-15 (
AE)
Agriculture Sector Industry Sector Services Sector
Dynamics of sector-wise percentage composition of GSDP at Current Prices
17.9
19.51
17.4
18.9
18.6
16.5
19.2
18.6
20.0
20.6
17.9
28.3
28.2
30.1
29.3
30.2
30.2 29.4
29.3
26.7
25.2
25.0
53.8
52.2
52.5
51.9
51.2
53.3
51.4
52.1
53.3
54.2
57.1
0.00
20.00
40.00
60.00
80.00
100.00
120.00
2004-05 2005-06 2006-07 2007-08 2008-09 2009-10 2010-11 2011-12(TRE)
2012-13(SRE)
2013-14(FRE)
2014-15(AE)
Agriculture Sector Industry Sector Services Sector
TRE: Third Revised Estimates, SRE: Second Revised Estimates, FRE: First Revised Estimates, AE: Advance EstimatesSource: Directorate of Economics and Statistics, Hyderabad.
Per Capita Income
The Per Capita income gives a better idea about the level of development in a State, which is a proxy indicator for the standard of living of the people. As per the Advance Estimates for 2014-15, the Per Capita Income of the State at current prices increased to Rs. 1,03,889, from Rs. 95,361 in 2013-14, registering a growth of 8.9 per cent, which is higher than the National Per Capita Income of Rs.88,533. The Per Capita Income at constant (2004-05) prices has also gone up from Rs. 48,881 in 2013-14 to Rs. 51,017 in 2014-15, registering a growth rate of 4.4 per cent. The Per Capita Income in the State has remained consistently higher than the

18Socio Economic Outlook 2015
National Per Capita Income throughout the period from 2004-05 to 2014-15. The Per Capita Income of the state increased from about Rs. 24,409 in 2004-05 to Rs. 1,03,889 at current prices in 2014-15.
The higher per capita income of the state is not only due to the higher growth in Gross State Domestic Prod-uct but it can also be attributed to faster deceleration in the population growth. In Telangana, six out of ten districts have per capita income lower than the State Per Capita Income. The districts recording higher per capita income than the state average are Hyderabad, Rangareddy, Medak and Khammam. This clearly shows that economic growth is unevenly distributed in the state and more concentrated in and around urban areas. The Per Capita Income over the period in current and constant prices is depicted in the chart given below.
Per Capita Income of State and All India at Current Prices
2440928987
3338139652
49114 51955
6695175124
8516995361
103889
24143 27131 3120635825
4077546249
5402164316
7159380388
88533
0
20000
40000
60000
80000
100000
120000
2004
-05
2005
-06
2006
-07
2007
-08
2008
-09
2009
-10
2010
-11
2011
-12
(TRE
)
2012
-13
(SRE
)
2013
-14
(FRE
)
2014
-15
(AE)
PCI of Telangana at Current Prices (Rupees) PCI of All India at Current Prices (Rupees)
TRE: Third Revised Estimates, SRE: Second Revised Estimates, FRE: First Revised Estimates, AE: Advance Estimates
Source: Directorate of Economics and Statistics, Hyderabad.
Gross District Domestic Product
As in other parts of India, in Telangana state also substantial variations prevailing in the levels of develop-ment across districts.
The estimates of Gross District Domestic Product (GDDP) reveal the size of the district economy and also to assess how the district is progressing over a period of time. As per the GDDP estimates for the year 2013-14 at current prices, Hyderabad occupies the highest position followed by Rangareddy and Medak districts. These three districts account for about 45 per cent of state GDP. On the other hand, the rest of seven districts together account for about 55 per cent of the state GDP. The GDDP of the three major districts grew at the average rate of more than 10 percent from 2004-05 to 2013-14. Whereas, Adilabad district GDDP grew at an average growth of 5.9 percent which is lowest among all the districts during the period.
19Socio Economic Outlook 2015
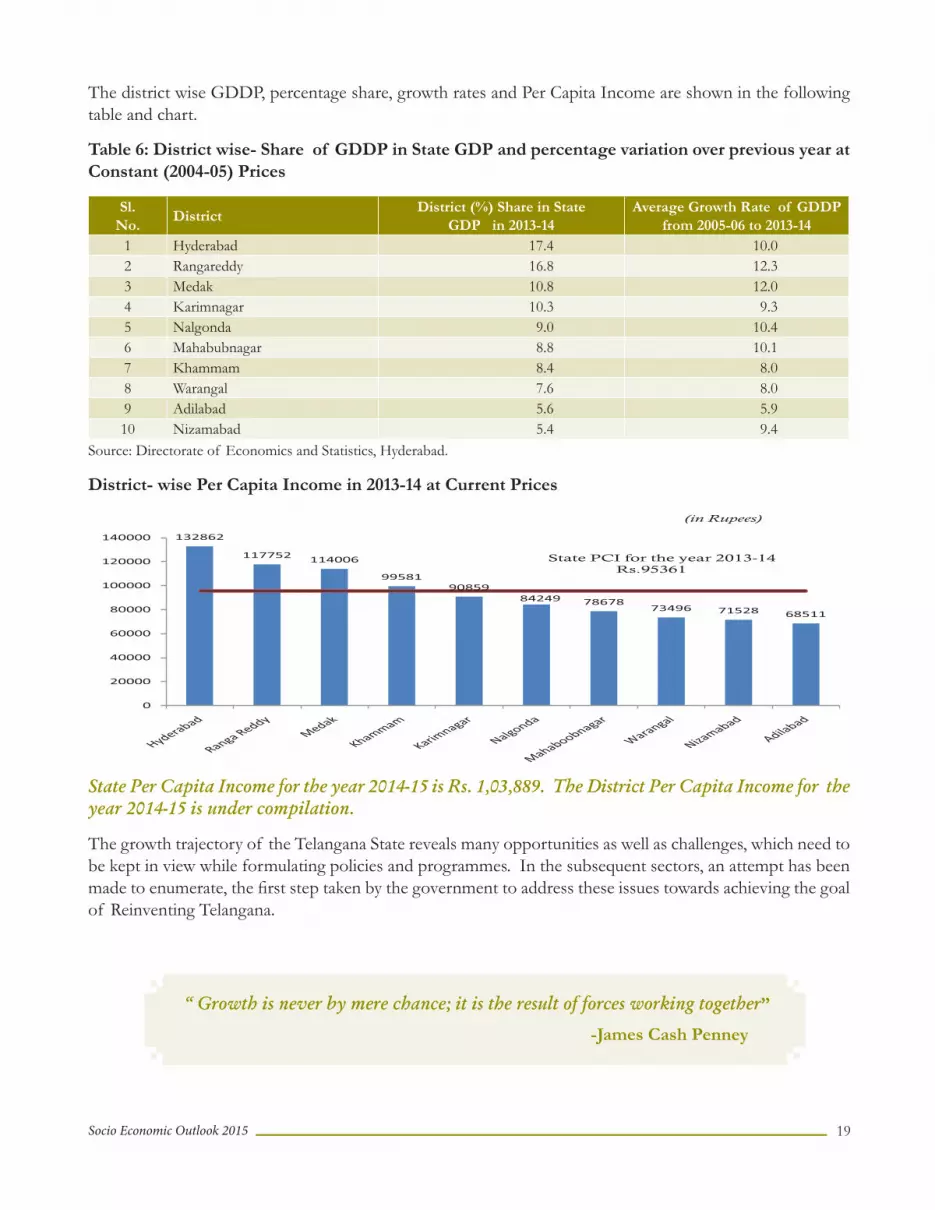
The district wise GDDP, percentage share, growth rates and Per Capita Income are shown in the following table and chart.
Table 6: District wise- Share of GDDP in State GDP and percentage variation over previous year at Constant (2004-05) Prices
Sl. No.
DistrictDistrict (%) Share in State
GDP in 2013-14Average Growth Rate of GDDP
from 2005-06 to 2013-141 Hyderabad 17.4 10.02 Rangareddy 16.8 12.33 Medak 10.8 12.04 Karimnagar 10.3 9.35 Nalgonda 9.0 10.46 Mahabubnagar 8.8 10.17 Khammam 8.4 8.08 Warangal 7.6 8.09 Adilabad 5.6 5.910 Nizamabad 5.4 9.4
Source: Directorate of Economics and Statistics, Hyderabad.
District- wise Per Capita Income in 2013-14 at Current Prices
132862
117752 114006
9958190859
84249 7867873496 71528 68511
0
20000
40000
60000
80000
100000
120000
140000
State PCI for the year 2013-14Rs.95361
(in Rupees)
State Per Capita Income for the year 2014-15 is Rs. 1,03,889. The District Per Capita Income for the year 2014-15 is under compilation.
The growth trajectory of the Telangana State reveals many opportunities as well as challenges, which need to be kept in view while formulating policies and programmes. In the subsequent sectors, an attempt has been made to enumerate, the fi rst step taken by the government to address these issues towards achieving the goal of Reinventing Telangana.
“ Growth is never by mere chance; it is the result of forces working together”
-James Cash Penney

20Socio Economic Outlook 2015

21Socio Economic Outlook 2015
Section IIREVAMPING AGRICULTURE &
ALLIED SECTORS

22Socio Economic Outlook 2015

23Socio Economic Outlook 2015
AGRICULTURE- CHALLENGES AND OPPORTUNITIES2.1
“Agriculture is not crop production as popular belief holds - it’s the production of food and fi ber from the world’s land and waters. Without agriculture it is not possible to have a city, stock market, banks, university, church or army.
Agriculture is the foundation of civilization and any stable economy.”
-Allan Savory
Sustainable growth in Agriculture continues to be core agenda for both the Central and State Governments. Agriculture sector is mainly rainfed and depends to a signifi cant extent on the depleting ground water. As nearly 55.49 percent of the State’s population is dependent on some form of farm activity for livelihoods, it is imperative to increase the farm incomes and ensuring sustainable growth in Telangana to reduce poverty. Highest priority is accorded to the Agriculture Sector in the State with the objective of shifting the excess labour force from this sector to other non-farm rural sectors such as rural industry through skill development. Ensuring food security and provision of gainful employment continues to be the essential premise of the socio economic development and employment guarantee schemes like MGNREGS and Rural livelihoods programmes.
The share of agriculture to state GSDP in 2014-15 is 9.3 percent at current prices.
Agriculture and allied sectors are constituted by crop husbandry (agriculture, horticulture), livestock, forestry and fi sheries sectors. The share of crop husbandry sector in agriculture and allied sector GSDP is declining overtime.
The share of livestock sector is around one third of total agriculture and allied sectors of GSDP during 2014-15. The growth of this sector is stable as compared to that of crop sector during the last decade. However, there has been a slow down in its growth during the last two years. The growth of livestock sector gains signifi cance in the light of the decline in the share of agriculture and allied activities share in GSDP. The detials are shown below.

24Socio Economic Outlook 2015
Table 7 : Share of allied sectors in Agricultural GSDP at Current Prices
Sector 2011-12* 2014-15Crop Husbandry Sector 57.7 51.8Livestock 34.4 39.7Forestry and Logging 5.5 5.0Fisheries 2.4 3.5Total Agriculture Sector 100.0 100.0Share of Agriculture and Allied Sector in GSDP 18.6 17.9Share of Animal Husbandry in GSDP 6.4 7.1
*Note: Reference year 2011-12 is taken due to Livestock Census.
Land Utilization
The total land area of the State is 114.84 lakh hectares, out of which the area under forest cover is 27.43 lakh hectares, constituting 23.89 percent of the geographic area. Nearly,43.20 percent area is under cultivation (49.61 lakh hectares), 8.36 percent is Current Fallow Lands (9.60 lakh hectares), 7.79 percent Land is put to non-agricultural uses (8.95 lakh hectares),5.36 percent is barren and uncultivable (6.15 lakh hectares) and 6.24 percent falls under other fallows (7.17 lakh hectares). The remaining 5.16 percent is under culturable waste, permanent pastures and other grazing lands, and land under miscellaneous tree crops and groves are not included in the net area sown (5.93 lakh hectares). Land use under various categories is indicated in the following chart

25Socio Economic Outlook 2015
Land Holdings
As per the Agricultural Census, 2010-11, the number of holdings in the State amounted to 55.54 lakh and the area held by these holding was 61.97 lakh hectares. The average size of the holdings in the State is 1.11 hectares, which is highly uneconomical to operate. In the State, 62.0 percent of the holdings are marginal (less than 1 hectare) and the percentage of small holdings (1 to 2 hectares) is 23.9 percent. Thus, marginal and small holdings constitute about 85.9 percent of total agricultural holdings in the State, making agriculture a subsistence source of livelihood for the majority of the population.
More than 60% holdings are marginal in Nizamabad, Karimnagar, Medak, Khammam and Warangal districts. However, percentage of area held by semi medium and small holdings is higher than marginal holdings. Average size of land holding is highest (1.40 ha.) for Adilabad District and lowest (0.92 ha.) for Nizamabad District. Distribution of land holdings and area according to size classes is given below.
Table 8 : Percentage distribution of Holdings and Area by size of Holdings: 2010-11
District
Holdings Area (ha)
Mar
gin
al
Smal
l
Sem
i-M
ediu
m
Med
ium
Lar
ge
Mar
gin
al
Smal
l
Sem
i-M
ediu
m
Med
ium
Lar
ge
Ave
rage
siz
e of
H
old
ing
(h
a)
Adilabad 49.8 27.7 17.5 4.6 0.4 16.9 28.3 31.9 18.1 4.8 1.4
Nizamabad 67.5 23.8 7.3 1.3 0.1 33.9 36.1 20.6 7.9 1.5 0.92
Karimnagar 67.5 21.9 8.4 2 0.2 30.9 31.8 22.9 11.8 2.6 0.96
Medak 67.9 21.7 7.8 2.3 0.3 29.9 31.3 21.2 13.2 4.4 0.97
Rangareddy 58.3 25.7 12.1 3.5 0.4 23.5 29.4 26.1 15.8 5.2 1.22
Mahabubnagar 57.9 25.4 12.6 3.7 0.4 22 29.5 27.2 16.8 4.5 1.23
Nalgonda 58.8 25.3 12.1 3.5 0.3 23.1 29.9 26.9 16.5 3.6 1.19
Warangal 67.1 21.4 8.7 2.5 0.3 28.6 29.7 22.8 14.2 4.7 1.01
Khammam 62.2 22.6 11.6 3.3 0.3 25.6 27.6 26.7 15.8 4.3 1.14
Total 62 23.9 10.8 3 0.3 25.3 30.2 25.5 15 4 1.11
Source: Directorate of Economics and Statistics, Hyderabad.
Rainfall
The State of Telangana is semi-arid. The average annual rainfall in the state is about 906 mm, 80 percent of which is received from the south-west monsoon (June-September). The rainfall in the State is erratic and uncertain and distribution of the rain fall is uneven in various mandals, thus, making agriculture a proverbial gamble in monsoon.
Of the rainfall received during the period from 2004-05 to 2013-14, the annual actual rainfall was lowest in 2004-05 with 614 mm, where as it was the highest in 2013-14 with 1212 mm as against normal rainfall of 906 mm in the state. Year wise details of Actual and Normal rainfall are depicted in the following graph

26Socio Economic Outlook 2015
.
Source: Directorate of Economics and Statistics, Hyderabad
The actual rainfall received during the South West Monsoons (June - September) period for 2013-14 was 852 mm as against the normal rainfall of 715 mm, recording an excess of 19 percent. Rainfall received during the North East monsoons (October- December) period for 2013-14 was 243 mm as against the normal rainfall of 129 mm, recording an excess of 88 percent. The trend of Rainfall over the past 10 years is depicted in the following graphs.
Rainfall during South-West Monsoon from 2004-05 to 2013-14
Source: Directorate of Economics and Statistics, Hyderabad.

27Socio Economic Outlook 2015
Rainfall During North-East Monsoon From 2004-05 To 2013-14
Source: Directorate of Economics and Statistics, Hyderabad.
During 2014-15 Agriculture Year, the normal and actual rainfall received during South-West and North-East monsoons period is given in the following charts.
Rainfall During South-West Monsoon Period, 2014 -15(Mms)

28Socio Economic Outlook 2015
Rainfall During North East Monsoon Period, 2014 -15(Mms)
Cropping Intensity
The cropping intensity (the ratio of gross cropped area to net cropped area) is one of the indicators for assessing effi ciency of agriculture sector. The cropping intensity for the year 2013-14 increased to 1.27 from 1.22 in 2012-13. The cropping intensity is highest in Nizamabad District (1.67) and lowest in Adilabad district (1.09).
Table 9: District Wise Cropping Intensity In 2013-14
Sl. No. Districts Cropping intensity1 Mahabubnagar 1.112 Rangareddy 1.143 Medak 1.234 Nizamabad 1.675 Adilabad 1.096 Karimnagar 1.537 Warangal 1.368 Khammam 1.169 Nalgonda 1.27
State 1.27Source: Directorate of Economics and Statistics, Hyderabad
Gross and Net Irrigated Area
During 2013-14, the gross irrigated area in the State has increased to 31.64 lakh hectares from 25.57 lakh hectares in 2012-13, showing an increase of 23.74 percent. The net area irrigated in the state has also increased to 22.89 lakh hectares in 2013-14 as against 17.74 lakh hectares in 2012-13, showing an increase of 29.03 percent.

29Socio Economic Outlook 2015
Gross and Net Irrigated Area from 2007-08 to 2014-15 Kharif
0.005.00
10.0015.0020.0025.0030.0035.00
20
07
-08
20
08
-09
20
09
-10
20
10
-11
20
11
-12
20
12
-13
20
13
-14
20
14
-15
(K
har
if
on
ly)
GIA under all sources (lakh ha.)
NIA under all sources (lakh ha.)
Source Wise Gross Area Irrigated During 2007-08 -2014-15
1215
251452
132231
2322222118
3226
2930
21
05
101520253035
2009-10 2010-11 2011-12 2012-13 2013-14 2014-15 ( Kharif only)
Are
a i
n L
ak
h H
ecta
res
Canals Tanks Wells ( Tube & Dug Wells ) Total
Source: Directorate of Economics and Statistics, Hyderabad.
The ratio of net area irrigated to the net area sown during the year 2013-14 is 46.14 percent and for Kharif 2014-15, the same is 35.86%. The details of the ratios from 2008-09 to 2014-15 Kharif are shown below.

30Socio Economic Outlook 2015
Table 10: Net Area Sown, Net Area Irrigated And Irrigation Ratio From 2008-09 To 2013-14
(lakh hectares)
Year Net Area Sown Net Irrigated Area Irrigation ratio%
2008-09 42.26 18.82 44.53
2009-10 39.58 14.93 37.72
2010-11 44.89 20.04 44.64
2011-12 45.73 19.85 43.41
2012-13 46.54 17.74 38.12
2013-14 49.61 22.89 46.14
2014-15 Kharif 41.46 14.87 35.86Source: Directorate of Economics and Statistics, Hyderabad
The source wise net irrigated area from 2008-09 to 2013-14 is shown in Table 10 given below. Net area irrigated by wells was the highest in 2009-10 at 84.33 percent and fell to 74.83 percent in 2013-14, while area irrigated by canals has increased from 5.07 percent in 2012-13 to 12.67 percent in 2013-14. During the given period, on an average, 76 percent of net irrigated area was through wells, showing the heavy dependence on well irrigation.
Table 11: Percentage of Net Area Irrigated by source of Irrigation from 2008-09 to 2013-14
YearNet Irrigated
Area (lakh ha.)
Source wise Net Irrigated Area (%)
Canals Tanks Wells
2008-09 18.28 11.55 13.03 72.09
2009-10 14.93 9.18 3.82 84.33
2010-11 20.04 15.76 11.87 69.63
2011-12 19.85 16.37 9.22 71.69
2012-13 17.74 5.07 8.91 83.77
2013-14 22.89 12.67 10.05 74.83
2014-15 K 14.87 10.52 6.05 81.055Source: Directorate of Economics and Statistics, Hyderabad.
Irrigation Intensity
Irrigation intensity (ratio of gross irrigated area to net irrigated area) under all sources of irrigation and wells is given in Table. Irrigation intensity under wells is 1.36 in 2013-14. Expansion in Gross and Net irrigated area has taken place due to well irrigation.

31Socio Economic Outlook 2015
Table 12: Gross and Net Irrigated Area and Irrigation Intensity from 2007-08 to 2014-15 Kharif
YearGIA under all sources (lakh ha.)
NIA under all sources (lakh ha.)
Irrigation intensity
(all sources)
GIA under wells
(lakh ha.)
NIA under wells
(lakh ha.)
Irrigation intensity (wells)
2007-08 24.46 17.49 1.40 18.23 13.14 1.392008-09 27.21 18.82 1.45 19.814 13.17 1.502009-10 21.31 14.93 1.43 18.42 12.59 1.462010-11 29.99 20.04 1.50 21.11 13.96 1.512011-12 28.64 19.85 1.44 21.57 14.23 1.522012-13 25.57 17.74 1.44 22.07 14.86 1.492013-14 31.64 22.89 1.38 23.36 17.13 1.362014-15 K 14.98 14.87 1.01 4.41 4.41 1.00
Source: Directorate of Economics and Statistics, Hyderabad.
Area and Production
Figures of area and production of food grains from 2004-05 to 2013-14 and Kharif 2014-15 in the state are shown in chart. There are fl uctuations in area and production of food grains in the past decade due to adverse seasonal conditions like drought, fl oods and heavy rains. It can be observed that in years of low rainfall the net area sown, gross irrigated area, area under food crops and production of food grains is low.
Area and Production of Food grains from 2004-05 to 2013-14 and Kharif 2014-15
41.68
75.29 65.2181.34 82.48
51.89
92.6075.01 82.42 107.49
44.30
24.97 31.31 30.81 30.09 31.72 26.49 34.43 31.09 28.36 34.5618.050
20406080
100120
2004
-05
2005
-06
2006
-07
2007
-08
2008
-09
2009
-10
2010
-11
2011
-12
2012
-13
2013
-14
2014
-15
( K
harif
onl
y )
Production ( in Lakh Tonnes ) Area ( in Lakh Hectares )
Source: Directorate of Economics and Statistics, Hyderabad.

32Socio Economic Outlook 2015
Crop Productivity
Productivity (production in kilogram per hectare of land) of rice crop is almost stable during the period 2009-10 to 2014-15 (Kharif), but the productivity of rice during Kharif 2014-15 decreased to 3054 Kgs/Ha as against 3227 Kgs/Ha during same period of the previous year i.e. 2013-14. The yield rate of Maize crop during Kharif 2014-15 is 2720 Kgs/Ha as against 4408 Kgs/Ha during the same period in the previous year. Yield rate of Jowar crop during Kharif 2014-15 was 1119 Kgs/Ha as against 1085 Kgs/Ha during last year in Kharif season. The yield rate of Green gram crop during Kharif 2014-15 was 489 Kgs/Ha as against 662 Kgs/Ha during previous year Kharif season. Red gram crop yield was estimated at 441 Kgs/Ha during Kharif 2014-15 as against 529 Kgs/Ha during Kharif season of last year. For most crops, productivity was lower during Kharif 2014-15 when compared to previous Kharif (2013-14), which is due to adverse seasonal conditions.
Productivity (Kg./Hectare) of Major Food Crops during 2009-10 to 2014-15 (Kharif)
2932 33
03
2942 32
77
3297
3054
877
913
1122
1094
1015
1119
380
443
304 55
4
530
441
125 53
7
552
735
694
489
2400
4056
3200
4440 46
85
2720
0
1000
2000
3000
4000
5000
2009-10 2010-11 2011-12 2012-13 2013-14 2014-15 ( Kharif only
Rice Jowar Redgram Greengram Maize
Source: Directorate of Economics and Statistics, Hyderabad.
Table 13: District-Wise Yield of important crops (Kg/Hectare) year ending 2013-14
District Rice MaizeBengal gram
Cotton (Lint)*
Chillies Turmeric
Adilabad 2745 3771 1371 369 2386 6721Khammam 2994 5500 1716 533 4179 5078Karimnagar 3591 5463 1352 492 2710 6303Mahabubnagar 2839 4749 1842 352 3232 5078Medak 3653 3720 1587 416 800 2869Nalgonda 3061 1675 1716 393 3196 5078Nizamabad 4004 5352 2046 338 3941 4178Rangareddy 2284 3554 1253 399 3490 3216Warangal 3141 4984 837 472 3249 4521Telangana 3297 4685 1716 423 3544 5078
Source: Directorate of Economics and Statistics, Hyderabad

33Socio Economic Outlook 2015
The productivity of Groundnut crop is almost stable from 2009-10 to 2014-15 where as productivity of Soyabean, except in 2009-10 remains stable. In case of Palm oil, there are fl uctuations from 2009-10 to 2014-15 (Kharif). Productivity of Groundnut, Soyabean and Palm oil is shown in given below chart.
Productivity of Groundnut, Soyabean and Palm oil.
1682
1793
1529
1789
1691
1700
824
1704
1616
1818
1610
1070
2615
0
1547
1
1561
0
1882
4
1259
9
1773
1
05000
1000015000200002500030000
2009-10 2010-11 2011-12 2012-13 2013-14 2014-15( Kharif only
Groundnut Soyabean Palm Oil
The Productivity of chillies crop is highest in Khammam whereas productivity of turmeric is highest in Adilabad, productivity of cotton remains more or less at the same level across the districts. The district wise productivity of Cotton (lint), Chillies and Turmeric are as shown in chart given below.
District Wise Productivity of Major Cash Crops
Outlook For Agriculture
Agriculture plays a pivotal role in the economy of Telangana and the better performance of this sector is vital for inclusive growth. Telangana went in for the Green Revolution in rice cultivation in the 1970s. There have been signifi cant changes in the structure and performance of the agrarian economy in the state in the recent years.

34Socio Economic Outlook 2015
Telangana State is endowed with bountiful resources having good soils, diversifi ed cropping pattern and major irrigation systems fed by rivers like Godavari and Krishna. Agriculture is a way of life, a tradition that has shaped the culture and economic life of the people of Telangana. Therefore, it will continue to be central to all strategies for planned socio-economic development of the State. The State Government has emphasized the need to achieve 6% growth rate and increased returns on investment to farmers through improved technology, effective extension reach, effi cient input delivery, mechanisation, marketing tie up, adequate credit and crop insurance.
The total Geographical area of the State is 114.84 lakh ha with a Gross Cropped Area of 62.88 lakh ha in the year 2013-14.
Table 14: The details of Cropped Area, Net Cropped Area
Sl. No Category Unit Value
1 Total Geographical Area Lakh Ha 114.842 Gross Cropped Area Lakh Ha 62.88
3 Net Cropped Area Lakh Ha 49.614 Gross Irrigated Area Lakh Ha 31.645 Net Irrigated Area Lakh Ha 22.896 No. of Farm holdings Lakh Nos. 55.547 Average Farm Holding size Ha 1.128 Average Annual Rainfall Mm 906.00 9 Cropping Intensity % 1.2710 Irrigation Intensity % 1.38
Operational Holdings
There are 55.54 lakh operational holdings with an area of 61.97 lakh ha. The Number of operational holdings belonging to various categories and the land operated by them (2010-11) is indicated below.
Table 15 : Land Holdings and area operated
Sl. No CategoryNumber of Holdings
(lakh Nos)
Area Operated(lakh ha)
Percentage
Number ofHoldings
Area Operated
1 Marginal 34.41 15.67 61.96 25.282 Small 13.27 18.69 23.90 30.173 Semi Medium 6.03 15.85 10.86 25.584 Medium 1.67 9.27 3.00 14.965 Large 0.16 2.49 0.28 4.01 Total 55.54 61.97 100.00 100.00
Soils
Telangana is situated on the Deccan Plateau, in the central stretch of the eastern seaboard of the Indian Peninsula. In Telangana State, there are varieties of soils ranging from fertile alluvial to very poor sandy soils. Various soil types abound, including chalkas, red sandy soils, dubbas, deep red loamy soils, and very deep black cotton soils that facilitate planting mangoes, oranges and fl owers, exist in Telangana. Red soils are predominant, accounting for 48 percent of the total area. Other soil types in the State are black cotton soils, alluvial, rocks and boulders accounting for 25 percent, 20 percent and 7 percent of the area, respectively.

35Socio Economic Outlook 2015
The soils in Nizamabad, Warangal and Nalgonda are defi cient in nitrogen (less than 44%). Phosphorous defi ciency (less than 55%) is prevalent in the districts of Adilabad, Medak, Mahabubnagar and Nizamabad.
Agro Climatic Zones
Based on rainfall, type of soils and cropping pattern, etc., the State is divided into four agro-climatic zones
Table 16 : Agro climatic zones
Sl. No.
Name of the zone DistrictsHead
QuartersGeographical area (sq.km)
No. of mandals
No. of Res. Stns.
1 Northern Telangana Zone
Karimnagar, Nizamabad, Adilabad Jagtial 35.5 144 6
2 Central Telangana Zone Warangal, Khammam, Medak Warangal 30.6 132 7
3 Southern Telangana Zone
Mahabubnagar, Nalgonda, Rangareddy Palem 39.3 164 6
4 High Altitude & Tribal Areas Zone
High Altitude & Tribal Areas of Khammam and Adilabad districts
Chintapalli 4.66 13 3
Source: Department of Agriculture
The agricultural planning for each zone is supported with the research and recommendations of Regional Agricultural Research Stations of Prof. Jayashankar Telangana State Agriculture University (PJTSAU) setup within each zone
Agriculture Potential of Telangana:
• Soils of Telangana are well drained to moderately well drained and provide favorable environment for soil fertility management.
• Soils are suitable for wide range of crops including food grains, oil seeds, pulses, fruit crops, pastures, forestry etc. There are a number of agriculture-related-institutions of importance in Telangana, including ICAR Institutes viz. DRR, DOR, MANAGE, NIPHM and NAARM, NIRD, NFDB, CRIDA and NRCS
• Food grain production recorded a growth rate of 3.97% (CAGR) as against 2.43 % at all India level.• 37.42 lakh quintals of seeds of various crops with an area of 3.22 lakh acres, HYV Paddy, Hybrid paddy,
Maize, Cotton and Bengal gram etc.are produced. Constraints in Telangana Agriculture
While there is lot of potential for growth in agriculture, there are constraints hampering the same . The major constraints are as follows.• Low and erratic rainfall leaves many areas under unprecedented drought, while some areas are subjected
to fl oods • Semi-arid climate restricts the growth of natural vegetation, due to which, scope of organic matter
development in soils is limited and, therefore, the most soils are inherently poor in available Nitrogen, the chief nutrient for plant growth 63% of the agriculture is rainfed, which is exposed to the hostilities of climate
• Among the farming community, about 85% of farmers are either marginal or small with poor socio-economic condition High labour cost and low mechanization levels have increased the cost of cultivation

36Socio Economic Outlook 2015
Agricultural extension is devoid of enough strength and mobility to address each and every farmer at right time
State’s Agriculture Vision
Despite the constraints, it is important to improve the agricultural situation in the state, duly harnessing the available agricultural potential and integrating it with technology and resources. Keeping in view the future requirements of agricultural production, a vision for Telangana is framed as put forth here under: Empowering the farmers in seed management, enabling them to acquiring good quality seed at the right time and at affordable cost
• Making farming a commercially viable endeavour
• Providing easy access to inputs, fi nance, technology and IT
• Increasing irrigated area by utilizing the available surface and groundwater potential
• Providing means for land development for effi cient soil and water management
• Providing trained extension staff for technology transfer at the door step of farmers
• Identifying the yield gaps and bridging them through suitable technologies
• Motivating for the farmers to adopt Integrated Nutrient Management (INM) and balanced fertilization with necessary demonstration and training support
• Providing short term weather forecasting for instant action
• Promoting farm mechanization through access to farm machinery and equipment at affordable cost
• Strengthening IT to help the farmer in accessing information on weather, input availability and markets
• Improving water use effi ciency through drip and sprinkler irrigation
• Empowering the farmers for eco-friendly agriculture through INM and IPM
• New Initiatives for Sustainable Agriculture Developm3ent
New Initiatives For Sustainable Agriculture Development
Strategy – Making Vision A Reality
TO MAKE THE VISION A REALITY THE FOLLOWING FLAGSHIP SCHEMES IN AGRICULTURE SECTOR DURING 2014-15 ARE IMPLEMENTED.
Seed Bowl
Seed is a critical determinant in increasing the agricultural productivity. The performance and effi ciency of other inputs depends on the quality of seed produced and supplied.
Telangana Government is developing a strategy to make the State, as the “Seed Bowl” of the country, endowed as it is with congenial climatic conditions and soils suitable for quality seed production of various crops viz., Paddy, Maize, Soybean Castor & Cotton. In view of the above, a fi ve year plan has been prepared for production of breeder and certifi ed seed by involving the technical expertise of Prof. Jayashankar Telangana State Agriculture University (PJTSAU) The seed production programme is planned to be taken up through Seed Village Programme and Seed Production in State Seed Farms and Government Agencies like Telanagana State Seed Development Corporation (TSSDC), Oil fed, MARKFED and HACA.

37Socio Economic Outlook 2015
The state produces 37.42 lakh quintals of seeds of various crops with an area of 3.22 lakh acres, mainly Hybrid paddy, Maize, Cotton and Bengal gram etc. which are supplied to our farmers and also to various other states. Thus the Telangana is the seed capital of the country.
Hence production and supply of quality seed to the farmers is one of the most important interventions proposed under the plan budget for which an amount of Rs 50.00 crores is allocated to strengthen the seed chain, which includes improving of seed varietal replacement in all crops, construction of additional seed storage godowns, procurement of seed processing equipment, strengthening of seed testing laboratories etc.
There are 10 seed farms in the state with an area of 536 ha of cultivable area. The main objective is to produce foundation seed and supply under the Seed Village Scheme. It is proposed to strengthen these farms by supplying Breeder seed for multiplication while providing assured irrigation and infrastructure support like seed processing and storage.
Development of Crop Colonies
Telangana State is having large areas under Paddy, Maize, Pulses and oilseeds like Soybean Castor and Groundnut with suitable soils and climatic conditions. It has been proposed to establish crop colonies under these crops with a view to expand area, increase production and productivity and to achieve self-suffi ciency.
Seeds are critical input for long term sustained growth in Agriculture. Timely availability of certifi ed seed to farmers with good yield potential continues to be a major problem in the state.
In India only 20% of the farmers use certifi ed seed and remaining 80% use farm saved seeds, where as in Telangana about 70%-80% farmers use certifi ed seeds. It may be mentioned here that rain fed areas are vulnerable to high risk and seed systems have to be re-oriented towards meeting shortages on account of supply shortages.
Seeds being rendered futile in rain fed areas owing to prolonged dry spells immediately after sowing is a common occurrence
There should be assured availability of a second batch of seed to repeat sowing if the fi rst sowing fails
In case of long dry spells the State Seed System must be capable of providing seeds for contingency plan.
There is a great potential for seed production in Telangana. Hybrid Cotton Seed Production is primarily taken up in the districts of Mahabubnagar, Hybrid maize Seed production is taken up in Karimnagar, Nizamabad, and Medak districts. The Hybrid paddy seed is produced in Karimnagar and Warangal districts.
Similarly there are large areas under seed production of varieties of various crops like Paddy, Castor, Pulses, Groundnut, Soybean and vegetables in Karimnagar, Warangal, Nalgonda, Nizamabad, Mahabubnagar and Adilabad. Hence, it is proposed to establish crop colonies under these crops with a view to expanding area, increasing production and productivity to achieve self-suffi ciency in seeds.
Consumption of Fertilizers:
The consumption of fertilizers in 2014-15 is 19.40 lakh metric tonnes as on date in Telangana. Consumption of fertilizers by nutrients was the highest in 2010-11 at 14.81 lakh mts which has been falling there after to 13.39 lakh mts in 2013-14 and to 12.48 lakh mts in 2014-15. Per hectare consumption of fertilizers is highest for Karimnagar district and lowest for Medak district.

38Socio Economic Outlook 2015
Farm Mechanisation:
Most of the farming is carried out on small holdings. Mechanization possibility is strongly infl uenced by the farm size, cost of farm labour, availability and suitability of machines and energy. The farming system continues to utilize manual power, animal power and tractor power. In order to bring more land under cul-tivation and to improve productivity per unit area, the Government is promoting farm mechanization by en-couraging machinery to be used from sowing to harvest, like power tractors, power tillers, including through the use of renewable energy.
Objectives of the scheme
• Reduction of physical drudgery associated with various farm operations
• Making available the presence of mechanization in every village.
• Rise in Productivity level/ Net income per hectare
• Helps in the protection of the produce and byproducts from qualitative and quantitative damages
• Product quality improvement through use of Post harvest machinery/ improved processing methods
Reduction in cost of cultivation for major crops grown in the State These objectives are to be pursued with the view point that mechanization induced enhancement in productivity could be one of the important inputs to usher in all round development in the rural areas.
An amount of Rs 100.00 crores is proposed to supply various farm implements i.e. Animal Drawn Implements, Tractor Drawn Implements, High Cost Machinery (Upto 1 lakh & 1 to 5 lakh), Rotovators, Harvesters, Taiwan Sprayers, Power Tillers, Mini Tractors, Post Harvest Equipment, Plant Protection Equipment, Inter cultivation Equipment and for establishment of Custom Hiring Centers for Paddy Land Preparation package. The subsidy proposed under Normal State Plan (NSP) is 50%.
Farm Mechanization - Rashtriya Krishi Vikas Yojana (RKVY)
An amount of Rs 67.40 cores is proposed for establishment of Custom Hiring Centers for Paddy, Cotton, Maize, Groundnut, Sugarcane, Mini SMSRI, Paddy Nursery Package, Paddy Harvesting package, Post Harvest Items & Procurement Centers, Implement Hiring Stations, Tarpaulins, Solar fencing, Paddy reapers, Power Tillers, Seed cum ferti-drills, Maize Shellers, Multi Crop Threshers, Rotovators, Power Weeders, Improved farm machinery (4- Row walker type Paddy Transplanters, Paddy Threshers, Turmeric Boilers, Laser guided land leveler, Wet land leveler, Groundnut wet pod thresher, Combine Harvesters etc) and for organizing Trainings & Demonstrations and also for establishment of Solar pump sets.
Out of total amount proposed, an amount of Rs 10.42 crores which is the unspent balance available under RKVY 2013-14 will be utilized for establishment of Solar Pump sets during 2014-15 @ Rs 1,00,000/- subsidy from the Department of Agriculture and 30% from New & Renewable Energy Development Ltd. (NRED). The remaining amount of Rs 56.98 crores was allocated and Rs 22.00 crores was released to all the districts. The subsidy approved by State Level Sanction Committee (SLSC) is 50% for all the components supplied under FM component of RKVY scheme.
Sub-Mission on AGRICULTURAL MECHANIZATION (SMAM)
An amount of Rs 23.54 crores is proposed for supply of Mini Tractors, Power Tillers, Self Propelled machinery, Animal drawn implements, Tractor drawn implements, Plant protection equipment, establishment of Farm Machinery Banks for Custom Hiring Center up to Rs. 10 lakh to Rs. 25 lakh and for organizing trainings & demonstrations to farmers.

39Socio Economic Outlook 2015
Out of the total amount proposed, Rs 7.54 crores was already allocated to the districts for utilization towards above components. The subsidy pattern varies with the component and category (SC/ST/Women/SF/MF and other farmer) of farmer as per the SMAM guidelines communicated by Government of India.
Farm Mechanization- National Food Security Mission (NFSM)
An amount of Rs 9.11 crores was allocated to districts towards supply of Cono weeder, Sprayer, Power weeder, Drum seeder, Seed drill, Paddy thresher, multi-crop thresher, Self Propelled Paddy Transplanter, Pumpsets, manual Winnowers, Assistance for Custom Hiring Centers i.e.Puddling with Rotavator, Ridge Furrow Planters @ 50% subsidy and towards labour charges for spraying with Taiwan Sprayers, Combine Harvester under NFSM Rice.
Extension
The extension work at fi eld level is suffering for want of staff and staff mobility. Despite this, agricultural growth has been supported by several extension support mechanisms that included farmers’ meets under Rythu Chaitanya Yatralu, Rythu Sadassulu, awards to the best performing farmers, agricultural technology management (ATMA), strategic research extension plan, strategic extension work plan, farmers’ schools,; periodic soil testing reports providing soil health cards to the farmers; extensive use of information and communication technology tools and web based interventions like AGRISNET (http://agrisnet.tg.nic.in-Telugu);interactive services from the Agricultural University – Kisan call centres operated by the BSN-L,inter-active voice recorded system etc.; e-agrilabs to test the fertiliser and pesticide applications; Mee-Seva applications for farmers; farm mechanisation support system at the gram panchayats and capacity building of farmers for their effective use. Rashtriya Krishi Vikas Yojana, a fl agship programme with 100 percent Central Government support is a major Extension initiative.
Agricultural Credit
The Annual Credit Plan for 2014-15 was Rs.27233.59 crores for the Telangana towards Agriculture Credit, nearly Rs.17636.44 crores (65%) was disbursed under Agricultural credit. An amount of Rs.13,561 crores (72%) was disbursed under crop loans as against the target of Rs.18,717.95 crores and an amount of Rs. 2794.15crores (45%) was disbursed as against the target of Rs.6238.48 crores under Agriculture Term Loans and Rs.3,132.29 crore(137%) was disbursed as against the target of Rs.2,277.16 crore under Allied activities.
Crop Loan Waiver Scheme 2014-15
Farmers in the Telangana state have faced severe fi nancial crisis due to frequent crop failures, lack of ade-quate support price, steep hike in input costs etc. To mitigate the plight of the farmers, the Telangana Gov-ernment has decided to waive crop loans taken by the farmers up to Rs.1.00 Lakh per farmer. Agricultural loans on gold mortgage have also been included along with the interest. Government of Telangana released an amount of Rs. 4250.00 crores as fi rst installment under Loan waiver scheme and the amount was credited into the bank accounts of over 34 lakh farmers.
Crop Insurance
Three Crop Insurance schemes have been implemented in Telangana State during Kharif & Rabi 2014-15 viz.
National Agriculture Insurance Scheme (NAIS)
b) Weather Based Crop Insurance Scheme (WBCIS)
c) Modifi ed National Agriculture Insurance scheme (MNAIS)

40Socio Economic Outlook 2015
National Agricultural Insurance Scheme (NAIS) was introduced from Kharif 2000 season onwards with involvement of Agriculture Department, Agriculture Insurance Co. (Implementing Agency) and Directorate of Economics and Statistics.
Under the scheme, 19 crops were covered in Kharif and 10 crops in Rabi. 10 % of premium subsidy is al-lowed to small and marginal farmers only under National Agriculture Insurance Scheme (NAIS).
Objectives
To provide a measure of fi nancial support to the farmers in the event of yield loss recorded by conducting Crop Cutting Experiments.
• To restore the credit eligibility of a farmer after a crop failure for the next season.
• To encourage the farmers to adopt progressive farming practices, high value in-puts and higher technology in Agriculture.
• To help stabilize farm incomes, particularly in disaster years.
During Kharif 19 crops covered and 10 crops in Rabi. 10 % of premium subsidy is allowed to small and marginal farmers only under National Agriculture Insurance Scheme (NAIS).
Weather Based Crop Insurance Scheme (WBCIS)
For the benefi t of farming community, apart from the “National Agricultural Insurance Scheme” (NAIS) for the fi rst time in the State, the Government have implemented the “Weather Based Crop Insurance Scheme” during Kharif 2009 season. The Scheme aims to mitigate the hardship of the insured farmers due to crop losses resulting from incidence of adverse deviations of weather parameters like rainfall, temperature, relative humidity etc.
Automatic Weather Stations (AWS)
To measure the weather parameters “Automatic Weather Stations” (AWS) are established in all the mandals of the State at the rate of one per Mandal. Around 900 AWS are working in the State.
National Crop Insurance Programme (NCIP)
For the benefi t of the farming community the Government of India have issued orders to implement Na-tional Crop Insurance Programme (NCIP) for Kharif 2014 onwards by merging MNAIS & WBCIS in the state which has many more farmer friendly features.
Modifi ed National Agricultural Insurance Scheme (MNAIS)
The Government of India introduced Modifi ed National Agricultural Insurance Scheme (MNAIS) during Rabi 2010-11 on pilot basis in Warangal District which has many more farmer friendly features such as cover-ing for localized calamities (hail storm), prevented sowings, coverage for major crops in the district, coverage on individual farmer basis with 40 to 75% subsidy in premium etc. Rice being a major crop, has been selected for implementation under the scheme, with village being the unit of implementation. The scheme is success-fully under implementation and has been extended to all the districts in the State from Rabi 2014-15 season.

41Socio Economic Outlook 2015
National E-Governance Plan – Agriculture (NeGP-A)
NeGP-A has been approved by GoI which is a part of Sub Mission on Agriculture Extension under NMAET. NeGP-A is proposed to be implemented across the country and aims at offering Government to Citizen / Farmer (G2C or G2F), Government to Business (G2B) and Government to Government (G2G) agricultural services in an integrated manner through the Central Agriculture Portal (CAP) and State Agriculture Portals (SAPs). GoI is procuring hardware up to block level centrally. Before the hardware is supplied amount has been released for site preparation i.e. electrical works and furniture for Blocks and Training Centers. Amount has been released for connectivity and setting up of Project Monitoring Unit (PMU) for 2 months. Total amount of Rs. 66.55 lakhs has been released by GoI during this fi nancial year.
Rashtriya Krishi Vikas Yojana (RKVY)
RKVY is one of the fl agship programmes of Government of India with 100% Central Aid being imple-mented with an objective to achieve annual growth rate in excess of 4% in Agriculture sector.
Rashtriya Krishi Vikas Yojana (RKVY) an Additional Central Assistance scheme (100% GOI grant) intended to develop Agriculture and Allied Sectors in holistic manner to achieve the targeted annual growth.
The departments covered in RKVY scheme are Agriculture & allied sectors such as Agriculture, Horti-culture, Animal Husbandry, Fisheries, Dairy Development, Prof. Jayashankar Telangana State Agriculture University, Horticultural University, Veterinary University, AGROS, Sericulture, T.S. MARKFED & Food Processing (Industries) etc.
Thrust on farm mechanization as the availability of farm labour and escalated labour cost became major concerns for the present day farming. More mechanized farm equipment to the farmers are being provided so that they can undertake timely Agriculture activities. As per the requirement of the farmers, Equipment such as Tractors, Tillers, Custom Hiring Centers for High Cost Machinery like Multi Crop Threshers, Maize Sheller, Rotovators and combined harvesters etc., will be made available with the subsidy up to 50%, not exceeding Rs. 50,000/-. The allocations under RKVY to Telangana state is Rs. 195.27 crores during the year 2014-15.
National Food Security Mission (NFSM)
NFSM-The fl agship scheme launched by Government of India during 11th plan is continued with in 12th plan. Under National Food Security Mission Government of India has envisaged certain objectives during the 12th Plan i.e.
Government of India provides 100% fi nancial assistance for implementation of the scheme. An amount of Rs. 85.43 crores is allocated under NFSM during the year 2014-15
COOPERATION
Telangana State Cooperative Marketing Societies Federation Limited Hyderabad (T.S.MARKFED)
Telangana State Co-operative Marketing Societies Federation Limited Hyderabad (T.S. MARKFED) reconstituted on 02-6-2014, after the State is bifurcated, it covers nine district Cooperative Marketing Societies that undertaking the procurement and marketing of agricultural produce enabling the farmers to get remunerative prices. These Societies had a business turnover of Rs. 201.48 crores in 2013-14 compared to Rs.59.17 crore in the previous year. It has only one feed mixing plant in Karimnagar and one cotton ginning plant in Adilabad.

42Socio Economic Outlook 2015
Agriculture Marketing
A comprehensive Andhra Pradesh (Agriculture Produce and Livestock) Markets Act has come into force from 18.11.1996., which is to be adopted for Telangana State. The objective of the Markets Act is to protect the interests of farmers in the sale of agricultural produce and to ensure remunerative price to them and to protect them from the clutches of unscrupulous traders.
There are 150 Agricultural Market Committees under which 306 market yards are notifi ed in the State consisting of 147 main yards and 101 sub yards. In these 150 Agricultural Market Committees, Functional markets are 64, Seasonal markets are 16, Cattle markets are 19, Check Posts are 264, and Rythu Bazars 26.
Rythu Bandhu Pathakam
The Rythu Bandhu Pathakam is being implemented since 1990. But the scheme was not popular among the farmers as the upper limit of the loan amount under the scheme was Rs. 1.00 lakh only and after having consultations with farmers, the Govt. of Telangana have issued revised guidelines by enhancing the ceiling limit of the loan amount to Rs. 2.00 lakhs without any interest upto 180 days to avoid distress sales.
The renewal period of Rythu Bandhu Pathakam card is also extended to 5 years as against the 3 years existing earlier, the department spent Rs. 1.74 crores during 2014-15 for providing pledge loan to farmers to help them avoid distress sale of their produce. 1111 farmers in 2013-14 benefi ted as against 953 farmers in 2012-13 under Rythu Bandhu Pathakam.
Rythu Bazars
There is network of 30 Rythu Bazars in the State. On an average about 3115 farmers sell over 8,000/- to 10,000/- lakh quintals of vegetables, every week through these Rythu Bazars directly to the consumers. Mobile Rythu Bazars are operating in Hyderabad and Secunderabad cities for selling graded vegetables. This has proved to be successful.

43Socio Economic Outlook 2015
HORTICULTURE:NEW INITIATIVES2.2
Horticulture is identifi ed as one of the growth engines in the farm sector. It has been identifi ed as one of the “focus areas” for development of the state. Being traditionally rich with horticulture resources, the State having favourable climatic conditions suiting various horticulture crops, these resources are further blended with latest technology and practice to meet the global demand for qualitative produce, thus making a favour-able destination for global sourcing.
Horticulture is a signifi cant contributor to the Telangana State GSDP. Total area under Horticulture crops covers 10.86 lakh hectares with a total production of 112.56 lakh MTs. Major fruit crops in the state are Man-go, Citrus, Banana, Guava and Papaya while vegetables like Tomato, Brinjal, Bhendi and various varieties of Gourds are predominant. Chillies, Turmeric and Coriander are important spices. Coconut, Cashew and Oil palm constitute major plantation crops. The targeted area under Horticulture for the next fi ve years (2018-19) Action Plan is 14.48 lakh Ha, with estimated production of 152.31 lakh MTs. In India, under cultivated area Telangana ranks 3rd in fruits and 1st in Turmeric.
The Department of Horticulture is implementing various schemes with main thrust on core programmes to give a boost to horticulture sector and to tap available potential for the development of horticulture sector in the State. The major programmes are Micro Irrigation Project (MIP),Mission for Integrated Development of Horticulture (MIDH), Rastriya Krishi Vikas Yojana (RKVY), National Mission for Oilseeds and Oil Palm Mission (NMOOP) and State Plan Schemes.
During the year 2014-15, an amount of Rs.452.75 crores were allotted for Promotion of horticulture Activi-ties, Beautifi cation of Public Gardens and the construction of Poly houses in 1000 acres on 75% subsidy @ Rs.29.52 Lakhs per acre, limited to 3 acres per benefi ciary during 2014-15.
STATE HORTICULTURE MISSION (SHM)
The State Horticulture Mission(SHM), a Centrally Sponsored Scheme launched in November 2005 covers establishing of new gardens, rejuvenation, Integrated Pest Management(IPM) / Integrated Nutrient Man-agement(INM), Post Harvest Management (PHM)etc., and training of farmers to substantially enhance their incomes.
Though, the production is being increased multi-fold in Horticulture crops, the post harvest losses are around 30%-35% due to poor handling and storage. This need to be increased by utilizing available surplus produces. Processing and marketing through Agricultural Export Zones and private participation is to be encouraged in the potential regions.
“Earth laughs in a fl ower.”- Ralph Waldo Emerson

44Socio Economic Outlook 2015
An amount of Rs.28.30 Crores was utilized so far for implementation of various activities like Establishment of new gardens, Rejuvenation of senile gardens, IPM/INM, HRD, Organic farming, Farm mechanization and Post Harvest Management etc during 2014-15.
Post-Harvest Management
Horticulture crops are highly perishable and require special attention on harvesting, handling, packaging, storage and processing operations and capacity building of farmers. The focus was on providing pre-harvest tools and development of post harvest infrastructure facilities like Pack houses, Cold storages, Drying plat-forms, Refer Vans, Ripening Chambers etc. A total of (19) Cold storage units, (12) Ripening Chambers, (31) Pack houses and (40) Turmeric Boiling units were established. From 2013-14 onwards fi nancial assistance is proposed online credit to the farmers account through HORTNET to ensure transparency and accountabil-ity in implementation of SHM programmes.
Improvement of Production and Productivity of Horticulture Crops
New gardens were established in an area of 3155 ha and Rejuvenation of old and senile orchards and Canopy management was done in an area of 8255 Ha.
Protected Cultivation
Government intends to take up a construction of Green Houses in 7.9 Ha, to promote cultivation of High Value vegetables and fl owers to ensure that better quality of produce and also higher returns to the farmers. Assistance was provided to promote Mulching in 812 Ha.
On Farm Water Management Programme (Ofwm-Nmsa) & Micro Irrigation Scheme Through State Plan (100%)
Effective utilization of every drop of water through micro irrigation is imperative for improving crop pro-ductivity, production and to achieve sustainable improvement in living standards of small and marginal farmers of State by improving the water use effi ciency through micro irrigation and farmers can get assured additional income. Effective utilization of micro irrigation enables water saving and enhanced plant growth and yield, saving in labour and energy, most suitable to poor soils, control of weeds, economy in cultural practices and easy operations, possibility of using saline water, improves fertilizer effi ciency, fl exibility in operation and no soil erosion
Objectives
• Productivity enhancement & Quality improvement.• Improving water& Fertilizer use effi ciency.• Improving Energy & Labour effi ciency. • Produce more with less water.Components of Micro Irrigation
• Drip Irrigation for wide spaced crops (Online)• Drip Irrigation for closed spaced crops (Inline)• Mini & Micro Sprinklers• Portable, Semi Permanent & rain guns sprinklers

45Socio Economic Outlook 2015
Need for Micro Irrigation in Telangana
In Telangana, out of 14.85 lakh ha of net irrigated area irrigated with ground water, as on now only 4.7 lakh ha are only covered under micro irrigation, leaving a balance potential for micro irrigation area of 10.00 lakh ha.
Table 17 : District wise area covered under Micro Irrigation
Sl No
Name of the
District
Ground water net irrigated area (Ha)
Area covered under Micro Irrigation from 2003-04 to 2013-14 (Ha)
Balance Potential Area
(Ha)Drip Sprinkler Total
1 2 3 4 5 6 7(3-6)
1 Adilabad 60960 16703 17301 34004 26956
2 Karimnagar 311116 28260 9611 37871 273245
3 Nizamabad 169570 25099 6321 31420 138150
4 Khammam 94049 24039 9481 33520 60529
5 Warangal 256866 33512 9086 42598 214268
6 Nalgonda 185611 76949 9383 86332 99279
7 Medak 130517 47538 19335 66873 63644
8 Mahabubnagar 205217 80059 31642 111701 93516
9 Rangareddy 71942 23516 11928 35444 36498
Total 1485848 355675 124088 479763 1006085
• Therefore there is urgent need to increase the area coverage under micro irrigation per year from 44000 to 100000 ha per year in State.
• To cover more area under micro irrigation for optimal utilization of resources, to enhance productivity and net income of poor farmers in monsoon dependent Telangana State as there is lot of potential for micro irrigation. Thus Action Plan with 1 lakh hectares per year under micro irrigation is prepared to cover at least 50% of potential area in next fi ve years 2014 to 2019 under micro irrigation as area proposed under NMSA by Commissioner of Horticulture united AP for Telangana is only 44000 ha only for the year 2014-15.
• Focus Districts: Mahabubnagar, Rangareddy, Medak, Nizamabad, Adilabad, Karimnagar, Warangal, Khammam & Nalgonda.
• Horticulture Crops–Vegetables, Chillies, Spices, Fruits, Papaya & Oil Palm.
• Agriculture –Sugarcane, Cotton, Maize, Red Gram, Groundnut & Soyabean.
• Sericulture– Mulberry
Polyhouse for Cultivation of Vegetables : 2014-15
To promote high value horticulture crops and for continuous production and supply of Vegetables and fl ower crops encouraging poly houses in an area of 1000 acres in Telangana State for the year 2014-15. Poly Houses are being constructed to protect the structures made up of GI Pipes covered with UV stabilized Polyethylene (LLDPE) and nets (insect/shade net) used for cultivation of high value Horticulture crops.

46Socio Economic Outlook 2015
These structures are erected for protection of crops from adverse climatic conditions and for growing crops irrespective of their growing seasons.
Objectives
• To enhance productivity per unit area.
• Promotion of high value Horticulture crops under Poly houses. Year round production of fl oricultural crops and also off season production of vegetables.
• Disease free and genetically superior transplants can be produced continuously, there by generation of livelihoods in Rural areas
Progress Since Inception Under Shm Scheme (2007-2013)
• Under the Scheme State Horticulture Mission, subsidy has been provided to 346 no. of farmers in all 9 districts of Telangana, for establishment of Poly Houses in an area of 130 acres with fi nancial assis-tance of Rs. 24.42 Crores.
• An amount of Rs.9.91 Crores was extended as assistance towards Plant Material (Flowers) under Pol-yhouses and an amount of Rs. 22.86 Lakhs was extended as assistance towards Plant Material (Vege-tables) under Poly houses.
• Total assistance of Rs. 34.33 Crores were provided to the benefi ciaries for encouraging Protected Cul-tivation.
District wise achievement of Poly Houses, Plant Material (Flowers) & (Vegetables) under State Horticulture Mission since 2007 to 2013 are as follows:
Table 18: Poly Houses established in Telangana State Ssnce inception of SHM (2007-2013)
SI. No.
Name of the DistrictNo. of Farmers
CoveredArea in Acres.
Amount of subsidy (in Iakhs)
1 Ranga Reddy 181 61.644 1139.492 Mahabubnagar 55 21.879 397.503 Medak 87 32.575 608.824 Nalgonda 17 9.875 226.515 Adilabad 2 1.004 18.756 Warangal 3 2.5 46.757 Karimnagar 1 0.25 4.67
346 129.727 2442.50
Best Practices - Poly House Cultivation
• Expenditure including maintenance: Rs.80,000/- per month
• Net Income per Month Rs.1,00,000/- (Average)

47Socio Economic Outlook 2015
Poly House Cultivation
‘‘Mana Vooru- Mana Kurgayalu’’ Programme
Vegetable Initiatives for Urban Clusters (VIUC) scheme is for Strengthening of Vegetable Value chain and creating Marketing linkages in 3 districts i.e. Mahbubnagar, Medak & Ranga Reddy which are main feeders of Hyderabad Market. Major components are Supply of Hybrid Vegetable seeds, Permanent pandals, Trellies, Shadenet houses, Collection Centers, etc., the outlay proposed under VIUC is Rs.625.00 lakhs.
Inauguration of Mana Vooru- Mana Kurgayalu Programme at Medak
FLORICULTURE
Floriculture is one of the focus areas of Horticulture and has signifi cant potential for exports. Department provides incentives for encouraging the farmers to take up the fl oriculture activity. Bathukamma festival de-clared as State festival is basically a festival of fl owers decorating the Goddess in which people of Telangana repose their faith and is expected to provide impetus to the coming years.

48Socio Economic Outlook 2015
ANIMAL HUSBANDRY AND FISHERIES
2.3
Animal Husbandry sector consists of bovine, ovine, pig and poultry population. Bovine population is further classifi ed into cattle and buffaloes and ovine population into sheep and goat. Telangana is blessed with rich livestock resources especially Cattle and Sheep population accounting to 5.52% of Country’s population. The State stands 10th in Livestock population 1st in Sheep population, 12th in Goat population, 5th in Poul-try, 13th in Bovine population and 17th in Pig population, in the country as per the Livestock Census, 2007.
About 29 Lakh families in Telanagana State are engaged in livestock sector for their livelihood. The value of livestock produce is estimated to be Rs. 30584 crores at current prices and Livestock contributes 7.1% to the Gross State Domestic Product and formed 39.69% of the Agriculture sector in 2014-15(Advance Estimates).
With an annual output of 1006 crore eggs, Telangana stands 3rd in egg production in the country. Every eigth egg in the country comes from Telangana. Annual meat production of 4.46 Lakh Mts Telangana stands 6th in the country and annual production of 39.24 lakh Mts of milk, Telangana occupies 13th position in the country in milk production.
The mandate of the Department is to increase the availability of Animal origin foods like milk, meat and eggs to human population for consumption through scientifi c breeding, feeding and disease management of livestock.
Animal Husbandry schemes have been formulated to pursue the well-laid National policies aimed at improving livestock production, fi ghting protein hunger, improving nutritional standards of human population and provision of technical support for the maintenance and improvement of livestock.
Milk Production and Productivity
The State has produced 2354.32 lakh MTs of milk during 2014-15(upto 31.10.2014). The per capita availability of milk at 234 gm/day in the state and has to catch up with the national average of 263 gm/day even of 2009-10. The State Government has sanctioned a cash incentive of Rs.4.00 per litre of milk to the Telangana Dairy farmers supplying milk to the State Dairy Federation, with a view to encourage the farmers, to increase their profi ts in area of dairy and to sustain their livelihood in the villages. The Government of Telangana, to encourage the farmers, to increase their profi ts and to sustain their livelihood, launched a new scheme on 01.11.2014 by providing a cash incentive of Rs.4.00 per litre of milk to the Telangana Dairy farmers for supplying milk to the State Dairy Federation. So far an amount of Rs. 537.49 lakhs is paid to the dairy farmers of Telangana as an incentive amount.

49Socio Economic Outlook 2015
Table 19: Status of Milk Procurement
S No.Name of the Milk
Shed
Achievement
No. of pourers Milk Procurement (in litres)
01-11-2014 26-01-2015 01-11-2014 26-01-2015
1 Medak 4250 12421 27053 37777
2 Nizamabad 8336 10572 31188 29037
3 Khammam 2478 6250 5518 12690
4 Warangal 9420 15550 34254 47001
5 Mahabubnagar 7915 10700 29449 69869
6 Adilabad 0 398 0 2204
7 Nalgonda 0 195 0 1358
8 Karimnagar 0 190 0 1392
Total 32399 56276 127462 201328
Mana Vooru – Mana Paadi Pranalika
The Government launched another innovative programme called “MANA VOORU – MANA PAADI PRANALIKA” by way of pooling resources, manpower and convergence of various Government Schemes. Initially 425 Milk Producers’ Co-operative Societies are identifi ed. The Stree Nidhi Credit Co-operative Fed-eration Ltd., has come forward for promotion of dairy activities in the State of Telangana by extending loans for purchase of milch animals with a condition that, the milk will be supplied to the Village Milk Collection Center (VMCC) of Telangana State Dairy Federation, without any interruption.
All the initiatives taken up have resulted in increase of milk procurement in Telangana State from 1.27 Lakh litres per day (end of October i.e. before announcement of the incentive) to 2.01 Lakh litres per day as on 26-1-2015.
Meat and Egg Production
The State produced 294.00 lakh MT of meat and 624.80 crores eggs during 2014-15 (upto 31-10-2014). Both meat and egg production is subjected to fl uctuations in the last decade.
The details of milk, meat and egg production are given below.
Table 20: Production of Milk Eggs & Meat in Telangana
Item Unit 2012-13 2013-142014-15
(Up to 31.10.2014)
Milk 000MTs 3950 3924 2354.32Eggs Cr.Nos 942 1006 624.80Meat 000MTs 428 446 294.00
Source: Animal Husbandry Department.

50Socio Economic Outlook 2015
Size and Composition of Bovine and Ovine Population
The State has 92.28 lakh bovines according to Livestock Census of 2012. Cattle account for 50.34 lakhs and buffaloes 41.94 lakhs. The State had a total ovine population of 175.49 lakh, of which 128.74 lakh are sheep and 46.75 lakh are goats according to Livestock Census 2012.
Table 21 : Size and Composition of Bovine Population (No. Lakh)
Category As per 2007 Census As per 2012 Census
Cattle 57.50 50.34
Buffaloes 50.42 41.94
Sheep 133.57 128.74
Goat 48.01 46.75
Pigs 2.32 2.51
Poultry 494.47 691.58Source: Directorate of Animal Husbandry
Animal Health Activities
Animal Health plays an important role in the growth of livestock industry, since the livestock production programmes will not be successful without providing necessary safeguards against hazards of animal diseas-es. The department has taken up strengthening of existing institutions to improve quality of Animal Health Services by providing facilities for surgery, disease investigation and treatment. Polyclinics were established at district headquarters to address this issue. Every mandal has been provided with a veterinary graduate to effectively render Animal Health Services, support production program and for prevention and control of livestock diseases.
Types of Regular Institutions
Veterinary Polyclinics (8), Super Specialty Veterinary Hospital (1), Veterinary Hospitals (101), Veterinary Dispensaries (917), Mobile Veterinary Clinics (11) and (1105) Rural Livestock Units are functioning to attend to animal health needs throughout Telangana. 401.66 Lakhs cases were treated, 2.24 lakhs castrations done and 325.94 Lakhs vaccinations conducted by these institutions during the year 2014-15 (up to 31.12.2014). Proper diagnosis of disease is half the treatment. Towards this end, 9 Animal Disease Diagnostic Laborato-ries (ADDLs) were made functional.
Veterinary Biological Research Institute, Hyderabad
The Veterinary Biological Research institute is the main source of production of Viral and Biological Vac-cines in the State and produces nine types of viral and bacterial vaccines. Modernization of vaccine produc-tion laboratories in the V.B.R.I is completed for bacterial, PPR and Sheep Pox vaccines to maintain GMP standards as per Drugs and cosmetics Rules 1945 and trial batches of vaccine production is under progress. During the year 2014-15 (up to Dec’ 2014), 202.60 Lakh doses of various types of vaccines were produced by the institute for the livestock population in Telangana state.
51Socio Economic Outlook 2015
Government Livestock Farms
The department has established cattle breeding farms at suitable places to support cattle development activ-ities for producing pedigree bulls in Telangana Region. At present 22 Deoni cattle are maintained at Deoni Cattle breed farm during 2014-15 (up to 31.12.2014) at Gudgarpally in Medak district.
Feed and Fodder Development
High yielding and nutritious fodder are essential for scientifi c and economic management of livestock particularly in cross breeds. It is the endeavour of the department to popularize and propagate the high yielding fodder crops with the farmers on available arable and non-arable land, as scientifi c feeding of livestock is essential for increased productivity of milk and mutton. To intensify this activity, fodder slips, improved varieties of fodder and pasture seeds have been supplied to farmers with most encouraging results. 4.64 Lakh acres during 2013-14 and 2.69 Lakh acres during 2014-15 (up to 31.12.2014) were brought under fodder cultivation. Fodder development programmes are being taken up under regular plan schemes to enhance milk production in the state.
Sheep Development
Telangana Districts have about 129 lakhs Sheep population and 47 lakhs Goats. About 4.5 lakhs rural fami-lies belonging to socially and economically backward classes are involved in sheep & goat rearing.
Poultry Development
Poultry farming in Telangana State is a dynamic and fastest growing segment. The Department besides ex-tending modern technical know-how to the poultry farmers is attending to issues of production and supply of poultry vaccines to protect against various diseases. Poultry Development scheme contains the following components.
Assistance to State Poultry Farms
The scheme “Assistance to State Poultry Farms” is under implementation. This scheme was implement-ed in Government Livestock Farm, Mamnoor, and Warangal district during the year 2008-09. Vanaraja/ Gramapriya Multiplication Farm and Hatchery have been established and chicks are being supplied. Nec-essary arrangements are also made for capacity building of members on Vanaraja/ Gramapriya birds’ man-agement and benefi ts of the scheme. The farm had produced and supplied 239985 chicks in the fi eld. 22992 farmers have been trained in backyard poultry rearing.
Rashtriya Krishi Viaks Yojana (RKVY)
Rashtriya Krishi Viaks Yojana (RKVY) is being implemented in the State, with central assistance to enhance the overall growth rate of 8% annually from livestock sector during the year 2014-15. Female Calf Feed Subsidy Programme (”Sunandini” ) is a continuous two year programme under the project. Elite female calves are enrolled under this project and Calf feed, health care and insurance were provided during 2013-14 ( 1st year) and during the 2014-15 (2nd year ) calf feed is being provided to female calves that were already enrolled. With the implementation of this project there is a considerable impact in reduction in Calf mortality, early maturity, replacement stock, increase in milk production, increase in income generation.
Regular calf rallies are conducted with enrolled calves to apprise the farmers about the results.

52Socio Economic Outlook 2015
CALF RALLY
Impact of the Project:
REDUCTION IN CALF MORTALITY: With supplementation of balanced calf feed and health support, the health status of female calves is improved and calf mortality is reduced.
EARLY MATURITY: The concentrated feed supplementation to the female calves helped in attaining the early maturity and decrease the age at fi rst calving and thus provides one additional calving.
REPLACEMENT STOCK: Well nourished female calves will be used as replacement stock to develop good milch herd and elite stock .
INCREASE IN MILK PRODUCTION: Healthcare & supplementation of concentrated feed to female calf will enhance milk production when they attain the productive stage.
INCREASE IN INCOME GENERATION: Additional milk production which results from early maturity will add to the income of the BPL farmers.
FISHERIES
Fisheries sector is one of the fast growing sectors contributing to GSDP of the State as well as generating in-come and employment. Fisheries sector contributes 3.47 percent of GSDP from agriculture and 0.6 percent to the GSDP during 2014-15 at current prices. The sector aims at exploitation of all the possible resources under capture and culture fi shery base for increasing fi sh production and productivity through sustainable development. The sector is contributing considerably for, food security, nutrition and health, livelihood se-curity to rural population and welfare of fi shers.
Among the total 78 reservoirs in the State, the water spread area is below 1000 hectares in 53 reservoirs be-tween 1000 and 5000 hectares in 17 reservoirs and 8 percent of reservoirs have water spread area of more than 5000 hectares. Out of the total 35031 tanks in the State, more than 600 are found in Warangal, Medak, Karimnagar and Mahabubnagar districts. Thus, Warangal, Mahabubnagar, Karminagar and Medak districts have high potential for fi sheries development through tanks and reservoirs.
During 2014-15, up to December 2014, 1.69 Lakh tonnes of fi sh and prawn is produced in Telangana as against target of 2.92 Lakh tonnes. For the year 2015-16, the target for Fish and Prawn production is 3.21 Lakh tonnes.

53Socio Economic Outlook 2015
The average productivity of tank is 300 to 400 kgs per hectare of water spread area. Similarly, in reservoirs, the productivity is 30 kgs per hectare of water spread area as compared to the actual potential of 150 kgs per hectare. Thus, more attention needs to be given to reservoir and tank fi sheries of Telangana to improve their productivity.
The culture fi shery of Telangana is not developed as compared to tank and reservoir fi shery. A major pro-portion of aquaculture farms are concentrated in Khammam district. Farmers from Mahabubnagar, Nal-gonda,Karminagar and Adilabad districts are engaged in prawn culture.
There are 19.04 lakh fi shermen in the State. More than 65 percent of fi shermen are concentrated in Wa-rangal,Mahabubnagar, Nalgonda and Karimnagar districts. The State has been implementing several central-ly sponsored programmes that include strengthening the data base and network, registration of fresh water aquaculture, group accident insurance for fi shermen, supply of fi sh seed and ice boxes under State Plan and under the Special Component Plan for SCs. Similarly, it has been implementing for ST fi shermen also, that includes supply of inputs to ST fi shermen, supply of boats and nets, establishment of fi sh/prawn pond or fi sh seed farm for STs, vending units with moped and luggage autos.
Fisheries Development
The Government has proposed, a comprehensive project/scheme for Fisheries Development with an outlay of Rs.3856.72 lakh, to improve the productivity, reduce post harvest losses, increase livelihood support and welfare of fi shermen in capture and culture fi shers. In this project infrastructure oriented schemes, ben-efi ciary oriented schemes/programmes, community assets for fi shermen including SC/ST fi shermen are proposed.
Fisherwomen Self Help Groups- Matsya Mitra Groups (MMGS)
Fisherwomen Self Help Groups called Matsya Mitra Groups (MMGs), were set up in the State. There are 383 Fisherwomen Coop. Societies, with a total membership of 1068. The MMGs are organized within Fisherwomen Coop. Societies. So far 868 MMGs covering 8700 fi sherwomen are organized in Telangana State. These MMGs prepare their Micro business plan and take income generating schemes for improving their economic condition. Revolving fund is given to the group under Chief Minister package and RKVY @ Rs.25,000 per group of 10 to 15 women. The groups also approach the bank for taking loans to augment their resources. The fi nancial assistance of Rs.138.65 lakhs is released to 550 MMGs in Telangana State so far.
Sericulture
The state has an advantage of having a number of silk weaving pockets like Pochampalli, Kothakota, Narayanpet Gadwal where the silk yarn can be consumed and there is a high potentiality and scope to intro-duce further increase in production of not only mulberry silk but also Tassar silk.
The department is implementing various schemes under different programmes for Sericulture Development in the State of Telangana, which are aimed to improve production of international Grade Bivoltine Silk and to meet the gap between supply and demand of silk, transfer of technology to the farmers through Techni-cal Service Centres, preparation of High Yielding Varieties of Mulberry, economic conservation of water, promoting private chawkie rearing units for supply of chawkie worms, promoting construction of a separate rearing sheds and providing marketing facilities to farmers through cocoon markets.

54Socio Economic Outlook 2015
Catalytic Development Programme
The Govt of Telangana in co-ordination with the Central Silk Board, Bengaluru (Govt of India) is im-plementing Catalytic Development Programme for the production of international 2A and above graded Bivoltine silk in Telangana. Under this scheme the stake holders will be provided fi nancial assistance for components of On farm, nonfarm activities. An amount of Rs 545.63 Lakhs of Central share subsidy and state matching share of Rs.383.15 Lakhs was released for implementation of the CDP schemes during the year 2014-15.
Providing Incentive to The Farmers And The Silk Reelers for Their Produce:
Under the scheme, the stake holders are being provided production incentive of Rs 20/- per Kg for produc-tion of CB Cocoons, Rs 50/- per Kg of BV Cocoons, Rs 35/- per Kg of Silk produced on Charka, Cottage basin, and Rs 80/- per Kg for CB silk produced on Multi end and Rs 150/-per Kg of BV Silk of above 2A grade of international grade produced on Multi-end / Automatic Reeling Machinery. During 2014-15 Pro-duction incentive of Rs. 108.60 Lakhs was released towards reeling cocoons and Rs 35.16 Lakhs was released towards Silk incentive.
Yarn Support Price to The Silk Weavers
It is an ongoing Plan scheme. Telangana has traditional silk weaving heritage for the production of Tradition-al silk sarees, Dhotis, Dress material of South India are being produced by handlooms.
There is an imperative need for sustenance of traditional handloom silk weaving activity in the state by poor weavers due to steep fl uctuations in the prices of raw silk and twisted yarn. Due to increase in production cost of silk fabric on handlooms the traditional silk hand loom weavers are unable to continue the activity. To safeguard the handloom sector, an amount of Rs.600/- towards incentive for purchase of (4) kgs of silk yarn in a month per family is being provided under Silk yarn support Scheme to weavers. During 2014-15, an amount of Rs 246.252 Lakhs was released to implement the yarn support scheme.
Tassar Culture
Telangana ranks fourth in Tassar cocoon production in the country. The State is bestowed with 8200 acres of forest fl ora of T. tomentosa and T. arjuna for production of Tassar cocoons by the tribal’s in the districts of Adilabad, Karimnagar, Khammam and Warangal.
Tassar sericulture is one of the major livelihoods for the tribals of interior forest areas where abundant food plantation is available. Tassar culture involves all the activities pertaining to rearing of Tassar silkworm (Antheraea mylitta Drury), harvesting of Tassar cocoons, production of Tassar silk yarn from cocoons and weaving of Tassar yarn into fabric. The major producers in the sector include Silkworm rearers, yarn pro-ducers and weavers.
Consistent growth in the primary sector as could be seen above presents a mixed bag of achievements. In fact, this sector provides the much needed push for the manufacturing sector to perform which is a part of the secondary sector, namely, industries sector.
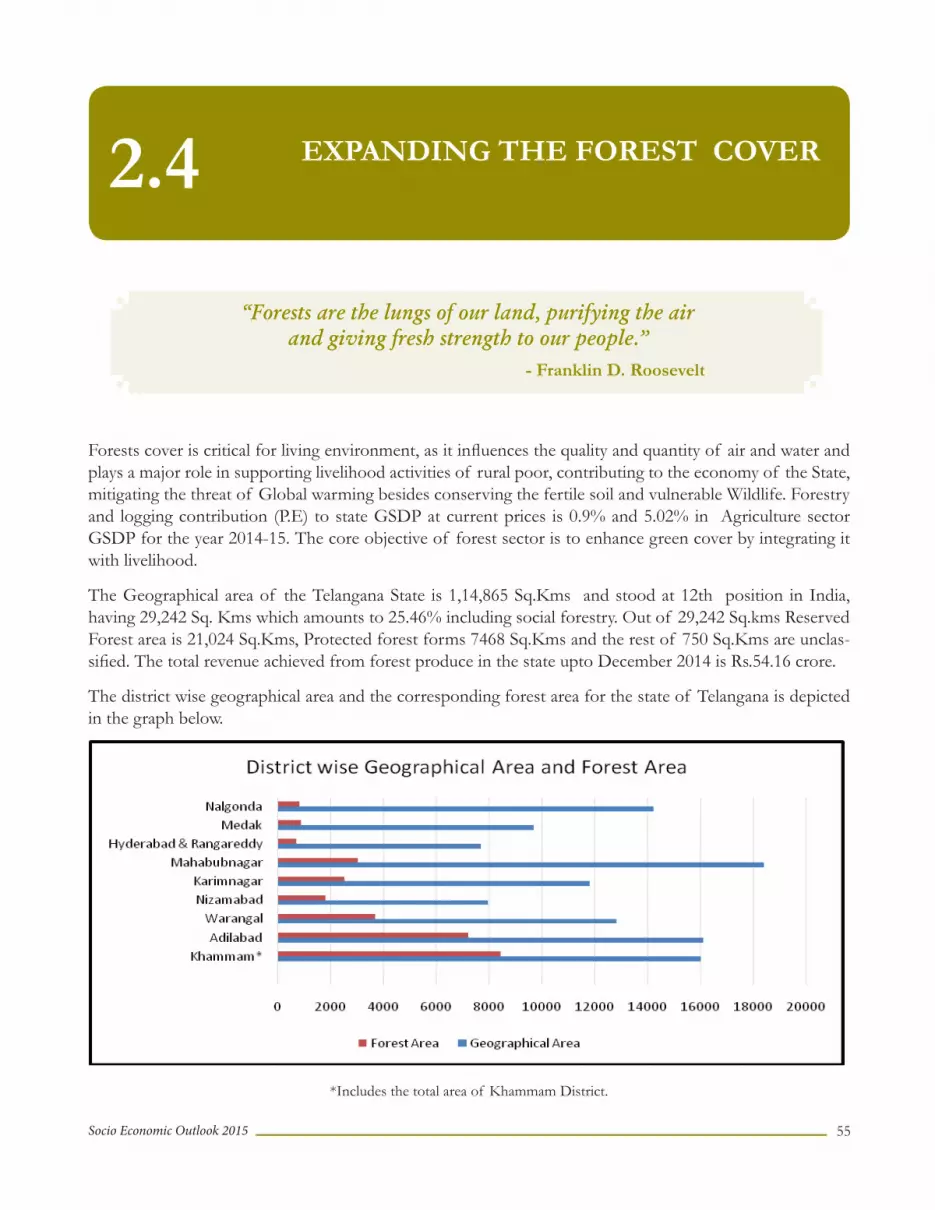
55Socio Economic Outlook 2015
EXPANDING THE FOREST COVER2.4
Forests cover is critical for living environment, as it infl uences the quality and quantity of air and water and plays a major role in supporting livelihood activities of rural poor, contributing to the economy of the State, mitigating the threat of Global warming besides conserving the fertile soil and vulnerable Wildlife. Forestry and logging contribution (P.E) to state GSDP at current prices is 0.9% and 5.02% in Agriculture sector GSDP for the year 2014-15. The core objective of forest sector is to enhance green cover by integrating it with livelihood.
The Geographical area of the Telangana State is 1,14,865 Sq.Kms and stood at 12th position in India, having 29,242 Sq. Kms which amounts to 25.46% including social forestry. Out of 29,242 Sq.kms Reserved Forest area is 21,024 Sq.Kms, Protected forest forms 7468 Sq.Kms and the rest of 750 Sq.Kms are unclas-sifi ed. The total revenue achieved from forest produce in the state upto December 2014 is Rs.54.16 crore.
The district wise geographical area and the corresponding forest area for the state of Telangana is depicted in the graph below.
*Includes the total area of Khammam District.
“Forests are the lungs of our land, purifying the air and giving fresh strength to our people.”
- Franklin D. Roosevelt

56Socio Economic Outlook 2015
The State of Telangana is endowed with rich diversity of fl ora and fauna with over 2939 plant species, 365 bird species, 103 mammal species, 28 reptile species and 21 amphibian species in addition to large number of Invertebrate species. Important endangered species found in the state are Tiger, Panther, Indian Gaur, Four Horned Antelope, Black Buck, Marsh Crocodile etc. The state is also bestowed with dense Teak for-est along the banks of river Godavari right from Nizamabad through Adilabad, Karimnagar, Warangal up to Khammam district. These forests are home for several deciduous species like Nallamaddi, Yegisa, Rose wood, Narepa, Bamboo in addition to Teak.
As per Revised 2002 State Forest Policy, Vision 2020, Forest Department implements various development schemes to protect and develop existing forests, to improve its productivity and economic value. The main objectives of programmes are Community Forest Management, National Afforestation Programme (NAP) (Centrally Sponsored), RIDF Projects, Soil & Moisture Conservation, Social Forestry, Wildlife Management and Human Resource Development are enriching existing low density forests and alleviating rural poverty. Contour Trenches, Rock fi ll dams, Percolation tanks etc, in forest areas. These structures help in recharging of ground water in turn improve forest vegetation besides stabilizing the status of agriculture in adjoining fi elds.
Keeping in view recent trends, the department has laid special emphasis on Forest Research to conduct experiments, improve nursery and plantation techniques, vegetative propagation, seed production and in various silvicultural practices.
Monitoring of vegetation (Forest) Canopy Cover Density, Forest Fire Risk Zonisation Mapping, Mapping all forest areas with site suitability, Re-locating & demarcating forest boundaries and inventory of forest re-sources are some of the major and important activities taken up by the department using latest information technology which includes GIS.
Almost all programmes/schemes of the Forest Department are being implemented through participation of local people, Vana Samrakshna Samithis (VSS) and Eco-Development Committees (EDCs) in Protected Areas and Watershed Development Committees in River Valley Project. Forest Development Agencies are federations of all VSS within a Territorial / Wildlife Forest Divisions under the Societies Registration Act. It operates in a 3-Tier system with the State Forest Development Agency (SFDA) at the State Level, Forest Development Agency (FDA) at Divisional Level and Vana Samrakshana Samithi (VSS) at Village Level.
Social Forestry
The Government has launched a massive people’s movement involving general public and farmers in a big way to increase tree cover outside reserve Forests to improve and protect the Environment and to provide gainful employment. The main components of Social Forestry are distribution of seedlings, raising of Plan-tations in community lands, Institutions and Road side Avenues.
The main species raised for free distribution and planting in public lands are Neem, Pongamia, Ficus species like Raavi & Marri, Gangaraavi, Usiri (Amla), Seethaphal, Badam, Mango, Teak, Casuraina, Eucalyptus and others. Forestry operations have been converged with MGNREGS in Reserved Forest areas and outside the Forest.
During the year 2014-15, under Mixed Plantations Scheme the seedlings raised and distributed Avenue Plan-tation raised and Block Plantation raised upto December 2014 is furnished below:

57Socio Economic Outlook 2015
Telangana Ku Haritha Haram
“Telangana Ku Haritha Haram (TKHH)”, a fl agship programme of the State Government envisages increas-ing the tree cover of the State from present 25.16% to 33% of the total geographical area of the state. This objective is sought to be achieved by a multi-pronged approach of rejuvenating degraded forests, ensuring more effective protection of forests against smuggling, encroachment, fi re, grazing and intensive soil and moisture conservation measures both inside and outside forest following the watershed approach.
Apart from the above major fi llip is sought to be given to Social Forestry by taking of massive plantation activities outside Forest areas which include Multi-row road side Avenues, River and Canal bank, Barren hill, Tank bunds and Foreshore areas, Institutional premises, Religious places, Housing Colonies, Community abandoned lands etc. The Greening efforts will be taken up involving all stakeholders. This approach would be duly supported by the needed reforms in policy, law and administrative matters.
As a part of this, in the coming three years 230 crore seedlings are proposed to be planted in the State. Out of this 130 crore seedlings are proposed to be planted outside the notifi ed forest areas i.e., 10 crore within HMDA limits, 120 crores in rest of the area of the State. It is also proposed to rejuvenate 100 crore plants inside the notifi ed forests by way of intensive protection of the Forests and encouraging the live root stock.
Under Telangana Ku Haritha Haram programme a comprehensive exercise for identifi cation of nurseries and plantation sites has been undertaken taking the inputs from “Mana Vooru- Mana Pranalika” (MVMP) initiative of the Government.
A Total number of 3888 nurseries have been identifi ed village wise for raising planting stock by involving various agencies (Forest Department, DWMA, Agriculture, Horticulture, Tribal Welfare etc.) for achieving the target of raising 40 crore seedlings for 2015 planting season. Further, initiative is being taken to raise another 40 crore tall seedlings of adequate height for 2016 planting.
Haritha Haram - Nursery

58Socio Economic Outlook 2015
Implementation of Compensatory Afforestation Fund Management and Planning Authority (CAMPA)
Compensatory Afforestation Fund Management and Planning Authority (CAMPA) is constituted by the Ministry of Environment and Forests, GOI, to promote afforestation and regeneration activities as a way of compensating forest land diverted for non-forest uses.
The CAMPA is being implemented from 2009 onwards in the State and the expenditure incurred for Tel-angana from 2009-2010 to 2013-2014 is Rs. 233.125 crores. The expenditure incurred during the year 2014-2015 (up to Dec 2014) is Rs. 45.11 crores as against the annual outlay of Rs. 101.95 crores.
Achievements of CAMPA in Telangana during 2014-15:
• The total area planted under Net Present Value (NPV) Component is 2695 ha.• 144 Base Camps, 60 Strike Forces, 57 Check Posts are established and maintained.• 763 kms of Fire lines created and maintained with 458 Fire watchers every season. 19 Fire watch Tow-
ers to be constructed in Fire risk zone areas.• 5070 Boundary pillars are proposed for construction around the forest blocks.• 6 kms of Protection wall is proposed for construction around Urban Forest Blocks.• 44 Quarters to frontline staff are proposed for construction of which 20 are completed and occupied.An advance operation in 5030 ha is proposed under NPV for planting in 2015 under CAMPA.
Wildlife Bio-Diversity Conservation in Telangana State
The state of Telangana is endowed with rich Flora, Fauna and Eco-Systems. The state has 2939 plant spe-cies, 365 bird species, 103 mammal species and 28 reptile species in addition to large number of Invertebrate species. With the objective of preserving the biodiversity the Government has declared 12 Protected Areas which includes 9 Wildlife Sanctuaries and 3 National Parks covering an area of 5692.48 Sq. Kms which is 19.73% of the forest area of Telangana State. The network of Protected Areas include important wetlands like Manjeera Wildlife Sanctuary and Siwaram Wildlife Sanctuary which are home for the endangered Marsh Crocodile also called Mugger.
Project Tiger
The state has two tiger reserves namely Amrabad Tiger Reserve in the Nallamala hill tracts spreading over Mahboobnagar and Nalgonda districts and the other Kawal Tiger Reserve has forest areas which are contig-uous to Tadoba Andheri Tiger Reserve in Maharashtra and Indravathi Tiger Reserve in Chattisgarh. Tigers are known to migrate between Kawal and the other two Tiger Reserves. Hence, development of corridors linking the three Tiger Reserves through Mancherial, Bellampalli and Kagaznagar Divisions are vital for the conservation of the endangered Tiger species.
Telangana Bio Diversity Board (TSBDB)
The Telangana Biodiversity Board constituted with the objective of conservation and sustainable utilization of biological diversity and fair and equitable sharing of biological resources among all stakeholders. Biodi-versity Board conducts International day of Biodiversity on 22nd May every year. 170 Bio-Diversity Manage-ment Committees have been constituted in Telangana by covering 10 Districts, 66 Mandals and 1 Municipal Corporation in Hyderabad. The Biodiversity Board proposed to establish Biodiversity parks in each district for creating awareness among the people about biodiversity and its implications.

59Socio Economic Outlook 2015
Section IIIWELFARE & SOCIAL DEVELOPMENT

60Socio Economic Outlook 2015

61Socio Economic Outlook 2015
FOCUS ON WELFARE 3.1
“Power has only one duty - to secure the social welfare of the People.”
- Benjamin Disraeli
Promoting People’s Welfare is the central agenda of the Government. Accordingly, a number of initiatives have been taken by the Government after the formation of Telengana State. In this regard, a sector-wise broad over view is presented in this section.
Aasara Pensions
Government , as a part of its welfare measures and social safety net strategy introduced the “Aasara” pen-sions, with a view to ensure secured life with dignity for all the poor.
‘Aasara’ pension scheme is meant to protect the most vulnerable sections of society in particular the old and infi rm, people with HIV-AIDS, widows, incapacitated weavers and toddy tappers, who have lost their means of livelihood with growing age, in order to support their day to day minimum needs required to lead a life of dignity and social security.
In the Old Pension Scheme, the pension amount under Social Security Pensions provided was meagere and barely suffi cient to cover the basic minimum requirements of the needy. Pension amount @ Rs.200/- p.m. to old age persons, widows, toddy tappers, weavers, HIV AIDs patients and Rs.500/- p.m. to the disabled persons were being paid in the Old Pension Scheme.
With a view to combat the ever-increasing cost of living and infl ation, the Telangana Government introduced a new Pension scheme called “Aasara” enhancing the monthly Pension from Rs.200/- to Rs.1000/- for old age persons, widows, weavers, toddy tappers and AIDS patients and Rs.500/- to Rs.1500/- for disabled persons.
In the past, Rs.835.63 Crores per year was spent by the previous Government. Now the Telangana Govern-ment is spending approximately Rs.4000.00 Crores per year for payment of pensions under the new Aasara Pensions Scheme. This is 478% increase over the past.
Government of India under National Social Assistance Programme(NSAP) is providing Rs.264.84 Crores per annum towards pensions. The Government of India scale of pension is Rs.200/- pm below (80) years and Rs.500/- pm for 80 and above years of age. For widows and disabled persons it is Rs.300/- pm with the Government of India funds 8.15 lakhs pensioners are covered under National Social Assistance Program-

62Socio Economic Outlook 2015
me(NSAP) with top up from the State Government. The details of number of pensioners and the amount paid in the old pension scheme and Aasara pension scheme as follows:
Table 22 : Category wise Aasara Pensions
Sl. No.
Category
Old Pension Scheme Aasara Pension Scheme
Scale of Pension
per month in Rupees.
Phy.
[Nos.]
Fin.
[Rs. In lakhs]
Scale of Pen-sion per
month in Rupees.
Phy. [Nos.]
Fin.
[Rs. In lakhs]
1 OAP 200 15,28,233 36677.59 1000 13,38,370 160604.402 Widows 200 9,26,879 22245.10 1000 12,61,190 151342.803 Toddy Tappers 200 27,345 656.28 1000 50,201 6024.124 Weavers 200 55,442 1330.61 1000 30,249 3629.885 HIV AIDs Patients 200 10,613 254.71 1000 10,788 1294.566 Disabled 500 3,73,316 22398.96 1500 3,84,202 69156.36
TOTAL 2921828 83563.25 3075000 392052.12
Table 23 : District & Category wise Physical & Financial information (February, 2015)
Sno District Name OAP DISABLED WIDOW WEAVERS
No.
Amt. per month (Rs. In lakhs)
No.
Amt. per
month (Rs. In lakhs)
No.
Amt. per month (Rs. In lakhs)
No.
Amt. per
month (Rs. In lakhs)
1 2 3 4 5 6 7 8 9 10
1 ADILABAD 1,10,080 1,100.80 28,632 429.48 1,13,646 1,136.46 574 5.74
2 HYDERABAD 42,665 426.65 20,425 306.38 67,614 676.14 - -
3 KARIMNAGAR 1,89,020 1,890.20 63,748 956.22 1,27,362 1,273.62 8,239 82.39
4 KHAMMAM 1,17,313 1,173.13 32,275 484.13 1,07,533 1,075.33 448 4.48
5 MAHABUBNAGAR 1,81,906 1,819.06 47,181 707.72 1,87,636 1,876.36 5,603 56.03
6 MEDAK 1,43,458 1,434.58 29,578 443.67 1,27,842 1,278.42 2,921 29.21
7 NALGONDA 1,65,338 1,653.38 49,454 741.81 1,47,776 1,477.76 5,709 57.09
8 NIZAMABAD 1,08,583 1,085.83 28,934 434.01 1,01,996 1,019.96 827 8.27
9 RANGA REDDY 1,08,224 1,082.24 35,038 525.57 1,30,158 1,301.58 573 5.73
10 WARANGAL 1,71,783 1,717.83 48,937 734.06 1,49,627 1,496.27 5,355 53.55
TOTAL 13,38,370 13,383.70 3,84,202 5,763.03 12,61,190 12,611.90 30,249 302.49

63Socio Economic Outlook 2015
Table 23 (Contd..)
Sn District Name TODDY TAPPERS Pension to AIDS
patients GRAND TOTAL
No. Amt. per
month (Rs. In lakhs)
No. Amt. per
month (Rs. In lakhs)
No.
Amt. per month (Rs. In lakhs)
1 2 11 12 13 14 15 16
1 ADILABAD 1003 10.03 707 7.07 254642 2689.58
2 HYDERABAD 1 0.01 2274 22.74 132979 1431.915
3 KARIMNAGAR 10365 103.65 2282 22.82 401016 4328.9
4 KHAMMAM 2413 24.13 1010 10.1 260992 2771.295
5 MAHABUBNAGAR 2762 27.62 1468 14.68 426556 4501.465
6 MEDAK 2394 23.94 203 2.03 306396 3211.85
7 NALGONDA 17905 179.05 1101 11.01 387283 4120.1
8 NIZAMABAD 1233 12.33 866 8.66 242439 2569.06
9 RANGA REDDY 1631 16.31 296 2.96 275920 2934.39
10 WARANGAL 10494 104.94 581 5.81 386777 4112.455
TOTAL 50201 502.01 10788 107.88 3075000 32671.01
Aasara Pension Disbrusment

64Socio Economic Outlook 2015
The Telangana Government took a decision to extend the fi nancial assistance to beedi workers (women only) from March 2015. Under this, assistance of Rs 1000 will be paid to beedi workers, based on the data collected during the ‘Samagra Kutumba Survey’.
REVAMPING OF PUBLIC DISTRIBUTION SYSTEM
Government of Telangana decided to issue Food Security Cards to all priority groups and all eligible BPL households with an objective to provide subsidized food grains and other essential commodities to the eli-gible households.
So far 1.01 crore applications were received and 99.01 lakh applications were enquired into. The process of verifi cation and enquiry of applications for the remaining is going on for identifi cation of benefi ciaries. So far, 87.57 lakh benefi ciaries are found eligible for Food Security Cards and 0.49 lakh benefi ciaries are eligible for Antyodaya Anna Yojana (AAY) Cards. Once the verifi cation is completed, Food Security Cards will be issued.
To arrive at the eligibility of the BPL families (priority house holds) the family income limit in rural areas has been increased to Rs.1.50 lakhs and in urban areas to Rs.2 lakhs. The land ceiling has also been increased to 3.5 acres of wet land and 7.5 acres of dry land.
All 87.57 lakh eligible families for Food Security Cards (covering 2.80 crore benefi ciaries) are being supplied rice from 1st January 2015 @ 6 kg. per person without any ceiling on the number of members in the family and AAY families @ 35 kg. per card.
Supply of rice to the priority households at 6 kg. per person
Rice is being supplied to all the eligible families found in the enquiry at 6 kg. per person at Re.1 per kg. with-out any restriction on number of members in the family, from 1st January, 2015.
Earlier, a family was entitled for rice @ 4 kg. per person subject to a maximum of 20 kgs. Now every person gets 6 kg. and at this rate all the number of members in the family get rice. The Antyodaya Anna Yojana (AAY) families will get 35 kg. per family per month @ Re.1 per kg.
This would show a good amount of saving to a family.
If a card was possessing one member, earlier he was getting 4 kg. at Re 1 per kg and he was purchasing 6 kgs. at Rs.25 per kg i.e he was spending Rs.154 on 10 kg. rice. Now, he spends Rs.6 on 6 kg. rice through PDS and spends Rs.100 on remaining 4 kg , which means he spends Rs.106 for 10 kgs. In other words he saves Rs.48 per month.
Another example is that if in a family there are 7 members, earlier the family was spending Rs.20 per kg. for 20 kgs. and Rs.1250 for 50 kgs., totaling Rs.1270 for 70 kgs. Now, the amount to be spent will be Rs. 42 for 42 kgs. (i.e. 6 kg. X 7 members) and balance 28 kgs. at Rs.25 i.e. Rs. 700, totaling Rs.742, which means the family of 7 members saves Rs. 708 per month.
The scheme of supply at 6 kg. provides substantial quantity of rice to the families having more than 5 mem-bers particularly.
Though Food Security Cards have not been issued, Government has been supplying rice based on the eligi-bility without causing any hardship to them.
Under the scheme, it is expected that about 1.80 lakh MT of rice per month would be required for supply

65Socio Economic Outlook 2015
to about 2.80 crore units. The expected allotment from Government is 1.12 lakh MT per month. This necessitates purchase of balance 0.68 lakh MT p.m. from the rice millers under State Pool. It is targeted to purchase 7.5 lakh MT of rice from the Rice Millers under State pool by paying Re.1 per quintal (1 paise per kg.).
A quantity of 3.22 lakh MT of rice has been purchased under State Pool procurement.
Supply of superfi ne rice (Sanna Biyyam) to the students in hostels and mid day meals programme in schools.
Government of Telangana considered that the students in the hostels and those benefi ted under Mid Day Meals programme should be provided with nutritious and good quality food and took a conscious and a very pragmatic decision to supply superfi ne preferred varieties, which are called “Sanna Biyyam”, to them.
The requirements of rice for Hostels is 6663 MT ; and for Mid Day Meals Programme it is 5837 MT, totaling 12,500 MT per month.
Government of Telangana, in order to make available good quality rice to the boarders , has been procuring old rice at Rs.36 per kg. for supply till 23rd April, 2015( till hostels and schools close for vacation) and rice of this crop (2014-15) at Rs.32.50 per kg. and supplying this rice for this prestigious scheme.
A quantity of 1.25 lakh MT of rice has been procured to meet the requirements of the Welfare hostels and for Mid day Meals in the Schools.
At the same time It is also, ensured that there is no diversion of these superfi ne (sanna biyyam) rice into the black market or for recycling, criminal action is proposed to be taken against those who indulge in such illegal activities.
Land Purchase Scheme
The Government of Telangana has launched a fl agship programme of Land Purchase Scheme for the ben-efi t of the poorest of the poor SC Women families.
Under this programme, the poorest of the poor SC women benefi ciaries who are absolutely landless agricul-tural families ( Bhoomileni Nirupeda Dalita Vyavasaya Aadharitha Kutumbhalu) are to be provided up to three acres of land in the 1st phase and other SC benefi ciaries having small pieces of land i.e. ½ acre, 1.00 acres, 2.00 acres etc. to be provided with balance extent of land to make them land owners of 3.00 acres each, in the next phases.
A comprehensive package is envisaged to include provision of irrigation facilities, drip facilities, seed, cost of cultivation, fertilizers, pesticides, ploughing, micro-irrigation, energisation of pump-sets etc. for one crop year in addition to providing funds for Land Development, preparation of nursery and agricultural inputs. The amount for meeting the cost of cultivation etc is directly transferred into the benefi ciary’s account.
The Land Purchase Scheme is implemented with 100% subsidy and without any contribution from the ben-efi ciaries and also without bank linkages. The District Collectors are given powers to purchase agricultural lands for the above programme at a cost ranging from Rs. 2 lakhs (Rupees Two lakhs) to Rs. 7 lakhs (Rupees Seven lakhs) per acre in the 9 Districts (excluding Hyderabad) of Telangana State. As on 29-1-2015, 1132 acres of private land and 270 acres of Government Land have been sanctioned to cover 525 benefi ciaries.

66Socio Economic Outlook 2015
Launching of Land Purchase Scheme
Kalyana Lakshmi Pathakam
To alleviate fi nancial distress of SC/ST families, Government decided to sanction a one-time fi nancial as-sistance of Rs.51,000/- at the time of marriage to each SC/ST girl, who is a resident of Telangana State. Accordingly, Kalyana Lakshmi Pathakam has been introduced with effect from 2nd October 2014 for un-married Girls, who have completed 18 years of age at the time of marriage and whose parental income does not exceed Rs.2.00 lakh per annum.
Shaadi Mubaarak
The Government of Telangana introduced the “Shaadi Mubaarak Scheme” with effect from 2nd October, 2014 to all Minority community unmarried girls on their marriage with a view to alleviate fi nancial distress in the family. Under the Scheme, a onetime fi nancial assistance of Rs.51,000/- shall be granted to every Minor-ity girl before the marriage, provided application is submitted at least one month in advance from the date of marriage subject to the guidelines. The amount will be credited in the bank account of the bride by way account payee cheque.
Shaadi Mubaarak

67Socio Economic Outlook 2015
TELANGANA DRINKING WATER SUPPLY PROJECT
Telangana Drinking Water Supply Project (TDWSP) is a fl agship programme of the State of Telangana TDWP will provide drinking water at the rate of 100 lpcd per person to the 319 lakh population in the state living in 25,139 rural habitations and 67 municipal bodies in nine districts, excluding Hyderabad. The total project cost is estimated to be about Rs. 42,000 crores, including bulk water supply (treatment and transmission system) managed by Telangana Drinking Water Supply Corporation (TDWSC), Intra-village water supply system managed by the Village Water and Sanitation Committee, sanitation and hygiene education, institution development and project management. All the ongoing drinking water projects will be integrated into the proposed TDW Project.
The State is enriched by perennial rivers like Krishna and Godavari fl owing in the State and major reservoirs like Nagarjunasagar , Palair, Wyra, Dummugudem, Srisailam, SRSP, Singur., Nizamsagar , Kaddam and Komaram Bheem Projects have abundant storage of water to meet the drinking water needs of the people of the State. TDWP will use about 63 TMC of water drawn from these dependent and sustainable Sources.
TDWP to be implemented in four years, involves over 1.25 lakh KM length of a maze of pipelines, 18 intake wells, 63 water treatment plants, 17,407 storage tanks (for 7.5 lakh KL), 62 intermediate pumping stations. The total power requirement is 186 MW, as the project will use a gravity based distribution network as far as possible. Using smart technology, water usage will be monitored and wastage will be reduced.
The state is seeking funds from bilateral and multi-lateral agencies and fi nancial institutions, in addition to utilizing Central Government and own resources, to fund this mega project divided into 26 segments.
In addition to domestic water supply, the Project also takes in to account the industrial demand to promote development of industry in the State .The bulk supply will be made by the Telangana Drinking water Supply Corporation while the distribution within village/municipal areas will be taken up by the respective PRIs/ULBs. While the bulk supply pipelines and structures are proposed to be constructed by reputed agencies having vast experience in the fi eld, the intra village or ULB distribution systems would be taken up by the local water committees involving women who are the best water managers.
1. The TDW project would be grounded in Nalgonda district, a fl uoride-affected region. The work will simultaneously begin in Adilabad, Karimnagar, Khammam, Medakand Nizamabad to cover all four regions of the state. The chief minister announced that 10 percent of water from all existing and new irrigation projects will be allocated for the TDWP, of which 10 percent will be for industries. It will be executed by the newly set up Telangana Drinking Water Supply Corporation Limited.
2. By providing water connection within individual homes, Telangana will have addressed the basic human right to suffi cient, safe, acceptable, physically accessible, and affordable water to all its inhabitants, and women will not have to go outside to fetch drinking water for the entire family.
3. It was decided by the government that the project shall be designed to meet the drinking water needs of the people for the next 30 years, and become a role model for other states. Rural Water Supply department offi cials have been instructed to ensure that pipelines of international standard are laid to each and every household. The government expects to avail of the new central law to be introduced to use forest land for development projects and exchange the required forest land for implementing the project.
4. The Telangana Drinking Water Project (TDWP) has been declared as a fl agship program of the state. A state level Coordination Committee, headed by the Chief Secretary, has been set up to review

68Socio Economic Outlook 2015
progress of the project. District level Coordination Committees, headed by the District Collectors, will monitor progress in the
5. districts. TDWP will converge with other water supply, hygiene education and environmental sanitation programmes of the Government of India such as: Swatch Bharat Abhiyan, Swatch Bharat-Swatch Vidyalaya, and Haritha Haram. TDWP will be a smart project using automation, water budgeting, water recycling, water recharge, and promoting greenery in rural and urban areas using sullage water
Need for the Telangana Drinking Water Project:
The annual rainfall in the state of Telangana is uncertain in space and time. There are prolonged dry spells and fl oods. Telangana has faced defi cit rainfall for fi ve years in the last decade. Unsustainable use of available water in the form of rainfall, surface water, groundwater, and soil moisture led to water crisis. The state is served by two major river basins – the Krishna and the Godavari. However, rural drinking water has been heavily dependent on groundwater which has become and unreliable source.
The proposed Telangana Drinking Water Project using stand alone water networks (segments) is to supply water needs of rural, urban, institutional, commercial and industrial needs excluding the GHMC and its surrounding habitations within the Outer Ring Road (ORR) of Hyderabad. There are several major challenges to be faced in providing assured water supply to every household in each habitation in the state. The major challenges to be addressed are:
Ground water depletion: One of the major problems in this sector is depletion of ground water mainly due to over exploitation and short fall in rainfall.
Ground Water Quality: In parts of Telangana ground water contains high concentration of fl uoride and iron deposits in the subsurface strata, with depletion of ground water, the concentration of fl uoride, iron and salinity is increasing in the ground water outside range of acceptable standard limits for drinking water which leads to provide surface treated water for human consumption. Total 8572 quality affected habitations are identifi ed in 9 districts with excess fl uoride (4506 Habitations), salinity (1590 Habs), TDS (19 Habs.), Nitrates (1881 Habs.) and Iron (576 Habs). However, some of these quality affected habitations are covered in the existing schemes/ongoing schemes with limited supply of quality water.
Groundwater pollution: Pollution is also a critical problem both from natural resources, Industrial pollutions, Agriculture pesticides, nitrates and improper disposal of solid and liquid waste etc.
Sustainability: In water supply sector sustainability of drinking water sources and systems is a major challenge in view of demand for irrigation and adverse seasonal conditions.
Increasing demand: Due to change in life styles & urbanization, most of the villagers are demanding household connections and increased level of water supply at their doorstep. Change in perception of people for better living standards is also leading to increased demand.
Rural Areas and Urban Areas: Presently separate network from even from the same water source is planned for rural areas and urban areas due to which the cost of the project is increasing as the urban areas, i.e., a total of 67, which are scattered over the State in between rural habitations.
Natinal Rrural Drinking Water Programme guidelines provide for “Gradual shift from over dependence on ground water to surface water sources, and conjunctive use of ground water, surface water and rainwater”. The TDWSP thus fulfi ls the objectives and aims of the Government of India.

69Socio Economic Outlook 2015
Institutional setup for Implementation and Supervision
A Telangana Drinking Water Supply Corporation has been set up for the implementation, supervision and future O&M of the Telangana Water Supply Project. The RWS&S Department will recruit the required staff for the effective implementation of the project and future O&M. A dedicated expert team of Consultants who has similar exposure to designing, construction and supervision of such schemes are being engaged.
Cost Recovery and Tariffs
Cost recovery and fi nancial self-reliance is also required for the long term sustainability of the system. Thus community shall not be dependent fi nancially or technically on the regional or central government in the long term. Tariffs for the consumption of water beyond a certain quantity required for drinking, cooking, and washing should be equal to the cost of providing additional supplies. A slab segregated consumption rate model (0-100 lpcd, 100-125 lpcd, 125 -150 LPCD, above 150 LPCD) has to be planned. Where the consumption up to 100 LPCD shall be nominal for Low Income Group (LIG) and economically Weaker Section(EWS) communities, and tariff has to be worked out for others. For higher consumption higher tariffs will be the norm. Separate tariffs will be planned for commercial and industrial customers.
Design Guidelines
The proposed Telangana Drinking Water Supply Project will be designed keeping in view of the Central Public Health and Environmental Engineering Organization (CPHEEO) Manual on Water Supply and as per the Guidelines and policies agreed by the state Government.
Operation and Maintenance of Systems
The Corporation will operate and maintain the bulk water supply grid. The PRIs will operate and maintain the water supply within the habitations. The end users will contribute to the maintenance cost through tariffs set by the PRIs.
Coordination
At the state level, the Water Supply and Sanitation Organization (WSSO) under the State Water and Sanitation Mission (SWSM) will be the nodal agency to coordinate all the sector programmes for convergence. A well-qualifi ed multi-disciplinary project management unit will be established within the Telangana Drinking Water Supply Corporation to manage the various project management tasks.In addition to the engineering expertise that would be available within the Corporation, the other expertise required for the PMU team will include: Project management, Procurement; MIS and GMIS; Monitoring, learning and evaluation; Environmental and social safeguards; Water quality studies; Research, documentation and dissemination; Training and Capacity building; Health and hygiene education. Effective human resource management will be important for the Corporation in the long term to become a model water management organization.
Automation and SCADA (System Control and Data Accessing)
The proposed Telangana Drinking Water Project also a smart grid which will have full automation system in the Treatment Plants and Pumping stations for monitoring of fl ow, water levels in tanks, and bearing/motor temperature. The system will be designed for automatic shutting down if any abnormalities are encountered during operation. This will safeguard the mechanical and electrical systems against damage. In addition, a centralized IT-enabled monitoring system located at the Head Offi ce will be designed to observe the fl ows and quantities delivered to each bulk customer and tank, and chlorine analyzers at suitable locations of bulk supply points to know the residual chlorine. This will ensure the desired supply levels to each bulk customer and effective management of the water supply system.

70Socio Economic Outlook 2015
The Project is a mega drinking water Project with complex designing and hydraulic modeling comprising 28 major stand alone segments having sources on the above mentioned independent sources.
SCHEDULED CASTES DEVELOPMENT
The Scheduled Castes Population in Telangana is 54,32,680 which is 15.44% of the total population as per 2011 Census of which 75.40% are in rural areas and 24.60% in Urban areas. Literacy rate among SCs in the State is 52.52 per cent.
A number of new initiatives have been made since the formation of the State for socio-economic, educational development and welfare of Scheduled castes which are described below.
Educational Programmes
Hostels
Government has taken up construction of Integrated Welfare Hostel Complexes (IWHC) for providing good amenities & superior facilities to hostellers at a cost of Rs.1.68 crore per complex and with a capacity of 400 SC/ST/BC boarders. Out of 34 IWHCs, 32 IWHCs were grounded in Phase-I and remaining 2 IWHCs are not grounded. Government has accorded administrative sanction for construction of 31 new IWHCs in Phase II under SCSP during 2013-14, of which 29 are grounded.
Ananda Nilayams
The inmates of nearly 33 Ananda Nilayams who are from orphan families and from families engaged in unclean occupations are provided all facilities on par with the boarders in Social Welfare hostels.
College Hostels
At present 183 college hostels are functioning in the State with 11,391 students.
Post-Matric Scholarships
Residential and Non-Residential scholarships to Post-Matric students belonging to Scheduled Castes are granted . During 2014-15, an amount of Rs.199.00 crore is released.
Ambedkar Overseas Vidya Nidhi
To help SC students pursue higher education in foreign universities an assistance of Rs.10.00 lakh each is sanctioned to meritorious students.
Telangana Social Welfare Residential Educational Institutions Society (TSWREIS)
There are 134 schools functioning under this society for students of class V to Class XII with nearly 71,493 students, with English as the medium of instruction. Seats are reserved for SCs-75%, Converted Christians-12 %, STs-6%, BCs-5% and OCs-2%. Reservation is also provided for children who are the victims of Worst Human Rights abuse and natural Calamities. TSWREIS has evolved as an institution that specifi cally cares for girls with about 88 institutions (66.16 %) reserved for girls.
TSWRIES has robust infrastructure with 121 school complexes functioning in own buildings and another 13 are under construction. TSWREIS has been the pioneer in leveraging technology both, in administration and education and made rapid strides in achieving effi ciency through technology. Today all 134 institutions are a part of an intranet with assured connectivity; own e-mail service and a website. The academic progress of the students and teachers is monitored online through Student Academic Monitoring System.

71Socio Economic Outlook 2015
SC SUB PLAN
• Proposed to provide infrastructural facilities under SCSP• Construction of 3 new complexes in SC constituencies (Alampur, Bellampalli and Manakondur).• Construction of 8 new complexes in other constituencies• Construction of 5 new complexes to existing schools(Palvancha, Yellareddy, Asifabad, Rukmapur and
Narayankhed).• Construction of Teacher Capacity Building Center & a new school at Rayadurgam, Hyderabad• Augmentation of infrastructure in 104 schools.Scheduled Castes Cooperative Finance Corporation Limited
The main objective of the Corporation is to provide fi nancial assistance for creation of income generating assets to the poor Scheduled Caste households for their social and economic development. SC Action Plans are prepared to assist maximum number of poor SC benefi ciaries under various Economic Developmental schemes. An amount of Rs.1096.00 crore was provided for 2014-15 towards fi nancial assistance to benefi t of 29,030 SC benefi ciaries.
TRIBAL WELFARE
Tribal population of the Telangana State, according to 2011 Census, is 32.87 lakhs which constitutes 9.34% of the total population of the State. ST literacy rate is 49.51 as against State literacy rate of 66.46. There are 32 Tribal groups living in the State which include 4 PvTGs (Particularly vulnerable Tribal Groups – earlier known as Primitive Tribal Group) viz., Kondareddies, Chenchus, Kolams and Thoties living in Khammam, Mahabubnagar, Nalgonda, Ranga Reddy, Adilabad Districts. The dominant tribal groups in the State are Lambada with a population of 20,46,117, Koyas – 4,86,391, Gonds – 2,97,846, Yerukalas – 1,44,128. The Government have accorded high priority for accelerated development of Tribals by implementing socio-economic development schemes. The major focus is on Education, Economic support and land based schemes.
New Initiatives
Komaram Bheem Memorial and Tribal Museum
Government is contructing a Komaram Bheem memorial and Tribal Museum at Jodeghat village in Adilabad District and devoping it as a Tribal Cultural Hub and Tourism Center with an estimated cost of Rs.25.00 crores.
Additional Facilities to Tribal Welfare Educational Institutions
During 2014-15 it is proposed to provide additional facilities like laboratories, libraries with required infrastructure, equipment, books & magazines, LCD TVs with DTH connection, Digital Projectors, Solar Water Heaters, RO Water Plants, Dual Desks, Computers, Furniture, Mosquito Nets, Play Material, additional seats under BAS etc is being taken up with an outlay of Rs.200.00 Crore in all Tribal Welfare Educational Institutions.
Panchayat Extension to Scheduled Areas
To protect the interests of tribals living in Scheduled Areas ensuring core principles, i.e. self-rule, decentralization of powers etc., the PESA Act was enacted. In Telangana State, there are 78 Scheduled Area Mandals and 690 Gram Panchayats. Nearly 1594 villages have been declared for the purpose of conducting Gram Sabhas covering 4127 tribal habitations/hamlets in the Gram Sabha villages.

72Socio Economic Outlook 2015
Ashram Schools and Hostels
Tribal welfare department is maintaining 283 Ashram Schools with a strength of 85,843 ST students, 212 Hostels with a strength of 40,763 and 101 Post Matric Hostels with boarder strength of 20,100 students. The pass percentage in SSC Public Examinations held in March, 2014 is 84.21.
Gurukulam
Gurukulam runs 150 institutions with a strength of 38,511 students. Nearly 88.67% of the students of TW Residential Schools passed in SSC Public Examinations held in March, 2014. The percentage of students of TW Residential Junior Colleges passed in Intermediate Public Examinations is 85.80% against the State Average of 55.85.
Post - Matric Scholarships
Residential and Non-Residential scholarships are being awarded to all eligible Post-Matric students belonging to Scheduled Tribe. An amount of Rs.256.42 crores for 1.50 lakh students were sanctioned and disbursed Online.
Economic Support Schemes
Economic support schemes are being implemented by Telangana ST Co-op Finance Corporation (TRICOR) to benifi t STs, who are below poverty line. During the year 2014-15, it is targeted to cover 25,765 benefi ciaries.
Implementation of Recognition of Forest Rights Act (ROFR) 2006
The Scheduled Tribes and Other Traditional Forest Dwellers (Recognition of Forest Rights) Act, 2006 provides recognizing and recording the rights of forest dwellers who have been residing and depending on the forest, for generations for their bonafi de livelihood. The Act also reserves certain community rights and provides for rights to collect minor forest produce. Under the act 95,022 individual title deeds were distributed covering an extent of 8,09,059 acres of forest land.
Implementation of 1/70 Act
Under this Act, 31,188 Land Transfer Related (LTR) cases were decided in favour of tribals covering 1,05,590 acres
Engineering Schemes
Tribal Welfare Engineering Wing has been created for development of various infrastructural facilities i.e. road works, buildings, drinking water schemes etc. as identifi ed from time to time in tribal areas/villages.
- 727 works of Multi Village Scheme, Single Village Scheme were taken up under 13th Finance Commission with an outlay of Rs.45.23 Crore. The RWS&S Department is also executing 311 works with Rs.54.60 crore.
- Infrastructure facility works were sanctioned with an estimated cost of Rs.279.20 crore in tribal welfare educational institutions (279 Ashram Schools & 379 Residential Schools), 96 works are completed and 283 works in progress.
- (27) Road works were sanctioned with an estimated cost of Rs.43.92 crore under NABARD, out of which 23 works are completed incurring an expenditure of Rs.32.12 crore.
- 1287 works taken up at a cost of Rs.212.65 crore under MGNREGS (RCP II) and 300 works were completed incurring Rs.23.52 crore.

73Socio Economic Outlook 2015
- 42 works taken up under Left Wing Extremist Program in Khammam District with Rs.210.80 crore and all the works are completed incurring an expenditure of Rs.200.12 crore.
- Works like development of cart tracks, improvement of existing gravel roads to BT roads, drinking water and other facilities were taken up and completed with an estimated cost of Rs.7.99 crore for Medaram Jathara.
Girijan Cooperative Corporation Limited
Girijan Cooperative Corporation was established for the socio-economic development of the agency tribals. Honey Processing unit at Kamareddy (Nizamabad District), Soaps Production Unit at Nirmal (Adilabad District), Turmeric Powder Unit at Eturunagaram (Warangal District), Shampoo Manufacturing Unit at Kondanagula (Mahabubnagar District) are established for supply of quality products to the Tribal Welfare Hostels and to the tribals. Construction of Multi Commodity Cold Storages, Society Offi ce Buildings, Multipurpose DR Depot cum NTFP Storage Godowns etc. are being taken up.
Backward Classes Welfare
The Backward Classes /Communities pursue traditional activities such as cattle and sheep rearing, toddy tapping, earth works, fi shing, weaving, goldsmith, blacksmith, brass smith, carpentry, stone carving, laundry, pottery, oil pressing, basketry, hair dressing, tailoring, dyeing etc. There are 112 communities divided into fi ve categories: A,B,C,D and E. Government is implementing several welfare, educational and economic development programmes to uplift these communities. Some of the prominent programmes are BC welfare hostels, residential schools, post-metric fees and tuition fee reimbursement to the economically backward class students (EBC). The pass percentage of 10th Class students in BC Welfare hostels during 2013-14 is 88.09.
Hostels
Hostels provide free boarding and lodging to the students belonging to Backward Classes to enable them to pursue their Pre-Matric studies. There are 490 Government B.C. hostels, (374 hostels for boys and 116 hostels for girls). A total strength of 49,370 boarders were admitted in the B.C. hostels during 2014-15 (37,740 Boys and 11,630 Girls). All these hostels have an admission pattern of 76% Backward Classes, 10% Scheduled Castes, 5% Scheduled Tribes, 3% Minorities and 6% other communities for the purpose of Social Integration.
Out of the total 490 Hostels, 362 Hostels are located in Government buildings. Of the remaining hostels, 31 buildings are under construction with Matching Grant support under Centrally Sponsored Scheme.
Hostels for College Girls and Boys
To promote higher education among Girls and Boys of Backward Class communities, Government have issued orders for establishing @ one hostel for girls and one hostel for boys for each Assembly Constituency. 247 College hostels are functioning (123 Boys Hostels and 124 Girls) with a total strength of 17,334 (8,917 Boys and 8,417 Girls) during the year 2014-15. All these College Hostels for Boys and Girls have an admission pattern of 69% Backward Classes, 15% Scheduled Castes, 6% Scheduled Tribes and 10% Minorities for encouraging social integration.
Residential Schools
There are 19 B.C. Residential Schools (12 for Boys and 7 for Girls) with a total strength of 7,584 students (5,218 Boys and 2,366 Girls) functioning in the State during the year 2014-15. All these Residential Schools have an admission pattern of 74% Backward Classes, 15% Scheduled Castes, 6% Scheduled Tribes, 2% EBCs

74Socio Economic Outlook 2015
and 3% Orphans. Kowdipally (Medak) school is exclusively meant for the children belonging to fi shermen community.
Post-Matric Scholarships and reimbursement of tuition fee to BC students
Government is implementing the Post-Matric Scholarships and Reimbursement of Tuition fee scheme to enable BC students to pursue higher education. All eligible BC students having an annual family income up to Rs.1.00 Lakh per annum are sanctioned Post Matric Scholarships and Reimbursement of Tuition fee on saturation basis. During the year 2013-14, 6.96 lakh BC students were sanctioned Post Matric Scholarships and Reimbursement of Tuition Fee. Scholarship and reimbursement of tuition fee registrations for the year 2014-15 is under process. The eligibility criteria for EBCs for getting reimbursement of tuition fee is the same as those applicable for BCs.
Backward Classes Cooperative Finance Corporation Ltd.
The Corporation is implementing the schemes of Margin Money and Rajiv Abhyudaya Yojana.
Margin Money
The Scheme is aimed at providing fi nancial assistance to the B.C. benefi ciaries in the Agriculture and Allied Sectors, Small Business and Industry, Service and Transport Sector activities. The scheme is being implemented with 50% subsidy on unit cost not exceeding Rs.1.00 lakh per benefi ciary and 50% unit cost as Bank Loan. Wherever, unit cost is more than Rs.2.00 lakh, subsidy of Rs.1.00 lakh is provided and the balance is loan from the Bank.
Action Plan for the year 2014-15 to benefi t 31,501 families is under implementation with a total value of Rs.173.04 Crore, out of which Rs.86.52 Crore is the subsidy provided by the Corporation and Rs.86.52 Crore is Loan from the Banks.
Scheme to help BC atrisans and occupational Groups
To provide fi nancial assistance to the B.C. Artisans / B.C. Occupational Groups in urban area a subsidy of 50% unit cost not exceeding Rs.1,00,000/- per benefi ciary is provided and wherever unit cost is more than Rs.2,00,000/-, Rs.1,00,000/- subsidy is provided and the balance is loan from the Bank.
Action Plan to benefi t 10,497 families is under implementation with a total value of Rs.57.66 crore for the year 2014-15.
Minorities Welfare
Minorities constitute signifi cant component in demographic profi le of the State. Most of these sections have deprivations both on economic and social fronts. The Government, therefore, considered a variety of developmental and welfare programmes for their benefi t.
Urdu Academy
Urdu Academy is an autonomous body for the promotion & protection of Urdu language & Literature. The following schemes are implemented by the academy.
• Preserving and Promotion of Urdu Language. • Vocational Training in Urdu Computer Education• Generating Awareness About Plan Schemes of Minorities Welfare.• Construction of Urdu Ghar cum Shaadi Khanas.• Construction of New Haj House.

75Socio Economic Outlook 2015
The Government proposed for construction of Facilitation Centre-cum-Rubaath at Dargah Hazrat Khaja Moinuddin Chishti Gharib Nawaz (RA) at Ajmer, Rajasthan State with an estimated cost of Rs.5.00 Crore.
State Minorities Finance Corporation Ltd
The Government intends skill up-gradation through training to enable the youth to compete for jobs and to empower their economic development. An amount of Rs. 20.00 crores is allocated during the year 2014-15. Government of India sanctioned an amount of Rs 48.03 crores for 1.76 Lakh pre-Metric, Rs 3.38 Crores for 1259 Post-Metric and Rs.7.25 crores for 12258 Merit-Cum-Means scholarships during the year 2014-15.
Telangana State Christian (Minorities) Finance Corporation
Corporation aims to advance welfare and development of poor Christians in the State and focuses on the issues faced by them in a time bound manner by co-ordinating with all Ministries of the Government. The Corporation initiated various activities especially in the areas of education and employment since its inception.
Government has sanctioned Rs.10.00 crores towards construction of Christian Bhavan in Hyderabad for Christian Youth Welfare Training, conduct of Marriages and other Social and Cultural functions.
Women Development and Child Welfare
The principle of gender inequality is enshrined in the Indian Constitution. The Constitution of India guarantees equality of opportunity, equal pay for equal work, no discrimination to all women. It also allows special provisions to be made by the State in favour of women and children for securing just and human conditions of work that renounce practices derogatory to the dignity of women.
The multifarious activities of the Department can broadly be classifi ed in to three categories
• Implementation of the Integrated Child Development Services (ICDS) Programme. The Programme has been universalized throughout the State with 149 Projects in all.
• Management of the Institutions for the Welfare of Women and Children in need of Care and Protection.
• Implementation and Monitoring of various Protective/Welfare and Empowerment measures relating to Women and Children.
NEW INITIATIVES
Arogyalaxmi Programme
The programme provides one full meal for pregnant and lactating women. It is being expanded in all Anganwadi Centres (AWCs) from 1st January, 2015. Pregnant and lactating women are provided one full meal every day in AWCs. 5,66,917 women have been covered incurring an expenditure of Rs 105.86 Crores.
Telangana State Society for Protection and Empowerment of Women
The “Telangana State Society for Protection and Empowerment of Women” is registered under the Societies Registration Act, 2001 on 25 November 2014, for the safety, security, protection and empowerment of women and girls in the State.

76Socio Economic Outlook 2015
24/7 Women Helpline (181)
Initiation has been taken up to start integrated Women Helpline with a view to support schemes/ interventions addressing the issues of violence against women for providing an immediate and 24 hours emergency response through emergency referral to Nirbhaya Centre/ police/ Hospital/Ambulance and other atrocities.
She-Taxi Scheme
The State has constituted a committee for implementation of the Scheme. Notifi cation was issued for calling applications from eligible candidates. The State Government is providing 35% subsidy on each taxi.
Integrated Child Development Services
The ICDS Scheme is a single largest centrally sponsored integrated programme to improve the nutritional and health status of children in the age group of 0-6 years and to contribute to their psychological, physical and social development. Following services are provided through ICDS;
a) Supplementary Nutrition Program to 0 to 6 years children, pregnant and lactating mothers
b) Pre-School Education to Children
c) Immunization
d) Health Checkups
e) Referral Services
f) Health & Nutrition Education to Children, Women and Adolescent Girls.
Out of 31,711 Main AWCs, 25,326 AWCs are in Rural Areas, 3,716 AWCs in Urban Areas and 2,669 AWCs in Tribal Areas. In addition 3,989 Mini AWCs, 3,160 AWCs are in Rural Areas, 42 AWCs in Urban Areas and 787 AWCs in Tribal Areas are functioning benefi ting 5,66,917 Women and 19,05,385 Children.
The Government has decided to enhance the remuneration to Anganwadi workers from Rs.4,200 to Rs.7,000 per month and the remuneration to Anganwadi helpers from Rs.2,500 to Rs.4,500 per month effective from March, 2015. A one-time grant of Rs.1,000 for each of the 35,000 Anganwadi centres will be provided towards the purchase of utensils for cooking.
Supplementary Nutrition Programme
Under Supplementary Nutrition Programme (SNP) ready to eat food is provided to 7 months to 3 years children and hot cooked food is provided to 3-6 years children in all 149 ICDS Projects. At present, the coverage of benefi ciaries under SNP component is 85 (average by saturation) for 800 Population and about 24.72 lakhs benefi ciaries have been enrolled.
Kishori Shakti Yojana
The scheme aims at empowering Adolescent Girls in the age group of 11-18 years by breaking the inter–cycle of nutritional and gender disadvantages and providing a supportive environment for self-development. The main focus is on Nutrition, Health, Education skill development, and training on home based skills, life skills and Vocational skills.

77Socio Economic Outlook 2015
Protection of Women from Domestic Violence Act-2005 has been implemented to provide protection to women at home and workplace.
Integrated Child Protection Scheme
The ICPS will provide preventive, statutory, Care and Rehabilitation services to vulnerable children including those from potentially vulnerable families and families at risk, children of socially excluded groups like migrant families, families living in extreme poverty, SCs, STs & OBCs families subjected to or affected by discrimination, minorities, children infected and/or affected by HIV/AIDS, orphans, child drug abusers, children of substance abusers, child beggars, traffi cked or sexually exploited children, children of prisoners street & working children.
Juvenile Welfare
Juvenile Welfare is addressed through education and focussed institutional and non institutional services. Vocational training is an important part under this programme.
There are two Children Homes, three Observation Homes, one Special Home and one Home exclusively for the Girls and one after Care Home in the Telangana State.
Non-institutional services are extended through “YUVA Adolescent Counselling & Guidance Clinics.These services include Psychological & Health related awareness, Counseling & Guidance Services to the children & Adolescents.
Disabled and Senior Citizens Welfare
The Disability Act,1996, deals with both prevention and promotion aspect of education, employment and vocational training of barrier free environment, provision of rehabilitation services for persons with disability.
A number of schemes are being implemented for the empowerment and rehabilitation of persons with disabilities. These schemes aim to promote Physical, Psychological, Social, Educational and Economic rehabilitation and development of Persons with Disabilities to enhance their quality of life and enable to lead their lives with dignity.
Survey, Assessment of Needs And Issue Of Medical Certifi cates And Identity Cards
Software for Assessment of Disabled for Access, Rehabilitation & Empowerment (SADAREM) is a computer aided disability assessment method evolved by the department in collaboration with the concerned departments like Medical & Health, Rural Development etc. The software is used to assess the disability as per the Government of India guidelines and generate disability certifi cate and identity cards with unique ID, and also to identify the services entitled from time to time. Thus, the data base generated will be hosted in the public domain to enable service providers to reach out to the disabled persons. 5,27,159 computerized disability certifi cates were given through SADAREM.
Aids and Appliances
The Government planned to organize Camps in all the districts in two phases with cooperation of ALIMCO (Artifi cial Limbs Manufacturing Corporation of India) during the year 2014-15. Camps were conducted in Warangal, Nalgonda, Mahabubnagar, Khammam,and Medak Districts from 08-12-2014 to 07-01-2015 and 2948 benefi ciaries were identifi ed in each district for various Aids & Appliances. Camps are proposed to be conducted in the remaining districts during the months of February and March, 2015.

78Socio Economic Outlook 2015
Welfare of Disabled and Senior Citizens
Government of India enacted the Maintenance and Welfare of Parents and Senior Citizens Act, 2007 (Act 56 of 2007). Appellate tribunals were also constituted in all the 10 Districts headed by the District Collectors. There are 42 Tribunals functioning in the State.
Government of India Schemes
The Government of India sanctioned Grant-in-aid for the Non Governmental Organisations working for the Welfare of Disabled and Senior Citizens. Government of India sanctioned 4 District Disability Rehabilitation Centres (DDRCs) to Telangana State in the districts of Nalgonda, Warangal, Mahabubnagar and Medak.
Achievements during 2014-15
Government have launched special recruitment drive for fi lling up of the backlog vacancies reserved for the disabled. Under special recruitment drive for disabled persons, 215 posts are identifi ed during the year 2014-15. Government issued orders enhancing the pension for disabled persons and Old age Homes from Rs.500/- to Rs.1500 P.M.on 05.11.2014. About 11,99,215 benefi ciaries Under old age pensions and 3,46,409 benefi ciaries under Disabled pensions are covered.
Telangana Vikalangula Cooperative Corporation.
In order to help the disabled in their rehabilitation, the Corporation has taken up the following programs.
1. Supply of prosthetic aids and mobility aids.
2. Supply of educational aids to individuals and institutions.
3. Facilities to impart training in various technical and non-technical trades.
4. Organizing employment generation production units with assured market for products.
5. Creating awareness among parents for early detection and stipulation and treatment of various disabilities.

79Socio Economic Outlook 2015
SOCIAL DEVELOPMENT3.2
The prime objective of any welfare State is to improve social infrastructure for sustainable and improved standard of living of the people. Social infrastructure comprises Education, Health, Nutrition, Sanitation and Water supply etc. Once the process of social development is institutionalized, it provides sustenance to the overall process of economic development.
LITERACY
The literacy rate of the State is 66.46 per cent in 2011 as against 58 per cent in 2001. The literacy rate of the State is lower than that of all India literacy rate 72.99%. A slow growth in literacy rate was identifi ed during the last decade at State and National levels.
The general literacy rates (7 years & above) in the State are not very high and with one third non-literate, the rank of the State is 25 among the States in 2011. The adult literacy rate for the State of Telangana is 73.7 per-cent and stands at 21st position among the States in 2011-12. The proportion of households with no adult literate was 29 percent in rural Telangana while it was 18.7 percent at all-India level in 2011-12. However, in the urban segment still 6 percent of households do not have any adult literate member.
Table 24: Indicators of Educational Progress
DistrictLiteracy Rates,
2011Adult Literacy,
2011-12Youth Literacy,
2011-12
Literates with Secondary & above levels
of Education, 2011-12
Rural Urban Rural Urban Rural Urban Rural UrbanAdilabad 55.30 75.60 52.08 76.07 89.83 99.07 25.16 48.96Nizamabad 56.50 77.20 47.79 72.19 89.93 91.64 24.19 48.81Karimnagar 59.60 77.80 52.23 80.12 96.75 98.05 31.30 55.56Medak 56.00 78.60 45.62 70.76 82.70 90.78 26.13 47.75Hyderabad - 83.20 - 85.59 - 95.90 - 61.59Rangareddy 60.60 82.30 60.84 78.32 93.32 94.65 37.74 54.39Mahabubnagar 50.90 78.00 40.88 78.07 80.53 92.87 23.78 50.25Nalgonda 60.10 81.70 59.84 81.47 90.33 90.87 33.17 57.55Warangal 58.80 81.00 52.25 77.15 91.63 97.19 25.85 54.56Khammam 59.80 81.30 59.15 84.97 89.43 99.34 31.20 57.39Telangana 57.25 81.08 52.04 83.03 89.19 95.82 28.77 58.69
Source: 68th NSS Employment and Unemployment Survey Estimates & Census, 2011
“ Literacy is the bridge from misery to hope.”
- Kofi Annan

80Socio Economic Outlook 2015
The State of Telangana with a literacy rate of 66.46% has 207.84 lakh literates, of which 117.49 lakh are males and 90.35 lakhs females. In terms of proportions the literacy rate stands at 74.95% for males and 57.92% for females.
SCHOOL EDUCATION
One of the primary goals for human development as identifi ed by the UNDP Millennium Development Goals (MDG’s) is ‘Education for All’ which is enshrined in Article 21A of the Constitution of India. Ed-ucation is a fundamental right post the 93rd Constitutional Amendment in 2009. In order to achieve this goal, need exists for ensuring access to education, gender parity in school enrolment, overall enrolment and retention and the quality of education being imparted.
To effectively implement this constitutional mandate, elementary education in India is brought under the ‘Sarva Siksha Abhiyaan’ (SSA) which seeks to universalize elementary education. Similarly, secondary edu-cation has been brought under the fl agship programme ‘Rashtriya Madhyamik Siksha Abhiyaan’ (RMSA). These two schemes along with the implementation of the Right to Education Act, via a distinct set of State rules, strengthen the provision of education in the State.
Universal Access to Education
The Right to Education Act lays down the following norms to be followed in establishing schooling facilities
• Primary level schools within 1 km walkable distance of all habitations.
• Elementary level schools within 3 km walkable distance of all habitations.
• Secondary level schools within a radius of 5kms of all habitations
Telangana State has achieved 99% access at elementary level and 91.5% at secondary level by setting up schools in accordance to the parameters mentioned above. Primary and secondary schools have started in areas which were not served earlier. The department provides schooling facility to school-aged population which stands at 61.78 lakh children. During 2014-15, there are 43208 schools of various managements func-tioning in the State. The State is close to achieving its objective of ‘Universalization of Primary Education’, signifi cant efforts were made in strengthening physical infrastructure at primary level of education insti-tutions that improved the teacher-pupil ratio with quality of teaching. The teacher pupil ratio for primary, upper primary and high school category as of 2014-15 for the State stand at 27, 23 and 24 respectively.
With the objective of universalization of elementary education several initiatives have been undertaken like strengthening of existing schools, opening of new primary schools, establishment of alternative schools and other type of educational facilities in remote and un-served habitations. The interventions undertaken to bring out-of-school children into the formal education system have been particularly successful in improving the enrolment of children in schools. Enrolment in all types of schools in the State during 2014-15 was 60.76 Lakh.
Drop Outs
Another challenge that requires attention, while trying to achieve universal access to education is the reten-tion of children. While primary enrolment levels are quite high, this number drops drastically as student’s progress through classes. Data shows that the dropout rate for Telangana is 22.32% at the primary (Class I-V) level alone and 38.21% at the secondary level (Class I-X). The ASER 2014 conducted by Pratham found that in the rural areas of Telangana, this issue can be attributed to the employment of children in agriculture and allied activities, especially during harvest season. Meanwhile, interventions undertaken to bring several
81Socio Economic Outlook 2015
out of school children into schools, provision of gender specifi c facilities and reforms in the examination system must be strengthened.
Mid-Day Meal Scheme
The Government of India is supporting the scheme for supply of mid-day meal to students of Classes I-VIII, and the State Government extended the scheme with their own funds for classes IX and X. The State Government is also providing Egg / Banana twice a week to improve the nutritional standards of the students. Mid-Day Meal is being served with superfi ne rice to all the students in the state. 30.44 lakh students were covered under the Mid-Day Meal scheme during 2014-15.
Sarva Shiksha Abhiyan
Sarva Shiksha Abhiyan (SSA) aims at providing useful and relevant Elementary Education for all children in the age group of 6 to 14. SSA intends to bridge social, regional and gender gaps, with the active participation of the community in the management of schools with a funding pattern of 65:35 for the year 2014-15.
Objectives
• Enrolment of all children in the age group of 6-14 years in regular schools.• Retaining the enrolled children till the completion of 8 years of elementary education.• Focus on elementary education of satisfactory quality with emphasis on education for life.• Bridging gender and social category gaps at elementary education level.Interventions
• Opening of New Primary Schools• Up-gradation of Primary Schools to Upper Primary Schools• Sanction of Regular Teachers to new schools and additional teachers to existing Primary & Upper
Primary Schools• Strengthening of Mandal Resource Centers and School Complexes• Providing 5 day training to in-service Teachers every year • Education for Out of School Children and special training• Supply of Uniforms • Release of Teaching Learning Equipment Grant to New Primary & Upper Primary Schools• Release of School Grant, Teacher Grant and Maintenance Grant to schools• Conducting Research and Evaluation studies on interventions being implemented - Supervision &
Monitoring of activities• Management, Quality and Community mobilization• Innovations – Organizing innovative activities for Girls Education, Early Childhood Education, Edu-
cation of SC’s& STs, Minority, Urban deprived Children and Computer Education for Upper Primary Schools
• Training of Community Leaders and Community mobilization• Transport / Escort • Running Special Residential Schools and hostels for urban deprived children

82Socio Economic Outlook 2015
Achievements During 2014-15
• Around 38 new primary schools opened during 2014-15 in school-less habitations.• About 22, 41,785 children were provided 2 sets of uniforms.• About 99.4% schools are implementing the Mid-day meal scheme, thereby placing the State of
Telangana at 2nd position in the national level.• Teacher-Pupil Ratio (TPR) has improved and is as per norms at 1:29 at the Class I-V level, 1:24 at the
Class I-VII/VIII level, 1: 39 at the class I- XII level. • About 98.4% schools in the State have functioning School Management Committees.• Around 52,947 out of school children were given special training for mainstreaming them into regular
schools.Intermediate Education
There are 397 Government Junior Colleges and 4 Government Vocational Junior colleges under the administrative control of the Director of Intermediate Education. The functioning of 43 Private Aided Junior Colleges with regard to the Grant-in-aid, service conditions and academic matters for all practical purposes are being looked after by the Director of Intermediate Education.
After completing Intermediate Studies (Class 12th) conventional courses in Science, Arts and Commerce and Vocational Courses are offered. 29 Vocational courses are also offered in 588 Junior colleges in the fi eld of Engineering & Technology, Agriculture, Home Science, Para-medical, Business & Commerce and Humanities.
Vocationalisation of Education
NVEQF Pilot
The Government of India approved Pilot Project under NVEQF (National Vocational Education Qualifi cation Frame Work) to be implemented in the State on Vocationalisation of Higher Education. The approved cost is Rs.1247.73 Lakhs, out of which the Central share is Rs.1066.73 Lakhs and State share is Rs.181.00 Lakhs.
Short Term Vocational Courses
There are 24 selected short term Vocational Courses belonging to Engineering, IT, Retail, Home Science, Animal Husbandry and other sectors. During 2014-15, 1333 students were trained from 2nd June , 2014 to 31st Jan, 2015 through Short Term Vocational Courses. The State Institute of Vocational Education is conducting 3 months and 1-year duration certifi cate courses for the benefi t of drop outs and others, like SSC failed/passed, Inter failed/passed candidates through-out the State.
Collegiate Education
The Department of collegiate education ensures quality, equity and access to higher education for the students. The department monitors academic quality in 126 Government degree colleges and 69 aided colleges existing in the State. The department also looks after the development needs of all Government Colleges. There are 195 degree colleges (126 Government and 69 aided) with 1,46,124 students (87,339 in Government colleges and 58,785 in aided colleges).
Capacity Building
Quality in Higher education is ensured through accreditation made by National Assessment and Accreditation

83Socio Economic Outlook 2015
Council (NAAC). As on 31-01-2015, 55 Government degree colleges were accredited in the Cycle 1, and 31 Government degree colleges were accredited in Cycle 2. Further State Quality Assurance Cell, the functional unit of SLQACC, is established in the Commissionerate of Collegiate Education, to take up quality enhancing activities, to plan and organize post accreditation activities in the institutions, and to plan and organize activities and programmes that help expediting the NAAC accreditation of institutions in the State.
SQAC organized number of workshops, conferences, seminars etc., for creating quality awareness at the O/o CCE and also at different colleges across the State.
Technical Education
The Department of Technical Education is responsible in the state to promote technical education. The objective is to bring out engineers and technicians with technical knowledge, adequate skills in order to meet the technical skills requirements as per the needs of the industry. There are 1356 Diploma & Degree Level professional Institutions in the State with a total intake of 3, 47,950.
Establishment of Skill Development Centers
To improve the quality in technical education, 27 Skill Development Centers (SDC) have been established in Polytechnics with a cost of Rs.30.00 lakh for each SDC to provide add on skills for employability of Polytechnic Students. 10,028 students have been trained since inception.
Higher Education in Telangana
Telangana faces several challenges in higher education and one of these relate to student’s access to Higher Education in the new State. With majority of higher education institutions concentrated in the urban locations of Hyderabad, Rangareddy, and Warangal districts, access to these institutions of higher education for the more populous rural youth, remains a pipe dream.
The distribution of higher education institutions across the State is shown below
INITIATIVES IN HEALTH SECTOR
Availability of health care services are found to be inadequate both quantitatively and qualitatively. The State of Telangana lags behind the National Averages in respect of number of health indicators. Concerned over the poor health status of the State, the Government has taken several initiatives. It is well accepted that the expenditure on health care is an investment in human development, which will result in lasting the benefi ts to the people and improve their productivity. For providing basic health facilities to all citizens, Government has introduced and implemented various health schemes and programmes.

84Socio Economic Outlook 2015
Demographic Indicators
Implementation of various planned departmental programmes in a structured process over the years has culminated in achievement of the set demographic goals in the following manner.
Table 25 :Status of achievement in Demographic Indicators
Sl. No
DistrictMMR
2011-13 *IMR
2013 *TFR
2013 *CPR ***
CBR * 2013
ASR 2011 **
CSR 2011 **
1 Mahabubnagar 98 53 2.0 58.8 17.6 977 9252 Rangareddy 78 33 2.0 65.1 17.9 961 9333 Hyderabad 71 20 2.0 64.7 19.4 954 9144 Medak 90 49 1.9 59.2 16.9 992 9525 Nizamabad 79 48 1.6 58.6 19.3 1040 9486 Adilabad 152 48 1.7 57.0 19.1 1001 9347 Karimnagar 74 37 1.9 67.9 17.9 1008 9358 Warangal 78 39 1.8 70.4 16.2 997 9239 Khammam 99 45 1.8 73.8 17.4 1011 95810 Nalgonda 90 47 1.6 68.8 17.3 983 923
Telangana 92 39 1.8 66.7 17.4 988 933
Source: 1. * - State Estimates - based on Census 2011, 2. ** - Census 2011, 3. *** - District Level Household Survey-3 - 2007-08
IMR – Infant Mortality Rate (per 1000 live births), MMR – Maternal Mortality Ratio (per 1 lakh live births),T-FR – Total Fertility Rate , CPR – Contraceptive Prevalence Rate, CBR – Crude Birth Rate, ASR – Adult Sex Ratio (per 1000 males), CSR – Child Sex Ratio (per 1000 males)
Source: Commissioner for Health and Family Welfare.
Health & Family Welfare
There are 4863 Sub-centers, 661 Primary Health Centers, 114 Community Health Centers, 42 Area Hospi-tals, 8 District Hospitals, 5 Mother and Child Care hospitals and 5 Teaching hospitals apart from 55 Urban Family Welfare Centers, 11 Urban Health Posts in Hyderabad and 87 Urban Health Centers to provide ma-ternal health care, child health care and family welfare services to the people of the State.
Maternal Health Care Services
Under Maternal Health Care services, the following services are provided to the pregnant woman.
Accredited Social Health Activist (ASHA)
ASHA Programme is the key component of Community Process. ASHA will take steps to the Community on Maternal & Child Health activities. ASHA also creates awareness to the community on Nutrition, basic sanitation and Hygienic practices, Healthy living and working condition, information on existing Health Ser-vices and need for timely use of Health services. The total number of ASHA sanctioned in Rural Areas are 28019, in position are 25818. In Urban 2660 ASHAs are sanctioned and 2502 are in position.

85Socio Economic Outlook 2015
Comprehensive Emergency Obstetric And Neo-Natal Care (Cemonc) Services
There are 68 CEMONC Centers in the State. These centres were established in the districts at select 4 to 9 First Referral Units to promote institutional deliveries, attend emergency pregnancy, delivery and child birth cases being reported from within a range of 35 to 40 kms. Obstetrician and anesthetist specialist services and emergency blood transfusion services are made available round-the-clock.
24-Hrs Mother & Child Health Centers
There are 340 PHCs, which were notifi ed as 24 hour round the clock Mother and Child Health Care centers, to promote institutional deliveries, as 50% of the maternal deaths occur during or immediately after child birth and also to reduce infant and neo-natal mortalities. 14480 deliveries were conducted during the period from April to December 2014.
Village Health & Nutrition Day Centers
Village Health & Nutrition Days are regularly conducted in 32,143 villages in the State to increase community awareness on age at marriage, registration of all pregnant women at 12 weeks, 3 times check up by MPHA (F), one time by Medical Offi cer, birth planning at 7th month of pregnancy, promotion of institutional de-liveries, post-natal care services to be delivered women & new born child, breast feeding practices, immuni-zation services, promotion of spacing methods, sterilizations, vasectomies and treatment of minor ailments.
Janani Suraksha Yojana (JSY) Scheme
JSY scheme is a cash incentive to pregnant woman under BPL Category to promote deliveries in public in-stitutions including Home Deliveries in rural and urban areas. 99,674 benefi ciaries are covered from April to December 2014.
Janani Sishu Suraksha Karyakram (JSSK)
This GOI scheme was aimed at providing free cashless deliveries and care to sick new born till one year af-ter birth at all public health institutions. 75402 pregnant women were benefi tted during April to December 2014.
Rashtriya Kishor Swasthya Karyakram (RKSK)
The Government of India have launched Rashtriya Kishor Swasthya Karyakram (RKSK) in the State during the year 2014-15 to provide exclusive health care and counseling services for adolescent boys and girls of 10-19 years of age. A total number of 185 Adolescent Friendly Health Clinics / Yuva Clinics have been established in the State during 2014-15.
Child Health Care Services
“18” Special New Born Care Units (SNCUs), 61 Newborn Stabilization Units (NBSUs) and 581 New Born Care Corners (NBCCs) are established in the State in order to reduce Infant Mortality Rate (IMR) by strengthening the neo-natal care services.
Child Immunization
All infants under one year are vaccinated against VPDs such as whooping cough, Diptheria, Tetanus, Polio, TB, Measles and Hep-B under Immunization Schedule through BCG,DPT, OPV, Measles and Hepatitis-B vaccines. DPT,OPV and Measles as booster doses are administered when they attain the age of 16 to 24 months. Subsequently, they are subjected to DPT 5 years TT at 10 and 16 years as booster doses. Indicator wise Children immunized from April to December 2014 i.e., BCG(467923), DPT(466349), Polio(465974), Measles(464543), Full immunization(466580), Hepatitis–B(466571), Vitamin–A(466691)

86Socio Economic Outlook 2015
Family Welfare Services
Family welfare services are guided by the State’s Population Policy with an objective to improve the quality of services under family welfare programme.
Sterilization Methods
Sterilization services are provided to eligible couples who want to adopt permanent or spacing methods to attain small family norm on voluntary basis. Government is providing family planning incentives as compensation towards wage loss to BPL, SC and ST. Rs.600/-(CSS) and Rs. 280/- (State Ex-gratia) is given to female sterilizations (Acceptors), Rs.1100/- to male sterilization (Acceptors). 141616 sterilizations have been done during the period from April to December 2014.
Medical Termination of Pregnancy (MTP)
The objective of the scheme is to provide the MTP services to the eligible couples for termination of unwanted pregnancy. These services are provided at all Government hospitals in the State. MTPs conducted during the period from April to December 2014 are 2919.
Family Planning Insurance Scheme
The objective is to provide insurance to sterilization acceptors through authorized insurance agency. 21 people are benefi ted from the scheme during April to December 2014.
Tribal Health Services
Tribal population are mainly covered through 3 ITDAs in Khammam, Warangal, and Adilabad districts. There are 599 SCs, 86 PHCs, 10 CHCs, 6 Area Hospitals and 10 Birth Waiting Homes providing health services. 2987 CHWs are hired in the tribal areas to provide extended health services to the deserving population.
Mother and Child Health Scheme & Epidemic Teams Out Reach Services (Multi Specialty Camps)
To facilitate access for the specialty care, specialists from plain area are drafted to Tribal areas to provide specialty care. 9840 patients are examined through the specialist camps during the period from April to December 2014.
Maintenance of Birth Waiting Homes
Birth waiting homes (BWH) are to encourage tribal ANCs opting for institutional delivery. 932 women are benefi ted through the waiting homes during April to December 2014.
25 MCH teams are provided to tribal areas to identify pregnant women living in remote areas who are not reaching to the health facilities to have regular checkups. The Performance of MCH & Epidemic Teams in terms of identifi cation of ANC’s (10526), High risk referral(625), Communicable Diseases(1585), Non Communicable Diseases(3868) up to December 2014
Special Initiatives
State is implementing emergency transportation to aid the patients in case of health urgency, fi xed day health services to converge services in each rural habitation for identifi cation, diagnosis, treatment, record keeping and referral of high risk cases and health information help line to provide health advice and health coun-seling to the public. 278 palkies were supplied to carry emergency patients from remote areas to the nearest road point.

87Socio Economic Outlook 2015
Emergency Health Transportation Scheme
319 ambulances with trained technical staff all 24 hours and 365 days through 108 - toll-free telephone num-ber were made operational to cover entire State. 355084 emergency cases are transported/ covered during April to December 2014.
Fixed Day Health Services (FDHS)
200 mobile health vehicles , in all, are placed in the districts except Hyderabad, to provide once-a-month fi xed day service at the rural habitations located 3 km beyond a PHC or CHC according to pre-determined calendar. 26,93,120 people are benefi tted through the services during April to December 2014.
National Health Mission
NHM mainly assist the efforts of the department to provide various health services to the deserving pop-ulation through the chain of public facilities. While GOI provides 75% of the assistance under NHM, the State Government shares 25% of the planned funds under NHM. Thus, the approved fi nancial details for 2014-15 under NHM is Rs.792.01 crore and so far Rs.376.57 crore is released.
Telangana Vaidya Vidhana Parishad (TVVP)
Trauma Care Centres
As part of initiatives in secondary healthcare services, the Government has taken initiative for establishing Trauma Care Centres in District Hospital Mahabubngar, Area Hospital Kamareddy, District Hospital Tan-dur.
Blood Component Separation Units
The State Government initiated the process of Purchase of Blood Component Separation Units for twelve hospitals under TVVP, to deal with the ‘Dengue’ fevers and other fevers that necessitate the patients to be inoculated with one of the blood components and not the whole blood, whereby rest of the Blood Compo-nents could be used for other patients as required by them.
Swine Flu Treatment
Swine Flu treatment management centres are established in all District and Area hospitals in the State. Free tests are made available for swine Flu positive inpatient cases at Institute of Preventive Medicine (IPM), Narayanaguda and Fever hospital, Nallakunta, Hyderabad. Swine Flu medicines such as tablets and syrups are available in all Districts and Area hospitals, Aarogyasri also covers for Swine Flu treatment.
Aids Control Society
Human Immuno defi ciency Virus (HIV) is a Retrovirus that eventually causes Acquired Immuno defi ciency Syndrome (AIDS), a global Public Health problem as more than 35 million people are living with HIV/AIDS worldwide. The HIV epidemic has been one of the most challenging modern public health problems for India. Provisional estimates put the number of people living with HIV in India at 25 lakhs and 2 lakhs in Telangana.
A multi-pronged approach of service delivery integrating various components of HIV prevention, care, support and treatment during last NACPs resulted decreasing trend of HIV prevalence, evidenced by the HIV Sentinel Surveillance (HSS).
88Socio Economic Outlook 2015
Aarogyasri Scheme
The scheme is the fl agship of all health initiatives of the State Government with a mission to provide quality healthcare to the poor as defi ned by Civil Supplies Department of Government of the State. The aim of the Government is to achieve “Health for All”. The scheme is a unique PPP model in the fi eld of Health Insur-ance, tailor made to the health needs of poor patients and providing end to end cashless medical services for 938 Medical Procedures through a network of service providers from Government and private sector.
Objective and Coverage
To provide free, quality hospital care and equity of access to BPL families to protect against Catastrophic health expenditures through strengthened public institutions and by purchase of quality private medical services from identifi ed network of health care providers through a self-funded reimbursement mechanism (serviced by Trust) to assist BPL families for their catastrophic health needs.
The scheme shall provide coverage for the 944 “Listed Therapies” for identifi ed diseases in the 29 categories
The scheme shall provide coverage for the services to the benefi ciaries up to Rs.1.50 lakh per family per an-num on fl oater basis and Rs.0.50 lakh through buffer, thus total coverage is for Rs.2.0 lakhs. There shall be no co-payment under this scheme.
104 Call Centre
Queries relating to coverage, benefi ts, procedures, network hospitals, cashless treatment, balance available, claim status and any other information under the insurance scheme or Trust scheme anywhere in the State on a 24x7 basis shall be answered in Telugu.
Performance of Aarogyasri Scheme
• Therapies (1,96,671 numbers) and amount ( Rs. 516.58 crore) during 2014 -15, as on 31-01-2015
• Claim paid Rs 406.76 Crore during 2014-15, against the total claim of Rs.964.89 crore, as on 31-01-2015
• Health Camps Conducted since inception: 17080
• Health Camp Patient Screened since inception: 3834538
• Health Camp Patients Referred since inception: 123785
RURAL DEVELOPMENT
As per the 2011 census, rural population of Telangana is 215.85 lakh representing 61.3% of the total population. The high population concentrated in the rural areas of the State, makes their development and livelihood a necessary condition for the overall development of the State.The Rural Development department is implementing programmes like Watershed Development, Self Help Groups and Mahatma Gandhi National Rural Employment Guarantee Scheme in the State.
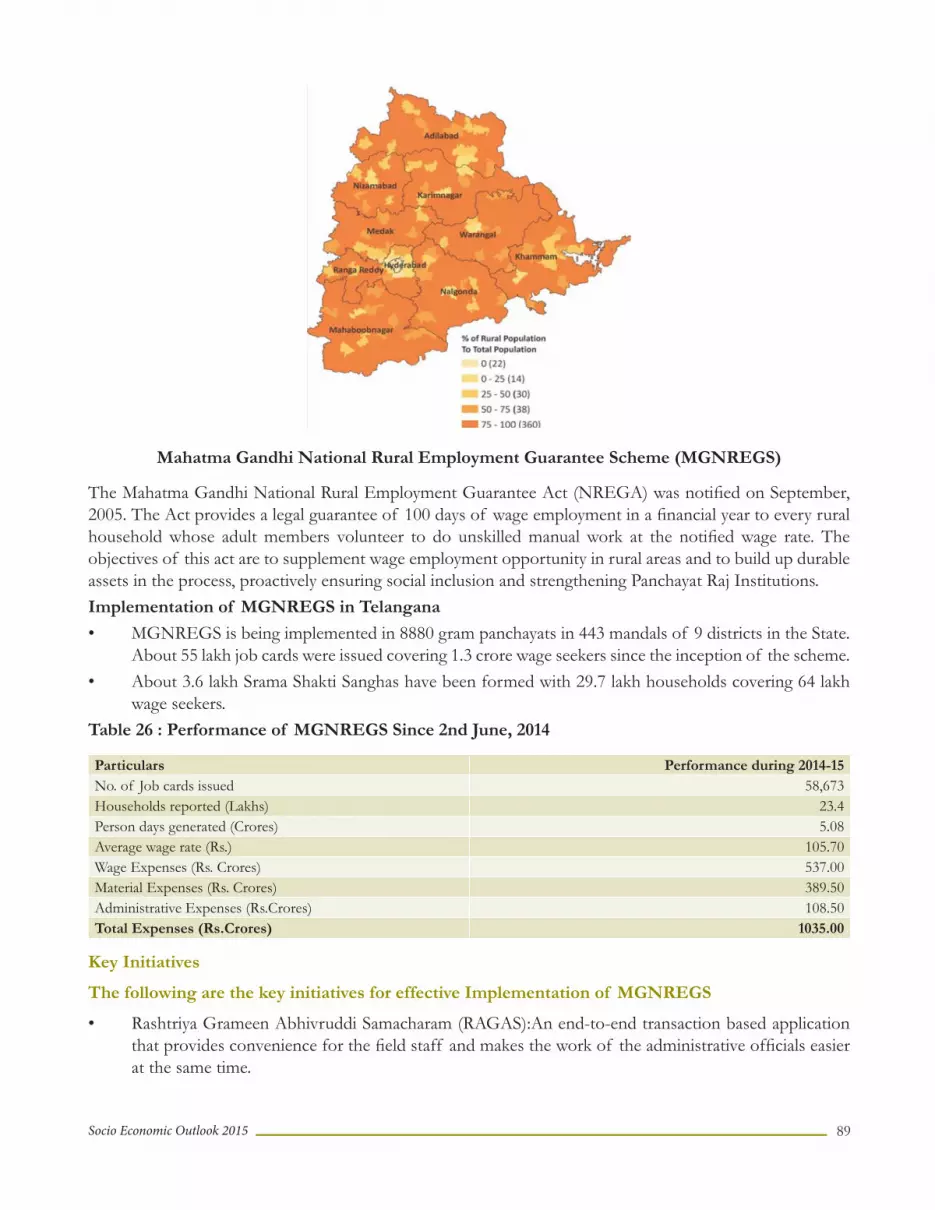
89Socio Economic Outlook 2015
Mahatma Gandhi National Rural Employment Guarantee Scheme (MGNREGS)
The Mahatma Gandhi National Rural Employment Guarantee Act (NREGA) was notifi ed on September, 2005. The Act provides a legal guarantee of 100 days of wage employment in a fi nancial year to every rural household whose adult members volunteer to do unskilled manual work at the notifi ed wage rate. The objectives of this act are to supplement wage employment opportunity in rural areas and to build up durable assets in the process, proactively ensuring social inclusion and strengthening Panchayat Raj Institutions.Implementation of MGNREGS in Telangana
• MGNREGS is being implemented in 8880 gram panchayats in 443 mandals of 9 districts in the State. About 55 lakh job cards were issued covering 1.3 crore wage seekers since the inception of the scheme.
• About 3.6 lakh Srama Shakti Sanghas have been formed with 29.7 lakh households covering 64 lakh wage seekers.
Table 26 : Performance of MGNREGS Since 2nd June, 2014
Particulars Performance during 2014-15No. of Job cards issued 58,673Households reported (Lakhs) 23.4Person days generated (Crores) 5.08Average wage rate (Rs.) 105.70Wage Expenses (Rs. Crores) 537.00Material Expenses (Rs. Crores) 389.50Administrative Expenses (Rs.Crores) 108.50Total Expenses (Rs.Crores) 1035.00
Key Initiatives
The following are the key initiatives for effective Implementation of MGNREGS
• Rashtriya Grameen Abhivruddi Samacharam (RAGAS):An end-to-end transaction based application that provides convenience for the fi eld staff and makes the work of the administrative offi cials easier at the same time.

90Socio Economic Outlook 2015
• Web Portal (MIS Reports): The user can access all the reports of www.nrega.telangana.gov.in that offer information related to employment generation, physical performance, expenditure incurred and reports related to works.
• Electronic Fund Transfer System (eFMS): Electronic Fund Transfer system (eFMS) has been estab-lished with the objective of putting in place an effi cient mechanism to generate transmission of funds through online money transfers. This system helps in avoiding the parking of funds in some places and empowers all blocks and Panchayats to access funds uninterruptedly.
• Electronic Muster & Measurement System (e-MMS): e-MMS is a mobile phone based technology that has been customized for the MGNREGS fi eld staff which includes mobile applications like Demand Capture, Work Allocation, e-Muster, e-Measurement, e-Check Measurement and e-Muster Verifi ca-tion.
• Biometric authenticated payments: Disbursement of wages is done at the pre-designated Govern-ment premises (usually the Gram Panchayat building) by the CSP, appointed by the bank. The CSP is equipped with a biometric reader networked to the bank and MGNREGA server so that any transac-tion made is directly updated in the database. The current mode of payment will be migrated from the biometric authenticated payment system to Aadhaar based payments through postal dept. and banks
• HRMS: Apart from the well laid out Institutional Arrangement at Village, Mandal, District and State Level, there is a HR policy in place. The HR policy complements the institutional arrangement and safeguard employee interests for all those working with CRD
• Shrama Shakti Sanghas (SSS groups): All serious labourers are grouped into SSS groups with group size of 10 to 30 with an objective to ensure 100 days of wage employment to all its members and for ensuring transparency.
• Work Motion Studies and RSSR: CRD undertakes work, motion studies for all kinds of proposed tasks, to bring out a special Rural Standard Schedule of Rates for the tasks taken up under MGNREGS every year
• Quality Control Wing: For ensuring the quality of works taken up, separate Quality Control cell is formed for inspecting works regularly. Quality Control Offi cers who not only check the quality of works but also support in capacity building of the technical staff.
• Grievance Redressal / Call Centre: A call centre with a toll-free number 1800-200-1001 established to register complaints on various issues in the implementation of the scheme.
• Special Provisions to PwDs: Separate groups (Vikalangula SSS) are formed for persons with disabilities and provisions like 30% additional wage rate, preference to PwDs in the selection of mates, separate schedule of rates for PwDs and exclusive works for PwDs identifi ed.
Key decisions taken during the year
• Wage rate enhanced to Rs. 169 from Rs. 149 during the year.• Aadhar Linkage: Out of the total target of 75 lakh benefi ciaries to be enrolled, 56.9 lakh benefi ciaries
were seeded with Unique Identifi cation Number (UID) or Enrolment Number (EID), i.e., 76% and 47.8 lakh benefi ciaries demo details were authenticated by Programme Offi cers.

91Socio Economic Outlook 2015
• Revamped eFMS: All the wage payments will be directly credited into the wage seekers accounts and are paid based on biometric authentication.
• Telanganaku Haritha Haaram has been announced for improving the green cover in the State by taking up plantations.
To improve the role of Gram Panchayats in the implementation of MGNREGS, State Government has taken a decision to actively involve Gram Panchayats in planning and execution of works. In convergence with SERP and PanchayatiRaj Department, Government has announced a fl agship program to support agriculture sector in addressing post harvesting issues. Therefore, construction of 181 rural godowns along with drying platforms to be taken up, where the IKP centers are active.
Society for Elimination of Rural Poverty (SERP)
Society for the Elimination of Rural Poverty (SERP) with the assistance from the World Bank, has mobilised the women in rural areas to form self-help groups in the early 2000s. This network of Community Based Organizations (CBOs) helped leverage and promote fi nancial inclusion, which was then expanded to include land based livelihood, skills training, livelihoods support, access to Government programs, and initiatives to improve health and education outcomes. Nearly 90 percent of the poor households in the State are members of these community institutions. Currently 47,41,891 women have formed 4,16,811, Self Help Groups (SHGs) at the Village / Habitation levels. The SHGs have federated at the village level to form village organizations (VO) and VOs have federated at Mandal level to form Mandal Mahila Samakhya (MMS). Currently there are 17,811 VOs and 438 MMS. These Mandal Mahila Samakhyas federated at District Level to form 9 Zilla Samakhyas.
The Government constituted a committee with a senior IAS offi cer to tour Karimnagar, Medak and Karimnagar districts to study the plight of beedi workers. Based on the committee report, appropriate guidelines will be prepared to facilitate pension payments to beedi workers.
Telangana Palle Pragathi Project
Telangana Palle Pragathi project (Telangana Rural Inclusive Growth Project – TRIGP) focusses on ena-bling the institutional platforms of the poor to achieve ‘inclusive growth’ by expanding and diversifying livelihood opportunities and ‘improved quality’ of life through human development initiatives and access to entitlements, particularly for the poorest of poor rural households. The total cost for the proposed Project has been estimated at Rs 642.00 Crore with the Government share of Rs.192.00 Crore and Rs.450 Crore funded by the World Bank. The project period for implementation is 5 years starting from February-2015 to February-2020.
The benefi ciaries targeted are small and marginal farmers and the SC/ST households from communities in the 150 most backward Mandals in the newly created State of Telangana, covering about 6,000 villages. There are fi ve components for the project, Value Chain development, Human Development, Palle Pragathi Seva Kendra, ICT & Partnerships and Project Implementation Support.
Financial Access – Bank Linkage
Through SHG Movement, savings has been taken up as a mass movement by women. The SHGs are not only resorting but are also taking small loans out of the corpus available with the group. SHGs have an accu-mulated Saving of Rs.1845.00 Crore cumulatively (Rs 378 Crore every year), Community Investment Fund- Total 435.00 Cr, Bank linkage /Cash credit limit – Rs.22657.00 Cr cumulative and potential of Rs.4000.00 Cr every year.

92Socio Economic Outlook 2015
Stree Nidhi
Stree Nidhi has earned a unique place in delivering of credit to poor, presiding timely and appropriate credit. Measure will be taken to portion the same as a livelihood promoting institutions to augment income of the poor. It is proposed to fi nance Rs 1100 crs. during the year 2015-16. There are 436 Mandal Mahila Samakhyas (MMS) of SHGs in association with Government of Telangana have promoted “STREE NIDHI Credit Co-operative Federation Ltd.” to address the issues of inadequate fi nance and to ensure timely availability of credit, preferably within 48 hours, for meeting emergency and other needs of the poorest of the poor. Rs.481.80 Crores were disbursed to 2,24,902 members of 60,797 SHGs in 7,432 VOs in 423 mandals for the FY 2014-15 up to January’2014.
Human Development
Inclusive Development of People with Disabilities
Equal opportunities, protection of rights & complete participation through CBOs. The disability interven-tions of IKP have enabled more than 4.1 lakh persons with disabilities in the rural areas to be organized and develop their own CBOs.
The PwD (Persons with Disability) activities are implemented in 438 mandals through 436 Mandal Vikalan-gula Samakhya (MVS) and 9 Zilla Vikalangula Samakhyas (ZVS), 198207 PwDs are organized into 20,368 ex-clusive PwD SHGs in the State of Telangana. PwDs are given an assistance of Rs.18.32 crores through CIF, Rs.214 crores Bank Linkages, Rs.9.9 crores Stree Nidhi and Revolving Fund for enhancing their livelihood. Community Managed Health & Nutrition
Around 1800 Nutrition cum Day Care Centres (NDCCs) had been established to provide three nutritious meals and health education to pregnant and lactating women. Gender Advocacy
As part of Social and Human development on Gender initiative, 436 Mandal Level Social Action Committees are formed and 340 community managed family counseling centres are functioning to reduce violence and injustice to address the following social issues which plague the State of Telangana:• Crimes against women (rape, sexual harassment, eve teasing, acid attacks)• Domestic violence• Dowry harassment• Female Foeticide/Infanticide (leading to low sex ratio)• Child Labour• Child Marriage• Alcoholism (amongst men leading to increase in crimes against women)• SC/ST atrocity cases• Jogini/Basivini/Matangi Systems• Traffi cking• Witch hunt (Violence against women purported to be practising black magic)
340 community managed family counseling centres are functioning in the State. Out of the 31991 cases reported, 26052 are solved.
Rural Water Supply and Sanitation
Rural Water Supply and Sanitation Department is the nodal agency in the State for providing drinking water and sanitation facilities in rural areas. The drinking water facilities are being provided by various types of

93Socio Economic Outlook 2015
schemes such as bore wells with hand pumps, Protected Water Supply Schemes , Community Protected Water Supply Schemes etc.,
The Government is determined to solve the drinking water problem in rural areas with the following objectives:
• Delivery of adequate, safe and potable drinking water to all rural people.• Safe water to fl uoride, brackish and other polluted habitations.• Up gradation of all habitations to fully covered status.• Special focus on sustainability of sources / schemes• Proper sanitation facilities to all habitations.
Various State and Central Government programmes such as NRDWP, Thirteenth Finance Commission (TFC), Nirmal Bharat Abhiyan (NBA) and other external agencies provide the funds for implementing schemes/works for providing drinking water and sanitation facilities to the habitations. Funds are also being tapped in the form of loans from NABARD, HUDCO and World Bank.
Water Supply Infrastructure
There are 1,58,496 hand pumps, 24,003 PWS Schemes and 147 CPWS Schemes (including SSP Schemes) are existing as on 02.06.2014.
Ongoing programmes and achievements during 2014-15 (from 2.6.2014) as on 01.02.2015
6284 works are ongoing with a cost of Rs.3354.15 crore to cover 15,208 habitations under various grants such as NRDWP, NABARD, World Bank, 13th Finance Commission Grants etc. Out of which, 2085 habitations are targeted for coverage during 2014-15. An expenditure of Rs.508.21 Crores is spent upto January 2015 and 1854 habitations are covered i.e., 1658 partially covered habitations and 196 quality affected habitations.
Rural Sanitation
The Total Sanitation Campaign is a central programme that is renamed as Nirmal Bharat Abhiyan (NBA) with effect from 1.4.2012 with modifi ed guidelines and objectives to accelerate further the sanitation cover-age in the rural areas, so as to comprehensively cover the rural community with renewed strategies. Nirmal Bharat Abhiyan (NBA) is envisaged for covering the entire community in saturation approach with a view to create Nirmal Gram Panchayats (NGPs).
To achieve 100% rural sanitation in the State, the Government has taken up construction of Individual House Hold Latrine (IHHLs), Schools and Anganwadi toilets as units.
The Government implemented the NBA project in convergence with MNREGS in the State for IHHLs to facilitate the BPL benefi ciary for construction of IHHL with a total incentive of Rs.10,000/- and Benefi ciary contribution as Rs.900/- up to 2nd October, 2014. Recently, the Government of India restructured the NBA program and replaced with Swachh Bharat Mission (Gramin) and launched the program on 2nd Oct. 2014 with a Mission mode approach to declare India open defecation free by 2019.
While restructuring the NBA programme and replacing with SBM (G), Government of India enhanced the incentive from Rs.10,000/- to Rs.12,000/- so as to provide water facility to toilet i.e., a tap connection, storage facility and hand wash facility.

94Socio Economic Outlook 2015
Telangana Academy of Rural Development
AMR- Telangana Academy of Rural Development is the apex training and capacity building institute of Telangana Government on Panchayat Raj & Rural Development activities. The Academy conducts trainings to Elected Representatives of Panchayat Raj Institutions and Offi cials of Panchayat Raj, Rural Development and other line departments. It also conducts workshops and Seminars on various issues relating to rural people.
URBAN DEVELOPMENT & MUNICIPAL ADMINISTRATION
As per the Census 2011, urban population of Telangana State is 13.61 million representing about 38.67% of total population compared to 31.15% at all India level. The level of urbanization has increased by seven per-centage points in the State. Hyderabad is a hundred percent urban district but the city of Hyderabad spreads much beyond the district boundary into the neighbouring Rangareddy district. This has made Rangareddy, which surrounds Hyderabad, as the next highly urbanized district in Telangana with 70.32 percent of urban population. The urban population is spread across 68 Urban Local Bodies consisting of 6 Corporations, 37 Municipalities of all grades and 25 Nagarpanchayats. The ten municipalities, which were part of Hyderabad urban agglomeration merged with Hyderabad City Corporation to form Greater Hyderabad Municipal Cor-poration (GHMC). Hyderabad Metropolitan Development Authority (HMDA) encompasses a total area of 7228 sq.km covering all 16 Mandals of Hyderabad district, 22 of Rangareddy, 10 of Medak, 5 of Nalgonda and 2 Mandals of Mahabubnagar district. However, the level of overall urbanization is low in the other dis-tricts surrounding the GHMC namely Medak, Mahabubnagar, and Nalgonda.
Table 27 : Growth and Level of Urbanisation in Telangana: 2001-11
Sl. No.
DistrictUrban Population
2001Urban Population
2011Decadal Growth
Rate 2001-11
Percent of Urban Population to Total
Population
1 Adilabad 6,60,017 7,60,259 15.19 27.73
2 Nizamabad 4,24,738 5,88,372 38.53 23.06
3 Karimnagar 6,78,812 9,51,225 40.13 25.19
4 Medak 3,83,524 7,27,871 89.78 24.00
5 Hyderabad 38,29,753 39,43,323 2.97 100.00
6 Rangareddy 19,37,837 37,19,172 91.92 70.22
7 Mahabubnagar 3,71,335 6,07,692 63.64 14.99
8 Nalgonda 4,32,678 6,62,507 53.12 18.99
9 Warangal 6,23,212 9,92,333 59.23 28.25
10 Khammam 5,10,861 6,55,911 28.39 23.45
Total 98,52,787 1,36,08,665 38.12 38.67
Total minus RR dist. 79,14,950 98,89,493 24.94
Urban development is constrained by in-migration, settlements in slums and their continuous growth, pres-sure on urban amenities, solid and electronic waste accumulation, pollution, and increasing disparities in living conditions.
Smart cities, the emerging concept encompasses information network, communication network, safe drink-ing water, sanitation, housing for all in green environment and zero open defecation with particular emphasis on participative process of the hitherto neglected population.

95Socio Economic Outlook 2015
Mana Wardu - Mana Pattanam - Mana Pranalika
Due to rapid urbanization and up-gradation of major Gram Panchayats as Urban Local bodies, a fi rst of its kind programme was launched in the State namely “Mana Wardu - Mana Pattanam - Mana Pranalika” to identify the felt needs of the people. Ward sabhas were conducted in all the ULBs involving all the public representatives and needs of the public at ward level and ULB level were identifi ed and prioritized needs in the focused areas of water supply, roads, drains, sanitation facilities and street lighting etc and future re-quirements. 5,98,632 proposals worth Rs.749179.71 lakh were identifi ed in 1549 wards in the 67 ULBs. Out of the above, 5165 top three priorities were indentifi ed for an amount of Rs.3159.85 crore. At ULB level, 201 top three priorities were identifi ed with an estimated cost of Rs.8166.90 crore. It is proposed to meet Rs.1847.76 crore from departmental budget for the year 2015-16 under the scheme of State Finance Com-mission, internal roads, assistance to new Municipalities for development works, MEPMA, APMDP etc. The remaining amount is to be pooled up in a phased manner in the next 5 years by tapping funds under 14th Finance Commission grants / departmental budget / special grants.
Swachha Bharat Mission
Swachha Bharat, a joint mission activity of the Ministry of Urban Development and Ministry of Drinking water and Sanitation, emanates from the vision of the Government articulated in the Hon’ble President’s address to the Joint session of the Parliament on 9th June 2014. The mission is implemented from 2nd October 2014 for a period of 5 years which is a tribute to Mahatma Gandhi on his 150th birth anniversary to be celebrated in the year 2019. The overall goal of the National Urban Sanitation Policy is to transform Urban India into community-driven, totally sanitized, healthy and livable cities and towns.
Mission in Telangana
Sanitation in Urban Local Bodies
• As per the census report 2011, 91.12 percent of urban Households in Telangana have access to toilets as compared to national average of 81.4 percent.
• Open Defecation in Urban Households of Telangana State is 8.98 % which is lower than the national average of 12.6%. There are 275151 urban households practicing open defecation out of 3171376 total urban households in State. Adilabad with 25.87% has highest percentage of Urban households practicing open defecation followed by Mahbubnagar with 19.37% and Nalgonda 18.22% .
• ULBs in the Telangana State, on an average, generate about 6287 Metric Tonnes of wastes per day and the per capita of waste generation in the ULBs ranges from 0.3-0.4 kg/per day. The quantities of waste are growing 5% annually and the collection effi ciency is 80%. 23 ULBs do not have land for processing and disposal of waste.
• Inadequate and improper maintenance of storm water drains with frequent fl ooding and choking of drains is leading to unhygienic environment
Initiatives of the Government
The Telangana Government has been a forerunner in implementing the Swachh Bharat Mission. In this regard as the fi rst step Swachh Telangana Varostavam (Clean Telangana Week), formally launched on 25th September 2014, was observed in all the 67 ULBs of the State with focused sanitation drives and culminating with a pledge on improving sanitation situation.

96Socio Economic Outlook 2015
Mission for Elimination of Poverty in Municipal Areas (MEPMA)
The main objective of MEPMA is to organize poor women into SHGs by covering all families living in slums and enable them to become self reliant. Around 12.66 lakh women members formed into 1.26 lakh Women Self Help Groups (SHGs). A total of 4177 Slum Level Federations (SLF) and 97 Town Level Federations (TLF) have been formed up to December 2014. Around 19,900 persons with disabilities are also organized into 3,980 exclusive SHGs. 57 Town Vikalangula Samakyas (TVSs) and 55 Parents Associations of Persons with Mental Rehabilitation were formed in the State.
SHGs Bank Linkage worth Rs.517.00 crore have been provided to 18,193 Self Help Groups for the year 2014-15. Further, under Vaddi Leni Runalu, an amount of Rs.75.02 crore is released to 6,448 Self Help Groups.
Pension-cum-Insurance Scheme
This is a co-contributory pension cum insurance scheme visualized by the State Government for the benefi t of SHG women over and above the age of 18 years in urban areas to provide social security after the age of 60 years. 56,276 women have been renewed during 2013-14, of which 5,852, who crossed the age of 60 years were given a pension of Rs.500 every month.
Status of Urban Water Supply
The State Government’s top priority is to provide protected drinking water to all urban local bodies by strengthening the existing infrastructure and to improve the service levels.
As per the standards stipulated in Central Public Health Engineering Environmental Organization (CPHEEO) manual, the rate of drinking water supply to be maintained in towns with under-ground drainage is 135 litres per capita per day (LPCD) and towns without under-ground drainage is 70 LPCD.
The normal daily water supply in various urban local bodies are varying from 35 LPCD to 135 LPCD and water supply is regulated as detailed below.
Table 28: Daily water supply
Frequency of supply Daily Alternate DaysOnce in three
days and aboveTotal
No. of ULBs 28 28 11 67

97Socio Economic Outlook 2015
Section IVECONOMIC INFRASTRUCTURE AND
INDUSTRIAL POLICY

98Socio Economic Outlook 2015

99Socio Economic Outlook 2015
IMPROVING ECONOMIC INFRASTRUCTURE4.1
Infrastructure is the basic physical and organizational structure needed for the operation of a society or enterprise, or the services and facilities necessary for economic growth in setting up an enabling platform for sustainable economic development. Economic infrastructure, particularly, lays emphasis on energy, irrigation, roads, transport, airports etc. A fast growing economy warrants an even faster development of infrastructure. Besides Government efforts, defi ning the role of private sector plays a vital role in the provision of infrastructure through Public Private Partnerships and exclusive role of private sectors in certain areas such as transport, communications, entertainment etc., accelerates the pace of infrastructure growth.
ENERGY
Telengana is the one of the top IT exporting states of India and about one third of the bulk drugs in the country are manufactured in the state. Besides these, the economy of Telangana is also dependent upon ag-riculture. Thereby Telangana is amongst the highest power intensive states in India, with a per capita power consumption of over 985 units as against an all India average of 917 units (as on FY 2012-13). Going for-ward, energy requirement is expected to see exponential growth owing to various factors such as buoyant growth in capital city and other urban centers, high domestic and agricultural consumption and upcoming major projects such as Hyderabad Metro Rail and Hyderabad-Nagpur industrial corridor.
Telengana plans to meet the demand by a number of capacity additions in pipeline and enhancing the energy availability from the existing sources. The gaps and challenges across the power value chain of Fuel – Gen-eration-Transmission –Distribution must be addressed to meet the energy requirement.
Present Scenario
The current energy availability (FY 14-15) for Telangana from various sources are 45795MU as detailed in Figure.1. Telengana has been allocated 53.89% of TSGENCO and APGENCO stations. Post expiry of PPAs, no capacity would be available from APGENCO stations while 100% capacity of TSGENCO plants would be available.
Planned Power Generation by Different Sources
Source: TSSLDC, All values in MU

100Socio Economic Outlook 2015
The demand supply projections for the next fi ve years are as detailed in Table.1. The energy requirement takes into account, assured 7 hours of power supply to agriculture customers and 6% increase in agriculture sales every year and ensuring 24x7 power supply to all other customers. The urban development in the cap-ital city of Hyderabad and planned urbanization in other centres of Nizamabad, Karimnagar and Warangal along with the upcoming major projects such as Hyderabad Metro Rail, Hyderabad Information Technology Investment Region (ITIR) and Hyderabad-Nagpur industrial corridor, lift irrigation schemes adds to the additional energy requirement.
Table 29 : Demand-Supply projections (MU)
Sl. No Item FY 14-15 FY 15-16 FY 16-17 FY 17-18 FY 18-19A Energy Requirement 54,998 63,047 67,902 77,164 84,496B Energy availability from existing sources 45,795 45,037 44,030 43,896 43,754C = A-B Energy Deficit/Surplus -9,203 -18,009 -23,872 -33,268 -40,742
Telangana Demand-Supply Summary Table (MU)
The transmission losses were 3.59% and transmission system availability was 99.94% in FY 13-14. However, there is a need to ensure augmentation and strengthening of transmission infrastructure at intra-state and inter-state level, failing which power supply cannot be improved.
There are two distribution companies namely -TSSPDCL and TSNPDCL that supply electricity to consumers in Telangana. The distribution companies cater to 1.12 crores customers. The split of customers is as shown below. Table 30 :Consumer CategoriesCategory Consumer categoriesDomestic 73%Agriculture 17%Industrial (LT & HT) 1%Commercial (LT & HT) 8%Others 1%
The transmission and distribution losses and employees per sales are less in Telangana DISCOMS while compared with select states- Tamilnadu, Gujarat and Maharastra.
Key Challenges
Demand supply Gap: Telengana has inherited a power defi cit was approximately 5%. During FY 2013-14, energy requirement was 47,428 MU of which only 44, 946 MU could be met from various sources. With the state’s growth plans in the forthcoming years, there is enormous energy requirement to fuel the development initiatives.
Integrating Non-Conventional Energy: Telengana is keen on increasing the power generation from Non-con-ventional Energy. As Telengana is a landlocked state, the potential to exploit wind energy is limited. The state is looking forward for avenues to improve the energy mix and is looking forward to integrate solar power and other non-conventional energy.

101Socio Economic Outlook 2015
Transmission corridor augmentation: Transmission corridor augmentation to ensure evacuation from up-coming generation centers should be monitored proactively to ensure that transmission corridor leads gen-eration availability.DISCOM challenges: The key challenges being reducing technical and commercial loss in distribution of power, minimizing interruptions and breakdowns in network infrastructure and meeting customer expecta-tions on new connection release and complaint resolution. TSDISCOMS are facing severe fi nancial crunch due to longer cash conversion cycle resulting from metering exceptions, low collection and billing effi cien-cies, unpaid dues from Government departments and dependence on agricultural subsidy. There is a need for agriculture feeder segregation so that the agriculture connections consumption can be captured.Measures Aimed at Capacity Additions
TSGENCO has planned signifi cant capacity additions of 4240 MW (cumulative) over the next fi ve years. Capacity additions of TSGENCO may not alone be suffi cient to address energy defi cit, and hence power procurement from other sources is necessary to augment energy availability. Some of the avenues for improving power supply position include CGS sources of Kudigi, Tuticorin, Neyveli, Kalpakkam, and Srikali are expected to contribute to over 7000 MU of power in the next fi ve years and Upcoming APGENCO plants and private plants such as Thermal Powertech will contribute to over 10,000 MU TSDISCOMS have initiated competitive bidding for procurement of 2000 MW of power on long-term basis. There is addition al spare capacity of about 6000 MW with SR generators which can be booked without transmission constraints. To improve the energy mix, the TSDISCOMS have already concluded bid process and have contracted 505 MW of solar power. Plans to purchase another 500 MW are underway.To augment and strengthen the transmission network, the TSTRANSCO line from Suryapet to Nandivanaparthy and Shankarpally (825 MW/Ckt) is in progress. Moreover for 765 KV-Wardha-Nizamabad-Maheshwaram, downstream strengthening by establishing 400 kV SS and associated line at Maheshwaram is being taken up. And network strengthening is proposed at Warangal and Hyderabad for the 765kV-Warora-Warangal-Hyd-Kurnool. Strengthening of Kalapaka to Khammam line is proposed for onward transmission from VemagiriTelengana plans to setup mega solar parks and generate about 5000 MW of solar power in the state. Way Forward
The TS power utilities have identifi ed an array of interventions across the Generation-Transmission-Distribution value chain for ensuring power suffi ciency to all consumers in the state. Some of the key interventions identifi ed are as follows :Generation
TSGENCO has huge capacity additions over the next few years and hence imperative for TSGENCO to expedite the process of completing feasibility studies, land acquisition and getting all necessary approvals. Revival of Shankarpally gas power plant is being considered subject to availability of gas from D6 basin. DPR has been prepared and GoI has been requested for allocation of 4.62 mmscmd natural gas for this project. The action points include undertaking effi ciency improvement measures such as coal auditing, three levels – loading, transportation and unloading at TSGENCO plants through a third party (SERC has initiated the process to identify consultants/auditors to carry out this exercise), improving blending infrastructure to improve GCV of coal at power plants., Implement an IT enabled coal tracking mechanism to monitor coal stock availability, coal shortfall, coal linkage materialization.For ensuring a more sustainable fuel mix, the Non-Conventional Energy (NCE) installed capacity would be increased by adapting the key measures of setting up of single window clearance mechanism, allowing

102Socio Economic Outlook 2015
unrestricted banking during ToD hours, providing cross subsidy surcharge exemption, providing policy support for solar roof tops and net metering, promoting Decentralized Distributed generation model for solar power generation and preparing an exclusive dedicated solar policy.Transmission
TSTRANSCO would ensure required transmission infrastructure for evacuation of Power from CGS and Power Plants. The key action points are augmenting the existing 400 kV lines and erect new 400 KV / 765 KV network to meet the projected energy requirement and identifying Transmission lines / projects to be constructed through Tariff based competitive bidding and Viability Gap Funding (VGF) based on grant by GoI and also identifying lines with high losses and thereby undertake system augmentation works.Distribution
The DISCOMs would focus on 4 major action points- Loss reduction, reliability improvement, improve renewables penetration and improve customer satisfaction. The Loss reduction would have commercial action plan and Technical action plan. The commercial action plan would focus on intensive inspection and reduction of MBC exceptions through support of data analytics to improve metering, billing and collection effi ciency. The technical action plan would include implementation of agricultural feeder segregation at an estimated investment of INR 1458 cr., Phased implementation of HVDS to cover 19.1 lakh agricultural consumers at an estimated investment of INR 43,780/ pump-set and improved metering of DTRs and feeders and phasing out of old mechanical meters at consumer end. The reliability improvement will comprise of providing adequate redundancy schemes for critical, commercial, security and essential services establishments, SCADA implementation at 11 kV feeder level and at all district headquarters at an estimated investment of INR 300 Cr and smart meter installation for existing 16 lakh three phase connections at an estimated investment of INR 1100 Cr. It will include monitoring the agriculture supply as per government policy, by effective metering and data collection.The renewable penetration would be improved by implementation of net metering for solar roof-top power plants and by solar pump sets installation in viable areas with above average water table. The discoms would focus on customer satisfaction by setting up consumer care centers in each district with mapping of all consumers in the district.
103Socio Economic Outlook 2015
Solar Energy Programme
The estimated solar power potential in Telangana State is 20.41 G.W. Government is keen to promote renewable energy power in the State particularly solar power plants at selected locations. Government is also planning to bring comprehensive solar policy for promotion of solar energy in the State.Government is encouraging solar roof top net metering systems in the State to reduce the pressure on grid supply with subsidy by GOI. It was decided to extend 30% subsidy in the Domestic sector for 1 KW of grid system for 4,200 numbers, in addition to the GoI subsidy. To support agricultural farmers, the Government initiated to provide fi nancial assistance to take up solar sets at large scale in order to provide uninterrupted power supply. As on 28-01-2015 Renewable Energy power projects in the State commissioned are 396.775 MW. ROADS AND BUILDINGS
Roads
Roads are one of the basic modes of transport system and also an important priority sector of infrastructure. Systematic development of Road is one of the important pre-requisites for development and acceleration of economic growth. The importance is much more in a State like Telangana whose economy is from service sector and has chosen manufacturing as its future, where the rail connectivity is poor and where the rural areas are hardly covered by the rail network. Where the transport systems are effi cient, there are better eco-nomic opportunities for people and greater mobility. States that provide greater mobility are often those with better opportunities to develop. Direct benefi ts of better and well connected transport facilities include greater economic activity and employment opportunities. There are many indirect benefi ts in terms of the multiplier effects. A better transport facility is a catalyst for both economic and social development. Among the different modes of domestic transport systems, road transport carries more than 80 percent of the goods and passenger traffi c. The network of roads, particularly from rural to urban facilitates speedy movement of goods and services and ensures higher growth trends, social integrity and wellbeing of the society. The productivity and effi ciency of Road transport is directly linked with the availability and quality of Road network. In view of the high potential in agricultural activity, there has been huge increase in Road network. The Roads and Buildings Department is maintaining total Road Network in the State that stands at 26,837 Kms. The density with reference to R&B Road Network in the State is 0.23 Kms per one square kilometer and 0.86 Kms per 1,000 persons.Table 31 : Status of Road Network
National Highways 2,592 KmsState Highways 3,152 KmsMajor District Roads 12,079 KmsRural Roads 9,014 KmsTotal Road length in Kms 26,837 KmsState Roads (Excluding National Highways) 24245 KmsCore Net Roads 4020 Kms

104Socio Economic Outlook 2015
Table 32: Category- Wise Details of The Roads
Sl. No.
Classifi cation of RoadFour Lane &
AboveDouble Lane
Intermediate Lane
Single Lane Total
1 National Highways 964 1264 153 211 2592
2 State Highways 377 2484 88 203 3152
3 Major District Roads 281 3274 478 8046 12079
4 Other District Roads 10 335 53 8616 9014
Total 1632 7357 772 17076 26837
Table 33: Quality of Roads
Sl.No. Classifi cation of Road CC Black Top Metalled Un-Metalled Total
1 National Highways 1 2591 0 0 2592
2 State Highways 5 3147 0 0 3152
3 Major Dist. Roads 75 11846 36 122 12079
4 Other District Roads 173 8410 249 182 9014
Total 254 25994 285 304 26837
Plan Works
Under this category original works, other than maintenance works are taken up. The main focus is on laying new roads, construction of new bridges, widening and strengthening of the existing roads to the present traffi c levels. It also includes construction of bridges at crossings without bridges, dilapidated bridge locations and widening of bridges.
1. Widening of single lane roads to double lane roads were taken up for improving the connectivity between the different mandal headquarters and district headquarters. Under this scheme, 143 works covering 149 mandals for a length of 1,996 Kms at a cost of Rs.2,585.00 crores has been taken up.
2. Widening of other important single lane roads to double lane roads is aimed at improving the connectivity in the entire State. Under this scheme, 260 works for a length of 2,721 Kms at an estimated cost of Rs.3704.00 crores has been taken up.
3. Construction of bridges in place having dilapidated / narrow bridges, at crossings without bridges, including bridges across Krishna and Godavari Rivers would improve the traffi c safety. Under this scheme, 389 works at an estimated cost of Rs. 1,974.00 crores has been taken up.
4. Connecting District Headquarters to State capital by 4-lane roads.
5. Formation of Ring Roads to district Headquarters & important towns. This intervention would cover important towns and improve connectivity for smoothtraffi c for faster mobility.
Maintenance of Works
It is not just suffi cient to develop assets, but they have to be maintained in proper shape to retain their asset value and to derive maximum benefi ts. During the past several years the maintenance was not taken up to the extent required. The Government has taken up the maintenance in a phased manner covering 10,000
105Socio Economic Outlook 2015
kms, at an estimated cost of Rs. 2,400 crores, which includes ordinary maintenance works like patch work, sectioning of berms, jungle clearance, maintenance of bridges/culverts/CD works etc. and periodical repairs programme such as repair of roads by laying top BT layers etc.
Road Safety Engineering Works (RSEW) Scheme
The Road Safety Engineering Works are specifi cally meant for improving the safety standards in the existing roads. Under this scheme, 37 works were taken up.
Railway Safety Works
Railway safety works are sanctioned at existing level crossings. The aim of these works is to reduce the traffi c confl ict, accidents and reduce the hindrance to traffi c movement.
The overall benefi ts that will accrue to the public include:
• Reduction in vehicle operating cost
• Reduction in travel time
• Reduced number of accidents/causalities
• Increased and faster access to market/business centres.
• Faster growth rate.
• Decentralization of growth
National Highways
The NH wing of Roads and Buildings Department is the executing agency for the development and maintenance of National Highways in the State of Telangana. The Government of India provides funds under Plan & Non Plan for the development and maintenance of National Highways in the state. As on 30.01.2015, there are 16 National Highways in the State of Telangana covering a length of 2592 Km crisscrossing the State. In addition, GOI have declared 3 new National Highways (around 285 Kms).
The density of National Highways in Telangana is 2.25 Kms / 100 Sq.Km of area against National average of 2.82Km / 100 Sq.Km of area. Out of 2592 Kms National Highway in the state, a total length of 768 Km was handed over to NHAI for development under NHDP. During 2014-15, road works costing Rs.356.00 crores and bridges costing Rs.64.20 crores have been approved by Ministry of Road Transport and Highways (MORTH).
NHDP IV
Under National Highways Development programme (Phase IV), 8 works (Two lane with Paved Shoulders) are taken up covering a length of 473 km costing Rs.1732 crores, out of which, 6 works are in progress.
EPC- Corridor Approach
About 4 works are taken up under Corridor Approach for a length of 174.9 km costing Rs.373 crores.
CRF Works
The Ministry of Road Transport and Highways (Mo RT&H) has accorded sanction for 58 works costing Rs 615.75 Cores in the State of Telangana in two phases under central road fund. All the works are let out and are in different stages of progress.

106Socio Economic Outlook 2015
Left Wing Extremism Scheme
Some 29 works are taken up under LWE (Phase-I) and (Phase-II) scheme, out of which 23 works are completed covering a total length of 508.94 kms with a cost of Rs.683.69 crores. The balance 6 works covering a length of 89.13 km for a cost of Rs.396.54 crores are in progress.
Public Private Partnership (PPP)
HKR (Hyderabad-Karimnagar-Ramagundam) Road
Commercial operations started on 01-06-2014 for a length of 190.19 km out of total length of 206.85 km.
NAM (Narketpally-Addanki-Medarmetla) Road
Commercial operations started on 11-03-2014 for a length of 190.38 km out of total length of 212.50 km.
Further feasibility studies are in progress for the following seven roads proposed to be taken up under PPP-BOT mode.
Table 34 : Details of Roads proposed under PPP-BOT mode
S. No. Name of the Road Length in Km
1 Sangareddy - Narsapur - Toopran - Gajwel - Bhongir - Chityal Road 164.00
2 Mahaboobnagar - Nalgonda Road (Km. 0/0 to Km. 163/2 ) 163.20
3 Hyderabad - Narsapur Road. 28.00
4 Jangaon - Cherial - Duddeda road. 46.40
5 Jangaon - Suryapet Road. 84.40
6 Suryapet - Mothey - Khammam Road. 58.30
7 Hyderabad - Bijapur Road (from Km. 23/6 to 60/0 - Manneguda) 36.40
Panchayati Raj Roads
The Panchayati Raj Engineering Department does planning, designing, execution and maintenance needed for infrastructure facilities in rural areas and assist the local bodies in construction and maintenance of rural roads, development of village internal roads and construction of buildings such as ZPP, MPP, GP and community halls etc. under various programmes.
The total length of the rural roads under Panchayati Raj Engineering Department as on 01.04.2014 is 64046 kms in the State.
The details are as follows:
• CC + BT roads is 20282kms.• WBM roads 14146 kms.• Gravel roads 14734kms.• Earthen roads 14884kms.
During 2014-15, 1409 works for up-gradation of roads up to BT standard including CD works with an estimated cost of Rs.1952.22 crore were taken up. Besides this, 3,426 works costing Rs.1766.92 crores for BT renewals and repairs to CD works were taken up.

107Socio Economic Outlook 2015
Buildings
The plinth area of Government Residential Buildings and Non-Residential Buildings in the State are 38.85 lakh Square feet and 12.27 lakh Square feet respectively. Major works of 46 numbers, with an estimated cost of Rs.14,384.00 lakhs during 2014-15 are in progress. Further, 29 numbers major works with an estimated Cost of Rs.8643.45 lakhs are being taken up during 2014-15.
Transport
Road Transport plays a prominent role in the economic development of the State. The Transport Department plays a key role in issuing licenses to drivers, registration of motor vehicles, issue of transport permits levy and collection of motor vehicle tax, enforcement of vehicle violations and acts as nodal agency for road safety.
As on 01-02- 2015, the State has registry of more than 77 lakh vehicles. About 74% of vehicles on road are two wheelers, followed by cars, the details of registered motor vehicles on road are shown below.
Table 35: Registered Motor Vehicles in Telanaga State
Sl. No.
Class of VehicleAs on 31.01.2015
(in Nos.)
1 Auto-Rickshaws 2913542 Contract carriage vehicles 64663 Educational Institute Vehicles 202434 Goods Carriage vehicles 3280875 Maxi cabs 189786 Mopeds and Motor Cycles 57228947 Motor Cars 9247788 Motor Cabs 625909 Private Service vehicles 248210 Stage Carriage Vehicles 1557211 Tractor and Trailers 28558112 Others 42090
TOTAL 7721115
The transport department collects revenues from the issue of driving licenses, registrations, permits and taxes. The growth of revenue is shown below.
Table 36: Revenue of Transport Department
Year Total Revenue(Rs.in crores)
2010-11 1294.73
2011-12 1517.40
2012-13 1768.00
2013-14 1753.72
2014-15 (UPTO 31.01.2015.) 1579.76
All the services in the Transport Department are fully computerized and the department provides for multiple

108Socio Economic Outlook 2015
accesses to services through the Internet, Mee-Seva centers in addition to the department’s offi ces with a view to increase transparency in the functioning of the department ensuring customer access. Citizens can now make tax payments or book slots of the learner licenses and driving licenses through the e-seva counters or through the internet or at the transport department’s offi ces.
All the 15 check posts and 11 MVI offi ces are also integrated to 3-tier architecture. As on today, all the 66 locations are migrated to 3-tier software in the State. On an average, 29,000 transactions per day are being attended by all the offi ces in the State. All the motor vehicle dealers update their transactions (issue of TR for a new vehicle) on to the central server by making online payment of tax for each vehicle at the time of sale itself. All the applicants who want to book slots for LLR Test and DL Test also can book slots at various places on the web from anywhere. With the help of centralized MIS, it is possible to monitor and track various transactions in real time from head offi ce.
Telangana State Road Transport Corporation
The Telangana State Road Transport Corporation consists of 3 zones, 10 regions and 94 depots with a total fl eet strength of 10,342 buses and 0.58 lakh employees on rolls as at the end of the year 2013-14. The fuel effi ciency is 5.18 per liter during 2013-14. It operates about 34.17 lakhs KMs and transports about 83.15 lakh passengers daily. The average vehicle productivity per day is 331 Kms.
AIRPORTS
Hyderabad International Airport
Hyderabad International Airport Limited owns and operates the Rajiv Gandhi International Airport (RGIA). This is a PPP project and the total investment for the airport construction in the fi rst phase is Rs.2920 crore. RGHIAL is a joint venture company promoted by GMR Group (63%) with Malaysia Airports Holding Berhad (MAHB) (11%), State Government (13%) and the Airports Authority of India (13%) as the other consortium partners. As on 31st December, 2014 RGHIAL employed 485 employees.
Connectivity
Airport has two major access points viz. the National Highway NH-7 and Outer Ring Road (ORR) from the western side and Srisailam State Highway on the eastern side. 1st phase of ORR connects Cyberabad region to the Airport. First of its kind 11.8 km long elevated expressway (PVNR) enable passengers to reach airport from the city centre through the NH-7 Highway, within 30 minutes. Besides these, Multi-Modal Transportation System (MMTS), Mono Rail Transport System (MRTS) and other alternative modes of transport are being actively explored in collaboration with the State Government.
Traffi c Highlights
Passenger Traffi c
For the year 2014-15 (April, 14 - December, 14), domestic passenger growth is around 20% year on year (YoY), whereas international passenger growth is 13%. Overall the passenger traffi c has shown a growth of 18% YoY. In the same period the airport handled 7.75 million passengers.
Air Traffi c Movements (ATM)
For the year 2014-15 (April, 14 - December, 14) Domestic ATM growth is around 9% YoY, whereas International ATM has grown by 7%. Overall the ATM have shown a growth of 9% YoY. In the same period, the airport handled 71,308 ATM.

109Socio Economic Outlook 2015
Freight Traffi c
For the year 2014-15 (April, 14 – December, 14 ) Domestic Cargo growth is around 18% YoY, whereas International cargo volume has grown by 13%. Overall the Cargo has shown growth of 15% YoY. In the same the airport handled 77,266 tonnes of Cargo.
New Developments at RGIA (April - December, 2014)
• Qatar Airways Cargo launched 2x Weekly freighter operations
• Turkish Cargo launched Weekly freighter Services.
• Air Asia Malaysia launched direct passenger fl ight services to Kuala Lumpur.
• Gulf Air launched direct passenger fl ights to Bahrain.
• Retail facilities in the International Security Hold Area upgraded to enhance passenger experience and retail options.
• Dedicated counter for Telangana Tourism opened at the airport to promote tourism activity in the State.
• Tourist Visa on Arrival (TVOA) facility enabled with Electronic Travel Authorization (ETA) to 43 countries was launched at RGIA effective 1st December, 2014.
• United Technologies Corporation India signed lease agreement to set-up an aircraft engine training centre in the Aerospace Park and ground breaking ceremony was held to mark the start of construction work.
• Lease agreement signed with Global Aero Tech India Private Limited to set up a state-of-the-art aircrafts parts bank within RGIA Aerospace Park.
Warangal Airport
This is an existing airport in an area of 748.02 acres. The AAI has requested for an additional land of 438 acres.
Regional Airports
Government proposed to formulate ‘Aviation Policy’ for development of Regional Airports. The consultant i.e. Administrative Staff College of India (ASCI), Hyderabad has submitted a draft on Aviation Policy. The Revenue, TR & B, Home and MA&UD Departments have furnished their remarks on the policy. The policy is under process of fi nalization.
IRRIGATION
Irrigation contributes immensely to the Agriculture sector and thereby to the Socio-Economic development of the State. Irrigation in Telangana is mostly dependent on the utilization of water from Godavari and Krishna rivers and tributaries, tanks and ponds. There are about 46,000 water conservation structures varying from very large tanks to small ponds including percolation tanks. These water conservation structures together are the leading source for meeting irrigation, commercial and other domestic needs.
The State Government realises the importance of irrigation and is striving hard to harness the water of both the rivers for development of the State in a sustainable way. Towards this endeavour, efforts are afoot to

110Socio Economic Outlook 2015
expedite the ongoing and proposed major and medium irrigation projects. This will allow rightful utilization of total allocation of water to Telangana. The planned utilization in Godavari & Krishna River is 933.70 TMC and 298 TMC respectively including fl oodwaters in Krishna Basin.
Irrigation system under the Kakatiyas, who developed excellent irrigation technology harnessing every drop of rainwater, offers a very good model to revive sustainable drought-proofi ng measures. Apart from the four major tanks – Pakhal, Ramappa, Lakhnavaram and Ghanpur with a yield of 5,872 mcft covering an ayacut of 11,975 ha, there are 5,000 other lakes with a storage capacity of 100 mcft each. Repairs, renovation and restoration of minor irrigation tanks have stabilized an ayacut of 3,908 ha in the years 2012-13 and 2013-14.
Minor irrigation tanks being the lifeline of Telangana, the Government has accorded highest priority for renovation of chain tanks in Minor irrigation sector under the fl agship programme ‘Mission Kakatiya’ in the next fi ve years with funding from GOI, JICA, AIBP, World Bank and through normal State Plan. These activities would also contribute to stabilize the groundwater levels. Rainwater harvesting is another area of high importance to ensure that water yields of micro and minor irrigation structures would be kept at easily exportable levels.
Government has planned to complete the Major & Medium Irrigation Projects in a phased manner, so as to create Irrigation potential of 99.136 lakh acres.
Table 37 : Status of Projects in Godavari Basin
River basin
Type of ProjectsNo. of
ProjectsCapacity in
TMC
Irrigation potential
(lakh acres)
Godavari Major & Medium Irrigation projects in Godavari basin 27 455 30.54
Major and Medium Irrigation projects 22 (ongoing) 395 35.465
New Projects contemplated 16 62.422 66.09
Water earmarked for Hydro Electric Projects in Godavari 21.453
Krishna Major & Medium Irrigation projects 13 89.15 21.494
Major & Medium Irrigation projects 5 (ongoing)23.90
(assured) 77.0 (fl oodwater)
11.63

111Socio Economic Outlook 2015
Table 38: On-Going other Projects
Name of the Project Details
Dr. B. R. Ambedkar Pranahitha-Chevella Project
• Pranahita-Chevella project is under active consideration to declare as national project by the GoI
• Contemplated to create an irrigation potential (IP) of 16.40 lakh acres
• Expected to benefi t 7 districts duly utilizing 180 TMC assured waters of Godavari River
• Cater to the needs of drinking water and water for Industries.
Accelerated Irrigation Benefi t Programme (AIBP)
• 13 major and medium irrigation projects under AIBP of GoI.
• So far Rs. 2078.71 Crore is released and balance of Rs.859.17 Crore to be released by GoI.
New Major Irrigation Schemes & Projects
Telangana Government has an overall strategy to create facilities for irrigating one lakh acres in each constituency excluding urban areas in the coming 5 years. Thus the government has proposed to take up 2 Major projects & One Flood Flow Canal, benefi ting the districts of Mahabubnagar, Ranga Reddy, Nalgonda and Warangal by irrigating 13.41 lakhs acres and check on fl oods in monsoon season.
Table 39 : Details of New Major Irrigation Schemes and Projects
Name of the Project Details
Palamuru-Ranga Reddy Lift Irrigation Scheme
• Project aims to provide drinking water to Hyderabad
• Irrigate 7 lakh acres in Mahabubnagar, 2.7 lakh acres in Ranga Reddy and 0.3 lakh acres in Nalgonda districts by lifting 70 TMC of fl ood water from Krishna River near Jurala project
• Estimated cost is about Rs.25,000 Crores.
Nakkalagandi Project
•Planned to irrigate 3.41 lakh acres of chronically fl uoride and drought affected areas of Nalgonda District and a part of Mahabubnagar District
• Estimated cost of Rs.6,000 crores utilizing 30 TMC of fl ood water to be drawn from the SLBC Tunnel being constructed from Srisailam Project
Jurala-Pakhala Flood Flow Canal
•The Jurala-Pakhala Flood Flow Canal is under investigation from the foreshore of Jurala Project
• Has a silt level at +311.000 (at Jurala) to Pakhala Reservoir in Warangal district
• Potential to feed approximately 700 tanks situated in drought prone areas of Mahabubnagar, Nalgonda and Warangal districts during fl ood season in 35 days by diverting 24,000 cusecs for total 70 TMC

112Socio Economic Outlook 2015
Minor Irrigation
There are 35,974 tanks serving an ayacut of 18.75 lakh acres including 31,196 Panchayat Raj department tanks serving an ayacut of 6.68 lakh acres. The tank irrigation is concentrated mostly in the districts of Warangal, Khammam and Karimnagar. Under minor irrigation, an area of 37,300 acres of irrigation potential is created and 19,700 acres of irrigation potential is utilised with an expenditure of Rs.488.46 crores during the year 2013-14. The rehabilitation of Minor irrigation schemes sanctioned under World Bank assisted by Telangana Community Based Tank Management Project is in Progress. The scheme is intended to improve 1182 tanks and about 762 schemes are completed.
District wise distribution of area under Tank Irrigation
Since 1990, well irrigation in the State has increased substantially while there is steady decline in tank irrigation, causing serious concern on source sustainability and energy demand for pumping groundwater. A comprehensive programme for restoration of tanks and revitalization of irrigation potential is critical for developing an integrated approach towards surface and groundwater management, and fi lling the prevailing 63% gap in realizing the potential of tank irrigation in the state benefi ting about 11.5 lakh farmers in the nine drought prone districts of Telangana state.
Tank irrigation has huge bearing on generation of rural employment, poverty reduction and agricultural growth. The sheer size of command area under tank irrigation makes it a large centre of agricultural production and provides a critical opportunity for commercial agriculture through market linkages.
MISSION KAKATIYA- A Flagship Programme
Tanks were the main source of irrigation in Telangana for centuries. Over a period of time, due to lack of proper maintenance and siltation, most of these tanks have either shrunk or become defunct. Reduced availability of surface water has resulted in over stress on the available ground water resources.
Monsoon rains have been unevenly distributed and 85% of cultivated area in the state is rain-fed. The topography and rainfall pattern in Telangana has made tank irrigation an ideal type of irrigation, storing and regulating water fl ow for agricultural use. The enormous number of inscriptions at tank sites and in temples proclaim the active role of Kakatiya, Qutubshahi and AsafJahi kings in the construction of tanks. In the state, there are about 46,531 minor irrigation sources irrigating a total area of 10.17 lakh hectares.

113Socio Economic Outlook 2015
The tank system has been critical to growth of agriculture in the state, contributing to soil and water conservation, fl ood control, drought mitigation, livestock and domestic uses, recharge of ground water, microclimate and protection of environment. Access to irrigation infrastructure for the poor people allows them to enhance their crop production and broaden the opportunities to diversify their income base, reducing the vulnerability caused by the seasonality amidst the threats of climate change.
Telangana has widely diversifi ed farming base with large variety of crops, which include food, horticulture and cash crops. The cultivable land is about 67% of the total geographical area, 60% of which is under food crops. Paddy is the predominant food crop and is sown in 25% of the cultivated area. Pulses occupy 18% area followed by sorghum and maize which accounts for 14% of the cultivated area. Groundnut, cotton, castor, sunfl ower, sesamum and sugarcane are other important crops grown in the State.
Considering the aforementioned issues related to the tank irrigation, the Government of Telangana State has taken up the massive programme of restoring all the 46,531 minor irrigation sources under the name “Mission Kakatiya” (ManaVooru– ManaCheruvu) in a decentralized manner through community involvement. The Government is aiming to complete the restoration of all the tanks in the next fi ve years at an estimated cost of Rs. 20,000 crores.
• Restoration of the tanks would involve the following components.
• Silt Removal and Silt Application
• Restoration of Feeder Channel to the tank ( Part of chain of tanks)
• Repairs to Bund , Weir and Sluices
• Re-sectioning of Irrigation Channels and Repairs to CM & CD works.
• Raising of FTL, wherever possible/necessary.

114Socio Economic Outlook 2015
Table 40 : District and year-wise Plan of Restoring the Tanks
Sl. No.
District No of Sources
No of tanks proposed during the year
2014-15 2015-16 2016-17 2017-18 2018-19
1 Karimnagar 5,939 1,188 1,210 1,220 1,200 1,1212 Adilabad 3,951 790 800 800 800 7613 Warangal 5,839 1,168 1,170 1,180 1,200 1,1214 Khammam 4,517 903 910 920 930 8545 Nizamabad 3,251 650 650 650 650 6516 Medak 7,941 1,588 1,590 1,600 1,610 1,5537 Ranga Reddy 2,851 570 500 570 600 6118 Mahaboobnagar 7,480 1,496 1,500 1,510 1,510 1,4649 Nalgonda 4,762 952 978 980 980 872
Total 46,531 9,305 9,308 9,430 9,480 9,008
All the 46,531 tanks are proposed to be rehabilitated, at the rate of about 1/5 number of tanks per year, in a span of 5 years starting from 2014 – 15 onwards. The State is committed to ensure restoration of all the irrigation tanks in the next fi ve years in a phased manner.
Command Area Development
Department takes up studies under three major project commands viz., Nagarjunasagar Left Canal Command, Sriramsagar Project Command, Jurala Project Command area to:• Delineate areas already water logged and prone to water logging• Recommend conjunctive use of both surface and ground water• Suggest other suitable remedial measures to improve productivity
Ground Water
Ground water is one of the major sources of irrigation in the State. Being an important and integral part of the hydrological cycle, its availability depends on the rainfall and recharge conditions.
The demand for water has increased over the years and this has led to water scarcity in many parts of the world. During the past two decades water level in several parts has been falling rapidly due to an increase in ground water extraction. The number of bore wells drilled for irrigation of both food and cash crops have rapidly increased. Intense competition among users viz., agriculture, industry and domestic sectors is in demand for ground water resulting in driving the ground water table lower.
The estimation of the ground water resources was done with 2010-11 databases where the state was divided into 494 watersheds, also known as groundwater basins or assessment units. The categorization of watersheds/ mandals/ villages on the basis of ground water development and level of exploitation was given in the Annexures .
Telangana Community Based Tank Management Project
Participatory Ground water Management aims at empowering the ground water users in the tank infl uence zone to wisely manage the dynamic groundwater resources replenished through rainfall, surface water sources and returns circulation from irrigated areas. Under this project a total of 172 tanks have been selected for Participatory Ground Water Management activities, falling in 7 districts and covering 78 Mandals.

115Socio Economic Outlook 2015
The activities cover installation of PHM equipment including, drilling of piezometers, installation of PHM equipment, trainings, data analysis and dissemination of data etc. The project is scheduled for seven years (2007-2014) at an estimated cost of Rs. 16.24 crores for Telangana State. In the year 2013-14, Rs.887.60 lakhs were released by the State Project Director and the expenditure is Rs.413.30 lakhs.
Telangana Water Sector Improvement Project
Considering limitations of present groundwater management system there is a need to develop a new groundwater management model that recognizes limitations of existing management system by individual and recommends an aquifer level groundwater management by the community. The project is scheduled for six years (2010 to 2018) at an estimated cost of Rs. 14.93 Crores. Two pilot projects are being undertaken by the department.
• User Centred Aquifer Level Groundwater Management Pilot in Nalgonda
• Conjunctive use of surface and groundwater pilots in NSLCCN in Khammam
Under this project, the budget estimate for the year 2014-15 was Rs.669.10 lakhs, the budget release was Rs.76.67 lakhs and the expenditure was Rs.13.25 lakhs.
Further 1,057 villages have been identifi ed as over exploited for the purpose of notifi cation under Telangana Water, Land and Trees Act (TWALTA), where continued exploitation of ground water is banned except for drinking water purpose. In terms of quantity, the total groundwater availability in the state is 1,36,74 Million Cubic Meters (MCM) out of which 7,502 MCM is the utilization for various purposes leaving a balance of 5,805 MCM. The overall stage of ground water development is about 58%. Total number of additional wells feasible is 2,33,529.
Sun set at Hussain Sagar
116Socio Economic Outlook 2015
NEW INDUSTRIAL POLICY4.2
The State of Telangana is home to large manufacturing industries in bulk drugs, pharmaceuticals, agro-pro-cessing, cement & mineral-based industries, high precision engineering, textiles, leather, iron & steel, gems & jewelry, biotechnology, defence etc. The State is one among the major industrial states in the Country ranked 6th in terms of industries and ranked 8th in terms of Gross Value Added from industries.The Government is promoting industrial incentive policy to create quality infrastructure coupled with congenial industrial en-vironment to make Telangana an attractive investment destination for both foreign and domestic investors, with special emphasis on creating an enabling eco-system for women entrepreneurs and for those from the Scheduled Castes (SC) and Scheduled Tribes (ST).
Growth of Industrial Sector
The growth of industrial sector in Telangana has been impressive. During the year 2014-15(Advanced Es-timate), the growth of industries surged to 4.1 percent from 0.13 percent of 2013-14 at constant (2004-05) prices due to the incentives being offered under the new Government’s Industrial Policy Framework, 2014.
During the decade 2004-05 to 2014-15 the State registered an average growth rate 7.8 % at constant prices (2004-05). However, the growth path of the State exhibited greater fl uctuations than that of all India. Man-ufacturing sector growth across districts indicates that seven districts other than Medak, Rangareddy and Hyderabad require specifi c strategies and policy interventions. The growth in sub-sectors indicates a fall in the unregistered manufacturing sector represented by the micro and small enterprises, electricity, gas & water supply, and construction. The share of industry sub sector in the Gross State Domestic Product (GSDP) is presented below.
Table 41: Share of Industry & Subsectors (%) in GSDP at Current Prices
Sub-Sector 2004-05 2014-15(AE) 1.Mining & Quarrying 4.8 2.92.Manufacturinga. Registered 10.0 9.9b. Un Registered 3.2 1.63.Electricity, Gas & Water supply 2.8 2.04.Construction 7.5 8.65.Industrial Sector contribution to GSDP 28.3 25.0
‘When you innovate, you create new industries that boost your economy.’
- Neil deGrasse Tyson

117Socio Economic Outlook 2015
Annual Survey of Industries
The Annual Survey of Industries (ASI) conducted by the Ministry of Statistics and Programme Implementa-tion, Government of India, provides statistical information on industries to assess and evaluate the changes in the growth, composition and structure of organized manufacturing sector, comprising activities related to manufacturing processes, repair services, gas and water supply and cold storage.
Highlights of ASI for Telangana State
The following are the notable points with reference to Telangana State in the results of ASI 2011-12 and 2012-13:
• The number of factories increased to 13,656 in 2012-13 from 9005 during 2011-12 (Provisional results of ASI 2012-13 & ASI 2011-12).
• These factories engaged a total of 7,01,110 persons during 2012-13 (Provisional results of ASI 2012-13).
• The Telangana State is one among the major industrial States in the country and ranked 8th place in terms of Gross Value Added (GVA), at Rs. 36,475.65crores (ASI 2011-12)
• The industrial growth from 2010-11 to 2011-12 in terms of Gross Value Added is 17.53% and Net Value Added is 16.76% (ASI 2011-12).
Key Industries in Telangana
Knowledge based industries such as Information Technology enabled services (ITES), pharma and engi-neering components have a strong presence in Telangana. They are largely located in Hyderabad and Ranga Reddy districts which have strong infrastructure and support systems such as Special Economic Zones (SEZ), availability of skilled manpower and research institutions. The districts of Nizamabad, Karimnagar and Warangal are largely dependent on agriculture and are in need of industrial development.
The fi gure below depicts the conceptual plan of the Government for development of districts based on their industrial strengths.

118Socio Economic Outlook 2015
District Industries Centres
District Industries Centres (DIC), the nodal agencies to provide all required approvals/ clearances for set-ting up industries under the Single Window System, implement the Mirco Small and Medium Enterprises (MSME) Development Act, 2006 and issue Entrepreneur Memorandum (EM) for MSME besides maintain-ing effective liaison with various fi nancial institutions in facilitating the required credit.
Micro, Small and Medium Enterprises
Investment limits were enhanced with the enactment of Micro, Small and Medium Enterprises Development (MSMED) Act, 2006. Government of India has unveiled a policy best suited for Micro and Small enterpris-es with the objectives of achieving 15% annual growth rate; increasing employment generation; creating congenial and hassle-free environment; helping the Small Scale Industries (SSI) sector to acquire new tech-nologies and skills; improving export performance; promoting linkage between large and small sectors; and promoting appropriate institutional mechanisms to revive sick industries.
During the period 2001 to 2015 (up to January, 2015), 40,894 MSMEs were established in Telangana with an investment of Rs.22520.63 crores, providing employment to 5,65,496 persons.
Table 42: MSME Trends in Number of units, employment and invenstment in Telangana
2001-05
2005-06
2006-07
2007-08
2008-09
2009-10
2010-11
2011-12
2012-13
2013-14
No. of MSMEs 3,807 731 1,319 2,645 2,828 2,759 5,374 5,561 5,125 6,844
Persons employed (‘00) 499 75 190 481 538 474 635 773 712 832
Investment (Rs. Lakhs) 311 84 553 1,358 1,559 4,576 3,301 3,033 2,674 3,111
The number of MSMEs and the number of persons employed in them in Telangana has witnessed an impressive growth between 2001-05 and 2013-14. Investment into the sector has also grown impressively. These details are depicted in the fi gure below:
Trends of MSME Sector in Telangana

119Socio Economic Outlook 2015
Large & Medium Industries
Up to January 2015, 2091 large industrial units were established with an investment of Rs.45393.33 Crores, providing employment to 6,67,499 persons.
Number of Units Approved In 2014-15
During 2014-15 nearly 1496 entreprenuers have applied for clearances under the Single Window System, of which 1173 clearances have been issued.
New Industrial Policy
Industrialization will be the key strategy followed for economic growth and development of Telangana. People of the new state have very high expectations from the State Government for creating jobs for the youth; promoting development of backward areas; maximizing growth opportunities by optimum utilization of the available resources; harnessing the talents and skills of the people and ushering in prosperity in every household. Industrialization holds the potential for fulfi lling these aspirations of the people of Telangana.
In this direction, the Government have unveiled the new ‘Industrial Policy Framework, 2014’.
The Government’s vision for industrialization of Telangana is “Research to Innovation; Innovation to In-dustry; Industry to Prosperity”. The industrial policy framework will be driven by the slogan of “In Telan-gana—Innovate, Incubate, Incorporate”. The policy framework intends to provide a business regulatory environment where doing business would be as easy as shaking hands. Innovation and technology will drive the industries of the Telangana State.
Core Values
The new policy will be rooted in certain core values, as follows:
• The Government regulatory framework shall facilitate industrial growth.
• Entrepreneurs will thrive in a peaceful, secure and progressive business regulatory environment.
• Industrial development will lead to massive creation of jobs benefi tting local youth.
• Industrialization shall be inclusive and facilitate social equality.
• Benefi ts of industrialization should reach marginal and socially disadvantaged sections of the State.
• Environment will be protected and any potential adverse impacts shall be mitigated.
Objectives
The objectives of the new policy are:
• Make existing industries more competitive.
• Attract new international and national investments in the industrial sector.
• Focus on the core manufacturing sectors, for creation of employment for urban and rural youth.
• Production of high quality goods at the most competitive prices.
• Establish “Made in Telangana- Made in India” as a brand with high global reorganization.

120Socio Economic Outlook 2015
• Zero graft and Zero tolerance to corruption.
• Adopt transparent decision-making.
• Minimize inspection and maximize facilitation.
Incentives
The Government of Telangana announced the new industrial incentive scheme T-IDEA of 2014 (Telangana State Industrial Development and Entrepreneur Advancement for the General category entrepreneurs and T-PRIDE (Telangana State Program for Rapid Incubation of Dalit Entrepreneurs) of 2014 for Scheduled Caste / Scheduled Tribe entrepreneurs, extending various incentives for MSME and Large Industries Sectors.
Incentives for Micro and Small Enterprises (MSEs)
The incentives for micro and small enterprises are listed below:
• 100% reimbursement of Stamp duty and transfer duty paid by the industry on purchase of land meant for industrial use
• 100% reimbursement of Stamp duty for lease of land/shed/ buildings and also mortgages and hy-pothecations.
• 25% rebate in land cost limited to Rs.10.00 Lakhs in industrial estates/ industrial parks.
• 25% land conversion charges for industrial use.
• Fixed power cost reimbursement @ Re.1.00 per unit for 5 years from the date of commencement of commercial production.
• 15% investment subsidy on fi xed capital investment subject to a maximum of Rs.20.00 lakhs.
• Reimbursement of 100% net VAT/CST or State Goods and Services Tax (SGST) for a period of 5 years from the date of commencement of commercial production.
• Interest subsidy under Pavala Vaddi Scheme on the term loan taken on the fi xed capital investment by new Micro and Small Enterprises in excess of 3% per annum subject to a maximum reimbursement of 9% per annum for a period of 5 years from the date of commencement of commercial production.
• Seed capital assistance to fi rst generation entrepreneurs to set-up micro enterprises @10% of the ma-chinery cost, which will be deducted from the eligible investment subsidy.
• 50% reimbursement of cost involved in skill up gradation and training the local manpower limited to Rs.2,000/- per person.
• 50% subsidy on the expenses incurred for quality certifi cation / patent registration limited to Rs. 2.00 Lakhs.
• 25% subsidy on specifi c cleaner production measures limited to Rs.5.00 Lakhs.
• Extension of investment subsidy to the identifi ed service activities related to industries set up in all municipal corporation limits in the state as per prescribed procedure in vogue.

121Socio Economic Outlook 2015
Incentives for Medium Enterprises & Large Industries
Following are the incentives for medium and large enterprises:
• 100% reimbursement of stamp duty and transfer duty paid by the industry on purchase of land meant for industrial use.
• 100% reimbursement of stamp duty for lease of land/shed/buildings, including mortgages and hy-pothecations.
• 25% rebate in land cost limited to Rs.10.00 Lakhs in industrial estates/ industrial parks.
• 25% land conversion charges for industrial use limited to Rs.10.0 lakhs for Medium Enterprises.
• Fixed power cost reimbursement @ Re.1.00/- per unit for 5 years from the date of commencement of commercial production.
• Reimbursement of 75% net VAT/CST or State Goods and Services Tax (SGST) for Medium Scale Enterprises for a period of 7 years from the date of commencement of commercial production or up to realization of 100% fi xed capital investment, whichever is earlier.
• Reimbursement of 50% net VAT/CST or State Goods and Services Tax (SGST) for Large Scale In-dustries for a period of 7 years from the date of commencement of commercial production or up to realization of 100% fi xed capital investment, whichever is earlier.
• 50% Reimbursement of cost involved in skill up gradation and training the local manpower limited to Rs.2,000 per person. 50% subsidy on the expenses incurred for quality certifi cation/ patent registra-tion limited to Rs. 2.00 Lakhs only for Medium Enterprises.
• 25% subsidy on specifi c cleaner production measures limited to Rs.5.00 Lakhs.
• Infrastructure like roads, power and water will be provided at door step of the industry for standalone units by contributing 50% of the cost of infrastructure from Industrial Infrastructure Development Fund (IIDF) with a ceiling of Rs.1.00 Crore, subject to: (a) the location being beyond 10 kilometres from the existing industrial estates/IDA’s having vacant land/shed for allotment and (b) cost of the infrastructure being limited to 15% of the eligible fi xed capital investment made in the industry.
Incentives for Women owned Enterprises
For units established by women entreprenuers the following are the incentives:
• Additional 10% investment subsidy on fi xed capital investment, subject to a maximum of Rs. 10.00 lakhs to MSE’s.
• All other benefi ts as applicable for Micro & Small Enterprises.
Incentives for Mega Projects
Following incentives are for mega projects (Mega Project means an industrial unit which is set up with a capital investment of Rs.200 Crores and above or a project that creates employment to more than 1000 persons)
• The Government will also extend tailor-made benefi ts to mega projects to suit the particular invest-ment requirements on a case-to-case basis.

122Socio Economic Outlook 2015
Infrastructure Support
The following are envisaged in the policy with reference to infrastructure support:
• Provision of Rs.100.00 Crore budget every year for promotion of quality infrastructure like roads, power, water, waste management etc. under Industrial Infrastructure Development Fund (IIDF) Scheme.
• Promotion of National Manufacturing Investment Zone (NMIZ) along National Highways to capital-ize on the strengths in line with Government of India initiatives for value addition within the State.
• Promotion of Industrial Corridors to leverage the existing strengths for optimum utilization of re-sources
• Reservation of 30-40% of the land for MSMEs in the upcoming industrial estates developed by Tel-angana Industrial Infrastructure Corporation (TSIIC).
• Allocation of 15.44% of plots to Scheduled Caste Entrepreneurs and 9.34% of plots to Scheduled Tribe Entrepreneurs in new Industrial Estate and preferential allotment to SC/ST entrepreneurs in existing Industrial Estates.
• Allocation of 10% of plots to women entrepreneurs in the new Industrial Estates.
Facilitation of Industries
Strengthening of existing Single Window Clearance System by the Telangana State Industrial Project Ap-proval and Self Certifi cation System (TS-iPASS) has been envisaged.
Effective Single Window Mechanism
The Government of Telangana State is determined to create an ecosystem in which the ease of doing busi-ness in the state matches and even exceeds the best global standards.
The Government has enacted the “Telangana State Industrial Project Approval and Self Certifi cation System (TS-iPASS) Act, 2014” (Act No.3 of 2014) repealing the AP Industrial Single Window Clearance Act 2002 for speedy processing of applications& for issue of various licenses, clearances and certifi cates required for setting up of industrial undertakings and also to provide for an investor friendly environment in the State of Telangana, based on the self-certifi cation by the entrepreneur.
Thrust Areas
The Government recognizes the following 14 sectors as thrust areas, investments in which will be accorded a higher priority over others.
Table 43 : Thrust areas for investments
S. No Thrust Area Remarks
1.Life Sciences—including, bulk drugs, formulations, vaccines, pharmaceuticals, biologicals, incubation cen-tres, R&D facilities and medical equipment
Hyderabad is the bulk drug and vaccine capital of the coun-try. New opportunities like life-saving drugs, new vaccines and biologicals have emerged. Need exists to encourage this sector.
2. IT Hardware including bio-medical devices, electronics, cellular communications, FAB
The GOI has approved an IT Investment Region for Hy-derabad as well as two Electronic Manufacturing Clusters. The Health industry will support bio-medical devices and medical electronics.
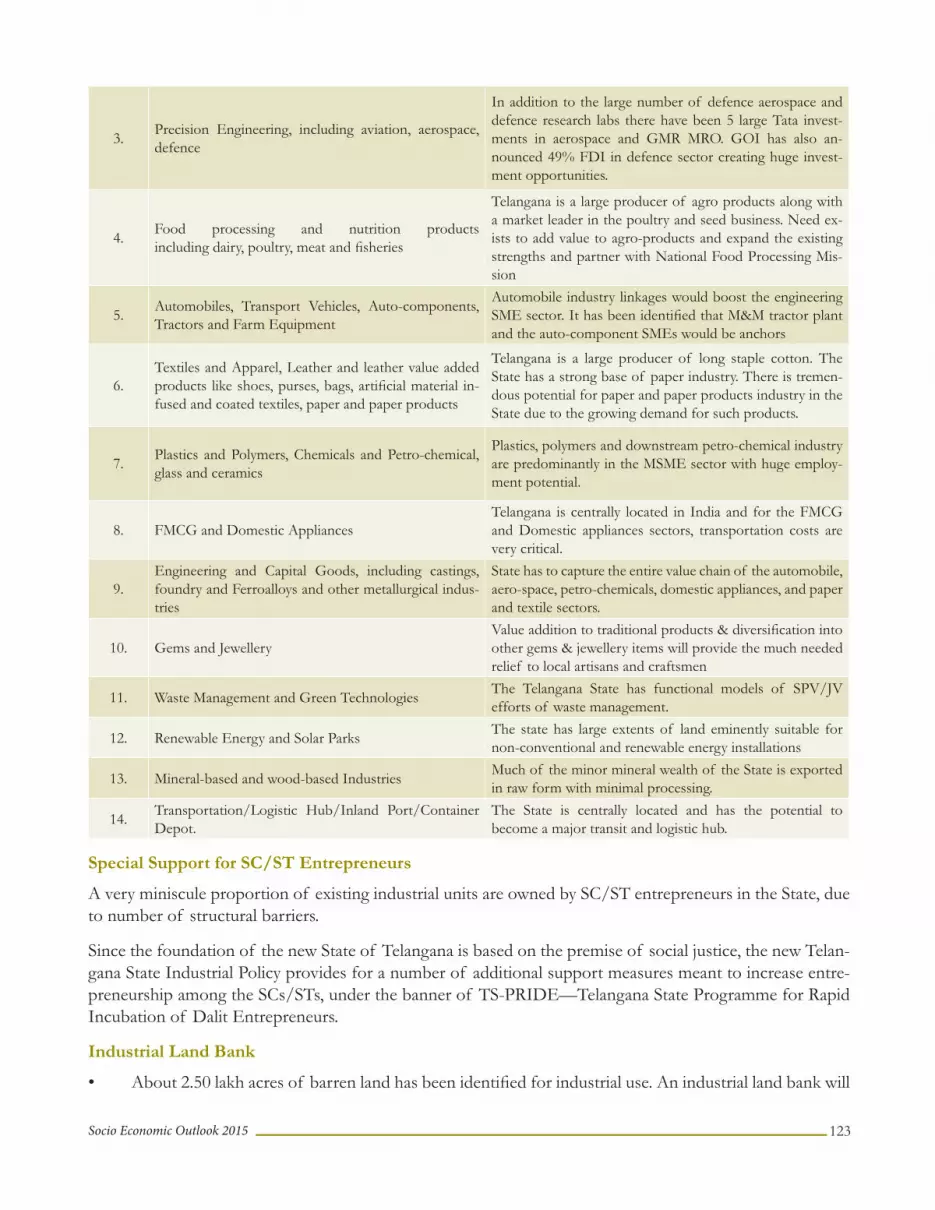
123Socio Economic Outlook 2015
3. Precision Engineering, including aviation, aerospace, defence
In addition to the large number of defence aerospace and defence research labs there have been 5 large Tata invest-ments in aerospace and GMR MRO. GOI has also an-nounced 49% FDI in defence sector creating huge invest-ment opportunities.
4. Food processing and nutrition products including dairy, poultry, meat and fi sheries
Telangana is a large producer of agro products along with a market leader in the poultry and seed business. Need ex-ists to add value to agro-products and expand the existing strengths and partner with National Food Processing Mis-sion
5. Automobiles, Transport Vehicles, Auto-components, Tractors and Farm Equipment
Automobile industry linkages would boost the engineering SME sector. It has been identifi ed that M&M tractor plant and the auto-component SMEs would be anchors
6. Textiles and Apparel, Leather and leather value added products like shoes, purses, bags, artifi cial material in-fused and coated textiles, paper and paper products
Telangana is a large producer of long staple cotton. The State has a strong base of paper industry. There is tremen-dous potential for paper and paper products industry in the State due to the growing demand for such products.
7. Plastics and Polymers, Chemicals and Petro-chemical, glass and ceramics
Plastics, polymers and downstream petro-chemical industry are predominantly in the MSME sector with huge employ-ment potential.
8. FMCG and Domestic AppliancesTelangana is centrally located in India and for the FMCG and Domestic appliances sectors, transportation costs are very critical.
9.Engineering and Capital Goods, including castings, foundry and Ferroalloys and other metallurgical indus-tries
State has to capture the entire value chain of the automobile, aero-space, petro-chemicals, domestic appliances, and paper and textile sectors.
10. Gems and JewelleryValue addition to traditional products & diversifi cation into other gems & jewellery items will provide the much needed relief to local artisans and craftsmen
11. Waste Management and Green Technologies The Telangana State has functional models of SPV/JV efforts of waste management.
12. Renewable Energy and Solar Parks The state has large extents of land eminently suitable for non-conventional and renewable energy installations
13. Mineral-based and wood-based Industries Much of the minor mineral wealth of the State is exported in raw form with minimal processing.
14. Transportation/Logistic Hub/Inland Port/Container Depot.
The State is centrally located and has the potential to become a major transit and logistic hub.
Special Support for SC/ST Entrepreneurs
A very miniscule proportion of existing industrial units are owned by SC/ST entrepreneurs in the State, due to number of structural barriers.
Since the foundation of the new State of Telangana is based on the premise of social justice, the new Telan-gana State Industrial Policy provides for a number of additional support measures meant to increase entre-preneurship among the SCs/STs, under the banner of TS-PRIDE—Telangana State Programme for Rapid Incubation of Dalit Entrepreneurs.
Industrial Land Bank
• About 2.50 lakh acres of barren land has been identifi ed for industrial use. An industrial land bank will

124Socio Economic Outlook 2015
be developed with the assistance of Telangana State Industrial Infrastructure Corporation (TSIIC).
• TSIIC shall set up core sector specifi c Industrial Parks.
• Exclusive industrial parks in safe zones shall be created for setting up of red category industries.
• Some of the industrial parks will also permit multi-sectoral activities and general manufacturing units.
Industrial Water
• 10% of water from all existing and new irrigation sources shall be reserved exclusively for industrial use, the water lines for which shall be provided through the proposed Water Grid project.
Industrial Power
• Quality power and uninterrupted power supply shall be arranged in each industrial park.
• “Open access” power restrictions will be removed to enable all types of industries, including MSMEs to access the power exchange.
• Use of non-conventional energy for industrial purposes shall be encouraged.
• The setting up of Private Merchant Power Plants in large industrial parks shall be facilitated
• 300-500 MW power plants will be from Chinese and Singapore based investors and the tariff could be negotiated between industry users and the producer. TSTRANSCO will facilitate wheeling and trans-mission.
Industrial Development on Private Lands
The Government shall
• Encourage industries in private lands designated for industrial use in spatial planning of HMDA and other urban development authorities in Telangana.
• Encourage private industrial park developers to pool their lands to develop good infrastructure as per the TSIIC standards.
• Allow the change in land use pattern
Skill Development
The skill development programmes targeted at generation of industrial sector jobs will be supported by the Government under the ambit of the Telangana State’s Skill Development Mission in general and the Telanga-na State Accelerated SSI Skills Training (T-ASSIST) program of the Industries and Commerce Department.
The State shall
• Train the youth in getting entry level jobs and make available, skilled manpower for the industry’s re-quirements.
• Develop the programmes for up gradation of Skills of the existing employees in consultation with the industry to suit their requirements.
• Encourage the Mega industries to start their own skill development centres within the same industrial park.

125Socio Economic Outlook 2015
• The Industrial Area Societies will also be encouraged to participate in design and implementation of skill development programs.
T-IDEA (Telangana State Industrial Development and Entrepreneur Advancement.The Telangana State Government will consider providing incentives to the entrepreneurs in the following areas under its T-IDEA (Telangana State Industrial Development and Entrepreneur Advancement) incentive scheme:
• Stamp duty reimbursement
• Land cost rebate
• Land conversion cost
• Power cost reimbursement
• Investment subsidy
• VAT reimbursement
• Interest subsidy
• Seed capital for fi rst generation entrepreneur
• Training and skill development cost reimbursement
• Quality/patent support
• Clean production measures
• Reimbursement of infrastructure development costs.
Industrial Corridors
• The Government shall develop the Industrial corridors along the roadways of important national and state highways linking Hyderabad to Warangal on a priority basis.
• The developed corridors will be modelled after Special Investment Zones like the DMIC or the PCPIR.
• Each district headquarters of the State will be connected by high speed rail and road network.
The Industrial Corridors that will be developed initially are :( a) Hyderabad-Warangal Industrial Corri-dor, (b) Hyderabad-Nagpur Industrial Corridor and (c) Hyderabad-Bengaluru Industrial Corridor. In the second phase, the corridors to be developed include: (a) Hyderabad-Mancherial Industrial Corri-dor, (b) Hyderabad-Nalgonda Industrial Corridor and (c) Hyderabad-Khammam Industrial Corridor
Research and Innovation Circle of Hyderabad (RICH)-
A ‘Research to Market’ fund shall be provided to build the essential link between industry, research/academic institutes and venture capitalists for fostering the spirit of innovation and entrepreneurship.
Specifi c Initiatives for 2014-15
In addition to the other mandates of the Policy Framework, the following specifi c initiatives are envisaged.
• New Pharma City and Chemical City with well developed infrastructure, including waste management.
• Development of the Hyderabad - Warangal Industrial Corridor.

126Socio Economic Outlook 2015
• Development of Warangal as the textile hub of Telangana.
• Food Processing and Seed Production Initiatives.
• Mini industrial townships along with industrial parks.
• Direct loan facilitation to Dalit entrepreneurs.
• Creation of a Venture Capital/Angel Fund.
• Inter state VAT rationalization on industrial inputs and outputs.
• Review and reform of all age old industry sector regulations, including labour laws.
Scheduled Castes / Scheduled Tribes owned Enterprises
SC/ST owned Enterprises are those units established by sole Proprietor or those in which they invariably have 100% share in Partnership/Private Limited Companies. Scheduled Castes and Scheduled Tribes entre-preneurs can set up enterprises with various lines of activities to avail themselves of the incentives in this policy.
• 100% reimbursement of Stamp duty and transfer duty paid by the industry on purchase of land meant for industrial use.
• 100% reimbursement of Stamp duty for Lease of Land/Shed/ Buildings and also mortgages and hy-pothecations
• 33.33% rebate in land cost limited to Rs.10.00 Lakhs in Industrial Estates / Industrial Parks,
• 25% Land conversion charges for the industrial use.
• Fixed power cost reimbursement @ Rs.1.50 per unit for a period of 5 years from the date of com-mencement of commercial production.
• Seed capital assistance to fi rst generation entrepreneurs to set up Micro Enterprises @ 20% of the machinery cost, which will be deducted from the eligible investment subsidy.
• 35% investment subsidy on fi xed capital investment for Micro and Small Enterprises set up by SC and ST Entrepreneurs, with a maximum limit per unit of Rs.75.00 Lakhs. Additional 5% investment subsi-dy for units set up in Scheduled Areas by ST entrepreneurs with a maximum limit per unit as Rs.75.00 Lakhs.
• Reimbursement of 100% net VAT/CST or State Goods and Services Tax (SGST) for a period of 5 years from the date of commencement of commercial production to Small and Micro Enterprises.
• Reimbursement of 75% net VAT/CST or State Goods and Services Tax (SGST) for a period of 7 years from the date of commencement of commercial production for Medium Scale Enterprises or up to realization of 100% fi xed capital investment, whichever is earlier.
• Reimbursement of 50% net VAT/CST or State Goods and Services Tax (SGST) for a period of 7 years from the date of commencement of commercial production for Large Scale Industries or up to realization of 100% fi xed capital investment, whichever is earlier.
• Interest subsidy under Pavala Vaddi Scheme on the term loan taken towards fi xed capital investment

127Socio Economic Outlook 2015
by new Micro and Small Enterprises in excess of 3% per annum subject to a maximum reimbursement of 9% per annum for a period of 5 years from the date of commencement of commercial production. This benefi t is also applicable to the Services Sector units set up under this Policy.
• 50% reimbursement of cost involved in skill upgradation and training the local manpower limited to Rs.2,000 per person.
• 50% subsidy on the expenses incurred for quality certifi cation / patent registration limited to Rs. 3.00 Lakhs for Micro and Small Enterprises.
• 25% subsidy on specifi c clean production measures limited to Rs.5.00 Lakhs.
• For Micro and Small Enterprises set up by Scheduled Castes and Scheduled Tribes entrepreneurs, Infrastructure like roads, power and water will be provided at doorstep of the industry for standalone units by contributing 50% of the cost of infrastructure from IIDF with a ceiling of Rs.1.00 Crore, subject to the location being beyond 10 kilometres from the existing Industrial Estates/IDAs having vacant land/shed for allotment and (b) cost of the infrastructure being limited to 15% of the eligible fi xed capital investment made in the industry. 50% of the cost of infrastructure is raised to 75% in respect of units set up by ST entrepreneurs in Scheduled areas.
• The line of activity of excavator is considered as eligible exclusively in case of Scheduled Caste and Scheduled Tribe entrepreneurs and incentive shall be extended under service activity.
National Investment and Manufacturing Zones (NIMZ)
Government of India has accorded approval for setting up of National Investment and Manufacturing Zone (NIMZ) at Medak District in an extent of 5,000 to 6,000 hectares. The concept of NIMZ is part of the Na-tional Manufacturing Policy which aims to increase the share of the manufacturing sector in the GDP from 16% to 25%. The NIMZ will be developed as integrated industrial townships with state of the art infrastruc-ture, with land use based on zoning, using clean and energy effi cient technology, having necessary social infrastructure and skill development facilities. The estimated investment fl ow to each NIMZ is expected to be around Rs.30,000 Crore and employment potential would be 3 lakh in each NIMZ. The land acquisition in Medak District is under process for setting up of National Investment and Manufacturing Zone.
Industrial Infrastructure
Special Economic Zones
Six SEZs in the fi elds of IT/ITES, Aerospace, Biotech, Formulations have been developed in the State of Telangana. As a part of Government initiative of developing IT Park in tier-2 cities, the State IIC has devel-oped SEZ at Madikonda (village) in Warangal District.
Land Identifi cation for Establishment of New Industrial Parks
The Telangana State Industrial Infrastructure Corporation (TSIIC) has identifi ed 150 industrial parks in 10 districts with an area of about 74133.18 acres of land. At present, 13165 units (enterprises) exist in these parks and out of 74133.18 acres of land, 917.30 acres of land is available for allotment to industries.
TSIIC had surveyed 2.50 lakh acres of waste/ barren land and has identifi ed an extent of 234064.35 acres, fi t for industrial use readily.
128Socio Economic Outlook 2015
Development of Women Industrial Park
The TSIIC has earmarked an extent of 50 acres in Green Industrial Park Jadcherla of Mahabubnagar Dis-trict and Sultanpur of Medak District for establishment of Women Industrial Parks. Further, the Corpora-tion has taken decision for development of Women Industrial Park for green line of activities in each district in Telangana.
Commerce and Export Promotion
As per the Trade Statistics maintained by the Director General, CIS, Telangana is among the top ten export-ing States in the Country. Also, according to the ITE&C Dept., and STPI export statistics, the State has ma-jor exports to its credit in the Software and enabled services sector etc. The State has exported the Software and enabled services worth of Rs.57,000 crores during the year 2013-14.
Mines and Geology
Minerals form a major contributor for economic growth of the State. The State focuses on planned exploita-tion of mineral resources, addressing key issues of legislation, devising objective & strategies in tune with the National Mineral Policy, 2008 in accelerating the growth under a liberal regime, thereby leading to overall development of the mining sector.
Mining
There are 3 Reconnaissance Permits for Gold, Diamonds, Base metals, 18 prospecting License and 521 Min-ing Lease for Major Minerals (Industrial Minerals), 1186 Quarry leases for cut and dressed blocks of Granites and 1429 Quarry leases for other Minor Minerals (Construction Minerals) have been issued with an extent of 535805 hectares, 5633 hectares, 79478 hectares, 2764 hectares and 3611 hectares respectively.
Mining for Coal, Limestone falls under large scale mechanized sector, while Granite, Dolomite, Quartz, Feldspar, Clays and Barytes etc., fall under semi mechanized medium sector and the other minerals fall under semi mechanized small sector. Nearly 90% of the mines fall under small sector and remaining under medi-um and large sectors.
Focus Minerals and Industries
Both Public & Private Sectors established large and medium scale mineral based industries for manufacture of Cement, Steel, Sponge Iron, Ferro-alloys, Glass, Ceramics, Refractory’s, Chemicals, Granite, Marble & Limestone cutting & polishing units, Slate cutting units, Gem Cutting & faceting units, Granite monuments manufacturing units, Pulverizing units, stone crushers, Mosaic & Ceramic tile units, Lime Kilns and Manu-factured sand units in Telangana State.
Mining Sector is identifi ed as one of the growth engines and certain minerals have been identifi ed as focus minerals viz., Limestone, Coal, Iron Ore, Diamond, Dolomite, Uranium, Garnet, Granite for establishment of Cement, Thermal Plants, Granite Cutting & Faceting, Steel & Sponge Iron as focus industry for over all growth and development of the mining Sector in the State.
Mineral Production and Value
The Mineral consumption has been increasing due to the promotion of various industries and manufacture of Mineral based products. The State produces about 33 million tonnes of industrial minerals and 50 to 55 million tonnes of coal and 54 million cubic meters of dimensional stones and building material.
Exclusive mining zones in Rangareddy, Mahabubnagar, Nalgonda, Medak districts have been identifi ed for declaration as mining zones for sustainable development. The detailed information regarding Mineral geographical distribution and utilization is given below.

129Socio Economic Outlook 2015
Table 44 : Geographical distribution and utilisation of Minerals
Major Minerals Geographical Distribution Mineral Based Industry
Amethyst Mahabubnagar, Rangareddy, Medak, Warangal Jewellery
Barytes Khammam Drilling, Paints, Filler in Tyres, Rubber Goods, Paper & Chemical
Fire Clay Adilabad Refractory, Ferro Alloys
Coal Khammam, Warangal, Adilabad, Karimnagar
Iron & Steel, Thermal Plants, Cement, Railways, Domestic Fuel
Corrundum Khammam Abrasives, Jewellery
Dolomite Khammam Iron & Steel, Ferro Alloys, Fertilizers, Glass, Foundry & Cosmetics
Feldspar Mahabubnagar, Rangareddy, Khammam Ceramics, Glass, Abrasive, Enamels, Electrical, Refractories
Fullers Earth Rangareddy Decolourizer of vegetable oils, Oil refi neriesIron OreHematiteMagnetite
Warangal, Khammam, Adilabad, Karimnagar Steel, Pelltization, Sponge Iron, Pig Iron
Kyanite Khammam Abrasive, Refractory
Laterite Mahabubnagar, Karimnagar,Medak, Nizamabad Cement
Limestone Rangareddy, Mahabubnagar, Nalgonda, Khammam, Adilabad, Karimnagar
Cement, Carbide, Iron & Steel, Soda Ash, Chemical, Sugar, Paper, Fertilizer, Glass
Manganese Adilabad Potassium Permanganate, Ferro Alloys, Iron & Steel, Batteries, Chemicals, Ceramic, Glass Industry
Quartz Rangareddy, Mahabubnagar, Khammam, Nizamabad
Glass, Foundry, Iron & Steel, Refractory, Ceramic, Electrical, Abrasive, Paints, Electronics
Steatite Khammam Paper, Textile, Rubber, Ceramics, Soaps, Detergents, Fertilizers
Stowing Sand Khammam Ceramics, Foundry, RefractoryMinor Minerals Geographical Distribution Mineral Based IndustryMarble Khammam Decorative, Flooring, PanelsLimestone slabs Rangareddy, Mahabubnagar, Nalgonda Floorings, Pavements
Granite Warangal, Khammam, Karimnagar, Rangareddy, Nalgonda, Medak, Nizamabad
Cutting & Polishing Industry, Decorative, Panels, Monuments, Flooring, Panels
Building Stones All districts in Telangana Building Material for construction purposes
Handlooms and Textiles
The State Government has been giving considerable importance to the Handloom and Textile Industry. The Government of India also sponsors a number of developmental and welfare schemes in the industry.
Primary Societies
There are about 200 primary handloom weavers’ cooperative societies in the State,with 41,491 weavers as members n the State. In 2012-13, the total sales of these societies was Rs. 5,923 lakhs
Programmatically, the schemes and programmes of the department are focused on: streamlining organization structure of cooperatives, marketing support, working capital facilitation, modernization of looms, trainings, weavers’ welfare, incentives like power subsidy etc.

130Socio Economic Outlook 2015
Apparel Export Parks and Textile Parks
The Government has set up the following Parks in Telangana State.• Apparel Export Park, Gundlapochampally, Rangareddy district• Textile Park, Siricilla, Karimnagar District• Textile Park, Pashamylaram, Medak District.• Textile Park, Malkapur, Nalgonda District A mega textile park is proposed in the outskirts of Warangal city on the lines of Surat and Coimbatore .
Industrial Relations
Industrial peace is a prerequisite for the growth and development of Industries. Work stoppages due to industrial disputes between employers and workmen and consequential loss of mandays in a given period would be an important indicator of Labour-Management relations in Industries. The Government through its conciliation machinery has been making efforts to settle disputes amicably and promote industrial peace and for ensuring congenial work environment. Efforts are being made by the department’s conciliation of-fi cers, to promote productivity-linked settlement in order to make Industries more competitive.
SERVICES SECTOR
As the State economy develops, it transforms from being an agrarian economy to industrial economy. At the take off stage of economic development, the contribution of services sector grows faster than even industri-al share. The services sector delivers “intangible” goods, in all social and economic sectors in the State econ-omy excluding broad agriculture and industry sector categories. Producing services tends to require relatively less natural capital and more human capital than producing agricultural or industrial goods.
The composition of the Service Sectors includes sub sectors namely trade, hotels and restaurants, transport, storage, communication, banking, insurance, real estate, ownership of dwellings& business services, railways, public administration and other services. The service led growth has been quite visible from the growth path and structural shift of economy. The structural shift is explained by the change in structure and composition of physical production of an economy. With an impressive anticipated share of 57.1 percent of GSDP in real terms in 2014-15, the Services Sector continues to be the leading broad sector in economy over the years. The sector recorded strong annual average growth rate of more than 9 percent in last decade.
Contribution of Services Sector
The composition of the Services Sector at current prices for the year 2014-15 under various segments of services sector, Real Estate, Ownership of dwellings & Business services is the leading subsector with share of 15.6 percent, followed by the ‘Trade, Hotels and Restaurants’ with 13.1 percent, other services at 9 per-cent, banking, insurance & communications at 6.6 percent, transport by other means and storage 6.3 percent, public administration with 4.6 percent, communications 1.5 percent and railways 0.5 percent as per advance estimates.
Though the share of each sub-sector refl ects their direct contributions to GSDP, some of them have huge indirect contributions and multiplier effects. For instance, “transport and communications” add to infra-structure, which is crucially important for any economy. By providing liquidity, “banking, insurance and fi nancial services” support the businesses and act like the ‘engine’ of economic activity. In a broader sense, it can also be viewed as infrastructure. Construction adds to real capital stock, which is a major input to output growth in various sectors.

131Socio Economic Outlook 2015
Table 45: Sub Sectoral Contribution of Services Sector in GSDP at Current Prices
Sub-Sectors 2004-05 2014-15 (AE)
Trade, Hotels & Restaurants 13.0 13.1
Railways 1.9 0.5
Transport by other means and storage 4.1 6.3
Communications 2.0 1.5
Banking and Insurance 4.5 6.6
Real Estate, Ownership of Dwellings and Business Services 13.9 15.6
Public Administration 4.7 4.6
Other Services 9.7 9.0
Service Sector Contribution in GSDP 53.8 57.1
District-Wise Comparison of Services Sector
The district wise contribution to total services sector Gross State Domestic Product is given in chart. It shows that the districts such as Hyderabad and Ranga Reddy contribute around 26.2 percent and 17.5 per-cent to total services GSDP respectively during 2013-14 (FRE).
District-Wise Contribution of Services Sector to GSDP (%) 2013-14 at Current Prices
Source: Directorate of Economics and Statistics, Hyderabad.
Similarly, district wise comparison of sectoral share to the Gross District Domestic Product (GDDP) is shown in Chart given below. It is interesting to see that the services sector contributes a major share to GDDP in most of the districts of Telangana. For instance, in Hyderabad, services sector contribute 81.6 percent to the Hyderabad GDDP in 2013-14. Similarly, in the case of Ranga Reddy and Nizamabad, the services sector contributes 56.3 per cent and 52.5 percent respectively.

132Socio Economic Outlook 2015
District-Wise Sectoral Share (%) to GDDP (2013-14) at Current Prices
Source: Directorate of Economics and Statistics, Hyderabad.
Information Technology, Electronics and Communications (ITE & C)
To achieve the objective of making Telangana the most preferred IT destination and for enhancing the ca-pacity for growth of IT sector in the State, ICT policy 2010-2015, has been put in place.
The objectives of the policy include
• Provision of congenial industrial friendly and proactive climate for IT Companies to locate, grow, and sustain their operations most competitively in hassle-free environment in the State.
• Creation of employment opportunities to the educated youth of all sections of the society across all regions.
• Achieving higher level of export turnover resulting in enhanced productivity, and augmentation of Gross State Domestic Product (GSDP).
• To spread IT to nook & corner of the State and
• Leverage Information Technology as a tool for the socio-economic development of the State.
ICT Policy 2010-2015 offers best incentives, facilitation and thrust for the growth of start ups, small and medium Enterprises and sun-rise areas like Engineering services, Product/R&D Companies, Animation and Gaming.

133Socio Economic Outlook 2015
Nation Wide IT Growth and the Perspective
• First state to pioneer e-Governance projects across the country• The share of IT exports of Telangana State is 10.5% of National IT exports.• Total IT exports from Telangana State for the year 2013-14 is Rs.57,257.97 crores • The IT direct employment created is 3,27,444
• New units registered /approved are 36
• Home for major MNC IT giants and Fortune 500 companies like Microsoft, Google, IBM, Ora-cle, DELL, Motorola, Deloitte, Converges, UBS, Computer Associates, Amazon, AMD, NVidia, Cap Gemini, Computer Science Corporation, Bank of America, HSBC, Honeywell, Siemens, JP Morgan, United Health Group, Facebook etc., besides IT majors like Infosys, Wipro, TCS, Polaris, Tech Mahin-dra, Sierra Atlantic, InfoTech Enterprises, HCL, Cognizant etc.
Information Technology Investment Region (ITIR)
Government of India has declared establishment of Information Technology Investment Region (ITIR) in Hyderabad. As per the DPR, the benefi ts of ITIR are as follows:
• Direct Revenues to the tune of Rs.310,849 crores
• IT Investment potential to the extent of Rs.219,440 crores
• IT Exports to the tune of Rs.235,000 crores
• Direct employment is estimated to be nearly 15 lakhs
• Indirect employment is estimated to be nearly 53 lakhs
• Increase in tax revenue to State to the tune of Rs.30,170 crores
Electronic Manufacturing Clusters (EMC)
As per the GoI Policy resolution to augment the growth of electronics manufacturing industry, two Elec-tronic Manufacturing Clusters (EMCs) i.e. E-city (in 602 acres) and also in Maheshwaram (in 310 acres) in

134Socio Economic Outlook 2015
Hyderabad (Telangana) have been approved by the GoI. The EMCs are expected to generate employment opportunities to the tune of 2.50 lakhs (direct – 0.40 lakhs; indirect - 2.10 lakhs) people.
Gaming and Animation
The gaming and Animation industry has a potential of US $42 billion worldwide / US $900 million in India. Recognizing Animation & Gaming, Visual/Special Effects and Digital Entertainment as sunrise industry, Telangana Government contemplated the following initiatives for the growth of Animation and Gaming Sector in the State, for which GAME Policy has been formulated.
• An extent of 30 acres of Telangana State Industrial Infrastructure Corporation (TSIIC) land at Rai-durg, Hyderabad, was already allocated for Gaming and Animation Park.
• Gaming and Animation Park shall comprise of built-up Incubation space, Shared Studios, Processing Labs, Media Centre, Conference facilities, Transit Offi ce / Business Centre., etc.
• Animation & Gaming Academy in collaboration with reputed Gaming & Animation organizations will be started to prepare the qualifi ed students for employment in Gaming & Animation sector.
T-HUB
The Government of Telangana decided to set up an Institute of Innovation i.e. ‘T-Hub’ at IIIT Campus, Gachibowli, Hyderabad. T-hub would serve as an “Incubator of Incubators” by providing the technology start-ups and the incubators a vibrant ecosystem of quality infrastructure, mentors, funders and network. This will enable the start-ups to sail through the entire cycle of growth from the seed stage to maturity. T-hub will help connect different incubators in the region and ensure that the requisite support to them is provided through the T-hub. T-hub’s founding partners are ISB, IIIT-H & NALSAR. They will bring along business, technical and legal expertise in the ecosystem. The key thrust areas for T-hub start-ups would be Education Technologies, Healthcare Technologies, Retail Technologies, Cloud Computing, IT, ITES, Mobile Applica-tions with an estimated cost of Rs.35 crores.
Warangal town has been identifi ed as Tier-II T-Hub, in which an area of 15,000 sft through TSIIC has been provided to build suitable infrastructure for IT companies to start their operations in plug & play mode.
Wi-Fi Facility
The Government of Telangana proposes to set up a Wi-Fi facility in Hyderabad to improve Governance and operational effi ciency and also to easily interact with citizens. Wi-Fi facility is an effort to promote greater digital inclusion for the citizens and intends to introduce Mobile Governance, Provide Customized alerts and to Disseminate Information such as Weather Warnings, traffi c alerts etc., all in real time.
Telangana State Data Centre
Government built a State Data Centre in Manikonda village to cater to the needs of all the Departments of the State Government, by providing rack space and the latest servers on dedicated basis. This Data Centre is expected to culminate in managed Data Center Services including Application Management. Some of the salient features of this State Data Centre are given below:
The total Building Infrastructure space is 9000 Sft. with Phase-I server form area (funded by Department of Electronics and Information Technology) consisting of 1585 Sft. with 35-rack capacity and Phase-II server form area (funded by State) consisting of 962 Sft. with 24-rack capacity.

135Socio Economic Outlook 2015
TSDC architecture design conforms to Tier-II + standards
(TIA-942 standards) with minimum uptime 99.749%
TSDC is connected to TSWAN and TSCAN with STM1 link (155 Mbps) in redundant mode.
Internet bandwidth of 1 GBPS from NKN and 84 Mbps from two other ISPs are provisioned.
Provision of Support Infrastructure such as power, AC, UPS, Generators, Network Infrastructure, Security Infrastructure, Management Infrastructure, Disaster Recovery Set-up, Compute Infrastructure, Storage In-frastructure etc.
Consolidation of major services and e-Governance applications of various departments of Telangana Gov-ernment with two types of hosting models i.e. ‘Hosted Model’ and ‘Co-located Model’
T-Scan (Telangana Secretariat Campus Area Network)
Telangana Secretariat Campus Area Network was established in Secretariat to connect 5000 nodes on the network for data. Every workplace is connected to each other through a data port. The backbone is connect-ed on 10 GB Ethernet on optical fi ber cable (OFC) network and within a block, inter-fl oor connectivity with Giga bit Ethernet on OFC/UTP.
At present in Secretariat, about 3000 computers connected on the network. There is a Secretariat Network Unit (SNU) located in 1st Floor, D-block where from the network management and monitoring is being done. The servers are confi gured on Windows and Linux to provide the network services like Internet, In-tranet, E-mail, Web services etc. It is also a DR site for Commercial Taxes and HMWS&SB.
SWAN (State Wide Area Network)
G2G SWAN connecting State Headquarters(SHQ) with District Headquarters (DHQ) and Mandal Head-quarters (MHQ) is implemented in place of Broadband Network with DIT, Government of India funding. DIT has approved the project at an estimated cost of Rs.249.76 Crores. M/s. Tata Consultancy Services was selected through a tender process as service provider. The project implementation with 10 DHQs connected with SHQ and 464 MHQs are connected to respective DHQs and Partial Acceptance Testing (PAT) is com-pleted. PAT clearance was issued from 26.11.2010. TPA (Third Party Audit) is completed and cleared for 464 Pops and 463 MHQs are operational.
Migration to new SWAN for existing Government offi ces connected to Old SWAN has been completed. For Horizontal Connectivity to SWAN, Service Providers were selected through tender process. Agreements were signed and orders were issued for e-Seva, IGRS, RTA, Revenue department connections to SWAN as per requirement projected by the departments concerned. Horizontal connectivity is under progress. A total of 1535 horizontal links were completed. Between SHQ – DHQ, the Bandwidth is upgraded from 8 Mbps to 12 Mbps and 1527 DHQ – MHQ bandwidth is upgraded from 2 to 4 Mbps.
SAPNET
An earth station has been functioning since 2002, utilizing the INSAT-III B Satellite using Ku Band. SAP-NET, an autonomous society is running the operations. The Earth Station has a capability of 5 Video Channels and one data channel. A State of the art digital studio is functional and utilization of live interactive channel has also increased.
136Socio Economic Outlook 2015
Presently 4 Channels are functioning. School, Collegiate, Technical and Medical Education departments use Channel 1 for live Interactive teaching and transmission of educational programmes. In addition, the channel is also used by the Agriculture Department, Indira Kranthi Patham, Police etc., for their interactive Video Conferences. Channel 2 and Channel 3 are dedicated to HRD and Social Sector Programs and Channel 4 is for Schools and TASK.
E-Governance Projects
The National e-Governance Plan (NeGP) of Indian Government seeks to lay the foundation and provides the impetus for long-term growth of e-Governance within the county. This provides information on creation of the right Governance and Institutional Mechanisms, setting up the core infrastructure and polices and implementation of a number of Mission Mode Projects at the Centre, State and Integrated Service levels.
Suitable arrangements for monitoring and coordinating the implementation of NeGP under the direction of the competent authorities have also been substantially put in place. The programme also involves evolving / laying down standards and policy guidelines, providing technical support, undertaking capacity building, R&D.
An amount of Rs.300.00 Lakhs was proposed to be allocated in the forthcoming budget of 2015-16 for tak-ing up new projects in different departments, Pilot Project, IT Audits, Road Map Reports, DPR Presentation, Mobile Service Delivery Gateway (MSDG), Procurement of interface equipment for e-Governance applica-tions and G2C applications and conducting exhibitions, summits etc. under the e-Governance.
Mee-Seva
“Mee-Seva” in Telugu means, ‘At your service’, i.e., service to citizens. It is a good governance initiative that incorporates the vision of National e-Governance Plan “Public Services Closer to Home” and facilitates sin-gle entry portal for entire range of G2C & G2B services. Mee-Seva is a service portal to deliver Government services to citizens using digital signatures on secured stationery. It has been the endeavour of Mee-Seva in bringing the dividend to the citizens across the State and to bring all the citizen-centric services under the ambit of Mee-Seva.
Mee-Seva is currently offering 311 Citizen Centric Services pertaining to 34 departments through more than 3715 Common Service Centers (CSCs) spread across the State. Mee-Seva has completed a total of 3,54,10,913 transactions out of which 1,70,15,488 transactions under Category A and 1,83,95,350 trans-actions under Category B. Mee-Seva also caters to 50 services pertaining to various departments through online mode. A citizen need not go to a KIOSK centre any where and any time he can avail the Government Department’s services through online mode.
Telangana Academy for Skill and Knowledge (TASK)
The Academy has been initiated to address the impending problems of unemployment in Telangana. TASK’s framework is designed to provide/ produce enough number of readily employable graduates by improving their skills. TASK will train the Engineering and degree students in communication skills, employable skills and technical skills through deployment of trained mentors in the various partnering colleges.
The TASK has agreements with various multinational companies in this regard and is working closely with corporations such as IBM, Oracle, Infosys, TCS, Autodesk, Google, Cognizant, HCL etc., and registered for conducting Skill Development Training to get employment in various MNC giants like Infosys, CTS, TCS, IBM, Tech Mahindra etc.

137Socio Economic Outlook 2015
TASK would focus on developing the soft skills as a part of their respective CSR initiatives. Telangana Government also signed a MoU with NASSCOM to support TASK in training the graduates. TASK also launched the program to promote entrepreneurship and R&D among the college students.
The new Government is ambitiously planning to take ‘TASK’ up to the next levels i.e., District and Mandal level of Telangana State.
TOURISM
Tourism is an industry with lot of opportunities and contributes signifi cantly to the socio-economic growth of the State. The state offers a number of opportunities for the tourism industry. With the formation of Telangana State Tourism Development Corporation,steps have been taken to initiate innovative methods of implementing different types of tourism packages / services and experiences to attract both domestic and foreign toursits.
Hyderabad was ranked second among the “Best of the World - 20 Places You Should see in 2015” list, published in the annual guide of National Geographic Traveller magazine. The Heritage sites of Hyderabad offer rich cultural diversity to the tourists and efforts are being made to prepare tailor- made packages which suits the requirements of different types of tourists visiting Hyderabad. TSTDC has launched a Nizam Pal-aces tour package covering Falaknuma and Chowmahalla palaces a Hyderabad by Night daily tour covering Sound & Light show at Golconda Fort and Taramati Baradari. Steps have also been taken to conserve and beautify Qutub Shahi Tombs with the assistance from Government of India, as announced during the Union budget. Already Aga Khan Trust is collaborating with the State Government in the conservation project of the famous tombs.
Falaknuma Palace
There is also a potential to promote Golf Tourism in the nearby International standard Golf Course devel-oped by Hyderabad Golf Association which recently hosted Golconda Masters PGTI tournament, the fi rst of its kind in Hyderabad. Hyderabad has also emerged as the hub for MICE (Meetings, Incentives, Con-ferences and Exhibitions) Tourism and boasts of the best infrastructure in india, in this regard. Hyderabad Conventions & Visitors Bureau (HCVB), the fi rst such organization to be set up in India, is coordinating the marketing efforts for this purpose.

138Socio Economic Outlook 2015
Concerted efforts have also been initiated to attract tourists to hitherto lesser known destinations in the districts of Telangana by developing required amenities and by launching suitable packages. Recently, NITI Aayog of Government of India sanctioned a grant of Rs.33.00 Crores to develop tourism infrastructure at Nagarjuna Sagar, Karimnagar, Ramappa, Kinnerasani, Kothagudem and Gajwel. Comprehensive district plans for development of Tourism spots in all the districts of Telangana are under preparation.
Telangana has many beautiful temples and historic places of worship located across the State, which are now popular pilgrim centers. One such circuit started by TSTDC covers Chilkur Balaji Temple on the banks of Osman Sagar Lake near Hyderabad. Similar package tours are offered for visit to Sitaramachandra Swamy Temple at Bhadrachalam of Khammam district, Saraswati Temple at Basara, Adilabad district and Laxmi Narasimha Swamy Temple at Yadagirigutta, Nalgonda district. Amenities for tourists have also been developed at Vemulawada Sri Raja Rajeshwara Swamy Temple , Hanuman Temple at Kondagattu and Narasimha Swamy temple at Dharmapuri in Karimnagar district, Ramappa Temple at Palampet in Warangal district and Jogulamba temple at Alampur in Mahabubnagar district.
Rural Tourism
Telangana has a tremendous potential for Rural Tourism and is a fascinating canvas of myriad colors, cultures and customs. Handicrafts represent, perhaps, the oldest traditions of living culture and Telangana has some of the richest sources of handicrafts. Rural Tourism projects identifi ed in Telangana, by the Ministry of
Vemulawada Temple, Karimnagar 1000 Pillars Temple, Warangal
Kolanupaka Jain Temple, Nalgonda Jogulamba Temple, Alampur, Mahabubnagar

139Socio Economic Outlook 2015
Tourism, Government of India are Pochampally Rural Tourism Project, Nalgonda, Nirmal Rural Tourism project, Adilabad, Cheriyal Rural Tourism Project and Pembarthi Rural Tourism Project Warangal.
Pochampally Handlooms Cheriyal Paintings
Wildlife And Eco Tourism
Telangana has rich forests and wild life sanctuaries, which provide scope for eco-tourism and wildlife tourism that cover Alisagar Deer park in Nizamabad, the Eturunagaram Sanctuary and Pakhal Wildlife Sanctuary in Warangal, Kawal Wildlife Sanctuary, Jannaram, Pranahitha Wildlife Sanctuary and Sivaram Wildlife Sanctuary in Adilabad, Mahavir Harina Vanasthali National Park, Vansthalipuram and Nehru Zoological park in Hyderabad, Manjira Bird Sanctuary in Sangareddy, and Pocharam Sanctuary in Medak, Shamirpet Deer Park in Rangareddy.
Heritage Tourism
Telangana is a historic land dotted with a number of forts, which have a potential to be developed into classic heritage tourism sites. Some famous forts, where Tourism Department is taking up projects to develop amenities for tourists are Golconda Fort, Medak Fort, Khammam Fort, Nizamabad Fort, Elagandula Fort, Karimnagar and Bhongir Fort, Nalgonda. Warangal Fort and Golconda Fort also host Sound and Light shows which take us back to a magnificient past. More shows of this kind will highlight the rich heritage of Telangana. Telangana State Tourism Development Corporation (TSTDC) organizes all the above tourist packages and also connects the neighbouring States. TSTDC also maintains Haritha Hotel chains, wayside amenities, river cruises and water fleet in different locations. Any trip to Telangana State is incomplete without a taste of its cuisine, including the famous Hyderabadi Biryani, Qubani-ka-Meetha, Haleem, and Irani Chai.
Bhongiri Fort, Nalgonda Kuntala Water Falls, Adilabad

140Socio Economic Outlook 2015
Medical Tourism
Hyderabad has the potential to ermerge as a global medical tourism hub, in view of the world class treatment at affordable prices offered in the leading hospitals located in the city. Steps are being taken to prepare a comprehensive plan for this purpose and to conduct road shows abroad.
Bathukamma
Bathukamma is the icon of cultural identity of Telangana and this festival has been declared as a State festival. This unique floral festival of Telangana has the potential to attract tourists from all over the country and has become an annual feature. Telangana State Government released an amount of Rs.10 crores for conduct of this festival in 2014 and plans to conduct this festival on a grand scale every year. Tour packages on the eve of Bathukamma were launched by TSTDC and steps are being taken to attract tourists from all over the country for this unique fl oral festival.
Bathukamma Celebrations At Tankbund, 2014BonaluBonalu was also declared as a State festival by the Government and the State Tourism Development Corporation has launched Hyderabad Bonalu weekend package tours to Secunderabad Ujjaini Mahankali Temple and Maisamma Temple at Lal Darwaza. These tours are being planned to be organized every year. The tableau of Telangana State which was displayed for the fi rst time at Rajpath in New Delhi during the Republic Day celebrations depicted Bonalu festival in a colorful manner.
Bonalu Festival Celebrations, 2014

141Socio Economic Outlook 2015
Sammakka Saralamma Jatara
This festival, also known as Medaram Jatara is celebrated in a remote tribal area of Warangal district. It is believed that after Kumbha Mela, the Medaram Jatara attracts the largest number of devotees in the country. More than one crore devotees had visited Medaram during the Jatara in 2014. This festival is celebrated once in every two years and the next festival would be in 2016.
Crafts Village – Shilparamam
Shilparamam Arts and Crafts village is a tribute to the cultural legacy of India. The primary aim of this establishment is to foster, restore and help fl ourish the culture of India’s glorious past. It provides a common platform for artisans and performing artists to showcase their talents.
Shilparamam
Shilparamam is also in the process of expansion to other places in Telangana like Sangareddy in Medak Dis-trict and Warangal.
New initiatives
Government has issued orders, creating a separate State Level Body called “Telangana Samskruthika Sarathi” to disseminate information on different Government policies and schemes and also to create awareness and a sense of pride among the people about the unique cultural identity of Telangana.
The State Government has proposed to develop a mega Cinema City spread over nearly 2000 acres in Rachakonda in Nalgonda-Ranga Reddy border. This initiative will defi nitely boost the tourism fi lm industry in the State.

142Socio Economic Outlook 2015
To promote culture and to provide world class facilities, “Telangana Kala Bharati” at Hyderabad and “Kaloji Kala Kendram” at Warangal have been proposed for construction by the Government.
The State Government has announced Rs.100 crores for development of Yadagirigutta devasthanam on the lines of TTD. This project also envisages development of Narasimha Abhyaranyam in 400 acres. besides construction of parks, marriage halls, meditation centers, Veda patashala and cottages in another 1600 acres.
Sri Laxmi Narasimha Swamy Temple at Yadagirigutta, Nalgonda District

143Socio Economic Outlook 2015
Section VHYDERABAD AS A GLOBAL CITY

144Socio Economic Outlook 2015

145Socio Economic Outlook 2015
5.1
“When I fi rst chose to use global city, I did so knowingly --it was attempt to name a difference: the specifi city of global as it gets structured in the contemporary period”
Prof. Saskia Sassen
The information technology revolution, economic globalization and the political leadership have been catalysts in nurturing Hyderabad as one of the nerve centres of global economy. The past decades have rapidly transformed Hyderabad. The IT growth led to the formation of HITEC city with IT enterprise agglomerates providing large scale services, employment and investment opportunities. However, with the rapid pace of development and infl ux of migrant population from other regions of the country, an uneven geography of development has taken place. While Hyderabad has around 1 crore population , it lacks adequate infrastructure and amenities. It is imperative that focus needs to be on improving City’s infrastructure and urban amenities to meet city’s aspirations of becoming a global city.
Vision Document For Global City
The government of Telangana is in the process of preparing a “Vision Document to make Hyderabad a Global City”. The responsibility of the document has been given to Hyderabad Metropolitan Development Region (HMDA) and the work is in the tendering stage. Apart from the Global City Plan, the vision document will encompass various interventions, physical and social infrastructure developments.
Integration of Master Plans
The State Government has decided to integrate all the fi ve notifi ed master plans and zoning regulations of the Hyderabad Metropolitan Region (HMR) in its bid to transform the State capital into a global city. Using spatial technology, it is proposed to integrate current 5 zonal master plans into one master plan. The integrated master plan is envisaged to help in better planning for administrators while also being amenable to an easier understanding by the general public.
GLOBAL CITY - A VISION

146Socio Economic Outlook 2015
Hyderabad Focus In The New Industrial Policy 2014
The New Industrial Policy Framework acknowledges the need for revitalizing the industrial scenario of Hyderabad. In the New Industrial Policy Framework 14 thrust areas identifi ed to reshape the stagnant industrial growth in the state, the new policy recognizes and emphasizes on reinventing Hyderabad’s industrial eco-system. Particular emphasis has been laid on using Hyderabad as a growth engine to positively impact the entire state.
Happening Hyderabad
With an aim to promote Hyderabad as a truly international city, Telangana government launched ‘Happening Hyderabad’ - an annual campaign that focuses on year-round events in the city. The idea of the ‘Happening Hyderabad’ campaign is to support and encourage events related to Arts, Culture, Sports and Entrepreneurship to enhance community engagement and interaction.
Safe Global City
It is the foremost duty of the State to provide safety and security to its citizens by preventing crimes. This will have the multiplier effect of not only attracting domestic investments into the State but also foreign investments. Mobility of police force and surveillance are crucial in this endeavour. During the current year, the Government sanctioned an amount of Rs.271 crore for the purchase of 4,433 vehicles for Hyderabad and Cyberabad Police. Out of these 3,883 vehicles equipped with modern technology have already been purchased. The number of new vehicles provided to the remaining nine districts in the state is 550. 1500 motor cycles have been provided to Cyberabad Police to respond within 10 minutes of receiving a complaint or call. This is unprecedented. Most of the police stations were lacking in minimum facilities. State Government has allocated a monthly amount of Rs.75,000, Rs.50,000 and Rs.25,000 to each police station in the city, district headquarters and villages, respectively.
The Government has taken up CCTV project under which a lakh CCTV cameras are planned to be installed in 2015-16 in Hyderabad city. All these cameras will be connected to the proposed Command and Control Centre. The Hyderabad Police has already introduced a system e-channels for the payment of fi nes for traffi c violations. This has received overwhelming support from the vehicle owners. Reception centres cum help desks supported by online monitoring system have been set up in all the police stations in Hyderabad / Cyberabad. These measures have already resulted in improving the operational effi ciency of Police Department at the cutting edge level while transforming it into citizen friendly organization through mobility and technology.
Information Technology Investment Region
• Paving the way for the development and consolidation of the information technology sector in the city, the Centre approved the setting up of a 202-square kilometre of Information Technology Investment Region (ITIR) in and around Hyderabad with an investment potential of over Rs 2.19 lakh crore and potential of creating 15 lakh direct jobs.
• The ITIR would comprise areas such as Cyberabad Development Authority (CDA), including Gachibowli and Madhapur, Hyderabad Airport Development Authority (HADA) area including Mamidipalli, Raviryal, Adibatla and Maheswaram as well as the Uppal and Pocharam belt.
The Government of Telangana has created benefi ts and incentives at the policy level under the ITIR such as exemption from zoning regulations, exemption from conversion charges, FAS/FSI relaxation, approval effi ciency and statutory clearances as a way to hasten up the investments.

147Socio Economic Outlook 2015
Hyderabad Metro Rail Project
In the absence of a comfortable and effi cient public transportation system, the traffi c and transportation scenario of the city is a matter for concern. Out of about 8 million motorized trips in the city, the share of public transport is a low 44%. At present, there are over 3 million vehicles and about 0.2 million vehicles are getting added every year, causing frequent traffi c jams and leaving the city polluted.
Metro Station
The 72 km Hyderabad Metro Rail project is the world’s largest mass transit project being built in Public Private Partnership (PPP) mode. The Hyderabad Metro Rail project has been designed in an innovative way to make it fi nancially viable as very few urban transit projects are fi nancially successful. Property development and commercial exploitation of air space over parking & circulation areas at Metro stations and in the Metro depots are expected to make the Project fi nancially viable. The fi nancial model envisages generation of about 55% of the revenue from passenger fares, 40% from property development and 5% from advertisements and other miscellaneous sources. The Concession period of the Project is 35 years (including a 5 year construction period) which can be extended by another 25 years.
The Project is designed as an elevated transit system to be fi nancially viable and to reduce carbon foot print in the city. Inter-modal integration with main rail, bus depots, feeder buses in traffi c catchment areas, sky-walks below elevated viaduct with landings into nearby residential/commercial complexes, bicycle tracks and other modes of Non-Motorized Transport (NMT), pedestrian facilities, street furniture etc. are part of the Project. The Project is thus not just a simple mass transit system, but is being used as an opportunity to redesign Hyderabad as a people friendly green city. The elevated stations are being designed as green building stations with emphasis on aesthetics.

148Socio Economic Outlook 2015
Salient features of HMR Project
Elevated Metro Rail on piers (pillars) with 2 metre (7ft) ground footprint at 30 metre (100ft) spacing; 10 metre (33 ft) fl yover like elevated guide way accommodating two rail lines (up and down); Stations at an average distance of 1 km - total 66 stations at 63 locations (3 interchange stations); Corridor-I: Miyapur - LB Nagar (29 km; 27 stations)
Corridor-II: Jubilee Bus Station - Falaknuma (15 km; 16 stations) Corridor-III: Nagole - Shilparamam (28 km; 23 stations)
State-of-the-art signaling system to ensure high safety standards - CBTC (Communication Based Train Control) technology being introduced for the fi rst time in India;
Video cameras in coaches and CCTVs in stations for better security; Elegant, lightweight and air-conditioned coaches with automatic door movement with the doors
opening only on platforms; & Sophisticated entry & exit gates access through contactless smart cards.Advantages:
Lower energy consumption (1/5th of road vehicles) and signifi cant reduction in air and noise pollution. High effi ciency in urban space usage, occupying only 2 meters (7ft) at ground level. One rail line equals
7 bus lanes or 24 car lanes. A 3 car (coach) train carries 1000 passengers & 6 car train carries 2000 passengers. Hyderabad Metro
will carry more than 50,000 passengers per hour per direction. Substantial reduction in travel time with a maximum speed of 80 kmph and an average speed of 34
kmph (3 times of the road speed). ‘Seamless travel’ facility through integration with rail terminals, bus depots, MMTS stations & “Merry-
go-round” feeder buses to nearby colonies and business areas / offi ces. Frequency of 2 to 5 min during peak hours, with cost-effective price to suit common man’s pocket.
Apart from addressing the traffi c problems, the Project aims at rejuvenating older parts of the city and redesigning Hyderabad city as a people friendly green city and to make it a major destination for global business and investment.
Metro Rail - Test Run

149Socio Economic Outlook 2015
5.2 DEVELOPMENT OF WORLD CLASS INFRASTRUCTURE
“ There is a huge need and a huge opportunity to everyone in the world connected, to give to everyone a voice and to transform society for future.”
- Mark Zuckerberg
Hyderabad Metropolitan Development Authority
A precondition for a global city is to periodically upgrade its infrastructure to the changing international standards, through a process of convergence. Towns this end, the urban local bodies as agencies of Hyder-abad are preparing an integrated action plan.
The Hyderabad Metropolitan Development Authority (HMDA) is aimed at planning, co-ordination, and supervising, promoting and securing planned development of the Hyderabad Metropolitan Region. The important development programs implemented by HMDA are:
Hussain Sagar Lake and Catchment Area Improvement Project
HMDA has taken up Hussain Sagar Lake and Catchment Area Improvement Project (HCIP) with an amount of Rs.370.00 crore, to maintain round the year water balance in the lake, to improve the lake water quality by preventing pollutants entering into the lake, both point source & non-point sources of pollution, to remove nutrient rich sediments in 500 m radius of nala and lake confl uence, to intercept & divert dry weather fl ows, from the lake, to improve the overall lake environment and its surroundings for enriched biodiversity and to increase the potential of eco-tourism around the lake.
Nehru Outer Ring Road
The Government of Telangana has taken up major infrastructure facilities in Hyderabad City and among them is construction of Outer Ring Road (ORR). The 158 Km long ORR passes through Patancheru (on NH -65 towards Mumbai) – Kandlakoi near Medchal (on NH-44 towards Nagpur) – Shamirpet (on Rajiv Rahadari) – Ghatkesar (on NH-163 towards Warangal) Pedda Amberpet (on NH-65 towards Vijayawada) – Shamshabad (on NH-44 towards Srisailam) – Patancheru (on NH-65 towards Mumbai) providing connectivity to various National Highways, State Highways and MDRs. The ORR is being taken up as an eight-lane access controlled expressway. The entire project is being implemented in 3 phases with an amount of Rs.6696 crore.
Development of Radial Roads
• 33 Radial Roads have been identifi ed for improvement to provide improved connectivity between Inner ring Road and Outer Ring Road.

150Socio Economic Outlook 2015
• Out the 33 Radial roads, 7 Radial Roads with a length of 53.72 Km at a cost of about Rs.341.17 crore have been completed to connect western and southern sectors of the ORR with IRR by widening to 4/6 lanes.
• The improvement of 5 roads with a length of 54.45 Km at an estimated cost of Rs.287.51 crore connecting Northern and Western sectors of ORR, with loan assistance from Japan International Cooperation Agency (JICA) had been taken up and the works are in progress.
• Government accorded sanction of Rs.304.90 crore for taking up improvements of balance 16 Radial Roads for a length of about 180 Km.
Development of Infrastructure
HMDA took up development of the residential layout in 413.32 acres at Uppal Bhagat (V), Uppal (M), R.R Dist at a cost of Rs.143.51 crore and works were grounded for the development of infrastructure in the proposed layout.
Inter City Bus Terminal
Inter City Bus Terminal is proposed in 55 acres of land of HMDA at Miyapur. The proposed Inter City Bus Terminal at Miyapur will be an Integrated One Stop Facility providing basic needs to commuters and bus operators (private and public), with zero investment from the Government.
Logistics Parks
The Logistics Park at Batasingaram on Vijayawada highway (NH9) is on 40.0 acres and Mangalapally on Nagarjunasagar highway on 22.0 acres is taken up by HMDA. The project is an Integrated One Stop Facility for freight operators, third party logistic (3PL) service providers, cargo handling companies, truck drivers warehousing, parking, etc., conceptualized on Public Private Partnership mode with zero investment from the Government.
GREATER HYDERABAD MUNICIPAL CORPORATION
The Greater Hyderabad Municipal Corporation is the urban planning that administers and provides urban amenities to Hyderabad which is the capital city and also the largest city in Telangana.
GHMC implements a number of welfare schemes which include, Rupees 5 Food Scheme and
Fellowships to the Sports persons.
To promote Hyderabad as a global city, the Government of Telangana with the support of GHMC is committed to make Hyderabad a slum-free city by improving the living conditions in existing slums and preventing growth of newer slums; congestion free Hyderabad by implementing Strategic Road Development Project (SRDP); implementing Haritha Haram under which is committed to making Hyderabad a world-class city. Several initiatives have been taken up to achieve this status with due collaboration with various the stakeholders. Some of these are as listed below
Slum-free City Hyderabad
This project has been initiated with the objective of making Hyderabad a slum-free city, by improving the living conditions in existing slums and preventing growth of newer slums. Under the project, a two bedroom hall kitchen (2 BHK) apartment is being envisaged to be given each slum dwellers family. For the pilot, 10 colonies in Hyderabad have been identifi ed where the project has been progressing at a swift pace.

151Socio Economic Outlook 2015
Congestion Free Hyderabad - Strategic Road Development Project (SRDP)
This project intends at easing the present and the potential traffi c congestion in the year to come. Construction of skyways, major corridors & roads and fl yovers, at an estimated budget of Rs. 21,684 Cores, are being planned under the project.
Eco City
With a view to transforming the city into ecologically rich one, the Government have started several initiatives.
Haritha Haram
The ‘Haritha Haram’ project, under which 50 lakh seedlings are to be planted by GHMC in 2015 and an area of 10,000 acres is to be brought under the green cover; development of lakes through which the effort is to conserve the lakes in Hyderabad; development of graveyards etc.
Among the novel initiatives in the city has been concept of ‘Green Toilets’. Eco toilets, using “zero odour technology” developed by IIT, Madras have been installed at several vantage points in the city. For the fi rst time, 100 She-Toilets for women in public places is proposed especially near bus stands, railway stations and at important public places. Similarly, 100 toilets in Govt schools with preference to schools with higher girl students are also proposed
Green Curtain
In addition to Haritha Haram project discussed earlier, the Government has initiated ‘Green Curtain’ project in the city, with a view to increasing the city green cover. Over 1,000 kilometres are planned to be covered under the project and to start with, 50 locations have been identifi ed, of which, plantations have been completed in 15 locations. .
Hyderabad Metropolitan Water Supply And Sewerage Board
At present, drinking water is being supplied through 8,31,163 consumer connections, 913 Mobile Tankers, with minimum water & sewerage cess per month Rs.152/- and Rs.400 per 5kl Mobile Tankers operate for Domestic purpose.
Godavari Drinking Water Supply Project Phase-I
HMWSSB has taken up the Godavari Drinking Water Supply Project Phase-I to augment 172 Mgd at a cost of Rs.3375 crore for main Project and Rs.350 crore for Ring Mains Project totalling to Rs.3725 crore. Out of 186 Km length of pipeline, about 175 Km laying is completed and all the civil works, WTP, Pumps and Motors etc are under progress. The Godavari Ring Mains project is also under progress and out of 67.23 Km total length so far 35.38 Km laying is completed. On completion of main project & ring mains project, city will receive additional 172 Mgd of treated water which improves the per capita water supply in GHMC area.
Krishna Drinking Water Supply Project Phase-III
The Government has approved the project proposals of Krishna Drinking Water Supply Project Phase-III to provide 90 Mgd from the river Krishna, Nagarjunasagar Reservoir, at a cost of Rs.1670 crore. The project is likely to be completed by June 2015. The city will receive additional 90 Mgd of treated water which ensures daily water supply in the core city and improves the rate of water supply in peripheral circles of GHMC. National River Conservation Project
HMWSSB has taken up the project of ‘Abatement of Pollution of River Musi’ at a cost of Rs.335.66 crore under NRCD and the Phase-I Project is successfully completed & commissioned for the treatment of about 600 Mld sewage (under National River Conservation Plan). Further, Phase-II project proposals were

152Socio Economic Outlook 2015
formulated to treat another 610 Mld sewage through new STPs at a cost of Rs.923 crore and submitted for approval of NRCD, MoEF, GoI. Implementation of this project will greatly improve the hygienic condition and environs all along the Musi River stretch in the midst of Hyderabad City.Malkajgiri Water Supply Project
The comprehensive water supply services improvements project for Malkajgiri Circle of GHMC is taken up at a cost of Rs.338.54 crore. The project envisages for creation of required storage reservoirs, providing inlet, outlet and distribution network & metering etc for the entire Malkajgiri circle. New Water Supply Projects for Peripheral Areas
There are 7 water supply projects of HMWSSB worth Rs.1632.32 crore under JnNURM are in transition phase at Ramchandrapuram, Patancheru, L.B.Nagar, Serilingampally, Asifnagar, Kapra and Kukatpally areas.Global Recognition:
Leaving behind India’s more traditional business centres such as Mumbai and Bengaluru, the city of pearls Hyderabad is the best city to live in the country, as per a global survey conducted by consultancy fi rm Mercer’s ‘Quality of Living Report-2015’ . The parameters taken into account for the survey include, political and social environment, medical and health care, public services, recreation facilities and natural environment, among others.It shall be the earnest endeavour of the Government that the capital city of Telengana shall refl ect global best practices in economy, ecology and equity. The Transformation of Hyderabad as a global city will depend on convergence of several factors as mentioned above and it is the aim of the State Government to facilitate this process through proactive policy initiatives.

Annexures 153
STATISTICAL PROFILE

154Socio Economic Outlook 2015

Annexures 155
Sl. No Title Page
Growth Trajectory
1 Gross State Domestic Product of Telangana at Current Prices 157
2 Growth Rates of Gross State Domestic Product of Telangana at Current Prices 158
3 Gross State Domestic Product of Telangana at Constant (2004-05) Prices 159
4 Growth Rates of Gross State Domestic Product of Telangana at Constant (2004-05) Prices 160
5 Gross State Domestic Product of Telangana State at Current Prices (% contribution) 161
6 Gross Value Added of All India at Factor Cost by Economic Activity at Current Prices 162
7 Growth Rates of Gross Value Added of All India at Factor Cost by Economic Activity at Current Prices
163
8 Gross Value Added of All India at Factor Cost by Economic Activity at Constant (2011-12) Prices 164
9 Growth Rates of Gross Value Added of All India at Factor Cost by Economic Activity at Constant (2011-12) Prices
165
10 Industry wise Percentage Share of Gross Value Added of All India at Factor Cost by Economic Activity at Current Prices
166
11 Net State Domestic Product (NSDP) and Per Capita Income of Telangana State and All India at Current and Constant Prices
167
12 Gross District Domestic Product of Telangana at Current Prices 168
13 Gross District Domestic Product of Telangana at Constant (2004-05) Prices 169
14 District Per Capita Income at Factor Cost at Current Prices 170
15 District Per Capita Income at Factor Cost at Constant (2004-05) Prices 171
Revamping Agriculture & Allied Sectors
16 Land Utilisation Particulars 172
17 Season wise Rainfall 173
18 Source –wise Gross Irrigated Area 174
19 Source-wise Net Irrigated Area 174
20 Area and Production of Foodgrains 175
21 National Agriculture Insurance Scheme 176
STATISTICAL PROFILE

156Socio Economic Outlook 2015
22 Area and Production of Horticulture Crops 2013-14 177
23 Potential and Status of Micro Irrigation 178
24 Targets and Achievements of Animal Husbandry 178
25 Fish and Prawn Production 179
26 District wise Geographical Area and Forest Area 179
27 Revenue collected from Forest Produce 180
28 Sancturies, Tiger Reserves & National Parks 181
Economic Infrastructure and Industrial Policy
29 District wise Number of Large Industries, Investment and Employment 182
30 District-wise Number of Micro, Small and Medium Enterprises, Investment and Employment 183
31 Production and Value of Minerals in 2014-15 (up to Dec’14) 184
32 District-wise, Mineral Revenue Collection during 2014-15 (Up to Dec’2014) 185
33 District wise Number of Bank Branches as on 30.09.2014 185
Welfare and Social Development
34 Population from 1961 to 2011 186
35 Percentage Decadal Variation of Population and Sex Ratio 187
36 Percentage of Urban Population to Total Population and Density of Population 188
37 Literates (Percentage of Literates to Population 7 years and above) 188
38 Enrolment of Children in Schools 189
39 School Dropout Rates 189
40 District Wise Health Camps conducted under Aarogyasri Healthcare Trust 190

Annexures 157
(Rs. Crore)
Sl. No.
Industry2004-
05 2005-
062006-
072007-
082008-
09 2009-
10 2010-11
2011-12 (TRE)
2012-13 (SRE)
2013-14 (FRE)
2014-15 (AE)
1 2 3 4 5 6 7 8 9 10 11 12 13
1 Agriculture, Forestry & Fishing
1.1A Agriculture 9806 13733 14222 19743 23726 20837 35218 32801 40725 48649 39930
1.1B Livestock 4205 5126 5381 6303 8394 9824 11732 19554 23777 25989 30584
1.2 Forestry & Log-ging 1689 1865 1947 2092 2177 2191 2767 3110 3323 3570 3869
1.3 Fishing 412 411 498 628 864 820 829 1400 1655 2337 2677
Agriculture Sector
16112 21135 22048 28766 35162 33672 50545 56866 69480 80544 77061
2Mining & Quar-rying 4275 4796 4986 6071 7244 8682 9620 12273 13494 13408 12456
3 Manufacturing
3.1 Registered 8954 10668 15402 16068 22685 22106 32065 36398 36465 38424 42669
3.2 Un-Registered 2909 3228 3631 4038 4359 4798 5250 6401 6366 6344 6850
4Electricity, Gas & Water Supply 2510 2967 3026 3924 4012 5057 7072 8228 6143 7790 8611
5 Construction 6785 8942 11176 14498 18909 20723 23605 26249 30092 32755 36942
Industry Sector 25433 30601 38221 44599 57209 61367 77612 89548 92559 98721 107528
6Trade, Hotels & Restaurants 11689 14549 17376 20555 26313 26031 36607 40120 45787 50790 56410
7 Transport, Storage & Communications
7.1 Railways 1707 1733 2033 2270 2485 2777 2822 1662 1902 2082 2301
7.2 Transport by Other means & Storage 3718 4736 6133 7225 9191 10705 13986 16301 21274 24792 27042
7.3 Communications 1784 1939 2019 2274 2622 3356 3292 4406 4888 5487 6292
8 Financing, Insurance, Real Estate & Business Services
8.1 Banking & Insur-ance 4073 4373 5294 6566 8579 9361 11964 19269 21697 23751 28322
8.2
Real Estate, Ownership of Dwellings & Business Services
12534 14828 17523 21365 25881 30110 35543 41493 48696 57134 67106
9 Community, Social & Personal Services
9.1 Public Adminis-tration 4206 4256 5054 5870 7148 8552 9164 11073 12477 15109 19839
9.2 Other Services 8690 10183 11270 12960 14792 17578 22361 24884 28322 33341 38698
Services Sector 48401 56598 66702 79086 97011 108470 135741 159209 185043 212486 246010
Gross State Domestic Product
89946 108335 126971 152452 189382 203508 263898 305622 347082 391751 430599
1. Gross State Domestic Product of Telangana at Current Prices
TRE: Third Revised Estimates, SRE: Second Revised Estimates, FRE: First Revised Estimates, AE: Advance Estimates.Totals may not tally due to rounding off.Source: Directorate of Economics and Statistics, Hyderabad.

158Socio Economic Outlook 2015
2. Growth Rates of Gross State Domestic Product of Telangana at Current Prices
(Percentage Change over Previous Year)
Sl.No
Industry2005-
062006-
072007-
082008-
09 2009-
10 2010-
11 2011-12 (TRE)
2012-13 (SRE)
2013-14 (FRE)
2014-15 (AE)
1 2 3 4 5 6 7 8 9 10 11 12
1 Agriculture, Forestry & Fishing
1.1 A Agriculture 40.0 3.6 38.8 20.2 -12.2 69.0 -6.9 24.2 19.5 -17.9
1.1 B Livestock 21.9 5.0 17.1 33.2 17.0 19.4 66.7 21.6 9.3 17.7
1.2 Forestry & Logging 10.4 4.4 7.5 4.0 0.6 26.3 12.4 6.8 7.4 8.4
1.3 Fishing -0.2 21.0 26.3 37.5 -5.1 1.1 68.9 18.2 41.1 14.6
Agriculture Sector 31.2 4.3 30.5 22.2 -4.2 50.1 12.5 22.2 15.9 -4.3
2 Mining & Quarrying 12.2 3.9 21.8 19.3 19.9 10.8 27.6 10.0 -0.6 -7.1
3 Manufacturing
3.1 Registered 19.1 44.4 4.3 41.2 -2.6 45.0 13.5 0.2 5.4 11.0
3.2 Un-Registered 11.0 12.5 11.2 8.0 10.1 9.4 21.9 -0.5 -0.3 8.0
4Electricity, Gas & Water Supply 18.2 2.0 29.7 2.2 26.0 39.9 16.3 -25.3 26.8 10.5
5 Construction 31.8 25.0 29.7 30.4 9.6 13.9 11.2 14.6 8.8 12.8
Industry Sector 20.3 24.9 16.7 28.3 7.3 26.5 15.4 3.4 6.7 8.9
6Trade, Hotels & Restaurants 24.5 19.4 18.3 28.0 -1.1 40.6 9.6 14.1 10.9 11.1
7 Transport, Storage & Communications
7.1 Railways 1.5 17.3 11.7 9.5 11.7 1.7 -41.1 14.4 9.5 10.5
7.2 Transport by Other means & Storage 27.4 29.5 17.8 27.2 16.5 30.6 16.6 30.5 16.5 9.1
7.3 Communications 8.7 4.1 12.6 15.3 28.0 -1.9 33.8 10.9 12.3 14.7
8 Financing, Insurance, Real Estate & Business Services
8.1 Banking & Insurance 7.4 21.0 24.0 30.6 9.1 27.8 61.1 12.6 9.5 19.2
8.2Real Estate, Ownership of Dwellings & Business Services
18.3 18.2 21.9 21.1 16.3 18.0 16.7 17.4 17.3 17.5
9 Community, Social & Personal Services
9.1 Public Administration 1.2 18.7 16.1 21.8 19.6 7.2 20.8 12.7 21.1 31.3
9.2 Other Services 17.2 10.7 15.0 14.1 18.8 27.2 11.3 13.8 17.7 16.1
Services Sector 16.9 17.9 18.6 22.7 11.8 25.1 17.3 16.2 14.8 15.8
Gross State Domestic Product
20.4 17.2 20.1 24.2 7.5 29.7 15.8 13.6 12.9 9.9
TRE: Third Revised Estimates, SRE: Second Revised Estimates, FRE: First Revised Estimates, AE: Advance Estimates. Totals may not tally due to rounding off. Source: Directorate of Economics and Statistics,Hyderabad.

Annexures 159
3. Gross State Domestic Product of Telangana at Constant (2004-05) Prices
(Rs. Crore)Sl.
No.Industry
2004-05
2005-06
2006-07
2007-08
2008-09
2009-10
2010-11
2011-12 (TRE)
2012-13 (SRE)
2013-14 (FRE)
2014-15 (AE)
1 2 3 4 5 6 7 8 9 10 11 12 131 Agriculture, Forestry & Fishing
1.1 A Agriculture 9806 13125 12867 15547 16093 12623 16221 14535 16609 18767 14772
1.1 B Livestock 4205 4926 4974 5427 6107 6583 7099 8442 9181 9217 9811
1.2 Forestry & Logging 1689 1748 1773 1812 1851 1831 1906 1847 1886 1942 1994
1.3 Fishing 412 378 466 562 700 628 631 942 1050 1210 1348Agriculture Sector
16112 20177 20079 23347 24751 21664 25858 25765 28726 31136 27926
2Mining & Quarrying 4275 4541 4737 5115 5405 5837 6244 6755 7103 6787 6139
3 Manufacturing
3.1 Registered 8954 10205 13957 13656 17996 17830 24293 25957 24759 25024 269433.2 Un-Registered 2909 3138 3348 3547 3610 3735 3857 4434 4167 3926 4110
4Electricity, Gas & Water Supply 2510 2818 2701 3331 3061 3362 4265 4684 3172 3285 3393
5 Construction 6785 8234 9130 10405 11745 12005 11311 11012 11461 11703 12225Industry Sector 25433 28937 33874 36054 41816 42769 49969 52842 50661 50725 52810
6Trade, Hotels & Restaurants 11689 13987 15883 17261 21064 19609 26319 27003 28579 29971 32199
7 Transport, Storage & Communications
7.1 Railways 1707 1762 1889 1988 2154 2148 2352 1351 1543 1675 1826
7.2Transport by Other means & Storage
3718 4534 5607 6221 7107 7929 9623 10196 12250 13436 14456
7.3 Communications 1784 2079 2396 2899 3296 5762 7918 10112 10219 10823 120798 Financing, Insurance, Real Estate & Business Services
8.1 Banking & Insurance 4073 4711 5852 7333 9128 9988 11854 18375 19397 20257 22485
8.2
Real Estate, Ownership of Dwellings & Business Services
12534 14192 15751 17841 19689 20095 21036 23238 24777 26034 28462
9 Community, Social & Personal Services
9.1 Public Administration 4206 4142 4621 4982 5589 5981 5841 6378 6516 7191 8789
9.2 Other Services 8690 9711 10392 10692 11308 11630 13415 14008 14387 15180 16400Services Sector 48401 55119 62390 69216 79335 83143 98358 110661 117668 124566 136696
Gross State Domestic Product
89946 104233 116343 128618 145902 147577 174185 189269 197056 206427 217432
TRE: Third Revised Estimates, SRE: Second Revised Estimates, FRE: First Revised Estimates, AE:Advance Estimates. Totals may not tally due to rounding off.Source: Directorate of Economics and Statistics,Hyderabad.

160Socio Economic Outlook 2015
4. Growth Rates of Gross State Domestic Product of Telangana at Constant (2004-05) Prices
(Percentage Change over Previous Year)
Sl.No
Industry2005-
062006-
072007-
082008-
09 2009-
10 2010-
11 2011-12 (TRE)
2012-13 (SRE)
2013-14 (FRE)
2014-15 (AE)
1 2 3 4 5 6 7 8 9 10 11 12
1 Agriculture, Forestry & Fishing
1.1 A Agriculture 33.8 -2.0 20.8 3.5 -21.6 28.5 -10.4 14.3 13.0 -21.3
1.1 B Livestock 17.1 1.0 9.1 12.5 7.8 7.8 18.9 8.8 0.4 6.5
1.2 Forestry & Logging 3.5 1.4 2.2 2.1 -1.1 4.1 -3.1 2.1 3.0 2.7
1.3 Fishing -8.2 23.1 20.7 24.6 -10.3 0.5 49.2 11.4 15.3 11.4
Agriculture Sector 25.2 -0.5 16.3 6.0 -12.5 19.4 -0.4 11.5 8.4 -10.3
2 Mining & Quarrying 6.2 4.3 8.0 5.7 8.0 7.0 8.2 5.1 -4.4 -9.6
3 Manufacturing
3.1 Registered 14.0 36.8 -2.2 31.8 -0.9 36.2 6.8 -4.6 1.1 7.7
3.2 Un-Registered 7.9 6.7 5.9 1.8 3.4 3.3 15.0 -6.0 -5.8 4.7
4Electricity, Gas & Water Supply 12.3 -4.2 23.3 -8.1 9.9 26.8 9.8 -32.3 3.6 3.3
5 Construction 21.4 10.9 14.0 12.9 2.2 -5.8 -2.6 4.1 2.1 4.5
Industry Sector 13.8 17.1 6.4 16.0 2.3 16.8 5.7 -4.1 0.13 4.1
6Trade, Hotels & Restaurants 19.7 13.6 8.7 22.0 -6.9 34.2 2.6 5.8 4.9 7.4
7 Transport, Storage & Communications
7.1 Railways 3.2 7.2 5.2 8.4 -0.3 9.5 -42.6 14.2 8.6 9.0
7.2 Transport by Other means & Storage 21.9 23.7 11.0 14.2 11.6 21.4 6.0 20.2 9.7 7.6
7.3 Communications 16.6 15.2 21.0 13.7 74.8 37.4 27.7 1.1 5.9 11.6
8 Financing, Insurance, Real Estate & Business Services
8.1 Banking & Insurance 15.7 24.2 25.3 24.5 9.4 18.7 55.0 5.6 4.4 11.0
8.2Real Estate, Ownership of Dwellings & Business Services
13.2 11.0 13.3 10.4 2.1 4.7 10.5 6.6 5.1 9.3
9 Community, Social & Personal Services
9.1 Public Administration -1.5 11.6 7.8 12.2 7.0 -2.4 9.2 2.2 10.4 22.2
9.2 Other Services 11.8 7.0 2.9 5.8 2.9 15.3 4.4 2.7 5.5 8.0
Services Sector 13.9 13.2 10.9 14.6 4.8 18.3 12.5 6.3 5.9 9.7
Gross State Domestic Product 15.9 11.6 10.6 13.4 1.1 18.0 8.7 4.1 4.8 5.3
TRE: Third Revised Estimates, SRE: Second Revised Estimates, FRE: First Revised Estimates, AE: Advance Estimates.Totals may not tally due to rounding off.Source: Directorate of Economics and Statistics,Hyderabad.

Annexures 161
5. Gross State Domestic Product of Telangana at Current Prices
(Percentage Contribution)Sl.
No.Industry
2004-05
2005-06
2006-07
2007-08
2008-09
2009-10
2010-11
2011-12 (TRE)
2012-13 (SRE)
2013-14 (FRE)
2014-15 (AE)
1 2 3 4 5 6 7 8 9 10 11 12 13
1 Agriculture, Forestry & Fishing
1.1 A Agriculture 10.9 12.7 11.2 13.0 12.5 10.2 13.3 10.7 11.7 12.4 9.3
1.1B Livestock 4.7 4.7 4.2 4.1 4.4 4.8 4.4 6.4 6.9 6.6 7.1
1.2 Forestry & Logging 1.9 1.7 1.5 1.4 1.1 1.1 1.0 1.0 1.0 0.9 0.9
1.3 Fishing 0.5 0.4 0.4 0.4 0.5 0.4 0.3 0.5 0.5 0.6 0.6
Agriculture Sector 17.9 19.51 17.4 18.9 18.6 16.5 19.2 18.6 20.0 20.6 17.9
2 Mining & Quarrying 4.8 4.4 3.9 4.0 3.8 4.3 3.6 4.0 3.9 3.4 2.9
3 Manufacturing
3.1 Registered 10.0 9.8 12.1 10.5 12.0 10.9 12.2 11.9 10.5 9.8 9.9
3.2 Un-Registered 3.2 3.0 2.9 2.6 2.3 2.4 2.0 2.1 1.8 1.6 1.6
4Electricity, Gas & Water Supply 2.8 2.7 2.4 2.6 2.1 2.5 2.7 2.7 1.8 2.0 2.0
5 Construction 7.5 8.3 8.8 9.5 10.0 10.2 8.9 8.6 8.7 8.4 8.6
Industry Sector 28.3 28.2 30.1 29.3 30.2 30.2 29.4 29.3 26.7 25.2 25.0
6Trade, Hotels & Restaurants 13.0 13.4 13.7 13.5 13.9 12.8 13.9 13.1 13.2 13.0 13.1
7 Transport, Storage & Communications
7.1 Railways 1.9 1.6 1.6 1.5 1.3 1.4 1.1 0.5 0.5 0.5 0.5
7.2 Transport by Other means & Storage 4.1 4.4 4.8 4.7 4.9 5.3 5.3 5.3 6.1 6.3 6.3
7.3 Communications 2.0 1.8 1.6 1.5 1.4 1.6 1.2 1.4 1.4 1.4 1.5
8 Financing, Insurance, Real Estate & Business Services
8.1 Banking & Insurance 4.5 4.0 4.2 4.3 4.5 4.6 4.5 6.3 6.3 6.1 6.6
8.2
Real Estate, Ownership of Dwellings & Business Services
13.9 13.7 13.8 14.0 13.7 14.8 13.5 13.6 14.0 14.6 15.6
9 Community, Social & Personal Services
9.1 Public Administration 4.7 3.9 4.0 3.9 3.8 4.2 3.5 3.6 3.6 3.9 4.6
9.2 Other Services 9.7 9.4 8.9 8.5 7.8 8.6 8.5 8.1 8.2 8.5 9.0
Services Sector 53.8 52.2 52.5 51.9 51.2 53.3 51.4 52.1 53.3 54.2 57.1
Gross State Domestic Product
100.0 100.0 100.0 100.0 100.0 100.0 100.0 100.0 100.0 100.0 100.0
TRE: Third Revised Estimates, SRE: Second Revised Estimates, FRE: First Revised Estimates, AE: Advance Estimates. Totals may not tally due to rounding off Source:Directorate of Economics and Statistics,Hyderabad.

162Socio Economic Outlook 2015
6. Gross Value Added of All India at Factor Cost by Economic Activity at Current Prices
(Rs. Crore)
Sl. No Industry 2011-12 (NS) 2012-13 (NS) 2013-14 (NS) 2014-15 (AE)
1 2 3 4 5 6
1 Agriculture, Forestry & Fishing 1553960 1729966 1951820 2059902
Agriculture Sector 1553960 1729966 1951820 2059902
2 Mining & Quarrying 259371 283095 297067 294202
3 Manufacturing 1469005 1637302 1788986 1969604
4 Electricity, Gas, Water Supply & Other Utility Services 202395 218944 245624 278394
5 Construction 769842 797274 864171 933262
Industry Sector 2700613 2936615 3195848 3475462
6 Trade, Hotels Transport & Communica-tions and Services related to Broadcasting 1419356 1662022 1945319 2195398
7 Financing, Insurance, Real Estate & Professional Services 1509686 1775020 2038838 2405223
8 Public Administration, Defence and Other Services 1022783 1159515 1355247 1567003
Services Sector 3951825 4596557 5339404 6167624
GVA at Factor Cost 8206398 9263138 10487074 11702988
NS: New Series Estimates, AE: Advance Estimates. Totals may not tally due to rounding off.Source: Central Statistics Offi ce, MOSPI, New Delhi.

Annexures 163
7. Growth Rates of Gross Value Added of All India at Factor Cost by Economic Activity at Current Prices
(Percentage Change over Previous Year)
Sl. No Industry 2012-13 (NS) 2013-14 (NS) 2014-15 (AE)
1 2 3 4 5
1 Agriculture, Forestry & Fishing 11.3 12.8 5.5
Agriculture Sector 11.3 12.8 5.5
2 Mining & Quarrying 9.1 4.9 -1.0
3 Manufacturing 11.5 9.3 10.1
4 Electricity, Gas, Water Supply & Other Utility Services
8.2 12.2 13.3
5 Construction 3.6 8.4 8.0
Industry Sector 8.7 8.8 8.7
6 Trade, Hotels Transport, Communications and Services related to Broadcasting
17.1 17.0 12.9
7 Financing, Insurance, Real Estate & Professional Services
17.6 14.9 18.0
8 Public Administration, Defence and Other Services
13.4 16.9 15.6
Services Sector 16.3 16.2 15.5
GVA at Factor Cost 12.9 13.2 11.6
NS: New Series Estimates, AE: Advance Estimates. Totals may not tally due to rounding off.Source: Central Statistics Offi ce, MOSPI New Delhi.

164Socio Economic Outlook 2015
8. Gross Value Added of All India at Factor Cost by Economic Activity at Constant (2011-12) Prices
(Rs. Crore)
Sl. No. Industry 2011-12 (NS) 2012-13 (NS) 2013-14 (NS) 2014-15 (AE)
1 2 3 4 5 6
1 Agriculture, Forestry & Fishing 1553960 1580362 1640869 1659407
Agriculture Sector 1553960 1580362 1640869 1659407
2 Mining & Quarrying 259371 260697 275093 279651
3 Manufacturing 1469005 1558893 1641285 1751041
4 Electricity, Gas, Water Supply & Other Utility Services 202395 206975 213069 225684
5 Construction 769842 736239 754847 788553
Industry Sector 2700613 2762804 2884294 3044929
6Trade, Hotels, Transport, Communications and Services related to Broadcasting
1419356 1550174 1719867 1876682
7 Financing, Insurance, Real Estate & Professional Services 1509686 1645071 1776156 2025588
8 Public Administration, Defence and Other Services 1022783 1071106 1157256 1258642
Services Sector 3951825 4266350 4653279 5160912
GVA at Factor Cost 8206398 8609516 9178444 9865247
NS: New Series Estimates, AE: Advance Estimates. Totals may not tally due to rounding off.Source: Central Statistics Offi ce, MOSPI, New Delhi.

Annexures 165
9. Growth Rates of Gross Value Added of All India at Factor Cost by Economic Activity at Constant (2011-12) Prices
(Percentage Change over Previous Year)
Sl. No. Industry 2012-13 (NS) 2013-14 (NS) 2014-15 (AE)
1 2 3 4 5
1 Agriculture, Forestry & Fishing 1.7 3.8 1.1
Agriculture Sector 1.7 3.8 1.1
2 Mining & Quarrying 0.5 5.5 1.7
3 Manufacturing 6.1 5.3 6.7
4 Electricity, Gas, Water Supply & Other Utility Services 2.3 2.9 5.9
5 Construction -4.4 2.5 4.5
Industry Sector 2.3 4.4 5.6
6Trade, Hotels, Transport,Communications and Services related to Broadcasting
9.2 10.9 9.1
7 Financing, Insurance, Real Estate & Professional Services 9.0 8.0 14.0
8 Public Administration, Defence and Other Services 4.7 8.0 8.8
Services Sector 8.0 9.1 10.9
GVA at Factor Cost 4.9 6.6 7.5
NS: New Series Estimates, AE: Advance Estimates. Source: Central Statistics Offi ce, MOSPI, New Delhi.
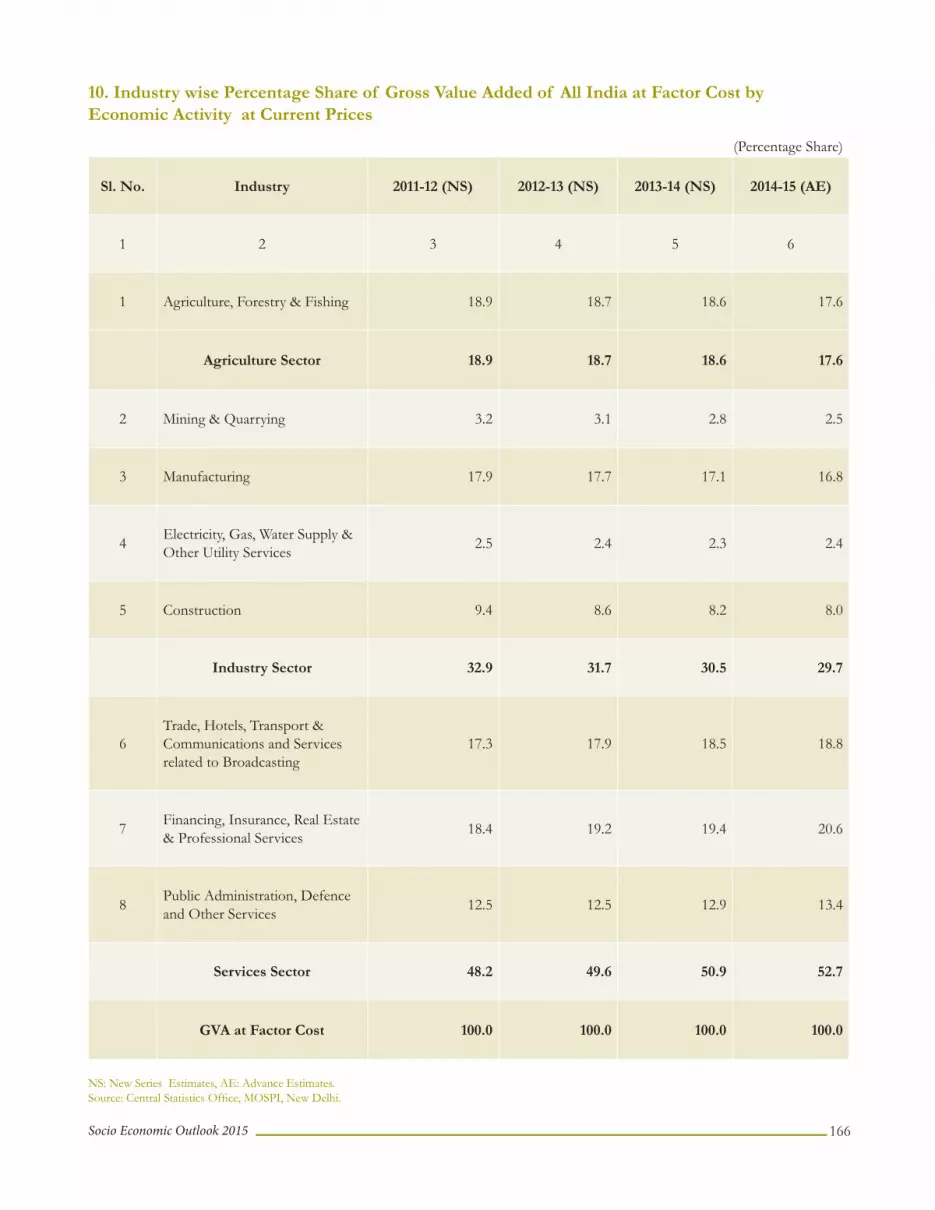
166Socio Economic Outlook 2015
10. Industry wise Percentage Share of Gross Value Added of All India at Factor Cost by Economic Activity at Current Prices
(Percentage Share)
Sl. No. Industry 2011-12 (NS) 2012-13 (NS) 2013-14 (NS) 2014-15 (AE)
1 2 3 4 5 6
1 Agriculture, Forestry & Fishing 18.9 18.7 18.6 17.6
Agriculture Sector 18.9 18.7 18.6 17.6
2 Mining & Quarrying 3.2 3.1 2.8 2.5
3 Manufacturing 17.9 17.7 17.1 16.8
4 Electricity, Gas, Water Supply & Other Utility Services 2.5 2.4 2.3 2.4
5 Construction 9.4 8.6 8.2 8.0
Industry Sector 32.9 31.7 30.5 29.7
6Trade, Hotels, Transport & Communications and Services related to Broadcasting
17.3 17.9 18.5 18.8
7 Financing, Insurance, Real Estate & Professional Services 18.4 19.2 19.4 20.6
8 Public Administration, Defence and Other Services 12.5 12.5 12.9 13.4
Services Sector 48.2 49.6 50.9 52.7
GVA at Factor Cost 100.0 100.0 100.0 100.0
NS: New Series Estimates, AE: Advance Estimates. Source: Central Statistics Offi ce, MOSPI, New Delhi.
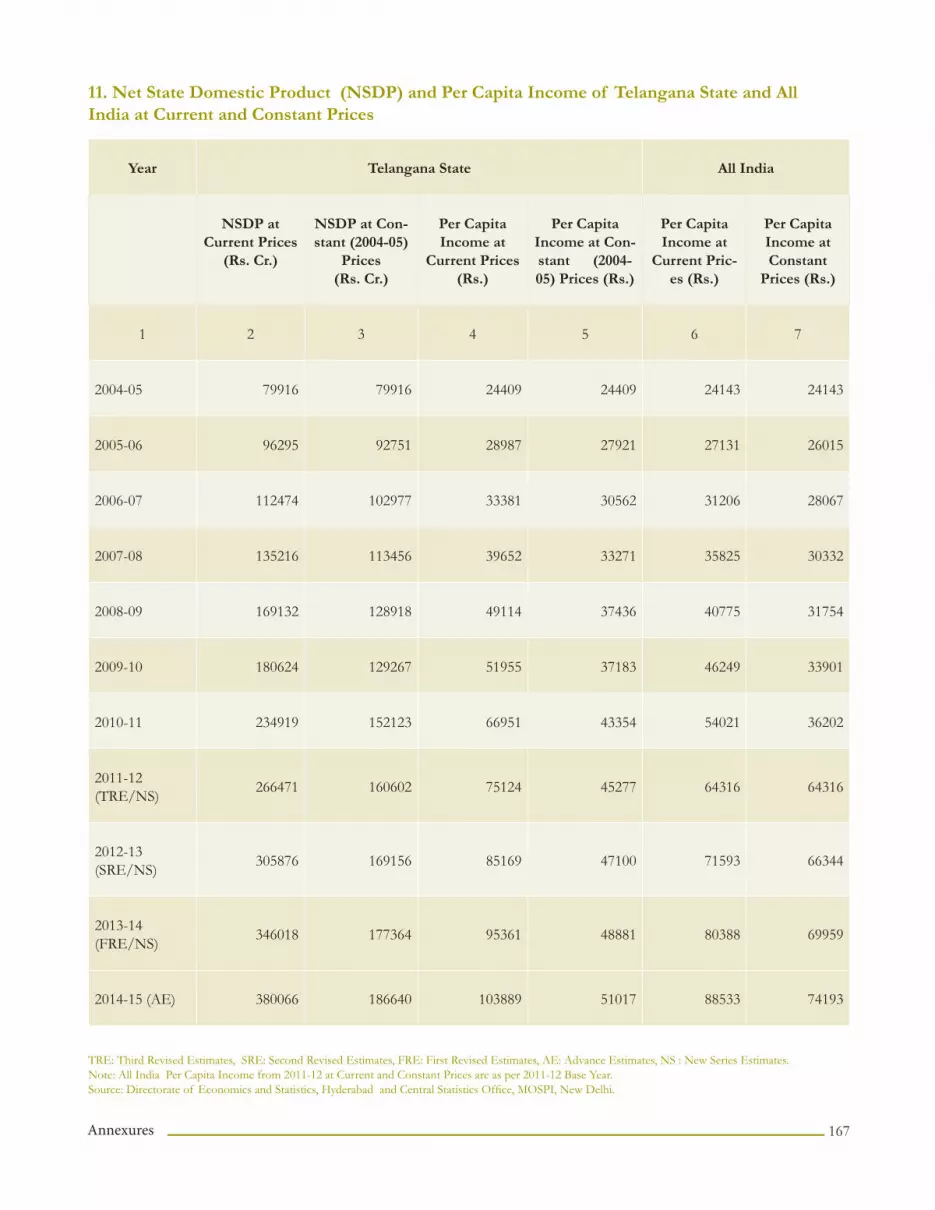
Annexures 167
11. Net State Domestic Product (NSDP) and Per Capita Income of Telangana State and All India at Current and Constant Prices
Year Telangana State All India
NSDP at Current Prices
(Rs. Cr.)
NSDP at Con-stant (2004-05)
Prices (Rs. Cr.)
Per Capita Income at
Current Prices (Rs.)
Per Capita Income at Con-stant (2004-05) Prices (Rs.)
Per Capita Income at
Current Pric-es (Rs.)
Per Capita Income at Constant
Prices (Rs.)
1 2 3 4 5 6 7
2004-05 79916 79916 24409 24409 24143 24143
2005-06 96295 92751 28987 27921 27131 26015
2006-07 112474 102977 33381 30562 31206 28067
2007-08 135216 113456 39652 33271 35825 30332
2008-09 169132 128918 49114 37436 40775 31754
2009-10 180624 129267 51955 37183 46249 33901
2010-11 234919 152123 66951 43354 54021 36202
2011-12 (TRE/NS) 266471 160602 75124 45277 64316 64316
2012-13 (SRE/NS) 305876 169156 85169 47100 71593 66344
2013-14 (FRE/NS) 346018 177364 95361 48881 80388 69959
2014-15 (AE) 380066 186640 103889 51017 88533 74193
TRE: Third Revised Estimates, SRE: Second Revised Estimates, FRE: First Revised Estimates, AE: Advance Estimates, NS : New Series Estimates.Note: All India Per Capita Income from 2011-12 at Current and Constant Prices are as per 2011-12 Base Year.Source: Directorate of Economics and Statistics, Hyderabad and Central Statistics Offi ce, MOSPI, New Delhi.

168Socio Economic Outlook 2015
12. Gross District Domestic Product of Telangana at Current Prices
(Rs. Crore)
Sl. No.
District 2004-05 2005-06 2006-07 2007-08 2008-09 2009-10 2010-11 2011-12 (TRE)
2012-13 (SRE)
2013-14 (FRE)
1 2 3 4 5 6 7 8 9 10 11 12
1 Adilabad 6527 7059 8301 9860 12343 13291 16508 18168 20083 21752
2 Nizamabad 4869 5940 6558 7977 11428 10507 14242 16432 18173 21102
3 Karimnagar 9090 11321 12782 14890 18253 19224 25066 30717 35313 40224
4 Medak 8907 10613 13880 14716 18733 20744 30668 34534 38232 42368
5 Hyderabad 16933 20524 25017 30038 35537 39564 47610 52038 59673 68176
6 Rangareddy 13310 17378 21023 24917 31847 34069 48226 54337 60833 65925
7 Mahabub-nagar
7107 8880 9502 11880 14006 16593 20428 25001 29980 34429
8 Nalgonda 7659 9047 10424 14737 18346 18634 22185 27735 30186 35145
9 Warangal 7350 8531 9290 11233 13705 14441 19107 22150 25859 29766
10 Khammam 8194 9042 10195 12204 15183 16439 19857 24511 28749 32864
Telangana 89946 108335 126971 152452 189382 203508 263898 305622 347082 391751
RE: Third Revised Estimates, SRE: Second Revised Estimates, FRE: First Revised Estimate.Source: Directorate of Economics and Statistics, Hyderabad.

Annexures 169
13. Gross District Domestic Product of Telangana at Constant (2004-05) Prices
(Rs. Crore)
Sl. No.
District 2004-05
2005-06
2006-07
2007-08
2008-09
2009-10
2010-11 2011-12 (TRE)
2012-13 (SRE)
2013-14 (FRE)
1 2 3 4 5 6 7 8 9 10 11 12
1 Adilabad 6527 6813 7651 8316 9342 9514 9962 10387 10713 10837
2 Nizamabad 4869 5745 6049 6762 8599 7238 8670 9800 9671 10361
3 Karimnagar 9090 10918 11874 12610 13839 13331 15441 17754 18879 19923
4 Medak 8907 10159 12597 12368 14790 15669 20410 21545 23391 23905
5 Hyderabad 16933 19849 23079 25956 28431 29889 34847 35808 37463 39502
6 Rangareddy 13310 16657 19180 20970 24906 24748 33036 35450 35565 36212
7 Mahabubnagar 7107 8543 8562 9823 10599 11845 12808 14447 15604 16664
8 Nalgonda 7659 8665 9357 12109 13982 13495 14462 16885 16999 18070
9 Warangal 7350 8218 8580 9438 10161 10186 11426 12765 13643 14652
10 Khammam 8194 8665 9414 10265 11253 11663 13123 14427 15129 16301
Telangana 89946 104233 116343 128618 145902 147577 174185 189269 197056 206427
TRE: Third Revised Estimates, SRE: Second Revised Estimates, FRE: First Revised Estimates. Source:Directorate of Economics and Statistics, Hyderabad.

170Socio Economic Outlook 2015
14. District Per Capita Income at Factor Cost at Current Prices
(in Rupees)
Sl.No.
District2004-
052005-
062006-
072007-
082008-
092009-
102010-
11 2011-12 (TRE)
2012-13 (SRE)
2013-14 (FRE)
1 2 3 4 5 6 7 8 9 10 11 12
1 Adilabad 22294 24013 27740 32577 40351 42491 53281 58264 63792 68511
2 Nizamabad 17742 21539 23457 28251 39755 36714 49859 56380 62091 71528
3 Karimnagar 22249 27544 30570 35394 43503 44808 58643 70003 80215 90859
4 Medak 27533 32351 41226 43667 54935 58986 87045 92896 103282 114006
5 Hyderabad 36560 43411 52325 62020 73775 81471 96516 102634 117445 132862
6 Rangareddy 29166 36776 42976 49931 63328 66867 93726 100308 110526 117752
7 Mahabubnagar 17507 21845 23206 29007 33734 39338 48146 57331 68907 78678
8 Nalgonda 20274 23753 26945 37200 46895 46899 55380 66564 72908 84249
9 Warangal 19665 22495 24239 28959 35452 36843 48626 55309 64412 73496
10 Khammam 27258 29745 33083 39142 48555 51333 62063 74841 87741 99581
Telangana 24409 28987 33381 39652 49114 51955 66951 75124 85169 95361
TRE: Third Revised Estimates, SRE: Second Revised Estimates, FRE: First Revised Estimates.Source:Directorate of Economics and Statistics, Hyderabad.

Annexures 171
15. District Per Capita Income at Factor Cost at Constant (2004-05) Prices
(in Rupees)
Sl.No.
District2004-
052005-
062006-
072007-
082008-
092009-
102010-
11 2011-12 (TRE)
2012-13 (SRE)
2013-14 (FRE)
1 2 3 4 5 6 7 8 9 10 11 12
1 Adilabad 22294 23187 25545 27304 30164 29956 31433 32617 33361 33498
2 Nizamabad 17742 20860 21661 23891 29633 25006 29889 33167 32577 34647
3 Karimnagar 22249 26568 28352 29769 32556 30550 35367 39469 41879 43981
4 Medak 27533 30992 37300 36372 42712 43730 56057 54820 60448 61243
5 Hyderabad 36560 42106 48324 53527 58824 61184 70250 69921 72852 75895
6 Rangareddy 29166 35283 39122 41688 48879 47764 62776 63295 62478 62400
7 Mahabubnagar 17507 21028 20896 23875 25294 27784 29672 32296 35038 37216
8 Nalgonda 20274 22771 24181 30395 35369 33582 35495 39466 40012 42021
9 Warangal 19665 21694 22402 24249 26039 25709 28592 31261 33397 35567
10 Khammam 27258 28503 30484 32645 35497 35836 40246 42832 44833 47973
Telangana 24409 27921 30562 33271 37436 37183 43354 45277 47100 48881
TRE: Third Revised Estimates, SRE: Second Revised Estimates, FRE: First Revised Estimates.Source:Directorate of Economics and Statistics, Hyderabad.

172Socio Economic Outlook 2015
16. Land Utilisation Particulars
(Area in Lakh Hectares)
Year Forest
Bar-ren & Uncul-tivable Land
Land put to Non Agri-
cultural Uses
Perma-nent
Pastures and
Other Grazing Lands
Misc.Tree
Crops and
Groves not
included in Net Area Sown
Cultur- able
Waste
Other Fallow Lands
Current Fallow
Net Area Sown
Geo-graphi-cal Area
1 2 3 4 5 6 7 8 9 10 11
2008-09 27.43 6.26 8.19 3.09 1.16 1.71 7.88 16.79 42.33 114.84
2009-10 27.43 6.18 8.24 3.08 1.16 1.70 8.08 19.38 39.59 114.84
2010-11 27.43 6.17 8.71 3.03 1.14 1.67 7.80 13.97 44.92 114.84
2011-12 27.43 6.17 8.82 3.02 1.14 1.65 8.26 12.36 45.99 114.84
2012-13 27.43 6.17 8.86 3.02 1.14 1.74 7.91 12.03 46.54 114.84
2013-14 27.43 6.15 8.95 3.01 1.14 1.78 7.17 9.60 49.61 114.84
Source: Directorate of Economics and Statistics, Hyderabad.

Annexures 173
17. Season wise Rainfall
(Rainfall in mm.)
Sl.No YearSouth-west Monsoon (June to Septemeber)
North-east Monsoon (October to December)
Normal 764 98
1 1984-85 570 99
2 1985-86 585 117
3 1986-87 704 62
4 1987-88 594 285
5 1988-89 1242 41
6 1989-90 1089 43
7 1990-91 869 181
8 1991-92 736 64
9 1992-93 639 114
10 1993-94 611 132
11 1994-95 577 212
12 1995-96 671 321
13 1996-97 740 129
14 1997-98 506 167
15 1998-99 813 185
16 1999-00 641 45
Normal 715 129
17 2000-01 875 24
18 2001-02 609 140
19 2002-03 508 89
20 2003-04 693 109
21 2004-05 487 76
22 2005-06 820 172
23 2006-07 734 64
24 2007-08 737 60
25 2008-09 755 39
26 2009-10 506 116
27 2010-11 903 151
28 2011-12 608 27
29 2012-13 713 144
30 2013-14 852 243
31 2014-15 495 54
Source: Directorate of Economics and Statistics, Hyderabad.

174Socio Economic Outlook 2015
18. Source–wise Gross Irrigated Area
(Area in Lakh Hectares)
Sl. No Year Canals Tanks Wells Others Total
1 2 3 4 5 6 7
1 2007-08 3.43 2.15 18.23 0.65 24.46
2 2008-09 3.74 2.86 19.81 0.80 27.21
3 2009-10 1.69 0.67 18.42 0.53 21.31
4 2010-11 5.04 3.05 21.11 0.79 29.99
5 2011-12 4.32 2.08 21.57 0.68 28.65
6 2012-13 1.21 1.79 22.07 0.50 25.57
7 2013-14 4.7 2.83 23.36 0.75 31.64
8 2014-15 (Kharif) 1.56 0.9 12.16 0.36 14.98
Source: Directorate of Economics and Statistics, Hyderabad.
19. Source-wise Net Irrigated Area (Area in lakh hectares)
Sl. No. Year Canals Tanks Wells Others Total
1 2 3 4 5 6 7
1 2007-08 2.22 1.62 13.14 0.51 17.49
2 2008-09 2.74 2.38 13.10 0.60 18.82
3 2009-10 1.37 0.57 12.59 0.40 14.93
4 2010-11 3.16 2.38 13.96 0.55 20.05
5 2011-12 3.25 1.83 14.23 0.54 19.85
6 2012-13 0.90 1.58 14.86 0.40 17.74
7 2013-14 2.90 2.30 17.12 0.57 22.89
8 2014-15(kharif) 1.56 0.9 12.05 0.36 14.87
Source: Directorate of Economics and Statistics, Hyderabad.

Annexures 175
20. Area and Production of Food grains
Sl. No.
YearArea
(Lakh Hects)
Production (Lakh Tonnes)
Sl.No. YearArea
(Lakh Hects)Production
(Lakh Tonnes)
1 1955-56 35.35 13.78 31 1985-86 34.64 32.23
2 1956-57 36.52 14.54 32 1986-87 32.02 29.11
3 1957-58 35.64 16.60 33 1987-88 34.93 36.78
4 1958-59 37.28 22.03 34 1988-89 35.39 43.42
5 1959-60 37.85 21.48 35 1989-90 35.32 48.43
6 1960-61 35.92 19.28 36 1990-91 34.10 48.20
7 1961-62 40.50 25.60 37 1991-92 32.33 43.21
8 1962-63 40.06 23.04 38 1992-93 28.39 39.08
9 1963-64 39.69 23.63 39 1993-94 28.03 39.90
10 1964-65 38.84 24.75 40 1994-95 27.76 41.60
11 1965-66 37.92 21.73 41 1995-96 27.73 39.78
12 1966-67 38.25 22.80 42 1996-97 30.56 53.05
13 1967-68 39.01 25.66 43 1997-98 25.90 35.26
14 1968-69 37.80 19.92 44 1998-99 32.47 60.94
15 1969-70 41.15 26.66 45 1999-00 30.77 52.47
16 1970-71 42.12 26.75 46 2000-01 33.39 64.63
17 1971-72 37.39 21.17 47 2001-02 29.64 55.31
18 1972-73 38.07 19.30 48 2002-03 26.67 39.48
19 1973-74 43.17 32.68 49 2003-04 29.93 57.99
20 1974-75 41.92 33.70 50 2004-05 24.97 41.68
21 1975-76 43.79 35.77 51 2005-06 31.31 75.29
22 1976-77 39.82 30.20 52 2006-07 30.81 65.21
23 1977-78 40.34 33.83 53 2007-08 30.09 81.34
24 1978-79 43.87 41.15 54 2008-09 31.72 82.48
25 1979-80 38.41 34.32 55 2009-10 26.49 51.90
26 1980-81 38.71 37.09 56 2010-11 34.44 92.60
27 1981-82 41.61 42.37 57 2011-12 31.09 75.01
28 1982-83 40.31 43.46 58 2012-13 28.36 82.42
29 1983-84 41.79 41.15 59 2013-14 34.56 107.49
30 1984-85 36.38 32.08 60 2014-15 (Kharif)
18.05 44.30
Source: Directorate of Economics and Statistics, Hyderabad.

176Socio Economic Outlook 2015
21. National Agriculture Insurance Scheme
Sl.No.
Year Season Farmers (Lakh)
Area (Ha.)
Sum In-sured (Rs.)
Full Premium
(Rs.)
Premium Subsidy
(Rs.)
Claim (Rs)
No. of Farmers Benifi ted
1 2 3 4 5 6 7 8 9 10
1 2000-01 Kharif 5.99 7.29 49762.63 1709.17 615.22 864.26 43579Rabi 1.2 1.61 11458.15 182.88 60.46 29.53 2600
2 2001-02 Kharif 5.28 6.65 50023.93 1585.74 477.08 1399.33 40128Rabi 1.1 1.53 11315.58 184.57 50.92 61.47 8319
3 2002-03 Kharif 5.04 6.54 52159.81 1464.95 328.73 5281.41 173024Rabi 0.69 1.08 7673.79 156.82 31.35 256.69 16098
4 2003-04 Kharif 3.75 5.7 44083.79 1203.85 174.62 261.04 12143Rabi 1.29 2.2 16642.58 325.15 42.24 279.44 19444
5 2004-05 Kharif 7.69 10.89 93855.73 2738.86 203.72 4120.16 192510Rabi 1.21 2.06 16377.25 334.3 22.98 362.4 15664
6 2005-06 Kharif 5.86 9.39 84136.88 2894.96 212.36 304.71 18365Rabi 1.48 2.18 23349.54 471.78 33.26 24.22 2090
7 2006-07 Kharif 5.55 8.28 94214.82 2970.58 214.2 1159.78 46861Rabi 1.27 2.4 23894.95 493.19 33.67 177.77 5316
8 2007-08 Kharif 5.99 9.39 115565.01 3525.31 257.68 47.25 2392Rabi 1.12 2.01 23717.33 492.5 34.21 23.21 1274
9 2008-09 Kharif 5.1 8 92167.04 3258.11 242.31 2223.14 77247Rabi 1.98 3.24 41266.87 896.57 67.03 44.04 2917
10 2009-10 Kharif 11.57 16.17 240194 7959.8 591.32 18053.22 313521Rabi 1.59 2.55 41047.14 878.45 61.67 1050.56 38920
11 2010-11
KharifNAIS 5.6 8.03 158393.92 4844.57 364.89 1562.96 38626WBCIS 1.2 1.23 33385.61 1606.24 3272.48 987.2 54820Rabi NAIS 1.85 2.98 60039.76 1292.81 93.08 343.67 12214 WBCIS 0.0009 0.0024 121.72 7.3 14.61 20.68 88MNAIS 0.23 0.23 6599.03 83.8 363.21 25.58 891
12 2011-12
KharifNAIS 7.07 10.85 197574.69 6063.38 439.02 10976.46 190543WBCIS 1.12 1.18 38683.67 3790.36 3790.35 4287.92 97388MNAIS 0.18 0.23 6059.26 294.06 173.61 211.36 4106Rabi NAIS 3.45 5.81 133783.69 2744.75 188.19 9160.92 159303WBCIS 0.04 0.05 2908.79 334.51 83.62 290.48 2641MNAIS 0.13 0.21 7783.14 211.62 27.96 291.48 2543
13 2012-13
KharifNAIS 6.64 9.53 243396.91 7068.76 151.44 534.17 15612WBCIS 1.47 1.56 50363.18 1234.1 4936.39 6109.46 136003Rabi NAIS 1.81 2.71 80981.67 1644.4 118.54 1028.74 26406WBCIS 0.02 0.03 1846.04 52.61 210.44 104.29 953MNAIS 0.96 0.11 4504.38 146.76 56.48 124.11 1357
14 2013-14
KharifWBCIS 1.09 1.21 38679.99 947.77 509.22 2984.7 83401RabiMNAIS 0.09 0.11 5450.62 2351.38 46.83 178.64 1955
Source: Commissioner of Agriculture, Hyderabad.

Annexures 177
22. Area and Production of Horticulture Crops 2013-14
Sl. No. Crop Area (Ha.) Production
(MTs)Sl.
No. Crop Area (Ha.) Production (MTs)
AromaticA Fruits C Flowers Category
Banana 18825 658888 Chrysanthemum 3498 17490Mango 200553 1804979 Gladious (Lakh Nos) 20 5Citrus Jasmine 1053 5264Lime/Lemon 33938 339377 Marigold 1514 12109Orange 139020 1390205 Rose 1025 3076Sub Total 392337 4193450 Tube Rose 53 317Custard Apple 3845 23070 Crossandera 453 1360Grapes 1043 21899 Others 790 3159Guava 7615 76149 Total 8406 42780Papaya 3711 185570 D Plantation CropsPomegranate 977 14652 Cashewnut 14112 70560Sapota 3146 25170 Coconut 3522 528Others 13425 134249 Oilpalm 6654 119777Sub Total 33762 480758 Total 24288 190865Total Fruits 426099 4674208 E Spices
B Vegetables Ajwan 3216 3216Beans 3994 31951 Chillies(Dried) 106570 319709Bhendi 43022 430222 Coriander 5343 10686Bottlegourd 8502 170036 Garlic 2451 6126Brinjal 31891 478369 Ginger 4672 93431Cabbage 3431 51461 Tamarind 95 762Carrot 8944 107326 Turmeric 149001 894006Cucumber 4807 96142 Total 271348 1327936
Onion 41332 743977 F Medicinal & Aromatic Plants
Peas 835 6681 Palm Rosa 17 33Annota 116 231
Potato 8427 168547 Lemon Grass 219 438Citronella 79 158
Tomato 158746 2381192 Amla 1825 9127Coleus 105 209
Others 33361 333614
Other Medicinal Plants 5710 11420Total 347293 4999519 Total 8071 21616
Grand Total 1085505 11256924
Source: Commissioner of Horticulture, Hyderabad.

178Socio Economic Outlook 2015
23.Potential and Status of Micro Irrigation.
24: Targets and Achievements of Animal Husbandry
Sl.No. DistrictGround Water Net Irrigated
Area (Ha)
Area covered under Micro Irrigation from 2003-04 to 2013-14 (Ha) Balance Poten-
tial Area (Ha)Drip Sprinkler Total
1 2 3 4 5 6 7 (Col.3-6)
1 Adilabad 60960 16703 17301 34004 26956
2 Karimnagar 311116 28260 9611 37871 273245
3 Nizamabad 169570 25099 6321 31420 138150
4 Khammam 94049 24039 9481 33520 60529
5 Warangal 256866 33512 9086 42598 214268
6 Nalgonda 185611 76949 9383 86332 99279
7 Medak 130517 47538 19335 66873 63644
8 Mahabubnagar 205217 80059 31642 111701 93516
9 Rangareddy 71942 23516 11928 35444 36498
Total 1485848 355675 124088 479763 1006085Source: Commissioner of Horticulture, Hyderabad.
Sl. No Item UnitAnnual Target
2014-15
2014-15 (up to Dec' 2014)
Target Achievement
1 Milk Production In '000 Mts. 4238.00 2330.90 2354.32
2 Meat Production In '000 Mts. 515.00 283.25 294.07
3 Egg Production In million Nos. 10600.00 6148.00 6248.00
4 Treatment of Animals Lakh Nos. 505.90 448.53 401.66
5 Castrations Lakh Nos. 2.72 2.05 2.24
6 Vaccinations Lakh Nos. 482.72 322.55 325.94
7 Artifi cial Inseminations(Excluding Gopalamitra)
Lakh Nos. 8.49 5.80 4.25
8 Calf Births (Excluding Gopalamitra)
Lakh Nos. 1.78 1.78 1.77
9 Fodder Development Lakh Acres 3.87 2.93 2.69
Source:Director of Animal Husbandary, Hyderabad.

Annexures 179
25. Fish and Prawn Production
26: District wise Geographical Area and Forest Area
(in MTs)
Year Freshwater Fish Production
Freshwater Prawn Production
Total
2006-07 604311 2221 606532
2007-08 688301 2296 690597
2008-09 149049 2242 151291
2009-10 133613 2008 135621
2010-11 133587 2206 135793
2011-12 196708 3774 200482
2012-13 214591 5037 219628
2013-14 243037 6596 249633
2014-15 (up to Dec., 2014) 163348 5621 168969
Source: Director of Fisheries, Hyderabad.
District Geographical Area(in Sq.Kms.)
Forest Area(in Sq.Kms.)
% of Forest Area to Geographical Area
Khammam* 16029 8436.94 52.64
Adilabad 16128 7231.89 44.84
Warangal 12847 3710.14 28.88
Nizamabad 7956 1812.15 22.78
Karimnagar 11823 2544.83 21.52
Mahabubnagar 18432 3032.51 16.45
Hyderabad & Rangareddy 7710 730.75 9.75
Medak 9700 905.94 9.34
Nalgonda 14240 836.93 5.88
Telangana 114865 29242.08 25.46
*Include the total area of Khammam District. Source: Chief Conservator of Forests, Hyderabad.

180Socio Economic Outlook 2015
27: Revenue collected from Forest Produce
(Rs. Lakh)
Sl. No. Item 2012-13 2013-142014-15
(up to Dec., 2014)
1 2 3 4 5
1 Timber 2351.551 1970.390 1045.367
2 Bamboo 1090.535 862.786 318.925
3 Firewood & Charcoal 23.589 34.308 19.254
4 Other Forest Produce 1.805 1.819 1.702
5 Beedi Leaves 4.137 0.000 0.000
6 Teak Plants 73.500 441.662 170.987
7 Cashew Plants 2.020 6.260 0.000
8 Red Sanders 0.000 2572.791 0.000
9 Other Plants 0.260 0.000 0.579
10 Thinnings 0.000 0.000 0.000
11 Miscellaneous 7902.841 8938.222 3859.030
Total 11450.238 14828.238 5415.844
Source:Chief Conservator of Forests, Hyderabad.

Annexures 181
28: Sanctuaries, Tiger Reserves, National Parks, Zoo Parks
Sl. No. Name District Area in Sq. Kms
Wildlife Sanctuaries & National Parks
1 Kawal WLS Adilabad 892.23
(Kawal Tiger Reserve)
2 Pranahita WLS Adilabad 136.02
3 Siwaram WLS Adilabad & Karimnagar 29.81
4 Eturinagaram WLS Warangal 803.00
5 Pakhal WLS Warangal 860.20
6 Kinnerasani WLS Khammam 635.40
7 Manjira WLS Medak 20.00
8 Pocharam WLS Medak & Nizamabad 129.84
9 Amarabad WLS (NSTR) Mahabubnagar & Nalgonda 2166.37
10 KasuBrahmananda Reddy NP Hyderabad 1.42
11 Mrugavani NP Rangareddy 3.60
12 MahavirHarinaVanasthali NP Rangareddy 14.59
Total 5692.48
Tiger Reserve
1 Kawal Tiger Reserve Adilabad 2015.44
2 Amrabad Tiger Reserve (NSTR) Mahabubnagar & Nalgonda 2611.39
Total 4626.83
Zoological Parks
1 Nehru Zoological Park Hyderabad 1.52
2 VanaVignanKendhram (Mini Zoo) Warangal 0.19
Total 1.71
Deer Parks
1 Jawaharlal Nehru Tourist Complex, (JLTC) Rangareddy (Shamirpet) 0.26
2 Pillalamarri Deer Park Mahabubnagar 0.06
3 Kinnerasani Deer Park Khammam (Paloncha) 0.15
4 LMD Deer Park Karimnagar 0.13
Total 0.60
Source: Chief Conservator of Forests, Hyderabad.

182Socio Economic Outlook 2015
29.District-wise Number of Large Industries
Sl.No. District 2008-09 2009-10 2010-11 2011-12 2012-13 2013-14 2014-152008-09 to
2014-15
1 Adilabad 1 - 1 - - - - 2
2 Nizamabad - - - 1 - - - 1
3 Karimnagar 1 - 1 - - - - 2
4 Medak 11 4 10 8 8 4 9 54
5 Hyderabad - - - - - - - 0
6 Rangareddy 25 15 11 6 10 2 4 73
7 Mahabubnagar 3 5 3 4 4 4 8 31
8 Nalgonda 4 4 6 3 1 6 24
9 Warangal - - - - - - 1 1
10 Khammam 1 1 1 1 - 1 2 7
Total 46 29 33 23 23 11 30 195
District-wise Investment (Rs.Crore) in Large Industries
Sl.No. District 2008-09 2009-10 2010-11 2011-12 2012-13 2013-14 2014-152008-09 to
2014-15
1 Adilabad 316.31 - 604.52 - - - - 920.83
2 Nizamabad - - - 11.44 - - - 11.44
3 Karimnagar 10.52 51.06 42.55 - - - - 104.13
4 Medak 298.69 172.34 1194.38 745.72 586.04 209.14 192.07 3398.38
5 Hyderabad - - - - - - - 0.00
6 Rangareddy 1017.05 549.87 1253.59 373.31 788.32 48.70 903.54 4934.38
7 Mahabubnagar 86.35 216.35 68.54 272.94 251.85 307.03 709.86 1912.92
8 Nalgonda 946.74 1251.88 297.77 250.62 523.00 - 59.89 3329.90
9 Warangal - - - - - - 71.76 71.76
10 Khammam 16.18 459.00 157.82 2536.81 - 509.25 1130.20 4809.26
Total 2691.84 2700.50 3619.17 4190.84 2149.21 1074.12 3067.32 19493.00
District-wise Number of Employees in Large Industries
Sl.No. District 2008-09 2009-10 2010-11 2011-12 2012-13 2013-14 2014-152008-09 to
2014-15
1 Adilabad 703 - 437 - - - - 1140
2 Nizamabad - - - 40 - - - 40
3 Karimnagar 120 75 350 - - - - 545
4 Medak 1634 1001 3617 2266 1942 904 836 12200
5 Hyderabad - - - - - 0
6 Rangareddy 5466 2746 2108 2735 5790 120 3289 22254
7 Mahabubnagar 444 648 966 885 600 638 888 5069
8 Nalgonda 718 783 553 609 295 - 416 3374
9 Warangal - - - - - - 10 10
10 Khammam 96 75 50 1118 - 50 236 1625
Total 9181 5328 8081 7653 8627 1712 5675 46257
Source: Commissioner of Industries, Hyderabad.

Annexures 183
30. District-wise Number of Micro, Small and Medium Enterprises
Sl.No.
District2001-
052005-
062006-
072007-
082008-
092009-
102010-
112011-
122012-
132013-
142014-
15
2000-01 to 2014-
15
1 Adilabad 24 22 29 49 68 135 103 171 12 145 86 8442 Nizamabad 115 18 33 50 36 131 421 268 220 413 216 19213 Karimnagar 155 27 47 127 88 143 421 311 68 101 117 16054 Medak 421 89 69 236 280 424 523 493 98 112 297 30425 Hyderabad 802 137 262 390 422 507 924 510 689 814 554 60116 Rangareddy 1567 330 650 1376 1385 732 1780 2435 2860 3865 1958 189387 Mahabubnagar 149 15 36 97 119 174 327 303 294 387 204 21058 Nalgonda 295 22 62 114 224 119 278 409 423 332 144 24229 Warangal 127 21 32 83 93 218 317 352 331 327 194 209510 Khammam 152 50 99 123 113 176 280 309 130 348 131 1911
Total 3807 731 1319 2645 2828 2759 5374 5561 5125 6844 3901 40894
District-wise Investment (Rs.Lakh) in Micro, Small and Medium Enterprises
Sl.No.
District2001-
052005-
062006-
072007-
082008-
092009-
102010-
112011-
122012-
132013-
14
2014-15 (up to Jan.15)
2000-01 to 2014-15
1 Adilabad 224 282 604 676 2594 4305 5126 8062 1491 6972 3549 338852 Nizamabad 475 124 2911 3656 8251 3662 9251 7486 6461 13807 10654 667383 Karimnagar 980 182 1219 2299 3893 6115 14586 13643 4257 6301 6541 600164 Medak 8084 2525 8779 21257 47681 139386 46882 69843 12405 15118 35135 4070945 Hyderabad 2127 926 4049 8540 13291 11083 59854 20415 24573 26474 19047 1903796 Rangareddy 12642 2019 27253 72242 47011 248144 153568 125042 146549 169609 84461 10885407 Mahabubnagar 1449 306 1804 5398 7166 9827 11305 15804 22815 23807 14796 1144768 Nalgonda 1976 419 3622 8579 13972 18531 15418 22865 26013 23713 9335 1444439 Warangal 849 200 1856 5970 4476 9622 10101 10397 13443 13407 9025 7934710 Khammam 2301 1404 3242 7161 7581 6940 4011 9788 9391 11933 3391 67143
Total 31107 8387 55339 135777 155915 457616 330102 303345 267399 311141 195934 2252063
District-wise Number of Employees in Micro, Small and Medium Enterprises
Sl.No.
District2001-
052005-
062006-
072007-
082008-
092009-
102010-
112011-
122012-
132013-
142014-
15
2000-01 to 2014-
15
1 Adilabad 355 326 420 1046 1190 1486 1187 1389 204 1180 657 94402 Nizamabad 1182 141 460 848 420 971 1981 1481 984 2072 1210 117503 Karimnagar 2296 224 536 1693 1130 1445 1909 3781 878 1133 1012 160374 Medak 10053 1221 1691 7097 8739 10324 9310 9311 1789 2249 4430 662145 Hyderabad 6668 1395 2517 5249 8299 7958 13643 7964 14207 11382 6458 857406 Rangareddy 19553 3470 9566 24955 23568 14529 25992 41764 39943 51752 24511 2796037 Mahabubnagar 1596 80 785 1727 2394 2763 2723 2130 4181 4665 2210 252548 Nalgonda 5272 300 1277 2714 5441 3856 3016 4674 4862 4553 1625 375909 Warangal 927 215 472 1199 1040 2129 2163 2290 2539 2163 1882 1701910 Khammam 2018 150 1240 1603 1625 1974 1590 2493 1583 2068 505 16849
Total 49920 7522 18964 48131 53846 47435 63514 77277 71170 83217 44500 565496
Source: Commissioner of Industries, Hyderabad.

184Socio Economic Outlook 2015
31. Production and Value of Minerals in 2014-15 (up to Dec., 2014)
Sl.No. Mineral Unit Production Value (Rs.'000)
A.Major Minerals
1 Amethyst Quartz Tonnes 100 1331.00
2 Barytes Tonnes 8956 37327.64
3 Coal Tonnes 35014317 60362231.93
4 Dolomite Tonnes 425978 137533.94
5 Feldspar Tonnes 464534 116016.94
6 Fire Clay Tonnes 34 8.29
7 Iron Ore/Hematite Tonnes 35000 17293.47
8 Latarite Tonnes 1748460 243846.30
9 Lime Stone Tonnes 16528151 2390382.82
10 Manganese Ore Tonnes 5557 7306.38
11 Quartz Tonnes 410479 89288.06
12 Shale Tonnes 95500 8824.81
13 Stowing Sand Tonnes 2582196 248653.17
14 White Clay Tonnes 67076 6627.40
Total 63666672.16
B. Minor Minerals
1 B.Granite M3 242831 10288452.08
2 C. Granite M3 621165 16570595.03
3 Gravel / Earth M3 11851738 3381439.13
4 Fuller's Earth Tonnes 312990 267899.10
5 L. Stone Slabs M2 1954735 836582.14
6 Limekankar Tonnes 336 185.02
7 Mosaic Chips Tonnes 20950 13149.93
8 Road Metal M3 16505452 11773155.92
9 Ordinary Sand M3 2030027 791189.77
Total 43922648.13
Grand total 107589320.30
Source:Director, Mines & Geology, Hyderabad.

Annexures 185
32 . District-wise, Mineral Revenue Collection during 2014-15 (up to Dec., 2014)
(Rs. Lakh)
Sl. No.
DistrictTarget2014-15
Major Mineral Minor Minerals Total
Target Achieve-ment Target Achieve-
ment Target Achieve-ment
1 Mahabubnagar 4038.31 274.78 271.06 2457.35 1223.36 2746.05 1494.42
2 Rangareddy 13962.07 3252.87 2547.66 6169.94 3911.43 9494.21 6459.09
3 Medak 2499.76 42.23 32.09 1650.28 1730.98 1699.84 1763.07
4 Nizamabad 2103.73 42.08 21.88 1382.23 897.95 1430.54 919.83
5 Adilabad 5778.74 2658.97 2162.23 1227.75 1166.02 3929.54 3328.25
6 Karimnagar 21844.71 754.55 525.15 14031.94 12246.93 14854.40 12772.08
7 Warangal 5455.64 362.89 323.23 3328.23 2984.66 3709.84 3307.89
8 Khammam 6010.31 497.83 303.17 3567.57 2435.30 4087.01 2738.47
9 Nalgonda 20606.73 9747.07 7094.01 4110.15 2290.48 14012.58 9384.49
Sub Total 82300.00 17633.26 13280.48 37925.46 28887.11 55964.00 42167.59
Coal 146500.00 108250.00 89308.09 0.00 0.00 108250.00 89308.09
*Cess on Others 1225.00 598.10 437.66 219.15 186.43 817.24 624.09
Total 230025.00 126481.35 103026.23 38144.61 29073.54 164625.96 132099.77
Source:Director, Mines & Geology, Hyderabad.
33. District-Wise Bank Branches as on 30-09-2014
Sl.No. District No. of Bank
Branches Deposits
(Rs. Crore)Advances
(Rs. Crore)Credit-Deposit
Ratio
1 Adilabad 239 6196 5392 87.03
2 Nizamabad 325 6016 7383 122.72
3 Karimnagar 408 11011 8296 75.35
4 Medak 291 7334 9268 126.37
5 Hyderabad 1102 179246 226866 126.57
6 Rangareddy 923 58976 44453 75.37
7 Mahabubnagar 362 5892 7547 128.09
8 Nalgonda 372 6017 9248 153.71
9 Warangal 332 8959 8536 95.28
10 Khammam 328 7775 7967 102.47
Total 4682 297422 334957 112.62
Source: 5th Meeting of State Level Bankers Committee Report, Hyderabad.

186Socio Economic Outlook 2015
34. Population from 1961 to 2011
Sl. No. District 1961 1971 1981 1991 2001 2011
1 2 3 4 5 6 7 8
1 Adilabad 10,09,292 12,88,348 16,39,003 20,82,479 24,88,003 27,41,239
2 Nizamabad 10,22,013 13,13,268 16,79,683 20,37,621 23,45,685 25,51,335
3 Karimnagar 16,21,515 19,63,928 24,36,323 30,37,486 34,91,822 37,76,269
4 Medak 12,27,361 14,67,944 18,07,139 22,69,800 26,70,097 30,33,288
5 Hyderabad 20,62,995 27,91,762 22,60,702 31,45,939 38,29,753 39,43,323
6 Rangareddy Not Formed 15,82,062 25,51,966 35,75,064 52,96,741
7 Mahabubnagar 15,90,686 19,32,082 24,44,619 30,77,050 35,13,934 40,53,028
8 Nalgonda 15,74,946 18,19,738 22,79,685 28,52,092 32,47,982 34,88,809
9 Warangal 15,45,435 18,70,933 23,00,295 28,18,832 32,46,004 35,12,576
10 Khammam 10,57,542 13,69,892 17,51,574 22,15,809 25,78,927 27,97,370
Telangana 1,27,11,785 1,58,17,895 2,01,81,085 2,60,89,074 3,09,87,271 3,51,93,978
India 43,92,34,771 54,81,59,652 68,33,29,097 84,64,21,039 102,86,10,328 121,05,69,573
Source: Registrar General of Census, Government of India.

Annexures 187
35. Percentage Decadal Variation of Population and Sex Ratio
Sl. No.
District Decadal Variation (%)Sex Ratio
(No. of Females per 1000 Males)
1961-71 1971-81 1981-91 1991-01 2001-11 1961 1971 1981 1991 2001 2011
1 2 3 4 5 6 7 8 9 10 11 12 13
1 Adilabad 27.65 27.32 26.95 19.47 10.18 981 976 980 980 989 1001
2 Nizamabad 29.01 27.90 21.31 15.12 8.77 1007 999 1013 1017 1017 1040
3 Karimnagar 21.12 24.05 24.68 14.96 8.15 996 985 994 986 998 1008
4 Medak 19.10 23.11 25.60 17.64 13.60 996 986 982 970 974 992
5 Hyderbad 41.17 33.81 39.76 21.74 2.97 953 936 920 933 933 954
6 Rangareddy 27.50 43.47 60.32 40.09 48.16 - - 956 941 944 961
7 Mahabubnagar 21.46 26.53 25.87 14.20 15.34 1003 988 983 973 972 977
8 Nalgonda 16.82 25.28 25.11 13.88 7.41 950 965 969 962 966 983
9 Warangal 21.06 22.95 22.54 15.15 8.21 954 956 964 962 973 997
10 Khammam 29.54 27.86 26.50 16.39 8.47 958 957 957 961 975 1011
Telangana 24.43 27.58 29.27 18.77 13.58 975 961 971 967 971 988
India 24.80 24.66 23.85 21.54 17.69 941 930 934 927 933 943
Source: Registrar General of Census, Government of India.
36. Percentage of Urban Population to Total Population and Density of Population
Sl. No.
DistrictPercentage of Urban Population
to Total PopulationDensity of Population (Persons per Sq. Km.)
1971 1981 1991 2001 2011 1961 1971 1981 1991 2001 2011
1 2 3 4 5 6 7 8 9 10 11 12 13
1 Adilabad 15.92 19.34 23.13 26.53 27.73 62 80 102 129 154 170
2 Nizamabad 15.94 19.21 20.27 18.11 23.06 127 165 211 256 295 321
3 Karimnagar 10.72 15.79 20.55 19.44 25.19 136 166 206 257 295 319
4 Medak 8.51 11.97 14.47 14.36 24.00 129 152 186 234 275 313
5 Hyderabad 65.88 100.00 100.00 100.00 100.00 266 362 10418 14499 17649 18,172
6 Rangareddy - 23.83 47.23 54.20 70.22 - - 211 340 477 707
7 Mahabubnagar 8.97 10.93 11.12 10.57 14.99 86 105 133 167 191 220
8 Nalgonda 6.69 11.38 11.87 13.32 18.99 111 128 160 200 228 245
9 Warangal 13.43 17.24 19.39 19.20 28.25 120 145 179 219 253 273
10 Khammam 13.59 16.98 20.23 19.81 23.45 67 86 109 138 161 175
Telangana 20.99 25.27 30.18 31.79 38.67 111 138 176 227 270 307
INDIA 17.98 19.51 22.87 25.49 31.15 144 177 216 273 325 368
Source: Registrar General of Census, Government of India.

188Socio Economic Outlook 2015
37. Literacy Rates (Percentage of Litertes to Population age of 7 years and above)
Sl. No.
District 1961 1981 2001 2011
Males Fe-males
Total Males Fe-males
Total Males Fe-males
Total Males Fe-males
Total
1 2 3 4 5 6 7 8 9 10 11 12 13 14
1 Adilabad 18.76 4.54 11.72 27.81 9.58 18.79 64.98 40.30 52.68 70.81 51.31 61.01
2 Nizamabad 22.98 5.73 14.33 31.89 11.70 21.73 64.91 39.48 52.02 71.47 51.54 61.25
3 Karimnagar 21.16 4.59 12.89 31.87 11.07 21.50 67.09 42.75 54.90 73.65 54.79 64.15
4 Medak 23.31 4.74 14.05 32.00 10.87 21.53 64.33 38.66 51.65 71.43 51.37 61.42
5 Hyderabad 45.88 23.67 35.05 66.72 49.22 58.33 83.74 73.50 78.80 86.99 79.35 83.25
6 Rangareddy Not Formed 39.09 19.28 29.41 75.26 56.49 66.16 82.11 69.40 75.87
7 Mahabubnagar 21.51 5.44 13.46 28.12 10.56 19.42 56.63 31.89 44.41 65.21 44.72 55.04
8 Nalgonda 22.00 5.80 14.11 31.59 13.00 22.44 69.23 44.68 57.15 74.88 59.15 64.20
9 Warangal 23.72 6.63 15.37 33.12 13.61 23.55 68.88 45.09 57.13 74.58 55.69 65.11
10 Khammam 22.04 8.13 15.23 33.16 17.68 25.59 66.11 47.44 56.89 72.30 57.44 64.81
Telangana 25.91 8.55 17.34 35.90 16.79 26.49 68.80 49.90 58.00 74.95 57.92 66.46
India NA NA 28.30 46.89 24.82 36.23 75.26 53.67 64.84 80.89 64.64 72.99
Source: Registrar General of Census, Government of India

Annexures 189
38. Enrolment of Children in Schools
Sl.No
YearPre
PrimaryI-V
ClassesVI-VII Classes
VIII-X Classes
XI-XII Classes
Total
1 2000-01 201671 3746763 921461 938079 3393 5811367
2 2001-02 275831 3737428 998912 1024986 2956 6040113
3 2002-03 289652 3888456 1081467 1108541 3081 6371197
4 2003-04 290767 3688865 1119506 1201439 3567 6304144
5 2004-05 217362 3577528 1180486 1297082 4171 6276629
6 2005-06 323621 3436306 1256075 1393142 4079 6413223
7 2006-07 423452 3442831 1278285 1466126 3680 6614374
8 2007-08 419329 3358789 1236830 1541091 4035 6560074
9 2008-09 426829 3332610 1193274 1588178 4607 6545498
10 2009-10 255699 3328545 1154606 1583438 11023 6333311
11 2010-11 231939 3297475 1169852 1547789 8801 6255856
12 2011-12 225741 3256509 1195855 1544896 11063 6234064
13 2012-13 231107 3172977 1175147 1534496 15657 6129384
14 2013-14 183223 3206958 1738259 1025861 24194 6178495
15 2014-15 164387 3127777 1719315 1033624 31638 6076741Note:- In 2013-14 enrolment is given for (VI-VIII) and (IX-X) classes instead of (VI-VII) and (VIII-X) classes.Source: Commissioner of School Education, Hyderabad.
39. School Dropout Rates
Year Class I - V Class I - VII Class I - X
Boys Girls Total Boys Girls Total Boys Girls Total
2004-05 37.30 37.06 37.17 54.85 55.73 55.25 61.20 61.86 61.47
2005-06 30.37 30.17 30.27 53.50 54.41 53.93 61.40 62.06 61.69
2006-07 32.81 33.34 33.08 43.38 44.29 43.82 63.03 63.56 63.27
2007-08 26.19 25.28 25.75 36.79 37.66 37.22 65.24 65.31 65.27
2008-09 23.74 22.82 23.29 39.29 40.20 39.74 64.59 64.68 64.63
2009-10 23.45 22.09 22.79 31.95 31.59 31.78 55.90 56.76 56.33
2010-11 25.61 24.20 24.92 29.39 28.06 28.74 48.65 47.77 48.22
2011-12 24.28 23.23 23.77 28.11 25.30 26.74 49.42 49.11 49.27
2012-13 24.28 24.56 24.42 33.98 31.35 32.69 42.71 41.59 42.16
2013-14 22.60 22.02 22.32 33.72 31.34 32.56 39.05 37.33 38.21
2014-15 20.78 20.25 20.52 32.10 30.53 31.34 38.85 36.41 37.66Source: Commissioner of School Education, Hyderabad.

190Socio Economic Outlook 2015
40. District-wise Health Camps conducted under Aarogyasri Healthcare Trust (since inception to 31-01-2015)
Sl. No.
District Health Camps Conducted
Patients Screened Patients Referred
1 Adilabad 1869 376663 11951
2 Hyderabad 1475 438159 7619
3 Karimnagar 1443 343478 10279
4 Khammam 1797 366814 15735
5 Mahabubnagar 1853 384621 14168
6 Medak 1522 332664 10281
7 Nalgonda 1834 335414 10428
8 Nizamabad 1816 421833 17461
9 Rangareddy 1815 364288 10135
10 Warangal 1656 470604 15728
Total 17080 3834538 123785
Source: Arogyasri Helath Care Trust, Hyderabad.


