Embed Size (px)
Citation preview
Telangana State Glimpses of Initiatives & Achievements
March, 2019
1

State Profile
2
TELANGANA STATE
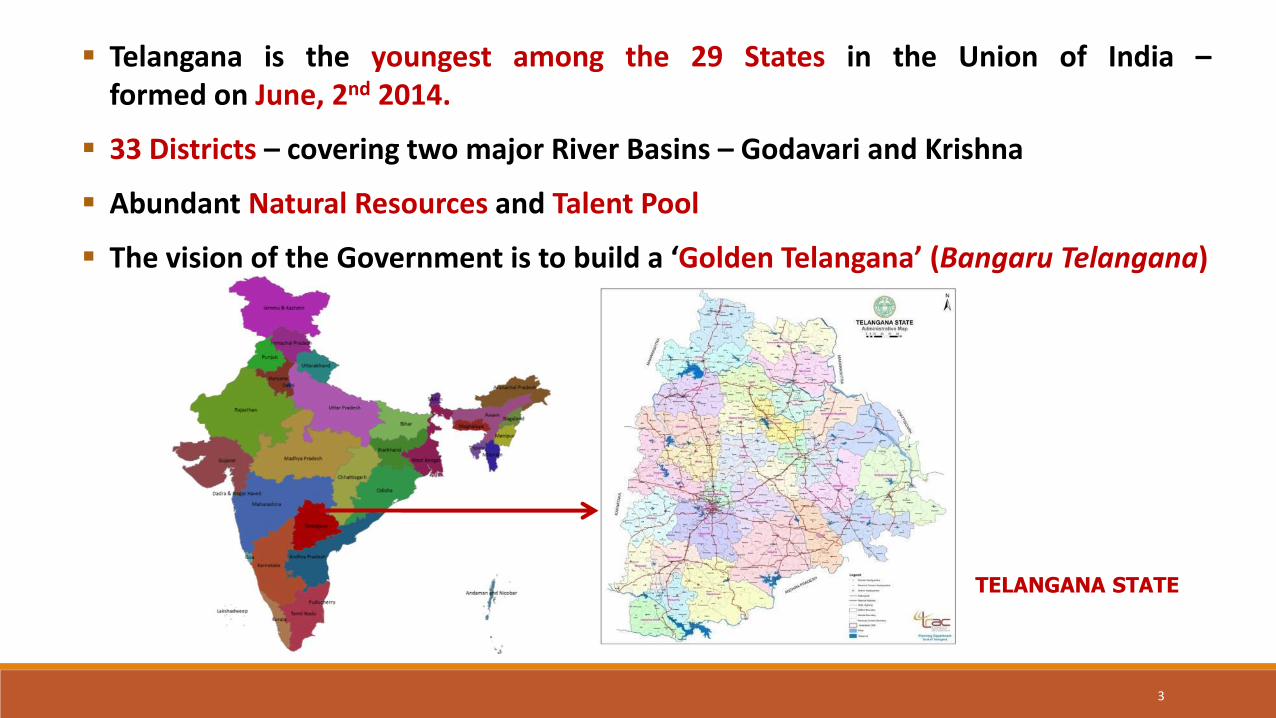
Telangana is the youngest among the 29 States in the Union of India – formed on June, 2nd 2014.
33 Districts – covering two major River Basins – Godavari and Krishna
Abundant Natural Resources and Talent Pool
The vision of the Government is to build a ‘Golden Telangana’ (Bangaru Telangana)
3
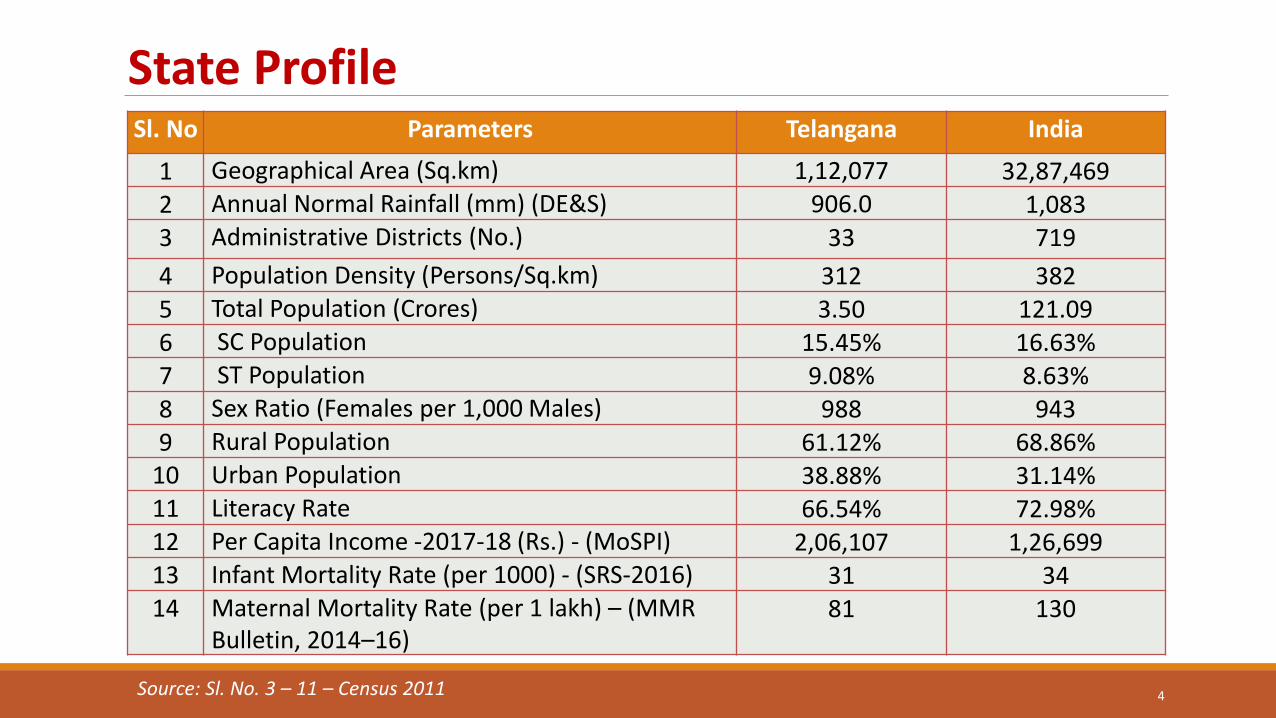
State Profile Sl. No Parameters Telangana India
1 Geographical Area (Sq.km) 1,12,077 32,87,469 2 Annual Normal Rainfall (mm) (DE&S) 906.0 1,083 3 Administrative Districts (No.) 33 719
4 Population Density (Persons/Sq.km) 312 382 5 Total Population (Crores) 3.50 121.09 6 SC Population 15.45% 16.63% 7 ST Population 9.08% 8.63% 8 Sex Ratio (Females per 1,000 Males) 988 943 9 Rural Population 61.12% 68.86%
10 Urban Population 38.88% 31.14% 11 Literacy Rate 66.54% 72.98% 12 Per Capita Income -2017-18 (Rs.) - (MoSPI) 2,06,107 1,26,699 13 Infant Mortality Rate (per 1000) - (SRS-2016) 31 34 14 Maternal Mortality Rate (per 1 lakh) – (MMR
Bulletin, 2014–16) 81 130
4 Source: Sl. No. 3 – 11 – Census 2011
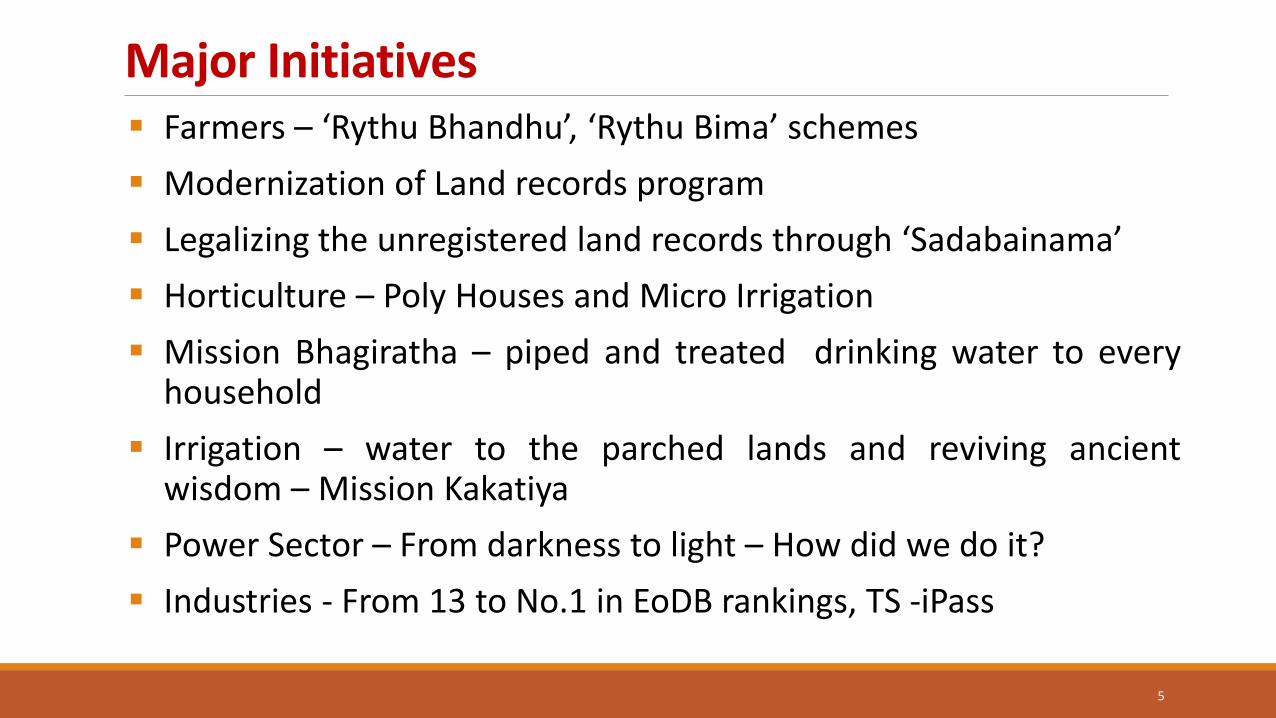
Major Initiatives Farmers – ‘Rythu Bhandhu’, ‘Rythu Bima’ schemes
Modernization of Land records program
Legalizing the unregistered land records through ‘Sadabainama’
Horticulture – Poly Houses and Micro Irrigation
Mission Bhagiratha – piped and treated drinking water to every household
Irrigation – water to the parched lands and reviving ancient wisdom – Mission Kakatiya
Power Sector – From darkness to light – How did we do it?
Industries - From 13 to No.1 in EoDB rankings, TS -iPass
5
Major Initiatives...
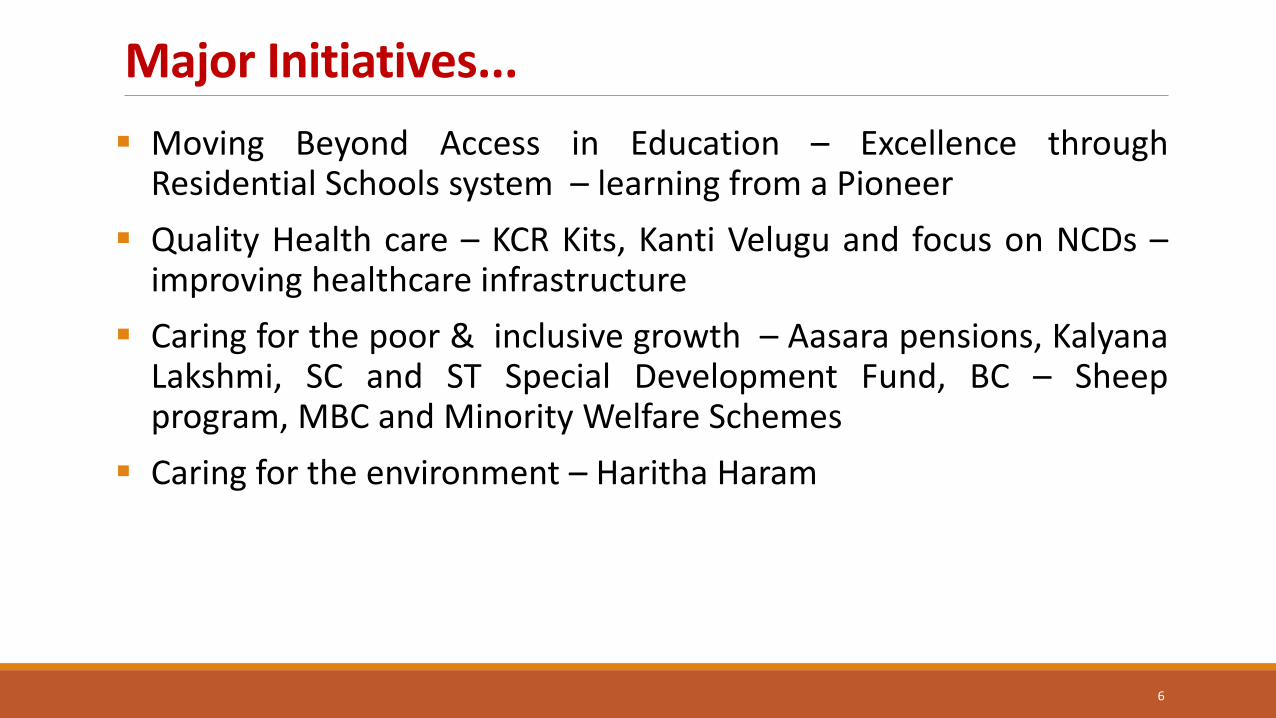
Moving Beyond Access in Education – Excellence through Residential Schools system – learning from a Pioneer
Quality Health care – KCR Kits, Kanti Velugu and focus on NCDs – improving healthcare infrastructure
Caring for the poor & inclusive growth – Aasara pensions, Kalyana Lakshmi, SC and ST Special Development Fund, BC – Sheep program, MBC and Minority Welfare Schemes
Caring for the environment – Haritha Haram
6

Economy
7
Gross State Domestic Product (GSDP) at 2011-12 Constant Prices
8
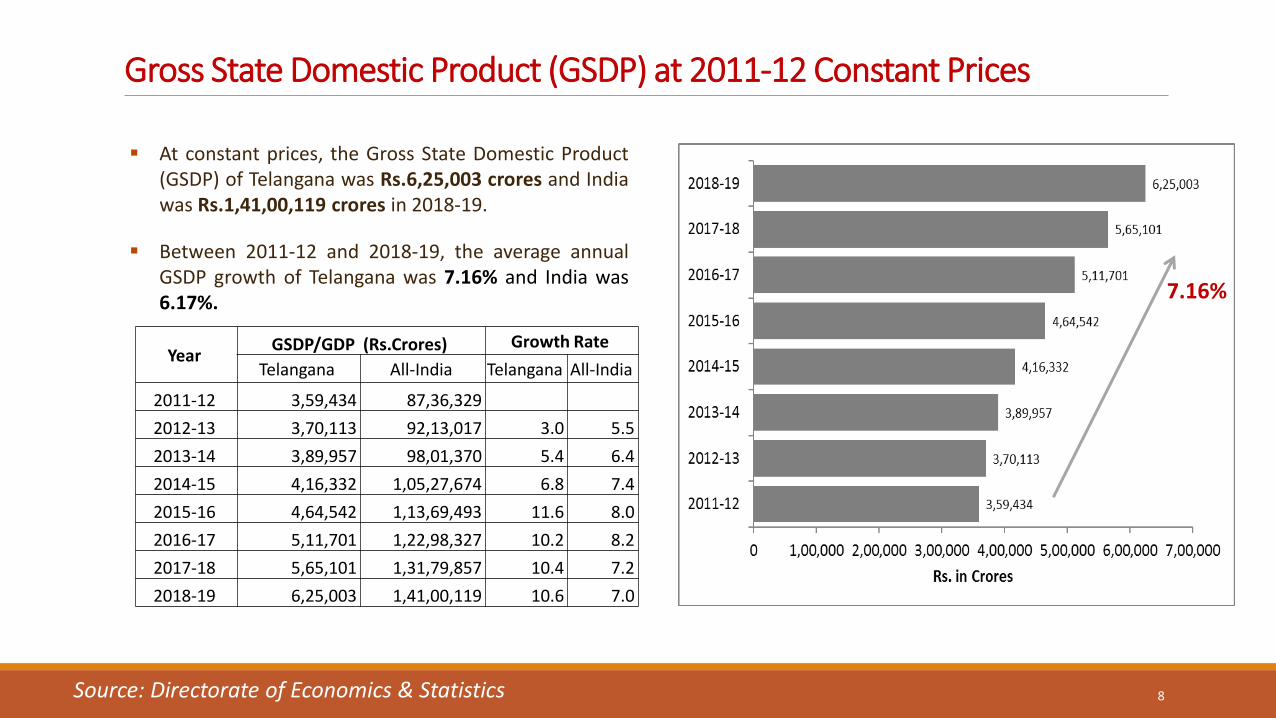
At constant prices, the Gross State Domestic Product (GSDP) of Telangana was Rs.6,25,003 crores and India was Rs.1,41,00,119 crores in 2018-19.
Between 2011-12 and 2018-19, the average annual GSDP growth of Telangana was 7.16% and India was 6.17%.
Year GSDP/GDP (Rs.Crores) Growth Rate
Telangana All-India Telangana All-India
2011-12 3,59,434 87,36,329
2012-13 3,70,113 92,13,017 3.0 5.5
2013-14 3,89,957 98,01,370 5.4 6.4
2014-15 4,16,332 1,05,27,674 6.8 7.4
2015-16 4,64,542 1,13,69,493 11.6 8.0
2016-17 5,11,701 1,22,98,327 10.2 8.2
2017-18 5,65,101 1,31,79,857 10.4 7.2
2018-19 6,25,003 1,41,00,119 10.6 7.0
Source: Directorate of Economics & Statistics
7.16%
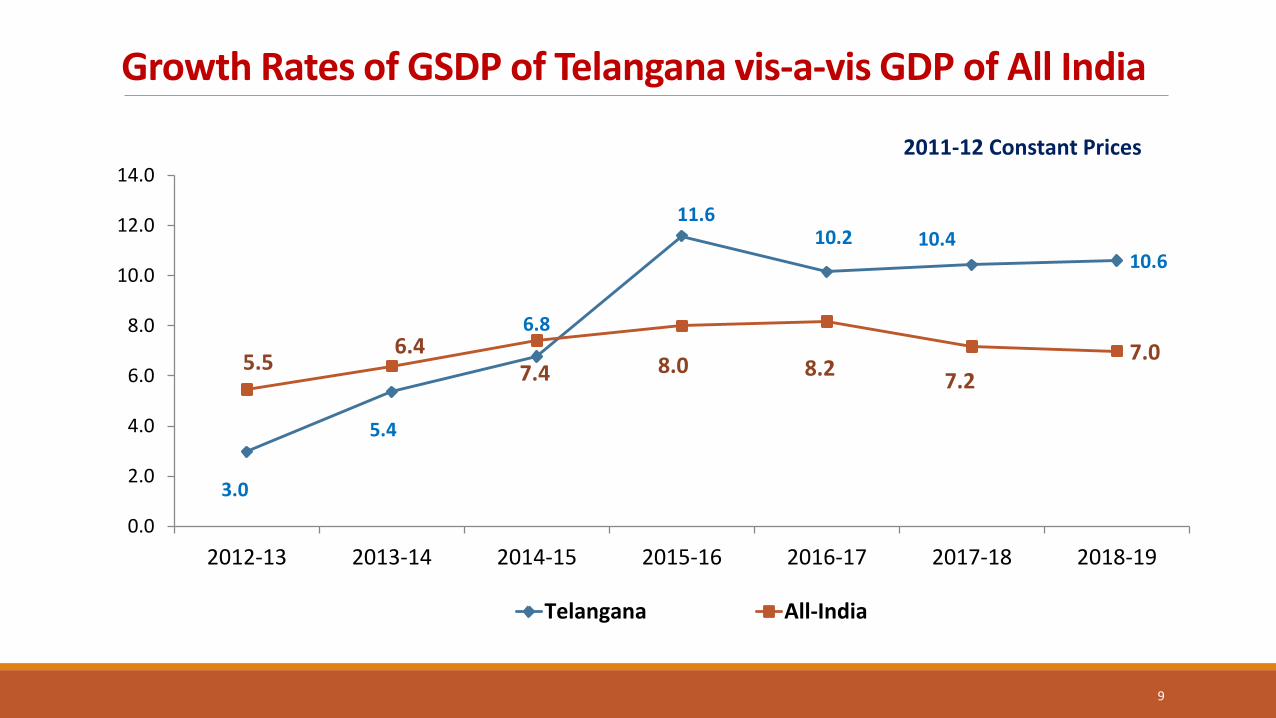
Growth Rates of GSDP of Telangana vis-a-vis GDP of All India
9
3.0
5.4
6.8
11.6 10.2 10.4
10.6
5.5 6.4
7.4 8.0 8.2 7.2
7.0
0.0
2.0
4.0
6.0
8.0
10.0
12.0
14.0
2012-13 2013-14 2014-15 2015-16 2016-17 2017-18 2018-19
Telangana All-India
2011-12 Constant Prices
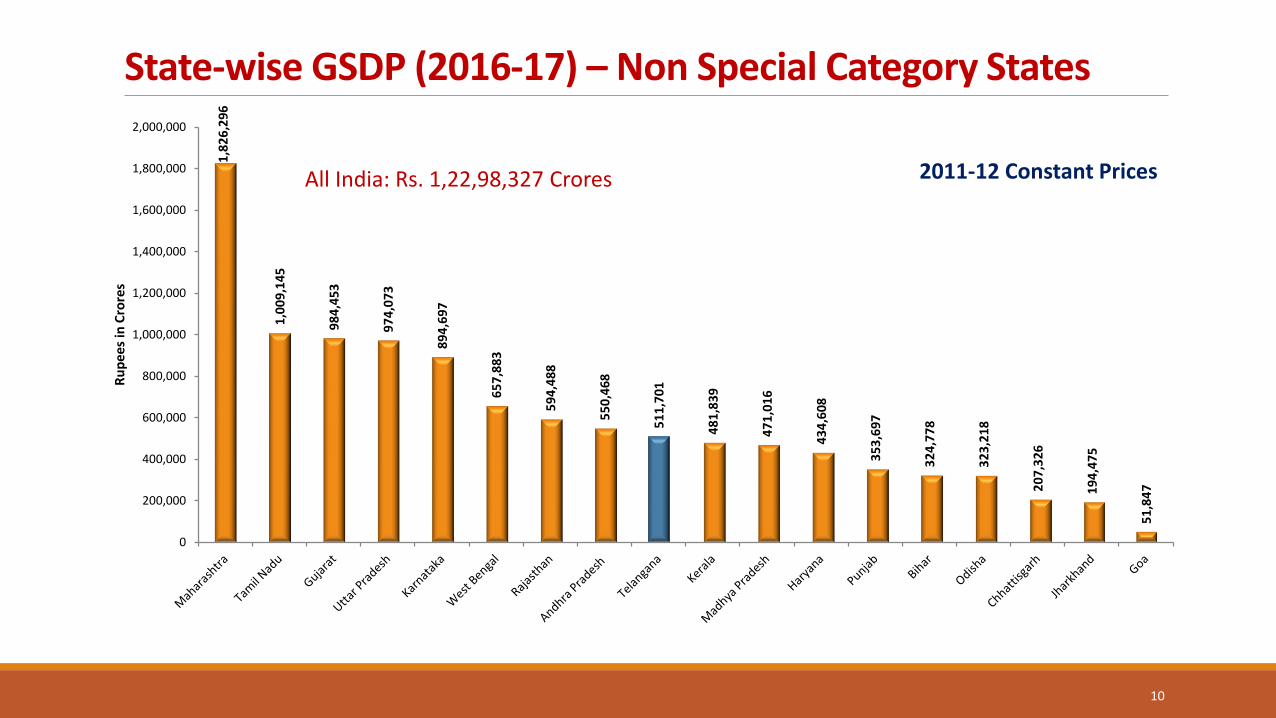
State-wise GSDP (2016-17) – Non Special Category States
10
1,8
26
,296
1,0
09
,145
98
4,4
53
97
4,0
73
89
4,6
97
65
7,8
83
59
4,4
88
55
0,4
68
51
1,7
01
48
1,8
39
47
1,0
16
43
4,6
08
35
3,6
97
32
4,7
78
32
3,2
18
20
7,3
26
19
4,4
75
51
,84
7
0
200,000
400,000
600,000
800,000
1,000,000
1,200,000
1,400,000
1,600,000
1,800,000
2,000,000R
up
ee
s in
Cro
res
2011-12 Constant Prices All India: Rs. 1,22,98,327 Crores
11
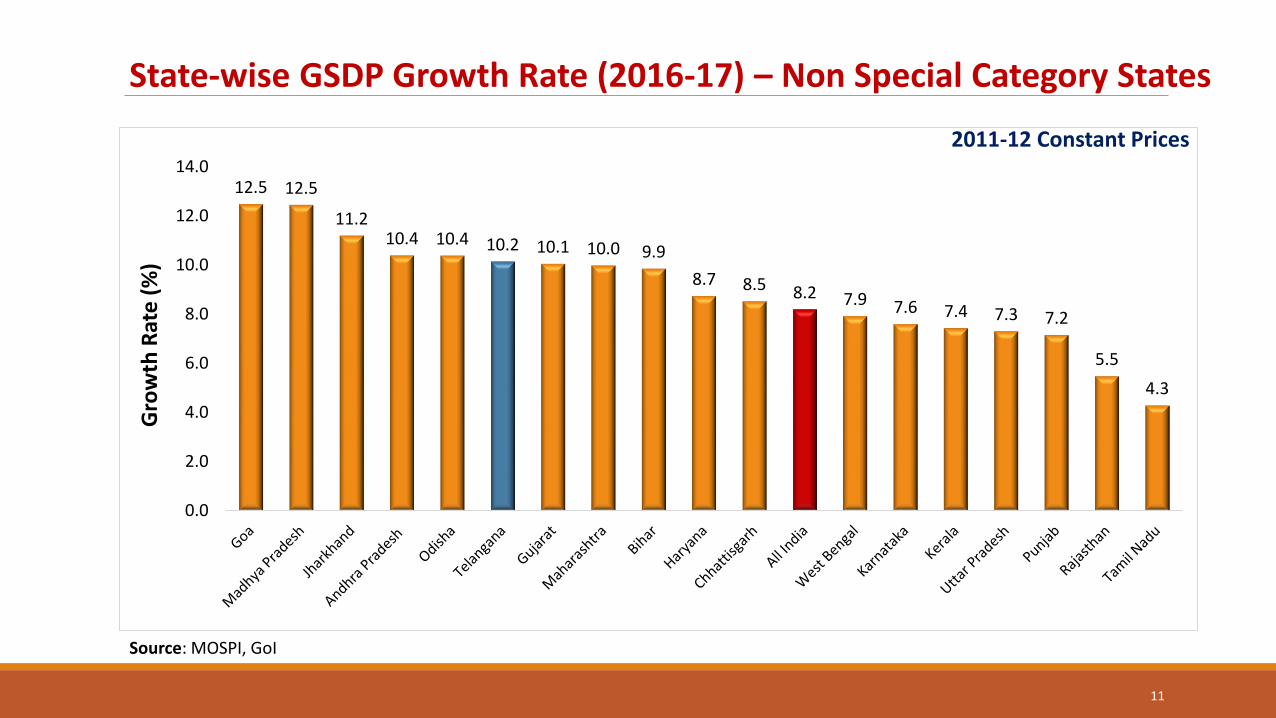
State-wise GSDP Growth Rate (2016-17) – Non Special Category States
Source: MOSPI, GoI
12.5 12.5
11.2 10.4 10.4 10.2 10.1 10.0 9.9
8.7 8.5 8.2 7.9 7.6 7.4 7.3 7.2
5.5
4.3
0.0
2.0
4.0
6.0
8.0
10.0
12.0
14.0G
row
th R
ate
(%
) 2011-12 Constant Prices
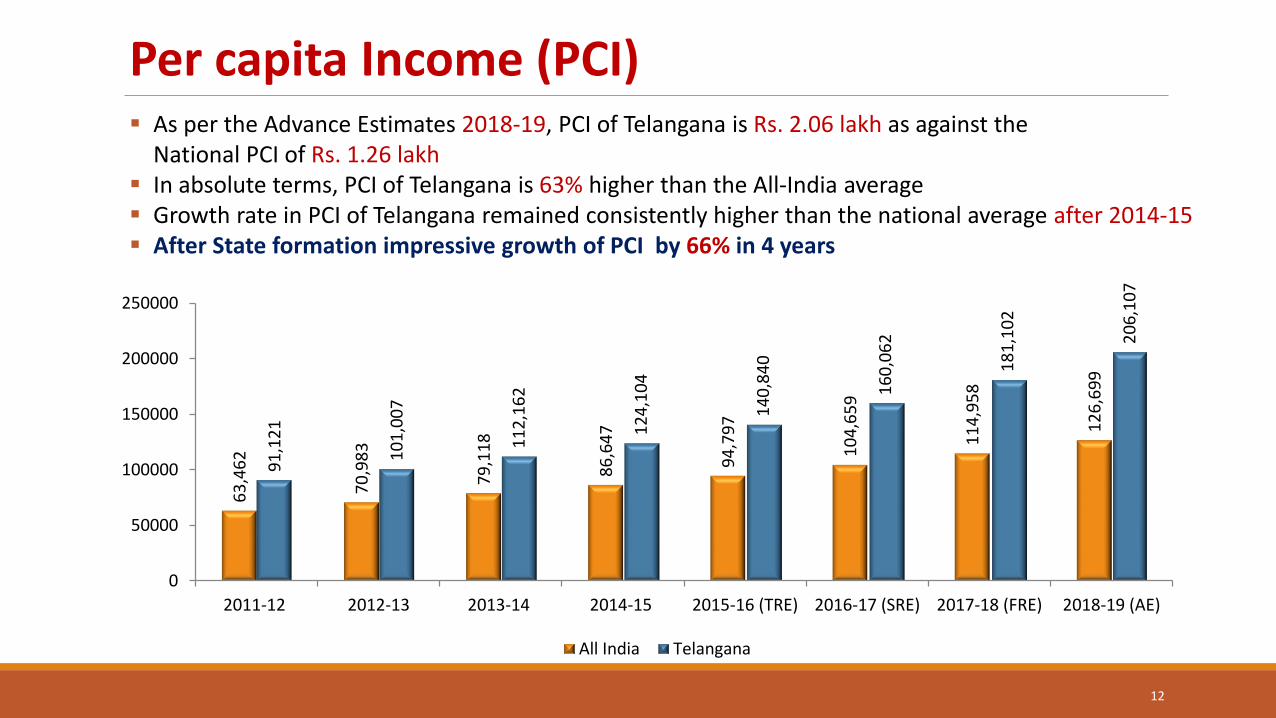
Per capita Income (PCI)
12
As per the Advance Estimates 2018-19, PCI of Telangana is Rs. 2.06 lakh as against the National PCI of Rs. 1.26 lakh
In absolute terms, PCI of Telangana is 63% higher than the All-India average Growth rate in PCI of Telangana remained consistently higher than the national average after 2014-15 After State formation impressive growth of PCI by 66% in 4 years
63
,46
2
70
,98
3
79
,11
8
86
,64
7
94
,79
7
10
4,6
59
11
4,9
58
12
6,6
99
91
,12
1
10
1,0
07
11
2,1
62
12
4,1
04
14
0,8
40
16
0,0
62
18
1,1
02
20
6,1
07
0
50000
100000
150000
200000
250000
2011-12 2012-13 2013-14 2014-15 2015-16 (TRE) 2016-17 (SRE) 2017-18 (FRE) 2018-19 (AE)
All India Telangana
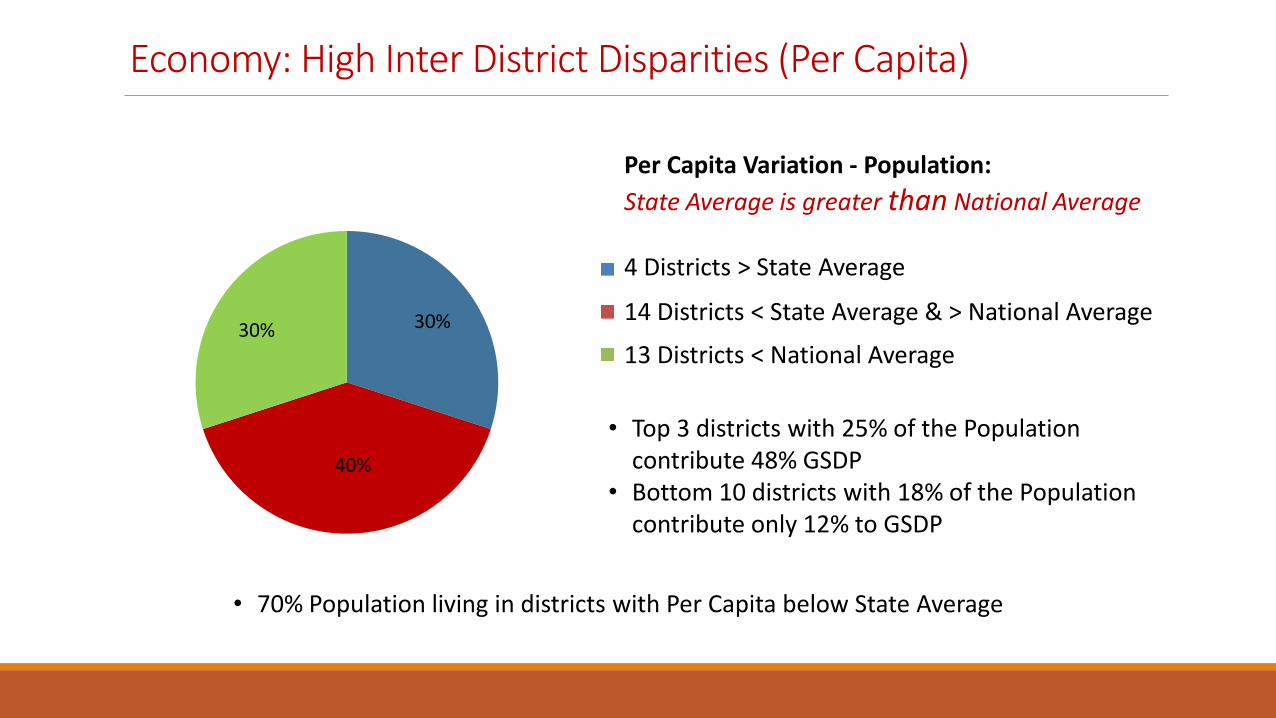
Economy: High Inter District Disparities (Per Capita)
Per Capita Variation - Population:
State Average is greater than National Average
4 Districts > State Average
14 Districts < State Average & > National Average
13 Districts < National Average
• Top 3 districts with 25% of the Population contribute 48% GSDP
• Bottom 10 districts with 18% of the Population contribute only 12% to GSDP
• 70% Population living in districts with Per Capita below State Average
30%
40%
30%
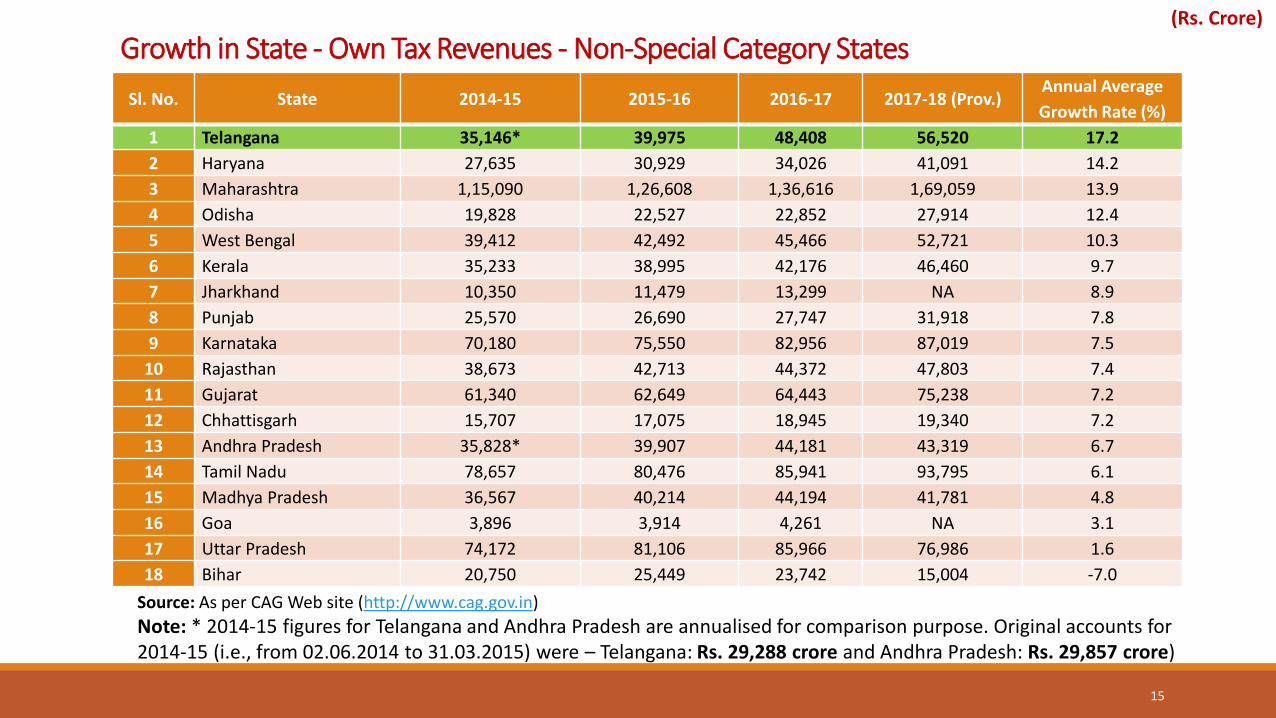
Growth in State - Own Tax Revenues - Non-Special Category States
15
Sl. No. State 2014-15 2015-16 2016-17 2017-18 (Prov.) Annual Average
Growth Rate (%)
1 Telangana 35,146* 39,975 48,408 56,520 17.2
2 Haryana 27,635 30,929 34,026 41,091 14.2
3 Maharashtra 1,15,090 1,26,608 1,36,616 1,69,059 13.9
4 Odisha 19,828 22,527 22,852 27,914 12.4
5 West Bengal 39,412 42,492 45,466 52,721 10.3
6 Kerala 35,233 38,995 42,176 46,460 9.7
7 Jharkhand 10,350 11,479 13,299 NA 8.9
8 Punjab 25,570 26,690 27,747 31,918 7.8
9 Karnataka 70,180 75,550 82,956 87,019 7.5
10 Rajasthan 38,673 42,713 44,372 47,803 7.4
11 Gujarat 61,340 62,649 64,443 75,238 7.2
12 Chhattisgarh 15,707 17,075 18,945 19,340 7.2
13 Andhra Pradesh 35,828* 39,907 44,181 43,319 6.7
14 Tamil Nadu 78,657 80,476 85,941 93,795 6.1
15 Madhya Pradesh 36,567 40,214 44,194 41,781 4.8
16 Goa 3,896 3,914 4,261 NA 3.1
17 Uttar Pradesh 74,172 81,106 85,966 76,986 1.6
18 Bihar 20,750 25,449 23,742 15,004 -7.0
Source: As per CAG Web site (http://www.cag.gov.in)
Note: * 2014-15 figures for Telangana and Andhra Pradesh are annualised for comparison purpose. Original accounts for 2014-15 (i.e., from 02.06.2014 to 31.03.2015) were – Telangana: Rs. 29,288 crore and Andhra Pradesh: Rs. 29,857 crore)
(Rs. Crore)
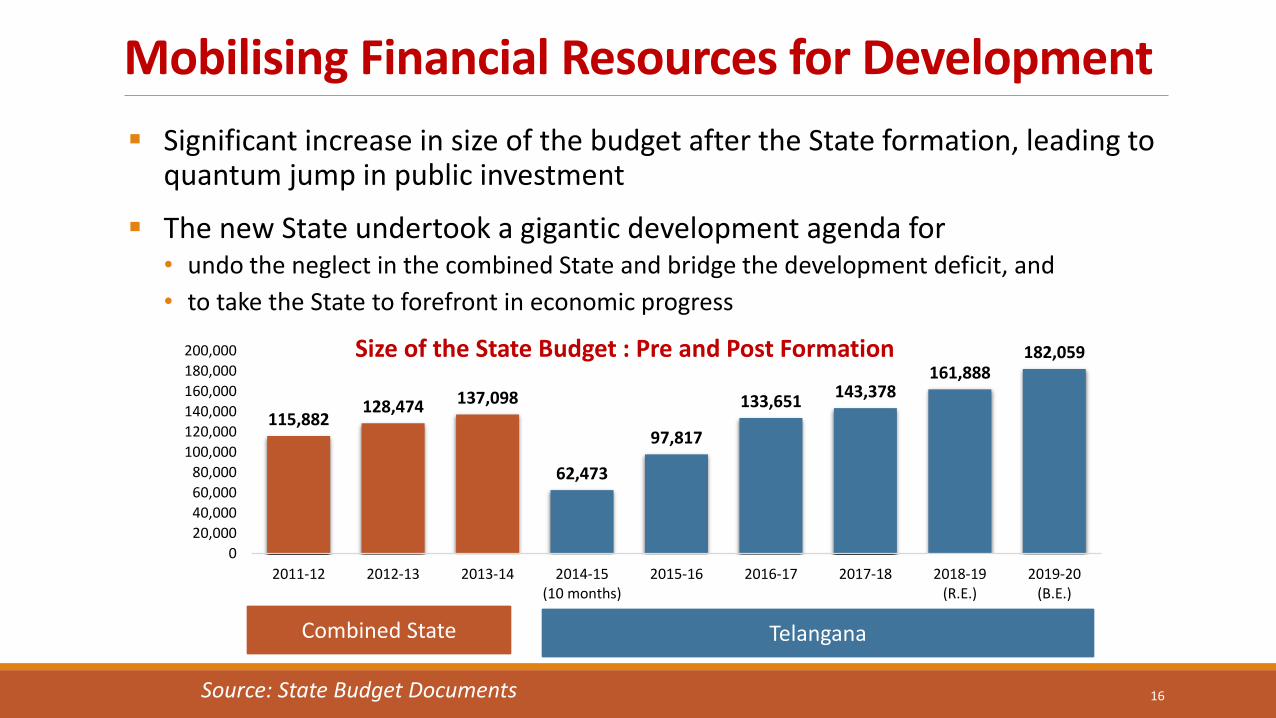
Mobilising Financial Resources for Development
Significant increase in size of the budget after the State formation, leading to quantum jump in public investment
The new State undertook a gigantic development agenda for • undo the neglect in the combined State and bridge the development deficit, and
• to take the State to forefront in economic progress
16
Size of the State Budget : Pre and Post Formation
115,882 128,474 137,098
62,473
97,817
133,651 143,378
161,888 182,059
0
20,000
40,000
60,000
80,000
100,000
120,000
140,000
160,000
180,000
200,000
2011-12 2012-13 2013-14 2014-15(10 months)
2015-16 2016-17 2017-18 2018-19(R.E.)
2019-20(B.E.)
Combined State Telangana
Source: State Budget Documents

Agriculture
20
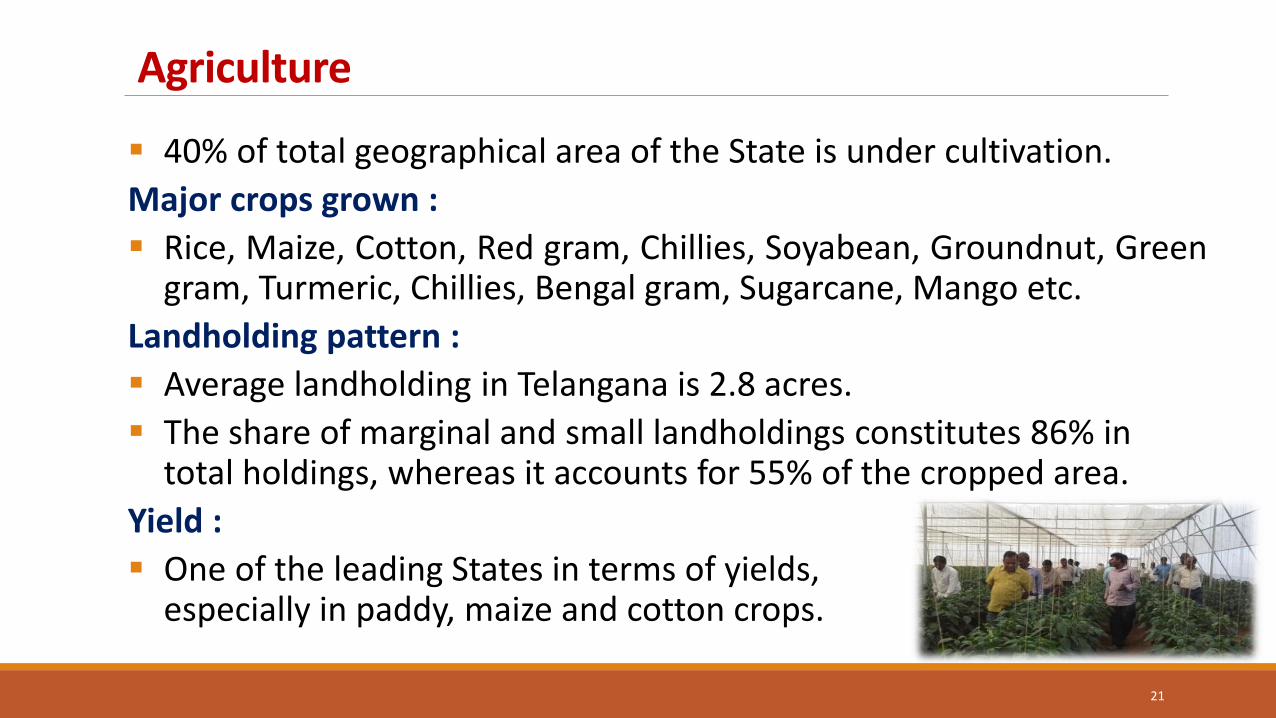
Agriculture
40% of total geographical area of the State is under cultivation.
Major crops grown :
Rice, Maize, Cotton, Red gram, Chillies, Soyabean, Groundnut, Green gram, Turmeric, Chillies, Bengal gram, Sugarcane, Mango etc.
Landholding pattern :
Average landholding in Telangana is 2.8 acres.
The share of marginal and small landholdings constitutes 86% in total holdings, whereas it accounts for 55% of the cropped area.
Yield :
One of the leading States in terms of yields, especially in paddy, maize and cotton crops.
21
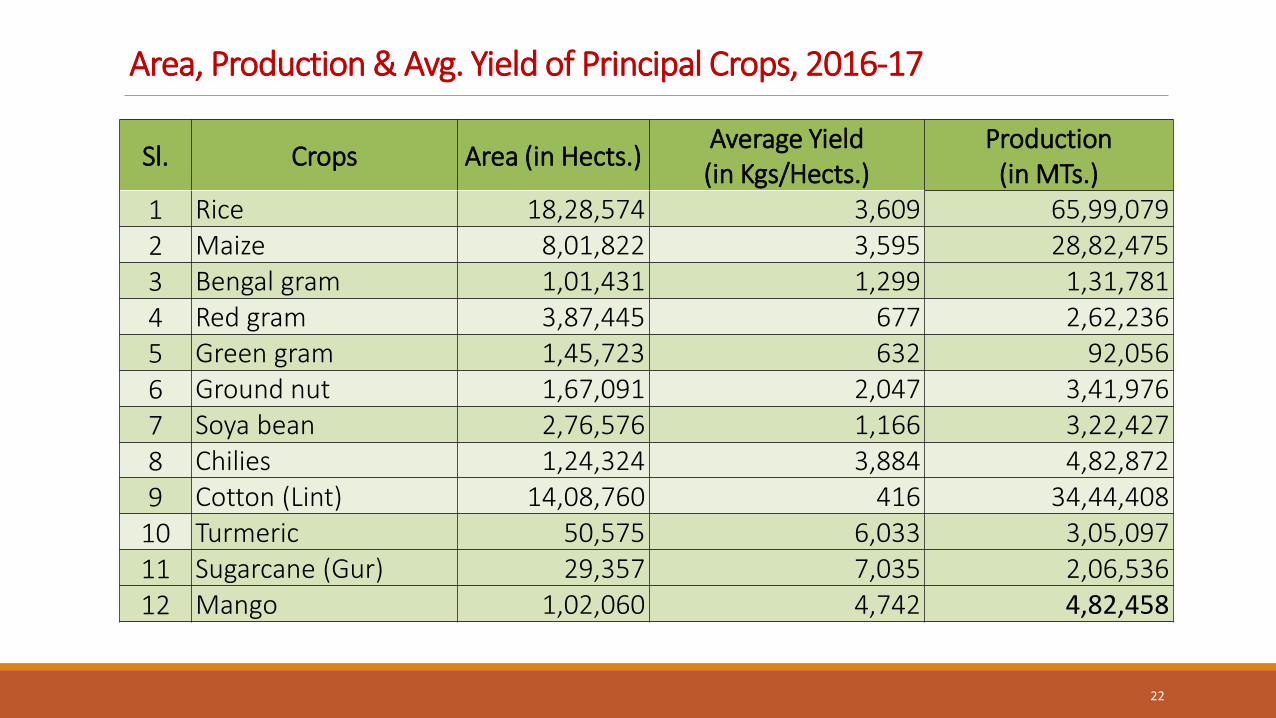
Area, Production & Avg. Yield of Principal Crops, 2016-17
22
Sl. Crops Area (in Hects.) Average Yield (in Kgs/Hects.)
Production (in MTs.)
1 Rice 18,28,574 3,609 65,99,079 2 Maize 8,01,822 3,595 28,82,475 3 Bengal gram 1,01,431 1,299 1,31,781 4 Red gram 3,87,445 677 2,62,236 5 Green gram 1,45,723 632 92,056 6 Ground nut 1,67,091 2,047 3,41,976 7 Soya bean 2,76,576 1,166 3,22,427 8 Chilies 1,24,324 3,884 4,82,872 9 Cotton (Lint) 14,08,760 416 34,44,408
10 Turmeric 50,575 6,033 3,05,097 11 Sugarcane (Gur) 29,357 7,035 2,06,536 12 Mango 1,02,060 4,742 4,82,458
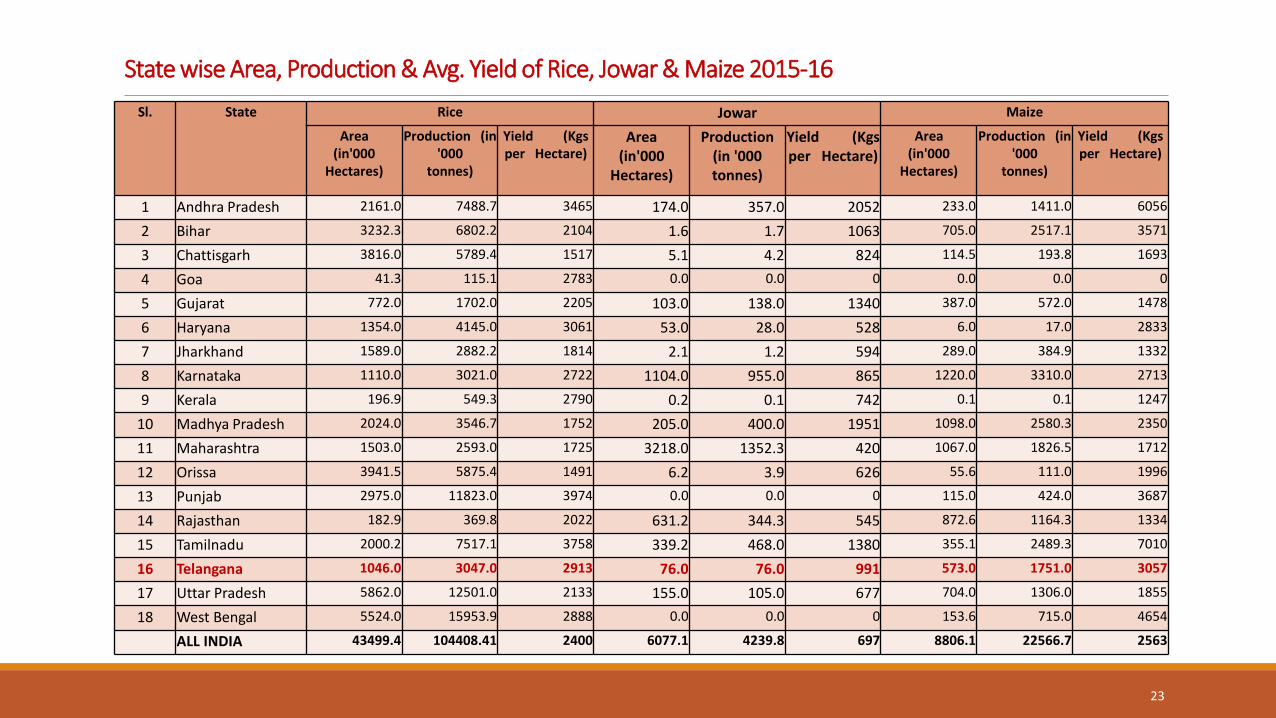
State wise Area, Production & Avg. Yield of Rice, Jowar & Maize 2015-16
23
Sl. State Rice Jowar Maize
Area (in'000
Hectares)
Production (in '000
tonnes)
Yield (Kgs per Hectare)
Area (in'000
Hectares)
Production (in '000 tonnes)
Yield (Kgs per Hectare)
Area (in'000
Hectares)
Production (in '000
tonnes)
Yield (Kgs per Hectare)
1 Andhra Pradesh 2161.0 7488.7 3465 174.0 357.0 2052 233.0 1411.0 6056
2 Bihar 3232.3 6802.2 2104 1.6 1.7 1063 705.0 2517.1 3571
3 Chattisgarh 3816.0 5789.4 1517 5.1 4.2 824 114.5 193.8 1693
4 Goa 41.3 115.1 2783 0.0 0.0 0 0.0 0.0 0
5 Gujarat 772.0 1702.0 2205 103.0 138.0 1340 387.0 572.0 1478
6 Haryana 1354.0 4145.0 3061 53.0 28.0 528 6.0 17.0 2833
7 Jharkhand 1589.0 2882.2 1814 2.1 1.2 594 289.0 384.9 1332
8 Karnataka 1110.0 3021.0 2722 1104.0 955.0 865 1220.0 3310.0 2713
9 Kerala 196.9 549.3 2790 0.2 0.1 742 0.1 0.1 1247
10 Madhya Pradesh 2024.0 3546.7 1752 205.0 400.0 1951 1098.0 2580.3 2350
11 Maharashtra 1503.0 2593.0 1725 3218.0 1352.3 420 1067.0 1826.5 1712
12 Orissa 3941.5 5875.4 1491 6.2 3.9 626 55.6 111.0 1996
13 Punjab 2975.0 11823.0 3974 0.0 0.0 0 115.0 424.0 3687
14 Rajasthan 182.9 369.8 2022 631.2 344.3 545 872.6 1164.3 1334
15 Tamilnadu 2000.2 7517.1 3758 339.2 468.0 1380 355.1 2489.3 7010
16 Telangana 1046.0 3047.0 2913 76.0 76.0 991 573.0 1751.0 3057
17 Uttar Pradesh 5862.0 12501.0 2133 155.0 105.0 677 704.0 1306.0 1855
18 West Bengal 5524.0 15953.9 2888 0.0 0.0 0 153.6 715.0 4654
ALL INDIA 43499.4 104408.41 2400 6077.1 4239.8 697 8806.1 22566.7 2563
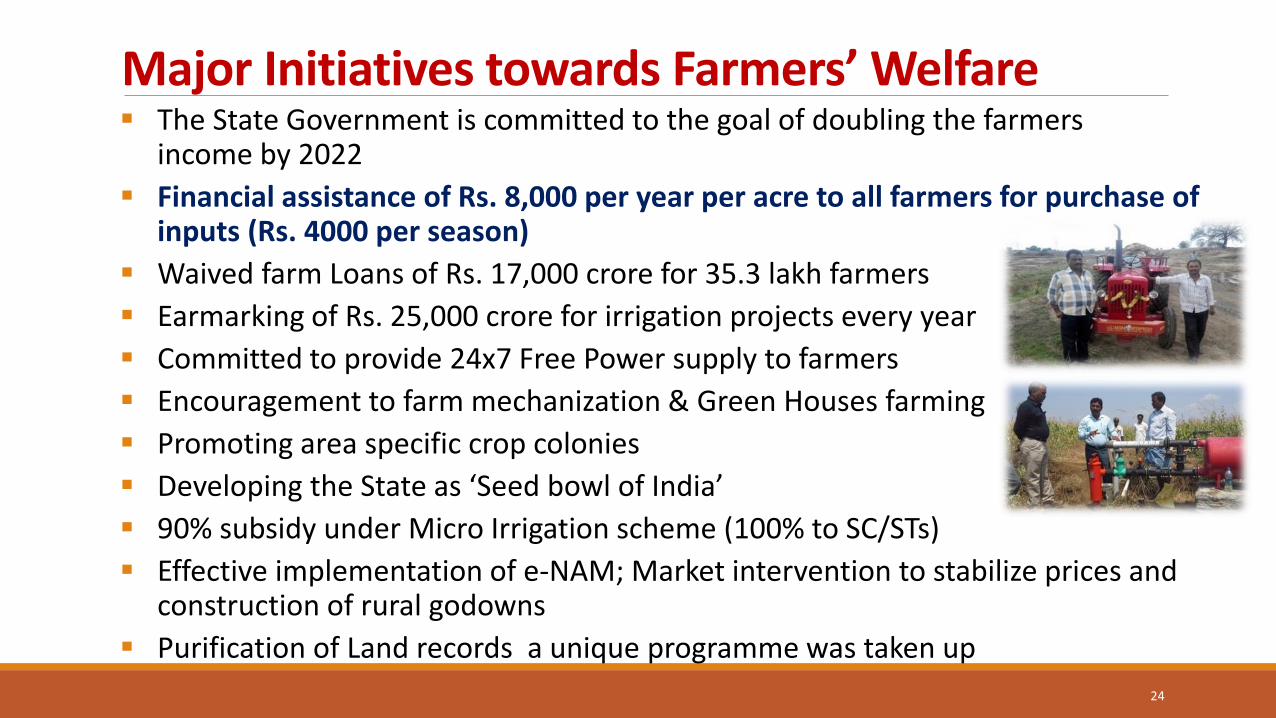
Major Initiatives towards Farmers’ Welfare The State Government is committed to the goal of doubling the farmers
income by 2022
Financial assistance of Rs. 8,000 per year per acre to all farmers for purchase of inputs (Rs. 4000 per season)
Waived farm Loans of Rs. 17,000 crore for 35.3 lakh farmers
Earmarking of Rs. 25,000 crore for irrigation projects every year
Committed to provide 24x7 Free Power supply to farmers
Encouragement to farm mechanization & Green Houses farming
Promoting area specific crop colonies
Developing the State as ‘Seed bowl of India’
90% subsidy under Micro Irrigation scheme (100% to SC/STs)
Effective implementation of e-NAM; Market intervention to stabilize prices and construction of rural godowns
Purification of Land records a unique programme was taken up
24
Rs. 4000.00 investment support per Acre each season towards
- Land preparation - Seed
- Fertilizers
- Pesticides
- Other Investments
Releasing amount directly to farmers through cheques or DBT mode in to their accounts Rs. (12,000) Crores provided in the budget 2018-19 During Kharif 2018 (50.88) lakh farmers benefitted to a tune of Rs. (5257.06) Crores.
It was disbursed by way of cheques During Rabi 2018-19 (52.68) lakh farmers benefitted to a tune of Rs. (5442.78) Crores.
Amount was electronically transferred into the bank accounts of the farmers During 2019-20, Government has enhanced the amount from Rs.4000/- to Rs. 5000/-
per acre per season
25
Agricultural investment support scheme (Rythu Bandhu)
Farmers’ Group Life Insurance Scheme (Rythu Bima)
Entire premium of Rs. 2,271.50 per farmer is borne by the State Government
Farmers in the age group of 18–59 covered (28 Lakhs)
Sum assured of Rs. 5.00 lakhs is paid on death, due to any cause, to the nominee
So far (6,833) Beneficiary claims (Nominees) have been settled with an amount Rs. (341.65) crores
AEOs are uploading the claims from the villages with the help of Tabs provided to them and amount is being transferred by the LIC within (10) days in to the Nominees account
26
Implementation of e-NAM Out of 585 APMCs in the Country, the Telangana State itself has connected 47 AMCs to the e-NAM
portal.
The Department of Agricultural Marketing was awarded with Prime Minister Award for Excellence
on 21-04-2017 for the performance of the State for the year 2016-17.
As 08-02-2019, the State has traded 22.72 L Mts of Agril. Produce with a 7209 crores.
Creation of entry points in AMCs, which can be used as Lot ID Generation Points and also for
e-Bidding by the Traders.
The Telangana State is the first in the country to implement 100% weighing Integration under e-NAM
duly capturing the weighment data into the e-NAM portal automatically.
The Telangana State stands at 3rd position in implementation of e-NAM in terms of Trade Quantity
and value. When compared with Gate entry, the state has traded 80% of its lots on e-National Agriculture
Market
27
Horticulture
28
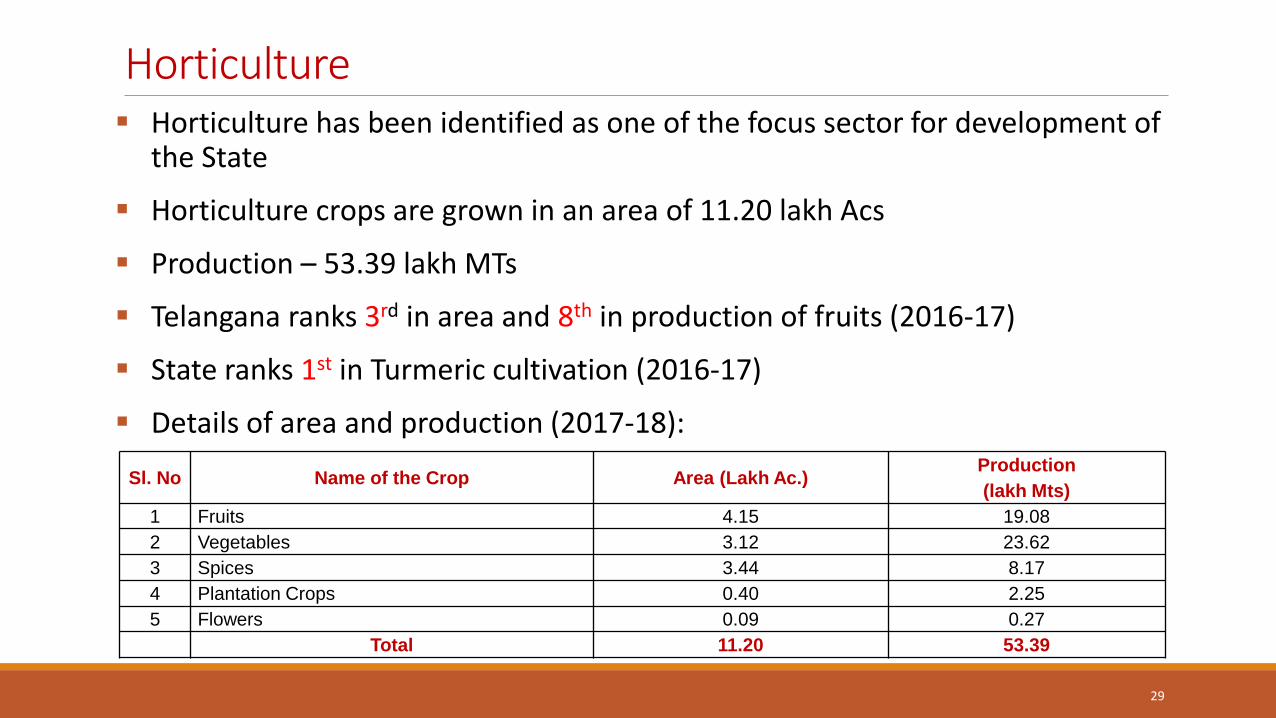
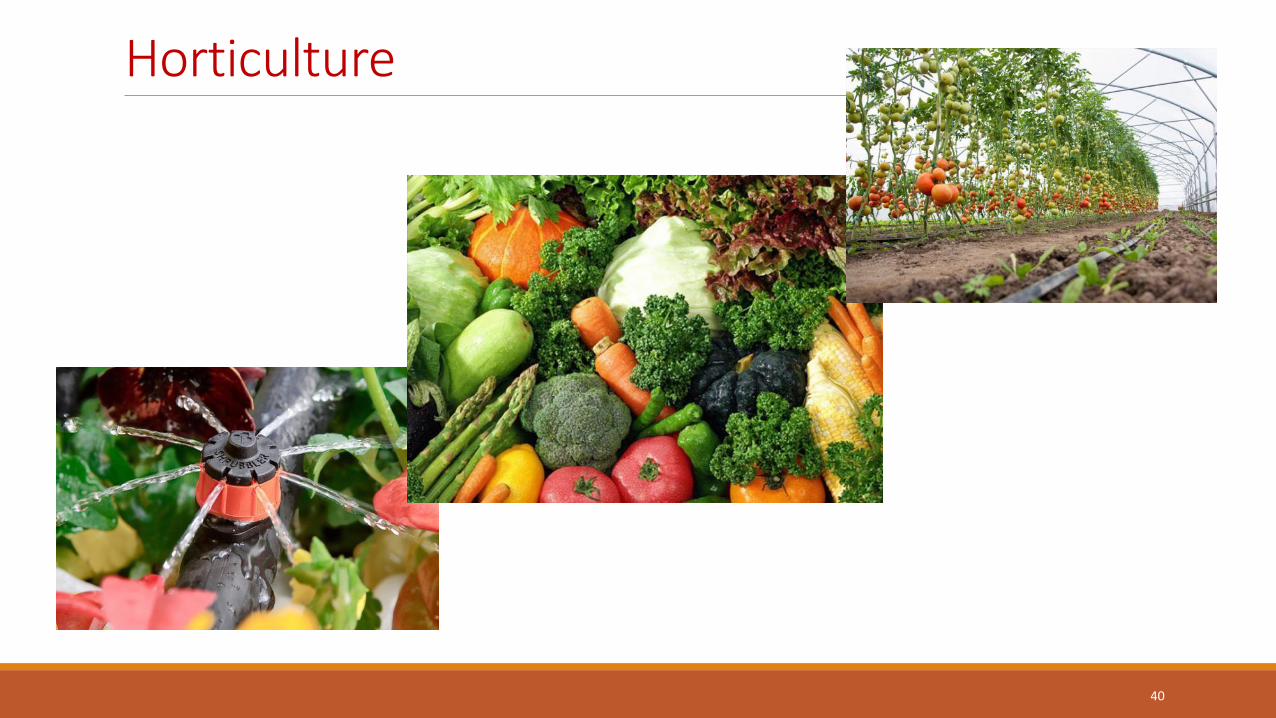
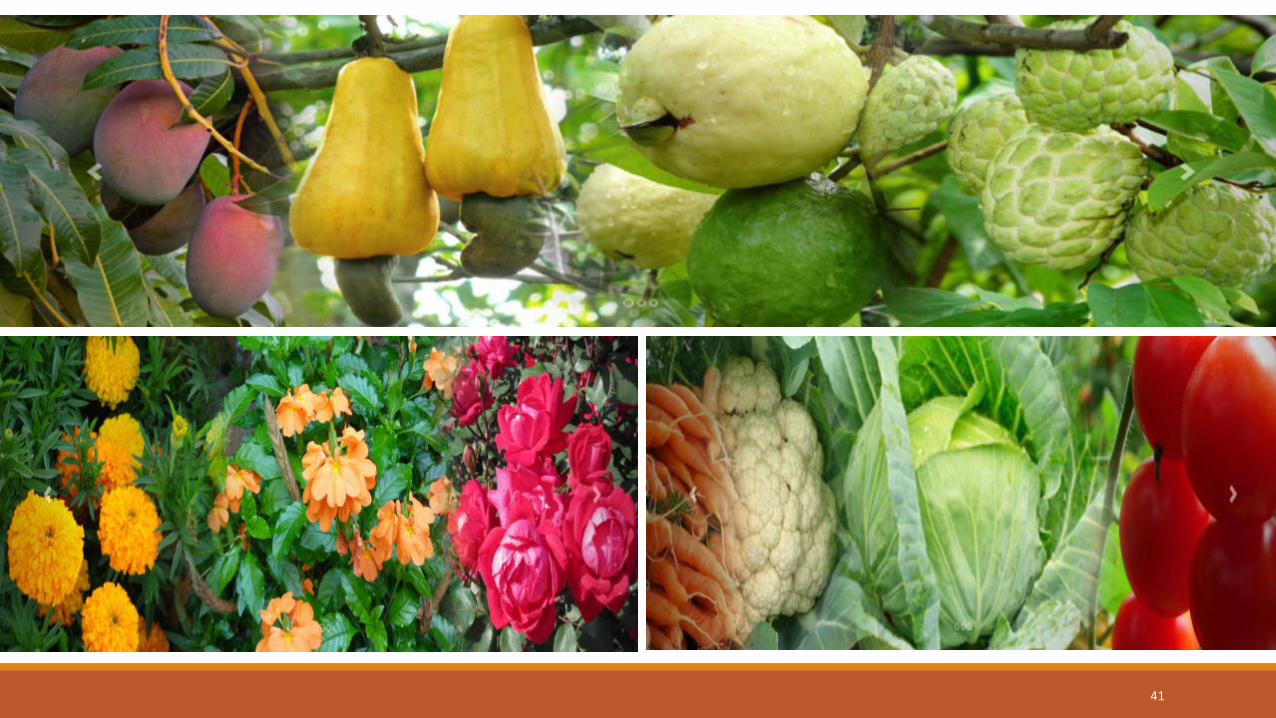
Horticulture Horticulture has been identified as one of the focus sector for development of
the State
Horticulture crops are grown in an area of 11.20 lakh Acs
Production – 53.39 lakh MTs
Telangana ranks 3rd in area and 8th in production of fruits (2016-17)
State ranks 1st in Turmeric cultivation (2016-17)
Details of area and production (2017-18):
29
Sl. No Name of the Crop Area (Lakh Ac.) Production
(lakh Mts)
1 Fruits 4.15 19.08
2 Vegetables 3.12 23.62
3 Spices 3.44 8.17
4 Plantation Crops 0.40 2.25
5 Flowers 0.09 0.27
Total 11.20 53.39
Schemes Micro Irrigation Project (MIP)
Establishment of Poly Houses / Green Houses
Mission for Integrated Development of Horticulture (MIDH)
Rasthtriya Krishi Vikas Yojana (RKVY)
NFSM – Oil Palm
30
Major initiatives Unique subsidy pattern of 100% for SC/ST farmers, 90% for SF/MF/BC farmers
and 80% for other farmers up to 5 ha under Micro Irrigation.
Financial assistance of Rs. 874.00 crores from NABARD to cover an area of 1.26 lakh ha.during 2016-17 & 2017-18 under micro irrigation.
Till last year 95% subsidy to SC & ST farmers 75% to general farmers for erection of Poly Houses.
In the current year shadenet houses are proposed with the same subsidy
Centre of excellence (COE) for vegetables and flowers established at Jeedimetla Ranga Reddy
Another COE established at Mulugu at Medak district for fruits to demonstrate latest technologies to the farmers.
31
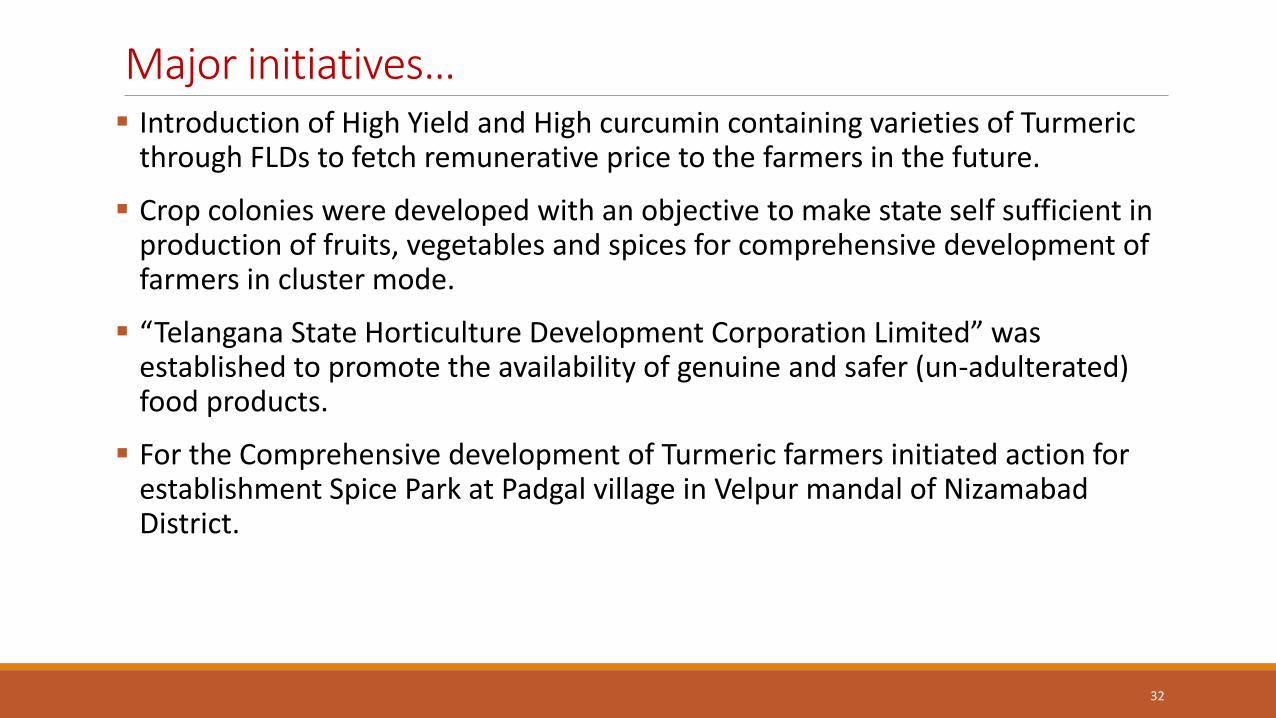
Major initiatives… Introduction of High Yield and High curcumin containing varieties of Turmeric
through FLDs to fetch remunerative price to the farmers in the future.
Crop colonies were developed with an objective to make state self sufficient in production of fruits, vegetables and spices for comprehensive development of farmers in cluster mode.
“Telangana State Horticulture Development Corporation Limited” was established to promote the availability of genuine and safer (un-adulterated) food products.
For the Comprehensive development of Turmeric farmers initiated action for establishment Spice Park at Padgal village in Velpur mandal of Nizamabad District.
32
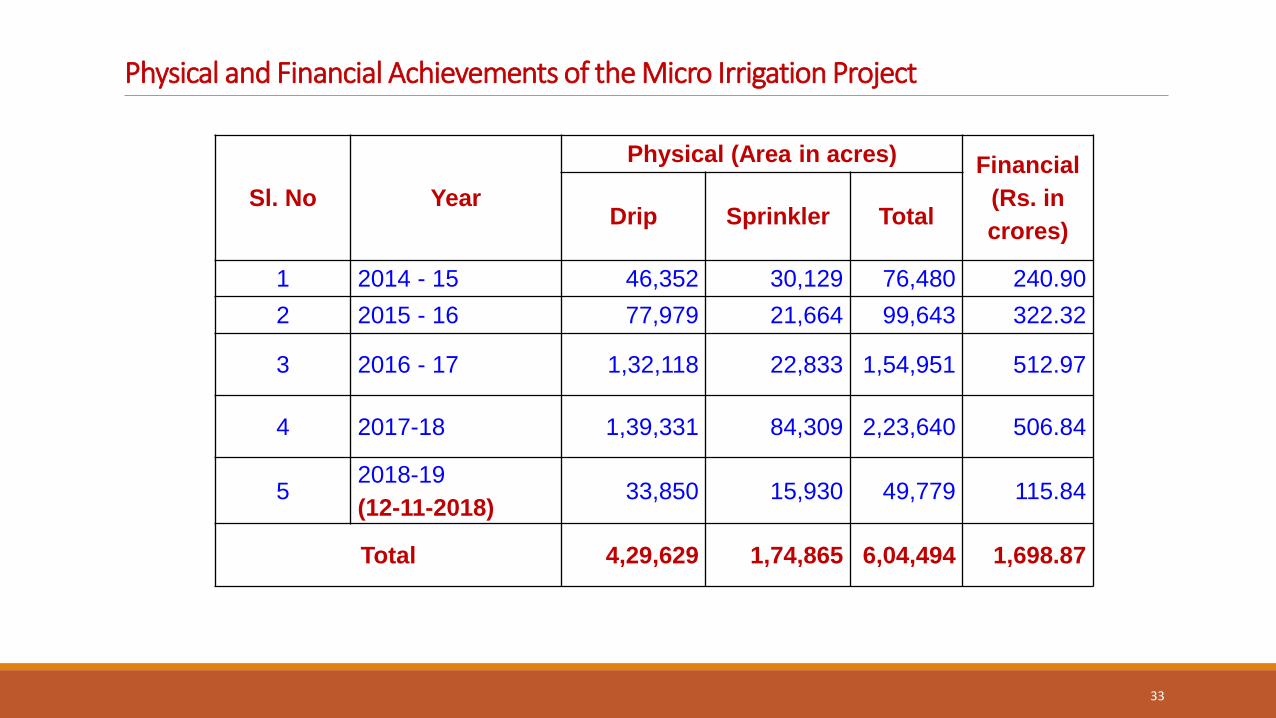
Physical and Financial Achievements of the Micro Irrigation Project
Sl. No Year
Physical (Area in acres) Financial
(Rs. in
crores) Drip Sprinkler Total
1 2014 - 15 46,352 30,129 76,480 240.90
2 2015 - 16 77,979 21,664 99,643 322.32
3 2016 - 17 1,32,118 22,833 1,54,951 512.97
4 2017-18 1,39,331 84,309 2,23,640 506.84
5 2018-19
(12-11-2018) 33,850 15,930 49,779 115.84
Total 4,29,629 1,74,865 6,04,494 1,698.87
33
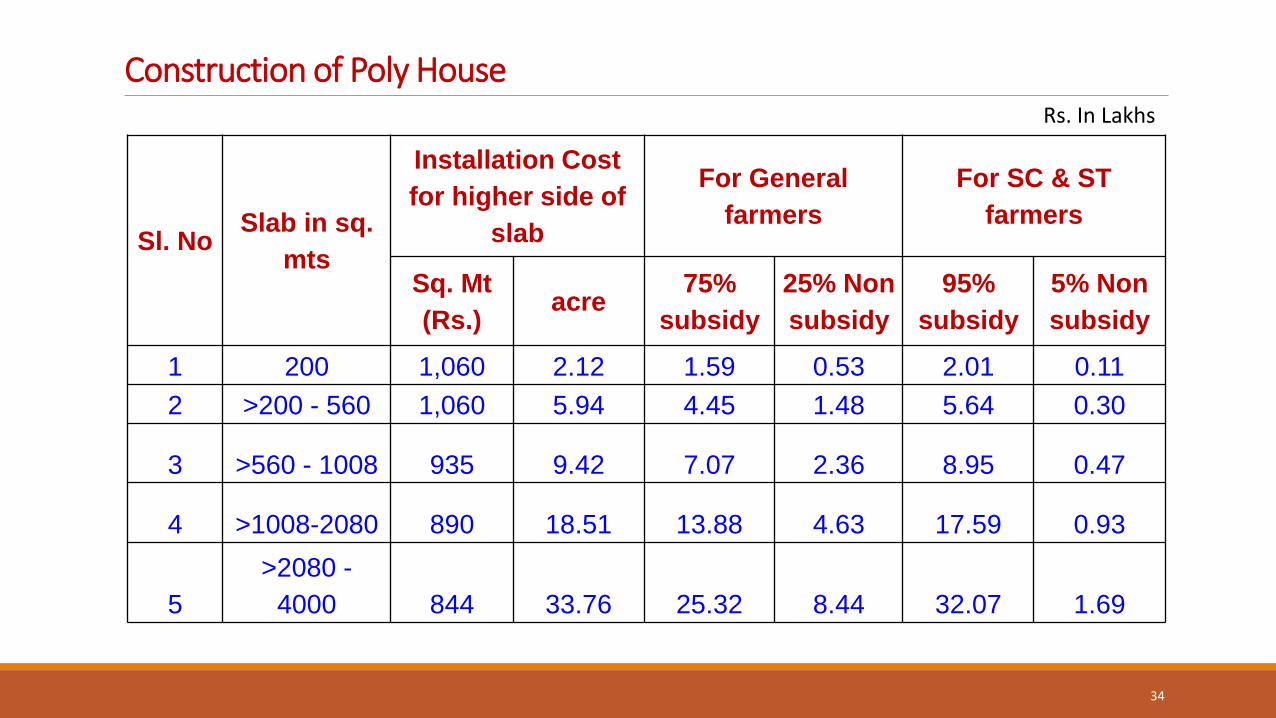
Construction of Poly House
Sl. No Slab in sq.
mts
Installation Cost
for higher side of
slab
For General
farmers
For SC & ST
farmers
Sq. Mt
(Rs.) acre
75%
subsidy
25% Non
subsidy
95%
subsidy
5% Non
subsidy
1 200 1,060 2.12 1.59 0.53 2.01 0.11
2 >200 - 560 1,060 5.94 4.45 1.48 5.64 0.30
3 >560 - 1008 935 9.42 7.07 2.36 8.95 0.47
4 >1008-2080 890 18.51 13.88 4.63 17.59 0.93
5
>2080 -
4000 844 33.76 25.32 8.44 32.07 1.69
34
Rs. In Lakhs
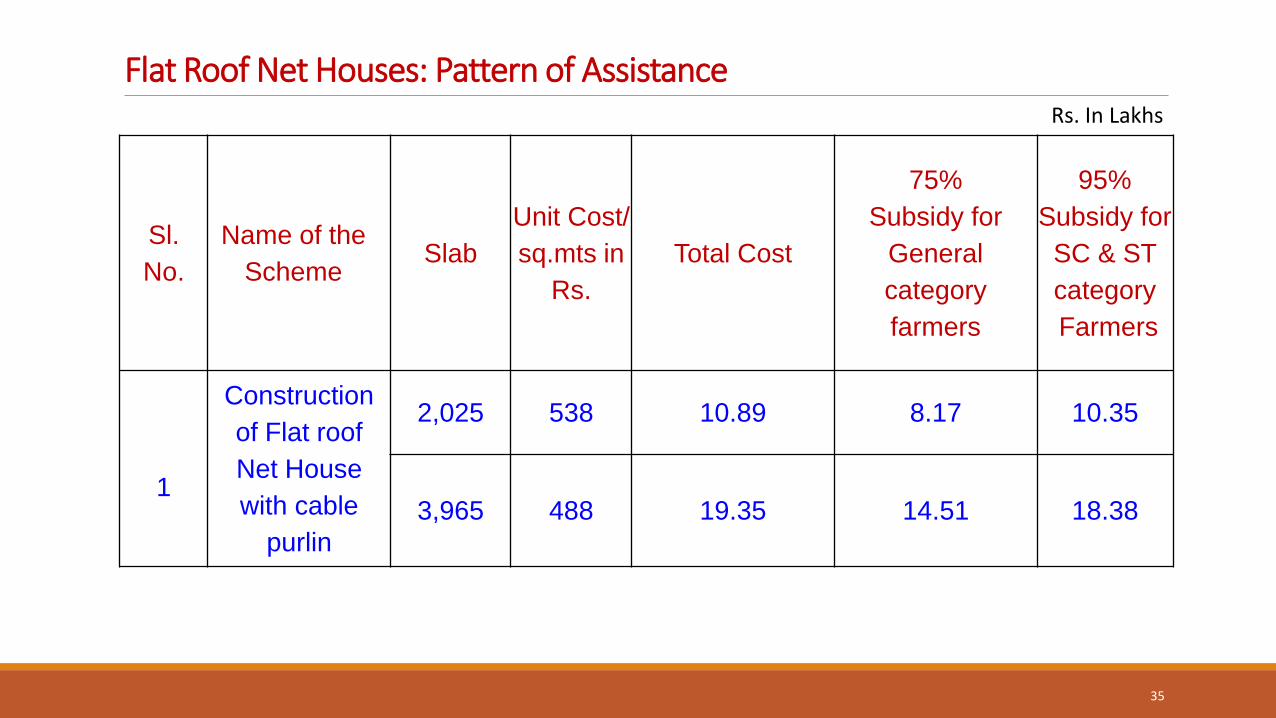
Flat Roof Net Houses: Pattern of Assistance
Sl.
No.
Name of the
Scheme Slab
Unit Cost/
sq.mts in
Rs.
Total Cost
75%
Subsidy for
General
category
farmers
95%
Subsidy for
SC & ST
category
Farmers
1
Construction
of Flat roof
Net House
with cable
purlin
2,025 538 10.89 8.17 10.35
3,965 488 19.35 14.51 18.38
35
Rs. In Lakhs
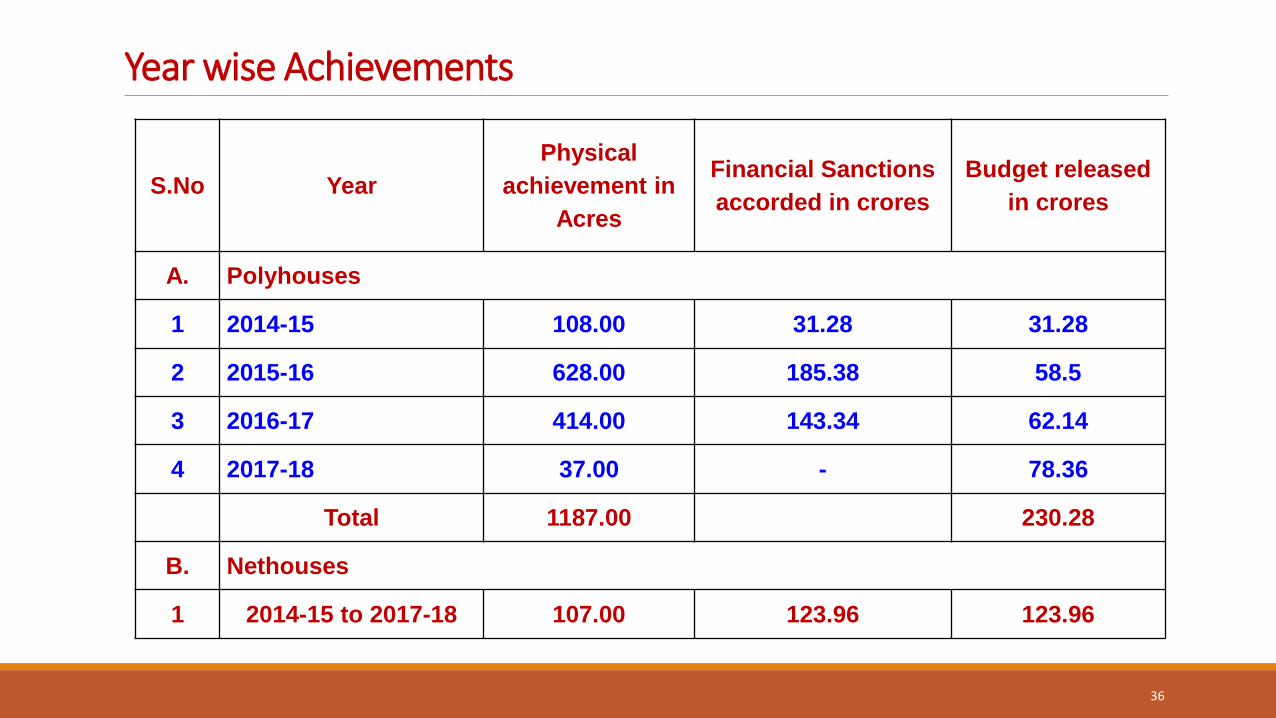
Year wise Achievements
S.No Year
Physical
achievement in
Acres
Financial Sanctions
accorded in crores
Budget released
in crores
A. Polyhouses
1 2014-15 108.00 31.28 31.28
2 2015-16 628.00 185.38 58.5
3 2016-17 414.00 143.34 62.14
4 2017-18 37.00 - 78.36
Total 1187.00 230.28
B. Nethouses
1 2014-15 to 2017-18 107.00 123.96 123.96
36
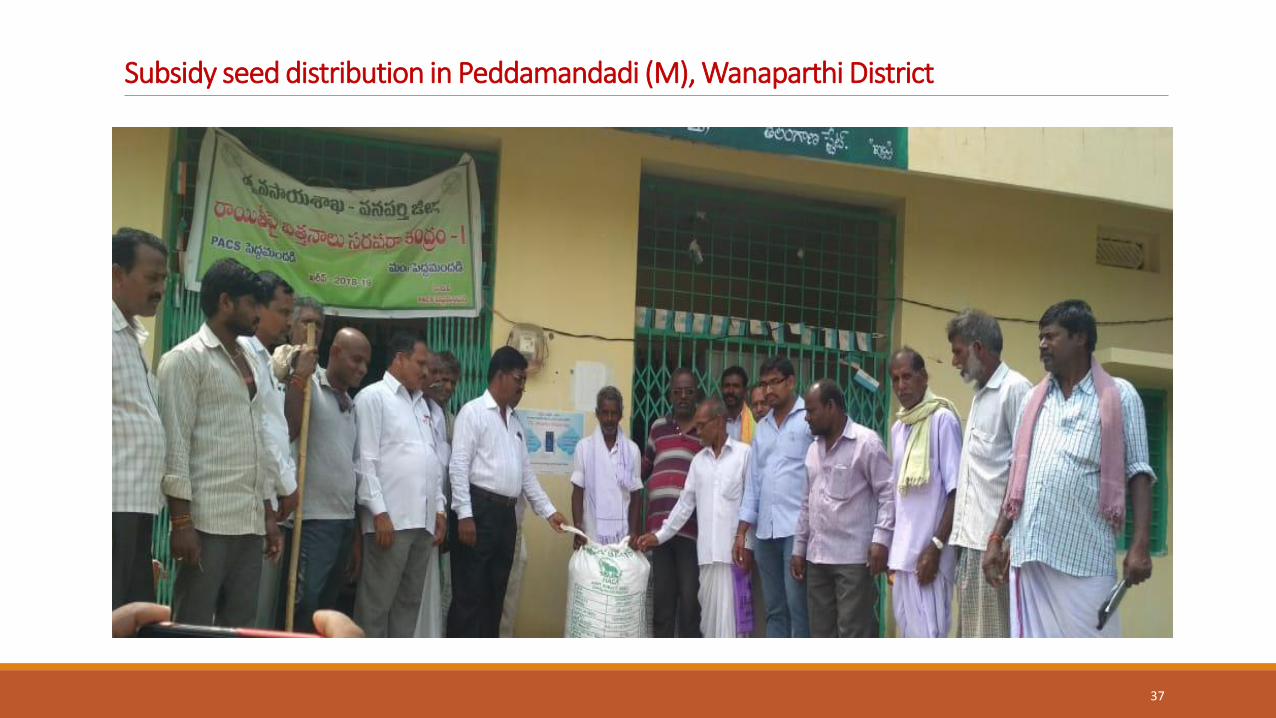
Subsidy seed distribution in Peddamandadi (M), Wanaparthi District
37
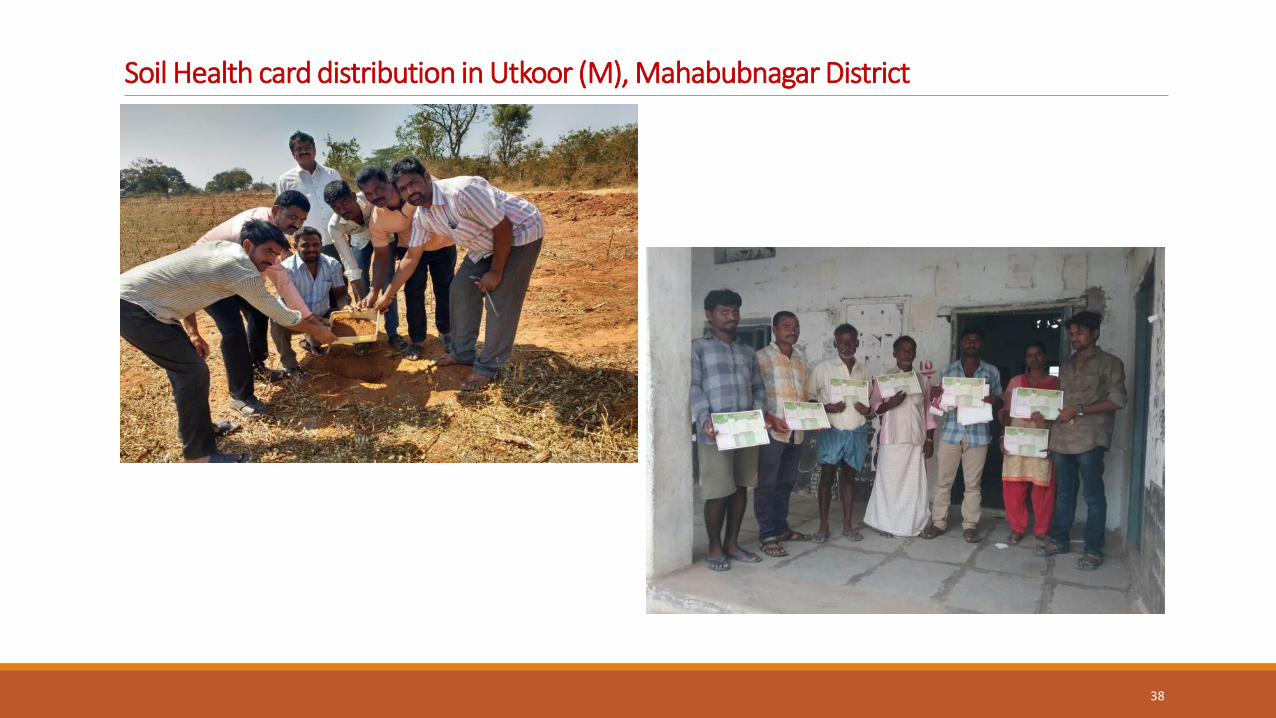
Soil Health card distribution in Utkoor (M), Mahabubnagar District
38
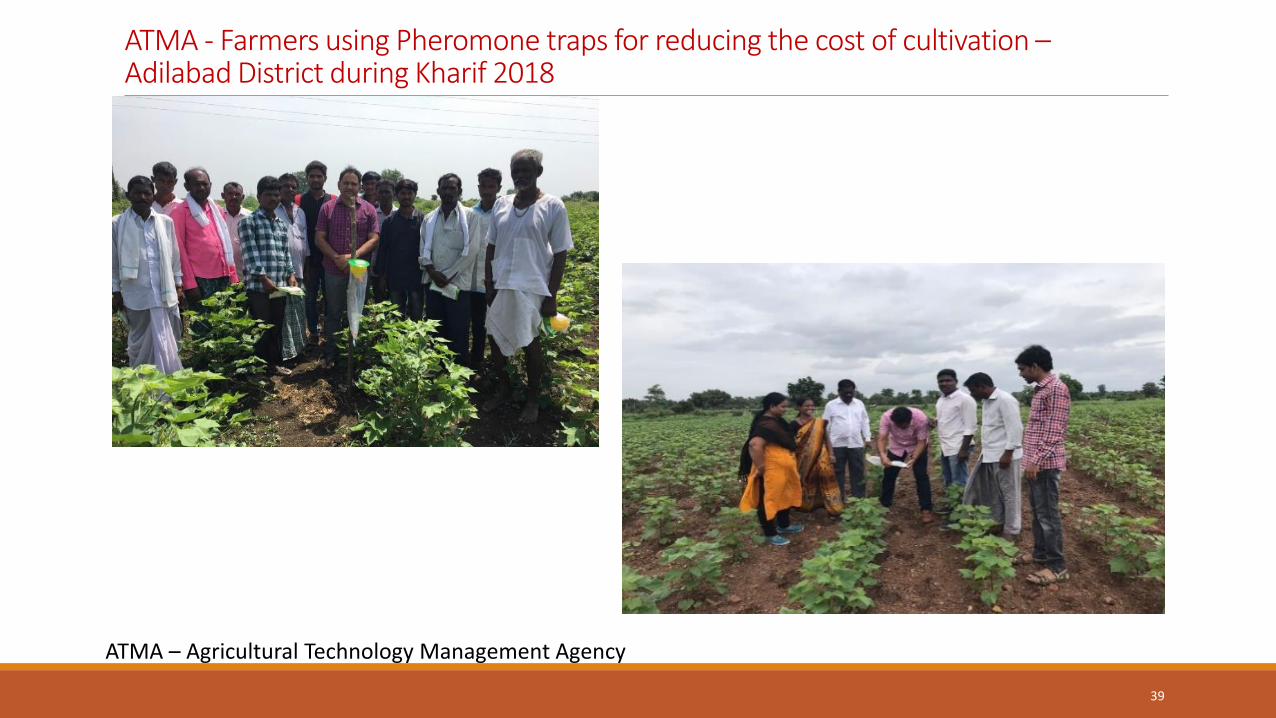
ATMA - Farmers using Pheromone traps for reducing the cost of cultivation – Adilabad District during Kharif 2018
39
ATMA – Agricultural Technology Management Agency
Horticulture
40
41
Animal Husbandry & Fisheries
42
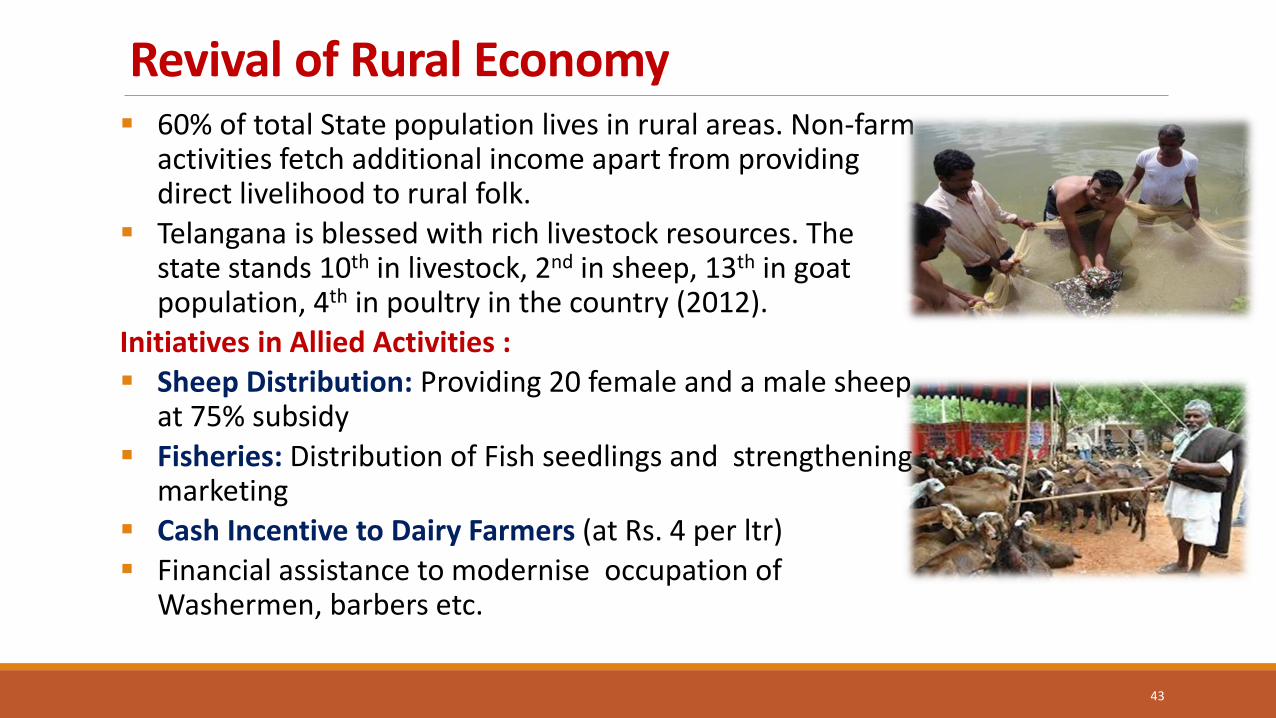
Revival of Rural Economy 60% of total State population lives in rural areas. Non-farm
activities fetch additional income apart from providing direct livelihood to rural folk.
Telangana is blessed with rich livestock resources. The state stands 10th in livestock, 2nd in sheep, 13th in goat population, 4th in poultry in the country (2012).
Initiatives in Allied Activities : Sheep Distribution: Providing 20 female and a male sheep
at 75% subsidy
Fisheries: Distribution of Fish seedlings and strengthening marketing
Cash Incentive to Dairy Farmers (at Rs. 4 per ltr) Financial assistance to modernise occupation of
Washermen, barbers etc.
43
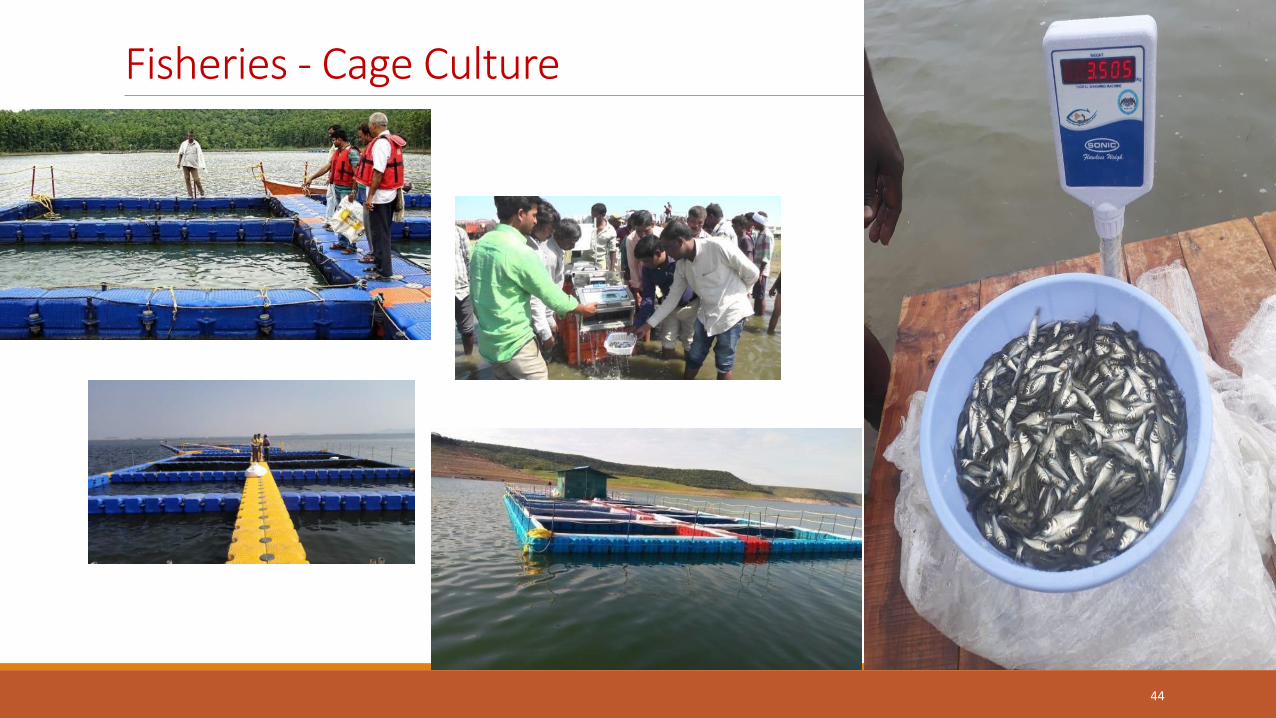
Fisheries - Cage Culture
44

Irrigation & CAD
45
Irrigation & CAD Irrigation Sector (Prior to formation of the State):
Land area of 112.08 Lakh Ha
Cultivable area of 67.52 lakh Ha.
Drained by 2 major rivers Godavari and Krishna.
Neglect of water resources utilization -over many decades
Droughts due to frequent failure of rainfall
Nalgonda & Mahboobnagar seriously affected with fluoride problems.
Only 16.91 lakh Ha (25 %) was having irrigation facilities, in spite of having 1260 TMC dependable water and share of Surplus waters
33 Major & Medium Irrigation ongoing projects & 2 Newly conceived projects (3 completed and others at different stages of progress.)
46
Irrigation Sector (After formation of the State):
Projects reviewed in detail - to suit the states requirements.
Prioritized- IP Creation - 125 lakh acres – utilizing entitled water
Assured Irrigation facility to 75 % of the Cultivable land in the next 5 years
Giving Fillip to Agriculture and allied Sectors
36 Major & Medium Ongoing projects with
• Irrigation potential (IP) - 70 Lakh acres
• Latest cost - Rs. 2,19,535 Crores.
So far, 12 projects completed - 16.18 Lakh acres of IP created -since inception (including 3 projects completed prior to state formation)
Expenditure incurred: Rs. 1,03,158 Crores - Balance cost : Rs. 1,16,377 Crores
47
Irrigation & CAD…
Major Interventions Re-Engineered Projects:
• Dr.BR Ambedkar Pranahita Chevella LIS - (Kaleshwaram & Pranahita),
• Indiramma Flood Flow Canal, J.Chokka Rao-Devadula LIS,
• Sita Rama LIS (Integration of Rajiv Dummugudem LIS & Indira Sagar Dummugudem LIS projects),
• Thupakulagudem Barrage (PVN Rao Kanthanapally Sujala Sravanthi)].
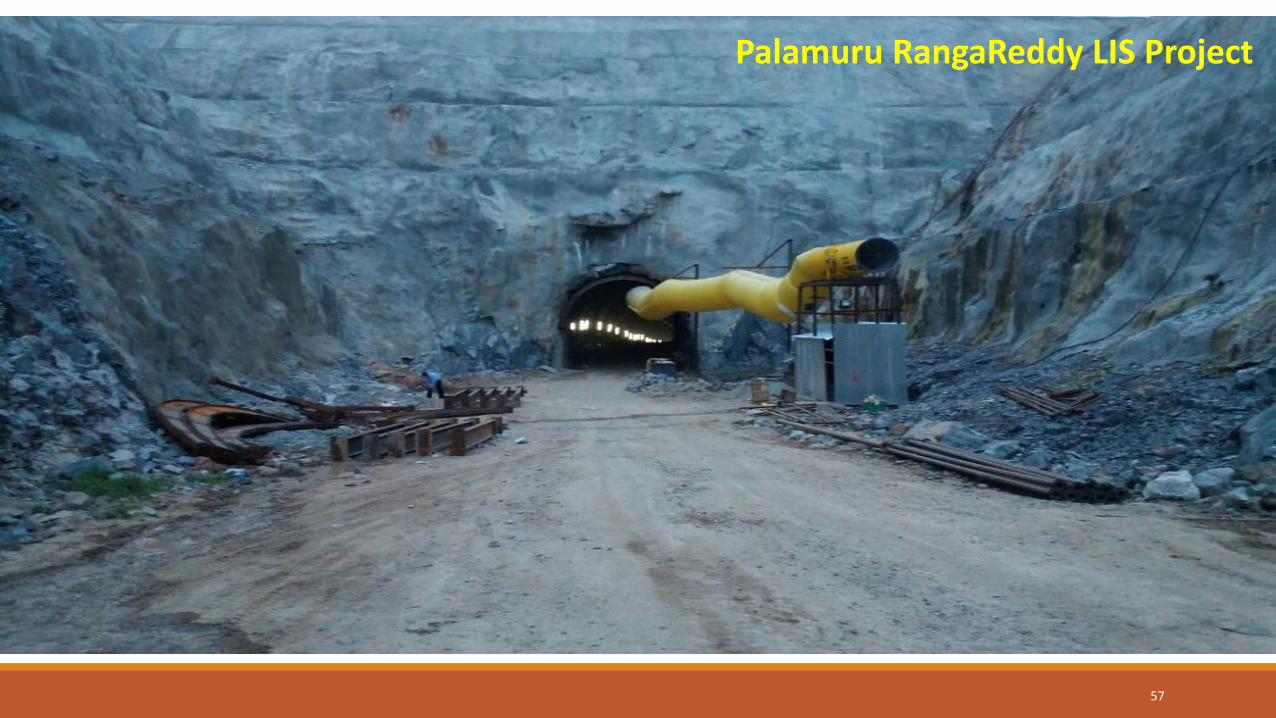
Grounding of Major projects Palamuru Rangareddy LIS and Dindi LIS. (conceptualized and under investigation stage prior to State formation )
Land mark Agreement with Maharashtra state and troubleshooting bottlenecks in implementation of Pranahita, Kaleshwaram, Chanaka-Korata and Lendi projects in Godavari Basin.
Enhanced Budget Support duly availing financial loan assistance from Andhra Bank, PNB, PFC, REC and from Govt. of India under PMKSY, DRIP, RRR, NABARD.
Programme for Restoration of all Minor Irrigation Tanks (46,531 Water Bodies) under Mission Kakatiya
New approach to Land Acquisition and Rehabilitation &Resettlement.
48
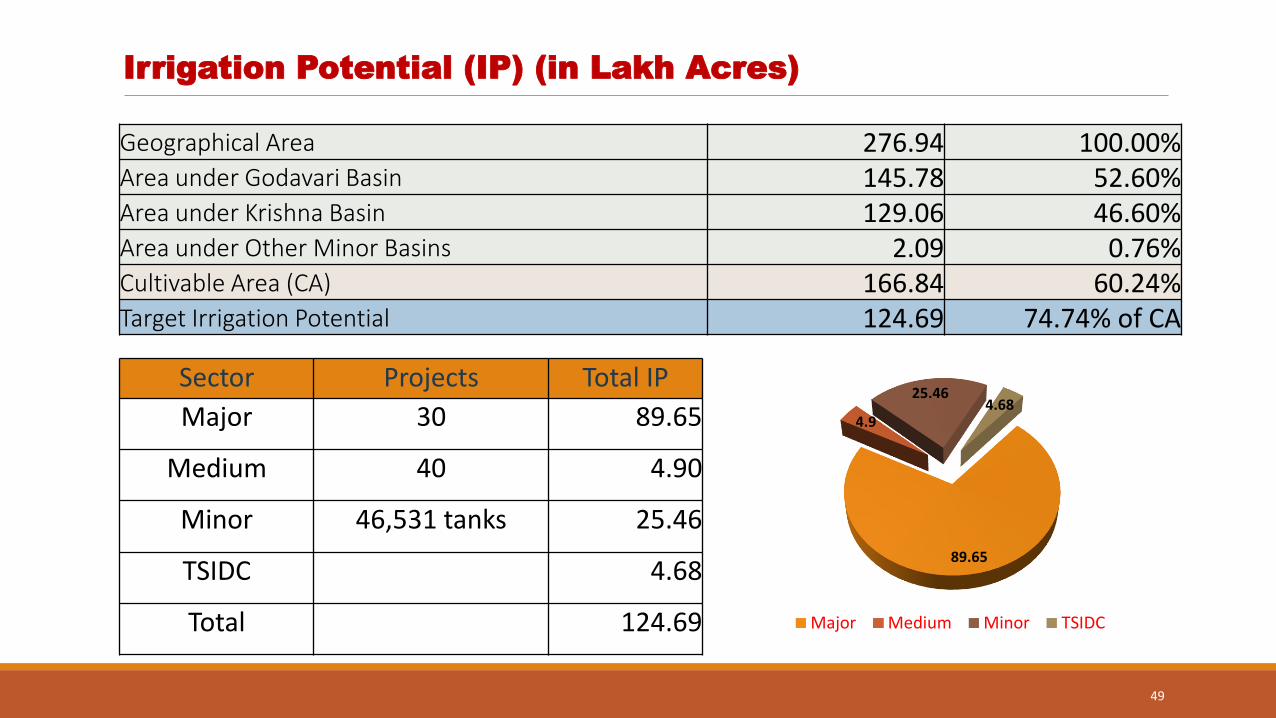
Geographical Area 276.94 100.00% Area under Godavari Basin 145.78 52.60% Area under Krishna Basin 129.06 46.60% Area under Other Minor Basins 2.09 0.76% Cultivable Area (CA) 166.84 60.24% Target Irrigation Potential 124.69 74.74% of CA
89.65
4.9
25.46 4.68
Major Medium Minor TSIDC
Irrigation Potential (IP) (in Lakh Acres)
49
Sector Projects Total IP
Major 30 89.65
Medium 40 4.90
Minor 46,531 tanks 25.46
TSIDC 4.68
Total 124.69
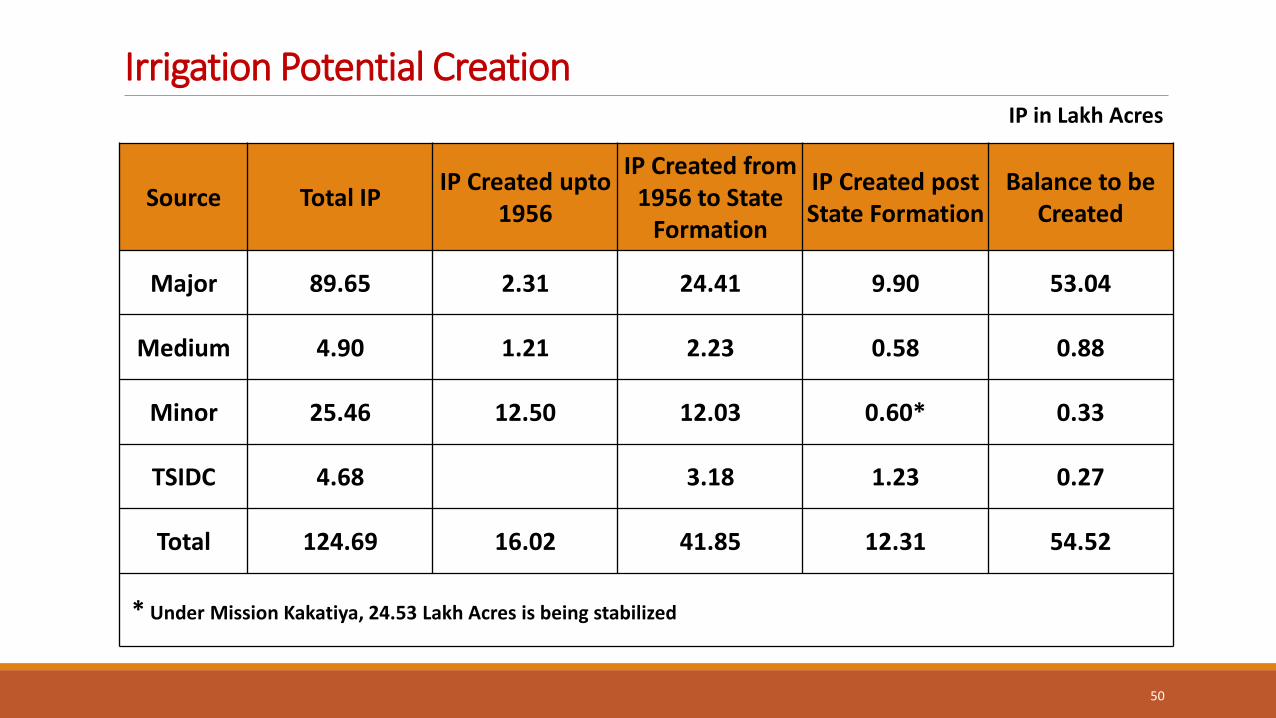
Irrigation Potential Creation
50
Source Total IP IP Created upto
1956
IP Created from 1956 to State
Formation
IP Created post State Formation
Balance to be Created
Major 89.65 2.31 24.41 9.90 53.04
Medium 4.90 1.21 2.23 0.58 0.88
Minor 25.46 12.50 12.03 0.60* 0.33
TSIDC 4.68 3.18 1.23 0.27
Total 124.69 16.02 41.85 12.31 54.52
* Under Mission Kakatiya, 24.53 Lakh Acres is being stabilized
IP in Lakh Acres
51
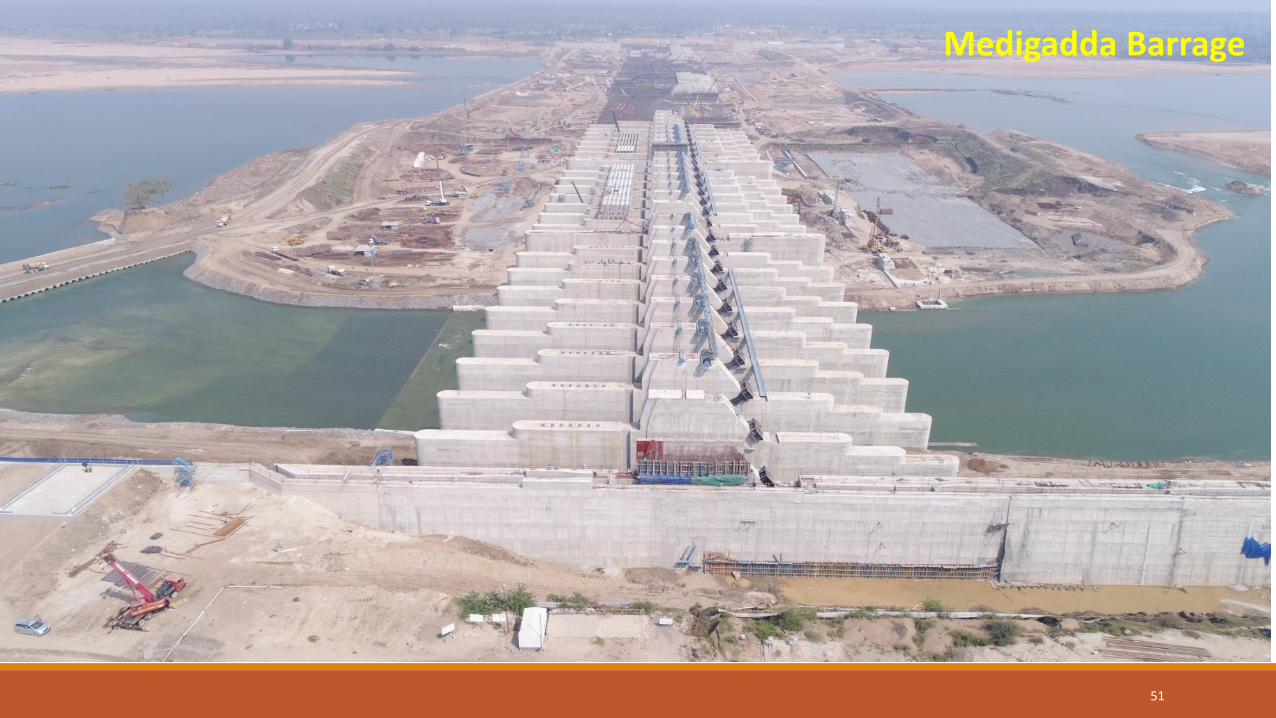
Medigadda Barrage
52
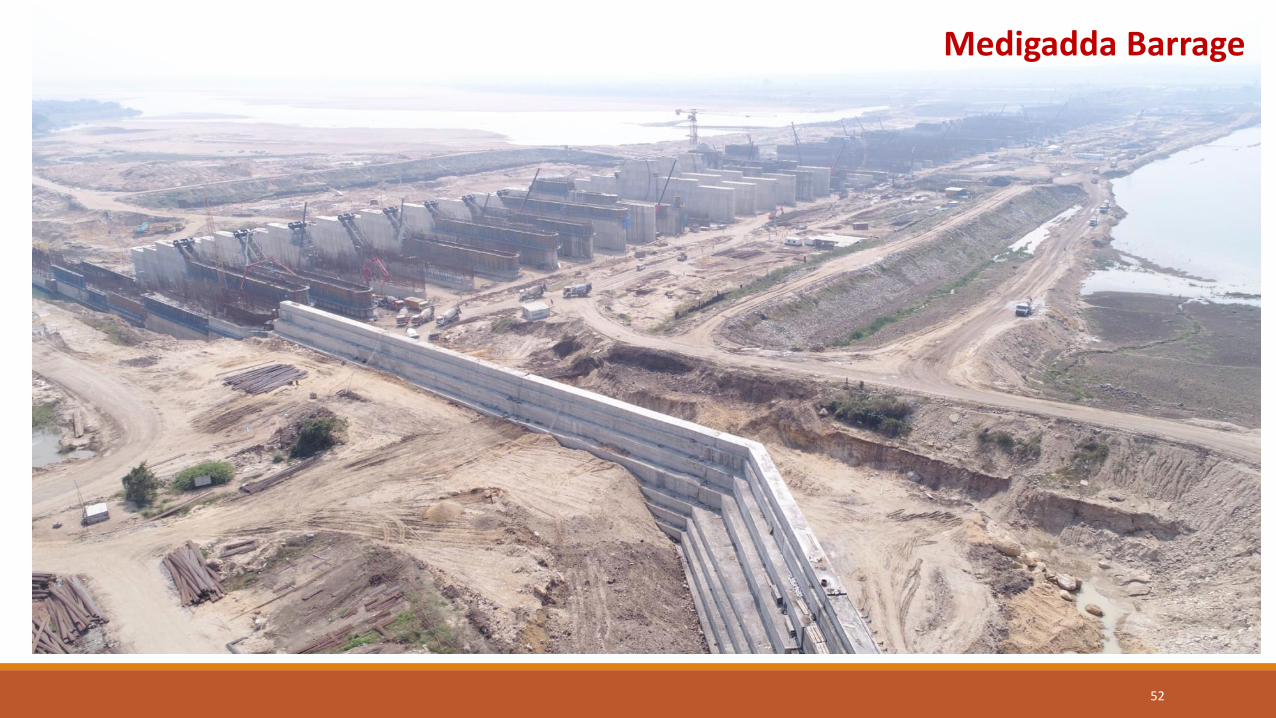
Medigadda Barrage
53
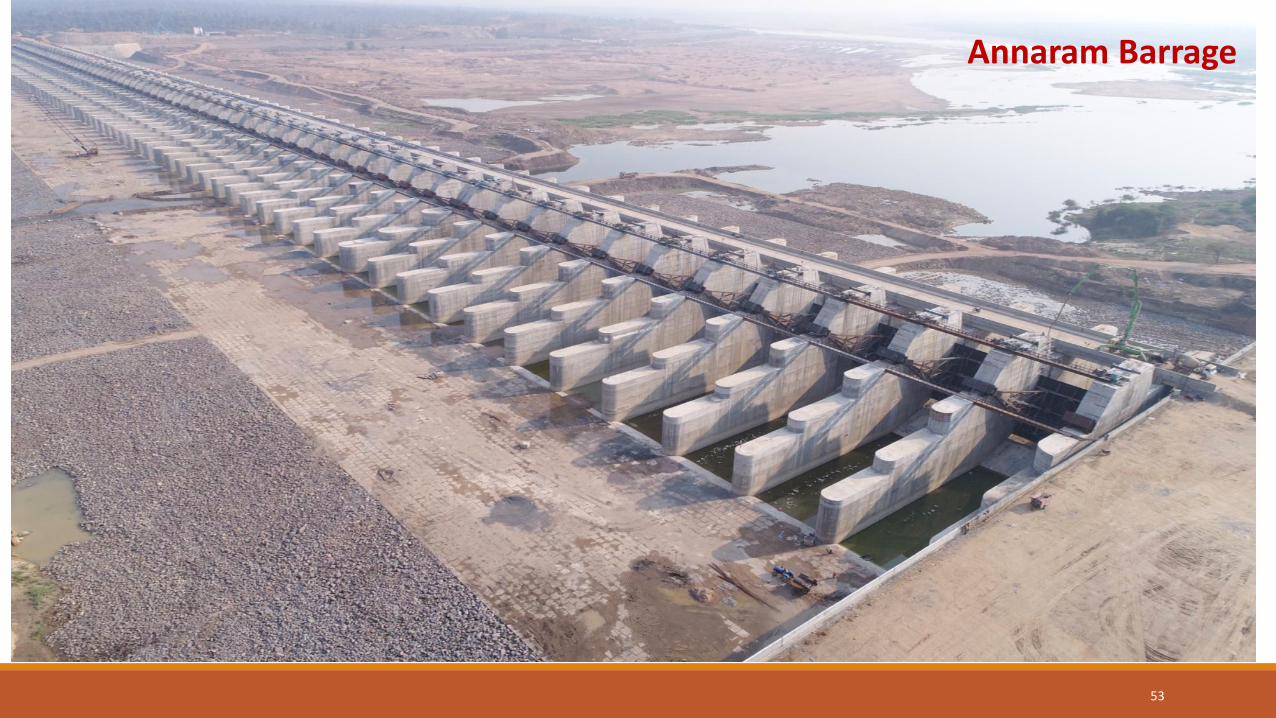
Annaram Barrage
54
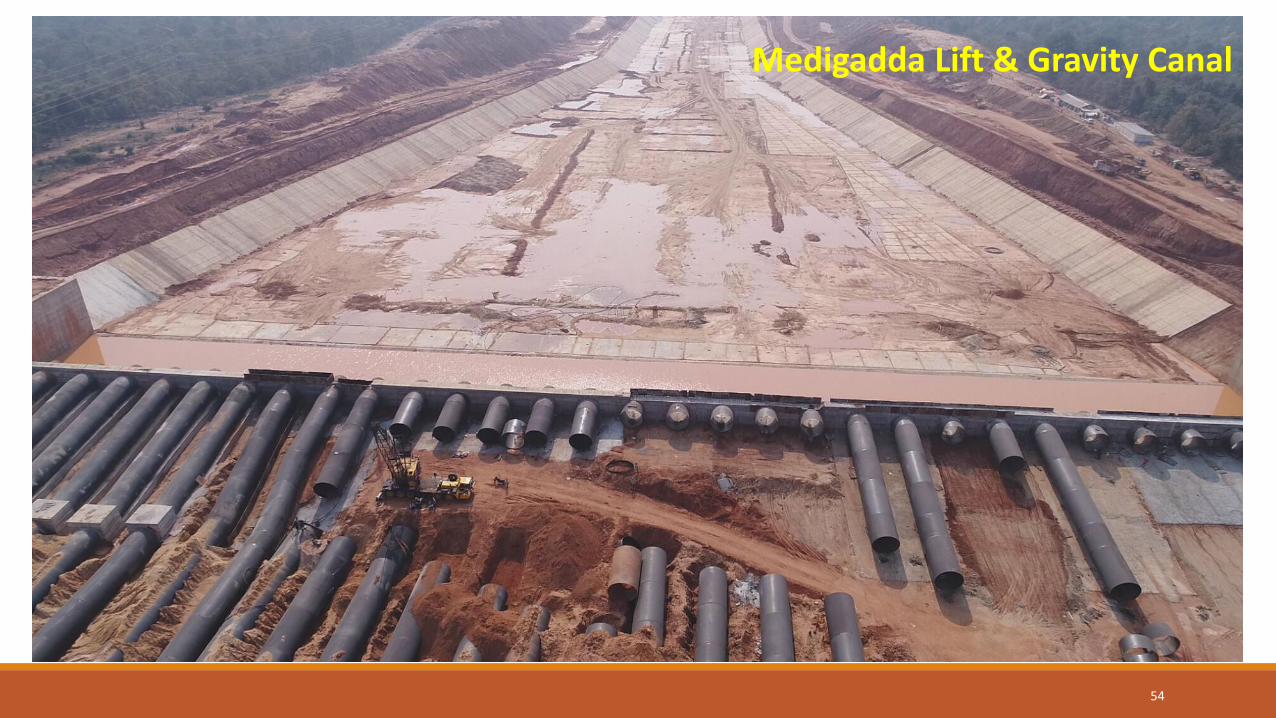
Medigadda Lift & Gravity Canal
55
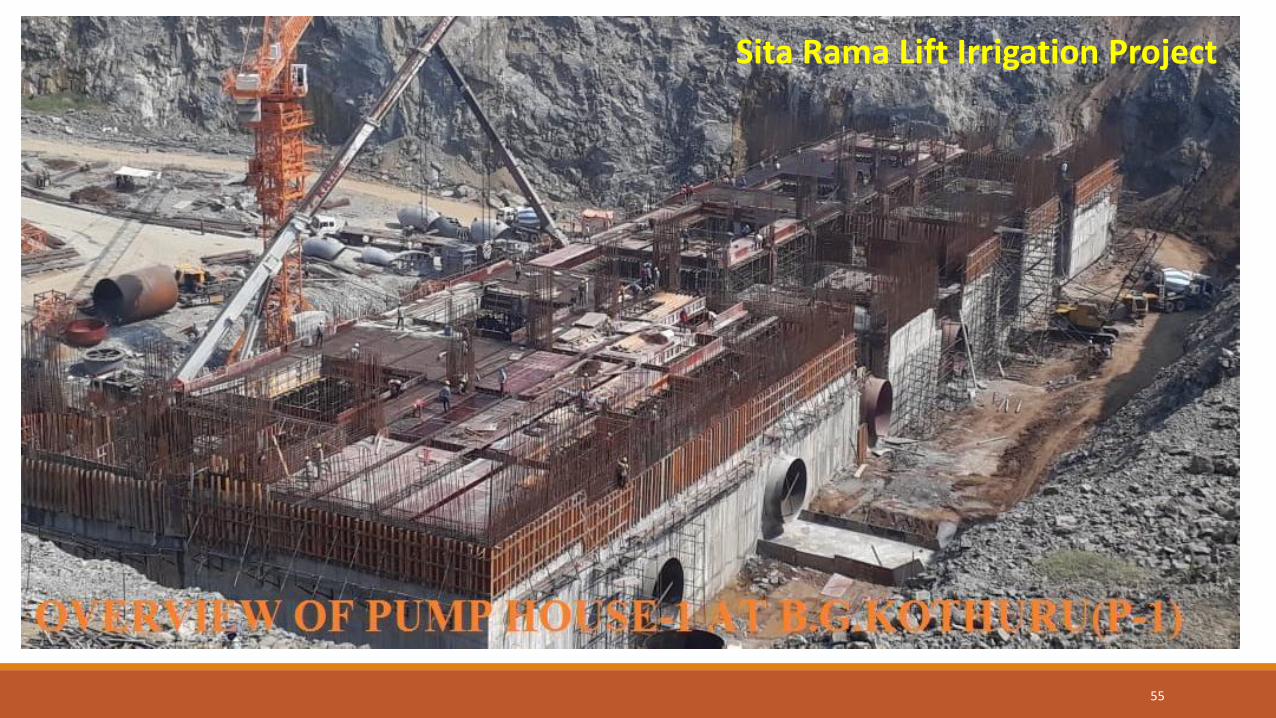
Sita Rama Lift Irrigation Project
56
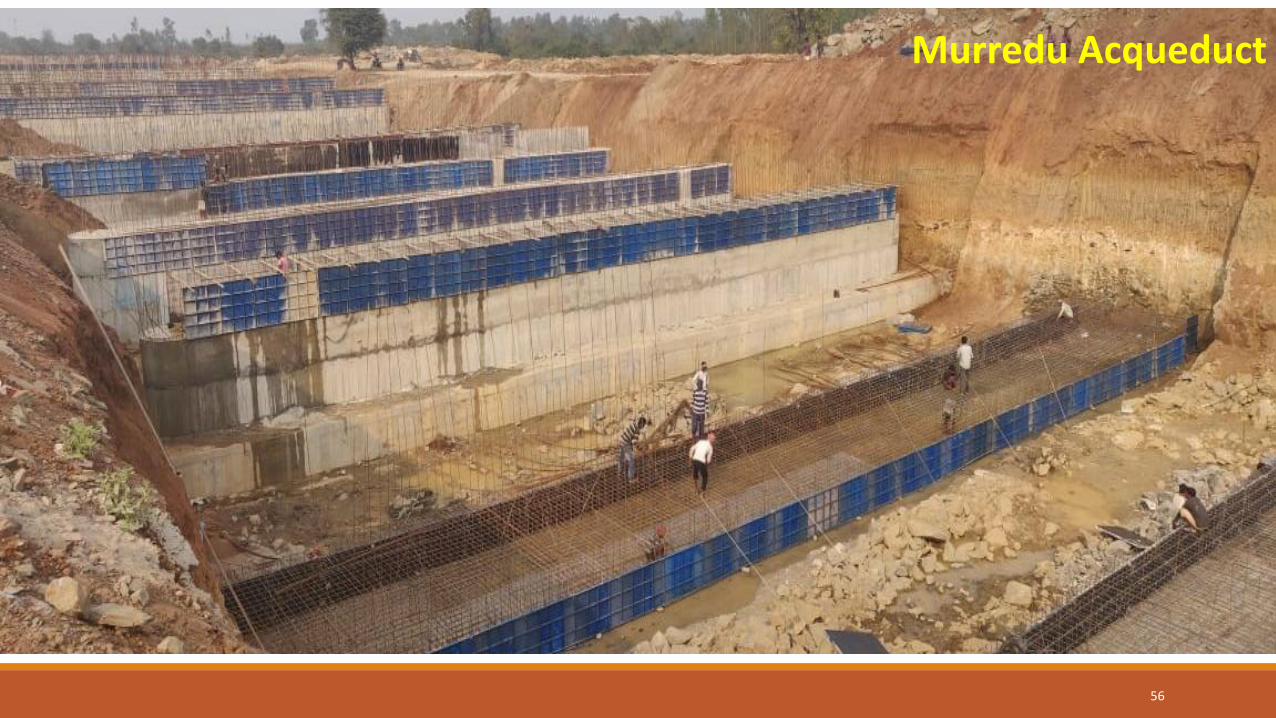
Murredu Acqueduct
57
Palamuru RangaReddy LIS Project
Minor Irrigation
58
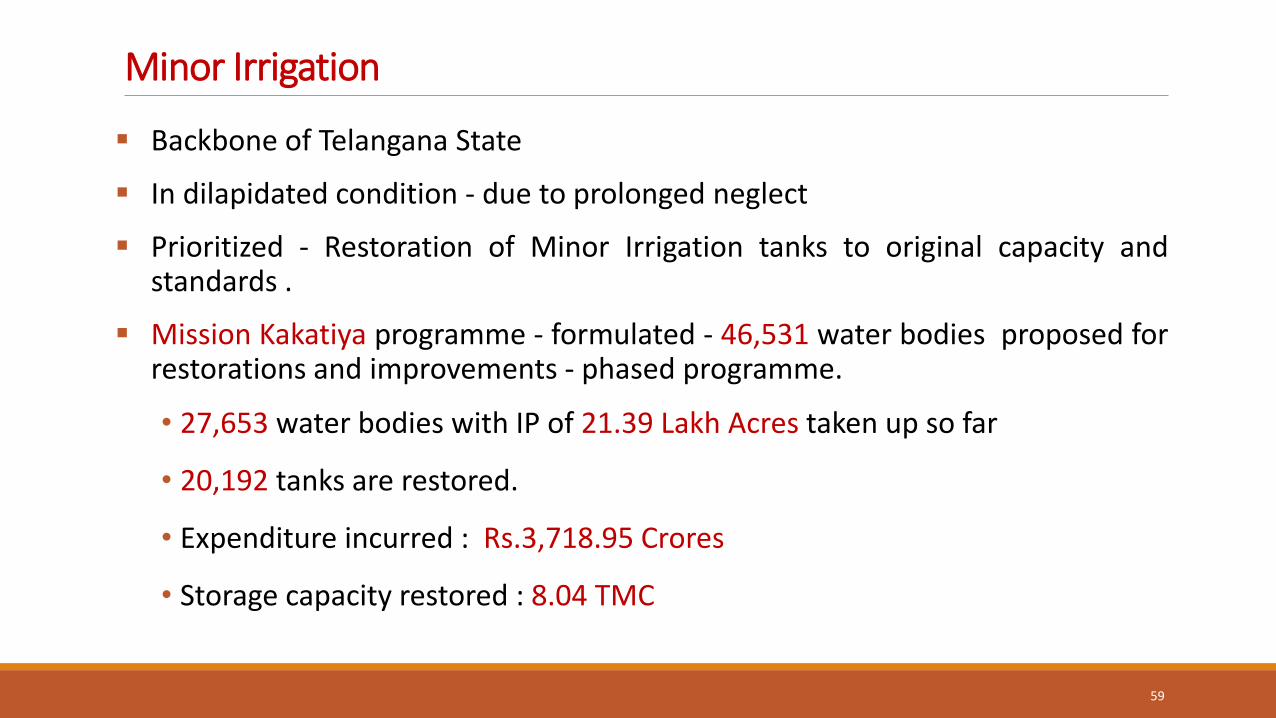
Minor Irrigation
Backbone of Telangana State
In dilapidated condition - due to prolonged neglect
Prioritized - Restoration of Minor Irrigation tanks to original capacity and standards .
Mission Kakatiya programme - formulated - 46,531 water bodies proposed for restorations and improvements - phased programme.
• 27,653 water bodies with IP of 21.39 Lakh Acres taken up so far
• 20,192 tanks are restored.
• Expenditure incurred : Rs.3,718.95 Crores
• Storage capacity restored : 8.04 TMC
59
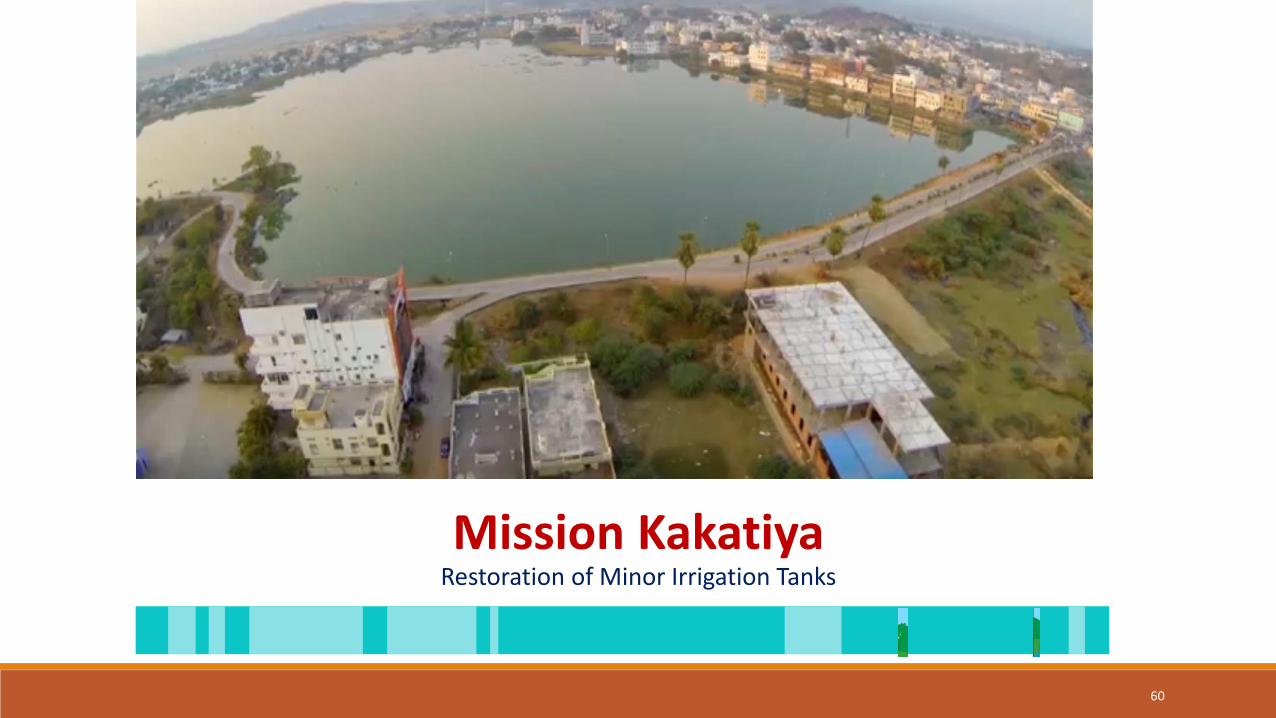
Mission Kakatiya Restoration of Minor Irrigation Tanks
60
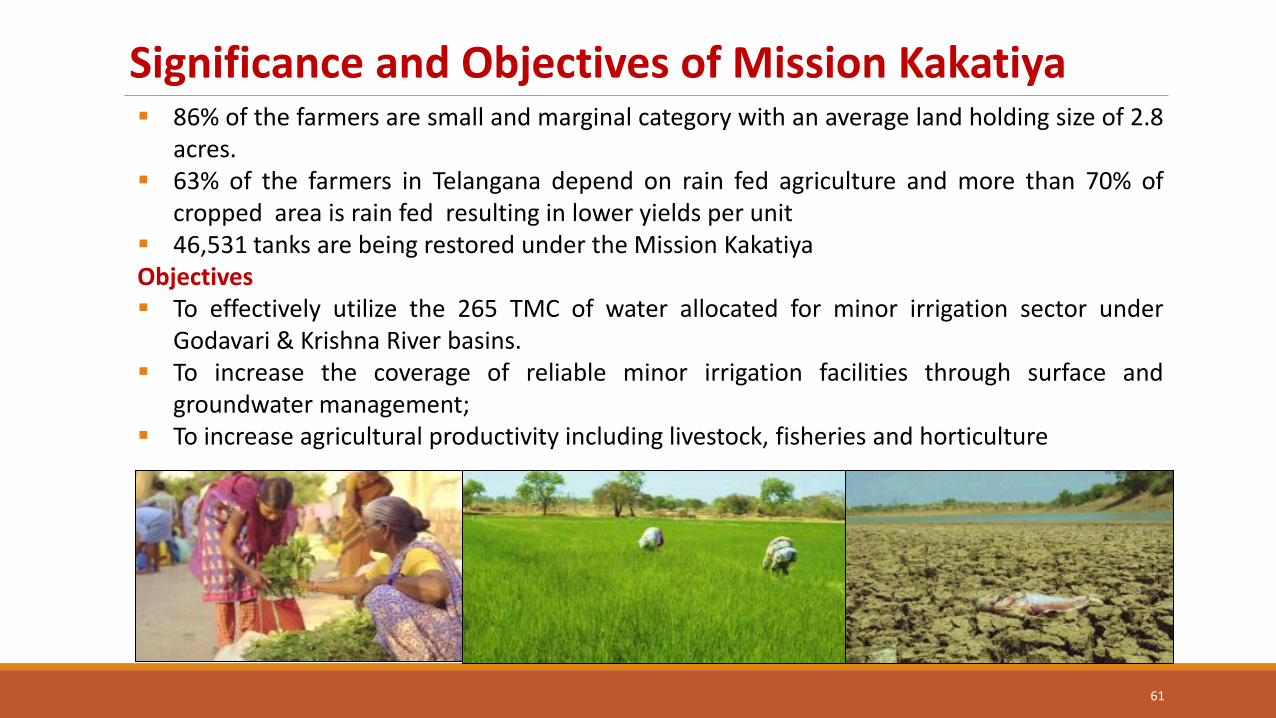
86% of the farmers are small and marginal category with an average land holding size of 2.8 acres.
63% of the farmers in Telangana depend on rain fed agriculture and more than 70% of cropped area is rain fed resulting in lower yields per unit
46,531 tanks are being restored under the Mission Kakatiya Objectives To effectively utilize the 265 TMC of water allocated for minor irrigation sector under
Godavari & Krishna River basins. To increase the coverage of reliable minor irrigation facilities through surface and
groundwater management; To increase agricultural productivity including livestock, fisheries and horticulture
Significance and Objectives of Mission Kakatiya
61
Works carried-out under Mission Kakatiya
De-silting of Tanks
Restoration of Feeder Channels
Re-sectioning of Irrigation Channels
Repairs to CM & CD works
Repairs to Bund , Weir & Sluices
Raising of FTL, wherever possible
62
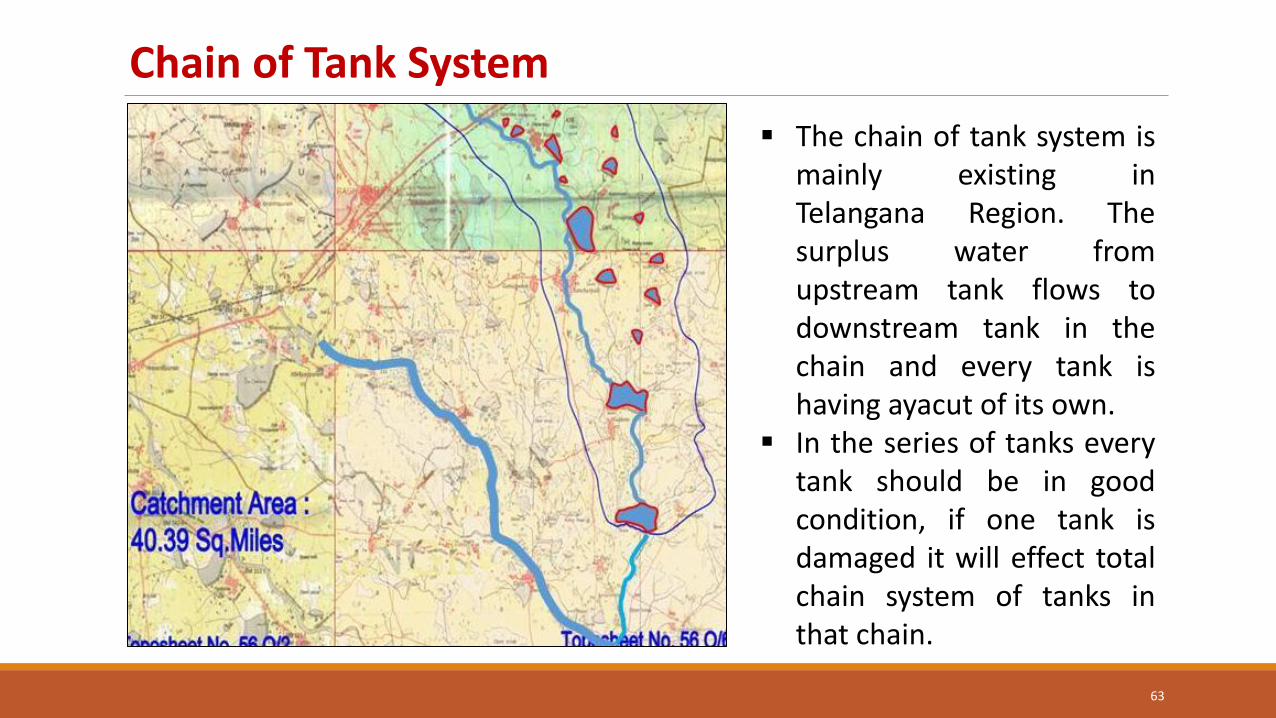
The chain of tank system is mainly existing in Telangana Region. The surplus water from upstream tank flows to downstream tank in the chain and every tank is having ayacut of its own.
In the series of tanks every tank should be in good condition, if one tank is damaged it will effect total chain system of tanks in that chain.
Chain of Tank System
63
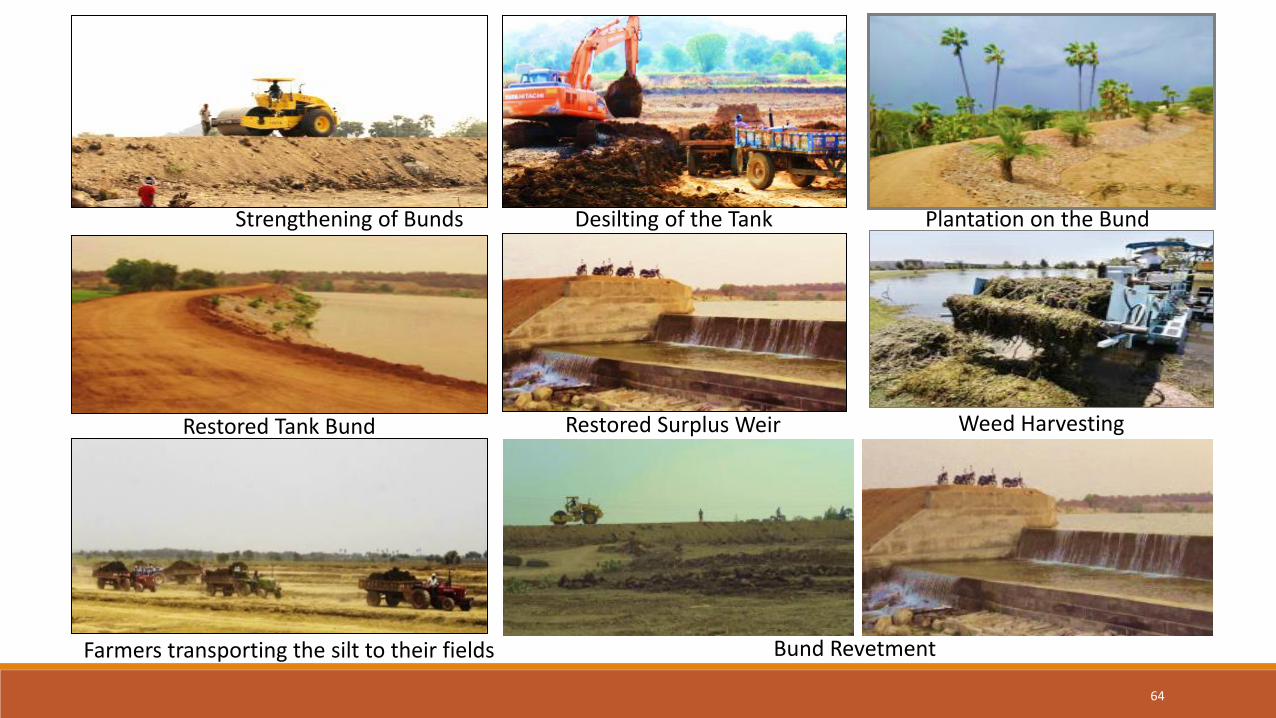
Bund Revetment
Strengthening of Bunds
Restored Surplus Weir Restored Tank Bund
Plantation on the Bund Desilting of the Tank
Weed Harvesting
Farmers transporting the silt to their fields
64
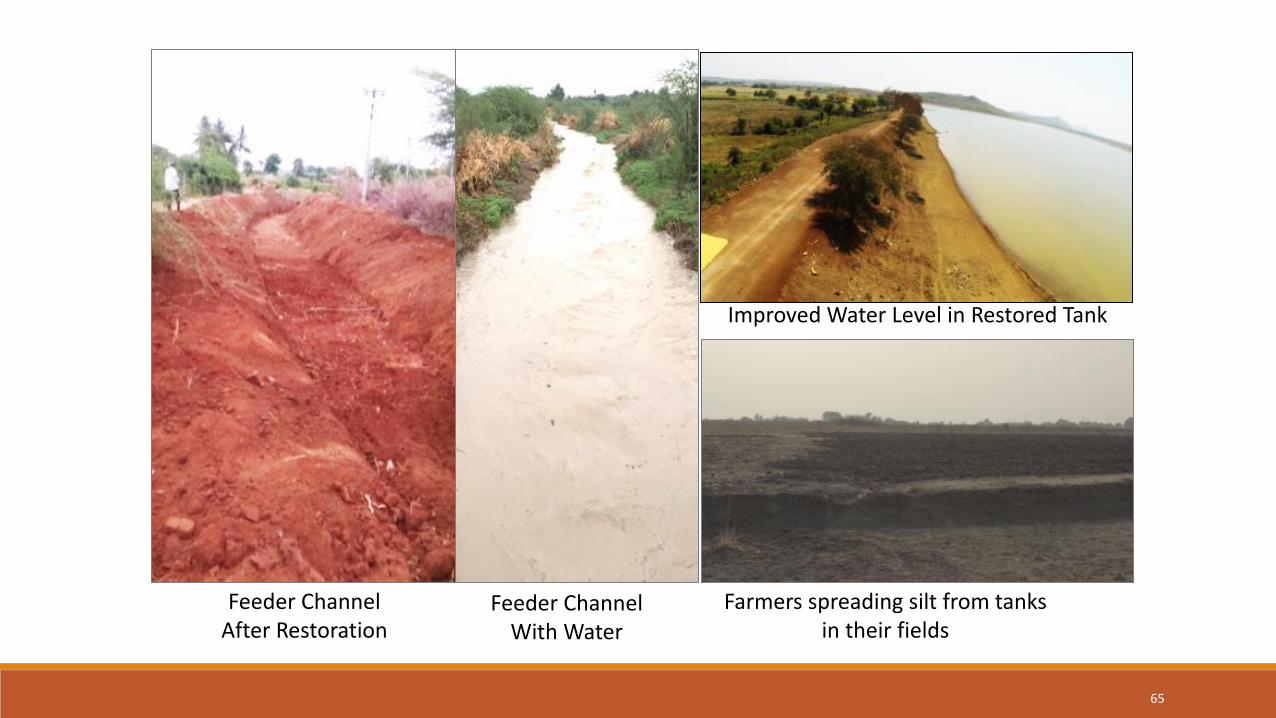
Feeder Channel After Restoration
Feeder Channel With Water
Improved Water Level in Restored Tank
Farmers spreading silt from tanks in their fields
65
Impact of Mission Kakatiya
Increase in groundwater levels in the tank influence areas,
Decrease of 19.2% in the gap ayacut
Increased Irrigation intensity by 45.6% over the base year 2013-14; (increased from 88.4% to 134.0%)
Water availability for the second crop
Increase in the yields of the crops like Paddy, Cotton and Jowar in the tank ayacut and influence zone
66

Industries
67
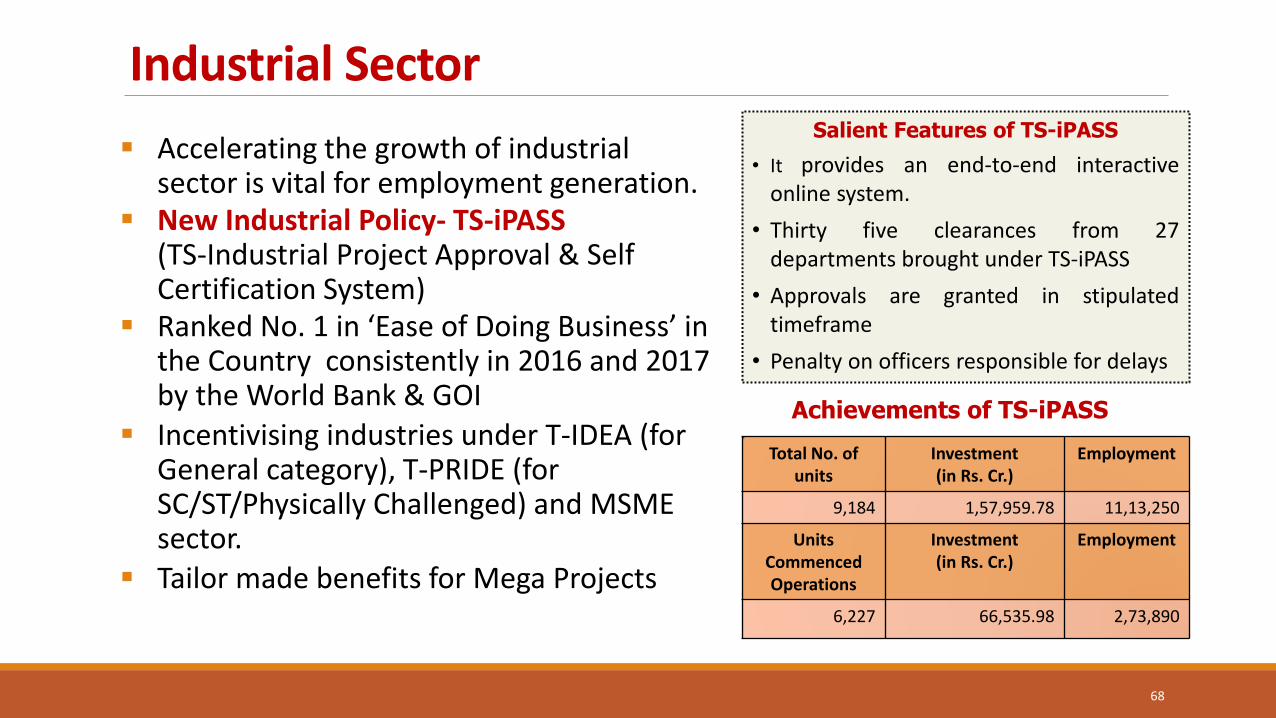
Industrial Sector
Accelerating the growth of industrial sector is vital for employment generation.
New Industrial Policy- TS-iPASS (TS-Industrial Project Approval & Self Certification System)
Ranked No. 1 in ‘Ease of Doing Business’ in the Country consistently in 2016 and 2017 by the World Bank & GOI
Incentivising industries under T-IDEA (for General category), T-PRIDE (for SC/ST/Physically Challenged) and MSME sector.
Tailor made benefits for Mega Projects
68
Salient Features of TS-iPASS
• It provides an end-to-end interactive online system.
• Thirty five clearances from 27 departments brought under TS-iPASS
• Approvals are granted in stipulated timeframe
• Penalty on officers responsible for delays
Total No. of units
Investment (in Rs. Cr.)
Employment
9,184 1,57,959.78 11,13,250
Units Commenced Operations
Investment (in Rs. Cr.)
Employment
6,227 66,535.98 2,73,890
Achievements of TS-iPASS
Slide 69
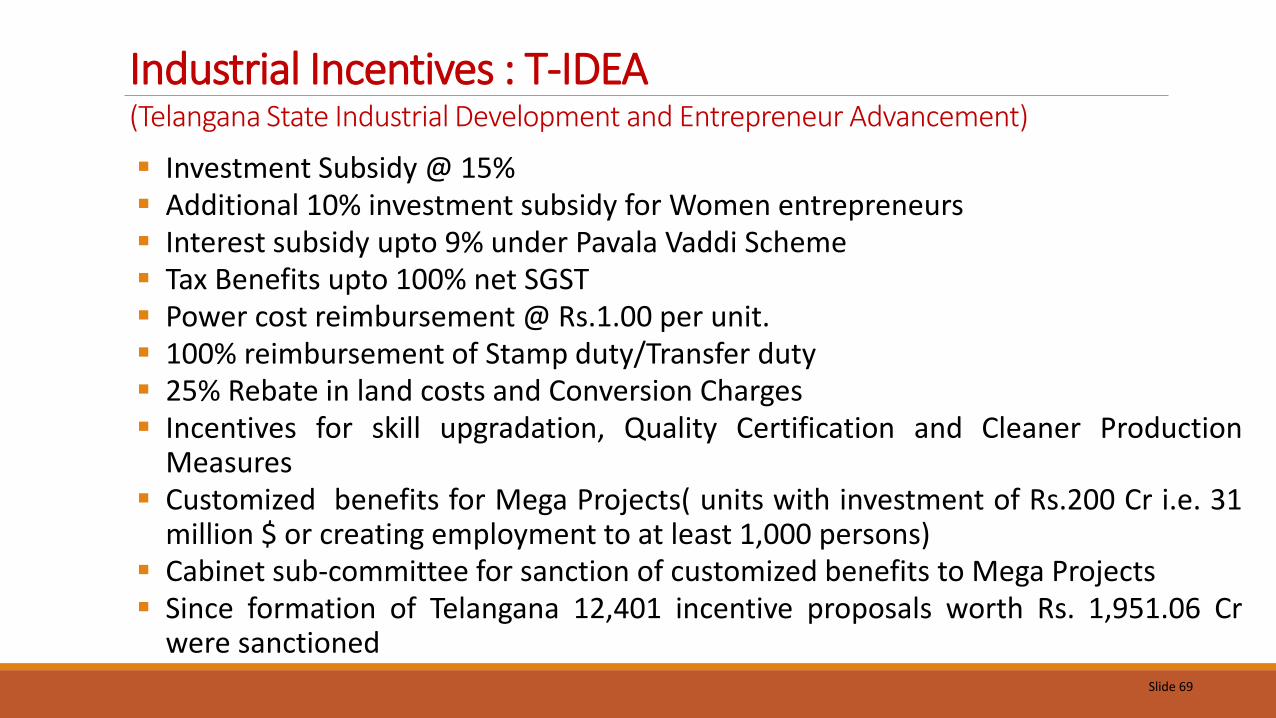
Industrial Incentives : T-IDEA (Telangana State Industrial Development and Entrepreneur Advancement)
Investment Subsidy @ 15% Additional 10% investment subsidy for Women entrepreneurs Interest subsidy upto 9% under Pavala Vaddi Scheme Tax Benefits upto 100% net SGST Power cost reimbursement @ Rs.1.00 per unit. 100% reimbursement of Stamp duty/Transfer duty 25% Rebate in land costs and Conversion Charges Incentives for skill upgradation, Quality Certification and Cleaner Production
Measures Customized benefits for Mega Projects( units with investment of Rs.200 Cr i.e. 31
million $ or creating employment to at least 1,000 persons) Cabinet sub-committee for sanction of customized benefits to Mega Projects Since formation of Telangana 12,401 incentive proposals worth Rs. 1,951.06 Cr
were sanctioned
Slide 70
Industrial Incentives : T-PRIDE (Telangana State Program for Rapid Incubation of Dalit Entrepreneurs)
Investment Subsidy @ 35% Additional 10% investment subsidy for Women entrepreneurs Additional 5% Investment subsidy for units set up in Scheduled Areas
by ST entrepreneurs Interest subsidy upto 9% under Pavala Vaddi Scheme Tax Benefits upto 100% net SGST Power cost reimbursement @ Rs.1.50 per unit. 100% reimbursement of Stamp duty/Transfer duty 50% Rebate in land costs and Conversion Charges Incentives for skill upgradation, Quality Certification and Cleaner
Production Measures
Services Sector
Telangana is one of the major exporter of ITeS services in the country.
Hyderabad has become a premier global destination for IT and ITeS investments.
Proactive initiatives are being taken by the Government to create state-of-the-art physical infrastructure for the growth of the IT Sector in the State.
71
Sectoral Policies Government launched following sector specific policies ITC Policy Frameworks, Electronics Policy IMAGE Policy (Animation & Gaming), Innovation Policy, Rural Technology Policy, Data Centres Policy, Open Data Policy, Cyber Security Policy and Data Analytics Policy.
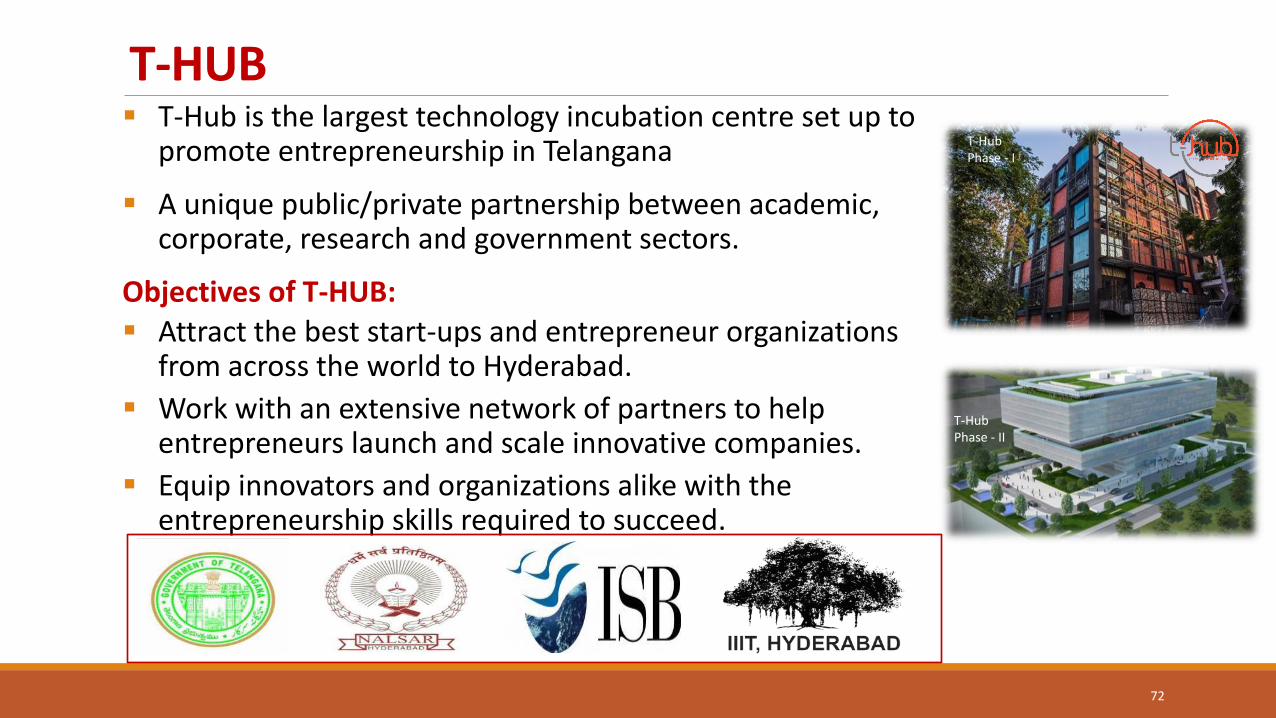
T-HUB T-Hub is the largest technology incubation centre set up to
promote entrepreneurship in Telangana
A unique public/private partnership between academic, corporate, research and government sectors.
Objectives of T-HUB: Attract the best start-ups and entrepreneur organizations
from across the world to Hyderabad.
Work with an extensive network of partners to help entrepreneurs launch and scale innovative companies.
Equip innovators and organizations alike with the entrepreneurship skills required to succeed.
72
T-Hub Phase - II
T-Hub Phase - I
73
Fact File: Physically incubated start-ups: 250 Number of Graduated ventures: 50 Cumulative turnover of ventures (Incubated & Graduated) : Rs. 100 Cr. Funds raised through grand challenges/business plan competitions etc. : Rs. 6 Cr. Cumulative quantum of external funding raised (debt + equity) : Rs. 24 Cr. T-HUB PHASE – II • Coming up in an area of about 3 lakh sq. ft., to house 3,000 entrepreneurs. Awards, Recognitions and MoUs: • T-Hub signed a statement of Cooperation with University of British Columbia to
establish a market access bridge for growth – stage start-ups. • DIPP (Department of Industrial Policy and Promotion) selected T-Hub as one of the top
3 incubators in India • 4 Hyderabad entrepreneurs from 3 T-hub start-ups made it to the Forbes 30 under 30
Asia 2018 list.
T-HUB...
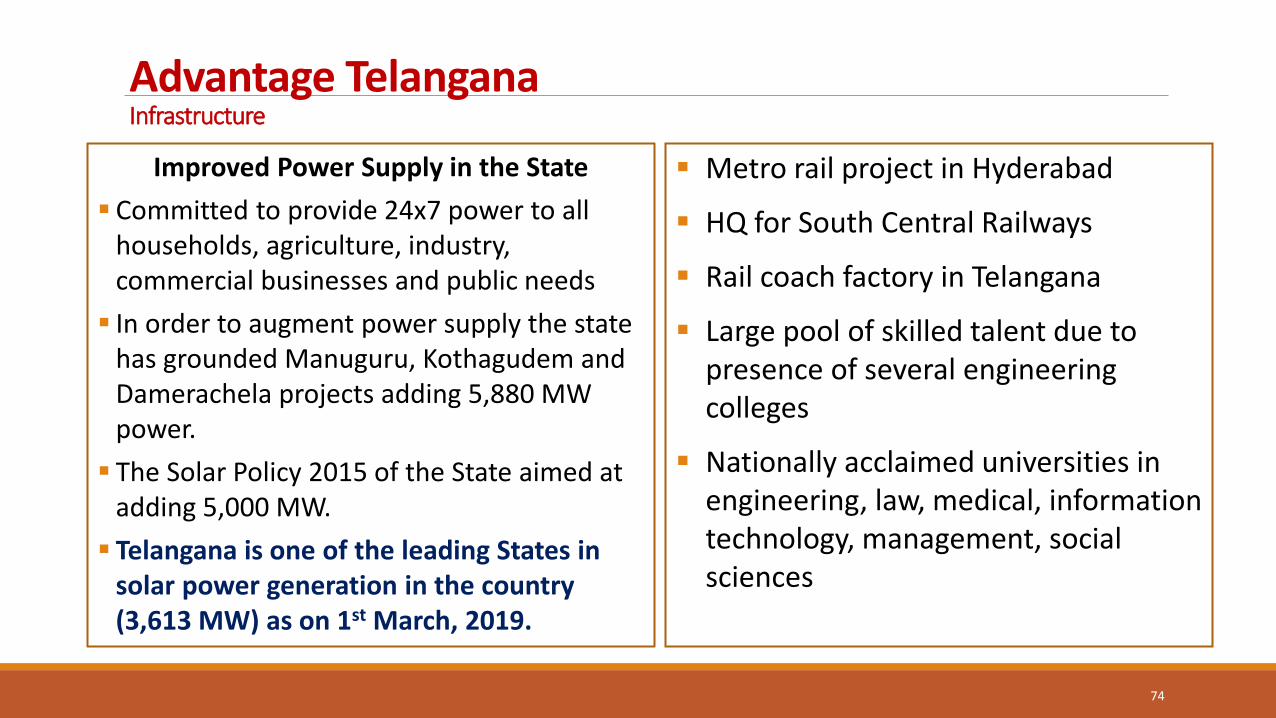
Advantage Telangana Infrastructure
Metro rail project in Hyderabad
HQ for South Central Railways
Rail coach factory in Telangana
Large pool of skilled talent due to presence of several engineering colleges
Nationally acclaimed universities in engineering, law, medical, information technology, management, social sciences
Improved Power Supply in the State
Committed to provide 24x7 power to all households, agriculture, industry, commercial businesses and public needs
In order to augment power supply the state has grounded Manuguru, Kothagudem and Damerachela projects adding 5,880 MW power.
The Solar Policy 2015 of the State aimed at adding 5,000 MW.
Telangana is one of the leading States in solar power generation in the country (3,613 MW) as on 1st March, 2019.
74
Education
75
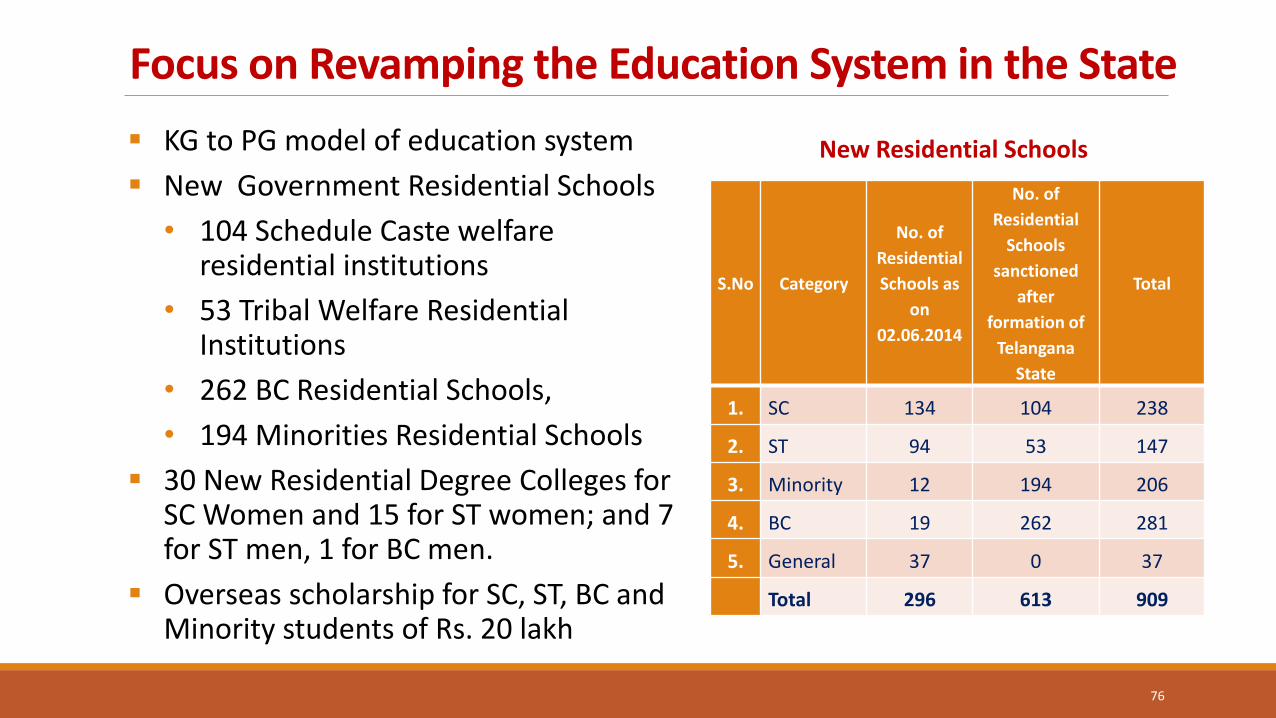
Focus on Revamping the Education System in the State
KG to PG model of education system
New Government Residential Schools
• 104 Schedule Caste welfare residential institutions
• 53 Tribal Welfare Residential Institutions
• 262 BC Residential Schools,
• 194 Minorities Residential Schools
30 New Residential Degree Colleges for SC Women and 15 for ST women; and 7 for ST men, 1 for BC men.
Overseas scholarship for SC, ST, BC and Minority students of Rs. 20 lakh
76
S.No Category
No. of
Residential
Schools as
on
02.06.2014
No. of
Residential
Schools
sanctioned
after
formation of
Telangana
State
Total
1. SC 134 104 238
2. ST 94 53 147
3. Minority 12 194 206
4. BC 19 262 281
5. General 37 0 37
Total 296 613 909
New Residential Schools
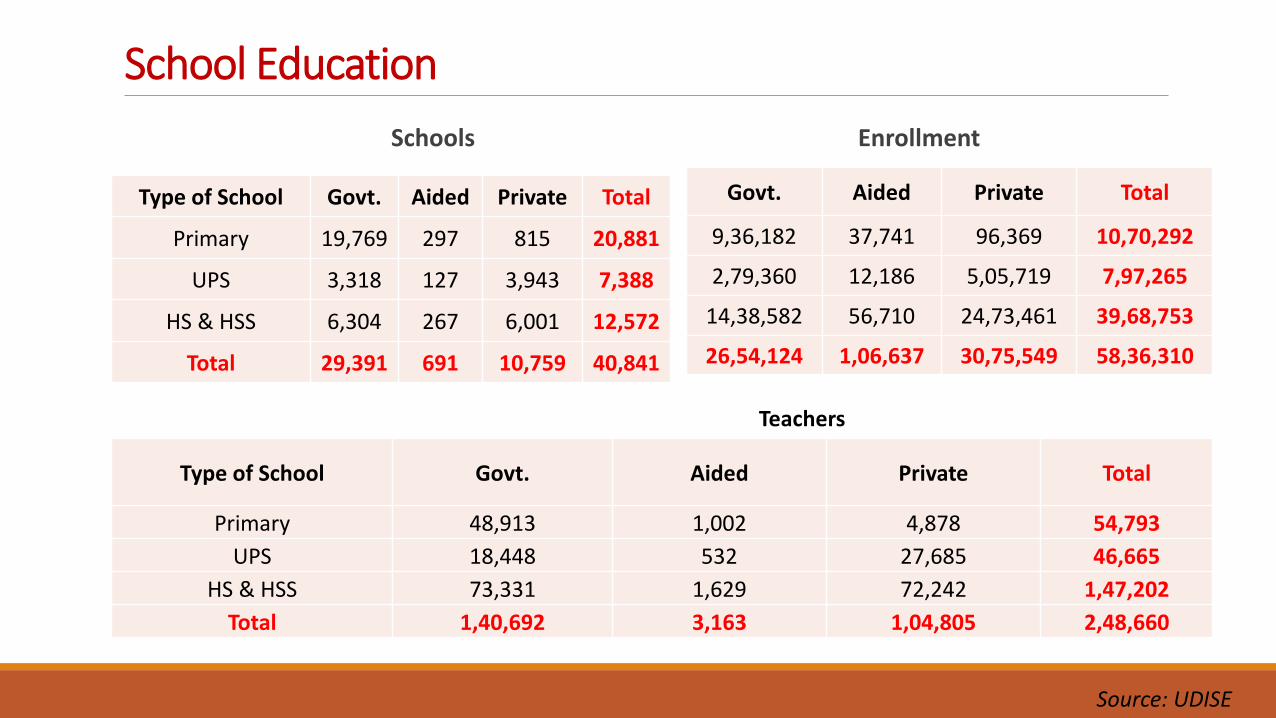
School Education
Schools Enrollment
Type of School Govt. Aided Private Total
Primary 19,769 297 815 20,881
UPS 3,318 127 3,943 7,388
HS & HSS 6,304 267 6,001 12,572
Total 29,391 691 10,759 40,841
Govt. Aided Private Total
9,36,182 37,741 96,369 10,70,292
2,79,360 12,186 5,05,719 7,97,265
14,38,582 56,710 24,73,461 39,68,753
26,54,124 1,06,637 30,75,549 58,36,310
Type of School Govt. Aided Private Total
Primary 48,913 1,002 4,878 54,793
UPS 18,448 532 27,685 46,665
HS & HSS 73,331 1,629 72,242 1,47,202
Total 1,40,692 3,163 1,04,805 2,48,660
Source: UDISE
Teachers
78
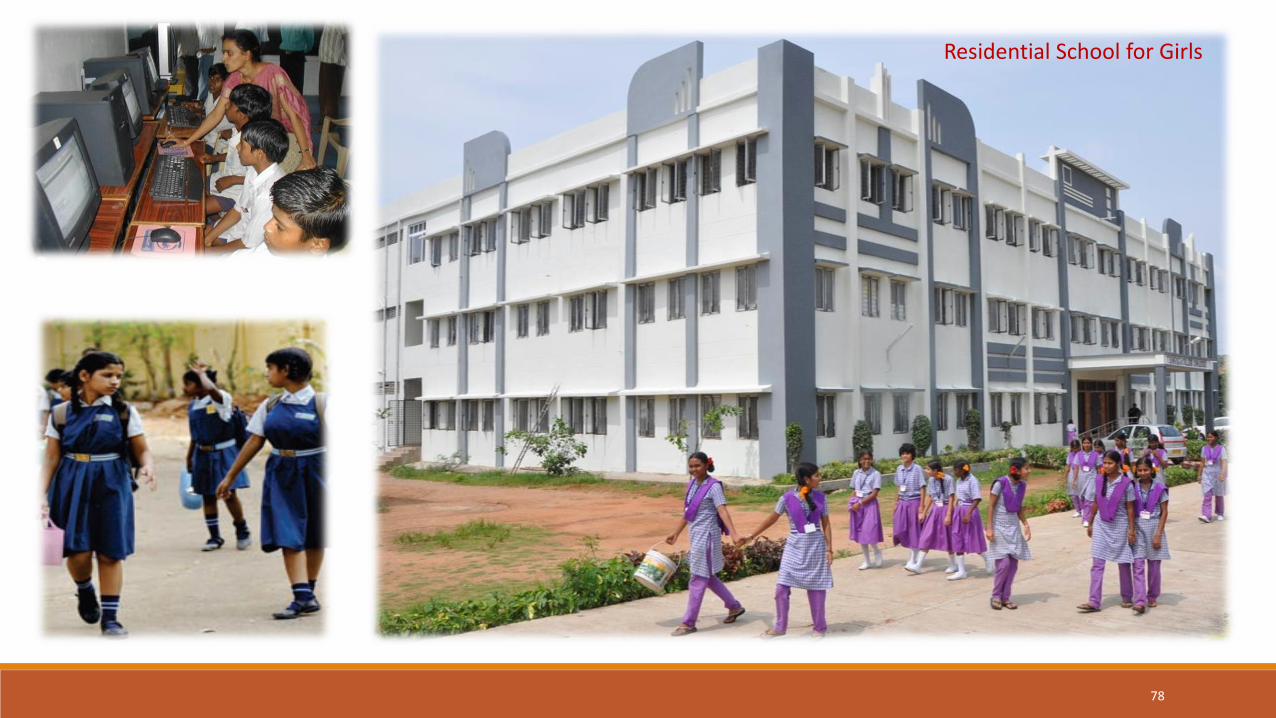
Residential School for Girls
79
80

Health
81
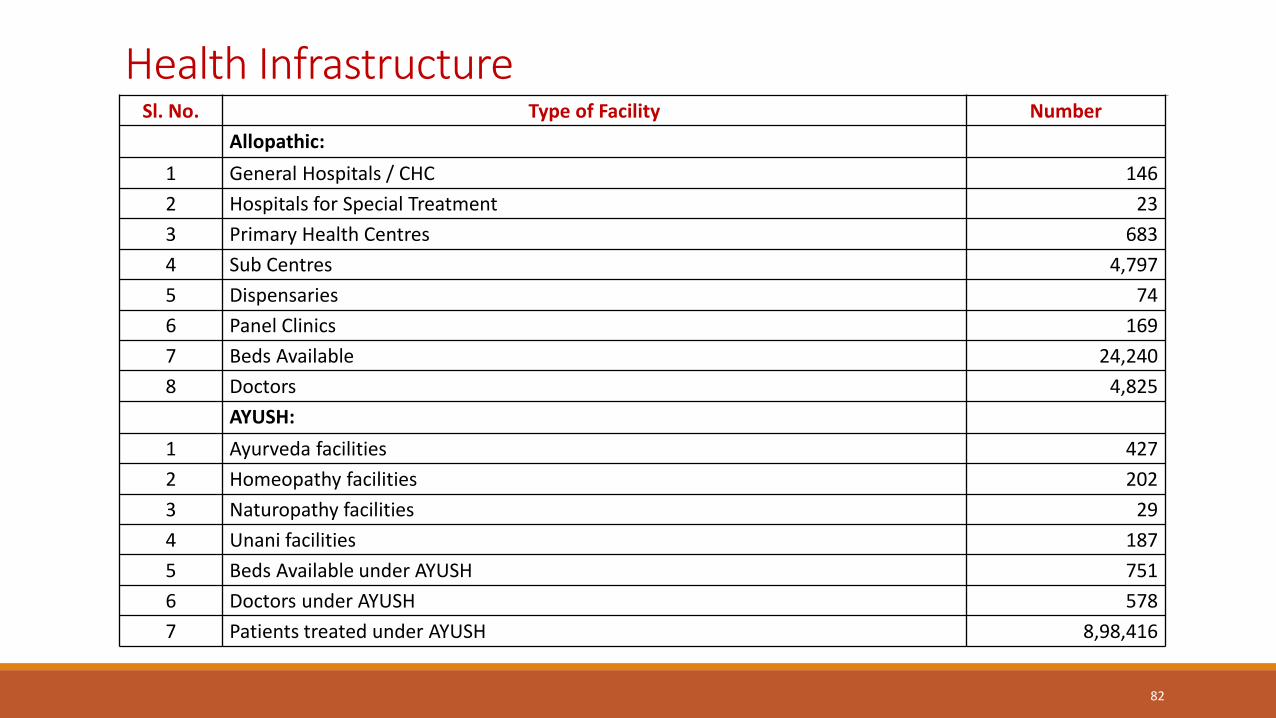
Health Infrastructure Sl. No. Type of Facility Number
Allopathic:
1 General Hospitals / CHC 146
2 Hospitals for Special Treatment 23
3 Primary Health Centres 683
4 Sub Centres 4,797
5 Dispensaries 74
6 Panel Clinics 169
7 Beds Available 24,240
8 Doctors 4,825
AYUSH:
1 Ayurveda facilities 427
2 Homeopathy facilities 202
3 Naturopathy facilities 29
4 Unani facilities 187
5 Beds Available under AYUSH 751
6 Doctors under AYUSH 578
7 Patients treated under AYUSH 8,98,416
82
83
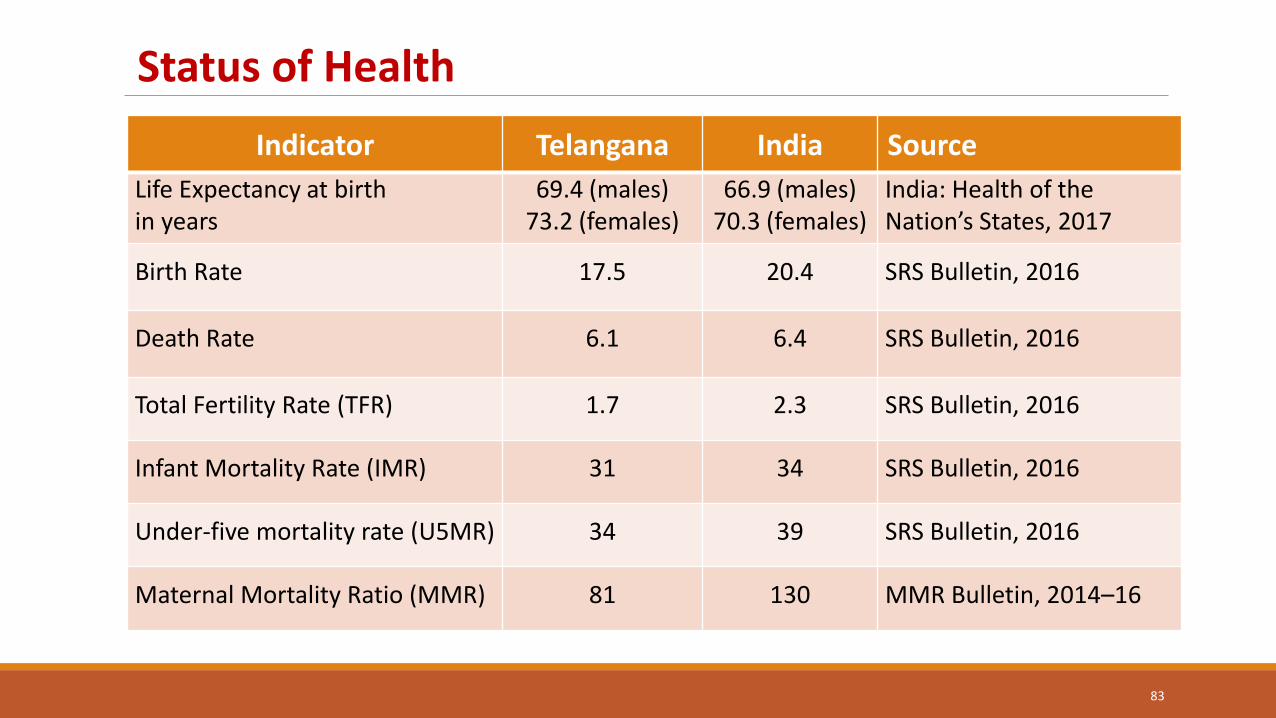
Indicator Telangana India Source
Life Expectancy at birth in years
69.4 (males) 73.2 (females)
66.9 (males) 70.3 (females)
India: Health of the Nation’s States, 2017
Birth Rate 17.5 20.4 SRS Bulletin, 2016
Death Rate 6.1 6.4 SRS Bulletin, 2016
Total Fertility Rate (TFR) 1.7 2.3 SRS Bulletin, 2016
Infant Mortality Rate (IMR) 31 34 SRS Bulletin, 2016
Under-five mortality rate (U5MR) 34 39 SRS Bulletin, 2016
Maternal Mortality Ratio (MMR) 81 130 MMR Bulletin, 2014–16
Status of Health
Revamping the Healthcare System in the State
84
Improvement in infrastructure and maintenance at Government hospitals “KCR Kit Scheme” for pregnant women (16 essential items) to encourage institutional deliveries at public health facilities.
Financial incentives of Rs. 12,000 (M)/13,000(F) is provided to the women who gave birth to the child in Government hospitals/PHC Centre’s in 3 instalments.
Arogya Laxmi scheme to improve nutritional status of mothers Under the ‘Amma Vodi scheme – free transport facilities through ambulance for regular check-ups and tests.
Major Maternal Health Initiatives The infrastructure is being strengthened with 100 bedded Maternal and Child
Health (MCH) blocks being planned in all districts.
At present nine 150 bedded MCH blocks are operational in nine districts
Government is planning to have these MCH blocks in all districts attached to the district hospitals.
All labour rooms are being standardized by making necessary repairs, painting, providing curtains and toilets, procuring equipment etc.
The Dakshata programme is implemented • to improve intra natal and post-natal care through skill development activities;
• to prevent needless deaths of mothers and new born due to preventable complications; and
• to increase the institutional deliveries in public health facilities.
A residential 18-month Midwifery Course is being started.
85
86
KCR Kit KCR Kits Scheme is aimed at the wellbeing of pregnant and lactating women and
the newborn babies.
The pregnant women are given Rs 12,000 financial assistance in three installments. Rs 1,000 given additionally if the baby happens to be a girl.
The idea is to encourage more and more deliveries in the government hospitals, reduce the infant mortality rate and female foeticide.
Immediately after the delivery, Government gives KCR Kit with 16 items consisting of clothes, baby soaps, oil, powder, mosquito net, toys, napkins, diapers etc.
After the delivery, the mother and newborn are provided with transportation through Amma Vodi vehicles.
Introduction of KCR Kit Scheme has resulted in increasing the public health institutional deliveries by about 16% from 32.8% to 47.2% since the launch in June, 2017.
87
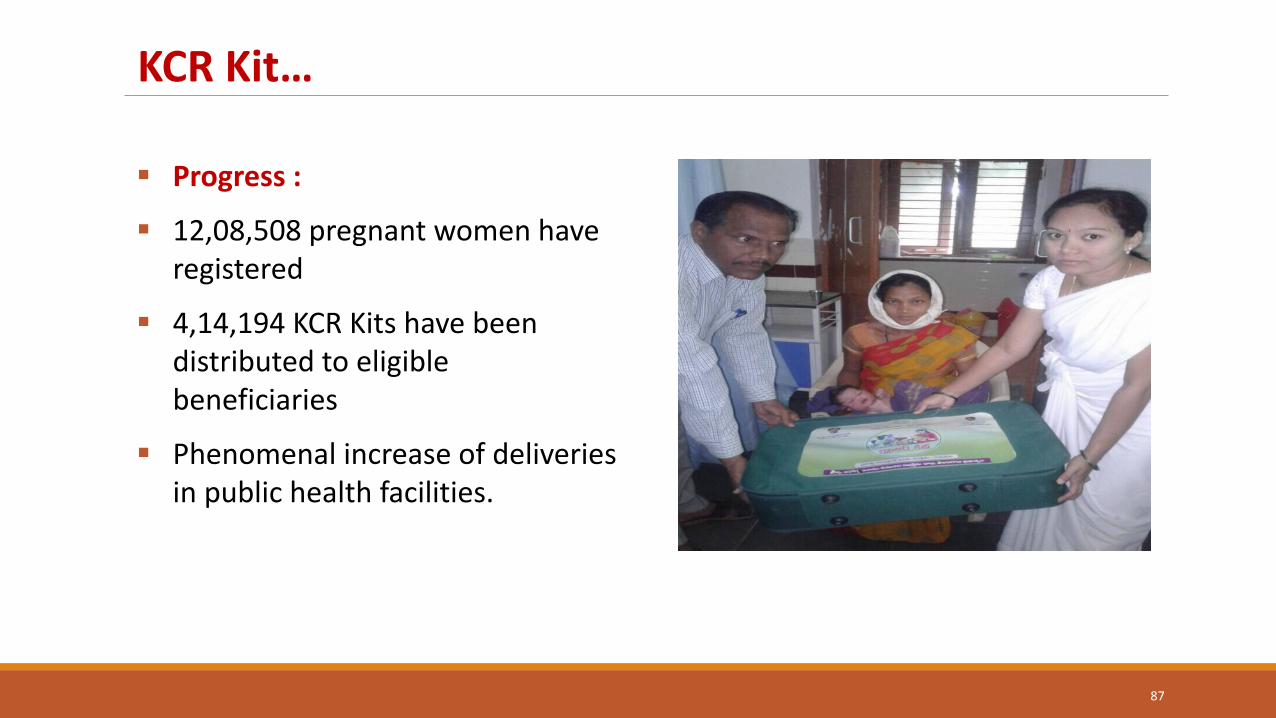
KCR Kit…
Progress :
12,08,508 pregnant women have registered
4,14,194 KCR Kits have been distributed to eligible beneficiaries
Phenomenal increase of deliveries in public health facilities.
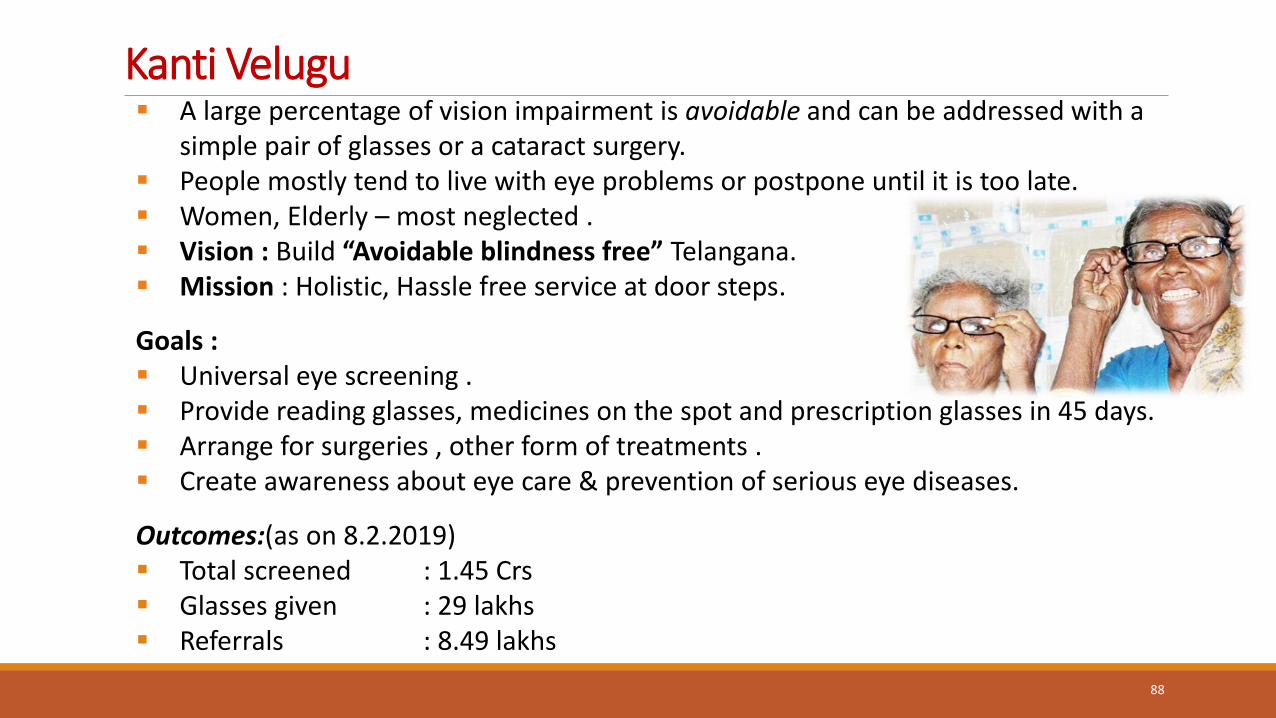
Kanti Velugu A large percentage of vision impairment is avoidable and can be addressed with a
simple pair of glasses or a cataract surgery. People mostly tend to live with eye problems or postpone until it is too late. Women, Elderly – most neglected . Vision : Build “Avoidable blindness free” Telangana. Mission : Holistic, Hassle free service at door steps.
Goals : Universal eye screening . Provide reading glasses, medicines on the spot and prescription glasses in 45 days. Arrange for surgeries , other form of treatments . Create awareness about eye care & prevention of serious eye diseases.
Outcomes:(as on 8.2.2019) Total screened : 1.45 Crs Glasses given : 29 lakhs Referrals : 8.49 lakhs
88
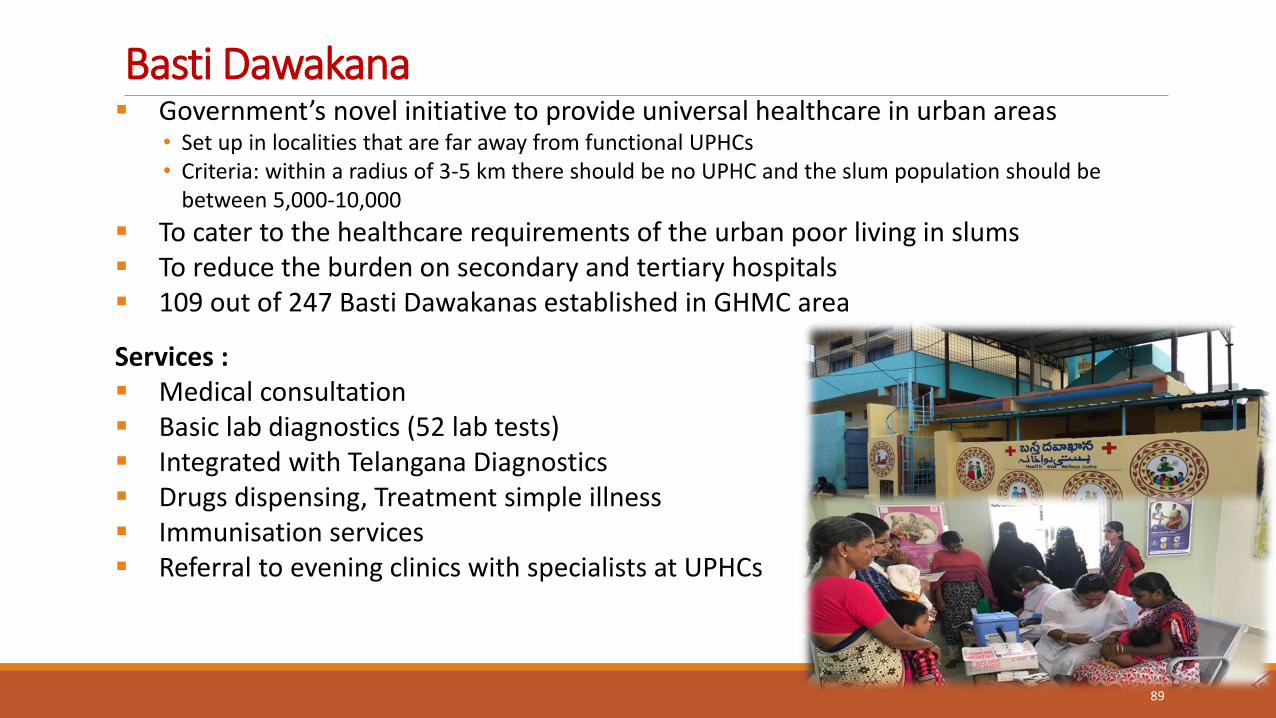
Basti Dawakana Government’s novel initiative to provide universal healthcare in urban areas
• Set up in localities that are far away from functional UPHCs • Criteria: within a radius of 3-5 km there should be no UPHC and the slum population should be
between 5,000-10,000
To cater to the healthcare requirements of the urban poor living in slums To reduce the burden on secondary and tertiary hospitals 109 out of 247 Basti Dawakanas established in GHMC area
Services : Medical consultation Basic lab diagnostics (52 lab tests) Integrated with Telangana Diagnostics Drugs dispensing, Treatment simple illness Immunisation services Referral to evening clinics with specialists at UPHCs
89
Women Development & Child Welfare
90
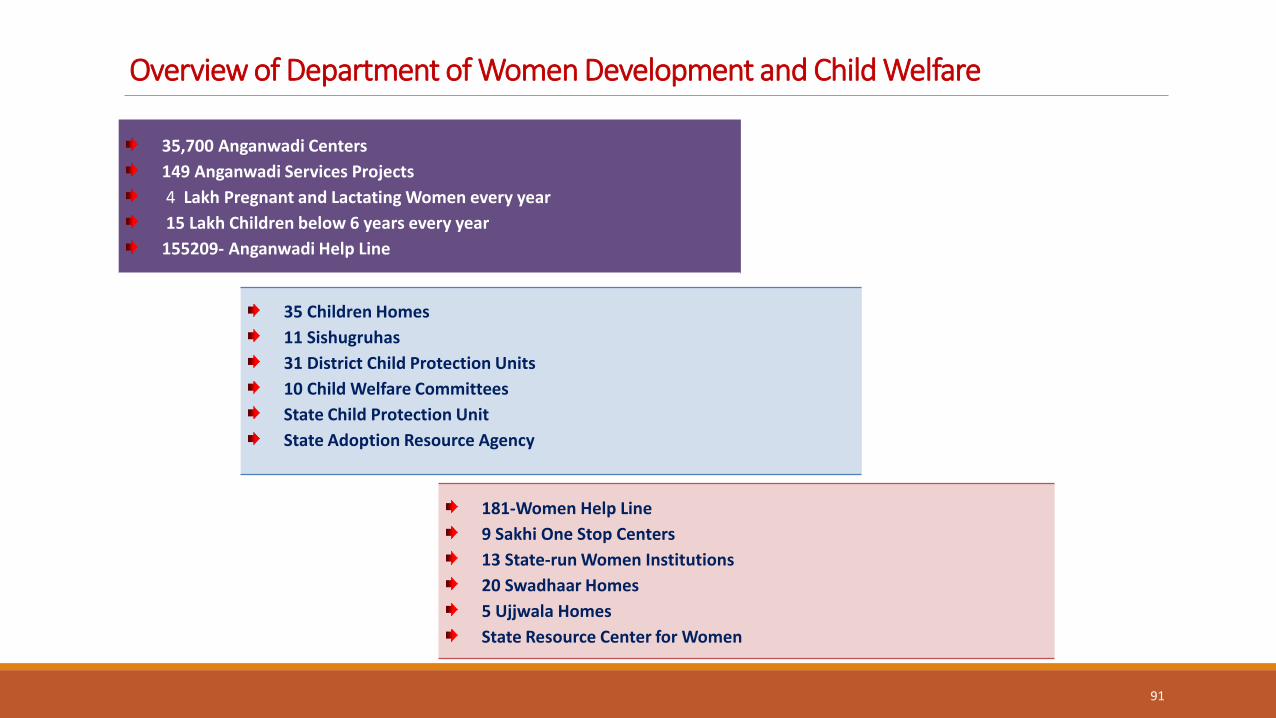
Overview of Department of Women Development and Child Welfare
35,700 Anganwadi Centers
149 Anganwadi Services Projects
4 Lakh Pregnant and Lactating Women every year
15 Lakh Children below 6 years every year
155209- Anganwadi Help Line
35 Children Homes
11 Sishugruhas
31 District Child Protection Units
10 Child Welfare Committees
State Child Protection Unit
State Adoption Resource Agency
181-Women Help Line
9 Sakhi One Stop Centers
13 State-run Women Institutions
20 Swadhaar Homes
5 Ujjwala Homes
State Resource Center for Women
91
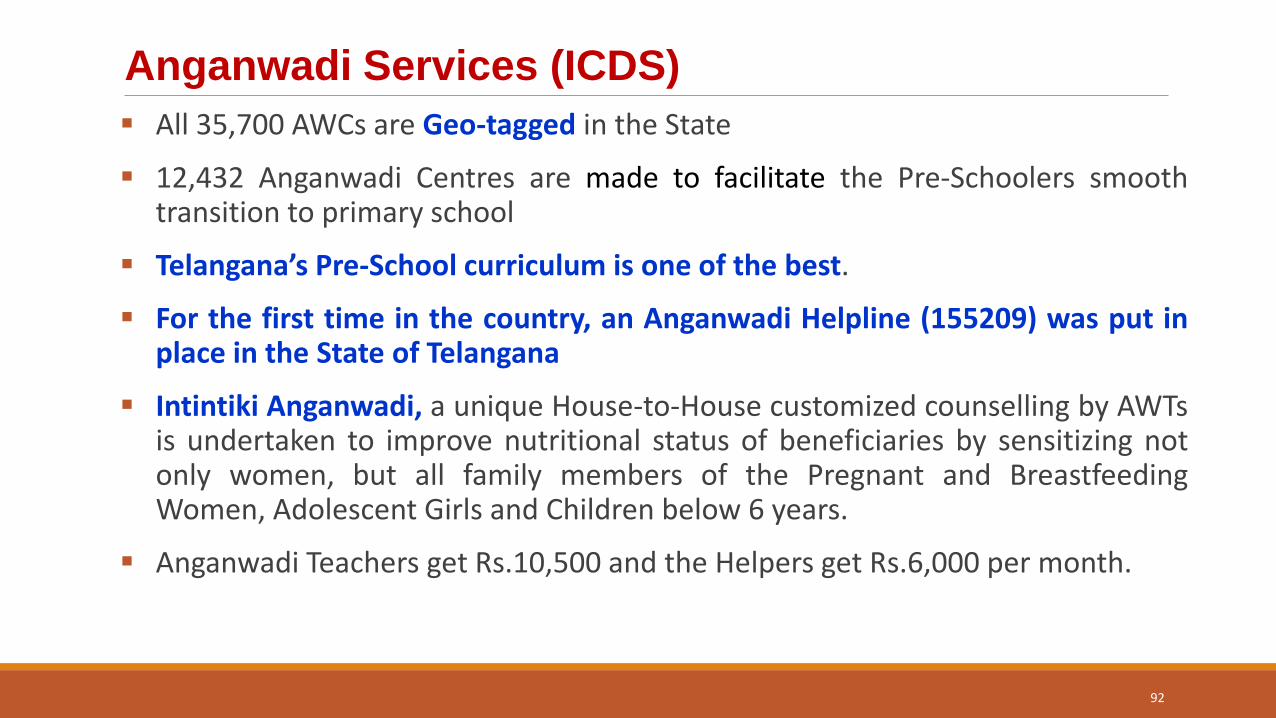
All 35,700 AWCs are Geo-tagged in the State
12,432 Anganwadi Centres are made to facilitate the Pre-Schoolers smooth transition to primary school
Telangana’s Pre-School curriculum is one of the best.
For the first time in the country, an Anganwadi Helpline (155209) was put in place in the State of Telangana
Intintiki Anganwadi, a unique House-to-House customized counselling by AWTs is undertaken to improve nutritional status of beneficiaries by sensitizing not only women, but all family members of the Pregnant and Breastfeeding Women, Adolescent Girls and Children below 6 years.
Anganwadi Teachers get Rs.10,500 and the Helpers get Rs.6,000 per month.
Anganwadi Services (ICDS)
92
Nutrition Programme
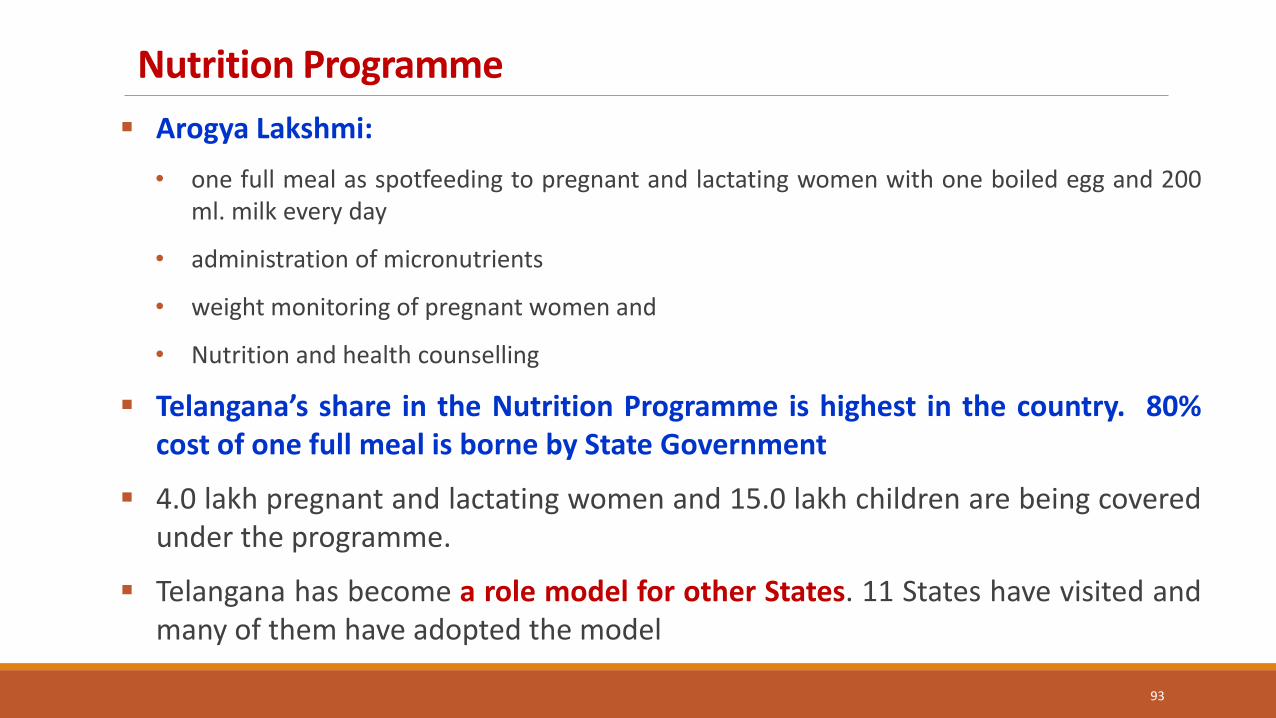
Arogya Lakshmi:
• one full meal as spotfeeding to pregnant and lactating women with one boiled egg and 200 ml. milk every day
• administration of micronutrients
• weight monitoring of pregnant women and
• Nutrition and health counselling
Telangana’s share in the Nutrition Programme is highest in the country. 80% cost of one full meal is borne by State Government
4.0 lakh pregnant and lactating women and 15.0 lakh children are being covered under the programme.
Telangana has become a role model for other States. 11 States have visited and many of them have adopted the model
93
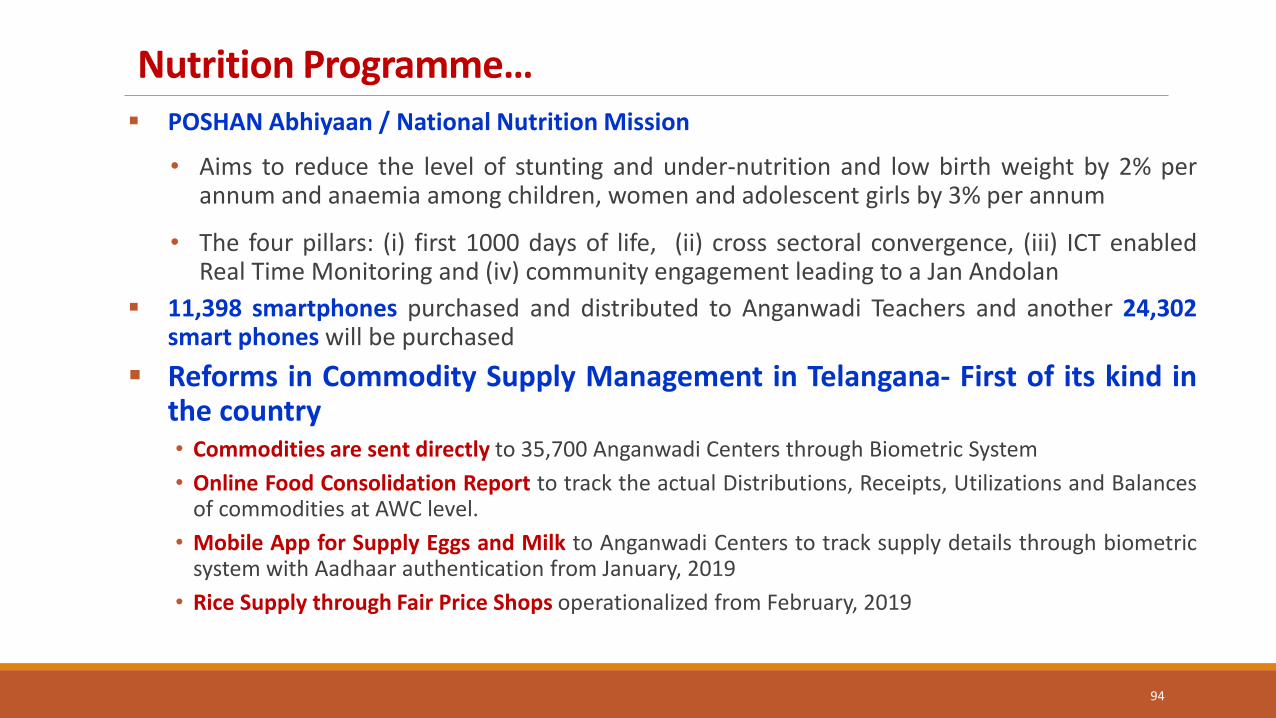
Nutrition Programme… POSHAN Abhiyaan / National Nutrition Mission
• Aims to reduce the level of stunting and under-nutrition and low birth weight by 2% per annum and anaemia among children, women and adolescent girls by 3% per annum
• The four pillars: (i) first 1000 days of life, (ii) cross sectoral convergence, (iii) ICT enabled Real Time Monitoring and (iv) community engagement leading to a Jan Andolan
11,398 smartphones purchased and distributed to Anganwadi Teachers and another 24,302 smart phones will be purchased
Reforms in Commodity Supply Management in Telangana- First of its kind in the country • Commodities are sent directly to 35,700 Anganwadi Centers through Biometric System
• Online Food Consolidation Report to track the actual Distributions, Receipts, Utilizations and Balances of commodities at AWC level.
• Mobile App for Supply Eggs and Milk to Anganwadi Centers to track supply details through biometric system with Aadhaar authentication from January, 2019
• Rice Supply through Fair Price Shops operationalized from February, 2019
94
Integrated Child Protection Scheme (ICPS)
ICPS aims to provide care and protection to the children in need of care and protection and children in conflict with law as mandated by the Juvenile Justice (Care and Protection of Children) Act, 2015.
20,147 children are rescued, 18,743 repatriated and 1404 institutionalized during 2014-18
831 children were given in adoption (687 in-country adoptions and 144 inter-country adoptions)
Online Registration and Monitoring System is put in place in 2018 to register and as well as monitor the Child Care Institutions (CCIs)
Child Friendly Court at Bharosa Support Center is being supported by WD&CW Department
Bal Raksha Bhavans, a unique initiative in Telangana, bring together all service providing mechanisms under one roof like CWCs, JJBs, DCPUs, SJPU, Child Line etc. to facilitate required services to the children in need of care and protection
95
Safety of Security of Women State for the first time had gone into issues of Safety and Security of Women and based on the recommendations of
the High Level Committee has allocated budgets
WD&CW supported setting up of Bharosa Support Centre by Hyderabad Police which is being acknowledged as one of its kind in the sector
Hyderabad District registered significant improvement in Child Sex Ratio by implementing Beti Bachao Beti Padhao. From 914 (2011 Census) to 966 (HMIS)
The Women Helpline-181 is made functional from 2017 with technical support from GVK EMRI
Swaraksha Campaign taken up on issues of trafficking with focus on adolescent girls. Swaraksha Day is observed on every 3rd Saturday in collaboration with Prajwala and Other NGOs’ in the districts.
Sakhi One Stop Centres, 24/7 Support Centres for women victims of violence, are established in 9 erstwhile districts to provide all required medical, legal, police, psychological services at one place. Sakhi Centers are under process of establishment in another 8 districts
She-Taxies are being facilitated for ensuring safety of women passengers
WD&CW Department made State Registrar General of Marriages and a campaign to register the marriages is being taken up
Tshe Box, a mobile and web app, is being put in place for facilitating women to file complaints of sexual harassment at workplace and also for monitoring the complaints till their redressal
96
97
Housing
98
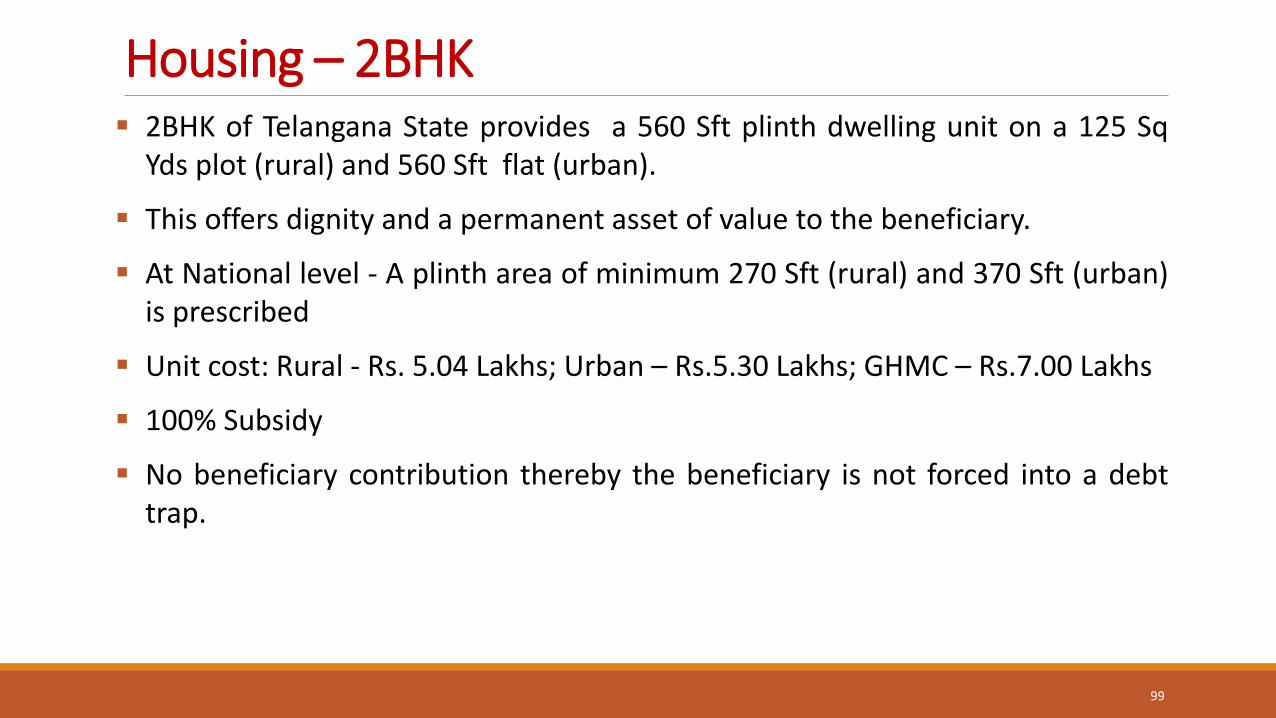
Housing – 2BHK 2BHK of Telangana State provides a 560 Sft plinth dwelling unit on a 125 Sq
Yds plot (rural) and 560 Sft flat (urban).
This offers dignity and a permanent asset of value to the beneficiary.
At National level - A plinth area of minimum 270 Sft (rural) and 370 Sft (urban) is prescribed
Unit cost: Rural - Rs. 5.04 Lakhs; Urban – Rs.5.30 Lakhs; GHMC – Rs.7.00 Lakhs
100% Subsidy
No beneficiary contribution thereby the beneficiary is not forced into a debt trap.
99
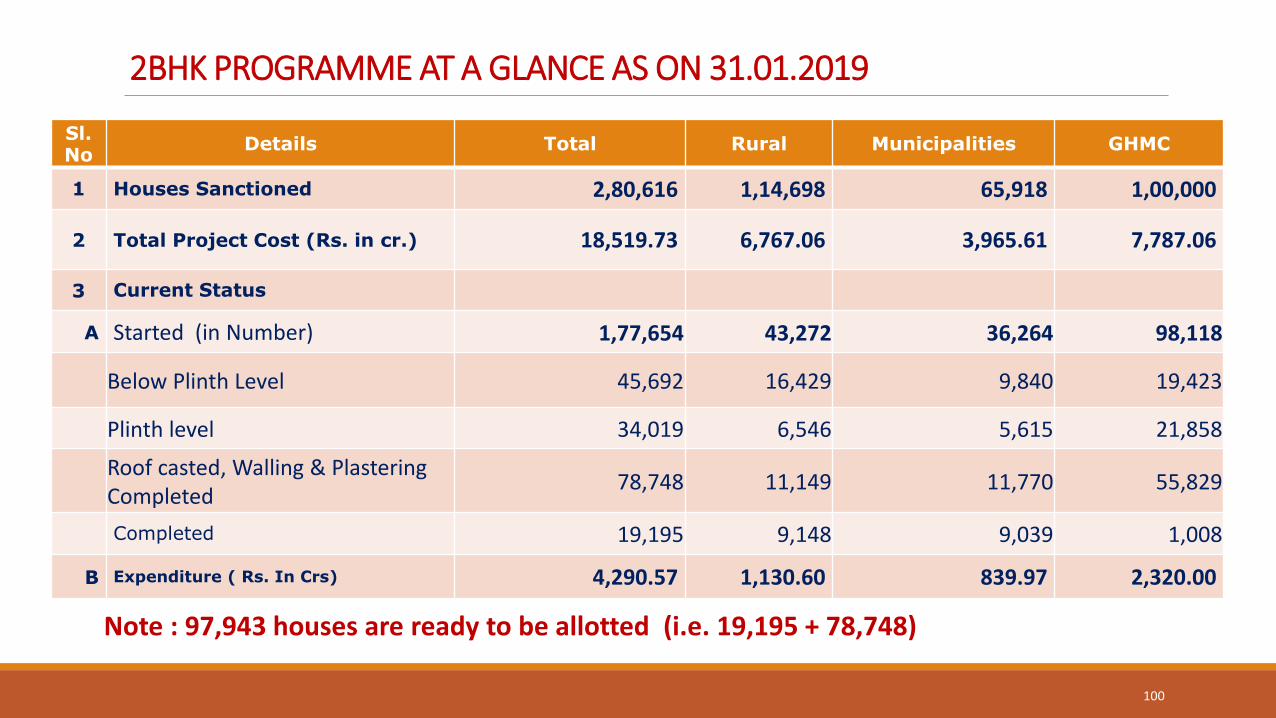
2BHK PROGRAMME AT A GLANCE AS ON 31.01.2019
Sl. No
Details Total Rural Municipalities GHMC
1 Houses Sanctioned 2,80,616 1,14,698 65,918 1,00,000
2 Total Project Cost (Rs. in cr.) 18,519.73 6,767.06 3,965.61 7,787.06
3 Current Status
A Started (in Number) 1,77,654 43,272 36,264 98,118
Below Plinth Level 45,692 16,429 9,840 19,423
Plinth level 34,019 6,546 5,615 21,858
Roof casted, Walling & Plastering Completed
78,748 11,149 11,770 55,829
Completed 19,195 9,148 9,039 1,008
B Expenditure ( Rs. In Crs) 4,290.57 1,130.60 839.97 2,320.00
Note : 97,943 houses are ready to be allotted (i.e. 19,195 + 78,748)
100
2BHK Houses
101
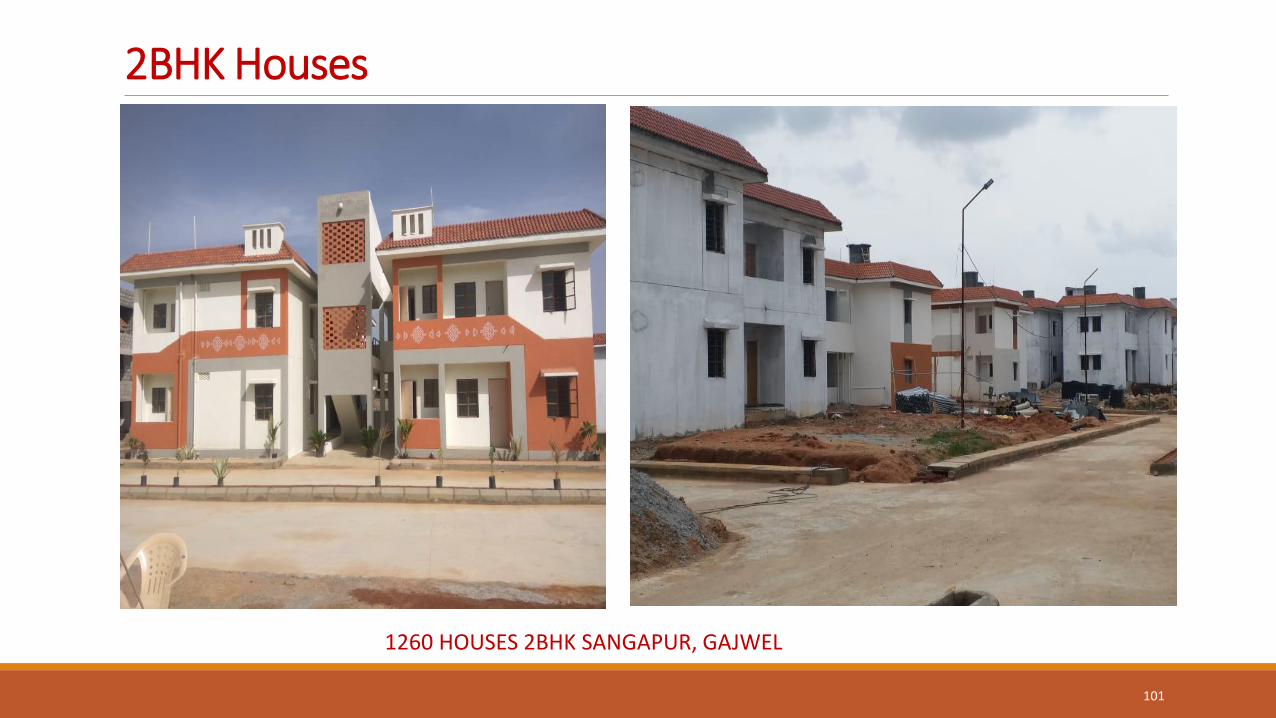
1260 HOUSES 2BHK SANGAPUR, GAJWEL
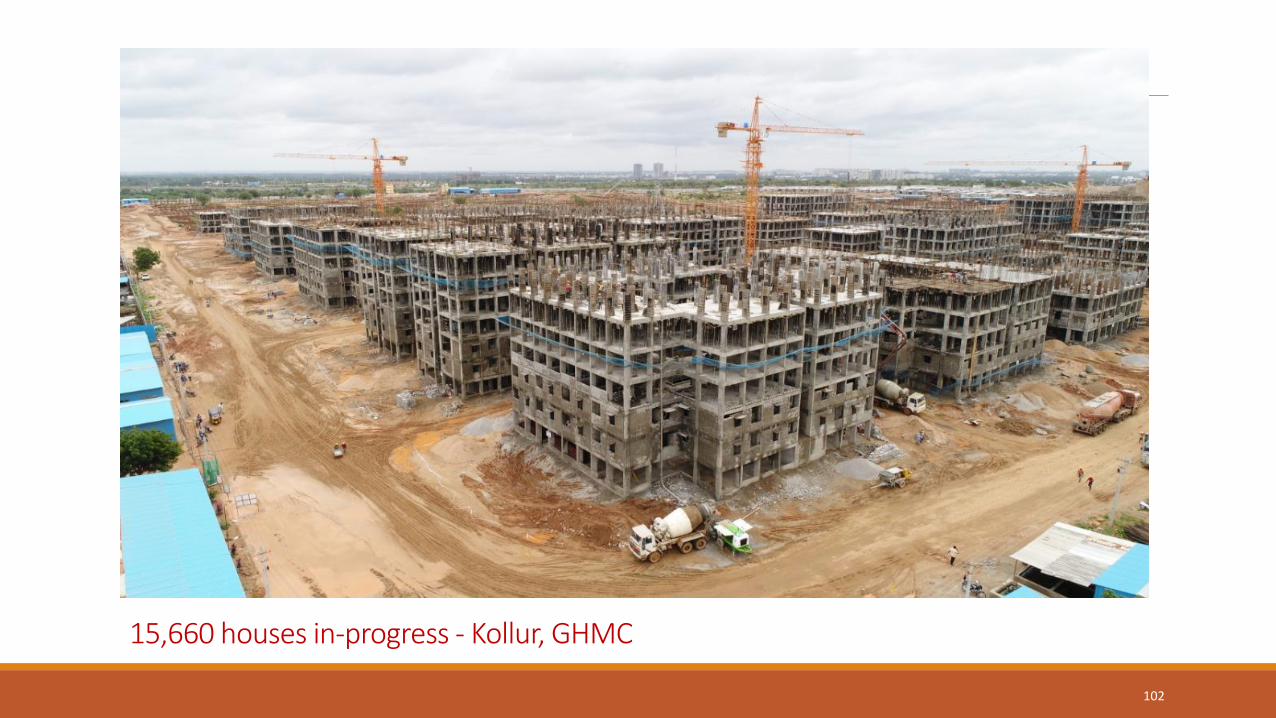
15,660 houses in-progress - Kollur, GHMC
102
Municipal Administration & Urban Development
103
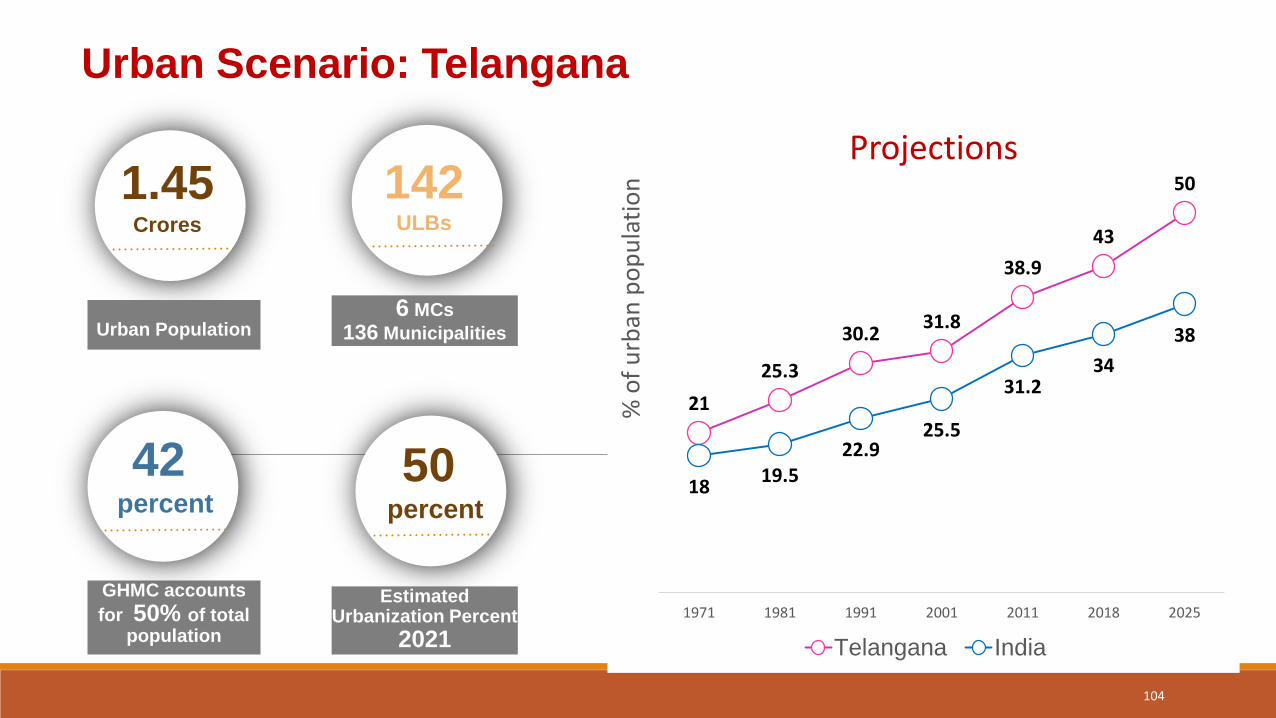
1.45 Crores
Urban Population
GHMC accounts
for 50% of total population
6 MCs
136 Municipalities
21
25.3
30.2 31.8
38.9
43
50
18 19.5
22.9 25.5
31.2 34
38
1971 1981 1991 2001 2011 2018 2025
% o
f u
rban
po
pu
lati
on
Telangana India
Estimated Urbanization Percent
2021
142 ULBs
42 percent
50 percent
104
Urban Scenario: Telangana
Projections
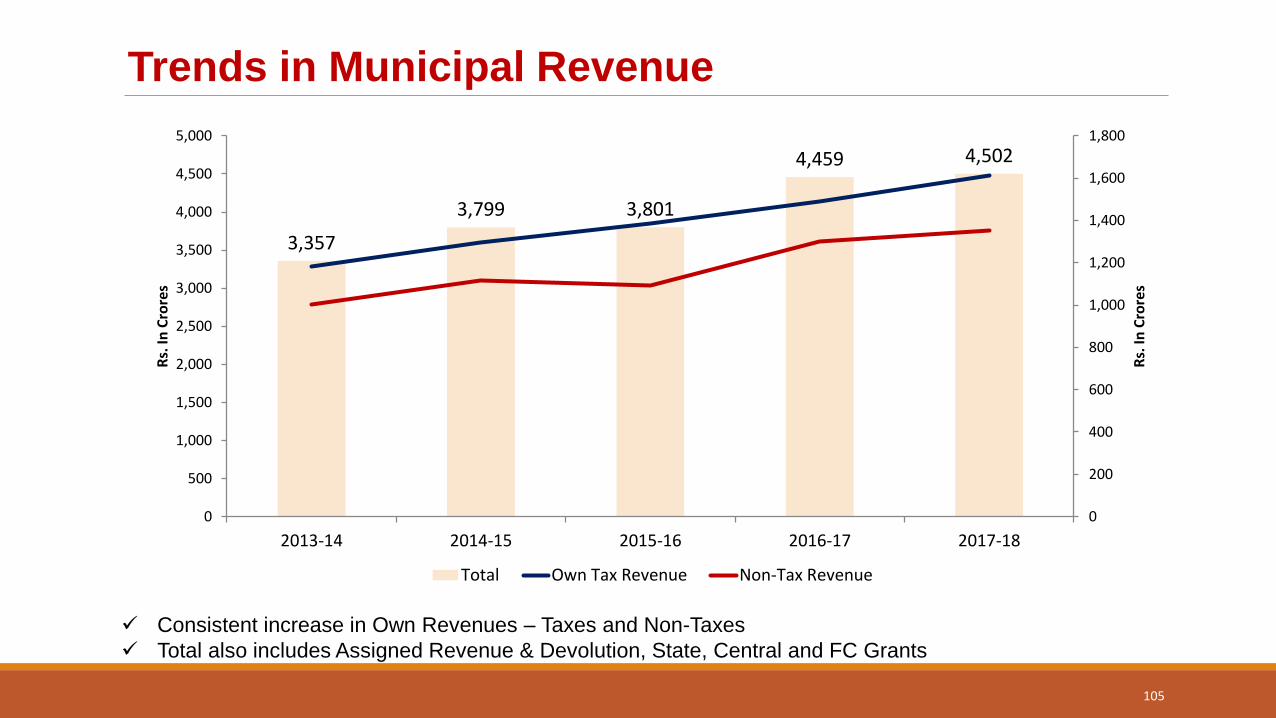
Trends in Municipal Revenue
Consistent increase in Own Revenues – Taxes and Non-Taxes
Total also includes Assigned Revenue & Devolution, State, Central and FC Grants
105
3,357
3,799 3,801
4,459 4,502
0
200
400
600
800
1,000
1,200
1,400
1,600
1,800
0
500
1,000
1,500
2,000
2,500
3,000
3,500
4,000
4,500
5,000
2013-14 2014-15 2015-16 2016-17 2017-18
Rs.
In C
rore
s
Rs.
In C
rore
s
Total Own Tax Revenue Non-Tax Revenue
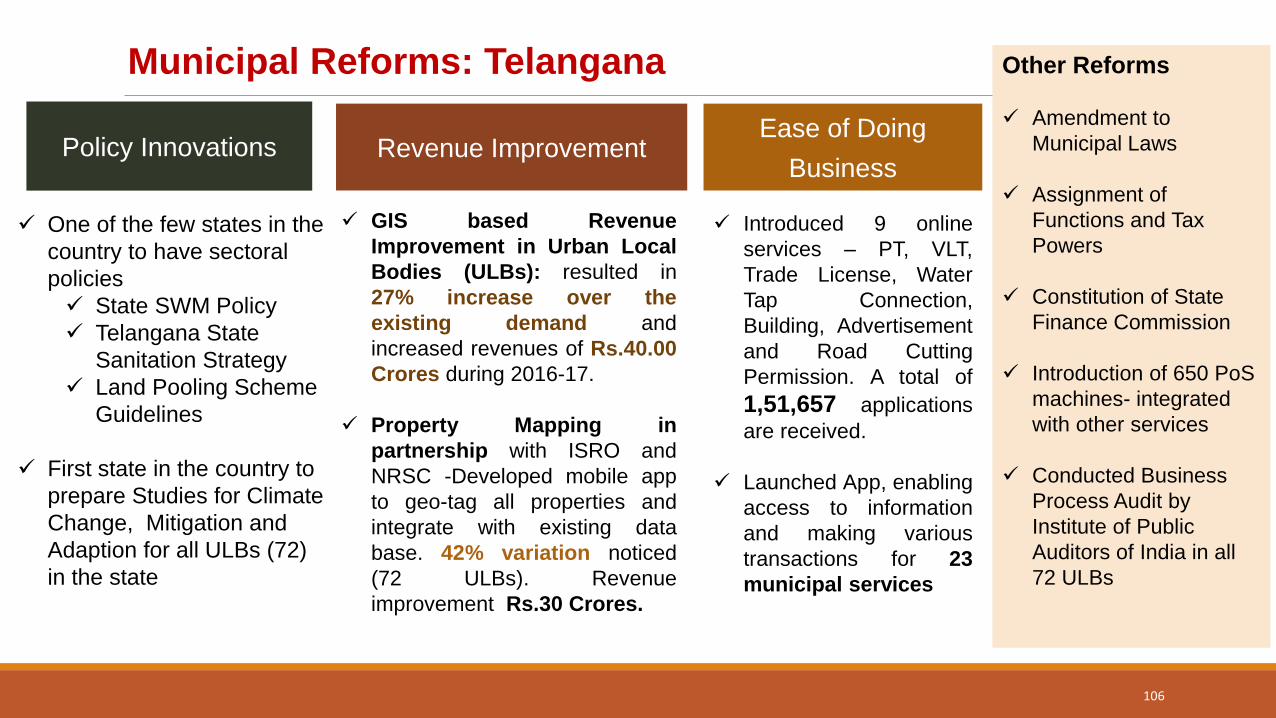
GIS based Revenue
Improvement in Urban Local
Bodies (ULBs): resulted in
27% increase over the
existing demand and
increased revenues of Rs.40.00
Crores during 2016-17.
Property Mapping in
partnership with ISRO and
NRSC -Developed mobile app
to geo-tag all properties and
integrate with existing data
base. 42% variation noticed
(72 ULBs). Revenue
improvement Rs.30 Crores.
Revenue Improvement Ease of Doing
Business
Introduced 9 online
services – PT, VLT,
Trade License, Water
Tap Connection,
Building, Advertisement
and Road Cutting
Permission. A total of
1,51,657 applications
are received.
Launched App, enabling
access to information
and making various
transactions for 23
municipal services
Municipal Reforms: Telangana
Policy Innovations
One of the few states in the
country to have sectoral
policies
State SWM Policy
Telangana State
Sanitation Strategy
Land Pooling Scheme
Guidelines
First state in the country to
prepare Studies for Climate
Change, Mitigation and
Adaption for all ULBs (72)
in the state
Other Reforms
Amendment to
Municipal Laws
Assignment of
Functions and Tax
Powers
Constitution of State
Finance Commission
Introduction of 650 PoS
machines- integrated
with other services
Conducted Business
Process Audit by
Institute of Public
Auditors of India in all
72 ULBs
106
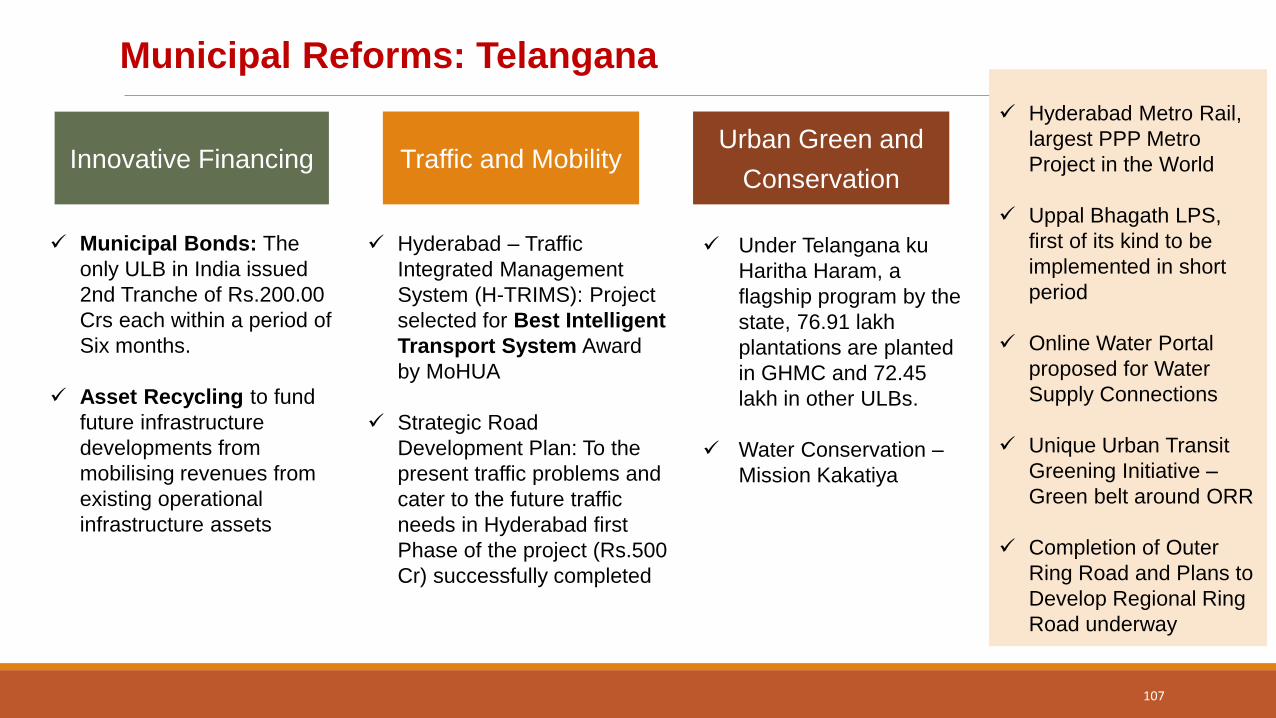
Municipal Bonds: The
only ULB in India issued
2nd Tranche of Rs.200.00
Crs each within a period of
Six months.
Asset Recycling to fund
future infrastructure
developments from
mobilising revenues from
existing operational
infrastructure assets
Hyderabad – Traffic
Integrated Management
System (H-TRIMS): Project
selected for Best Intelligent
Transport System Award
by MoHUA
Strategic Road
Development Plan: To the
present traffic problems and
cater to the future traffic
needs in Hyderabad first
Phase of the project (Rs.500
Cr) successfully completed
Innovative Financing Traffic and Mobility
Municipal Reforms: Telangana
Urban Green and
Conservation
Under Telangana ku
Haritha Haram, a
flagship program by the
state, 76.91 lakh
plantations are planted
in GHMC and 72.45
lakh in other ULBs.
Water Conservation –
Mission Kakatiya
Hyderabad Metro Rail,
largest PPP Metro
Project in the World
Uppal Bhagath LPS,
first of its kind to be
implemented in short
period
Online Water Portal
proposed for Water
Supply Connections
Unique Urban Transit
Greening Initiative –
Green belt around ORR
Completion of Outer
Ring Road and Plans to
Develop Regional Ring
Road underway
107
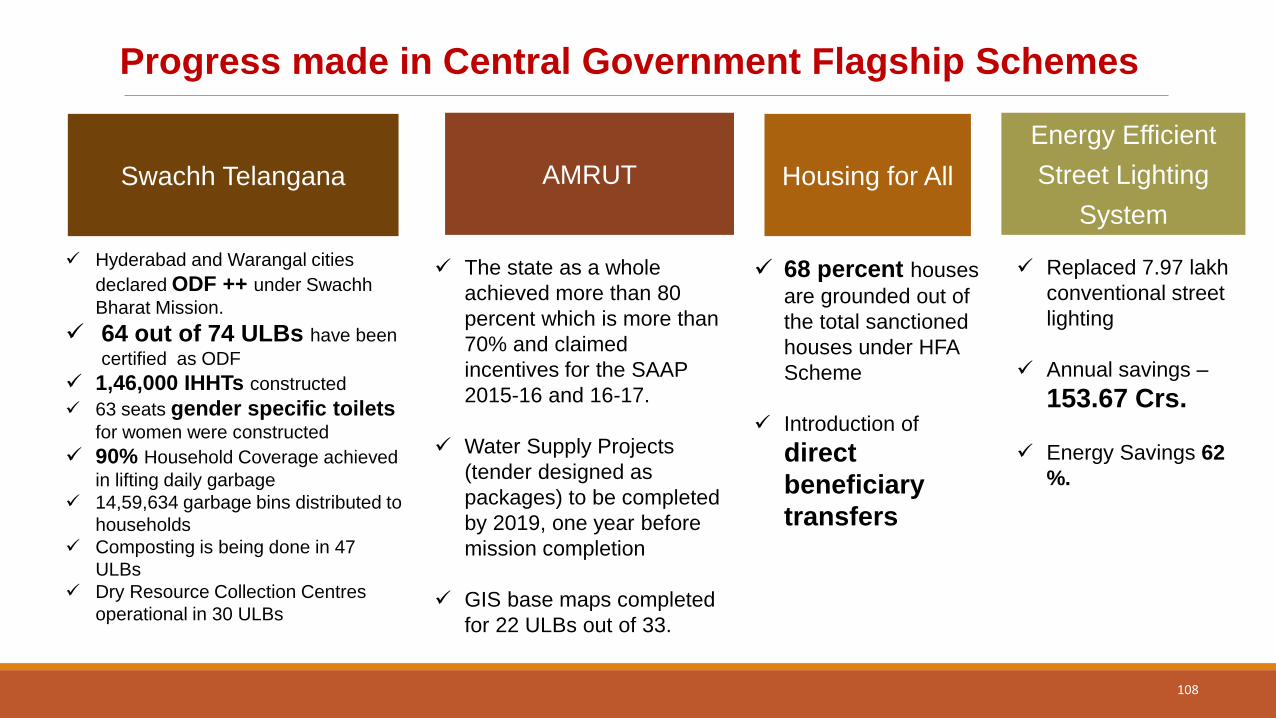
The state as a whole
achieved more than 80
percent which is more than
70% and claimed
incentives for the SAAP
2015-16 and 16-17.
Water Supply Projects
(tender designed as
packages) to be completed
by 2019, one year before
mission completion
GIS base maps completed
for 22 ULBs out of 33.
Hyderabad and Warangal cities
declared ODF ++ under Swachh
Bharat Mission.
64 out of 74 ULBs have been
certified as ODF
1,46,000 IHHTs constructed
63 seats gender specific toilets for women were constructed
90% Household Coverage achieved
in lifting daily garbage
14,59,634 garbage bins distributed to
households
Composting is being done in 47
ULBs
Dry Resource Collection Centres
operational in 30 ULBs
Energy Efficient
Street Lighting
System
Swachh Telangana AMRUT
Progress made in Central Government Flagship Schemes
Housing for All
68 percent houses
are grounded out of
the total sanctioned
houses under HFA
Scheme
Introduction of
direct
beneficiary
transfers
Replaced 7.97 lakh
conventional street
lighting
Annual savings –
153.67 Crs.
Energy Savings 62
%.
108
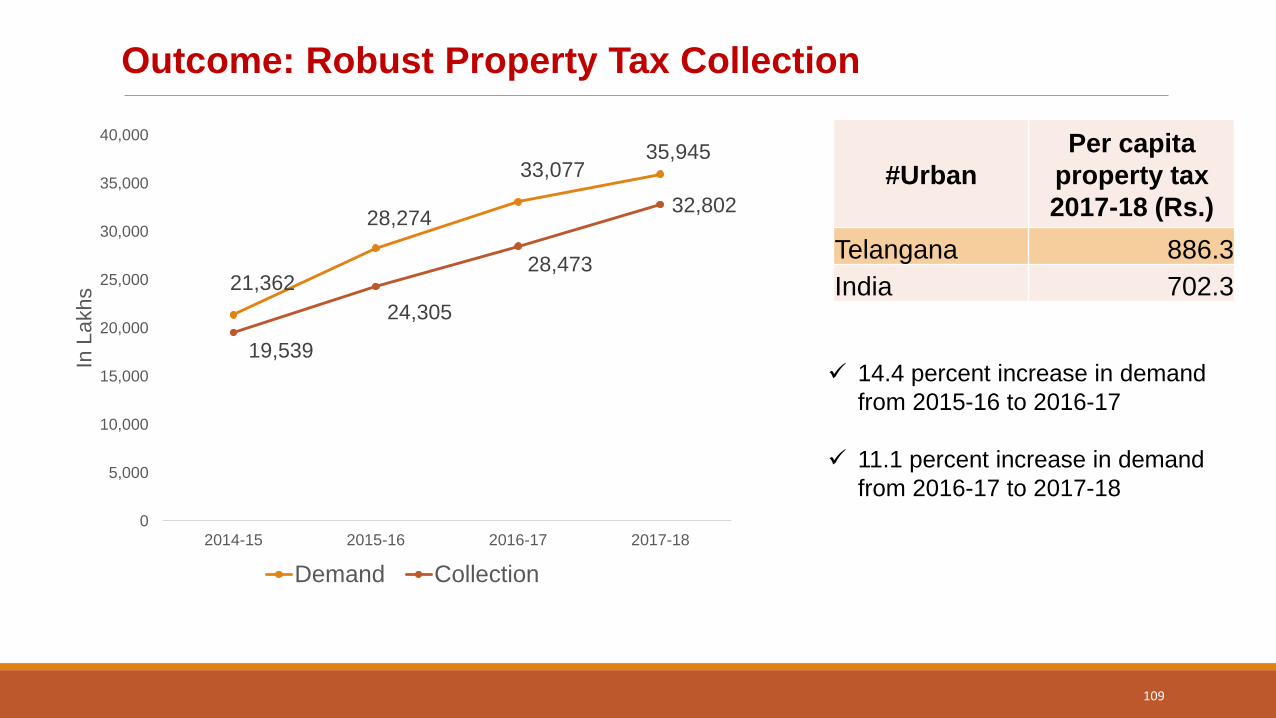
21,362
28,274
33,077 35,945
19,539
24,305
28,473
32,802
0
5,000
10,000
15,000
20,000
25,000
30,000
35,000
40,000
2014-15 2015-16 2016-17 2017-18
In L
akhs
Demand Collection
Outcome: Robust Property Tax Collection
14.4 percent increase in demand
from 2015-16 to 2016-17
11.1 percent increase in demand
from 2016-17 to 2017-18
#Urban
Per capita
property tax
2017-18 (Rs.)
Telangana 886.3
India 702.3
109
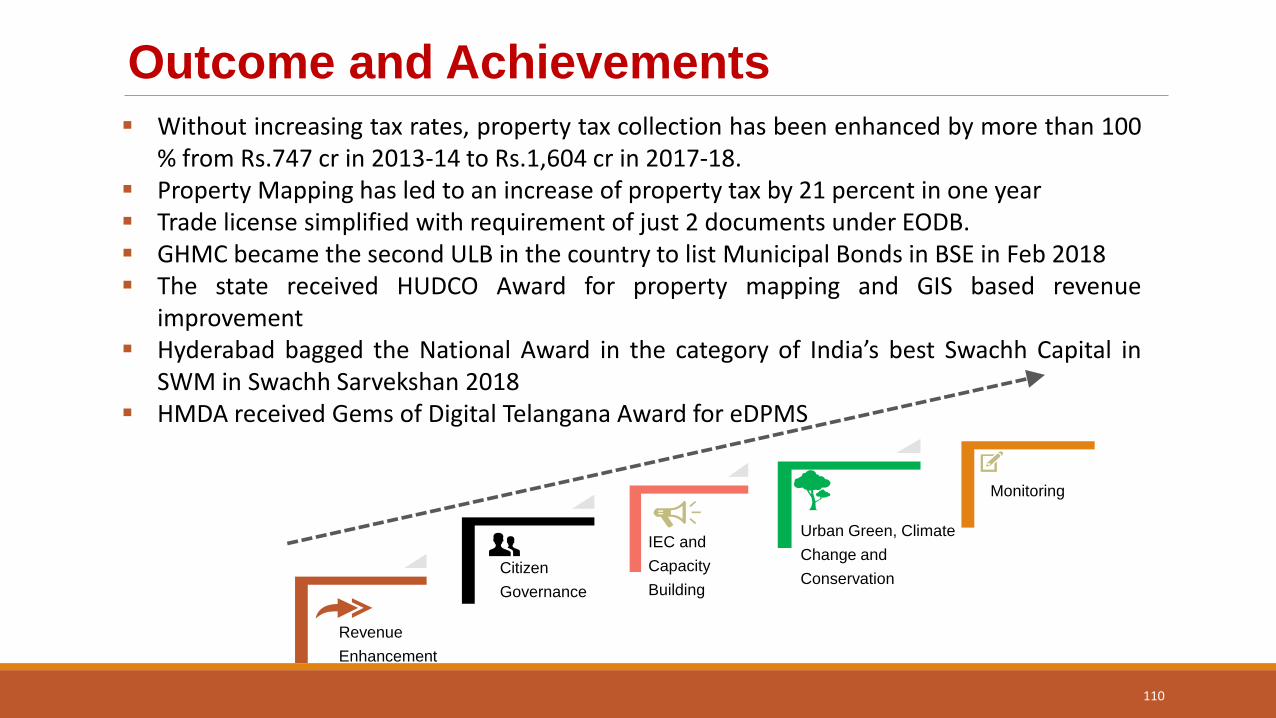
Without increasing tax rates, property tax collection has been enhanced by more than 100 % from Rs.747 cr in 2013-14 to Rs.1,604 cr in 2017-18.
Property Mapping has led to an increase of property tax by 21 percent in one year Trade license simplified with requirement of just 2 documents under EODB. GHMC became the second ULB in the country to list Municipal Bonds in BSE in Feb 2018 The state received HUDCO Award for property mapping and GIS based revenue
improvement Hyderabad bagged the National Award in the category of India’s best Swachh Capital in
SWM in Swachh Sarvekshan 2018 HMDA received Gems of Digital Telangana Award for eDPMS
Outcome and Achievements
Monitoring
Revenue
Enhancement
IEC and
Capacity
Building
Urban Green, Climate
Change and
Conservation Citizen
Governance
110
110
111
City of Hyderabad
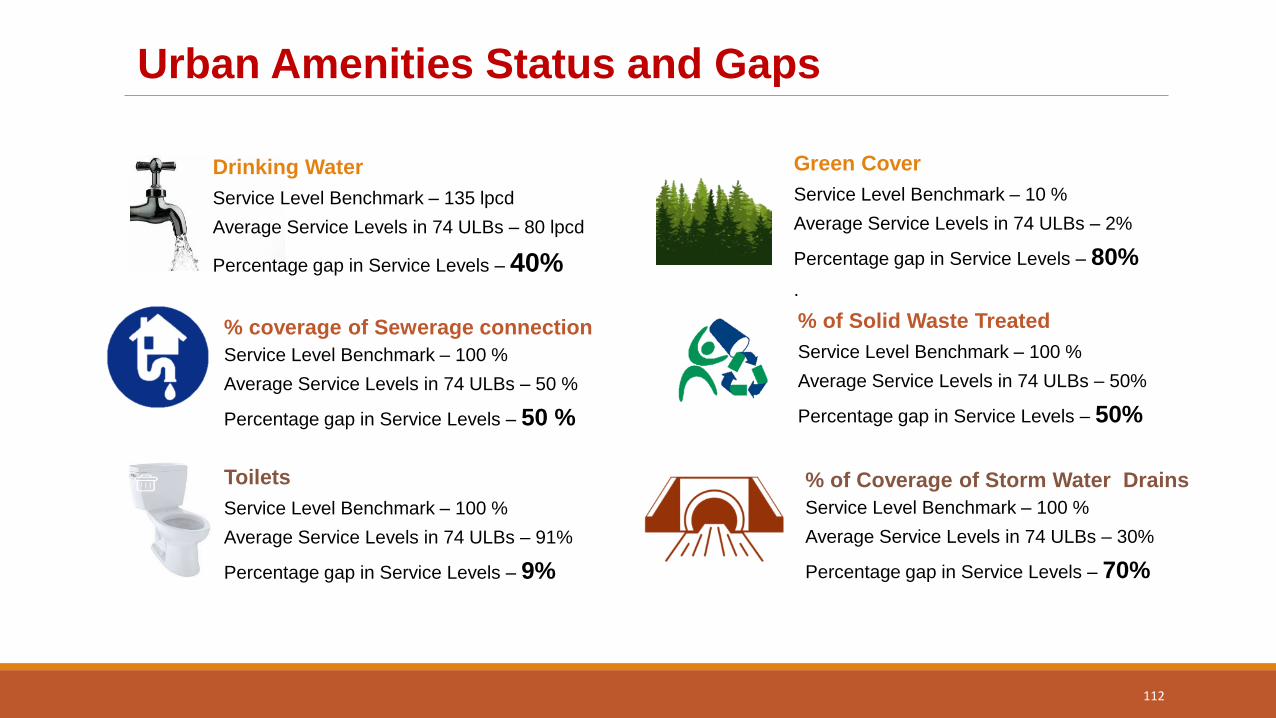
Urban Amenities Status and Gaps
Drinking Water
Service Level Benchmark – 135 lpcd
Average Service Levels in 74 ULBs – 80 lpcd
Percentage gap in Service Levels – 40%
% coverage of Sewerage connection
Service Level Benchmark – 100 %
Average Service Levels in 74 ULBs – 50 %
Percentage gap in Service Levels – 50 %
Toilets
Service Level Benchmark – 100 %
Average Service Levels in 74 ULBs – 91%
Percentage gap in Service Levels – 9%
Green Cover
Service Level Benchmark – 10 %
Average Service Levels in 74 ULBs – 2%
Percentage gap in Service Levels – 80%
.
% of Solid Waste Treated
Service Level Benchmark – 100 %
Average Service Levels in 74 ULBs – 50%
Percentage gap in Service Levels – 50%
% of Coverage of Storm Water Drains
Service Level Benchmark – 100 %
Average Service Levels in 74 ULBs – 30%
Percentage gap in Service Levels – 70%
112

Sector
Rs. In crores
Capital Expenditure
Required O&M Expenditure Required
Water Supply 6,320.17 1,774.24
Urban Roads 25,358.62 1,405.93
Drains 70,253.90
1,749.45 Sewerage
SWM 3,505.00
Urban Transport 14,170.97 2,000.00
Traffic Support Infrastructure
Street Lighting 183.12 28.33
State Specific Needs 950.00 -
Total 1,20,741.78 6,957.95
Urban Cost Estimates FY. 2020-25, Telangana
113
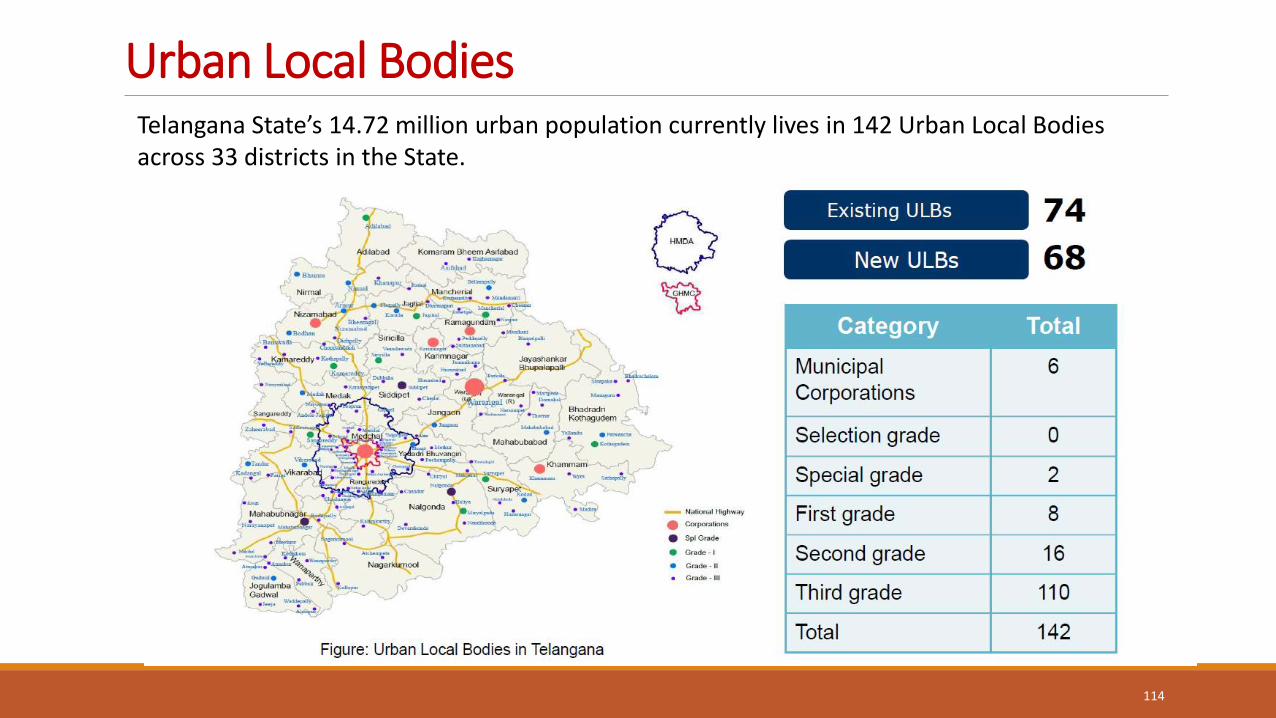
Urban Local Bodies
114
Telangana State’s 14.72 million urban population currently lives in 142 Urban Local Bodies across 33 districts in the State.
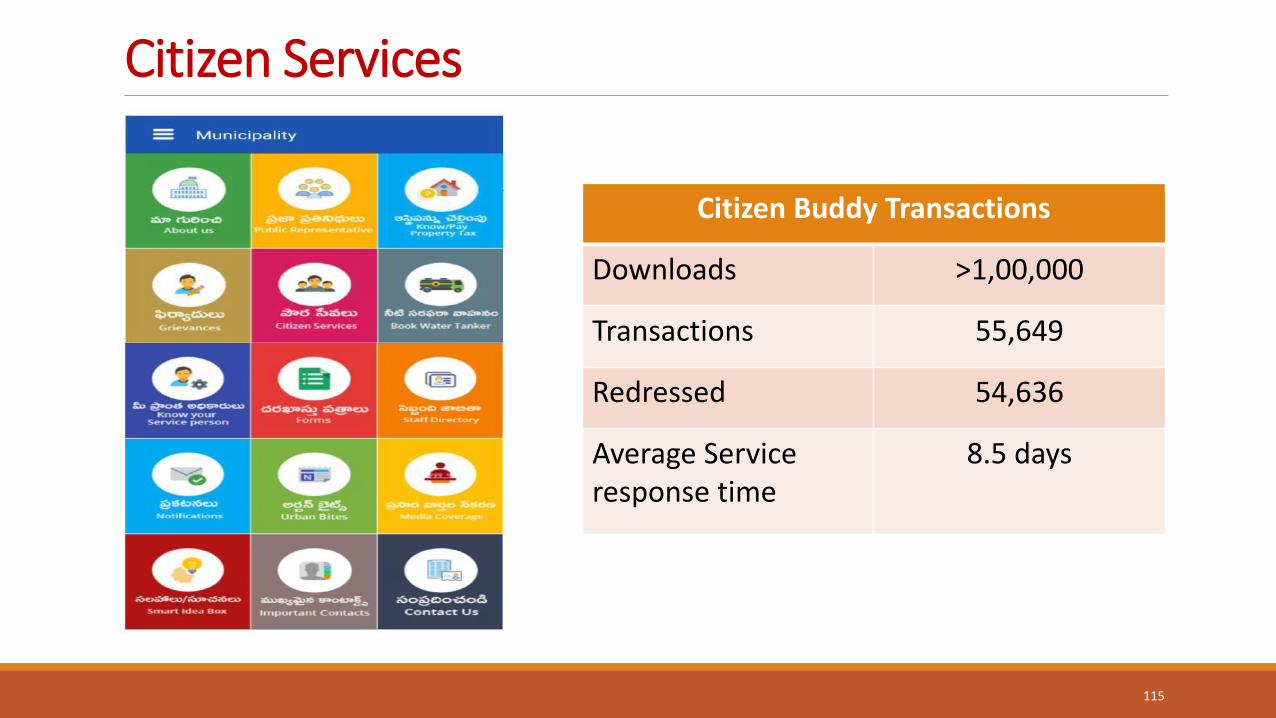
Citizen Services
115
Citizen Buddy Transactions
Downloads >1,00,000
Transactions 55,649
Redressed 54,636
Average Service response time
8.5 days
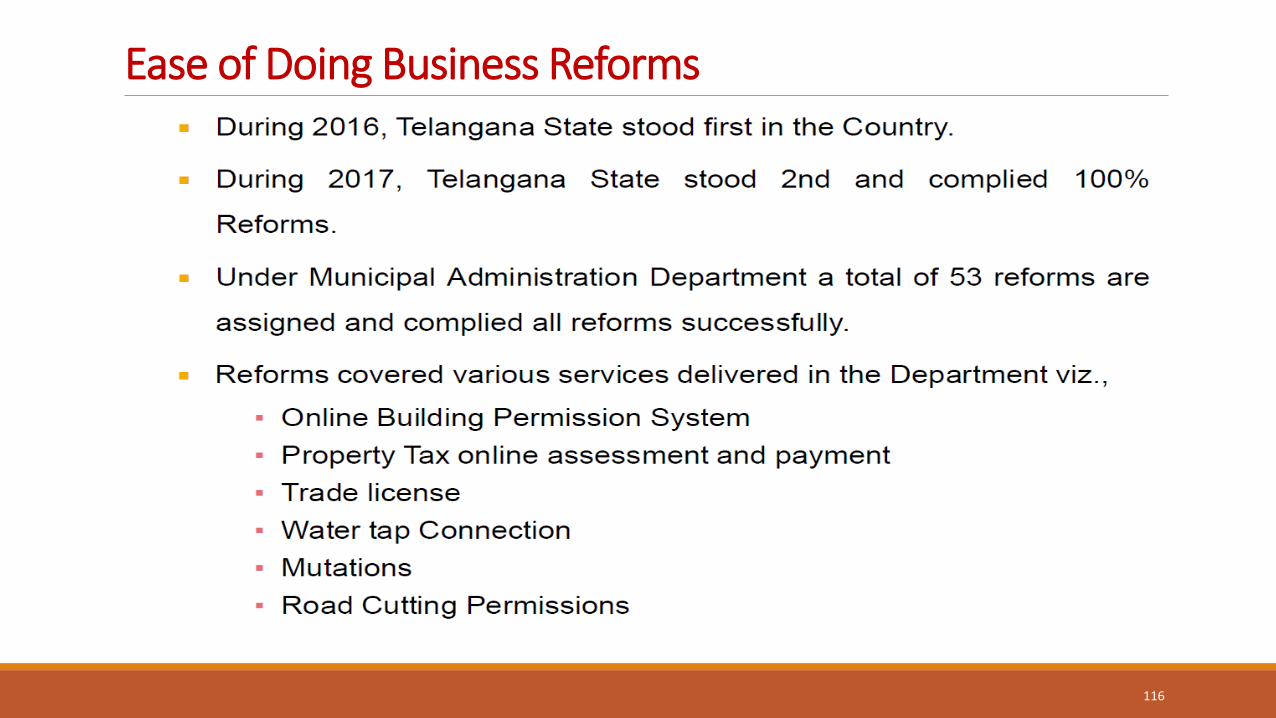
Ease of Doing Business Reforms
116
Energy
117
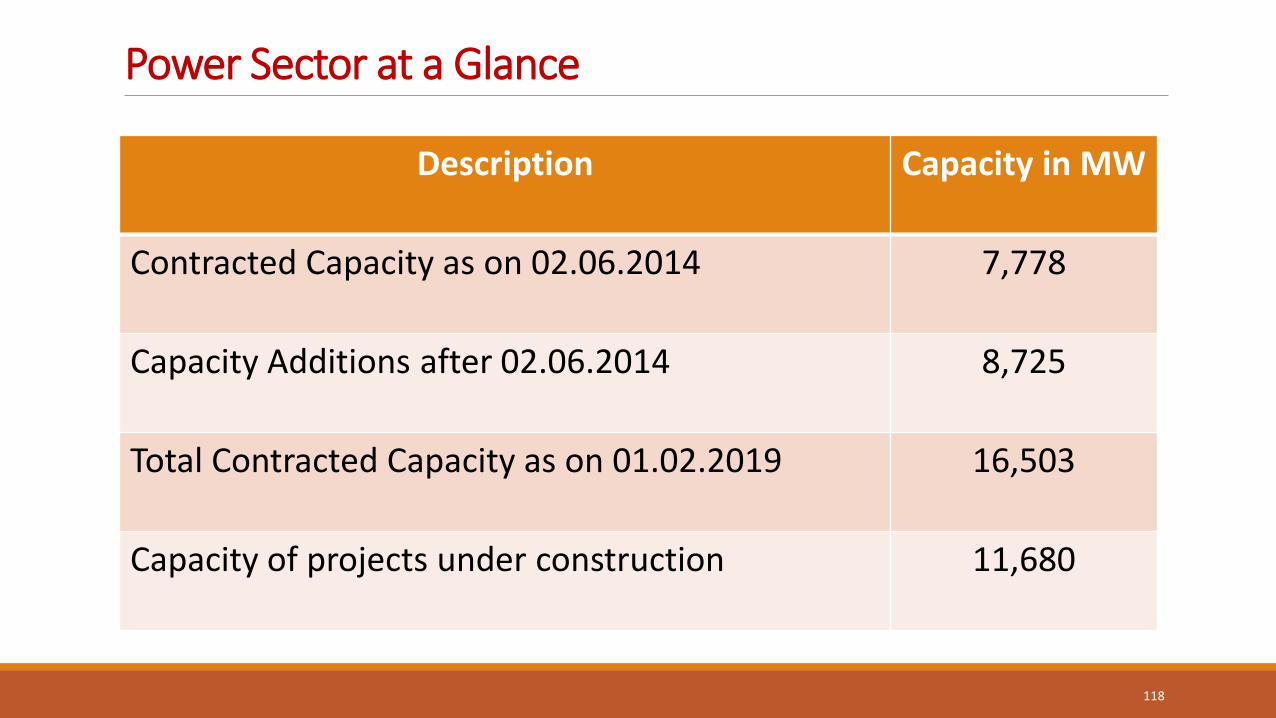
Power Sector at a Glance
118
Description Capacity in MW
Contracted Capacity as on 02.06.2014 7,778
Capacity Additions after 02.06.2014 8,725
Total Contracted Capacity as on 01.02.2019 16,503
Capacity of projects under construction 11,680
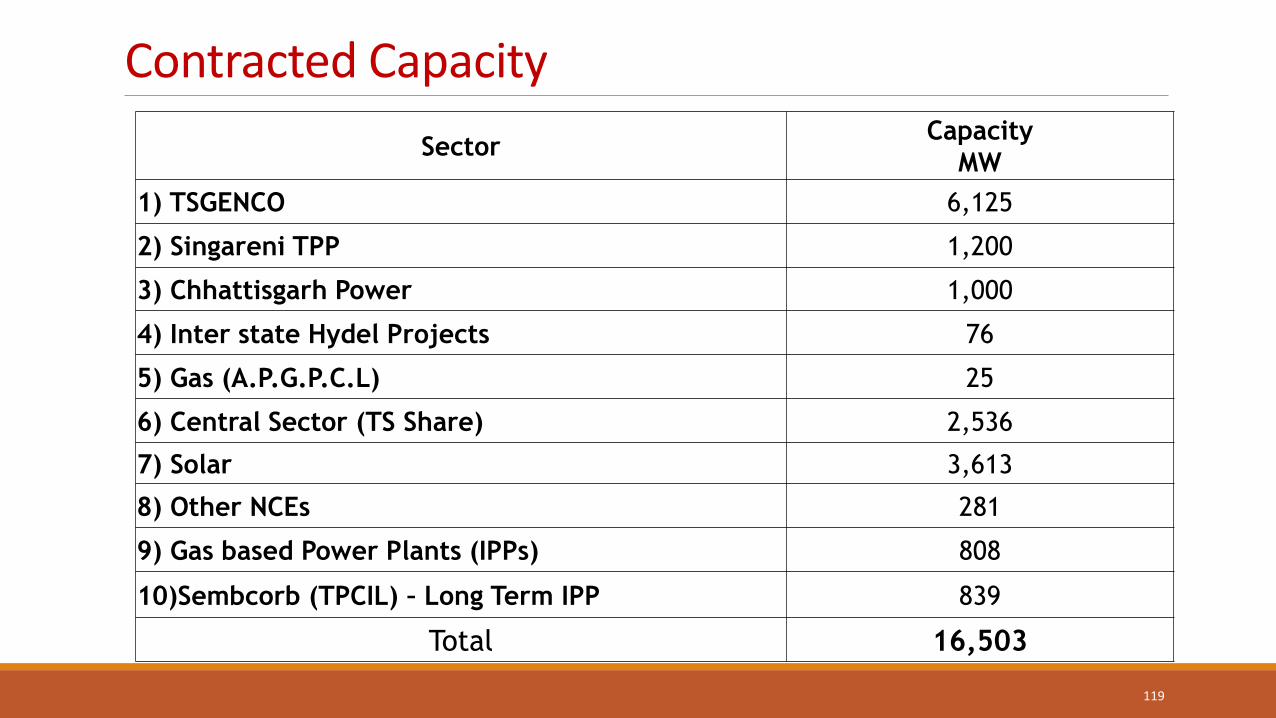
Contracted Capacity
119
Sector Capacity
MW
1) TSGENCO 6,125
2) Singareni TPP 1,200
3) Chhattisgarh Power 1,000
4) Inter state Hydel Projects 76
5) Gas (A.P.G.P.C.L) 25
6) Central Sector (TS Share) 2,536
7) Solar 3,613
8) Other NCEs 281
9) Gas based Power Plants (IPPs) 808
10)Sembcorb (TPCIL) – Long Term IPP 839
Total 16,503
120
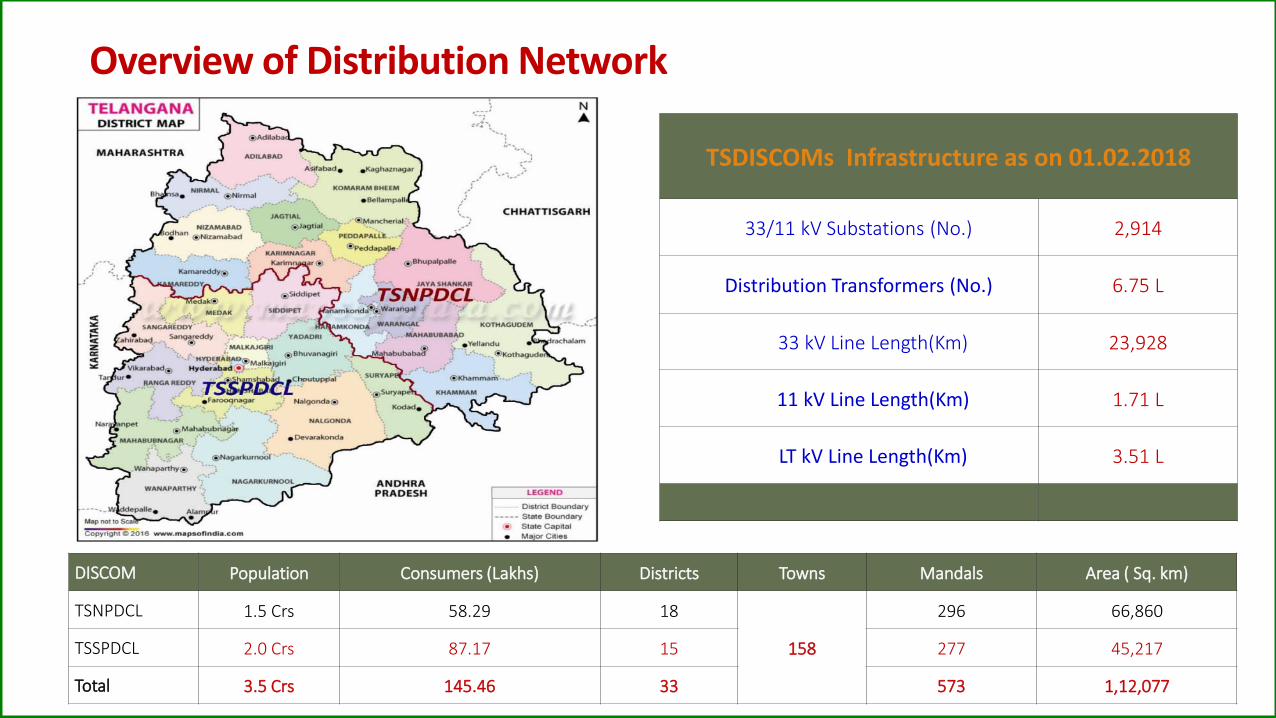
TSDISCOMs Infrastructure as on 01.02.2018
33/11 kV Substations (No.) 2,914
Distribution Transformers (No.) 6.75 L
33 kV Line Length(Km) 23,928
11 kV Line Length(Km) 1.71 L
LT kV Line Length(Km) 3.51 L
DISCOM Population Consumers (Lakhs) Districts Towns Mandals Area ( Sq. km)
TSNPDCL 1.5 Crs 58.29 18
158
296 66,860
TSSPDCL 2.0 Crs 87.17 15 277 45,217
Total 3.5 Crs 145.46 33 573 1,12,077
Overview of Distribution Network
Power Utilities - Achievements
Telangana has Created New Record in Supplying Quality Power Free of cost for 24 hours to the Agriculture sector. For the First time in the Country 24 hours power is being supplied from 01.01.2018.
TS GENCO commissioned 800 MW Super Critical Thermal power plant at KTPS in a record time of 48 months in the state sector.
TSTRANSCO has the distinction of having the lowest transmission losses of 2.86 % (As on Dec’18) and highest transmission availability in the country at 99.99 %.
During 2017-18 the per capita energy consumption of Telangana is 1,727 units. This is 50% more than the All India average of 1149 units. Telangana has recorded the highest growth in per capita consumption amongst all the States in our country in 2017-18.
T&D Losses of Telangana state has reduced from 16.06% (at the time formation of State) to 14.10 % (FY 2017-18).
121
State’s Flagship Programs in Energy Sector Telangana is the only state in the country supplying Free Power for 24 hours to the
Agriculture sector to 23.58 Lakh agriculture pump sets in the state from 01.01.2018 onwards.
In order to make state self sufficient in power it is planned to add 11,680 MW of Power in coming 3 to 4 years.
As a part of UDAY scheme Telangana Govt., has taken over 75% of total debt i.e. Rs.8,923 Crores as per Scheme and remaining 25% of the debt retained by the DISCOMS i.e., Rs.2,974.31 Crores is being restructured. As per the conditions of UDAY Scheme, Telangana DISCOMS are meeting all the operational Parameters.
IPDS scheme cost was revised to Rs. 670.23 Crs based on the tendering process & works have been awarded for 100% of the scheme cost. Works are taken up and under progress.
For DDUGJY Scheme REC has approved for an amount of Rs. 457.36Crs + Rs. 2.28Crs (PMA cost) for 9 Rural districts in Telangana State. Works are taken up and under progress. Out of 84Nos. SS, 47 Nos. SS charged, 37 Nos. SS under progress.
122

Forest
123
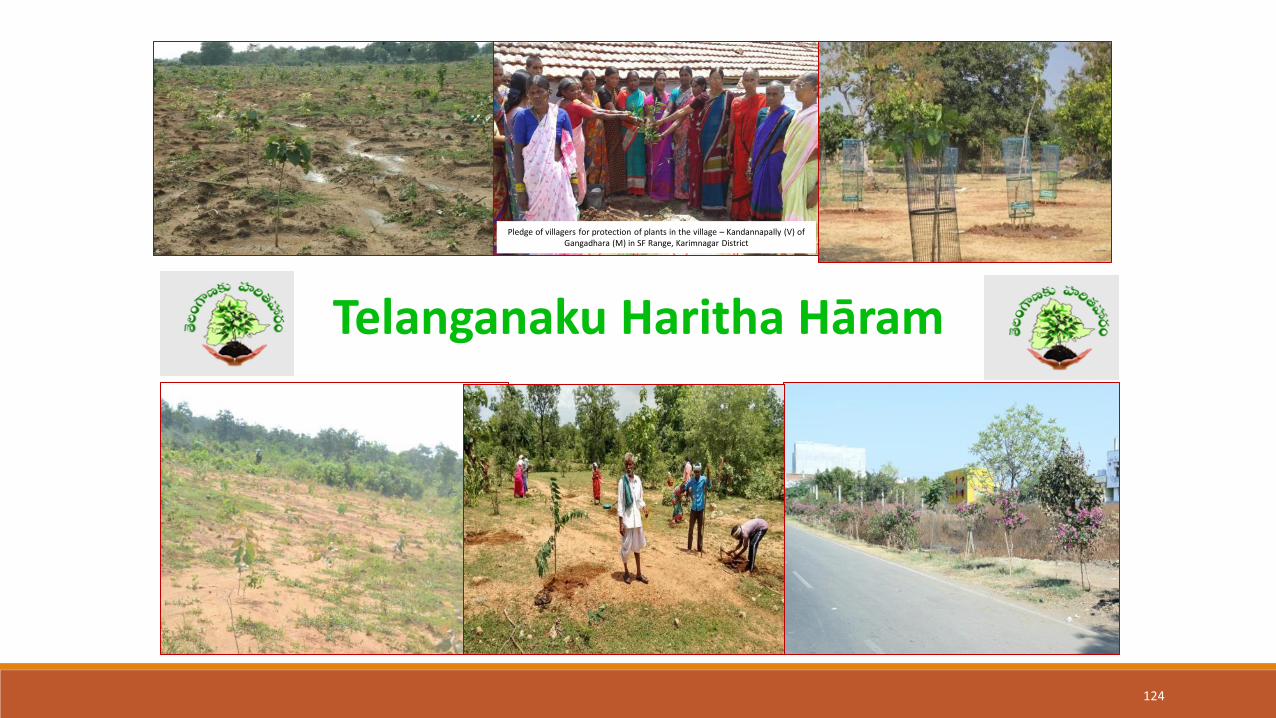
Telanganaku Haritha Hāram
124
Pledge of villagers for protection of plants in the village – Kandannapally (V) of Gangadhara (M) in SF Range, Karimnagar District
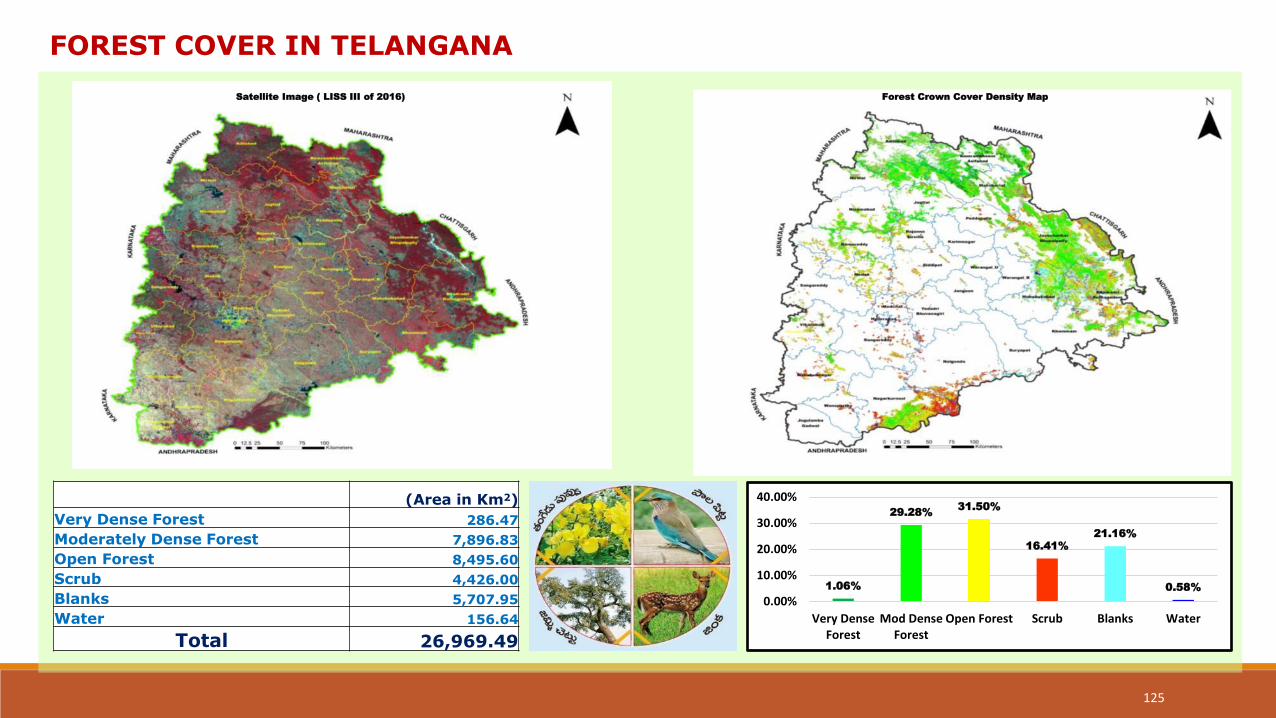
(Area in Km2)
Very Dense Forest 286.47
Moderately Dense Forest 7,896.83
Open Forest 8,495.60
Scrub 4,426.00
Blanks 5,707.95
Water 156.64
Total 26,969.49
1.06%
29.28% 31.50%
16.41%
21.16%
0.58%
0.00%
10.00%
20.00%
30.00%
40.00%
Very DenseForest
Mod DenseForest
Open Forest Scrub Blanks Water
Satellite Image ( LISS III of 2016) Forest Crown Cover Density Map
FOREST COVER IN TELANGANA
125
Objective:
To increase the tree cover from 24% to 33% in tune with National Forest Policy
Strategy:
Taking up extensive plantation outside the notified forest
Planting inside the notified forests,
Rejuvenation of Degraded Natural Forests
Mandate:
Plant 230 Crores seedlings in 4 years
130 crore seedlings outside the forest area
• 120 Crs other areas
• 10 Crs in GHMC / HMDA areas
100 Crores seedlings / saplings inside the notified forests
• 20 Crs by planting inside Forests
• 80 Crs by Rejuvenation of degraded forests
Achieve these targets in 4 years
Telanganaku Haritha Haram
126
Each GP 40,000 Nos Plants
Each Assembly Constituency : 40 Lakhs Plants
Each District target varying from 41 Lakhs to 2.03 Crs. Plants
Each year 40.00 Crs. Plants
Yearly Targets for Planting
127
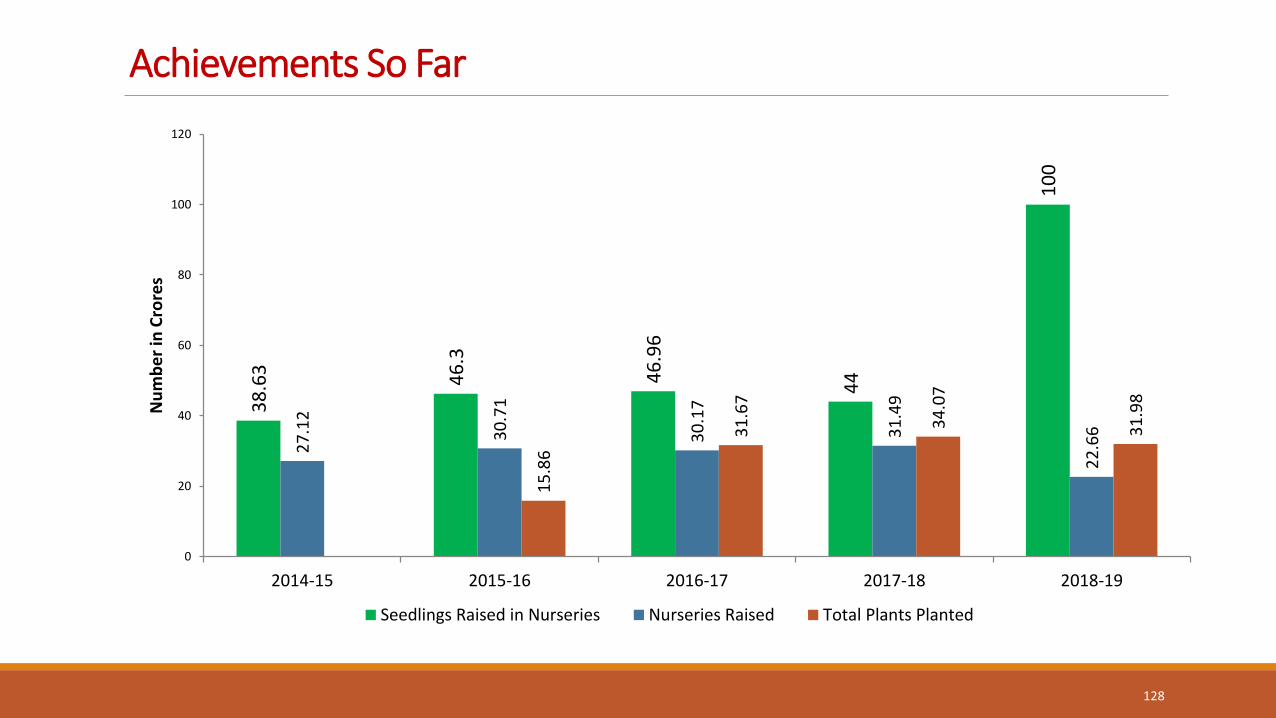
Achievements So Far
38
.63
46
.3
46
.96
44
10
0
27
.12
30
.71
30
.17
31
.49
22
.66
15
.86
31
.67
34
.07
31
.98
0
20
40
60
80
100
120
2014-15 2015-16 2016-17 2017-18 2018-19
Nu
mb
er
in C
rore
s
Seedlings Raised in Nurseries Nurseries Raised Total Plants Planted
128
Achievements So Far…
Total Plants Planted so far: 139.56 Crores (113.58 crores + 25.98 crores including ANR)
Geo-tagged: 26.65 Crores (During 2018-19)
Green Brigades : 30,900 Teams, 4,82,508 Members
Total Block plantations so far : 28,859 Ha
Total Avenue plantations so far: 6,711 Kms
Total area being treated under Aided Natural Regeneration (ANR): 2.65 Lakh Ha
Total Peripheral trench dug so far: 7,157 Kms
Total Fire lines created so far: 5,823 Kms
Urban Parks being developed : 32 Nos
129
Future Expansion of the Programme
Yearly Planting Target from 2019 onwards : 100 Crores
One GP one Nursery in Rural Areas : 12,751 Nos
One nursery in each ULB : 143 Nos
Green cell in each ULB
Rejuvenation of Degraded Natural Forests on saturation basis
Taking up avenue plantations on all roads on saturation basis
Create at least one Urban Forest Park in each ULB
Completely saturate GPs and ULBs with planting
130
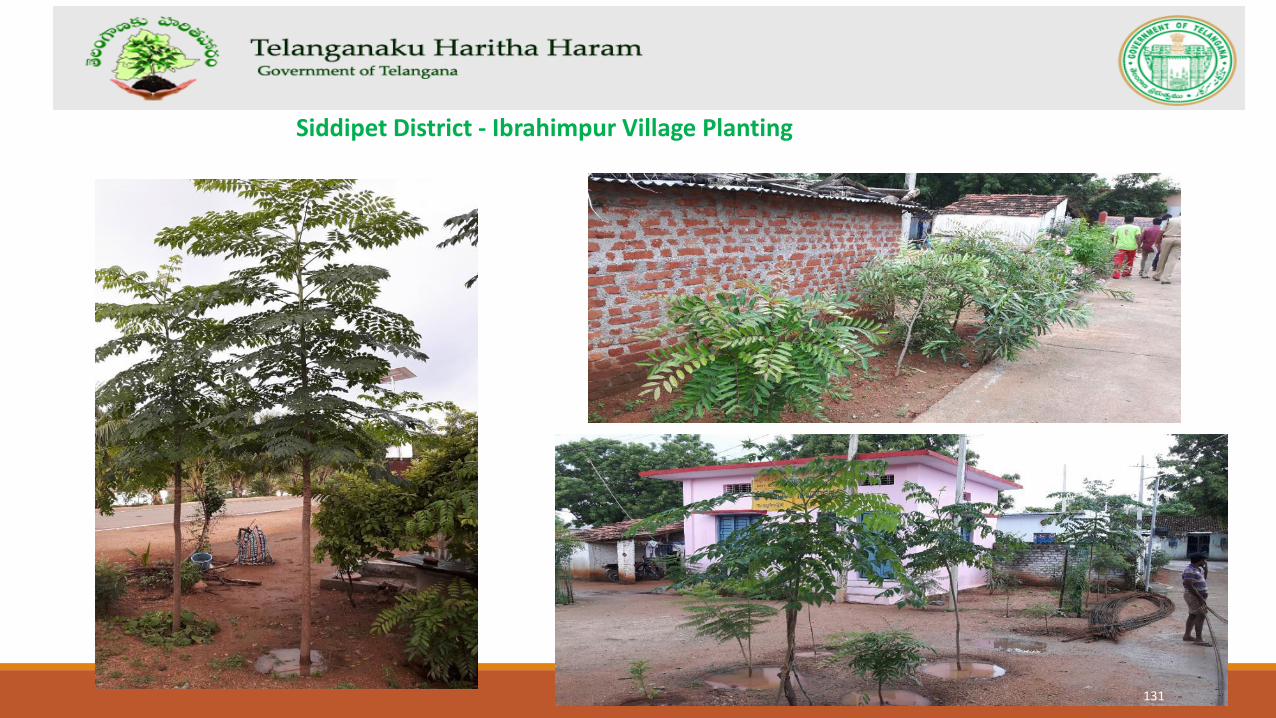
Siddipet District - Ibrahimpur Village Planting
131
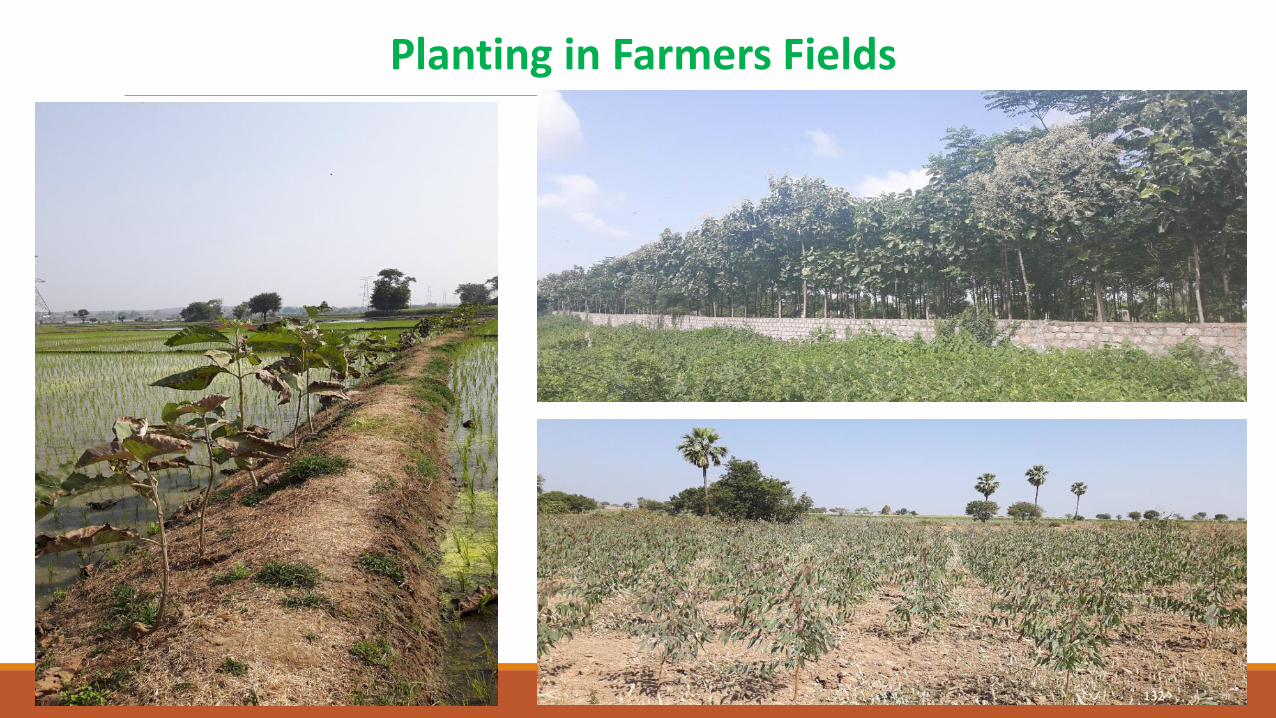
Planting in Farmers Fields
132
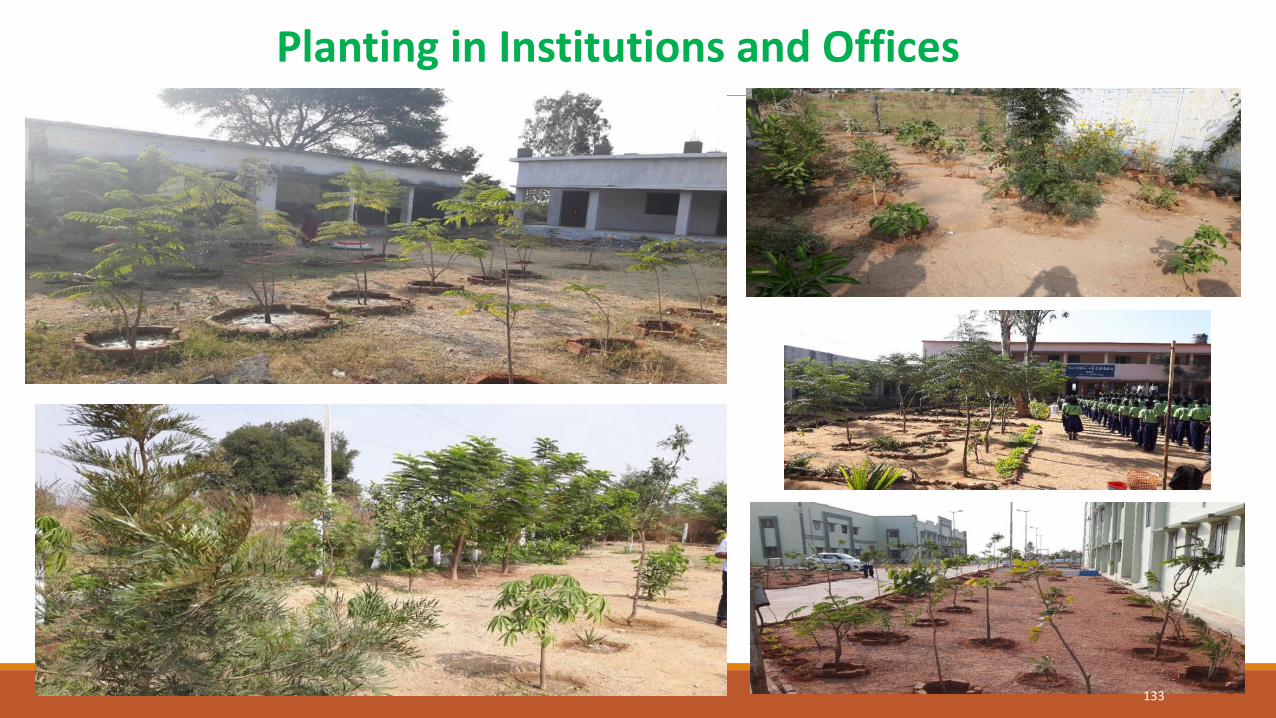
Planting in Institutions and Offices
133
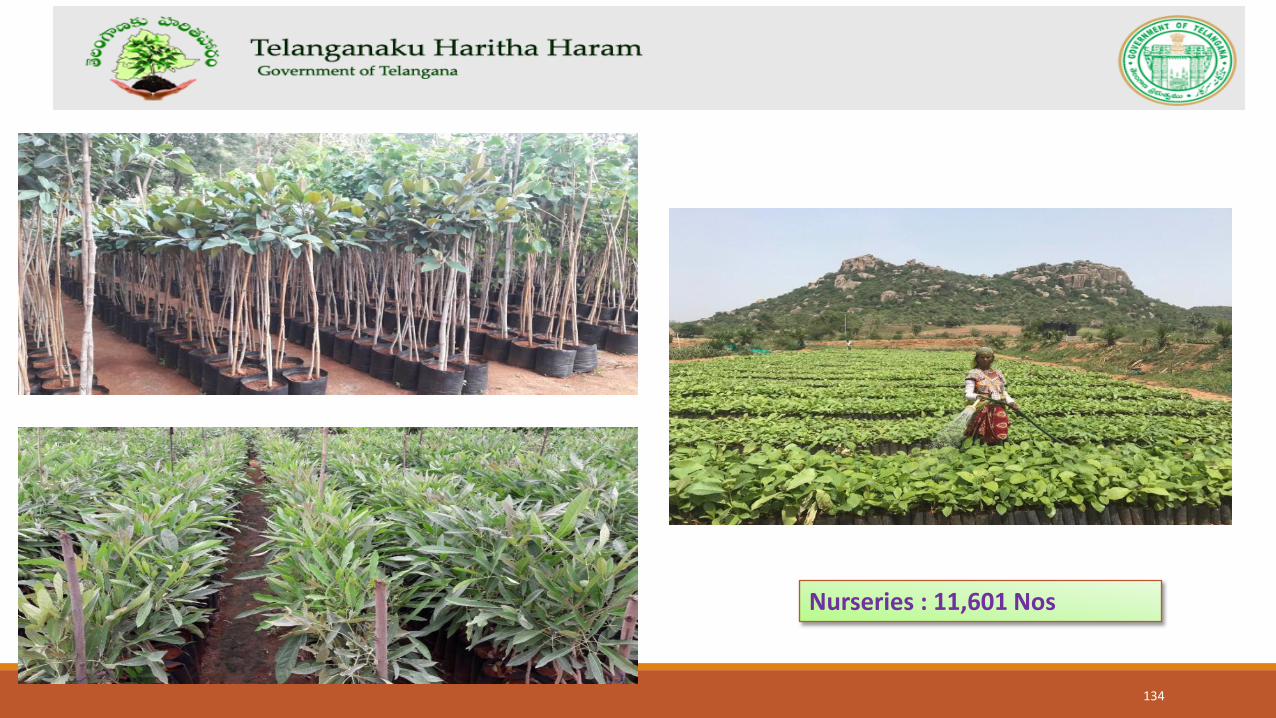
Nurseries : 11,601 Nos
134
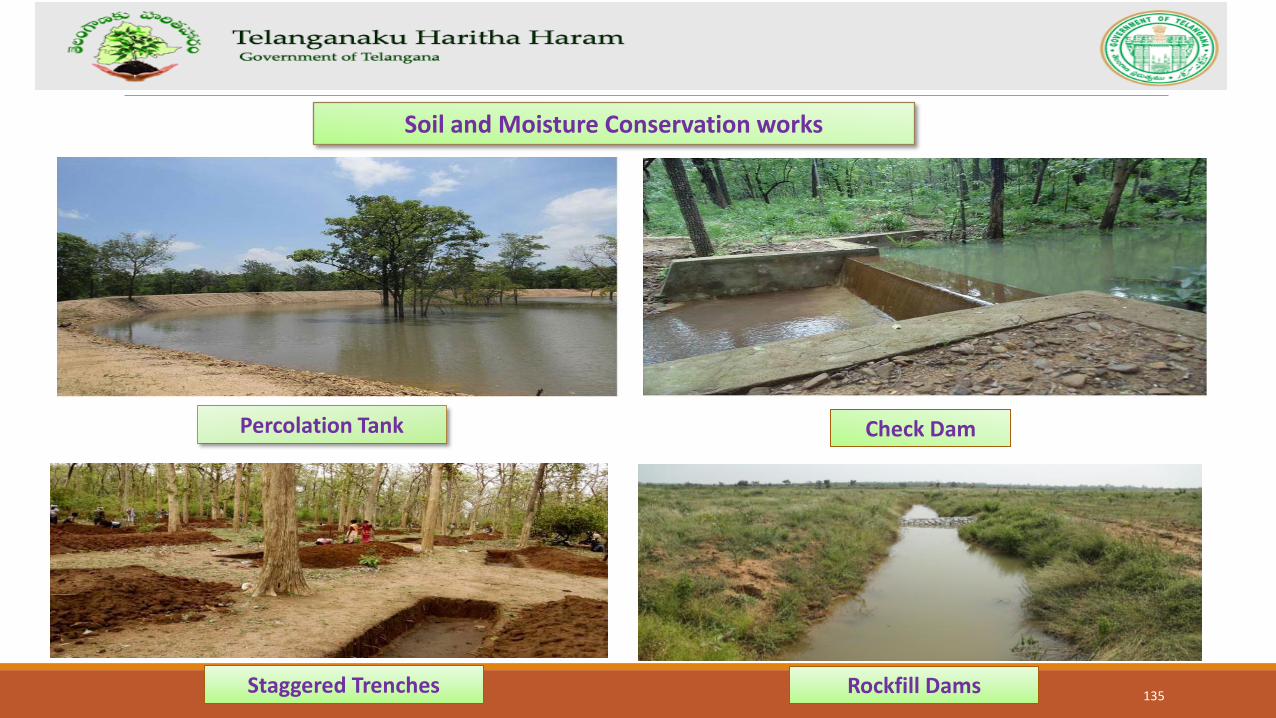
Soil and Moisture Conservation works
Percolation Tank Check Dam
Staggered Trenches Rockfill Dams 135
136
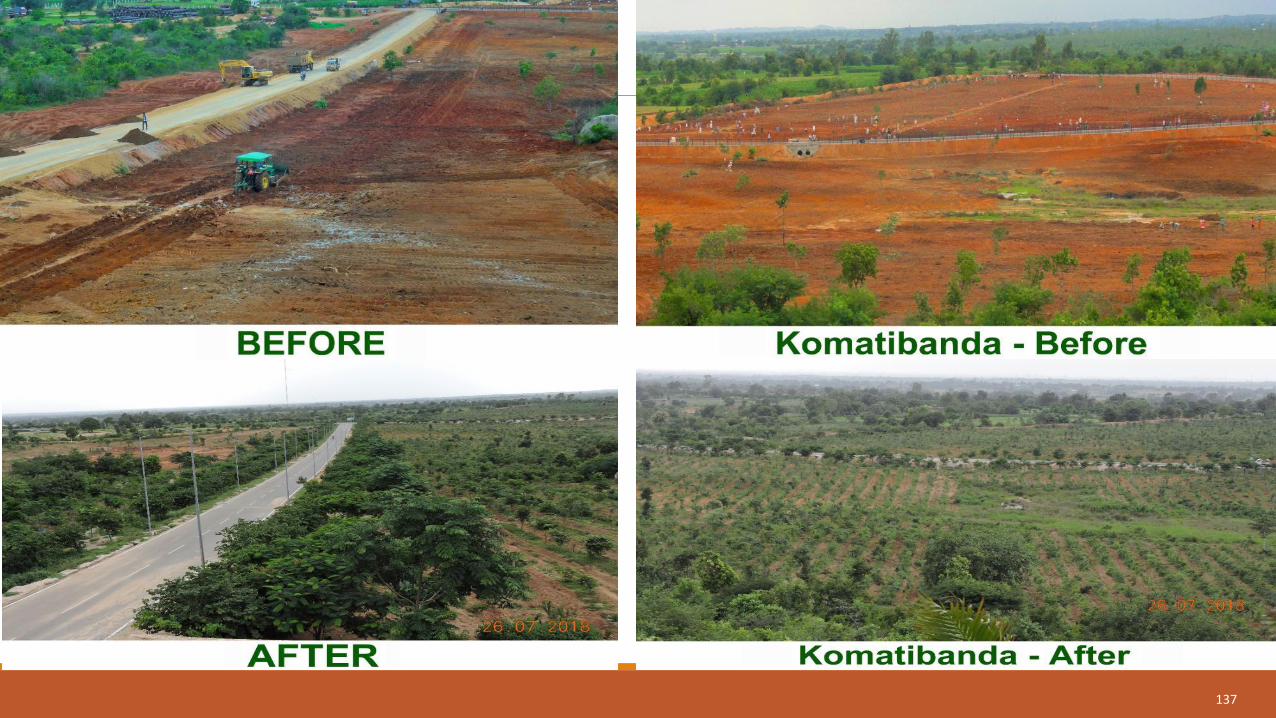
137
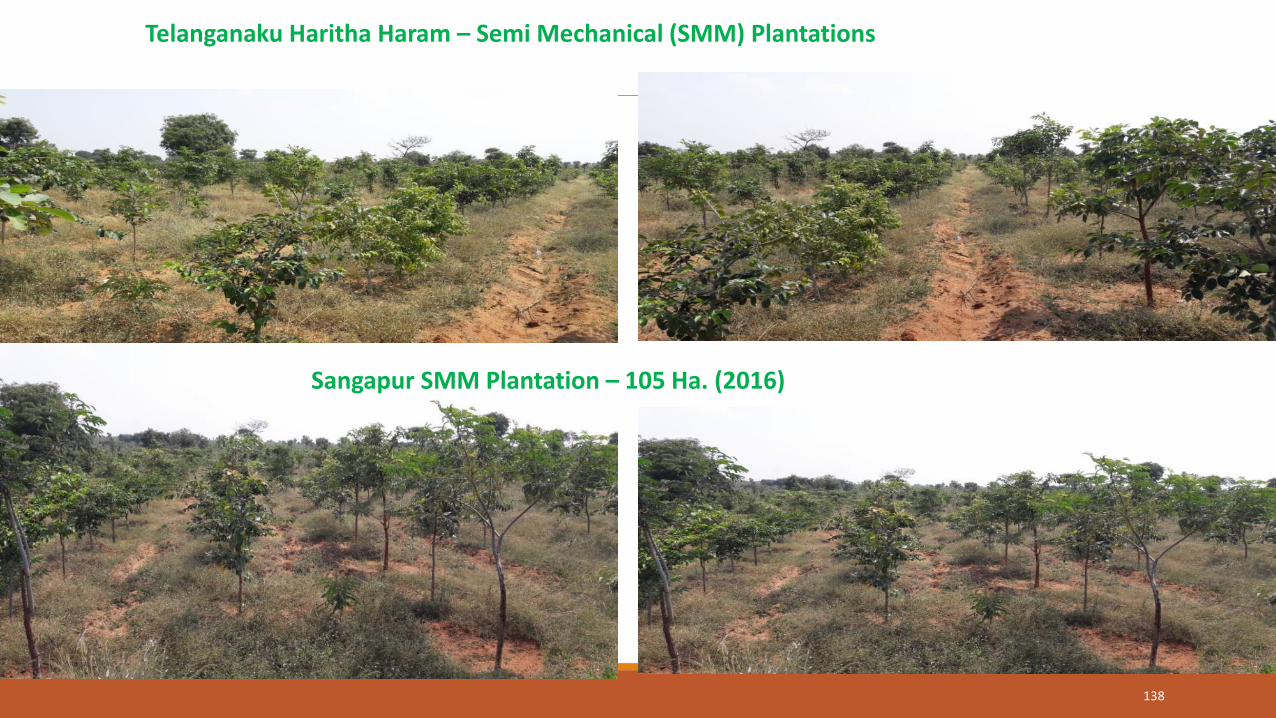
Sangapur SMM Plantation – 105 Ha. (2016)
Telanganaku Haritha Haram – Semi Mechanical (SMM) Plantations
138
Panchayati Raj & Rural Development
139
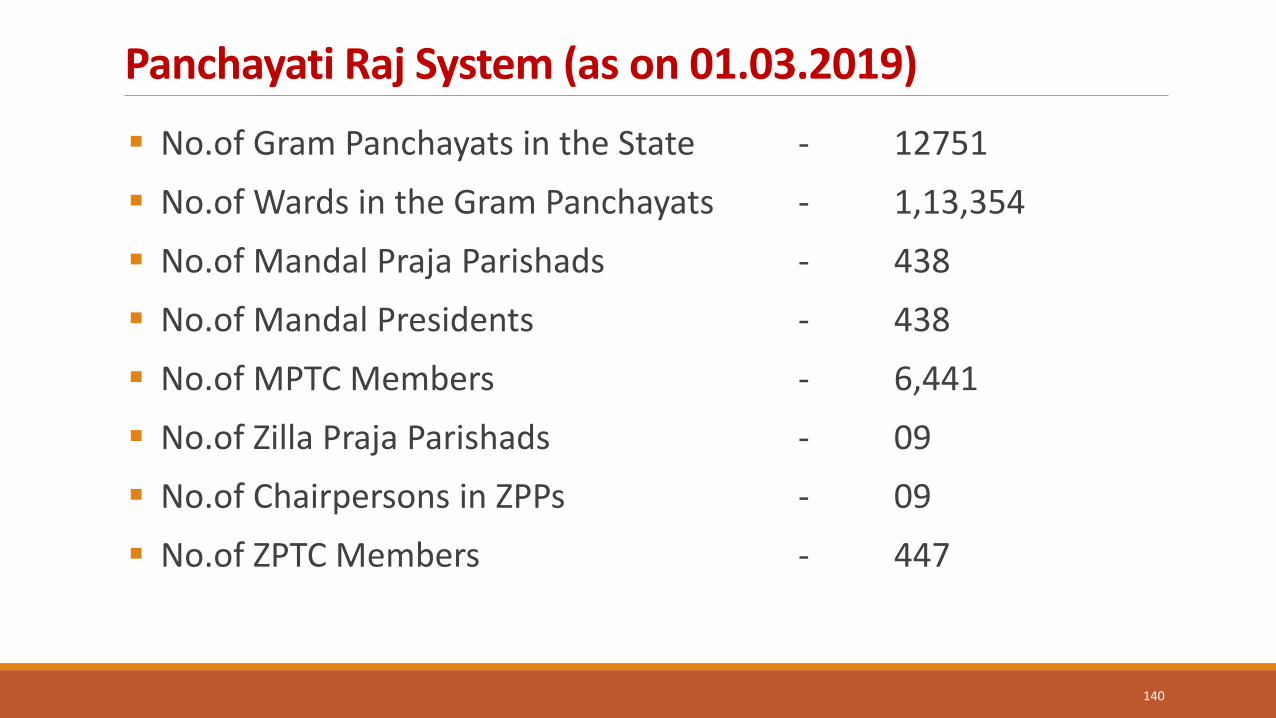
Panchayati Raj System (as on 01.03.2019)
No.of Gram Panchayats in the State - 12751
No.of Wards in the Gram Panchayats - 1,13,354
No.of Mandal Praja Parishads - 438
No.of Mandal Presidents - 438
No.of MPTC Members - 6,441
No.of Zilla Praja Parishads - 09
No.of Chairpersons in ZPPs - 09
No.of ZPTC Members - 447
140
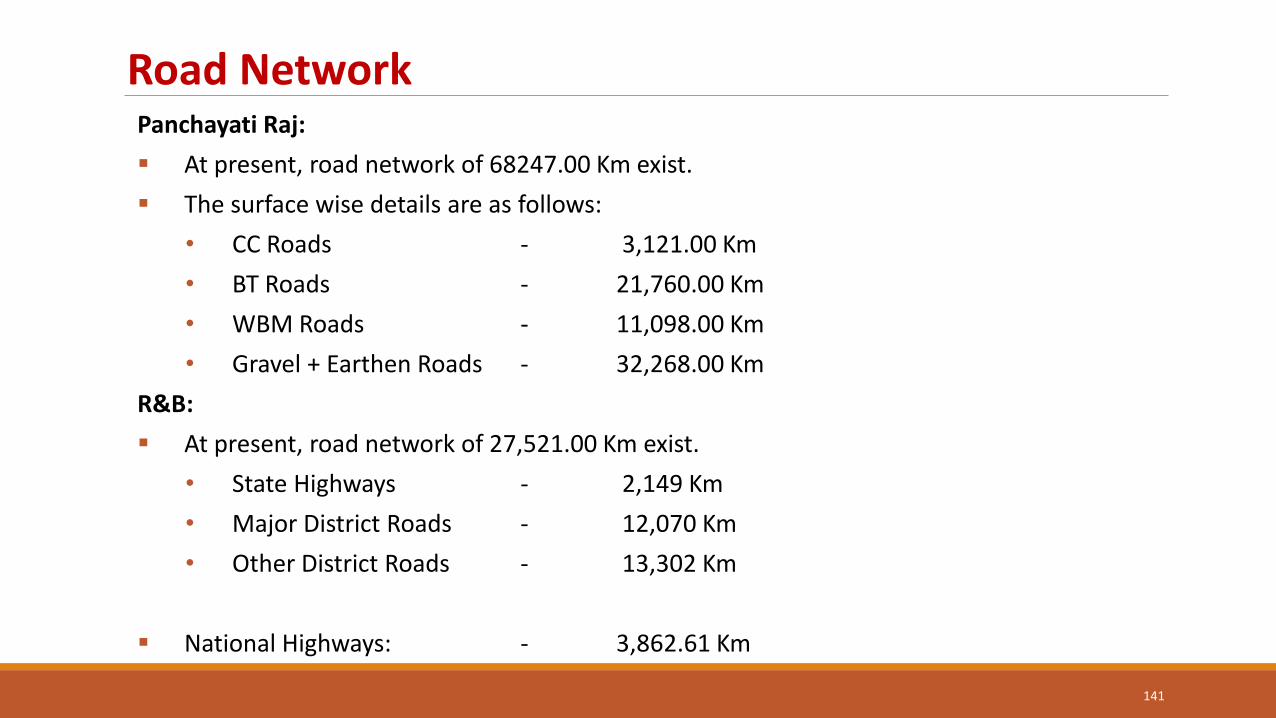
Road Network
141
Panchayati Raj:
At present, road network of 68247.00 Km exist.
The surface wise details are as follows:
• CC Roads - 3,121.00 Km
• BT Roads - 21,760.00 Km
• WBM Roads - 11,098.00 Km
• Gravel + Earthen Roads - 32,268.00 Km
R&B:
At present, road network of 27,521.00 Km exist.
• State Highways - 2,149 Km
• Major District Roads - 12,070 Km
• Other District Roads - 13,302 Km
National Highways: - 3,862.61 Km
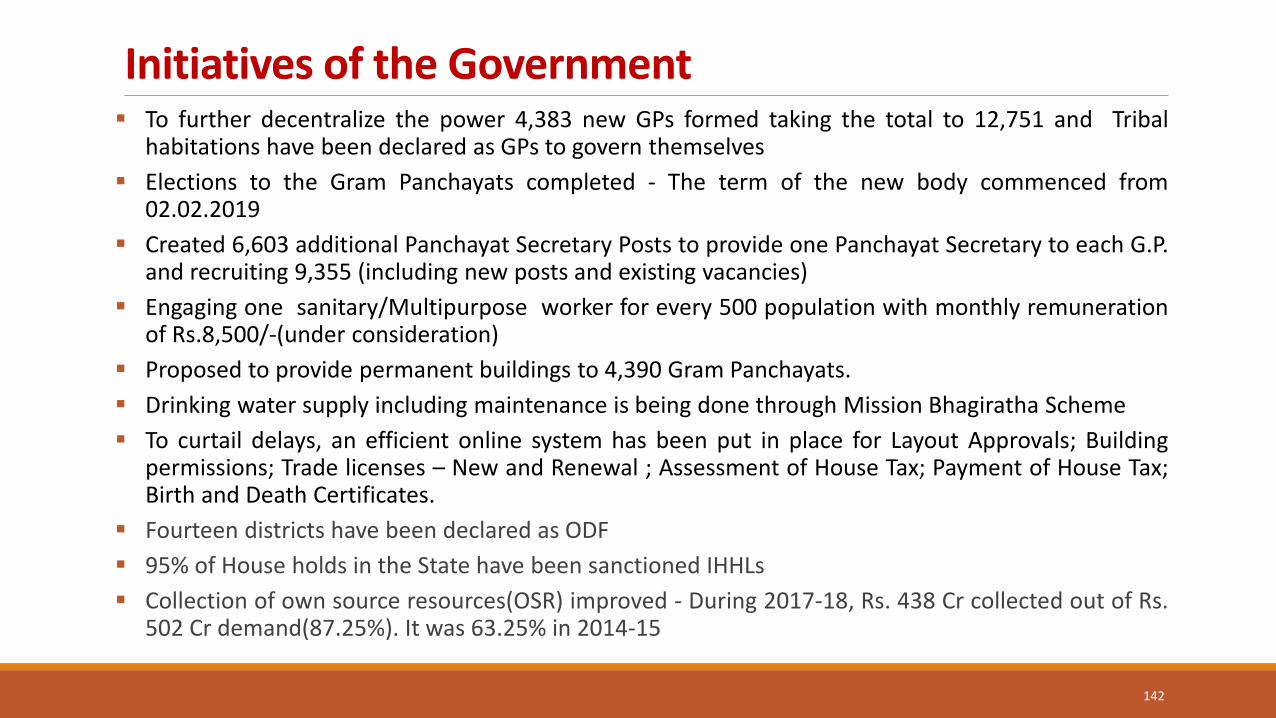
Initiatives of the Government To further decentralize the power 4,383 new GPs formed taking the total to 12,751 and Tribal
habitations have been declared as GPs to govern themselves
Elections to the Gram Panchayats completed - The term of the new body commenced from 02.02.2019
Created 6,603 additional Panchayat Secretary Posts to provide one Panchayat Secretary to each G.P. and recruiting 9,355 (including new posts and existing vacancies)
Engaging one sanitary/Multipurpose worker for every 500 population with monthly remuneration of Rs.8,500/-(under consideration)
Proposed to provide permanent buildings to 4,390 Gram Panchayats.
Drinking water supply including maintenance is being done through Mission Bhagiratha Scheme
To curtail delays, an efficient online system has been put in place for Layout Approvals; Building permissions; Trade licenses – New and Renewal ; Assessment of House Tax; Payment of House Tax; Birth and Death Certificates.
Fourteen districts have been declared as ODF
95% of House holds in the State have been sanctioned IHHLs
Collection of own source resources(OSR) improved - During 2017-18, Rs. 438 Cr collected out of Rs. 502 Cr demand(87.25%). It was 63.25% in 2014-15
142
Aasara Pensions
143
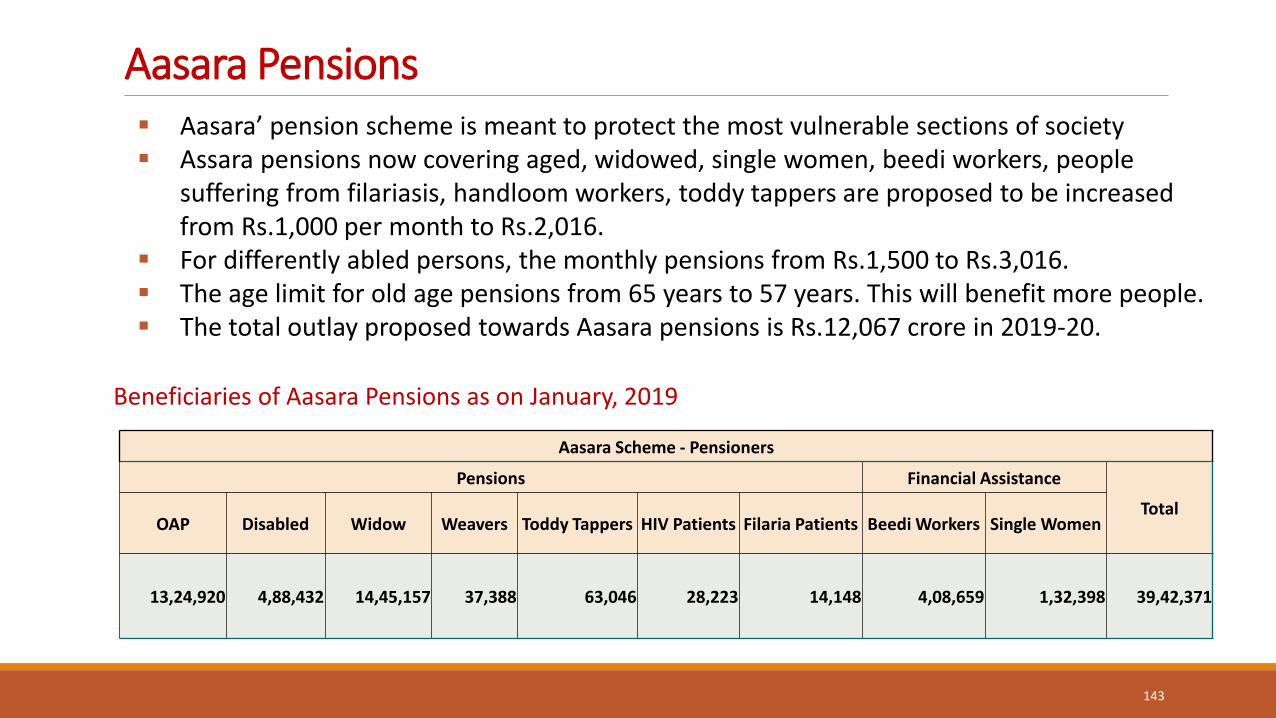
Aasara’ pension scheme is meant to protect the most vulnerable sections of society Assara pensions now covering aged, widowed, single women, beedi workers, people
suffering from filariasis, handloom workers, toddy tappers are proposed to be increased from Rs.1,000 per month to Rs.2,016.
For differently abled persons, the monthly pensions from Rs.1,500 to Rs.3,016. The age limit for old age pensions from 65 years to 57 years. This will benefit more people. The total outlay proposed towards Aasara pensions is Rs.12,067 crore in 2019-20.
Beneficiaries of Aasara Pensions as on January, 2019
Aasara Scheme - Pensioners
Pensions Financial Assistance
Total OAP Disabled Widow Weavers Toddy Tappers HIV Patients Filaria Patients Beedi Workers Single Women
13,24,920 4,88,432 14,45,157 37,388 63,046 28,223 14,148 4,08,659 1,32,398 39,42,371
Mission Bhagiratha
144
145
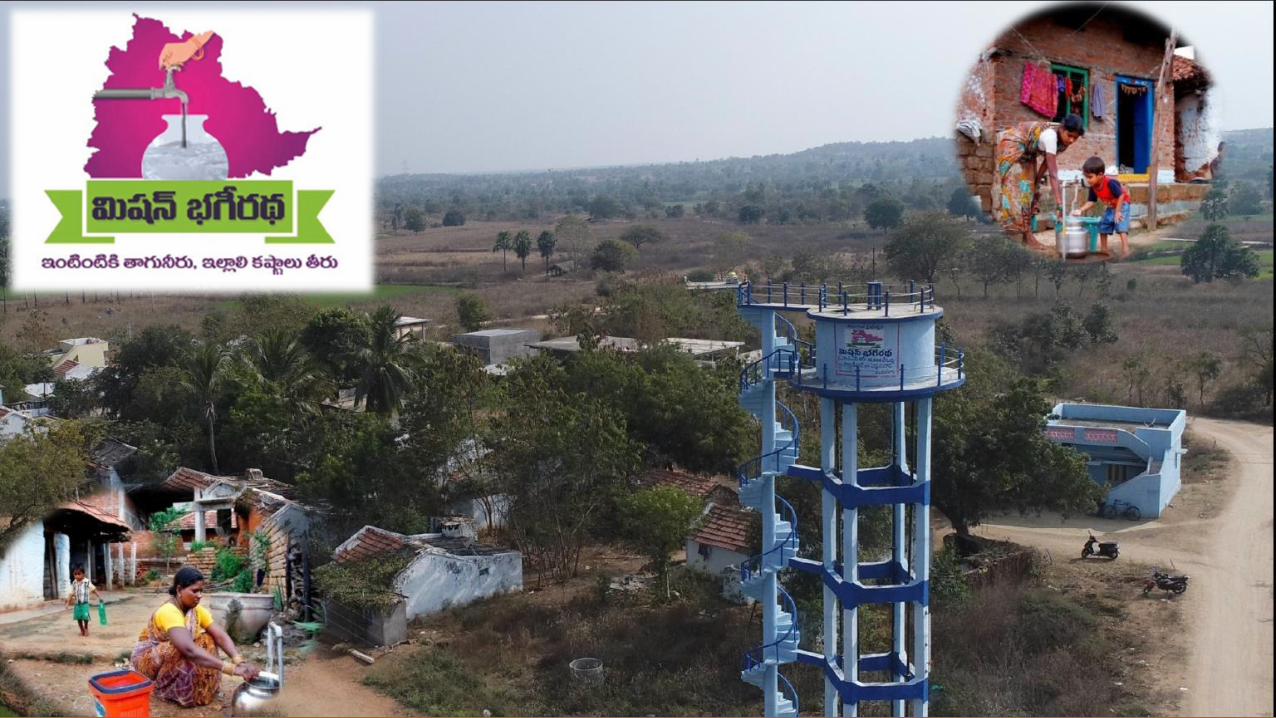
Mission Bhagiratha
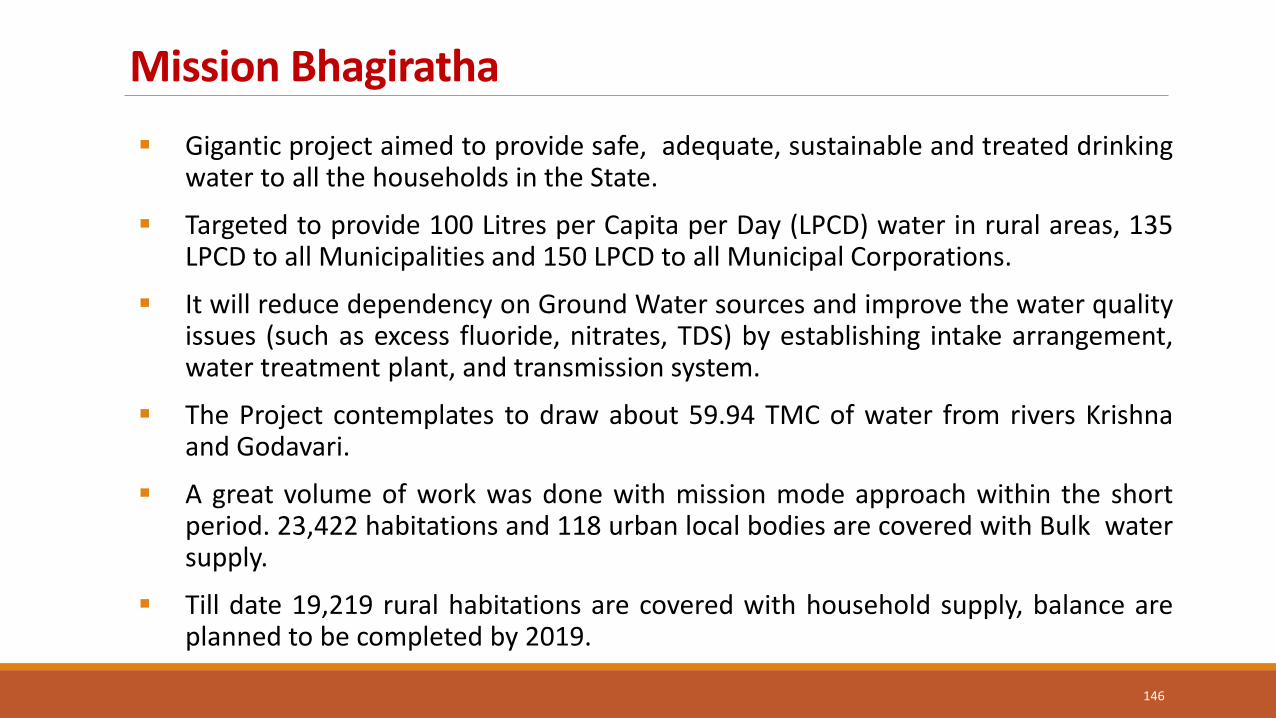
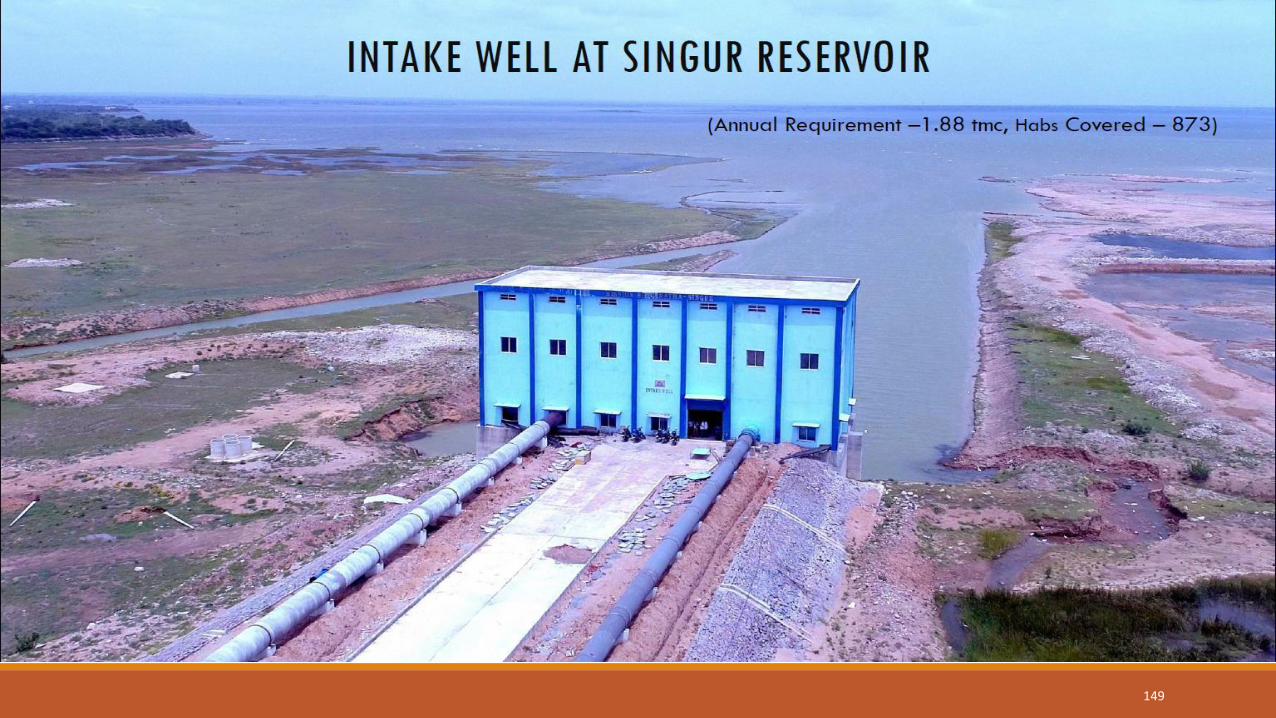
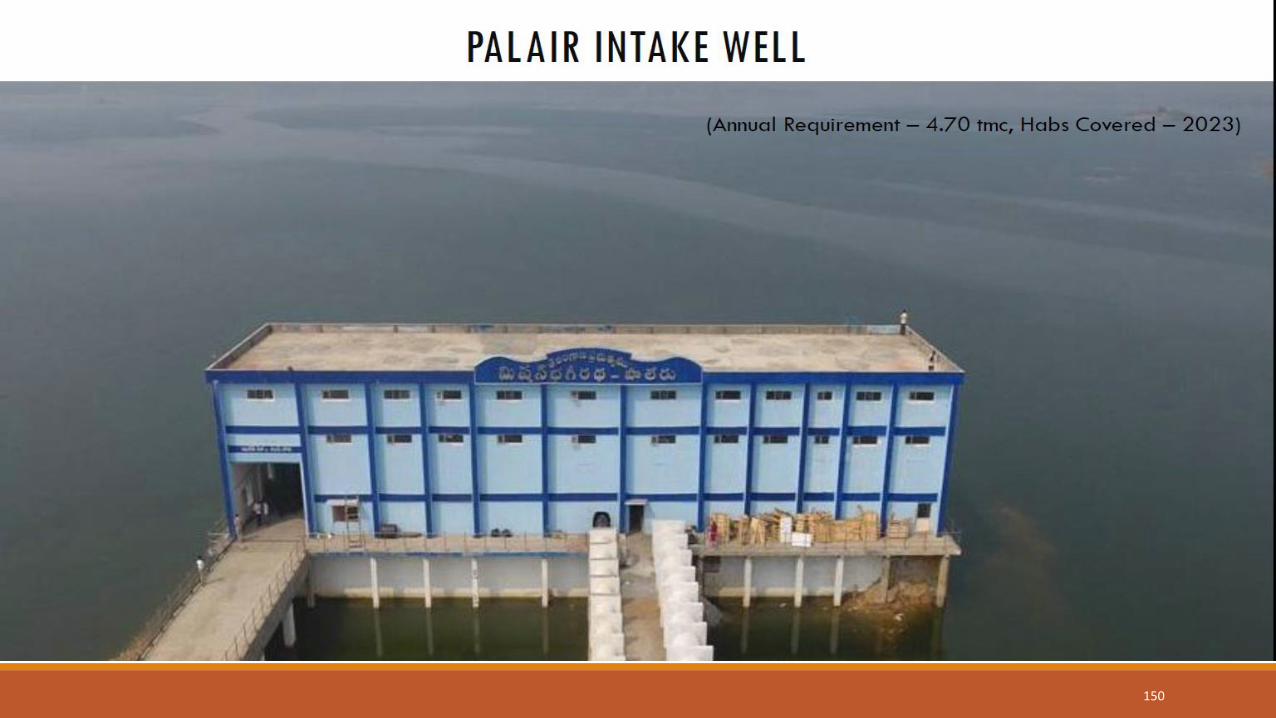
Gigantic project aimed to provide safe, adequate, sustainable and treated drinking water to all the households in the State.
Targeted to provide 100 Litres per Capita per Day (LPCD) water in rural areas, 135 LPCD to all Municipalities and 150 LPCD to all Municipal Corporations.
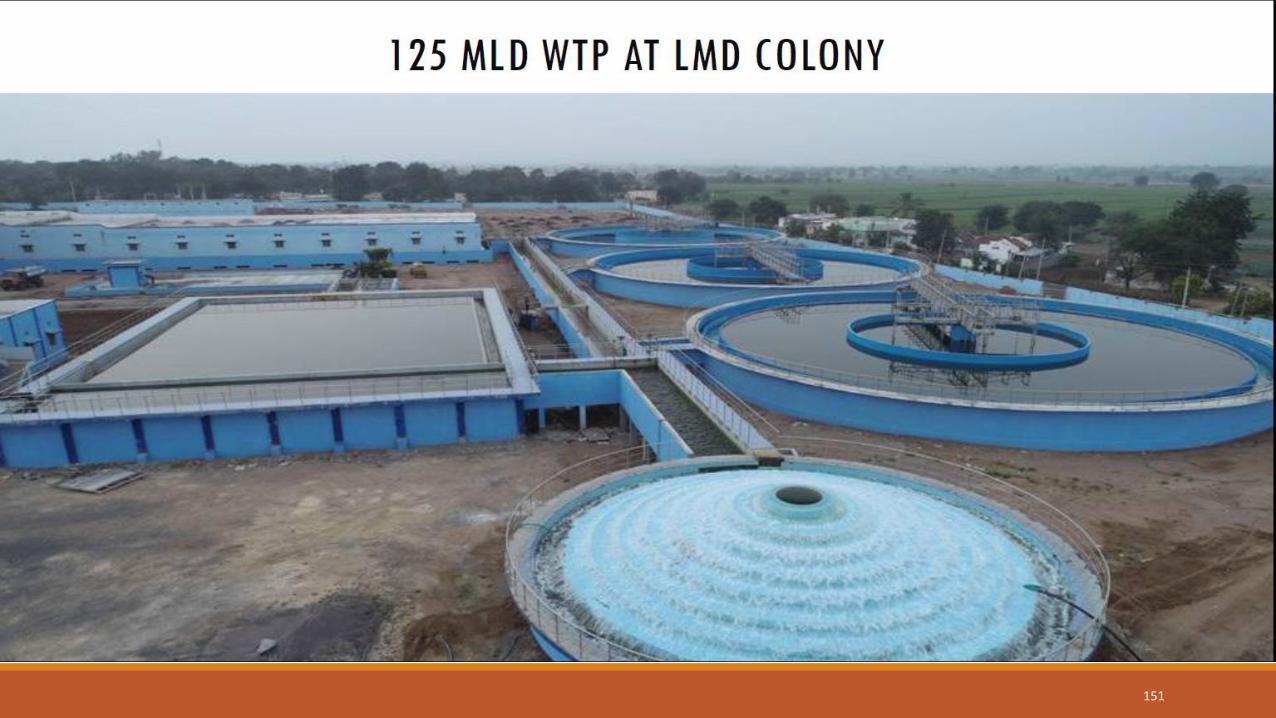
It will reduce dependency on Ground Water sources and improve the water quality issues (such as excess fluoride, nitrates, TDS) by establishing intake arrangement, water treatment plant, and transmission system.
The Project contemplates to draw about 59.94 TMC of water from rivers Krishna and Godavari.
A great volume of work was done with mission mode approach within the short period. 23,422 habitations and 118 urban local bodies are covered with Bulk water supply.
Till date 19,219 rural habitations are covered with household supply, balance are planned to be completed by 2019.
146
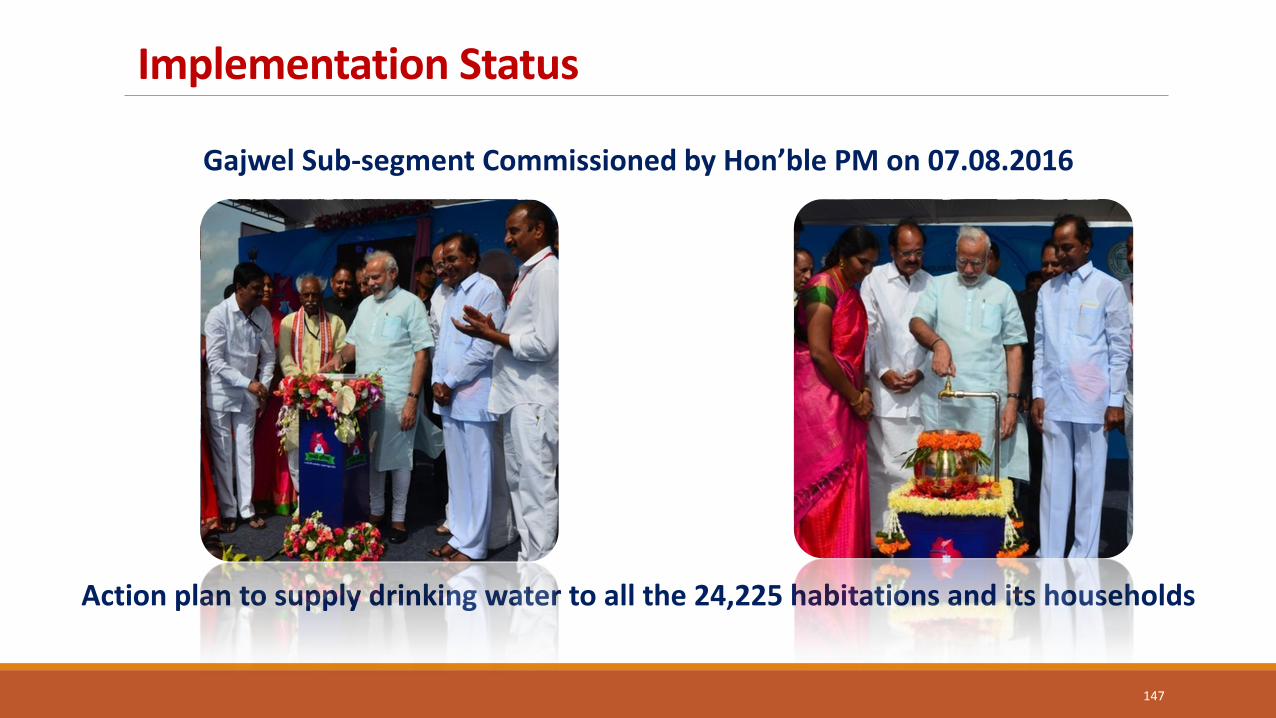
Implementation Status
Action plan to supply drinking water to all the 24,225 habitations and its households
Gajwel Sub-segment Commissioned by Hon’ble PM on 07.08.2016
147
148
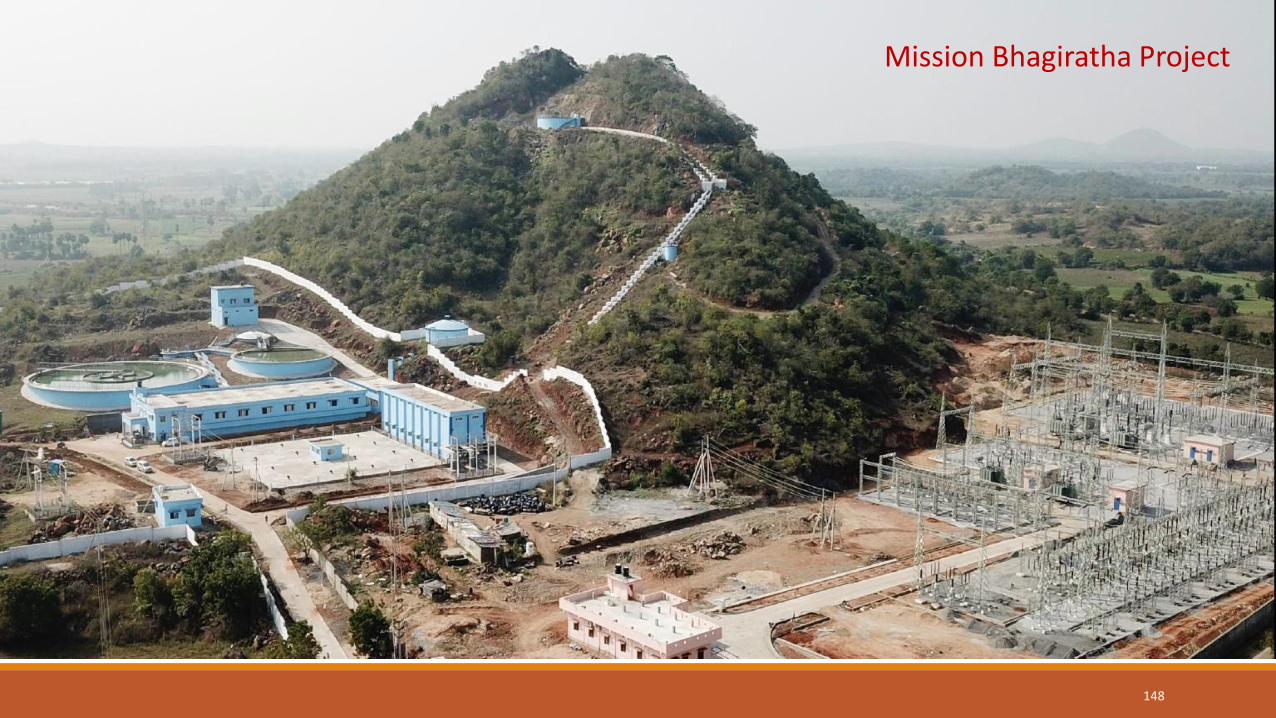
Mission Bhagiratha Project
149
150
151
Transport
152
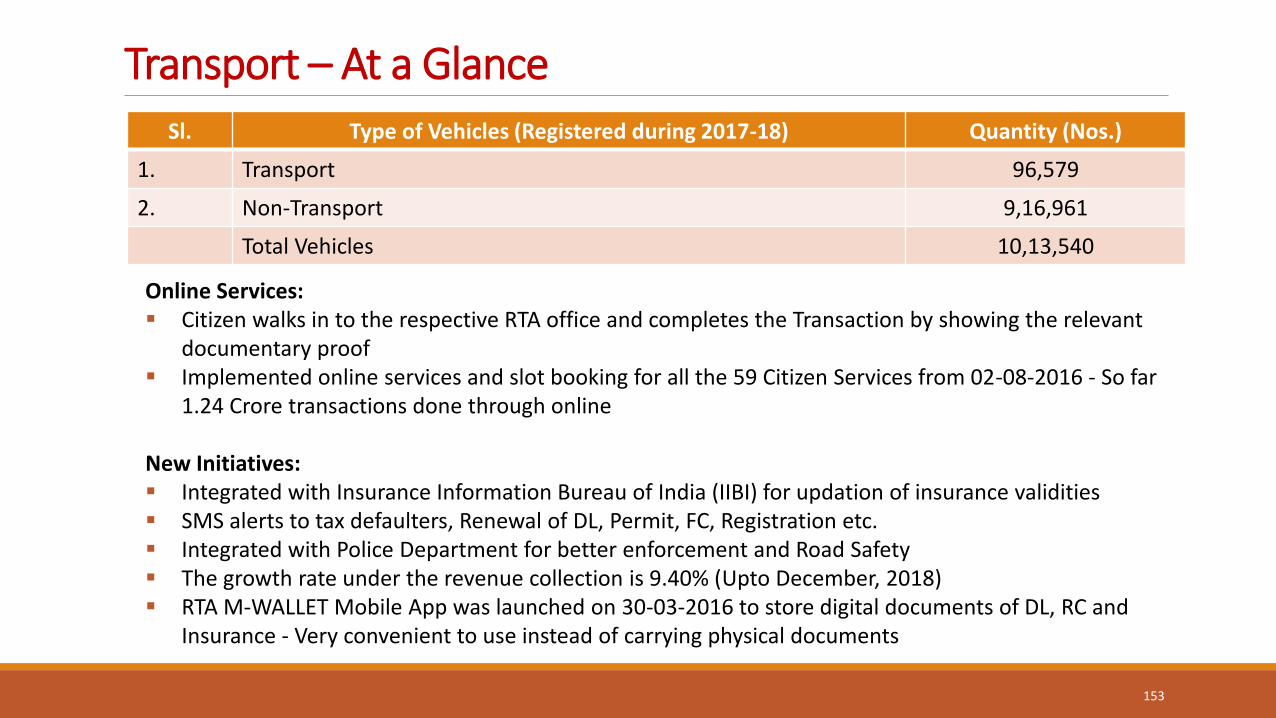
Transport – At a Glance
Sl. Type of Vehicles (Registered during 2017-18) Quantity (Nos.)
1. Transport 96,579
2. Non-Transport 9,16,961
Total Vehicles 10,13,540
153
Online Services: Citizen walks in to the respective RTA office and completes the Transaction by showing the relevant
documentary proof Implemented online services and slot booking for all the 59 Citizen Services from 02-08-2016 - So far
1.24 Crore transactions done through online New Initiatives: Integrated with Insurance Information Bureau of India (IIBI) for updation of insurance validities SMS alerts to tax defaulters, Renewal of DL, Permit, FC, Registration etc. Integrated with Police Department for better enforcement and Road Safety The growth rate under the revenue collection is 9.40% (Upto December, 2018) RTA M-WALLET Mobile App was launched on 30-03-2016 to store digital documents of DL, RC and
Insurance - Very convenient to use instead of carrying physical documents
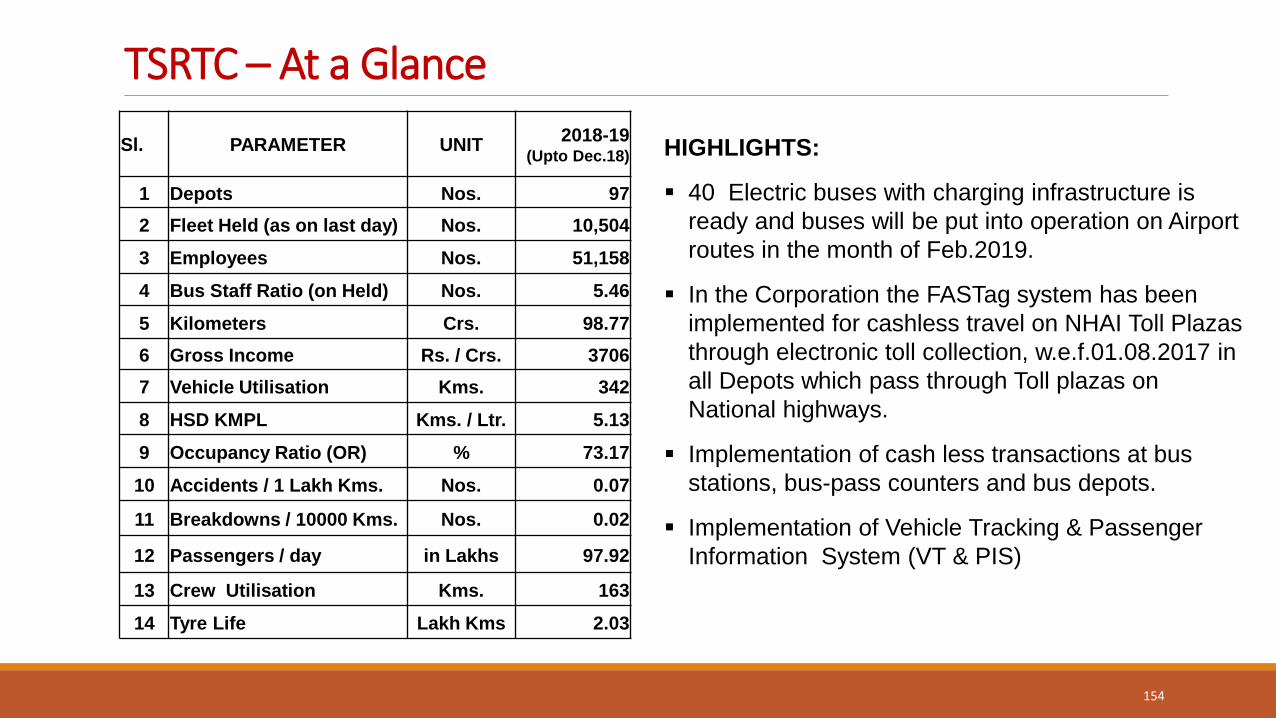
TSRTC – At a Glance
154
Sl. PARAMETER UNIT 2018-19
(Upto Dec.18)
1 Depots Nos. 97
2 Fleet Held (as on last day) Nos. 10,504
3 Employees Nos. 51,158
4 Bus Staff Ratio (on Held) Nos. 5.46
5 Kilometers Crs. 98.77
6 Gross Income Rs. / Crs. 3706
7 Vehicle Utilisation Kms. 342
8 HSD KMPL Kms. / Ltr. 5.13
9 Occupancy Ratio (OR) % 73.17
10 Accidents / 1 Lakh Kms. Nos. 0.07
11 Breakdowns / 10000 Kms. Nos. 0.02
12 Passengers / day in Lakhs 97.92
13 Crew Utilisation Kms. 163
14 Tyre Life Lakh Kms 2.03
HIGHLIGHTS:
40 Electric buses with charging infrastructure is
ready and buses will be put into operation on Airport
routes in the month of Feb.2019.
In the Corporation the FASTag system has been
implemented for cashless travel on NHAI Toll Plazas
through electronic toll collection, w.e.f.01.08.2017 in
all Depots which pass through Toll plazas on
National highways.
Implementation of cash less transactions at bus
stations, bus-pass counters and bus depots.
Implementation of Vehicle Tracking & Passenger
Information System (VT & PIS)

Home
155
Home VISION
Hon’ble Chief Minister of Telangana Sate has defined the vision of transforming the State to expand its footprint on the global map where
High standards of Quality Living and Enhance Life Expectancy
An opportunity to global communities for long-term investments and nurture into high growth corridor
Enhance safety and security of habitants and critical infrastructure
Respect and promote diverse cultural values and historical heritage
Foster good governance, continuous development and sustenance of multi-disciplinary capabilities.
Human Capital Development for continuous innovation and compete on global platform for economic growth.
156
Home... OBJECTIVES
Telangana State Police Department has defined the Citizen-centric objectives in line with the State Vision where
Establish good governance in safeguarding the rights of the citizens and encourage law abiding citizens.
Be Responsive, Accountable, and Transparent in providing citizen-friendly uniform service delivery to the citizens with a motto of “One State – One Service – One Experience for all citizens at all times”.
Continuous Innovation to transform the future through leveraging incremental and disruptive technology and process innovations.
Engage in community partnerships and global networks to build safer neighborhoods and community cohesion.
Promote Change Management and Personnel Development Programs.
157
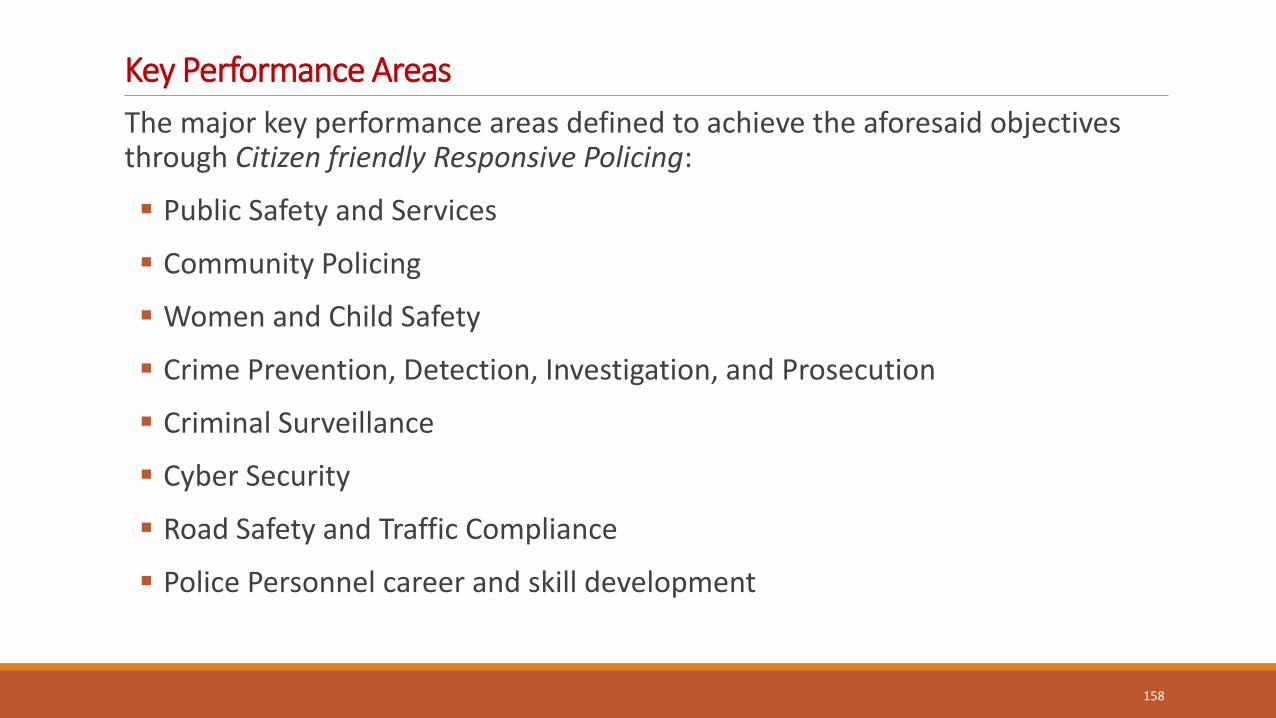
Key Performance Areas
The major key performance areas defined to achieve the aforesaid objectives through Citizen friendly Responsive Policing:
Public Safety and Services
Community Policing
Women and Child Safety
Crime Prevention, Detection, Investigation, and Prosecution
Criminal Surveillance
Cyber Security
Road Safety and Traffic Compliance
Police Personnel career and skill development
158
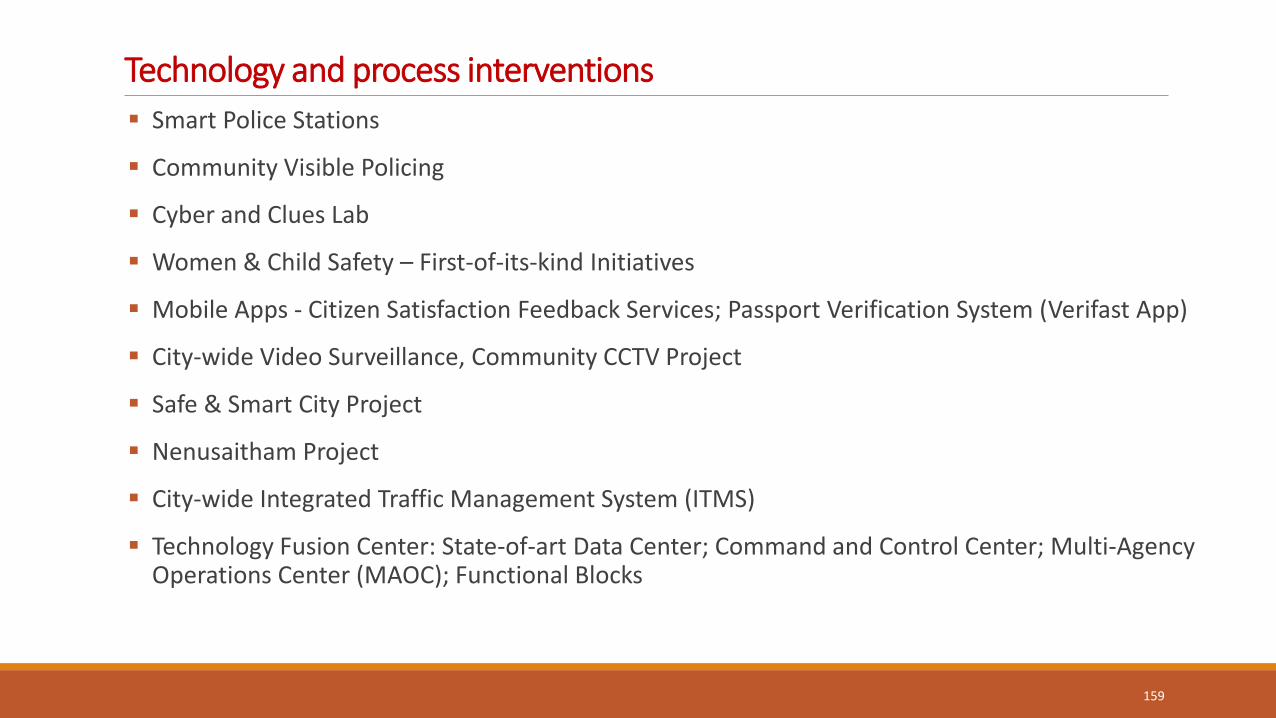
Technology and process interventions
Smart Police Stations
Community Visible Policing
Cyber and Clues Lab
Women & Child Safety – First-of-its-kind Initiatives
Mobile Apps - Citizen Satisfaction Feedback Services; Passport Verification System (Verifast App)
City-wide Video Surveillance, Community CCTV Project
Safe & Smart City Project
Nenusaitham Project
City-wide Integrated Traffic Management System (ITMS)
Technology Fusion Center: State-of-art Data Center; Command and Control Center; Multi-Agency Operations Center (MAOC); Functional Blocks
159
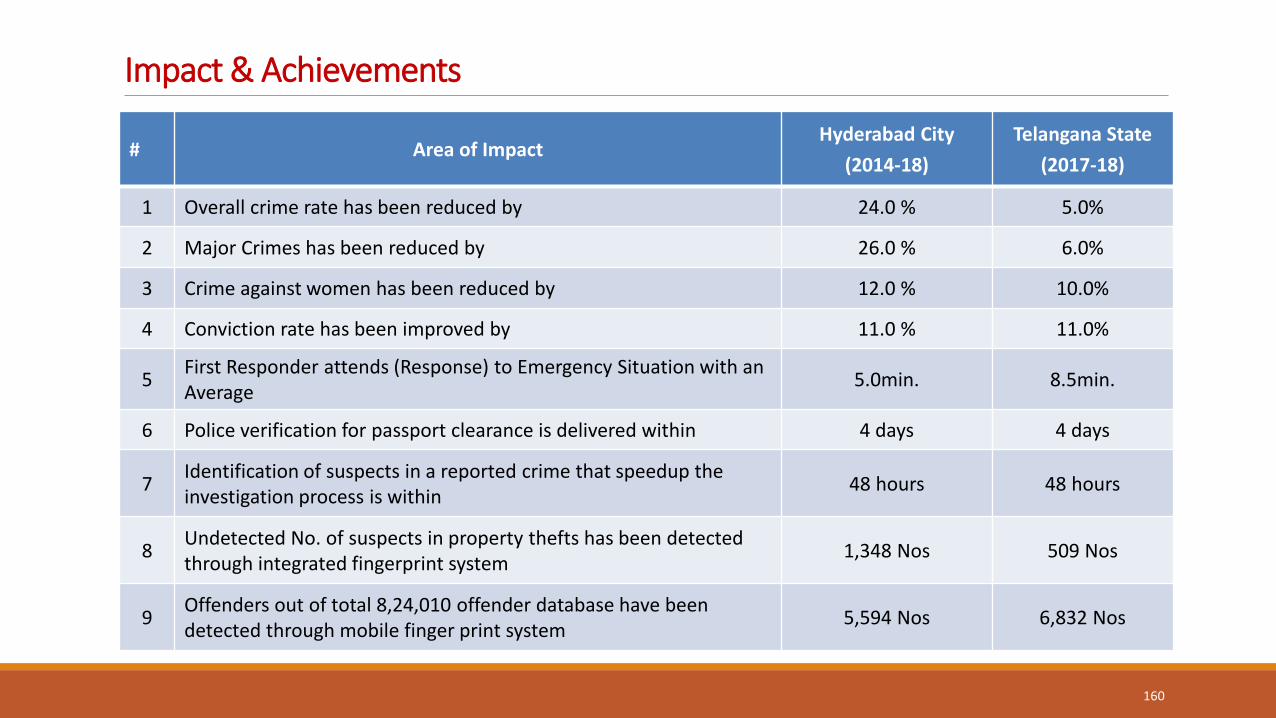
Impact & Achievements
# Area of Impact Hyderabad City
(2014-18)
Telangana State
(2017-18)
1 Overall crime rate has been reduced by 24.0 % 5.0%
2 Major Crimes has been reduced by 26.0 % 6.0%
3 Crime against women has been reduced by 12.0 % 10.0%
4 Conviction rate has been improved by 11.0 % 11.0%
5 First Responder attends (Response) to Emergency Situation with an Average
5.0min. 8.5min.
6 Police verification for passport clearance is delivered within 4 days 4 days
7 Identification of suspects in a reported crime that speedup the investigation process is within
48 hours 48 hours
8 Undetected No. of suspects in property thefts has been detected through integrated fingerprint system
1,348 Nos 509 Nos
9 Offenders out of total 8,24,010 offender database have been detected through mobile finger print system
5,594 Nos 6,832 Nos
160
Revenue
161
Revenue – Land Records Updation Programme Background:
Survey, Settlement and bundobust was conducted during Nizam period in Telangana area during 1932-34.
Recording of Khata wise details were carried out and Khasra Pahanis were prepared in Hyderabad State in 1954.
No serious attempts made to update the land records in the state after 1954.
Huge gap between records and ground reality resulting in litigations and disputes including crimes went up and sufferings of farmers increased.
Government has decided to take up a massive programme to purify & update the land Records.
162
Objective Accordingly, the Government has taken up this ambitious
programme in a time bound manner and the field exercise was conducted from 15.09.2017 to 31.12.2017 to redress the grievances of farmers with the objective of having
• Accurate land records which reflect the ground reality with regard to holdings & possession of the farmers.
• Transparent and accountable Land Record Management System, so that farmers are able to freely access land records.
163
Coverage 1,523 teams formed.
3,500 revenue officers were deployed.
Taken up in 10,823 Villages
Exercise covered in all 568 Mandals of 30 Districts of whole State (except Hyderabad).
Total Extent of Land covered - Ac 2,38,59,727.12 Gts.
Detailed guidelines/circulars were issued and all Teams sensitized by imparting Trainings starting from VRO to Joint Collector.
164
165
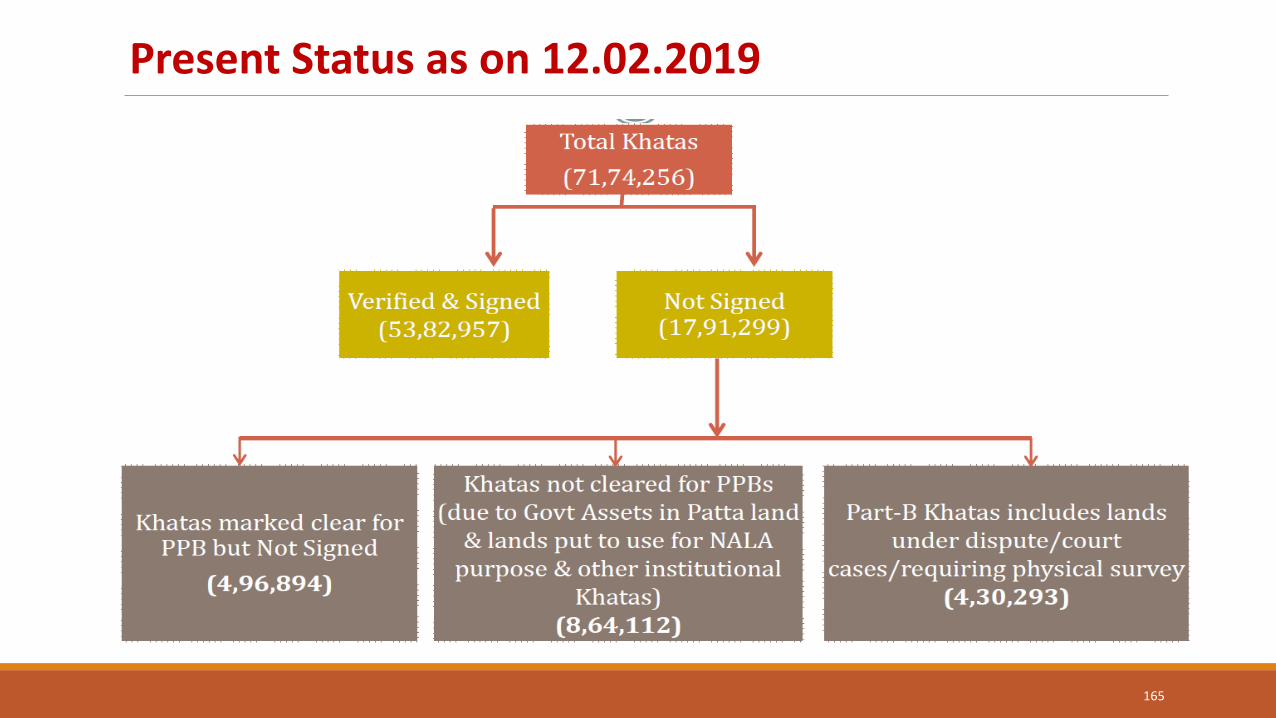
Present Status as on 12.02.2019
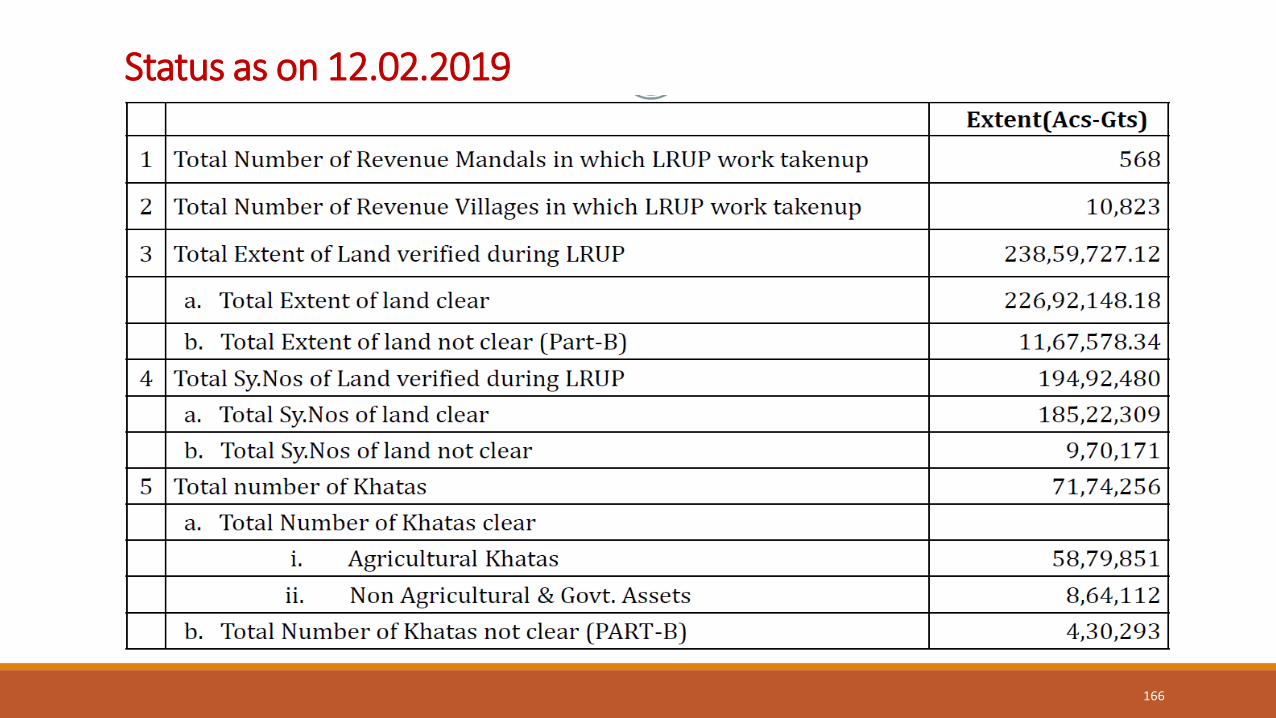
Status as on 12.02.2019
166
Outcomes of the Programme
The total land mass of the Village has been accounted for. (Agricultural lands, Non-Agricultural lands, Assets & Structures)
The Aadhaar linked updated Land Records serve as base record for various schemes of different departments like Agriculture, Civil Supplies, Rural Development etc.
The updated records were the key for implementation of prestigious Rythu Bandhu (Agriculture Investment Support Scheme) in Telangana State.
Legal complications on the land issues reduced and court cases in civil and revenue courts has come down.
The updated land records are made available through the CCLA web portal (http://ccla.telangana.gov.in/).
167
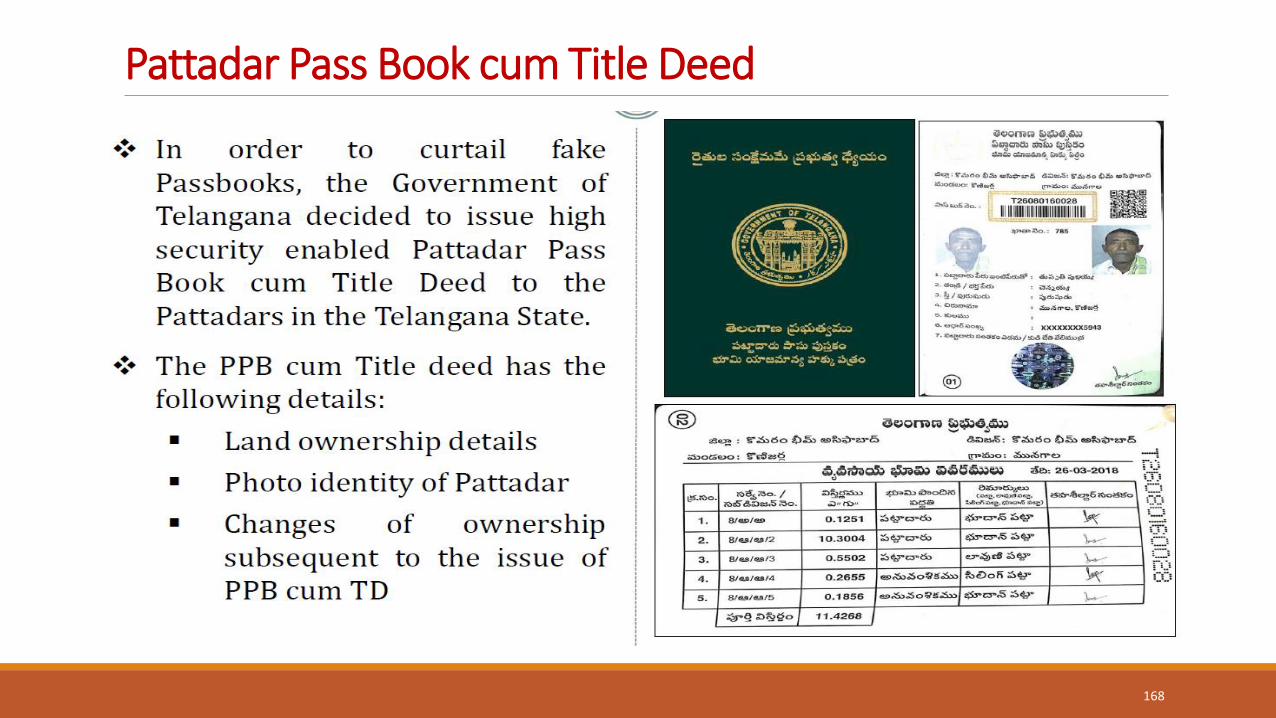
Pattadar Pass Book cum Title Deed
168
Thank You
169


