Embed Size (px)
Citation preview
Team Telangana State Remote Sensing Applications Centre
(TRAC)
Sri . B. P. Acharya, IAS Director General Spl. Chief Secretary Government of Telangana Dr. G. Sreenivasa Reddy Addl. Director General Dr. M. Kavitha Scientist 'SC' Sri. A. Kamalakar Reddy Senior Technical Officer Sri. N. Narender Technical Officer
Telangana State Developing Planning Society (TSDPS)
Dr. Y. V. Rama Rao Consultant Sri. B. Shiva Kumar Data Analyst (Drought Monitoring)
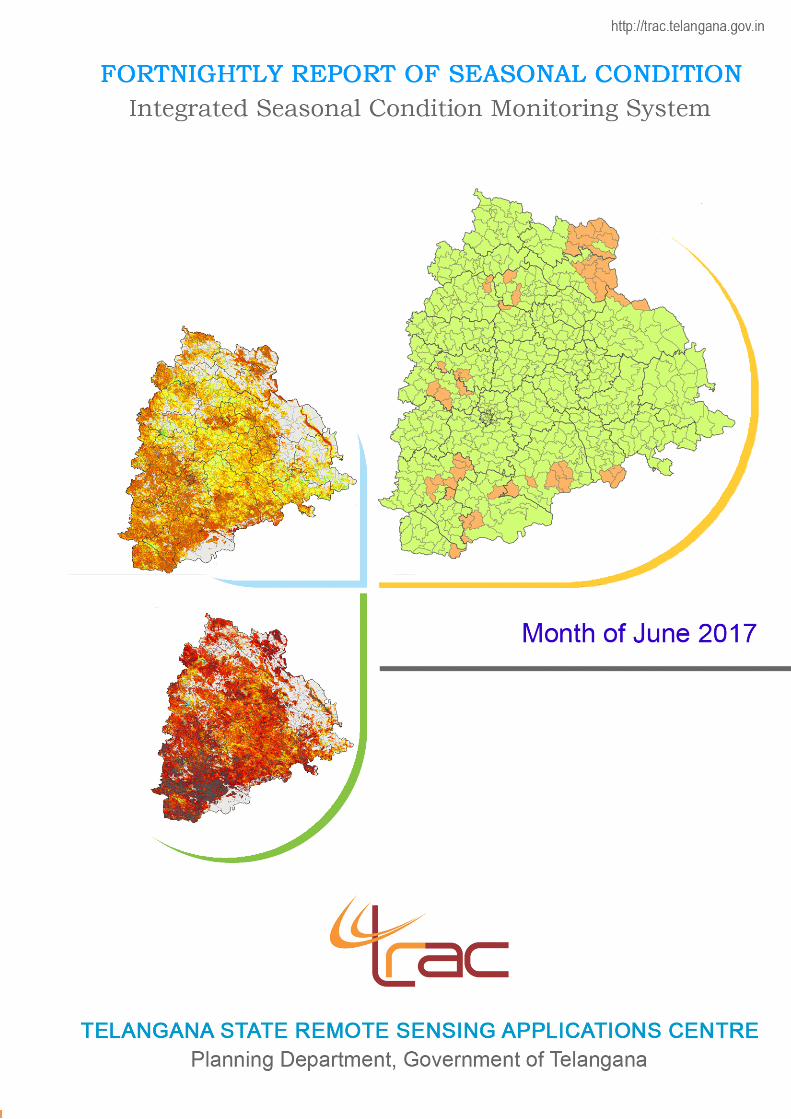
HIGHLIGHTS
INTEGRATED SEASONAL CONDITION MONITORING SYSTEM (ISMS) - TELANGANA
Cumulative Report up to 30th June, 2017
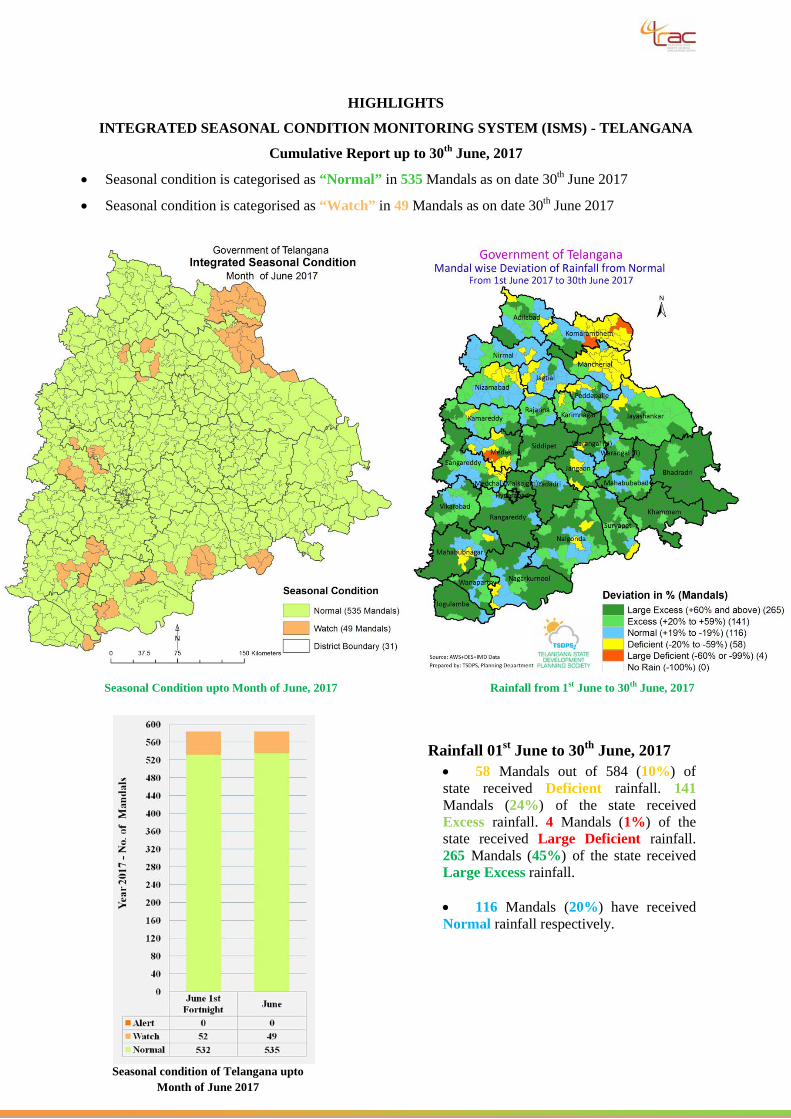
• Seasonal condition is categorised as “Normal” in 535 Mandals as on date 30th June 2017
• Seasonal condition is categorised as “Watch” in 49 Mandals as on date 30th June 2017
Rainfall 01st June to 30th June, 2017
• 58 Mandals out of 584 (10%) of state received Deficient rainfall. 141 Mandals (24%) of the state received Excess rainfall. 4 Mandals (1%) of the state received Large Deficient rainfall. 265 Mandals (45%) of the state received Large Excess rainfall. • 116 Mandals (20%) have received Normal rainfall respectively.
Seasonal Condition upto Month of June, 2017 Rainfall from 1st June to 30th June, 2017
Seasonal condition of Telangana upto Month of June 2017
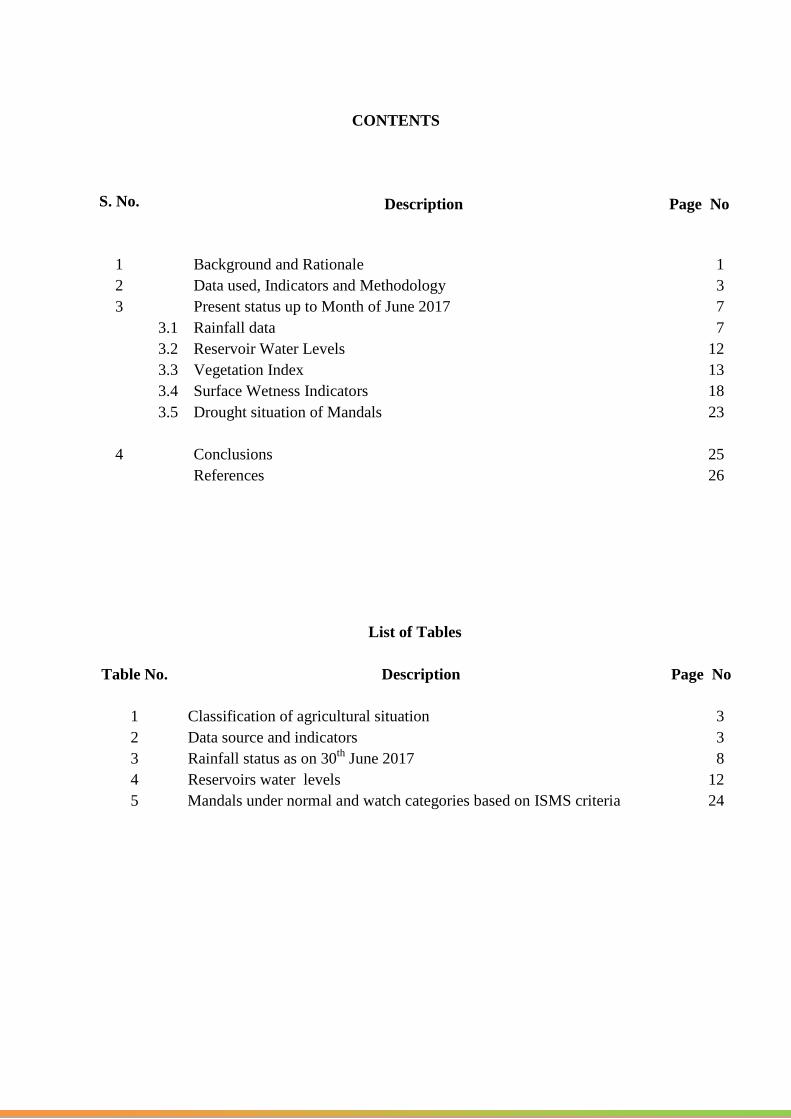
CONTENTS
S. No.
Description
Page No
1 Background and Rationale 1 2 Data used, Indicators and Methodology 3 3 Present status up to Month of June 2017 7 3.1 Rainfall data 7 3.2 Reservoir Water Levels 12 3.3 Vegetation Index 13 3.4 Surface Wetness Indicators 18 3.5 Drought situation of Mandals 23 4 Conclusions 25 References 26
List of Tables
Table No. Description Page No 1 Classification of agricultural situation 3 2 Data source and indicators 3 3 Rainfall status as on 30th June 2017 8 4 Reservoirs water levels 12 5 Mandals under normal and watch categories based on ISMS criteria 24
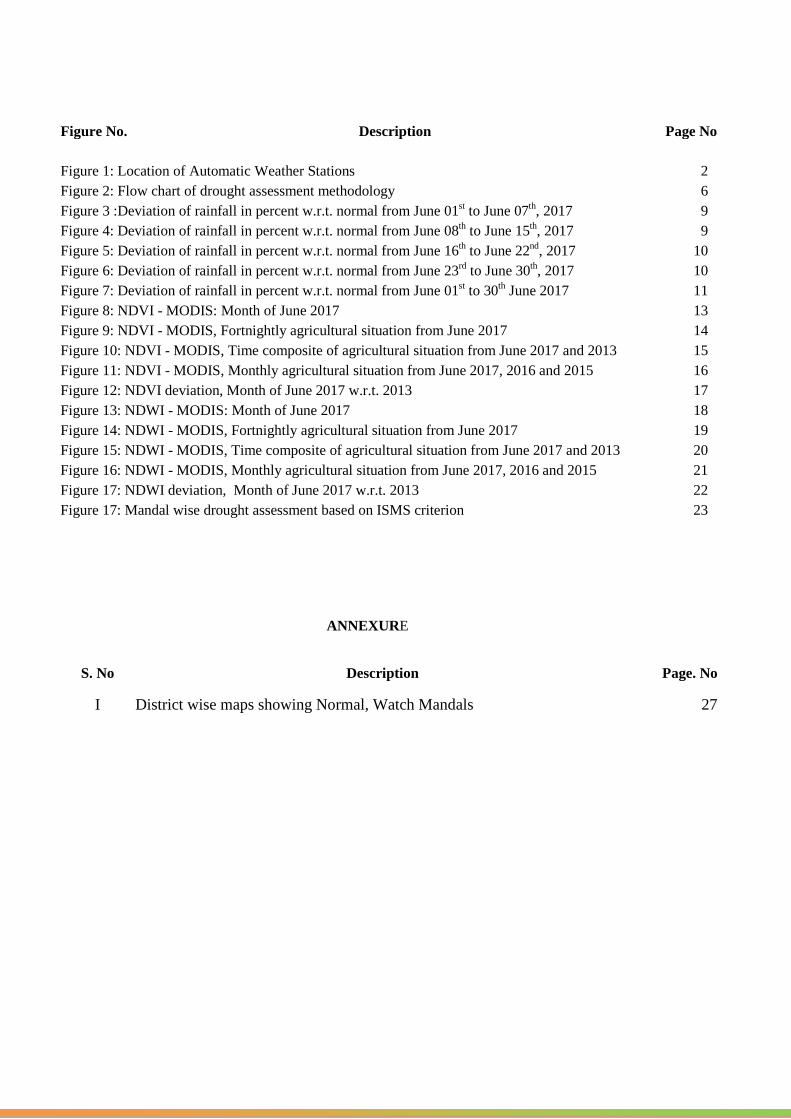
Figure No. Description Page No
Figure 1: Location of Automatic Weather Stations 2 Figure 2: Flow chart of drought assessment methodology 6 Figure 3 :Deviation of rainfall in percent w.r.t. normal from June 01st to June 07th, 2017 9 Figure 4: Deviation of rainfall in percent w.r.t. normal from June 08th to June 15th, 2017 9 Figure 5: Deviation of rainfall in percent w.r.t. normal from June 16th to June 22nd, 2017 10 Figure 6: Deviation of rainfall in percent w.r.t. normal from June 23rd to June 30th, 2017 10 Figure 7: Deviation of rainfall in percent w.r.t. normal from June 01st to 30th June 2017 11 Figure 8: NDVI - MODIS: Month of June 2017 13 Figure 9: NDVI - MODIS, Fortnightly agricultural situation from June 2017 14 Figure 10: NDVI - MODIS, Time composite of agricultural situation from June 2017 and 2013 15 Figure 11: NDVI - MODIS, Monthly agricultural situation from June 2017, 2016 and 2015 16 Figure 12: NDVI deviation, Month of June 2017 w.r.t. 2013 17 Figure 13: NDWI - MODIS: Month of June 2017 18 Figure 14: NDWI - MODIS, Fortnightly agricultural situation from June 2017 19 Figure 15: NDWI - MODIS, Time composite of agricultural situation from June 2017 and 2013 20 Figure 16: NDWI - MODIS, Monthly agricultural situation from June 2017, 2016 and 2015 21 Figure 17: NDWI deviation, Month of June 2017 w.r.t. 2013 22 Figure 17: Mandal wise drought assessment based on ISMS criterion 23
ANNEXURE
S. No Description Page. No
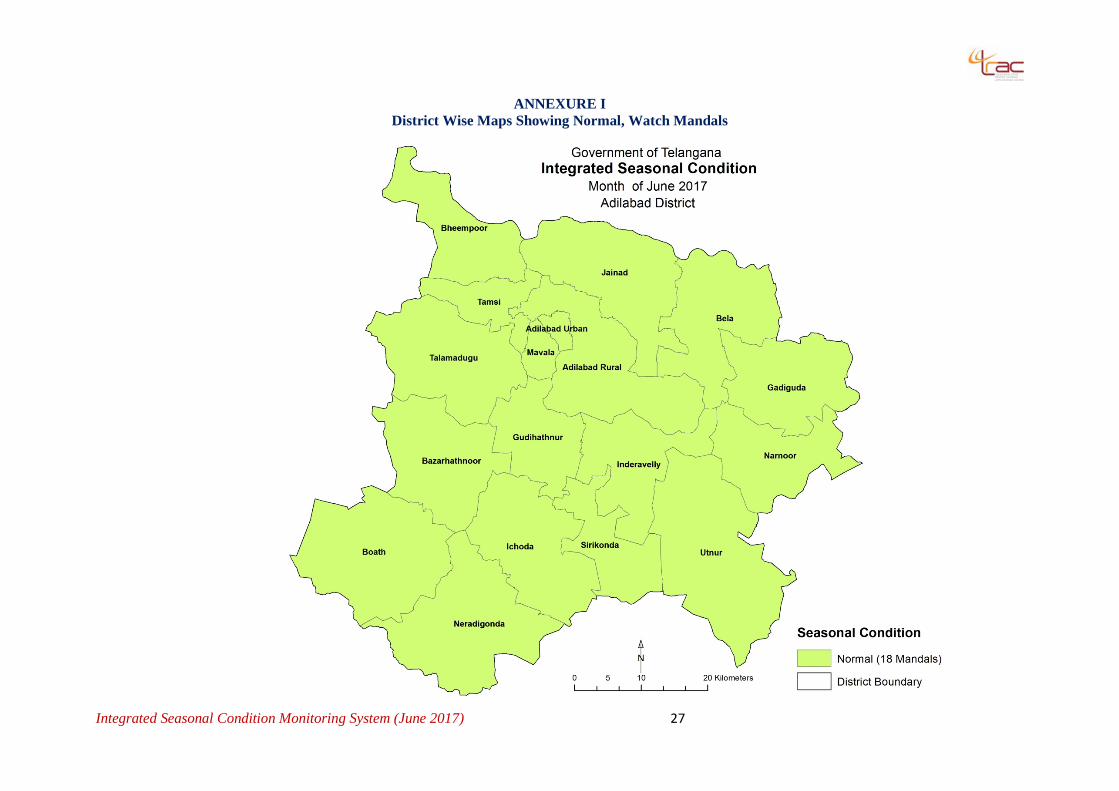
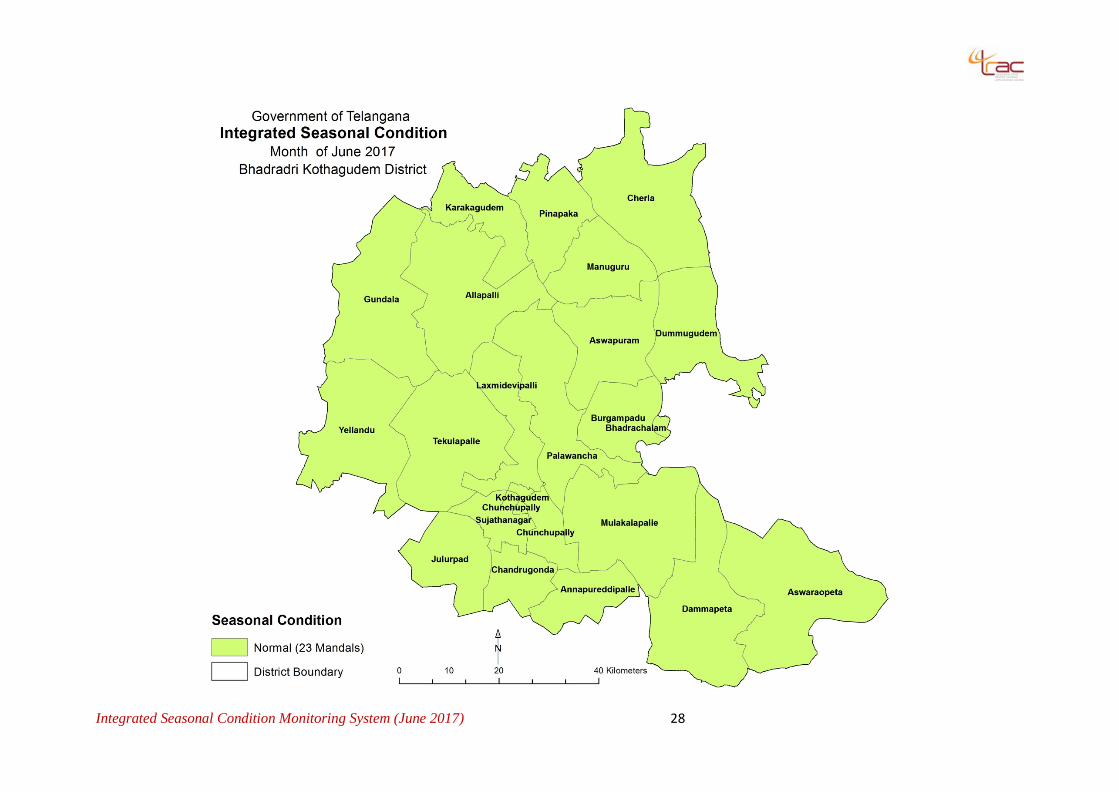
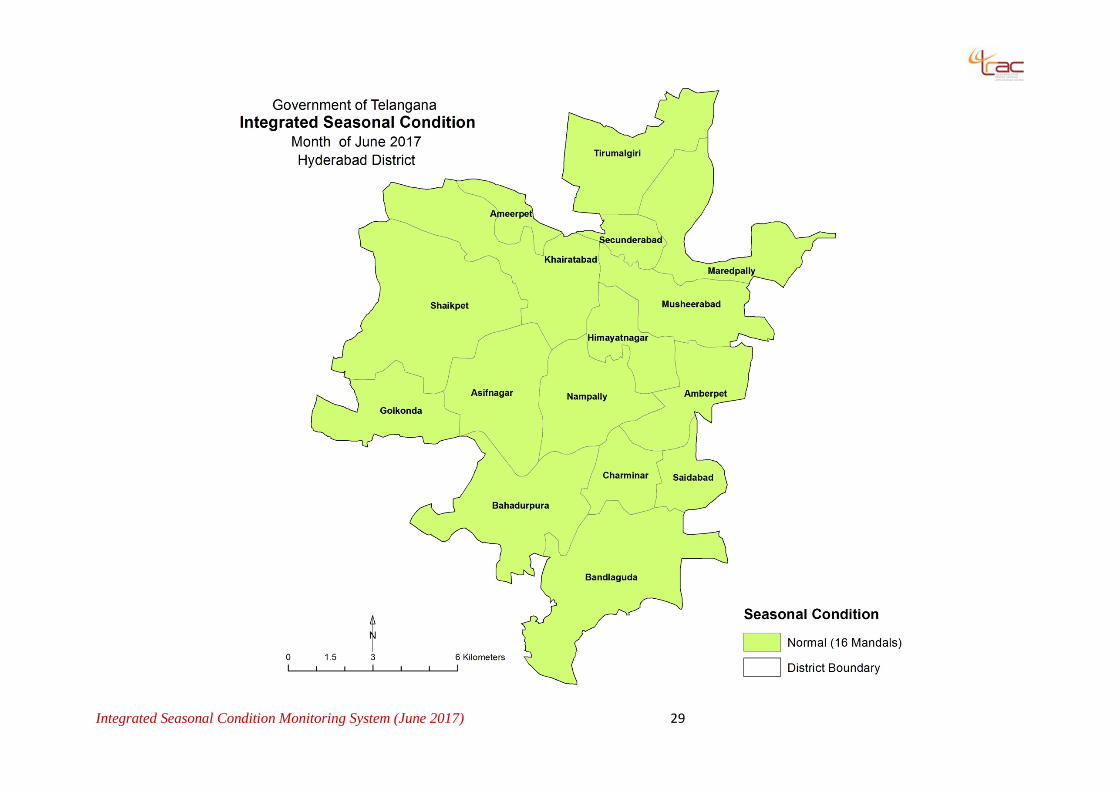
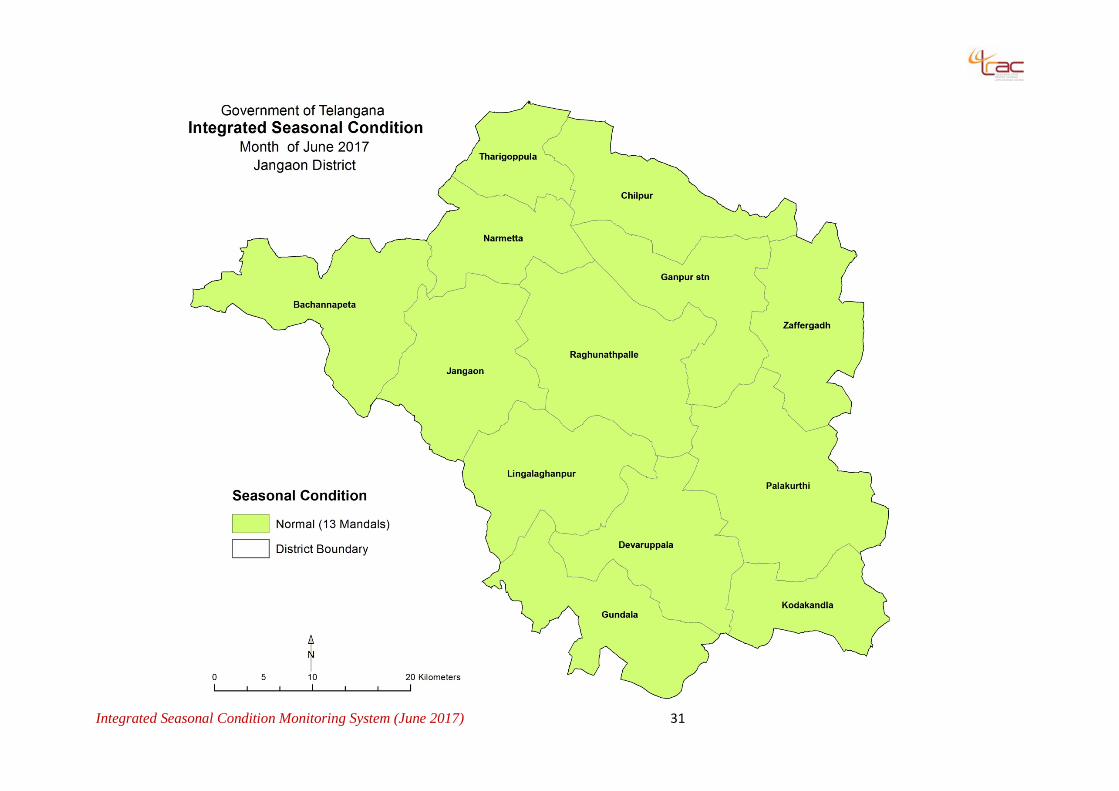
I District wise maps showing Normal, Watch Mandals 27
Integrated Seasonal Condition Monitoring System (June 2017) 1
1. Background and Rationale
Drought is a complex natural hazard. It is defined as any deficiency of water to satisfy the
normal need to agriculture, livestock, industry, or human population. Drought assessment and
monitoring is essential for the agricultural sector to take appropriate mitigation measures. Drought
indices derived from satellite data play a major role in assessing the health and condition of the
crops/vegetation.
National Agricultural Drought Assessment and Monitoring System (NADAMS) project of
National Remote Sensing Centre (NRSC), Indian Space Research Organization (ISRO) established a
remote sensing based drought assessment protocol utilizing the Normalized Difference Vegetation
Index (NDVI) and Normalized Difference Water Index (NDWI). The Government of India has
established Mahalanobis National Crop Forecast Centre (MNCFC) under Department of Agriculture
and Cooperation, New Delhi for carrying out drought assessment at national level.
The Department of Agriculture and Cooperation, Government of India published a drought
manual in 2009 which suggested parameters like rainfall deficiency, area under sowing, NDVI,
Moisture Adequacy Index (MAI) and some other indictors to declare drought. The Government of
Telangana (GoTS) uses the following criterion for declaration of drought.
1. Mandatory Condition - Rainfall deficiency of 25% (>1000 mm rainfall) and 20% (999 to 750
mm rainfall) and 15% (<750 mm rainfall)
2. Minimum of two condition to be fulfilled out of following three
a) Reduction in cropped area of 50% and above under all principal crops.
b) Reduction in yield (50% and above), in case of high input oriented crops viz., ground nut,
bengal gram, hybrid sunflower, 40% reduction of yield or above.
c) Dry spells and its impact on crop damages.
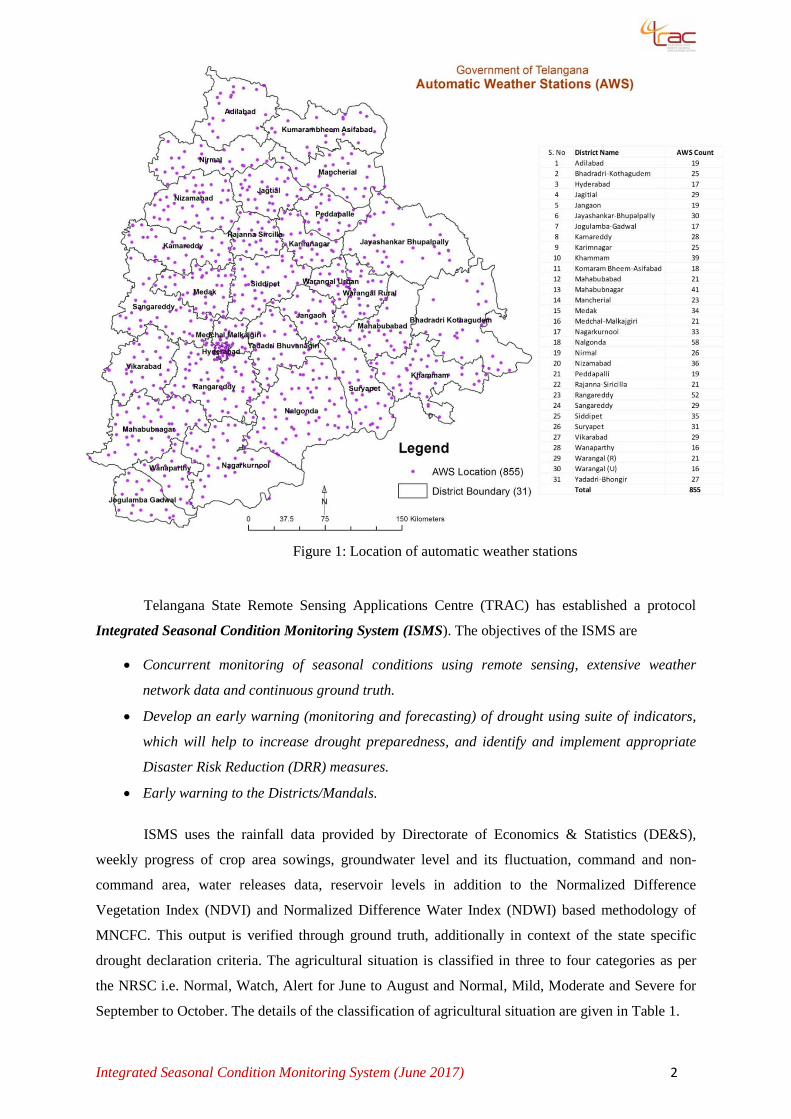
An extensive weather observation network of 855 Automatic Weather Stations (AWS), is
established in Telangana. Telangana State Development Planning Society (TSDPS) monitor the data
and maintains the networks. Figure 1 showing the location of AWS stations in Telangana.
Integrated Seasonal Condition Monitoring System (June 2017) 2
Telangana State Remote Sensing Applications Centre (TRAC) has established a protocol
Integrated Seasonal Condition Monitoring System (ISMS). The objectives of the ISMS are
• Concurrent monitoring of seasonal conditions using remote sensing, extensive weather
network data and continuous ground truth.
• Develop an early warning (monitoring and forecasting) of drought using suite of indicators,
which will help to increase drought preparedness, and identify and implement appropriate
Disaster Risk Reduction (DRR) measures.
• Early warning to the Districts/Mandals.
ISMS uses the rainfall data provided by Directorate of Economics & Statistics (DE&S),
weekly progress of crop area sowings, groundwater level and its fluctuation, command and non-
command area, water releases data, reservoir levels in addition to the Normalized Difference
Vegetation Index (NDVI) and Normalized Difference Water Index (NDWI) based methodology of
MNCFC. This output is verified through ground truth, additionally in context of the state specific
drought declaration criteria. The agricultural situation is classified in three to four categories as per
the NRSC i.e. Normal, Watch, Alert for June to August and Normal, Mild, Moderate and Severe for
September to October. The details of the classification of agricultural situation are given in Table 1.
Figure 1: Location of automatic weather stations
Integrated Seasonal Condition Monitoring System (June 2017) 3
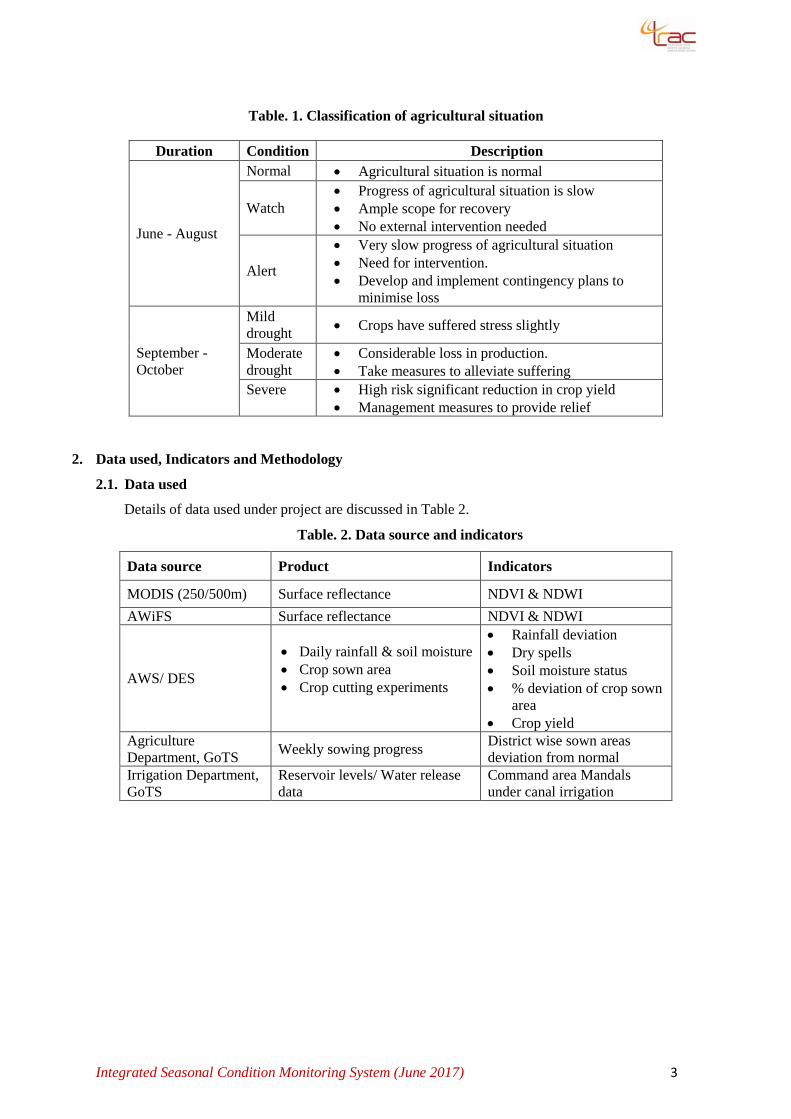
Table. 1. Classification of agricultural situation
Duration Condition Description
June - August
Normal • Agricultural situation is normal
Watch • Progress of agricultural situation is slow • Ample scope for recovery • No external intervention needed
Alert
• Very slow progress of agricultural situation • Need for intervention. • Develop and implement contingency plans to
minimise loss
September - October
Mild drought • Crops have suffered stress slightly
Moderate drought
• Considerable loss in production. • Take measures to alleviate suffering
Severe
• High risk significant reduction in crop yield • Management measures to provide relief
2. Data used, Indicators and Methodology
2.1. Data used
Details of data used under project are discussed in Table 2.
Table. 2. Data source and indicators
Data source Product Indicators
MODIS (250/500m) Surface reflectance NDVI & NDWI AWiFS Surface reflectance NDVI & NDWI
AWS/ DES
• Daily rainfall & soil moisture • Crop sown area • Crop cutting experiments
• Rainfall deviation • Dry spells • Soil moisture status • % deviation of crop sown
area • Crop yield
Agriculture Department, GoTS Weekly sowing progress District wise sown areas
deviation from normal Irrigation Department, GoTS
Reservoir levels/ Water release data
Command area Mandals under canal irrigation
Integrated Seasonal Condition Monitoring System (June 2017) 4
2.2. Indicators and Index
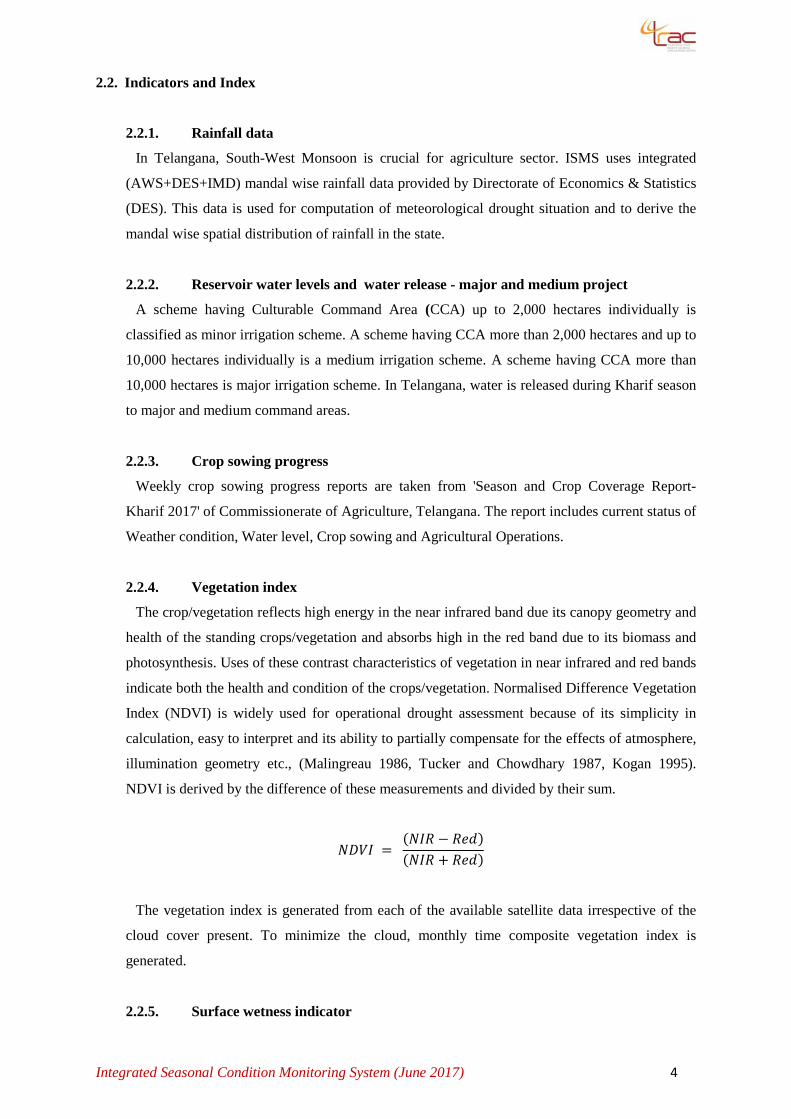
2.2.1. Rainfall data
In Telangana, South-West Monsoon is crucial for agriculture sector. ISMS uses integrated
(AWS+DES+IMD) mandal wise rainfall data provided by Directorate of Economics & Statistics
(DES). This data is used for computation of meteorological drought situation and to derive the
mandal wise spatial distribution of rainfall in the state.
2.2.2. Reservoir water levels and water release - major and medium project
A scheme having Culturable Command Area (CCA) up to 2,000 hectares individually is
classified as minor irrigation scheme. A scheme having CCA more than 2,000 hectares and up to
10,000 hectares individually is a medium irrigation scheme. A scheme having CCA more than
10,000 hectares is major irrigation scheme. In Telangana, water is released during Kharif season
to major and medium command areas.
2.2.3. Crop sowing progress
Weekly crop sowing progress reports are taken from 'Season and Crop Coverage Report-
Kharif 2017' of Commissionerate of Agriculture, Telangana. The report includes current status of
Weather condition, Water level, Crop sowing and Agricultural Operations.
2.2.4. Vegetation index
The crop/vegetation reflects high energy in the near infrared band due its canopy geometry and
health of the standing crops/vegetation and absorbs high in the red band due to its biomass and
photosynthesis. Uses of these contrast characteristics of vegetation in near infrared and red bands
indicate both the health and condition of the crops/vegetation. Normalised Difference Vegetation
Index (NDVI) is widely used for operational drought assessment because of its simplicity in
calculation, easy to interpret and its ability to partially compensate for the effects of atmosphere,
illumination geometry etc., (Malingreau 1986, Tucker and Chowdhary 1987, Kogan 1995).
NDVI is derived by the difference of these measurements and divided by their sum.
𝑁𝑁𝑁𝑁𝑁𝑁𝑁𝑁 = (𝑁𝑁𝑁𝑁𝑁𝑁 − 𝑁𝑁𝑅𝑅𝑅𝑅)(𝑁𝑁𝑁𝑁𝑁𝑁 + 𝑁𝑁𝑅𝑅𝑅𝑅)
The vegetation index is generated from each of the available satellite data irrespective of the
cloud cover present. To minimize the cloud, monthly time composite vegetation index is
generated.
2.2.5. Surface wetness indicator
Integrated Seasonal Condition Monitoring System (June 2017) 5
Shortwave Infrared (SWIR) band is sensitive to moisture available in soil as well as in crop
canopy. In the beginning of the cropping season, soil background is dominant hence SWIR is
sensitive to soil moisture in the top 1-2 cm. As the crop progresses, SWIR becomes sensitive to
leaf moisture content. SWIR band provides only surface wetness information. When the crop is
grown-up, SWIR response is only from canopy and not from the underlying soil. NDWI using
SWIR can complement NDVI for drought assessment particularly in the beginning of the
cropping season. NDWI is derived as under;
𝑁𝑁𝑁𝑁𝑁𝑁𝑁𝑁 =(𝑁𝑁𝑁𝑁𝑁𝑁 − 𝑆𝑆𝑁𝑁𝑁𝑁𝑁𝑁)(𝑁𝑁𝑁𝑁𝑁𝑁 + 𝑆𝑆𝑁𝑁𝑁𝑁𝑁𝑁)
Higher values of NDWI signify more surface wetness. The wetness index is generated from
each of the available satellite data irrespective of the cloud cover present. To minimize the cloud,
monthly time composite wetness index is generated.
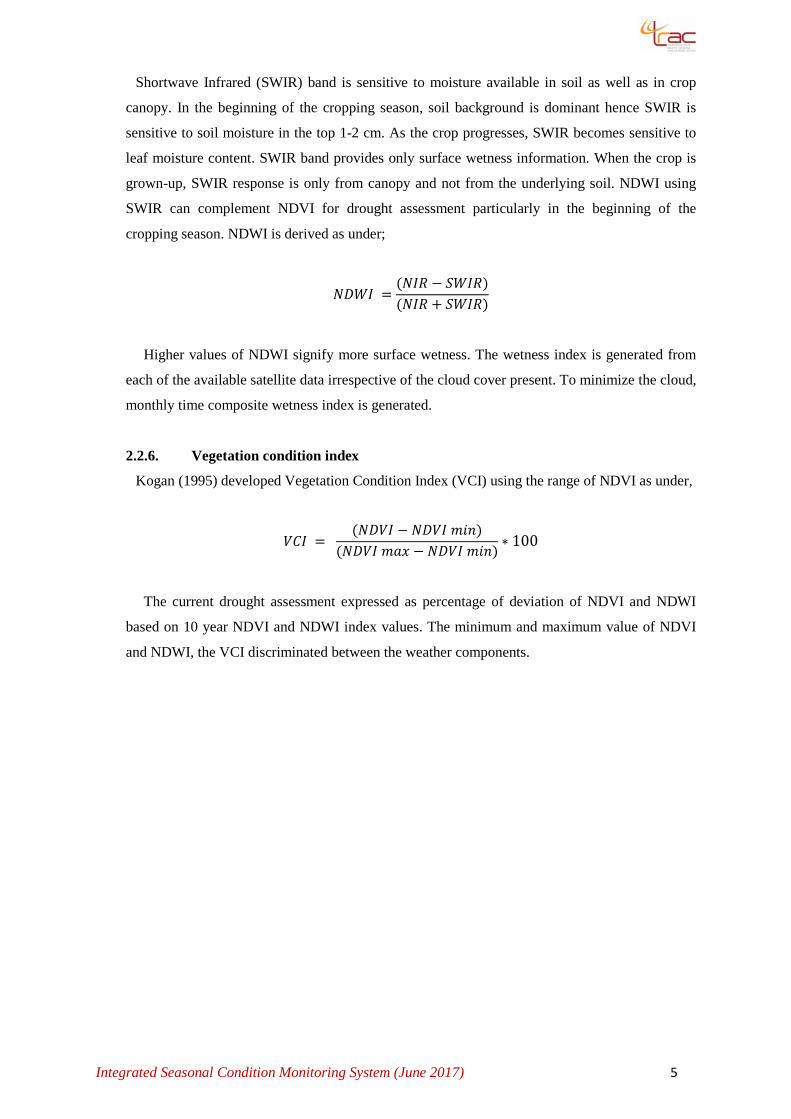
2.2.6. Vegetation condition index
Kogan (1995) developed Vegetation Condition Index (VCI) using the range of NDVI as under,
𝑁𝑁𝑉𝑉𝑁𝑁 = (𝑁𝑁𝑁𝑁𝑁𝑁𝑁𝑁 − 𝑁𝑁𝑁𝑁𝑁𝑁𝑁𝑁 𝑚𝑚𝑚𝑚𝑚𝑚)
(𝑁𝑁𝑁𝑁𝑁𝑁𝑁𝑁 𝑚𝑚𝑚𝑚𝑚𝑚 − 𝑁𝑁𝑁𝑁𝑁𝑁𝑁𝑁 𝑚𝑚𝑚𝑚𝑚𝑚)∗ 100
The current drought assessment expressed as percentage of deviation of NDVI and NDWI
based on 10 year NDVI and NDWI index values. The minimum and maximum value of NDVI
and NDWI, the VCI discriminated between the weather components.
Integrated Seasonal Condition Monitoring System (June 2017) 6
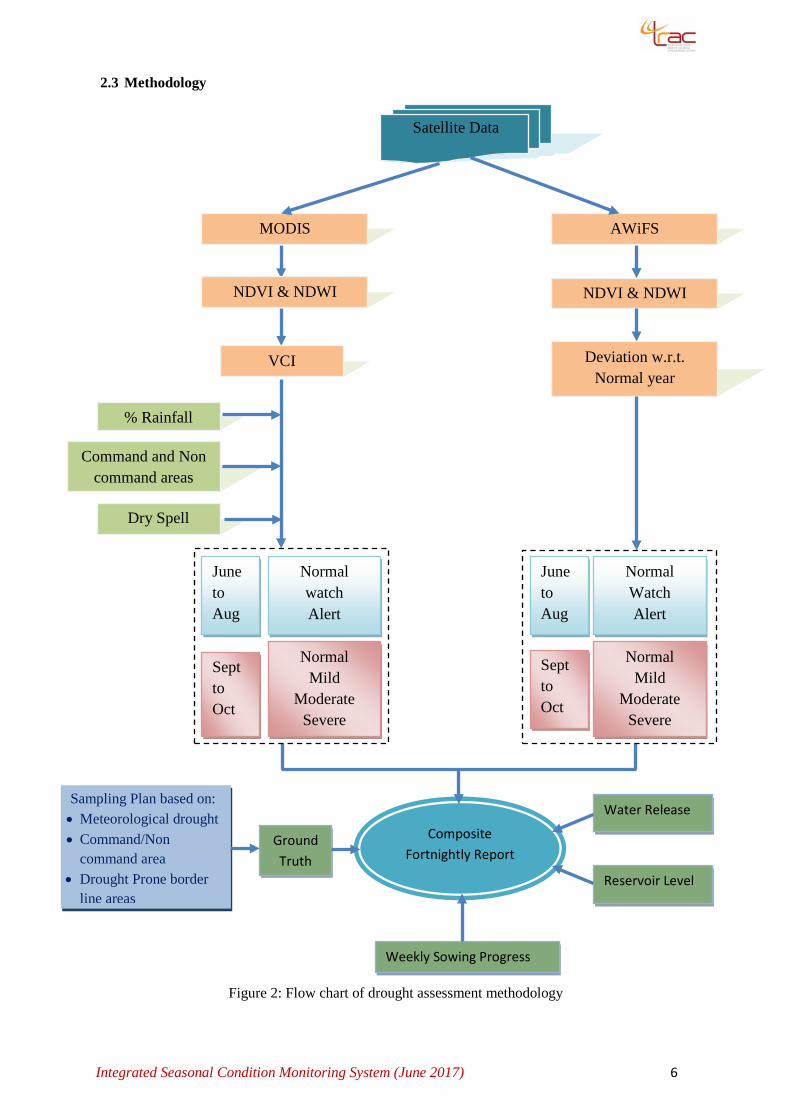
2.3 Methodology
Figure 2: Flow chart of drought assessment methodology
NDVI & NDWI NDVI & NDWI
Satellite Data
MODIS AWiFS
VCI Deviation w.r.t. Normal year
% Rainfall
Command and Non command areas
Dry Spell
June to Aug
Sept to Oct
June to Aug
Sept to Oct
Normal watch Alert
Normal Mild
Moderate Severe
Normal Watch Alert
Normal Mild
Moderate Severe
Composite Fortnightly Report
Ground Truth
Weekly Sowing Progress
Reservoir Level
Water Release Sampling Plan based on: • Meteorological drought • Command/Non
command area • Drought Prone border
line areas
Integrated Seasonal Condition Monitoring System (June 2017) 7
The methodology to assess and monitor the agricultural conditions and situation in the state at
district and Mandal level uses IRS Resourcesat-2 AWiFS data. Indian Remote Sensing satellite
(IRS) Resourcesat-2 having Advanced Wide Imaging Field Sensor (AWiFS) payload collects data
in two spectral bands 0.62-0.68 µm (red) and 0.77-0.86 µm (near infrared) with spatial resolution
of 56 m and ground swath of 740 km with a revisit period of 5 days. Along with this MODIS
250/500 m satellite data provide spectra, radiometric and spatial resolutions products for better
monitoring of the agriculture. The combination of AWiFS and MODIS is useful to increase the
frequency of images.
The different activities carried out through ISMS commence with acquisition of MODIS (250
m) and AWiFS (56 m) satellite data. The satellite data being processed and NDVI and NDWI
indices are developed. Based on these indices deviation with respect to normal year (2013) is
calculated and Mandal wise statistics are derived. The agricultural situation is assessed
incorporating rainfall deviation, command and non command areas, dry spell, drought prone
border line areas, crop sown area progress and ground truth along with satellite derived indices.
The flow chart of methodology is shown in Figure 2.
3. Present status up to Month of June 2017
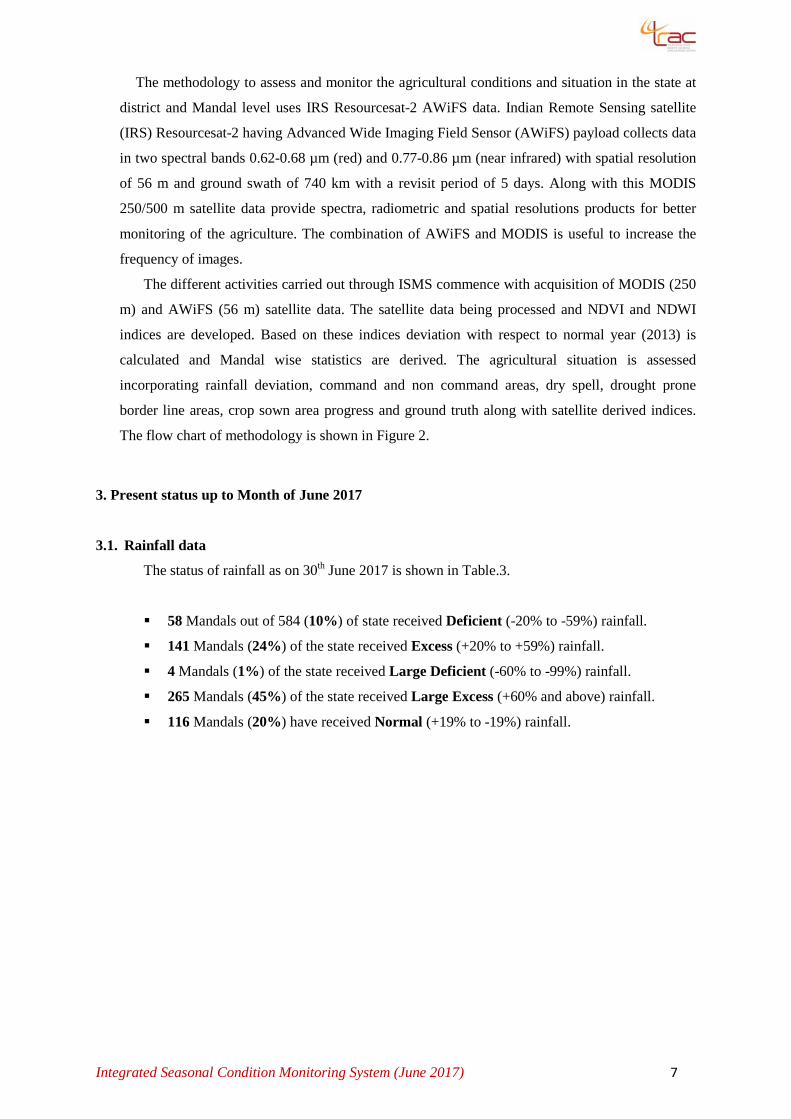
3.1. Rainfall data
The status of rainfall as on 30th June 2017 is shown in Table.3.
58 Mandals out of 584 (10%) of state received Deficient (-20% to -59%) rainfall.
141 Mandals (24%) of the state received Excess (+20% to +59%) rainfall.
4 Mandals (1%) of the state received Large Deficient (-60% to -99%) rainfall.
265 Mandals (45%) of the state received Large Excess (+60% and above) rainfall.
116 Mandals (20%) have received Normal (+19% to -19%) rainfall.

Integrated Seasonal Condition Monitoring System (June 2017) 8
Table. 3. Rainfall status as on 30th June 2017
Sl. No. District Name No. of
Mandals Deficient Excess Low Deficient
Large Excess Normal
1 Adilabad 18 02 07 -- 04 05
2 Bhadradri-Kothagudem 23 -- 02 -- 21 --
3 Hyderabad 16 -- 01 -- 15 -- 4 Jagtial 18 03 01 -- 01 13 5 Jangaon 13 02 01 -- 07 03
6 Jayashankar-Bhupalpally 20 03 10 -- 05 02
7 Jogulamba-Gadwal 12 -- 01 -- 10 01 8 Kamareddy 22 01 13 -- 05 03 9 Karimnagar 16 01 08 -- 06 01 10 Khammam 21 -- 02 -- 19 --
11 Komaram Bheem-Asifabad 15 08 02 02 01 02
12 Mahabubabad 16 -- 05 -- 07 04 13 Mahabubnagar 26 03 01 -- 17 05 14 Mancherial 18 10 02 02 04 15 Medak 20 05 03 02 06 04 16 Medchal-Malkajgiri 14 -- 03 -- 10 01 17 Nagarkurnool 20 02 03 -- 10 05 18 Nalgonda 31 02 10 -- 13 06 19 Nirmal 19 01 05 -- -- 13 20 Nizamabad 27 07 09 -- -- 11 21 Peddapalli 14 02 03 -- 04 05 22 Rajanna-Siricilla 13 01 05 -- 03 04 23 Rangareddy 27 -- 03 -- 22 02 24 Sangareddy 26 03 05 -- 10 08 25 Siddipet 22 -- 04 -- 18 -- 26 Suryapet 23 01 09 -- 11 02 27 Vikarabad 18 - 07 -- 08 03 28 Wanaparthy 14 -- 05 -- 07 02 29 Warangal Rural 15 -- 05 -- 08 02 30 Warangal Urban 11 01 02 -- 06 02 31 Yadadri-Bhongir 16 -- 04 -- 09 03
Total 584 58 141 04 265 116 SOURCE: AWS, DE&S and IMD, HYDERABAD
Integrated Seasonal Condition Monitoring System (June 2017) 9
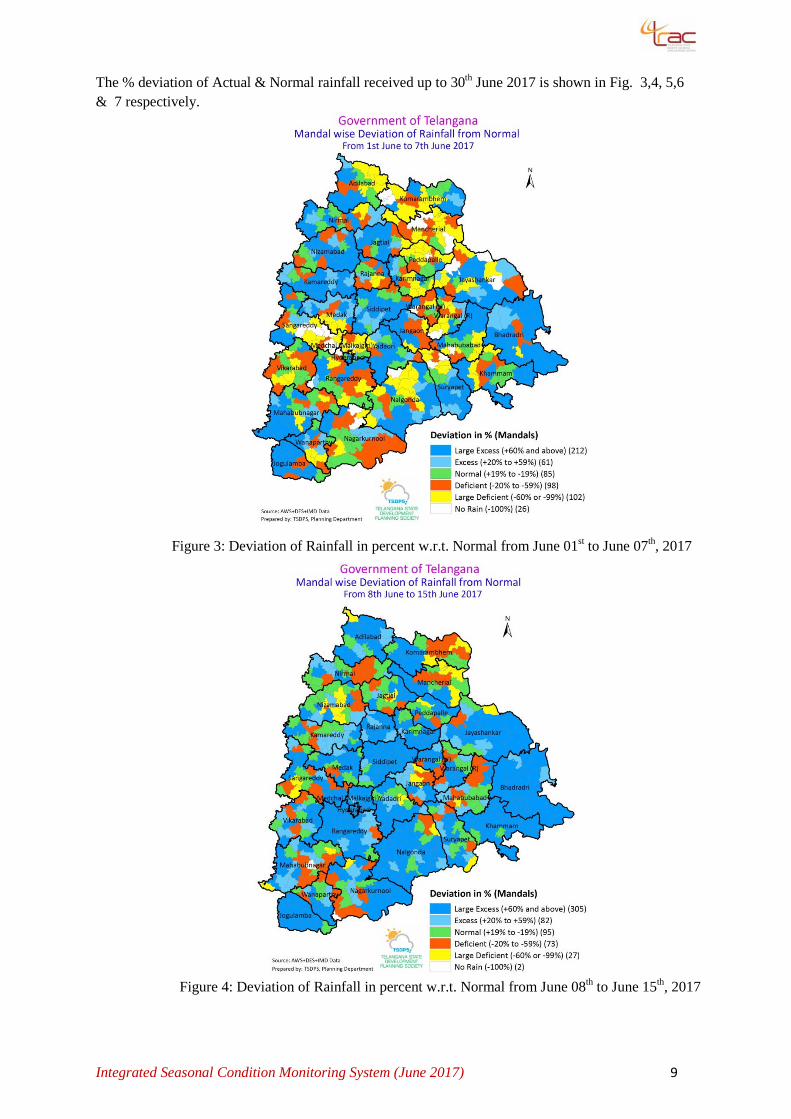
The % deviation of Actual & Normal rainfall received up to 30th June 2017 is shown in Fig. 3,4, 5,6 & 7 respectively.
Figure 3: Deviation of Rainfall in percent w.r.t. Normal from June 01st to June 07th, 2017
Figure 4: Deviation of Rainfall in percent w.r.t. Normal from June 08th to June 15th, 2017

Integrated Seasonal Condition Monitoring System (June 2017) 10
Figure 5: Deviation of rainfall in percent w.r.t. normal from June 16th to June 22nd, 2017
Figure 6: Deviation of rainfall in percent w.r.t. normal from June 23rd to June 30th, 2017
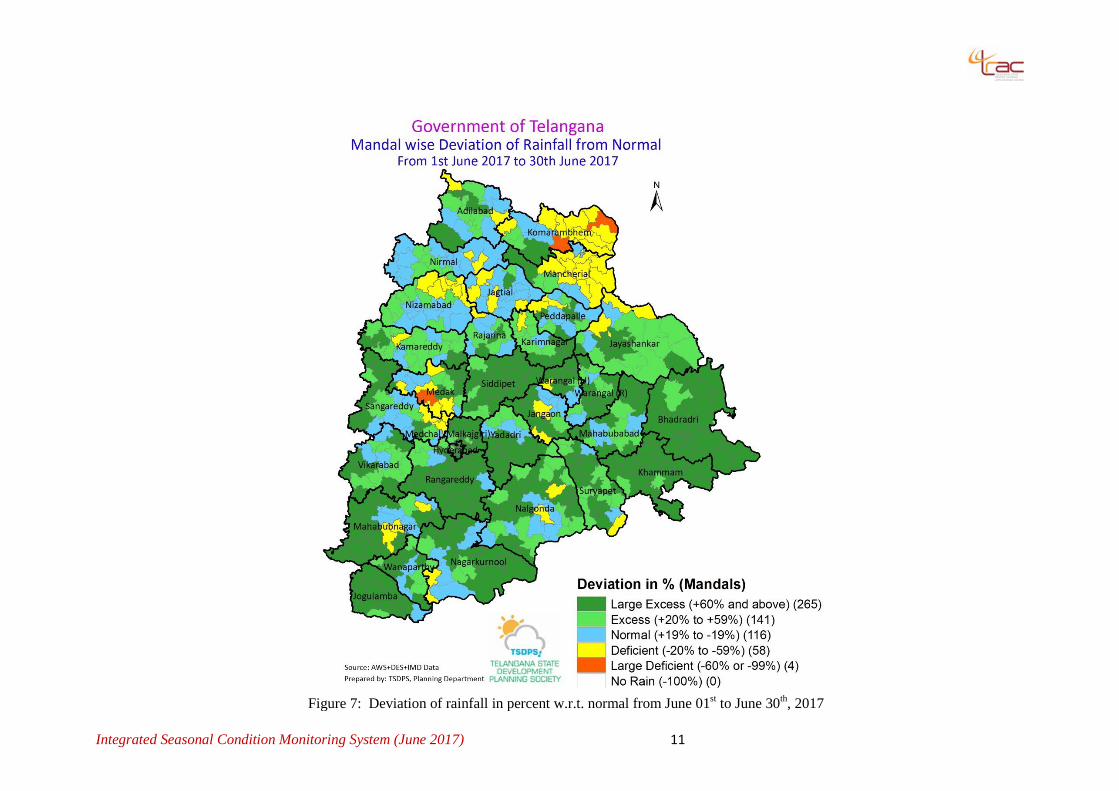
Integrated Seasonal Condition Monitoring System (June 2017) 11
Figure 7: Deviation of rainfall in percent w.r.t. normal from June 01st to June 30th, 2017
Integrated Seasonal Condition Monitoring System (June 2017) 12
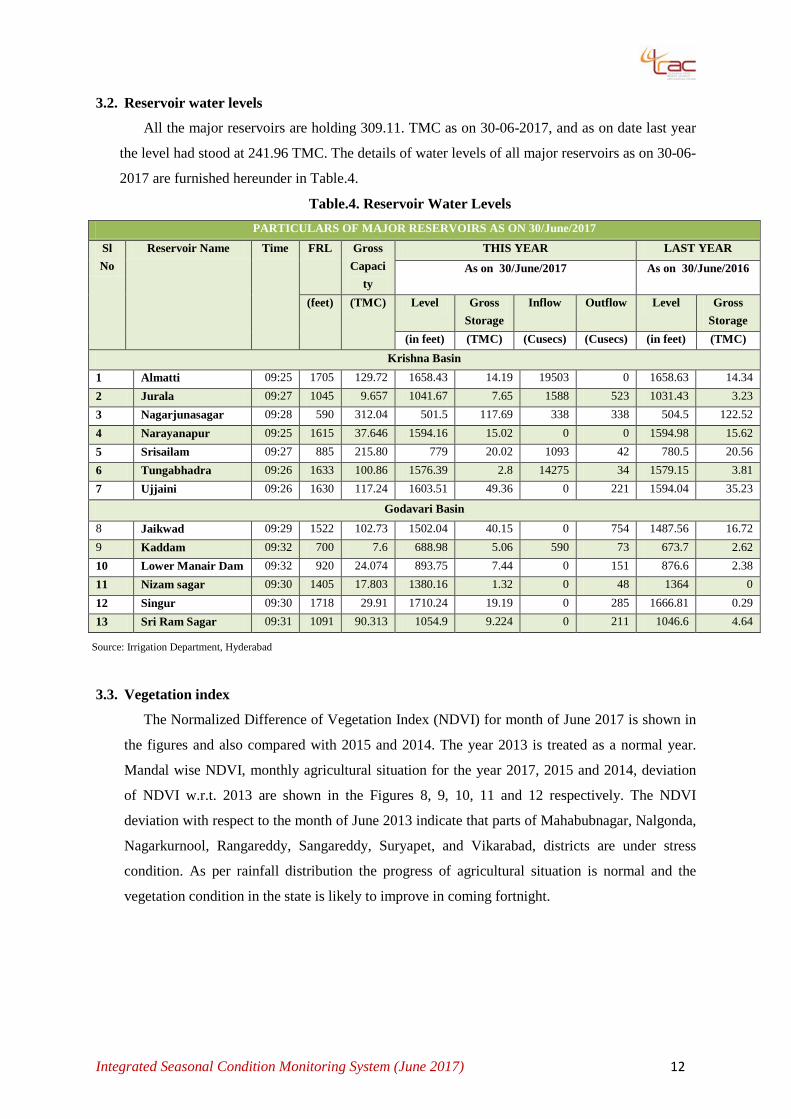
3.2. Reservoir water levels
All the major reservoirs are holding 309.11. TMC as on 30-06-2017, and as on date last year
the level had stood at 241.96 TMC. The details of water levels of all major reservoirs as on 30-06-
2017 are furnished hereunder in Table.4.
Table.4. Reservoir Water Levels PARTICULARS OF MAJOR RESERVOIRS AS ON 30/June/2017
Sl No
Reservoir Name Time FRL Gross Capaci
ty
THIS YEAR LAST YEAR
As on 30/June/2017 As on 30/June/2016
(feet) (TMC) Level Gross Storage
Inflow Outflow Level Gross Storage
(in feet) (TMC) (Cusecs) (Cusecs) (in feet) (TMC) Krishna Basin
1 Almatti 09:25 1705 129.72 1658.43 14.19 19503 0 1658.63 14.34 2 Jurala 09:27 1045 9.657 1041.67 7.65 1588 523 1031.43 3.23 3 Nagarjunasagar 09:28 590 312.04 501.5 117.69 338 338 504.5 122.52 4 Narayanapur 09:25 1615 37.646 1594.16 15.02 0 0 1594.98 15.62 5 Srisailam 09:27 885 215.80 779 20.02 1093 42 780.5 20.56 6 Tungabhadra 09:26 1633 100.86 1576.39 2.8 14275 34 1579.15 3.81 7 Ujjaini 09:26 1630 117.24 1603.51 49.36 0 221 1594.04 35.23
Godavari Basin 8 Jaikwad 09:29 1522 102.73 1502.04 40.15 0 754 1487.56 16.72 9 Kaddam 09:32 700 7.6 688.98 5.06 590 73 673.7 2.62 10 Lower Manair Dam 09:32 920 24.074 893.75 7.44 0 151 876.6 2.38 11 Nizam sagar 09:30 1405 17.803 1380.16 1.32 0 48 1364 0 12 Singur 09:30 1718 29.91 1710.24 19.19 0 285 1666.81 0.29 13 Sri Ram Sagar 09:31 1091 90.313 1054.9 9.224 0 211 1046.6 4.64
Source: Irrigation Department, Hyderabad
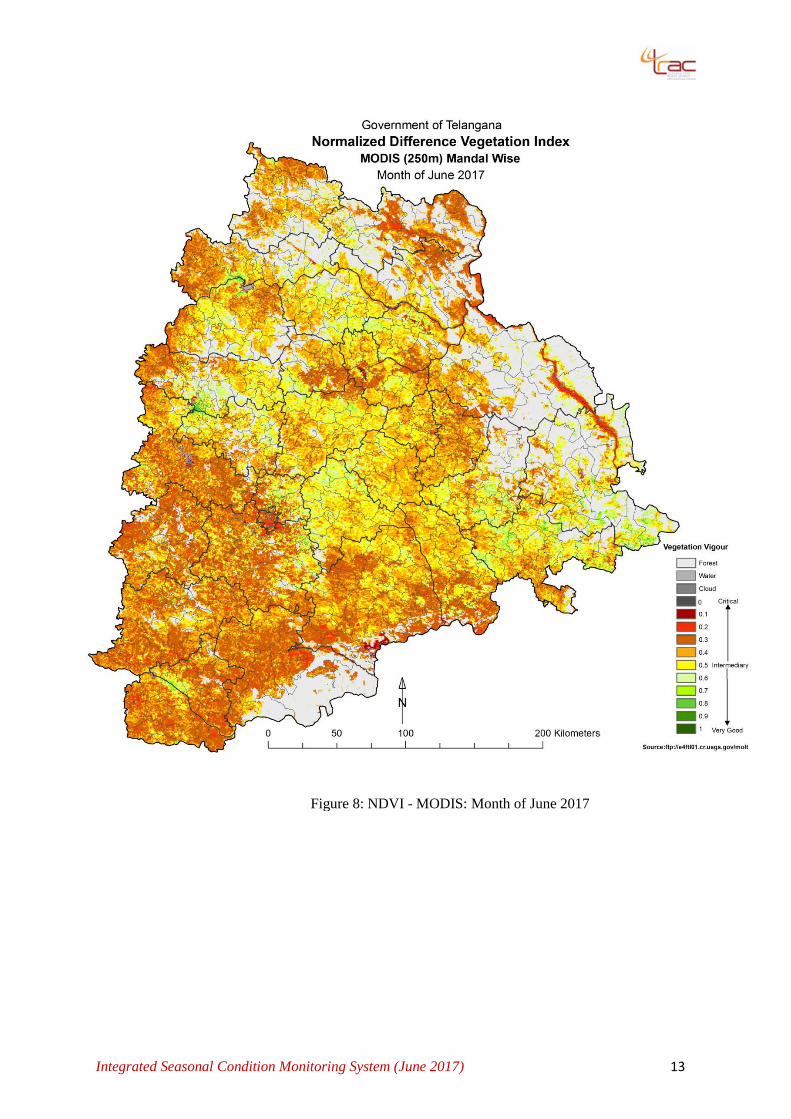
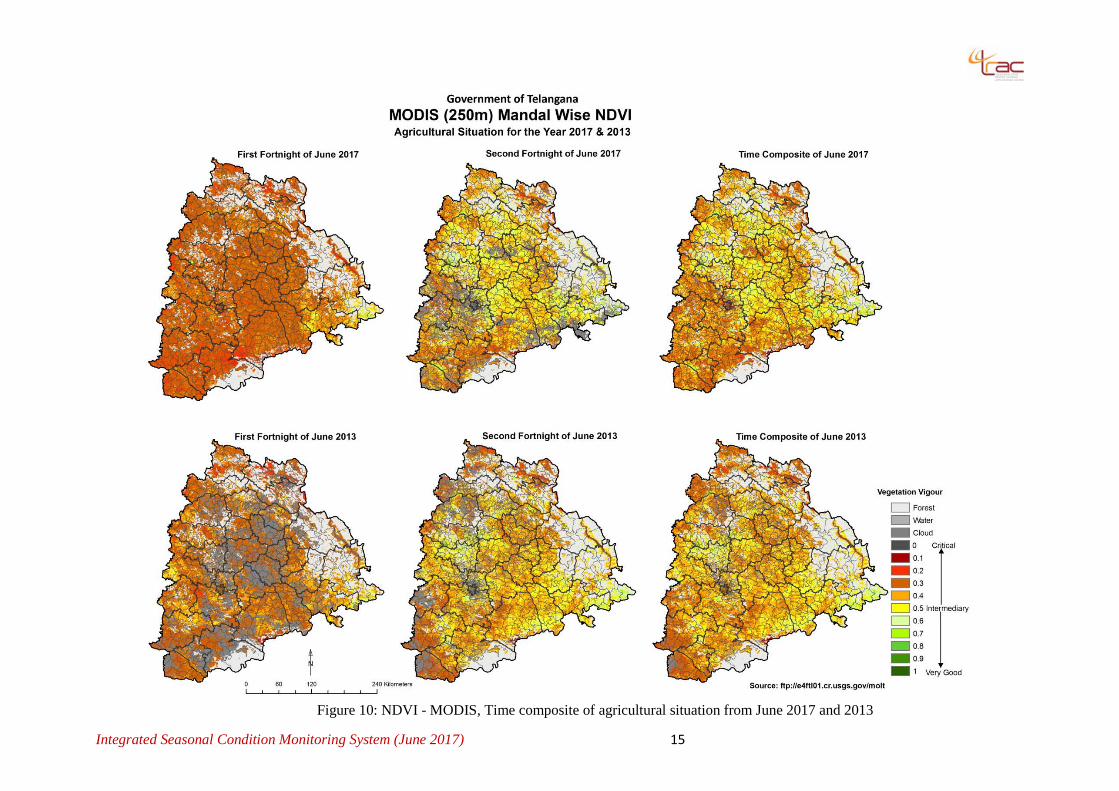
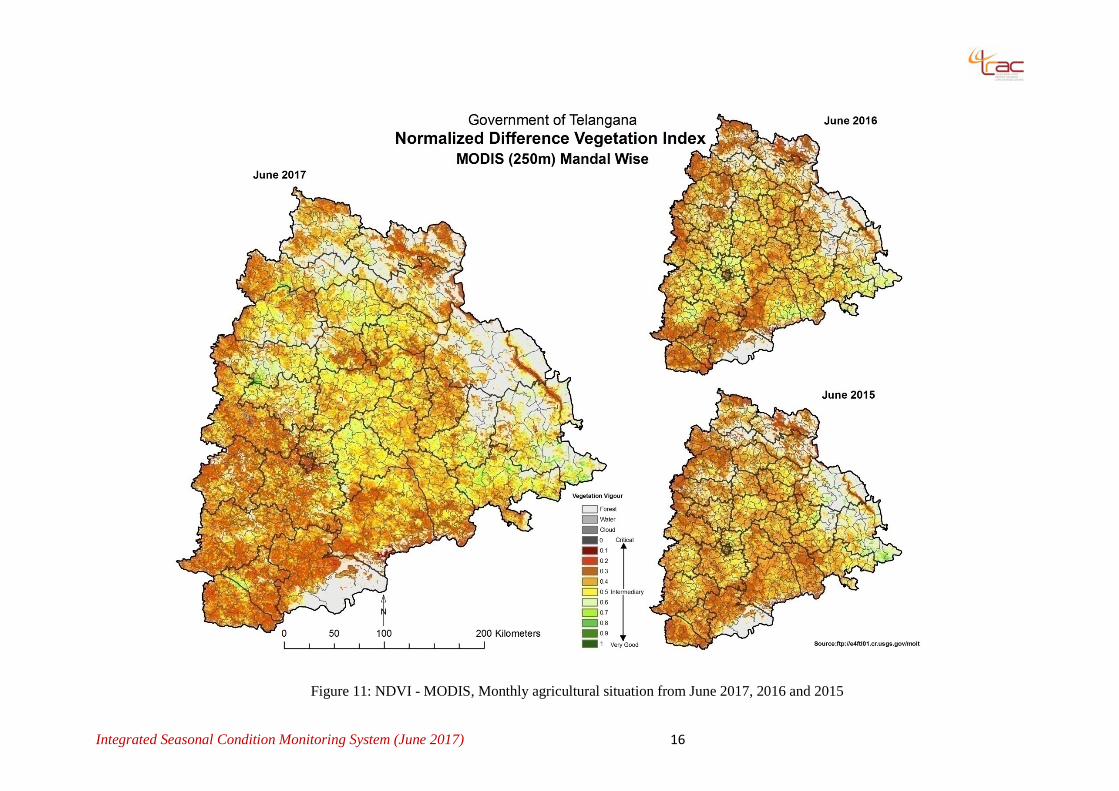
3.3. Vegetation index
The Normalized Difference of Vegetation Index (NDVI) for month of June 2017 is shown in
the figures and also compared with 2015 and 2014. The year 2013 is treated as a normal year.
Mandal wise NDVI, monthly agricultural situation for the year 2017, 2015 and 2014, deviation
of NDVI w.r.t. 2013 are shown in the Figures 8, 9, 10, 11 and 12 respectively. The NDVI
deviation with respect to the month of June 2013 indicate that parts of Mahabubnagar, Nalgonda,
Nagarkurnool, Rangareddy, Sangareddy, Suryapet, and Vikarabad, districts are under stress
condition. As per rainfall distribution the progress of agricultural situation is normal and the
vegetation condition in the state is likely to improve in coming fortnight.
Integrated Seasonal Condition Monitoring System (June 2017) 13
Figure 8: NDVI - MODIS: Month of June 2017

Integrated Seasonal Condition Monitoring System (June 2017) 14
Figure 9: NDVI - MODIS, Fortnightly agricultural situation from June 2017
Integrated Seasonal Condition Monitoring System (June 2017) 15
Figure 10: NDVI - MODIS, Time composite of agricultural situation from June 2017 and 2013
Integrated Seasonal Condition Monitoring System (June 2017) 16
Figure 11: NDVI - MODIS, Monthly agricultural situation from June 2017, 2016 and 2015

Integrated Seasonal Condition Monitoring System (June 2017) 17
Figure 12: NDVI deviation (MODIS - 250m), Month of June 2017 w.r.t. 2013

Integrated Seasonal Condition Monitoring System (June 2017) 18
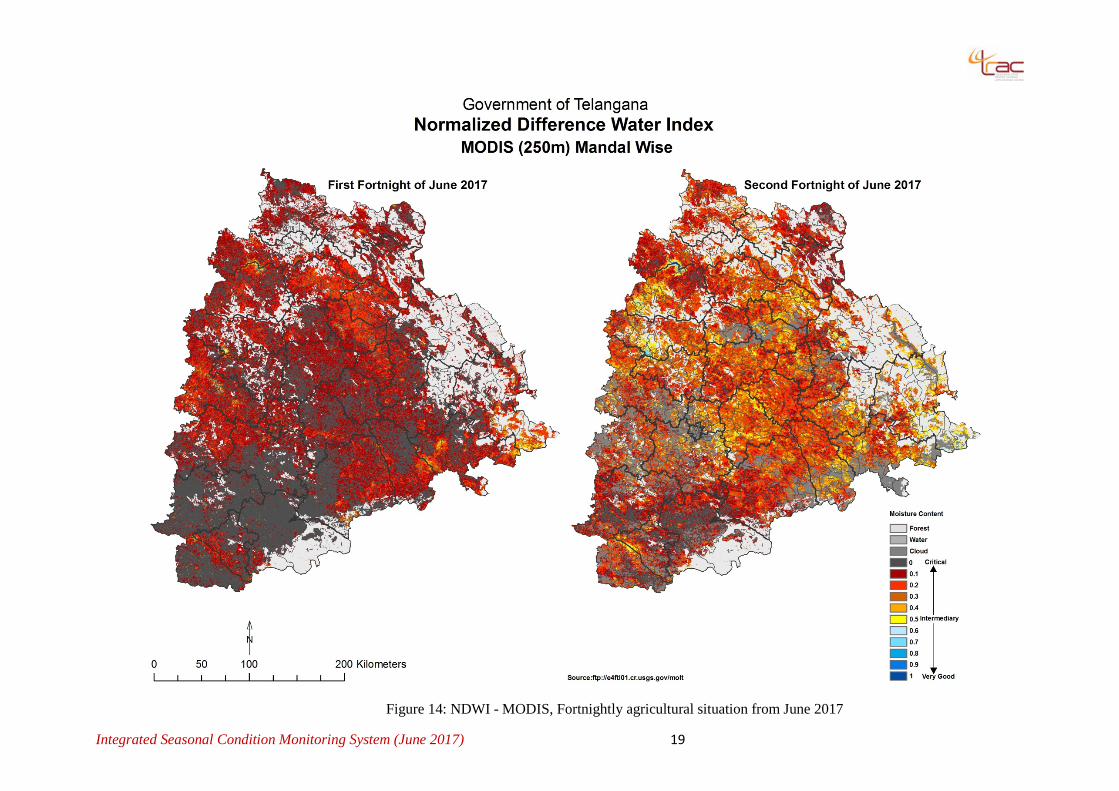
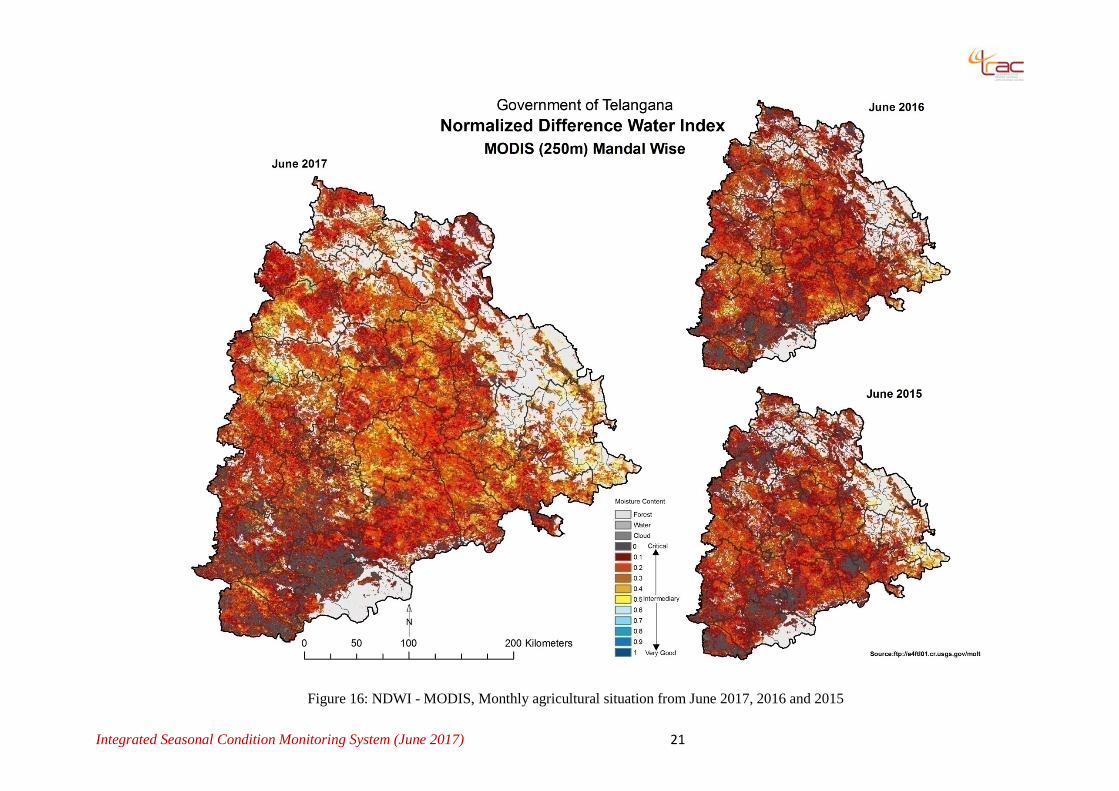
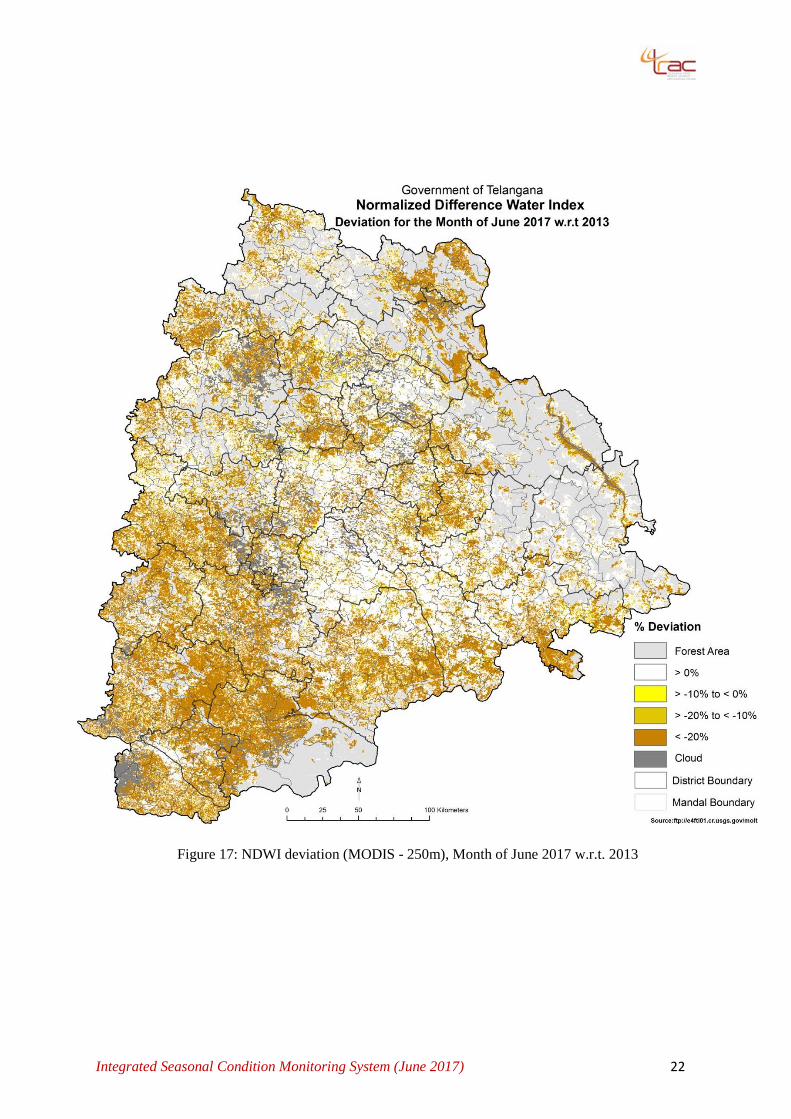
3.4. Surface wetness indicator
The map indicates status of moisture availability in soil as well as in crop canopy for month
of June 2017. The year 2013 is treated as a normal year. Mandal wise Normalized Difference
Water Index (NDWI) situation from the year 2017, 2015 & 2014, monthly agricultural situation
deviation of NDWI w.r.t. 2013 are shown in the Figures 13, 14, 15, 16 and 17 respectively.
NDWI deviations with respect to month of June 2013 indicate that parts of Mahabubnagar,
Nalgonda, Nagarkurnool, Nirmal, SangaReddy, and Vikarabad districts are under mild stress
condition. As per rainfall distribution the progress of agricultural situation is normal and the soil
moisture condition in the state is likely to improve in next fortnight.
Figure 13: NDWI - MODIS: Month of June 2017
Integrated Seasonal Condition Monitoring System (June 2017) 19
Figure 14: NDWI - MODIS, Fortnightly agricultural situation from June 2017

Integrated Seasonal Condition Monitoring System (June 2017) 20
Figure 15: NDWI - MODIS, Time composite of agricultural situation from June 2017 and 2013
Integrated Seasonal Condition Monitoring System (June 2017) 21
Figure 16: NDWI - MODIS, Monthly agricultural situation from June 2017, 2016 and 2015
Integrated Seasonal Condition Monitoring System (June 2017) 22
Figure 17: NDWI deviation (MODIS - 250m), Month of June 2017 w.r.t. 2013
Integrated Seasonal Condition Monitoring System (June 2017) 23
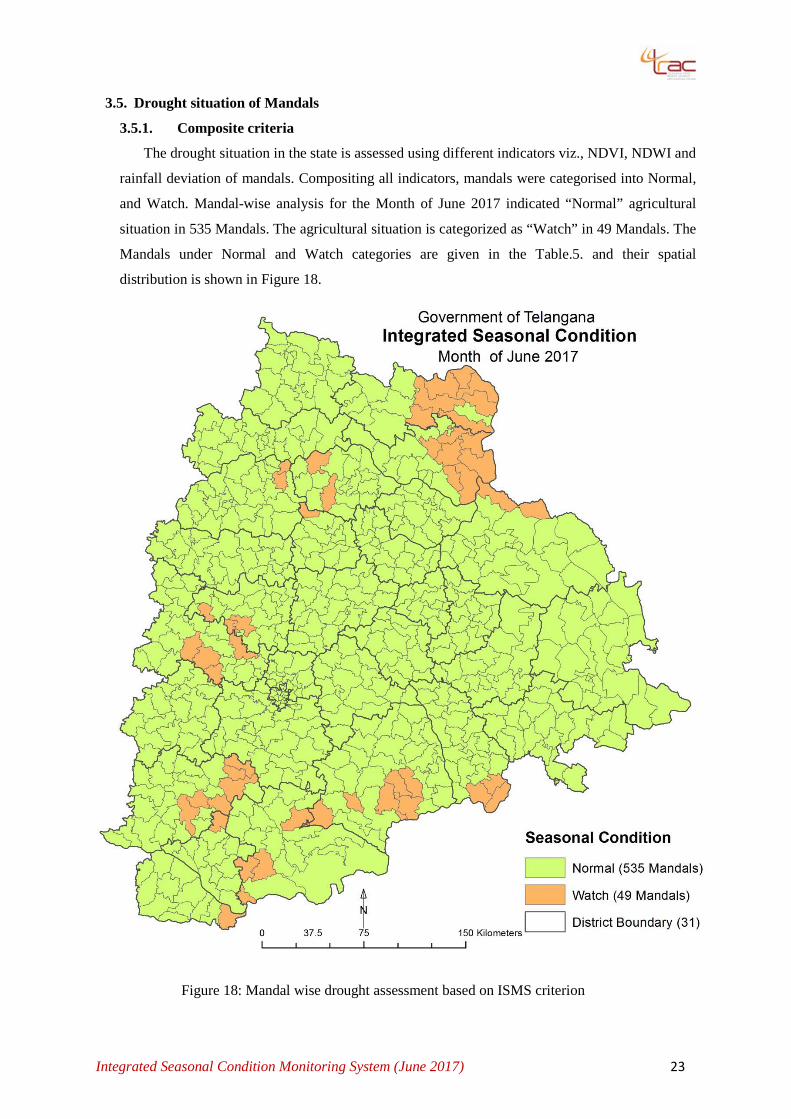
3.5. Drought situation of Mandals
3.5.1. Composite criteria
The drought situation in the state is assessed using different indicators viz., NDVI, NDWI and
rainfall deviation of mandals. Compositing all indicators, mandals were categorised into Normal,
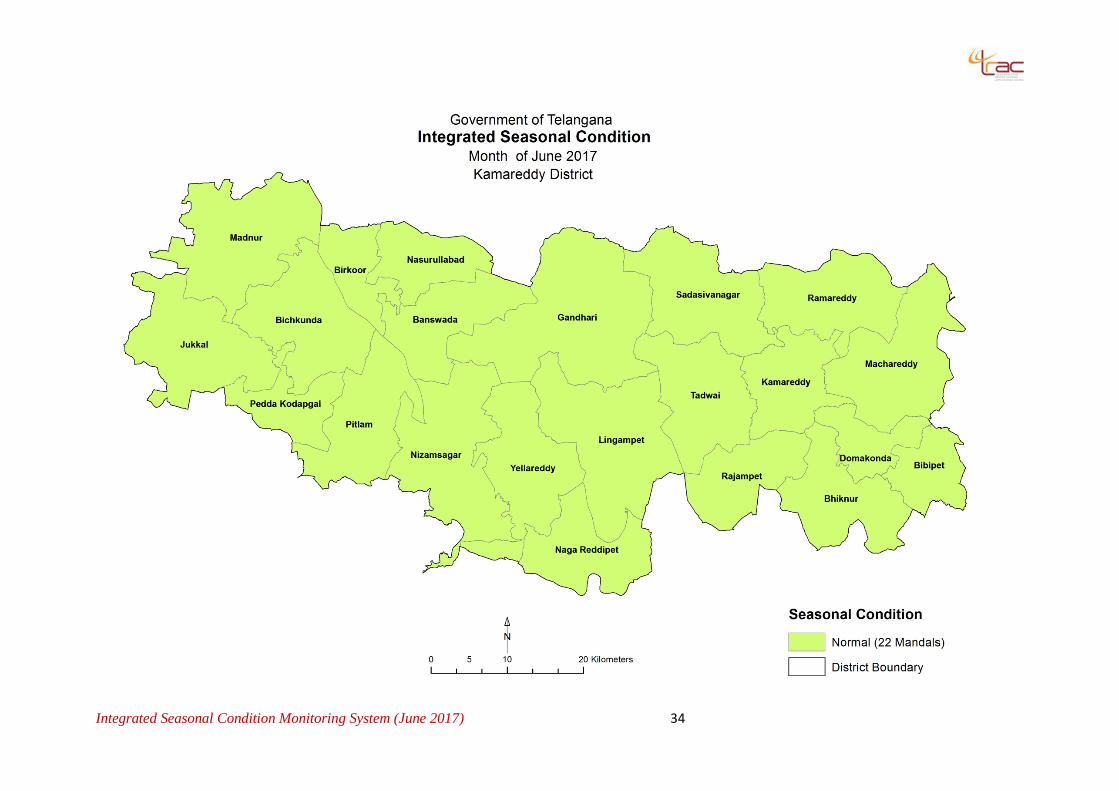
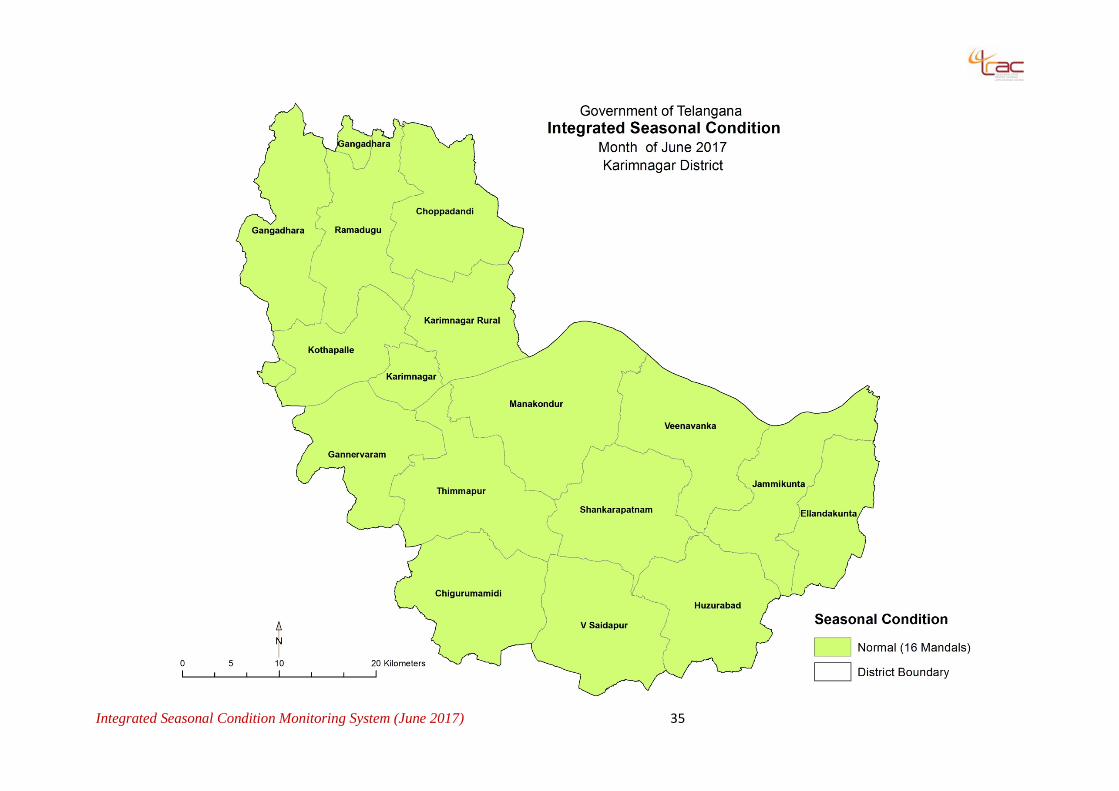
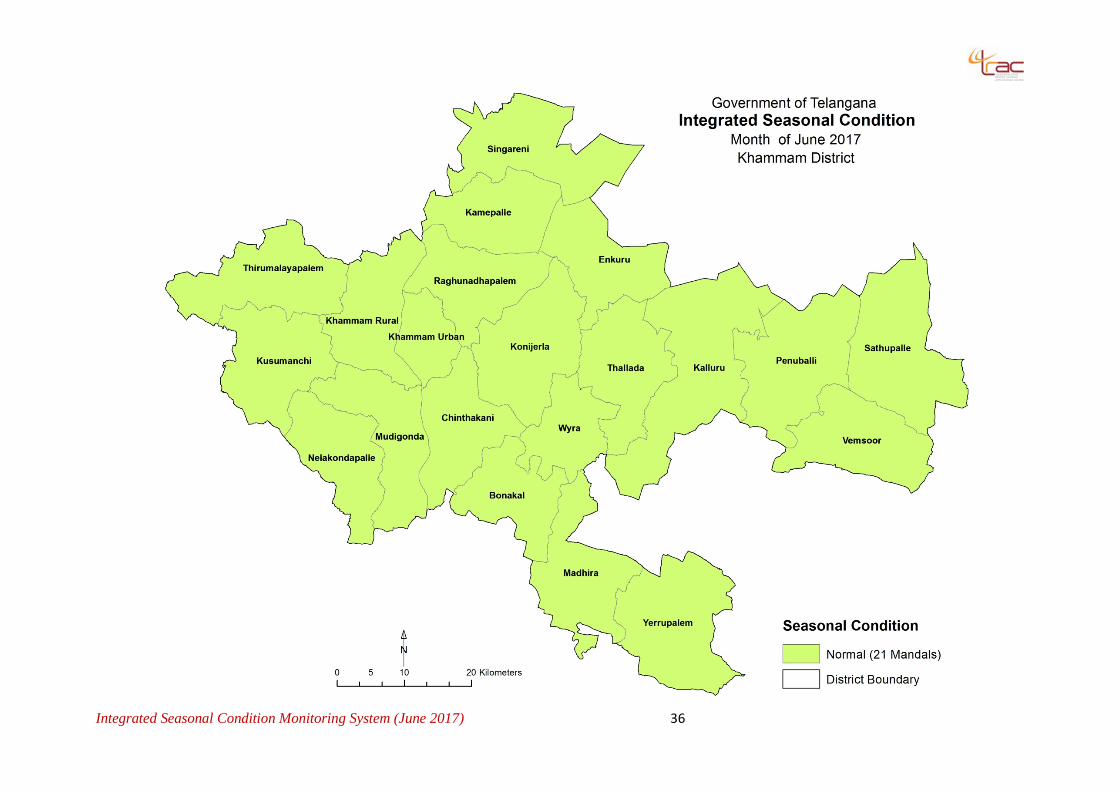
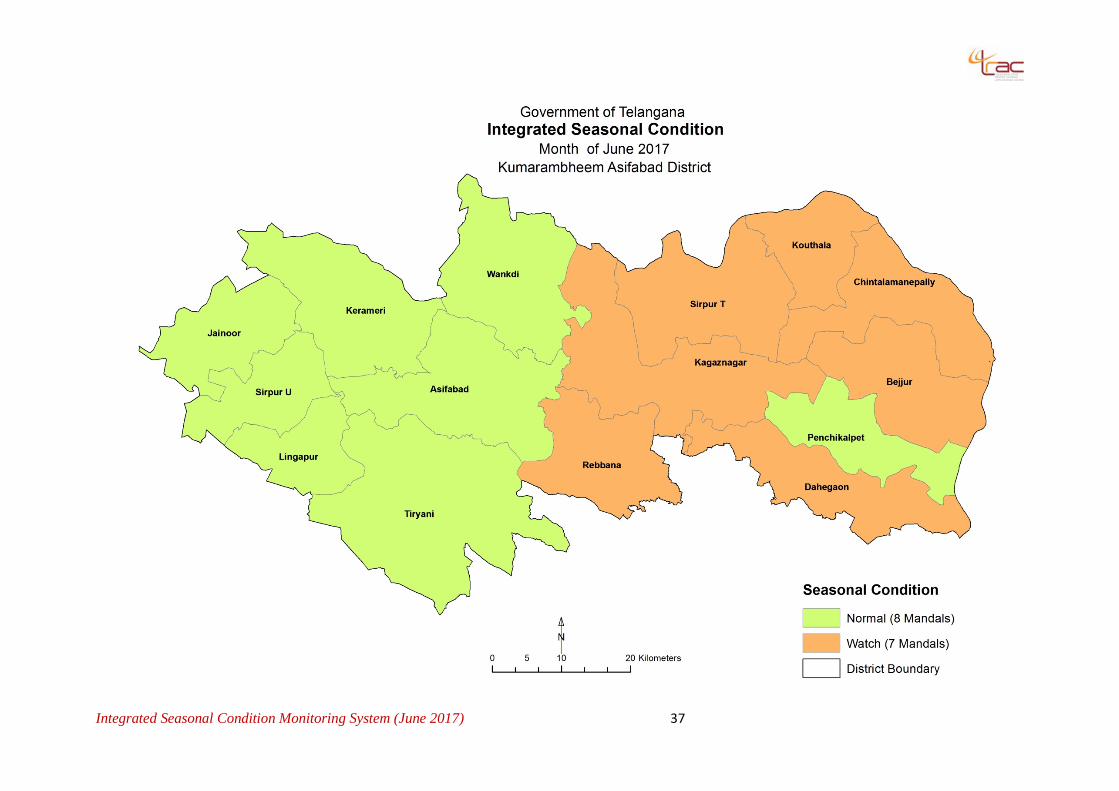
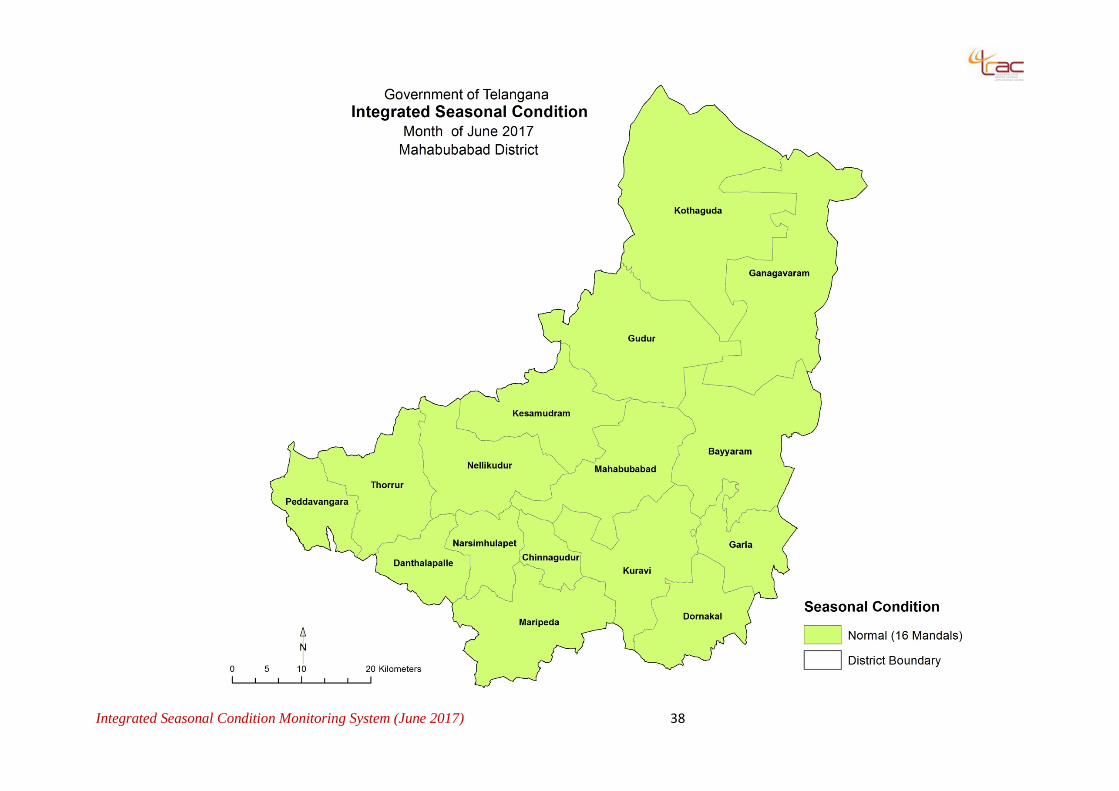
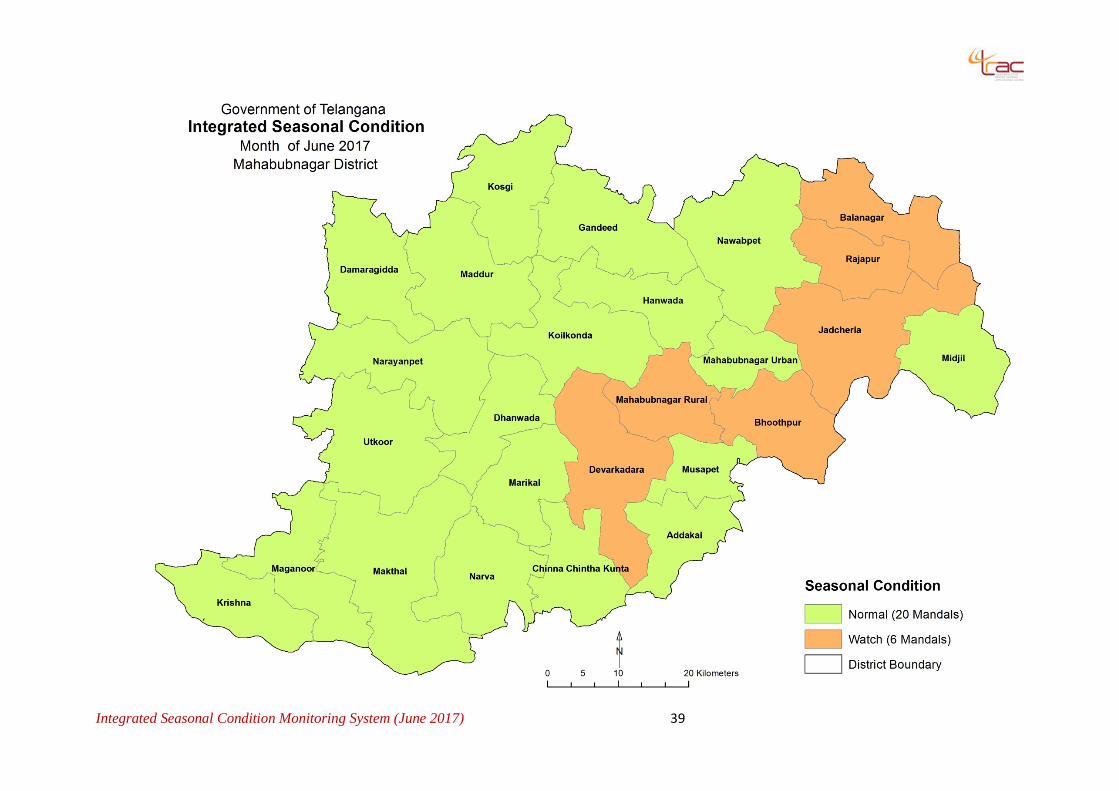
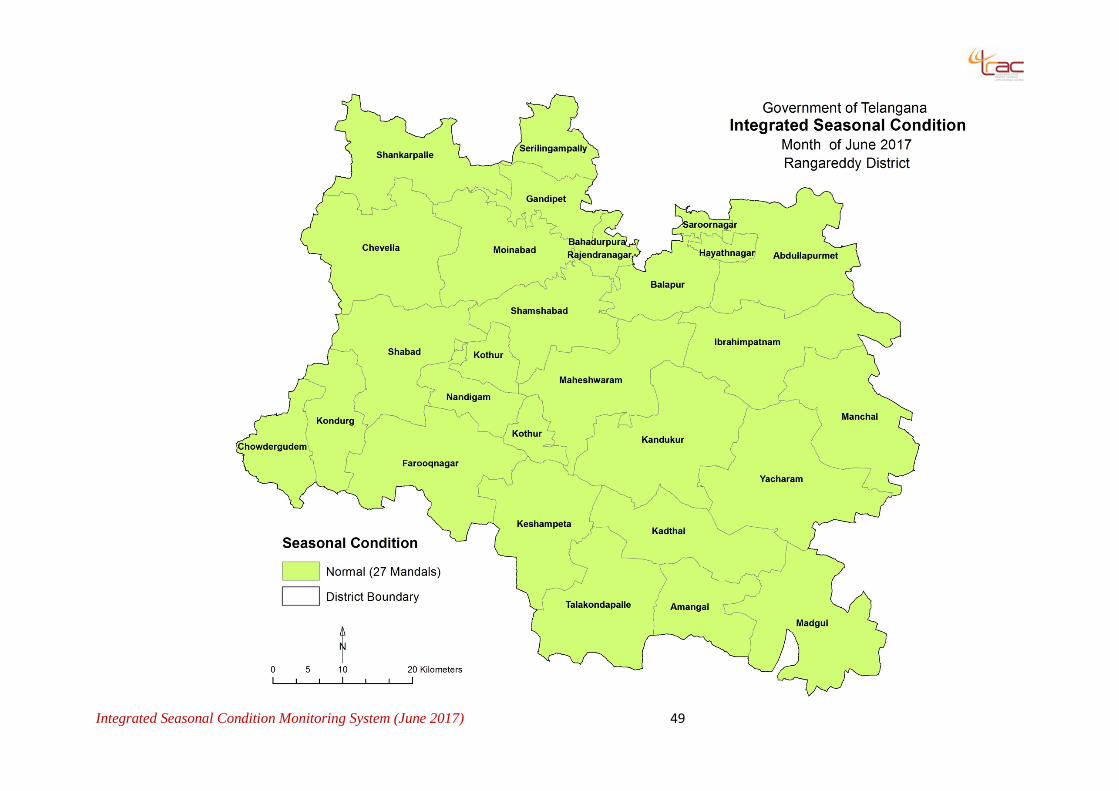
and Watch. Mandal-wise analysis for the Month of June 2017 indicated “Normal” agricultural
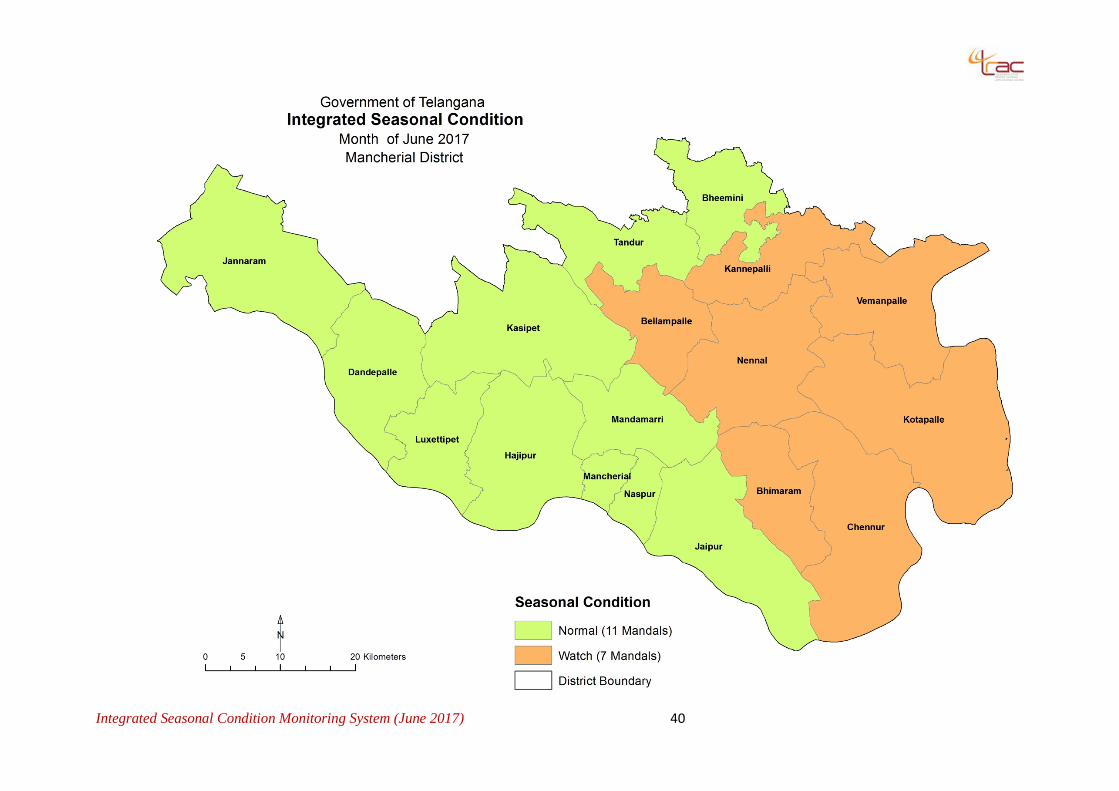
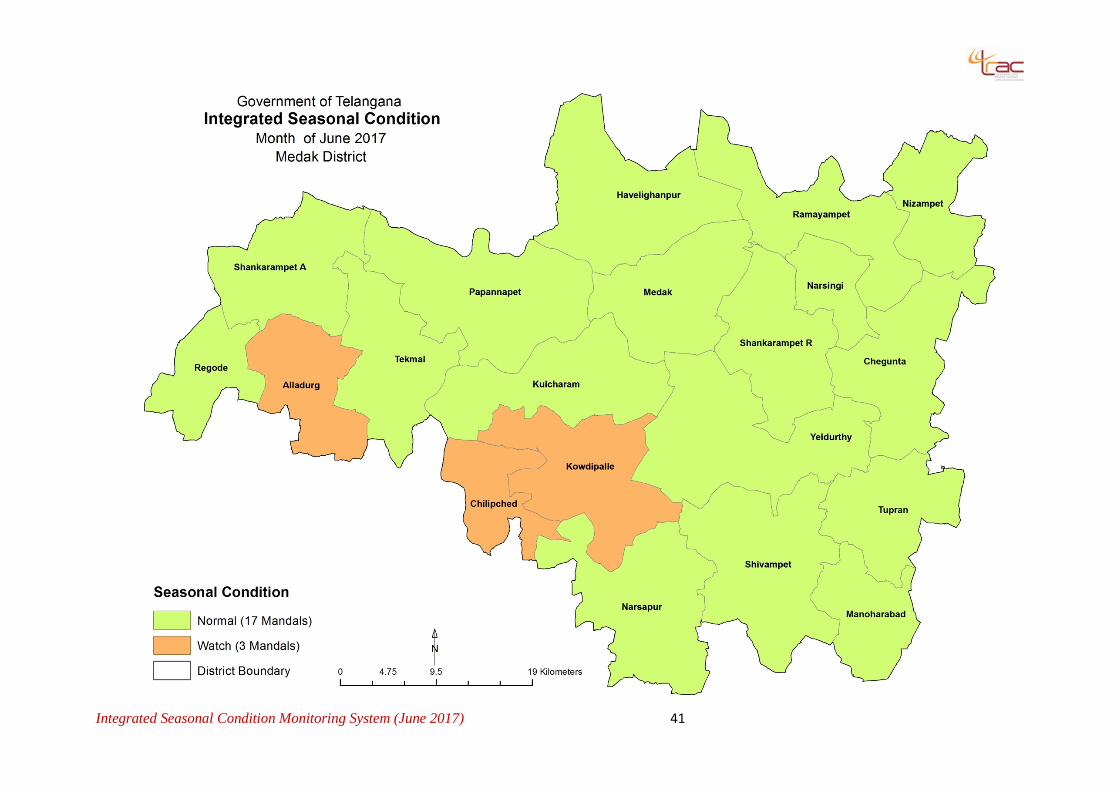
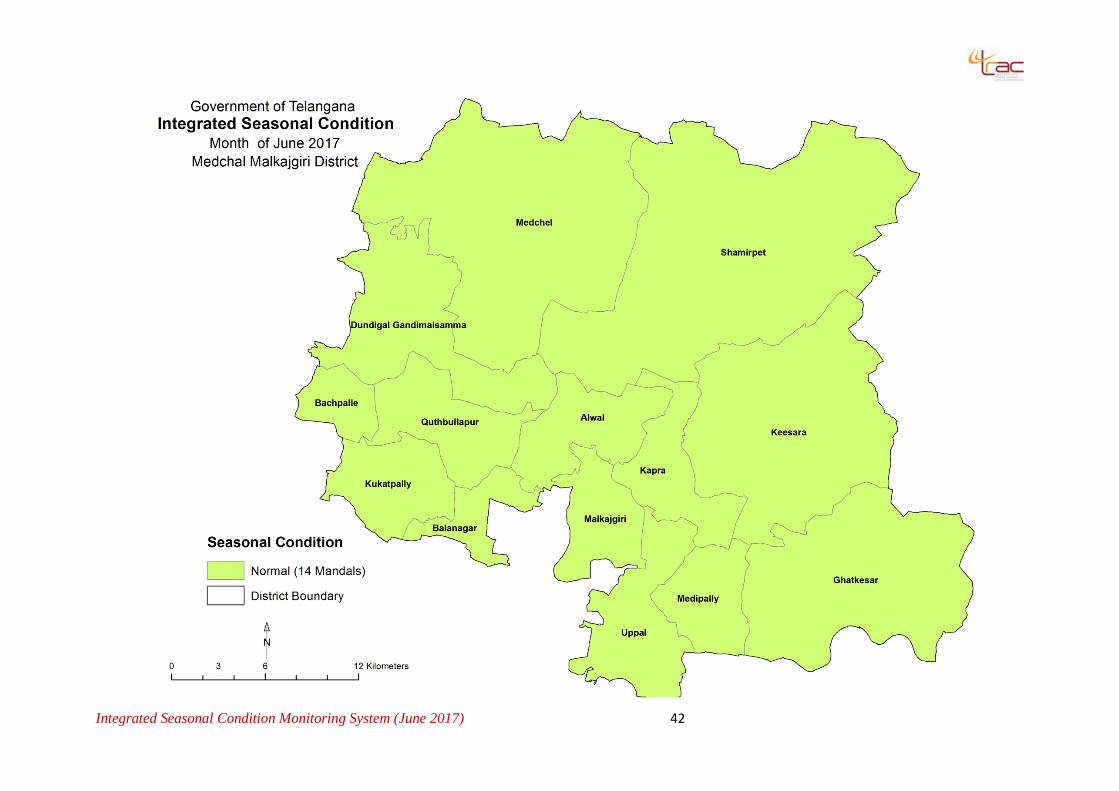
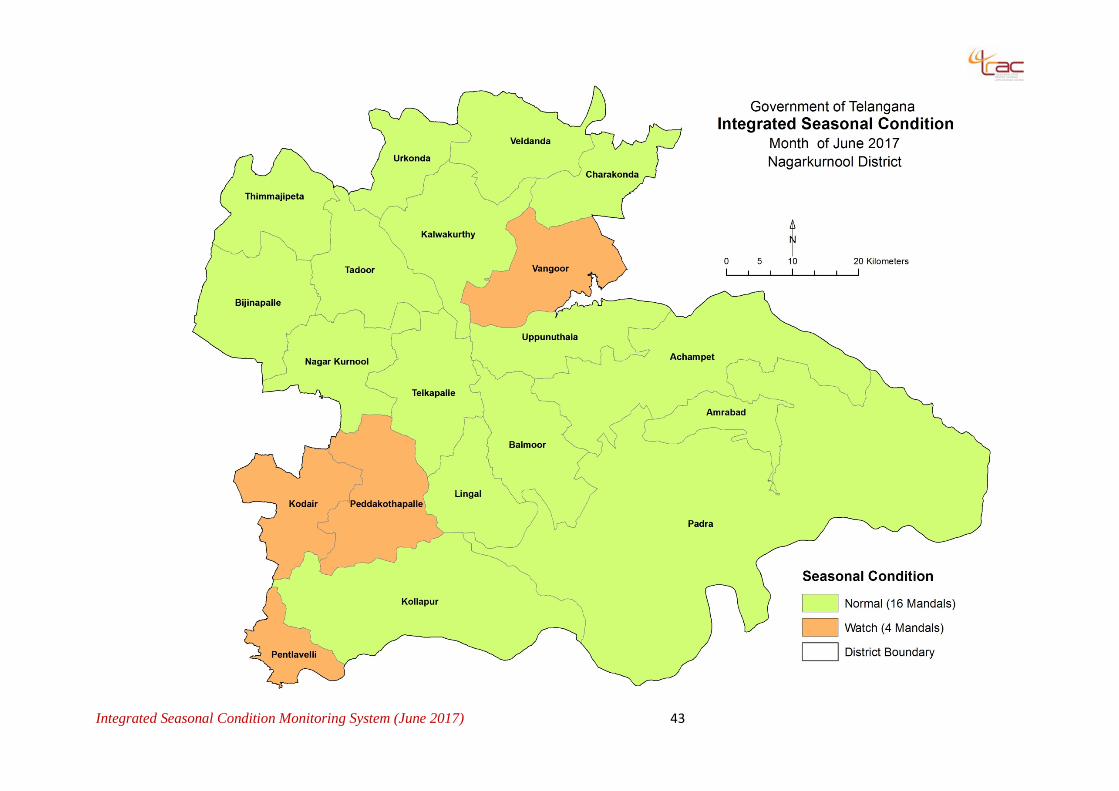
situation in 535 Mandals. The agricultural situation is categorized as “Watch” in 49 Mandals. The
Mandals under Normal and Watch categories are given in the Table.5. and their spatial
distribution is shown in Figure 18.
Figure 18: Mandal wise drought assessment based on ISMS criterion
Integrated Seasonal Condition Monitoring System (June 2017) 24
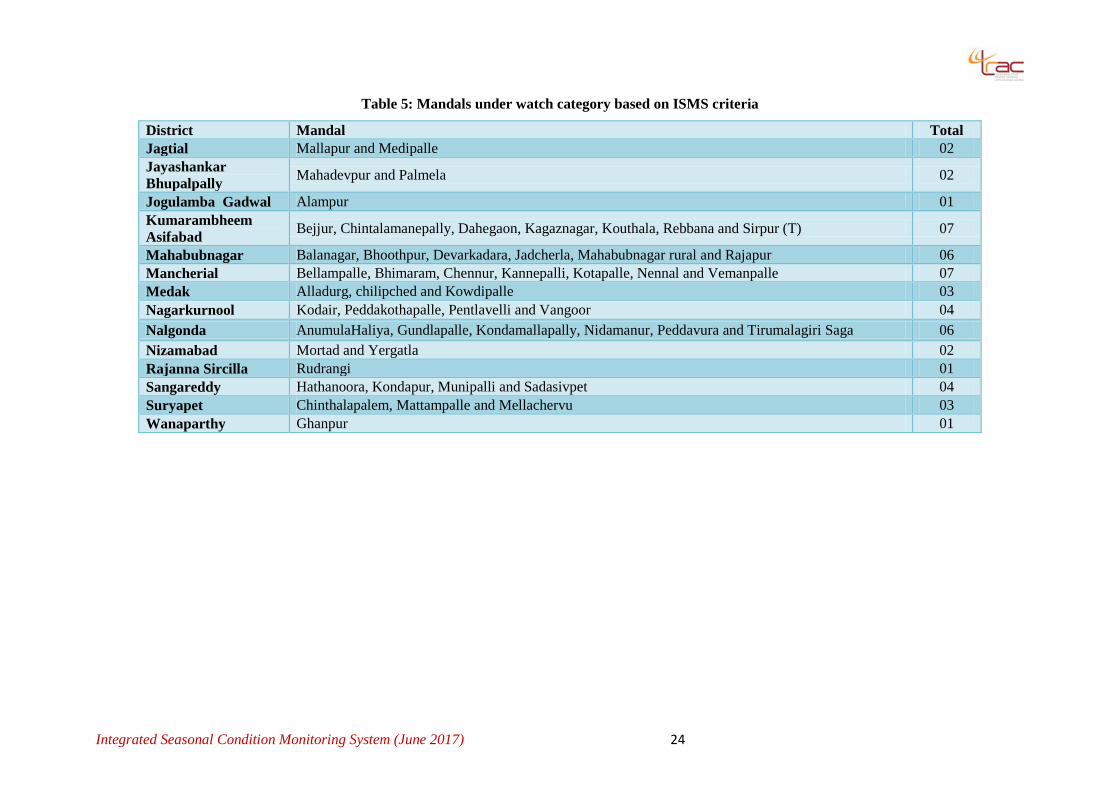
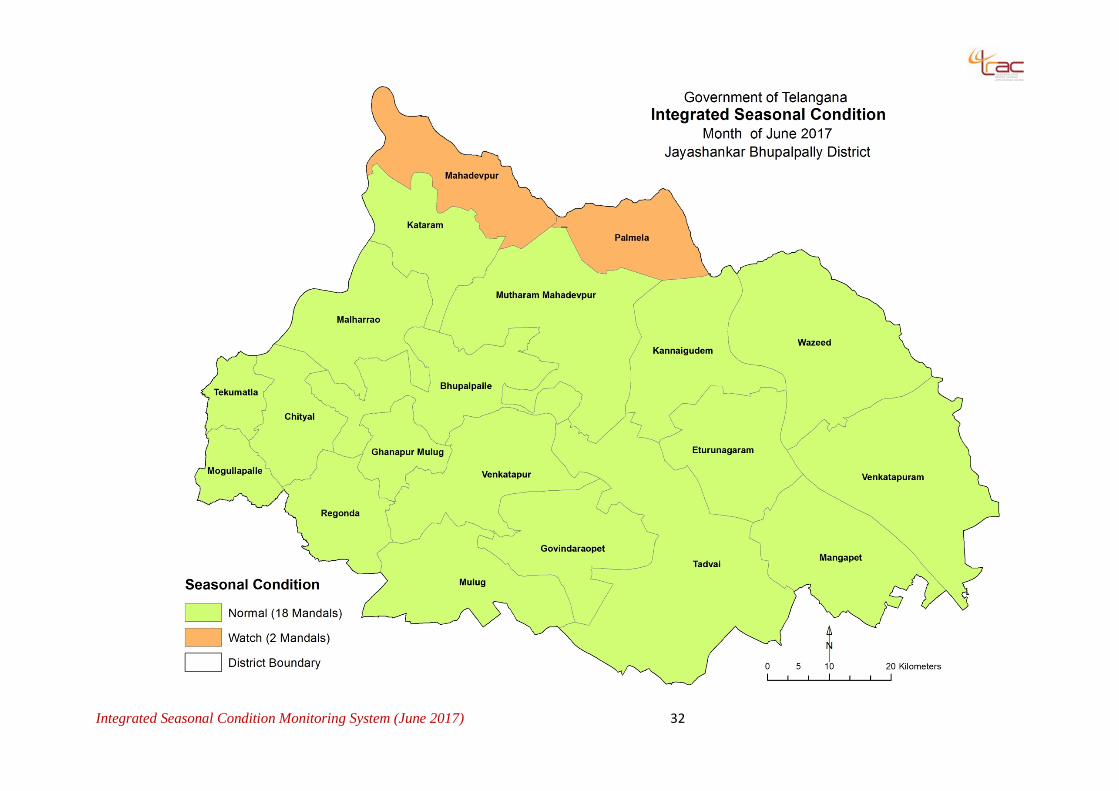
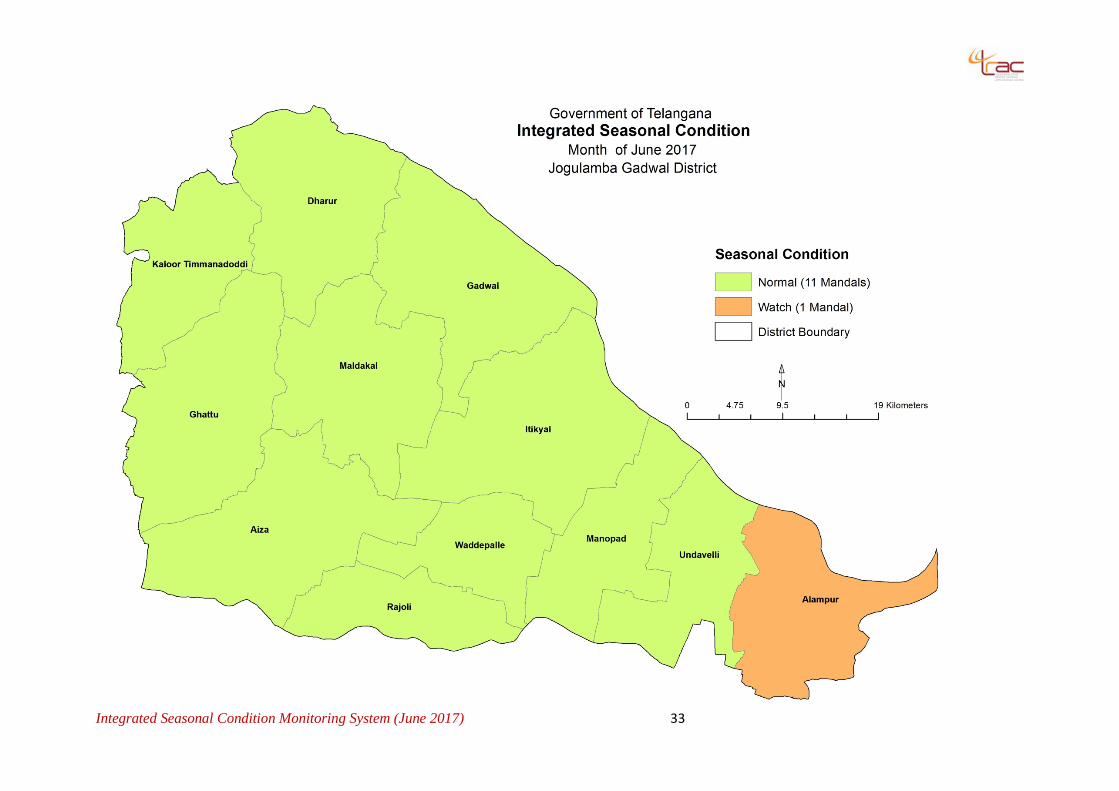
Table 5: Mandals under watch category based on ISMS criteria
District Mandal Total Jagtial Mallapur and Medipalle 02 Jayashankar Bhupalpally Mahadevpur and Palmela 02
Jogulamba Gadwal Alampur 01 Kumarambheem Asifabad Bejjur, Chintalamanepally, Dahegaon, Kagaznagar, Kouthala, Rebbana and Sirpur (T) 07
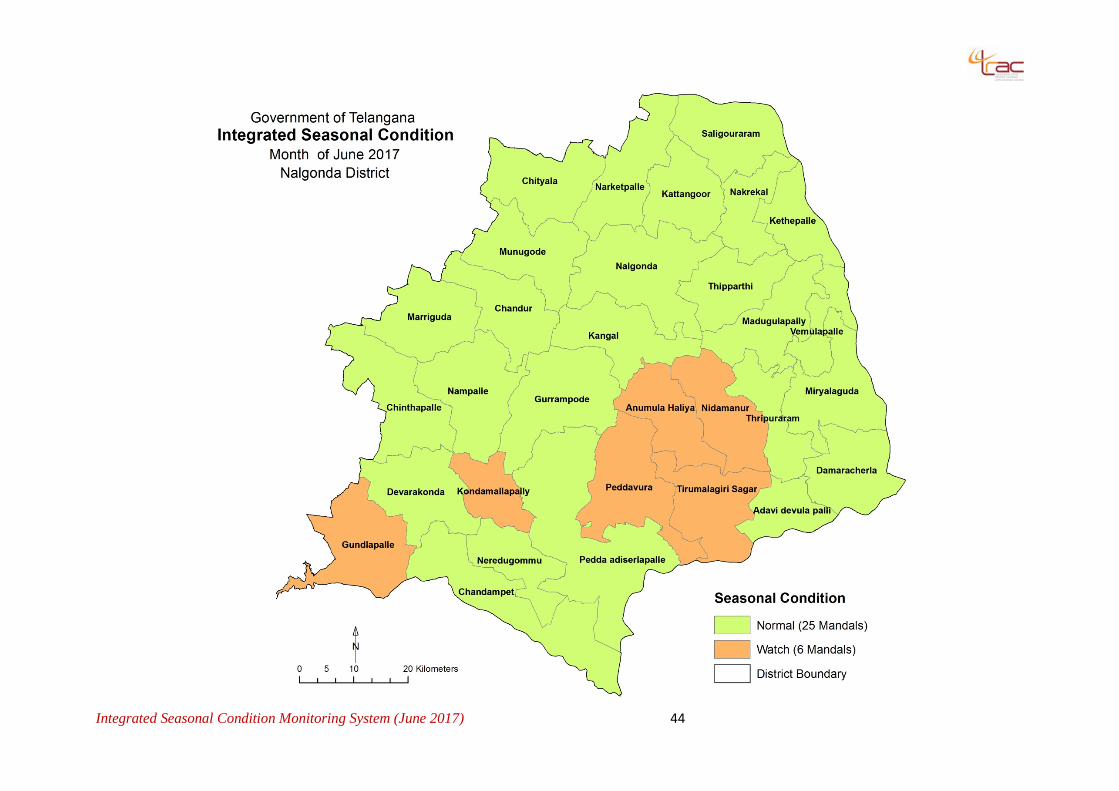
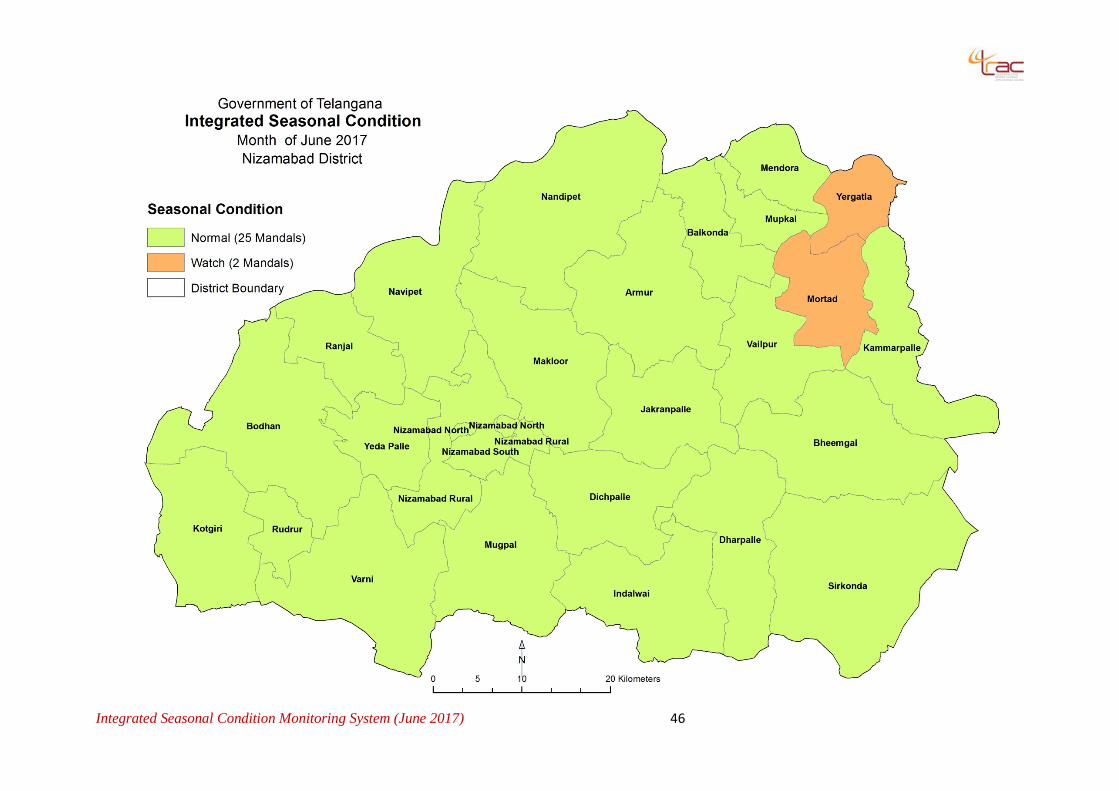
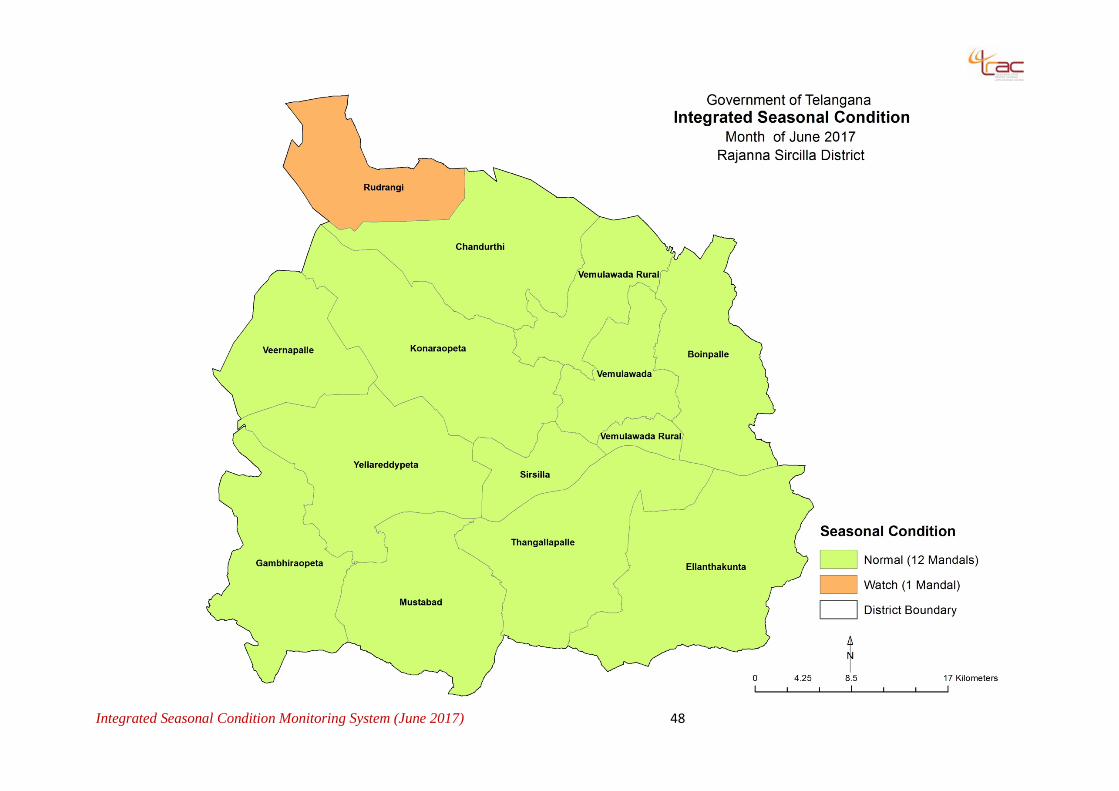
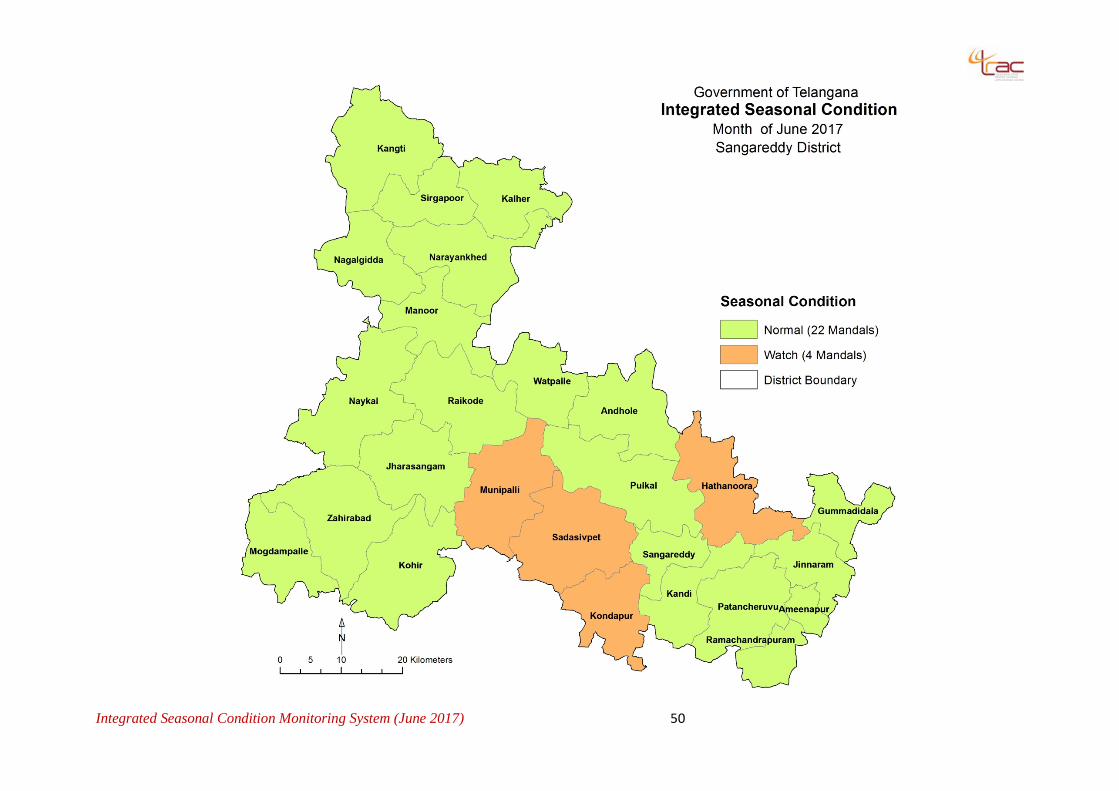
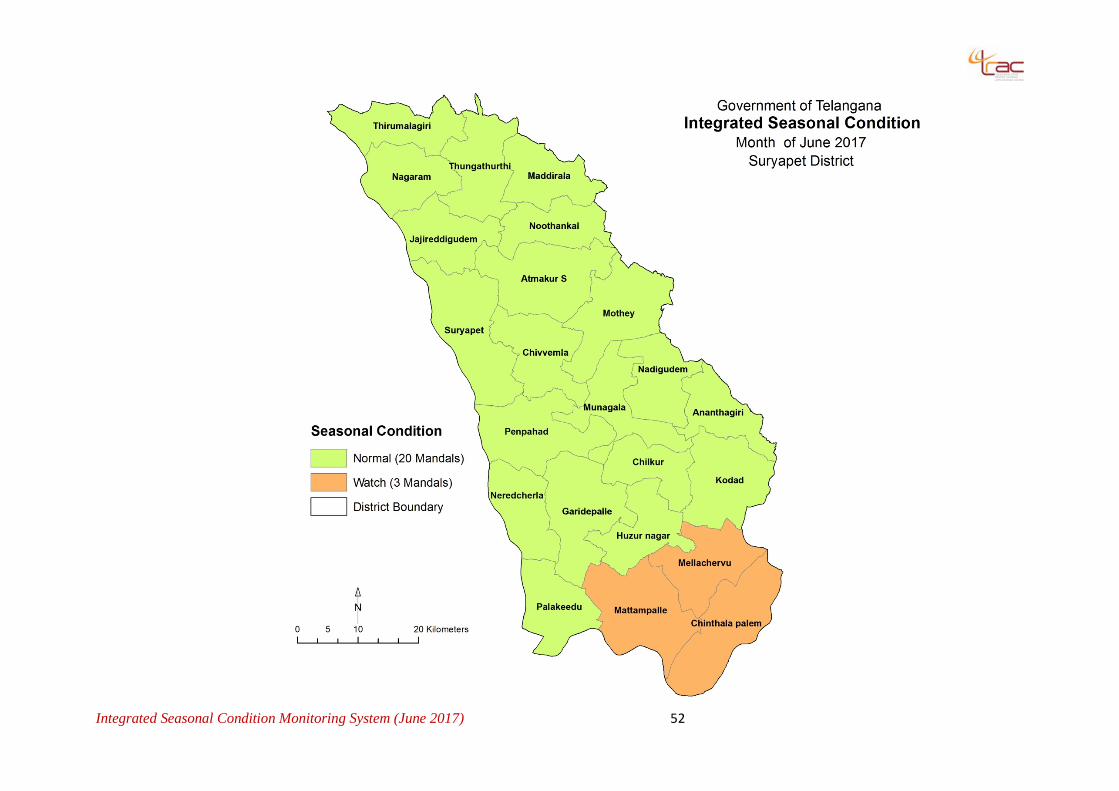
Mahabubnagar Balanagar, Bhoothpur, Devarkadara, Jadcherla, Mahabubnagar rural and Rajapur 06 Mancherial Bellampalle, Bhimaram, Chennur, Kannepalli, Kotapalle, Nennal and Vemanpalle 07 Medak Alladurg, chilipched and Kowdipalle 03 Nagarkurnool Kodair, Peddakothapalle, Pentlavelli and Vangoor 04 Nalgonda AnumulaHaliya, Gundlapalle, Kondamallapally, Nidamanur, Peddavura and Tirumalagiri Saga 06 Nizamabad Mortad and Yergatla 02 Rajanna Sircilla Rudrangi 01 Sangareddy Hathanoora, Kondapur, Munipalli and Sadasivpet 04 Suryapet Chinthalapalem, Mattampalle and Mellachervu 03 Wanaparthy Ghanpur 01
Integrated Seasonal Condition Monitoring System (June 2017) 25
4. Conclusions
Highlights of seasonal conditions at the end of the month, June 2017 are as follows.
58 Mandals of state received Deficient rainfall. Deficient rainfall was recorded north eastern
parts of Komaram Bheem- Asifabad, Mancherial, Nizamabad, Sangareddy districts. South
western part of Medak and parts of Jagitial, Mahabunagar district also received deficient
rainfall.
116 Mandals received Normal rainfall in State. Normal rainfall was recorded mostly in parts
of Adilabad, Jagitial, Mahabubnagar, Nagarkurnool, Nalgonda, Nirmal, Nizamabad, Peddapalli
and Sangareddy districts.
141 and 265 Mandals of state received Excess and Large Excess rainfall in State
respectively. All most all parts of Bhadradri kothagudem, Jangaon, Jayashankar-Bhupalpally,
Jogulamba Gadwal, Kamareddy, Karimnagar, Khammam, Mahabubabad, Mahabubnagar,
Medchal-Malkajgiri, Nagarkurnool, Nalgonda, Rangareddy, Sangareddy, Siddipet, Suryapet,
Vikarabad, Wanaparthy , Warangal Rural, Warangal Urban and Yadadri Districts received
excess to large excess rainfall.
Mandal wise analysis by the end of June, 2017 indicated “Normal” agricultural situation in 535
Mandals and in 49 Mandals are in "Watch" category.

Integrated Seasonal Condition Monitoring System (June 2017) 26
References
Department of Agriculture and Cooperation, 2009, Manual for Drought Management, Ministry of Agriculture, Govt. of India, New Delhi.
http://drought.unl.edu/portals/0/docs/international/GovtIndiaDroughtManual.pdf
Department of Agriculture, 2017, Season and Crop Coverage Report, Kharif - 2017, Govt. of Telangana
Kogan FN, 1995, Droughts of late 1980s in the USA as derived from NOAA polar orbiting satellite data, Bulletin of American Meteorological Society, 76: 655-668
Malingreau JP, 1986, Global vegetation dynamics: Satellite observations over Asia, International Journal of Remote Sensing, 7: 1121-1146.
Tucker CJ and Chowdhary BJ, 1987, Satellite remote sensing of drought conditions, Remote Sensing of Environment, 23: 243-251
Integrated Seasonal Condition Monitoring System (June 2017) 27
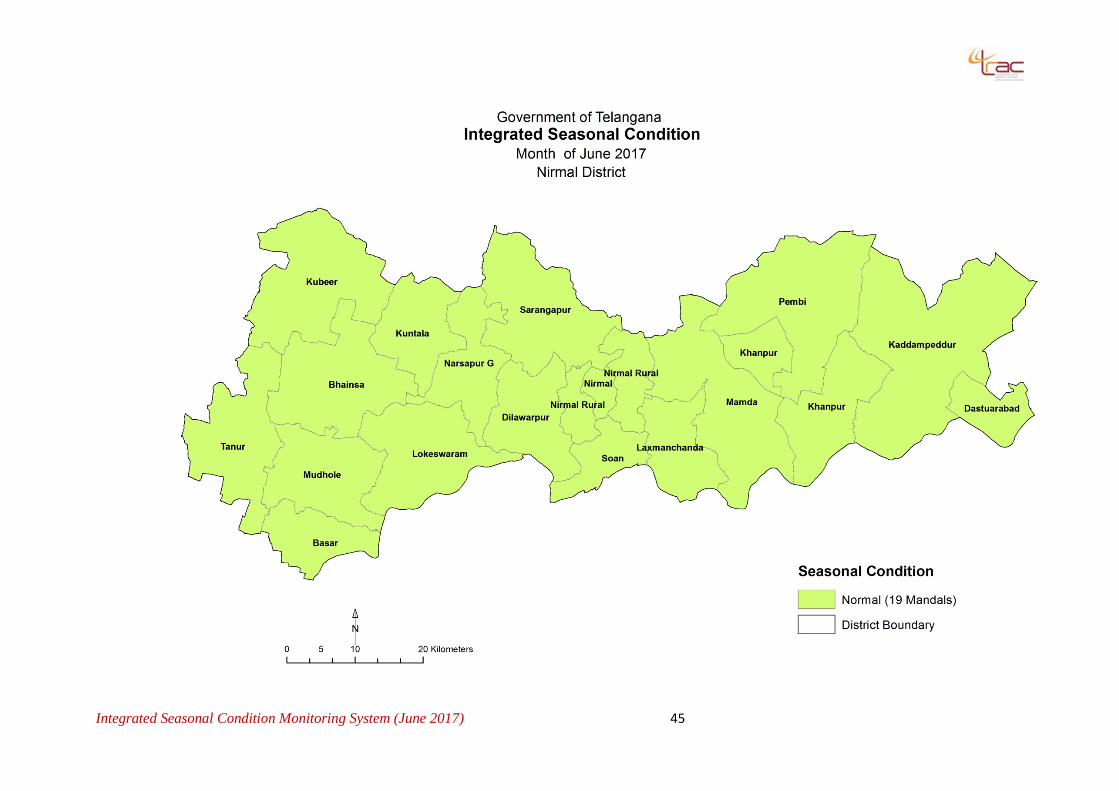
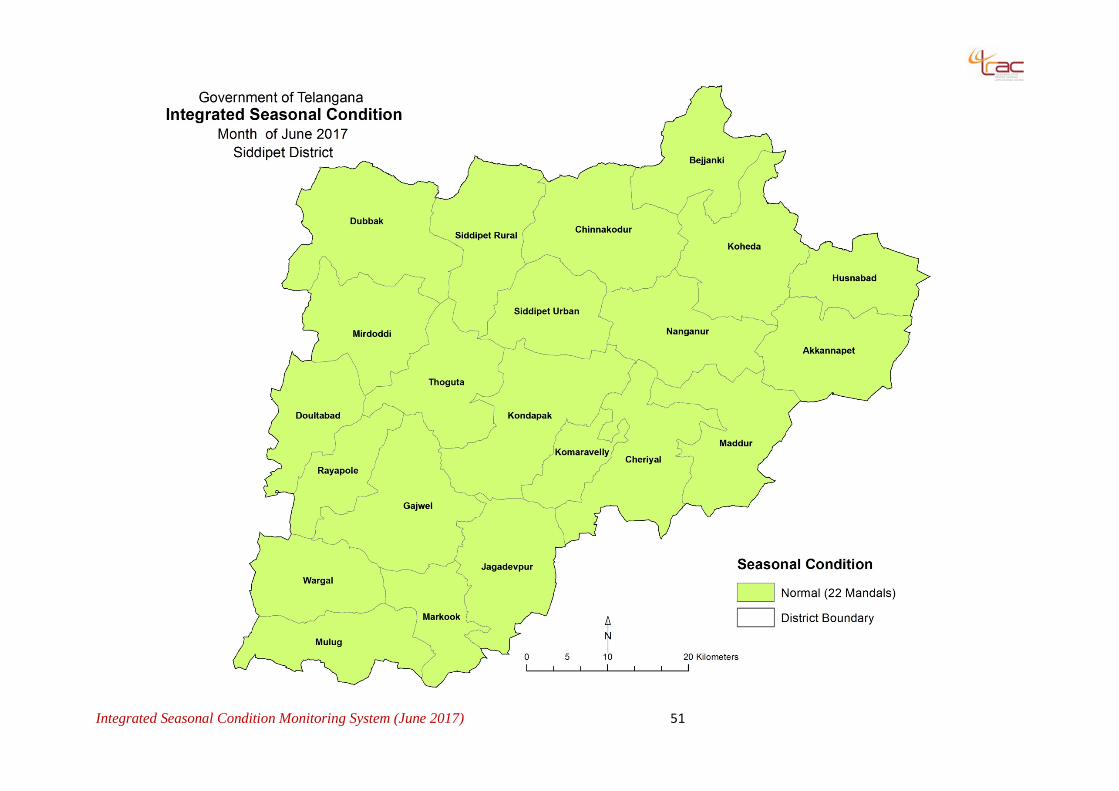
ANNEXURE I District Wise Maps Showing Normal, Watch Mandals
Integrated Seasonal Condition Monitoring System (June 2017) 28
Integrated Seasonal Condition Monitoring System (June 2017) 29

Integrated Seasonal Condition Monitoring System (June 2017) 30
Integrated Seasonal Condition Monitoring System (June 2017) 31
Integrated Seasonal Condition Monitoring System (June 2017) 32
Integrated Seasonal Condition Monitoring System (June 2017) 33
Integrated Seasonal Condition Monitoring System (June 2017) 34
Integrated Seasonal Condition Monitoring System (June 2017) 35
Integrated Seasonal Condition Monitoring System (June 2017) 36
Integrated Seasonal Condition Monitoring System (June 2017) 37
Integrated Seasonal Condition Monitoring System (June 2017) 38
Integrated Seasonal Condition Monitoring System (June 2017) 39
Integrated Seasonal Condition Monitoring System (June 2017) 40
Integrated Seasonal Condition Monitoring System (June 2017) 41
Integrated Seasonal Condition Monitoring System (June 2017) 42
Integrated Seasonal Condition Monitoring System (June 2017) 43
Integrated Seasonal Condition Monitoring System (June 2017) 44
Integrated Seasonal Condition Monitoring System (June 2017) 45
Integrated Seasonal Condition Monitoring System (June 2017) 46

Integrated Seasonal Condition Monitoring System (June 2017) 47
Integrated Seasonal Condition Monitoring System (June 2017) 48
Integrated Seasonal Condition Monitoring System (June 2017) 49
Integrated Seasonal Condition Monitoring System (June 2017) 50
Integrated Seasonal Condition Monitoring System (June 2017) 51
Integrated Seasonal Condition Monitoring System (June 2017) 52
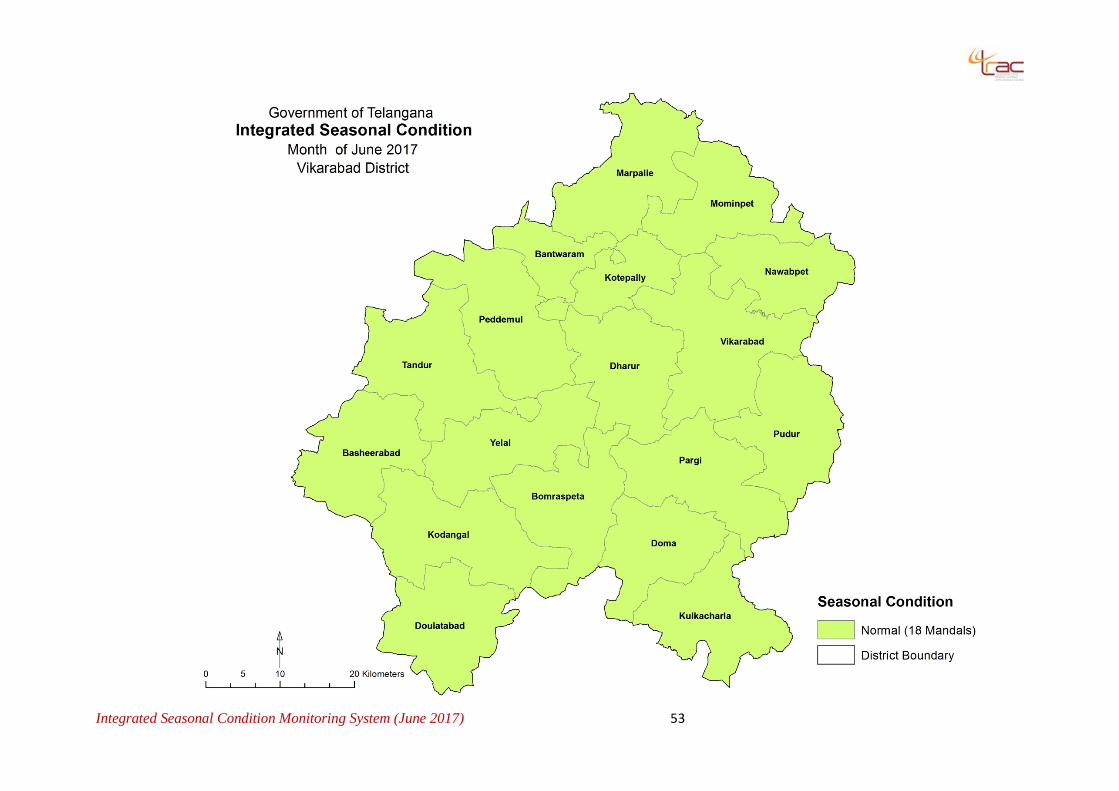
Integrated Seasonal Condition Monitoring System (June 2017) 53
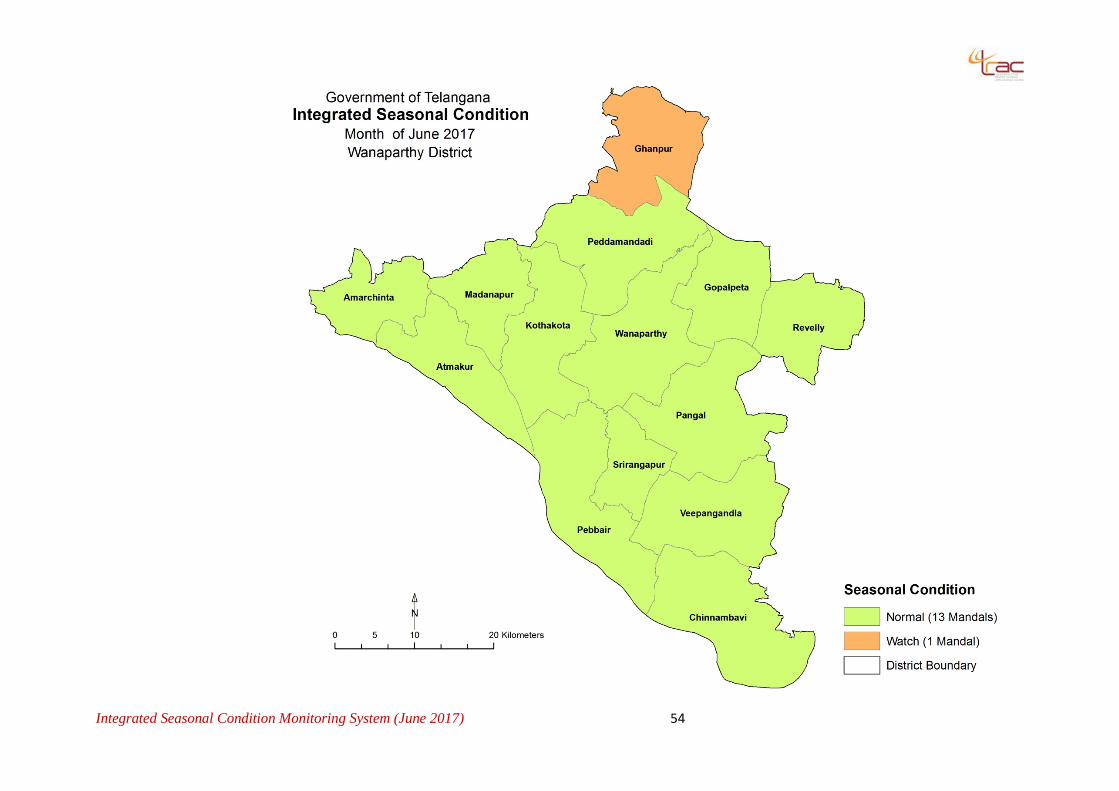
Integrated Seasonal Condition Monitoring System (June 2017) 54
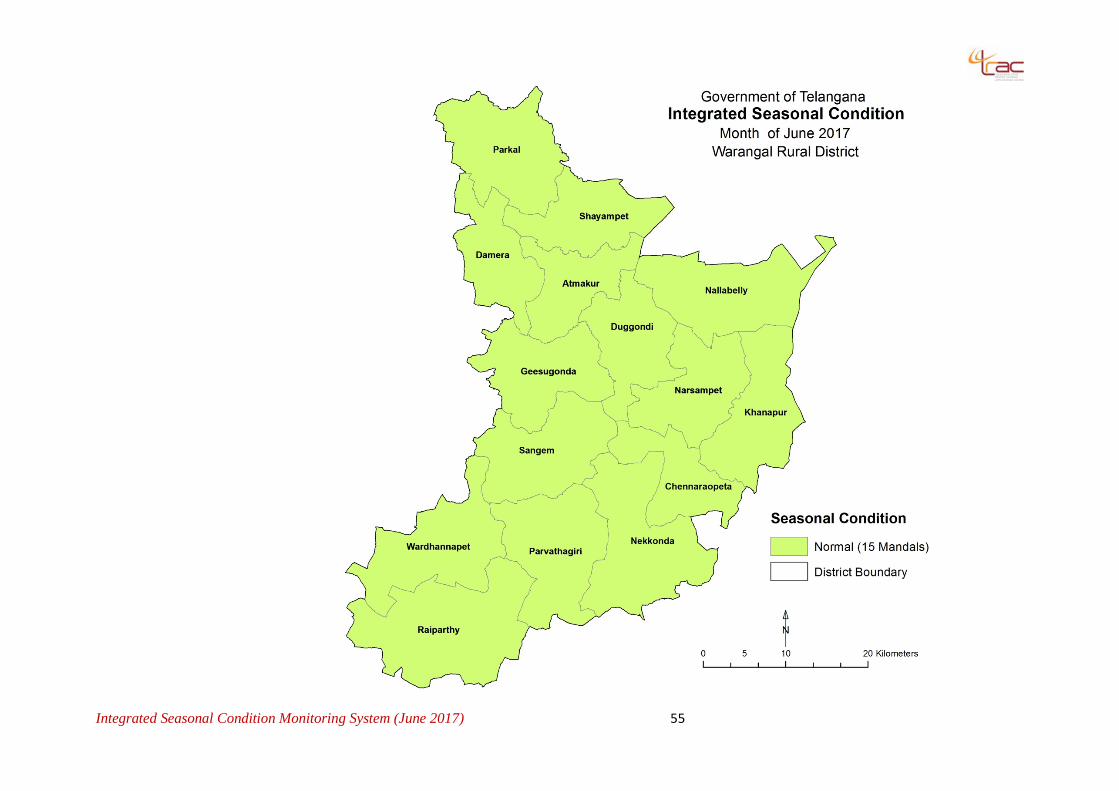
Integrated Seasonal Condition Monitoring System (June 2017) 55
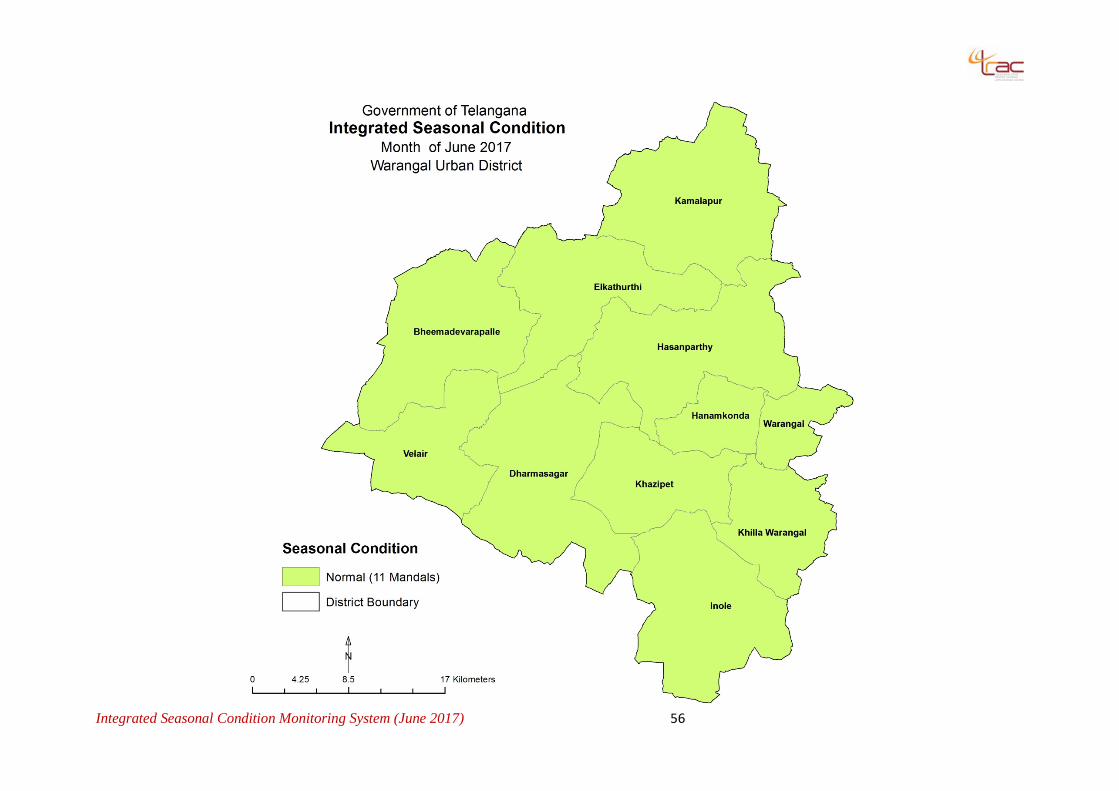
Integrated Seasonal Condition Monitoring System (June 2017) 56

Integrated Seasonal Condition Monitoring System (June 2017) 57
Integrated Seasonal Condition Monitoring System (June 2017) 58


