Embed Size (px)
Citation preview
Social Capital in an online brand community:
Volkswagen in China
CUI LI
Department of Human Resource and Marketing Management
Portsmouth Business School
University of Portsmouth
Submitted in fulfilment of the requirements of the degree of
Doctor of Philosophy
July 2013

i
DECLARATION
Whilst registered as a candidate for the above degree, I have not been registered for any
other award. The results and conclusions embodied in this thesis are the work of the named
candidate and have not been submitted for any other academic award.
Cui Li

ii
ACKNOWLEDGEMENTS
I would like to take this opportunity to express my gratitude to many people who have
provided assistance and support throughout the study. First of all, I would like to thank both
my supervisors, Professor Colin Wheeler and Dr. Lillian Clark, for giving me an opportunity
to pursue my doctoral degree and for their encouragement and patience throughout the
process. Their excellent supervision, expertise and valuable advice have enabled me to
progress until completion. Another supervisor that I would like to thank is Mr. Chris Fill,
who provided valuable guidance and insightful comments during the first two years of my
PhD study.
I must give special acknowledgement to my colleagues, Dr. Sutthirat Ploybut, Dr. Nor
Ashmiza Mahamed Ismail, Dr. Hui Wang and Dr. Lee Do-Hyung, who were always so kind,
caring and supportive. All the discussions we had on our Doctoral studies were inspirational.
Most of all, I would especially like to thank my husband and my parents, who are most
important part of my life; for the love, prayers, courage and moral support they gave to me
throughout my studies.

iii
ABSTRACT
Over the past ten years, mainly as a result of developments in digital technology and social
media, academics and practitioners have become more interested in communities. The
number of studies investigating online brand communities (OBCs) has been increasing with
most attention being paid to the characteristics, functions and benefits associated with OBCs.
However, an important aspect of OBCs has been overlooked, which is the contribution of
social capital to the communities and the impact on brands. This research seeks to fill this
gap by developing an understanding of social capital in order to assist marketers to utilise
OBC more effectively.
This study investigates the use of social capital in two ways: firstly, to examine the presence
of social capital in OBCs; and secondly, to examine the potential impact of social capital on
brand knowledge. Accordingly this study is deductive in nature, using a web-survey
approach. Thirty-five Volkswagen consumer-initiated OBCs were involved in the survey
which was selected from www.Xcar.com in China.
This study finds that both social capital and brand knowledge constructs have a high level of
reliability and validity, which indicates their presence within consumer-initiated OBCs.
Further, a significant causal relationship is found between social capital and brand
knowledge. In particular, each dimension of social capital exerts differential effects upon
brand knowledge. The findings are an original contribution to social capital theory and OBC
studies and they are also important for brand owners and community leaders who wish to
develop and implement OBC strategies.

iv | P a g e
Table of Contents DECLARATION ........................................................................................................................... i
ACKNOWLEDGEMENTS ............................................................................................................ ii
ABSTRACT ................................................................................................................................ iii
List of Tables ............................................................................................................................ xi
List of Figures ......................................................................................................................... xiii
Chapter 1 Introduction ............................................................................................................ 1
1.0 Background to the research ....................................................................................... 1
1.1 Need for the present study ......................................................................................... 2
1.1.1 OBC research from a social capital perspective ............................................... 3
1.1.2 Brand knowledge in an OBC ............................................................................. 4
1.1.3 Empirical OBC research into consumer-initiated communities ....................... 5
1.2 Research objectives .................................................................................................... 5
1.3 Research approach and methods ............................................................................... 6
1.4 Main variables measured under this study ................................................................ 7
1.5 Organisation of thesis ............................................................................................... 10
Chapter 2 Literature Review and Hypotheses Development .............................................. 13
2.0 Introduction .............................................................................................................. 13
2.1 Online Brand Communities (OBCs) ........................................................................... 14
2.1.1 What is a community? .................................................................................... 14
2.1.2 What is a brand community? ......................................................................... 16
2.1.3 What is a virtual community? ........................................................................ 20
v | P a g e
2.1.4 What is an OBC? ............................................................................................. 22
2.1.5 Summary ......................................................................................................... 33
2.2 Brand knowledge ...................................................................................................... 35
2.2.1 The concept of brand knowledge ................................................................... 35
2.2.2 Measuring brand knowledge ......................................................................... 40
2.2.3 Brand knowledge and the OBC ...................................................................... 41
2.2.4 Summary ......................................................................................................... 43
2.3 Social capital ............................................................................................................. 44
2.3.1 The emergence of social capital ..................................................................... 44
2.3.2 The term social capital ................................................................................... 44
2.3.3 Definitions of social capital ............................................................................ 45
2.3.3.1 Defining social capital in the OBC ................................................................... 50
2.3.4 Forms of social capital .................................................................................... 51
2.3.4.1 Social ties theory as a prerequisite ................................................................. 51
2.3.4.2 Bonding and bridging social capital ................................................................ 52
2.3.4.3 Internet ties ..................................................................................................... 53
2.3.4 Measuring social capital ................................................................................. 54
2.3.5 The dimensions of social capital..................................................................... 55
2.3.5.1 Overview of the dimensions of social capital ................................................. 56
2.3.5.2 The use of dimensions of social capital according to different contexts ....... 64
2.3.5.3 Identifying the dimensions of social capital in the OBC ................................. 77
2.3.6 Summary ......................................................................................................... 83
2.4 Hypotheses development and conceptual framework ............................................ 84
2.4.1 The development of the conceptual framework in this study ....................... 84

vi | P a g e
2.4.1.1 The role of social capital in the OBC ............................................................... 84
2.4.1.2 The role of brand knowledge in the OBC ........................................................ 85
2.4.1.3 Linking the dimensions of social capital and brand knowledge ..................... 85
2.4.2 The development of research hypotheses in this study ................................ 88
2.5 Summary ................................................................................................................... 92
Chapter 3 Research Methodology ........................................................................................ 95
3.0 Introduction .............................................................................................................. 95
3.1 Philosophical orientation .......................................................................................... 96
3.1.1 Ontological and epistemological choice ......................................................... 96
3.1.2 Choice of research paradigms ........................................................................ 96
3.1.3 Philosophical approach for this study ............................................................ 97
3.2 Refining the research propositions ........................................................................... 99
3.3 Justification for choice of Chinese Volkswagen's brand communities ................... 102
3.3.1 The automobile industry in China ................................................................ 102
3.3.2 Volkswagen in China: the key player in China’s automobile market ........... 103
3.3.3 The Internet environment in China .............................................................. 104
3.3.4 Research context of this study ..................................................................... 104
3.4 Research design: quantitative research strategy via questionnaire survey ........... 104
3.4.1 The justifications for using the survey method ............................................ 105
3.4.2 Data collection method: Questionnaires ..................................................... 108
3.5 Target respondents and sample planning .............................................................. 109
3.6 Online self-completion questionnaire .................................................................... 110
3.6.1 Specify the required information ................................................................. 110
vii | P a g e
3.6.2 The development of measured items for each variable .............................. 112
3.6.2.1 Measurement of interaction ties .................................................................. 112
3.6.2.2 Measurement of shared language ................................................................ 113
3.6.2.3 Measurement of identification ..................................................................... 114
3.6.2.4 Measurement of commitment ..................................................................... 115
3.6.2.5 Measurement of information exchange ....................................................... 116
3.6.2.6 Measurement of brand awareness ............................................................... 118
3.6.2.7 Measurement of brand image ...................................................................... 119
3.6.3 Development of questionnaire .................................................................... 120
3.6.3.1 Question content .......................................................................................... 120
3.6.3.2 Question phrasing and translation ............................................................... 120
3.6.3.3 Response format ........................................................................................... 121
3.6.3.4 Question sequence ....................................................................................... 122
3.6.3.5 Question layout ............................................................................................. 122
3.6.3.6 Questionnaire pre-test and revise ................................................................ 123
3.7 Data collection procedure ...................................................................................... 124
3.8 Data analysis procedure ......................................................................................... 126
3.8.1 Data preparation .......................................................................................... 126
3.8.2 Data analysis techniques .............................................................................. 127
3.8.2.1 CFA analysis ................................................................................................... 127
3.8.2.2 Correlation and Multiple Regression Analysis .............................................. 129
3.9 Summary ................................................................................................................. 131
Chapter 4 Data Analysis and Testing of Hypotheses.......................................................... 132
viii | P a g e
4.0 Introduction ............................................................................................................ 132
4.1 Responses of participants ....................................................................................... 132
4.2 Descriptive data analysis: general characteristics of participants ......................... 133
4.2.1 Demographic data of participants ................................................................ 133
4.2.2 Non-response bias ........................................................................................ 137
4.3 Descriptive statistics of measured items ................................................................ 138
4.4 CFA Analysis ............................................................................................................ 140
4.4.1 Measurement model assessment of CFA analysis ....................................... 147
4.4.1.1 Measurement assessment regarding the structural dimension of social capital
(INTER) ....................................................................................................................... 147
4.4.1.2 Measurement assessment regarding the cognitive dimension of social capital:
Shared Language (SLAN) ........................................................................................... 149
4.4.1.3 Measurement assessment regarding the relational dimension of social capital:
Identification (IDEN) and Commitment (COMIT) ...................................................... 150
4.4.1.4 Measurement assessment regarding the communicative dimension of social
capital: Quality of Information Exchange (INFC Quality) .......................................... 154
4.4.1.5 Full measurement assessment regarding the social capital ......................... 156
4.4.1.6 Measurement assessment regarding the brand knowledge: Brand Awareness
(BKA) and Brand Image (BKI) ..................................................................................... 158
4.4.2 Validity and reliability assessment of CFA analysis ...................................... 164
4.4.2.1 Convergent validity and discriminant validity .............................................. 166
4.4.2.2 Reliability ....................................................................................................... 167
4.5 Correlation analysis ................................................................................................ 167
4.6 Multiple regression analysis ................................................................................... 169
4.7 Summary of Results ................................................................................................ 175

ix | P a g e
4.8 Summary ................................................................................................................. 178
Chapter 5 Discussion, Contribution and Implication ......................................................... 180
5.0 Introduction ............................................................................................................ 180
5.1 The assessment of full social capital measurement model in the context of an OBC
...................................................................................................................................... 180
5.2 The assessment of full brand knowledge measurement model in the context of an
OBC ............................................................................................................................... 182
5.3 Evidence of the relationship between each dimension of social capital and brand
knowledge ..................................................................................................................... 183
5.3 How social capital impacts on brand knowledge ................................................... 184
5.3.1 The effect of the structural dimension of social capital on brand knowledge
............................................................................................................................... 184
5.3.2 The effect of the cognitive dimension of social capital on brand knowledge
............................................................................................................................... 186
5.3.3 The effect of the relational dimension of social capital on brand knowledge
............................................................................................................................... 187
5.3.4 The effect of the communication dimension of social capital on brand
knowledge ............................................................................................................. 189
5.4 Theoretical contribution ......................................................................................... 190
5.4.1 OBC research ................................................................................................ 190
5.4.2 The brand knowledge concept ..................................................................... 192
5.4.3 Social capital theory ..................................................................................... 194
5.4.4 Social capital and the brand knowledge model ........................................... 197
5.5 Practical implications .............................................................................................. 199
5.5.1 Practical implications for managers from company-initiated OBCs ............ 199

x | P a g e
5.5.2 Practical implications for community leaders from consumer-initiated OBCs
............................................................................................................................... 201
5.6 Summary ................................................................................................................. 201
Chapter 6 Conclusion and Future Research........................................................................ 203
6.0 Summary of this study ............................................................................................ 203
6.1 Accomplishment of research objectives ................................................................. 205
6.2 Original theoretical contributions .......................................................................... 209
6.2.1 OBC studies ................................................................................................... 209
6.2.2 Social capital ................................................................................................. 209
6.2.3 Social Capital and Brand Knowledge Model ................................................ 210
6.2.4 Comparison of literature on OBCs between the West and China ............... 210
6.3 Practical contributions ............................................................................................ 212
6.3.1 Contribution for managers from company-initiated OBCs .......................... 212
6.3.2 Contribution to community leaders from consumer-initiated OBCs ........... 213
6.4 Limitations of this study.......................................................................................... 214
6.5 Recommendations for future research .................................................................. 216
6.6 Final thoughts ......................................................................................................... 217
References ............................................................................................................................ 219
Appendix A Analytical Statistics ........................................................................................... 240
Appendix B Survey Questionnaire (English Version) ........................................................... 302
Appendix C Survey Questionnaire (Chinese Version) .......................................................... 308
Appendix D Screenshot of Volkswagen’s Cooperated Website in China ............................ 312
Appendix E Screenshot of Xcar.com .................................................................................... 315

xi | P a g e
List of Tables
Table 2. 1 Correspondence of motives to dominant relationships in brand communities ... 27
Table 2. 2 Examples of brand knowledge measures .............................................................. 40
Table 2. 3 Difference associated with the strength of ties .................................................... 52
Table 2. 4 A summary of social capital measures .................................................................. 55
Table 2. 5 The dimensions of social capital across network types ........................................ 62
Table 2. 6 The dimensions of social capital in marketing contexts ....................................... 65
Table 2. 7 The dimensions of social capital in virtual communities ...................................... 66
Table 3. 1 Hypotheses in this study.....................................................................................102
Table 3. 2 A summary table of research methodology from previous research of social
capital ............................................................................................................................ 107
Table 3. 3 Measured items of interaction ties ..................................................................... 112
Table 3. 4 Measurement of shared language ...................................................................... 113
Table 3. 5 Measurement of identification ........................................................................... 114
Table 3. 6 Measurements of commitment .......................................................................... 115
Table 3. 7 Measurement of information exchange ............................................................. 117
Table 3. 8 Measurement of brand awareness ..................................................................... 119
Table 3. 9 Measurement of brand image ............................................................................ 119
Table 3. 10 Questionnaire content ...................................................................................... 124
Table 4. 1 Descriptive statistics of participants’ profile of category data………………………….133
Table 4. 2 Descriptive statistics of participants’ profile of category data ........................... 134
Table 4. 3 Results of non-response bias test for web-based responses .............................. 138
Table 4. 4 Descriptive statistics of measured items ............................................................ 139
Table 4. 5 Recommended fit indices for measurement model evaluation ......................... 145
Table 4. 6 The result of CFA analysis of SLAN measurement model ................................... 148
Table 4. 7 The result of CFA analysis of SLAN measurement model ................................... 149
Table 4. 8 The result of CFA analysis of IDEN measurement model .................................... 150
Table 4. 9 The result of CFA analysis of COMIT measurement model................................. 151
xii | P a g e
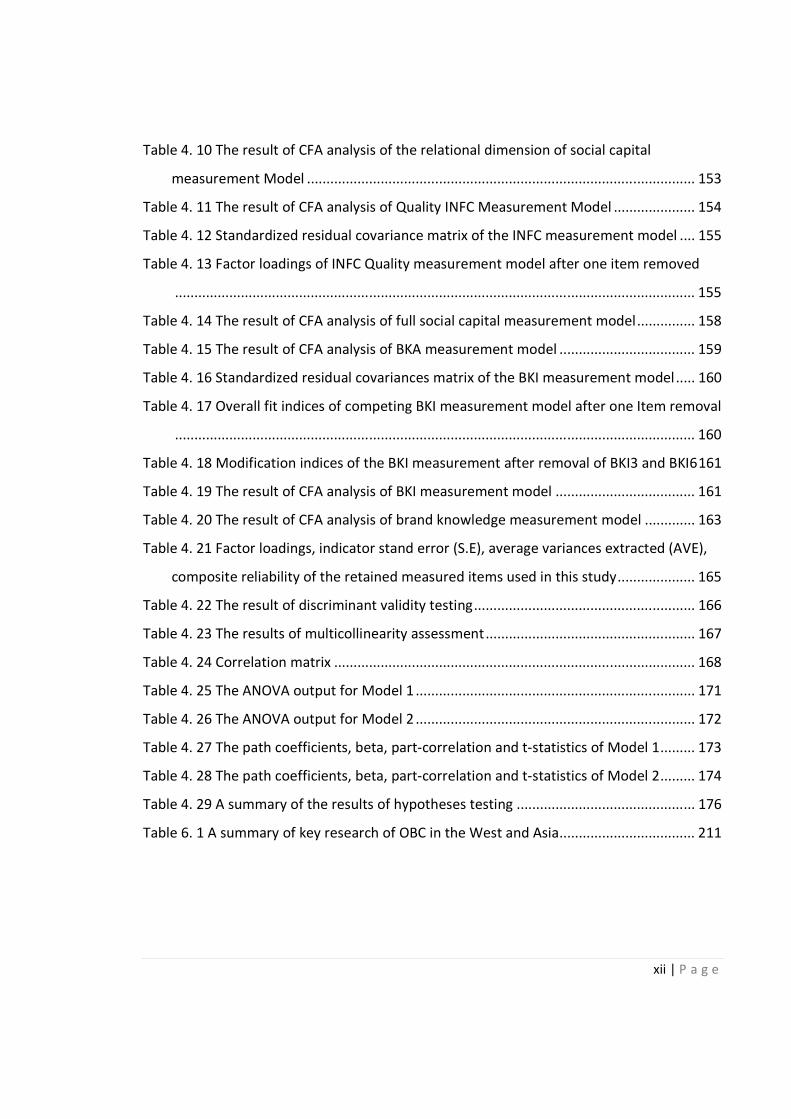
Table 4. 10 The result of CFA analysis of the relational dimension of social capital
measurement Model .................................................................................................... 153
Table 4. 11 The result of CFA analysis of Quality INFC Measurement Model ..................... 154
Table 4. 12 Standardized residual covariance matrix of the INFC measurement model .... 155
Table 4. 13 Factor loadings of INFC Quality measurement model after one item removed
...................................................................................................................................... 155
Table 4. 14 The result of CFA analysis of full social capital measurement model ............... 158
Table 4. 15 The result of CFA analysis of BKA measurement model ................................... 159
Table 4. 16 Standardized residual covariances matrix of the BKI measurement model ..... 160
Table 4. 17 Overall fit indices of competing BKI measurement model after one Item removal
...................................................................................................................................... 160
Table 4. 18 Modification indices of the BKI measurement after removal of BKI3 and BKI6 161
Table 4. 19 The result of CFA analysis of BKI measurement model .................................... 161
Table 4. 20 The result of CFA analysis of brand knowledge measurement model ............. 163
Table 4. 21 Factor loadings, indicator stand error (S.E), average variances extracted (AVE),
composite reliability of the retained measured items used in this study .................... 165
Table 4. 22 The result of discriminant validity testing ......................................................... 166
Table 4. 23 The results of multicollinearity assessment ...................................................... 167
Table 4. 24 Correlation matrix ............................................................................................. 168
Table 4. 25 The ANOVA output for Model 1 ........................................................................ 171
Table 4. 26 The ANOVA output for Model 2 ........................................................................ 172
Table 4. 27 The path coefficients, beta, part-correlation and t-statistics of Model 1 ......... 173
Table 4. 28 The path coefficients, beta, part-correlation and t-statistics of Model 2 ......... 174
Table 4. 29 A summary of the results of hypotheses testing .............................................. 176
Table 6. 1 A summary of key research of OBC in the West and Asia ................................... 211

xiii | P a g e
List of Figures
Figure 1. 1 A conceptual framework of the influence of social capital on brand knowledge . 8
Figure 2. 1 Comparison of the brand community triad and the customer centric models ... 18
Figure 2. 2 The dimensions of brand knowledge: adapted from Keller (1993) ..................... 37
Figure 2. 3 Social capital in the creation of intellectual capital ............................................. 57
Figure 2. 4 Relationship among the dimensions of social capital .......................................... 59
Figure 2. 5 Individual motivations, social capital, and knowledge contribution ................... 72
Figure 2. 6 Research model for knowledge sharing in virtual communities ......................... 74
Figure 2. 7 A conceptual model of knowledge contribution in firm-hosted online
communities ................................................................................................................... 75
Figure 3. 1 The process of deduction-based research ........................................................... 98
Figure 3. 2 The relationship between social capital and brand knowledge ........................ 101
Figure 4. 1 Frequencies of the postings ............................................................................... 135
Figure 4. 2 Frequencies of the postings after re-categorizing the data............................... 136
Figure 4. 3 The measurement model for interaction ties .................................................... 141
Figure 4. 4 The measurement model for shared language .................................................. 141
Figure 4. 5 The measurement model for identification ....................................................... 142
Figure 4. 6 The measurement model for commitment ....................................................... 142
Figure 4. 7 The measurement model for quality of information exchange ........................ 143
Figure 4. 8 The measurement model for brand awareness ................................................ 143
Figure 4. 9 The measurement model for brand image ........................................................ 144
Figure 4. 10 Standardized Estimates of INTER (Interaction Ties) Measurement Model ..... 148
Figure 4. 11 Standardized estimates of SLAN (shared language) measurement model ..... 149
Figure 4. 12 Standardized estimates of IDEN measurement model .................................... 151
Figure 4. 13 Standardized estimates of COMIT (commitment) measurement model ........ 152
Figure 4. 14 Standardized estimates of the relational dimension of social capital ............. 153
Figure 4. 15 Standardized estimates the quality of information exchange (INFC Quality)
measurement model after removal of INFC4 ............................................................... 156
xiv | P a g e
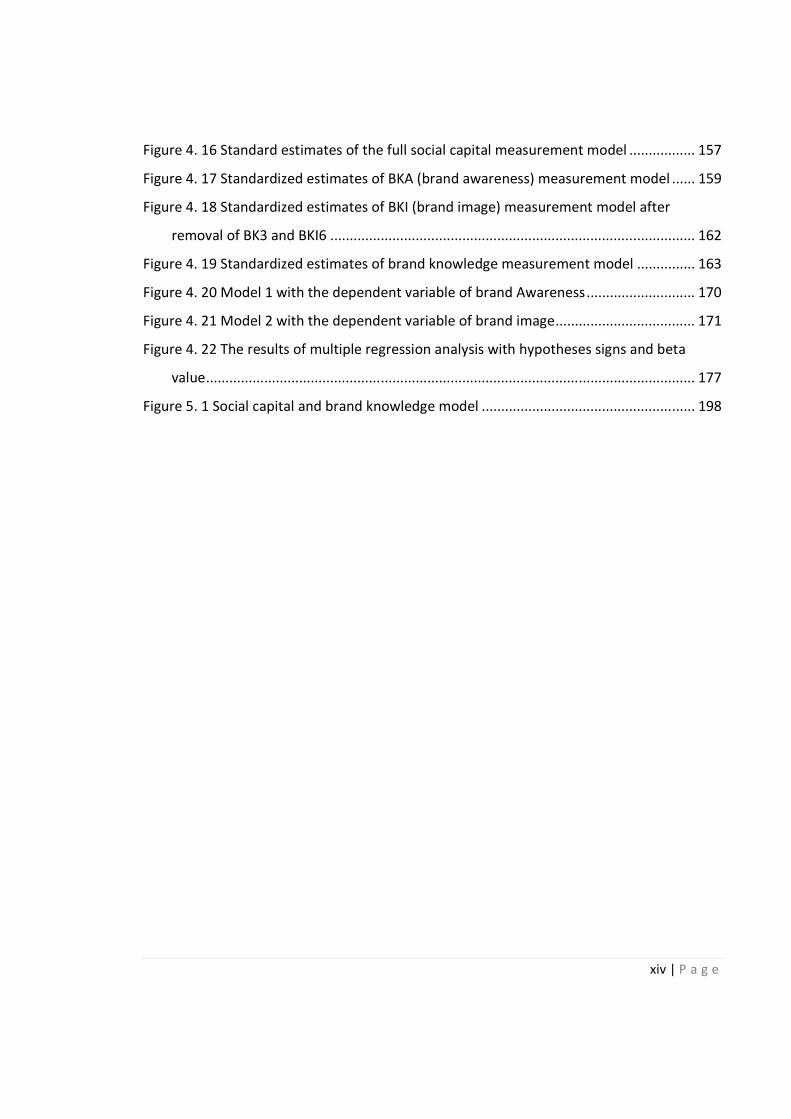
Figure 4. 16 Standard estimates of the full social capital measurement model ................. 157
Figure 4. 17 Standardized estimates of BKA (brand awareness) measurement model ...... 159
Figure 4. 18 Standardized estimates of BKI (brand image) measurement model after
removal of BK3 and BKI6 .............................................................................................. 162
Figure 4. 19 Standardized estimates of brand knowledge measurement model ............... 163
Figure 4. 20 Model 1 with the dependent variable of brand Awareness ............................ 170
Figure 4. 21 Model 2 with the dependent variable of brand image .................................... 171
Figure 4. 22 The results of multiple regression analysis with hypotheses signs and beta
value .............................................................................................................................. 177
Figure 5. 1 Social capital and brand knowledge model ....................................................... 198

1 | P a g e
Chapter 1 Introduction
1.0 Background to the research
Communities have always been of particular interest to marketers because they provide
insights into understanding consumer behaviour (Miniz and O’Guinn, 2001). Developments
in information technology and the growth of the Internet have significantly changed people’s
lives with the phenomenal growth in online virtual communities, online social networks and
online brand communities (OBCs) (Poytner, 2008; Smith, 2009). Especially in recent years,
OBCs have emerged as an interesting topic for both marketing researchers and brand
managers (Liaw and Jen, 2008; Fournier and Lee, 2009).
Why the interest in the OBC? Firstly, the widespread use of the Internet has enabled
consumers to easily access an abundance of information about a variety of products and
services. With many consumers using several online tools to share ideas and contact fellow
consumers (Pitta and Fowler, 2005; Casaló, Falavian and Guinaliu, 2010), physical
interaction is reduced in an online shopping environment. Hence the OBC can become a
powerful tool for helping companies understand consumer needs and promote brand loyalty
(Rowley, 2007; Hunt, 2009). Nowadays, consumers not only select a product for their use,
but also select the brands they recognize. This relationship between consumers and brands
can be strengthened through the OBC (Jang, Olfman, Ko, Koh, and Kim, 2008).
Casaló, Falavian and Guinaliu (2008) describe online brand communities as groups of
individuals who are voluntarily related to each other online through their interest in the same
product or brand. In other words, those who have the same preference toward a certain brand,
and who discuss, participate in, and pass on information about it, form a specific brand
community. Based upon the discussion above, the OBC is an application of the ‘community’
concept in the marketing field. It is conducted from a set of interactive social relationships
(i.e. customers have relationships with the product, the brand, the marketer, and also with
fellow consumers) (Muniz and O’Guinn, 2001; McAlexander, Schouten and Koening, 2002).
Additionally, Bagozzi and Dholakia (2006) emphasize the social aspects of consumers and
what consumers experience when forming and participating in an OBC. It can be argued that
2 | P a g e
there are three components that comprise an OBC: the brand and consumer experience,
which provides the source for the establishment of brand communities; relationships among
members gathering around the brand; and the aggregation of the community members.
However, many scholars follow Muniz and O’Guinn (2001) and McAlexander’s et al. (2002)
approach and largely consider OBCs for commercial purposes or company-initiated OBCs.
There are few studies which have focused on OBCs that are primarily established by
consumers.
In addition, the majority of empirical research into the OBC has been conducted in the U.S
and European markets, which mainly focus on vehicles and motorcycles (e.g. U.S brand
communities of Jeep and Harley Davidson, European car clubs for brands such as Ford and
Volkswagen). This is because consumers are emotionally engaged with automotive brands
and highly involved in product and product purchase (McAlexander et al., 2002;
Algesheimer, Dholakia and Herrmann, 2005).
Importantly, the antecedents and consequences of participating in online brand communities
have been frequently discussed which is helpful in understanding online consumer behaviour.
Shared content and exchange of information have been regarded as the major motivation that
drives people to participate in OBC activities and to become members (Bagozzi and
Dholakia, 2006; Casaló et al., 2008, 2010). The shared content within an OBC is about the
shared experience and knowledge of a certain product or brand, which can be regarded as the
consumers’ brand knowledge (Keller, 1993).
1.1 Need for the present study
Prior research has provided a valuable contribution into the understanding of OBCs, their
characteristics, functions and benefits (Muniz and O’Guinn, 2001; McAlexander et al., 2002;
Schau and Muniz, 2002; Amine and Sitz, 2004; Kang, 2004; Kim, Bae and Kang, 2008).
Most of the researchers apply the community approach to understand the definition and
development of OBCs. The author acknowledges that an OBC is based on a community
setting formed by a set of interactive relationships. In particular, Bagozzi and Dholakia
(2006) emphasize the social aspects that an OBC can bring to its consumers. Most
importantly, shared content and brand knowledge are regarded as the major motivations that
3 | P a g e
drive consumers to participate in OBC activities. However, some gaps in the literature still
prevail, which are explained below.
1.1.1 OBC research from a social capital perspective
There is a need to extend OBC research from a social perspective by exploring the effects of
social capital within OBCs. It is noted that prior research into OBCs applies a community
approach in order to define OBCs and understand their development. However, these prior
studies stop at this point without going further beyond the community nature of an OBC.
They fail to consider the social aspects that an OBC brings to consumers, and the social
influence among consumers that may impact upon brands and the communities. In other
words, the role of the consumers’ experiences, and the social aspect of OBCs, has not been
given enough attention in the empirical research.
From the perspective of the humanities and social sciences, social capital is seen as a major
aspect of community studies, and is embedded in relationships (Bourdieu, 1986; Coleman,
1988; Lin, 1999; Putnam, 2000). Social capital refers to “the resource embedded within,
available through and derived from the network relationship, possessed by an individual or
social unit” (Nahapiet and Ghoshal, 1998, p.243). Recently, social capital has gained
credibility and been increasingly studied in virtual communities (Blanchard and Horan, 1998;
Pigg and Crank, 2004; Bauer and Grether, 2005; Scott and Johnson, 2005). The higher the
level of social capital embedded in a community, the more frequent interaction is found
among members (Narayan and Pritchet, 1997). Therefore, OBCs with a higher level of social
capital may generate a quality of information and knowledge that allows individuals to learn
and develop expertise around a focal product or brand (Surachartkumtonkun and Patterson,
2007). However, there is a lack of research into OBCs from the social capital perspective.
Thus, this study aims to bridge these gaps in the literature by examining the impacts of social
capital on brands within OBCs, especially in consumer-initiated OBCs. As discussed earlier,
social capital theory plays an important role in understanding community relationships. It is
a multi-dimensional concept, which has been studied in a variety of disciplines. Researchers
and scholars have consistently supported its presence and benefits in both physical and
online communities. Therefore, the author believes that social capital exists in an OBC

4 | P a g e
context, which resides in the consumer-to-consumer and consumer-to-community
relationships.
Social capital is significant in bringing information benefits and social benefits to an OBC.
The direct benefit of social capital is to provide network ties which help OBC members gain
access to a broader source of information, and improve that information’s quality, relevance
and timelessness (Adler and Kwon, 2002). Also, the importance of social capital lies in the
social support, integration and cohesion it provides for OBC members.
Nahapiet and Ghoshal (1998) suggest dividing social capital into three major dimensions –
structural, relational and cognitive – in order to gain an in-depth understanding of this theory.
These dimensions are found to have great influence on knowledge sharing and creation in
virtual learning communities (Wasko and Faraj, 2005; Chiu, Hsu and Wang, 2006; Wiertz
and de Ruyter, 2007). Likewise, an OBC is seen as a typical form of virtual communities.
Consumers’ brand knowledge can be a motivation for people to join OBCs. Therefore, it can
be argued that the dimensions of social capital may exert a positive effect on brand
knowledge in an OBC. Most importantly, this study incorporates a communication
dimension as the fourth dimension of social capital from a marketing perspective. This
communication dimension is needed to facilitate the flow of information within a social
group, which is believed to influence the mobilization of social capital. Within an OBC, the
communication dimension is visible and this binds together individual consumers into a
strong social environment (Hazelton and Kennan, 2000; Widen-Wulff et al., 2008). However,
the communication dimension of social capital so far has always been considered at the
conceptual level. This study will empirically examine the effectiveness of this fourth
dimension within an OBC.
1.1.2 Brand knowledge in an OBC
There is a lack of empirical research into brand knowledge in OBCs. Within an OBC, brand
knowledge plays a significant role in motivating and encouraging consumers’ active
participation in OBC activities, which can be developed effectively through the interactive
communication among OBC members. However, the research into the role of brand
knowledge in OBCs is still lacking. The brand knowledge concept in the branding literature

5 | P a g e
represents the thoughts, feelings, perceptions, images and so on that become linked to the
brand in consumers’ minds. It captures both the aspects of interest in the brand, and
consumers’ previous experience with the brand. It is more intangible than tangible and
cannot be easily measured in terms of quality and quantity. According to the prior research
brand knowledge is measured through a variety of measures, such as, brand awareness,
brand image, brand association, etc. Therefore, there is a need to assess the brand knowledge
construct within an OBC, and to further investigate how each dimension of social capital can
have an influence on brand knowledge.
1.1.3 Empirical OBC research into consumer-initiated communities
There is also a need to extend the empirical OBC research into consumer-initiated
communities, especially those located outside the U.S. and European markets. Consumers
and consumer experience are regarded as the major components needed to form a brand
community. There has been extensive research, which has examined OBCs based on
commercial purposes or company-initiated communities, but less on the role of consumers
and social aspects of the OBC context. Therefore, it is interesting to extend empirical
research to the consumer-initiated OBCs. In addition, a large proportion of research into
OBCs has been conducted in the U.S and European markets. There is a need to direct OBC
research to a greater diversity of nationalities (Casaló et al., 2008). Therefore, this study
takes the opportunity to research consumer-initiated OBCs outside the U.S or European
markets (for example, in China).
1.2 Research objectives
The purpose of this study is to develop and extend the understanding of OBCs from a social
science perspective. It draws on social capital theory in a community sense to investigate the
differential effects of each dimension of social capital on brand knowledge from the
perspective of the consumers’ participation in OBCs, particularly within consumer-initiated
OBCs. This study firstly aims to identify the dimensions of social capital considered and
presented within OBCs, and in particular, to introduce the communication dimension as the
fourth dimension of social capital from a marketing perspective. Then, this study examines
the effect of each dimension upon brand knowledge within the communities.

6 | P a g e
The primary objective is to determine and evaluate how the dimensions of social capital
have an influence on brand knowledge within the marketing context of OBCs, which can be
reflected in four aspects as follows:
� To investigate the presence of social capital within four dimensions (i.e. the
structural, cognitive, relational and communication dimensions) in the Chinese
Volkswagen consumer-initiated OBCs
� To investigate the presence of brand knowledge within two dimensions (i.e. brand
awareness and brand image) in the Chinese Volkswagen consumer-initiated OBCs
� To investigate the relationship between each dimension of social capital and brand
knowledge in the Chinese Volkswagen consumer-initiated OBCs
� To evaluate the efficacy of each dimension of social capital, with regard to
developing effective brand knowledge in the Chinese Volkswagen consumer-
initiated OBCs
The conceptual framework and research hypotheses are developed from the above research
objectives and discussed in detail in Chapter 3.
1.3 Research approach and methods
The research aim of this study is to test empirically the relationships between each
dimension of social capital and brand knowledge in OBCs. Thus, the hypothetical-
quantitative approach is adopted for this study, which is to test hypotheses deduced from the
literature through empirical research. In this regard, the method designed for data collection
was a web-survey via the self-administered questionnaire. Targeted respondents are the
registered members who were participating in the selected thirty-five Volkswagen OBCs in
Xcar.com at the time the survey is conducted. All these selected communities are established
and maintained by consumers themselves with no company involvement. Since this study
aims to examine the context-specific relationship between social capital and brand
knowledge that has not been investigated before, all the measured indicators for the survey
are obtained and developed from previous empirical studies in similar research contexts.
7 | P a g e
After data collection, confirmatory factor analysis (CFA) is conducted to assess the
reliability and validity of the research constructs (including convergent validity and
discriminant validity). Furthermore, Correlation and Multiple Regression Analyses are
conducted to test the hypothesized relationships between each independent variable and the
dependent variable. All the results are obtained from SPSS 18.0 and AMOS 18.0.
Justifications for the research design features are discussed in detail in Chapter 3.
1.4 Main variables measured under this study
According to the research objectives of this study, one can develop a context-specific
“Social capital and Brand Knowledge Model” which represents the causal relationship
between social capital and brand knowledge within the consumer-initiated OBC (see Figure
1.1). Social capital is examined through its four dimensions: structural (interaction ties),
cognitive (shared language), relational (identification and commitment) and communication
(quality and quantity of information exchange). Brand knowledge is measured through two
major components, namely brand awareness and brand image.

8 | P a g e
Figure 1. 1 A conceptual framework of the influence of social capital on brand knowledge
Source: Author

9 | P a g e
As seen in Figure 1.1, seven main measured variables were studied and are defined and
explained as follows:
1. Interaction Ties is manifested as the structural dimension of social capital. It refers to
the extent of an individual’s interaction with others, which is the amount of time
spent together and the frequency of communication among community members in
an OBC (Chiu et al., 2006; Lu and Yang, 2011).
2. Shared Language represents the cognitive dimension of social capital, which can
facilitate and influence the conditions for the combination and exchange of resources.
For example, shared language provides a common conceptual apparatus for
participants to understand each other, and to build a common and shared vocabulary
in their communities (Nahapiet and Ghoshal, 1998).
3. Identification is one of the manifestations of the relational dimension of social capital,
which is the process whereby individuals see themselves as at one with another
person or a group of people (Chiu et al., 2006).
4. Commitment is another manifestation of the relational dimension of social capital. It
represents a duty or obligation to engage in future action, which arises from frequent
interaction (Morgan and Hunt, 1996; Wasko and Faraj, 2005; Wiertz and Ruyter,
2007).
5. Information Exchange is reflected as the communication dimension of social capital
and refers to the quality and quantity of information exchange (Lu and Yang, 2011).
6. Brand Awareness refers to the strength of the brand node in the memory, for example,
how easy it is for the consumer to remember the brand (Aaker, 1996).
7. Brand Image refers to the functional and symbolic perception about a brand as
reflected by the brand associations held in a consumer’s memory (Aaker, 1996;
Kaplan, 2007).

10 | P a g e
1.5 Organisation of thesis
The content of each chapter is briefly outlined as follows:
Chapter 2: Literature review and hypotheses development
A review of literature relevant to the four research objectives of this study is
presented in this chapter, which is further divided into four sub-sections. In order to
investigate the existence of social capital in OBCs, it is necessary to understand the
formation and development of OBCs. The first section of this chapter reviews the
development, nature, characteristics and classification of the OBC. This is aimed at
investigating where and how the OBC originated, and how it was formed.
Having reviewed the wider literature on OBCs, the next section then focuses on the
concept of brand knowledge. Brand knowledge is seen as the major reason or
motivation driving consumers to participate in OBC activities. This section firstly
reviews the concept of brand knowledge in branding literature, and then identifies it
in the OBC. It also looks at the measurement of brand knowledge and in particular
where it is different from the factual knowledge, which cannot simply be measured
by quality and quantity.
The third section reviews the literature of social capital and discusses why and how
social capital plays a part in brand community development. It begins with the
emergence and terms of social capital, which is helpful in explaining the meaning of
social capital in a community sense. It is then followed by the multiple definitions,
and measurement tools for social capital, with a specific emphasis on the dimension
of social capital. Most importantly, each dimension of social capital differs in
intensity when applied to a variety of research contexts. These dimensions are widely
accepted as measurements of the concept of social capital.
The conceptual framework and research hypotheses are derived and developed from
the literature, which is outlined in the fourth section. The author firstly discusses the
roles of social capital and brand knowledge in the OBC; they are both significant for

11 | P a g e
the development of the OBC. In particular, the author proposes the potential
relationship between the dimensions of social capital and brand knowledge.
Chapter 3: Research methodology
This chapter details the research process of web-survey design, which includes
decisions about the measurement of variables, target respondents and the
questionnaire development. The data collection process and the justification for the
chosen statistical methods used for data analysis are also discussed and it concludes
with a summary of the chapter.
Chapter 4: Data analysis and testing of hypotheses
The preliminary analysis of the collected data uses descriptive statistics, such as
frequencies, percentages, and means. Then, an assessment of the constructs’
reliability and validity is presented. This is followed by the results of hypotheses
testing via Multiple Regression analysis. Finally, this chapter summarizes the key
results from this empirical study, ending with a summary of Chapter 4.
Chapter 5: Discussions, contributions and implications
This chapter synthesises and discusses the major findings from Chapter 4, including
the evidence of the presence of social capital and brand knowledge in an OBC
context, the evidence of the relationship between social capital and brand knowledge,
and the differential effects of each dimension of social capital on brand knowledge.
According to these findings, this study highlights theoretical contributions in the
relevance of OBC research, the brand knowledge concept and social capital theory,
and is followed by some practical implications for marketers and community leaders.
The chapter ends with a summary of these findings.
Chapter 6: Conclusion
This chapter summarizes the research and outlines the achievements of this study by
showing how the research objectives are accomplished. This study uses social capital
theory to develop our understanding of the interactive relationship among consumers,
12 | P a g e
and to investigate its effects upon brand knowledge. The findings from this study
reveal the marketing potential of social capital within OBCs in that its three
dimensions have positive impacts on brand knowledge in terms of brand awareness
and brand image. These findings suggest that marketers, managers and community
leaders should take notes to the contribution of social capital towards the
development and sustainability of OBCs. Further, this chapter identifies some
limitations in this study and makes recommendations for future research. The chapter
concludes with a final thought concerning the contribution of social capital and OBC
research. Social capital brings both information and social benefits towards the
community, most importantly through its three dimensions (the cognitive, relational
and communication dimensions), which are found to have positive effects upon
brand knowledge through the consumers’ participation in OBC activities.

13 | P a g e
Chapter 2 Literature Review and Hypotheses Development
2.0 Introduction
This chapter presents a comprehensive review of the relevant literature on online brand
communities, brand knowledge and social capital, which is divided into four main sections
as follows:
� Section 1: This section reviews the development, nature, characteristics and
classification of OBCs, and investigates how an OBC it is formed and developed.
� Section 2: Having reviewed the wider literature on OBCs, section 2 focuses on the
concept of brand knowledge. Brand knowledge is seen as the major reason or
motivation driving consumers to participate in OBC activities. This section firstly
reviews the concept of brand knowledge in the brand literature and in OBCs. This
section looks at the measurement of brand knowledge.
� Section 3: The third section reviews social capital literature and discusses the
importance of social capital in brand community development. It begins with the
emergence and terms of social capital, which is helpful in explaining the meaning of
social capital in a community sense, followed by the multiple definitions,
measurement tools for social capital, as well as a specific emphasis on the dimension
of social capital. Most importantly, each dimension of social capital is found to work
differently in intensity when applied to a variety of research contexts. Thus the
dimensions of social capital considered will be identified when present within an
OBC.
� Section 4: This section outlines how the conceptual framework and research
hypotheses are derived and developed from the literature. The author firstly discusses
the roles of social capital and brand knowledge in OBCs; both are significant for the
development of OBCs. In particular, the author proposes the potential relationship
between the dimensions of social capital and brand knowledge.

14 | P a g e
2.1 Online Brand Communities (OBCs)
This study focuses on OBCs. The following subsections examine approaches to, and the
development and definitions of communities. First, traditional communities are introduced
which are based on shared geography. Second, brand communities are reviewed. These are
communities built upon consumers’ shared attributes through brands or consumption
activities (McAlexander et al., 2002). Third, online communities are defined emphasizing
the role of the Internet in creating communities. Following this, OBCs are examined through
their definitions, unique characteristics and classifications. Most importantly, this study
reviews a number of empirical studies of OBCs and reveals that consumers’ participation is
crucial for the development and sustainability of an OBC.
2.1.1 What is a community?
The word ‘community’ comes from two Latin derivations, the tri-syllabic comunete (Oxford
English Dictionary, 2000) which means “common fellowship, society” the 4-syllabic
co(m)munité, meaning fellowship, community of relations or feelings. This term is used
within various disciplines such as geographic units, sociology and interactive connections
(Kang, 2004). The traditional definition of a community is derived from a geographically
circumscribed entity, such as neighbourhoods, villages etc. (Cohen, 1985).
For the community phenomenon, a multiplicity of definitions existed which are discussed in
a variety of research areas (Wiegandt, 2009). Fernback (1999) proposes three distinctive
community characteristics that the majority of definitions focus on:
i. The community as a place: an interactive relationship is generated within an area.
ii. The community as a symbol: an aggregation formed by significances, values,
standards and customs; a common understanding of a shared identity.
iii. The community as a virtual entity: with emphasis on the fact that a community exists
with the same conditions, including history, culture, habit or customs, but may just
be in people’s imagination.

15 | P a g e
Considering these characteristics, a community in general can be defined as: “a network is
social relation marked by mutuality and emotional bonds” (Bender, 1978, p.145). A
community was originally a dense network linking people with shared value and a trusted
personal contact (Wiegandt, 2009, p.1). Nowadays, it is the essence of every organisation
and society, which is developed as a social organisation of people who share knowledge,
values, interests and needs (Jonassen et al., 1999; Liaw and Jen, 2008). von Loewenfeld
(2006) has developed a classification scheme of communities based on two dimensions. The
first dimension is the “type of primary commonness” which refers to the basis of community
membership. Communities are distinguished by the following three attributes:
� Common origin such as geographic closeness
� Common characteristics such as age, income, education, profession etc.
� Common interests such as consumption, brand etc.
The second dimension is “focus of the community”:
� Focus on values such as religious, family or rural community
� Focus on needs such as community of transactions, community of professions or
functions etc.
� Focus on values and needs such as hyper-community, community of relations and
brand community.
Nowadays the community attracts broad target groups and focuses on shared interests. In
particular, from a marketing perspective, brands often constitute shared interests, as people
derive much of their personality from brands and are highly emotionally attached to brands
(Wiegandt, 2009).
16 | P a g e
2.1.2 What is a brand community?
Brand community is defined as:
“a specialized, non-geographically bound community, based on a structured
set of social relationships among admirers of a brand” (Muniz and O’Guinn,
2001, p. 412).
The important point here is that specialized means that a brand community is more
specifically oriented and non-geographically bound, as its members are not compelled to be
located in the same physical area; and brand communities gather customers attached to a
brand (Amine and Sitz, 2004). In short, a brand community is a set of individuals who are
voluntarily related to each other by their interest in the same product or brand (Casaló et al.,
2008). This definition has been widely accepted by many researchers (e.g. McAlexander,
Kim and Roberts, 2003; Anderson, 2005; Algesheimer et al., 2005; Bagozzi and Dholakia,
2006).
However, Amine and Sitz (2004) argue that Muniz and O’Guinn’s definition lacks clarity on
the content of a community and the basis for membership. Therefore, they propose another
definition of brand community as:
“a congregation of customers with self-selection, non-geographic
relationship and with hierarchy, the members of which have common
standards, values and social statements, there are connections among
members and communities and with a very strong cohesion toward the
specific brand they are involved in” (Amine and Sitz, 2004, p.3).
This definition is valuable by emphasizing the “membership feeling” that exists on both
individual and collective levels that consumers may believe and trust the community or other
community members more than the commercial advertisements (Amine and Sitz, 2004).
Furthermore, Muniz and O’Guinn (2001) identify three distinctive characteristics of brand
communities:
17 | P a g e
� Consciousness of kind is made up of the intrinsic connection that members feel
toward one another, and the collective sense of difference from others who are not in
the community. This indicates that members within brand communities may be
affected by the brand and this would cause them to be linked with each other.
� Shared rituals and traditions represent the social processes carried out by members
to transmit and reproduce the community meaning, which are normally centred on
shared experiences of the brand in a brand community.
� A sense of moral responsibility reflects the moral commitment among members. It
can be described as feeling a sense of duty or obligation to the community and its
individual members. This is a very important component for brand communities as it
forces on members shared information as a brand-related resource.
With regard to these specific characteristics, there are three central relationships which exist
in a brand community: the “consumers to brand” relationship, the “consumers to consumers”
relationship and the “consumers to the community” relationship (Muniz and O’Guinn, 2001;
Schau and Muniz, 2002). The study by Muniz and O’Guinn points out that a member of a
brand community has important and strong connections to both the brand and other
community members, because they share similar interests, values, thoughts and views of the
specific brand (Woratschek and Popp, 2010). In particular, this customer-customer-brand
triad model indicates the significance of social relationships among members.
On the other hand, McAlexander et al., (2002) point out that Muniz and O’Guinn’s model
fails to consider the dominant role of consumers within the brand communities and portrays
brand communities as customer-centric. McAlexander et al., (2002) acknowledges that
consumers are central to the brand communities; their experience plays a significant role in
forming and enhancing relationships not only between consumers and brands but also
between consumers and products, consumers and firms and amongst consumers themselves.
In other words, McAlexander et al. (2002) extend the model suggesting that brand
community intensity is made up of four relations between the customer and other fellow
members, the brand, the product and employees of the company (Wiegandt, 2009). Figure

18 | P a g e
2.1 compares the difference between the brand community triad model and the customer
centric model.
Figure 2. 1 Comparison of the brand community triad and the customer centric models
Brand Community Triad Model Customer Centric Model
Source: Wiegandt, 2009, p.19
There is another difference between the study of Muniz and O’Guinn (2001) and that of
McAlexander et al. (2002). Muniz and O’Guinn explicitly highlight the fact that a brand
community is commercially-based as it is formed around brands, but they did not focus on
any non-commercial brand community or company-initiated brand communities. In contrast,
the study by McAlexander et al. provides a valuable insight in that a brand community can
be formed or hosted by companies or by brand owners. Thereby these two implications of
brand communities are used as the criteria to distinguish the types of OBCs in section 2.1.4.
Like the approach of McAlexander et al., Bagozzi and Dholakia (2006) also consider the
role of consumer and consumers’ experiences played in brand communities. They take a
socio-centric approach to brand communities and re-describe brand communities as small
group communities that are friendly groups of consumers with shared enthusiasm for a brand
and a well developed social identity.
Based upon the discussion, Muniz and O’Guinn envision a brand community as based on a
customer-brand-customer triad, which emphasizes the commercial purposes of brand
communities. McAlexander et al. extend and broaden this conceptualization by adding the
relationship with the products and marketing institutions to the customer and portrayed
brand communities as consumer-centric. Further, Bagozzi and Dholakia (2006) employ the
Customer Customer
Customer
Brand Product
Company Customer
Brand

19 | P a g e
approach of McAlexander et al. by emphasizing the reason that consumers join brand
communities, is not only to look for brand-related activities but also to look for social
activities. Accordingly, it can be argued that there are four components comprising an OBC,
the brand and consumer experience which provides the source for the establishment of brand
communities; relationships among members gathering around the brand; and the aggregation
of the community members (Oh and Kim, 2004). Most importantly, these components
confirm that a brand community is based on a community setting, as a community is
originally a network of social relationships linking people with shared values and emotional
bonds. In essence, a brand community is a group of people who have shared interests in the
same brand or product.
Moreover, Muniz and O’Guinn (2001, p.426) and McAlexander et al. (2002, p.51) stress a
number of benefits and competitive advantages of brand communities, which are
summarized below:
� Brand communities increase the influence of consumers in brand shaping
� Brand communities represent an important information resource about the brand for
consumers
� Brand communities provide wider social benefits to their members through
interaction with other community members
� The appearance of members as brand missionaries through positive word-of-mouth
� A strong market for licensing products and brand extensions
� Members’ willingness to make long-term investment in stocks of the specific brand
� Members’ high emotional connection to the brand.
Therefore, brand communities provide a number of benefits for marketers: they produce an
excellent marketing tool by connecting the brand site and the social aptitude of community
participants (Jang et al., 2008); brand communities may help to identify the needs and
desires of consumers (Kozinets, 2002). As the relationship is established among community

20 | P a g e
members social influence can affect other consumers’ behaviour (Muniz and O’Guinn,
2001), such as, repurchase of same products, brand choice and brand loyalty (Koh and Kim,
2004). In particular, Lichtenberg (2006) finds that it is possible to increase consumers’
emotional ties with brands by fostering interactive communities. For marketers, consumers’
active participation and advocacy can influence brand equity in a positive way (Almquist
and Robert, 2000).
A brand community in a marketing context is a new emerging type of community where the
shared identity of members is derived from the members’ commonalities regarding a specific
brand (Woratschek and Popp, 2010). Within a brand community, members possess a fairly
well developed understanding of their feelings and perceptions toward the brand, and their
connections to other users. In addition, Muniz and O’Guinn (2001) illustrate and discuss
three important elements for the formation of traditional offline communities and virtual
communities: an intrinsic connection such as that members feel different from others not in
the community; the presence of shared rituals and traditions that perpetuate the community’s
history, culture, and consciousness; and a sense of moral responsibility, duty or obligation to
other community members and the community itself (Jang et al., 2008).
2.1.3 What is a virtual community?
Since the development of the Internet, the concept of ’community’ no longer has
geographical limitations, as people can now gather virtually in an online community and
share common interests regardless of physical location. Gradually, the growth of the World
Wide Web interface provides potential for the widespread use of virtual communities on a
commercial basis (Koh, Kim, Butler and Bock, 2007). Therefore, a review of virtual
communities is important to this study as the research focuses on brand communities in an
online context.
A virtual community is defined by Rheingold (1993, p.57) as “a social aggregation that
emerges from the net when enough people carry on those public discussions long enough,
with sufficient human feeling, to form webs of personal relationships in cyberspace”.
Likewise, Ridings, Gefen and Arinze (2002) describe a virtual community as a group of
21 | P a g e
people with common interests that interact regularly in an organised way over the Internet.
In addition, Plant (2004, p.54) proposes that virtual communities are
“a collective group of entities, individual organisations that come together
either temporarily or permanently through an electronic medium to interact
in a common problem or interest space”.
These definitions emphasize the nature of online communities in aggregating people in an
online interactive context. In this instance, people can satisfy their four basic needs: interests,
social relationships, fantasies and transactions (Hagel and Armstrong, 1997). Within a
marketing context, these four elements are used to categorize the typologies of online
communities (Armstrong and Hagel, 1996; Szmigin et al., 2004). First, communities of
transactions facilitate the buying and selling process and deliver information related to this
process (i.e. eBay). Second, communities of interests involve a higher degree of inter-
personal communication as participants interact intensively with each other on specific
topics. Third, communities of fantasies allow participants to create new stories, personalities
or a whole new environment. Fourth, communities of relationships give participants the
opportunity to share certain life experiences to build up significant and interactive
relationships among themselves (i.e. Facebook and Twitter). On the other hand, Plant (2004)
suggests that virtual communities exist for both profit organisations (i.e. communities of
practice), and for non-commercial ones where individuals establish their own communities
of interests (i.e. consumer communities).
Furthermore, the difference between virtual and offline communities is that with the virtual
community, the motivation for the online grouping is generated from the information
accumulated by that community (Algesheimer et al., 2005). The attraction of shared content
is the reason that drives people to participate in a virtual community and become members.
The more members the community has, the more interactions occur, which in turn results in
the richness of the shared content within the community (Liaw and Jen, 2008).
In recent years, in light of the importance of branding, marketers has become especially
interested in the influence of virtual communities on brand management (Bauer and Grether,

22 | P a g e
2005; Woratschek and Popp, 2010). Firstly, they are interested in the development of
extensive consumer-to-consumer relationships facilitated by social network websites (i.e.,
Facebook, MySpace etc); and secondly, the emergence of the customer experience as a
hedonistic, holistic integrator of interpersonal and brand relationships (i.e. online brand
communities) (Palmer and Koenig-Lewis, 2009).
In summary, due to the development and growth of the Internet, communities have been
enabled to develop online without relying on shared geographical space. The phenomenon of
the brand community is also found in online environments (Jeppesen and Frederiksen, 2006;
Stokburger-Sauer, 2010). This is consistent with the development of the virtual community.
Within marketing an OBC represents a typical form of online virtual community (Palmer
and Koenig, 2009). A detailed review of OBCs is presented in the following section.
2.1.4 What is an OBC?
As mentioned in section 2.1.2, Muniz and O’Guinn (2001) were the first to introduce brand
communities to the marketing literature and define the brand community as a set of
individuals who voluntarily relate to each other for their interests in a brand. Consequently,
in an OBC, these relationships are carried out through the Internet (Casaló et al., 2010). By
integrating these definitions from virtual communities and offline brand communities, the
OBC is proposed by Fill (2009) as:
“a group of individuals who interact online in order to share their interests in
a brand or product” (Fill, 2009, p.376).
There is not much difference in essence and content between OBCs and offline brand
communities (Wellman, Salaff, Dimitrova, Gaton, Gulia and Haythornwaite, 1996; Muniz
and O’Guinn, 2001). Within an OBC, consumers or members usually discuss the knowledge
of a product, its functionalities or share their experience with the brand (Füller, Matzler and
Hoppe, 2008). Meanwhile, an OBC can help enterprises to obtain feedback from customers
and understand different customers’ demands, which in turn helps to establish and foster the
customer-brand relationship.

23 | P a g e
Unique characteristics of OBCs
Despite the three distinctive characteristics of brand communities (consciousness of kind,
rituals and traditions, and sense of moral responsibility), OBCs also have some unique
characteristics, such as anonymity, operating cross time and space, and widespread
information transmission. Online members do not meet regularly face-to-face, since the
existence of an online brand community is directly based on postings and other members’
responses. More specifically, the speed and frequency of response when an individual posts
a message can be considered a key element of communication in the community since they
create conversations (Ridings et al., 2002). Also, Jang et al. (2008) address four other major
characteristics of OBCs: quality of information, quality of system, interaction and reward for
activities. Quality of information means the excellence, richness and high credibility of
information provided through an OBC; Quality of system stands for the speedy and
convenient search for information in the community (Kozinet, 1999); Interaction refers to
the degree of information exchange among OBC members (McWilliam, 2000); Reward
activities are regarded as the degree of monetary or psychological rewards for proactive
OBC members (Sheth and Atual, 1995). These specific characteristics are found to be
important motivations when they participate in OBC activities (Jang et al., 2008; Casalo et
al., 2008).
Classification of OBCs
There are several classifications of online brand communities, but by and large they can be
categorized according to their different hosts and forms. Yoo and Jung (2004) distinguish
OBCs as having three forms. First, marketers can provide a gathering place for community
members as a service. They often lead and support community activities of core consumers
in a move to raise consumers’ brand loyalty. Second, consumers can spontaneously form
communities in order to share their common interests and brand-related experiences with
other like-minded people. In the process of interacting with marketers, passive consumers in
the communities can become active ones who deliver their experiences and demands to
makers. Third, consumers can form communities led by core consumers. These kinds of
communities are run from the perspectives of the core consumers, and the relationships

24 | P a g e
among brand, marketers and other consumers are configured according to the core
consumers’ perspectives.
On the other hand, Kim et al. (2008) classify OBCs into two categories: consumer-initiated
and company-initiated. Consumer-initiated communities are voluntarily established by their
members, members’ activities centred on their expression of experience and attachment to
brands or products; Company-initiated communities are built or sponsored by the brand
owner in order to establish relationships with customers and obtain product feedback from
them (Kang, 2004). The current study only focuses on one type of OBCs, which is the
consumer-initiated OBC.
Research into OBCs
In addition, OBCs have wider practical implications than the offline brand communities. The
literature on brand community traditionally focuses on niche or luxury brands or high
technology products, such as cars, motorcycles and computers (McAlexander et al., 2002).
In particular, there are a number of in-depth studies into the vehicle and motorcycle industry
which because consumers are emotionally engaged with automotive brands and highly
involved in products and product purchase (Algesheimer et al., 2005). For example,
McAlexander et al., (2002) investigated the brand communities of Jeep and Harley Davidson
to provide a broader view of OBCs. Algesheimer et al., (2005) focus on European car clubs
for car brands such as Ford and Volkswagen. Recently, some research has taken the concept
into a wider range of industries, as marketers and scholars both believe an OBC can be a
better tool when a product is digital, network-based, modular, convergent and innovative
(Kim et al., 2008). For example, Cova and Pace (2006) conducted a study on a convenience
product – the Nutella online brand community – by looking at consumers’ empowerment
within the OBC, in order to identify community differences between niche luxury products
and food convenience products. Its importance lies in the fact that the practical implications
of OBCs are not only for emotional brands and cult brands but also extend into the field of
mass-market convenience products. Despite this, OBCs have been documented for some
products including television series, movies and personal digital assistants (Thompson and
Sinha, 2008). Indeed, different products categories or industries may affect OBC activities

25 | P a g e
and the results of research (Kim et al., 2008). This indicates that the present studies should
focus on specific brands and industries to increase the validity and reliability of the research.
Consumers’ participation in OBCs
OBCs have been investigated from a marketing standpoint (Bagozzi and Dholakia, 2006;
Kim et al., 2008). In particular, members’ participation in an OBC is seen as one of the most
important factors for the development and sustainability of brand communities, which are
crucial elements in guaranteeing the community’s survival in the long term (Koh and Kim,
2004). An individual’s participation in OBCs gives them an opportunity to share information,
knowledge and experience, which helps to develop and maintain consciousness of kind and
group cohesion (Casaló, Falavian and Guinaliu et al., 2007). Also, Algesheimer et al. (2005)
find that the active participation may promote members’ identification with the community
and, in turn, increase the value of the OBC. Thus, the motivations and outcomes of
consumers’ participation in OBCs have been frequently discussed in the literature, which is
helpful for companies to understand the behaviour of community members (Kozinets, 2002;
Sung and Lim, 2002; Bagozzi and Dholakia, 2006). For these reasons, this section reviews
some recent studies and empirical research about consumers’ participation in OBCs.
Sung and Lim (2002) illustrate six groups of activities of OBC members by observing their
posting messages from 12 car brand communities: attachment to the brands; buying, selling
and exchanging of products; exchanging information; social contacts and relationships;
investigating customers’ interests and rights; and service to society. From these activities, it
is possible to understand the reasons or motivations of customers’ participation in OBCs.
i. Customers take part in discussions with fellow customers about their attachment to
the brands or products through community activities. During the process, they show
tendencies to dismiss flaws of the brand, or to exaggerate trivial strengths; sometimes
they talk negatively about the brand (Sohn, 2005).
ii. The exchange of information is the major reason for consumers joining OBCs, as the
formation of an OBC is based on the existence of shared information or knowledge
related to the brand of interest. This information sharing can be classified as
26 | P a g e
information-seeking and information-giving activities. Most importantly, consumers
tend to believe that the information provided by the OBC is reliable and abundant.
iii. Within these communities, members may not only exchange information, but they
might also develop friendships on the basis of their common interest or passion (de
Valck, Bruggen and Wierenga, 2009). Therefore, extending personal relationships
becomes another reason for a consumer’s participation in an OBC.
iv. Consumers obtain economic benefits through buying, selling or exchanging products,
because the members trust other members in the same community more than other
sources on the Internet.
v. Customers seek to protect their consumer rights against marketers through online
discussion. Finally, some active participants volunteer to provide information and
help for people. Through online discussion, these individuals might inform and
influence fellow customers about products, brands or organisations (Kozinets, 2002).
Similar to the research findings of Sung and Lim (2002), Ouwersloot and Odekerken-
Schroder (2008, p.574) also suggest some reasons motivating customers to participate in an
OBC based on the online consumer behaviour literature:
i. Consumers participate in an OBC because of their need for quality assurance. Quality
assurance is proposed as one type of product or brand information consumers would
like to seek and search within OBCs (Nelson, 1970).
ii. Consumers participate in an OBC to express their involvement with the branded
product category. Ouwersloot and Odekerken-Schroder (2008) further suggest the
OBC helps consumers to share their experiences of high-involvement products (i.e.
car, computers), as the high-involvement product categories typically are those,
which consumers want to feel connected with. Thus consumers search extensively
for those products and feel a strong need to share their consumption experience in
retrospect with others (Arnould et al., 2002).

27 | P a g e
iii. Consumers participate in an OBC for the opportunity of joint consumption. Notably,
this is consistent with the viewpoint of Sung and Lim (2002) as consumers want to
obtain some economic benefits through collective purchasing.
iv. Consumers participate in an OBC because they want to live up to the brand’s
symbolic function. This indicates that some consumers may have strong emotional
association with a specific brand (Aaker, 1996), such as Nike or Apple, which has
reached an iconic status. For these brands with important symbolic meanings, the
brand owners usually conduct their own brand communities by strengthening the
meanings of their brand and offering a place for consumers to express their devotion
to the brand.
These motives and objectives to join an OBC may lead to different aspects of community
life (Ouwersloot and Odekerken-Schroder, 2008). Integrating the study of Ouwerloot and
Odekerken-Schroder (2008) with McAlexander et al. (2002), Table 2.1 demonstrates a
strong correspondence between customer motives and the types of relationship within an
OBC.
Table 2. 1 Correspondence of motives to dominant relationships in brand communities
Motive Dominant relationship
Assurance for credence good Customer-company relationship
High involvement in product category Customer-product relationship
Joint consumption Customer-customer relationship
Brand symbol Customer-brand relationship
Source: Ouwersloot and Odekerken-Schroder (2008), p. 575
As shown in Table 2.1, when consumers participate in an OBC looking for the possibility of
joint-consumption, they are more likely to emphasize the inter-related relationships with
other members. Whereas those who see an OBC as a brand symbol, feel more interested in
the relationship with the brand or the company. Finally, when a consumer’s main objectives
are focused on the quality assurance of a product, they will most likely be concerned with
their relationship with the product. In this respect, an individual’s active participation in
OBCs can strengthen the four dominant relationships that are summarized in Table 2.1.
28 | P a g e
Both Sung & Lim (2002) and Ouwersloot & Odekerken-Schroder (2008) have investigated a
number of factors influencing or motivating consumers’ active participation in an OBC. It is
evident that consumers participate in an OBC because they have strong emotional
attachments to the specific brand. More importantly, the two studies emphasize that giving
and seeking information on a brand or product is the major reason why people participate in
OBCs.
In contrast, Casaló et al. (2008) did not directly identify the factors influencing consumers’
active participation; instead, they investigate four antecedent variables – propensity to trust,
satisfaction, familiarity and communication – which positively influence consumers’
intention to participate in an OBC:
i. Propensity to trust is defined as an individual’s willingness to trust in other members.
Generally, trust is associated with the achievement of a long lasting and profitable
relationship. In the OBC context, the importance of trust is even greater. Due to the
OBCs lack of face-to-face contact, consumers find it difficult to have all the
information about other community members at the beginning of the relationship
with the OBC (Ridings et al., 2002). Accordingly, an individual consumer with a
higher level of propensity to trust is more likely to participate in OBCs.
ii. Satisfaction within an OBC is considered as a global evaluation or attitude made by
the individual consumer about the behaviour of participating in the OBC. This results
from the interactions produced by both parties in the relationship, which concentrates
on the psychological perspective of satisfaction (Casaló et al., 2008, p.24).
Consumers are motivated to interact with other community members when their
satisfactions are met.
iii. Consumers’ familiarity has been traditionally defined as the consumers experience
with a given product and it reflects direct and indirect knowledge available to the
individual. Within an OBC, if consumers were familiar with the activities carried out
in the community, the particular language and tools used in the community, the result
29 | P a g e
would be that their relationship with fellow members and with the community itself
would be enhanced (Kozinets, 2002).
iv. Communication in general refers to a human activity that joins people together and
generates relationships (Anderson and Narus, 1990). In an OBC, effective
communication is directly based on the members’ valuable responses, and then the
consumers are motivated to participate in the community (Casaló et al., 2010, p.30).
Casaló et al. did not distinctively identify the shared product or brand information as the
major reason for consumers joining OBCs, they revealed the importance of a consumers’
contribution towards OBCs, because effective communication is based on the exchange of
shared information. On a more practical level, many OBC members exchange and share their
experience regarding the maintenance, repair, adoption or even basic usage of the product
(Schau and Muniz, 2002).
Further, Casaló et al. analyze the effect of consumers’ participation in an OBC and define
three possible outcomes: consumer trust, loyalty to the brand and affective commitment to
the brand. Casaló et al. (2007) find that active consumer participation has a positive and
important effect on both a consumer’s trust and brand loyalty by looking at the research in
the context of a company-initiated OBC. This can be explained by the development of a
consumer’s emotional ties with the brand and interaction with fellow community members.
In addition, according to the studies of traditional offline brand communities, both Muniz
and O’Guinn (2001) and McAlexander et al. (2003) believe that brand communities are
related to building customer loyalty.
Then, in a later study by Casaló et al. (2010) consider that commitment could be another
significant and valuable outcome of an individuals’ participation in OBCs. Commitment is
seen as an important element contributing to the customer-brand relationship, which may
influence buyer behaviour (Morgan and Hunt, 1994). It has been defined in marketing
literature as “an enduring desire to maintain a valuable relationship” and “a tendency to
resist change” (Jang et al., 2008, p.61). However, the concept of commitment is complex,
which can usually be distinguished as calculative commitment and affective commitment.

30 | P a g e
Calculative commitment is more rational and economics-based, which relies on the product
benefits due to a lack of choice and switching costs. In contrast, affective commitment is
developed through the personal involvement that consumers have with the brand, which is
closer and more emotional (Gustafsson, Johnson and Roos, 2005, p.211). More specifically
in the context of OBCs, Casaló et al. only consider affective commitment since it determines
consumers’ desires to develop long-term relationships with the brand (Roberts, Varki and
Brodie, 2003). Affective commitment is found to develop through time, because of the fact
that OBC members get used to positive and effective emotional responses, and accordingly
their relationship with the brand is made more secure (Casaló’s et al., 2008).
Jang et al. (2008) support the research findings from Casaló et al., that brand loyalty and
commitment can be enhanced through an OBC. However, there are some differences
between the studies by Casaló et al. and Jang et al. Firstly, the concept of commitment is
focused at the community level in the Jang et al. study. In light of the multiple aspects of the
commitment concept, community commitment in the Jang et al. study is treated as an
individual OBC member’s attitude towards the community. It can be explained as a factor
influencing members’ attitudes as to whether they want to continue the relationship with
their OBC. Secondly, Jang et al. argue that commitment and brand equity are affected not
only by a consumer’s participation in OBC activities, but also by the unique OBC
characteristics and different typologies of OBCs. For example, in a consumer-initiated OBC,
members are more likely to have strong commitment to the community, as the consumer-
generated information and experience are more reliable and trustworthy, thereby establishing
a persistent brand loyalty.
As outlined in section 2.4.1, four major OBC characteristics are examined in the empirical
study by Jang et al.: quality of information, quality of system, interaction and reward for
activities. However, the results suggest that only two characteristics (interaction and reward
activities) have a significant impact on community commitment. There is no direct effect of
types of OBCs on community commitment. Further, Jang et al. make an effort to determine
a moderating effect of community types on the relationship between the other two OBC
characteristics and community commitment. Members from consumer-initiated OBCs

31 | P a g e
considered both quality of information and system as more important in enhancing
commitment than did members from a firm-initiated OBC. This is because consumer-
initiated OBCs are mainly based on consumers’ voluntary participation, which greatly
affects the quality of shared information and usefulness of the OBC website (Jang et al.,
2008, p.74). It is consistent with prior studies that brand loyalty is affected by community
commitment through both consumer-initiated and firm-initiated OBCs. This result indicates
the necessity and significance of commitment in enhancing the brand value and company
value.
The studies by Casaló et al. and Jang et al. both appear to confirm the argument of
Ouwersloot and Odekerken-Schroder (2008) that consumers’ active participation can
strengthen the four dominant relationships within OBCs. For example, brand loyalty and
brand commitment are enhanced through developing the consumer-brand relationship; the
company value represents strong relationships between consumers and the company and its
products.
Furthermore, Andersen (2005) states that consumers’ participation can help new products or
service development through the valuable comments and suggestions made by the
community members. Füller et al. (2008) also claim that innovation activities and
suggestions for product improvements can be found in many brand communities.
Accordingly, the study of Kim et al. (2008) focuses on how an OBC is utilized throughout
the new product development (NPD) process, by promoting communication between firms
and its OBC members. The NPD process can be divided as the “need” information (what the
consumer wants) which resides in the consumers’ minds, and the “solution” information
(how to satisfy these needs) lies with the firms or manufacturers (Thomke and von Hippel,
2002). The linking process between consumers and firms can be very expensive and time
consuming (Kim et al., 2008). Brand community members are passionate about the brand
and their experience with the products or services and they usually have extensive product
knowledge and engage in product-related discussion. Therefore, the members of brand
communities are considered as valuable innovation resources (McAlexander et al., 2002;
32 | P a g e
Füller et al., 2008). Brand communities influence consumers’ perceptions and attitudes and
increase their knowledge of the brand and product (Muniz and Schau, 2005).
Kim et al. (2008) used an in-depth multiple case studies to look at the level of members’
involvement in the NPD process based on consumers’ participation in OBCs. Firstly, the
empirical results found that the firm’s attitude towards customers’ resource innovation and
willingness to activate or promote their OBCs strongly relies on the degree of members’
involvement in the communities. The higher the level of members’ involvement in OBCs,
the greater the communication flow and information circulation that happens between the
firm and consumers (Kim et al., 2008). Accordingly, Kim et al. state the characteristics of
OBC members as: the group of people is a set of socially gathered consumers who are also
treated as product innovators and information providers. More specifically, the active and
knowledgeable members can easily identify in the OBC how the firm is able to explore
various kinds of information and perceptions from consumers. In the community, members
express and share their ideas and opinions freely; in turn, useful information about the brand,
product and firm emerges. In other words, an OBC can act as a knowledge sharing and
creation space, which can attract a large number of consumers to participate (Kim et al.,
2008, p.367).
In order to circulate the shared content or information within OBCs, and then to generate
consumers’ ideas about the new product, Kim et al. identify three major communication
patterns, i.e. communication between a firm and OBC members, communication among the
members and internal communication in the firm. The OBC activities promote this
communication at all levels. Also, Kim et al. (2008, p.370) claim that these communication
activities in OBCs build consumers’ brand loyalty with the firm.
Notably, as an important outcome of consumers’ active participation, the NPD process
directly resulted from the exchanged and shared information through consumers’
communication internally and with OBCs. That is, communication can join people and
generate relationships, in order to circulate consumers’ shared content and information
within the community, then to generate consumers’ ideas for the new product or service.

33 | P a g e
Based upon the discussion above, these empirical studies highlight the importance of
consumers’ active participation in OBC activities vital to OBCs’ development and
sustainability. Researchers and scholars mainly focus on exploring the antecedents of
consumers’ participation in OBC activities, which is the shared content or exchange of
information. Consequently, brand owners may obtain valuable comments and feedback from
consumers, which can facilitate their product innovation and new product development. In
addition, customer brand loyalty, brand commitment, brand value and company value can be
enhanced as the outcomes of consumers’ active participation in OBCs.
2.1.5 Summary
This section presented an overview of the research context of OBCs, which included their
development, characteristics, typologies and recent empirical research. The author finds that
the nature of brand communities is an application of the community concept reflected in the
marketing field. Early communities based on shared geographical space. However, due to
the popularity of the Internet, virtual communities are becoming popular, as people can
communicate freely and interact with each other on the web. Thus, the great influence of
virtual communities, which have enabled communities to be formed around shared
consumption of a brand and over the Internet, thereby is facilitating the creation of OBCs.
An OBC is found in a set of interactive relationships among brands, consumers, as well as
the OBC itself.
Additionally, a number of empirical studies of OBCs emphasized the importance of
consumers’ active participation for OBCs’ sustainability (Sung and Lim, 2002; Ouwersloot
and Odekerken-Schroder, 2008; Casaló et al., 2008; 2010). The literature proposed that the
shared content or exchange of information is the major reason that drives consumers into
participating in OBC activities. Within an OBC, the shared content or exchange of
information among members about a focal brand or product can then be defined as brand
knowledge according to the branding literature. This leads to the literature review in the
section 2.2.
As the literature suggested, an OBC is based on the community setting. However, there are
still different theoretical approaches to understanding OBCs. Muniz and O’Guinn (2001)
34 | P a g e
accentuate the role of the focal brand in brand communities, which is widely accepted by
many researchers. However, Muniz and O’Guinn’s definition is contrasted with that of
McAlexander et al. (2002) and Bagozzi and Dholakia (2006) who emphasize the role of the
consumer, consumer experience and the social context, especially in consumer-initiated
OBCs. From a social perspective, social capital is seen as a major aspect of community
studies, which resides and is embedded in relationships (Bourdieu, 1986). More specifically,
social capital is defined as a set of social resources embedded in the network of relationships
between individuals; communities exist through internal relationships among individuals,
which can facilitate combine and exchange resources to create new knowledge (Nahapiet
and Ghoshal, 1998). Recently, social capital has gained credibility and been increasingly
studied in virtual communities (Blanchard and Horan, 1998; Pigg and Crank, 2004; Bauer
and Grether, 2005; Scott and Johnson, 2005). The higher the level of social capital
embedded in a community, the more frequent the interaction found among members
(Narayan and Pritchet, 1997). However, there is a lack of studies of OBCs from a social
capital perspective. Those studies have largely ignored the contribution social capital can
make to an understanding of the OBC phenomenon and its impact on brands.
While prior empirical research makes a valuable contribution to understanding OBCs, three
research gaps emerged. First, most OBC research starts with a community approach to
understanding the community setting of OBCs. A lack of studies to consider the impact of
social capital upon brand within an OBC occurs because the social capital resides and is
embedded among consumer-to-consumer relationships. Second, many empirical studies fail
to consider those OBCs created by consumers for non-commercial purposes. Third, a large
proportion of research into OBCs has been conducted in U.S and European markets. Thus
Casalo, Flavian and Guinaliu (2008) have identified a need for research into OBCs to span a
greater diversity of nationalities. These three gaps in the literature point to opportunities for
extending research into OBCs. This study focuses on consumer-initiated OBCs, examines
the impact of social capital upon brand knowledge and investigates these consumer-initiated
OBCs, which reside outside the U.S. and European markets. Section 2.3 explains in detail
what social capital is, and why and how to apply the concept in current research.

35 | P a g e
2.2 Brand knowledge
Brand knowledge, an important research concept in the present study, is vital to the survival
of an OBC, as the formation of OBCs is based on the existence of shared information and
knowledge related to the brand of interest (Sung and Lim, 2002). Also, section 2.1.4.2
outlined that the exchange of information or knowledge is the major reason and motivation
for consumers participating in an OBC (Kozinets, 2002; Sung and Lim, 2002; Bagozzi and
Dholakia, 2006). Brand knowledge in a consumer’s memory is significant, as it influences
what comes to mind when a consumer thinks about a brand. To enhance consumers’ brand
knowledge through marketing activities would help companies to develop a positive brand
attitude among customers; indeed, much research has indicated that brand knowledge can
affect a consumer’s product choice as well as their purchase decisions (Gupta, Melewar, and
Bourlakis 2010). Hence, understanding the content and structure of brand knowledge is very
important (Chen and He, 2003).
Therefore, this section starts by reviewing the conceptualization and importance of brand
knowledge in literature, and then discusses the measurement of brand knowledge in an OBC.
2.2.1 The concept of brand knowledge
Researchers have studied brand knowledge for decades. Much of that earlier research
focused on more tangible and product-related information for brands. Increasingly, scholars
are attempting to understand more of the abstract, intangible aspects of brand knowledge
from a consumer perspective, which relates to consumers’ cognitive representation of the
brand (Peter and Olson, 2001; Keller, 2003).
Keller (1993) discusses the concept of brand knowledge in a study of customer-based brand
equity. In particular, brand knowledge is regarded as the core element of customer-based
brand equity, as brand equity is defined as “the differential effect of brand knowledge on
consumer responses to the marketing of a brand” (Keller, 1993, p.2). Subsequently, what
customers have learned, felt, seen and heard about the brand as a result of their experiences
over time, which are seen as consumers’ brand knowledge, causes these differences in their
responses. Finally, perceptions, preferences and behaviour related aspects to all of the
marketing activities of the brand reflect the differential response by consumers, which make

36 | P a g e
up brand equity (Kaynak, Salman and Tatoglu, 2008, p.340). This study does not intend to
look at the differential effect of brand knowledge, but only consider its presence in an OBC
context. Accordingly, brand knowledge has been defined as “consisting of a brand node in
memory to which a variety of association are linked” (Keller, 1993, p.3). It contains different
kinds of information that may become linked to a brand, including awareness, attributes,
benefits, images, thoughts, feelings, attitudes and experiences (Keller, 1993).
Blackwell, Miniard, and Engel (2006) state that brand knowledge represents the information
stored in a consumer’s memory about a specific brand within the product category (Cheung
and Chan, 2009). In a recent study by Alimen and Cerit (2010, p.539), brand knowledge is
defined by “the descriptive and evaluative brand-related information that it is individualistic
inference about a brand stored in consumers’ memory”.
Figure 2.2 shows the dimensions of brand knowledge. Keller’s model suggests that brand
knowledge consists of two major components – brand awareness and brand image – which
have been confirmed and adopted in many prior marketing studies (Schmitt and Geus, 2006).
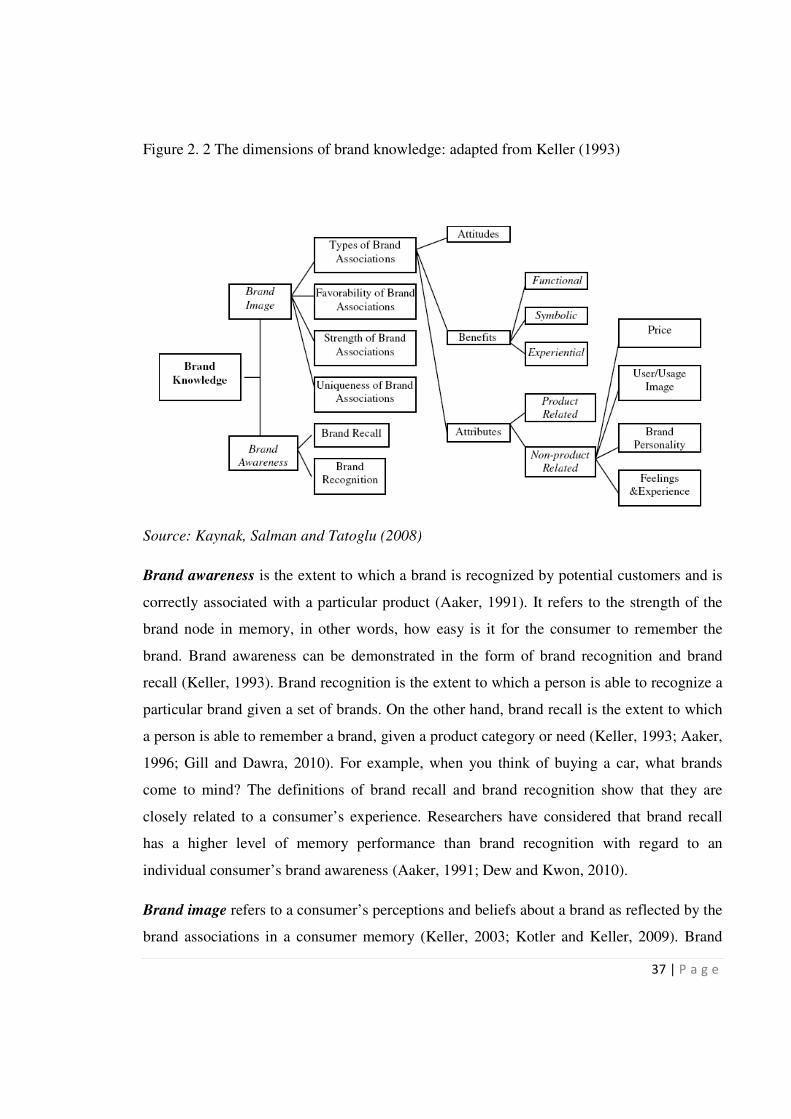
37 | P a g e
Figure 2. 2 The dimensions of brand knowledge: adapted from Keller (1993)
Source: Kaynak, Salman and Tatoglu (2008)
Brand awareness is the extent to which a brand is recognized by potential customers and is
correctly associated with a particular product (Aaker, 1991). It refers to the strength of the
brand node in memory, in other words, how easy is it for the consumer to remember the
brand. Brand awareness can be demonstrated in the form of brand recognition and brand
recall (Keller, 1993). Brand recognition is the extent to which a person is able to recognize a
particular brand given a set of brands. On the other hand, brand recall is the extent to which
a person is able to remember a brand, given a product category or need (Keller, 1993; Aaker,
1996; Gill and Dawra, 2010). For example, when you think of buying a car, what brands
come to mind? The definitions of brand recall and brand recognition show that they are
closely related to a consumer’s experience. Researchers have considered that brand recall
has a higher level of memory performance than brand recognition with regard to an
individual consumer’s brand awareness (Aaker, 1991; Dew and Kwon, 2010).
Brand image refers to a consumer’s perceptions and beliefs about a brand as reflected by the
brand associations in a consumer memory (Keller, 2003; Kotler and Keller, 2009). Brand

38 | P a g e
association is considered as anything linked in a consumer’s memory to that brand (Aaker,
1991). Hence brand image is seen as a consumer-constructed concept, due to consumers’
having their own reasoned (functional) and emotional (symbolic) perceptions attached to a
specific brand (Low and Lamb, 2000; Nandan, 2005). Figure 2.2 shows that brand image is
detailed largely in the model and has a complex nature. It results from strong, favourable and
unique brand associations. These associations are divided into three types: attributes
(product-related and non-product related), benefits (functional, experiential and symbolic)
and attitudes (Oakenfull and McCarthy, 2010).
Attribute association refers to the descriptive features that characterize a product or service,
which are distinguished by how they directly influence a product or service performance
(Keller, 1993). More specifically, product-related associations represent the product’s
physical composition while non-product attributes refer to the external aspects of a brand,
such as price information, product appearance and packaging information, users and usage
imagery (Oakenfull and McCarthy, 2010).
Benefit associations are the personal value that consumers think the product or services can
bring to them. Functional benefits usually satisfy consumers’ basic motivations such as
solving or avoiding problems (Kaynak et al., 2008). Experiential benefits relate to a
consumers’ experience when using a particular product or service and often satisfy their
sensory pleasure, and cognitive stimulation. As Keller (1993) describes, both functional and
experiential benefits correspond to product-related attributes, which can satisfy consumers’
physiological and safety needs and desire for pleasurable experiences, while the symbolic
benefits represent a consumer’s personal expression, social approval and self-esteem, which
are related with non-product attributes (Kaynak et al., 2008).
Finally, brand attitudes are the consumers’ overall evaluation of a brand and rely on the
strength and favourability of the attributes and benefits that the brand provides (Keller, 2003;
Kaynak et al., 2008). In this case, consumers’ brand attitudes can be associated with both
product-related (correspondent to functional and experiential benefits) and non-product-
related attributes (correspondent to symbolic benefits).
39 | P a g e
Although the branding literature conceptualizes brand awareness and brand image separately,
the relationship between them is highly correlated (Aaker, 1991; Keller, 1993). For example,
before a customer can form an association with a brand, a brand node (e.g., brand name or
logo) must exist in the consumer’s mind and should be able to be retrieved when a clue is
given (e.g. a consumer being aware of the brand) (Washburn and Plank, 2002). Therefore,
Dew and Kwon (2010) further suggest that brand awareness influences and strengthens the
favourability of brand associations to the brand image, as the brand image is the perception
about a brand due to a set of associations held in the consumer’s memory.
In addition, Plummer (2000) indicates that brand image comprises three components:
product attributes, consumer benefits and brand personality. This is consistent with Keller’s
view in which brand personality is conceived as an aspect of brand image. With regard to
brand personality, some researchers see it as another dimension of brand knowledge.
Brand personality is defined as “the set of human characteristics associated with a brand”
(Aaker, 1997, p.347). It has been shown in a number of studies to play a significant role in
creating brand knowledge (Sirsi, Reingen, and Ward, 1996; Aaker, 1997; Oakenfull and
McCarthy, 2010). In this manner, Keller (1998) argued that the pseudo-emotional and
symbolic human personality aspects of a brand may provide consumers with additional
reasons beyond the functional characteristic, to buy the brand, and this creates positive
attitudes among consumers (Aaker, 1991; Pappu, Quester, and Cooksey, 2005).
Further, Jennifer Aaker’s framework presents an adoption of the ’Big Five’ personality
model from a psychological perspective (Arora and Stoner, 2009). Her framework contains
five brand personality dimensions: sincerity (wholesome, honest, down-to-earth), excitement
(exciting, imaginative, daring), competence (intelligent, confident), sophistication (charming,
glamorous, smooth), and ruggedness (strong, masculine) (Aaker, 1997). Aaker (1996, p.118)
develops a general measure of brand personality that applies across the spectrum of products
and markets. The instrument questions are illustrated as: this brand has a personality; this
brand is interesting; I (customer) have a clear image of the type of person who would use
this brand.
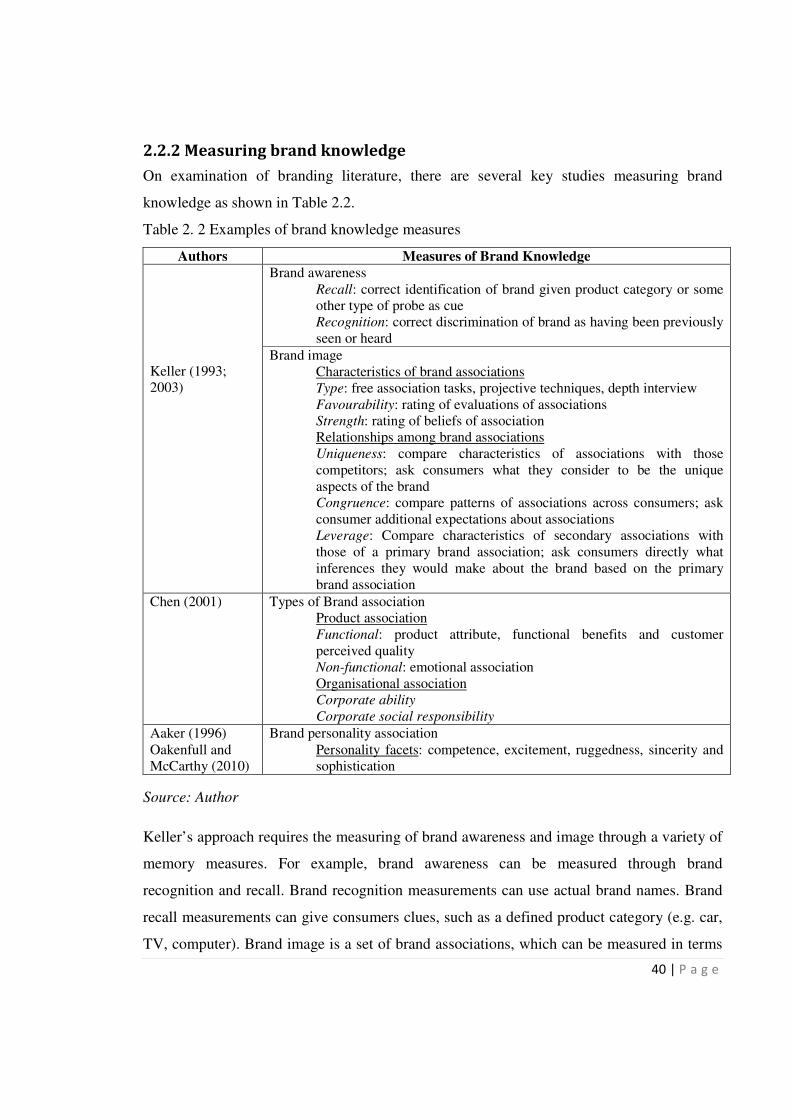
40 | P a g e
2.2.2 Measuring brand knowledge
On examination of branding literature, there are several key studies measuring brand
knowledge as shown in Table 2.2.
Table 2. 2 Examples of brand knowledge measures
Authors Measures of Brand Knowledge
Keller (1993;
2003)
Brand awareness
Recall: correct identification of brand given product category or some
other type of probe as cue
Recognition: correct discrimination of brand as having been previously
seen or heard
Brand image
Characteristics of brand associations
Type: free association tasks, projective techniques, depth interview
Favourability: rating of evaluations of associations
Strength: rating of beliefs of association
Relationships among brand associations
Uniqueness: compare characteristics of associations with those
competitors; ask consumers what they consider to be the unique
aspects of the brand
Congruence: compare patterns of associations across consumers; ask
consumer additional expectations about associations
Leverage: Compare characteristics of secondary associations with
those of a primary brand association; ask consumers directly what
inferences they would make about the brand based on the primary
brand association
Chen (2001) Types of Brand association
Product association
Functional: product attribute, functional benefits and customer
perceived quality
Non-functional: emotional association
Organisational association
Corporate ability
Corporate social responsibility
Aaker (1996)
Oakenfull and
McCarthy (2010)
Brand personality association
Personality facets: competence, excitement, ruggedness, sincerity and
sophistication
Source: Author
Keller’s approach requires the measuring of brand awareness and image through a variety of
memory measures. For example, brand awareness can be measured through brand
recognition and recall. Brand recognition measurements can use actual brand names. Brand
recall measurements can give consumers clues, such as a defined product category (e.g. car,
TV, computer). Brand image is a set of brand associations, which can be measured in terms
41 | P a g e
of their characteristics and relationships among different brand associations (Keller, 1993).
There are many ways to measure the characteristics of brand associations (e.g. their types,
favourability and strength). The relationship among different associations can be measured
through: comparing the characteristics of brand association; or asking consumers directly
about the congruence, competitive overlap or leverage of brand associations (Keller, 1993).
Chen (2001) simplifies Keller’s approach on measuring brand image and categorizes brand
associations into two types: – product association and organisational association. Product
association could be further divided into functional association. Organisational association
can be separated into corporate ability and corporate social responsibility association.
However, the research context for the current study is a consumer-initiated OBC, the brand
owner or manufacturer is not involved in the research and organisational association is
disregarded.
Furthermore, Aaker (1996) and Oakenfull and McCarthy (2010) expand brand personality
association as a measure of brand knowledge, which has five factors: competence,
excitement, ruggedness, sincerity and sophistication. However, brand personality might not
provide a general measure for brand knowledge, because not all brands have personalities,
particularly those that are positioned with respect to functional advantages and value (Low
and Lamb, 2000).
2.2.3 Brand knowledge and the OBC
Brand communities impart to their members both general and specific knowledge relevant to
the brand and provide a discussion forum for the exchange of consumers’ common interests
and ideas. Gradually, members come to share essential cognitive emotional resources and,
more specifically, they learn to negotiate and create their own brand knowledge (Berthon,
Pitt and Campbell, 2009).
Based upon the branding literature discussed above, consumer brand knowledge is more
abstract, subjective, practical and personal. Likewise, brand knowledge in brand
communities represents knowledge, experience, and know-how regarding the use of certain
preferred products, and is not just about the facts of a product or service (Algesheimer et al.,

42 | P a g e
2005). It is more about the thoughts, feelings, perceptions, images and so on that become
linked to the brand in the consumers’ minds (Keller, 2009). All of these types of information
capture both the aspects of interest in the brand and the consumers’ previous experience with
it. With the accumulation of greater brand knowledge, consumers within an OBC can learn
more about products and can exchange personal experiences to support each other in solving
problems (Wu and Fang, 2010).
Keller (1993) clarifies the structure and content of brand knowledge showing it to have two
major components: brand awareness and brand image. Füller et al. (2008) argue that brand
community members already have a strong interest in the product or brand; they usually
have extensive product knowledge and are often involved in product-related discussion. In
this case, consumers are already aware of the brands, and that brand awareness remains
constant. However, as the branding literature emphasizes, brand awareness is a necessary
component for the creation of brand image (Keller, 1993). If a brand is well established in a
consumer’s memory, it is easier to become attached to the brand and keep it firmly in mind
(Schmitt and Geus, 2006). In addition, the primary research objective of this study is to test
the effectiveness of the dimensions of social capital on brand knowledge. Brand awareness
has to be assessed as a key component of brand knowledge.
It is generally accepted in the branding literature that brand image is the result of a set of
brand associations. Moreover, Kang (2004) states that the consequence of participating in an
OBC can build up and enhance brand association through a consumer’s attachment to the
brand. As the present study does not intend to examine the interrelated relationship between
brand awareness and brand image, the author only considered them as two separate
components of brand knowledge.
As section 2.2.2 discussed, there are two major approaches when measuring brand
knowledge, mainly derived from Keller’s model and Aaker’s model of customer-based
brand equity. A direct way is to measure the components of brand knowledge, including
brand awareness and image; an indirect way is to adopt brand association as an alternative
measure as the nature of brand knowledge results from a set of associations (Keller, 1993;
Aaker, 1996; Keller, Sternthal, and Tybout, 2002). However, academics have proposed
43 | P a g e
various constructs of brand associations without reaching any consensus (Chang and Chieng,
2006). Some scholars focus on product associations, and others concentrate on organisations;
they do not use consistent measurement techniques and, hence, the results are not
comparable. This study applies and synthesises prior research that measures the two
components of brand knowledge: brand awareness and brand image. Brand awareness is
evaluated in two ways: which are brand recognition and brand recall. There are several ways
to measure brand image by applying an existing list of brand associations (Aaker, 1991),
measuring the strength, favourability and uniqueness of the brand association, adopted from
previous empirical studies (Low and Lamb, 2000). These two elements are selected for the
following reasons:
i. The two main dimensions are discussed frequently in prior conceptual studies;
ii. They are the most commonly cited brand knowledge constructs in empirical
branding research;
iii. They have established, reliable, published measurements in literature.
The development of measured instruments for brand knowledge is discussed in detail in
Chapter 3.
2.2.4 Summary
The concept of brand knowledge, which stems from the theory of consumer-brand equity, is
well developed in brand literature. It plays a significant role in motivating and encouraging
the consumers’ active participation in OBC activities. At the same time, brand knowledge
can be developed through interactive communication among OBC members. However,
brand knowledge in OBCs still lacks empirical research.
According to prior research into brand knowledge, the author acknowledges that the
measurements of brand knowledge are determined by examining its content and construct.
As stated in Chapter 1, the research objective of the present study is to investigate the effect
of social capital on brand knowledge. Next we aim for a deeper understanding of social

44 | P a g e
capital theory and to investigate why and how social capital can have an influence on brand
knowledge in a marketing context of OBCs.
2.3 Social capital
2.3.1 The emergence of social capital
The concept of social capital has emerged as a popular and dominant research theme across a
variety of disciplines in order to understand the wide range of social phenomena involved
(Dhakal, 2010). The concept of social capital originated in the social science and humanities
literature (Huysman and Wulf, 2004) and was firstly used to describe the relational resources
embedded in cross-cutting personal ties that are useful for the development of individuals in
community social organisations (Jacobs, 1961). The role of social capital has been examined
with regard to the development of human capital (Coleman, 1998), the creation of
intellectual capital (Nahapiet and Ghoshal, 1998), and in its economic performance
(Woolcock, 1998; Worldbank, 1999), geographical regions (Putnam, 1993) and nations
(Fukuyama, 1995). Further, as the result of the development of the Internet, social capital
has been discussed and examined in the online realm (Lee and Lee, 2010). It is noted that
many individuals do have more opportunities today to interact with others through web
surfing and online communication (Ellison, Steinfield and Lampe, 2007). Therefore, social
capital leads itself to multiple definitions and interpretations from different perspectives.
Although the description of social capital varies somewhat from scholar to scholar, there is
an agreement that social capital is derived from relationships with other people in a social
network. The central idea behind the notion is that social relationships are valuable, allowing
individuals and organisations within certain networks to corporate with each other to achieve
their goals (Lee and Lee, 2010).
2.3.2 The term social capital
The concept of social capital has been embedded in a broad notion of ‘capital’ theory since
the outset (Dhakal, 2010). In order to get a comprehensive understanding of social capital, it
is necessary to first explore the nature of capital and how theories of capital vary (Lin, 1999).
Lin (2001, p.3) defines capital as “an investment of resources with expected return in the

45 | P a g e
market place” according to the Marxist classical theory of capital. Further, there are about
six principal forms of capital identified in the literature, namely physical, financial, cultural,
human, natural and social capital.
Physical capital means the stock of real goods such as plant, machines and buildings, which
can contribute to the production of further goods. Financial capital refers to money or wealth
that facilitates these productive activities. Cultural capital represents investments or assets
that contribute to the value and customs of a particular society. Human capital refers to
people’s knowledge, skills and abilities that are either inherited or developed through nurture,
education and other aspects of life experience. Natural capital is described as the stock of
renewable and non-renewable resources provided by nature. Finally, social capital refers to
the resources available in and through personal, or a network, of relationships (Throsby,
1999; Goodwin, 2003).
Similarly, as with other forms of capital, social capital is also a kind of resource. These
resources may include information, ideas, leads, business opportunities, financial support,
power and influence, emotional support, even goodwill, trust and cooperation (Baker, 2000,
p.2). “Capital” in social capital emphasizes these resources, and just like human and
financial capital, these are productive, and can encourage cooperation and enable individuals,
or groups of people, to create value and achieve a common goal. However, the main
difference is that the word “social” emphasizes that the resources are not personal assets; no
single person owns them. Accordingly, social capital is an intangible asset that resides in
social relationships, which cannot be traded in the market (Robinson, Schmid and Siles,
2002).
2.3.3 Definitions of social capital
Given that social capital is explored in a number of disciplines, its definition and emphases
can vary. Some predominant definitions are drawn from previous research and discussed as
follows:
46 | P a g e
In the early 1980s, the French sociologist Pierre Bourdieu was the first scholar who
systematically analysed and explained the contemporary social capital concept. He defines
social capital as:
“... the aggregate of the actual or potential resources which are linked to
possession of a durable network of more or less institutionalized relationships
of mutual acquaintance or recognition (or in other words, to membership in a
group) which provides each of its members with backing of the collective-
owned, a credential which entitles them to credit in the various senses of the
word” (Bourdieu, 1985, p.248).
In Bourdieu’s study, social capital represents a process by which individuals in the
dominating class with mutual recognition and acknowledgement, reinforce and reproduce a
privileged group which holds various types of capital, such as economic, cultural and
symbolic capital (Lin, 1999).
From a functional point of view, Coleman defines social capital:
“... Social capital is defined by its function. It is not a single entity, but a
variety of different entities having characteristics in common: they all consist
of some aspects of a social structure, and they facilitate certain actions of
individuals who are within the structure” (Coleman, 1990, p.302).
This definition indicates that social capital is something facilitating individual or collective
action, generated by networks of relationships, reciprocity, trust and social norms
Furthermore, Coleman (1990) argues that social capital may facilitate the social control
within a society through the closure and density of networks. Ports (1998) credits Coleman
by introducing and giving visibility to the concept of social capital in American sociology.
He focuses on social relations and networks when analyzing social capital by identifying its
sources. These sources include information, ideas, leads, business opportunities, financial
capital, power and influence, emotional support, even goodwill, trust and cooperation.

47 | P a g e
Robert Putnam defines social capital as:
“... features of social organisation such as networks, norms, and social trust
that facilitate coordination and cooperation for mutual benefit” (Putnam,
1995, p.67).
This definition suggests that social capital facilitates co-operation and mutually supportive
relationships in communities and nations and should therefore be a valuable means of
combating many of the social disorders inherent in modern societies. The similarity between
the works of Coleman and Putnam is that they both emphasize social capital as a collective
asset.
Lin (1999) suggests that social capital can be defined as:
“... the resources embedded in a social structure which are accessed and
mobilized in purposive actions” (Lin, 1999, p.35).
This definition contains three core elements: structural (embeddedness), opportunity
(accessibility) and action-oriented aspects. Other scholars working on the theory of social
capital have mentioned these elements. For example, Flap (1995) explains social capital as a
combination of network size, relationship strength and possessed resources within the social
networks. Likewise, Burt (1992) proposes that social capital is seen as colleagues, friends
and more general contacts through which you receive opportunities to use your financial and
human capital. In this regard, social capital resides in social ties.
Apart from the above four predominant definitions from Bourdieu, Coleman, Putnam and
Lin, a number of theoretical and empirical analyses of social capital have been published;
these provide broader views of definitions from different perspectives. For example, Cohen
and Prusak (2001) develop Putnam’s definition by identifying social capital as a stock of
active connections among people, which covers the trust, mutual understanding, and shared
values and behaviours that bind people as members of human networks and communities.

48 | P a g e
Fountain (1998) links information technology with social capital and defines it as:
“... the institutional effectiveness of inter-organisational relationships and
cooperation – horizontally among similar firms in associations, vertically in
the supply chain and multidirectional links to sources of technical knowledge,
human resources and public agencies” (Fountain, 1998).
More broadly, Nahapiet and Goshal (1998) define social capital as:
“... the sum of actual and potential resources embedded within, available
through, and derived from the network relationships possessed by an
individual or social unit. Social capital thus comprises both the network and
the assets that may be mobilized through the network.” (Nahapiet and Goshal,
1998, p.243)
Likewise, Kim and Aldrich (2005) define social capital in the context of entrepreneurship,
which refers to the social connections people use to obtain resources they would otherwise
acquire through expending their human and financial capital. These two definitions examine
the concept of social capital at the organisational level, as an organisation’s ability to
manage its knowledge resources.
Furthermore, another way to identify social capital is through the study of social networks. A
social network is described as a set of social entities, such as: individuals, groups and
organisations that are connected to each other in order to exchange information or resource
(Haythornwaite, Wellman and Garton, 1998). Accordingly, Alder and Kwon (2002, p.23)
conceptualize social capital as:
“... the goodwill available to individuals or groups, its resource lies in the
structure and content of an actor’s social relations, its effects flow from the
information, influence and solidarity it makes available to the actor” (Alder
and Kwon, 2002, p.23).
This definition particularly encompasses the internal and external social ties which allow
social capital to be attributed to both individuals and organisations.

49 | P a g e
Not only has social capital been examined in organisations and a social society, its presence
has also been supported within online social networks. Rafaeli, Ravid and Soroka, (2004)
suggest online social capital to be:
“... a collection of features of social networks created as a result of virtual
community activities that lead to development of common social norms and
rules that assist cooperation for mutual benefits” (Rafaeli, Ravid and Soroka,
2004, p.4).
Similarly, Daniel, Schwiser and McCalla (2003) propose social capital in a virtual learning
community as:
“... common social resource that facilitates information exchange, knowledge
sharing and knowledge construction through continuous interaction, built on
trust and maintained through shared understanding” (Daniel, Schwiser and
McCalla, 2003).
Clearly, there is no consensus on the definition of social capital. Rather than debate its
varying definitions, this study accepts the substantial work already done by other researchers
and instead attempts to categorize their definitions into individual and group levels (Lin,
1999). The use of social capital on an individual level is similar to human capital that
emphasizes an individual’s access and use of embedded resources in social networks to gain
the expected returns (such as finding a better job, learning and getting information, and
generally improving personal situations). At this level, the focal point is to analyse ‘how
individuals invest in social relations; and how they capture the embedded resources in such
relationships to obtain a return’ (Lin, 2001). The representative authors are Lin (1999), Burt
(1992), Flap (1995), and Kim and Aldrich (2005). Conversely, the group level of social
capital stands for a collective asset, with discussion focused on: 1) how certain groups
develop and 2) how such a collective asset can enhance group value. Bourdieu (1985, 1986),
Coleman (1988, 1990) and Putnam (2000) are the key authors who support this viewpoint
and emphasize the collective asset gained from a society taking advantage of connections
and relationships.
50 | P a g e
An overview of the concept of social capital from its emergence and multiple definitions
would indicate that the meaning of social capital is in a community sense. The constructs of
social capital depend on the development of social relationships, and these relationships are
built on social connections in communities. In other words, the concept of social capital
implies that its development takes places within a community (Australian government
discussion paper, 2005). In respect to social science and humanity studies, researchers and
scholars have consistently supported the existence of social capital in both physical and
virtual communities.
2.3.3.1 Defining social capital in the OBC
The review of the literature has also led to a suggestion of defining the working definition of
social capital according to different contexts. Therefore, for practical purposes, this study
identifies an appropriate definition for social capital in OBCs as:
The social resources embedded in the network of relationships between
individual members and their connections with their OBC.
This definition stems from the existing definition of Nahapiet and Ghoshal (1998) rather
than creating a new definition for social capital, and the reasons are justified as follows:
i. Nahapiet and Ghoshal’s definition has been accepted and supported by many
scholars in a number of empirical studies.
ii. Nahapiet and Ghoshal’s definition highlights key elements identified by a range of
literature on social capital. They conceptualize social capital as a set of social
resources embedded in the network of relationships between individuals,
communities existing through internal relationships among individuals; this is
aligned with the social capital in OBCs, as the OBC social capital. As previously
identified, the nature of an OBC is a typical form of virtual communities founded on
a set of relationships, thus OBC social capital is found in two types of relationships:
consumer-to-consumer and consumer-to-community.

51 | P a g e
iii. Nahapiet and Ghoshal’s definition is on a variety of levels, such as individual, group
and community. Social capital from an individual level is the most pertinent one for
this study.
2.3.4 Forms of social capital
Section 2.3.3 identified and detailed several conceptualizations of social capital according to
different contexts. In particular, many scholars agreed to identify social capital as a set of
resources embedded in the social network of relationships. Therefore, this section discusses
different forms of social capital in order to have a better understanding of this concept.
2.3.4.1 Social ties theory as a prerequisite
A social tie exists between communicators wherever they exchange or share resources such
as goods, services, or information (Haythornwaite, 2002). According to Granovetter (1973,
1974), “weak-ties” tend to lead people into wide networks and gain broader sets of
information and communication opportunities. However, “strong-ties” are more likely to
offer strong emotional and substantive support for people, even though the networks are
smaller and very often more closed than those experiencing “weak ties”. Table 2.3
summarizes the main characteristics of “weak ties” and “strong ties” to show the differences
between them. The weakly tied people are known a little but not as close friends, they travel
in different social circles from us, and thus are more likely to have different experiences
from us and access to different information, resources, and contacts. This is the strength of
weak ties as described by Granovetter. The strength of strong ties, for example our close
friends and co-workers, is their willingness to work with us, sharing what information and
resources they have, and access to the contacts they know.
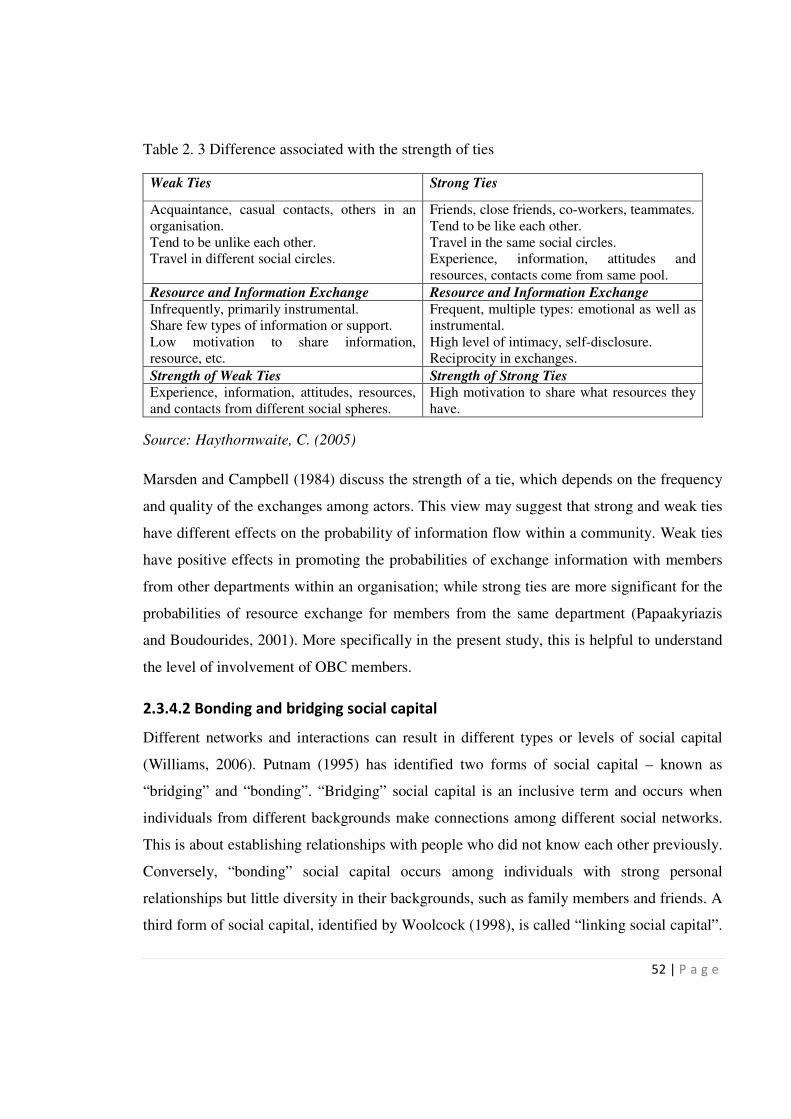
52 | P a g e
Table 2. 3 Difference associated with the strength of ties
Weak Ties Strong Ties
Acquaintance, casual contacts, others in an
organisation.
Tend to be unlike each other.
Travel in different social circles.
Friends, close friends, co-workers, teammates.
Tend to be like each other.
Travel in the same social circles.
Experience, information, attitudes and
resources, contacts come from same pool.
Resource and Information Exchange Resource and Information Exchange
Infrequently, primarily instrumental.
Share few types of information or support.
Low motivation to share information,
resource, etc.
Frequent, multiple types: emotional as well as
instrumental.
High level of intimacy, self-disclosure.
Reciprocity in exchanges.
Strength of Weak Ties Strength of Strong Ties
Experience, information, attitudes, resources,
and contacts from different social spheres.
High motivation to share what resources they
have.
Source: Haythornwaite, C. (2005)
Marsden and Campbell (1984) discuss the strength of a tie, which depends on the frequency
and quality of the exchanges among actors. This view may suggest that strong and weak ties
have different effects on the probability of information flow within a community. Weak ties
have positive effects in promoting the probabilities of exchange information with members
from other departments within an organisation; while strong ties are more significant for the
probabilities of resource exchange for members from the same department (Papaakyriazis
and Boudourides, 2001). More specifically in the present study, this is helpful to understand
the level of involvement of OBC members.
2.3.4.2 Bonding and bridging social capital
Different networks and interactions can result in different types or levels of social capital
(Williams, 2006). Putnam (1995) has identified two forms of social capital – known as
“bridging” and “bonding”. “Bridging” social capital is an inclusive term and occurs when
individuals from different backgrounds make connections among different social networks.
This is about establishing relationships with people who did not know each other previously.
Conversely, “bonding” social capital occurs among individuals with strong personal
relationships but little diversity in their backgrounds, such as family members and friends. A
third form of social capital, identified by Woolcock (1998), is called “linking social capital”.

53 | P a g e
This refers to relationships with people in power to leverage resources, ideas, information
and knowledge within a community or groups.
Granovetter (1973, 1974) referred to theoretical frameworks as “weak-tie” and “strong-tie”
relationships. To integrate Putnam’s work with Granovetter, the “weak-tie” comes from
“bridging” social capital; and the “strong-tie” comes from “bonding” social capital. From
this, Williams (2006) suggests that different types of relationship can determine different
kinds of social capital. Hence, in the case of “weak-tie”, these tend to be those people who
have a broader set of information and opportunities. Granovetter (1973) called this
phenomenon the “strength of weak ties”.
Bourdieu (1996) claims that the fundamental proposition of social capital is that networks of
relationships constitute an important resource for social action and the conduct of social
affairs. Liao and Welsch (2005) explain Bourdieu’s view of social capital theory in terms of
the network ties, which provide access to resources and information.
2.3.4.3 Internet ties
Subsequent research in this field indicates that communication is the key way of maintaining
social ties (Haythornthwaite et al. 1998). Thus, media enable and ensure this connection
(Wellman et al., 1996). Accordingly, Haythornthwaite (2002) states that online and offline
ties share many similarities. The online ties are expected to be stronger in that they
demonstrate greater varieties of interaction and exchange. In other words, it is closer to the
extent that it exchanges emotional support. Besides, a latent tie emerges from the Internet
through Internet Relay Chat (IRC) channels, Web-based bulletin boards and email listserv.
An essential characteristic of this type of tie is that individuals do not establish it. Instead, it
depends on the structures, which are established by management of an organisation, system
administrators, or community organisers (Haythornthwaite, 2002).
This study does not seek to investigate the forms of social capital and their uses in social
network analysis, but it has found that interactive social ties are existed between
communicators wherever they exchange or share resources such as goods, services, or
information (Haythornwaite, 2002). The different forms of social capital emphasize the

54 | P a g e
importance of networks and relationships as a critical component (Butt, 2008), because
social capital is derived from social relations and is found inherently in the actor’s social
network which ties the actors to each other (Ramstrom, 2008, p.503). There are a numbers of
studies have focused on social capital in business contexts (Alder and Kwon, 2002). In this
case, these social ties may also present in brand communities, as the brand community is
founded on consumer-brand-triad relationships that share the same communication features
with social networks and social connectivity among people (Chi, 2011).
2.3.4 Measuring social capital
There is no consensus on the definition for social capital and thus there are some difficulties
of measuring social capital. With the communities, social capital can be considered at
individual level, group level, as well as community level. Therefore, Fukuyama (1999)
argues that the common shortcoming of the social capital concept is the absence of
consensus on how to measure it. Almost every scholar who provides measurement tools for
it finds it necessary to define social capital from his or her own perspective (Daniel et al.,
2003). Most of the measures of social capital mainly concentrate on quantifying social
capital at a society level and contributing to economic development (Widen-Wulff and
Ginman, 2004). As will be seen in Table 2.4, a short selection of social capital measurement
tools at individual or group level is presented from previous studies.
The issues of trust and network density have been frequently addressed in formal studies to
assess social capital. However, social capital is such a complex concept that it is not likely to
be represented by any single measure or figure. Therefore, Krishna and Schrader (2002)
argue that the appropriate approach to measure social capital is to combine those
assessments by measuring their multiple dimensions1
(i.e. structural vs. cognitive
dimensions of social capital). Many researchers and scholars in a wide range of empirical
studies of social capital have accepted this approach.
1
Nahapiet and Goshal (1998) identify three dimensions of social capital, namely the
structural, relational and cognitive dimensions.
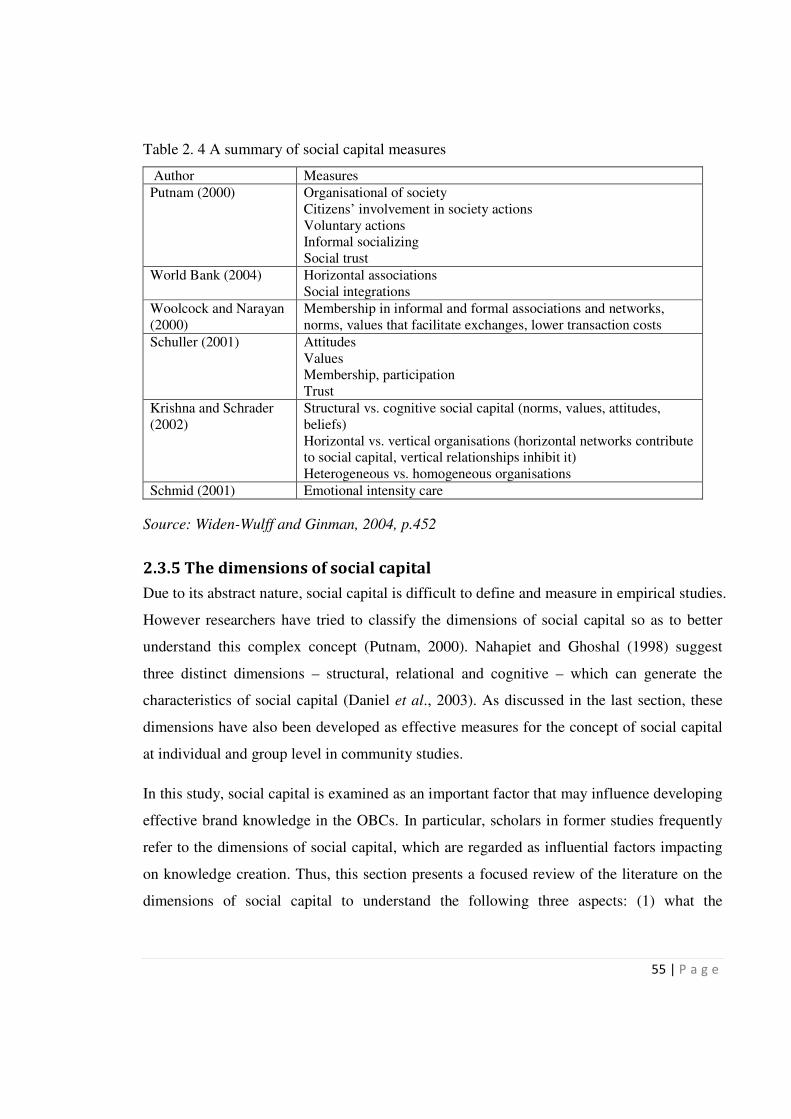
55 | P a g e
Table 2. 4 A summary of social capital measures
Author Measures
Putnam (2000) Organisational of society
Citizens’ involvement in society actions
Voluntary actions
Informal socializing
Social trust
World Bank (2004) Horizontal associations
Social integrations
Woolcock and Narayan
(2000)
Membership in informal and formal associations and networks,
norms, values that facilitate exchanges, lower transaction costs
Schuller (2001) Attitudes
Values
Membership, participation
Trust
Krishna and Schrader
(2002)
Structural vs. cognitive social capital (norms, values, attitudes,
beliefs)
Horizontal vs. vertical organisations (horizontal networks contribute
to social capital, vertical relationships inhibit it)
Heterogeneous vs. homogeneous organisations
Schmid (2001) Emotional intensity care
Source: Widen-Wulff and Ginman, 2004, p.452
2.3.5 The dimensions of social capital
Due to its abstract nature, social capital is difficult to define and measure in empirical studies.
However researchers have tried to classify the dimensions of social capital so as to better
understand this complex concept (Putnam, 2000). Nahapiet and Ghoshal (1998) suggest
three distinct dimensions – structural, relational and cognitive – which can generate the
characteristics of social capital (Daniel et al., 2003). As discussed in the last section, these
dimensions have also been developed as effective measures for the concept of social capital
at individual and group level in community studies.
In this study, social capital is examined as an important factor that may influence developing
effective brand knowledge in the OBCs. In particular, scholars in former studies frequently
refer to the dimensions of social capital, which are regarded as influential factors impacting
on knowledge creation. Thus, this section presents a focused review of the literature on the
dimensions of social capital to understand the following three aspects: (1) what the
56 | P a g e
dimensions of social capital are; (2) the concept of each dimension; (3) how these concepts
are investigated and examined empirically in different contexts.
2.3.5.1 Overview of the dimensions of social capital
Nahapiet and Ghoshal (1998) suggest that social capital can be classified into three distinct
dimensions: structural, relational and cognitive; the influence of each of these three
dimensions can facilitate the creation of intellectual capital within an organisation. The term
intellectual capital builds on the expansion literature to understand the impact of social
capital upon knowledge 2 creation. Nahapiet and Ghoshal’s conceptual framework (see
Figure 2.2) summarizes the specific relationship between social capital and new intellectual
capital (new knowledge) through resource combination and exchange. The manifestations of
each dimension of social capital are identified in Figure 2.3.
2 Knowledge is seen as a key resource in achieving different kinds of goals and is well
recognized in sustaining competitive advantages in organisational strategic management
(Widen-Wuff and Ginman, 2004; Wasko and Faraj, 2005).

57 | P a g e
Figure 2. 3 Social capital in the creation of intellectual capital
Source: Nahapiet and Ghoshal (1998)
The structural dimension refers to the overall patterns of connections between actors, that is,
it relates to an individual’s ability to make connections to others within a community; these
connections can help to reduce the amount of time and investment needed to obtain
information (Nahapiet and Ghoshal, 1998). Among the most important facets of this
dimension is the presence or absence of network ties between actors and network
configuration (Liao and Welsch, 2005). Furthermore, Adler and Kwon (2002) emphasize the
importance of social ties as a fundamental aspect of social capital, because ties create
opportunities for social capital transactions. Accordingly, Hazleton and Kennan (2000)
58 | P a g e
propose four elements in terms of network issues: access, referral, timing (Burt, 1992) and
appropriability. Access means the ability to send and receive messages as well as the ability
to gain entry to networks through their relationships with others. Timing includes the
availability of messages in a time frame which is useful for individuals, groups or
organisations for their goal achievement. Referral indicates the network process that
provides information and opportunities for actors to gain additional network ties.
Appropriability symbolizes the degree to which a network or community for one purpose
can be put to different usages.
The cognitive dimension represents those resources providing shared representations,
interpretations and systems of meaning among parties (Nahapiet and Ghoshal, 1998). For
example, the extent to which people share a common language facilitates their ability to gain
access to others and information. A shared common language is not only for individuals to
communicate and exchange information and knowledge, but it also determines how
individuals understand the information they receive from individuals within their networks
(Daniel et al. 2003).
The relational dimension describes the kind of personal relationships people have
developed with each other through a history of interactions (Nahapiet and Ghoshal, 1998). It
focuses on some particular relationships, such as respect, trustfulness and friendliness.
Szulanski’s study (1996) highlights the significance of this dimension: the transfer of best
practice within communities or organisations. Kennan, Hazleton, Janoke and Short (2008)
believe that the focus of the relational dimension is on the nature and character of the
connections among individual actors. Hence, trust, obligation, norms and identification are
classified as features of this dimension (Nahapiet and Ghoshal, 1998). Trust refers to
anticipated cooperation (Burt and Knez, 1995), which is the most studied concept of social
capital (Ports, 1998). Simply, trust refers to one individual relying on the integrity, ability or
character of other individuals (Striukova and Rayna, 2008). Obligations can be understood
as binding oneself with social and moral ties. Norms consist of behaviours regarded by
individuals as standard. Identification refers to the extent to which individuals see
themselves as connected to others.

59 | P a g e
However, a limitation of Nahapiet and Ghoshal’s framework is that their analysis largely
considers these dimensions separately, instead of the interrelationships among them. Tsai
and Ghoshal (1998), Tsai (2000) and Stiukova and Rayna (2008) address this in their
empirical studies. They argue that all three dimensions of social capital can influence each
other within organisations and virtual teams. As seen in the conceptual model presented in
Figure 2.4, in virtual teams, trust and reputation can result in a more active participation of
the team member; the structural dimension of social capital can affect the relational
dimension (Striukova and Rayna, 2008). For example, if an individual (firm) has a central
location in a network, it is easier for this individual (firm) to create a trustful relationship
with other network members. The cognitive dimension of social capital may affect the
relational dimension as the shared version helps create trust. In addition, when individuals
share the same values and goals, the ties between them become stronger, which leads to
cooperation between these individuals. In this sense, there is a link between cognitive and
structural social capital. The study of Striukova and Rayna is valuable in emphasizing the
inter-related relationships among structural, relational and cognitive dimensions.
Figure 2. 4 Relationship among the dimensions of social capital
Source: Stiukova and Rayna (2008)
60 | P a g e
Apart from Nahapiet and Ghoshal, other authors have also identified a different group of
dimensions. For example, Hazleton and Kennan (2000) add a communication dimension
rather than a cognitive dimension by drawing on the work of Nahapiet and Ghoshal.
Hazleton and Kennan believe that communication is needed to access and use social capital
through information exchange, problem identification, behavioural regulations and conflict
management. Information Exchange refers to the ability to gather, interpret, organise, store
and disseminate information to relevant components. Problem identification emphasises that
the organisation needs to be able to exchange information in order to identify problems and
find appropriate solutions. Behavioural regulation is a process through which the behaviour
of various actors (e.g. employees and customers) is shaped in relation to organisational goals
and objectives. Conflict management is the process through which conflict is understood as a
normal and valuable activity that must be managed as a regular and on-going process
(Hazleton and Kennan, 2000). This communicative dimension is a visible condition
necessary for the formation and utilization of social capital (Widen-Wulff and Ginman,
2004), which is developed to examine social capital as a theoretical construct with the
potential to enhance the understanding of the internal public relations contribution to the
organisational bottom line.
The concept of social capital is grounded in social relationships (Hazleton and Kennan,
2006), and public relations have increasingly been linked to relationship management (Heath,
2001; Ledingham and Bruning, 2000). Therefore, the work of Hazleton and Kennan mostly
contributes to developing a theory of internal public relations grounded in social capital
theory. A common definition of public relations is identified as follows:
“the management function that establishes and maintains mutually beneficial
relationships between an organisation and the public on whom its success or
failure depends” (Cutlip, Broom and Center, 1999, p.6).
Ihlen (2005) argues that such relationships can be called the social capital of an organisation,
and the development of social capital is a crucial public relations activity. From a marketing
standpoint, public relation is one of the marketing communication tools. Thus, the
communication dimension can be considered to be the fourth dimension of social capital in

61 | P a g e
the marketing context. This dimension seems to complement rather than replace the
cognitive dimension.
Nahapiet and Ghoshal and Hazleton and Kennan, both focus on a firm or an organisation as
their primary research context; and they both believe that social capital can help companies
to underpin organisational advantages. Nahapiet and Ghoshal (1998) explore the relationship
between social capital and the creation of intellectual capital. However, there appears to be
less concern about the diffusion and exploitation of social capital. Hazleton and Kennan
(2006, p.322) refine the definition from Portes (1998) and re-define social capital as:
“the ability that organisations have of creating, maintaining, and using
relationships to achieve desirable organisational goals.”
In this definition, social capital is seen as something that can be stocked, accessed and used
to further various organisational objectives through communication behaviour. Therefore,
social capital can be diffused through the communication process among network members.
Another paper by Widén-Wulff and Ginman (2004) also emphasizes the importance of the
communication dimension as a visible condition necessary for information and utilization of
social capital. Thus their study does not follow Nahapiet and Goshal’s framework
completely but replaces the cognitive dimension with a communication dimension. Widén-
Wulff and Ginman posit that the dimension of social capital can be explored as a theoretical
framework to understanding knowledge sharing behaviour in organisations from a
information science perspective. Most importantly, the study of Widén-Wulff and Ginman
suggests that the dimensions of social capital and knowledge sharing should be studied in
different contexts, because the output of social capital and knowledge sharing is affected by
the context in which it is built up.
Inkpen and Tsang (2005) support the standpoint of Widén-Wulff and Ginman and adopt
Nahapiet and Ghoshal’s (1998) work and examine where the dimensions of social capital,
organisational knowledge transfer and network intersect. They distinguish three common
network types – intra-corporate networks, strategic alliances and industrial districts – and
outline the dimensions of social capital that are embedded in these three different types of

62 | P a g e
networks, to influence knowledge transfer among network members. There are substantial
variances within each network types; for example, the network stability of the structural
dimension is different between intra-corporate network and strategic alliance (as Table 2.5
shows below). Therefore, Inkpen and Tsang conclude that the nature of social capital varies
depending on the types of network.
Table 2. 5 The dimensions of social capital across network types
Source: Inkpen and Tsang (2005)
Based upon this discussion, it is suggested that Widén-Wulff and Ginman’s replacement of
the cognitive dimension as a communication dimension is due to the contextual factor. This
is especially important today when increasing complexity means organisations contain
different kinds of groups and networks (Widén-Wulff and Ginman, p.454). However, this
theoretical framework has not been tested in any empirical studies, indicating that the
communication dimension of social capital is still considered at the conceptual level.
Furthermore, Koka and Prescott (2002) propose another set of three different dimensions of
social capital as an alternative to Nahapiet and Ghoshal’s categorization, which are
information diversity, information volume and information richness. This proposition is
63 | P a g e
based on a systematic analysis of the benefits of the social capital concept, as the
information is widely regarded as one of the key benefits of social capital (Adler and Kwon,
2002; Inkpen and Tsang, 2005). The information benefits of social capital have also been
studied in a wide range of research fields, such as network research (Burt, 1992; Granovetter,
1973), research on ethnic entrepreneurs and ethic firms (Portes and Sensenbrenner, 1993)
and inter-organisational research (Uzzi, 1997). These studies demonstrate that different types
of information have differential effects on firms’ performance. Therefore, each dimension is
manifested as: the information volume dimension emphasizes the quality of information that
a firm can access and acquire by virtue of its alliance. The primary focus is on the number of
partners that a firm possesses and the number of ties it has with each partner. The
information diversity dimension emphasizes the variety and, to a somewhat lesser extent, the
quantity of information that a firm can access through its relationships. The focus here is not
only on the number of partners but also on the characteristics of partners and their
relationships. The information richness dimension of social capital emphasizes the quality
and nature of information that a firm can access through its relationships. It focuses on both
the firm’s overall alliance experiences and its history with current partners.
In comparison, Nahapiet and Ghoshal’s framework is predominately built on structural and
network-based social capital; Koka and Prescott develop a more comprehensive theory of
social capital from information benefits aspects within the strategic alliance firms. However,
Koka and Prescott’s framework has only been used in their own work which lacks of
published empirical studies to test its generalizability and validity across different research
contexts. It therefore has a limited use in understanding social capital in OBCs in the present
study.
Based upon the discussion, the dimensions of social capital are commonly defined as the
structural, cognitive and relational dimensions (Nahapiet and Ghoshal, 1998). Despite this,
Hazleton and Kannen, (2000) suggest a communication dimension instead of the cognitive
dimension. Koka and Prescott (2002) propose a set of dimensions of social capital, which is
different from Nahapiet and Ghoshal’s framework by focusing on information benefits of
social capital. In addition, some authors argue that identifying each dimension of social
64 | P a g e
capital really depends on the context. According to these critics, more insight about the
dimensions of social capital would be gained by looking at a number of empirical studies,
which lead to where the review turns next.
2.3.5.2 The use of dimensions of social capital according to different contexts
As mentioned earlier, the concept of social capital has traditionally been discussed in civic
engagement (Putnam, 2000) and economic performance (Woolcock, 1998; Worldbank,
1999). Nowadays it is playing a significant role in understanding the nature of social
relationships and social networks among individuals or within organisations (van Vuuren,
2011). Consequently, social capital has become a key theoretical approach to understand the
knowledge sharing and creation, in particular, Nahapiet and Ghoshal (1998) posit that the
dimensions of social capital are found to have a strong influence on developing, sharing and
creating knowledge. Recent empirical research on the dimension of social capital can be
categorized into three main themes as follows:
i. The dimensions of social capital are developed in strategic management studies in
order to examine the contribution of social capital dimensions to a firms’ value
creation in terms of firm performance (Arregle, Hitt, Sirmon, and Very, 2007; Burt,
2007), a firm’s competitive capabilities (Wu, 2008), and product innovation (Moran,
2005). Thus social capital is conceptualized as an important source for the creation of
the value-generating resources that are inherent and available in a firm’s network of
relationships (Granovetter, 1992; Gulati, Norhria, and Zaheer, 2000).
ii. Gradually, the dimensions of social capital have been extended from organisational
settings into the marketing discipline to facilitate new product development
(Atuahene-Gima and Murray, 2007), explain the customer relationship value, and
facilitate innovation in Internet marketing.
iii. The dimensions of social capital are examined as significant factors that impact on
knowledge sharing behaviour, in particular in virtual communities (Wasko and Faraj,
2005; Chiu et al., 2006, and Cummings, Heeks and Huysman, 2006).

65 | P a g e
The major focus of this present study is to investigate the effects of social capital in the
marketing context of OBCs. The author does not intend to investigate the use of social
capital in organisation settings. Tables 2.6 and 2.7 below synthesize the recent empirical
studies of the dimensions of social capital from marketing contexts and virtual communities.
Table 2. 6 The dimensions of social capital in marketing contexts
Authors
Research
Context
The dimensions of social capital
(Merlo, Bell,
Mengüc and
Whitwell,
2006)
Retailing
business
Structural Dimension: open communication
Cognitive Dimension: shared vision
Relational Dimension: Trust
(Tsai, 2006) e-stores
(Internet
marketing)
Structural Dimension: centrality, equivalence between
members, network density
Relational Dimension: website-customer relationship,
customer-customer relationship
(Lawson,
Tyler, and
Cousins, 2008)
Buyer-supplier
relationships
(supply chain
management)
Structural Dimension: managerial communication
Relational Dimension: supplier integration and closeness
(Atuachene-
Gima and
Murray, 2007)
Exploratory and
exploitative
learning in new
product
development
Structural Dimension: Power; intra and extra-industry
managerial ties
Relational Dimension: trust
Cognitive Dimension: solidarity and strategic consensus
(Hsieh and
Tsai, 2007)
Launch
strategies for
innovative
products
Structural Dimension: the embedded ties with partners
(Westerlund
and Svahn,
2008)
Relationship
value
Structural Dimension: the network ties and contacts
Relational Dimension: perceived trust and sense of proximity
Cognitive Dimension: person-related intangible skills and
competences that are embedded in organisations
Source: Author

66 | P a g e
Table 2. 7 The dimensions of social capital in virtual communities
Authors
Research
Context
The dimensions of social capital
(Wasko and
Faraj, 2005)
An electronic
networks of
practice
supporting a
professional
legal association
Structural Dimension: centrality
Relational Dimension: Commitment and reciprocity
Cognitive Dimension: self-rated expertise and tenure in the
field
(Chiu, Hsu,
and Wang,
2006)
A professional
(IT) virtual
communities
Structural Dimension: social interaction ties
Relational Dimension: trust, norm of reciprocity and
identification
Cognitive Dimension: shared language and version
(Wiertz and
Ruyter, 2007)
A firm-hosted
online technique
supported
community
Relational Dimension: reciprocity, commitment to community,
commitment to host firm
Source: Author
Both of these research disciplines are significant for gaining a comprehensive view and
understanding of the dimensions of social capital and investigating how these dimensions are
conceptualized and operationalized. This is in turn will influence their potential effect on
brand knowledge in the OBCs. Thus the literature below is to review and evaluate these
empirical studies, which are summarized in Tables 2.7 and 2.8.
The dimensions of social capital in marketing context
According to Nahapiet and Ghoshal (1998), social capital can increase knowledge sharing,
create an information channel and facilitate cooperative behaviour. Thus Merlo, Bell, Bülent,
and Whitwell (2006) employ Nahpiet and Ghoshal’s conceptual framework in retailing
businesses and argue that social capital is regarded as the significant antecedent of customer
service orientation and store creativity. However, the study of Merlo et al. does not follow
Nahapiet and Ghoshal’s identification of each dimension; instead, the structural dimension is
articulated in terms of the degree of open communication facilitated by a social network
infrastructure, which enables retail employees to combine or share resources; the relational
dimension is reflected in terms of a trust culture, which is capable of increasing the
cooperation and support among service employees; the cognitive dimension is seen as the
67 | P a g e
shared vision that facilitates individual and group actions. Subsequently, the survey research
finding shows that open communication, shared vision and trust are positively related to
customer services orientation. These results are valuable and show that all the three
dimensions of social capital enhance customer service quality in a retailing store. Merlo et al.
also find that structural (open communication) and cognitive dimensions (shared vision)
have positive impacts on store creativity. Contrary to expectation, the relationship between
relational dimension and store creativity is not significant.
The dimensions of social capital have also been investigated in the field of Internet
marketing. Tsai (2006) explores social capital that resides in websites and discusses its
influences on customer knowledge flow in the context of a Taiwanese Internet store. The
research aim of Tsai’s study is to investigate the effect of dimensions of social capital and
customer knowledge flow on website innovation performance. This study also adopts
Nahapiet and Ghoshal’s framework, but it only considers structural and relational
dimensions of social capital. As the social capital is often applied in network analysis,
network structure characteristics are used to represent the structural dimension, including
centrality, structural equivalence, and network density. The constructs of the website-
customer relationship and customer-customer relationship are used to represent the relational
dimension of social capital. The empirical data demonstrates that centrality, equivalence and
density all have a positive effect on the absorptive capability and innovation performance of
a website. In respect of the relational dimension of social capital, there is an indirect positive
effect between the website-customer relationship and innovation performance. However, the
customer-customer relationship is not associated with absorptive capability or innovation
performance. The biggest contribution of Tsai’s study to the marketing literature is that it
confirms the presence of social capital in the online marketing environment, which resides in
the website-customer relationship and customer-customer relationship. This is consistent
with the assumption of this present study that social capital exists in the OBC context.
As seen in Table 2.7, social capital theory has been studied in understanding new ventures
learning for NPD (new product development) by placing significant emphasis on the role of
internal and external relationships. Atuachene-Gima and Murray (2007) argue that different
68 | P a g e
dimensions of social capital have differential effects on exploratory and exploitative learning
in NPD in new ventures in China. In line with Nahapiet and Ghoshal’s theoretical
framework, the authors distinguish between intra-industry managerial ties (e.g. connections
with other executives of other firms that operate within the actor’s same industry) and extra-
industry managerial ties (e.g. connections with managers of firm outside the actor’s industry).
In addition, power is introduced as another component of the structural dimension, actors in
a relationship can get things done and achieve their goals through their power (Alder and
Kwon, 2002). The relational dimension of social capital focuses on trust as a key resource
derived from relationships because it reflects the quality of the relationship (Tsai and
Ghoshal, 1998). Finally, solidarity and strategic consensus are determined as the key benefits
of cognitive social capital. This can diminish misunderstanding and promotes frequent
communication among organisational members (Atuachene-Gima and Murray, 2007). The
empirical finding shows that power and intra-industry managerial ties positively enhance
both exploitative and exploratory learning in NPD. In particular, extra-industry managerial
ties help members gain exposure to diversify the information. The relational dimension in
the form of trust increased exploitative but not exploratory learning. The cognitive
dimension was found to have a positive or neutral impact on learning.
In another marketing-orientated research paper, Hsieh and Tsai (2007) investigate the
influence of social capital as one of the key primary resources for innovation in high tech
firms, on the adoption of a launch strategy for innovative products. This study assumes that
social capital is positively associated with the launch strategy by measuring the structural
dimension. Here the structural dimension represents the embedded ties with partners (Uzzi,
1996). Based on this embeddedness between partners, social capital provides external
networks for the discovery of opportunities, testing of new product ideas, and the attainment
of resources (Aldrich and Zimmer, 1986; Lee, Lee and Penning, 2001). Further, the obtained
empirical findings confirm and support the positive relationship between the structural
dimension of social capital and a launch innovation strategy.
69 | P a g e
As discussed above, both studies from Atuachene-Gima and Murray and Hsieh and Tsai are
valuable in emphasizing the link between knowledge and product management, essentially
the impact of social capital on the strategic formulation of innovation launches.
Moreover, Lawson et al. (2008) extend the application of social capital theory to the buyer-
supplier relationship, which aims to investigate how social capital accumulates within the
strategic buyer-supplier relationship, and in turn contributes to improve buyer performance.
In Lawson’s research they consider structural and relational dimensions but disregard the
cognitive dimension, as they argue that most prior research primarily focuses on structural
and relational capital when examining buyer-supplier relationship effects on buyer-supplier
performance (i.e. Dyer and Nobeoka, 2000; Hoetker, 2005). Thus managerial
communication and technique exchange reflect the structural dimension; supplier integration
and closeness represent the relational dimension. The internet survey results provide insights
into how social capital is accumulated in the buyer-supplier relationship and then improve
the buyer performance: the relational dimension of social capital led to buyer performance;
and both managerial communication and technical exchange has significant effects in
improving buyer-performance. Accordingly, this study highlights the need to extend buyer-
supplier research by clarifying the informational, communication and knowledge-sharing
benefits associated with the structural and relational dimension (Koka and Prescott, 2002;
Krause, Handfield, and Tyler, 2007).
Anderson and Jack (2002) point out that social capital was originally described as a
relational resource comprised of personal ties. However, a subsequent broader
conceptualization presents social capital as a set of resources embedded in business
relationships or networks. This view is supported by Westerlund and Svahn (2008), and
discusses relationship value and its connection to the concept of social capital within
software companies. Economic exchange relationships, derived from transaction cost
analysis, have dominated the conceptual and empirical research on industrial relationships.
However, a relationship is not entirely about economic exchange (Easton and Araujo, 1992);
it also includes relational and social exchange. A large proportion of the emerging literature
on relationship value focuses only on the value of customer relationships or the value of

70 | P a g e
buyer-seller relationships. However, Westerlund and Svahn categorize other types of
relationships within business networks: relationship value involved in research and
development activities, relationship value involved in marketing and distribution activities,
and relationship value that facilitates and supports the business of the focal firm. The
structural, cognitive and relational aspects of social capital are identified as a basis for
creating relationship value, which can differ among the types of business relationships. The
findings suggest that the cognitive and structural dimensions of social capital in relationships
can be clearly distinguished. Particularly, they strongly contribute to the relational dimension,
which is the quality of relationships and is manifested through the concept of relationship
value. Westerlund and Svahn’s study is different from prior research discussed above, as it
examines the interrelated relationship among the three dimensions rather than operationally
separating them.
As stated earlier, social capital is a useful concept for understanding the network of
relationships (Adler and Kwon, 2002). The above research discussed the role of social
capital in different marketing contexts by disaggregating social capital into three distinctive
dimensions, which are followed and derived from the theoretical framework of Nahapiet and
Gohsal (see Table 2.6). The author finds that most of these prior studies examined the
dimensions of social capital in industrial marketing settings (i.e. the dimensions of social
capital facilitate NPD process and innovation in product management); retailing business (i.e.
the dimensions of social capital has positive influence on customer service quality and
retailing store creativity) and business relationships (i.e. customer-customer and buyer-
supplier relationships have been enhanced by the dimensions of social capital).
Although social capital has been discussed in the Internet marketing literature, researchers
still have been relatively slow in investigating the implication of these dimensions within
online marketing contexts. There is a lack of empirical studies of social capital in OBCs.
Therefore, the author turn next to the application of social capital in virtual communities,
since the construct of OBCs is similar to virtual communities.

71 | P a g e
The dimensions of social capital and facilitating knowledge sharing behaviour
As seen in Table 2.7, three empirical studies are selected to review the literature on the
social capital in virtual communities. These studies emphasize that the three dimensions of
social capital are regarded as driving factors to facilitate knowledge sharing (Kosonen, 2009).
Why has social capital become a common approach to understand knowledge sharing in
virtual communities? The reasons are justified below:
i. Knowledge is significant for virtual communities’ survival. A virtual community is
described as a social aggregation that emerges from the net when enough people
carry on those public discussions long enough, with sufficient human feeling, to form
webs of personal relationship in cyberspace (Rheingold, 1993, 2000). Hence social
interactions and sets of resources embedded within a network of relationships can
sustain virtual/online communities (Chiu et al., 2006). In addition, many individuals
participate in virtual communities to seek and share knowledge to resolve problems
in real life. Therefore, without rich knowledge, virtual communities are of limited
value (Chiu et al., 2006).
ii. A review of Nahapiet and Ghoshal’s definition of social capital indicates social
capital is itself the access to other knowledge and sources. In this manner, Chetty and
Agndal (2007) suggest that knowledge is socially embedded, residing in situations
and relationships. Therefore, the dimensions of social capital directly affect the
combination-and-exchange process and provide relatively easy access to network
resources (McFadyen and Cannella Jr, 2004; Wiertz and Ruyter, 2007).
The following literature reviews how social capital influences knowledge sharing or creation
in virtual communities and what sort of issues have been raised in these three studies with
respect to the identification, manifestation and effects of each dimensions of social capital.
The first one is Wasko and Faraj (2005), who adapt Nahapiet and Ghoshal’s framework to
explore the role of the dimensions of social capital in relation to knowledge contribution in
electronic networks. However, Nahapiet and Ghoshal focused on the group level of social
capital. Wasko and Faraj suggest examining social capital at the individual level, to explore
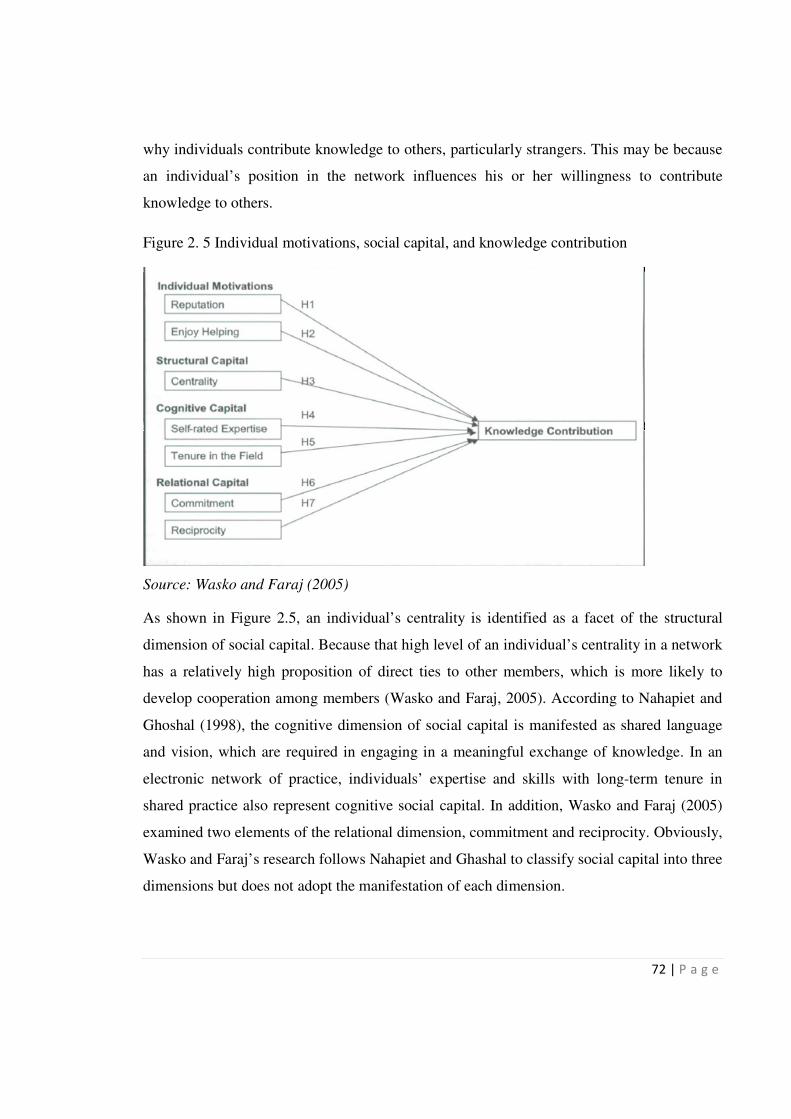
72 | P a g e
why individuals contribute knowledge to others, particularly strangers. This may be because
an individual’s position in the network influences his or her willingness to contribute
knowledge to others.
Figure 2. 5 Individual motivations, social capital, and knowledge contribution
Source: Wasko and Faraj (2005)
As shown in Figure 2.5, an individual’s centrality is identified as a facet of the structural
dimension of social capital. Because that high level of an individual’s centrality in a network
has a relatively high proposition of direct ties to other members, which is more likely to
develop cooperation among members (Wasko and Faraj, 2005). According to Nahapiet and
Ghoshal (1998), the cognitive dimension of social capital is manifested as shared language
and vision, which are required in engaging in a meaningful exchange of knowledge. In an
electronic network of practice, individuals’ expertise and skills with long-term tenure in
shared practice also represent cognitive social capital. In addition, Wasko and Faraj (2005)
examined two elements of the relational dimension, commitment and reciprocity. Obviously,
Wasko and Faraj’s research follows Nahapiet and Ghashal to classify social capital into three
dimensions but does not adopt the manifestation of each dimension.

73 | P a g e
Wasko and Faraj use a combination method of mail survey and observation of posting
messages to collect data. The dimensions of social capital are regarded as independent
variables; knowledge contribution is set as an independent variable in terms of helpfulness
and volume. The results support most of Wasko and Faraj’s research hypotheses that social
capital has a significant influence on knowledge contribution. In particular, the cognitive
dimension of social capital is seen as a vital factor underlying knowledge contribution in
electronic networks of practice. However, the relational dimension of social capital does not
appear to contribute to knowledge.
As will be seen in Figure 2.6, Chiu et al. extend the previous work of Wasko and Faraj. The
study by Chiu et al. (2006) is directly relevant to the work of Wasko and Faraj (2005), and
examines the influence of the dimensions of social capital on knowledge sharing within a
professional virtual learning community. They simplify these dimensions as: social
interaction ties (a structural dimension); trust, norms of reciprocity and identification (a
relational dimension); and shared vision and language (a cognitive dimension), which is the
same as Nahapiet and Ghoshal’s manifestation of each dimension. This is one of the key
differences between the research model of Chiu et al. and that of Wasko and Faraj in terms
of independent variables. Further, Chiu et al. develop a web-survey to collect data, as they
believe that a web-survey has no time and geographic restrictions especially for online
participants.
In addition to the dimensions of social capital, the dependent variable consists of two
characteristics: quality of knowledge sharing, and quantity of knowledge sharing, which is
similar to the way Wasko and Faraj (2005) measure knowledge creation. With regards to the
impact of social capital on knowledge sharing, the key research finding of Chiu et al. is
illustrated below:
� Social interaction ties and the norm of reciprocity and identification increase
knowledge sharing quantitatively, but not qualitatively.
� The norms of reciprocity and identification exert a positive and strong effect on trust.
� Trust has a positive impact on the quality of knowledge sharing.
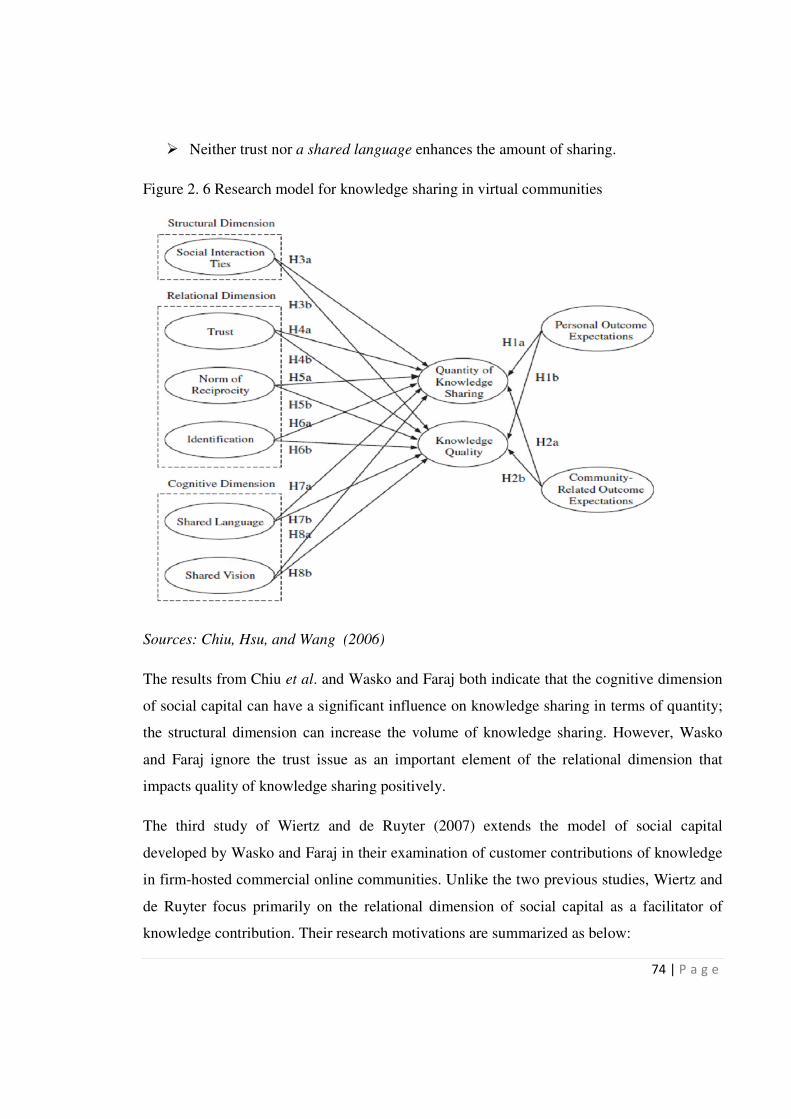
74 | P a g e
� Neither trust nor a shared language enhances the amount of sharing.
Figure 2. 6 Research model for knowledge sharing in virtual communities
Sources: Chiu, Hsu, and Wang (2006)
The results from Chiu et al. and Wasko and Faraj both indicate that the cognitive dimension
of social capital can have a significant influence on knowledge sharing in terms of quantity;
the structural dimension can increase the volume of knowledge sharing. However, Wasko
and Faraj ignore the trust issue as an important element of the relational dimension that
impacts quality of knowledge sharing positively.
The third study of Wiertz and de Ruyter (2007) extends the model of social capital
developed by Wasko and Faraj in their examination of customer contributions of knowledge
in firm-hosted commercial online communities. Unlike the two previous studies, Wiertz and
de Ruyter focus primarily on the relational dimension of social capital as a facilitator of
knowledge contribution. Their research motivations are summarized as below:

75 | P a g e
i. The impacts of both the structural and cognitive dimensions of social capital do not
differ in the context of firm-hosted online communities, as confirmed by Wasko and
Faraj (2005); Chiu et al. (2006) and Tsai (2006).
ii. Wasko and Faraj (2005) were unable to prove the positive effect of the relational
dimension of social capital on knowledge sharing in electronic networks. As a result,
Wiertz and Ruyter (2007) decided to re-examine the efficacy of the relational
dimension on knowledge contribution.
In line with Wasko and Faraj (2005), Wiertz and Ruyter identify the same independent and
dependent variables (see Figure 2.7), but divide the commitment variable into two layers
(commitment to community and commitment to host firm) since the research context is firm-
hosted communities. They employ the same method as Chiu et al., which is a purely
quantitative study. Contrary to research expectations, the empirical results show that
reciprocity does not have a significant effect on the quality or quantity of knowledge
contributed. In contrast with Wasko and Faraj’s findings, customers’ commitment to the
firm-hosted online communities contribute to knowledge, both qualitatively and
quantitatively. On the other hand, commitment to the host firm negatively impacts on the
quality of knowledge contribution.
Figure 2. 7 A conceptual model of knowledge contribution in firm-hosted online
communities
Sources: Wiertz and de Ruyter (2007)

76 | P a g e
The three empirical studies discussed above appear to have been conducted using similar
approaches by adopting Nahapiet and Gohsal’s theoretical framework and the survey
methods. Yet they have resulted in different identifications and manifestations of the
dimensions of social capital according to different contexts. Not all the dimensions impact
positively on knowledge sharing and contribution, which support the viewpoint of Widen-
Wulff and Ginman3 (2004). However, the focal point of these empirical studies is to examine
knowledge sharing behaviour from a social capital perspective; other influential factors are
also considered, including individual motivation (Wasko and Faraj, 2004; Wiertz and Ruyter,
2007), and personal outcome and community-related outcome expectations (Chiu et al.,
2006). This indicates that the dimensions of social capital are affected indirectly by these
factors.
After reviewing these empirical studies of the dimensions of social capital in marketing
contexts and virtual communities, it is evident in both conceptual and empirical literature
reviewed that the manifestations and facts of each dimension of social capital vary, as the
ultimate value of a given form of social capital depends on contextual factors (Chen, Ching,
Tsai, and Kuo 2008). The author finds three major insights:
i. Most of the authors linking social capital and knowledge sharing or creation typically
adopt Nahapiet and Gohsal’s framework, which identifies structural, cognitive and
relational dimensions of social capital in their empirical studies. This indicates that
Nahapiet and Goshal’s framework is widely accepted across different research
contexts; it is not just useful in knowledge management but also extend into a
marketing context. In particular, a key area of interest between social capital and
knowledge sharing lies in the study of virtual communities. However, there appears
to be a gap in that the communication dimension of social capital has not been
considered in any empirical studies.
3 As stated earlier, Widén-Wulff and Ginman (2004) suggest that the dimensions of social
capital and knowledge sharing should be studied in different contexts, because the output of
social capital and knowledge sharing is affected by the context in which it is built up.

77 | P a g e
ii. The manifestations of each dimension of social capital very, and each dimension
works differently according to a variety of contexts. Some researchers do not concern
all the three dimensions in one study. For example, Hsieh and Tsai (2007) only adopt
and examine a structural dimension in respect of product management research.
iii. The consequence of social capital’s impact on knowledge in an organisation or
community covers two aspects: firstly, social capital increases capability to share
knowledge; secondly, social capital is an aid to adaptive efficiency, creativity, and
learning, which in turn facilitate a firm's value creation potential (Cummings, Heeks,
and Huysman, 2006).
Drawn from conceptual and empirical studies concerning the concept of social capital, all
studies discuss the definition and dimensions in relation to the particular discipline and
research context. This provides a justification for clarifying the dimensions of social capital
in the marketing context of OBC to which the review next turns.
2.3.5.3 Identifying the dimensions of social capital in the OBC
Drawn from conceptual and empirical studies concerning the dimensions of social capital,
the author found that each dimension is manifested differently, and works in intensity
according to different contexts. However, most of these studies did not empirically examine
and measure the communication dimension of social capital (Hazleton and Kennan, 2000).
In order to fill the research gap, this study incorporates the communication dimension as the
fourth dimension of social capital in OBCs from a marketing perspective, rather than
replacing the cognitive dimension. Thus the dimensions of social capital are identified in
OBCs as a structural, relational, cognitive and communication dimension. Also these four
dimensions are measured in this empirical research to investigate how social capital impacts
on developing effective brand knowledge in the OBC. Although this study follows Nahapiet
and Goshal’s framework, it does not adopt their manifestations of each of these dimensions,
because the OBC differs notably from organisation settings since interactions among OBC
members are through online communication. Most importantly, this section provides
justifications for incorporating the communication dimension in the present study.

78 | P a g e
Structural dimension
The structural dimension of social capital has a positive impact on knowledge sharing in
electronic networks (Widen-Wulff and Ginman, 2004; Chiu et al., 2006). Coleman (1988)
notes that information and knowledge are significant in providing a basis for action, but
these are costly to gather. Interaction ties are seen as the fundamental proposition of
structural social capital, which provides access to information and knowledge (Nahapiet and
Ghoshal, 1998; Hazleton and Kennan, 2000; Koka and Prescot, 2002). In this case, social
relationships are established through interaction ties that can reduce the amount of time and
investment necessary to gather information and knowledge (Tsai and Ghoshal, 1998). More
specifically, interaction is seen as a unique characteristic for OBCs, as this study discussed
in chapter one, which refers to the degree of information exchange among members (Jang et
al., 2008). An OBC consists of a group of people with different backgrounds, abilities,
knowledge and experiences of a specific brand or product; therefore, motivating interaction
among those individuals is very important. Granovetter (1973) emphasizes the strength of
social ties as the amount of time spent together with other members, and the emotional
feelings of intensity and intimacy. Within OBCs, social capital resides in the relationships
among registered community members; the interaction ties represent the strength of these
relationships, the amount of time spent, and frequency of communication among members.
Relational dimension
Trust has been widely studied by scholars as the key element of the relational dimension of
social capital, which reflects the quality of social relationships (Tsai and Ghoshal, 1998;
Atuahene-Gima and Murray, 2007). However, trust is divided into different types (e.g.
economy-based trust, information-based trust and identification-based trust) and other levels,
which are difficult to measure (Widen-Wulff and Ginman, 2004). Instead, identification and
commitment are a manifestation of the relational dimension of social capital in online
networks (Wasko and Faraj, 2005). Within an OBC, a group of individuals get together and
share interests toward a certain product or brand. In this case, the relational dimension of
social capital exists when members have strong identification with collective activities
(Lewicki and Bunker, 1996) and commitment contributed to other fellow members and their
79 | P a g e
community (Coleman, 1990; Ellemers, Kortekaas, and Ouwerkerk, 1999). In this study,
identification arises from an individual involvement and represents members’ sense of
belonging toward the OBC, which is helpful in explaining customers’ willingness to
maintain long-term relationships with the community (Bagozzi and Dholakia, 2002).
Commitment is reflected as individual members’ moral responsibility and attachment to their
OBC.
Cognitive dimension
The cognitive dimension of social capital normally reflects as shared language and vision,
which can facilitate and influence the conditions for the combination and exchange of
resources (Nahapiet and Ghoshal, 1998). For example, shared language provides a common
conceptual apparatus for participants to understand each other, and to build a common and
shared vocabulary in their communities. Researchers have confirmed that shared goals of the
cognitive dimension do not have positive or direct impacts on a company’s creativity (Chen
et al., 2008) and relationship value (Westerlund and Svahn, 2008); shared language was not
found to enhance quality of knowledge sharing in virtual communities (Chiu et al., 2006).
However, the efficacy of the cognitive dimension of social capital would differ in the case of
the context of online brand communities, because shared language plays an essential role to
improve the efficiency of communication among members with similar interests and
experience of the same brand or product. It may also support the development of new
product ideas and concepts by enhancing combination capability (van Vuuren, 211).
Communication dimension
Since the literature reinforces the importance of communication for social capital,
communication is needed to develop social ties and to facilitate the flow of information
within social groups or networks (Coleman, 1988). This dimension is supported by Widen-
Wulff and Ginman (2004), and argues that social capital theory and information behaviour
are integrated to explore the consequences of social capital and knowledge sharing. The
construction of knowledge sharing results from group information behaviour. Within a brand
community, a group of individuals get together to produce questions and answers as a
process of analysing, storing, using and refusing information to establish shared knowledge

80 | P a g e
toward a specific brand or product. Widen-Wulff, Ginman, Perttila, Sodergard, and
Totterman (2008, p.347) describe social capital in terms of “three dimensions affecting the
construction of social environment enabling sharing and communication within groups and
organisations”. This definition reinforces the significant role of the communication process
as a basis for collective creativity, innovation and productivity in a group or community
(Cronin, 1995).
On the other hand, communication is believed to influence the mobilization of social capital
(Chan, 2008). In this case, social capital is understood to be an individual’s social
relationships or ties with others, and provides potential embedded resources that can be
accessed, stored and utilized for actions that lead to expected economic and non-economic
returns (Lin, 1999; Chan, 2008). Synthesizing various formal definitions of social capital can
support this viewpoint. As the earlier section mentions, social capital has multiple theoretical
propositions, measurements and applications, each proposition having implicit and explicit
assumptions on the role of communication behaviour impacting on social capital (Chan,
2008). Pierre Bourdieu, James Coleman, Robert Putnam and Nan Lin all make influential
contributions to the literature of social capital (Field, 2003).
Pierre Bourdieu – communication for accumulation: social capital is viewed by Bourdieu as
the resources derived from a group of members or networks. This indicates that the resources
obtained depend on the quality and quantity of social relationships and for the development
of those relationships, time is needed to accumulate and maintain them. The overall
sociological framework of Bourdieu is concerned with how differential access to various
forms of capital (e.g. economic, cultural, social etc.) creates and reproduces generational
class stratification within a society. In other words, the creation and maintenance of social
capital, according to Bourdieu, is one aspect of an overall strategy to maximize and secure
one’s position in society and to pass on the benefits to the next generation (Bourdieu, 1986).
The function of communication towards social capital is not emphasized directly by
Bourdieu, but he does make a distinction between access to social capital and social capital
utilization. This distinction indicates that the utilization of social capital does not happen

81 | P a g e
instinctively, that the embedded resources have to be transmitted through communication
among people (Chan, 2008).
James Coleman – communication for social control: Coleman (1988) argues that social
capital is stored in the structure of social relations among actors, not in the actors themselves
or in any physical means of production (Lumsden, 2006). Furthermore, Coleman (1990)
emphasizes three antecedents of utilizing social capital, in particular the essentiality of
communication to develop social ties and facilitate the flow of information so as to enforce
the norms and control members’ behaviours within a society (Chan, 2008).
Robert Putnam – communication for interactions: Putnam (1993) draws social capital in to
civic societies and suggests that it can facilitate co-operation and mutually supportive
relationships in communities and nations. Face-to-face communications are stressed to
enhance the trust and interactions of civic engagement. With the popularity of the Internet,
Putnam (2000) is concerned that the Internet or e-communication technology could replace
traditional face-to-face or telephone contact with families and friends, and diminish social
capital in the U.S. However, Quan-Hasse and Wellman (2002) argue that the Internet works
as a supplementary communication channel to help individuals maintain existing ties; having
more opportunities to interact with others through online communications.
Nan Lin – communication as means for a personal end: Lin (2001) defines social capital
with a resource-based view: “social capital is resources embedded in a social structure that
are accessed or mobilized in purposive actions” (p.29). However, Lin’s view of
communication is different to that of Putnam; he argues that the emergence of cyberspace on
the Internet may become a new era in the construction and development of social capital
(Lin, 2001; Cummings et al., 2006). The popularity of online social network sites (SNSs) is
the best example of the social use and influence of the Internet, such as, Facebook, Twitter
etc. Those SNSs allow individuals to present themselves, articulate their social networks,
and establish or maintain interactive connections with others (Ellison, et al., 2007).
From a relationship marketing perspective, e-communication “encompasses the entire
exchange relationship” (Wu and Lee, 2005, p.11), which is one of the fundamental aspects

82 | P a g e
of e-marketing activities to establish and maintain the relationship with customers and
stakeholders (Deighton and Barwise, 2001). Because of that, e-communication can provide
real-time interactivity among consumers and facilitate the information and knowledge flow
across firm boundaries (Wu and Lee, 2005). In particular, customer-to-customer
communication (or C2C exchanges) creates value through the sharing of experiences
(Arnould and Price, 1993), the sharing of physical, emotional and monetary resources or
information (McAlexander et al., 2002). Furthermore, Bagozzi and Dholakia (2002) note
that the value created for participants can occur in different forms, such as economic value
(e.g. reducing prices or increasing benefits), personal value (e.g. providing encouragement),
and social value (e.g. sharing emotional feelings and stories). Also, the research context of
online brand communities is an example of a type of situation where C2C value creation
occurs (McWilliams, 2000; Gruen, Osmonbekov, and Czaplewski, 2005).
As mentioned in section 2.3.5.1 earlier in this chapter, the communication dimension is
visible especially in information management research (Widen-Wulff and Ginmen, 2004). It
has four functions to stock and utilize social capital: information exchange, problem
identification, behaviour regulation and conflict management. In particular, information
exchange is the fundamental aspect, because of its importance to gather knowledge and
contribute to the relationships between people within a network or organisation (Huotari,
2000). In favourable conditions, the positive results of information exchange between
members would influence and shape people’s attitudes, problem solving and decision-
making (Widen-Wulff et al., 2008). In this case, information exchange is in connection with
the three other functions of the communication dimension of social capital, which could
further bind together individuals into a strong social environment (Hazelton and Kennan,
2000; Nahapiet and Ghoshal, 1998; Widen-Wulff et al., 2008). In this case, the
communication dimension of social capital is manifested as information exchange in the
context of OBCs.
83 | P a g e
2.3.6 Summary
This section introduced the concept of social capital and provided a range of definitions
through which social capital was conceptualized (i.e. the economic literature, political
science, sociological literature etc) (Butt, 2008). Social capital has been explained in a
community sense, embedded and residing in a network of relationships.
This section then identified and detailed the structural, cognitive and relationship dimensions
suggested by Nahapiet and Ghoshal (1998) as a popular framework that has been widely
used within literature linking social capital and knowledge sharing or creation. Most
importantly, these dimensions are suggested as the measurements for the social capital
concept. In addition, Hazelton and Kennan (2000) introduce another communication
dimension for social capital. However, after reviewing a number of empirical studies
regarding the dimensions of social capital from marketing contexts and virtual communities,
the author found that the communication dimension has not been considered in any previous
empirical research.
A review of the literature on social capital was presented from a multi-dimensional
perspective, to gain a deeper understanding of what social capital is and how it works. The
definition and dimensions of social capital vary according to different research disciplines.
The aim of the present study is to explore the marketing potential of social capital in an OBC,
by investigating the differential effects of each dimension of social capital on brand
knowledge. Therefore, this section has sought to clarify social capital in an OBC on three
fronts:
i. the presence of social capital in an OBC has been confirmed and supported
ii. a working definition of social capital in an OBC has been given
iii. instead of the three traditional dimensions of social capital, this present study
introduced the communication dimension as the fourth dimension of social capital
from a marketing perspective.

84 | P a g e
Having reviewed and discussed the literature of OBC, brand knowledge and social capital,
the following section is to present a conceptual framework that encapsulate the key factors
of interest to this current study, and identify the hypothesis relationships between these
factors.
2.4 Hypotheses development and conceptual framework
2.4.1 The development of the conceptual framework in this study
2.4.1.1 The role of social capital in the OBC
This thesis acknowledges that the term social capital has been traditionally addressed in
economic theory and civic terms. Nowadays, scholars generally agree that social capital is
playing an important role in understanding the nature of social relations and networks among
individuals and within organisations, and consequently, social capital has become a useful
theoretical approach to understand these interactive relationships (Terjesen, 2005; van
Vuuren, 2011).
Social capital has been identified in a number of disciplines; researchers and scholars have
consistently supported its presence and benefits in both physical and virtual communities. As
section 2.1 mentioned, an OBC is formed by a set of consumer-brand triad relationships
(Muniz and O’Guinn, 2001). The author believes that social capital resides in “consumers-
to-consumers” and “consumers-to-community” relationships (Chang and Chuang, 2010). In
addition, regarding the distinctive characteristics, commitment, interaction and quality of
information are reflected as the key elements of the social capital concept. Therefore, the
existence of social capital in an OBC is evident. Social capital has been re-defined in an
OBC as social resources embedded in the relationships between individual OBC members
and their connections with the community.
Further, the significance of social capital towards OBC studies has been highlighted. The
first direct benefit of social capital is information (Adler and Kwon, 2002): social capital
provides network ties helping OBC members gain access to broader sources of information
and improve the quality, relevance and timelessness of information. In addition, Requena
(2003) suggests that the importance of social capital lies in the social support, integration
85 | P a g e
and cohesion it provides. The OBC is a structured set of consumer-brand relations
articulated online which provide a space for consumers to communicate about the brands,
sharing ideas and experiences. In this manner, OBCs make access to social support,
integration and cohesion possible; consumers are motivated to participate in OBCs (Chi,
2011). Therefore, it is suggested that social capital exerts a positive influence on OBC
members’ participation. Social capital is proposed as a major aspect towards OBC research
in the present study.
2.4.1.2 The role of brand knowledge in the OBC
Brand knowledge in an OBC represents the knowledge, experience and know-how regarding
the use of certain admired products (Algesheimer et al., 2005). It is not the facets of a brand;
it is all about the thoughts, feelings, perceptions, images, and experiences that become linked
to the brand in consumers’ minds (Keller, 2009).
Brand knowledge is significant to the survival of OBCs, as the formation of OBCs is based
on the existence of shared information and knowledge related to the brand of interests. It has
two roles in OBCs: firstly, brand knowledge is seen as the major reason and motivation
driving consumers to participate in OBC activities; secondly, brand owners may obtain
valuable brand knowledge from consumers’ active participation of OBC activities, which
can facilitate their NPD process. An OBC offers a network of relationships with the brand
and with other consumers (Keller, 2003); within this community relationship, consumers can
communicate with each other toward the product or brand through the interactive exchange
process (McAlexander et al., 2002; Füller et al., 2008). As a result, brand knowledge can be
developed and enhanced through consumers’ participation in OBC activities.
2.4.1.3 Linking the dimensions of social capital and brand knowledge
Both the concepts of social capital and brand knowledge are vital for the sustainability of
OBCs. Many scholars and researchers frequently refer to the dimensions of social capital for
a better understanding of this complex concept. In particular, these dimensions have been
widely accepted as measurements for social capital.

86 | P a g e
Most importantly, the dimensions of social capital have great influence on knowledge
sharing and creation in both an organisation setting and virtual communities. Thereby, an
OBC – a typical form of virtual community – with a higher level of social capital may
generate a quality of product information and brand knowledge. The author assumes that the
dimensions of social capital may impact on developing effective brand knowledge. The
major focus of this research is to investigate the influence of the dimensions of social capital
on brand knowledge in OBCs.
In this present study, the conceptual framework draws together the researcher’s thoughts
about the phenomenon of social capital and brand knowledge, and connects the key issues
from the literature review. This initial conceptual framework helps to guide the research
process. The literature review has offered a comprehensive critical review of social capital
and brand knowledge, which forms the conceptual framework tested in this study, shown in
Figure 1.1.
The framework identifies that an OBC is the research context for this study, Following
Nahapiet and Ghoshal (1998) and Hazleton and Kennan (2000), social capital is defined in
terms of four distinct dimensions: structural, cognitive, relational and communication.
Among the most important facets of the structural dimension is the presence or absence of
social interaction ties between actors (Liao and Welsch, 2005). Among the key facets of the
cognitive dimension is shared language. Among the key facets of the relational dimension
are identification and commitment. Quality and quantity of information exchange represent
the communication dimension of social capital. Brand knowledge constitutes two
components: brand awareness and image, as it cannot be simply measured through quality
and quantity.
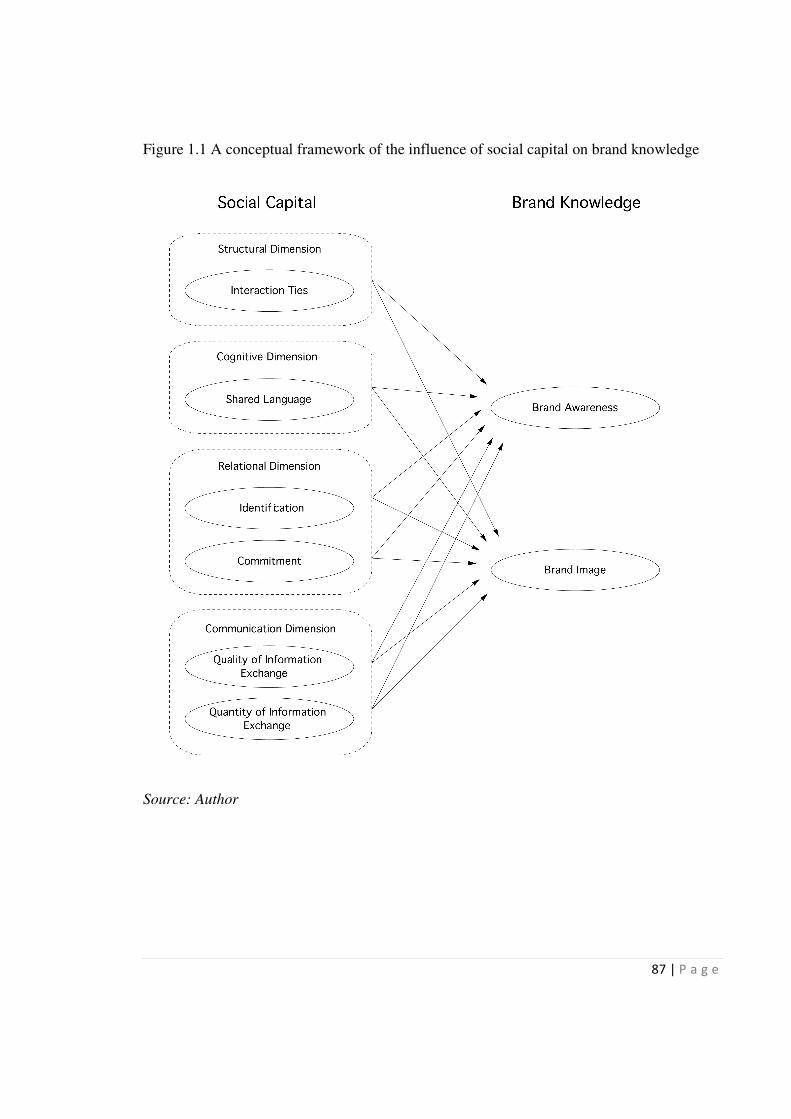
87 | P a g e
Figure 1.1 A conceptual framework of the influence of social capital on brand knowledge
Source: Author
88 | P a g e
2.4.2 The development of research hypotheses in this study
The purpose of this section is to develop and form research hypotheses on how each facet of
the dimensions of social capital influence brand knowledge in terms of brand awareness and
brand image.
Interaction ties for brand knowledge
Social interactions ties are seen as the fundamental propositions of the structural dimension
of social capital, which provides access to resources (Nahapiet and Ghoshal, 1998).
Granovetter (1973) described tie strength as a combination of the amount of time, the
emotional intensity and intimacy. Both Larson (1993) and Ring and Van de Ven (1994)
noted that the more social interactions undertaken by exchange partners, the greater the
intensity, frequency and breadth of information exchanged. Nahapiet and Ghoshal argued
that interaction ties influence access to combining and exchanging information and
knowledge. In this study, social capital resides in the social relationships among registered
members of OBCs; thus the interaction ties represent the strength of these relationships, the
amount of time spent together and frequency of communication among members. Recent
empirical studies have provided support for the influence of interaction ties on knowledge
acquisition and knowledge sharing in virtual communities (Wasko and Faraj, 2005; Chiu et
al., 2006; Wiertz and Ruyter, 2007). These interaction ties provide a cost-effective way for
members to access a wider range of information and knowledge. In this case, through close
social interactions, consumers within OBCs can learn more about products and exchange
personal experience to support each other in solving problems, in turn, to pool and
disseminate greater brand knowledge (Hung and Li, 2007). Therefore, hypothesis H1a and
H1b are stated as follows:
H1a Interaction ties from participation have a positive effect on brand
awareness in an OBC.
H1b Interaction ties from participation have a positive effect on brand image
in an OBC.
89 | P a g e
Shared language for brand knowledge
According to Cummings et al. (2006), the cognitive dimension has been revised as the
cognitive ability to share, which combines Nahapiet and Ghoshal’s classification with that of
Adler and Kwon (2002). Nahapiet and Ghoshal stated that there are several ways in which
shared language influences the conditions for combination and exchange. Firstly, shared
language can facilitate an individual’s ability to gain access to other people and their
information. Secondly, shared language may provide a common conceptual apparatus for
evaluating the likely benefits of exchange and combination. To the extent that their language
is different, this would keep people apart and restrict their access to information and
knowledge. Thirdly, a shared language enhances the capability of different parties to
combine the information and knowledge they gained through social exchange. Accordingly,
shared language is essential for virtual communities as it provides a common understanding
for all the participants (Chiu et al., 2006). Further, a common vocabulary developed from the
shared language would improve the efficiency of communication among people with the
same interests and similar practical experience. In the context of OBCs, shared language
would help to motivate consumers to be actively involved in sharing their brand knowledge,
and enhance the strength of brand knowledge. Therefore, the hypotheses to be tested are:
H2a Shared language from participation has a positive effect on brand
awareness in an OBC.
H2b Shared language from participation has a positive effect on brand image
in an OBC.
Identification for brand knowledge
In an online network, identification represents one key aspect of the relational dimension of
social capital (Wasko and Faraj, 2005). It refers to the extent to which actors view
themselves as connected to others (Widén-Wulff and Ginman, 2004). In particular, within an
OBC, the relational dimension of social capital exists when members have strong
identification with collective activities on sharing interests towards a certain product and
brand (Lewicki and Bunker, 1996). In other words, identification refers to an individual’s

90 | P a g e
sense of belonging and positive emotional feeling toward a brand community, which is a
result of their membership. This is helpful in explaining consumers’ willingness to keep
committed relationships with the community. Furthermore, Nahapiet and Ghoshal (1998)
argued that identification acts as a resource influencing the motivation to combine and
exchange knowledge. However, given that valuable brand knowledge is embedded in
individual consumers, and people usually tend to keep the knowledge, one would not share
and contribute one’s knowledge unless the person is recognized as one of their community
members (Chiu et al., 2006). From a marketing perspective, the community member’s
identification with the brand community is seen as a central characteristic of that community
(Matzler, Pichler, Füller, and Mooradian, 2011). It has been defined as ‘the perception of
belonging to a group with the result that a person identifies with that group’ (Bhattacharya,
Hayagreeva and Glynn, 1995). Therefore, identification can evaluate an individual’s
activeness and willingness to contribute and increase the depth and breadth of brand
knowledge. As such, it is hypothesised that:
H3a Identification from participation has a positive effect on brand awareness
in an OBC.
H3b Identification from participation has a positive effect on brand image in
an OBC.
Commitment for brand knowledge
In addition to identification, commitment is another significant aspect of the relational
dimension of social capital in online networks (Wasko and Faraj, 2000). Commitment
represents a duty or obligation to engage in future action which arises from frequent
interactions (Coleman, 1990). In marketing literature, commitment is described as an
enduring desire to maintain a valued relationship with customers and stakeholders (Morgan
and Hunt, 1996). In this regard, Wasko and Faraj (2005) argued that individuals participating
in an online network who feel a strong sense of commitment to the community are more
likely to consider it a duty to assist other members and contribute knowledge. However,
prior research finds that commitment does not have a direct effect on knowledge
91 | P a g e
contribution in online communities of practice (Wasko and Faraj, 2005), or online
commercial communities (Wiertz and Ruyter, 2007). In this study, the moral commitment
among members is seen as a key characteristic of brand communities (Casaló et al., 2010).
Individuals are supposed to have a sense of moral responsibility to share their interests and
experience with other members. Hence, the influence of commitment on brand knowledge
would differ in the marketing context of OBCs. This leads to the following hypotheses:
H4a Commitment from participation has a positive effect on brand awareness
in an OBC.
H4b Commitment from participation has a positive effect on brand image in
an OBC.
Information exchange for brand knowledge
There has so far been little empirical research into the influence of the communication
dimension of social capital. It has four functions to stock and utilize social capital:
information exchange, problem identification, behaviour regulation and conflict
management (Hazleton and Kennan, 2000; Widen-Wulff and Ginman, 2004). Several
conceptual studies have included information exchange as a key element of this
communication dimension because of its importance to gather knowledge and contribute to
the relationships between people within a network or organisation (Huotari, 2000). To some
extent, the positive results of information exchange between members would influence and
shape people’s attitudes in problem solving and the decision making process (Widen-Wulff
et al., 2008). In this case, information exchange is in connection with the other three
functions of the communication dimension of social capital, which could further bind
together individuals into a strong social environment (Hazleton and Kennan, 2000; Nahapiet
and Ghoshal, 1998; Widen-Wulff et al., 2008). In addition, there are two characteristics of
information exchange: quality and quantity (Wasko and Faraj, 2005; Chiu et al., 2006; Lu
and Yang, 2010).

92 | P a g e
Therefore, having hypothesised that the quality and quantity of information exchange may
increase and enhance the strength of brand knowledge in terms of brand awareness and
image, the following hypotheses are proposed:
H5a Quality of information exchange from participation has a positive effect
on brand awareness in an OBC.
H5b Quantity of information exchange from participation has a positive effect
on brand image in an OBC.
H6a Quality of information exchange from participation has a positive effect
on brand awareness in an OBC.
H6b Quantity of information exchange from participation has a positive effect
on brand image in an OBC.
2.5 Summary
The first section of the literature review presented OBCs as the specific research context on
which this present study is focused. The overview of the development of communities and
virtual communities reveals the community setting of an OBC (Muniz and O’Guinn, 2001).
Then, the characteristics, classification and consumers’ participation in an OBC were
discussed. In particular, the importance of consumers’ participation was highlighted with
specific emphasis on shared and exchanged information among community members that
motivate consumers’ active participation in the OBC (Kozinets, 2002; Sung and Lim, 2002;
Bagozzi and Dholakia, 2006). Also, the formation of OBCs is based on the existence of
shared interest and knowledge of a certain brand or product (Algesheimer et al., 2005). This
kind of shared knowledge or exchanged information within OBCs can be defined as brand
knowledge in branding literature.
The review continues with a section discussing the concept of brand knowledge. It identified
the structure and content of brand knowledge from branding literature. As the literature of
OBC suggests, brand knowledge plays a significant role in motivating and encouraging
93 | P a g e
consumers’ active participation in OBCs, which can be developed through interactive
communication among OBC members.
The concept of social capital is introduced and defined in a community sense and its
theoretical application to knowledge sharing and creation has been discussed (Nahapiet and
Ghoshal, 1998). The structural, relational and cognitive dimensions of social capital are
identified as those most often empirically examined in some marketing contexts and virtual
communities. However, the communication dimension (Hazelton and Kennan, 2000) has not
been considered in any previous empirical research. The first section of this chapter
introduced the OBC as a specific research context to this study to explore the marketing
potential of social capital and its impact on brand knowledge. Hence, the use of social capital
in OBCs is investigated in two ways: first, to explore the presence of social capital in OBCs;
and second, to predict that social capital has potential impacts on brand knowledge in the
context of OBCs.
The literature provides theoretical evidence that social capital exists and resides in
‘consumer-consumer’ and ‘consumer-community’ relationships within OBCs. The
dimensions of social capital are assumed as crucial factors influencing brand knowledge.
Most importantly, this study incorporates the communication dimension as the fourth
dimension of social capital from a marketing standpoint. In order to understand the
relationship between the dimensions of social capital and brand knowledge, hypotheses are
developed for four main objectives in this study.
i. To investigate the presence of social capital with four dimensions (i.e. structural,
cognitive, relational and communication dimensions) in the Chinese Volkswagen
consumer-initiated OBCs
ii. To investigate the presence of brand knowledge with two dimensions (i.e. brand
awareness and brand image) in the Chinese Volkswagen consumer-initiated OBCs
iii. To investigate the relationship between each dimension of social capital and brand
knowledge in the Chinese Volkswagen consumer-initiated OBCs

94 | P a g e
iv. To evaluate the efficacy of each dimension of social capital, with regard to
developing effective brand knowledge in the Chinese Volkswagen consumer-
initiated OBCs.
The conceptual model presented in Figure 2.8 forms the basis of the empirical components
of this study, and also informs the development of an appropriate research design discussed
in the following methodology chapter.

95 | P a g e
Chapter 3 Research Methodology
3.0 Introduction
Chapter 2 outlines the context in which the research takes place and the theoretical
framework developed from this study, before presenting the hypotheses to be investigated.
This chapter presents a comprehensive discussion and rationale behind the selection of the
research methodology for this study, which is organised into eight main sections:
� Section 1: Summarizes three philosophical approaches to research and outlines the
philosophical position of the author. Within the discussion, issues of epistemology are
explored, along with a wider discussion of the deductive approach to research
employed in this study
� Section 2: Refines the research propositions of this study
� Section 3: Identifies the research context
� Section 4: Survey design is examined in detail, including the justification of the
method and data collection instrument
� Section 5: Sampling issues are discussed
� Section 6: Describes the whole process of the development of the online self-
completion questionnaire. In this section, measurement instruments and scales are
specified
� Section 7: Outlines the specific procedures of data collection
� Section 8: Selects and justifies the appropriate data analysis techniques, i.e. CFA,
correlation and multiple regression analysis
� Section 9: A summary of the chapter

96 | P a g e
3.1 Philosophical orientation
A researcher must determine which philosophical approach is appropriate for his or her
research, considering the influence of his or her own “world view” and the nature of the
phenomenon under study (Burrell and Morgan, 1997). Different research methods arise from
different research philosophies. Thus, the purpose of this section is to clarify ontological and
epistemological assumptions and address the paradigms of this research.
3.1.1 Ontological and epistemological choice
The philosophical underpinnings of research can be broadly considered as comprising both
ontology and epistemology.
Ontology is concerned with the nature of reality (Saunders et al., 2009). It refers to
metaphysics, the discipline of enquiry into the most basic and general features of reality, such
as the nature of existence and social entities (Bryman and Bell, 2003; van Vuuren, 2011).
Epistemology concerns what constitutes acceptable knowledge in a field of study, which
refers to the possibility of obtaining knowledge (Hughes and Sharrock, 1997; Saunders et al.,
2009). It can be explained by asking questions about what is true knowledge and what is the
relationship between what is known and who knows it (Orlikowski and Baroudi, 1991).
3.1.2 Choice of research paradigms
From a research perspective, how people look at the world occupies a continuum between
positivist and interpretivist paradigms (Hamre, 2008).
The positivist position is characterised by the testing of hypotheses developed from existing
theory through measurement of observable social realities (Saunders et al., 2007). Positivism
is based upon values of reason, truth, and validity, and there is a focus on facets (Chen and
Hirschheim, 2004). In general, positivist studies are more likely to collect data through
quantitative methods such as direct observation, experiment, stimulation and survey
questionnaire (Mingers and Brocklesby, 1997).

97 | P a g e
According to Hatch and Cunliff (2006), the interpretivist approach assumes that individuals
create their own subjective reality as they interact in their environment. It attempts to
generate new knowledge by understanding the complex environment and the information
gained about a particular situation at a specific time (Hamre, 2008). Therefore, interpretive
research is often qualitative in nature, so that the empirical information is usually in the form
of words (i.e. interview transcripts, recordings etc) (Punch, 1998).
3.1.3 Philosophical approach for this study
Based upon the research objectives, this study adopts a positivistic epistemological stance
with a deductive approach through hypotheses testing. Hughes and Sharrock (1997) argue
that the growth in marketing research has led to a revival of positivism, as many techniques
associated with the positivistic orientation are actually derived from marketing research (i.e.
questionnaires and sampling). From an epistemological viewpoint, positivists are concerned
with the hypothetic-deductive testability of theories, which seeks to explain and predict what
happens in the social world by searching for regulatory and causal relationships between its
constituent elements (van Vuuren, 2010). The current study is purely quantitative exploratory
research, as the primary research objective is to generate hypothesized relationships, which
can be tested and proven.
Therefore, this study is deductive in nature. Deduction, in contrast with induction, involves
the development of theoretical frameworks which are subsequently tested through empirical
studies. In addition, Saunders et al. (2007) state that the deductive approach provides
effective means to recognize and investigate relationships between research variables. Figure
3.1 presents the logical deduction-based research process designed for this present study.

98 | P a g e
Figure 3. 1 The process of deduction-based research
Source: Author

99 | P a g e
The research process was divided into three stages. The first stage concerned the theoretical
conceptualisation in which activities were carried out with regard to the identification of the
research gaps, the exploration of conceptual and empirical literature in relation to the gap,
and the derivation of the research questions and research hypotheses specific to the research
gap. This stage helped the researcher in designing further empirical activities in order to
investigate the findings that would later fill the research gaps. Regarding the second stage,
the empirical activities included the specification of the research design and approach, the
identification of appropriate data collection methods and sample populations, the
development of the survey instruments, and the self-completion questionnaire. Once the data
collection was completed, the process of data preparing, analysing and interpreting was
further conducted. This then led to the research findings being finalized and discussed, as
well as the research implications and conclusions being drawn in the final stage.
3.2 Refining the research propositions
As discussed in the literature, there is a lack of research OBCs from a social capital
perspective. Prior research has largely ignored the contribution of social capital in
understandings the OBC phenomenon and its effects within an OBC. On the other hand,
social capital is seen as a significant factor influencing knowledge sharing and creation.
However, not much prior research provides empirical support conforming a positive
relationship between social capital and brand knowledge. In addition, prior research indicates
that there is a need to extend OBC studies into consumer-initiated communities.
Consequently, the present study proposes to fill these research gaps. This section refines the
research proposition of this present study; the research objectives, hypotheses and conceptual
framework are presented as follows.
The primary objective is to determine and evaluate how the dimensions of social capital
influence brand knowledge within a marketing context of consumer-initiated OBCs, which
can be reflected in four aspects as follows:

100 | P a g e
� To investigate the presence of social capital with four dimensions (i.e. structural,
cognitive, relational and communication dimensions) in the Chinese Volkswagen
consumer-initiated OBCs
� To investigate the presence of brand knowledge with two dimensions (i.e. brand
awareness and brand image) in the Chinese Volkswagen consumer-initiated OBCs
� To investigate the relationship between each dimension of social capital and brand
knowledge in the Chinese Volkswagen consumer-initiated OBCs
� To evaluate the efficacy of each dimension of social capital, with regard to
developing effective brand knowledge in the Chinese Volkswagen consumer-initiated
OBCs
The research hypotheses and conceptual framework are developed from the review of
literature (see section 2.4 in Chapter 2). The hypothesized relationships between each
dimension of social capital and brand knowledge are depicted in Figure 3.2, and then the
developed hypotheses are summarized in Table 3.1.

101 | P a g e
Figure 3. 2 The relationship between social capital and brand knowledge
Source: Author

102 | P a g e
Table 3. 1 Hypotheses in this study
Hypotheses
H1a Interaction ties from participation has a positive effect on brand awareness in an
OBC
H1b Interaction ties from participation has a positive effect on brand image in an OBC
H2a Shared language from participation has a positive effect on brand awareness in an
OBC
H2b Shared language from participation has a positive effect on brand image in an OBC
H3a Identification from participation has a positive effect on brand awareness in an
OBC
H3b Identification from participation has a positive effect on brand image in an OBC
H4a Commitment from participation has positive effect on brand awareness in an OBC
H4b Commitment from participation has a positive effect on brand image in an OBC
H5a Quality of Information exchange from participation has a positive effect on brand
awareness in an OBC
H5b Quality of Information exchange from participation has a positive effect on brand
image in an OBC
H6a Quantity information exchange from participation has a positive effect on brand
awareness in an OBC
H6b Quantity information exchange from participation has a positive effect on brand
image in an OBC
Source: Author
Next the research context is presented.
3.3 Justification for choice of Chinese Volkswagen's brand communities
This section gives an account of the research context of this study. It reviews the automobile
industry in China, Volkswagen in China and the Internet environment in China, providing
justifications for the choice of Chinese Volkswagen OBCs.
3.3.1 The automobile industry in China
China became the world’s largest automobile producer and market in 2009. In the first nine
months of 2010, automobile product reached 13.08 million units, a 36.1 per cent increase
from 2009. The China Association of Automobile Manufactures (AAM) raised its forecast
for annual sales to reach a record 17 million in 2010, matching the highest annual total ever
reached in the U.S (Market Analysis Report: China Automobile Industry, 2010). There are
currently more than 100 whole-vehicle manufacturers and nearly 8,000 automotive parts
103 | P a g e
manufacturers in China, located primarily in Southern, Eastern, and Northeastern and central
China. Together, the top ten passenger vehicle manufacturers, seven of which are joint
ventures (JVs), make up almost 90 per cent of China’s market share, and nearly every major
global vehicle manufacturer has established JV operations in China (Zhao and Gao, 2009).
3.3.2 Volkswagen in China: the key player in China’s automobile market
Among all the global vehicle manufacturers, Volkswagen group is considered to be the most
successful one in China. The company started to enter the Chinese market in 1984 with a
production base in Shanghai. It was one of the earliest vehicle manufacturers to set up
business in China. Volkswagen followed this up with a second joint venture in Changchun in
1990. At present, the company owns 14 enterprises in the whole mainland of China (Market
Analysis Report: China Automobile Industry, 2010). In the first quarter 2011, Volkswagen
Group maintained its number one position by market share in China (Volkswagen Group
China, 2011).
Volkswagen is a multi-brand company which targets nearly every segment possible by
offering cars in every price range and for every possible use. When Volkswagen is translated,
it means “people’s car”, which also supports the targeting of every segment and is congruent
with the company’s mission (Elliott and Percy, 2007). Furthermore, Volkswagen is known as
a reliable and high-quality vehicle manufacturer and is also known for reliability, reasonable
prices and good trade-in value (Kapferer, 2004).
Volkswagen Group in China utilizes some social network sites, for example, its company-
sponsored OBCs in China on Sina WeiBo RenRen, and KaiXin, (see screenshots in
Appendix D). These sites are the commonly used domestic social networks in China, and
help Volkswagen to promote their brand value and increase brand awareness. These
communities allow Volkswagen to interact with their community members by posting news,
information regarding products, replies to their enquires, or even conducting short chats.
Through these online activities, the company has an opportunity to develop customer loyalty
and obtain valuable market information. These company-initiated OBCs focus on the
company-consumer network, which provides members with special offers and nurture
positive feelings for the brand (Chung and Shin, 2011). For example, the Volkswagen’s
104 | P a g e
company-initiated OBC on Chinese Twitter (Sina Weibo) appears to be a news media, where
the content consists of updated product information, brands, events etc. It has little
interaction between members. In contrast, consumer-initiated OBCs emphasize the
relationships and communications among members, producing more consumer-generated
content. Consumers participate in consumer-initiated OBCs seeking product/brand
information and learning about others experiences with the product, and thus they can reduce
uncertainty before purchasing products.
3.3.3 The Internet environment in China
China has 538 million Internet users and Internet penetration is currently at 39.9 per cent as
of the end of June 2012. In particular, the number of mobile Internet users has reached 388
million; an increase of 32.7 million over the end of 2011, indicating mobile phone has
became the number one Internet access platform in China (CNNIC, 2012). China’s netizens
use the Internet primarily for communication and entertainment. Domestic sites dominate
China’s social networking sphere, and social network site use is relatively high, with more
than one third of users accessing a social network site at least once a day, and 40 per cent of
them creating original content (CNNIC, 2010).
3.3.4 Research context of this study
This study extends the empirical OBC research into China's consumer-initiated communities
especially focusing on the Volkswagen brand. The automobile industry was chosen as the
product category is high value, especially as compared to the average income in China, and
purchasing a car is usually a complex decision. The choice of the Volkswagen brand for this
study was due to its industry leadership in China, as the Chinese car buyers believe that
Volkswagen has a good reputation for safety and reliability (Hoffe, Lan and Nam, 2003).
Nowadays, as the Chinese lifestyle has changed with the popularity of digital media and
Internet usage, the Chinese consumers’ purchase journey has changed as well, especially for
high-involvement products like cars. They now seek advice and review requirements from
other consumers on the Internet before they make purchasing decisions. In addition, as
discussed in Chapter 2, there is a need to consider those OBCs created by consumers since
social capital is an useful theoretical approach to understand the interactive relationship
105 | P a g e
among members, and in turn, to develop effective brand knowledge. Therefore, this study
focuses on the consumer-initiated communities rather than the company ones.
3.4 Research design: quantitative research strategy via questionnaire
survey
In line with the research objectives presented in section 3.1, the aim of this study is to
determine and evaluate how each facet of the dimension of social capital influences brand
knowledge in terms of brand awareness and brand image. In order to achieve this aim, it is
necessary to identify and evaluate those dimensions of social capital considered to be
presented in OBCs. As such, a quantitative research strategy is adopted in this study by
emphasizing quantification in data collection, measurements and analysis (Bryman and Bell,
2007). Based on the research strategy selected, the survey method implemented in this
research to test and determine the relative strength of each dimension of social capital upon
brand knowledge.
3.4.1 The justifications for using the survey method
Survey research is considered as an appropriate research method when a researcher has very
clearly defined independent and dependent variables as the specific model of the expected
relationships that can be tested by observation of a phenomenon (Bryman and Bell, 2007). As
shown in the conceptual framework in Chapter 2, the four dimensions of social capital are set
as the independent variables; brand knowledge is set as the dependent variable. The
justification of the choice of survey methodology in this research is as follows:
i. The purpose of the survey is to explore, describe or explain a phenomenon by
identifying characteristics, attitudes or opinions for a representative sample of
populations (Creswell, 2003). In this study, the use of survey was to obtain
quantitative data concerning participants’ attitudes, opinions and experiences towards
online brand communities. Respondents were also asked to evaluate the importance
of four dimensions of social capital toward brand knowledge.
ii. As Neuman (2006) suggested, survey analysis is primarily concerned with the
relationships or associations between variables.

106 | P a g e
iii. Much previous research on social capital adopted a survey methodology. In regard to
Table 3.2, mail surveys, on-site questionnaire surveys and web surveys were the
major methods employed in these empirical studies. In addition, this study adopted
Keller’s (1993) theoretical framework of brand knowledge and his measurement tools.
Keller proposed a multi-dimensional measurement for consumer brand knowledge
(i.e. brand association, brand awareness, brand images etc.) and was thus essentially a
quantitative measure.
Low-cost computing and the rapid growth of the Internet have created another environment
for conducting surveys (Nie et al., 2002; Sue and Ritter, 2007). In particular, in this study a
web-survey is used as the studies of online populations have led to an increase in the use of
online surveys (Wright, 2005). Most importantly, the decision was based on an assessment of
the advantages of web-survey compared with other research methods (e.g. mail survey,
telephone survey and personal survey):
i. A web-survey had no time and geographic restrictions for participants.
ii. A web-survey allowed researchers to reach thousands of people with common
characteristics in a short period of time. At the same time, it allows researchers to
collect data while they work on other tasks (Llieva et al., 2002).
iii. Using a web-survey helped researchers save money by moving from a paper format
to an electronic medium (Couper, 2000).

107 | P a g e
Table 3. 2 A summary table of research methodology from previous research of social capital
Authors Research
Contexts
Methodology and Sampling
(Tsai and
Ghoshal,
1998)
Intra-firm
relationship
Mail survey.
One-site sampling schemes in a multinational electronic company with 15
business units, thus sample size: select 3 member of management team
from each unit.
(Tsai, 2000) Intra-firm
relationship
On-site questionnaire survey for two years. Interviews with directors from
each business unit.
One-site sampling schemes in a multinational food manufactory company
with 37 business units.
(Koka and
Prescott,
2002)
Strategic
alliance
Longitudinal secondary data analysis
Sample frame:10 year set data from the primary alliance data source
Sample size: top 68 firms of 162 firms form steel industry
(Wasko and
Faraj, 2005)
Electronic
networks of
practice
Mail survey and observation of online message board.
Sample frame: members of national legal professional association (USA).
Random sample technique.
(Moran,
2005)
Managerial
performance
Intra-firm survey and interviews with sales and product innovation
managers.
Sample frame: Selected sales and product innovation managers from 10
operating companies in pharmaceutical industry.
Sample size: 208 product and sales managers (respondents are 120, final
respondent rate is 65 per cent).
(Chiu, Hsu,
and Wang,
2006)
Virtual
learning
communities
Web survey was posted on pre-selected IT-oriented virtual community
website.
Sample frame: member register with the community
Sample size: 336 questionnaires are collected.
(Hsieh and
Tsai, 2007)
Launch
strategies for
innovative
products
A self-administered mail survey.
Sample population: marketing and sales managers launching physical IC
products for a Taiwanese firm.
Sample frame: 155 IC design firms list in ITIS data book (2002).
Sample size: 97 firms are selected after telephone and e-mail
communication. Finally 90 valid responses received with 75.63 response
rate.
(Lawson,
Tyler, and
Cousins,
2008)
Buyer-supplier
relationships
(supply chain
management)
An Internet-based survey.
Sample frame and size: a sample of 750 United Kingdom manufacturing
firms were surveyed from a database held by The Chatted Institute of
Purchasing and Supply (CIPS), UK. Response rate is 28 per cent.
(Chen,
Chang, and
Hung, 2008)
Creativity in
research and
development
Survey questionnaires were sent to all team members from a total of 54
R&D teams from high-tech firms.
(Westerlun
d and
Svahn,
2008)
Relationship
value
Multiple case studies methodology consisting of structured interviews and
observations.
(Wu, 2008) Firm
performance
A Mail survey.
Sample frame and size: sample frame is the membership directory of
Chinese Manufactures’ Association of Hong Kong. Response rate is 11per
cent.
Source: Author
108 | P a g e
3.4.2 Data collection method: Questionnaires
Several techniques can be used to collect survey data, including self-completion, interviewer-
completion and observation (Hair, et al., 2007). Self-completion methods include mail
surveys, Internet/electronic surveys, drop-off/pick up and similar approaches. Interviewer-
completion methods involve direct contact with the respondents through personal interviews
either face-to-face or via telephone. Observation studies that were quantitative involved
collecting a large amount of numerical data. Each technique has its own advantages and
disadvantages (Sanders et al., 2003). In particular, the self-completion questionnaire survey
seems to be one of the most popular techniques due to its distinctive advantages: it enabled
more economic and timely collection from a large, geographically dispersed population
(Frazer and Lawley, 2000); it also encourages respondents to freely divulge private
information. In this thesis, the self-completion approach is used to collect primary data using
a structured questionnaire. Questionnaires were widely used in marketing research, thus the
decision to use this data collection technique was partially informed by congruence with
other marketing-based research being undertaken both in academic and commercial
environments. As the survey was conducted online, it was proposed to post the questionnaire
on a website. However, online self-completion questionnaire surveys have several
weaknesses, in particular, the potential problems of non-response error or low response rate.
Invited survey participants can refuse participation altogether, terminate participation during
the process, or answer questions selectively (Vehovar and Manfreda, 2008). Also the
possibility of respondent misunderstanding may occur, since no interviewer is available to
provide explanations and clarifications of questions (Copper and Schindler, 2006).
In order to increase response rates and achieve a high quality of responses, it was decided
that the author would provide a covering letter for all the participants, which gave the
rationale of this study, the ethical issues and full instructions for participating in this survey.
After the survey was launched, multiple follow-up reminders were made to encourage
people’s participation. In addition, the questionnaires on the web differed greatly from the
questionnaires used in the traditional survey method. They were navigated using a mouse and
a keyboard, which may cause the loss of eye-hand centralization (Bowerker and Dillman,
2000). Therefore, the author had to pay particular attention to the length of the questionnaire

109 | P a g e
as well as the manner in which the questions were structured, sequenced and coded. This also
facilitated data collection and statistical analysis (Hair et al., 2007).
3.5 Target respondents and sample planning
The first step of sample planning is to define the sample population. In this research, the
population included all the registered members participating in OBCs at the time when the
survey was conducted. Females and males of different ages, educational levels and
occupations were included. However, only the members could see and join in the survey.
The second step is to identify a proper sample technique to meet the needs of the web survey.
Survey sampling can be grouped into broad categories that are representative of a population:
probability sampling and non-probability sampling. A probability-based sample is one in
which the respondents are selected using some sort of probabilistic mechanism, and where
the probability with which every member of the frame population can be selected into the
sample is known (Cooper and Schindler, 2006). In contrast, non-probability sample,
sometimes named a convenience sample, occurs when the probability that every unit or
respondent included in the sample cannot be determined (Babbie, 2004; Ronald and Fricker,
2008).
When conducting an online survey, researchers often have difficulties with regard to
sampling issues (Andrews, et al., 2003). Due to the nature of the online survey method, it is
hard to control that are who were going to participate. For instance, relatively little
information might be known about the characteristics of the participants in an online
community (Dillman, 2000). A lack of sample frame is another concern when researching an
online community (Wright, 2005). Unlike membership-based organisations, many online
communities (e.g. chat rooms and bulletin boards) do not provide members’ e-mail addresses.
In this study, an OBC was a group of individuals who are voluntarily related to each other for
their interests in the same product and brand (Casaló et al., 2008). The OBC membership was
based on common interests, not fees, and little information was required when registering to
use these communities (Preece et al., 2004). It was difficult for the author to identify an
accurate sample frame or an accurate estimate of the population characteristics due to
restricted access to the comprehensive database of all OBC members. Under such conditions,

110 | P a g e
the probability sampling had limitations in its application; it was time-consuming and
expensive to ensure each selected sample member is reached. Accordingly, Vehovar and
Manfreda (2008) suggested that many contemporary web-surveys are simply posted on a
website where it is left up to those browsing through the site to decide to participate in the
survey or not. This solution led to a non-probability sample that often gave acceptable results
if it was carefully controlled (Cooper and Schindler, 2006).
Based upon the above discussion, non-probability sampling was selected as an appropriate
sample technique in the present study. Among three specific types of non-probability sample,
including quota sampling, snowball sampling and judgment sampling, snowball sampling
was employed in this research to obtain a large number of completed questionnaires quickly
and economically, as snowball sampling was often applied where respondents were difficult
to identify and contact, and located through referral networks (Cooper and Schindler, 2006).
3.6 Online self-completion questionnaire
3.6.1 Specify the required information
According to the research objectives, the major composition of the required information was
intended to include the items which were used to measure the variables in this study. These
variables comprised interaction ties, shared language, identification, commitment, quality of
information exchange, quantity of information exchange, brand awareness and brand image,
which were initially derived from a comprehensive literature review. The measurement items
for each variable were developed from previous published studies and then some minor
modifications were made to the existing items to make them more suitable to this research
context. Regarding the number of items to measure a concept, Hair et al. (2007) suggested
that a minimum of three items is necessary to achieve acceptable reliability but it was
common to see at least five to seven items, and sometimes ten or even 20 items. In addition,
these items or statements needed to be closely related and represent a single construct.
Measurements are achieved through the use of scale (Hair et al., 2007). There are four levels
of scales: nominal, ordinal, interval and ratio scales (Cooper and Schindler, 2006). A nominal
scale uses numbers as labels to identify and classify objects, individuals or events. An
ordinal scale was a ranking scale, which placed objects into a predetermined category (e.g.
111 | P a g e
age, income group, etc.). An interval scale uses numbers to rate objects or events so that the
distances between the numbers were equal. A ratio scale provides the highest level of
measure; it is used when participants score an object indirectly without making a direct
comparison. In this study, most of the items were measured on a seven-point Likert scale
ranging from “strongly disagree” to “strongly agree”. The Likert scale is one the most
frequently used measurements of the ratio scale, which attempts to measure participants’
attitudes, feelings, perceptions and opinions. Also it could be used to measure the importance
and intensity of a concept (Hair et al., 2007).
A five-point or seven-point scale is often used to access the strength of agreement about a
group of statements. The more points used the more precision the researcher got with regard
to the extent of the agreement or disagreement with a statement. However, with more
categories, it is difficult to discriminate between the levels, and the respondents also face
greater difficulty in processing the information. Respondents must be reasonably well
educated to process the information associated with a larger number of categories. In this
study, the author was unable to define the characteristics of respondents, for example, the
education level of respondents was unknown. Further, Hair et al. (2007) suggest researchers
use no fewer than five-point scale, as the respondents often avoid the extremes and feel it
easier to respond to scales with fewer categories. Therefore, the desire for a high level of
precision must be balanced with the demands placed on the respondents. This study
developed a five-point scale, which made it easier for respondents to answer the questions.
In particular, there are three measurement techniques to measure brand awareness and brand
image of brand knowledge: a Likert rating scaling, a ranking scale and a pick-any technique
(sorting) (Driesener and Romaniuk, 2006). The score of a rating technique gauges the extent
to which the respondent feels the brand to be associated with a certain attribute. The ranking
measure is where brands are ranked relative to competitors according to their association
with an attribute. Both rating and ranking measures requires the respondents not only to show
whether or not there was an association but also to indicate the strength of that association. In
contrast, the third type of measure – “pick any” – is only used to indicate the presence of the
perceived association between the brand and an attribute. This technique is applied where

112 | P a g e
respondents are asked which brands, if any, they associate with each attribute. The brand
names could be provided on a list or recalled from memory (Drisener and Romaniuk, 2006).
However, this study only focused on one single brand; there is no comparative measure
among multiple brands. Based upon the criteria discussed above, the Likert rating scale was
employed to measure brand awareness and image.
3.6.2 The development of measured items for each variable
3.6.2.1 Measurement of interaction ties
Table 3.3 presents the modified measured items adopted in this study and original sources
from which such items were obtained.
Table 3. 3 Measured items of interaction ties
Measured Items Sources
I maintain close relationship with some
members in the community in Xcar.com.
I spend a lot of time interacting with other
members in the community in Xcar.com.
I know some members personally in the
community in Xcar.com.
I communicate frequently with some
members in the community.
Items adopted from Tsai and Ghoshal (1998)
Time spent in interaction with other units.
Close contact with other units.
Items adopted from Chiu et al. (2006)
I maintain close relationship with some members in
the BlueShop virtual community.
I spend a lot of time interacting with some members
in the BlueShop virtual community.
I know some members in the BlueShop virtual
community on the personal level.
I have a frequent communication with some members
in the BlueShop virtual community.
Source: Author
Interaction ties of the structural dimension of social capital concerned the interaction among
individual members, which was adopted from Chiu et al. (2006), and Tsai and Ghoshal
(1998). Items for measuring interaction ties focused on close relationships, time spent
interacting, and frequent communication with other members in the community in Xcar.com
(Lu and Yang, 2010). In addition, scholars suggested that most virtual communities primarily
supported and maintained the pre-existing relationships among members (Choi, 2006; Lampe,

113 | P a g e
Ellison and Steinfield, 2007). At this point, some OBC members might already have existing
offline relationships with other members.
3.6.2.2 Measurement of shared language
As shown in Table 3.4, shared language of the cognitive dimension of social capital is
measured by the items adopted from Chiu et al. (2006), such as common terms, meaningful
communication pattern, and understandable messages. In this study, the original three items
adopted from the empirical research by Chiu et al., were modified into four items.
Table 3. 4 Measurement of shared language
Measured Items Sources
Members in the community in Xcar.com use
a common vocabulary in their discussions in
the forum.
Members in the community in Xcar.com use
technical terms in their discussion in the
forum.
Members in the community in Xcar.com
communicate with each other in a way that is
easy to understand.
Members in the community in Xcar.com
share their own experience in the discussions
in the forum.
Items adopted from Chiu et al., (2006)
Members in BlueShop virtual community use
common terms or jargon.
Members in BlueShop virtual community use
understandable communication pattern during the
discussion.
Members in BlueShop virtual community use
understandable narrative forms to post messages
or articles.
Source: Author
The first original item included two issues (i.e. common terms and jargon) in one statement,
which is called double-barrelled items in methodology literature (Hair et al, 2007). When
items like this are used, it might cause interpretation difficulties and mislead the respondents.
Thus the original item was divided into two separate statements by rephrasing the common
terms to a common vocabulary and using technique terms instead of jargon. In particular, the
understandable narrative forms were too abstract for respondents to understand. Based on the
author’s understanding, narrative form was one kind of communication that was shared by
Xcar.com members in the community. It was about writing something in the first person that
it is written from personal experience, or stories in many cases. Therefore, the last item was

114 | P a g e
transferred as “members in the community in Xcar.com share their own experience in the
discussion in the forum”.
3.6.2.3 Measurement of identification
Table 3. 5 Measurement of identification
Measured Items Sources
I am very attached to this community.
I see myself as a part of this community.
I share the same vision with other
members in this community.
The close relationship I have with other
members in this community means a lot
to me.
I am proud to be a member of this
community.
Items adopted from Chiu et al. (2006)
I feel a sense of belonging towards BlueShop virtual
community.
I have the feeling of togetherness or closeness in
BlueShop virtual community.
I have a strong positive feeling toward BlueShop
virtual community.
I am proud to be a member of BlueShop virtual
community.
Items adopted from Matzler et al., (2011)
I am very attached to the community.
I identify myself with other GTI fans at this meeting.
I see myself as a part of this fan community.
Other brand community members and I share the same
objectives.
The friendships I have with other brand community
members means a lot to me.
Source: Author
As the literature review emphasized, a member’s identification with the OBC was seen as a
central characteristic of a brand community, which concerned members’ self awareness of
their membership and emotional involvement with the community. It also included their
perceived similarities with other members (Matzler et al., 2010). Thus, the research followed
prior studies of Chiu et al. (2006) and Matzler et al. (2010) in that identification was assessed
with items adopted to reflect an individual’s sense of belonging, attachment with the
community, shared vision and close relationship with other members, and positive feeling
toward the virtual community. The modified items were expressed in an easy to understand
way which is summarized in Table 3.5.

115 | P a g e
3.6.2.4 Measurement of commitment
The measured items of commitment adopted in this study are presented in Table 3.6.
Table 3. 6 Measurements of commitment
Measured Items Sources
I would feel a loss if this
community is not available
anymore in Xcar.com.
I feel very loyal to this community.
I try my best to maintain the
relationship that I have with this
community in Xcar.com.
Items adopted from Morgan and Hunt (1994)
The relationship that my firm has with my major supplier is
something we are very committed.
The relationship that my firm has with my major supplier is
something my firm intends to maintain indefinitely.
The relationship that my firm has with my major supplier
deserves our firm’s maximum effort to maintain.
Items adopted from Wasko and Faraj, (2005)
I would feel a loss if the Message Boards were no longer
available.
I really care about the fate of the Message Board.
I feel a great deal of loyalty to the Message Board.
Items adopted from Chang and Chieng, (2006)
I will stay with this coffee store through good times or bad.
I have a lot of faith in my future with this coffee store.
I feel very loyal to this coffee store.
Items adopted from Wiertz and Ruyter, (2007)
The relationship I have with the X community is something
to which I am very committed
The relationship I have with the X community deserves my
effort to maintain
The relationship I have with the X community is one I
intend to maintain definitely.
Source: Author
Commitment was defined in marketing literature as the enduring desire to maintain a valued
relationship (Morgan and Hunt, 1996). It also represented a duty or obligation to engage in
future action that arose from social exchanges (Coleman, 1990). The ‘valued relationship’
meant a long-term meaningful relationship between a member and the community. The
‘enduring desire to maintain’ and ‘obligation to engage’ corresponded with the researcher’s
view that a committed member wants the relationship to endure definitely and their

116 | P a g e
willingness to enhance it. Accordingly, commitment in this study was about a member’s
willingness and effort to maintain their loyalty relationships with the community in Xcar.com.
It was measured with three items as shown in Table 3.6, which were developed from a
number of research studies (i.e. Morgan and Hunt, 1996; Wasko and Faraj, 2005; Chang and
Chieng, 2006; and Wiertz and Ruyter, 2007). As the research context was the consumer-
initiated OBC, this study only measured the commitment to the community, not the
commitment towards the brand owner.
3.6.2.5 Measurement of information exchange
As the literature emphasized, positive results of information exchange between members
influences people’s attitudes, problem solving and decision-making (Widen-Wulff et al.,
2008). Also, this study focuses on one specific type of activity undertaken in OBCs – online
discussion forums – where individuals discuss interesting topics on a focal brand and build
social ties into networks of relationships. Therefore, the higher the level of information
exchanged among members, the higher the level of influence on members’ decision making
in the communities. There were two characteristics of information exchange – quality and
quantity – which were widely accepted as measurements for information exchange. Thus
Table 3.7 presents the modified measured items adopted in this study and original sources
from which such items were obtained from Lu and Yang (2010), Wasko and Faraj (2005),
and Chiu et al. (2006).
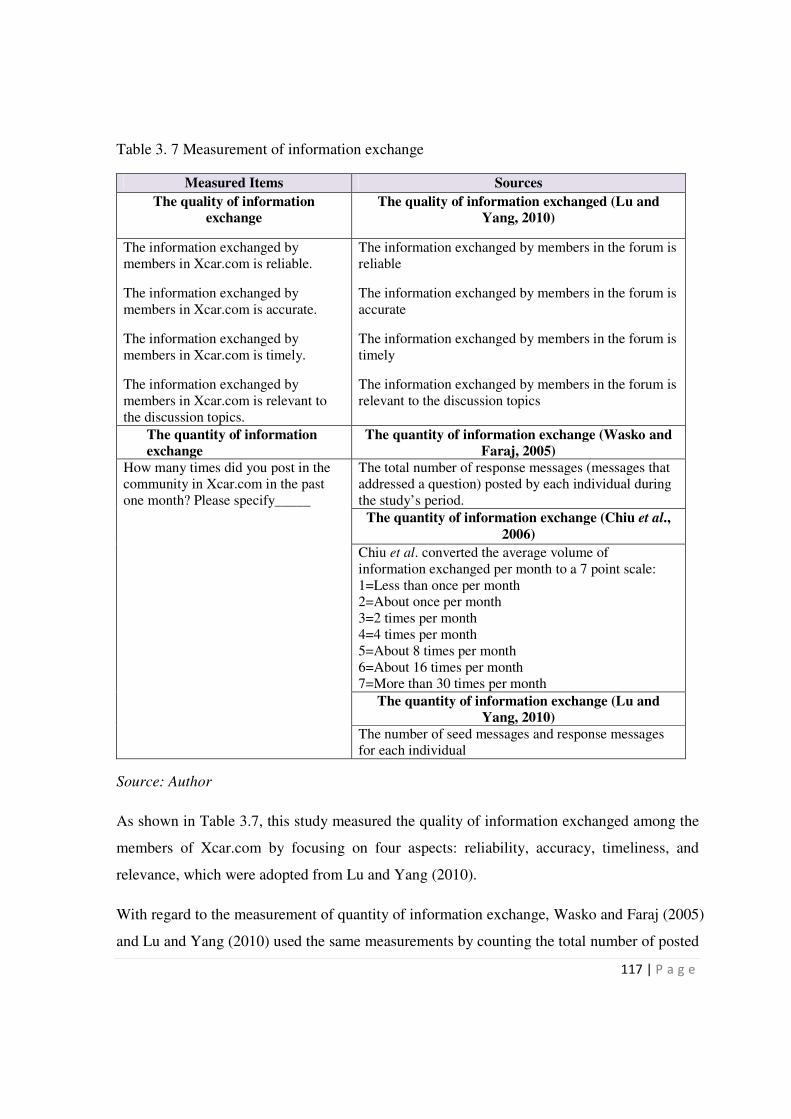
117 | P a g e
Table 3. 7 Measurement of information exchange
Measured Items Sources
The quality of information
exchange
The quality of information exchanged (Lu and
Yang, 2010)
The information exchanged by
members in Xcar.com is reliable.
The information exchanged by
members in Xcar.com is accurate.
The information exchanged by
members in Xcar.com is timely.
The information exchanged by
members in Xcar.com is relevant to
the discussion topics.
The information exchanged by members in the forum is
reliable
The information exchanged by members in the forum is
accurate
The information exchanged by members in the forum is
timely
The information exchanged by members in the forum is
relevant to the discussion topics
The quantity of information
exchange
The quantity of information exchange (Wasko and
Faraj, 2005)
How many times did you post in the
community in Xcar.com in the past
one month? Please specify_____
The total number of response messages (messages that
addressed a question) posted by each individual during
the study’s period.
The quantity of information exchange (Chiu et al.,
2006)
Chiu et al. converted the average volume of
information exchanged per month to a 7 point scale:
1=Less than once per month
2=About once per month
3=2 times per month
4=4 times per month
5=About 8 times per month
6=About 16 times per month
7=More than 30 times per month
The quantity of information exchange (Lu and
Yang, 2010)
The number of seed messages and response messages
for each individual
Source: Author
As shown in Table 3.7, this study measured the quality of information exchanged among the
members of Xcar.com by focusing on four aspects: reliability, accuracy, timeliness, and
relevance, which were adopted from Lu and Yang (2010).
With regard to the measurement of quantity of information exchange, Wasko and Faraj (2005)
and Lu and Yang (2010) used the same measurements by counting the total number of posted
118 | P a g e
messages (included seed messages and response messages) from each individual respondent
during the time the survey was carried out. The method of Chiu et al. (2006) was similar but
slightly different to the other two studies; they still counted the total number of posted
messages, but added an another step to calculate the average volume of postings per month,
and then they transformed them into a seven-point scale with 1=Less than once per month,
2=About once per month, 3=twice per month, 4=4 times per month, 5=About 8 times per
month, 6=About 16 times per month, and 7=More than 30 times per month.
The above three measurements required the author to have access to the mechanism provided
by Xcar.com, which allowed use of each respondent’s nickname to retrieve the number of
their posted messages. However, the researcher in this study did not have access to members’
profiles Therefore, the quantity of information exchange was assessed by asking respondents
that the total number of times they had posted in the community in Xcar.com in the past one
month. In addition, this question was also designed to evaluate the level of participants’
involvement in OBC activities. Although this question might not be able to retrieve the
source of seed or response messages, it was still able to get the total number of messages
posted in a certain period of time. The reasons for setting the one month time are justified
thus: firstly, the ideal time length of a web-posted survey is 4-6 weeks which is about one
month (Saunders et al., 2007); secondly, if it was more than one month, some members may
not be able to remember clearly about their times of postings, especially for some heavy
users of the discussion forum in Xcar.com.
3.6.2.6 Measurement of brand awareness
Brand awareness consisted of brand recognition and recall. For new or niche brands,
recognition could be important. In contrast, for the well-known brands, recall was more
sensitive and meaningful. In this study, the selected OBCs in Xcar.com were all focused on
one particular brand, Volkswagen. The Volkswagen brand is a well-known global brand so
the author decided not to measure brand recognition, instead, employing the items such as
top-of-mind, brand meaning and brand opinion to measure brand recall, which were adopted
from Aaker (1996). The measured items used in this study are presented in Table 3.8.

119 | P a g e
Table 3. 8 Measurement of brand awareness
Measured Items Sources
If I am buying a car, the Volkswagen brand is
my first choice.
I know what the Volkswagen brand stands for.
I have my own opinion about Volkswagen
brand.
Items adopted from D. Aaker, (1996)
Top-of-mind (the first-named brand in a recall
task)
I know what the brand stands for.
I have an opinion about the brand.
Source: Author
3.6.2.7 Measurement of brand image
Table 3. 9 Measurement of brand image
Measured Items Sources
Volkswagen cars perform as I
expected.
Volkswagen cars offer good value
for the money.
Volkswagen cars are reliable.
Volkswagen cars are functional.
Driving a Volkswagen car make me
feel good.
Owning a Volkswagen car is
admired by my friends and
families.
Volkswagen cars express my
personality.
Items adopted from Kaplan, (2007)
Products of this brand perform as expected.
Products of this brand offer value for price.
Products of this brand are reliable.
Products of this brand are functional.
Products of this brand are usable.
Products of this brand are durable.
Products of this brand are expensive.
Products of this brand make a person feels good.
Products of this brand increase the respectability of its
users.
Products of this brand are admired by my friends and
relatives.
Products of this brand express my personality.
Items adopted from Chang and Chieng, (2006)
This coffee store focuses on coffee quality.
This coffee store satisfies my desire to drink coffee.
This coffee store meets my sensory enjoyment.
This coffee store offers me a sense of group belonging.
Source: Author

120 | P a g e
As shown in Table 3.9, nine items were developed for measuring brand image, based on the
studies of Chang and Chieng (2006) and Kaplan, (2007). The first six modified items were
reflected as a consumer’s functional brand perception, which concerned the quality, physical
function and price issues of Volkswagen cars. The remaining three items were emotional
perceptions, which were used to measure a consumer’s intangible attachment to the
Volkswagen brand (Blackwell, Miniard and Engel, 2006), such as the enjoyment and
fulfilment of driving a Volkswagen car, and concerning the perceptions of friends and
families.
3.6.3 Development of questionnaire
3.6.3.1 Question content
Now that a decision to use web-posted structured questionnaires had been made, the decision
about question content had to be considered. Question content was operationalized based on
the literature and research objective in this study. Measured items and scales employed in the
literature to evaluate the variables were discussed in last section. In addition to the major
content, the participants’ socio-demographic information was included in the questionnaire,
such as gender, age group and education level. These kinds of information were helpful for
the author to understand the backgrounds and characteristics of respondents, as this study did
not have any sample frame and size. In addition, membership length and frequency of
community visit were assumed as the community members’ characteristics when they were
involved and interacted in the OBC (de Valck et al., 2009).
3.6.3.2 Question phrasing and translation
The items identified to measure each variable were examined for multiple meanings, inherent
ambiguity, double barrelled interpretation, phrasing bias, and implicit assumptions about
respondents’ knowledge (De Vaus, 2001). The questions were phrased into a way easy for
respondents to understand by using simple words and avoiding ambiguity. Supervisors, PhD
students and other experts in the area reviewed the questionnaire. Since this study was
conducted in China, the Chinese version of the questionnaire was developed to suit the nature
of the research. To ensure that meaning was unchanged in the translation process, the author
adopted the technique of ‘Back Translation’, which was a process of translating a document

121 | P a g e
that had been translated into a foreign language back into the original language. The
advantage of this approach to discover problems with regard to lexical, idiomatic, conceptual
and experiential meanings as well as the grammar and syntax of the questionnaire (Saunders
et al., 2007). It required two translators, one translating the English-version questionnaire
(known as the source questionnaire) into the Chinese-version one (known as the target
questionnaire), and the other translating the Chinese version back into the English (known as
the new source questionnaire). The two source questionnaires were then compared for the
development of a final version. In this study, the questions were reviewed and translated by
two university lecturers who are both English and Chinese bilinguals: (1) a lecture in Chinese
language and translation in the School of Language and Area Studies at the University of
Portsmouth; (2) a lecturer in the faculty of Business at Zhengzhou University in China. In
addition, the difficulty of the questionnaire needed to be kept as low as possible. Questions
had to be in a language familiar to the respondents by avoiding using jargon or technical
terms unless absolutely necessary.
3.6.3.3 Response format
In broad terms, there are two basic response formats: open-ended and closed-ended questions
(Hair et al., 2007). The open-ended questions allow respondents to answer freely in their own
words; while the closed-ended questions give respondents the option of choosing from a
number of predetermined answers (Cooper and Schindler, 2001). Given that the
questionnaire was posted on the website, closed-ended questions would be an appropriate
response format for this study. In detail, dichotomous, multiple choice and Likert rating scale
questions were adopted. A dichotomous response was applied in questions where two
exclusive choices were equated, such as in questions relating to gender. Multiple choice
questions were developed for respondents to select from but only one answer was sought,
such as questions about participants’ age group, occupation category and education level. A
five-point scale was the major response format adopted in this study in order to gauge the
perceptions, attitudes and feelings of respondents on social capital and brand knowledge. The
rationale for using Likert scale has been discussed in section 3.6.1. With the Likert scales, a
set of statements were made about an issue or object, the respondents are given certain

122 | P a g e
options in each case from “strongly disagree” (1) to “strongly agree” (5). Then respondents
were required to indicate their ratings on the scale for each statement.
3.6.3.4 Question sequence
Question sequence could play a significant role in the successful administration of the
questionnaire. One technique is to start with relatively general questions rather than personal
and sensitive questions (Cooper and Schindler, 2001). In this study, the questionnaire was
delivered through the Internet, divided into six sections: the initial section started by asking
respondents about their experience of participating in the selected OBCs in Xcar.com, such
as questions about the length of time as a registered member of that OBC and the frequency
of visiting the OBC in Xcar.com. Sections two to five consisted of all the scale questions.
Section two was designed to ask about participants’ attitudes, feelings and perceptions
toward the Volkswagen brand. Section three comprised the questions regarding respondents’
experience of information exchange by participating in the online discussion forum of the
community in Xcar.com. The questions in section four were designed to ask respondents
about their relationship towards the community. Section five was designed to ask
respondents about their relationships with other members within the same community. The
final section asked for personal information from respondents, such as gender and age group,
because asking such information at the beginning may embarrass or threaten respondents
(Zikmund, 1999). This logical ordering of questions could help to maintain respondents’
cooperation and involvement throughout the questionnaire (Zikmund, 1999).
3.6.3.5 Question layout
The layout is very important for a self-completion questionnaire, which should be attractive
to encourage the respondents to complete it while not appearing too long (Dillman, 2000).
Saunders et al. (2007) suggest that fewer screens are probably better for Internet
questionnaires. In particular, one way to reduce apparent length without reducing legibility
was to place the questions in rows and responses in the columns. The instructions on how to
answer the questions and column headings are given on each subsequent page. In this study,
the author adopted the online survey design and analysis software SurveyMonkey.com to

123 | P a g e
produce a professional-looking questionnaire. In addition, a cover letter was provided for
respondents, which outlined the purpose and importance of the study.
3.6.3.6 Questionnaire pre-test and revise
It is important to test a newly developed questionnaire before it is used, in order to identify
and detect any problems in the questionnaire design (Zikmund, 2003). In particular, the pre-
test is a process to examine the content and face validity of the questionnaire (Cavana et al.,
2001; Hair et al., 2007). Content validity refers to the relatedness of the questionnaire to the
content or theoretical constructs to be measured. Face validity refers to whether or not the
questionnaire appears to measure the theoretical concepts being examined.
In order to examine and judge the representativeness and suitability of the questions, the
content validity was assessed by testing it with a small group of five colleagues (e.g. PhD
students in Portsmouth Business School). The first draft English-version questionnaire
examined by the PhD students was then compared and modified where necessary prior to the
actual pre-testing.
A pre-test was then conducted using a convenience sample of ten registered members of a
Chinese online network site (renren.com) to access the face validity of the questionnaire. The
questionnaire used in the pilot test is the Chinese version. In particular, the pilot test context
– online social network – was a similar setting to the actual research and sought to verify that
the questions were clear enough to be understood by the target respondents. After completion,
the participants were asked to identify if there were any concerns about:
� question wordings and clarity of instructions
� difficulty in understanding and answering questions
� the length and time required to finish the questionnaire
� the sequence of the questionnaire.
Suggestions obtained from the participants were then considered for questionnaire
modifications. For instance, there was an indication of some minor errors regarding question
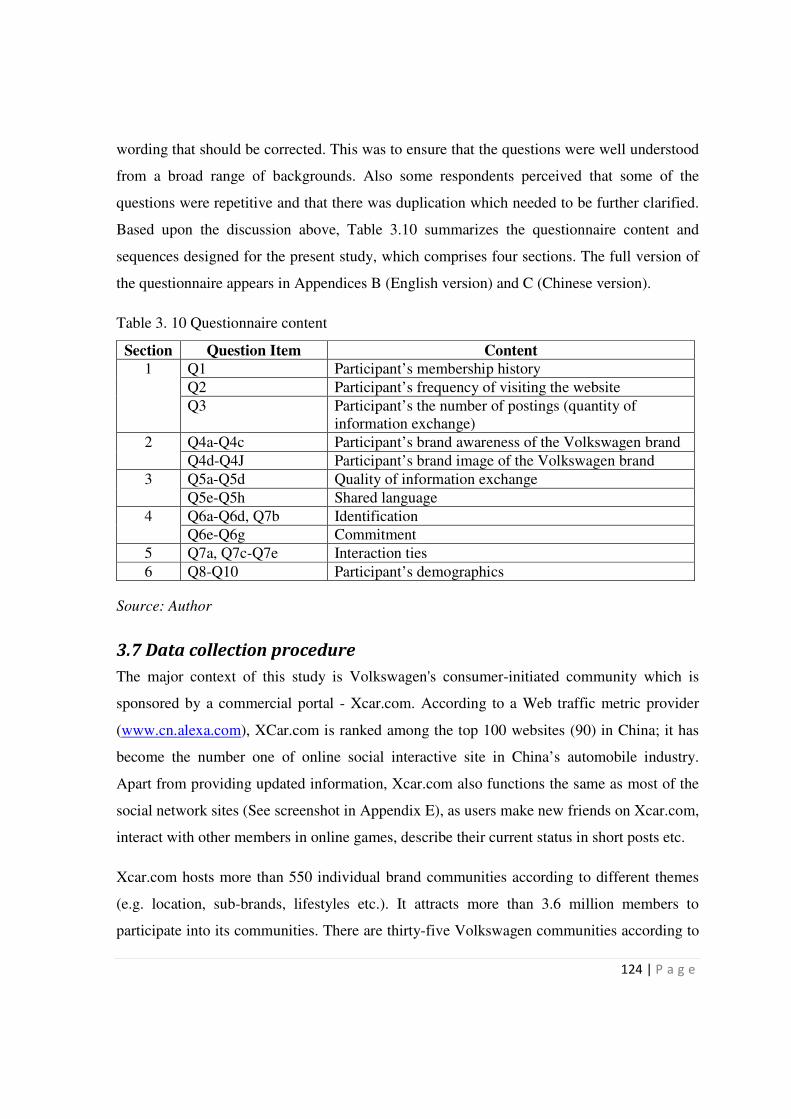
124 | P a g e
wording that should be corrected. This was to ensure that the questions were well understood
from a broad range of backgrounds. Also some respondents perceived that some of the
questions were repetitive and that there was duplication which needed to be further clarified.
Based upon the discussion above, Table 3.10 summarizes the questionnaire content and
sequences designed for the present study, which comprises four sections. The full version of
the questionnaire appears in Appendices B (English version) and C (Chinese version).
Table 3. 10 Questionnaire content
Section Question Item Content
1 Q1 Participant’s membership history
Q2 Participant’s frequency of visiting the website
Q3 Participant’s the number of postings (quantity of
information exchange)
2 Q4a-Q4c Participant’s brand awareness of the Volkswagen brand
Q4d-Q4J Participant’s brand image of the Volkswagen brand
3 Q5a-Q5d Quality of information exchange
Q5e-Q5h Shared language
4 Q6a-Q6d, Q7b Identification
Q6e-Q6g Commitment
5 Q7a, Q7c-Q7e Interaction ties
6 Q8-Q10 Participant’s demographics
Source: Author
3.7 Data collection procedure
The major context of this study is Volkswagen's consumer-initiated community which is
sponsored by a commercial portal - Xcar.com. According to a Web traffic metric provider
(www.cn.alexa.com), XCar.com is ranked among the top 100 websites (90) in China; it has
become the number one of online social interactive site in China’s automobile industry.
Apart from providing updated information, Xcar.com also functions the same as most of the
social network sites (See screenshot in Appendix E), as users make new friends on Xcar.com,
interact with other members in online games, describe their current status in short posts etc.
Xcar.com hosts more than 550 individual brand communities according to different themes
(e.g. location, sub-brands, lifestyles etc.). It attracts more than 3.6 million members to
participate into its communities. There are thirty-five Volkswagen communities according to
125 | P a g e
different sub-brands, such as, POLO, GOLF, PASSAT, etc. (See screenshot in Appendix E).
These communities are based on bulletin board systems – where people go to find topic-
based communities and where consumers talk about products or services.
Prior to conducting the survey, the author registered as a member of Xcar.com in order to
observe these communities for two months to become familiarized with its culture, and
understand how it facilitates the development of brand knowledge. The author’s role in this
observation was a “completed observer” (an unobtrusive observation), having no interaction
with community members and no involvement in consumers’ discussion (Hair et al., 2007).
During the two-month time, the author spent about 1-2 hours a day to observe members’
topic for discussion and their shared content; the insights generated from the observation
were following:
� To register, a member needed to provide contact information (email is compulsory), a
user name and password, demographic details are optional.
� As is common to most discussion forums/virtual communities, anyone can read the
Xcar.com postings but only registered members can post and reply to threads.
� The topic for discussion was around Volkswagen brand, Volkswagen cars, and
consumers’ explicit and tacit knowledge of cars.
Due to the author’s previous connection with Xcar’s staff as university colleagues, the author
was able to conduct two face-to-face meetings with the Web masters and the Marketing
Campaign manager for Xcar.com. Each meeting lasted 30-40 minutes. The purpose of these
these meetings were to set up access to the online community and decide the method of
distributing the questionnaire. As an ordinary member, the author was unable to access to
members’ email address. Thus the survey questionnaire was distributed by posting threads in
the thirty-five Volkswagen communities on the website of Xcar.com and invite members to
voluntarily participate, leaving it up to individuals to choose to participate (opt in).
With approval from the Webmaster, the web survey was conducted in China during the
period from 17th May to 12th August 2011. The self-completion questionnaire was posted in
126 | P a g e
thirty-five Volkswagen OBCs in Xcar.com along with a cover letter to introduce and describe
the survey to all potential participants (See Appendix B and C).
Community leaders from each selected OBC agreed to help promote the participation. A
survey follow-up was instituted to increase the number of questionnaires completed, by
posting the reminder messages every week after the survey was launched. There was no
incentive offer to the respondents. A potential bias might occur in that respondents might
respond to the questionnaire more than once. In order to minimise such bias, the survey
collector settings did not allow multiple responses, but only allowed one response per IP
address. This was done through the professional online survey software SurveyMonkey.com.
In addition, some paper-based questionnaires were distributed on 15th July 2011 through a
one-day off-line event hosted by local Volkswagen communities of Xcar.com in Zhengzhou
city. The marketing campaign manager from Xcar.com informed the author about this event,
and also obtained approval to distribute the questionnaires. The printed questionnaire
contents were the same as web-based ones, because the targeted respondents were the same.
Given the concern that participants of this event might not all have been Xcar.com members,
each participant was required to confirm their Xcar membership identity before they started
the questionnaire.
3.8 Data analysis procedure
In line with the positivist epistemological stance adopted and the deductive approach to
research, this study collected quantitative data in order to test the hypotheses outlined in the
literature chapter. The data analysis procedures were divided into two parts: data preparation
and data analysis.
3.8.1 Data preparation
Data collected from the participants were prepared in the SPSS application. The data were
firstly numerically recorded in an SPSS spreadsheet by figural and score appointments. Score
reversion was also carried out, where appropriate, to accommodate further analytical
procedures.

127 | P a g e
The data input was screened and checked for errors. The file was rechecked to ensure that no
errors existed. Following this, further analyses were undertaken. The relevant analytical
techniques are explained in the following sections.
3.8.2 Data analysis techniques
SPSS 18.0 and AMOS 18.0 were used to perform all statistical tests and produce all results
output included in this study. Confirmatory Factor Analysis (CFA), Pearson Correlation and
Multiple Regression Analysis were major statistical techniques employed for data analysis.
Each analytical technique and related procedure is explained below.
3.8.2.1 CFA analysis
Factor analysis consists of two main approaches: exploratory factor analysis (EFA) and
confirmatory analysis (CFA). EFA is often used in the early stages of research to gather
information to explore the interrelationships among a set of variables. For instance, Wasko
and Faraj (2005) did not follow Nahapiet and Ghoshal’s (1998) framework completely;
instead, they developed “centrality” as an instrument to measure the structural dimension of
social capital at the individual level. In contrast, CFA is used to test and confirm specific
measurement scales concerning the structure underlying a set of variables (Pallant, 2007). In
this study, all the measurements and scales were developed on the basis of previous studies
without developing any new items.
In addition, there are three particularly important reasons for marketing researchers:
i. In common with other areas of social science, marketing researchers have to deal with
complex real-life phenomenon, examining the relationship between theoretical
constructs commonly found in marketing (e.g. customer satisfaction, brand loyalty
etc.). In situations where a large amount of literature has accumulated on a topic,
CFA is one of the most rigorous statistical techniques for testing the validity of
factorial structures within the framework of structural equation modelling (SEM).
ii. Many important marketing variables are latent. Researchers often try to estimate
latent variables with only a single observed measurement, and the reliability of this is
usually unknown. In this study, CFA could help the author model important latent
128 | P a g e
variables with multiple indicator variables (e.g. identification and commitment were
set as measured indicators for the relational dimension of social capital) while taking
into account the unreliability of these indicators.
iii. Customer evaluation, perception or behavioural measures might have lower reliability.
Similarly with this research, brand knowledge is measured by customers’ perceptions
and attitudes towards the Volkswagen brand. It is worth knowing how those
perceptions and attitudes are positively or negatively related to brand knowledge.
Furthermore, Albright and Park (2009) argue that CFA is a special case of Structural
Equation Modelling (SEM). In a comparison of formal studies of the dimensions of social
capital by Wasko and Faraj (2005), Chiu et al. (2006) and Wertz and Ruyter (2007), the
similarity among these three studies is that SEM is used as the main technique to analyze
data. These studies aimed at exploring if there are any indirect relationships between social
capital and knowledge contribution or knowledge sharing; and then determining the
interrelationship among all the variables. In contrast, the primary aim of the present study is
more straightforward and simple which is to determine and evaluate how four dimensions of
social capital influence brand knowledge within a marketing context of online brand
communities. Not much prior research provides empirical support confirming a positive
association between social capital and brand knowledge. Following Nhapiet and Ghoshal
(1998), this study largely considers the dimensions of social capital separately instead of the
interrelationship among them. Therefore, SEM analysis is inappropriate for the research
objectives.
Based upon the discussion, CFA analysis was employed in this research to conduct two
statistical assessments. The first essential step in CFA analysis was the measurement model
assessment, which specified the relationship between observed (measured) and underlying
unobserved (latent) variables. The second step was to access the construct reliability and
validity of the seven scales (interaction ties, shared language, identification, commitment,
information exchange, brand awareness and brand image) in the context of OBCs. Most
importantly, the result of CFA was to examine the presence of the social capital, with four
dimensions, within the context of OBCs.

129 | P a g e
In particularly, AMOS 18.0 was employed to run the CFA analysis in this study, which has
been widely used by other researchers (Hair et al., 1998; Byrne, 2001). A notable feature of
the AMOS program, AMOS Graphics, allowed researchers to work directly from a path
diagram (Byrne, 2001).
3.8.2.2 Correlation and Multiple Regression Analysis
A number of statistical techniques can be used to test hypotheses. The choice of a particular
technique depended on: 1) number of variables; 2) the scale of measurement (Hair et al.,
2007). As mentioned in section 3.6.1, there were five independent variables and two
dependent variables in this study; these variables are measured through Likert scale (ratio
scale). In such cases, multivariate statistical techniques were required to analyse multiple
variables at the same time.
Pearson Correlation Analysis
Correlation Analysis is used to describe the strength and direction of the linear relationship
between two continuous variables (Pallant, 2007). There are three types of correlation
analysis: Pearson Correlation, Spearman Correlation and Partial Correlation. Pearson
Correlation deals with interval and ratio data to access the association between two variables.
Spearman Correlation is used to measure nominal and ordinal data rather than Pearson
Correlation Analysis (Hair et al., 2007). Partial Correlation is similar to Pearson Correlation,
except that it allows the researcher to control for an additional variable. This is usually a
variable that the researcher suspects might be influencing the two variables of interest
(Pallant, 2007).
In this study, the measurement items were measured through the use of ratio scales, Likert
scale ranging from “strongly disagree (1)” to “strongly agree (5)”. Also, as stated in section
3.1, the second objective is to determine whether or not a relationship is present between
each dimension of social capital and brand knowledge. Based upon the discussion above,
Pearson Correlation Analysis was required to test whether the two variables were associated;
and then to access the strength of the relationship between them (Saunders, et al., 2007). In
detail, a correlation coefficient and coefficient of determination examined to represent
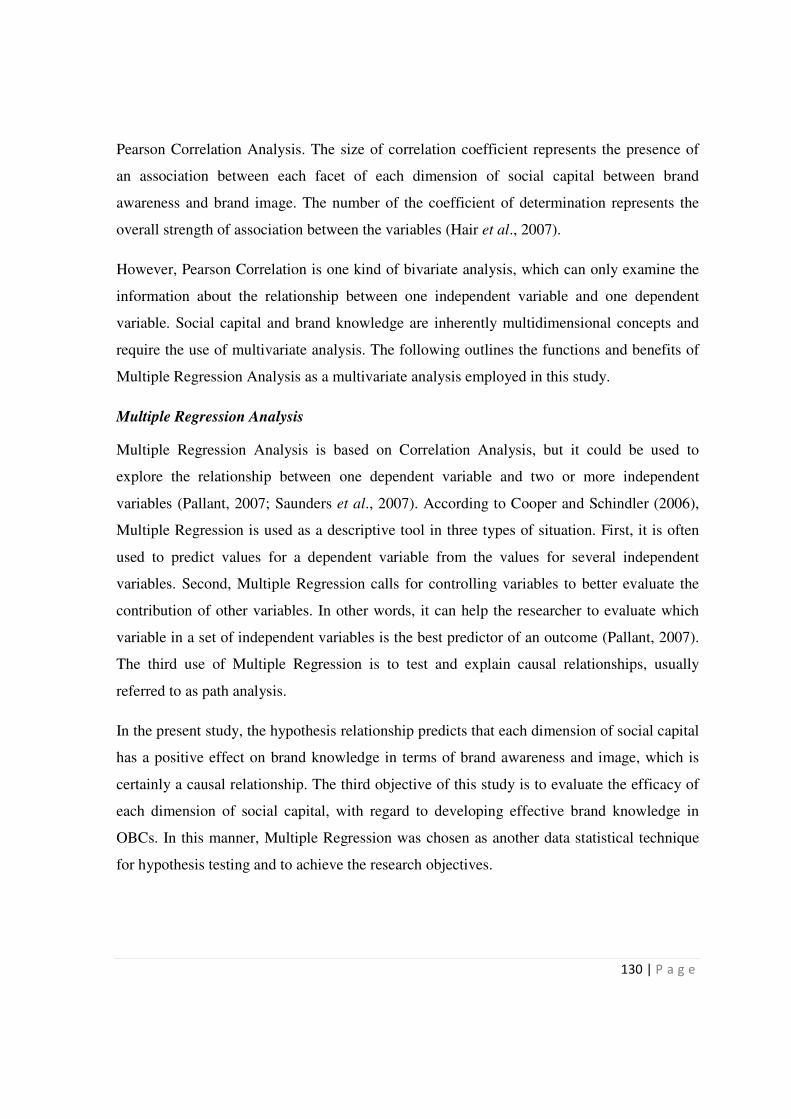
130 | P a g e
Pearson Correlation Analysis. The size of correlation coefficient represents the presence of
an association between each facet of each dimension of social capital between brand
awareness and brand image. The number of the coefficient of determination represents the
overall strength of association between the variables (Hair et al., 2007).
However, Pearson Correlation is one kind of bivariate analysis, which can only examine the
information about the relationship between one independent variable and one dependent
variable. Social capital and brand knowledge are inherently multidimensional concepts and
require the use of multivariate analysis. The following outlines the functions and benefits of
Multiple Regression Analysis as a multivariate analysis employed in this study.
Multiple Regression Analysis
Multiple Regression Analysis is based on Correlation Analysis, but it could be used to
explore the relationship between one dependent variable and two or more independent
variables (Pallant, 2007; Saunders et al., 2007). According to Cooper and Schindler (2006),
Multiple Regression is used as a descriptive tool in three types of situation. First, it is often
used to predict values for a dependent variable from the values for several independent
variables. Second, Multiple Regression calls for controlling variables to better evaluate the
contribution of other variables. In other words, it can help the researcher to evaluate which
variable in a set of independent variables is the best predictor of an outcome (Pallant, 2007).
The third use of Multiple Regression is to test and explain causal relationships, usually
referred to as path analysis.
In the present study, the hypothesis relationship predicts that each dimension of social capital
has a positive effect on brand knowledge in terms of brand awareness and image, which is
certainly a causal relationship. The third objective of this study is to evaluate the efficacy of
each dimension of social capital, with regard to developing effective brand knowledge in
OBCs. In this manner, Multiple Regression was chosen as another data statistical technique
for hypothesis testing and to achieve the research objectives.

131 | P a g e
3.9 Summary
This chapter presented epistemological and methodological considerations of the research
process and the specific research design for this study. The adoption of a positivistic
epistemology stance supported the objectives of the research, and reflected the author’s view
of the world.
Regarding the nature of this study, independent and dependent variables were clearly defined.
In addition, many prior empirical studies in both social capital and brand knowledge have
adopted the survey method. Thus the author decided to employ a web-survey method to
collect the primary data since the target respondents were registered OBC members. This
approach taken in the present study was pragmatic. It had been assured by the selection of a
representative sample, which provided quantitative data, through an online self-completed
questionnaire. In line with the nature of the online survey method, it was difficult to control
who was going to participate (i.e. relatively little information may be known about the
characteristics of the participants in an OBC). The snowball sample technique of sample
selection was suitable for this research due to a lack of sample frame. Further, the
justification and discussion for the chosen questionnaire instrument were also described. The
measurement items for each variable were adopted and developed from previous published
empirical studies, but some minor modifications were made to the existing items to make
them more suitable to this research context.
As stated earlier, this study only focused on the automobile industry with one particular
brand. The data collection was conducted in China; the questionnaires were posted online
within thirty-five Volkswagen OBCs in Xcar.com. Apart from the web-based questionnaire,
the author managed to distribute some paper-based questionnaires to the target respondents
through a one-day off-line event organised by Xcar.com. Consequently, the actual obtained
survey responses contained two types of sources: web-based and paper-based.
Finally, the data analysis techniques and procedures were outlined so that such multivariate
analytical techniques as CFA Analysis, Correlation and Multiple Regression Analysis must
have contributed to the validity and reliability of the results. The next chapter presents the
data analysis and hypothesis testing results of the present study.

132 | P a g e
Chapter 4 Data Analysis and Testing of Hypotheses
4.0 Introduction
This chapter presents the data analysis and findings of this study. In summary, after data
collection, three analyses were performed as follows:
� A descriptive statistical analysis is used to summarize the characteristics of
respondents and the results of measured items. The statistical results were obtained
from SPSS 18.0.
� Confirmatory Factor Analysis (CFA) is used to assess the goodness-of-fit of
measurement model as well as the reliability and validity of each research conduct.
The statistical results were obtained from SPSS 18.0 and AMOS 18.0
� Correlation and Multiple Regression Analysis are conducted via SPSS which was
used to analyse the hypothesised relationships between each independent variable
and dependent variables.
4.1 Responses of participants
In total, the author managed to collect 353 valid responses for the statistical analysis. During
the three-month survey period, the survey website (www.SurveyMonkey.com) registered
339 clicks, of which 301 were completed and usable responses. 38 responses were deleted
because of empty responses. For the paper-based questionnaire, 69 of a total 137 responses
were returned. Of these, 52 questionnaires were completed and usable, but 17 were only
partially answered. However, two responses belonged to the age group of “17 years old or
younger”, which were not adults. The researcher decided to delete these two responses.
Hence, the valid usable web-based responses were 300, paper-based were 51. The response
rate in this study was not able to be calculated, as this study did not have a specific sample
frame.
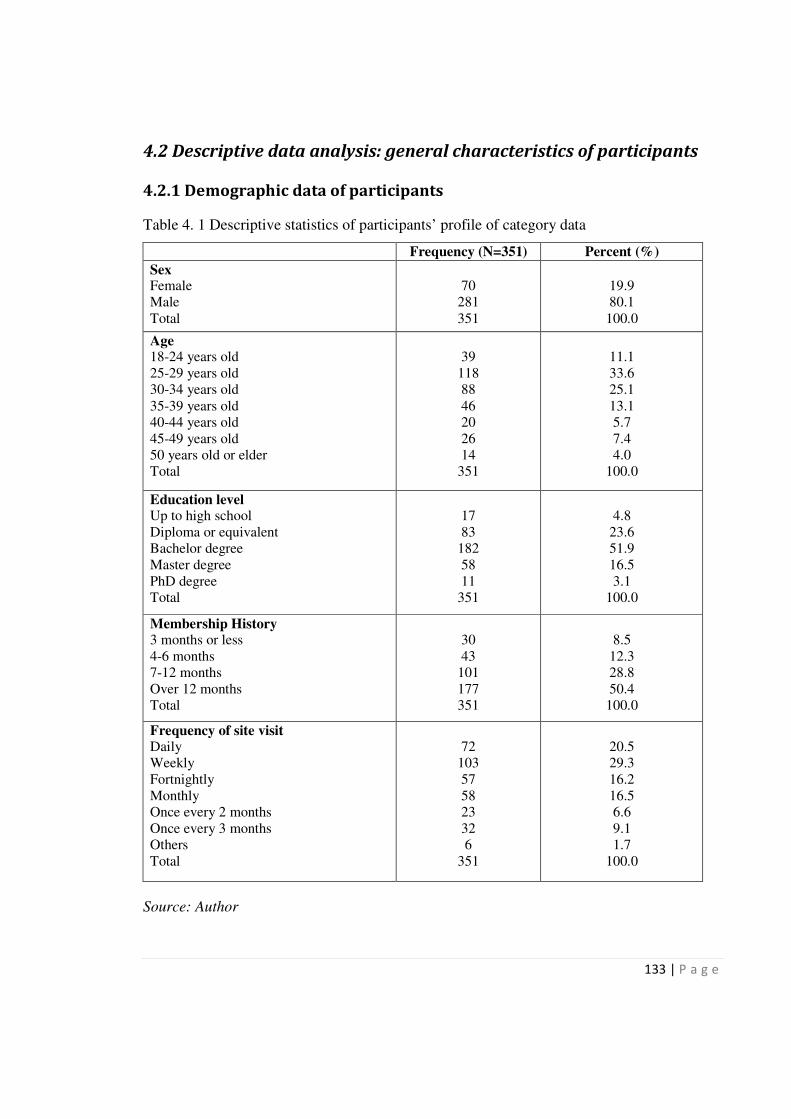
133 | P a g e
4.2 Descriptive data analysis: general characteristics of participants
4.2.1 Demographic data of participants
Table 4. 1 Descriptive statistics of participants’ profile of category data
Frequency (N=351) Percent (%)
Sex Female
Male
Total
70
281
351
19.9
80.1
100.0
Age 18-24 years old
25-29 years old
30-34 years old
35-39 years old
40-44 years old
45-49 years old
50 years old or elder
Total
39
118
88
46
20
26
14
351
11.1
33.6
25.1
13.1
5.7
7.4
4.0
100.0
Education level Up to high school
Diploma or equivalent
Bachelor degree
Master degree
PhD degree
Total
17
83
182
58
11
351
4.8
23.6
51.9
16.5
3.1
100.0
Membership History 3 months or less
4-6 months
7-12 months
Over 12 months
Total
30
43
101
177
351
8.5
12.3
28.8
50.4
100.0
Frequency of site visit Daily
Weekly
Fortnightly
Monthly
Once every 2 months
Once every 3 months
Others
Total
72
103
57
58
23
32
6
351
20.5
29.3
16.2
16.5
6.6
9.1
1.7
100.0
Source: Author
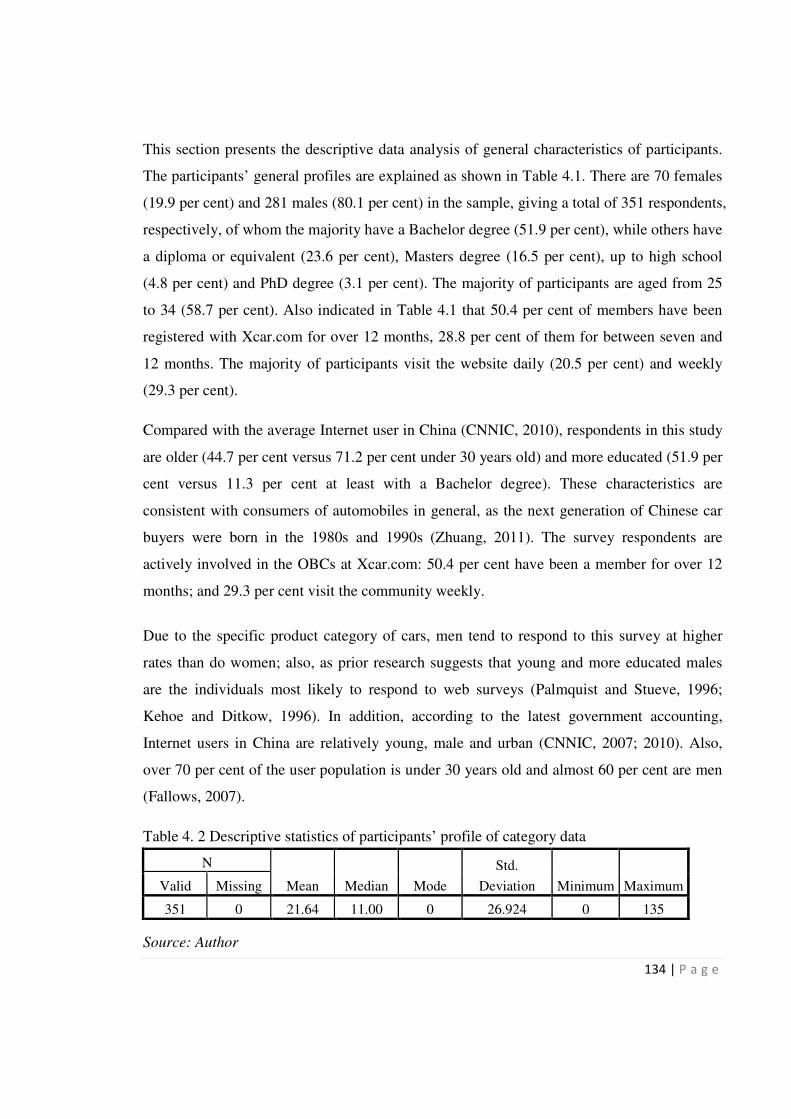
134 | P a g e
This section presents the descriptive data analysis of general characteristics of participants.
The participants’ general profiles are explained as shown in Table 4.1. There are 70 females
(19.9 per cent) and 281 males (80.1 per cent) in the sample, giving a total of 351 respondents,
respectively, of whom the majority have a Bachelor degree (51.9 per cent), while others have
a diploma or equivalent (23.6 per cent), Masters degree (16.5 per cent), up to high school
(4.8 per cent) and PhD degree (3.1 per cent). The majority of participants are aged from 25
to 34 (58.7 per cent). Also indicated in Table 4.1 that 50.4 per cent of members have been
registered with Xcar.com for over 12 months, 28.8 per cent of them for between seven and
12 months. The majority of participants visit the website daily (20.5 per cent) and weekly
(29.3 per cent).
Compared with the average Internet user in China (CNNIC, 2010), respondents in this study
are older (44.7 per cent versus 71.2 per cent under 30 years old) and more educated (51.9 per
cent versus 11.3 per cent at least with a Bachelor degree). These characteristics are
consistent with consumers of automobiles in general, as the next generation of Chinese car
buyers were born in the 1980s and 1990s (Zhuang, 2011). The survey respondents are
actively involved in the OBCs at Xcar.com: 50.4 per cent have been a member for over 12
months; and 29.3 per cent visit the community weekly.
Due to the specific product category of cars, men tend to respond to this survey at higher
rates than do women; also, as prior research suggests that young and more educated males
are the individuals most likely to respond to web surveys (Palmquist and Stueve, 1996;
Kehoe and Ditkow, 1996). In addition, according to the latest government accounting,
Internet users in China are relatively young, male and urban (CNNIC, 2007; 2010). Also,
over 70 per cent of the user population is under 30 years old and almost 60 per cent are men
(Fallows, 2007).
Table 4. 2 Descriptive statistics of participants’ profile of category data
N
Mean Median Mode
Std.
Deviation Minimum Maximum Valid Missing
351 0 21.64 11.00 0 26.924 0 135
Source: Author

135 | P a g e
Table 4.2 presents the descriptive statistics of participants’ profiles for continuous data.
Participants’ posting messages varied from 0 to 135, with a mean of 21.64, standard
deviation of 26.924, Median of 11, and Mode of 0. However, the size of Std. Deviation is
larger than the Mean, thus the author decided to choose the Median to represent the centre of
distribution. The Median is relatively unaffected by the extreme scores.
Figure 4. 1 Frequencies of the postings
Source: Author
The above Scatterplot graph (Figure 4.1) shows the frequency of respondents’ postings,
indicating that a number of respondents did not post any messages in the past one month.
The author decided to transfer and re-categorize the data into seven groups: 1=less than 1,
2=1-10, 3=11-20, 4=21-30, 5=31-40, 6=41=50, and 7=51 and above. The frequencies after
re-categorizing the data are shown in Figure 4.2.
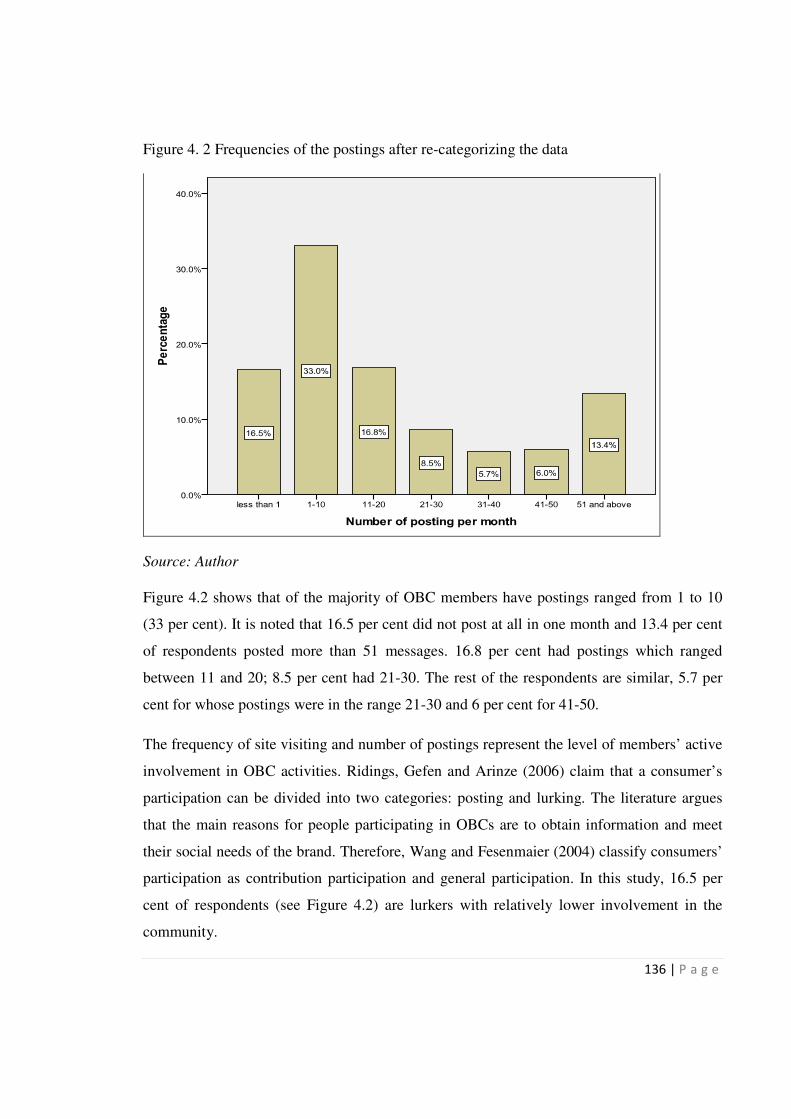
136 | P a g e
Figure 4. 2 Frequencies of the postings after re-categorizing the data
Source: Author
Figure 4.2 shows that of the majority of OBC members have postings ranged from 1 to 10
(33 per cent). It is noted that 16.5 per cent did not post at all in one month and 13.4 per cent
of respondents posted more than 51 messages. 16.8 per cent had postings which ranged
between 11 and 20; 8.5 per cent had 21-30. The rest of the respondents are similar, 5.7 per
cent for whose postings were in the range 21-30 and 6 per cent for 41-50.
The frequency of site visiting and number of postings represent the level of members’ active
involvement in OBC activities. Ridings, Gefen and Arinze (2006) claim that a consumer’s
participation can be divided into two categories: posting and lurking. The literature argues
that the main reasons for people participating in OBCs are to obtain information and meet
their social needs of the brand. Therefore, Wang and Fesenmaier (2004) classify consumers’
participation as contribution participation and general participation. In this study, 16.5 per
cent of respondents (see Figure 4.2) are lurkers with relatively lower involvement in the
community.

137 | P a g e
Algesheimer et al. (2005) further argue that an OBC exerts more influence on its
knowledgeable members. Consumers’ brand knowledge captures both the aspects of interest
in brands and their previous experience with it. This suggests that knowledgeable members
are more engaged with the brand and the OBC, and they are more likely to take on leader
roles in the community. In this study, 13.4 per cent of respondents are highly involved in the
discussions with more than 51 posts in one month, because they may know more about the
brand and feel more confident to express their opinions.
4.2.2 Non-response bias
Non-response bias occurs in statistical surveys if the answers of respondents differ from the
potential answers of those who did not answer in terms of demographic or attitudinal
variables (Sax, Gilmartin and Bryant, 2003). In other words, not all people included in the
sample are willing or able to complete the survey (Couper, 2000). In detail, non-response
can take two forms: total non-response refers to individuals failing to return the survey at all;
while unit or item non-response indicates that the survey was returned incomplete (Franked
and Wallen, 1993).
The present study focuses on total non-response bias. Due to the setting of the web-survey,
respondents need to fill in all the questions without any missing items. In addition, mode
effects are considered as an influential factor on non-responses to the survey in paper-based
versions; within a single administration, this may impact on responses. Thus, the non-
response bias testing is carried out among 301 web-based responses (this number is the total
number of 353 valid responses minus 52 paper-based responses).
There are different techniques for accessing non-response bias: archive analysis, the follow-
up-approach, wave analysis and passive non-response (Rogelberg and Stanton, 2007). This
study has no access to a comprehensive database of OBC members, so it is unable to identify
an accurate sample frame. It is difficult for the author to control who participated in the
survey. Under such conditions, wave analysis is chosen to access non-response bias by
verifying that early respondents and late respondents do not significantly differ in their
characteristics. A total of 300 web-based responses are divided as follows: the first 1/3 is set
as early response; the last 1/3 is set as late response. Demographic variables, such as sex, age,

138 | P a g e
educational level, membership history and frequency of site visiting are used in the test of
non-responses bias. The non-parametric statistic techniques Chi-Square and Mann-Whitney
are chosen to run the test. Chi-Square is a basic test for comparing the differences between
two groups; while Mann-Whitney U is more powerful, used to test a continuous variable.
Table 4.3 illustrates the results of the two types of statistical testing as below:
Table 4. 3 Results of non-response bias test for web-based responses
Variables Chi-Square (Asymp Sig.) Mann-Whitney (Asymp Sig.)
Sex .298* __
Age .657* .304*
Education Level .452* .486*
Membership History .619* .185*
Frequency of Site Visiting .084* .286*
Note: *p-value>0.05
Source: Author
As seen in Table 4.3, the comparison on ‘Sex’, ‘Age’, ‘Education Level’, ‘Membership
History‘’ and ‘Frequency of Site Visiting’ between the two groups, shows no significant
differences based on Chi-Square and Mann-Whitney U test. Although a discrepancy is found
in the result between the two types of tests, the significant p-values all exceeded 0.05.
4.3 Descriptive statistics of measured items
This section presents the descriptive statistics of all the measured items from SPSS 18.0,
which includes frequency analysis, the value of Mean, Sta. Deviation and variance. As
discussed in section 3.5.3.1 of the methodology chapter, there are seven measured variables
with 30 items in total in this study. Table 4.4 presents the meaning and descriptive statistics
for each measured item based on 351 samples.

139 | P a g e
Table 4. 4 Descriptive statistics of measured items
Measured Items
N=351
Mean Std
Deviation
Variance
Interaction ties (INTER)
I maintain close relationships with some members in this
community (INTER1) 3.54 .784 .615
I spend a lot of time interacting with other members in this
community (INTER2) 3.35 .865 .747
I know some members personally in this community (INTER3) 3.74 .794 .631
I communicate frequently with some members in this community
(INTER4) 3.71 .793 .630
Shared language (SLAN)
Members in this community in Xcar.com use a common vocabulary
in their discussion in this forum (SLAN1) 3.70 .729 .531
Members in this community in Xcar.com use technique terms in
their discussion in this forum (SLAN2) 3.54 .795 .632
Members in this community in Xcar.com communicate with each
in a way that is easy to understand (SLAN3) 3.75 .780 .608
Members in this community in Xcar.com use share their own
experience in their discussion in this forum (SLAN4) 3.93 .772 .595
Identification (IDEN)
I am very attached to this community (IDEN1) 3.69 .723 .522
I see myself as part of this community (IDEN2) 3.69 .742 .551
I share the same vision with other members in this community
(IDEN3) 3.59 .840 .705
I am proud to be a member of this community (IDEN4) 3.62 .753 .567
The close relationships I have with other members in this
community means a lot to me (IDEN5) 3.58 .743 .553
Commitment (COMIT)
I feel very loyal to this community (COMIT1) 3.66 .730 .533
I would feel a loss if this community is not available anymore in
Xcar.com (COMIT2) 3.57 .828 .685
I try my best to maintain the relationship that I have with this
community in Xcar.com (COMIT3) 3.78 .745 .555
Quality of Information Exchange (Quality INFC)
The information exchanged by members in Xcar.com is reliable
(INFC1) 3.45 .805 .648
The information exchanged by members in Xcar.com is accurate
(INFC2) 3.44 .805 .647
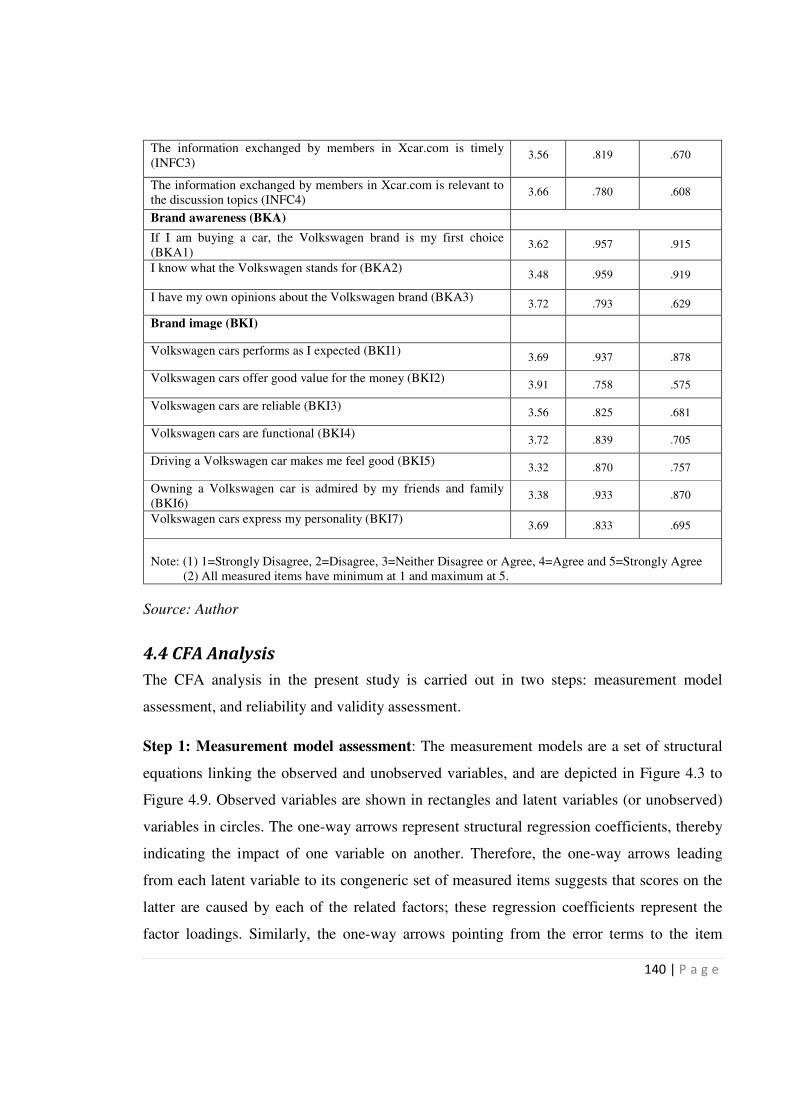
140 | P a g e
The information exchanged by members in Xcar.com is timely
(INFC3) 3.56 .819 .670
The information exchanged by members in Xcar.com is relevant to
the discussion topics (INFC4) 3.66 .780 .608
Brand awareness (BKA)
If I am buying a car, the Volkswagen brand is my first choice
(BKA1) 3.62 .957 .915
I know what the Volkswagen stands for (BKA2) 3.48 .959 .919
I have my own opinions about the Volkswagen brand (BKA3) 3.72 .793 .629
Brand image (BKI)
Volkswagen cars performs as I expected (BKI1) 3.69 .937 .878
Volkswagen cars offer good value for the money (BKI2) 3.91 .758 .575
Volkswagen cars are reliable (BKI3) 3.56 .825 .681
Volkswagen cars are functional (BKI4) 3.72 .839 .705
Driving a Volkswagen car makes me feel good (BKI5) 3.32 .870 .757
Owning a Volkswagen car is admired by my friends and family
(BKI6) 3.38 .933 .870
Volkswagen cars express my personality (BKI7) 3.69 .833 .695
Note: (1) 1=Strongly Disagree, 2=Disagree, 3=Neither Disagree or Agree, 4=Agree and 5=Strongly Agree
(2) All measured items have minimum at 1 and maximum at 5.
Source: Author
4.4 CFA Analysis
The CFA analysis in the present study is carried out in two steps: measurement model
assessment, and reliability and validity assessment.
Step 1: Measurement model assessment: The measurement models are a set of structural
equations linking the observed and unobserved variables, and are depicted in Figure 4.3 to
Figure 4.9. Observed variables are shown in rectangles and latent variables (or unobserved)
variables in circles. The one-way arrows represent structural regression coefficients, thereby
indicating the impact of one variable on another. Therefore, the one-way arrows leading
from each latent variable to its congeneric set of measured items suggests that scores on the
latter are caused by each of the related factors; these regression coefficients represent the
factor loadings. Similarly, the one-way arrows pointing from the error terms to the item

141 | P a g e
indicate that the reliability of these observed variables is influenced by random measurement
error (Byrne, 2001).
Figure 4. 3 The measurement model for interaction ties
Where INTER1, INTER2, INTER3, INTER4 are defined as in Table 4.4.
Figure 4. 4 The measurement model for shared language
Where SLAN1, SLAN2, SLAN3, SLAN4 are defined as in Table 4.4.

142 | P a g e
Figure 4. 5 The measurement model for identification
Where IDEN1, IDEN2, IDEN3, IDEN4, IDEN5 are defined as in Table 4.4.
Figure 4. 6 The measurement model for commitment
Where COMIT1, COMIT2, COMIT3 are defined as in Table 4.4.

143 | P a g e
Figure 4. 7 The measurement model for quality of information exchange
Where INFC1, INFC2, INFC3, INFC4 are defined as in Table 4.4.
Figure 4. 8 The measurement model for brand awareness
Where BKA1, BKA2, BKA3 are defined as in Table 4.4.

144 | P a g e
Figure 4. 9 The measurement model for brand image
Where BKI1, BKI2, BKI3, BKI4, BKI5, BKI6, BKI7 are defined as in Table 4.4.
The first step in conducting measurement assessment is to identify the model by reviewing
the value of degree of freedom (DF). DF<0 suggests that a model is under-identified, thus
the proposed model is not able to test; DF=0 suggests that a model is just identified, the
proposed model fits the data perfectly; DF>0 suggests that a model is over-identified; the
proposed model is acceptable by assessing the model fit indices. The literature offers a wide
range of goodness of fit indices; the following Table 4.5 illustrates the most cited indices in
the methodological literature of SEM. Then, some measured items that comprise the
research construct are eliminated according to the standard CFA methodology in order to
achieve a good-fit measurement model.

145 | P a g e
Table 4. 5 Recommended fit indices for measurement model evaluation
Statistics Statistic Property Recommend
Value
Sources
X²/DF Minimum discrepancy divided by its degree of
freedom
<3.00 Joreskog and
Sorbom, 1993;
Hu and Bentler,
1995; Kline,
2005.
p-value Level of correspondence of the model to the
observed data
>0.05 Byrne, 2001;
Gefen, 2003;
Kline, 2005.
GFI Proportion of observed covariance explained by
the model-implied covariance
>0.90 Hair et al., 1998;
Gefen, 2003;
Kline, 2005.
AGFI Proportion of observed covariance explained by
the model-implied covariance (adjusted for
degree of freedom)
>0.80 Hair et al. 1998;
Byrne, 2001;
Kline, 2005.
CFI Proportion in the improvement of the overall fit
of the model as compared to a null model
>0.90 Chin et al. 2001;
Byrne, 2001;
Kline, 2005.
TLI Relative improvement per degree of freedom if
the target model over an independence model
>0.90 Byrne, 2001;
Kline, 2005
RMSEA Square root of model’s discrepancy per degree
of freedom
<0.10 Joreskog and
Sorbom, 1993;
Byrne, 2001;Hair
et al., 2006
RMR Square root of the average squared amount by
which the sample variances and covariance
differ from their estimates obtained under the
assumption of the correct model
<0.05 Hu and Bentler,
1995; Chin et al.,
2001
Source: Sarapaivanich (2006)
As two measures of absolute fit statistics, the X² and significance of p-value are often subject
to over-inflation due to sensitivity to large sample sizes (Kline, 2005). In this manner, the
measurement model fit is suggested to examine various indices as shown in Table 4.5.
Step 2: Validity and reliability assessment
Before using the score from any concept for analysis, the researcher must ensure the
variables or indicators selected to represent and measure the concept do so in an accurate and
consistent manner. Accuracy is associated with the item validity while consistency is
associated with the term reliability (Hair et al., 2007; Bryman, 2008).
146 | P a g e
Validity
There are three approaches to assessing measurement validity: content validity, criterion
validity and construct validity (Hair et al., 2007). In general, content validity involves
consulting a small sample of typical respondents or experts to pass judgment on the
suitability of the items chosen to represent the construct. For questionnaire-based research in
this study, each measured item or indicator represented a particular question or statement.
Accordingly, content validity had been examined in the questionnaire pilot study.
Criterion validity assesses whether a construct performs as expected relative to other
variables identified as meaningful criteria. For example, the researcher needs to show that
the scores obtained from the application of the scale being validated are able to predict
scores on a theoretically identified dependent variable, referred to as the criterion variable
(Hair et al., 2007). However, criterion validity is very difficult to assess in questionnaire-
based research, as the appropriate criterion variable is hard to set up. Construct validity is to
assess what the construct is in fact measuring which can be performed through convergent
validity and discriminant validity checks. Convergent validity is present when different
instruments are used to measure the same construct and scores from these different
instruments are strongly correlated. In contrast, discriminant validity is present when
different instruments are used to measure different constructs and the measures of these
different constructs are weakly correlated (Hair et al., 2007).
The average variance extracted (AVE) coefficient is used to assess the convergent validity,
examining whether the measured items are able to explain the variance in the constructs. The
following formula is applied to calculate the AVE value (Diamantopoulos and Siguaw,
2000). The recommended AVE value is supposed to be greater than .50.
AVE= (∑λ²)/[(∑λ²) + ∑ (ө)]
Where λ= indicator factor loadings
ө= indicator error variances
∑= summation over the indicators of the unobserved variable
147 | P a g e
Further, comparing the square root of AVEs to the correlation between research constructs
assesses the discriminant validity.
Reliability
Reliability is when a scale or question consistently measures a concept. In this study, the
internal consistency reliability test is chosen to assess a summated scale where multi-items
are summed to form a total score for a construct (Hair et al., 2007). In detail, the reliability is
assessed by factor loadings and composite reliability coefficients; the following formula is
applied to calculate the composite reliability and the recommended value is supposed to be
greater than .70 (Diamantopoulos and Siguaw, 2000).
Composite Reliability= (∑λ) ²/[(∑λ) ² + ∑ (ө)]
Where λ= indicator factor loadings
ө= indicator error variances
∑= summation over the indicators of the unobserved variable
The factor loadings (λ) and error variances (ө) were obtained directly from AMOS’s output.
Also, this study examines Cronbach’s alpha values to assess the reliability of constructs,
which is obtained from SPSS output. Cronbach’s alpha is the most commonly used test to
examine the reliability of the measured items. Researchers generally consider an alpha of .70
as a minimum. Range between .60 and .70 is still acceptable but the strength of association
between constructs and measured items is moderate.
4.4.1 Measurement model assessment of CFA analysis
4.4.1.1 Measurement assessment regarding the structural dimension of social
capital (INTER)
Regarding the statistical output shown in Table 5.6, it is suggested that this proposed
measurement model fits the data well. Factor loadings ranged from .592 to .807 (the
recommended value is exceeded .50) and t-values are from 9.617 to 11.980 (recommended t-
value > |1.96|). Here, factor loading is represented as standard regression weight (S.R.W)
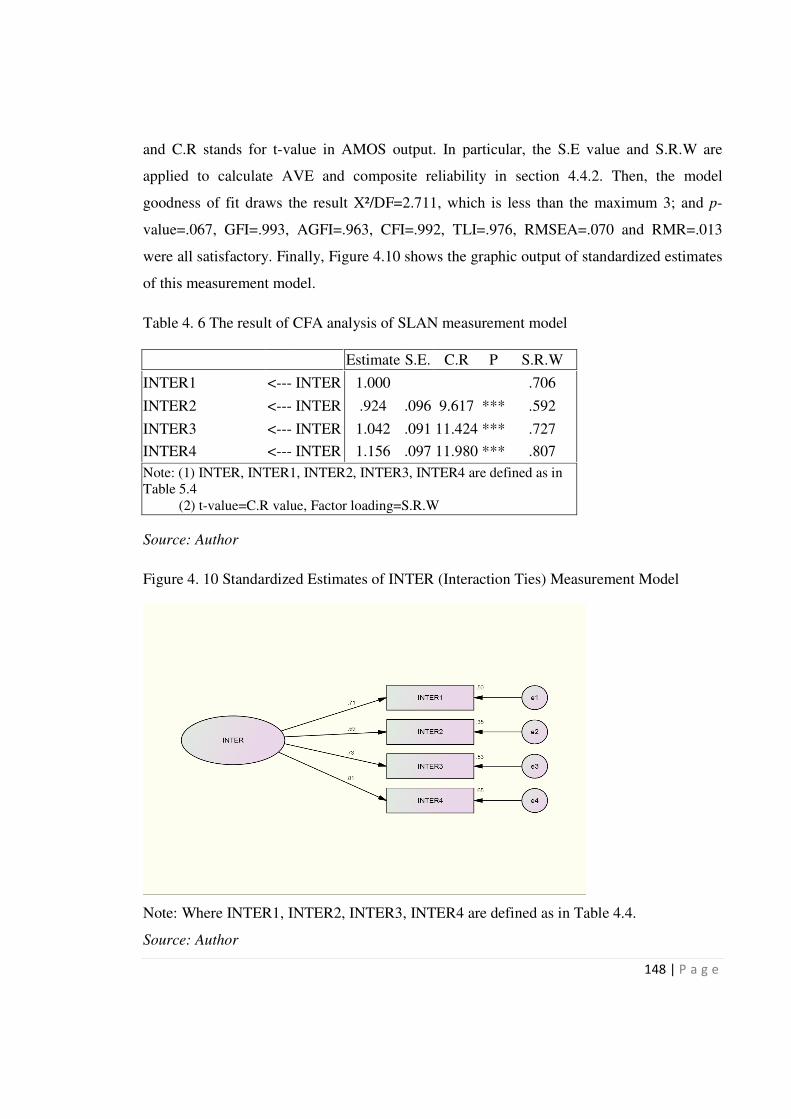
148 | P a g e
and C.R stands for t-value in AMOS output. In particular, the S.E value and S.R.W are
applied to calculate AVE and composite reliability in section 4.4.2. Then, the model
goodness of fit draws the result X²/DF=2.711, which is less than the maximum 3; and p-
value=.067, GFI=.993, AGFI=.963, CFI=.992, TLI=.976, RMSEA=.070 and RMR=.013
were all satisfactory. Finally, Figure 4.10 shows the graphic output of standardized estimates
of this measurement model.
Table 4. 6 The result of CFA analysis of SLAN measurement model
Estimate S.E. C.R P S.R.W
INTER1 <--- INTER 1.000
.706
INTER2 <--- INTER .924 .096 9.617 *** .592
INTER3 <--- INTER 1.042 .091 11.424 *** .727
INTER4 <--- INTER 1.156 .097 11.980 *** .807
Note: (1) INTER, INTER1, INTER2, INTER3, INTER4 are defined as in
Table 5.4
(2) t-value=C.R value, Factor loading=S.R.W
Source: Author
Figure 4. 10 Standardized Estimates of INTER (Interaction Ties) Measurement Model
Note: Where INTER1, INTER2, INTER3, INTER4 are defined as in Table 4.4.
Source: Author

149 | P a g e
4.4.1.2 Measurement assessment regarding the cognitive dimension of social
capital: Shared Language (SLAN)
Similar to the assessing process for INTER model, the following Table 4.7 shows that SLAN
measurement model has a DF=2, which suggests the goodness of model fit can be tested:
X²/DF=2.733, p-value=.065, GFI=.993, AGFI=.993, CFI=.993, TLI=.978, RMSEA=.070
and RMR=.011. The results show that SLAN measurement model has a good fit towards the
sample data. As shown in Table 4.1.2, factor loadings are ranged from .661 to .835 and t-
value is ranged between 10.665 and 12.339. Figure 4.11 depicts the graphic output of
standardized estimates of SLAN measurement model.
Table 4. 7 The result of CFA analysis of SLAN measurement model
Estimate S.E. C.R. P S.R.W
SLAN1 <--- SLAN 1.000
.693
SLAN2 <--- SLAN 1.040 .097 10.665 *** .661
SLAN3 <--- SLAN 1.289 .104 12.339 *** .835
SLAN4 <--- SLAN 1.093 .096 11.393 *** .715
Note: (1) SLAN, SLAN1, SLAN2, SLAN3, SLAN4 are defined as in
Table 5.4
(2) t-value=C.R value, Factor loading=S.R.W
Source: Author
Figure 4. 11 Standardized estimates of SLAN (shared language) measurement model
Note: Where SLAN1, SLAN2, SLAN3, SLAN4 are defined as in Table 4.4

150 | P a g e
4.4.1.3 Measurement assessment regarding the relational dimension of social
capital: Identification (IDEN) and Commitment (COMIT)
The relational dimension of social capital is assessed by identification and commitment.
Therefore, this measurement model has two factors: identification has five indicators
(IDEN1, IDEN2, IDEN3, IDEN4 and IDEN5), and commitment has three indicators
(COMIT1, COMIT2 and COMIT3). This section firstly assesses the single measurement for
each factor, and then assesses the measurement model of the relational dimension of social
capital.
Table 4. 8 The result of CFA analysis of IDEN measurement model
Estimate S.E. C.R. P S.R.W
IDEN1 <--- IDEN 1.000
.782
IDEN2 <--- IDEN 1.106 .071 15.569 *** .842
IDEN3 <--- IDEN 1.064 .080 13.288 *** .716
IDEN4 <--- IDEN .902 .072 12.486 *** .676
IDEN5 <--- IDEN .852 .072 11.899 *** .647
Note: (1) INDEN, IDEN1, IDEN2, IDEN3, IDEN4, IDEN5 are defined as in Table 5.4
(2) t-value=C.R value, Factor loading=S.R.W
Source: Author
Table 4.8 shows that factor loadings of the five identification indicators loadings are all
above .60, and the t-value is ranged from 11.899 to 15.569. However, neither X²/DF value
(3.106) nor the associated p-value (.008) indicates a good fit between the model and data.
For X²/DF, the smaller and less significant the value is, the better the model fit the data.
Many researchers recommend ratios of less than 3.00 as an indication of the model fit, but
any value between 3 to 5 is still accepted (Bentler, 1989; Chiu et al., 2006). In addition,
Garver and Mentzer (1999) argue that the model can be accepted if other fit indices reach the
accepted values. The reason is that the chi-square statistics and associated p-value are highly
sensitive to a large sample size, and it is often found to be so in cases involving more than
200 responses as in this study (Kline, 2005). The results show other indices, GFI=.984,
AGFI=.951, CFI=.985, TLI=.970, RMSEA=.078 and RMR=.014, all achieve the
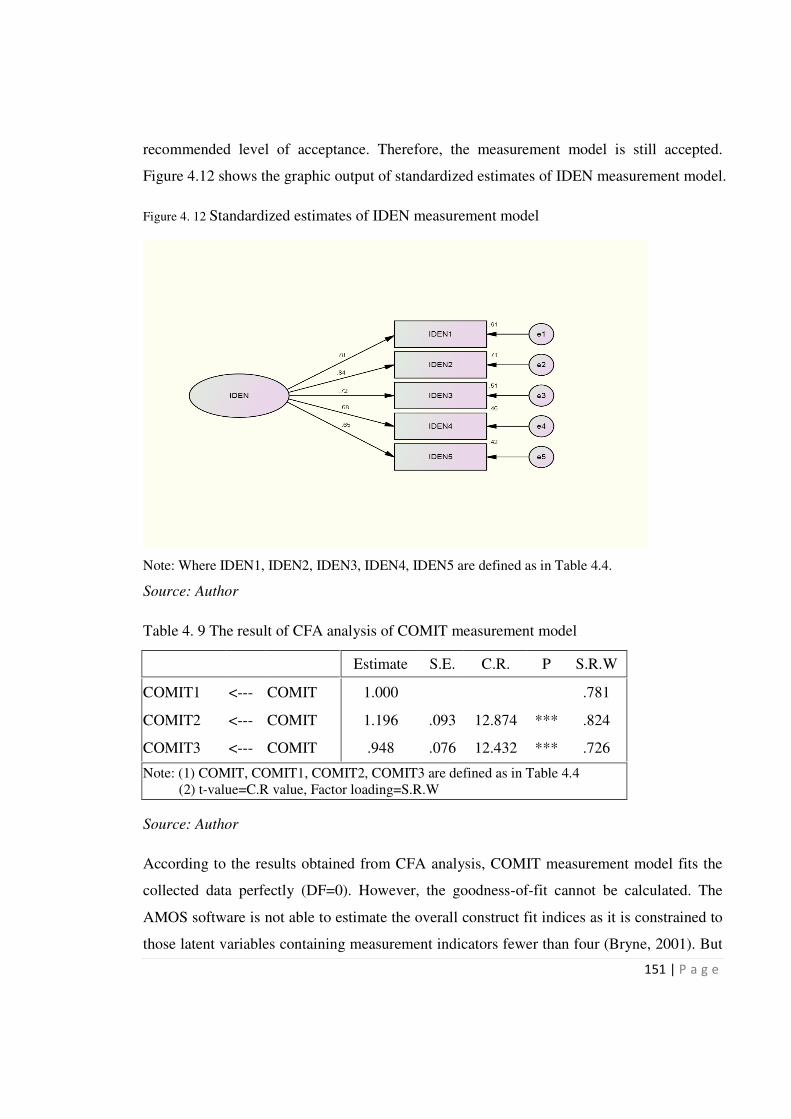
151 | P a g e
recommended level of acceptance. Therefore, the measurement model is still accepted.
Figure 4.12 shows the graphic output of standardized estimates of IDEN measurement model.
Figure 4. 12 Standardized estimates of IDEN measurement model
Note: Where IDEN1, IDEN2, IDEN3, IDEN4, IDEN5 are defined as in Table 4.4.
Source: Author
Table 4. 9 The result of CFA analysis of COMIT measurement model
Estimate S.E. C.R. P S.R.W
COMIT1 <--- COMIT 1.000
.781
COMIT2 <--- COMIT 1.196 .093 12.874 *** .824
COMIT3 <--- COMIT .948 .076 12.432 *** .726
Note: (1) COMIT, COMIT1, COMIT2, COMIT3 are defined as in Table 4.4
(2) t-value=C.R value, Factor loading=S.R.W
Source: Author
According to the results obtained from CFA analysis, COMIT measurement model fits the
collected data perfectly (DF=0). However, the goodness-of-fit cannot be calculated. The
AMOS software is not able to estimate the overall construct fit indices as it is constrained to
those latent variables containing measurement indicators fewer than four (Bryne, 2001). But
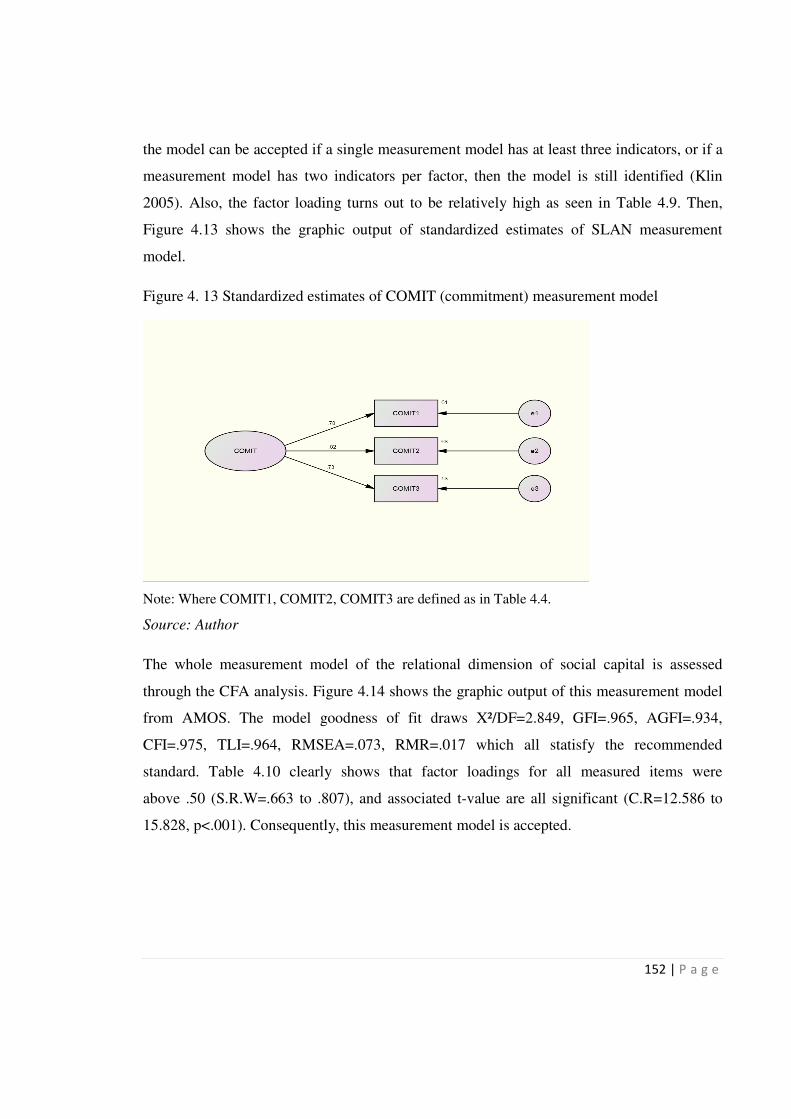
152 | P a g e
the model can be accepted if a single measurement model has at least three indicators, or if a
measurement model has two indicators per factor, then the model is still identified (Klin
2005). Also, the factor loading turns out to be relatively high as seen in Table 4.9. Then,
Figure 4.13 shows the graphic output of standardized estimates of SLAN measurement
model.
Figure 4. 13 Standardized estimates of COMIT (commitment) measurement model
Note: Where COMIT1, COMIT2, COMIT3 are defined as in Table 4.4.
Source: Author
The whole measurement model of the relational dimension of social capital is assessed
through the CFA analysis. Figure 4.14 shows the graphic output of this measurement model
from AMOS. The model goodness of fit draws X²/DF=2.849, GFI=.965, AGFI=.934,
CFI=.975, TLI=.964, RMSEA=.073, RMR=.017 which all statisfy the recommended
standard. Table 4.10 clearly shows that factor loadings for all measured items were
above .50 (S.R.W=.663 to .807), and associated t-value are all significant (C.R=12.586 to
15.828, p<.001). Consequently, this measurement model is accepted.

153 | P a g e
Table 4. 10 The result of CFA analysis of the relational dimension of social capital
measurement Model
Estimate S.E. C.R. P S.R.W
IDEN2 <--- IDEN 1.060 .067 15.828 *** .807
IDEN3 <--- IDEN 1.047 .078 13.507 *** .705
IDEN4 <--- IDEN .957 .069 13.807 *** .718
COMIT1 <--- COMIT 1.000
.788
COMIT2 <--- COMIT 1.120 .075 14.919 *** .778
COMIT3 <--- COMIT .991 .068 14.647 *** .765
IDEN5 <--- IDEN .872 .069 12.586 *** .663
IDEN1 <--- IDEN 1.000
.782
Note: (1) IDEN1, IDEN2, IDEN3, IDEN4, IDEN5, COMIT1, COMIT2,
COMIT3 are defined as in Table 4.4
(2) t-value=C.R value, Factor loading=S.R.W
Source: Author
Figure 4. 14 Standardized estimates of the relational dimension of social capital
Note: Where IDEN1, IDEN2, IDEN3, IDEN4, IDEN5, COMIT1, COMIT2, COMIT3 are defined as
in Table 4.4.
Source: Author
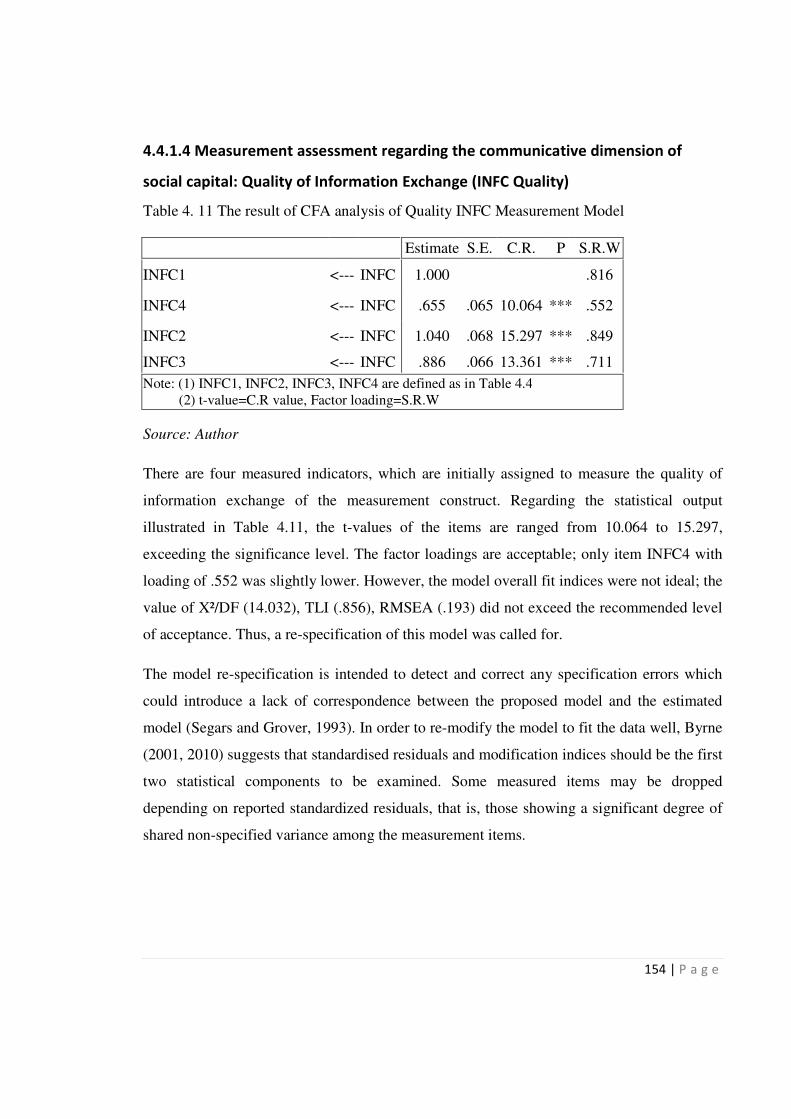
154 | P a g e
4.4.1.4 Measurement assessment regarding the communicative dimension of
social capital: Quality of Information Exchange (INFC Quality)
Table 4. 11 The result of CFA analysis of Quality INFC Measurement Model
Estimate S.E. C.R. P S.R.W
INFC1 <--- INFC 1.000
.816
INFC4 <--- INFC .655 .065 10.064 *** .552
INFC2 <--- INFC 1.040 .068 15.297 *** .849
INFC3 <--- INFC .886 .066 13.361 *** .711
Note: (1) INFC1, INFC2, INFC3, INFC4 are defined as in Table 4.4
(2) t-value=C.R value, Factor loading=S.R.W
Source: Author
There are four measured indicators, which are initially assigned to measure the quality of
information exchange of the measurement construct. Regarding the statistical output
illustrated in Table 4.11, the t-values of the items are ranged from 10.064 to 15.297,
exceeding the significance level. The factor loadings are acceptable; only item INFC4 with
loading of .552 was slightly lower. However, the model overall fit indices were not ideal; the
value of X²/DF (14.032), TLI (.856), RMSEA (.193) did not exceed the recommended level
of acceptance. Thus, a re-specification of this model was called for.
The model re-specification is intended to detect and correct any specification errors which
could introduce a lack of correspondence between the proposed model and the estimated
model (Segars and Grover, 1993). In order to re-modify the model to fit the data well, Byrne
(2001, 2010) suggests that standardised residuals and modification indices should be the first
two statistical components to be examined. Some measured items may be dropped
depending on reported standardized residuals, that is, those showing a significant degree of
shared non-specified variance among the measurement items.
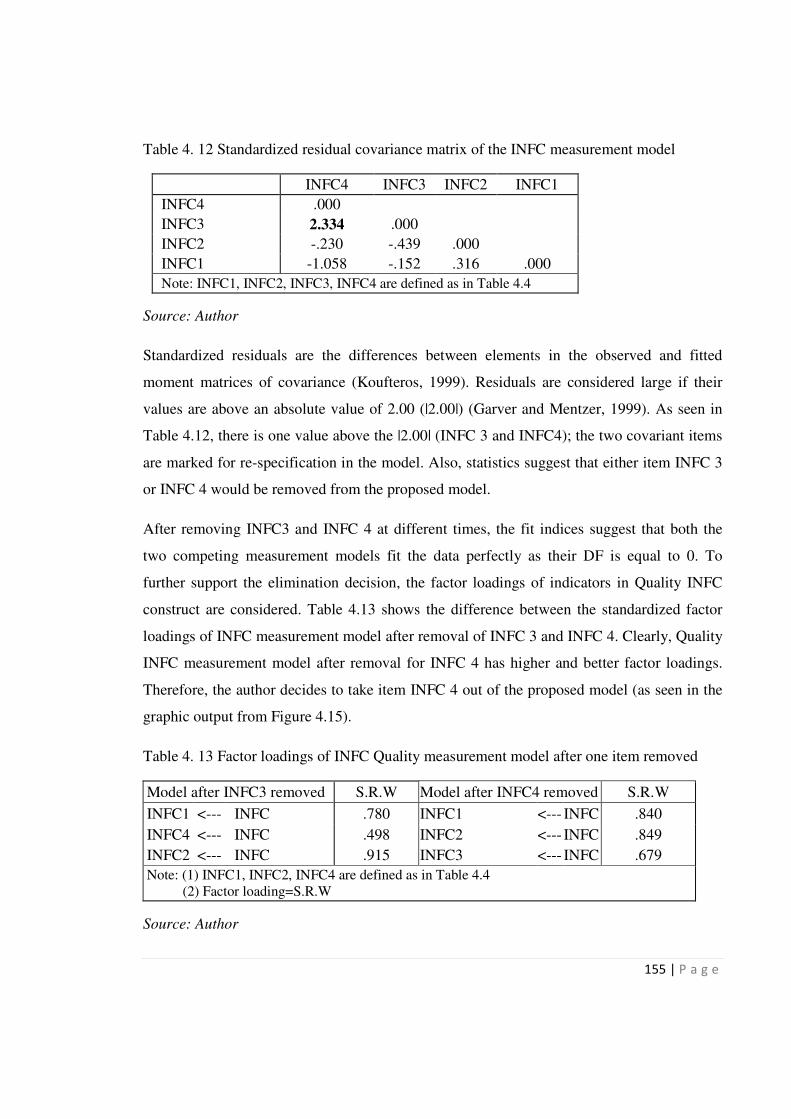
155 | P a g e
Table 4. 12 Standardized residual covariance matrix of the INFC measurement model
INFC4 INFC3 INFC2 INFC1
INFC4 .000
INFC3 2.334 .000
INFC2 -.230 -.439 .000
INFC1 -1.058 -.152 .316 .000
Note: INFC1, INFC2, INFC3, INFC4 are defined as in Table 4.4
Source: Author
Standardized residuals are the differences between elements in the observed and fitted
moment matrices of covariance (Koufteros, 1999). Residuals are considered large if their
values are above an absolute value of 2.00 (|2.00|) (Garver and Mentzer, 1999). As seen in
Table 4.12, there is one value above the |2.00| (INFC 3 and INFC4); the two covariant items
are marked for re-specification in the model. Also, statistics suggest that either item INFC 3
or INFC 4 would be removed from the proposed model.
After removing INFC3 and INFC 4 at different times, the fit indices suggest that both the
two competing measurement models fit the data perfectly as their DF is equal to 0. To
further support the elimination decision, the factor loadings of indicators in Quality INFC
construct are considered. Table 4.13 shows the difference between the standardized factor
loadings of INFC measurement model after removal of INFC 3 and INFC 4. Clearly, Quality
INFC measurement model after removal for INFC 4 has higher and better factor loadings.
Therefore, the author decides to take item INFC 4 out of the proposed model (as seen in the
graphic output from Figure 4.15).
Table 4. 13 Factor loadings of INFC Quality measurement model after one item removed
Model after INFC3 removed S.R.W Model after INFC4 removed S.R.W
INFC1 <--- INFC .780 INFC1 <--- INFC .840
INFC4 <--- INFC .498 INFC2 <--- INFC .849
INFC2 <--- INFC .915 INFC3 <--- INFC .679
Note: (1) INFC1, INFC2, INFC4 are defined as in Table 4.4
(2) Factor loading=S.R.W
Source: Author

156 | P a g e
Figure 4. 15 Standardized estimates the quality of information exchange (INFC Quality)
measurement model after removal of INFC4
Note: Where INFC1, INFC2, INFC3 are defined as in Table 4.4.
Source: Author
4.4.1.5 Full measurement assessment regarding the social capital
Figure 4.16 displays the relationship of all social capital measurement dimensions, including
interaction ties, shared language, identification, commitment and quality of information
exchange. In order to validate the fit properties and consider potential modification of the
full social capital measurement model, the model-fit indices, standardized residuals and
modification were considered. Figure 4.16 thus depicts the standardized estimates of the full
social capital measurement model.
With regard to the model-fit indices, most of the statistics support the model fit (i.e.
X²/DF=2.894, AGFI=.861, CFI=.925, TLI=.910, RMSEA=.074, RMR=.027). In addition,
Table 4.14 clearly shows that factor loadings are above .50 (S.R.W=.614 to .864), and
associated t-values are all significant (C.R=11.106 to 16.839, p<.001). Therefore, this full
social capital measurement model is accepted which indicates the collected data fits the
sample data well.

157 | P a g e
Figure 4. 16 Standard estimates of the full social capital measurement model
Source: Author
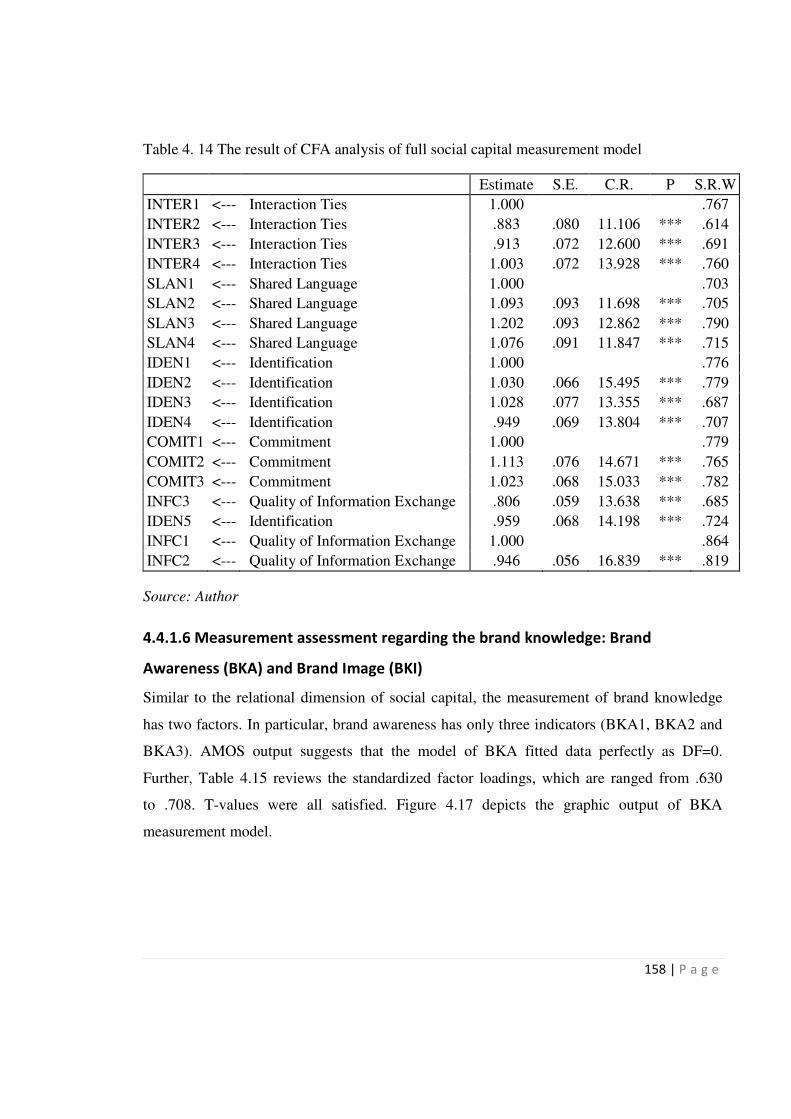
158 | P a g e
Table 4. 14 The result of CFA analysis of full social capital measurement model
Estimate S.E. C.R. P S.R.W
INTER1 <--- Interaction Ties 1.000
.767
INTER2 <--- Interaction Ties .883 .080 11.106 *** .614
INTER3 <--- Interaction Ties .913 .072 12.600 *** .691
INTER4 <--- Interaction Ties 1.003 .072 13.928 *** .760
SLAN1 <--- Shared Language 1.000
.703
SLAN2 <--- Shared Language 1.093 .093 11.698 *** .705
SLAN3 <--- Shared Language 1.202 .093 12.862 *** .790
SLAN4 <--- Shared Language 1.076 .091 11.847 *** .715
IDEN1 <--- Identification 1.000
.776
IDEN2 <--- Identification 1.030 .066 15.495 *** .779
IDEN3 <--- Identification 1.028 .077 13.355 *** .687
IDEN4 <--- Identification .949 .069 13.804 *** .707
COMIT1 <--- Commitment 1.000
.779
COMIT2 <--- Commitment 1.113 .076 14.671 *** .765
COMIT3 <--- Commitment 1.023 .068 15.033 *** .782
INFC3 <--- Quality of Information Exchange .806 .059 13.638 *** .685
IDEN5 <--- Identification .959 .068 14.198 *** .724
INFC1 <--- Quality of Information Exchange 1.000
.864
INFC2 <--- Quality of Information Exchange .946 .056 16.839 *** .819
Source: Author
4.4.1.6 Measurement assessment regarding the brand knowledge: Brand
Awareness (BKA) and Brand Image (BKI)
Similar to the relational dimension of social capital, the measurement of brand knowledge
has two factors. In particular, brand awareness has only three indicators (BKA1, BKA2 and
BKA3). AMOS output suggests that the model of BKA fitted data perfectly as DF=0.
Further, Table 4.15 reviews the standardized factor loadings, which are ranged from .630
to .708. T-values were all satisfied. Figure 4.17 depicts the graphic output of BKA
measurement model.

159 | P a g e
Table 4. 15 The result of CFA analysis of BKA measurement model
Estimate S.E. C.R. P S.R.W
BKA1 <--- BKA 1.000
.708
BKA2 <--- BKA .945 .120 7.885 *** .668
BKA3 <--- BKA .737 .093 7.884 *** .630
Note: (1) BKA1, BKA2, BKA3 are defined as in Table 4.4
(2) t-value=C.R value, Factor loading=S.R.W
Source: Author
Figure 4. 17 Standardized estimates of BKA (brand awareness) measurement model
Note: Where BKA1, BKA2, BKA3 are defined as in Table 4.4.
Source: Author
There are seven measured indicators which are initially assigned to the brand image
construct (BKI1, BKI2, BKI3, BKI4, BKI5, BKI6 and BKI7). Both chi-square value
(205.122) and associated p-value (0.000) are first assessed with the same procedures applied
to other measurement models. Also, the results indicate a badness-of-fit between the
proposed measurement model and data (X²/DF=14.652, GFI=.857, AGFI=.714, CFI=.818,
TLI=.727, RMSEA=.197, RMR=.060); only an RMR index is fit. Thus, a re-specification of
the model is called for.

160 | P a g e
Firstly, the model misspecification is examined via standardized residual value. As the
results of Table 4.16 show, item BKI 3 and BKI 6 are removed from the BKI measurement
model, as their value is above an absolute value of 2.00. After removing BKI3 and BKI6 at
different times, the fit indices of two competing models are presented in Table 4.17.
Table 4. 16 Standardized residual covariances matrix of the BKI measurement model
BKI6 BKI5 BKI4 BKI3 BKI2 BKI1
BKI7 .000
BKI6 4.085 .000
BKI5 .027 1.559 .000
BKI4 -.093 .030 .143 .000
BKI3 -2.878 -2.350 1.898 .203 .000
BKI2 -.217 -1.992 -1.420 -.393 1.809 .000
BKI1 .168 -.668 -1.887 .092 .417 1.637 .000
Note: BKI1, BKI2, BKI3, BKI4, BKI5, BKI6 and BKI7 are defined as in
Table 4.4
Source: Author
Table 4. 17 Overall fit indices of competing BKI measurement model after one Item removal
Statistics Model after BKI 3 removed Model after BKI 6 Removed
Value Fit Status Value Fit Status
X²/DF 10.658 Misfit 11.020 Misfit
p-value 0.000 Misfit 0.000 Misfit
GFI 0.912 Fit 0.928 Fit
AGFI 0.795 Misfit 0.820 Fit
CFI 0.888 Misfit 0.890 Misfit
TLI 0.813 Misfit 0.816 Misfit
RMSEA 0.166 Misfit 0.169 Misfit
RMR 0.049 Fit 0.041 Fit
Source: Author
Clearly, Table 4.17 shows that the competing model from which BKI6 is eliminated
performed slightly better than the other one, but neither of the two models fits the data well.
Therefore, the author decides to remove both items BKI 3 and BKI 6 from this measurement
model. However, Table 4.18 shows that the re-specified competing model performs better
but still cannot fit the data well. Most of the indices are achieved to the recommended level

161 | P a g e
of acceptance, except the value of X²/DF and RMSEA (X²/DF=4.854, GFI=.972,
AGFI=.915, CFI=.964, TLI=.929, RMSEA=.105 and RAR=.027).
Table 4. 18 Modification indices of the BKI measurement after removal of BKI3 and BKI6
M.I. Par Change
e4 <--> e5 7.351 .062
e1 <--> e5 8.752 -.070
e1 <--> e2 10.767 .081
Source: Author
Then, the modification index is reviewed. As seen in Table 4.18, the modification
covariances matrix suggests that if the covariance of an error term of measurement BKI1 (e1)
and an error term of measurement BKI2 (e2) is treated as a free parameter, the chi-square
discrepency would decrease by at least 10.767 compared to the present analysis. The result
suggests adding an extra path between e1 and e2 to the competing model from which BKI 3
and BKI 6 are both eliminated. After adding an extra parameter path, the re-specified BKI
measurement model fits data well with the statistical support (X²/DF=2.075, p-value=.081,
GFI=.991, AGFI=.967, TLI=.980, RMSEA=.055 and RMR=.016). Table 4.19 summarizes
the key results of CFA analysis of re-specified BKI model, and Figure 4.18 displays a
graphic output of BKI model.
Table 4. 19 The result of CFA analysis of BKI measurement model
Estimate S.E. C.R. S.R.W
BKI4 <--- BKI 1.165 .110 10.613 .778
BKI1 <--- BKI 1.000
.661
BKI2 <--- BKI 1.069 .094 11.321 .629
BKI7 <--- BKI 1.127 .115 9.815 .666
BKI5 <--- BKI .967 .102 9.484 .635
Note: (1) BKI1, BKI2, BKI4, BKI5, BKI7 are defined as in Table 4.4
(2) t-value=C.R value, Factor loading=S.R.W
Source: Author
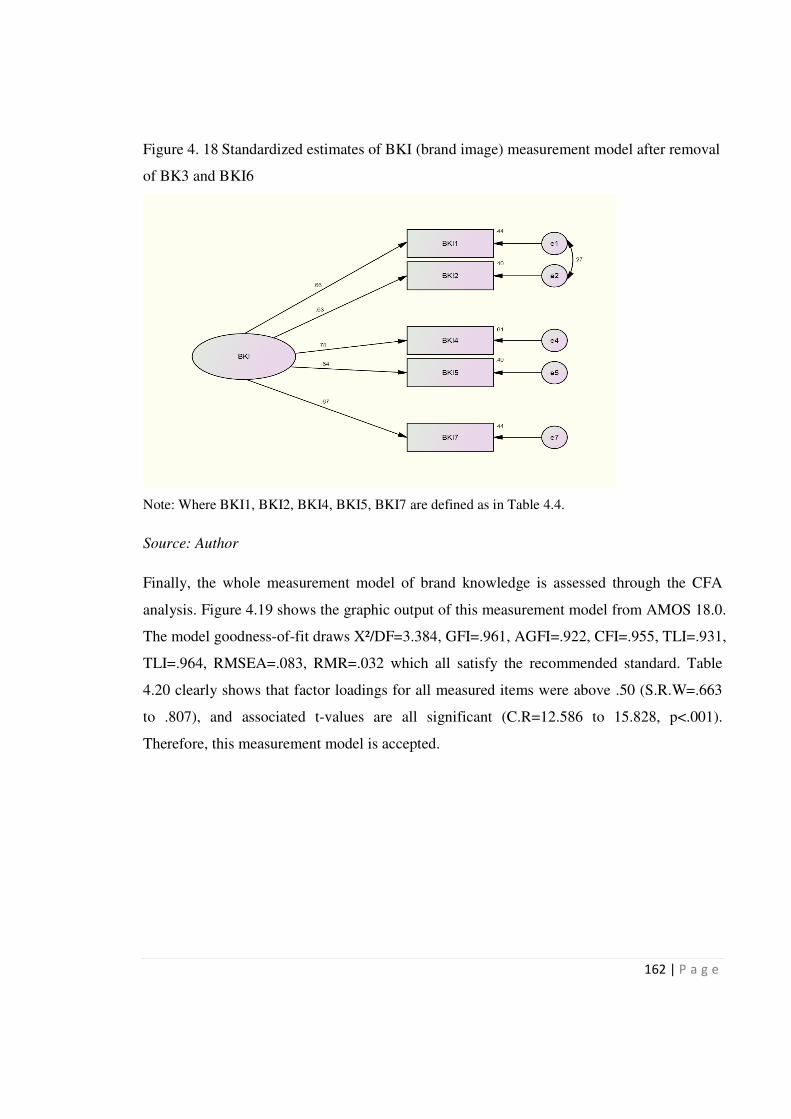
162 | P a g e
Figure 4. 18 Standardized estimates of BKI (brand image) measurement model after removal
of BK3 and BKI6
Note: Where BKI1, BKI2, BKI4, BKI5, BKI7 are defined as in Table 4.4.
Source: Author
Finally, the whole measurement model of brand knowledge is assessed through the CFA
analysis. Figure 4.19 shows the graphic output of this measurement model from AMOS 18.0.
The model goodness-of-fit draws X²/DF=3.384, GFI=.961, AGFI=.922, CFI=.955, TLI=.931,
TLI=.964, RMSEA=.083, RMR=.032 which all satisfy the recommended standard. Table
4.20 clearly shows that factor loadings for all measured items were above .50 (S.R.W=.663
to .807), and associated t-values are all significant (C.R=12.586 to 15.828, p<.001).
Therefore, this measurement model is accepted.

163 | P a g e
Table 4. 20 The result of CFA analysis of brand knowledge measurement model
Estimate S.E. C.R. P S.R.W
BKA1 <--- BKA 1.000
.770
BKA2 <--- BKA .739 .078 9.459 *** .568
BKA3 <--- BKA .696 .065 10.658 *** .646
BKI1 <--- BKI 1.000
.691
BKI2 <--- BKI 1.090 .089 12.298 *** .670
BKI4 <--- BKI 1.045 .091 11.480 *** .730
BKI5 <--- BKI .949 .091 10.468 *** .651
BKI7 <--- BKI 1.060 .101 10.516 *** .655
Note: (1) BKA1, BKA2, BKA3, BKI1, BKI2, BKI4, BKI5, BKI7 are defined as in Table 4.4
(2) t-value=C.R value, Factor loading=S.R.W
Source: Author
Figure 4. 19 Standardized estimates of brand knowledge measurement model
Where BKA1, BKA2, BKA3, BKI1, BKI2, BKI4, BKI5, BKI7 are defined in Table 4.4
Source: Author
164 | P a g e
4.4.2 Validity and reliability assessment of CFA analysis
Table 4.21 shows the main results of validity and reliability assessment for the measured
items retained in this study, including factor loadings, indicator stand error (S.E),
Cronbach’s Alpha, composite reliability and average variances extracted (AVE). In
particular, the value of factor loadings and indicator stand error are used to calculate
composite reliability and AVE.
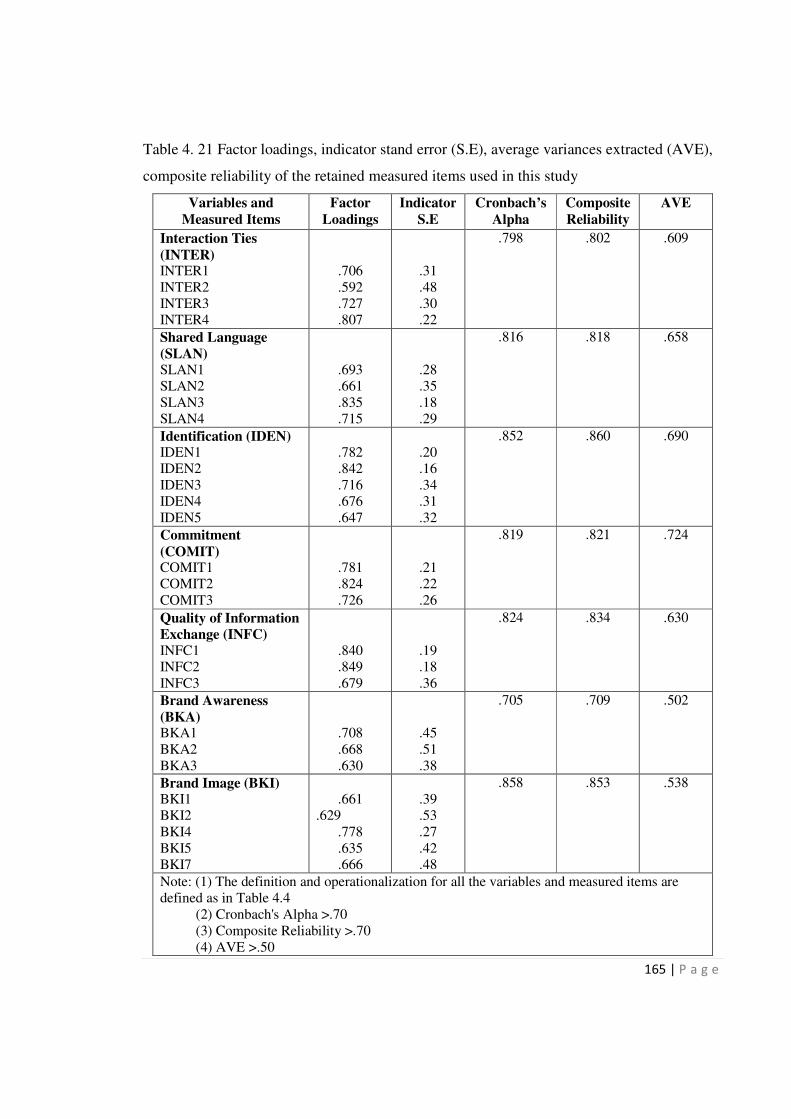
165 | P a g e
Table 4. 21 Factor loadings, indicator stand error (S.E), average variances extracted (AVE),
composite reliability of the retained measured items used in this study
Variables and
Measured Items
Factor
Loadings
Indicator
S.E
Cronbach’s
Alpha
Composite
Reliability
AVE
Interaction Ties
(INTER) INTER1
INTER2
INTER3
INTER4
.706
.592
.727
.807
.31
.48
.30
.22
.798 .802 .609
Shared Language
(SLAN) SLAN1
SLAN2
SLAN3
SLAN4
.693
.661
.835
.715
.28
.35
.18
.29
.816 .818 .658
Identification (IDEN) IDEN1
IDEN2
IDEN3
IDEN4
IDEN5
.782
.842
.716
.676
.647
.20
.16
.34
.31
.32
.852 .860 .690
Commitment
(COMIT) COMIT1
COMIT2
COMIT3
.781
.824
.726
.21
.22
.26
.819 .821 .724
Quality of Information
Exchange (INFC)
INFC1
INFC2
INFC3
.840
.849
.679
.19
.18
.36
.824 .834 .630
Brand Awareness
(BKA) BKA1
BKA2
BKA3
.708
.668
.630
.45
.51
.38
.705 .709 .502
Brand Image (BKI) BKI1
BKI2
BKI4
BKI5
BKI7
.661
.629
.778
.635
.666
.39
.53
.27
.42
.48
.858 .853 .538
Note: (1) The definition and operationalization for all the variables and measured items are
defined as in Table 4.4
(2) Cronbach's Alpha >.70
(3) Composite Reliability >.70
(4) AVE >.50
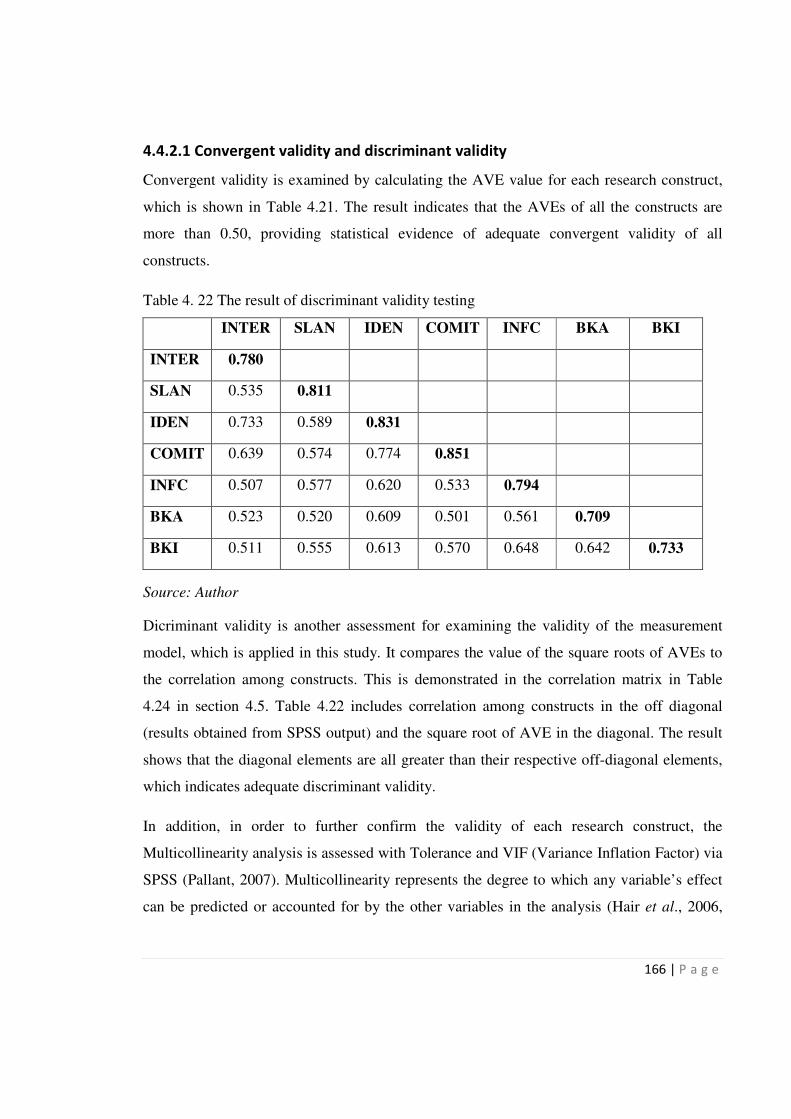
166 | P a g e
4.4.2.1 Convergent validity and discriminant validity
Convergent validity is examined by calculating the AVE value for each research construct,
which is shown in Table 4.21. The result indicates that the AVEs of all the constructs are
more than 0.50, providing statistical evidence of adequate convergent validity of all
constructs.
Table 4. 22 The result of discriminant validity testing
INTER SLAN IDEN COMIT INFC BKA BKI
INTER 0.780
SLAN 0.535 0.811
IDEN 0.733 0.589 0.831
COMIT 0.639 0.574 0.774 0.851
INFC 0.507 0.577 0.620 0.533 0.794
BKA 0.523 0.520 0.609 0.501 0.561 0.709
BKI 0.511 0.555 0.613 0.570 0.648 0.642 0.733
Source: Author
Dicriminant validity is another assessment for examining the validity of the measurement
model, which is applied in this study. It compares the value of the square roots of AVEs to
the correlation among constructs. This is demonstrated in the correlation matrix in Table
4.24 in section 4.5. Table 4.22 includes correlation among constructs in the off diagonal
(results obtained from SPSS output) and the square root of AVE in the diagonal. The result
shows that the diagonal elements are all greater than their respective off-diagonal elements,
which indicates adequate discriminant validity.
In addition, in order to further confirm the validity of each research construct, the
Multicollinearity analysis is assessed with Tolerance and VIF (Variance Inflation Factor) via
SPSS (Pallant, 2007). Multicollinearity represents the degree to which any variable’s effect
can be predicted or accounted for by the other variables in the analysis (Hair et al., 2006,
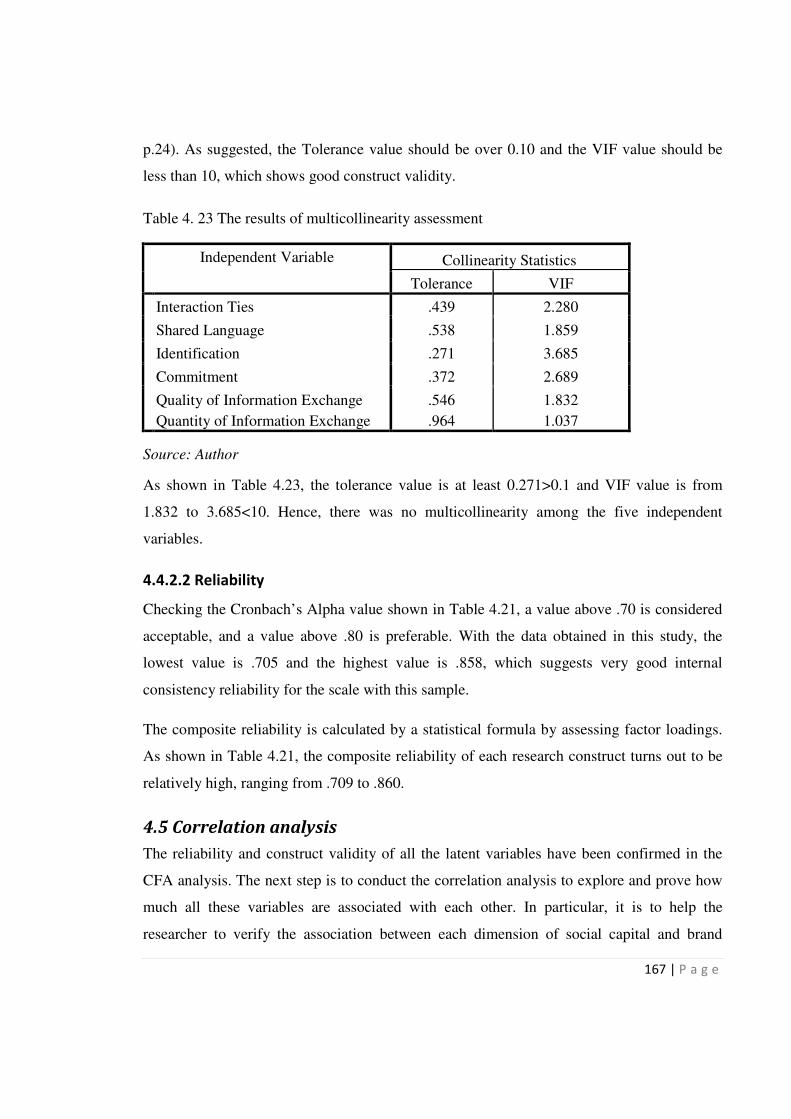
167 | P a g e
p.24). As suggested, the Tolerance value should be over 0.10 and the VIF value should be
less than 10, which shows good construct validity.
Table 4. 23 The results of multicollinearity assessment
Independent Variable Collinearity Statistics
Tolerance VIF
Interaction Ties .439 2.280
Shared Language .538 1.859
Identification .271 3.685
Commitment .372 2.689
Quality of Information Exchange
Quantity of Information Exchange
.546
.964
1.832
1.037
Source: Author
As shown in Table 4.23, the tolerance value is at least 0.271>0.1 and VIF value is from
1.832 to 3.685<10. Hence, there was no multicollinearity among the five independent
variables.
4.4.2.2 Reliability
Checking the Cronbach’s Alpha value shown in Table 4.21, a value above .70 is considered
acceptable, and a value above .80 is preferable. With the data obtained in this study, the
lowest value is .705 and the highest value is .858, which suggests very good internal
consistency reliability for the scale with this sample.
The composite reliability is calculated by a statistical formula by assessing factor loadings.
As shown in Table 4.21, the composite reliability of each research construct turns out to be
relatively high, ranging from .709 to .860.
4.5 Correlation analysis
The reliability and construct validity of all the latent variables have been confirmed in the
CFA analysis. The next step is to conduct the correlation analysis to explore and prove how
much all these variables are associated with each other. In particular, it is to help the
researcher to verify the association between each dimension of social capital and brand
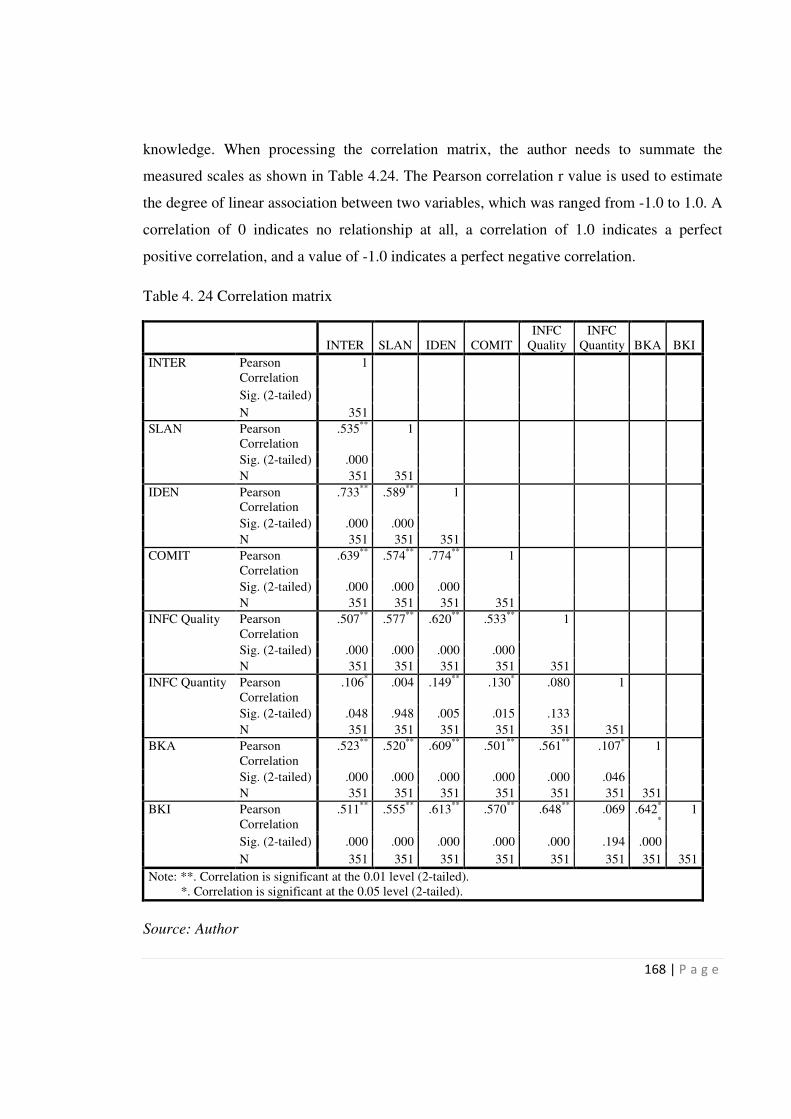
168 | P a g e
knowledge. When processing the correlation matrix, the author needs to summate the
measured scales as shown in Table 4.24. The Pearson correlation r value is used to estimate
the degree of linear association between two variables, which was ranged from -1.0 to 1.0. A
correlation of 0 indicates no relationship at all, a correlation of 1.0 indicates a perfect
positive correlation, and a value of -1.0 indicates a perfect negative correlation.
Table 4. 24 Correlation matrix
INTER SLAN IDEN COMIT
INFC
Quality
INFC
Quantity BKA BKI
INTER Pearson
Correlation
1
Sig. (2-tailed)
N 351
SLAN Pearson
Correlation
.535**
1
Sig. (2-tailed) .000
N 351 351
IDEN Pearson
Correlation
.733**
.589**
1
Sig. (2-tailed) .000 .000
N 351 351 351
COMIT Pearson
Correlation
.639**
.574**
.774**
1
Sig. (2-tailed) .000 .000 .000
N 351 351 351 351
INFC Quality Pearson
Correlation
.507**
.577**
.620**
.533**
1
Sig. (2-tailed) .000 .000 .000 .000
N 351 351 351 351 351
INFC Quantity Pearson
Correlation
.106* .004 .149
** .130
* .080 1
Sig. (2-tailed) .048 .948 .005 .015 .133
N 351 351 351 351 351 351
BKA Pearson
Correlation
.523**
.520**
.609**
.501**
.561**
.107* 1
Sig. (2-tailed) .000 .000 .000 .000 .000 .046
N 351 351 351 351 351 351 351
BKI Pearson
Correlation
.511**
.555**
.613**
.570**
.648**
.069 .642*
*
1
Sig. (2-tailed) .000 .000 .000 .000 .000 .194 .000
N 351 351 351 351 351 351 351 351
Note: **. Correlation is significant at the 0.01 level (2-tailed).
*. Correlation is significant at the 0.05 level (2-tailed).
Source: Author
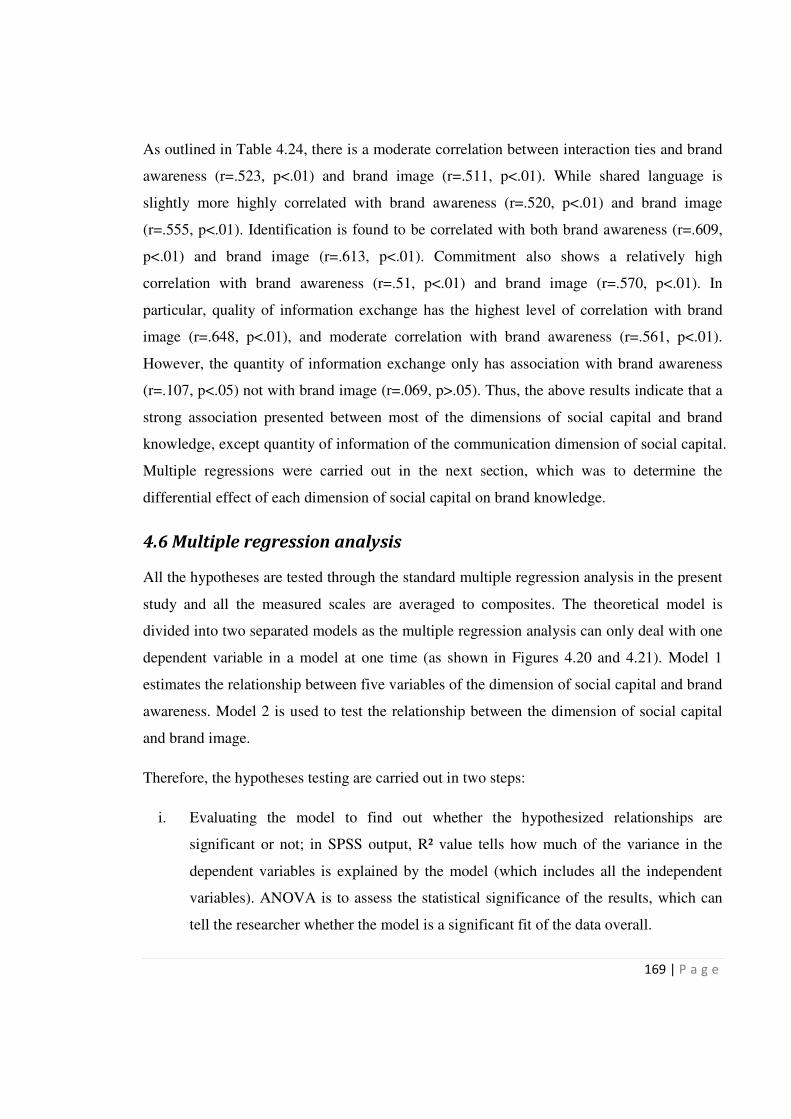
169 | P a g e
As outlined in Table 4.24, there is a moderate correlation between interaction ties and brand
awareness (r=.523, p<.01) and brand image (r=.511, p<.01). While shared language is
slightly more highly correlated with brand awareness (r=.520, p<.01) and brand image
(r=.555, p<.01). Identification is found to be correlated with both brand awareness (r=.609,
p<.01) and brand image (r=.613, p<.01). Commitment also shows a relatively high
correlation with brand awareness (r=.51, p<.01) and brand image (r=.570, p<.01). In
particular, quality of information exchange has the highest level of correlation with brand
image (r=.648, p<.01), and moderate correlation with brand awareness (r=.561, p<.01).
However, the quantity of information exchange only has association with brand awareness
(r=.107, p<.05) not with brand image (r=.069, p>.05). Thus, the above results indicate that a
strong association presented between most of the dimensions of social capital and brand
knowledge, except quantity of information of the communication dimension of social capital.
Multiple regressions were carried out in the next section, which was to determine the
differential effect of each dimension of social capital on brand knowledge.
4.6 Multiple regression analysis
All the hypotheses are tested through the standard multiple regression analysis in the present
study and all the measured scales are averaged to composites. The theoretical model is
divided into two separated models as the multiple regression analysis can only deal with one
dependent variable in a model at one time (as shown in Figures 4.20 and 4.21). Model 1
estimates the relationship between five variables of the dimension of social capital and brand
awareness. Model 2 is used to test the relationship between the dimension of social capital
and brand image.
Therefore, the hypotheses testing are carried out in two steps:
i. Evaluating the model to find out whether the hypothesized relationships are
significant or not; in SPSS output, R² value tells how much of the variance in the
dependent variables is explained by the model (which includes all the independent
variables). ANOVA is to assess the statistical significance of the results, which can
tell the researcher whether the model is a significant fit of the data overall.
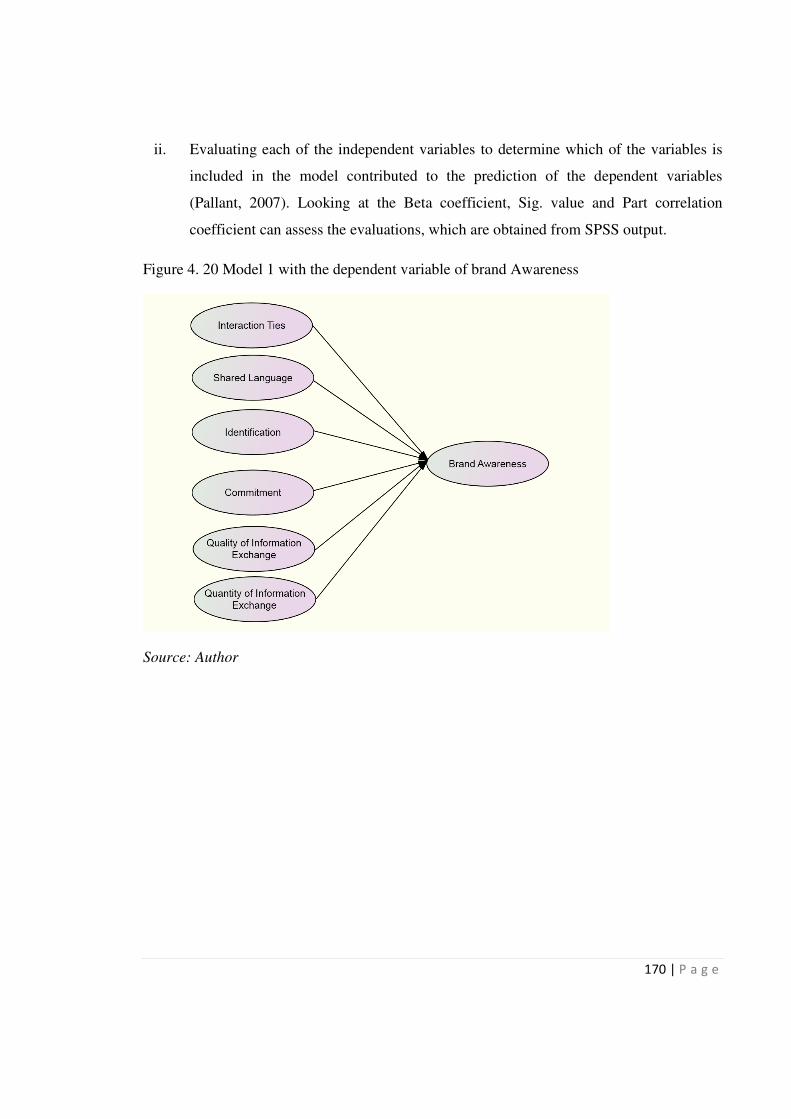
170 | P a g e
ii. Evaluating each of the independent variables to determine which of the variables is
included in the model contributed to the prediction of the dependent variables
(Pallant, 2007). Looking at the Beta coefficient, Sig. value and Part correlation
coefficient can assess the evaluations, which are obtained from SPSS output.
Figure 4. 20 Model 1 with the dependent variable of brand Awareness
Source: Author

171 | P a g e
Figure 4. 21 Model 2 with the dependent variable of brand image
Source: Author
In this study, the R² value for Model 1 is 0.448. Expressed as a percentage, this means that
all the five independent variables (Interaction ties, Shared language, Identification,
Commitment and Information exchange) explain 44.8 per cent of the variance in the
dependent variable of brand awareness. Likewise, the R² value for Model 2 represents that
all the dependent variables explain 51.9 per cent of the variance in the dependent variable of
brand image.
Table 4. 25 The ANOVA output for Model 1
Model 1 Sum of Squares df Mean Square F Sig. R²
Regression 81.071 6 13.512 46.614 .000a 0.448
Residual 99.716 344 .290
Total 180.787 350
Note: (1). Predictors: (Constant) Interaction Ties, Shared Language, Identification,
Commitment, Quality of Information Exchange, Quantity of Information Exchange
(2). Dependent Variable: Brand Awareness
Source: Author
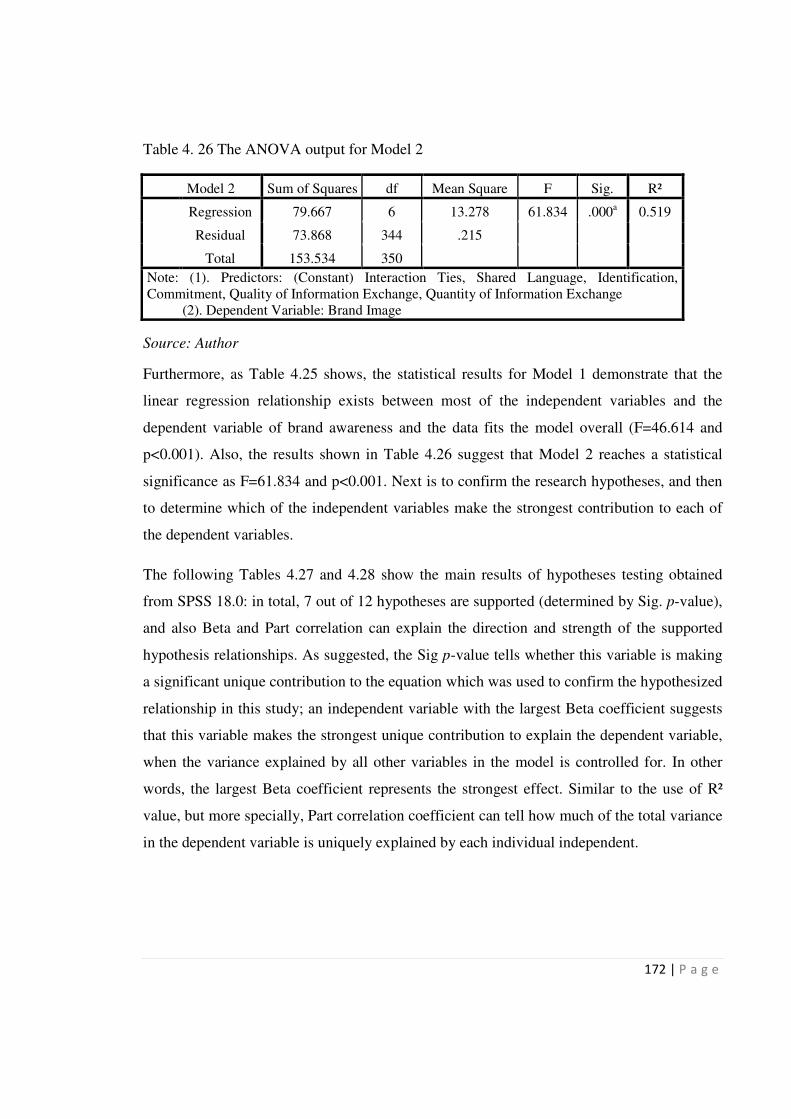
172 | P a g e
Table 4. 26 The ANOVA output for Model 2
Model 2 Sum of Squares df Mean Square F Sig. R²
Regression 79.667 6 13.278 61.834 .000a 0.519
Residual 73.868 344 .215
Total 153.534 350
Note: (1). Predictors: (Constant) Interaction Ties, Shared Language, Identification,
Commitment, Quality of Information Exchange, Quantity of Information Exchange
(2). Dependent Variable: Brand Image
Source: Author
Furthermore, as Table 4.25 shows, the statistical results for Model 1 demonstrate that the
linear regression relationship exists between most of the independent variables and the
dependent variable of brand awareness and the data fits the model overall (F=46.614 and
p<0.001). Also, the results shown in Table 4.26 suggest that Model 2 reaches a statistical
significance as F=61.834 and p<0.001. Next is to confirm the research hypotheses, and then
to determine which of the independent variables make the strongest contribution to each of
the dependent variables.
The following Tables 4.27 and 4.28 show the main results of hypotheses testing obtained
from SPSS 18.0: in total, 7 out of 12 hypotheses are supported (determined by Sig. p-value),
and also Beta and Part correlation can explain the direction and strength of the supported
hypothesis relationships. As suggested, the Sig p-value tells whether this variable is making
a significant unique contribution to the equation which was used to confirm the hypothesized
relationship in this study; an independent variable with the largest Beta coefficient suggests
that this variable makes the strongest unique contribution to explain the dependent variable,
when the variance explained by all other variables in the model is controlled for. In other
words, the largest Beta coefficient represents the strongest effect. Similar to the use of R²
value, but more specially, Part correlation coefficient can tell how much of the total variance
in the dependent variable is uniquely explained by each individual independent.

173 | P a g e
Table 4. 27 The path coefficients, beta, part-correlation and t-statistics of Model 1
Path between Latent Variables p Beta Part
Correlation
t-value
(H1a) Interaction Ties Brand Awareness .077 .107 .095 1.775
(H2a) Shared Language Brand Awareness .003 .163 .156 2.978
(H3a) Identification Brand Awareness .000 .304 .208 3.953
(H4a) Commitment Brand Awareness .701 -.025 -.021 -.384
(H5a) Quality of Information Brand Awareness
Exchange .000 .235 .227 4.331
(H6a) Quantity of Information Brand Awareness
Exchange .407 .034 .045 .831
Note: (1) Significant value at .05 level
(2) Significant value at .01 level
(3) Dependent Variable is Brand Awareness
Source: Author
As shown in Table 4.26, the relationship between interaction ties and brand awareness is not
significant, as the p-value is .077. Therefore, the null hypothesis is accepted and the results
do not support the alternative hypothesis. This indicates interaction ties have no significant
effect on brand awareness.
The hypothesis H2a proposes that shared language has an effect on brand awareness. The
results indicate that this effect is positive and significant, as Beta=.163, p=.003<.05.
Therefore, the null hypothesis is rejected and alternative hypothesises H2a is supported.
Then, the statistical result from SPSS output shows identification and quality of information
exchange all have a positive effect on brand awareness, as the p-values of their relationships
are both significant at .01 level. In particular, the largest Beta value in model 1 is .304 that is
for identification. This means that identification has the strongest unique positive effect on
brand awareness. The Beta value for the quality of information exchange is slightly lower
(.235), indicating that it made less of a contribution than identification. Thus, hypotheses
H3a and H5a are supported. However, concerning H4a, the effect of commitment on brand
awareness is not significant (Beta=-.025, p=.701>.05). Also the quantity of information
exchange does not have significant effect on brand awareness as the statistics show
Beta=.034, p=.407>.05.

174 | P a g e
In addition, the Part correlation value needs to be squared to explain the variance in
dependent variables. As Table 4.26 demonstrates, quality of information exchange has a
squared Part correlation coefficient of .227²=.05, indicating that information exchange
uniquely explains 5 per cent of the variance in brand awareness. Likewise, identification has
4 per cent of the variance in brand awareness (.208²=.04). Shared language only has 2 per
cent of the variance (.156²=.02).
Table 4. 28 The path coefficients, beta, part-correlation and t-statistics of Model 2
Path between Latent Variables p Beta Part
Correlation
t-value
(H1b) Interaction Ties Brand Image .489 .039 .026 .693
(H2b) Shared Language Brand Image .005 .146 .107 2.858
(H3b) Identification Brand Image .025 .161 .084 2.250
(H4b) Commitment Brand Image .024 .139 .085 2.274
(H5b) Quality of Information Brand Image
Exchange .000 .370 .274 7.316
(H6b) Quantity of Information Brand Image
Exchange .850 -.007 -.007 -.190
Note: (1) Significant value at .05 level
(2) Significant value at .01 level
(3) Dependent Variable is Brand Image
Source: Author
Hypothesis H1b predicts a positive relationship between interaction ties and brand image.
However, the Beta coefficient for this relationship is not significant at .05 level, as the p-
value is .489. Hence, the result indicates that the null hypothesis is accepted and the
alternative hypothesis H1b is rejected.
The null hypothesis is rejected and the positive effect of shared language on brand image
(alternative hypothesis H2b) is supported. This was because the value of Beta coefficient for
this relationship is positive and at a significant level (Beta=.146, p-value=.005<.05). But
Shared Language only shows 1 per cent (.107²=.01) in the variance of brand image as the
Part correlation is quite small. Thus, the higher the level of shared language used by the
OBC members, the stronger the brand image are enhanced.
175 | P a g e
As seen in Table 4.28, in hypothesis H3b, it is predicted that identification has a positive
influence on brand image. And the results suggest that this relationship is significant, as Beta
coefficient is .161 and p-value is .025<.05. Hence, the null hypothesis is refused and
alternative hypothesis H3b is accepted. Further, alternative hypothesis H4b is supported as
the null hypothesis is rejected as the p-value=.024, and the effect from commitment on brand
image is positive, as Beta=.139. That is, the higher level of commitment among OBC
members has an adverse effect on brand image. However, neither identification nor
commitment can explain much variance in brand image, because their Part correlation value
is too small to calculate.
The relationship between the quality of information exchange and brand image is significant,
which is evidenced by the p-value=.000<.001. Therefore, the null hypothesis is refused and
the alternative hypothesis H5b is supported. Then, the Beta value shown in Table 4.27
suggests that the quality of information exchange has the strongest effect on brand image
when compared with the other four independent variables (Beta=.370). In addition, it has 8
per cent of the variance in brand image (.274²=.08), which is also much higher than any
other independent variables in Model 2. However, H6b is not supported as p=.850>.05.
4.7 Summary of Results
The major results of this research can be summarized as follows:
i. Assessment of the research constructs: with reference to the finding regarding the
CFA analysis of the seven constructs in section 4.4 (i.e. interaction ties, shared
language, identification, commitment, quality of information exchange, brand
awareness, and brand image), these measured constructs had reached a relatively
high reliability and validity which were established by sufficient values of
Cronbach’s Alpha, composite reliability and AVE in section 4.4.2. This finding also
indicates that the data fits well with the targeted sample via the measurement model
assessment in section 4.4.1.
ii. The association between social capital and brand knowledge: the correlation co-
efficiency suggests that most of the dimensions of social capital are strongly
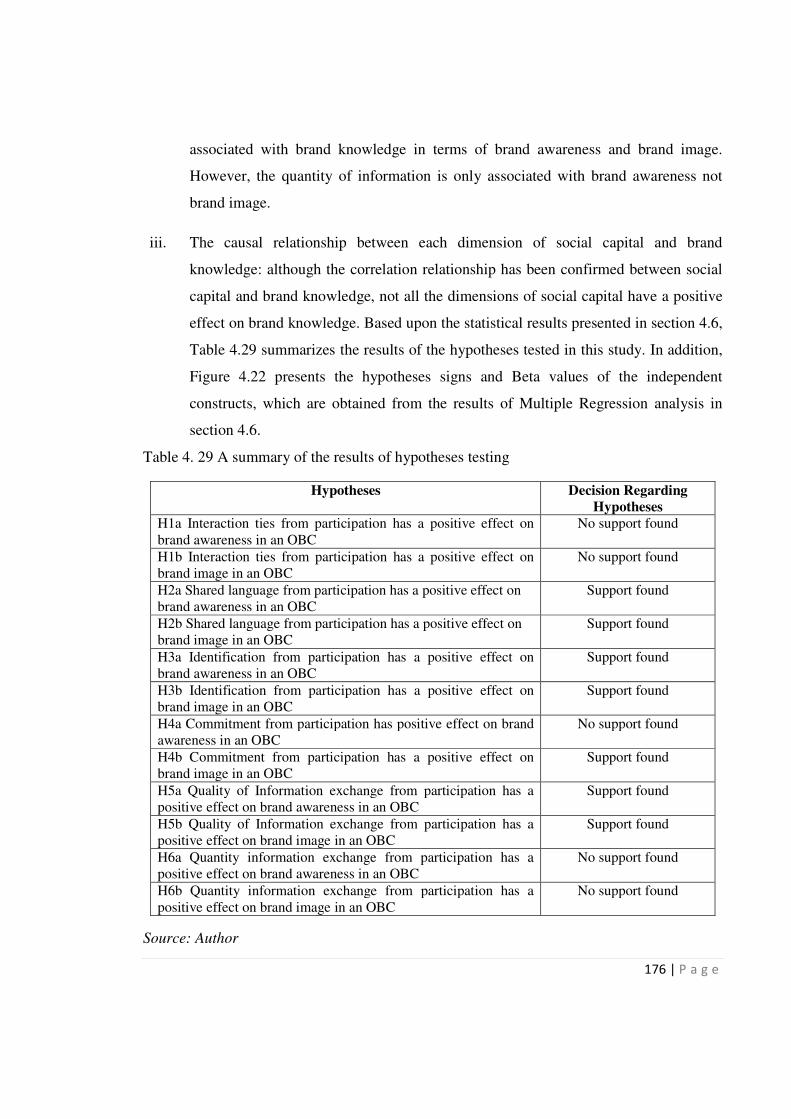
176 | P a g e
associated with brand knowledge in terms of brand awareness and brand image.
However, the quantity of information is only associated with brand awareness not
brand image.
iii. The causal relationship between each dimension of social capital and brand
knowledge: although the correlation relationship has been confirmed between social
capital and brand knowledge, not all the dimensions of social capital have a positive
effect on brand knowledge. Based upon the statistical results presented in section 4.6,
Table 4.29 summarizes the results of the hypotheses tested in this study. In addition,
Figure 4.22 presents the hypotheses signs and Beta values of the independent
constructs, which are obtained from the results of Multiple Regression analysis in
section 4.6.
Table 4. 29 A summary of the results of hypotheses testing
Hypotheses Decision Regarding
Hypotheses
H1a Interaction ties from participation has a positive effect on
brand awareness in an OBC
No support found
H1b Interaction ties from participation has a positive effect on
brand image in an OBC
No support found
H2a Shared language from participation has a positive effect on
brand awareness in an OBC
Support found
H2b Shared language from participation has a positive effect on
brand image in an OBC
Support found
H3a Identification from participation has a positive effect on
brand awareness in an OBC
Support found
H3b Identification from participation has a positive effect on
brand image in an OBC
Support found
H4a Commitment from participation has positive effect on brand
awareness in an OBC
No support found
H4b Commitment from participation has a positive effect on
brand image in an OBC
Support found
H5a Quality of Information exchange from participation has a
positive effect on brand awareness in an OBC
Support found
H5b Quality of Information exchange from participation has a
positive effect on brand image in an OBC
Support found
H6a Quantity information exchange from participation has a
positive effect on brand awareness in an OBC
No support found
H6b Quantity information exchange from participation has a
positive effect on brand image in an OBC
No support found
Source: Author
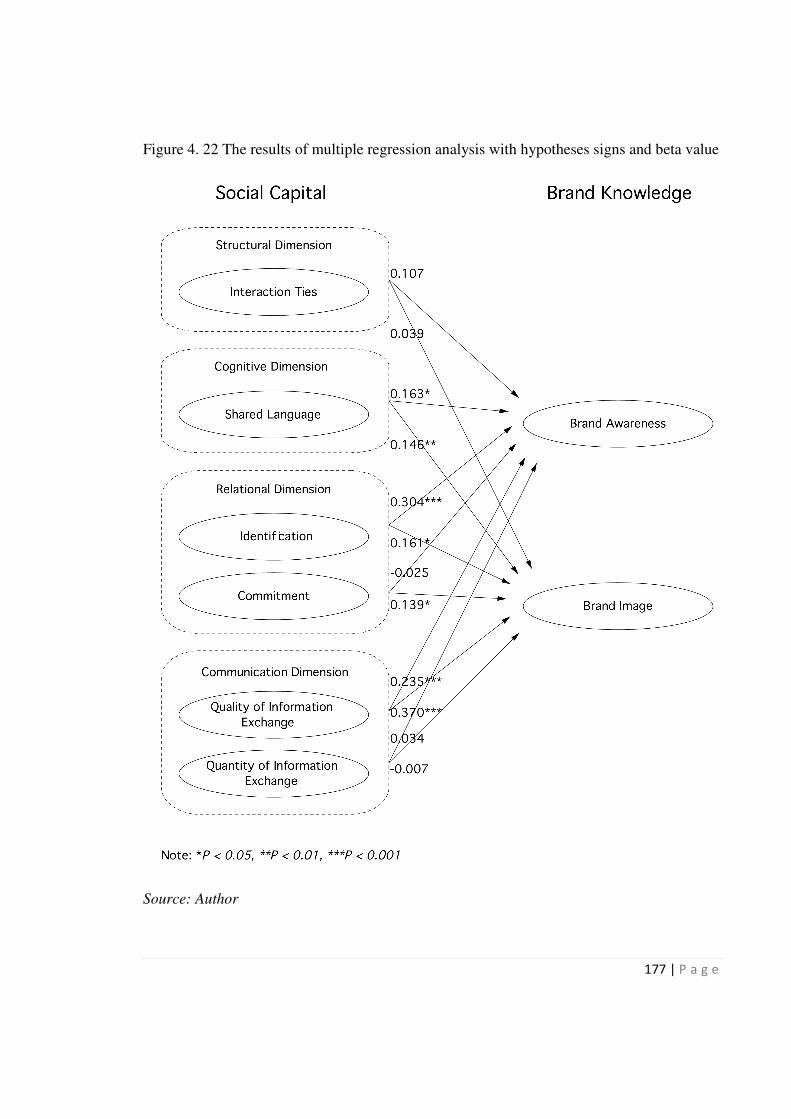
177 | P a g e
Figure 4. 22 The results of multiple regression analysis with hypotheses signs and beta value
Source: Author

178 | P a g e
As shown in Table 4.28 and Figure 4.22, seven out of 12 hypotheses are supported and
exhibited a p-value less than .05, while the remaining five hypothesized relationships are not
significant at the .05 level of significance. Although interaction ties exhibited a strong
association with brand knowledge, it does not have any significant effect on either brand
awareness or brand image, consequently hypotheses 1a and 1b are not supported. Shared
language significantly and positively affects brand knowledge, supporting hypotheses 2a and
2b. The path from identification to brand awareness and brand image is significant and
positive, thus hypotheses 3a and 3b are supported. The results show a positive and
significant path between commitment and brand image, while a negative and insignificant
path is found between commitment and brand awareness. Hypothesis 4b is supported, while
hypothesis 4a is not supported. Quality of information exchange exhibited significant
positive effects on both brand awareness and brand image, supporting hypotheses 5a and 5b
Contrary to quality of information exchange, the results show insignificant paths between
quantity of information exchange and brand knowledge, consequently, hypotheses 6a and 6b
are not supported.
4.8 Summary
In this chapter, the OBC members’ characteristics were generated from the descriptive
statistics of the actual respondents’ profile data. There were over 80 per cent male
respondents who were well educated and aged from 25 to 34. This was mainly because of
the specific product category of cars. In addition, this research was conducted in China
where the majority of Internet users are relatively young and male. Regarding the level of
OBC members’ involvements in the community, over 50 per cent of the actual participants
had more than one year membership history and visited the website frequently, but very few
of them posted in the discussion forums.
Further, the descriptive statistics of measurement items for each dimension of social capital
and brand knowledge were reported. Based on the results of measurement assessment and
confirmatory factor analysis, some poor performing measured items were eliminated from
the original research constructs to ensure the reliability and validity of each construct. At the
179 | P a g e
same time, the results of CFA analysis revealed that the full social capital measurement
model fits the sample data very well.
The correlation matrix in section 4.5 indicated that most of the dimensions of social capital
are highly correlated with brand knowledge except for the quantity of information exchange
of the communication dimension.
Finally, the hypothesized relationships between social capital and brand knowledge were
tested via Multiple Regressions analysis. Seven out of 12 hypotheses were supported with
the empirical results, revealing that not every dimension of social capital has a significant
positive effect on brand knowledge in the OBCs. The findings of these hypotheses are
discussed in detail in the next chapter.
180 | P a g e
Chapter 5 Discussion, Contribution and Implication
5.0 Introduction
This chapter synthesises and discusses the major findings generated from this present study.
This is significant in drawing out the theoretical contribution as well as the practical
implications. This chapter is divided into four main sections:
� Section 1: This section discusses the major findings, including the evidence of the
presence of social capital and brand knowledge in an OBC context; the evidence of
relationship between social capital and brand knowledge; and the differential effects
of each dimension of social capital on brand knowledge.
� Section 2: The second section presents discussions of theoretical contributions in the
relevance of OBC research, brand knowledge concept and social capital theory.
� Section 3: This section provides some implications for marketing practitioners and
community leaders.
� Section 4: The final section comprises a summary of this chapter.
5.1 The assessment of full social capital measurement model in the
context of an OBC
The first objective of this study is to investigate the presence of social capital in the context
of an OBC. With reference to the findings regarding the full measurement model assessment
of social capital in section 4.4.1.5, the presence of social capital has been confirmed. The
findings of this study are consistent with the theoretical proposition originally put forward by
the social science and humanities studies that social capital resides in social relationships in
both physical and virtual communities (Putnam, 2000; Alder and Kwon, 2002; Daniel et al.,
2003; Rafaeli, et al., 2004). This result is similar to that found by Tsai (2006), who
investigates social capital in an online retailing store, where social capital resides in the
website-customer relationships and customer-customer relationships. Three types of
relationship are noted in the formation of an OBC: consumer to brand relationship,
consumer-to-consumer relationship and the consumer to community relationship (Muniz and
181 | P a g e
O’Guinn, 2001). Especially for the consumer-to-consumer relationships, social capital can
be mobilized through these social interactions among consumers, since the OBC is originally
a network of social relations linking a group of people who have shared interests and values
in the same particular brand or product.
Most importantly, this study supports the presence of social capital with four dimensions.
Apart from the three traditional dimensions (the structural, cognitive and relational
dimensions introduced by Nahapiet and Ghoshal (1998), this study also incorporates a
communication dimension as the fourth dimension of social capital especially from a
marketing standpoint. The three traditional dimensions have been widely accepted as
effective measures for the concept of social capital in prior empirical research. Regarding the
communication dimension, it has been discussed theoretically but has not been measured
empirically in prior research. Thus, this study address the issues. In addition, the literature
suggested that each dimension of social capital works differently in intensity according to a
variety of contexts. The author raises concerns that these dimensions should be manifested
differently in an OBC when considered in other research contexts. In an OBC, the structural
dimension is manifested as interaction ties; the cognitive dimension is reflected as the shared
language; the relational dimension is manifested by two elements: identification and
commitment; finally, quality and quantity of information exchange represents the
communication dimension of social capital.
The use of CFA analysis in the present study is firstly to examine and assess the reliability
and validity of each research construct. Secondly, in order to prove the presence of social
capital with four dimensions, within an OBC, the single measurement of each dimension and
the full measurement model of social capital are assessed. The results show that all seven
research constructs have a relatively high reliability and validity which are established by
sufficient value of Crobach’s Alpha, composite reliability and AVE (see the result presented
in Table 4.21 in section 4.4.2). Meanwhile, the model fit indexes suggest all the
measurement models fit the sample data very well, which empirically supports the presence
of social capital with four dimensions in an OBC, which resides within consumer-consumer
relationships (adding a figure depicts social capital with four dimensions).
182 | P a g e
5.2 The assessment of full brand knowledge measurement model in the
context of an OBC
In this study, brand knowledge represents the information about the Volkswagen brand
stored in a consumer’s memory within the car product category. There is a continuous debate
about the measurement of brand knowledge in prior research. Two major approaches are
presented in the literature review, which are mainly developed from Keller’s and Aaker’s
studies of consumer-based brand equity having been widely accepted in many recent
empirical studies (Chang and Chieng, 2006; Oakenfull, 2008; Alimen, 2010; Hsu and Cai,
2009). Keller proposed a direct way to measure the two major components of the brand
knowledge concept: brand awareness and brand image. In contrast, Aaker’s approach works
indirectly by measuring a set of associations attached to the brand. However, a problem is
found from prior research: there is no consensus on the constructs of brand associations, for
example, some studies concentrate on more functional product associations while others may
focus on the organisational associations. This would result in the empirical findings not
being comparable. The author follows Keller’s approach, as brand awareness and image are
the two main dimensions, which have been discussed and cited frequently in both conceptual
and empirical studies.
Similar to the assessment of the full social capital measurement model, the purpose of the
full measurement model for brand knowledge is firstly to check the level of reliability and
validity of brand knowledge construct, and secondly to confirm the presence of brand
knowledge within an OBC. The results reveal that the concept of brand knowledge is well
assessed by measuring brand awareness and brand image (see results presented in Table 4.21
in section 4.4.2). As this study is the first to introduce the brand knowledge construct into an
OBC, the model fit index is used to empirically approve the existence of brand knowledge in
an OBC. In other words, the formation of an OBC is based on the sharing of brand
knowledge among its members. As discussed in the review of literature, brand knowledge
plays a dual role, which is seen as the major reason driving consumers to join OBCs as well
as one of the consequences after a consumers’ participation in OBC discussions. Thus the
findings of measurement assessment empirically support the significant role of brand

183 | P a g e
knowledge in OBCs; adding a figure depicts brand knowledge with two dimension - brand
awareness and brand image.
5.3 Evidence of the relationship between each dimension of social
capital and brand knowledge
With respect to the confirmation of the presence of social capital (with four dimensions) and
brand knowledge within the context of an OBC, independent and differential relationships
between these dimensions of social capital (i.e. structural, cognitive and relational dimension)
and brand knowledge (i.e. brand awareness and brand image) are discussed below.
Referring to the results reported in section 4.5, there is a strong association between most of
the dimensions of social capital and brand knowledge, but the quantity of information
exchange of the communication dimension is only associated with brand awareness (r=.107,
p<.05) not brand image (r= .069, p>.05). However, the quality of information exchange has
the highest level of association with brand image (r=.648, p<.01) and moderate correlation
with brand awareness (r=.561, p<.01). A possible explanation for this result may be that the
quantity of the information exchange is not an important attribute for the communication
dimensions of social capital. Another possible explanation is that consumers participating in
an OBC are able to obtain accurate, reliable, relevant information or knowledge about the
brand, but in contrast, the quantity of information exchange is less important for consumers.
From the methodology perspective, quantity of information exchange is the respondents’
self-reported data due to the author’s limited accessibility. Within those discussion forums of
OBCs, 16 per cent of respondents did not post any messages in the past one month during
the survey period, indicating that those members are lurkers with relatively lower
involvement in their community.
The above finding, that social capital is related to brand knowledge, is consistent with the
author’s theoretical assumption derived from the literature and empirically proves the
positive relationship between these two concepts.
184 | P a g e
5.3 How social capital impacts on brand knowledge
As discussed in sections 5.1 and 5.4, the presence of social capital and brand knowledge
within a consumer-initiated OBC are empirically supported; and the correlated relationship
between most dimensions of social capital and brand knowledge is also proved. However,
each dimension works intensively and differentially within an OBC in comparison with
other online contexts. Thus the purpose of this section is to discuss the findings that show
insight into how social capital in an OBC impacts on brand knowledge. As this present study
is not intended to look at the inter-related relationship among each dimension of social
capital, only the direct effects are found between social capital and brand knowledge.
5.3.1 The effect of the structural dimension of social capital on brand
knowledge
Interaction ties are seen as the fundamental propositions of the structural dimension of social
capital in this study. They represent the strength of the relationship, the amount of time spent
together and the frequency of communication among community members, which provide
access to information and knowledge. Contrary to expectation, the interaction ties have no
effect on brand awareness or brand image. This finding may suggest that the major reason
for consumers to participate in an OBC is to obtain product information and brand
knowledge while not looking to build personal relationships with fellow members.
Interaction ties are found in online social networks (i.e. Facebook, Twitter). An online social
network site (SNS) is a platform that brings people together, which is more for people-
centricity than for brand orientation. In other words, people participating in an SNS want to
build personal relationships with others. In contrast, the OBC context differs from prior
research. An OBC is identified as a group of consumers or would be consumers who interact
online in order to share their interests in a particular brand, indicating that consumers and
brands are the key components within an OBC.
In addition, interaction ties are frequently discussed in virtual learning communities, which
are found to have positive impacts on the quality and quantity of knowledge sharing. The
context of virtual learning communities is similar to OBCs in that their members have a
shared objective. OBC members have shared interests in a specific brand or product.
185 | P a g e
However, the use of social capital in virtual learning communities is to understand why
people are willing to share personal knowledge and participate in community discussion.
The knowledge in virtual learning communities is about facts, which can be measured
through quality and quantity. On the other hand, the use of social capital in an OBC is to
predict it as a factor having influence on brand knowledge. Brand knowledge in an OBC
represents the thoughts, feelings, perceptions, images and so on that become linked to the
brand in the consumers’ minds. The nature of consumer brand knowledge is so intangible
and abstract that it cannot be directly measured through quality and quantity. Although
interaction ties have been investigated as a key factor influencing knowledge sharing and
creation, they do not have a direct effect on brand knowledge in an OBC.
In essence, interaction ties of the structural dimension of social capital exist in an OBC but
do not make any contribution to building effective brand knowledge. The significant finding
was that the efficacy of interaction ties of the structural relational dimension differed from
other types of virtual communities, and especially differed from the social network sites and
virtual learning communities. It is interesting that interaction ties, when inconsistent in other
research, are not significant in this study.
Although the interaction ties do not have a direct effect on brand knowledge, it still plays a
significant role in an OBC. To recall the literature discussion, social capital research has
generally taken two theoretical propositions. Putnam’s proposition stresses interaction ties
but also compiles that data with a person’s engagement, which diminishes the role of the
network in getting people engaged in their communities. In contrast, the proposition from
Bourdieu and Coleman argue that the networks built between people are social capital, and
that those networks are like conduits, through which the act of engagement happens (Littau,
2009). However, the above discussion only concerned the role of social capital in local
communities; the offline interactions ties cannot work in the same way online. The results of
CFA analysis and correlation matrix confirmed the existence of interaction ties in an OBC.
Accordingly, that an OBC member possesses his/her social capital online could be seen as a
conduit he/she has. The networks and relationship created online via social capital allow the
OBC members to extend that conduit to other fellow members virtually.

186 | P a g e
5.3.2 The effect of the cognitive dimension of social capital on brand
knowledge
The cognitive dimension of social capital is manifested as shared language in this study.
Consistent with the author's supposition, a positive effect between shared language and
brand knowledge was indicated by the empirical results in section 4.6. The finding reveals
that the cognitive dimension of social capital in an OBC has a significant influence on both
brand awareness and brand image. Shared language in an OBC is to provide a common
conceptual apparatus for community members to communicate with and understand each
other.
As the literature suggested, social capital theory is frequently used to explain people’s
knowledge sharing behaviour. Shared language and shared vision are the major
manifestation for the cognitive dimension which has a positive effect on resource exchanges
within an organisational setting. However, the cognitive dimension does not work effectively
in every context. For example, shared language did not enhance the quality of knowledge
sharing in virtual communities; while shared vision was not found as having impacts on
either a company’s creativity or relationship value in marketing contexts. In this present
study, the author does not consider the shared vision as the major manifestation since the
OBC members already have the shared vision or objective, which is their mutual interest in a
particular brand or product.
In contrast with prior empirical research, the efficacy of shared language of the cognitive
dimension of social capital differs in an OBC. The importance of shared language has been
confirmed in an OBC, especially in the discussion forum, which reflected in two ways:
i. A common vocabulary and technical terms used by OBC members within their
discussions provide a common language for evaluating the shared information and
knowledge about the brand. In addition, this study focused on a car brand, including
many technical terms about the particular product category. These are the premier
foundation for OBC members to carry on their discussion, which would strengthen
the relationships among members to gain their access to brand knowledge.

187 | P a g e
ii. Consumers’ experience of the brand is another aspect of shared language that
indicates the shared content among members’ discussions. As the branding literature
proposed, the shared content, information or experience within an OBC is about a
focal brand, which is defined as brand knowledge.
Based upon the discussion, the first effect of shared language is to provide a common
language for all the OBC members in their discussions which allows them to communicate
with each other in a way that is easy to understand; then the second effect of shared language
reveals that the major shared content within an OBC is the consumers’ brand knowledge.
Accordingly, shared language of the cognitive dimension of social capital can enhance OBC
members’ abilities to accumulate effective brand knowledge by increasing the level of brand
awareness and brand image.
5.3.3 The effect of the relational dimension of social capital on brand
knowledge
In this study, the relational dimension is represented by identification and commitment. The
regression findings suggest that identification has a positive effect on brand knowledge. In
particular, identification has a stronger effect on brand awareness than brand image
according to the differences shown in Beta value in section 4.6. As a unique characteristic of
OBCs, identification represents a member’s sense of belonging to the community, which is
derived from a member’s involvement when participating in community activities (Bagozzi
and Dholakia, 2002). Accordingly, the statistical results reveal that many members feel
attached to their community and feel himself/herself as a part of the community. This is
helpful to establish the strong relationship between members and the community itself. At
the same time, an individual’s identification also perceives the similarities with other OBC
members. Most importantly, the finding shows that strong identification with other fellow
members and the community would strengthen consumers’ understanding and confidence in
the Volkswagen brand, in turn increasing their brand awareness and brand image.
Commitment is defined as the enduring desire to maintain a valuable relationship (Morgan
and Hunt, 1996). As regards the commitment within an OBC, it represents a member’s
willingness and effort to maintain loyal, long-term relationships with their community and
188 | P a g e
with fellow members. In comparison with the effect of identification, commitment is only
found to have positive impacts on brand image, but makes no significant contribution to
brand awareness. It is interesting to find that commitment can positively increase the level of
brand image, and the effect of commitment (Beta=.139) is quite close with identification
(Beta=.161). Brand image refers to a consumer’s perception and belief about the brand as
associations held in consumers’ memories. At this point, both identification and commitment
can enhance a consumer’s overall perception and attitude towards the Volkswagen brand (i.e.
consumers’ functional and emotional brand perceptions).
On the other hand, commitment is not found to have any effect upon brand awareness. In
this study, commitment is divided into two layers, the consumer’s commitment and the OBC
commitment. One possible explanation is that there is no direct effect between those two
commitments and brand awareness. However, Kim, Choi, Qualls and Han (2008) argue that
a consumer’s participation in an OBC would have a positive influence on a member’s
commitment behaviour towards a specific brand or product.
Based upon the discussion, identification and commitment represent the relational dimension
of social capital, which both contribute to building two types of relationship: consumer-
consumer relationship and consumer-to-community relationship. In particular, commitment
acts as an important element in explaining relationship building in the OBC setting. This
dimension does have an impact on brand knowledge but is less effective in comparison with
the cognitive dimension and communication dimension. Its main function is to build and
strengthen the relationships. The finding also indicates that the relational dimension can
contribute to the consumer-brand relationship within an OBC. As OBCs are based online
without face-to-face contact, which rely on the interaction among their members, OBCs need
a strong identification and commitment from community members to ensure their vitality
and longevity (Wellman and Gulia, 1999). Moreover, according to the results of the
relational dimension of social capital, an OBC is not only a place for gathering information
about a brand but is also the desire to connect consumers together.
189 | P a g e
5.3.4 The effect of the communication dimension of social capital on brand
knowledge
Quality and quantity of information exchange are the major elements that represent the
communication dimension of social capital. As the literature indicated earlier, information
exchange plays a significant role within virtual communities, as it can be used to help
explain ways in which online relationships and virtual communities develop and evolve
(Hersberger, Murray and Rioux, 2007). Similar to the common interests in a focal brand and
shared brand knowledge bringing consumers together to join an OBC, the relationship
among consumers or the relationship between consumer and the brand are dependent on the
nature of communication within the community, which is information exchange. In
particular, when members participate in the discussion forum activities, quality of
information exchange should be reliable, accurate, timely and relevant to the discussion
topic. In this study, quality of information exchange is found to have a positive effect on
brand knowledge in an OBC. This result is consistent with the author’s assumption that
quality of information exchange can increase the level of consumers’ brand awareness and
brand image.
However, in comparison with the quality of information exchange, quantity of information is
not found to have any direct effect upon brand knowledge. This is can be explained by the
fact that quantity of information exchange is less important for consumers, as the quality of
information exchange is the major reason for them to participate in OBCs. This can also be
explained by the public goods characteristics of virtual communities, especially when
consumers participate in online discussion forum activities. Wasko et al. (2005) explain that
participation in virtual communities is a form of collective action, which is based on
interactive posting and responding to messages. Accordingly, this interaction produces and
maintains the public good of information or knowledge that is stored and is available to any
member of the community (Lu and Yang, 2010). In this study, consumers participating in an
OBC share their interests, feelings, and experience towards the focal brand by posting
messages in their community, which are saved and available to all the community members.
It is an interesting finding that the quantity of information exchange could not help stock and
utilize social capital within OBCs. Therefore, although the quantity of information exchange
190 | P a g e
does not contribute to developing effective brand knowledge, it can still reflect the level of
consumers’ active involvement within OBC activities. In fact, the active and enthusiastic
members are significant for consumer-initiated OBCs as they are likely to make more
contribution to the community and help fellow members.
5.4 Theoretical contribution
This research is a cross-disciplinary study and is the first that brings two separate concepts –
social capital and brand knowledge – into the context of OBCs for researchers and marketing
practitioners. Therefore, theoretical contributions of this study are divided into two major
aspects: (1) extending and adding value to the existing literature of OBCs, brand knowledge
concept and social capital theory; (2) the development of a context specific social capital and
brand knowledge model (see Figure 2.8). The following subsections discuss all these
contributions in detail.
5.4.1 OBC research
The first contribution of this research is to develop the understanding of OBCs from a social
science perspective by drawing social capital theory into OBC studies. There is a growing
body of research into OBCs that has provided valuable insights into understanding the OBC
phenomenon, including its characteristics, classifications, benefits, consumers’ antecedents
and consequences of participation in OBCs etc. Much research starts with a community
approach to understand the definition and development of an OBC. The author found that the
nature of an OBC is an application of the community concept reflected in the marketing field.
In other words, an OBC is based on a community setting, which originates from a network
of social relationship by linking people with shared values and emotional bonds to the same
brand or product. At this point, the author further investigated how social capital theory
contributes in many types of community studies, as it is rooted and embedded in social
relationships. Therefore, the author decided to draw the social capital theory into an OBC by
investigating whether social capital can contribute to developing effective brand knowledge
in an OBC. The empirical findings empirically support the author’s theoretical assumption
that social capital is embedded in consumer-consumer relationships within an OBC,
meanwhile each dimension of social capital was found to have differential effects on brand

191 | P a g e
knowledge in terms of brand awareness and brand image. This important contribution is
discussed in detail in the following section 5.4.4.
The second contribution is to extend empirical OBC studies into consumer-initiated OBCs.
There are several classifications of OBCs, but, by and large, these can be categorized subject
to different hosts, thus Kim et al. (2008) distinguish OBCs as: company-initiated (i.e. the
brand owner sponsored communities) and consumer-initiated OBCs (i.e. the OBCs are
voluntarily established and maintained by their members). However, prior empirical studies
into OBCs mainly focus on company-initiated communities; there is still a lack of
consideration for the role of a consumer in consumer-initiated OBCs that primarily exist
online. In order to fill this gap in OBC research, this study specified consumer-initiated
OBCs as the web-survey research context. The author also acknowledged that these
successful OBCs are organised and facilitated entirely by enthusiastic customers with no
company involvement. At this point, social capital applied to the consumer-initiated OBCs is
helpful in explaining what the benefits of OBC brought to consumers and why they
volunteered to build these OBCs. This is because social capital brings information and social
benefits for consumers. In other words, the shared content is still the major motivation which
drives people to participate in an OBC; at the same time, consumers have a desire to
establish friendships with other members and maintain a long-term relationship with the
community.
The third contribution is the finding that an OBC is a place to accumulate effective brand
knowledge. To recall the literature, Sung and Lim (2002) emphasize the importance of
shared information related to the brand interests among members, which is the formation of
an OBC. Furthermore, many scholars suggested that shared information is the major reason
for consumers joining OBCs. The research into OBCs has also indicated that some
innovative ideas or consumer generated information are developed from the consumer-to-
consumer interactions and this is one of the major consequences of consumers’ participation
in an OBC. However, all these studies fail to specify the content of the shared information.
The author argues that this brand information and content should not just contain the facts
about brands or products; it should also include consumers’ brand knowledge (representing
192 | P a g e
their experience, attitudes, perceptions and emotional association toward the brand). Thus
this study contributes to clarifying that this shared information is brand knowledge.
The findings reported in this study confirm the existence of brand knowledge in an OBC
context. An OBC can offer a network of relationships with the brand and with fellow
consumers. Relevant research has indicated the characteristics of OBC members that they,
like creative consumers, are usually independent of the organisation especially within the
consumer-initiated OBCs (Fang and Wu, 2010). They often have extensive product
knowledge and engage in product-related discussion (Füller et al., 2008). Within this kind of
community relationship, consumers can communicate with each other about the brand when
they participate in discussion activities. Basically, an OBC is a computer-mediated space
that emphasizes the consumers’ discussion and communication about the specific brand and
product. As a result, brand knowledge can be accumulated through the consumer-consumer
interactive exchange progress.
The fourth contribution is to add value to the empirical studies of OBCs outside the U.S.
market. The literature for OBCs is the large proportion of research that has been conducted
in the U.S market, so this offers an opportunity to explore OBC studies in other non-U.S
markets. Apart from the U.S market, China is an expanding market with a large Internet
population. As the empirical data collection is conducted in China, the OBC phenomenon
has been investigated, principally for gaining understanding into the Chinese consumers’
characteristics. These were relatively young, male, and urban with a higher educational
background. With regard to the obtained results of the frequency of site visiting and the
numbers of postings, the majority of the participants were highly involved in OBC activities,
but still over 15per cent of respondents are lurkers with a relatively low involvement.
5.4.2 The brand knowledge concept
This study also contributes added value to the findings of previous studies held on the brand
knowledge concept. As noted in the literature, brand knowledge is regarded as the major
source of consumer-based brand equity, as brand equity is defined as “the differential effect
of brand knowledge on consumers’ responses to the marketing of a brand” (Keller, 1993).
Brand knowledge is accumulated when consumers are familiar with a brand or product and

193 | P a g e
have knowledge about that brand, which results in positive associations about the brand in
consumers’ memories. Therefore, most research into brand knowledge is categorized into the
following three aspects:
i. Understanding the content and construct of brand knowledge to determine the
measurements for this concept.
ii. To investigate the effects of brand knowledge especially on consumers’ attitudes
toward the brand, their purchasing behaviours and their reactions towards a variety of
marketing activities.
iii. To investigate the factors influencing brand knowledge.
The first theoretical contribution of this study into brand knowledge is to validate the
existing measurements for brand knowledge. The findings reported from CFA analysis in
this study have substantiated Keller’s direct approach to measure brand knowledge. The
brand knowledge construct (consisting of brand awareness and brand image) had reached a
relatively high reliability and validity, which were established by sufficient value of
Cronbach’s Alpha, composite reliability and AVE.
As discussed in the last section, the CFA results also supported the presence of brand
knowledge in a consumer-initiated OBC. From this point, this current study also aims to
extend the understanding of the brand knowledge concept in an OBC context by assuming
that brand knowledge plays a significant role in surviving an OBC. The brand knowledge in
a consumer’s memory is significant, as it influences what comes to mind when a consumer
thinks about a brand; in turn, it affects consumers’ attitudes, product choices and purchase
decision. At the same time, an OBC is a place to accumulate effective brand knowledge
through consumer-to-consumer interaction when they participate in OBC activities that were
discussed in detail in section 5.4.1. Most importantly, the findings from regression analysis
also reveals that brand knowledge could be enhanced through three dimensions of social
capital (i.e. cognitive, relational, and communication dimensions) within a number of
consumer-initiated OBCs. In other words, the dimensions of social capital have been found
194 | P a g e
as predictors for developing effective brand knowledge in an OBC. This was another
valuable finding from this research that is discussed in detail in section 5.4.4.
5.4.3 Social capital theory
The findings obtained from this study have also added value to the body of literature
concerning social capital theory by exploring its marketing potential in an OBC, which is
discussed in the following four aspects.
The first is that this study identifies an appropriate working definition for social capital in an
OBC. Although the literature argues that the definitions of social capital vary author by
author due a variety of contexts, all these definitions describe social capital in a community
sense, which can be further categorized into two levels: individual and group levels. The
author realizes that it is necessary to identify a working definition for social capital in this
present study. Social capital is conceptualized as “a set of social resources embedded in the
network of relationships between individuals and their connections with the OBC”. This
definition is based on Nahapiet and Ghoshal’s theoretical position which explained social
capital as a set of social resources embedded in the network of relationships among
individuals; this is aligned with social capital in the OBC. At this point, this study enriches
social capital by giving a definition of social capital with regard to the specific OBC context.
This definition also helps in understanding the role of social capital in an OBC, which leads
to the second contribution this study made to the social capital theory.
The second aspect is that it stresses the important role of social capital in a consumer-
initiated OBC. According to the literature on social capital, it is a broad concept that has
tried to incorporate a wide variety of relationships, cognition, benefits and values (Batt,
2008). The advantage of this broad framework is that it encourages greater integration of
different-specific perspectives. For example, social capital has traditionally had its empirical
focus on networks and the role of networks in a society or organisation (Batt, 2008). Thus
the bonding and bridging of social capital are frequently discussed in business and industrial
networks as social capital is developed from a social exchange theory. Granovetter (1971)
also argues that social relations and social networks within which individuals are embedded
play a significant role in determining their actions and behaviour. Furthermore, social capital
195 | P a g e
has been investigated as to its influence on relationships, particularly in marketing contexts;
it has been used in understanding the relationship between firms from different countries
(Ramström, 2008).
Based upon the discussion above, social capital is a useful theoretical approach to
understanding interactive relationships. Many researchers have paid attention to social
capital in a variety of contexts; its presence and benefits have been consistently supported.
However, there is still a lack of research concerning the role of social capital in an OBC,
especially in a consumer-initiated OBC. The findings from this study support the presence of
social capital (with four dimensions) in a consumer-initiated OBC; furthermore its
importance towards OBC studies is highlighted. Social capital provides interaction ties
helping community members gain access to broader sources of information. Also social
capital provides information benefits, which allow consumers to improve the effectiveness
of their brand information and knowledge. In other words, social capital increases the ability
to share information and knowledge. Within an OBC, the richness of information about
brands can encourage consumers’ participation in OBC activities. In addition to the
information benefits, social capital can increase members’ access to social support from
other fellow consumers in their community. At the same time, they are more likely to build
up relationships with others due to their common interests in the brand or product.
Social capital with an additional communication dimension is regarded as an extension of
social capital theory from prior research. Apart from defining social capital in a consumer-
initiated OBC and confirming the important role of social capital, the third contribution to
social capital theory is to validate and confirm the existing three-dimensional construct in an
OBC and to incorporate a fourth dimension, the communication dimension, into social
capital theory.
Many researchers and scholars have recognized the disadvantages of the broad framework of
social capital theory which increases the difficulty in measuring the construct of social
capital (Durlauf, 2002; Batt, 2008). For the purposes of this study, the author follows
Nahapiet and Goshal’s (1998) framework by dividing the concept of social capital into three
major dimensions: structural, cognitive and relational.
196 | P a g e
Hazelton and Kennan (2000) introduced the communication dimension into social capital
theory; they believe that the communication dimension and cognitive dimension are
duplicated. Although these two dimensions both emphasize the necessity of assessing and
utilizing social capital in the community, the author argues that they reinforce different
aspects of social capital in an OBC. For example, the cognitive dimension represents the
shared language necessary for providing a foundation for the community member to
exchange information and knowledge. In contrast, the communication dimension emphasizes
the importance of information exchange influencing the mobilization of social capital. The
significant function of communication has been indicated in the traditional definitions of
social capital from a number of key authors, which can facilitate the resources accumulation
(Bourdieu, 1980), increasing social control (Coleman, 1988), stimulating the level of
interaction (Putnam, 1998), and giving meaning to a personal achievement (Lin, 1999).
Finally, from a relationship marketing perspective, e-communication consumer-to-consumer
creates value through the sharing of information and experiences.
Based upon the discussion above, the communication dimension is visible in an OBC but is
different from the cognitive dimension; it is used to stock and utilize the social capital.
Rather than replacing the cognitive dimension, the author decided to incorporate the
communication dimension as a separate dimension of social capital. In addition, most of the
prior literature considers that the dimensions of social capital emphasize the conduit role of
social capital, but largely ignores the information benefits of social capital as well as its
utilization. Therefore, this is another reason why this study incorporates a communication
dimension as the fourth dimension of social capital, because a communication process is
needed to develop social ties and to facilitate the flow of information within the community
(Coleman, 1988).
To recall the literature, some scholars, for example, have adopted the proposition with regard
to the communication dimension. Winden-Wulff and Ginman (2004) argued that the
communication dimension may have an impact on people’s information sharing behaviour.
However, this communication dimension remains at the conceptual level and has not been
empirically assessed and approved yet. This study has filled this literature gap. With

197 | P a g e
reference to the findings reported in this study, there are three major empirical achievements
towards social capital theory that have been outlined as below:
i. The findings of CFA analysis suggested that both quality and quantity of information
exchange were highly reliable indicators for the communication dimension.
ii. The findings of a measurement model assessment revealed that the cognitive
dimension and communication dimension are not duplicated, they are two separate
key elements presented in the social capital construct.
iii. The findings of the regression model explained that the dimensions of social capital
do have effects on brand knowledge, but not every dimension make significant
contributions. Among the four dimensions, the quality of information of the
communication dimension was found to be the best predictor for brand knowledge.
Thus, the use of social capital in this study builds upon prior research and extends the
understanding of social capital in an OBC.
5.4.4 Social capital and the brand knowledge model
The final contribution of this study is the specified role of social capital and brand
knowledge in an OBC. The recent literature suggests that the use of three traditional
dimensions of social capital have been applied in three major research disciplines which are
described as below:
i. The dimensions of social capital are applied in strategic management studies in order
to examine the contribution of social capital in a firm’s value creation.
ii. These dimensions are extended into marketing disciplines and found as factors
influencing the process of new product development, improving customer
relationship value and facilitating the Internet marketing innovation.
iii. These dimensions are also found as significant factors impacting on people’s
knowledge sharing behaviour, particularly in virtual communities.
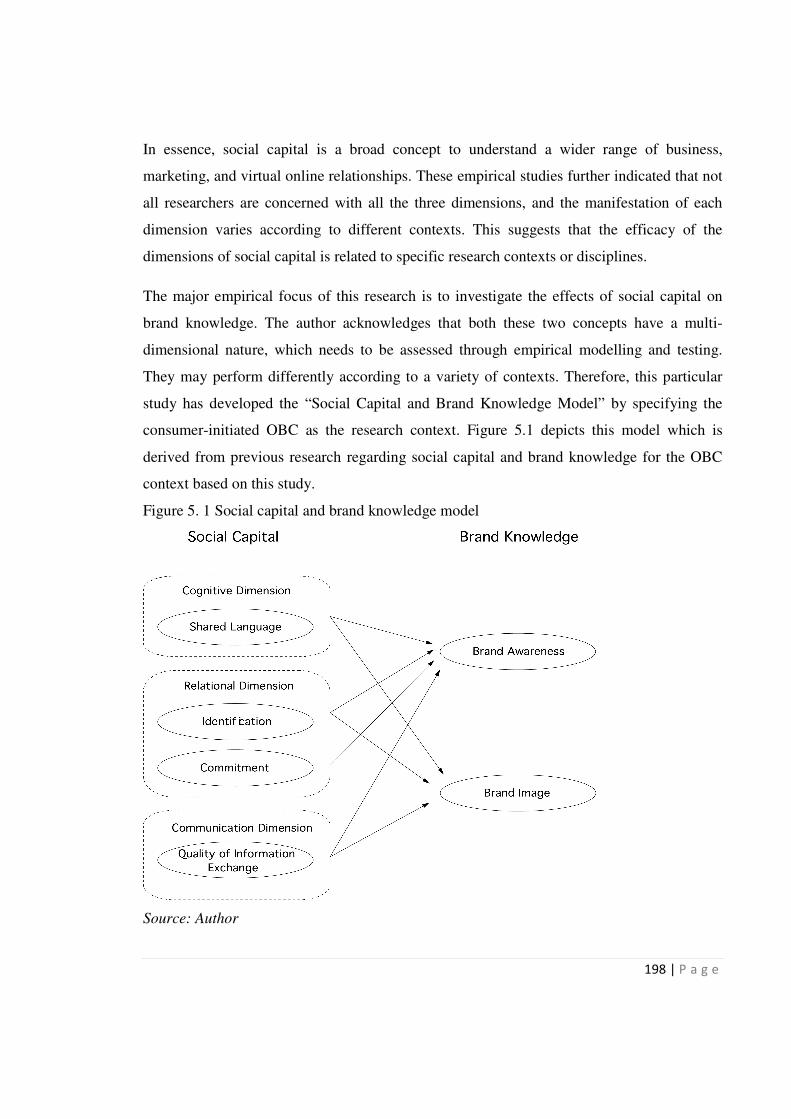
198 | P a g e
In essence, social capital is a broad concept to understand a wider range of business,
marketing, and virtual online relationships. These empirical studies further indicated that not
all researchers are concerned with all the three dimensions, and the manifestation of each
dimension varies according to different contexts. This suggests that the efficacy of the
dimensions of social capital is related to specific research contexts or disciplines.
The major empirical focus of this research is to investigate the effects of social capital on
brand knowledge. The author acknowledges that both these two concepts have a multi-
dimensional nature, which needs to be assessed through empirical modelling and testing.
They may perform differently according to a variety of contexts. Therefore, this particular
study has developed the “Social Capital and Brand Knowledge Model” by specifying the
consumer-initiated OBC as the research context. Figure 5.1 depicts this model which is
derived from previous research regarding social capital and brand knowledge for the OBC
context based on this study.
Figure 5. 1 Social capital and brand knowledge model
Source: Author
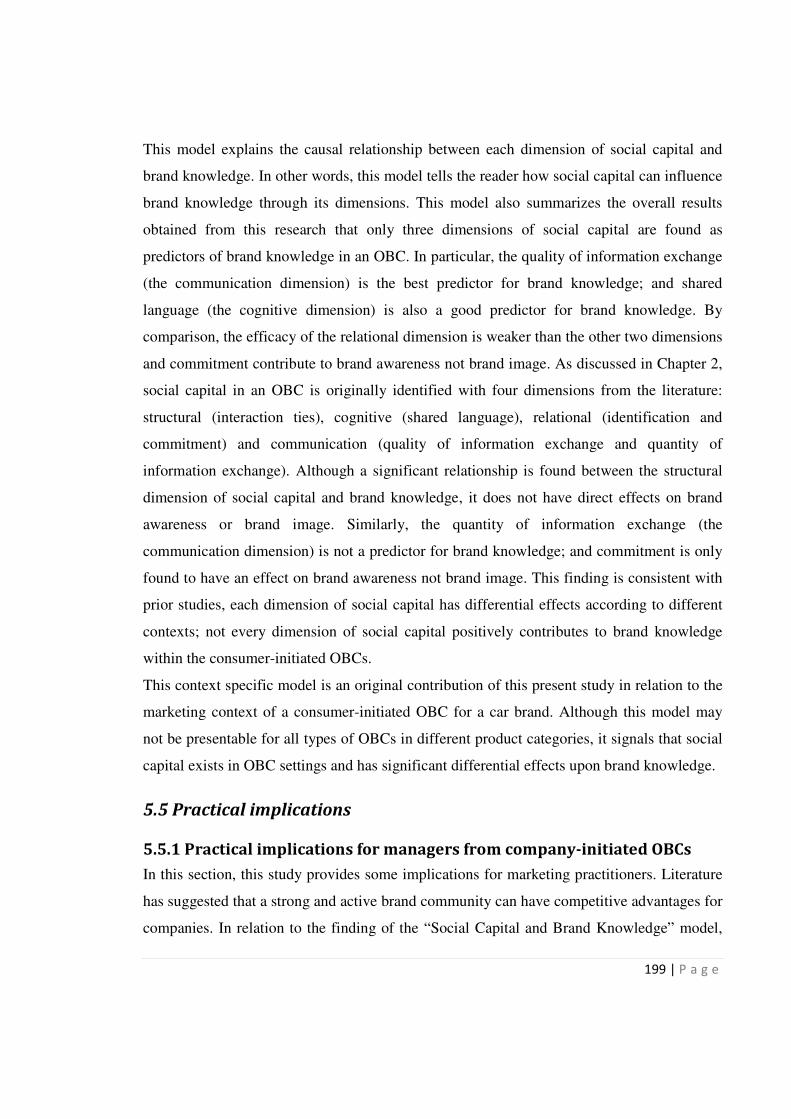
199 | P a g e
This model explains the causal relationship between each dimension of social capital and
brand knowledge. In other words, this model tells the reader how social capital can influence
brand knowledge through its dimensions. This model also summarizes the overall results
obtained from this research that only three dimensions of social capital are found as
predictors of brand knowledge in an OBC. In particular, the quality of information exchange
(the communication dimension) is the best predictor for brand knowledge; and shared
language (the cognitive dimension) is also a good predictor for brand knowledge. By
comparison, the efficacy of the relational dimension is weaker than the other two dimensions
and commitment contribute to brand awareness not brand image. As discussed in Chapter 2,
social capital in an OBC is originally identified with four dimensions from the literature:
structural (interaction ties), cognitive (shared language), relational (identification and
commitment) and communication (quality of information exchange and quantity of
information exchange). Although a significant relationship is found between the structural
dimension of social capital and brand knowledge, it does not have direct effects on brand
awareness or brand image. Similarly, the quantity of information exchange (the
communication dimension) is not a predictor for brand knowledge; and commitment is only
found to have an effect on brand awareness not brand image. This finding is consistent with
prior studies, each dimension of social capital has differential effects according to different
contexts; not every dimension of social capital positively contributes to brand knowledge
within the consumer-initiated OBCs.
This context specific model is an original contribution of this present study in relation to the
marketing context of a consumer-initiated OBC for a car brand. Although this model may
not be presentable for all types of OBCs in different product categories, it signals that social
capital exists in OBC settings and has significant differential effects upon brand knowledge.
5.5 Practical implications
5.5.1 Practical implications for managers from company-initiated OBCs
In this section, this study provides some implications for marketing practitioners. Literature
has suggested that a strong and active brand community can have competitive advantages for
companies. In relation to the finding of the “Social Capital and Brand Knowledge” model,

200 | P a g e
social capital has favourable impacts on brand knowledge though its three dimensions (i.e.
cognitive, relational and communication dimensions). Showing the higher level of social
capital in an OBC generates a higher level of consumers’ brand awareness and brand image.
This in turn can help marketing practitioners to realize the importance of social capital in an
OBC.
Furthermore, the implications for the combined research findings for branding strategies are
also interesting. It is important to note in this quantitative research that brand knowledge is
more strongly affected by the communication dimension (quality of information exchange)
of social capital than the other dimensions. This result indicates that marketers would be
encouraged to pay more attention to the quality of information exchange on their OBC
websites. Such a strategy may help in developing effective brand knowledge by increasing
the consumers’ brand awareness and brand image. The brand knowledge in an OBC is not
only influenced by the quality of information exchange but has also been impact by shared
language (the cognitive dimension of social capital) within the community discussion. In
addition, managers of company-initiated OBCs can encourage consumers to share and
develop effective brand knowledge by enhancing a member’s identification towards the
community.
The OBC is regarded as a part of online marketing strategy. In relation to the importance of
consumer-to-consumer relationships, this study suggests that brand owners or company-
initiated OBCs can give opportunities for consumers to conduct their own OBCs and the
freedom to express their opinions, because the brand managers must understand the
behaviour of consumers if they wish to develop a strong, sustainable and beneficial OBC
around their brand (McWillian, 2000). Managing the consumer-to-consumer relationship is
also a means of enhancing consumers’ interaction within their discussion in the OBC, and to
possess more effective brand knowledge.
201 | P a g e
5.5.2 Practical implications for community leaders from consumer-
initiated OBCs
As this empirical research focused on consumer-initiated OBCs, some implications for
community leaders can be derived from the findings reported in this study. Community
leaders interested in developing effective brand knowledge through consumers’ participation
in their OBCs should develop strategies that encourage consumers’ communication with
each other as well as promoting shared language during their discussion. For example,
community leaders can arrange face-to-face meeting and invite the top active members to
share and contribute their brand information and experience, as does the Xcar.com, by
holding some offline events as a way to enhance consumers’ interaction with other
members’ and the community at a personal level.
In relation to the effect exerted by the relational dimension of social capital upon brand
knowledge, community leaders should acknowledge that social relationships among
consumers would enhance the consumers’ brand awareness and brand image. However, the
key motivation which drives consumers to participate in an OBC activity is still the shared
interest in a focal brand. Community leaders need to develop strategies to strengthen these
consumer-to-brand relationships and consumer-to-community relationships.
Further, in order to guarantee the sustainability of the consumer-initiated OBCs in the long
term, community leaders should be aware of the quality of information exchange by
continuously filtering out low-value material from their site to make the usefulness of the
OBC.
5.6 Summary
This chapter discussed and synthesised the major findings generated from this study in the
light of previous empirical literature. There are three major notable findings arising from the
results, including: (1) the evidence that shows the presence of social capital (with four
dimensions) and brand knowledge (consisting of brand awareness and brand image) in an
OBC; (2) the evidence of the relationship between social capital and brand knowledge; (3)
each dimension has differential effects on brand knowledge. These findings provide insights
into how social capital can have an influence on brand knowledge in an OBC.

202 | P a g e
Following prior research of OBCs, this study applies the community approach to understand
the development of OBCs, and then takes an important step to draw social capital theory into
OBC studies. Where this research differs from other OBC research is that it investigates the
dimensions of social capital as predictors for building effective brand knowledge by
increasing a high level of brand awareness and brand image. This study also contributes to
the extending of empirical research into consumer-initiated OBCs in China by emphasizing
the important role that consumers play in an OBC. The findings reveal that shared brand
knowledge in consumer-to-consumer interaction is the major reason that drives people to
build and participate in the community.
Another major contribution of this study is to investigate the uses of social capital by
developing a working definition and identifying the dimension of social capital presented in
consumer-initiated OBCs, in particular, adding a fourth dimension, the communication
dimensions of social capital from a marketing perspective. Most importantly, the empirical
results of this study show that the communication dimension (i.e. quality of information
exchange) works effectively for developing brand knowledge in an OBC. Apart from the
communication dimension, the cognitive dimension (i.e. shared language) and relational
dimension (i.e. identification) also have a positive influence upon brand knowledge. Finally,
the context specific “Social Capital and Brand Knowledge” is developed to reveal the
marketing potential of social capital exerted within an OBC.
Finally, this section offers some practical implications for both marketing practitioners from
brand owners and community leaders from consumer-initiated OBCs. Managers interested in
building effective brand knowledge within OBCs should acknowledge the importance of
social capital and develop appropriate strategies to guarantee the sustainability of their OBCs.
For example, they need to create an environment for positive and active brand knowledge-
based communications.

203 | P a g e
Chapter 6 Conclusion and Future Research
6.0 Summary of this study
This study provides a deeper understanding of the OBC phenomenon from a social
science perspective. This study is motivated by the fact that there is a lack research on
OBCs from a social capital perspective; a lack of consideration of consumer-initiated
communities, especially outside the US market; and a lack of clarification for the shared
content within an OBC.
Based upon the discussion in literature, an OBC is a place to gather a group of people
who have shared interests in the same brand or product. This study has contributed to
clarifying two issues from the previous research into OBCs: firstly, an OBC is based on a
community setting, which is established on three types of relationships (i.e. consumer-to-
brand, consumer-to-consumer and consumer-community relationships); secondly, the
shared brand knowledge is the major reason that drives people to participate in OBC
activities. It is also evident in the literature that social capital resides and is embedded in
the consumer-to-consumer relationships within an OBC, which may influence brand
knowledge.
This study mainly aims to investigate the impact of social capital on brand knowledge
within a consumer-initiated OBC context. It investigates the use of social capital in
OBCs in two ways. Firstly, it investigates the presence of social capital in OBCs. In order
to investigate this presence, the literature reviews the nature, characteristics and
classification of OBCs to understand the formation and development of OBCs. Secondly,
it predicts that social capital has a potential impact on brands in the context of an OBC.
The relationship between social capital and brand is reflected as the relationship between
each dimension of social capital and brand knowledge.
This study is deductive in nature and seeks to explain and predict what happens in the
research context by searching for the causal relationships between the research variables.
This study intends to develop a theoretical framework, which and test it through
empirical research.

204 | P a g e
Due to the deductive nature of this study, a web-survey was conducted via a self-
administered questionnaire which was posted on the website of the selected consumer-
initiated OBCs. The research context of this study was a car-lovers online community,
which was sponsored by a commercial portal, XCar.com in China. Thirty-five consumer-
initiated OBCs were selected from XCar.com which all focused on the Volkswagen car
brand. These OBCs were selected according to three criteria: (1) the level of awareness,
(2) the traffic level and (3) the availability. Regarding the nature of the web-survey
method, it was difficult to identify an accurate sample frame and relatively little
information was known about the characteristics of the participants from these OBCs. In
this case, the snowball sampling technique was selected as an appropriate sample
technique for this present study, since this technique was able to obtain a large number of
completed questionnaires through respondents’ referral networks (Cooper and Schindler,
2006). Apart from the web-survey, the author also managed to distribute some paper-
based questionnaires through a one-day offline event, which was held by the Volkswagen
communities of XCar.com. The questionnaire content was the same as that of the web-
based one but on hard copy, since the targeted respondents were the same. In total, the
author managed to collect 353 valid responses, 301 of which were web-based responses
and 52 of which were hard copy.
The major composition of the required information for the questionnaire included the
items which are used to measure the variables in this study. These variables comprised
interaction ties, shared language, identification, commitment, and quantity of information
exchange, quality of information exchange, brand awareness and brand image, which
were derived from prior research. These variables were measured using a five-point
Likert scale ranging from “strongly disagree” to “strongly agree”. The data collected in
this study was used to test the hypotheses developed from the literature, which
determined the data analysis techniques. Accordingly, three types of analysis were
utilized in this study: (1) a descriptive statistical analysis was used to summarize the
characteristics of the respondents and the results of measured items – the statistical
results were obtained from SPSS 18.0; (2) Confirmatory Factor Analysis (CFA) was
conducted to assess the goodness-of-fit of the measurement model as well as the
reliability and validity of each research construct - the statistical results were obtained
from SPSS 18.0 and AMOS 18.0; (3) Correlation and Multiple Regression analysis were
205 | P a g e
conducted via SPSS, which was used to analyse the hypothesized relationship between
each independent and dependent variable.
The overall results of this study provide insights into how social capital in an OBC
influences brand knowledge in terms of brand awareness and brand image. This study
found that both measured constructs – social capital and brand knowledge – had a high
level of reliability. They were both presented in the consumer-initiated OBCs according
to the results obtained from the full measurement model assessments. A positive and
strong association was also found between social capital and brand knowledge which was,
suggested by the correlation co-efficiency value. Further, the relationship between social
capital and brand knowledge was specified as the causal relationship between each
dimension of social capital and brand awareness and brand image. This causal
relationship indicates that the dimensions of social capital are predictors for brand
knowledge. Most importantly, the regression results suggest that each dimension of
social capital works intensively but not all the dimensions have positive effects on brand
knowledge.
This study was carried out in the context of Chinese automobile industry, and the survey
participants were from the consumer-initiated OBCs on Xcar.com only. As such, the
findings may not be generalizable to other industries, and the sample group may not be
large and robust enough to represent the whole population in China. A single research
domain and the selected respondents could be limitations of this study worth noting and
will be discussed in section 6.4.
6.1 Accomplishment of research objectives
Following the research findings and discussion provided in Chapter 5, the conclusions of
this research are formulated in terms of objectives achieved and contribution to
knowledge both theoretically and practically.
The four objectives of this study set out in Chapter 1 have been achieved, and are
discussed in detail as follows:
� To investigate the presence of social capital with four dimensions (i.e.
structural, cognitive, relational and communication dimensions) in the Chinese
Volkswagen consumer-initiated OBCs

206 | P a g e
The presence of social capital with four dimensions has been confirmed and
supported by the empirical results obtained from CFA analysis and measurement
assessments. This is the first step in exploring the marketing potential of social
capital within the consumer-initiated OBCs, as social capital has not previously
been studied in such a context. Social capital has been studied in a variety of
contexts and disciplines, and has been regarded as a useful concept to understand
the network of relationships. The confirmation of the presence of social capital in
an OBC is seen as a precondition before exploring its potential effect on brands.
According to the multi-dimensional nature of the social capital concept, its
presence within an OBC was examined through its four dimensions. Literature on
social capital also suggests that the manifestation for each dimension varies
according to different contexts. The four dimensions are identified as the
structural dimension (interaction ties), the cognitive dimension (shared language),
the relational dimension (identification and commitment) and the communication
dimension (quality and quantity of information exchange). These dimensions
provide a comprehensive understanding of the use of social capital within
consumer-initiated OBCs. Interaction ties provide access for OBC members to a
variety of resources. Shared language provides members with a common
apparatus for community members to communicate and understand each other.
Identification and commitment explains a consumer’s willingness to maintain
loyal relationships with the community and fellow consumers. Information
exchange explains the ways in which consumer-to-consumer relationships
develop and evolve, especially in consumer-initiated OBCs.
� To investigate the presence of brand knowledge within two dimensions (i.e.
brand awareness and brand image) in the Chinese Volkswagen consumer-
initiated OBCs
As this study is the first to introduce the brand knowledge construct into an OBC,
the presence of brand knowledge within a consumer-initiated OBC is confirmed
through CFA analysis and measurement assessments. Although the concept of
brand knowledge is well developed in branding literature, there is still a lack of
research in an online marketing context. In this study, brand knowledge

207 | P a g e
represents the information, feelings, thoughts and perceptions stored in
consumers’ minds about the Volkswagen brand within the car product category.
The author follows Keller’s (1993) direct approach to empirically assess the
brand knowledge construct with its two major dimensions – brand awareness and
brand image –generate a high level of reliability and validity. This means the
existing measurements for brand knowledge from prior research are also
validated in the context of OBCs. Most importantly, the presence of brand
knowledge within an OBC supports the author’s assumption that a consumers’
brand knowledge is accumulated through their participation in OBCs.
� To investigate the relationship between each dimension of social capital and
brand knowledge in the Chinese Volkswagen consumer-initiated OBCs
This study is cross-disciplinary and brings social capital and brand knowledge
together in the same context of OBCs. It uncovers a significant positive
relationship between social capital and brand knowledge, which is supported by
the empirical results obtained from correlation analysis. This relationship explains
that consumers utilize their social capital to develop brand knowledge within
OBCs.
Most of the dimensions of social capital are associated with brand knowledge in
terms of brand awareness and brand image. However, the quantity of information
exchange of the communication dimension is only positively associated with
brand awareness not brand image. This is maybe because quantity of information
does not have a direct relationship with brand image, as it is inter-related with
other dimensions of social capital according to the results obtained from the
correlation matrix. For example, quantity of information exchanged is also
correlated with interaction ties, identification and commitment, indicating that the
quantity of information exchange may have an indirect relationship with brand
knowledge through other dimensions of social capital.
� To evaluate the efficacy of each dimension of social capital, with regard to
developing effective brand knowledge in the Chinese Volkswagen consumer-
initiated OBCs
208 | P a g e
As the positive relationship between each dimension of social capital and brand
knowledge are evident, this study finally reveals that each dimension of social
capital has differential effects on brand knowledge. In particular, quality of
information exchange (the communication dimension) has the strongest effect on
brand knowledge of all the dimensions of social capital. Shared language (the
cognitive dimension) is also a good predictor of brand knowledge. The efficacy of
the relational dimension (identification and commitment) is weaker in comparison
with the above two dimensions. Contrary to expectations, the structural
dimension (interaction ties) and quantity of information exchange (the
communication dimension) have no direct effect on brand awareness or brand
image.
There is a substantial amount of research into OBCs, including their characteristics,
classifications, benefits, practical implications etc. In particular, Muniz and O’Guinn’s
definition of OBC is widely accepted by other scholars; however this definition mainly
focuses on OBCs for commercial purposes without consideration of consumer-initiated
OBCs. This research has extended the empirical study into consumer-initiated
communities. These communities are voluntarily established and maintained by the
consumers themselves; the major reason for their members to participate is to obtain
shared information and knowledge of the focal brand; at the same time, consumers also
want to establish friendships with other fellow members.
Additionally, most prior studies apply the community approach to understand the
development of OBCs. Little information has been given concerning the contribution of
social capital theory to OBC studies as social capital contributes many types of
community study. This study applies social capital theory to consumer-initiated OBC
studies, which in particular explains the important role of social capital in understanding
the interactive consumer-brand-consumer relationships within the community. Most
importantly, social capital has influence on brands in that its three dimensions (i.e.
cognitive, relational and communication dimensions) are found as significant predictors
of brand knowledge.
A consumer-initiated OBC is found as a place to accumulate effective brand knowledge.
The concept of brand knowledge is frequently discussed in the literature of consumer-

209 | P a g e
brand equity. In this study, brand knowledge plays a dual role: it is not only regarded as
the major motivation which drives people to join OBC activities but it is also seen as an
important outcome of a consumer’s active participation. Thus the author argues that
brand knowledge is significant to the survival of an OBC. However, brand knowledge in
OBCs still lacks empirical research. This study investigates the presence of brand
knowledge in two ways: firstly, seeking to assess the brand knowledge constructs within
the OBC context; and secondly exploring the factors influencing brand knowledge.
6.2 Original theoretical contributions
The findings from the quantitative analysis presented in this present study add a relevant
and original contribution to the literature, which emphasizes three aspects. As stated in
Chapter 5, this study extends and adds value to OBC studies, brand knowledge concept
and social capital theory. This section is to signify the original contribution this study
makes to the literature.
6.2.1 OBC studies
With regard to the OBC studies, this study has advanced on the literature by drawing the
social capital theory into consumer-initiated OBC studies to give a deeper understanding
of OBCs’ community setting. Three types of relationships form a consumer-initiated
OBC, including consumer-to-brand, consumer-to-consumer and consumer-to-community
relationships. Social capital is found to reside within the consumer-to-consumer
relationship, which is conceptualized as a set of social sources, embedded in the network
relationship between individuals and their connections with the OBC. In detail, the use of
social capital in a consumer-initiated OBC is reflected in three ways: (1) it provides
interaction ties for OBC members and helps them gain access to broader sources of brand
information and knowledge; (2) it brings information benefits which allow consumers to
improve the effectiveness of their shared information on the focal brand or product; (3) it
also brings social benefits to OBC members which can increase consumers’ access to
social support from fellow members and establish personal relationships with them.
6.2.2 Social capital
In terms of social capital theory, many scholars have referred to the dimensions of social
capital in a variety of research disciplines. Apart from the three traditional dimensions
(i.e. structural, cognitive and relational) introduced by Nahapiet and Ghoshal (1998), this

210 | P a g e
study incorporates the communication dimension as the fourth dimension of social
capital and empirically assesses this dimension within the context of OBCs. This study
has not extended social capital theory from prior research but has made advances on the
literature. The communication dimension is manifested as quality of information
exchange, which is visible within the context of OBCs. The results of this study further
confirm that the communication dimension does not duplicate the cognitive dimension;
and that has a stronger effect on brand knowledge by comparison with other dimensions
of social capital.
6.2.3 Social Capital and Brand Knowledge Model
This is a cross-disciplinary study which brings social capital theory and brand knowledge
into the same context as consumer-initiated OBCs. Social capital has its origin in the
social science and humanities literature that is used to understand a wide range of social
phenomena. In this study, social capital is explained in a community sense, which resides
within the social relationships among OBC members. In terms of brand knowledge, its
marketing concept originates from consumer-based brand equity literature. Therefore,
this study develops the specific “Social Capital and Brand Knowledge” model within the
OBC context. This model provides insights on how social capital influences brand
knowledge in consumer-initiated OBCs. The findings reveal that each dimension of
social capital works intensively and that not every dimension has an equal effect on both
brand awareness and image.
6.2.4 Comparison of literature on OBCs between the West and China
This section compares the findings of this study and the literature on OBCs in the West.
It reviews the prior OBC research discussed in Chapter 2 from the West and Asia, and
highlights the similarities and differences between them.
Table 6.1 summarizes the key findings of prior OBC research discussed in Chapter 2
from western countries and Asia. Prior research in the West makes a valuable
contribution to understanding OBCs, their characteristics, formation, typologies etc.
Recently, the motivation and consequence of consumers' participation have been widely
discussed in both western and Asian research. Shared product and brand information is
the major reason driving people to participate in OBCs; meanwhile, active consumer
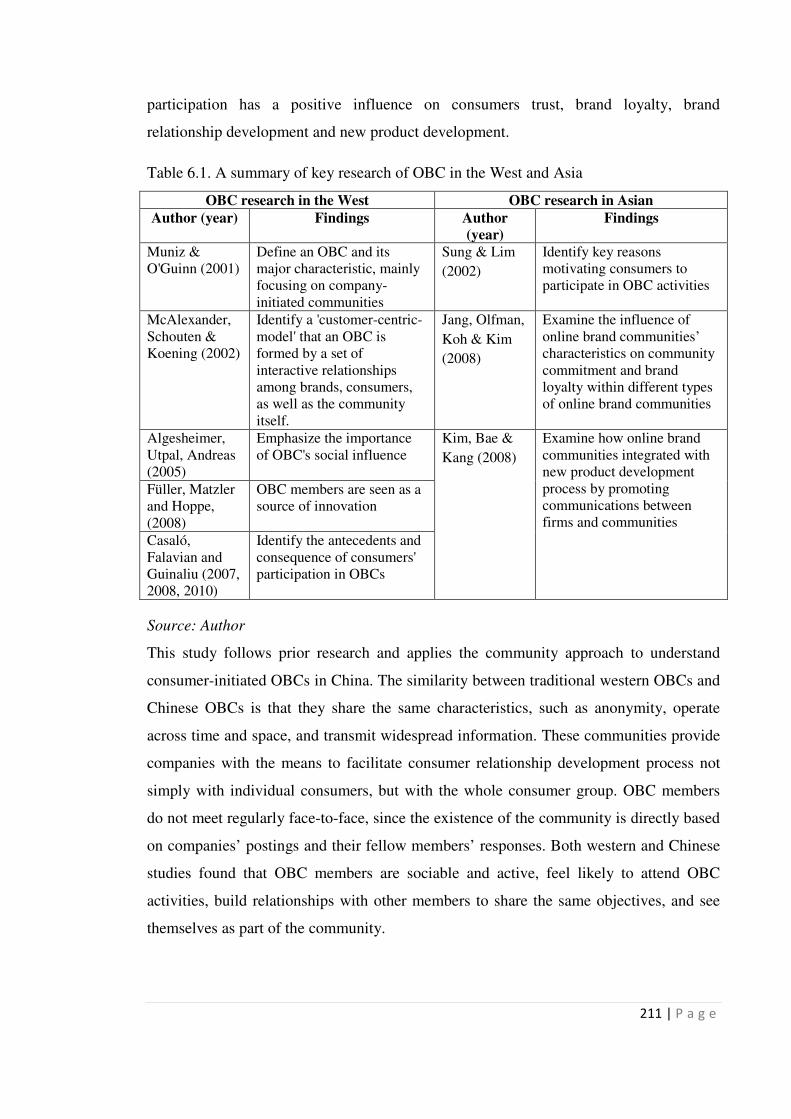
211 | P a g e
participation has a positive influence on consumers trust, brand loyalty, brand
relationship development and new product development.
Table 6.1. A summary of key research of OBC in the West and Asia
OBC research in the West OBC research in Asian
Author (year) Findings Author
(year)
Findings
Muniz &
O'Guinn (2001)
Define an OBC and its
major characteristic, mainly
focusing on company-
initiated communities
Sung & Lim
(2002)
Identify key reasons
motivating consumers to
participate in OBC activities
McAlexander,
Schouten &
Koening (2002)
Identify a 'customer-centric-
model' that an OBC is
formed by a set of
interactive relationships
among brands, consumers,
as well as the community
itself.
Jang, Olfman,
Koh & Kim
(2008)
Examine the influence of
online brand communities’
characteristics on community
commitment and brand
loyalty within different types
of online brand communities
Algesheimer,
Utpal, Andreas
(2005)
Emphasize the importance
of OBC's social influence
Kim, Bae &
Kang (2008)
Examine how online brand
communities integrated with
new product development
process by promoting
communications between
firms and communities
Füller, Matzler
and Hoppe,
(2008)
OBC members are seen as a
source of innovation
Casaló,
Falavian and
Guinaliu (2007,
2008, 2010)
Identify the antecedents and
consequence of consumers'
participation in OBCs
Source: Author
This study follows prior research and applies the community approach to understand
consumer-initiated OBCs in China. The similarity between traditional western OBCs and
Chinese OBCs is that they share the same characteristics, such as anonymity, operate
across time and space, and transmit widespread information. These communities provide
companies with the means to facilitate consumer relationship development process not
simply with individual consumers, but with the whole consumer group. OBC members
do not meet regularly face-to-face, since the existence of the community is directly based
on companies’ postings and their fellow members’ responses. Both western and Chinese
studies found that OBC members are sociable and active, feel likely to attend OBC
activities, build relationships with other members to share the same objectives, and see
themselves as part of the community.

212 | P a g e
As discussed in prior Western literature, the big automobile brands, such as Jeep, Harley
Davidson, Ford, and Volkswagen, usually establish their company-sponsored
communities either in their company cooperative websites or an individual website in
U.S and European countries. In China's automobile industry, companies are heavily
reliant on the domestic SNSs, since they dominate China’s social networking sphere. In
this study, the Volkswagen group has three company-sponsored communities from
different SNSs platforms - Sina Weibo, RenRen and KaiXin.
Where this study differs from other OBC research is that it draws social capital theory
into an OBC context, and identifies the significant role of social capital in consumer-
initiated communities. Social capital provides information and social benefits for OBC
members and exerts a positive influence on consumers' participation. The findings also
reveal that brand knowledge is a major motivation driving people to participate in Xcar’s
Volkswagen communities. Most importantly, the dimensions of social capital are
examined as predictors for building effective brand knowledge in these communities by
increasing a high level of brand awareness and brand image.
6.3 Practical contributions
6.3.1 Contribution for managers from company-initiated OBCs
To the extent that brand owners develop OBC strategies targeting consumer-brand
relationships, they should consider the contribution of social capital to the development
of OBCs. Social capital helps managers understand the information benefits an OBC can
bring to its members. It is embedded among a member’s social relationship with other
fellow members. In practice, company managers are suggested to give consumers the
opportunity to construct brand communities and the freedom to express their own
attitudes and perceptions of the brand or product. Social capital also provides social
benefits for OBCs in that the consumer-to-consumer interactive relationships can be
strengthened through their active participation of OBC activities.
The “Social Capital and Brand Knowledge” model provides managers with a greater
understanding of the three dimensions of social capital, which are significant for
developing effective brand knowledge (i.e. brand awareness and brand image) through
consumers’ participation in consumer-initiated OBCs. Managers must be aware that an

213 | P a g e
appropriate online branding strategy should consider the differential effect from the three
dimensions of social capital (i.e. communication, relational and cognitive) upon brand
knowledge in terms of brand awareness and brand image. The quality of information
exchange (the communication dimension) is found to have a strong effect on brand
knowledge. Shared language (the cognitive dimension) can enhance the OBC members’
abilities to accumulate effective brand knowledge. The relational dimension of social
capital has less effective impacts upon brand knowledge compared to the above two
dimensions. Only a consumer’s identification with the community can strengthen his/her
understanding and confidence with the brand, in turn, to increase their brand awareness
and brand image. However, the commitment of the relational dimension is found to have
a positive effect on brand image but not on brand awareness; it still tells the managers
that commitment can enhance consumers’ overall perception and attitude towards a
specific brand.
6.3.2 Contribution to community leaders from consumer-initiated OBCs
In this study, brand knowledge plays a significant role in sustaining a consumer-initiated
OBC, because the members are volunteered to participate in the OBC activities and are
willing to share their experience or stories without paying any membership fee. Brand
knowledge is regarded as the major reason that drives people to participate in an OBC.
Community leaders interested in developing effective brand knowledge should develop
strategies that encourage a consumer to utilize his/her social capital during the
community discussion. In addition, strong identification and commitment can also
enhance consumers’ brand images within OBCs.
Apart from brand knowledge, the consumer-to-consumer relationship is another
fundamental element to a community’s survival. Most of the consumer-initiated OBCs
are organised and facilitated entirely by enthusiastic consumers with no company
involvement. At this point, social capital theory is a useful framework for community
leaders to understand the interactive relationships among consumers. Social capital acts
as a conduit by providing social ties for the community members to gain access to
broader sources of information to improve the quality of shared brand information or
knowledge. At the same time, community members want to establish friendships with
other members. Therefore, the community leaders should develop strategies to strengthen

214 | P a g e
the social relationships among members, for example, they can arrange some face-to-face
meetings and invite the top active members to share and contribute their brand
information and experience and hold some offline events as a way to enhance consumers’
interaction with others members and the community.
6.4 Limitations of this study
Although the findings are encouraging and useful, this present study is subject to several
limitations that should be addressed in future research as follows.
Single research domain
In this study, the data was collected from OBC members of Xcar.com, which only focus
on the automobile industry. Thus the analyses based on this single research area may not
be applicable to other types of industry or product categories. However, it is noted that
focusing on a single product category provides more in-depth information than is
possible from cross-sectional analyses. On the other hand, the chosen consumer-initiated
OBCs in this study in China are mostly forum communities that are information-and-
discussion oriented. Thus, the features and structures of OBCs may differ in other
countries. In the future, it would be interesting to extend the OBC studies outside the
automobile industry.
The survey participants of this study were drawn from a very specific population, the
members of Volkswagen's consumer-initiated OBCs on Xcar.com, and therefore
excluded OBC members outside Xcar.com. It was a relatively homogenous demographic
with the majority of respondents male (80 per cent), with higher education (51 per cent of
them have a Bachelor degree), and over 50 per cent of them were aged between 25 and
34. Thus the survey findings cannot be generalized to the whole population of China's
automobile market.
Issues with the communication dimension of social capital
One of the contributions of this study is to introduce a communication dimension as the
fourth dimension of social capital within the context of OBCs. This communication
dimension is manifested as the quality and quantity of information exchange, and this
study is the first time it has been empirically measured. The results confirm that the
communication dimension is well assessed through quality and quantity of information
215 | P a g e
exchange. Quality of information exchange exerts a strong positive effect on brand
knowledge. However, the quantity of information exchange is found to have no direct
effect on brand knowledge. According to the results from correlation analysis, the
quantity of information exchange is correlated with other variables, such as interaction
ties (the structural dimension) and identification and commitment (the relational
dimension). This result suggests that the quantity of information may have an indirect
effect upon brand knowledge. Therefore, it is worth exploring the inter-relationship
among the dimensions of social capital in future research.
On the other hand, due to the limited access to the participants’ personal profiles, the
author is unable to retrieve the total number of respondent postings, and has to rely on the
use of self-reported data for measuring the quantity of information exchange. The
findings may therefore be interpreted with this limitation in mind, which could be
another reason for the insignificant relationship between the quantity of information
exchange and brand knowledge. Future research is suggested to assess the effectiveness
of the quantity of information exchange and in turn to ensure the total effect of the
communication dimension of social capital upon brand knowledge.
Issues with the structural dimension of social capital
Apart from the quantity of information exchange, interaction ties (the structural
dimension) are not found to have a direct effect upon brand knowledge either. The
correlation result also shows that interaction ties are correlated with the other three
dimensions of social capital (i.e. shared language, identification, commitment, the quality
and quantity of information exchange). Similar to the quantity of information exchange,
the interaction ties may manifest other indirect effects upon brand knowledge through
other dimensions of social capital.
The lack of a qualitative methodology
Another limitation of this study is the lack of qualitative methodology. A qualitative
approach could provide a deeper understanding of social phenomena than what would be
obtained from purely quantitative approach. As the study of social capital in OBC
settings were not previously well researched, the potential richness in information
gathered through a qualitative approach could help the researcher to elicit deeper insights
into the effectiveness of social capital through the OBC members' subjective experience.
216 | P a g e
6.5 Recommendations for future research
Apart from looking back on the research, this study also recommends future research.
These research recommendations are partly based on the shortcomings of this study, and
partly based on the findings, which suggest future exploration or testing.
Overcoming the single research domain
This present study has established a significant positive relationship between social
capital and brand knowledge within the same context of a consumer-initiated OBC,
which only focuses on the Volkswagen brand. It would be interesting to investigate
whether social capital can exert effects upon brand knowledge in other product categories
or service brands compared to the automobile industry. Prior research indicates that OBC
has been taken into a wider range of industries, such as beverages (Coca-Cola), personal
digital products (Apple, Samsung), movies (Star Wars) and even authors (Shakespeare
and Jack Kerouac). Future research is needed to investigate the contribution of social
capital towards OBCs from different fields.
In addition, the chosen communities in this empirical study are mainly information-and-
discussion oriented, which lack generality. Following the discussion in literature, OBCs
involve different types of activities, including transactions, gaming, social relationships,
service to society etc (Sung and Lim, 2002). A consumer’s participation is determined by
these activities. Thus future research can test the “Social Capital and Brand Knowledge”
model in a wider selection of OBC activities to prove its generality.
Further investigation of inter-relationship among each dimension of social capital
In order to investigate the inter-relationships among each dimension of social capital,
future studies would gain from adding a number of paths within their investigative
framework. There can be other possible forms of relationships among these variables
within the present research. This study is among the earliest that examines the causal
relationship between social capital and a consumer’s brand knowledge. The inter-
relationship among each dimension of social capital is not examined. Interaction ties (the
structural dimension) and quantity of information exchange (the communication
dimension) are found to have no direct effect upon brand knowledge. Likewise,
commitment (the relational dimension) is only found to have a direct effect on brand
awareness but not on brand image. These facets may have indirect effects through other
217 | P a g e
dimensions of social capital. Hence, future studies could consider inter-relationships
among different variables, and will then be able to assess the total effect from each
dimension of social capital upon brand knowledge in terms of brand awareness and brand
image.
Incorporating the qualitative method for future research
In future research, the researcher could take a participation observation method
(Saunders and Lewis, 2012). In this method, the researcher acts in the role of observer-
as-participant, which is still primarily observing, but the research purpose will be known
or informed to the participants, allowing the researcher to have some interactions with
informants and enrich the data. Future research would include semi-structured interviews
with survey respondents to investigate community member behaviours, perceptions and
experiences of OBCs in depth.
6.6 Final thoughts
This present study is the first to bring social capital theory to OBC studies, and is also
cross-disciplinary in that it brings social capital and brand knowledge into the context of
consumer-initiated OBCs. Social capital provides interaction ties for OBC members and
helps them gain access to broader sources of brand information and knowledge; it brings
information benefits which allow consumers to improve the effectiveness of their shared
information of the focal brand or product; it also bring social benefits for OBC members
which can increase a consumer’s access to social support from other fellow members and
establish personal relationships with others. Most importantly, the context specific
“Social Capital and Brand Knowledge” model provides insights into three dimensions of
social capital (the cognitive, relational and communication dimensions) that do have
positive direct effects upon brand knowledge through consumers’ participation in OBC
activities.
This research calls for both managers and community leaders to be aware of the social
aspects of OBCs, and the contribution of social capital to a community’s development
and survival. Understanding the use of social capital in OBCs helps managers to develop
their OBC strategy to enhance their relationship with customers and develop effective
brand knowledge. Social capital also provides insights into consumer-initiated OBCs for

218 | P a g e
community leaders, thus showing the power of social relationships among members in
sustaining the community.
219 | P a g e
References
Aaker, D. A. (1991). Managing Brand Equity New York: Macmillan.
Aaker, D. A. (1996). Measuring Brand Equity Across Products and Markets. California
Management Review, 38(3), 102-120.
Aaker, J. L. (1997). Dimensions of Brand Personality. Journal of marketing Research, 34(3),
347-356.
Alder, P. S., and Kwon, S. W. (2002). Social Capital: Prospects for a new concept. Academy
of Management Review, 27, 17-40.
Aldrich, H. E., and Zimmer, E. R. (1986). Entrepreneurship through Social Network. In L.
Sexton D and W. Smilor R (Eds.), In the Art and Science of Entreneurship.
Cambridge: Mass: Ballinger.
Algesheimer, R., Dholakia, U. M., and Herrmann, A. (2005). The Social Influence of Brand
Community: Evidence from European Car Clubs. Journal of Marketing, 69, 19-34.
Alimen, N., and Cerit, A. G. (2010). Dimensions of brand knowledge: Turkish university
students’ consumption of international fashion brands. Journal of Enterprise
Information Management, 23(4), 538-558.
Almquist, E., and Roberts, K. J. (2000). A ‘mindshare’ manifesto. Mercer Management
Journal, 12, 9-20.
Amine, A., and Sitz, L. (2004). How does a virtual brand community emerge? Some
implications for marketing research. Unpublished Research Paper. University of
Paris.
Andersen, A. R., and Jack, S. L. (2002). The Articulation of Social Capital in
Entrepreneurial Networks: A Glue or Lubricant? . Entrepreneurship and Regional
Development, 14, 193-210.
Andersen, P. H. (2005). Relatioship Marketing and Brand Involvement of Professionals
through Web-enhanced Brand Communities: the Case of Coloplast. Industrial
Management and Data System, 34(1), 39-51.
Anderson, J. C., and Gerbing, D. W. (1988). Structural Equation Modeling in Practice: A
Review and Recommended Two-Step Approach. Psychological Bulletin, 103(3),
411-423.

220 | P a g e
Anderson, J. C., and Narus, J. A. (1990). A model of distribution firm and manufacturer firm
working partnerships. Journal of Marketing, 54(1), 42-58.
Andrews, D., Nonnecke, B., and Preece, J. (2003). Electronic survey methodology: a case
study in reaching hard-to-involve Internet usres. International Journal of Human-
Computer Interaction, 16(2), 185-210.
Armstrong, A., and Hagel, J. (1996). The real value of online communities. Harvard
Business Review, 134-140.
Arnould, E. J., and Price, L. L. (1993). River Magic: Extraordinary Experience and the
Extended Service Encounter. Journal of Consumer Research, 20(June), 24-25.
Arora, R., and Stoner, C. (2009). A mixed method appraoch to understanding brand
personality. Journal of Product and Brand Management, 18(4), 272-283.
Arregle, J. L., Hitt, M. A., Sirmon, D. G., and Very, P. (2007). The Development of
Organisational Social Capital: Attributes of Family Firms. Journal of Management
Studies, 44, 73-95.
Atuahene-Gima, K., and Murray, J., Y. . (2007). Exploratory and Exploitative Learning in
New Product Development: A Social Capital Perspective on New Technology
Ventures in China. Journal of International Marketing, 15(2), 1-29.
Babbie, E. R. (2004). The practice of social research (7th Edition ed.). Belmont: Wadsworth
Publishing.
Bagozzi, R. P., and Dholakia, U. M. (2006). Antecedents and purchase consequences of
customer participation in small group brand communities. International Journal of
Research in Marketing, 23(1), 45-61.
Baker, W. E. (2000). What is Social Capital, and Why Should You Care About It? In
Achieving Success Through Social Capital: Tapping the Hidden Resources in Your
Personal and Business Networks: University of Michigan Business School.
Batt, P. J. (2008). Building social capital in networks. Industrial Marketing Management,
37, 487-491.
Bauer, H., H., and Grether, M. (2005). Virtual Community: Its Contribution to Customer
Relastionships by Providing Social Capital. Journal of Relastionship Marketing, 4(1-
2), 91-109.

221 | P a g e
Bender, T. (1978). Community and Social Change in America. New Brunswick: NJ:Rutgers
University Press.
Berthon, P., Pitt, L. F., and Campbell, C. (2009). Does brand meaning exist in similarity or
singularity? Journal of Business Research, 62, 356-361.
Bhattacharya, C. B., Hayagreeva, R., and Glynn, M. A. (1995). Understanding the bond of
indentification: An investigation of its correlates among art museum members.
Journal of Marketing, 59(4), 46-57.
Blackwell, R. D., Miniard, P. W., and Engel, J. F. (2006). Consumer Behaviour. Mason:
International Thomson Publishing.
Blanchard, A., and Horan, T. (1998). Virtual communities and social capital. Social Science
Computer Review, 16(3), 293-307.
Bourdieu, P. (1985). The Forms of Capital In: Handbook of Theory and Research for the
Sociology of Education. NewYork: Greenwood.
Bourdieu, P. (1986). The forms of social capital In J. G. Richadson (Ed.), Handbook of
Theory and Research for the Sociology of Education. Westport: CT: Greeenwood
Press.
Bowerker, D., and Dillam, D. A. (2000). An experimental evaluation of left and right
oriented screens for web questionnaires Paper presented at the Annual Meeting of
the American Association for Public Opinion Research (AAPOR).
Braa, K., and Vidgen, R. (1999). Interpretation, Intervention and Reduction in the
Organisational Laboratory: a Framework for In-Context Information System
Research Accounting Management and Information Technologies, 9, 25-47.
Bryman, A. (2004). Social Research Methods (2nd ed.). Oxford: Oxford University Press.
Bryman, A., and Bell, E. (2003). Business Research Methods. Oxford: Oxford University
Press.
Byrne, B. M. (2001). Structural Equation Medeling with AMOS: Basic concepts,
Applications, and Programming. London: Lawrence Erlbaum Associates.
Burt, R. S. (1992). Structure Holes: The Social Structure of Competition. Cambridge:
Harvard University Press.

222 | P a g e
Burt, R. S. (2007). Secondhand Brokerage: Evidence on the Importance of Local Structure
for Managers, Bankers, and Analysts. Academy of Management Studies, 43, 1727-
1752.
Burt, R. S., and Knez, M. (1995). Third Party Effects on Trust. Rationality and Society., 7,
255-292.
Casaló, L., V. , Flavian, C., and Guinaliu, M. (2007). The impact of participation in virtual
brand communities on consumer trust and loyalty: the case of free software. Online
Information Review, 31(6), 775-792.
Casaló, L., V. , Flavian, C., and Guinaliu, M. (2010). Some antecedents and effects of
participation in Spanish virtual brand communities. International Journal of Web
Based Communities, 6(1), 25-42.
Casaló, L., V. , Flavián, C., and Guinalíu, M. (2008). Promoting Consumer’s Participation in
Virtual Brand Communities: A New Paradigm in Branding Strategy. Journal of
marketing Communications, 14(1), 19-36.
Chan, C. M. M. (2008). Just CC Everyone! The Role of Communication Channel in Social
Capital Mobilization. City University of Hong Kong, Hong Kong.
Chang, H. H., and Chuang, S. S. (2010). Social Capital and Individual Motivations on
Knowledge Sharing: Participant Involvement as A Moderator. Journal of
Information and Management, Nov.
Chang, P.-L., and Chieng, M.-H. (2006). Building Consumer-Brand Relationships: A Cross-
Cultural Experiential View. Psychology and Marketing, 23(11), 927-959.
Chen, A. C.-H. (2001). Using Free Association to Examine the Relationship Between the
Characteristics of Brand Associations and Brand Equity. Journal of Product and
Brand Management, 10(6), 439-451.
Chen, J.-S., Ching, R., Tsai, H.-T., and Kuo, Y.-J. (2008). Blog Effects on Brand Attitude
and Purchase Intention [Electronic Version],
Chen, R., and He, F. (2003). Examination of brand knowledge, perceived risk and
consumers’ intention to adopt an online retailer. Total Quality Management and
Business Excellence, 14(6), 677.
223 | P a g e
Chetty, S., and Agndal, H. (2007). Social Capital and Its Influence on Changes in
Internationalization Mode Among Small and Medium-Sized Enterprises. Journal of
International Marketing, 15(1), 1-29.
Cheung, M.-C., and Chan, A. S. (2009). Measures for Brand Knowledge: Comparison of
Testing Formats, Languages and Product Categories Paper presented at the The 10th
Asian Textile Conference (ATC), Japan.
Chiu, C. M., Hsu, M. H., and Wang, E. T. G. (2006). Understanding knowledge sharing in
virtual communities: an integration of social capital and social cognitive theories
Decision Support System, 42, 1872-1888.
Choi, J. H. (2006). Living in Cyworld: Contextualising Cy-Ties South Korea. . In A. Bruns
and J. Jacobs (Eds.), Use of Blogs (Digital Formations) (pp. 173-186). New York:
Peter Lang.
Chung, M., and Shin, S. K. (2011), Relationship Development Process in Brand Community:
From the consumer-consumer-company triad perspective, Paper presented on AMCIS
Proceedings
CNNIC. (2010). Statistic Report on Internet Development in China (26th) China Internet
Network Information Centre (CNNIC)
CNNIC. (2012). Statistic Report on Internet Development in China (30th) China Internet
Network Information Centre (CNNIC)
Cohen, A. P. (1985). The Symbolic Construction of Community New York: Routledge.
Cohen, D., and Prusak, L. (2001). In Good Company: How Social Capital Makes
Organisations Work. Massachusetts: Harvard Business School Press.
Coleman, J. S. (1988). Social capital in the creation of human capital. The American Journal
of Sociology, 94, S95-S120.
Coleman, J. S. (1990). Foundations of Social Theory. Cambridge.
Copper, D. R., and Schindler, P. S. (2006). Business Research Methods (9th Edition ed.).
Boston: McGraw-Hill Irwin.
Couper, M. P. (2000). Review: web surveys: a review of issues and approaches. The Public
Opinion Quarterly, 64(4), 464-494.

224 | P a g e
Couper, M. P. (2000). Web-based surveys: A review of issues and approaches Public
Opinion Quarterly, 64(4), 464-494.
Couper, M. P., and Miller, P. V. (2008). WEB SURVEY METHODS. Public Opinion
Quarterly, 72(5), 831-835.
Cova, B., and Pace, S. (2006). Brand Community of Convenience Products: New Forms of
Customer Empowerment - the Case “My Nutella The Community”. European
Journal of Marketing, 40(9/10), 1087-1105.
Creswell, J. W. (2003). Research Designs: qualitative, quantitative, and mix methdos
approaches (2nd ed.). Thousand Oaks: CA:Sage.
Cronin, B. (1995). The Scholar’s Courtesy: the Role of Acknowledgement in the Primary
Communication Process London: Taylor Graham.
Cummings, S., Heeks, R., and Huysman, M. (2006). Knowledge and learning in online
networks in development: a social-capital perspective. Development in Practice,
16(6).
Cutlip, S. M., Broom, G. M., and Center, A. H. (1999). Effective Public Relations (8th ed.).
Upper Saddle River: NJ: Prentice Hall.
Daniel, B., Schwiser, R. A., and McCalla, G. (2003). Social Capital in Virtual Learning
Communities and Distributed Communities of Practice. Canadian Journal of
Learning and Technology, 29(3).
de Valck, K., van Bruggen, G. H., and Wierenga, B. (2009). Virtual communities: A
marketing perspective. Decision Support Systems, 47(3), 185-203.
Deighton, J., and Barwise, P. (2001). Digital Marketing Communication. In J. Wind and V.
Mahajan (Eds.), Digital Marketing (pp. 339-361). New York: John Wiley.
De Vaus, D. A. (2001). Research Design in Social Research. London: Sage.
Dew, L., and Kwon, W.-S. (2010). Exploring of Apparel Brand Knowledge: Brand
Awareness, Brand Association, and Brand Category Structure. Clothing and Textiles
Research Journal 28(1), 3-18.
Dillman, D. A. (2000). Mail and Internet Surveys: The Tailored Design Method. New York:
John Wiley and Sons.

225 | P a g e
Driesener, C., and Romaniuk, J. (2006). Comparing methods of brand image measurement.
International Journal of Market Research, 48(6), 681-698.
Durlauf, S. (2002). On the Empirics of Social Capital Economic Journal 112(483), 459-479.
Easton, G., and Araujo, L. (1992). Non-Economic Exchange in Industrial Networks. In B.
Axelsson and G. Easton (Eds.), Industrial Networks: A New View of Reality. GB:
Routledge.
Ellemers, N., Kortekaas, P., and Ouwerkerk, J. W. (1999). Self-categorization, commitment
to the group and group self-esteem as related but distinct aspects of social identity.
European Journal of Social Psychology, 29(2-3), 371-389.
Ellison, N. B., Steinfield, C., and Lampe, C. (2007). The benefits of Facebook “friends”:
social capital and colledge students’ use of online social network sites. Journal of
Computer-Mediated Communication, 12, 1143-1168.
Elliott, R., and Percy, L. (2007). Strateguc Brand Management Oxford: Oxford University
Press.
Fernback, J. (1999). There is a there there: Notes toward a definition of cybercommunity. In
S. Jones (Ed.), Doing Internet Research: Critical Issues and Methods for Examing
the Net. London: Sage Publication Ltd.
Frazer, L., and Lawley, M. (2000). Questionnaire Design and administrtion: A Practical
Guide. Brisbane: John Wiley.
Field, J. (2003). Social Capital. New York: Routledge.
Fill, C. (2009). Marketing Communications: Interactivity, Communities and Content (5th
Eds ed.). Harlow: Pearson Education Limited.
Flap, H. D. (1995). Getting a Job (Revised Edition ed.). Chicago: University of Chicago
Press.
Fountain, J. E. (1998). Social Capital: Its Relationship to Innovation in Science and
Technology Science and Public Policy, 25(2), 103-107.
Fournier, S., and Lee, L. (2009). Getting Brand Communities Right. Harvard Business
Review, 87(4), 105-111.
Fukuyama, F. (1999). Social Capital and Civil Society. Paper presented at the IMF
Conference on Second Generation Reforms.

226 | P a g e
Füller, J., Matzler, K., and Hoppe, M. (2008). Brand Community Members as a Source of
Innovation. Journal of Product Innovation Management, 25(6), 608-619.
Gabbay, S. M., and Leenders, R. T. A. J. (1999). CSC: the Structure of Advantages and
Disadvantages. . In R. T. A. J. Leenders and S. M. Gabbay (Eds.), Corporate Social
Capital and Liability. London: Kluwer Academic Publishers.
Gill, M. S., and Dawra, J. (2010). Evaluating Aaker’s sources of brand equity and the
mediating role of brand image. Journal of Targeting, Measurement and Analysis for
Marketing, September, 1-10.
Goodwin, N. R. (2003). Five Kinds of Capital: Useful Concepts for Sustainable Dvelopment.
Tufts University.
Granovetter, M. (1973). The Strength of Weak Ties. American Journal of Sociology, 78(6),
1360-1380.
Granovetter, M. (1974). Getting a job: A study of contacts and careers Chicago: University
of Chicago Press.
Granovetter, M., and Swedberg, R. (1992). The Sociology of Economic Life. Boulder, CO:
Westview Press.
Gruen, T., W., Osmonbekov, T., and Czaplewski, J. (2005). How e-communication extend
the concept of exchange in marketing: An application of the motivation, opptunity,
ability (MOA) theory. Marketing Theory, 5(1), 33-49.
Gulati, R., Norhria, N., and Zaheer, A. (2000). Strategic Networks. Strategic Management
Journal, 21, 203-215.
Gupta, S., Melewar, T. C., and Bourlakis, M. (2010). Transfer of brand knowledge in
business-to-buiness markets: a qualitative study. Journal of Business and Industrial
Marketing, 25(5), 395-403.
Gusfield, J. (1978). Community: A Critical Response. New York: Harper and Row.
Gustafsson, A., Johnson, M. D., and Roos, I. (2005). The Effects of Consumer Satisfaction,
Relationship Commitment Dimensions, and Triggers on Consumer Retention.
Journal of Marketing 69(October), 210-218.
Hagel, J., and Armstrong, A. (1997). Net Gain: Explaining Markets throug Virtual
Communities. Boston, MA: Harvard Business School Press.

227 | P a g e
Hair Jr., J., F. , Money, A., H., Samouel, P., and Page, M. (2007). Research Methods for
Business Chichester: John Wiley and Sons Ltd.
Hamre, L. J. (2008). Exporing the use of social capial to support technology adoption and
implementation. University of Bath, Bath.
Haythornwaite, C. (2002). Strong, weak, and latent ties and the impact of new media. The
Information Society, 18, 385-401.
Haythornwaite, C., Wellman, B., and Garton, L. (1998). Work and community via computer-
mediated communication. In J. Gackenbach (Ed.), In Psychology of the Interent (pp.
199-226). San Diego: CA: Academic Press.
Hazleton, V., and Kennan, W. (2000). Social capital: reconceptualizing the bottom line.
Corporate Communication: An International Journal, 5(2), 81-86.
Hazleton, V., and Kennan, W. (2006). Internal Public Relations, Social Capital, and the Role
of Effective Orgnisational Communication. In C. Botan and V. Hazleton (Eds.),
Public Relation Theory II (pp. 311-338). Mahwah: NJ: Lawrence Erlbaum
Associates.
Heath, R. L. (2001). Shifting Foundations: Public Relations as Relationship Building. In R.
L. Heath (Ed.), Handbook of Public Relations: Thousand Oaks, CA:Sage.
Hersberger, J., A. , Murray, A., L. , and Rioux, K., S. (2007). Examining information
exchange and virtual communities: an emergent framework. Online Information
Review, 31(2), 135-147.
Hsieh, M.-H., and Tsai, K.-H. (2007). Tehcnological Capability, Social Capital and the
Launch Strategy for Innovative Products. Industrial Marketing Management, 36,
493-502.
Hsu, C., & Cai, L. A. (2009). Brand Knowledge, Trust and Loyalty - A Conceptual Model of
Destination Branding. Paper presented at the International CHRIE Conference
Retrieved from
http://scholarworks.umass.edu/cgi/viewcontent.cgi?article=1110&context=refereed
Hughes, J., and Sharrock, W. (1997). The Philosophy of Social Research (3rd ed.). London:
Longman.
228 | P a g e
Hung, K., Gu, F. F., and Tse, D. K. (2005). Improving Media Decisions in China. Journal of
Advertising, 4(1), 49-64.
Hung, K. H., and Yiyan Li, S. (2007). The Influence of eWOM on Virtual Consumer
Communities: Social Capital, Consumer Learning, and Behavioral Outcomes.
Journal of Advertising Research, 47(4), 485-495.
Hoffe, J., Lan, K., and Nam, V. M. (2003). Branding Cars in China, The Mckinsey Quarterly,
4.
Huotari, M.-L. (2000). Information behaviour in value constellation. An example from the
context of higher education. Swedish Library Research, 3(4), 3-20.
Ihlen, φ. (2005). The power of social capital: Adapting Bourdieu to the study of public
relations. Public Relations Review, 31, 492-496.
Inkpen, A. C., and Tsang, E. W. K. (2005). Social Capital, Networks, and Knowledge
Transfer. Academy of Management Review, 30(1), 146-165.
Jacobs, J. (1961). The death and life of great American cities New York Random House.
Jang, H., Olfman, L., Ko, I., Koh, J., and Kin, K. (2008). The Influence of On-Line Brand
Community Characteristics on Community Commitment and Brand Loyalty.
International Journal of Electronic Commerce, 12(3), 57-80.
Jeppesen, L. B., and Frederiksen, L. (2006). Why Do Users Contribute to Firm-Hosted User
Communities? The Case of Computer-Controlled Music Instruments. Organisation
Science, 17, 45-63.
Jonassen, D. H. (1999). Creating Technology-supported Learning Communities. In C. M.
Reigeluth (Ed.), Instructional-design Theories and Models: A new paradigm of
instructional theory. Mahwah: Lawrence Erlbaum Associates Inc.
Kang, M. S. (2004). The Establishment of Online Brand Community for CRM. Marketing
Kaplan, M. D. (2007). Product Appearance and Brand Knowledge: An Analysis of Critical
Relationships. Izmir University of Economics, Izmir.
Kapferer, J.-N. (2004). The New Strategic Brand Management: Creating and Sustaining
Brand Equity Long Term. London: Kogan Page.

229 | P a g e
Kaynak, E., Salman, G. G., and Tatoglu, E. (2007). An integrative framework linking brand
associations and brand loyalty in professional sports. Brand Management, 15(5),
336-357.
Keller, K. L. (1993). Conceptualizing, Measuring, and Managing Customer-Based Brand
Equity. Journal of Marketing, 57, 1-22.
Keller, K. L. (2003). Brand Synthesis: The Multidimensionality of Brand Knowledge.
Journal of Business Research, 29, 595-600.
Keller, K. L. (2009). Building strong brands in a modern marketing communications
environment. Journal of Marketing Communications, 15(2/3), 139-155.
Keller, K. L., Sternthal, B., and Tybout, A. (2002). Three Questions You Need to Ask About
Your Brand. Harvard Business Review, 80(9), 80-86.
Kennan, W., Hazleton, V., Janoke, M., and Short, M. (2008). The Influence of New
Communication Technologies on Undergraduate Preferences for Social Capital
Formation, Maintenance, and Expenditure. Public Relations Journal, 2(2).
Kim, P. H., and Aldrich, H. E. (2005). Social Capital and Entrepreneurship. Foundations
and Trends in Entrepreneurship, 1(2).
Kim, J. H., Bae, Z. T., and Kang, H. S. (2008). The Role of Online Brand Community in
New Product Development: Case Studies on Digital Product Manufactures in Korea.
International Journal of Innovation Management,12(3), 357-376.
Kim, J. W., Choi, J., Qualls, W., and Han, K. (2008). It takes a marketplace community to
raise brand commitment: the role of online communities. Journal of Marketing
Management, 24(3/4), 409-431.
Koh, J., and Kim, D. (2004). Knowledge sharing in virtual communities: an e-business
perspective. Expert Systems with Applications, 26, 155-166.
Koh, J., Kim, Y.-G., Butler, B., and Bock, G.-W. (2007). Encouraging participation in
virtual communities. Communication of ACM, 50(2), 68-73.
Koka, B. R., and Prescott, J. E. (2002). Strategic Alliance as Social Capital: A
Multidimensional View. Strategic Management Journal, 23, 795-816.
Kosonen, M. (2009). Knowledge sharing in virtual communities - a review of the empirical
research Journal of Web Based Communities, 5(2), 144-163.

230 | P a g e
Kotler, P., and Keller, K. L. (2009). Marketing Management (13th ed.). Upper Saddle River,
NJ: Prentice-Hall
Kozinets, R. V. (1999). E-tribalized marketing?: the strategic implications of virtual
communities of consumption. European Management Journal, 17(3), 252-264.
Kozinets, R. V. (2002). The field behind the screen: using netnography for marketing
research in online communities Journal of marketing Research, 39(1), 61-72.
Krause, D. R., Handfield, R. B., and Tyler, B. B. (2007). The Relationships between
Supplier Development, Commitment, Social Capital Accumulation and Performance
Improvement. Journal of Operations Management, 25(2), 528-545.
Larson, A. (1992). Network days in entrepreneurial settings: a study of governance of
exchange relationships. Administrative Science Quarterly, 37(1), 76-104.
Lawson, B., Tyler, B. B., and Cousins, P. D. (2008). Antecedents and Consequences of
Social Capital on Buyer Performance Improvement. Journal of Operations
Management, 26, 446-460.
Lee, C., Lee, K., and Penning, J. M. (2001). Internal Capabilities, External Networks, and
Performance: A Study on Tehcnology-Based Ventures. Strategic Management
Journal, 22((6/7)), 615-640.
Lee, J., and Lee, H. (2010). The computer-mediated communication network: exploring the
linkage between the online community and social capital. New Media and Society, 1-
17.
Lewicki, R. J., and Bunker, B. B. (1996). Developing and maintaining trust in work
relationships. In R. M. Kramer and T. R. Tyler (Eds.), Trust in Organisations.
London: Sage Publications.
Liao, J. W., and Welsch, H. (2005). Roles of social capital in venture creation: key
dimensions and research implications. Journal of Small Business Management, 43(4),
345-362.
Liaw, G.-F., and Jen, F. (2008). A study on the influence of consumers’ participation in a
brand community on their purchase intension. Paper presented at the 8th Global
Conference on Business and Economics.
231 | P a g e
Lichtenberg, J. (2006). Risk free social nework marketing [Electronic Version], from
http://www.imediaconnection.com/content/11329.imc
Llieva, J., Baron, S., and Healey, N. M. (2002). Online Surveys in Marketing Research: Pros
and cons. International Journal of Market Research, 44(3), 361-367.
Lin, N. (1999a). Building a Network Theory of Social Capital. Connections 22(1), 28-51.
Lin, N. (2001). Social capital: A Theory of Social Structure and Action. New York:
Cambridge University Press.
Littau, J. (2009). The Virtual Social Capital of Online communities University of Missouri.
Low, G. S., and Lamb Jr, C. W. (2000). The measurement and dimensionality of brand
associations Journal of Product and Brand Management, 9(6), 350-368.
Lumsden, L. (2006). The development of tools to measure and describe social capital in
specific communities in organisations. Griffith University.
Lu, Y., and Yang, D. (2010). Information Exchange in Virtual Communities under Extreme
Disaster Conditions. Decision Support Systems, In Press, Accepted Manuscript.
Marsden, P., and Campbell, K. E. (1984). Measuring tie strength. Social Forces, 63, 482-501.
Matzler, K., Pichler, E., Füller, J., and Mooradian, T. A. (2011). Personality, Person-brand
fit, and brand community: An investigation of individuals, brands, and brand
communities. Journal of Marketing Management, 1-17.
Market Analysis Report: China's Automobile Industry. (2010), APCO Worldwide.
McAlexander, J. H., Kim, S. K., and Roberts, S. D. (2003). LOYALTY: THE INFLUENCE
OF SATISFACTION AND BRAND COMMUNITY INTEGRATION. Journal of
Marketing Theory and Practice, 11(4), 1-11.
McAlexander, J. H., Schouten, J. W., and Koening, H. F. (2002). Building brand
communities. Journal of Marketing, 66(1), 38-55.
McFadyen, M. A., and Cannella Jr, A. A. (2004). SOCIAL CAPITAL AND KNOWLEDGE
CREATION: DIMINISHING RETURNS OF THE NUMBER AND STRENGTH
OF EXCHANGE RELATIONSHIPS. Academy of Management Journal, 47(5), 735-
746.
McWilliam, G. (2000). Building Strongger Brands through Online Communities. Sloan
Mnanagement Review.
232 | P a g e
Merlo, O., Bell, S. J., Bülent, M., and Whitwell, G., J. (2006). Social Capital, Customer
Service Orientation and Creativity in Retail Stores. Journal of Business Research, 59,
1214-1221.
Mingers, J., and Brocklesby, J. (1997). Multimethodology: Toward a framework for mixing
methdologies. International Journal of Management Science, 25(5), 485-509.
Moran, P. (2005). Structural vs. Relational Emeddeness: Social Capital and Managerial
Performance. Strategic Management Journal, 26, 1129-1151.
Morgan, R. M., and Hunt, S. D. (1994). The commitment-trust theory of relationship
marketing. Journal of Marketing, 58(July), 20-38.
Muniz, A. M. J., and O’Guinn, T. C. (2001). Brand Community. Journal of Consumer
Research, 27(4), 412-432.
Muniz, A. M. J., and Schau, H. J. (2005). Religiosity in the Abandoned Apple Newton
Brand Community. Journal of Consumer Research, 31(4), 737-747.
Nahapiet, J., and Ghoshal, S. (1998). Social capital, intellectual capital and the
organisational advantage. Academy of Management Review, 23(2), 242-266.
Nandan, S. (2005). An exploration of the brand identity-brand image linkage: A
communications perspective. Journal of Brand Management, 12(4), 264-278.
Narayan, D., and Pritchett, L. (1997). Cents and Sociability: Household Income and Social
Capital in Rural Tanzania Washington, DC: World Bank.
Nie, N., Hillygus, D. S., and Erbring, L. (2002). Internet use, interpersonal relations and
sociability: A time diary study. In B. Wellman and C. Haythornwaite (Eds.), The
Internet in Everyday Life. Malden: MA: Blackwell.
Nigel, F., Lee, R. M., and Blank, G. (Eds.). (2008). The Sage Handbook pf Online Research
Methods. London: Sage Publications Ltd.
Oakenfull, G. K., and McCarthy, M. S. (2010). Examining the relationship between brand
usage and brand knowledge structures. Journal of Brand Management, 17(4), 279-
288.
Oh, Y. S., and Kim, S., H. (2004). A Marketing Branding Strategy through Online
Communities. Korea Telecommunications Policy, 16(12), 20-37.

233 | P a g e
Orlikowski, W. J., and Baroudi, J. J. (1991). Studying Information Technology in
Organisations: Research Approaches and Assumptions. Information Systems
Research, 2(1-28).
Ouwersloot, H., and Odekerken-Schroder, G. (2008). Who’s who in brand communities -
and why? European Journal of Marketing, 42(5/6), 571-585.
Pallant, J. (2007). SPSS Survival Manual: A Step-by-Step Guide to Data Analysis Using
SPSS version 15. Maidenhead: Open University Press.
Palmer, A., and Koenig-Lewis, N. (2009). An entended, community focused, experiential
framework for relationship marketing Journal of Customer Behaviour, 8(1), 85-96.
Papaakyriazis, N., and Boudourides, M. (2001). Electronic Weak Ties in Network
Organisations. Paper presented at the 4th GOR Conference.
Pappu, R., Quester, P. G., and Cooksey, R. W. (2005). Consumer-based brand equity:
improving the measurement – empirical evidence. Journal of Product and Brand
Management, 14(3), 143-154.
Peter, J. P., and Olson, J. C. (2001). Consumer Behaviour. Chicago: Irwin.
Pigg, E. K., and Crank, L. D. (2004). Building Community Social Capital: The Potential and
Promise of Information and Communications Techologies. The Journal of
Community Informatics 1(1), 58-73.
Pitta, D. A., and Fowler, D. (2005). Online communities and their value to new product
developers. Journal of Product and Brand Management, 14(5), 283-291.
Plant, R. (2004). Online communities. Technology in Society, 26, 51-65.
Plummer, J. T. (2000). How personality makes a difference. Journal of Advertising Research,
40 (6), 79-83.
Portes, A. (1998). Social Capital: Its origins and applications in modern sociology. Annual
Review of Sociology, 22, 1-24.
Portes, A., and Sensenbrenner, J. (1993). Embededness and Immigration: Notes on the
Social Determinants of Economic Action. . American Journal of Sociology, 98, 1320-
1350.

234 | P a g e
Preece, J., Nonnecke, B., and Andrews, D. (2004). The top five reasons for lurking:
Improving community experiences for everyone. Computers in Human Behaviour,
20(2), 201-223.
Punch, K. F. (1998). Introduction to Social Research: Quantitative and Qualitative
Approaches: Sage Publications
Putnam, R. D. (1993). Making democracy work: civic traditions in modern Italy. Princeton:
NJ: Princeton University Press.
Putnam, R. D. (1995). Bowlling along: American’s declining social capital. Journal of
Democracy, 6, 65-78.
Putnam, R. D. (2000). Bowling Along: The Collapse and Revival of American Community.
New York: Simon and Schuster.
Quan-Hasse, A., and Wellman, B. (2002). How does the Internet affect social capital.
Forthcoming in Huysman, M and Wulf, V. (Eds). IT and Social Capital, 1-14.
Rafaeli, S., Ravid, G., and Soroka, V. (2004). De-lurking in virtual communities: a social
communication network appraoch to measuring the effects of social capital and
cultural capital Paper presented at the Proceedings of the 37th Hawaii International
Conference on System Sciences.
Ramström, J. (2008). Inter-organisational meets inter-personal: An exploratory study of
social capital processes in relationships between Northern European and ethnic
Chinese firms. Industrial Marketing Management 37(502-512).
Rheingold, H. (1993). Virtual Community: Homesteadung on The Electrinic Frontier.
Cambridge: The MIT Press.
Rheingold, H. (2000). The Virtual Community: Finding Connection in a Computerized
World. London: Secker Warburg.
Rhodes, M. (2009). Examples of online communities in the automotive industry. Retrieved
24th Aug, 2009, from http://www.freshnetworks.com/blog/2009/02/examples-of-
online-communities-in-the-automotive-industry/
Ridings, C. M., Gefen, D., and Arinze, B. (2002). Some Antecedents and Effects of Trust in
Virtual Communities Journal of Strategic Information System, 11(3-4), 271-295.

235 | P a g e
Ring, P. S., and Van de Ven, A. H. (1994). Development process of cooperative
interorganisational relationships. Academy of Management Review, 19(1), 90-118.
Roberts, K., Varki, S., and Brodie, R. (2003). Measuring The Quality of Relationships in
Consumer Services: An Empirical Study. European Journal of Marketing, 37(1-2),
169-196.
Robinson, L. J., Schmid, A. A., and Siles, M. E. (2002). Is Social Capital Really Capital? .
Review of Social Economy, 60(1), 1-21.
Ronald, D., and Fricker, J. (2008). Sampling Methods for Web and E-mail Surveys. In F.
Nigel, R. M. Lee and B. Grant (Eds.), The Sage Handbook of Online Research
Methods. London: Sage Publication Ltd.
Saunders, M., Lewis, P., and Thornhill, A. (2003). Research Methods for Business Students
(3rd ed.). Edinburgh: Pearson Education Limited.
Saunders, M., Lewis, P., and Thornhill, A. (2007). Researchh Methods for Business Students
(4th ed.). Harlow: Prentice Hall Financial Times.
Schau, H. J., and Muniz Jr, A. M. (2002). Brand Communities and Personal Identities:
Negotiations in Cyberspace. Advances in Consumer Research, 29(1), 344-349.
Schmitt, B. H., and Geus, P. (2006). Are brands forever? How brand knowledge and
relationships affect current and future purchases. Journal of Product and Brand
Management, 15(2), 98-105.
Scott, J. K., and Johnson, T. G. (2005). Bowling Along but Online Together: Social Capital
in E-communities. Journal of the Community Development Society, 36(1).
Sheth, J. N., and Atul, P. (1995). Relationship Marketing in Consumer Market: Antecedents
and Consequences. Journal of Academic Marketing Science, 23(4), 255-271.
Sirsi, A., Reingen, P., and Ward, J. (1996). Micro-cultural analysis of variation in sharing of
causal reasoning about behaviour Journal of Consumer Research, 22(4), 345-372.
Sohn, Y. (2005). Opinion Leaders and Seekers in Online Brand Communities: Centred On
Korean Digital Camera Brand Communities. The Florida State University.
Stokburger-Sauer, N. (2010). Brand Community: Drivers and Outcomes. Psychology and
Marketing, 27(4), 347-368.
236 | P a g e
Striukova, L., and Rayna, T. (2008). The Role of Social Capital in Virtual Teams and
Organisations: Corporate Value Creation. International Journal of Networking and
Virtual Organisations 5(1), 103-119.
Saunders, M. and Lewis, P. (2012). Doing Research in Business and Management, Harlow,
Pearson.
Sung, Y. S., and Lim, S. H. (2002). Why work in brand communities. The Korean Journal of
Advertising, 13(5), 159-175.
Sue, V. M., and Ritter, L. (2007). Conducting Online Survey. Thousand Oaks: SAGE
Publications.
Suracharkumtonkun, J., and Patterson, P. (2007). The Role of Social Capital and On-Line
Communities in Enhancing Consumers’ Consumptionn Value [Electronic Version],
from
http://smib.vuw.ac.nz:8081/WWW/ANZMAC2007/papers/J%20Surachartkumtonku
n_1a.pdf
Szmigin, I., Canning, L., and Reppel, A. E. (2005). Online community: enhancing the
relationship marketing concept through customer bonding. International Journal of
Service Industry Management, 16(5), 480-496.
Szulanski, G. (1996). Exploring internal stickiness: Impediments to the transfer of best
practices within the firm. Strategic Management Journal, 17(2), 27-44.
Terjesen, S. A. (2005). Enterpreneurs’s Transitions From Corporate Life To Own Ventures:
Leveraging Human Capital and Soacial Capital To Establish New Ventures.
Cranfield University.
Thomke, S. H., and von Hippel, E. (2002). Customers as Innovators: A New Way to Create
Value Harvard Business Review, 80(4), 74-81.
Thompson, S. A., and Sinha, R. K. (2008). Brand Communities and New Product
Adoption:The Influence and Limits of Oppositional Loyalty. Journal of Marketing,
72, 65-80.
Throsby, D. (1999). Cultural Capital. Journal of Cultural Economics, 23, 3-12.
Tsai, W. (2000). Social Capital, Strategic Relatedness, and the Formation of
Intraorganisational Linkages. Strategic Management Journal, 21, 925-939.

237 | P a g e
Tsai, W., and Ghoshal, S. (1998). Social capital and value creation: the role of intrafirm
networks Academy of Management Journal 42(4), 464-476.
Tsai, Y.-C. (2006). Effects of social capital and absorptive capability on innovation in
Internet marketing. International Journal of Management, 23(1), 157-166.
Uzzi, B. (1996). The Resource and Consequences of Embeddedness for the Economic
Performance of Organisations: The Network Effect. American Sociological Review,
61(674-698).
Uzzi, B. (1997). Social Structure and Competition in interfirm networks: the Paradox of
Embeddedness. Administrative Science Quarterly., 42, 35-67.
van Vuuren, S. J. (2011). Inter-Organisational Knowledge Sharing in theon and Public
Sector: The Role of Social Capital and Information and Communication Technology.
Victoria University of Wellington.
Vehovar, V., and Manfreda, K. L. (2008). Overview: Online Surveys. In F. Nigel, R. M. Lee
and B. Grant (Eds.), The Sage Handbook of Online Research Methods. London: Sage
Publications Ltd.
Volkswagen Group (China), 2011. Retrieved from
http://www.vw.com.cn/en/corporate_information1/vgc.html
von Loewnfeld, F. (2006). Brand Communities - Erfolgsfaktoren und okonmomische
Relevanz von Markengemeinschaften. Wiesbadeno. Document Number)
Wasko, M. M., and Faraj, S. (2005). Why Should I Share? Examing Social Capital and
Knowledge Contribution in Electronic Networks of Practice. . MIS Quarterly, 29(1),
35-57.
Weber, M. (1978). Economy and Society. Berkeley: University of California Press.
Wellman, B., Salaff, J., Dimitrova, D., Garton, L., Gulia, M., and Haythornwaite, C. (1996).
Computer networks as social networks: collaborative work, telework, and virtual
community. Annual Review of Sociology, 22, 213-238.
Wellman, B., and Gulia, M. (1999). Virtual Communities as Communities-Net Surfers Don’t
ride Along. In P. Kollock and M. Smith, A. (Eds.), Communities in Cyberspace (pp.
167-194). London.
238 | P a g e
Westerlund, M., and Svahn, S. (2008). A Relationship Value Perspective of Social Capital in
Networks of Software SMEs. Industrial Marketing Management, 37, 492-501.
Widen-Wulff., Ek, S., Ginman, M., Perttila, R., Sodergard, P., and Totterman, A.-K. (2008).
Information behaviour meets social capital: a conceptual model. Journal of
Information Science, 34(3), 346-355.
Widen-Wulff., and Ginman, M. (2004). Explaining knowledge sharing in organisations
through the dimensions of social capital. Journal of Information Science, 30, 448.
Wiegandt, P. (2009). Value Creation of Firm-Established Brand Communities Ludwig
Maximilians University, Munich.
Wiertz, C., and de Ruyter, K. (2007). Beyond the Call of Duty: Why Customers Contribute
to Firm-hosted Commercial Online Communities. Organisation Studies, 28(3), 347-
376.
Williams, D. (2006). On and off the Net: scales for social capital in an online era. Journal of
Computer-Mediated Communication, 11, 593-628.
Woolcock, M. (1998). Social capital and economic development: toward a theorectical
synthesis and policy framework. Technology in Society, 27(2), 151-208.
Woratschek, H., and Popp, B. (2010). Branded Communities as an Alternative Branding
Concept to Brand Communities: The Case of German Football Community.
University Bayreuth.
WorldBank. (1999). Social Capital Research Group [Electronic Version]. Retrieved 29 Feb,
2009, from http://www.worldbank.org/poverty/scapital/
Wright, K. B. (2005). Researching Internet-based populations: advantages and disadvantages
of online survey research, online questionnaire authoring software packages, and web
survey services. Journal of Computer-Mediated Communication, 10(3).
Wu, F., and Lee, Y.-K. (2005). Determinants of e-communication adoption: The internal
push versus external pull factors. Marketing Theory, 5(1), 7-31.
Wu, S.-C., and Fang, W. (2010). The effect of consumer-to-consumer interactions on idea
generation in virtual brand community relationships. Technovation, 30, 570-581.
239 | P a g e
Wu, W.-P. (2008). Dimensions of Social Capital and Firm Competitiveness Improvement:
The Mediating Role of Information Sharing. Journal of Management Studies, 45(1),
122-146.
Yoo, C. J., and Jung, H. E. (2004). Analyses of brand community chracteristics, members’
behaviour patterns and Participantion experoences, and quality of relationship
according to community formation orientation: comparisons between maker oriental
community and customer oriented community. Korean Marketing Research, 19(3),
47-80.
Zhao. and Gao. (2009). How to be competitive in Chinese automobile industry International
Journal of Economics and Finance 1(2), 144-148.
Zikmund, W. G. (1999). Essential of Marketing Research. Fort Worth: Texas:Dryden Press.
Zikmund, W. G. (2003). Business Research Methods. Cincinnati: Thompson/South-Western.

240 | P a g e
Appendix A Analytical Statistics
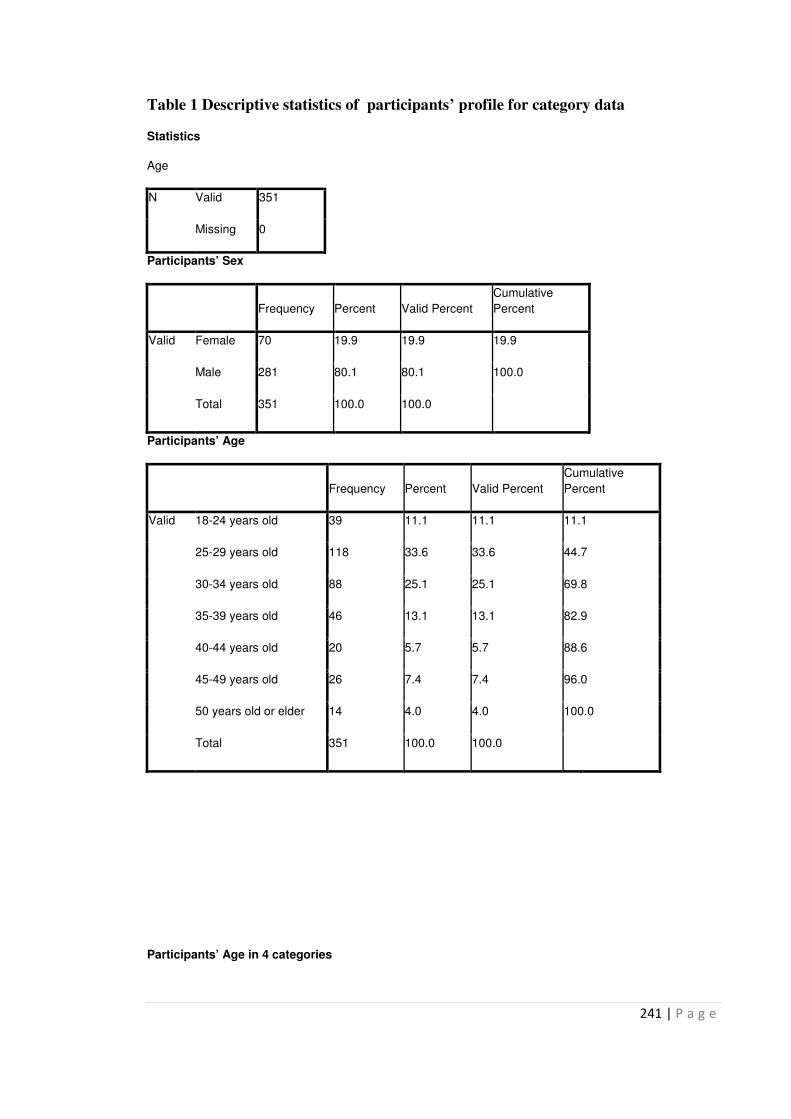
241 | P a g e
Table 1 Descriptive statistics of participants’ profile for category data
Statistics
Age
N Valid 351
Missing 0
Participants’ Sex
Frequency Percent Valid Percent
Cumulative
Percent
Valid Female 70 19.9 19.9 19.9
Male 281 80.1 80.1 100.0
Total 351 100.0 100.0
Participants’ Age
Frequency Percent Valid Percent
Cumulative
Percent
Valid 18-24 years old 39 11.1 11.1 11.1
25-29 years old 118 33.6 33.6 44.7
30-34 years old 88 25.1 25.1 69.8
35-39 years old 46 13.1 13.1 82.9
40-44 years old 20 5.7 5.7 88.6
45-49 years old 26 7.4 7.4 96.0
50 years old or elder 14 4.0 4.0 100.0
Total 351 100.0 100.0
Participants’ Age in 4 categories

242 | P a g e
Frequency Percent Valid Percent
Cumulative
Percent
Valid <24 39 11.1 11.1 11.1
25-34 206 58.7 58.7 69.8
35-44 66 18.8 18.8 88.6
45> 40 11.4 11.4 100.0
Total 351 100.0 100.0
Participants’ Education level
Frequency Percent Valid Percent
Cumulative
Percent
Valid Up to high school 17 4.8 4.8 4.8
Diploma or equivalent 83 23.6 23.6 28.5
Bachelor degree 182 51.9 51.9 80.3
Master degree 58 16.5 16.5 96.9
PhD degree 11 3.1 3.1 100.0
Total 351 100.0 100.0
Participants’ Membership history
Frequency Percent Valid Percent
Cumulative
Percent
Valid 3 months or less 30 8.5 8.5 8.5
4-6 months 43 12.3 12.3 20.8
7-12 months 101 28.8 28.8 49.6
Over 12 months 177 50.4 50.4 100.0
Total 351 100.0 100.0
Participants’ Frequency of site visit
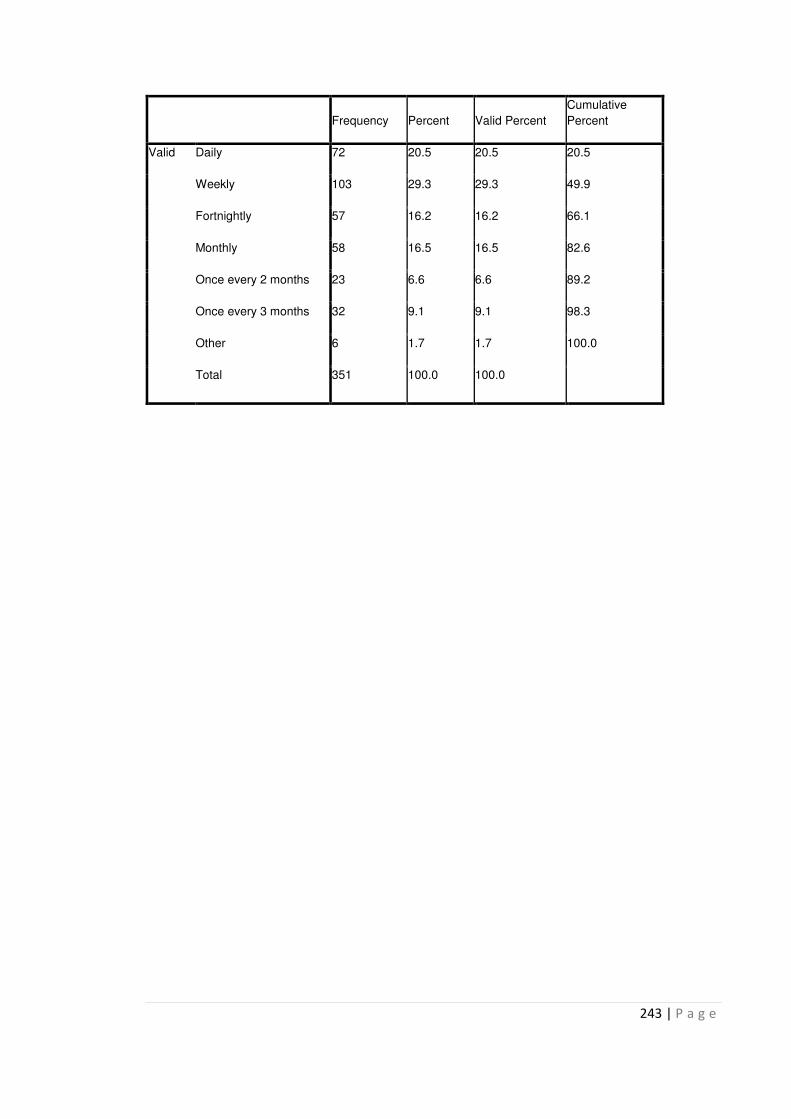
243 | P a g e
Frequency Percent Valid Percent
Cumulative
Percent
Valid Daily 72 20.5 20.5 20.5
Weekly 103 29.3 29.3 49.9
Fortnightly 57 16.2 16.2 66.1
Monthly 58 16.5 16.5 82.6
Once every 2 months 23 6.6 6.6 89.2
Once every 3 months 32 9.1 9.1 98.3
Other 6 1.7 1.7 100.0
Total 351 100.0 100.0
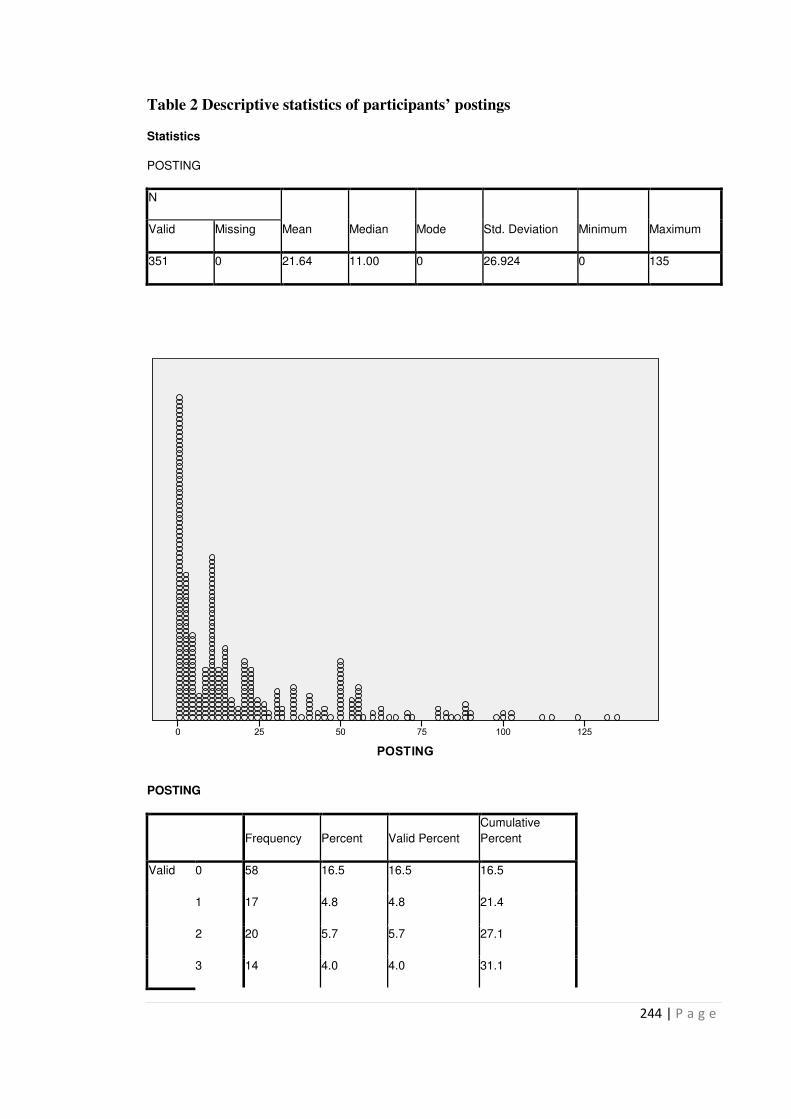
244 | P a g e
Table 2 Descriptive statistics of participants’ postings
Statistics
POSTING
N
Mean Median Mode Std. Deviation Minimum Maximum Valid Missing
351 0 21.64 11.00 0 26.924 0 135
POSTING
Frequency Percent Valid Percent
Cumulative
Percent
Valid 0 58 16.5 16.5 16.5
1 17 4.8 4.8 21.4
2 20 5.7 5.7 27.1
3 14 4.0 4.0 31.1

245 | P a g e
4 8 2.3 2.3 33.3
5 12 3.4 3.4 36.8
6 2 .6 .6 37.3
7 4 1.1 1.1 38.5
8 6 1.7 1.7 40.2
9 6 1.7 1.7 41.9
10 27 7.7 7.7 49.6
11 11 3.1 3.1 52.7
12 6 1.7 1.7 54.4
13 6 1.7 1.7 56.1
14 3 .9 .9 57.0
15 14 4.0 4.0 61.0
16 1 .3 .3 61.3
17 4 1.1 1.1 62.4
18 1 .3 .3 62.7
19 2 .6 .6 63.2
20 11 3.1 3.1 66.4
21 3 .9 .9 67.2
22 5 1.4 1.4 68.7
23 7 2.0 2.0 70.7
24 2 .6 .6 71.2
25 3 .9 .9 72.1
26 3 .9 .9 72.9
27 1 .3 .3 73.2
28 2 .6 .6 73.8
30 4 1.1 1.1 74.9
31 3 .9 .9 75.8
32 3 .9 .9 76.6
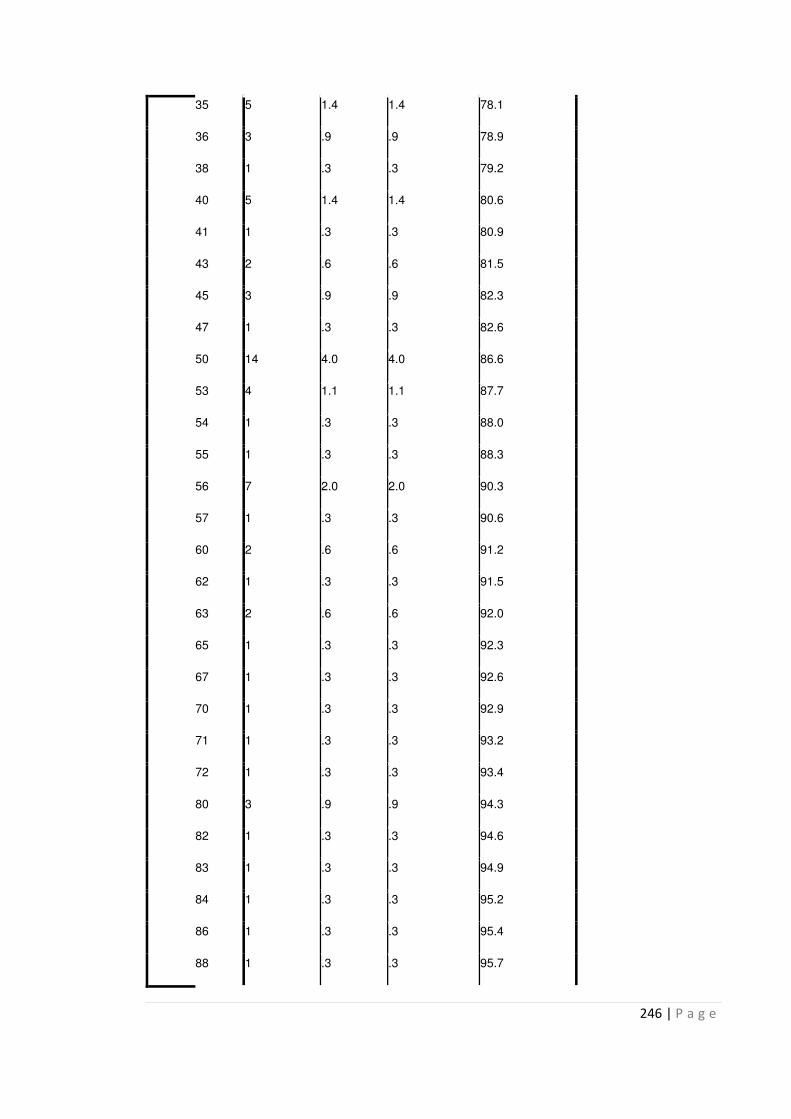
246 | P a g e
35 5 1.4 1.4 78.1
36 3 .9 .9 78.9
38 1 .3 .3 79.2
40 5 1.4 1.4 80.6
41 1 .3 .3 80.9
43 2 .6 .6 81.5
45 3 .9 .9 82.3
47 1 .3 .3 82.6
50 14 4.0 4.0 86.6
53 4 1.1 1.1 87.7
54 1 .3 .3 88.0
55 1 .3 .3 88.3
56 7 2.0 2.0 90.3
57 1 .3 .3 90.6
60 2 .6 .6 91.2
62 1 .3 .3 91.5
63 2 .6 .6 92.0
65 1 .3 .3 92.3
67 1 .3 .3 92.6
70 1 .3 .3 92.9
71 1 .3 .3 93.2
72 1 .3 .3 93.4
80 3 .9 .9 94.3
82 1 .3 .3 94.6
83 1 .3 .3 94.9
84 1 .3 .3 95.2
86 1 .3 .3 95.4
88 1 .3 .3 95.7

247 | P a g e
89 3 .9 .9 96.6
90 2 .6 .6 97.2
98 1 .3 .3 97.4
100 2 .6 .6 98.0
102 1 .3 .3 98.3
103 1 .3 .3 98.6
112 1 .3 .3 98.9
115 1 .3 .3 99.1
123 1 .3 .3 99.4
132 1 .3 .3 99.7
135 1 .3 .3 100.0
Total 351 100.0 100.0
Table 3 Descriptive statistics of participants’ postings after re-categorizing the data
Statistics
Range of posting
N Valid 351
Missing 0
Mean 3.25
Median 3.00
Mode 2
Std. Deviation 1.983
Minimum 1
Maximum 7
Range of posting
Frequency Percent Valid Percent
Cumulative
Percent
Valid 1 58 16.5 16.5 16.5

248 | P a g e
2 116 33.0 33.0 49.6
3 59 16.8 16.8 66.4
4 30 8.5 8.5 74.9
5 20 5.7 5.7 80.6
6 21 6.0 6.0 86.6
7 47 13.4 13.4 100.0
Total 351 100.0 100.0
Table 4 Descriptive statistics for measured items
Descriptive Statistics
N Mean Std. Deviation Variance
INTER1 351 3.54 .784 .615
INTER2 351 3.35 .865 .747
INTER3 351 3.74 .794 .631
INTER4 351 3.71 .793 .630
Valid N (listwise) 351
Descriptive Statistics
N Mean Std. Deviation Variance
SLAN1 351 3.70 .729 .531
SLAN2 351 3.54 .795 .632
SLAN3 351 3.75 .780 .608
SLAN4 351 3.93 .772 .595
Valid N (listwise) 351
Descriptive Statistics
N Mean Std. Deviation Variance

249 | P a g e
COMIT1 351 3.66 .730 .533
COMIT2 351 3.57 .828 .685
COMIT3 351 3.78 .745 .555
Valid N (listwise) 351
Descriptive Statistics
N Mean Std. Deviation Variance
IDEN1 351 3.69 .723 .522
IDEN2 351 3.69 .742 .551
IDEN3 351 3.59 .840 .705
IDEN4 351 3.62 .753 .567
IDEN5 351 3.58 .743 .553
Valid N (listwise) 351
Descriptive Statistics
N Mean Std. Deviation Variance
BKA1 351 3.62 .957 .915
BKA2 351 3.48 .959 .919
BKA3 351 3.72 .793 .629
Valid N (listwise) 351
Descriptive Statistics
N Mean Std. Deviation Variance
BKI1 351 3.69 .833 .695
BKI2 351 3.69 .937 .878
BKI3 351 3.91 .758 .575
BKI4 351 3.56 .825 .681
BKI5 351 3.72 .839 .705
BKI6 351 3.32 .870 .757
BKI7 351 3.38 .933 .870

250 | P a g e
Descriptive Statistics
N Mean Std. Deviation Variance
COMIT1 351 3.66 .730 .533
COMIT2 351 3.57 .828 .685
COMIT3 351 3.78 .745 .555
Valid N (listwise) 351
Descriptive Statistics
N Mean Std. Deviation Variance
INFC1 351 3.45 .805 .648
INFC2 351 3.44 .805 .647
INFC3 351 3.56 .819 .670
INFC4 351 3.66 .780 .608
Valid N (listwise) 351
Table 5Chi-Square test for non-response bias assessment
Statistics
Non-response bias
N Valid 300
Missing 0
Non-response bias
Frequency Percent Valid Percent
Cumulative
Percent
Valid Early response 100 33.3 33.3 33.3
Late reponse 100 33.3 33.3 66.7
Not use for N-BIAS test 100 33.3 33.3 100.0
Total 300 100.0 100.0
Sex * Non-response bias Crosstabulation
Non-response bias Total

251 | P a g e
Early response Late reponse
Sex Female Count 24 18 42
% within Sex 57.1% 42.9% 100.0%
Male Count 76 82 158
% within Sex 48.1% 51.9% 100.0%
Total Count 100 100 200
% within Sex 50.0% 50.0% 100.0%
Sex* Non-response bias Chi-Square Tests
Value df
Asymp. Sig. (2-
sided)
Exact Sig. (2-
sided)
Exact Sig. (1-
sided)
Pearson Chi-Square 1.085a 1 .298
Continuity Correctionb .753 1 .385
Likelihood Ratio 1.088 1 .297
Fisher's Exact Test .386 .193
Linear-by-Linear Association 1.080 1 .299
N of Valid Cases 200
a. 0 cells (.0%) have expected count less than 5. The minimum expected count is 21.00.
b. Computed only for a 2x2 table
Age in 4 groups * Non-response bias Crosstabulation
Non-response bias
Total Early response Late reponse
New age in 4 groups 1 Count 13 11 24
% within New age in 4 groups 54.2% 45.8% 100.0%
2 Count 62 56 118
% within New age in 4 groups 52.5% 47.5% 100.0%
3 Count 15 19 34
% within New age in 4 groups 44.1% 55.9% 100.0%
4 Count 10 14 24

252 | P a g e
% within New age in 4 groups 41.7% 58.3% 100.0%
Total Count 100 100 200
% within New age in 4 groups 50.0% 50.0% 100.0%
Age in 4 groups * Non-response bias Chi-Square Tests
Value df
Asymp. Sig. (2-
sided)
Pearson Chi-Square 1.609a 3 .657
Likelihood Ratio 1.614 3 .656
Linear-by-Linear Association 1.422 1 .233
N of Valid Cases 200
a. 0 cells (.0%) have expected count less than 5. The minimum expected
count is 12.00.
Education level * Non-response bias Crosstabulation
Non-response bias
Total Early response Late reponse
Education level Up to high school Count 6 5 11
% within Education level 54.5% 45.5% 100.0%
Diploma or equivalent Count 22 27 49
% within Education level 44.9% 55.1% 100.0%
Bachelor degree Count 48 49 97
% within Education level 49.5% 50.5% 100.0%
Master degree Count 22 14 36
% within Education level 61.1% 38.9% 100.0%
PhD degree Count 2 5 7
% within Education level 28.6% 71.4% 100.0%
Total Count 100 100 200
% within Education level 50.0% 50.0% 100.0%
Education level * Non-response bias Chi-Square Tests
Value df
Asymp. Sig. (2-
sided)

253 | P a g e
Pearson Chi-Square 3.675a 4 .452
Likelihood Ratio 3.733 4 .443
Linear-by-Linear Association .161 1 .689
N of Valid Cases 200
a. 2 cells (20.0%) have expected count less than 5. The minimum expected
count is 3.50.
Membership history * Non-response bias Crosstabulation
Non-response bias
Total Early response Late reponse
Membership history 3 months or less Count 8 6 14
% within Membership history 57.1% 42.9% 100.0%
4-6 months Count 11 8 19
% within Membership history 57.9% 42.1% 100.0%
7-12 months Count 32 28 60
% within Membership history 53.3% 46.7% 100.0%
Over 12 months Count 49 58 107
% within Membership history 45.8% 54.2% 100.0%
Total Count 100 100 200
% within Membership history 50.0% 50.0% 100.0%
Membership history * Non-response bias Chi-Square Tests
Value df
Asymp. Sig. (2-
sided)
Pearson Chi-Square 1.783a 3 .619
Likelihood Ratio 1.787 3 .618
Linear-by-Linear Association 1.553 1 .213
N of Valid Cases 200
a. 0 cells (.0%) have expected count less than 5. The minimum expected
count is 7.00.

254 | P a g e
Membership history * Non-response bias Chi-Square Tests
Value df
Asymp. Sig. (2-
sided)
Pearson Chi-Square 1.783a 3 .619
Likelihood Ratio 1.787 3 .618
Linear-by-Linear Association 1.553 1 .213
N of Valid Cases 200
Frequency of site visit * Non-response bias Chi-Square Tests
Value df
Asymp. Sig. (2-
sided)
Pearson Chi-Square 11.159a 6 .084
Likelihood Ratio 12.066 6 .061
Linear-by-Linear Association .501 1 .479
N of Valid Cases 200
a. 2 cells (14.3%) have expected count less than 5. The minimum
expected count is 1.00.
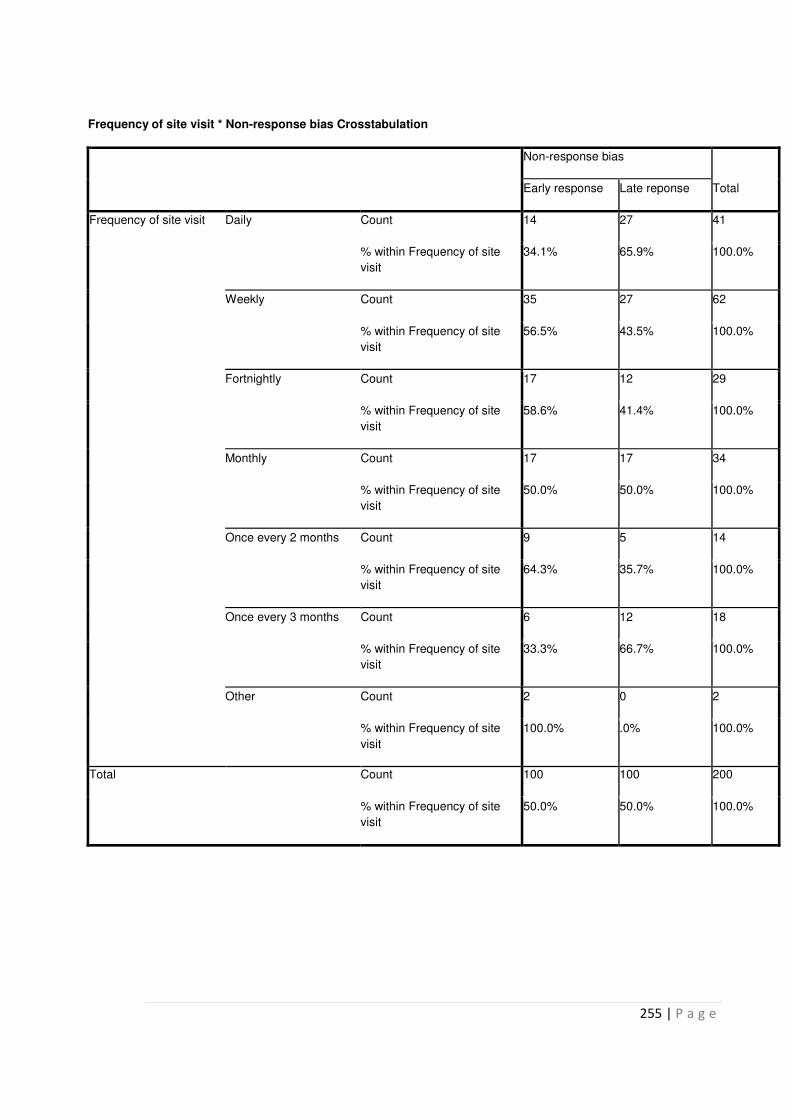
255 | P a g e
Frequency of site visit * Non-response bias Crosstabulation
Non-response bias
Total Early response Late reponse
Frequency of site visit Daily Count 14 27 41
% within Frequency of site
visit
34.1% 65.9% 100.0%
Weekly Count 35 27 62
% within Frequency of site
visit
56.5% 43.5% 100.0%
Fortnightly Count 17 12 29
% within Frequency of site
visit
58.6% 41.4% 100.0%
Monthly Count 17 17 34
% within Frequency of site
visit
50.0% 50.0% 100.0%
Once every 2 months Count 9 5 14
% within Frequency of site
visit
64.3% 35.7% 100.0%
Once every 3 months Count 6 12 18
% within Frequency of site
visit
33.3% 66.7% 100.0%
Other Count 2 0 2
% within Frequency of site
visit
100.0% .0% 100.0%
Total Count 100 100 200
% within Frequency of site
visit
50.0% 50.0% 100.0%

256 | P a g e
Table 6 Mann-Whitney test for non-response bias assessment
Ranks
Non-response bias N Mean Rank Sum of Ranks
Age
dimension1
Early response 100 96.42 9642.00
Late reponse 100 104.58 10458.00
Total 200
Education level
dimension1
Early response 100 103.15 10315.00
Late reponse 100 97.85 9785.00
Total 200
Membership history
dimension1
Early response 100 95.59 9559.00
Late reponse 100 105.41 10541.00
Total 200
Frequency of site visit
dimension1
Early response 100 104.77 10476.50
Late reponse 100 96.24 9623.50
Total 200
Test Statisticsa
Age Education level
Membership
history
Frequency of site
visit
Mann-Whitney U 4592.000 4735.000 4509.000 4573.500
Wilcoxon W 9642.000 9785.000 9559.000 9623.500
Z -1.029 -.696 -1.326 -1.068
Asymp. Sig. (2-tailed) .304 .486 .185 .286
a. Grouping Variable: Non-response bias
Table 7 Reliability assessment: Cronbach’s Alpha
Case Processing Summary
N %
Cases Valid 351 100.0

257 | P a g e
Excludeda 0 .0
Total 351 100.0
a. Listwise deletion based on all variables in the
procedure.
Reliability Statistics
Cronbach's Alpha N of Items
.819 3
Item Statistics
Mean Std. Deviation N
If I am buying a car, the
Volkswagen brand is my first
choice
3.62 .957 351
I know what the Volkswagen
brand stands for
3.48 .959 351
I have my own opinions about
the Volkswagen brand
3.72 .793 351
Reliability Statistics
Cronbach's Alpha N of Items
.858 7
Item Statistics
Mean Std. Deviation N
Volkswagen cars perform as I
expected
3.69 .833 351
Volkswagen cars offer good
value for the money
3.69 .937 351
Volkswagen cars are reliable 3.91 .758 351
Volkswagen cars
arefunctional
3.56 .825 351
Driving a Volkswagen car
makes me feel good
3.72 .839 351

258 | P a g e
Owning a Volkswagen car is
admired by my friends and
family
3.32 .870 351
Volkswagen cars express my
personality
3.38 .933 351
Reliability Statistics
Cronbach's Alpha N of Items
.819 3
Item Statistics
Mean Std. Deviation N
I feel very loyal to this
community
3.66 .730 351
I would feel a loss if this
community is not available
anymore in Xcar.com
3.57 .828 351
I try my best to maintain the
relationship that I have with
this community in Xcar.com
3.78 .745 351
Reliability Statistics
Cronbach's Alpha N of Items
.824 4
Item Statistics
Mean Std. Deviation N
The information exchanged
by members in Xcar.com is
reliable
3.45 .805 351
The information exchanged
by members in Xcar.com is
accurate
3.44 .805 351
The information exchanged
by members in Xcar.com is
timely
3.56 .819 351
The information exchanged
by members in Xcar.com is
relevant to the discussion
topic
3.66 .780 351
Reliability Statistics

259 | P a g e
Cronbach's Alpha N of Items
.798 4
Item Statistics
Mean Std. Deviation N
I maintain close relationship
with some members in this
community
3.54 .784 351
I spend a lot of time
interacting with other
members in this community
3.35 .865 351
I know some members
personally in this community
3.74 .794 351
I communicate frequently with
some members in this
community
3.71 .793 351
Reliability Statistics
Cronbach's Alpha N of Items
.816 4
Item Statistics
Mean Std. Deviation N
Members in this community in
Xcar.com use a common
vocabulary in their
discussions in the forum
3.70 .729 351
Members in this community in
Xcar.com use technical terms
in their discussions in the
forum
3.54 .795 351
Members in this community in
Xcar.com communicate with
each other in a way that is
easy to understand
3.75 .780 351
Members in this community in
Xcar.com share their own
experiences in their
discussions in the forum
3.93 .772 351
Reliability Statistics
Cronbach's Alpha N of Items

260 | P a g e
Item Statistics
Mean Std. Deviation N
If I am buying a car, the
Volkswagen brand is my first
choice
3.62 .957 351
I know what the Volkswagen
brand stands for
3.48 .959 351
.852 5
Item Statistics
Mean Std. Deviation N
I am very attached to this
community
3.69 .723 351
I see myself as a part of this
community
3.69 .742 351
I share the same vision with
other members in this
community
3.59 .840 351
I am proud to be a member of
this community
3.62 .753 351
The close relationship I have
with other members in this
community means a lot to me
3.58 .743 351
Table 8 Amos output of Interaction Ties Measurement Model (Fit Construct)
Computation of degrees of freedom (Default model)
Number of distinct sample moments: 10
Number of distinct parameters to be estimated: 8
Degrees of freedom (10 - 8): 2
Result (Default model)
Minimum was achieved
Chi-square = 5.421
Degrees of freedom = 2
Probability level = .067

261 | P a g e
Regression Weights: (Group number 1 - Default model)
Estimate S.E. C.R. P Label
INTER1 <--- Interaction Ties 1.000
INTER2 <--- Interaction Ties .924 .096 9.617 *** par_1
INTER3 <--- Interaction Ties 1.042 .091 11.424 *** par_2
INTER4 <--- Interaction Ties 1.156 .097 11.980 *** par_3
Standardized Regression Weights: (Group number 1 - Default model)
Estimate
INTER1 <--- Interaction Ties .706
INTER2 <--- Interaction Ties .592
INTER3 <--- Interaction Ties .727
INTER4 <--- Interaction Ties .807
Model Fit Summary
CMIN
Model NPAR CMIN DF P CMIN/DF
Default model 8 5.421 2 .067 2.710
Saturated model 10 .000 0
Independence model 4 432.404 6 .000 72.067
RMR, GFI
Model RMR GFI AGFI PGFI
Default model .013 .993 .963 .199
Saturated model .000 1.000
Independence model .253 .567 .278 .340
Baseline Comparisons

262 | P a g e
Model NFI
Delta1
RFI
rho1
IFI
Delta2
TLI
rho2 CFI
Default model .987 .962 .992 .976 .992
Saturated model 1.000
1.000
1.000
Independence model .000 .000 .000 .000 .000
RMSEA
Model RMSEA LO 90 HI 90 PCLOSE
Default model .070 .000 .144 .240
Independence model .451 .415 .487 .000
Table 9 Amos output of Shared Language Measurement Model (Fit Construct)
Computation of degrees of freedom (Default model)
Number of distinct sample moments: 10
Number of distinct parameters to be estimated: 8
Degrees of freedom (10 - 8): 2
Result (Default model)
Minimum was achieved
Chi-square = 5.467
Degrees of freedom = 2
Probability level = .065
Regression Weights: (Group number 1 - Default model)
Estimate S.E. C.R. P Label
SLAN1 <--- Shared Language 1.000
SLAN2 <--- Shared Language 1.040 .097 10.665 *** par_1
SLAN3 <--- Shared Language 1.289 .104 12.339 *** par_2

263 | P a g e
Estimate S.E. C.R. P Label
SLAN4 <--- Shared Language 1.093 .096 11.393 *** par_3
Standardized Regression Weights: (Group number 1 - Default model)
Estimate
SLAN1 <--- Shared Language .693
SLAN2 <--- Shared Language .661
SLAN3 <--- Shared Language .835
SLAN4 <--- Shared Language .715
Model Fit Summary
CMIN
Model NPAR CMIN DF P CMIN/DF
Default model 8 5.467 2 .065 2.733
Saturated model 10 .000 0
Independence model 4 474.448 6 .000 79.075
RMR, GFI
Model RMR GFI AGFI PGFI
Default model .011 .993 .963 .199
Saturated model .000 1.000
Independence model .242 .544 .239 .326
Baseline Comparisons
Model NFI
Delta1
RFI
rho1
IFI
Delta2
TLI
rho2 CFI
Default model .988 .965 .993 .978 .993
Saturated model 1.000
1.000
1.000

264 | P a g e
Model NFI
Delta1
RFI
rho1
IFI
Delta2
TLI
rho2 CFI
Independence model .000 .000 .000 .000 .000
RMSEA
Model RMSEA LO 90 HI 90 PCLOSE
Default model .070 .000 .144 .237
Independence model .472 .437 .509 .000
Table 10 Amos output of Identification Measurement Model (Fit Construct)
Computation of degrees of freedom (Default model)
Number of distinct sample moments: 15
Number of distinct parameters to be estimated: 10
Degrees of freedom (15 - 10): 5
Result (Default model)
Minimum was achieved
Chi-square = 15.532
Degrees of freedom = 5
Probability level = .008
Regression Weights: (Group number 1 - Default model)
Estimate S.E. C.R. P Label
IDEN1 <--- IDEN 1.000
IDEN2 <--- IDEN 1.106 .071 15.569 *** par_1
IDEN3 <--- IDEN 1.064 .080 13.288 *** par_2
IDEN4 <--- IDEN .902 .072 12.486 *** par_3
IDEN5 <--- IDEN .852 .072 11.899 *** par_4
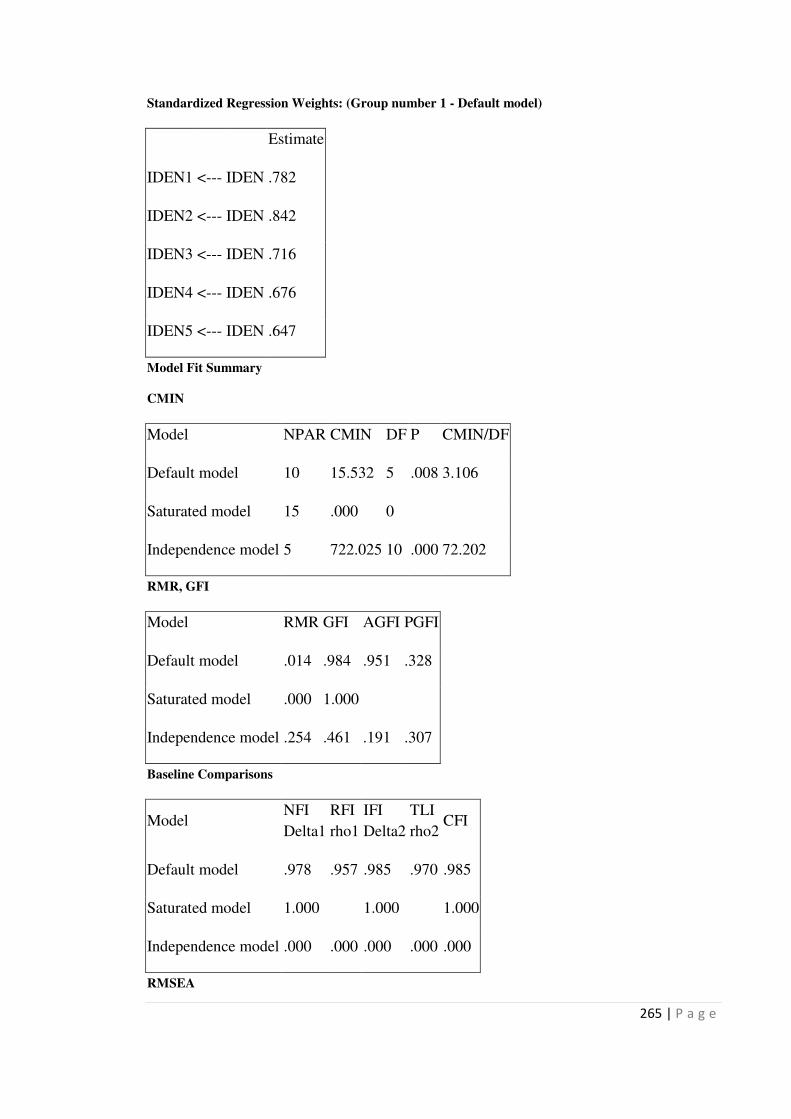
265 | P a g e
Standardized Regression Weights: (Group number 1 - Default model)
Estimate
IDEN1 <--- IDEN .782
IDEN2 <--- IDEN .842
IDEN3 <--- IDEN .716
IDEN4 <--- IDEN .676
IDEN5 <--- IDEN .647
Model Fit Summary
CMIN
Model NPAR CMIN DF P CMIN/DF
Default model 10 15.532 5 .008 3.106
Saturated model 15 .000 0
Independence model 5 722.025 10 .000 72.202
RMR, GFI
Model RMR GFI AGFI PGFI
Default model .014 .984 .951 .328
Saturated model .000 1.000
Independence model .254 .461 .191 .307
Baseline Comparisons
Model NFI
Delta1
RFI
rho1
IFI
Delta2
TLI
rho2 CFI
Default model .978 .957 .985 .970 .985
Saturated model 1.000
1.000
1.000
Independence model .000 .000 .000 .000 .000
RMSEA
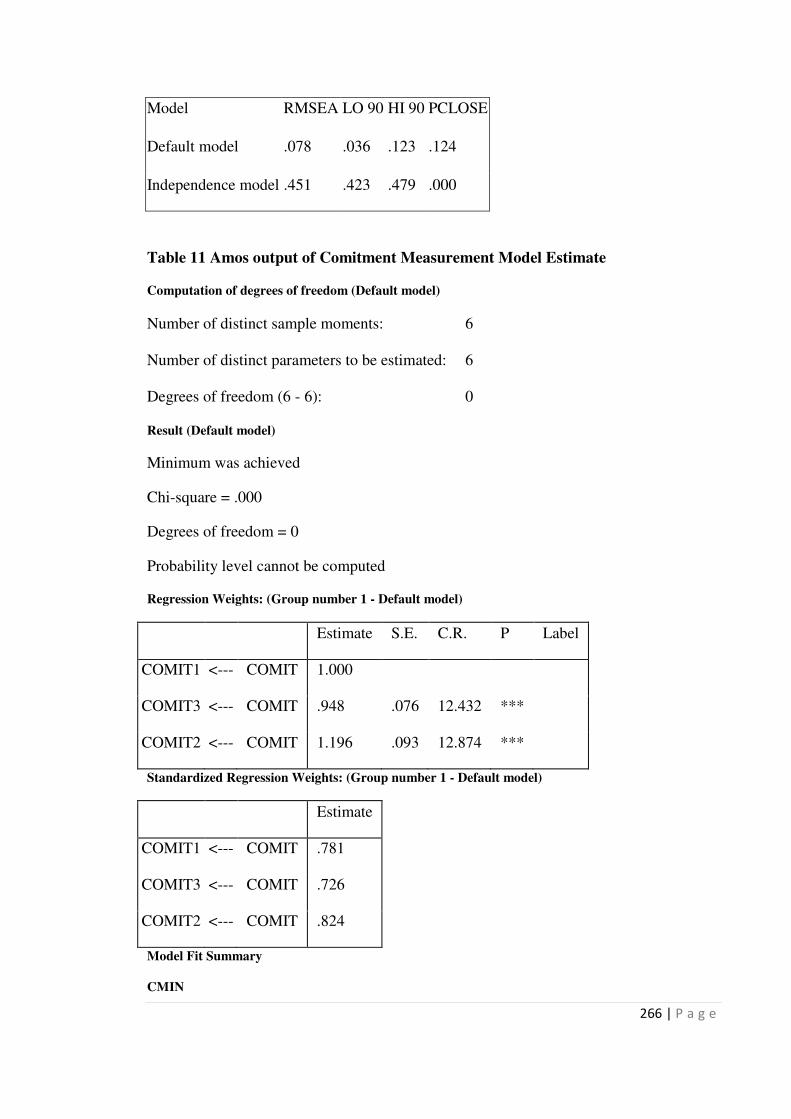
266 | P a g e
Model RMSEA LO 90 HI 90 PCLOSE
Default model .078 .036 .123 .124
Independence model .451 .423 .479 .000
Table 11 Amos output of Comitment Measurement Model Estimate
Computation of degrees of freedom (Default model)
Number of distinct sample moments: 6
Number of distinct parameters to be estimated: 6
Degrees of freedom (6 - 6): 0
Result (Default model)
Minimum was achieved
Chi-square = .000
Degrees of freedom = 0
Probability level cannot be computed
Regression Weights: (Group number 1 - Default model)
Estimate S.E. C.R. P Label
COMIT1 <--- COMIT 1.000
COMIT3 <--- COMIT .948 .076 12.432 ***
COMIT2 <--- COMIT 1.196 .093 12.874 ***
Standardized Regression Weights: (Group number 1 - Default model)
Estimate
COMIT1 <--- COMIT .781
COMIT3 <--- COMIT .726
COMIT2 <--- COMIT .824
Model Fit Summary
CMIN
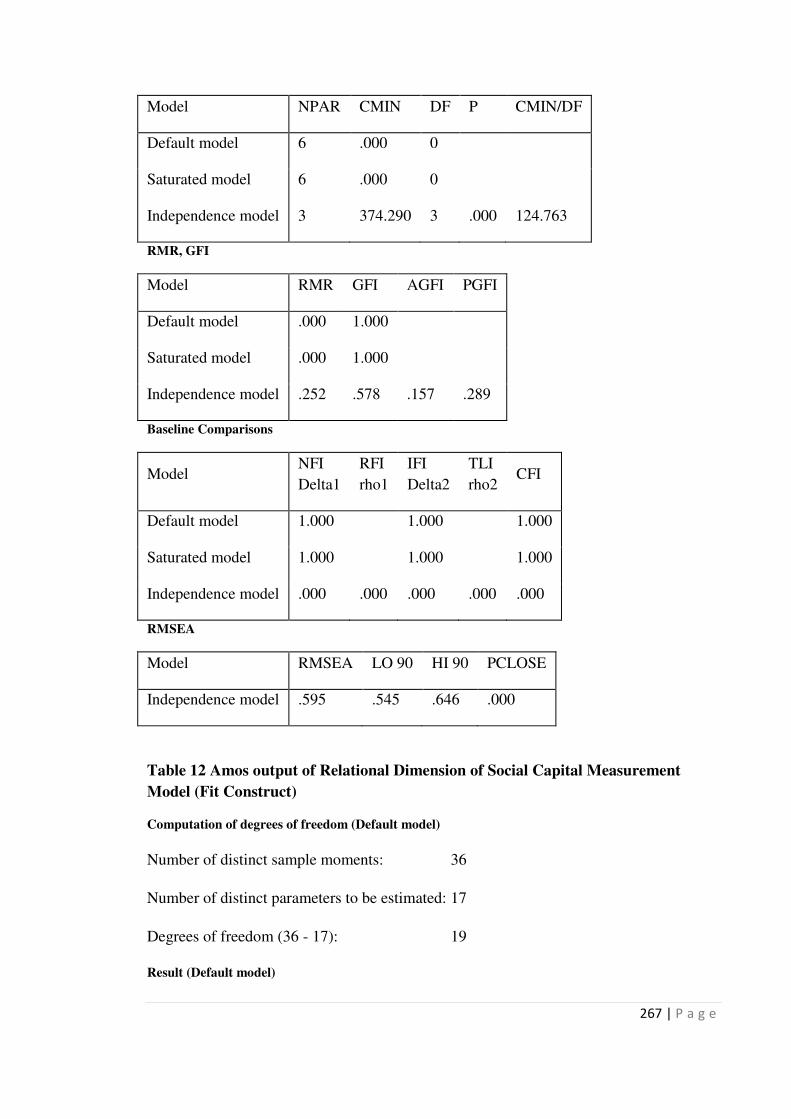
267 | P a g e
Model NPAR CMIN DF P CMIN/DF
Default model 6 .000 0
Saturated model 6 .000 0
Independence model 3 374.290 3 .000 124.763
RMR, GFI
Model RMR GFI AGFI PGFI
Default model .000 1.000
Saturated model .000 1.000
Independence model .252 .578 .157 .289
Baseline Comparisons
Model NFI
Delta1
RFI
rho1
IFI
Delta2
TLI
rho2 CFI
Default model 1.000
1.000
1.000
Saturated model 1.000
1.000
1.000
Independence model .000 .000 .000 .000 .000
RMSEA
Model RMSEA LO 90 HI 90 PCLOSE
Independence model .595 .545 .646 .000
Table 12 Amos output of Relational Dimension of Social Capital Measurement
Model (Fit Construct)
Computation of degrees of freedom (Default model)
Number of distinct sample moments: 36
Number of distinct parameters to be estimated: 17
Degrees of freedom (36 - 17): 19
Result (Default model)
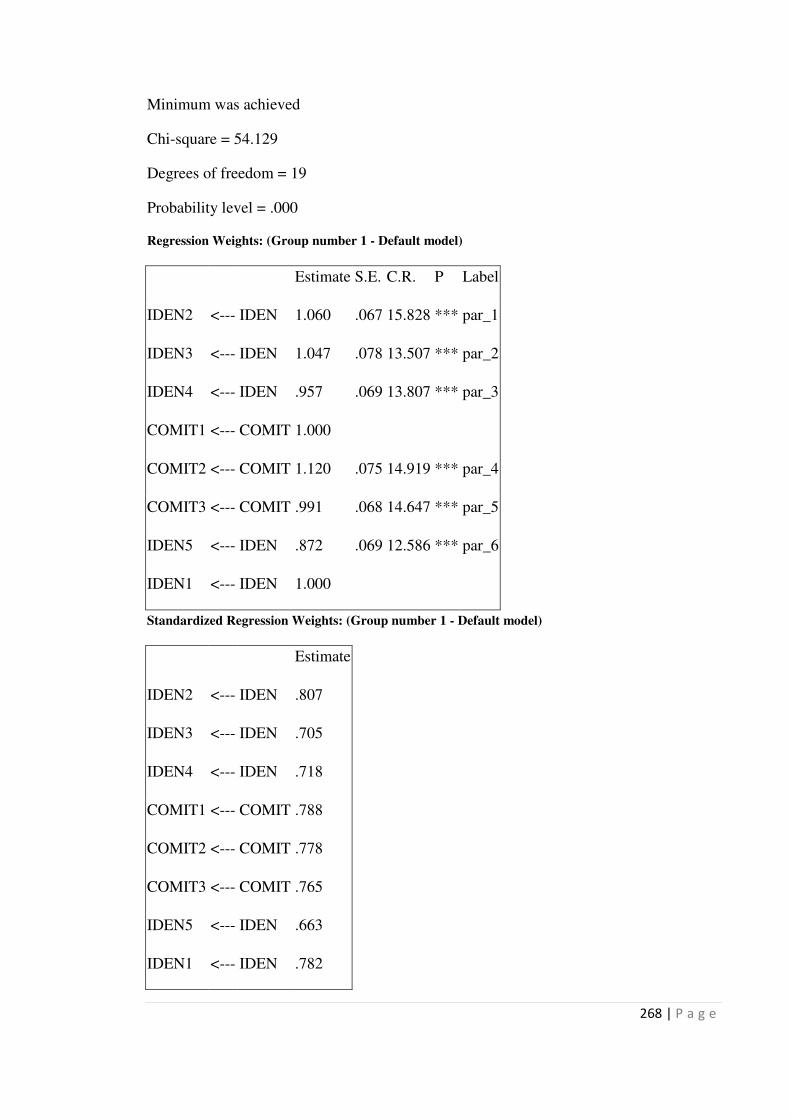
268 | P a g e
Minimum was achieved
Chi-square = 54.129
Degrees of freedom = 19
Probability level = .000
Regression Weights: (Group number 1 - Default model)
Estimate S.E. C.R. P Label
IDEN2 <--- IDEN 1.060 .067 15.828 *** par_1
IDEN3 <--- IDEN 1.047 .078 13.507 *** par_2
IDEN4 <--- IDEN .957 .069 13.807 *** par_3
COMIT1 <--- COMIT 1.000
COMIT2 <--- COMIT 1.120 .075 14.919 *** par_4
COMIT3 <--- COMIT .991 .068 14.647 *** par_5
IDEN5 <--- IDEN .872 .069 12.586 *** par_6
IDEN1 <--- IDEN 1.000
Standardized Regression Weights: (Group number 1 - Default model)
Estimate
IDEN2 <--- IDEN .807
IDEN3 <--- IDEN .705
IDEN4 <--- IDEN .718
COMIT1 <--- COMIT .788
COMIT2 <--- COMIT .778
COMIT3 <--- COMIT .765
IDEN5 <--- IDEN .663
IDEN1 <--- IDEN .782

269 | P a g e
Model Fit Summary
CMIN
Model NPAR CMIN DF P CMIN/DF
Default model 17 54.129 19 .000 2.849
Saturated model 36 .000 0
Independence model 8 1446.938 28 .000 51.676
RMR, GFI
Model RMR GFI AGFI PGFI
Default model .017 .965 .934 .509
Saturated model .000 1.000
Independence model .277 .327 .134 .254
Baseline Comparisons
Model NFI
Delta1
RFI
rho1
IFI
Delta2
TLI
rho2 CFI
Default model .963 .945 .975 .964 .975
Saturated model 1.000
1.000
1.000
Independence model .000 .000 .000 .000 .000
RMSEA
Model RMSEA LO 90 HI 90 PCLOSE
Default model .073 .050 .096 .048
Independence model .381 .364 .397 .000
Table 13 Amos Output of Quality of Information Exchange Measurement Model
Estimates
Computation of degrees of freedom (Default model)
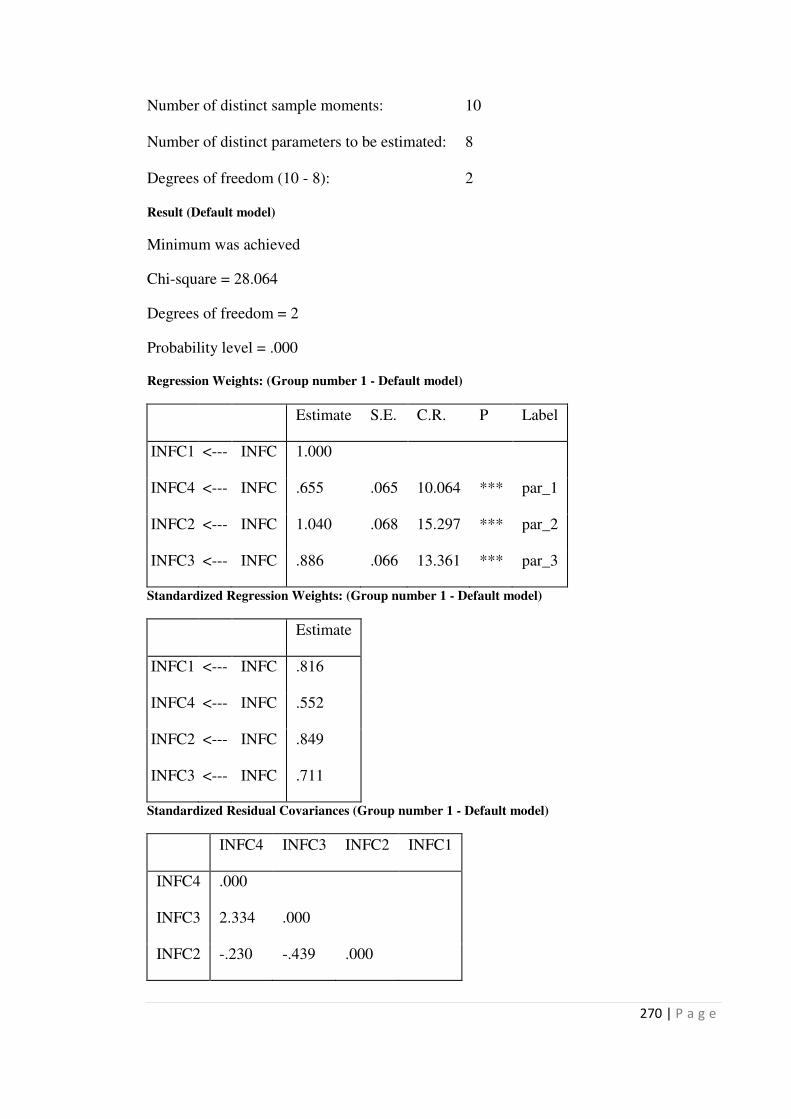
270 | P a g e
Number of distinct sample moments: 10
Number of distinct parameters to be estimated: 8
Degrees of freedom (10 - 8): 2
Result (Default model)
Minimum was achieved
Chi-square = 28.064
Degrees of freedom = 2
Probability level = .000
Regression Weights: (Group number 1 - Default model)
Estimate S.E. C.R. P Label
INFC1 <--- INFC 1.000
INFC4 <--- INFC .655 .065 10.064 *** par_1
INFC2 <--- INFC 1.040 .068 15.297 *** par_2
INFC3 <--- INFC .886 .066 13.361 *** par_3
Standardized Regression Weights: (Group number 1 - Default model)
Estimate
INFC1 <--- INFC .816
INFC4 <--- INFC .552
INFC2 <--- INFC .849
INFC3 <--- INFC .711
Standardized Residual Covariances (Group number 1 - Default model)
INFC4 INFC3 INFC2 INFC1
INFC4 .000
INFC3 2.334 .000
INFC2 -.230 -.439 .000

271 | P a g e
INFC4 INFC3 INFC2 INFC1
INFC1 -1.058 -.152 .316 .000
Modification Indices (Group number 1 - Default model)
Covariances: (Group number 1 - Default model)
M.I. Par Change
e3 <--> e4 22.543 .105
e1 <--> e4 8.381 -.056
Regression Weights: (Group number 1 - Default model)
M.I. Par Change
INFC4 <--- INFC3 9.642 .136
INFC3 <--- INFC4 14.866 .165
INFC1 <--- INFC4 5.608 -.089
Model Fit Summary
CMIN
Model NPAR CMIN DF P CMIN/DF
Default model 8 28.064 2 .000 14.032
Saturated model 10 .000 0
Independence
model 4 549.142 6 .000 91.524
RMR, GFI
Model RMR GFI AGFI PGFI
Default model .031 .961 .807 .192
Saturated model .000 1.000
Independence
model .274 .526 .210 .316
Baseline Comparisons

272 | P a g e
Model NFI
Delta1
RFI
rho1
IFI
Delta2
TLI
rho2 CFI
Default model .949 .847 .952 .856 .952
Saturated model 1.000
1.000
1.000
Independence
model .000 .000 .000 .000 .000
RMSEA
Model RMSEA LO 90 HI 90 PCLOSE
Default model .193 .134 .259 .000
Independence
model .509 .473 .545 .000
Table 14 Amos Output of Competing Quality of Information Measurement Model
after Removal of INFC3
Computation of degrees of freedom (Default model)
Number of distinct sample moments: 6
Number of distinct parameters to be estimated: 6
Degrees of freedom (6 - 6): 0
Result (Default model)
Minimum was achieved
Chi-square = .000
Degrees of freedom = 0
Probability level cannot be computed
Regression Weights: (Group number 1 - Default model)
Estimate S.E. C.R. P Label
INFC1 <--- INFC 1.000
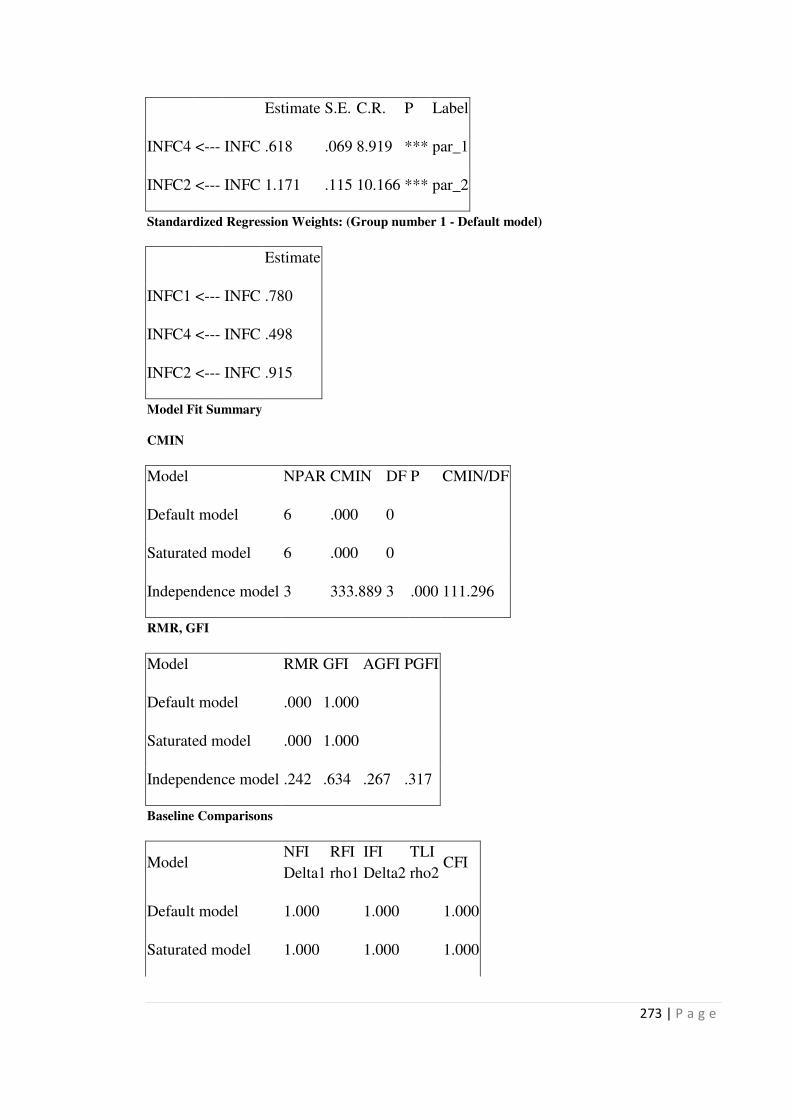
273 | P a g e
Estimate S.E. C.R. P Label
INFC4 <--- INFC .618 .069 8.919 *** par_1
INFC2 <--- INFC 1.171 .115 10.166 *** par_2
Standardized Regression Weights: (Group number 1 - Default model)
Estimate
INFC1 <--- INFC .780
INFC4 <--- INFC .498
INFC2 <--- INFC .915
Model Fit Summary
CMIN
Model NPAR CMIN DF P CMIN/DF
Default model 6 .000 0
Saturated model 6 .000 0
Independence model 3 333.889 3 .000 111.296
RMR, GFI
Model RMR GFI AGFI PGFI
Default model .000 1.000
Saturated model .000 1.000
Independence model .242 .634 .267 .317
Baseline Comparisons
Model NFI
Delta1
RFI
rho1
IFI
Delta2
TLI
rho2 CFI
Default model 1.000
1.000
1.000
Saturated model 1.000
1.000
1.000

274 | P a g e
Model NFI
Delta1
RFI
rho1
IFI
Delta2
TLI
rho2 CFI
Independence model .000 .000 .000 .000 .000
RMSEA
Model RMSEA LO 90 HI 90 PCLOSE
Independence model .561 .511 .613 .000
Table 15 Amos Output of Competing Quality of Information Measurement model
after Removal of INFC4
Computation of degrees of freedom (Default model)
Number of distinct sample moments: 6
Number of distinct parameters to be estimated: 6
Degrees of freedom (6 - 6): 0
Result (Default model)
Minimum was achieved
Chi-square = .000
Degrees of freedom = 0
Probability level cannot be computed
Regression Weights: (Group number 1 - Default model)
Estimate S.E. C.R. P Label
INFC1 <--- INFC 1.000
INFC2 <--- INFC 1.009 .071 14.170 *** par_1
INFC3 <--- INFC .821 .065 12.613 *** par_2
Standardized Regression Weights: (Group number 1 - Default model)
Estimate

275 | P a g e
Estimate
INFC1 <--- INFC .840
INFC2 <--- INFC .849
INFC3 <--- INFC .679
Model Fit Summary
CMIN
Model NPAR CMIN DF P CMIN/DF
Default model 6 .000 0
Saturated model 6 .000 0
Independence model 3 418.475 3 .000 139.492
RMR, GFI
Model RMR GFI AGFI PGFI
Default model .000 1.000
Saturated model .000 1.000
Independence model .288 .562 .125 .281
Baseline Comparisons
Model NFI
Delta1
RFI
rho1
IFI
Delta2
TLI
rho2 CFI
Default model 1.000
1.000
1.000
Saturated model 1.000
1.000
1.000
Independence model .000 .000 .000 .000 .000
RMSEA
Model RMSEA LO 90 HI 90 PCLOSE
Independence model .629 .579 .681 .000

276 | P a g e
Table 16 Amos Output of Full Social Capital Measurement Model (Fit Construct)
Computation of degrees of freedom (Default model)
Number of distinct sample moments: 190
Number of distinct parameters to be estimated: 48
Degrees of freedom (190 - 48): 142
Result (Default model)
Minimum was achieved
Chi-square = 410.945
Degrees of freedom = 142
Probability level = .000
Regression Weights: (Group number 1 - Default model)
Estimate S.E. C.R. P Label
INTER1 <--- Interaction Ties 1.000
INTER2 <--- Interaction Ties .883 .080 11.106 *** par_1
INTER3 <--- Interaction Ties .913 .072 12.600 *** par_2
INTER4 <--- Interaction Ties 1.003 .072 13.928 *** par_3
SLAN1 <--- Shared Language 1.000
SLAN2 <--- Shared Language 1.093 .093 11.698 *** par_4
SLAN3 <--- Shared Language 1.202 .093 12.862 *** par_5
SLAN4 <--- Shared Language 1.076 .091 11.847 *** par_6
IDEN1 <--- Identification 1.000
IDEN2 <--- Identification 1.030 .066 15.495 *** par_7
IDEN3 <--- Identification 1.028 .077 13.355 *** par_8
IDEN4 <--- Identification .949 .069 13.804 *** par_9
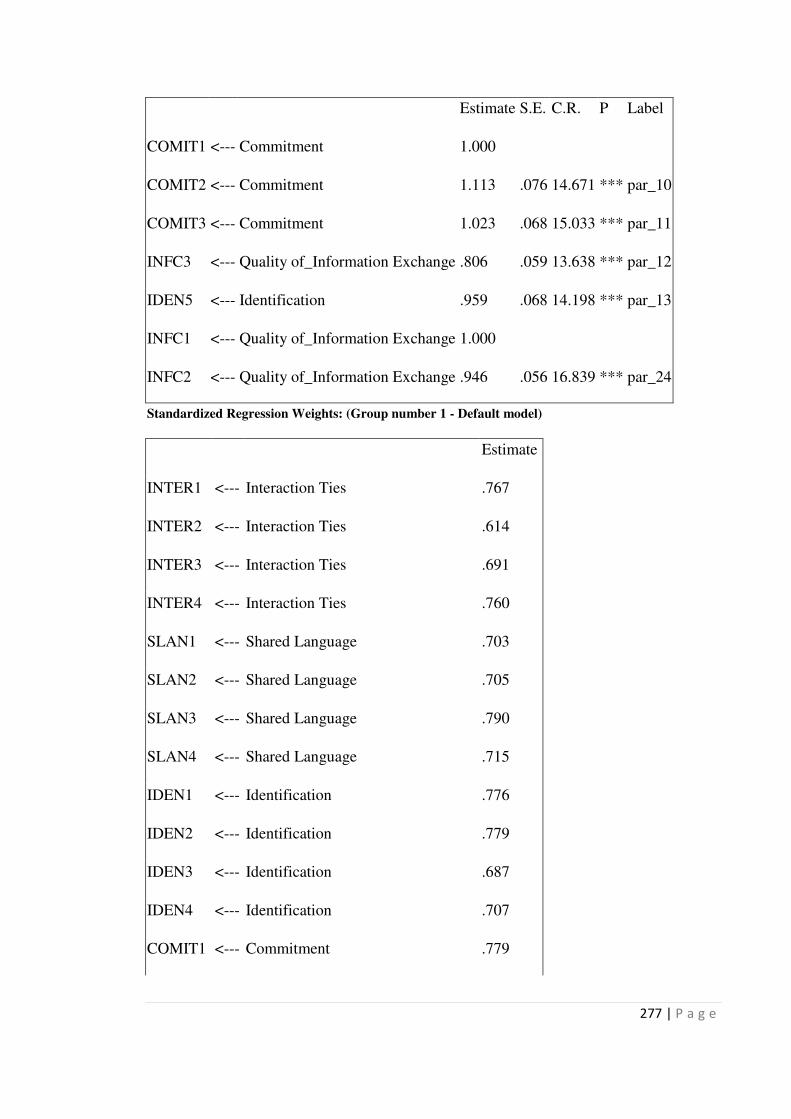
277 | P a g e
Estimate S.E. C.R. P Label
COMIT1 <--- Commitment 1.000
COMIT2 <--- Commitment 1.113 .076 14.671 *** par_10
COMIT3 <--- Commitment 1.023 .068 15.033 *** par_11
INFC3 <--- Quality of_Information Exchange .806 .059 13.638 *** par_12
IDEN5 <--- Identification .959 .068 14.198 *** par_13
INFC1 <--- Quality of_Information Exchange 1.000
INFC2 <--- Quality of_Information Exchange .946 .056 16.839 *** par_24
Standardized Regression Weights: (Group number 1 - Default model)
Estimate
INTER1 <--- Interaction Ties .767
INTER2 <--- Interaction Ties .614
INTER3 <--- Interaction Ties .691
INTER4 <--- Interaction Ties .760
SLAN1 <--- Shared Language .703
SLAN2 <--- Shared Language .705
SLAN3 <--- Shared Language .790
SLAN4 <--- Shared Language .715
IDEN1 <--- Identification .776
IDEN2 <--- Identification .779
IDEN3 <--- Identification .687
IDEN4 <--- Identification .707
COMIT1 <--- Commitment .779

278 | P a g e
Estimate
COMIT2 <--- Commitment .765
COMIT3 <--- Commitment .782
INFC3 <--- Quality of_Information Exchange .685
IDEN5 <--- Identification .724
INFC1 <--- Quality of_Information Exchange .864
INFC2 <--- Quality of_Information Exchange .819
Model Fit Summary
CMIN
Model NPAR CMIN DF P CMIN/DF
Default model 48 410.945 142 .000 2.894
Saturated model 190 .000 0
Independence model 19 3771.316 171 .000 22.054
RMR, GFI
Model RMR GFI AGFI PGFI
Default model .027 .896 .861 .670
Saturated model .000 1.000
Independence model .254 .220 .134 .198
Baseline Comparisons
Model NFI
Delta1
RFI
rho1
IFI
Delta2
TLI
rho2 CFI
Default model .891 .869 .926 .910 .925
Saturated model 1.000
1.000
1.000
Independence model .000 .000 .000 .000 .000
RMSEA

279 | P a g e
Model RMSEA LO 90 HI 90 PCLOSE
Default model .074 .065 .082 .000
Independence model .245 .238 .252 .000
Table 17 Amos output of Brand Awareness Measurement Model Estimate
Notes for Model (Default model)
Computation of degrees of freedom (Default model)
Number of distinct sample moments: 6
Number of distinct parameters to be estimated: 6
Degrees of freedom (6 - 6): 0
Result (Default model)
Minimum was achieved
Chi-square = .000
Degrees of freedom = 0
Probability level cannot be computed
Regression Weights: (Group number 1 - Default model)
Estimate S.E. C.R. P Label
BKA1 <--- BKA 1.000
BKA2 <--- BKA .945 .120 7.885 *** par_1
BKA3 <--- BKA .737 .093 7.884 *** par_2
Standardized Regression Weights: (Group number 1 - Default model)
Estimate
BKA1 <--- BKA .708
BKA2 <--- BKA .668
BKA3 <--- BKA .630
CMIN

280 | P a g e
Model NPAR CMIN DF P CMIN/DF
Default model 6 .000 0
Saturated model 6 .000 0
Independence
model 3 192.135 3 .000 64.045
RMR, GFI
Model RMR GFI AGFI PGFI
Default model .000 1.000
Saturated model .000 1.000
Independence
model .259 .714 .428 .357
Baseline Comparisons
Model NFI
Delta1
RFI
rho1
IFI
Delta2
TLI
rho2 CFI
Default model 1.000
1.000
1.000
Saturated model 1.000
1.000
1.000
Independence
model .000 .000 .000 .000 .000
RMSEA
Model RMSEA LO 90 HI 90 PCLOSE
Independence
model .424 .375 .476 .000
Table 18 Amos output of Brand Image Measurement Model Estimate
Computation of degrees of freedom (Default model)
Number of distinct sample moments: 28
Number of distinct parameters to be estimated: 14
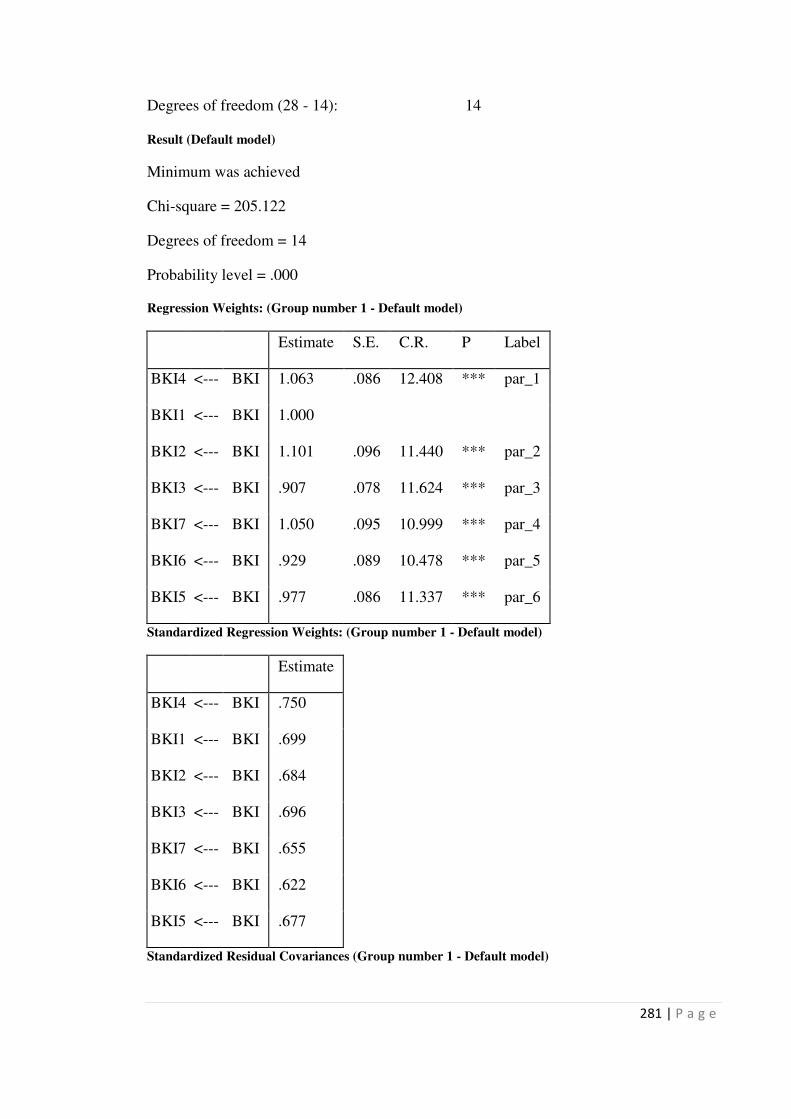
281 | P a g e
Degrees of freedom (28 - 14): 14
Result (Default model)
Minimum was achieved
Chi-square = 205.122
Degrees of freedom = 14
Probability level = .000
Regression Weights: (Group number 1 - Default model)
Estimate S.E. C.R. P Label
BKI4 <--- BKI 1.063 .086 12.408 *** par_1
BKI1 <--- BKI 1.000
BKI2 <--- BKI 1.101 .096 11.440 *** par_2
BKI3 <--- BKI .907 .078 11.624 *** par_3
BKI7 <--- BKI 1.050 .095 10.999 *** par_4
BKI6 <--- BKI .929 .089 10.478 *** par_5
BKI5 <--- BKI .977 .086 11.337 *** par_6
Standardized Regression Weights: (Group number 1 - Default model)
Estimate
BKI4 <--- BKI .750
BKI1 <--- BKI .699
BKI2 <--- BKI .684
BKI3 <--- BKI .696
BKI7 <--- BKI .655
BKI6 <--- BKI .622
BKI5 <--- BKI .677
Standardized Residual Covariances (Group number 1 - Default model)

282 | P a g e
BKI7 BKI6 BKI5 BKI4 BKI3 BKI2 BKI1
BKI7 .000
BKI6 4.085 .000
BKI5 .027 1.559 .000
BKI4 -.093 .030 .143 .000
BKI3 -2.878 -2.350 1.898 .203 .000
BKI2 -.217 -1.992 -1.420 -.393 1.809 .000
BKI1 .168 -.668 -1.887 .092 .417 1.637 .000
Modification Indices (Group number 1 - Default model)
Covariances: (Group number 1 - Default model)
M.I. Par Change
e6 <--> e7 67.183 .230
e5 <--> e6 10.550 .081
e3 <--> e7 42.906 -.150
e3 <--> e6 25.749 -.112
e3 <--> e5 20.159 .091
e2 <--> e6 17.670 -.116
e2 <--> e5 10.764 -.083
e2 <--> e3 18.771 .097
e1 <--> e5 20.090 -.099
e1 <--> e2 15.508 .097
Regression Weights: (Group number 1 - Default model)
M.I. Par Change
BKI7 <--- BKI6 38.041 .282
BKI7 <--- BKI3 19.569 -.232
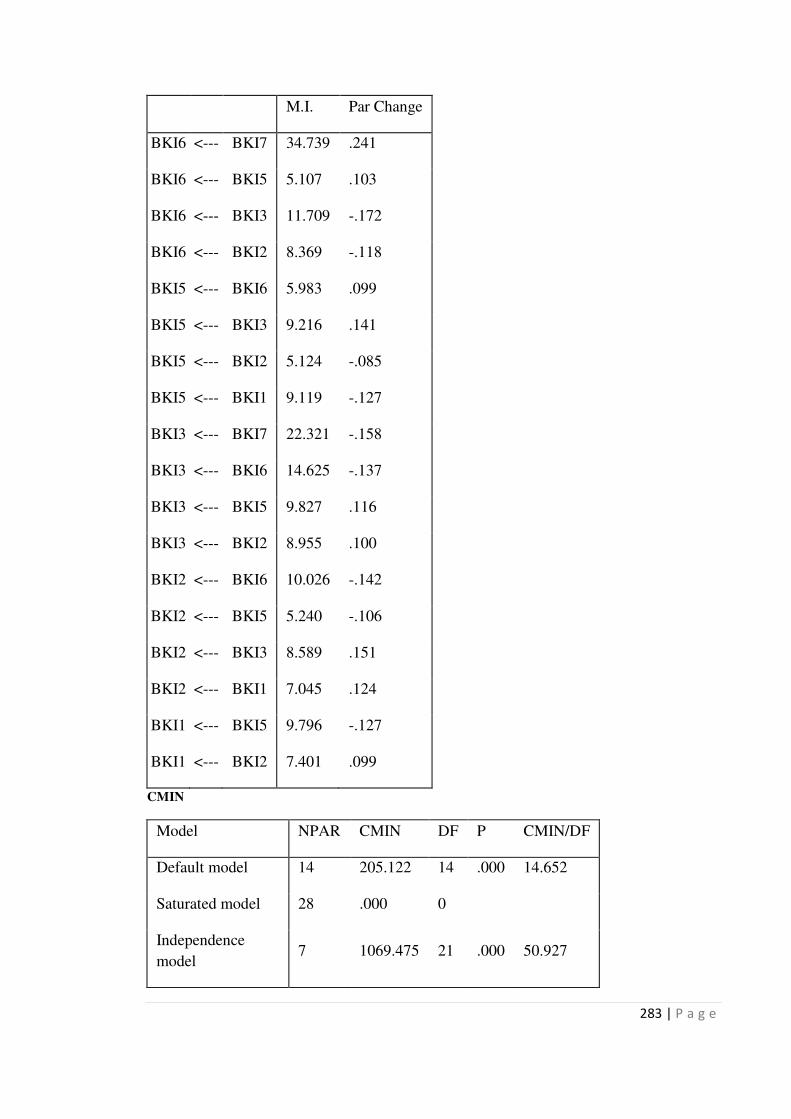
283 | P a g e
M.I. Par Change
BKI6 <--- BKI7 34.739 .241
BKI6 <--- BKI5 5.107 .103
BKI6 <--- BKI3 11.709 -.172
BKI6 <--- BKI2 8.369 -.118
BKI5 <--- BKI6 5.983 .099
BKI5 <--- BKI3 9.216 .141
BKI5 <--- BKI2 5.124 -.085
BKI5 <--- BKI1 9.119 -.127
BKI3 <--- BKI7 22.321 -.158
BKI3 <--- BKI6 14.625 -.137
BKI3 <--- BKI5 9.827 .116
BKI3 <--- BKI2 8.955 .100
BKI2 <--- BKI6 10.026 -.142
BKI2 <--- BKI5 5.240 -.106
BKI2 <--- BKI3 8.589 .151
BKI2 <--- BKI1 7.045 .124
BKI1 <--- BKI5 9.796 -.127
BKI1 <--- BKI2 7.401 .099
CMIN
Model NPAR CMIN DF P CMIN/DF
Default model 14 205.122 14 .000 14.652
Saturated model 28 .000 0
Independence
model 7 1069.475 21 .000 50.927

284 | P a g e
RMR, GFI
Model RMR GFI AGFI PGFI
Default model .060 .857 .714 .428
Saturated model .000 1.000
Independence
model .302 .422 .230 .317
Baseline Comparisons
Model NFI
Delta1
RFI
rho1
IFI
Delta2
TLI
rho2 CFI
Default model .808 .712 .819 .727 .818
Saturated model 1.000
1.000
1.000
Independence
model .000 .000 .000 .000 .000
RMSEA
Model RMSEA LO 90 HI 90 PCLOSE
Default model .197 .174 .222 .000
Independence
model .378 .359 .397 .000
Table 19 Amos Output of Competing Brand Image Measurement model after
Removal of BKI3
Computation of degrees of freedom (Default model)
Number of distinct sample moments: 21
Number of distinct parameters to be estimated: 12
Degrees of freedom (21 - 12): 9
Result (Default model)

285 | P a g e
Minimum was achieved
Chi-square = 95.918
Degrees of freedom = 9
Probability level = .000
Regression Weights: (Group number 1 - Default model)
Estimate S.E. C.R. P Label
BKI4 <--- BKI 1.073 .094 11.391 *** par_1
BKI1 <--- BKI 1.000
BKI2 <--- BKI 1.048 .104 10.065 *** par_2
BKI7 <--- BKI 1.230 .107 11.509 *** par_3
BKI6 <--- BKI 1.082 .098 10.995 *** par_4
BKI5 <--- BKI .965 .094 10.303 *** par_5
Standardized Regression Weights: (Group number 1 - Default model)
Estimate
BKI4 <--- BKI .728
BKI1 <--- BKI .672
BKI2 <--- BKI .627
BKI7 <--- BKI .738
BKI6 <--- BKI .696
BKI5 <--- BKI .644
Standardized Residual Covariances (Group number 1 - Default model)
BKI7 BKI6 BKI5 BKI4 BKI2 BKI1
BKI7 .000
BKI6 2.151 .000
BKI5 -.504 1.080 .000

286 | P a g e
BKI7 BKI6 BKI5 BKI4 BKI2 BKI1
BKI4 -.850 -.649 .808 .000
BKI2 -.454 -2.169 -.409 .568 .000
BKI1 -.472 -1.225 -1.218 .678 2.658 .000
Modification Indices (Group number 1 - Default model)
Covariances: (Group number 1 - Default model)
M.I. Par Change
e6 <--> e7 34.568 .145
e5 <--> e6 5.987 .059
e4 <--> e7 6.187 -.056
e2 <--> e6 22.872 -.131
e1 <--> e6 8.483 -.068
e1 <--> e5 6.939 -.063
e1 <--> e2 31.274 .150
Regression Weights: (Group number 1 - Default model)
M.I. Par Change
BKI7 <--- BKI6 15.793 .170
BKI6 <--- BKI7 13.306 .141
BKI6 <--- BKI2 12.739 -.138
BKI6 <--- BKI1 4.163 -.088
BKI2 <--- BKI6 10.249 -.151
BKI2 <--- BKI1 15.216 .193
BKI1 <--- BKI2 17.371 .157
Model Fit Summary
CMIN

287 | P a g e
Model NPAR CMIN DF P CMIN/DF
Default model 12 95.918 9 .000 10.658
Saturated model 21 .000 0
Independence
model 6 788.206 15 .000 52.547
RMR, GFI
Model RMR GFI AGFI PGFI
Default model .049 .912 .795 .391
Saturated model .000 1.000
Independence
model .305 .470 .258 .336
Baseline Comparisons
Model NFI
Delta1
RFI
rho1
IFI
Delta2
TLI
rho2 CFI
Default model .878 .797 .888 .813 .888
Saturated model 1.000
1.000
1.000
Independence
model .000 .000 .000 .000 .000
RMSEA
Model RMSEA LO 90 HI 90 PCLOSE
Default model .166 .137 .197 .000
Independence
model .384 .361 .407 .000
Table 20 Amos Output of Competing Brand Image Measurement model after
Removal of BKI6
Computation of degrees of freedom (Default model)

288 | P a g e
Number of distinct sample moments: 21
Number of distinct parameters to be estimated: 12
Degrees of freedom (21 - 12): 9
Result (Default model)
Minimum was achieved
Chi-square = 99.178
Degrees of freedom = 9
Probability level = .000
Regression Weights: (Group number 1 - Default model)
Estimate S.E. C.R. P Label
BKI4 <--- BKI 1.029 .084 12.314 *** par_1
BKI1 <--- BKI 1.000
BKI2 <--- BKI 1.142 .095 12.075 *** par_2
BKI3 <--- BKI .951 .077 12.376 *** par_3
BKI7 <--- BKI .923 .093 9.946 *** par_4
BKI5 <--- BKI .921 .084 10.966 *** par_5
Standardized Regression Weights: (Group number 1 - Default model)
Estimate
BKI4 <--- BKI .739
BKI1 <--- BKI .711
BKI2 <--- BKI .723
BKI3 <--- BKI .744
BKI7 <--- BKI .587
BKI5 <--- BKI .651
Standardized Residual Covariances (Group number 1 - Default model)

289 | P a g e
BKI7 BKI5 BKI4 BKI3 BKI2 BKI1
BKI7 .000
BKI5 1.117 .000
BKI4 .899 .604 .000
BKI3 -2.553 1.689 -.246 .000
BKI2 .201 -1.530 -.738 .761 .000
BKI1 .870 -1.716 .062 -.291 1.012 .000
Modification Indices (Group number 1 - Default model)
Covariances: (Group number 1 - Default model)
M.I. Par Change
e5 <--> e7 4.540 .060
e4 <--> e7 4.173 .052
e3 <--> e7 34.394 -.136
e3 <--> e5 18.205 .085
e2 <--> e5 13.541 -.092
e2 <--> e4 4.493 -.048
e2 <--> e3 4.880 .046
e1 <--> e5 16.208 -.091
e1 <--> e2 7.446 .064
Regression Weights: (Group number 1 - Default model)
M.I. Par Change
BKI7 <--- BKI3 12.821 -.199
BKI5 <--- BKI3 6.841 .124
BKI5 <--- BKI2 5.552 -.091
BKI5 <--- BKI1 6.950 -.114
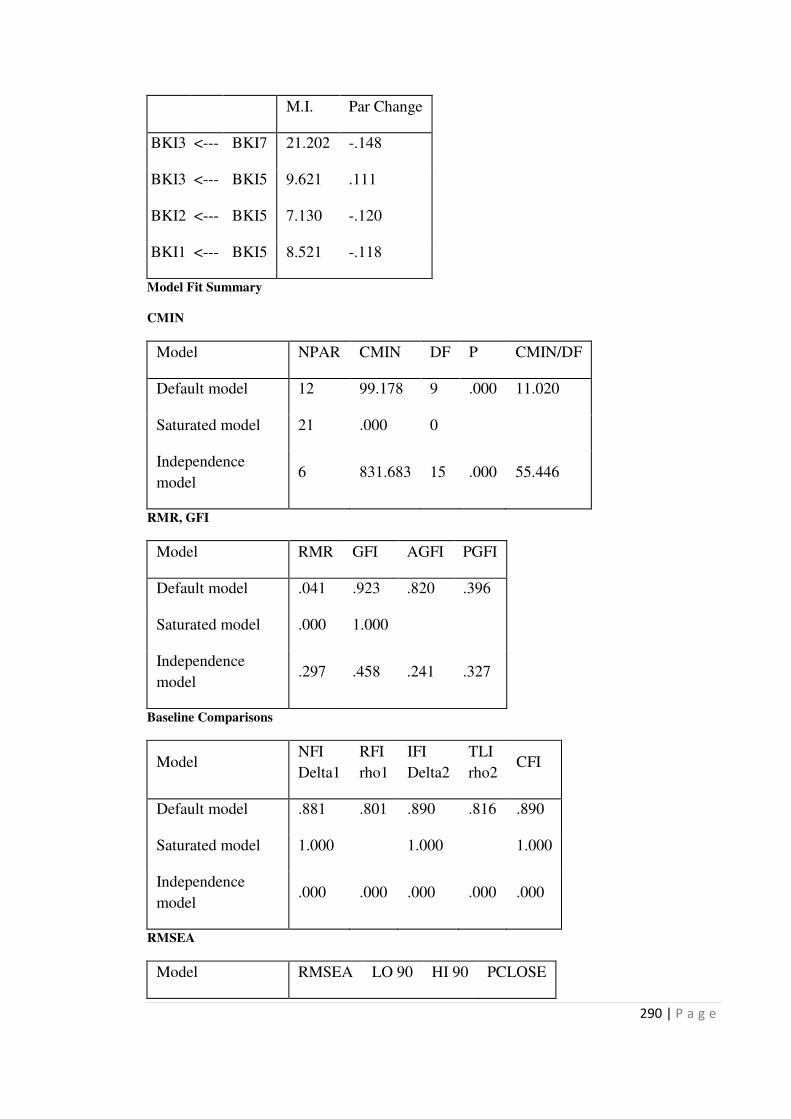
290 | P a g e
M.I. Par Change
BKI3 <--- BKI7 21.202 -.148
BKI3 <--- BKI5 9.621 .111
BKI2 <--- BKI5 7.130 -.120
BKI1 <--- BKI5 8.521 -.118
Model Fit Summary
CMIN
Model NPAR CMIN DF P CMIN/DF
Default model 12 99.178 9 .000 11.020
Saturated model 21 .000 0
Independence
model 6 831.683 15 .000 55.446
RMR, GFI
Model RMR GFI AGFI PGFI
Default model .041 .923 .820 .396
Saturated model .000 1.000
Independence
model .297 .458 .241 .327
Baseline Comparisons
Model NFI
Delta1
RFI
rho1
IFI
Delta2
TLI
rho2 CFI
Default model .881 .801 .890 .816 .890
Saturated model 1.000
1.000
1.000
Independence
model .000 .000 .000 .000 .000
RMSEA
Model RMSEA LO 90 HI 90 PCLOSE

291 | P a g e
Model RMSEA LO 90 HI 90 PCLOSE
Default model .169 .140 .200 .000
Independence
model .394 .372 .417 .000
Table 21 Amos Output of Competing Brand Image Measurement model after
Removal of BKI3 & BKI6
Computation of degrees of freedom (Default model)
Number of distinct sample moments: 15
Number of distinct parameters to be estimated: 10
Degrees of freedom (15 - 10): 5
Result (Default model)
Minimum was achieved
Chi-square = 24.270
Degrees of freedom = 5
Probability level = .000
Regression Weights: (Group number 1 - Default model)
Estimate S.E. C.R. P Label
BKI4 <--- BKI 1.024 .086 11.946 *** par_1
BKI1 <--- BKI 1.000
BKI2 <--- BKI 1.079 .096 11.279 *** par_2
BKI7 <--- BKI 1.017 .095 10.753 *** par_3
BKI5 <--- BKI .842 .084 9.967 *** par_4
Standardized Regression Weights: (Group number 1 - Default model)
Estimate
BKI4 <--- BKI .748
BKI1 <--- BKI .723
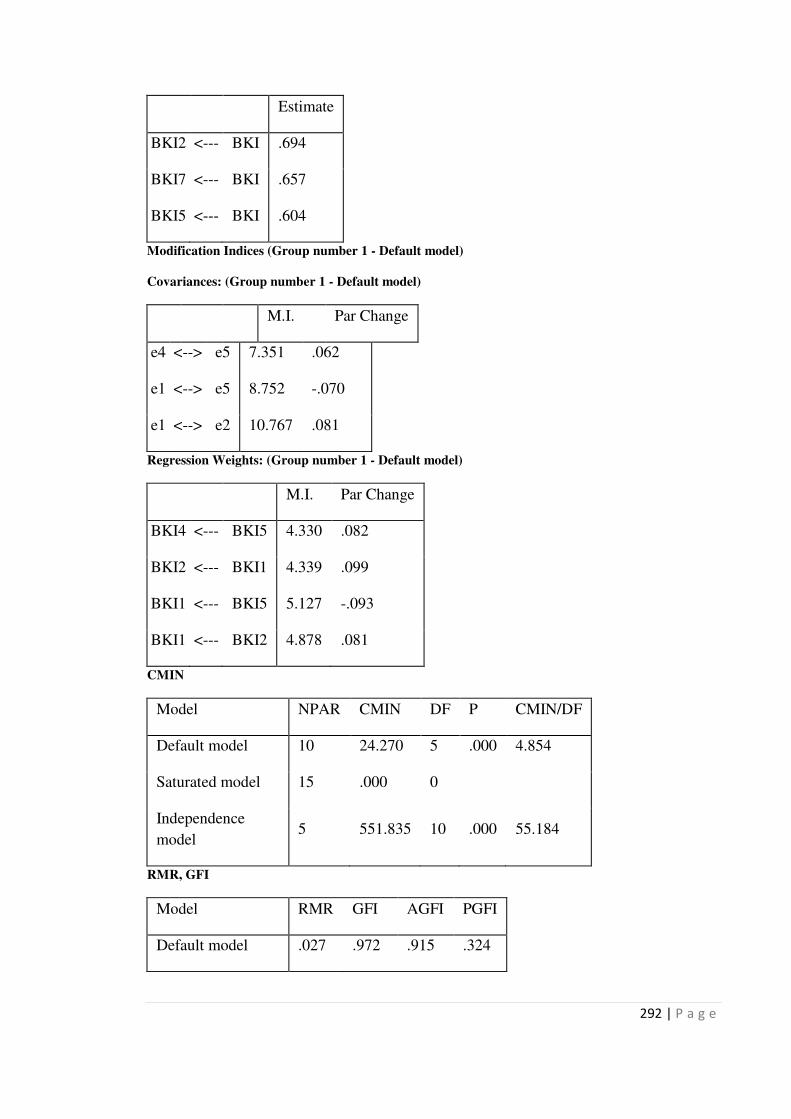
292 | P a g e
Estimate
BKI2 <--- BKI .694
BKI7 <--- BKI .657
BKI5 <--- BKI .604
Modification Indices (Group number 1 - Default model)
Covariances: (Group number 1 - Default model)
M.I. Par Change
e4 <--> e5 7.351 .062
e1 <--> e5 8.752 -.070
e1 <--> e2 10.767 .081
Regression Weights: (Group number 1 - Default model)
M.I. Par Change
BKI4 <--- BKI5 4.330 .082
BKI2 <--- BKI1 4.339 .099
BKI1 <--- BKI5 5.127 -.093
BKI1 <--- BKI2 4.878 .081
CMIN
Model NPAR CMIN DF P CMIN/DF
Default model 10 24.270 5 .000 4.854
Saturated model 15 .000 0
Independence
model 5 551.835 10 .000 55.184
RMR, GFI
Model RMR GFI AGFI PGFI
Default model .027 .972 .915 .324

293 | P a g e
Model RMR GFI AGFI PGFI
Saturated model .000 1.000
Independence
model .293 .528 .292 .352
Baseline Comparisons
Model NFI
Delta1
RFI
rho1
IFI
Delta2
TLI
rho2 CFI
Default model .956 .912 .965 .929 .964
Saturated model 1.000
1.000
1.000
Independence
model .000 .000 .000 .000 .000
RMSEA
Model RMSEA LO 90 HI 90 PCLOSE
Default model .105 .066 .148 .013
Independence
model .393 .366 .422 .000
Table 22 Amos output of Brand Knowledge Measurement Model (Fit Construct)
Computation of degrees of freedom (Default model)
Number of distinct sample moments: 36
Number of distinct parameters to be estimated: 18
Degrees of freedom (36 - 18): 18
Result (Default model)
Minimum was achieved
Chi-square = 60.914
Degrees of freedom = 18
Probability level = .000
Regression Weights: (Group number 1 - Default model)

294 | P a g e
Estimate S.E. C.R. P Label
BKA1 <--- BKA 1.000
BKA2 <--- BKA .739 .078 9.459 *** par_1
BKA3 <--- BKA .696 .065 10.658 *** par_2
BKI1 <--- BKI 1.000
BKI2 <--- BKI 1.090 .089 12.298 *** par_3
BKI4 <--- BKI 1.045 .091 11.480 *** par_4
BKI5 <--- BKI .949 .091 10.468 *** par_5
BKI7 <--- BKI 1.060 .101 10.516 *** par_7
Standardized Regression Weights: (Group number 1 - Default model)
Estimate
BKA1 <--- BKA .770
BKA2 <--- BKA .568
BKA3 <--- BKA .646
BKI1 <--- BKI .691
BKI2 <--- BKI .670
BKI4 <--- BKI .730
BKI5 <--- BKI .651
BKI7 <--- BKI .655
Model Fit Summary
CMIN
Model NPAR CMIN DF P CMIN/DF
Default model 18 60.914 18 .000 3.384

295 | P a g e
Model NPAR CMIN DF P CMIN/DF
Saturated model 36 .000 0
Independence model 8 990.564 28 .000 35.377
RMR, GFI
Model RMR GFI AGFI PGFI
Default model .032 .961 .922 .480
Saturated model .000 1.000
Independence model .296 .434 .273 .338
Baseline Comparisons
Model NFI
Delta1
RFI
rho1
IFI
Delta2
TLI
rho2 CFI
Default model .939 .904 .956 .931 .955
Saturated model 1.000
1.000
1.000
Independence model .000 .000 .000 .000 .000
RMSEA
Model RMSEA LO 90 HI 90 PCLOSE
Default model .083 .060 .106 .010
Independence model .313 .297 .330 .000

296 | P a g e
Table 23 Correlation Matrix
INTER SLAN IDEN COMIT Quality INFC Quantity INFC BKA BKI
INTER Pearson Correlation 1 .535** .733
** .639
** .507
** .106
* .523
** .511
**
Sig. (2-tailed) .000 .000 .000 .000 .048 .000 .000
N 351 351 351 351 351 351 351 351
SLAN Pearson Correlation .535** 1 .589
** .574
** .577
** .004 .520
** .555
**
Sig. (2-tailed) .000 .000 .000 .000 .948 .000 .000
N 351 351 351 351 351 351 351 351
IDEN Pearson Correlation .733** .589
** 1 .774
** .620
** .149
** .609
** .613
**
Sig. (2-tailed) .000 .000 .000 .000 .005 .000 .000
N 351 351 351 351 351 351 351 351
COMIT Pearson Correlation .639** .574
** .774
** 1 .533
** .130
* .501
** .570
**
Sig. (2-tailed) .000 .000 .000 .000 .015 .000 .000
N 351 351 351 351 351 351 351 351
Quality INFC Pearson Correlation .507** .577
** .620
** .533
** 1 .080 .561
** .648
**
Sig. (2-tailed) .000 .000 .000 .000 .133 .000 .000
N 351 351 351 351 351 351 351 351
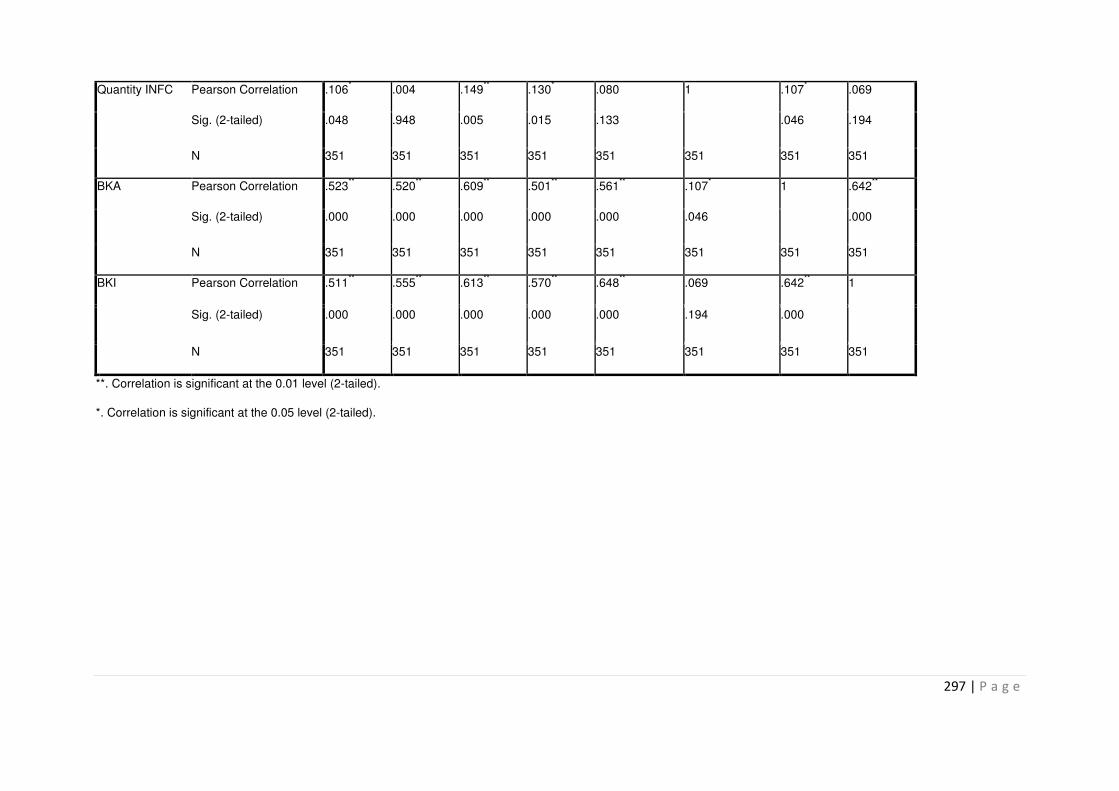
297 | P a g e
Quantity INFC Pearson Correlation .106* .004 .149
** .130
* .080 1 .107
* .069
Sig. (2-tailed) .048 .948 .005 .015 .133 .046 .194
N 351 351 351 351 351 351 351 351
BKA Pearson Correlation .523** .520
** .609
** .501
** .561
** .107
* 1 .642
**
Sig. (2-tailed) .000 .000 .000 .000 .000 .046 .000
N 351 351 351 351 351 351 351 351
BKI Pearson Correlation .511** .555
** .613
** .570
** .648
** .069 .642
** 1
Sig. (2-tailed) .000 .000 .000 .000 .000 .194 .000
N 351 351 351 351 351 351 351 351
**. Correlation is significant at the 0.01 level (2-tailed).
*. Correlation is significant at the 0.05 level (2-tailed).
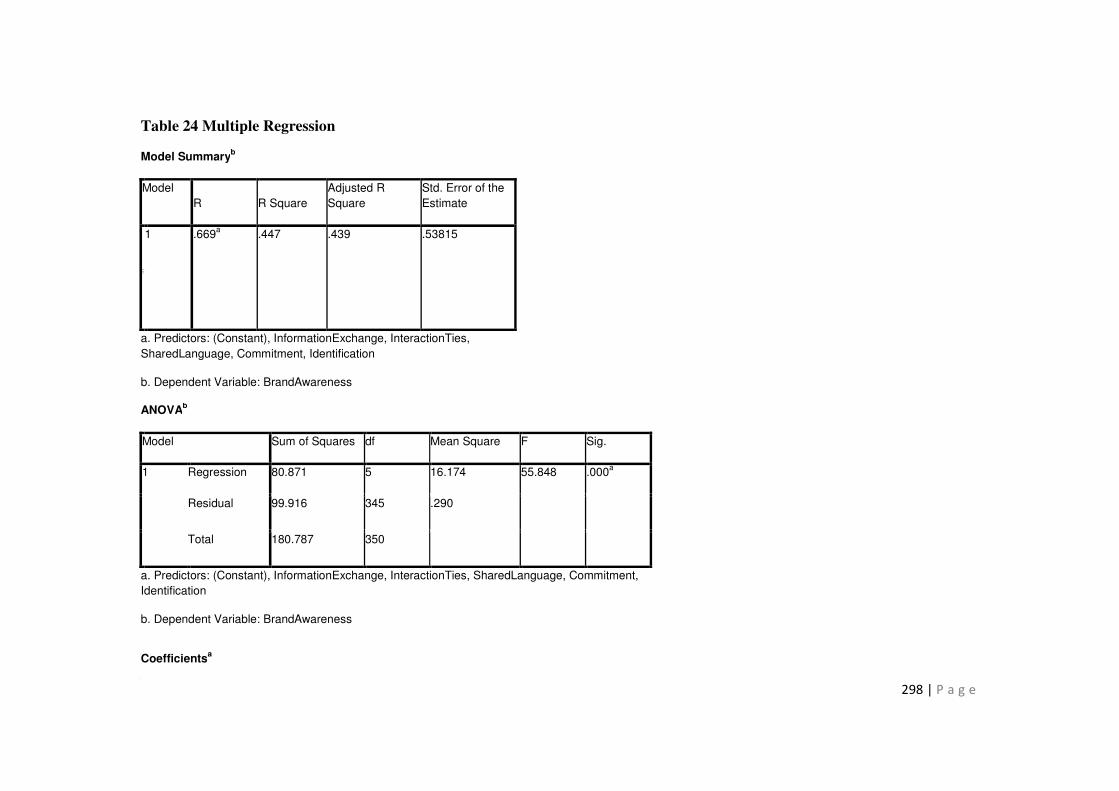
298 | P a g e
Table 24 Multiple Regression
Model Summaryb
Model
R R Square
Adjusted R
Square
Std. Error of the
Estimate
dim
ensi
on0
1 .669a .447 .439 .53815
a. Predictors: (Constant), InformationExchange, InteractionTies,
SharedLanguage, Commitment, Identification
b. Dependent Variable: BrandAwareness
ANOVAb
Model Sum of Squares df Mean Square F Sig.
1 Regression 80.871 5 16.174 55.848 .000a
Residual 99.916 345 .290
Total 180.787 350
a. Predictors: (Constant), InformationExchange, InteractionTies, SharedLanguage, Commitment,
Identification
b. Dependent Variable: BrandAwareness
Coefficientsa

299 | P a g e
Model Unstandardized
Coefficients
Standardized
Coefficients
t Sig.
95.0% Confidence Interval for B Correlations Collinearity Statistics
B
Std.
Error Beta Lower Bound Upper Bound Zero-order Partial Part Tolerance VIF
1 (Constant) .400 .201 1.989 .048 .004 .796
InteractionTies .121 .068 .108 1.783 .076 -.013 .255 .523 .096 .071 .439 2.280
SharedLanguage .183 .063 .157 2.903 .004 .059 .307 .520 .154 .116 .545 1.834
Identification .368 .091 .309 4.038 .000 .189 .548 .609 .212 .162 .273 3.659
Commitment -.025 .072 -.023 -.346 .730 -.165 .116 .501 -.019 -.014 .373 2.683
InformationExchange .242 .056 .236 4.349 .000 .133 .352 .561 .228 .174 .546 1.832
a. Dependent Variable: BrandAwareness
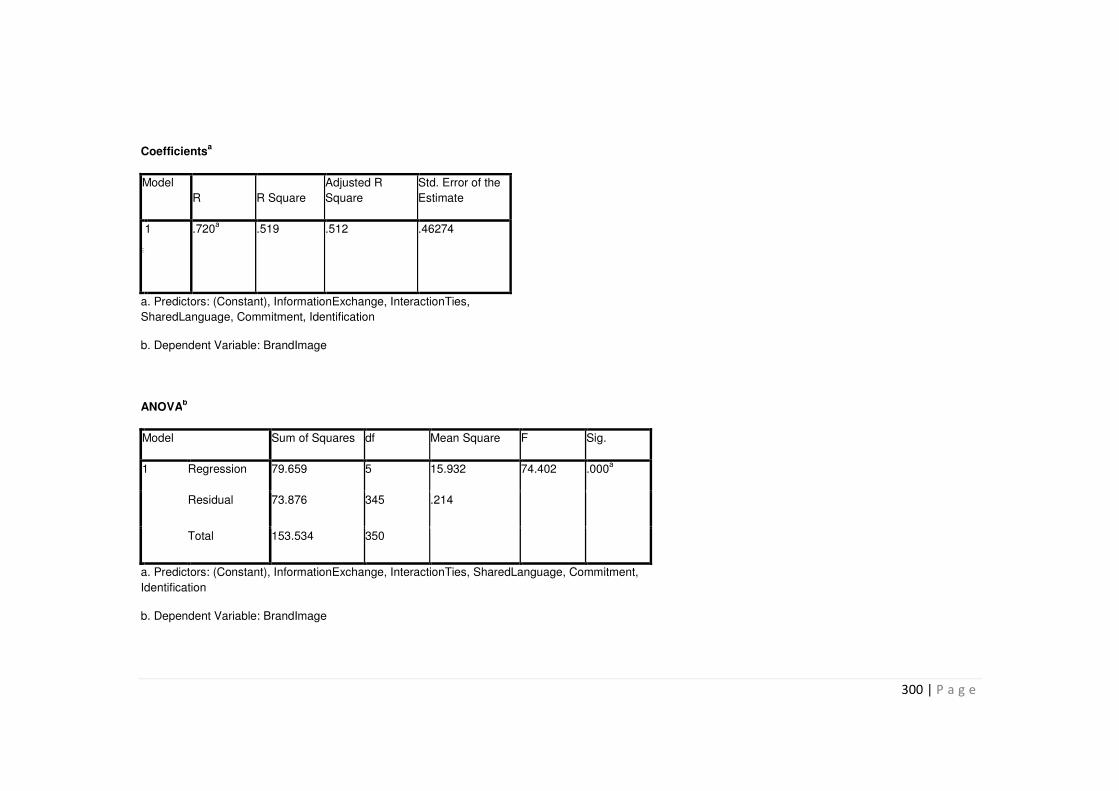
300 | P a g e
Model
R R Square
Adjusted R
Square
Std. Error of the
Estimate
dim
ensi
on0
1 .720a .519 .512 .46274
a. Predictors: (Constant), InformationExchange, InteractionTies,
SharedLanguage, Commitment, Identification
b. Dependent Variable: BrandImage
ANOVAb
Model Sum of Squares df Mean Square F Sig.
1 Regression 79.659 5 15.932 74.402 .000a
Residual 73.876 345 .214
Total 153.534 350
a. Predictors: (Constant), InformationExchange, InteractionTies, SharedLanguage, Commitment,
Identification
b. Dependent Variable: BrandImage
Coefficientsa

301 | P a g e
Model
Unstandardized
Coefficients
Standardized
Coefficients
t Sig.
95.0% Confidence Interval for B Correlations Collinearity Statistics
B Std. Error Beta Lower Bound Upper Bound Zero-order Partial Part Tolerance VIF
1 (Constant) .501 .173 2.896 .004 .161 .841
InteractionTies .040 .058 .039 .693 .489 -.074 .155 .511 .037 .026 .439 2.280
SharedLanguage .158 .054 .147 2.903 .004 .051 .264 .555 .154 .108 .545 1.834
Identification .176 .078 .160 2.245 .025 .022 .330 .613 .120 .084 .273 3.659
Commitment .140 .062 .139 2.271 .024 .019 .261 .570 .121 .085 .373 2.683
InformationExchange .351 .048 .370 7.324 .000 .256 .445 .648 .367 .274 .546 1.832
a. Dependent Variable: BrandImage

302 | P a g e
Appendix B Survey Questionnaire (English Version)

303 | P a g e
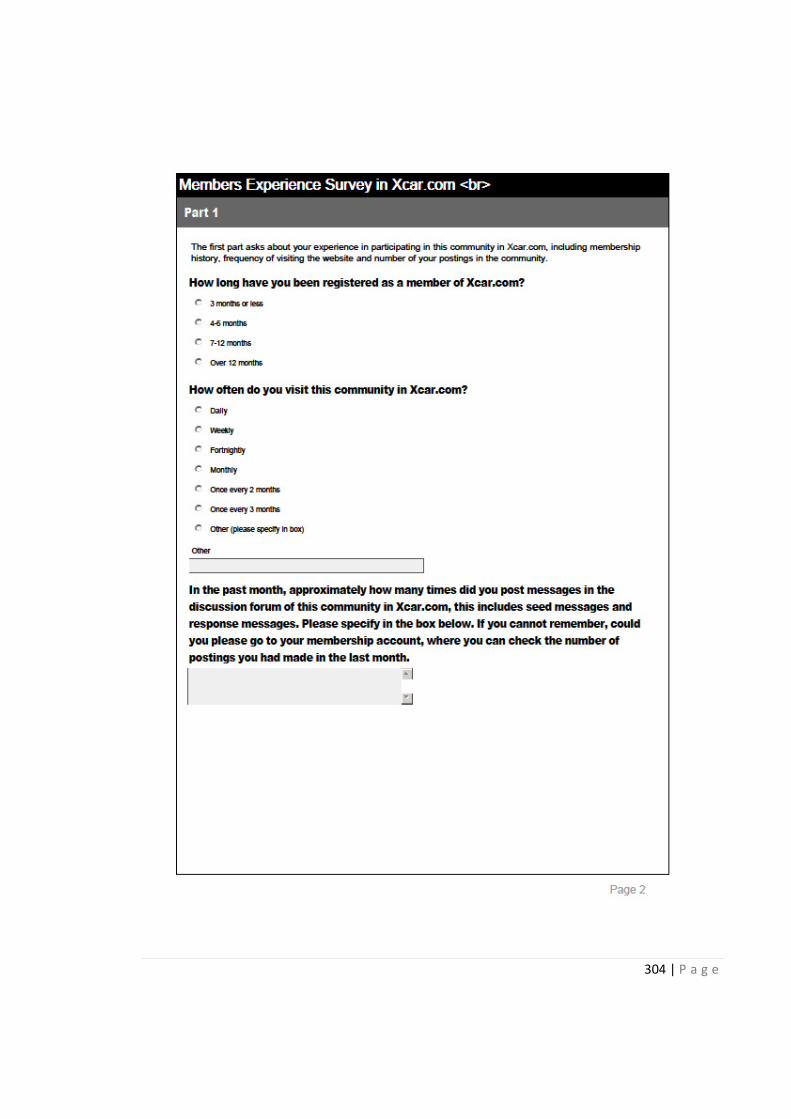
304 | P a g e
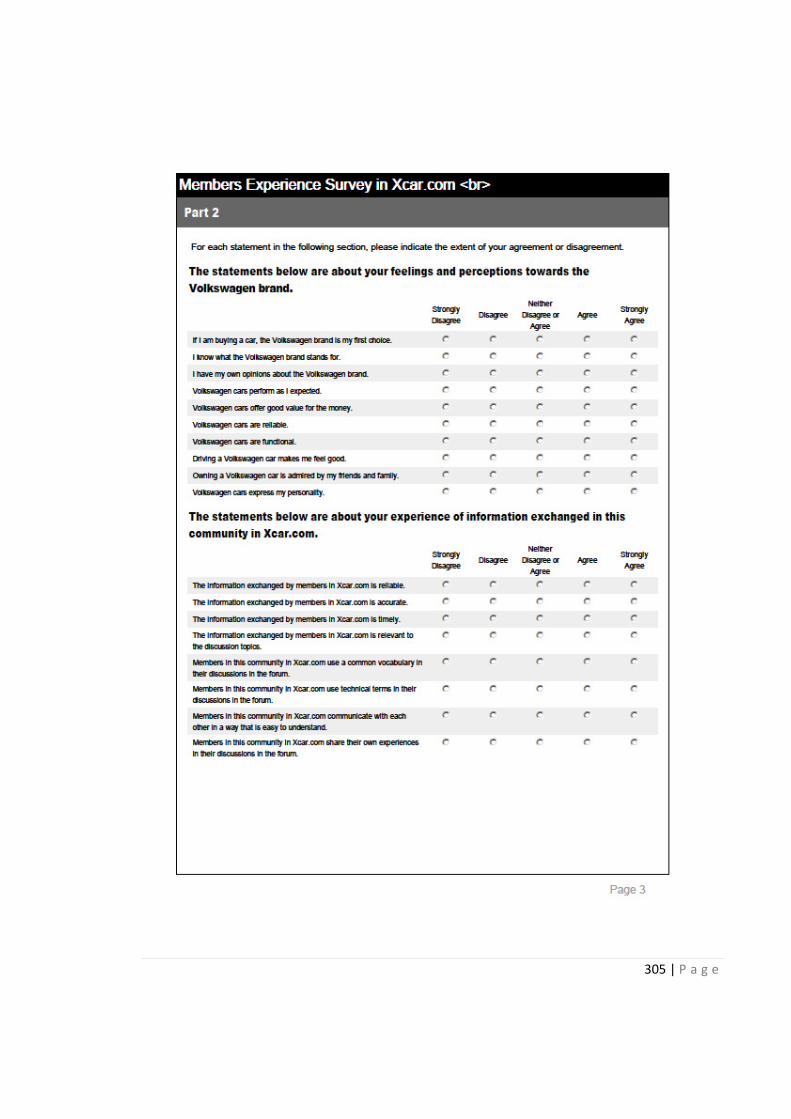
305 | P a g e
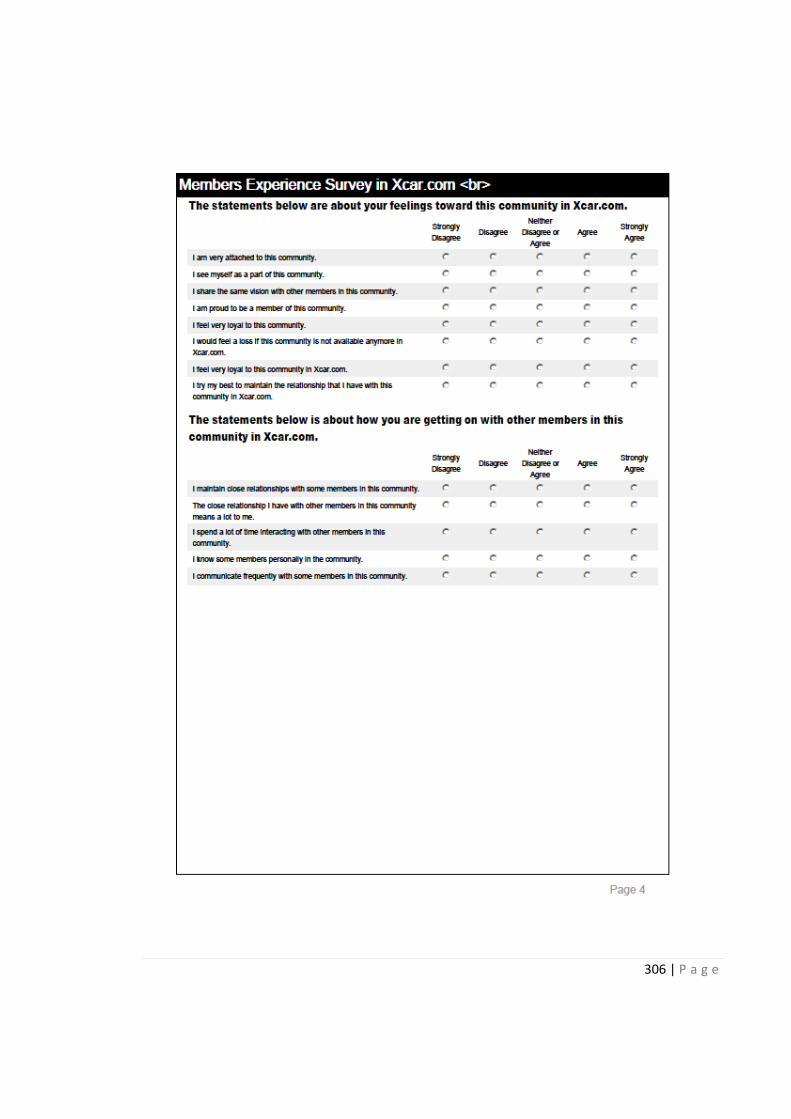
306 | P a g e
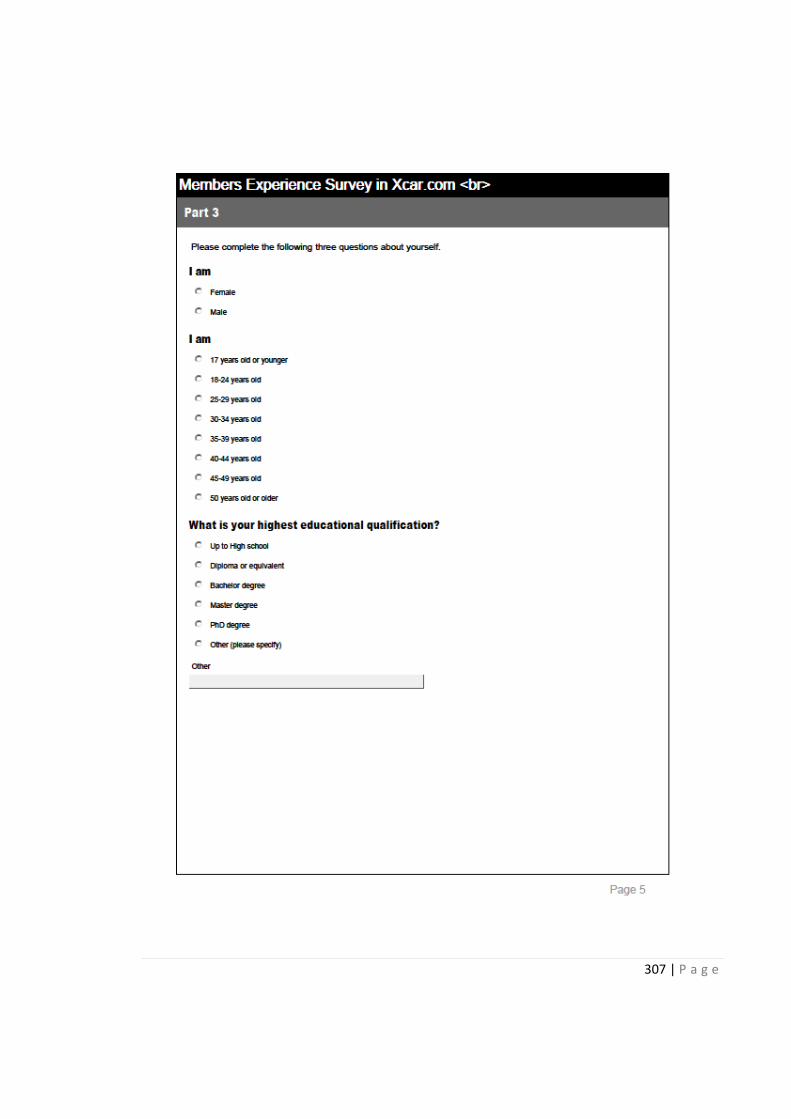
307 | P a g e
308 | P a g e
Appendix C Survey Questionnaire (Chinese Version)

309 | P a g e

310 | P a g e
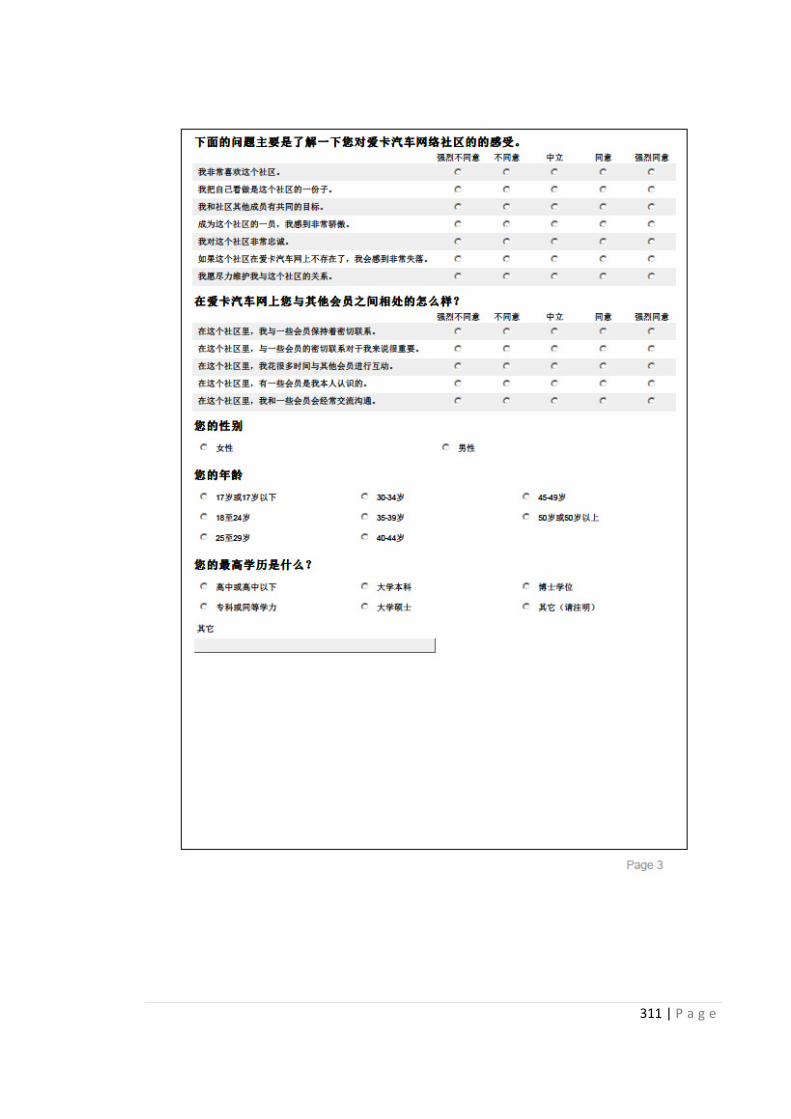
311 | P a g e

312 | P a g e
Appendix D Screenshot of Volkswagen’s Cooperated
Website in China

313 | P a g e
Volkswagen’
Company-
sponsored
fan-page in
Sina weibo
(China’s
twitter)
Volkswagen’s
cooperated
website in
China- the
multimedia
page
314 | P a g e
Volkswagen’s
company-
sponsored fan-
page in
Kaixin.com
Volkswagen’s
company-
sponsored fan-
page in
Kaixin.com
(China’s

315 | P a g e
Appendix E Screenshot of Xcar.com

316 | P a g e
Home
page of
Xcar.com
The directory
of
Volkswagen’s
consumer-
initiated OBCs
on Xcar.com

317 | P a g e
Example of
Volkswagen’
s consumer-
initiated
OBCs-Polo
Example of
Volkswagen’s
consumer-
initiated OBCs-
Golf GTI

318 | P a g e
User’s profile
page on
Xcar.com