Embed Size (px)
Citation preview
Bin
gham
ton
Inve
stm
ent
Fun
d |
Sn
ap-O
n I
nc.
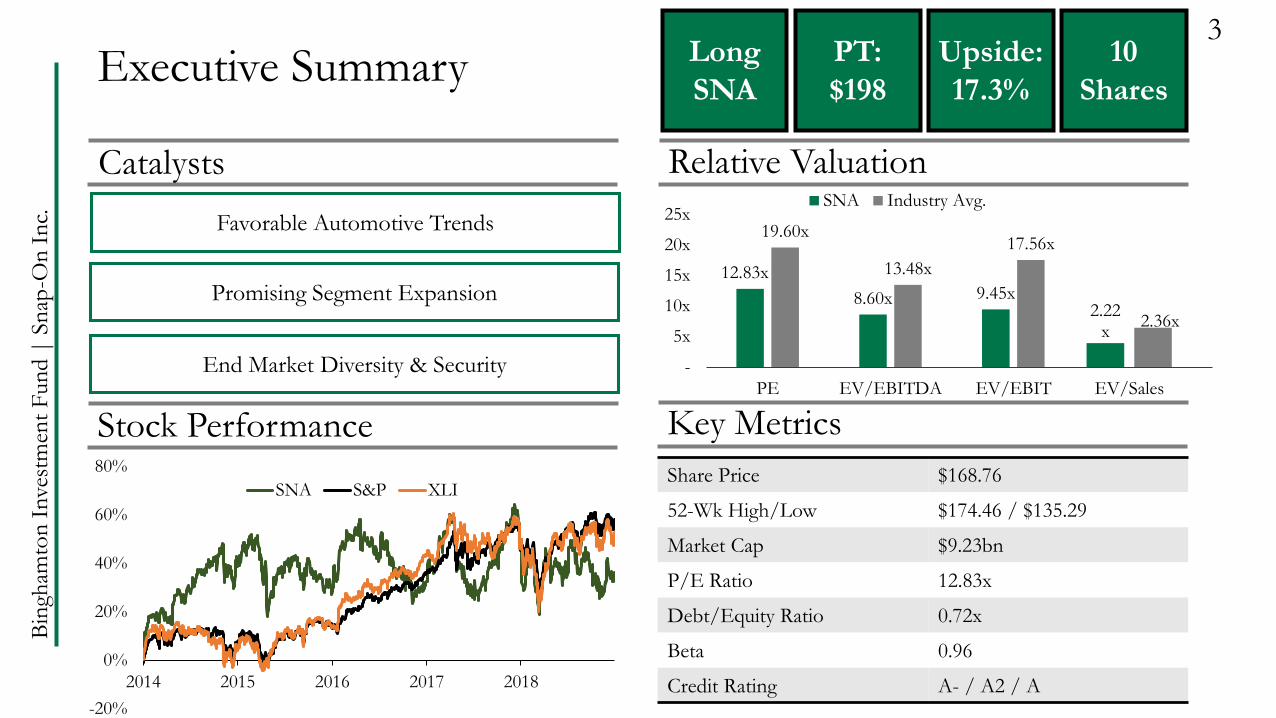
NYSE: SNA | Price Target: $198 | Upside: 17.3% | 10 Shares
Snap-On Inc. Sector Head: Vienna BuscherJunior Analyst: Christopher SucheckiNovember 5, 2019
BINGHAMTONINVESTMENT FUND
Bin
gham
ton
Inve
stm
ent
Fun
d |
Sn
ap-O
n I
nc.
Agenda2
SNA Company Overview
Industry Overview
Valuation
Risks & Mitigations
SNA Market Position
Investment Thesis & Catalysts
Bin
gham
ton
Inve
stm
ent
Fun
d |
Sn
ap-O
n I
nc.
Executive Summary3
Catalysts Relative Valuation
Stock Performance Key Metrics
Favorable Automotive Trends
End Market Diversity & Security
Promising Segment Expansion12.83x
8.60x 9.45x
19.60x
13.48x
17.56x
-
5x
10x
15x
20x
25x
PE EV/EBITDA EV/EBIT
SNA Industry Avg.
2.22x
2.36x
EV/Sales
Long
SNA
PT:
$198
Upside:
17.3%
Share Price $168.76
52-Wk High/Low $174.46 / $135.29
Market Cap $9.23bn
P/E Ratio 12.83x
Debt/Equity Ratio 0.72x
Beta 0.96
Credit Rating A- / A2 / A-20%
0%
20%
40%
60%
80%
2014 2015 2016 2017 2018
SNA S&P XLI
10
Shares
Bin
gham
ton
Inve
stm
ent
Fun
d |
Sn
ap-O
n I
nc.
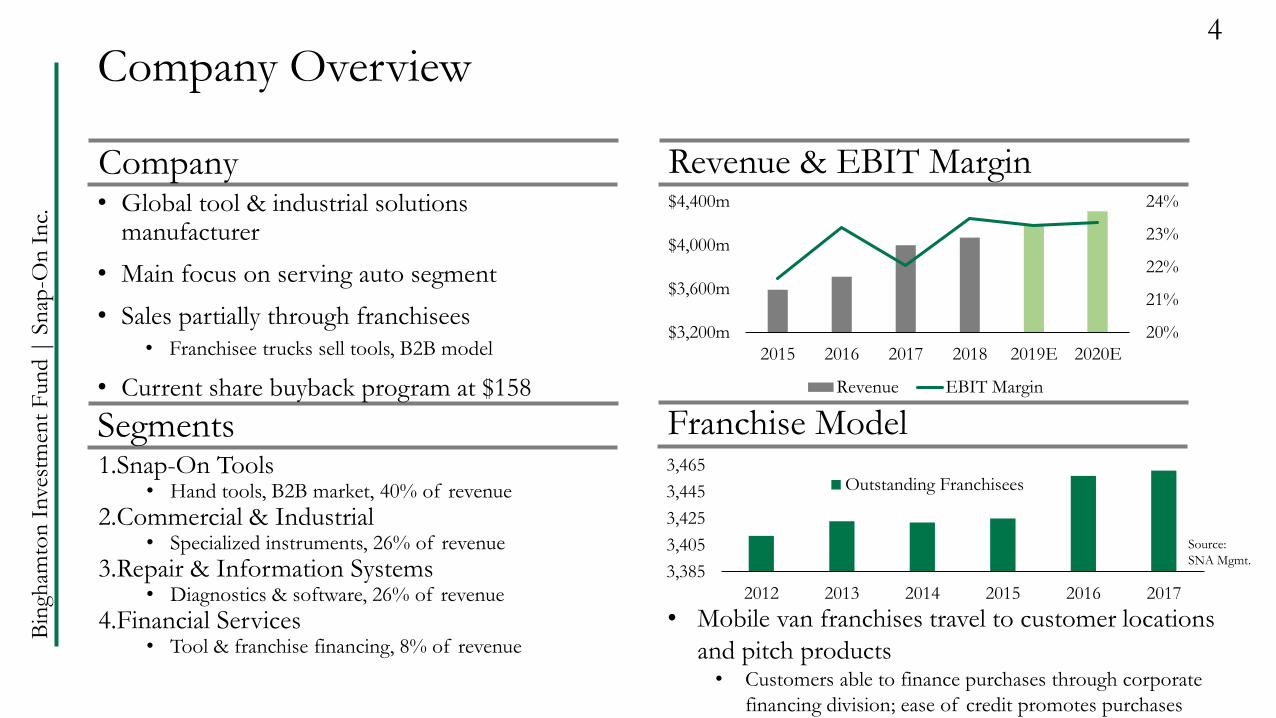
• Global tool & industrial solutions manufacturer
• Main focus on serving auto segment
• Sales partially through franchisees
• Franchisee trucks sell tools, B2B model
• Current share buyback program at $158
1.Snap-On Tools• Hand tools, B2B market, 40% of revenue
2.Commercial & Industrial• Specialized instruments, 26% of revenue
3.Repair & Information Systems• Diagnostics & software, 26% of revenue
4.Financial Services • Tool & franchise financing, 8% of revenue
Company Overview4
Company Revenue & EBIT Margin
Segments Franchise Model
20%
21%
22%
23%
24%
$3,200m
$3,600m
$4,000m
$4,400m
2015 2016 2017 2018 2019E 2020E
Revenue EBIT Margin
3,385
3,405
3,425
3,445
3,465
2012 2013 2014 2015 2016 2017
Outstanding Franchisees
• Mobile van franchises travel to customer locations
and pitch products• Customers able to finance purchases through corporate
financing division; ease of credit promotes purchases
Source:
SNA Mgmt.
Bin
gham
ton
Inve
stm
ent
Fun
d |
Sn
ap-O
n I
nc.
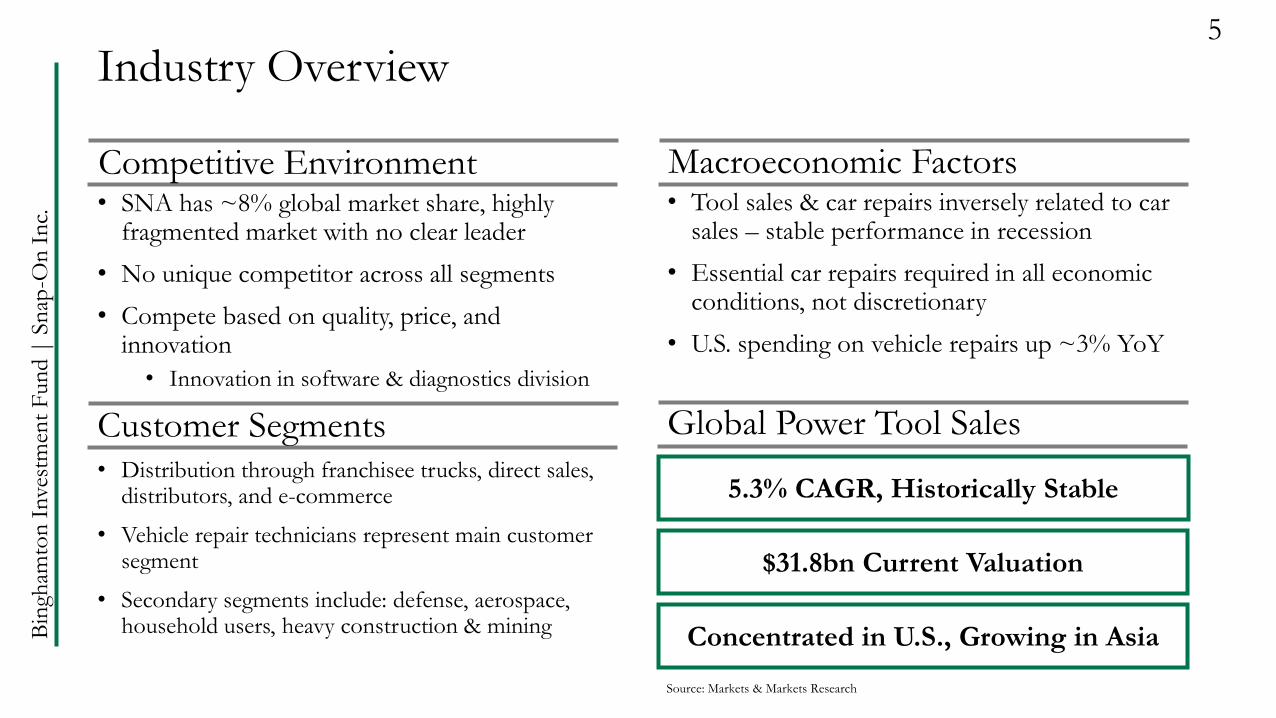
• SNA has ~8% global market share, highly fragmented market with no clear leader
• No unique competitor across all segments
• Compete based on quality, price, and innovation
• Innovation in software & diagnostics division
• Distribution through franchisee trucks, direct sales, distributors, and e-commerce
• Vehicle repair technicians represent main customer segment
• Secondary segments include: defense, aerospace, household users, heavy construction & mining
• Tool sales & car repairs inversely related to car sales – stable performance in recession
• Essential car repairs required in all economic conditions, not discretionary
• U.S. spending on vehicle repairs up ~3% YoY
Industry Overview5
Competitive Environment Macroeconomic Factors
Customer Segments Global Power Tool Sales
5.3% CAGR, Historically Stable
$31.8bn Current Valuation
Concentrated in U.S., Growing in Asia
Source: Markets & Markets Research
Bin
gham
ton
Inve
stm
ent
Fun
d |
Sn
ap-O
n I
nc.
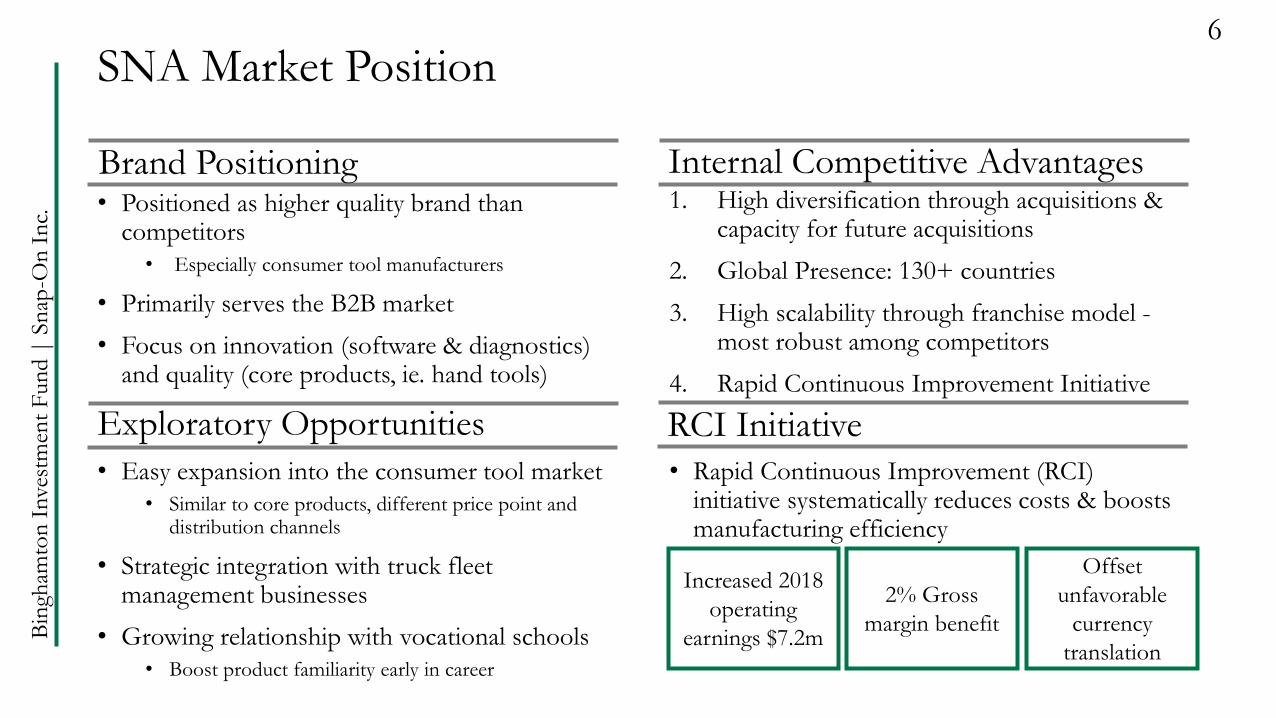
• Positioned as higher quality brand than competitors
• Especially consumer tool manufacturers
• Primarily serves the B2B market
• Focus on innovation (software & diagnostics) and quality (core products, ie. hand tools)
1. High diversification through acquisitions & capacity for future acquisitions
2. Global Presence: 130+ countries
3. High scalability through franchise model -most robust among competitors
4. Rapid Continuous Improvement Initiative
• Rapid Continuous Improvement (RCI) initiative systematically reduces costs & boosts manufacturing efficiency
SNA Market Position6
Brand Positioning Internal Competitive Advantages
Exploratory Opportunities RCI Initiative
Increased 2018
operating
earnings $7.2m
2% Gross
margin benefit
Offset
unfavorable
currency
translation
• Easy expansion into the consumer tool market
• Similar to core products, different price point and distribution channels
• Strategic integration with truck fleet management businesses
• Growing relationship with vocational schools
• Boost product familiarity early in career
Bin
gham
ton
Inve
stm
ent
Fun
d |
Sn
ap-O
n I
nc.
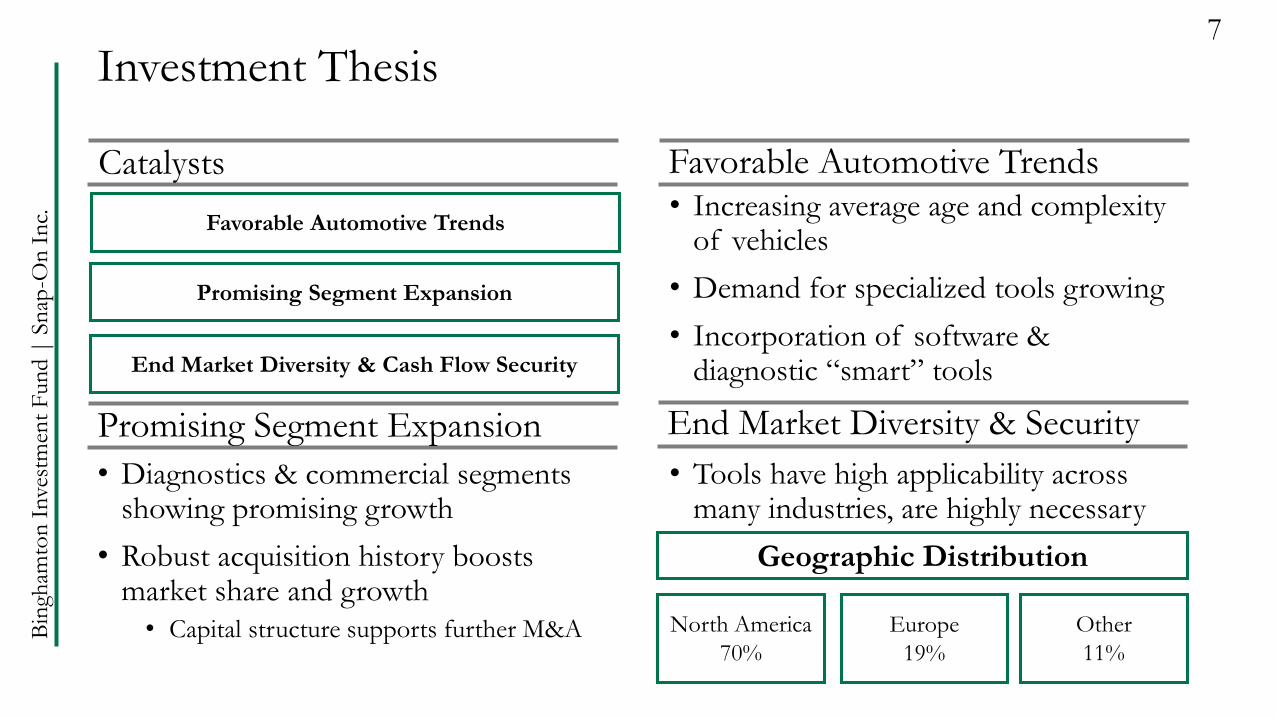
• Increasing average age and complexity of vehicles
• Demand for specialized tools growing
• Incorporation of software & diagnostic “smart” tools
• Diagnostics & commercial segments showing promising growth
• Robust acquisition history boosts market share and growth
• Capital structure supports further M&A
• Tools have high applicability across many industries, are highly necessary
Investment Thesis7
Catalysts Favorable Automotive Trends
Promising Segment Expansion End Market Diversity & Security
Favorable Automotive Trends
End Market Diversity & Cash Flow Security
Promising Segment Expansion
Geographic Distribution
North America
70%
Europe
19%
Other
11%
Bin
gham
ton
Inve
stm
ent
Fun
d |
Sn
ap-O
n I
nc.
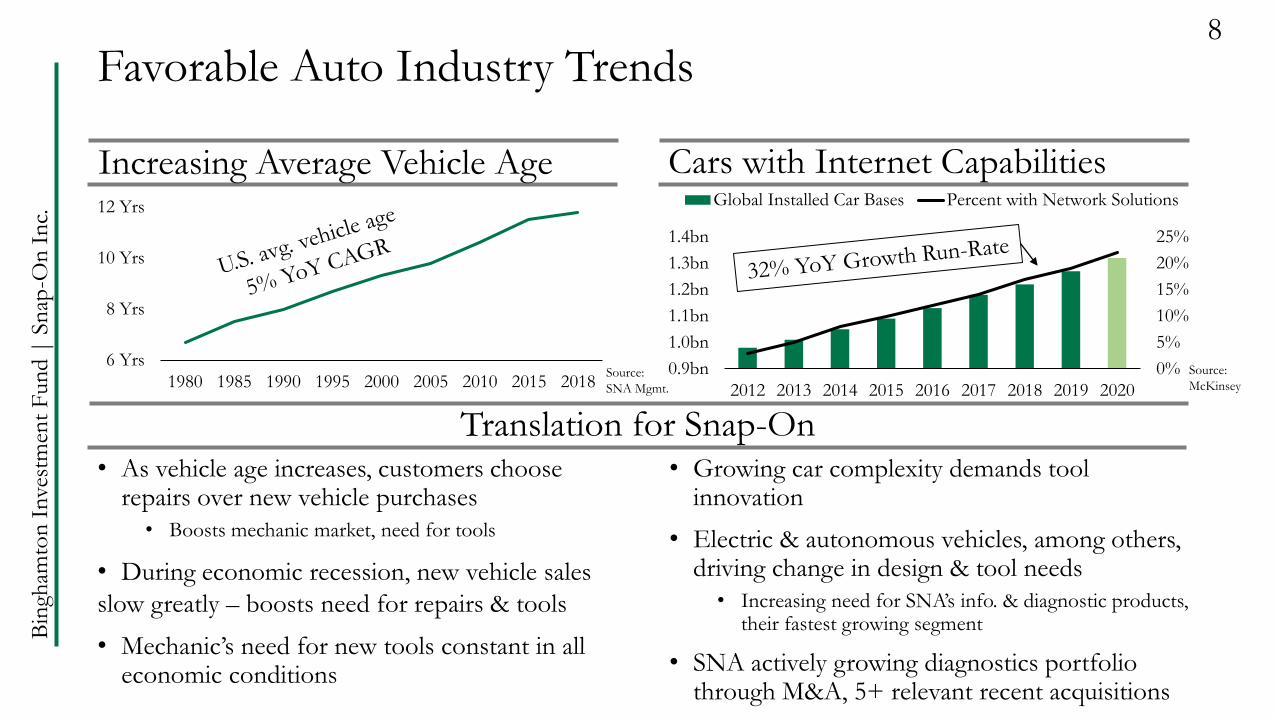
Translation for Snap-On• As vehicle age increases, customers choose
repairs over new vehicle purchases
• Boosts mechanic market, need for tools
• During economic recession, new vehicle sales
slow greatly – boosts need for repairs & tools
• Mechanic’s need for new tools constant in all economic conditions
• Growing car complexity demands tool innovation
• Electric & autonomous vehicles, among others, driving change in design & tool needs
• Increasing need for SNA’s info. & diagnostic products, their fastest growing segment
• SNA actively growing diagnostics portfolio through M&A, 5+ relevant recent acquisitions
Favorable Auto Industry Trends8
Increasing Average Vehicle Age Cars with Internet Capabilities
6 Yrs
8 Yrs
10 Yrs
12 Yrs
1980 1985 1990 1995 2000 2005 2010 2015 2018Source:
McKinseySource:
SNA Mgmt.
0%
5%
10%
15%
20%
25%
0.9bn
1.0bn
1.1bn
1.2bn
1.3bn
1.4bn
2012 2013 2014 2015 2016 2017 2018 2019 2020
Global Installed Car Bases Percent with Network Solutions
Bin
gham
ton
Inve
stm
ent
Fun
d |
Sn
ap-O
n I
nc.
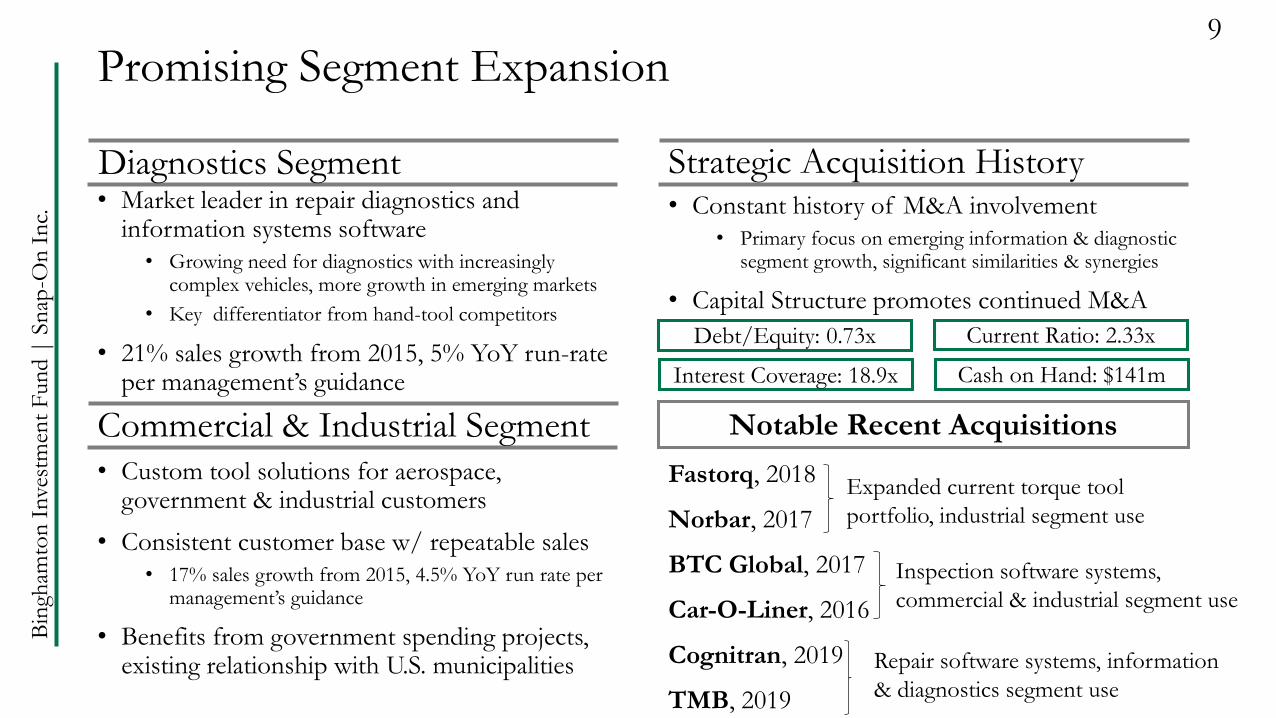
• Custom tool solutions for aerospace, government & industrial customers
• Consistent customer base w/ repeatable sales
• 17% sales growth from 2015, 4.5% YoY run rate per management’s guidance
• Benefits from government spending projects, existing relationship with U.S. municipalities
Promising Segment Expansion9
Diagnostics Segment Strategic Acquisition History
Commercial & Industrial Segment Notable Recent Acquisitions
Fastorq, 2018
Norbar, 2017
BTC Global, 2017
Car-O-Liner, 2016
Cognitran, 2019
TMB, 2019
Expanded current torque tool
portfolio, industrial segment use
Inspection software systems,
commercial & industrial segment use
Repair software systems, information
& diagnostics segment use
• Market leader in repair diagnostics and information systems software
• Growing need for diagnostics with increasingly complex vehicles, more growth in emerging markets
• Key differentiator from hand-tool competitors
• 21% sales growth from 2015, 5% YoY run-rate per management’s guidance
• Constant history of M&A involvement
• Primary focus on emerging information & diagnostic segment growth, significant similarities & synergies
• Capital Structure promotes continued M&A
Debt/Equity: 0.73x
Interest Coverage: 18.9x
Current Ratio: 2.33x
Cash on Hand: $141m
Bin
gham
ton
Inve
stm
ent
Fun
d |
Sn
ap-O
n I
nc.
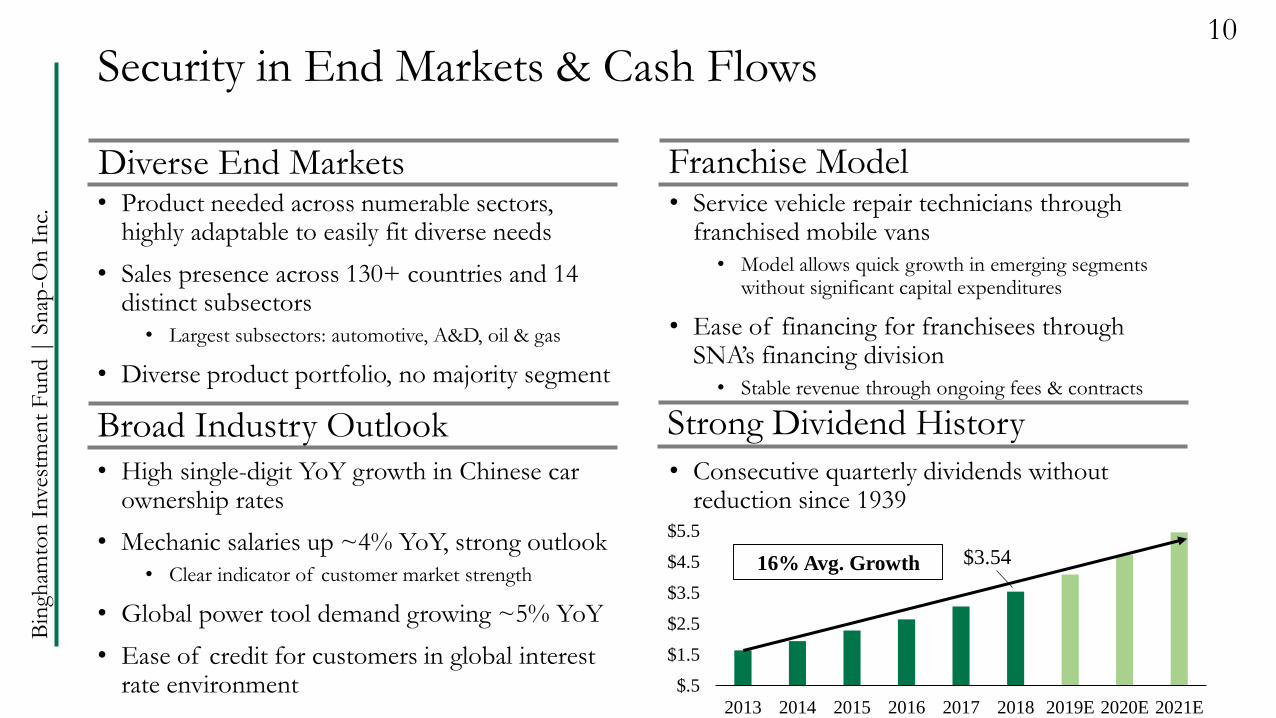
• Product needed across numerable sectors, highly adaptable to easily fit diverse needs
• Sales presence across 130+ countries and 14 distinct subsectors
• Largest subsectors: automotive, A&D, oil & gas
• Diverse product portfolio, no majority segment
• Service vehicle repair technicians through franchised mobile vans
• Model allows quick growth in emerging segments without significant capital expenditures
• Ease of financing for franchisees through SNA’s financing division
• Stable revenue through ongoing fees & contracts
• High single-digit YoY growth in Chinese car ownership rates
• Mechanic salaries up ~4% YoY, strong outlook
• Clear indicator of customer market strength
• Global power tool demand growing ~5% YoY
• Ease of credit for customers in global interest rate environment
• Consecutive quarterly dividends without reduction since 1939
Security in End Markets & Cash Flows10
Diverse End Markets Franchise Model
Broad Industry Outlook Strong Dividend History
$.5
$1.5
$2.5
$3.5
$4.5
$5.5
2013 2014 2015 2016 2017 2018 2019E 2020E 2021E
$3.5416% Avg. Growth
Bin
gham
ton
Inve
stm
ent
Fun
d |
Sn
ap-O
n I
nc.
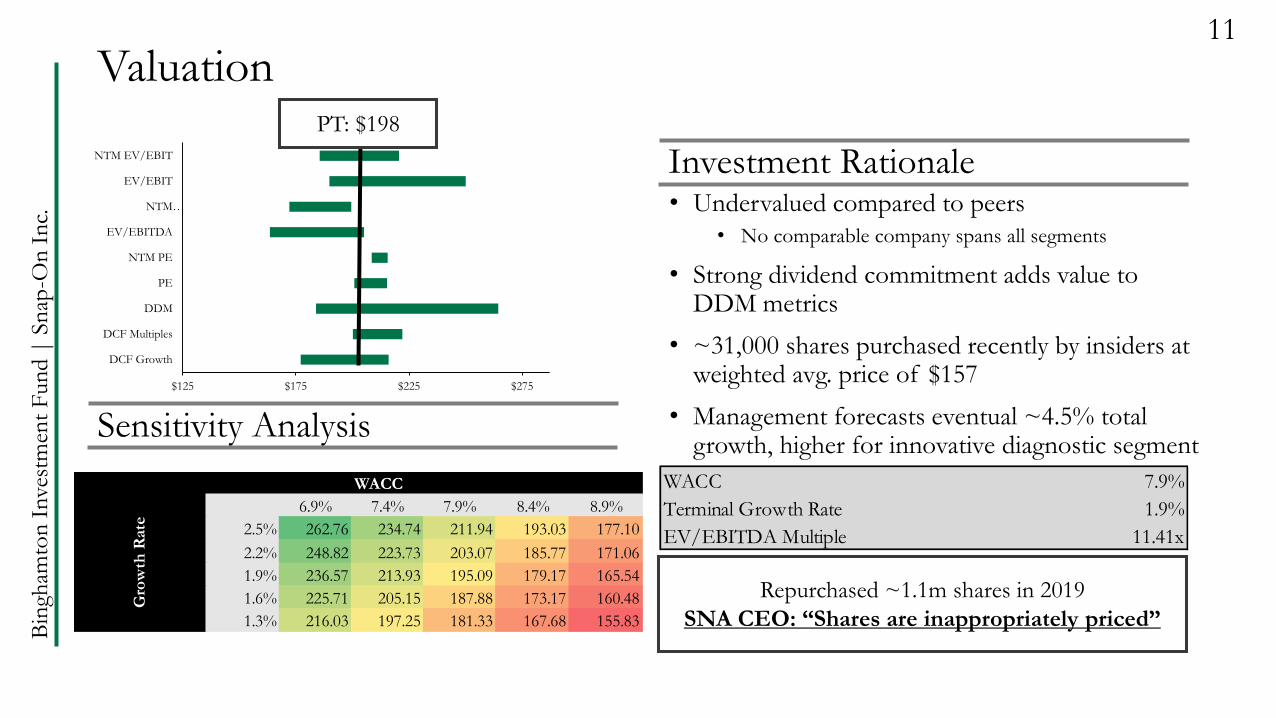
$125 $175 $225 $275 $325
DCF Growth
DCF Multiples
DDM
PE
NTM PE
EV/EBITDA
NTM…
EV/EBIT
NTM EV/EBIT
• Undervalued compared to peers
• No comparable company spans all segments
• Strong dividend commitment adds value to DDM metrics
• ~31,000 shares purchased recently by insiders at weighted avg. price of $157
• Management forecasts eventual ~4.5% total growth, higher for innovative diagnostic segment
Valuation11
Investment Rationale
Sensitivity Analysis
Repurchased ~1.1m shares in 2019
SNA CEO: “Shares are inappropriately priced”
PT: $198
WACC
194.82$ 6.9% 7.4% 7.9% 8.4% 8.9%
2.5% 262.76 234.74 211.94 193.03 177.10
2.2% 248.82 223.73 203.07 185.77 171.06
1.9% 236.57 213.93 195.09 179.17 165.54
1.6% 225.71 205.15 187.88 173.17 160.48
1.3% 216.03 197.25 181.33 167.68 155.83
Gro
wth
Rate
WACC 7.9%
Terminal Growth Rate 1.9%
EV/EBITDA Multiple 11.41x
Bin
gham
ton
Inve
stm
ent
Fun
d |
Sn
ap-O
n I
nc.
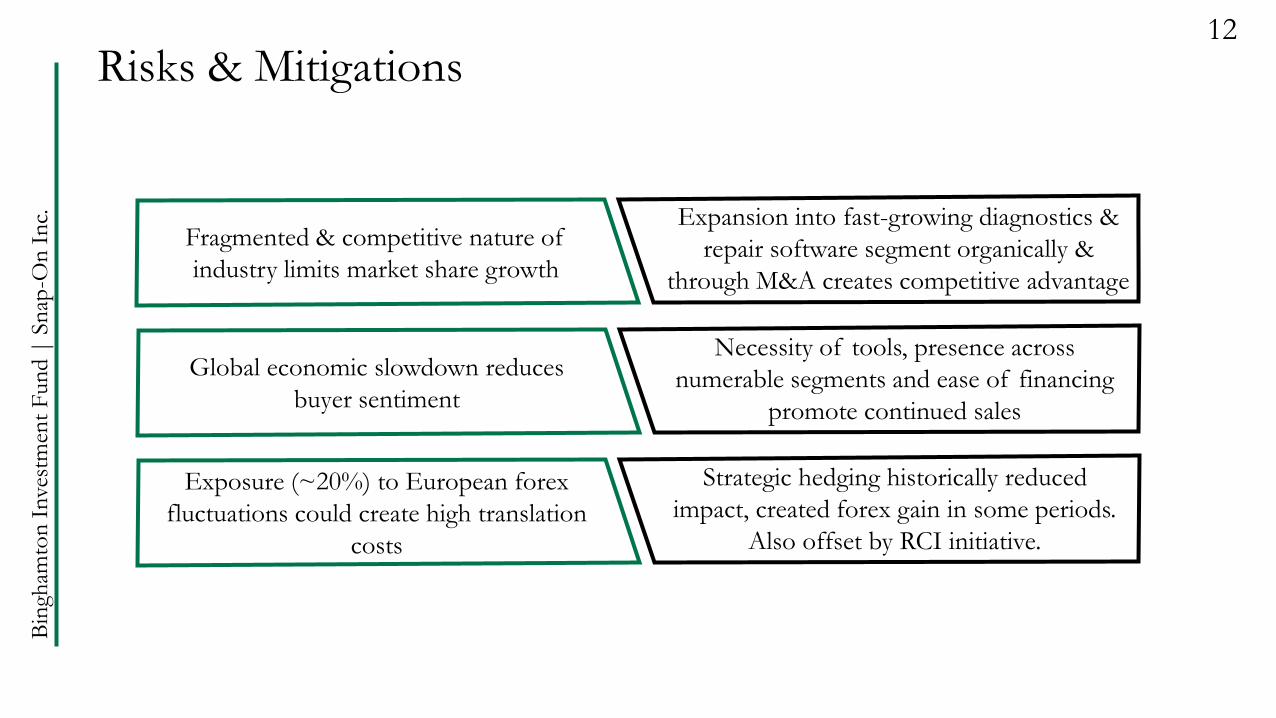
Risks & Mitigations12
Fragmented & competitive nature of
industry limits market share growth
Expansion into fast-growing diagnostics &
repair software segment organically &
through M&A creates competitive advantage
Exposure (~20%) to European forex
fluctuations could create high translation
costs
Strategic hedging historically reduced
impact, created forex gain in some periods.
Also offset by RCI initiative.
Global economic slowdown reduces
buyer sentiment
Necessity of tools, presence across
numerable segments and ease of financing
promote continued sales
Bin
gham
ton
Inve
stm
ent
Fun
d |
Sn
ap-O
n I
nc.
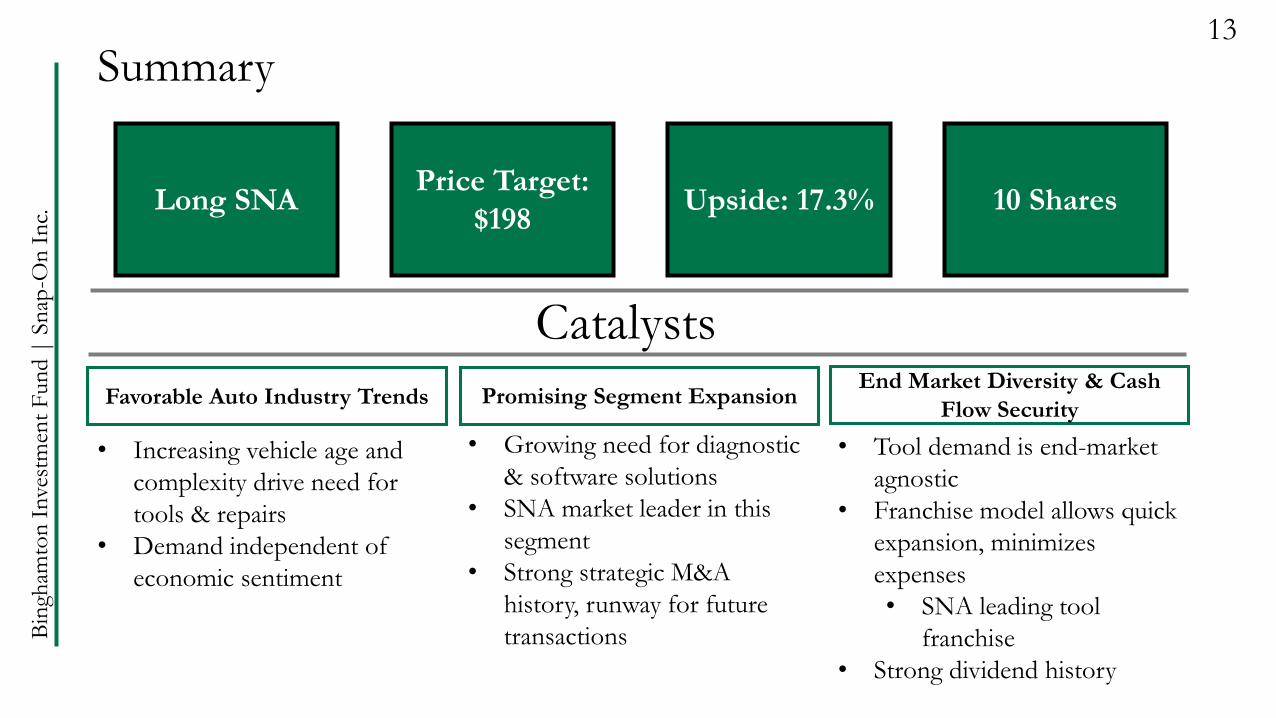
Summary13
Catalysts
Long SNAPrice Target:
$198Upside: 17.3%
End Market Diversity & Cash
Flow SecurityFavorable Auto Industry Trends Promising Segment Expansion
• Increasing vehicle age and
complexity drive need for
tools & repairs
• Demand independent of
economic sentiment
• Growing need for diagnostic
& software solutions
• SNA market leader in this
segment
• Strong strategic M&A
history, runway for future
transactions
• Tool demand is end-market
agnostic
• Franchise model allows quick
expansion, minimizes
expenses
• SNA leading tool
franchise
• Strong dividend history
10 Shares

Bin
gham
ton
Inve
stm
ent
Fun
d |
Sn
ap-O
n I
nc.
14
Thank You
Questions?
Bin
gham
ton
Inve
stm
ent
Fun
d |
Sn
ap-O
n I
nc.
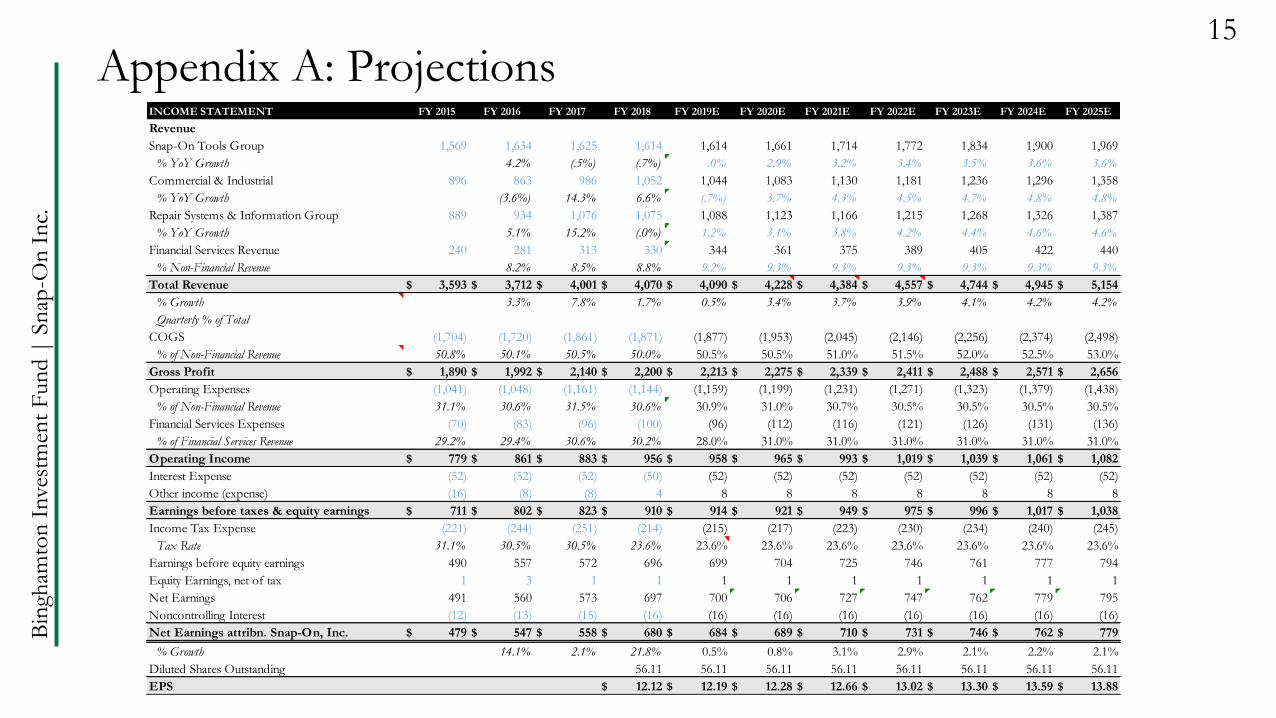
INCOME STATEMENT FY 2015 FY 2016 FY 2017 FY 2018 FY 2019E FY 2020E FY 2021E FY 2022E FY 2023E FY 2024E FY 2025E
Revenue
Snap-On Tools Group 1,569 1,634 1,625 1,614 1,614 1,661 1,714 1,772 1,834 1,900 1,969
% YoY Growth 4.2% (.5%) (.7%) .0% 2.9% 3.2% 3.4% 3.5% 3.6% 3.6%
Commercial & Industrial 896 863 986 1,052 1,044 1,083 1,130 1,181 1,236 1,296 1,358
% YoY Growth (3.6%) 14.3% 6.6% (.7%) 3.7% 4.3% 4.5% 4.7% 4.8% 4.8%
Repair Systems & Information Group 889 934 1,076 1,075 1,088 1,123 1,166 1,215 1,268 1,326 1,387
% YoY Growth 5.1% 15.2% (.0%) 1.2% 3.1% 3.8% 4.2% 4.4% 4.6% 4.6%
Financial Services Revenue 240 281 313 330 344 361 375 389 405 422 440
% Non-Financial Revenue 8.2% 8.5% 8.8% 9.2% 9.3% 9.3% 9.3% 9.3% 9.3% 9.3%
Total Revenue 3,593$ 3,712$ 4,001$ 4,070$ 4,090$ 4,228$ 4,384$ 4,557$ 4,744$ 4,945$ 5,154$
% Growth 3.3% 7.8% 1.7% 0.5% 3.4% 3.7% 3.9% 4.1% 4.2% 4.2%
Quarterly % of Total
COGS (1,704) (1,720) (1,861) (1,871) (1,877) (1,953) (2,045) (2,146) (2,256) (2,374) (2,498)
% of Non-Financial Revenue 50.8% 50.1% 50.5% 50.0% 50.5% 50.5% 51.0% 51.5% 52.0% 52.5% 53.0%
Gross Profit 1,890$ 1,992$ 2,140$ 2,200$ 2,213$ 2,275$ 2,339$ 2,411$ 2,488$ 2,571$ 2,656$
Operating Expenses (1,041) (1,048) (1,161) (1,144) (1,159) (1,199) (1,231) (1,271) (1,323) (1,379) (1,438)
% of Non-Financial Revenue 31.1% 30.6% 31.5% 30.6% 30.9% 31.0% 30.7% 30.5% 30.5% 30.5% 30.5%
Financial Services Expenses (70) (83) (96) (100) (96) (112) (116) (121) (126) (131) (136)
% of Financial Services Revenue 29.2% 29.4% 30.6% 30.2% 28.0% 31.0% 31.0% 31.0% 31.0% 31.0% 31.0%
Operating Income 779$ 861$ 883$ 956$ 958$ 965$ 993$ 1,019$ 1,039$ 1,061$ 1,082$
Interest Expense (52) (52) (52) (50) (52) (52) (52) (52) (52) (52) (52)
Other income (expense) (16) (8) (8) 4 8 8 8 8 8 8 8
Earnings before taxes & equity earnings 711$ 802$ 823$ 910$ 914$ 921$ 949$ 975$ 996$ 1,017$ 1,038$
Income Tax Expense (221) (244) (251) (214) (215) (217) (223) (230) (234) (240) (245)
Tax Rate 31.1% 30.5% 30.5% 23.6% 23.6% 23.6% 23.6% 23.6% 23.6% 23.6% 23.6%
Earnings before equity earnings 490 557 572 696 699 704 725 746 761 777 794
Equity Earnings, net of tax 1 3 1 1 1 1 1 1 1 1 1
Net Earnings 491 560 573 697 700 706 727 747 762 779 795
Noncontrolling Interest (12) (13) (15) (16) (16) (16) (16) (16) (16) (16) (16)
Net Earnings attribn. Snap-On, Inc. 479$ 547$ 558$ 680$ 684$ 689$ 710$ 731$ 746$ 762$ 779$
% Growth 14.1% 2.1% 21.8% 0.5% 0.8% 3.1% 2.9% 2.1% 2.2% 2.1%
Diluted Shares Outstanding 56.11 56.11 56.11 56.11 56.11 56.11 56.11 56.11
EPS 12.12$ 12.19$ 12.28$ 12.66$ 13.02$ 13.30$ 13.59$ 13.88$
Appendix A: Projections15
Bin
gham
ton
Inve
stm
ent
Fun
d |
Sn
ap-O
n I
nc.
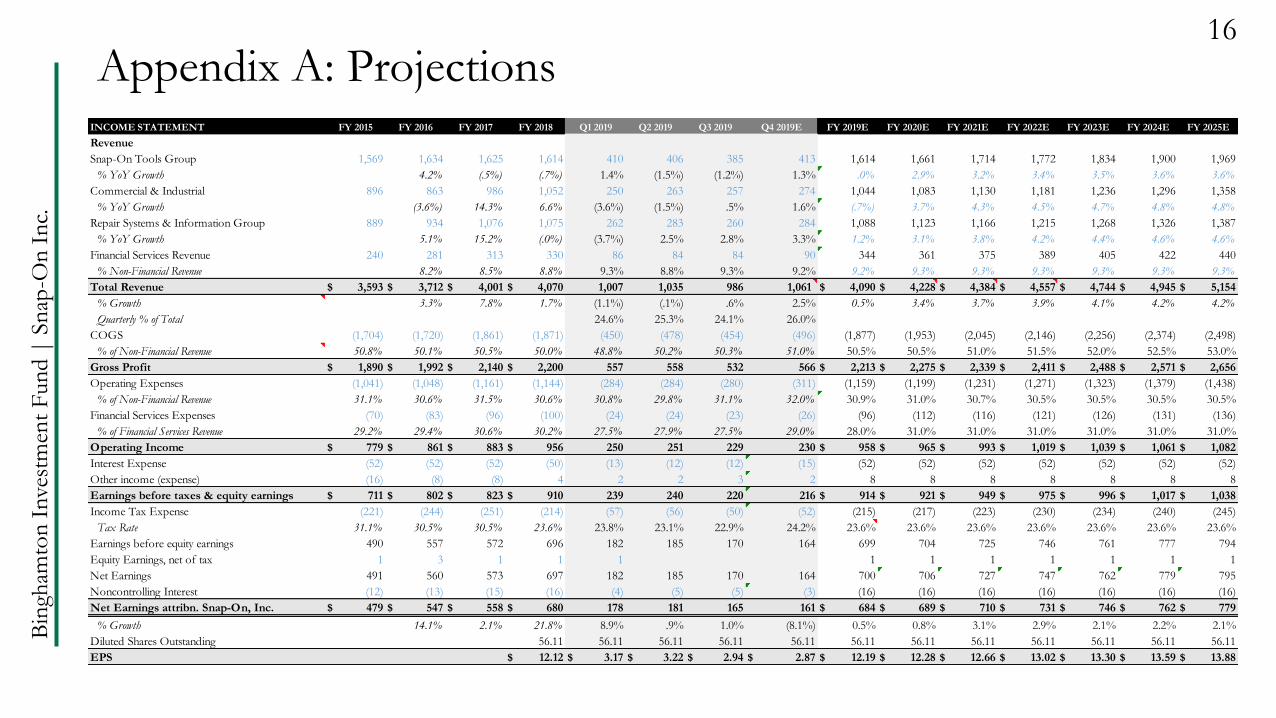
Appendix A: Projections16
INCOME STATEMENT FY 2015 FY 2016 FY 2017 FY 2018 Q1 2019 Q2 2019 Q3 2019 Q4 2019E FY 2019E FY 2020E FY 2021E FY 2022E FY 2023E FY 2024E FY 2025E
Revenue
Snap-On Tools Group 1,569 1,634 1,625 1,614 410 406 385 413 1,614 1,661 1,714 1,772 1,834 1,900 1,969
% YoY Growth 4.2% (.5%) (.7%) 1.4% (1.5%) (1.2%) 1.3% .0% 2.9% 3.2% 3.4% 3.5% 3.6% 3.6%
Commercial & Industrial 896 863 986 1,052 250 263 257 274 1,044 1,083 1,130 1,181 1,236 1,296 1,358
% YoY Growth (3.6%) 14.3% 6.6% (3.6%) (1.5%) .5% 1.6% (.7%) 3.7% 4.3% 4.5% 4.7% 4.8% 4.8%
Repair Systems & Information Group 889 934 1,076 1,075 262 283 260 284 1,088 1,123 1,166 1,215 1,268 1,326 1,387
% YoY Growth 5.1% 15.2% (.0%) (3.7%) 2.5% 2.8% 3.3% 1.2% 3.1% 3.8% 4.2% 4.4% 4.6% 4.6%
Financial Services Revenue 240 281 313 330 86 84 84 90 344 361 375 389 405 422 440
% Non-Financial Revenue 8.2% 8.5% 8.8% 9.3% 8.8% 9.3% 9.2% 9.2% 9.3% 9.3% 9.3% 9.3% 9.3% 9.3%
Total Revenue 3,593$ 3,712$ 4,001$ 4,070$ 1,007 1,035 986 1,061 4,090$ 4,228$ 4,384$ 4,557$ 4,744$ 4,945$ 5,154$
% Growth 3.3% 7.8% 1.7% (1.1%) (.1%) .6% 2.5% 0.5% 3.4% 3.7% 3.9% 4.1% 4.2% 4.2%
Quarterly % of Total 24.6% 25.3% 24.1% 26.0%
COGS (1,704) (1,720) (1,861) (1,871) (450) (478) (454) (496) (1,877) (1,953) (2,045) (2,146) (2,256) (2,374) (2,498)
% of Non-Financial Revenue 50.8% 50.1% 50.5% 50.0% 48.8% 50.2% 50.3% 51.0% 50.5% 50.5% 51.0% 51.5% 52.0% 52.5% 53.0%
Gross Profit 1,890$ 1,992$ 2,140$ 2,200$ 557 558 532 566 2,213$ 2,275$ 2,339$ 2,411$ 2,488$ 2,571$ 2,656$
Operating Expenses (1,041) (1,048) (1,161) (1,144) (284) (284) (280) (311) (1,159) (1,199) (1,231) (1,271) (1,323) (1,379) (1,438)
% of Non-Financial Revenue 31.1% 30.6% 31.5% 30.6% 30.8% 29.8% 31.1% 32.0% 30.9% 31.0% 30.7% 30.5% 30.5% 30.5% 30.5%
Financial Services Expenses (70) (83) (96) (100) (24) (24) (23) (26) (96) (112) (116) (121) (126) (131) (136)
% of Financial Services Revenue 29.2% 29.4% 30.6% 30.2% 27.5% 27.9% 27.5% 29.0% 28.0% 31.0% 31.0% 31.0% 31.0% 31.0% 31.0%
Operating Income 779$ 861$ 883$ 956$ 250 251 229 230 958$ 965$ 993$ 1,019$ 1,039$ 1,061$ 1,082$
Interest Expense (52) (52) (52) (50) (13) (12) (12) (15) (52) (52) (52) (52) (52) (52) (52)
Other income (expense) (16) (8) (8) 4 2 2 3 2 8 8 8 8 8 8 8
Earnings before taxes & equity earnings 711$ 802$ 823$ 910$ 239 240 220 216 914$ 921$ 949$ 975$ 996$ 1,017$ 1,038$
Income Tax Expense (221) (244) (251) (214) (57) (56) (50) (52) (215) (217) (223) (230) (234) (240) (245)
Tax Rate 31.1% 30.5% 30.5% 23.6% 23.8% 23.1% 22.9% 24.2% 23.6% 23.6% 23.6% 23.6% 23.6% 23.6% 23.6%
Earnings before equity earnings 490 557 572 696 182 185 170 164 699 704 725 746 761 777 794
Equity Earnings, net of tax 1 3 1 1 1 1 1 1 1 1 1 1
Net Earnings 491 560 573 697 182 185 170 164 700 706 727 747 762 779 795
Noncontrolling Interest (12) (13) (15) (16) (4) (5) (5) (3) (16) (16) (16) (16) (16) (16) (16)
Net Earnings attribn. Snap-On, Inc. 479$ 547$ 558$ 680$ 178 181 165 161 684$ 689$ 710$ 731$ 746$ 762$ 779$
% Growth 14.1% 2.1% 21.8% 8.9% .9% 1.0% (8.1%) 0.5% 0.8% 3.1% 2.9% 2.1% 2.2% 2.1%
Diluted Shares Outstanding 56.11 56.11 56.11 56.11 56.11 56.11 56.11 56.11 56.11 56.11 56.11 56.11
EPS 12.12$ 3.17$ 3.22$ 2.94$ 2.87$ 12.19$ 12.28$ 12.66$ 13.02$ 13.30$ 13.59$ 13.88$
Bin
gham
ton
Inve
stm
ent
Fun
d |
Sn
ap-O
n I
nc.
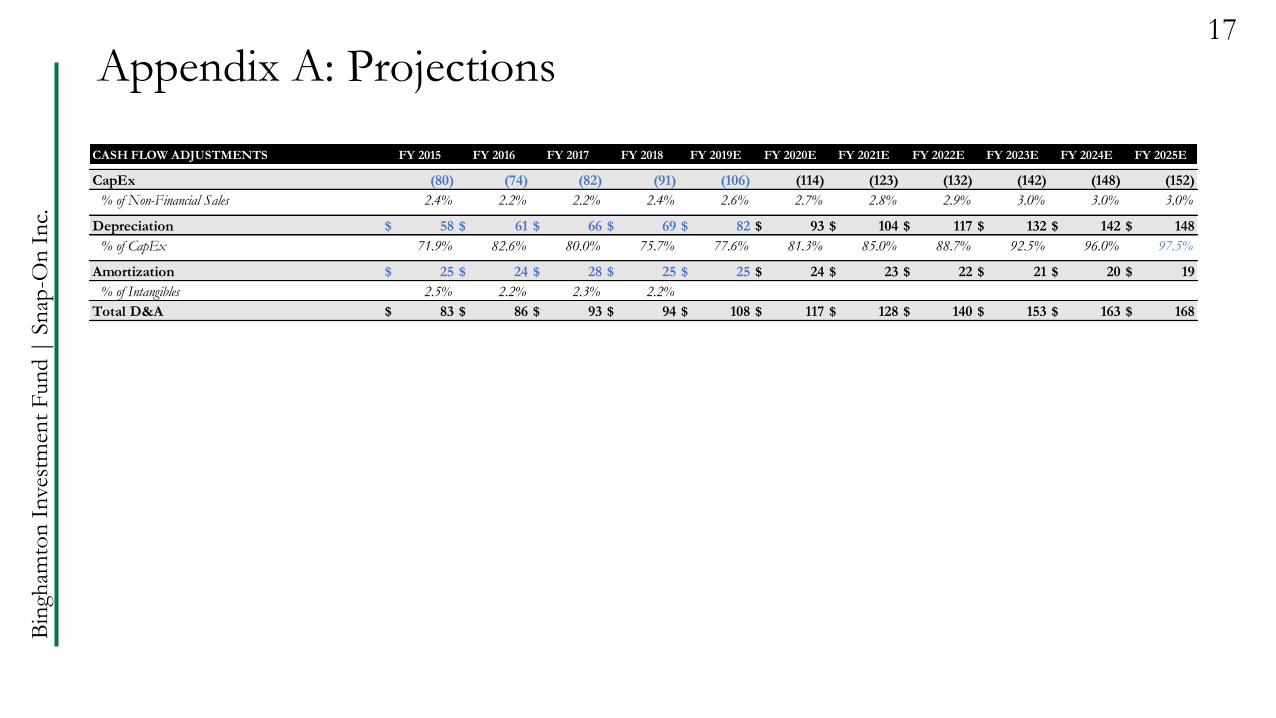
CASH FLOW ADJUSTMENTS FY 2015 FY 2016 FY 2017 FY 2018 FY 2019E FY 2020E FY 2021E FY 2022E FY 2023E FY 2024E FY 2025E
CapEx (80) (74) (82) (91) (106) (114) (123) (132) (142) (148) (152)
% of Non-Financial Sales 2.4% 2.2% 2.2% 2.4% 2.6% 2.7% 2.8% 2.9% 3.0% 3.0% 3.0%
Depreciation 58$ 61$ 66$ 69$ 82$ 93$ 104$ 117$ 132$ 142$ 148$
% of CapEx 71.9% 82.6% 80.0% 75.7% 77.6% 81.3% 85.0% 88.7% 92.5% 96.0% 97.5%
Amortization 25$ 24$ 28$ 25$ 25$ 24$ 23$ 22$ 21$ 20$ 19$
% of Intangibles 2.5% 2.2% 2.3% 2.2%
Total D&A 83$ 86$ 93$ 94$ 108$ 117$ 128$ 140$ 153$ 163$ 168$
Appendix A: Projections17
Bin
gham
ton
Inve
stm
ent
Fun
d |
Sn
ap-O
n I
nc.
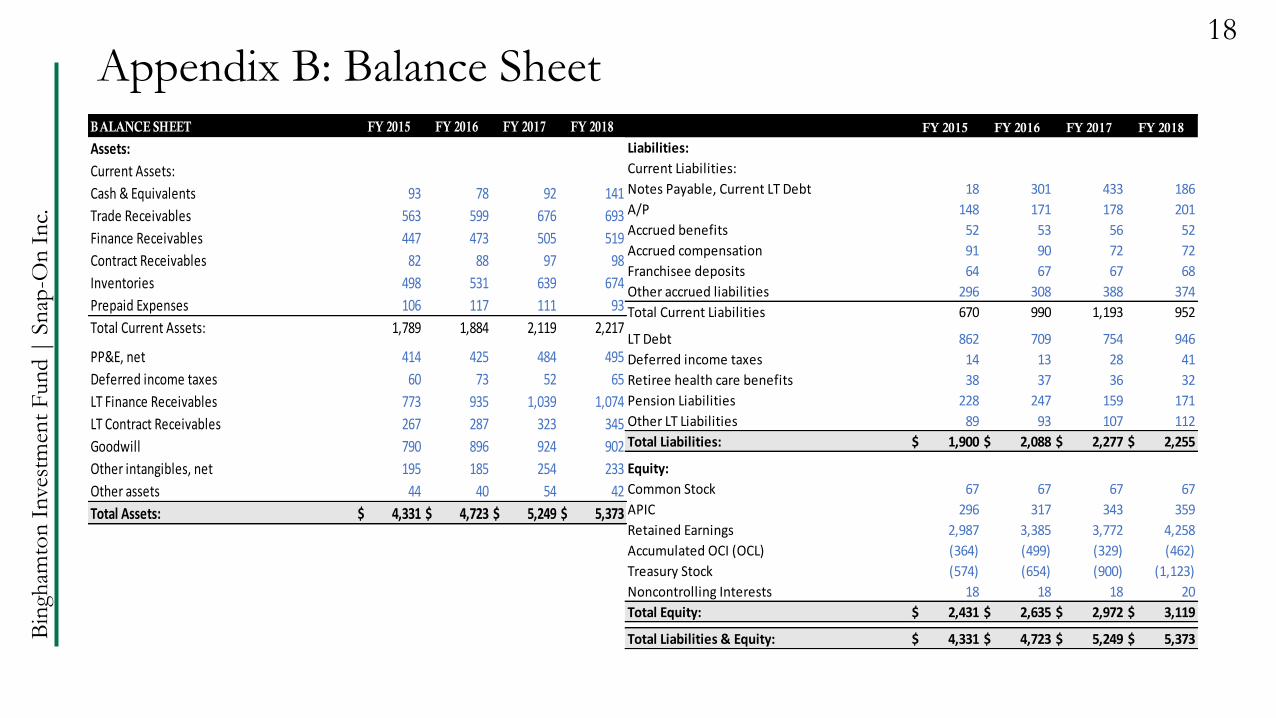
Appendix B: Balance Sheet18
BALANCE SHEET FY 2015 FY 2016 FY 2017 FY 2018
Assets:
Current Assets:
Cash & Equivalents 93 78 92 141
Trade Receivables 563 599 676 693
Finance Receivables 447 473 505 519
Contract Receivables 82 88 97 98
Inventories 498 531 639 674
Prepaid Expenses 106 117 111 93
Total Current Assets: 1,789 1,884 2,119 2,217
PP&E, net 414 425 484 495
Deferred income taxes 60 73 52 65
LT Finance Receivables 773 935 1,039 1,074
LT Contract Receivables 267 287 323 345
Goodwill 790 896 924 902
Other intangibles, net 195 185 254 233
Other assets 44 40 54 42
Total Assets: 4,331$ 4,723$ 5,249$ 5,373$
FY 2015 FY 2016 FY 2017 FY 2018
Liabilities:
Current Liabilities:
Notes Payable, Current LT Debt 18 301 433 186
A/P 148 171 178 201
Accrued benefits 52 53 56 52
Accrued compensation 91 90 72 72
Franchisee deposits 64 67 67 68
Other accrued liabilities 296 308 388 374
Total Current Liabilities 670 990 1,193 952
LT Debt 862 709 754 946
Deferred income taxes 14 13 28 41
Retiree health care benefits 38 37 36 32
Pension Liabilities 228 247 159 171
Other LT Liabilities 89 93 107 112
Total Liabilities: 1,900$ 2,088$ 2,277$ 2,255$
Equity:
Common Stock 67 67 67 67
APIC 296 317 343 359
Retained Earnings 2,987 3,385 3,772 4,258
Accumulated OCI (OCL) (364) (499) (329) (462)
Treasury Stock (574) (654) (900) (1,123)
Noncontrolling Interests 18 18 18 20
Total Equity: 2,431$ 2,635$ 2,972$ 3,119$
Total Liabilities & Equity: 4,331$ 4,723$ 5,249$ 5,373$
Bin
gham
ton
Inve
stm
ent
Fun
d |
Sn
ap-O
n I
nc.
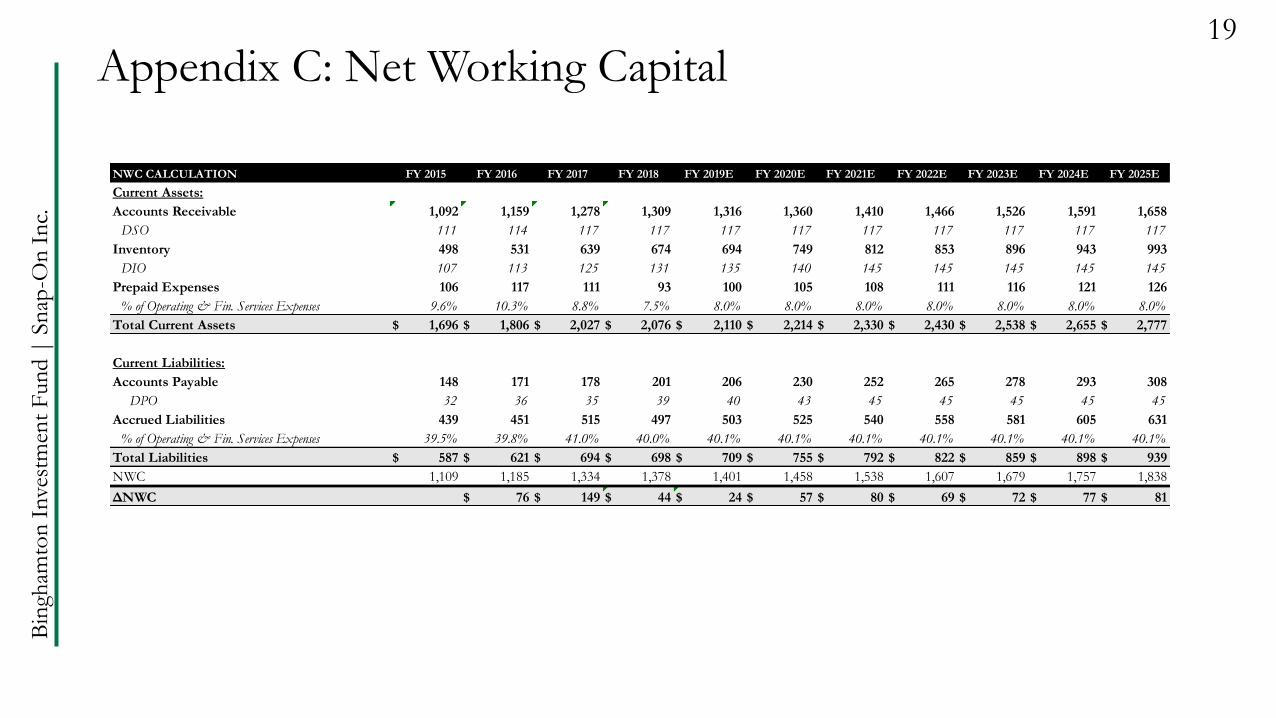
Appendix C: Net Working Capital 19
NWC CALCULATION FY 2015 FY 2016 FY 2017 FY 2018 FY 2019E FY 2020E FY 2021E FY 2022E FY 2023E FY 2024E FY 2025E
Current Assets:
Accounts Receivable 1,092 1,159 1,278 1,309 1,316 1,360 1,410 1,466 1,526 1,591 1,658
DSO 111 114 117 117 117 117 117 117 117 117 117
Inventory 498 531 639 674 694 749 812 853 896 943 993
DIO 107 113 125 131 135 140 145 145 145 145 145
Prepaid Expenses 106 117 111 93 100 105 108 111 116 121 126
% of Operating & Fin. Services Expenses 9.6% 10.3% 8.8% 7.5% 8.0% 8.0% 8.0% 8.0% 8.0% 8.0% 8.0%
Total Current Assets 1,696$ 1,806$ 2,027$ 2,076$ 2,110$ 2,214$ 2,330$ 2,430$ 2,538$ 2,655$ 2,777$
Current Liabilities:
Accounts Payable 148 171 178 201 206 230 252 265 278 293 308
DPO 32 36 35 39 40 43 45 45 45 45 45
Accrued Liabilities 439 451 515 497 503 525 540 558 581 605 631
% of Operating & Fin. Services Expenses 39.5% 39.8% 41.0% 40.0% 40.1% 40.1% 40.1% 40.1% 40.1% 40.1% 40.1%
Total Liabilities 587$ 621$ 694$ 698$ 709$ 755$ 792$ 822$ 859$ 898$ 939$
NWC 1,109 1,185 1,334 1,378 1,401 1,458 1,538 1,607 1,679 1,757 1,838
ΔNWC 76$ 149$ 44$ 24$ 57$ 80$ 69$ 72$ 77$ 81$
Bin
gham
ton
Inve
stm
ent
Fun
d |
Sn
ap-O
n I
nc.
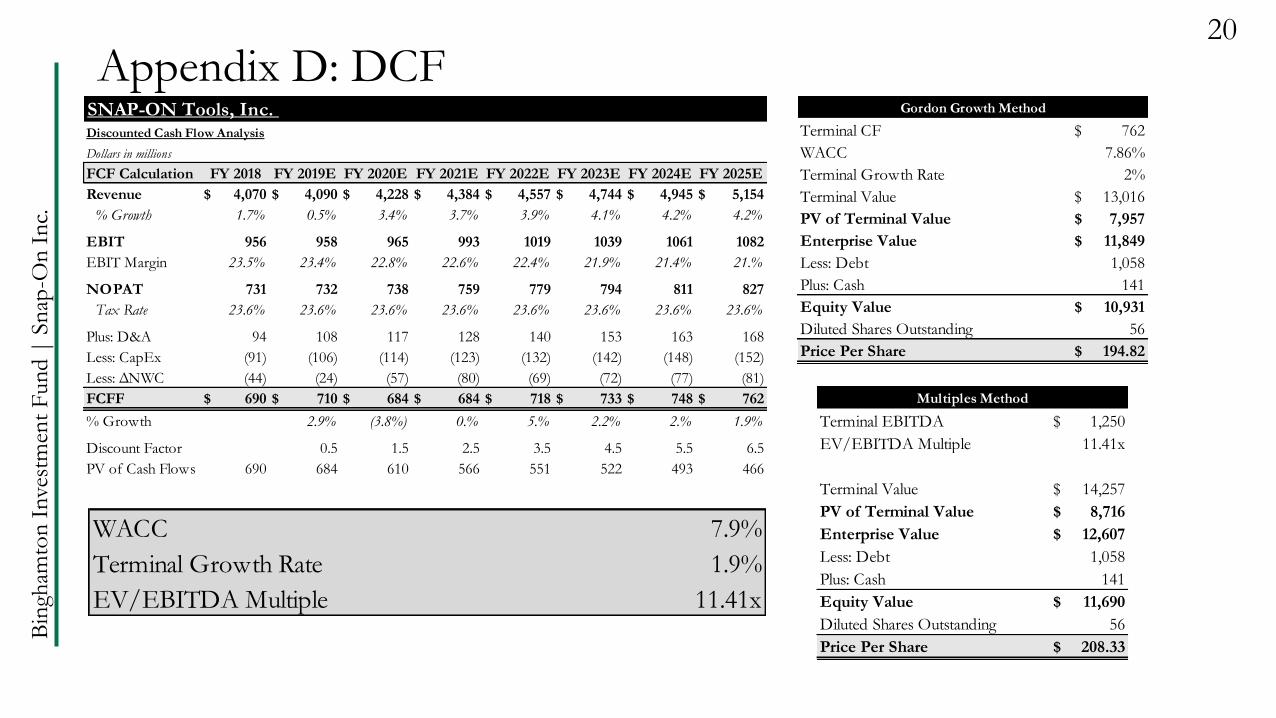
Appendix D: DCF20
SNAP-ON Tools, Inc. Discounted Cash Flow Analysis
Dollars in millions
FCF Calculation FY 2018 FY 2019E FY 2020E FY 2021E FY 2022E FY 2023E FY 2024E FY 2025E
Revenue 4,070$ 4,090$ 4,228$ 4,384$ 4,557$ 4,744$ 4,945$ 5,154$
% Growth 1.7% 0.5% 3.4% 3.7% 3.9% 4.1% 4.2% 4.2%
EBIT 956 958 965 993 1019 1039 1061 1082
EBIT Margin 23.5% 23.4% 22.8% 22.6% 22.4% 21.9% 21.4% 21.%
NOPAT 731 732 738 759 779 794 811 827
Tax Rate 23.6% 23.6% 23.6% 23.6% 23.6% 23.6% 23.6% 23.6%
Plus: D&A 94 108 117 128 140 153 163 168
Less: CapEx (91) (106) (114) (123) (132) (142) (148) (152)
Less: ΔNWC (44) (24) (57) (80) (69) (72) (77) (81)
FCFF 690$ 710$ 684$ 684$ 718$ 733$ 748$ 762$
% Growth 2.9% (3.8%) 0.% 5.% 2.2% 2.% 1.9%
Discount Factor 0.5 1.5 2.5 3.5 4.5 5.5 6.5
PV of Cash Flows 690 684 610 566 551 522 493 466
Gordon Growth Method Multiples Method
Terminal CF 762$
WACC 7.86%
Terminal Growth Rate 2%
Terminal Value 13,016$
PV of Terminal Value 7,957$
Enterprise Value 11,849$
Less: Debt 1,058
Plus: Cash 141
Equity Value 10,931$
Diluted Shares Outstanding 56
Price Per Share 194.82$
Multiples Method
Terminal EBITDA 1,250$
EV/EBITDA Multiple 11.41x
Terminal Value 14,257$
PV of Terminal Value 8,716$
Enterprise Value 12,607$
Less: Debt 1,058
Plus: Cash 141
Equity Value 11,690$
Diluted Shares Outstanding 56
Price Per Share 208.33$
WACC 7.9%
Terminal Growth Rate 1.9%
EV/EBITDA Multiple 11.41x
Bin
gham
ton
Inve
stm
ent
Fun
d |
Sn
ap-O
n I
nc.
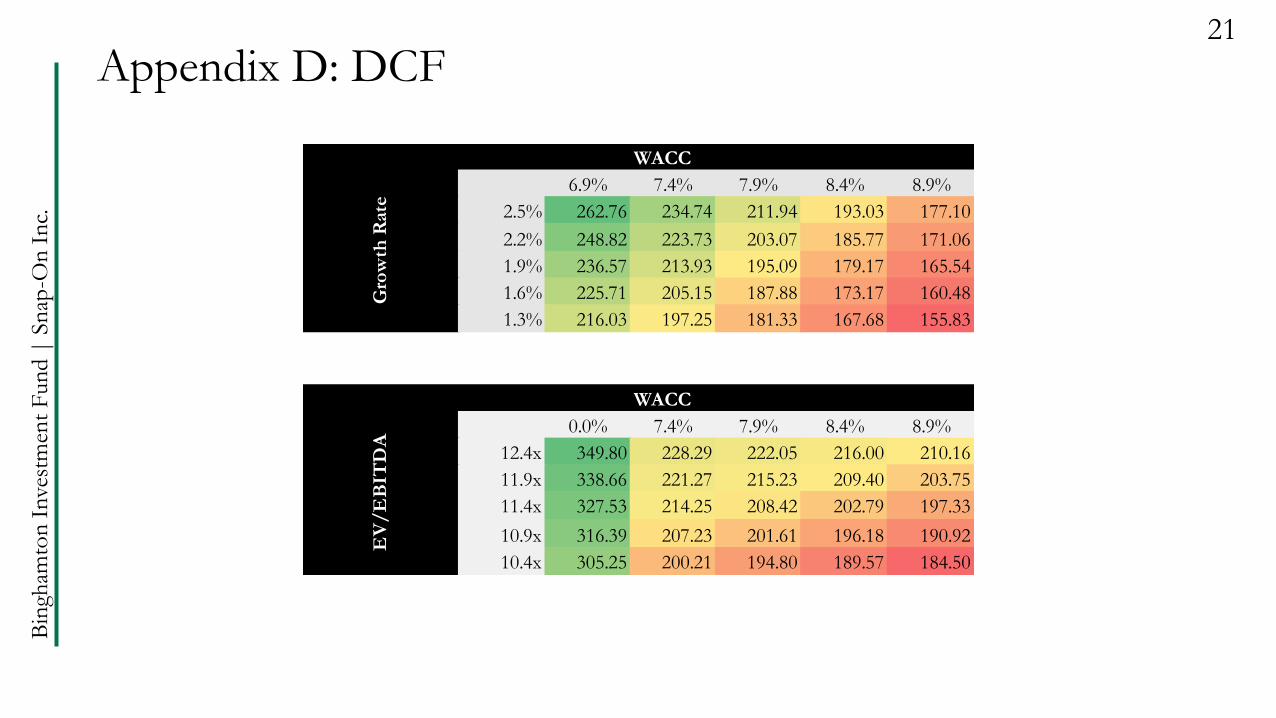
Appendix D: DCF21
WACC
194.82$ 6.9% 7.4% 7.9% 8.4% 8.9%
2.5% 262.76 234.74 211.94 193.03 177.10
2.2% 248.82 223.73 203.07 185.77 171.06
1.9% 236.57 213.93 195.09 179.17 165.54
1.6% 225.71 205.15 187.88 173.17 160.48
1.3% 216.03 197.25 181.33 167.68 155.83
WACC
208.33$ 0.0% 7.4% 7.9% 8.4% 8.9%
12.4x 349.80 228.29 222.05 216.00 210.16
11.9x 338.66 221.27 215.23 209.40 203.75
11.4x 327.53 214.25 208.42 202.79 197.33
10.9x 316.39 207.23 201.61 196.18 190.92
10.4x 305.25 200.21 194.80 189.57 184.50
Gro
wth
Rate
EV
/E
BIT
DA
Bin
gham
ton
Inve
stm
ent
Fun
d |
Sn
ap-O
n I
nc.
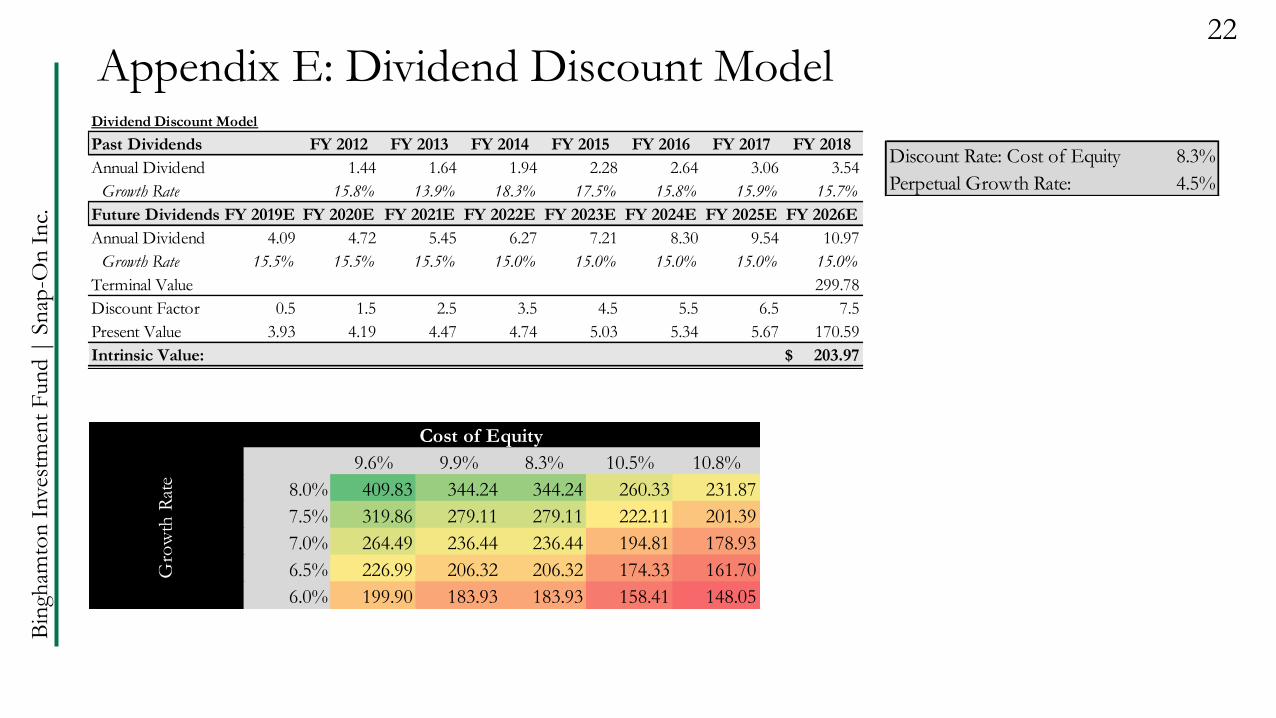
Appendix E: Dividend Discount Model22
Dividend Discount Model
Past Dividends FY 2012 FY 2013 FY 2014 FY 2015 FY 2016 FY 2017 FY 2018
Annual Dividend 1.44 1.64 1.94 2.28 2.64 3.06 3.54
Growth Rate 15.8% 13.9% 18.3% 17.5% 15.8% 15.9% 15.7%
Future Dividends FY 2019E FY 2020E FY 2021E FY 2022E FY 2023E FY 2024E FY 2025E FY 2026E
Annual Dividend 4.09 4.72 5.45 6.27 7.21 8.30 9.54 10.97
Growth Rate 15.5% 15.5% 15.5% 15.0% 15.0% 15.0% 15.0% 15.0%
Terminal Value 299.78
Discount Factor 0.5 1.5 2.5 3.5 4.5 5.5 6.5 7.5
Present Value 3.93 4.19 4.47 4.74 5.03 5.34 5.67 170.59
Intrinsic Value: 203.97$
Discount Rate: Cost of Equity 8.3%
Perpetual Growth Rate: 4.5%
Cost of Equity
203.97$ 9.6% 9.9% 8.3% 10.5% 10.8%
8.0% 409.83 344.24 344.24 260.33 231.87
7.5% 319.86 279.11 279.11 222.11 201.39
7.0% 264.49 236.44 236.44 194.81 178.93
6.5% 226.99 206.32 206.32 174.33 161.70
6.0% 199.90 183.93 183.93 158.41 148.05
Gro
wth
Rat
e
Bin
gham
ton
Inve
stm
ent
Fun
d |
Sn
ap-O
n I
nc.
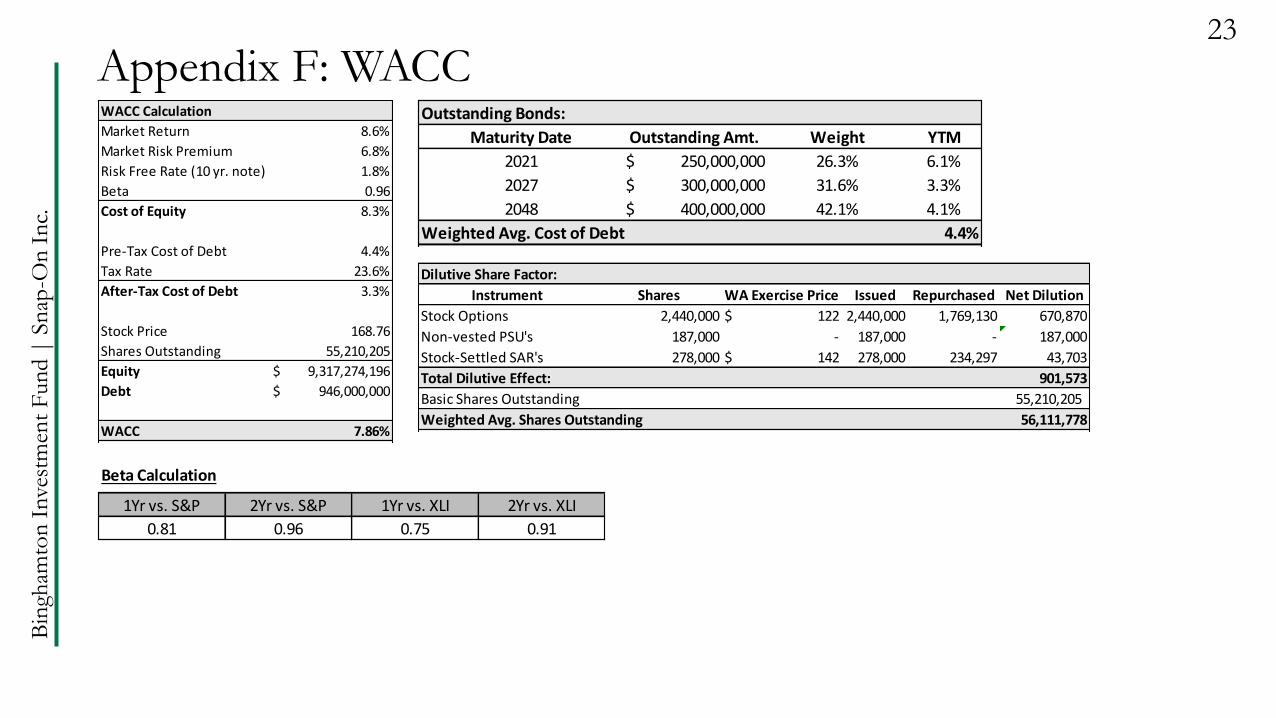
Appendix F: WACC23
Beta Calculation
1Yr vs. S&P 2Yr vs. S&P 1Yr vs. XLI 2Yr vs. XLI
0.81 0.96 0.75 0.91
WACC Calculation
Market Return 8.6%
Market Risk Premium 6.8%
Risk Free Rate (10 yr. note) 1.8%
Beta 0.96
Cost of Equity 8.3%
Pre-Tax Cost of Debt 4.4%
Tax Rate 23.6%
After-Tax Cost of Debt 3.3%
Stock Price 168.76
Shares Outstanding 55,210,205
Equity 9,317,274,196$
Debt 946,000,000$
WACC 7.86%
Outstanding Bonds:
Maturity Date Outstanding Amt. Weight YTM
2021 250,000,000$ 26.3% 6.1%
2027 300,000,000$ 31.6% 3.3%
2048 400,000,000$ 42.1% 4.1%
Weighted Avg. Cost of Debt 4.4%
Dilutive Share Factor:
Instrument Shares WA Exercise Price Issued Repurchased Net Dilution
Stock Options 2,440,000 122$ 2,440,000 1,769,130 670,870
Non-vested PSU's 187,000 - 187,000 - 187,000
Stock-Settled SAR's 278,000 142$ 278,000 234,297 43,703
Total Dilutive Effect: 901,573
Basic Shares Outstanding 55,210,205
Weighted Avg. Shares Outstanding 56,111,778
Bin
gham
ton
Inve
stm
ent
Fun
d |
Sn
ap-O
n I
nc.
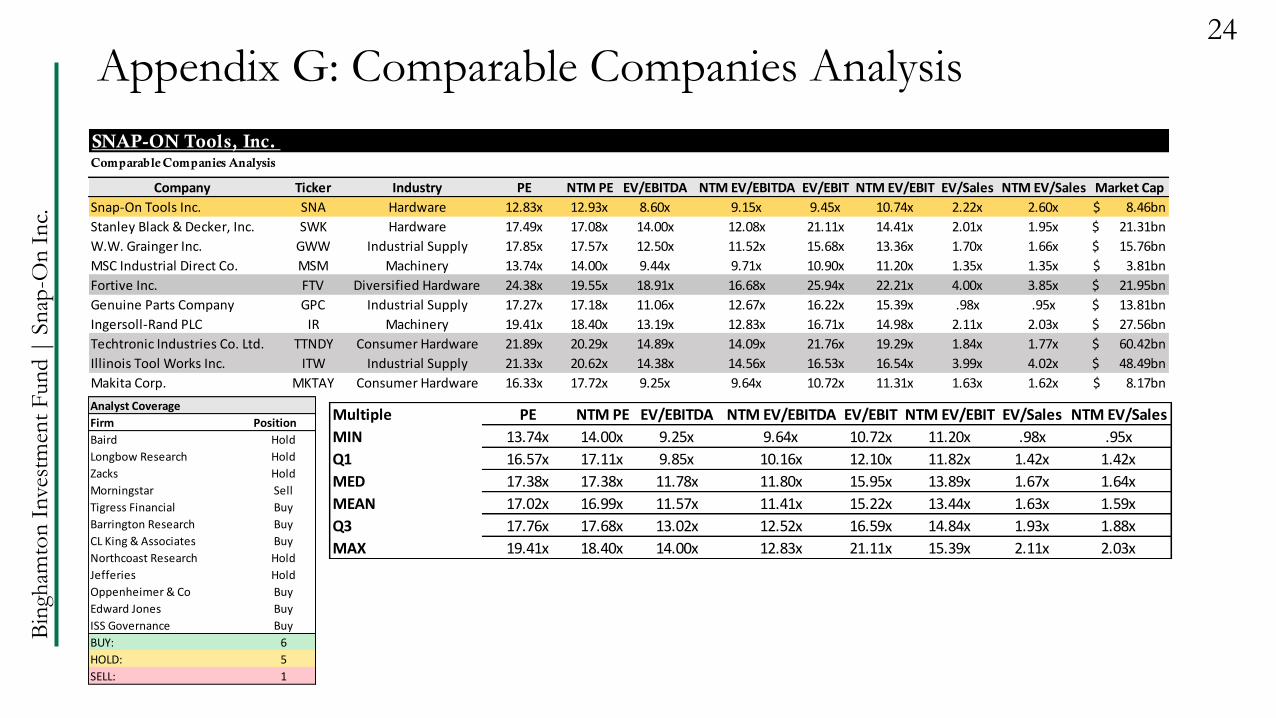
SNAP-ON Tools, Inc. Comparable Companies Analysis
Company Ticker Industry PE NTM PE EV/EBITDA NTM EV/EBITDA EV/EBIT NTM EV/EBIT EV/Sales NTM EV/Sales Market Cap
Snap-On Tools Inc. SNA Hardware 12.83x 12.93x 8.60x 9.15x 9.45x 10.74x 2.22x 2.60x 8.46bn$
Stanley Black & Decker, Inc. SWK Hardware 17.49x 17.08x 14.00x 12.08x 21.11x 14.41x 2.01x 1.95x 21.31bn$
W.W. Grainger Inc. GWW Industrial Supply 17.85x 17.57x 12.50x 11.52x 15.68x 13.36x 1.70x 1.66x 15.76bn$
MSC Industrial Direct Co. MSM Machinery 13.74x 14.00x 9.44x 9.71x 10.90x 11.20x 1.35x 1.35x 3.81bn$
Fortive Inc. FTV Diversified Hardware 24.38x 19.55x 18.91x 16.68x 25.94x 22.21x 4.00x 3.85x 21.95bn$
Genuine Parts Company GPC Industrial Supply 17.27x 17.18x 11.06x 12.67x 16.22x 15.39x .98x .95x 13.81bn$
Ingersoll-Rand PLC IR Machinery 19.41x 18.40x 13.19x 12.83x 16.71x 14.98x 2.11x 2.03x 27.56bn$
Techtronic Industries Co. Ltd. TTNDY Consumer Hardware 21.89x 20.29x 14.89x 14.09x 21.76x 19.29x 1.84x 1.77x 60.42bn$
Illinois Tool Works Inc. ITW Industrial Supply 21.33x 20.62x 14.38x 14.56x 16.53x 16.54x 3.99x 4.02x 48.49bn$
Makita Corp. MKTAY Consumer Hardware 16.33x 17.72x 9.25x 9.64x 10.72x 11.31x 1.63x 1.62x 8.17bn$
Appendix G: Comparable Companies Analysis24
Analyst Coverage
Firm Position
Baird Hold
Longbow Research Hold
Zacks Hold
Morningstar Sell
Tigress Financial Buy
Barrington Research Buy
CL King & Associates Buy
Northcoast Research Hold
Jefferies Hold
Oppenheimer & Co Buy
Edward Jones Buy
ISS Governance Buy
BUY: 6
HOLD: 5
SELL: 1
Multiple PE NTM PE EV/EBITDA NTM EV/EBITDA EV/EBIT NTM EV/EBIT EV/Sales NTM EV/Sales
MIN 13.74x 14.00x 9.25x 9.64x 10.72x 11.20x .98x .95x
Q1 16.57x 17.11x 9.85x 10.16x 12.10x 11.82x 1.42x 1.42x
MED 17.38x 17.38x 11.78x 11.80x 15.95x 13.89x 1.67x 1.64x
MEAN 17.02x 16.99x 11.57x 11.41x 15.22x 13.44x 1.63x 1.59x
Q3 17.76x 17.68x 13.02x 12.52x 16.59x 14.84x 1.93x 1.88x
MAX 19.41x 18.40x 14.00x 12.83x 21.11x 15.39x 2.11x 2.03x
Bin
gham
ton
Inve
stm
ent
Fun
d |
Sn
ap-O
n I
nc.
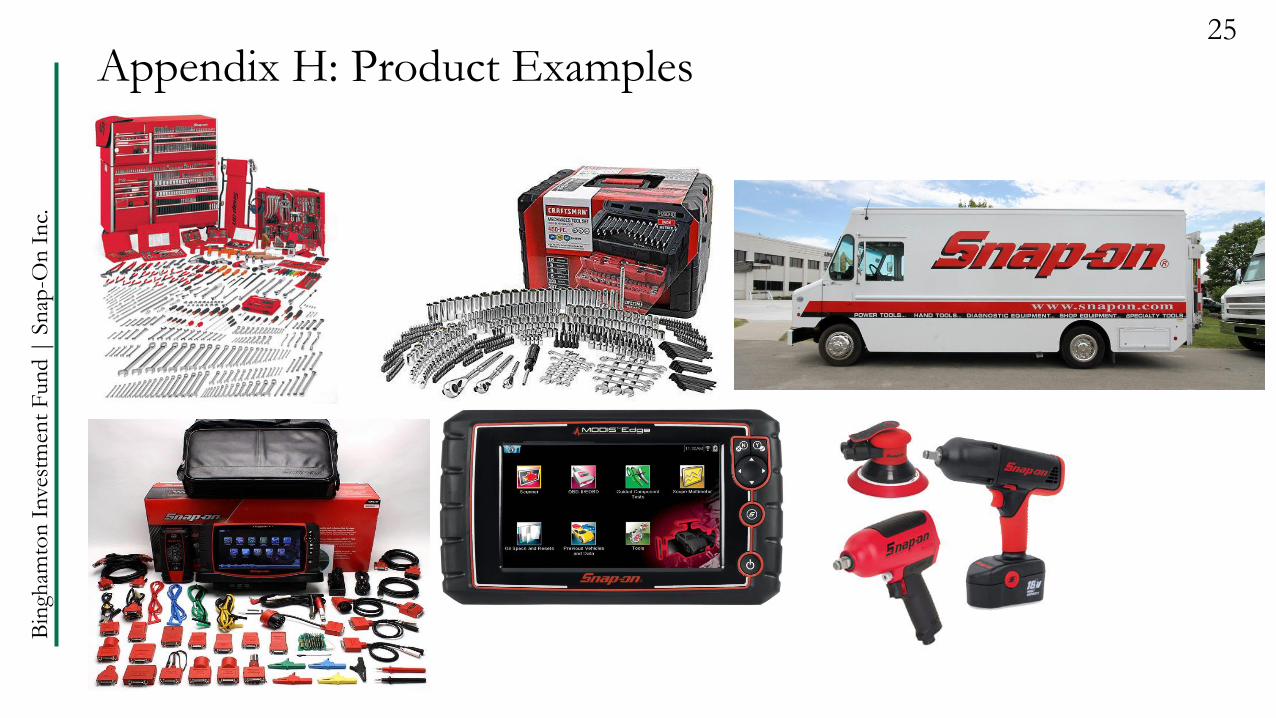
Appendix H: Product Examples25
Bin
gham
ton
Inve
stm
ent
Fun
d |
Sn
ap-O
n I
nc.
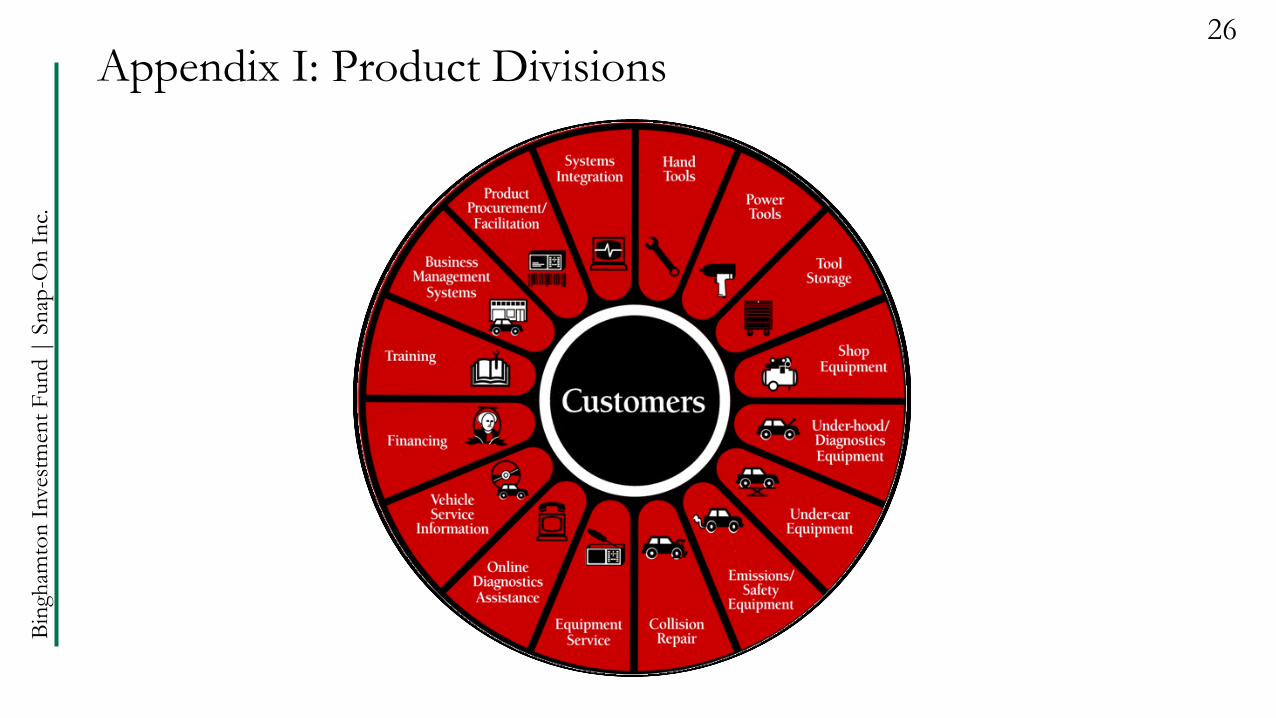
Appendix I: Product Divisions26
Bin
gham
ton
Inve
stm
ent
Fun
d |
Sn
ap-O
n I
nc.
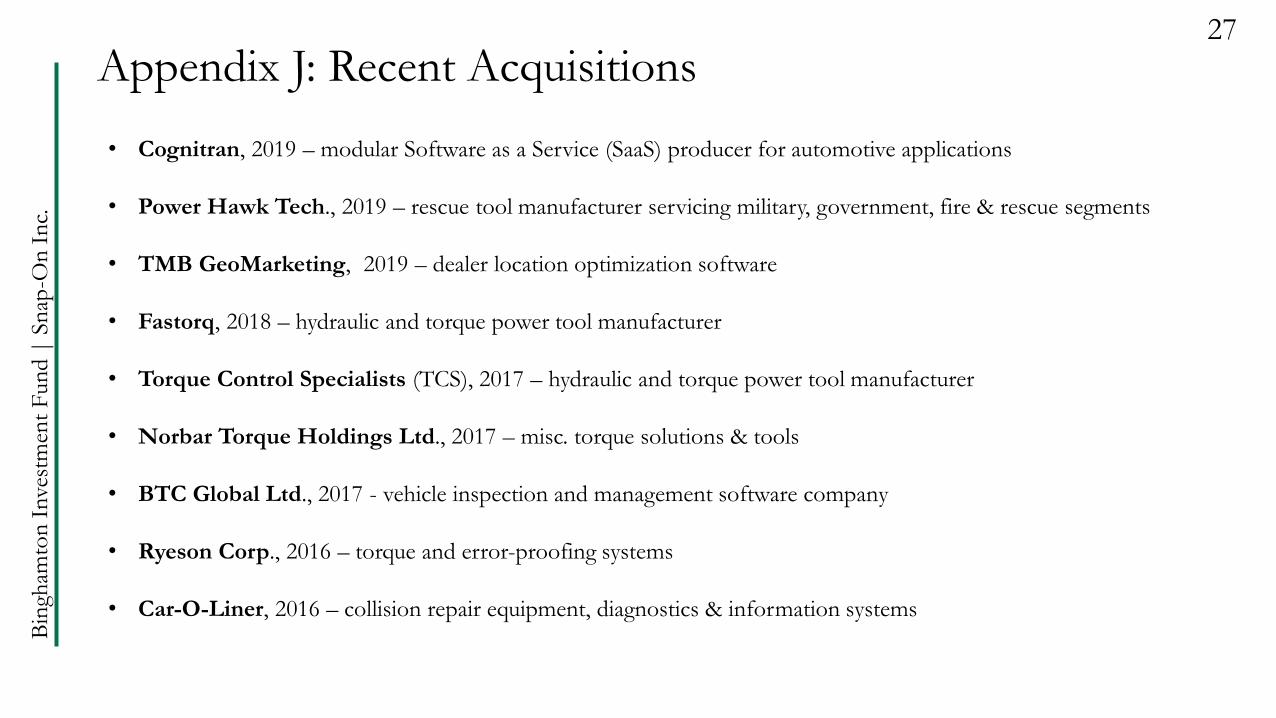
Appendix J: Recent Acquisitions27
• Cognitran, 2019 – modular Software as a Service (SaaS) producer for automotive applications
• Power Hawk Tech., 2019 – rescue tool manufacturer servicing military, government, fire & rescue segments
• TMB GeoMarketing, 2019 – dealer location optimization software
• Fastorq, 2018 – hydraulic and torque power tool manufacturer
• Torque Control Specialists (TCS), 2017 – hydraulic and torque power tool manufacturer
• Norbar Torque Holdings Ltd., 2017 – misc. torque solutions & tools
• BTC Global Ltd., 2017 - vehicle inspection and management software company
• Ryeson Corp., 2016 – torque and error-proofing systems
• Car-O-Liner, 2016 – collision repair equipment, diagnostics & information systems
Bin
gham
ton
Inve
stm
ent
Fun
d |
Sn
ap-O
n I
nc.
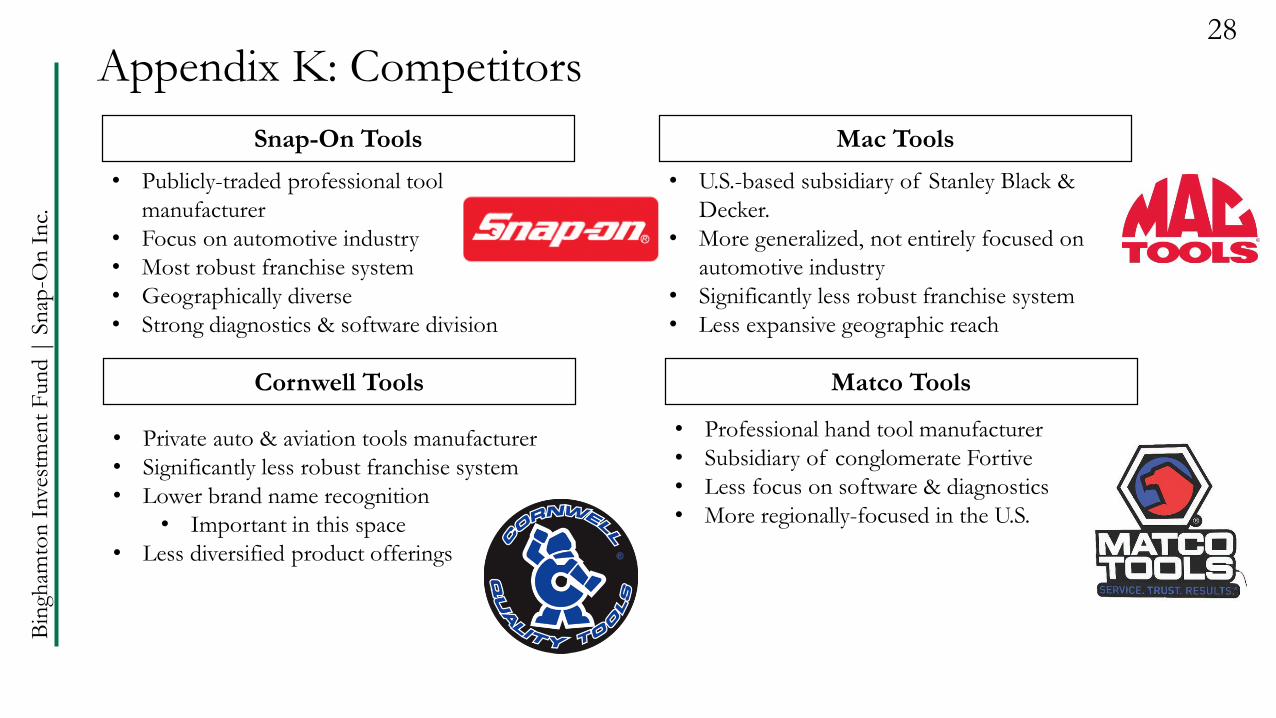
Appendix K: Competitors28
Snap-On Tools Mac Tools
• Publicly-traded professional tool
manufacturer
• Focus on automotive industry
• Most robust franchise system
• Geographically diverse
• Strong diagnostics & software division
• U.S.-based subsidiary of Stanley Black &
Decker.
• More generalized, not entirely focused on
automotive industry
• Significantly less robust franchise system
• Less expansive geographic reach
• Private auto & aviation tools manufacturer
• Significantly less robust franchise system
• Lower brand name recognition
• Important in this space
• Less diversified product offerings
• Professional hand tool manufacturer
• Subsidiary of conglomerate Fortive
• Less focus on software & diagnostics
• More regionally-focused in the U.S.
Cornwell Tools Matco Tools
Bin
gham
ton
Inve
stm
ent
Fun
d |
Sn
ap-O
n I
nc.
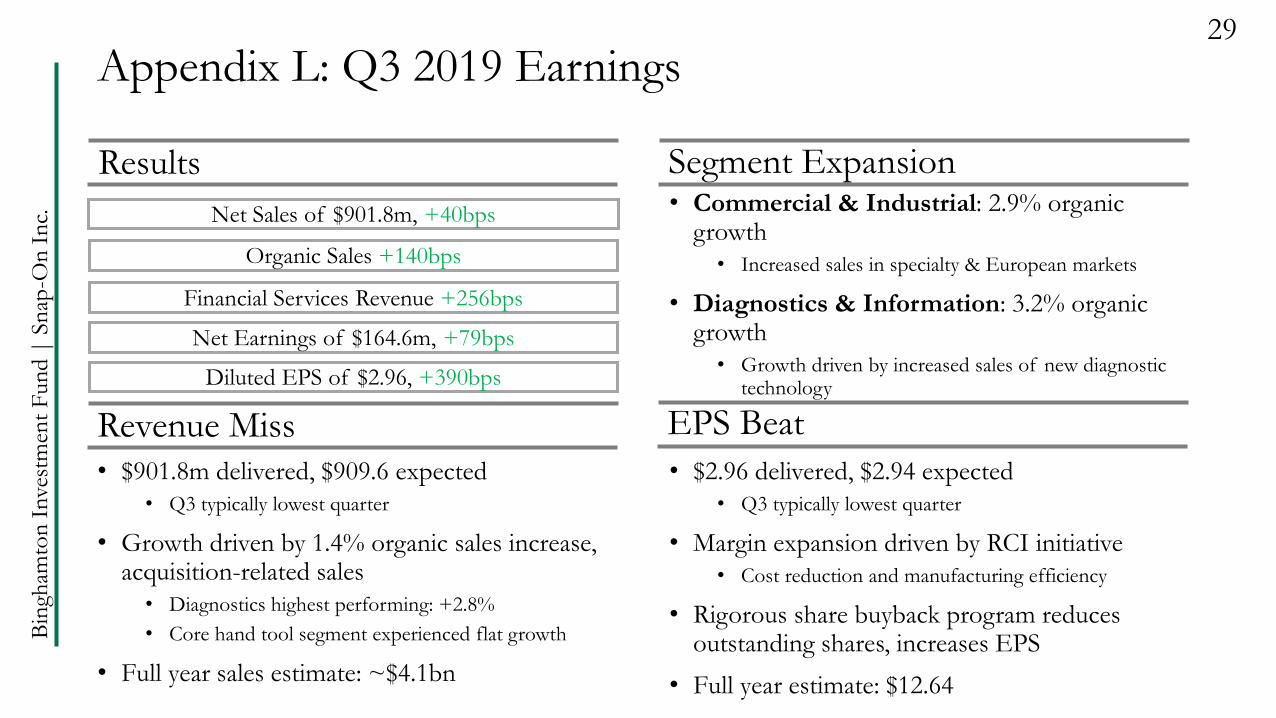
• Commercial & Industrial: 2.9% organic growth
• Increased sales in specialty & European markets
• Diagnostics & Information: 3.2% organic growth
• Growth driven by increased sales of new diagnostic technology
• $901.8m delivered, $909.6 expected
• Q3 typically lowest quarter
• Growth driven by 1.4% organic sales increase, acquisition-related sales
• Diagnostics highest performing: +2.8%
• Core hand tool segment experienced flat growth
• Full year sales estimate: ~$4.1bn
• $2.96 delivered, $2.94 expected
• Q3 typically lowest quarter
• Margin expansion driven by RCI initiative
• Cost reduction and manufacturing efficiency
• Rigorous share buyback program reduces outstanding shares, increases EPS
• Full year estimate: $12.64
Appendix L: Q3 2019 Earnings29
Results Segment Expansion
Revenue Miss EPS Beat
Net Sales of $901.8m, +40bps
Organic Sales +140bps
Financial Services Revenue +256bps
Net Earnings of $164.6m, +79bps
Diluted EPS of $2.96, +390bps