Embed Size (px)
Citation preview

A ‘middle-out’ approach to Balanced Scorecard (BSC) design and
implementation for Service Management: Case Study in Off-shore
IT-Service Delivery
Raghavan, Srinivasa-Desikan; Sethi, Monika; Sunder Singh, Dayal; Jogia, Subhash
-------------------------------------
Details of authors 1. Name: [Last, First] : Raghavan, Srinivasa-Desikan
affiliation, : Tata Consultancy Services Ltd.,
country and : India
email address. : [email protected]
2. Name: [Last, First] : Sethi, Monika
affiliation, : Tata Consultancy Services Ltd.,
country and : India
email address. : [email protected]
3. Name: [Last, First] : Sunder Singh, Dayal
affiliation, : Tata Consultancy Services Ltd.,
country and : India
email address. : [email protected]
4. Name: [Last, First] : Jogia, Subhash
affiliation, : customer organisation
country and : India (at post)
email address. : -----
--------------------------------------------------------

A ‘middle-out’ approach to Balanced Scorecard (BSC) design and
implementation for Service Management: Case Study in Off-shore
IT-Service Delivery
Raghavan, Srinivasa-Desikan; Sethi, Monika; Sunder Singh, Dayal; Jogia, Subhash
Abstract In this paper, we describe a BSC approach to Service Management for a portfolio of projects
at Tata Consultancy Services Ltd. (TCS), India, with one of its valuable customers, a Leading
Global Financial Service Company. During the growth of their business relationship, there was
a need to manage a critical portfolio of projects in ‘Straight-Through-Processing’ (STP)
services, with special reference to customer feedback and KPI management. We chose BSC
approach to manage and control this flagship program, for the ease of design and for the clarity
of communication amongst its stake holders. The design characteristics for the scorecard and
experience of its implementation are highlighted here.
1. Introduction and background The Balanced Scorecard (BSC, henceforth) has been in practice for Corporate Performance
Management and for strategy deployment purposes since early 1990s [1, 2, 3]. Since then
numerous cases of its usage, both as success and as failure abound the corporate case history.
From the example of a corporate scorecard getting cascaded to individual teams’ level, there are
cases where BSC had also been used for ‘Project focused IT Organization’ [4]. From the design
view point, there are many organisations that specialize in both BSC tools (there are many tools
in the market, besides in-house developed usages) and in BSC practices and training
[“Performance Management & 3rd Generation Balanced Scorecard”; ‘www.2gc.co.uk’][5].
In this paper, we describe our attempt to design and implement BSC, which can be a ‘middle-
out’ approach compared to the traditional top down way of arriving at scorecards.
1.1. STP highlights Tata Consultancy Services Ltd, (TCS, henceforth), is India’s the largest IT Services firm, a
US$ 5.7 billion global software and services company and is part of the well known Tata Sons
group; it has many Fortune-10 and Fortune-100 organisations in its customer base.
In this paper, we will be describing our experience in implementing BSC for the purpose of
moving up the value chain in Vendor – Customer Relationship, (Relationship, henceforth), for a
specific customer.
The customer is one of the largest multinational corporations (Customer, henceforth) in
Financial Services industry. The following figure summarises the Relationship status, as per last
quarter (January – March 2009) data.
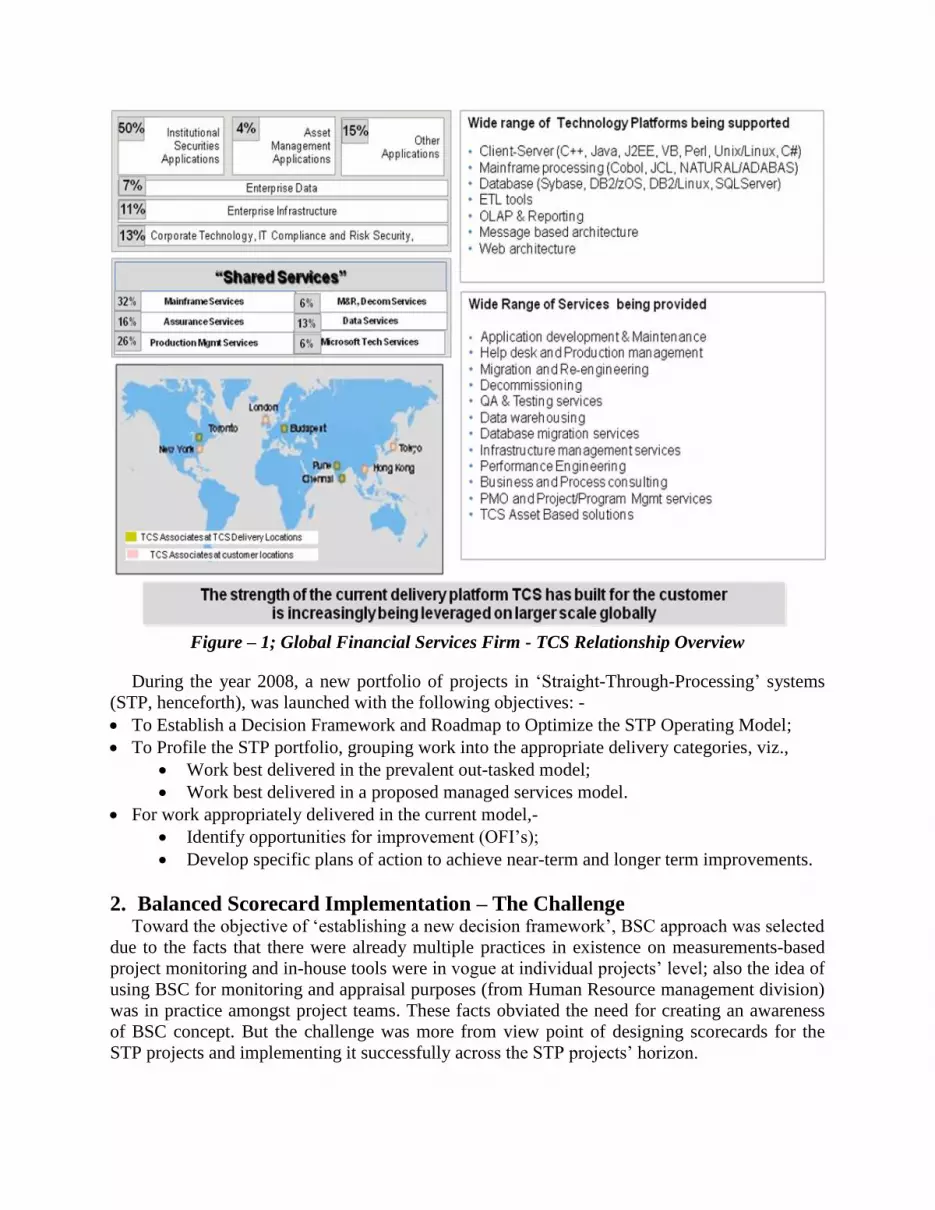
Figure – 1; Global Financial Services Firm - TCS Relationship Overview
During the year 2008, a new portfolio of projects in ‘Straight-Through-Processing’ systems
(STP, henceforth), was launched with the following objectives: -
To Establish a Decision Framework and Roadmap to Optimize the STP Operating Model;
To Profile the STP portfolio, grouping work into the appropriate delivery categories, viz.,
Work best delivered in the prevalent out-tasked model;
Work best delivered in a proposed managed services model.
For work appropriately delivered in the current model,-
Identify opportunities for improvement (OFI’s);
Develop specific plans of action to achieve near-term and longer term improvements.
2. Balanced Scorecard Implementation – The Challenge Toward the objective of ‘establishing a new decision framework’, BSC approach was selected
due to the facts that there were already multiple practices in existence on measurements-based
project monitoring and in-house tools were in vogue at individual projects’ level; also the idea of
using BSC for monitoring and appraisal purposes (from Human Resource management division)
was in practice amongst project teams. These facts obviated the need for creating an awareness
of BSC concept. But the challenge was more from view point of designing scorecards for the
STP projects and implementing it successfully across the STP projects’ horizon.

2.1. Prevailing Governance mechanism Given the complexity of the projects’ affiliation to various Customer sponsorship units,
spanning across the globe with multiple sets of IT Services on different platforms, the prevailing
governance mechanism was focused more on individual sponsorship units and the monitoring
method driven by Service Level Agreements (SLAs, henceforth) across individual contracts. The
sources of data for this purpose were derived from multiple systems, both at TCS and from
Customer systems. A generic governance structure, as shown below, was in practice for
monitoring and controlling the specific sets of projects.
Table – 1; Governance mechanism
Frequency Participants Agenda
Bi-weekly Joint Steering
Committee
Program
Management Team
Working Groups
STP wide governance
Review overall program progress and set directions
Review overall program Key Performance
Indicators (KPIs)
Review exit criteria
Jointly assess checkpoints for switch over different
project modes
Bi-weekly TCS Steering
Committee
Core Team (TCS)
Working Groups
Review overall program progress and set directions
Review overall program Risks / Issues
Weekly Working groups
Core Team (TCS)
Application groups governance
Progress review at application group level
Discuss challenges, risks & issues, exit criteria
Review and detail Knowledge Management (KM)
processes and Service Delivery processes for
application groups
Weekly Program
Management Team
Overall progress
Plan updates, Issues, Risks
Issues that need escalation
2.2. BSC Implementation Plan A new program to launch BSC was sanctioned for the STP portfolio and a core program
management team was announced, with members from TCS and from Customer teams. A new
reporting structure was drawn up and apart from the governance mechanism present at that point,
it was decided to create a data system exclusively for BSC reports.
For deploying the BSC, five projects were chosen as ‘pilots’ that have their individual SLAs
closely aligned to STP objectives. Milestones were identified for achieving the STP objectives
with BSC implementation being a primary one across these five pilot projects.

Figure – 2; STP Program Roadmap
3. BSC design – the ‘Middle out’ There are cases in literature [4], where BSC was used as a pure Project Management element,
complementing the traditional project management and control mechanism. But the design of
BSC was attempted from a top down approach. Goold et al. [6] describes three types of
‘Parenting Styles’, viz. strategic planning, strategic control and financial control, for the roles
and responsibilities between corporate and organisational units. These types of styles also
influence the role the corporate would adopt in the design and usage of BSC across corporate and
business units [7]. We have adopted a method that has parallel to ‘strategic control’ model in our
situation, wherein the corporate (the Relationship, in our case) would influence the design of
scorecard, but it would be the business units (it is the STP – BSC Program and the constituent
projects) that influence the usage of it.
As mentioned before, when the program was sanctioned, there were projects with their own
measures to monitor, but they existed as disparate systems. After having discussions with the
program steering committee, the stake holders and the project teams, a first cut BSC was drawn
for the program, much akin to a Corporate BSC, but with the focus aimed at customer service
levels and KPIs. In fact, we found that the financial measure was more of a derived benefit
(Total Cost of Ownership) rather than a starting point!
The program core team worked out multiple iterations, to arrive at individual scorecards
across the pilot projects (re-using many prevailing measures) and connecting them to the
Program BSC, to arrive at a consensus that was aligned with the proposed governance
requirements. We were able to retain many measures that were used at projects’ level, while
choosing the ones that would get ‘aggregated’ at program level scorecard. Thus, Relationship

expectations were typically ‘cascaded’ downwards as BSC measures (from Program BSC to
Projects’ BSC), while re-used individual project measures were ‘aggregated’ upwards.
3.1. Characteristics of BSC design – the ‘Middle out’ The design process was typically recursive at each time when a new project was added to the
program portfolio and we found that the participating projects contributed to the design more, by
way of carrying forward their set of measures; and thus we would prefer to call the design
approach the ‘Middle-out’, compared to top down mode of designing scorecards.
The following steps would describe the process of this design approach:
1. Start up / or from a previous steady state phase: Existing islands of projects in the
Relationship portfolio, (with independent SLAs, KPIs and measures) focus on their
operational efficiency, project management and control, besides monitoring for Risk
management.
2. Coalescence phase: When a new program is sanctioned, driven by the goals and changes
in the objectives of the Relationship, coalescence comes into play. The steps in this phase
are -
1. Select pilot projects that have similar and comparable SLAs and KPIs.
2. Derive ‘tactical themes’ as opposed to Corporate Strategic Themes. (the example
is - “Move maximum number of projects to ‘Managed Services’ mode(MSM)
from ‘Time and Materials’ mode (MTM)”)
3. Develop Strategy Map from the new business goals, and the identified program
benefits and derive the new set of KPIs and measures.
4. Assign targets with tolerance ranges (Green / Amber / Red) for the finalized
measures that would drive the SLAs to fruition.
5. Apply Data Quality Framework (explained in later section), to individual
measures and identify support projects and initiatives required to achieve it.
6. Re-draw (or edit) the program and project plans.
7. Analyse new risk profiles and mitigation plans.
8. Derive the new governance model and get approval for the same.
3. Communication Phase: Publish the Scorecard to stake holders and draw up
communication and change management plans. (Town hall meetings, Training, Kiosks
for Demonstrations, etc. as required).
4. Implementation Phase: Go Live and monitor. (Closure / start steady state phase)
5. Iterate from ‘Coalescence’, when new projects join.
The following figure depicts the design elements.

Figure –3; Strategy Maps for BSC Design Middle-Out
We can compare the traditional Balanced Scorecard approach (the first generation) with the
middle-out approach in the following way.
Table – 2; BSC Top down Vs Middle-Out
BSC Top Down BSC Middle-Out
Starts at Organisational top; Corporate Vision
driven SLAs / KPI
Focus on Customer – Vendor Relationship,
Portfolio / Program Objectives; Benefits driven
SLAs
Long Term planned (3-5 years) Short Term focused (1-2 years)
Start from Financial goals (Perspective) and
derive other Perspectives. Identify Strategic
Initiatives (as relevant).
Start from Customer Expectations on Portfolio
Benefits and distribute SLAs across relevant
BSC Perspectives
Usually top-down approach to BSC design ‘Middle-out’ design’; iterative process of top-
down (from Portfolio SLAs) and bottom-up,
where the quantum of contribution is more
from Projects’ level (operational parameters
for arriving at measures and targets).
Strategy Maps are enablers for BSC design;
they validate the Strategic Themes.
Strategy Maps drive the design
Changes to Dash board measures are generally
minimal at Corporate level BSC.
Flexible to changes to measures or their targets
both at Projects’ level and at ‘Internal
Processes’ Perspective of individual
Scorecards.

The advantages of this middle-out approach can be summed up as follows:
The Program Scorecard can evolve from the vendor – customer relationship, while
contributing to the respective organisational scorecards, at specific KPIs and at individual
Perspectives of scorecard.
The scorecard structure (parent – children scorecards) can be extended to more projects, at
different ‘coalescence’ phases, as the maturity of vendor – customer relationship grows.
3.2. Data Quality Framework During the ‘coalescence’ phase of getting all the individual scorecards and lists of measures,
in order to derive a consistent set of scorecards at program and at individual projects’ level, the
following set of parameters are important for ensuring high data integrity, viz.-
1. Single source of data (the Customer or TCS) Vs. Disparate Sources
2. Atomic data Vs. Derived one
3. Manual data entry Vs. Automatic updating
4. Testing is done (one time activity) for BSC data at individual measures, for logic and
expected result, with the Customer managers Vs. testing not done
The 16 combinations of situations for these parameters can then be grouped into 5 ratings
(assuming a normal distribution) for, what we call ‘certainty factor’ (CF), so that appropriate
actions or initiatives can be taken at the Program level. These are given in following 2 tables.
Table-3; Combinations of selected parameters into CF ratings
Type of Data Data Entry Data Testing
(Yes / No)
Single source of
data
Disparate
sources of data
Atomic Automatic Yes High High
NO Medium-High Medium
Manual Yes Medium Medium
NO Low Low
Derived Automatic Yes High Medium-High
NO Medium-High Medium
Manual Yes Medium-Low Low
NO Low Low
Final CF ratings
Table-4; Recommendations for Improvements (With specific reference to ratings and combinations)
CF Rating Approximate CF
Percent range
Things to improve
High >90 • Do nothing
Medium-High 80-90 • Do one system test
• Move from disparate to one data
source
Medium 70-79 • Reduce, avoid manual data entry
• Move from disparate to one data
source
Medium-Low 60-69 • Move from disparate to one data
source
Low <60 • Do one system test
• Move from disparate to one data
source
• Reduce, avoid manual data entry
While re-planning after data quality analysis, we had identified special projects that would
feed the benefits of data quality improvements across the program data sources. These were
added to the program plan, were budgeted accordingly and were monitored along, through the
governance mechanism.
3.3. Performance Index For the purpose of monitoring performance, as well for the purpose of rewards recognition,
the individual measures were given ‘weights’ (though, during the time of piloting, the weights
were set to a value of 1) and their performance deviation was measured at regular intervals. The
individual measures’ performance values were then aggregated for specific BSC perspectives, as
well as at individual scorecard levels. Thus we had various ‘weighted performance of measures’,
which were called Performance Indices (PI) on the scorecards. This idea helped the STP-
program in a significant way, by comparing PIs across various perspectives, across scorecards as
well as across individual projects.
Given below is a simplified version of PI formula (exceptions and other indeterminate results
were given separate heuristics in the system).
PI = ∑ (MP*W) / ∑ (W)
Primary Parameters (for design of PI)
o Target (‘T’)
o Actual (‘A’)
o Directionality (‘D’)
o Weight (‘W’)
Derived Parameter (for design of PI)
o Metric Performance (MP)
MP= A/T (if D is ‘>=‘)
MP= T/A (if D is ‘<=‘)
The MP gives the ‘% performance’, viz., the extent of target getting achieved,
based on the Directionality.
Directionality focuses on the goal of, either maximization or minimization of
the ‘Metric intent’ (for example, measures like ‘profit’ will be having a

Directionality of ‘>=’ while a ‘metric intent’ for ‘cost’ will be to get
minimized (‘<=‘)).
4. STP – BSC Program Implementation The launch preparation phase lasted about 4 weeks, when internal marketing campaign was
conducted. The project teams, their managers from TCS and from the Client teams and the
program core team had frozen the scorecard elements (that included the measures, initiatives for
achieving the desired data quality, negotiated targets and their target deviation zones (for traffic
lights metaphor of monitoring)). Detailed launch plan was drawn up (at weekly and daily level of
activities) and these activities were executed.
4.1. Go-Live time lines As mentioned before, some of the activities we executed during the launch preparation phase
were to freeze measures, address the program risks and issues. We conducted many town hall
meetings with individual teams and stake holders, prepared collaterals for internal marketing
purposes besides launched self-running demonstration kits.
The following diagram gives the launch plan we had.
Figure –4; STP – BSC Roll out Plan
In the final mode of governance, we have superposed the new BSC based STP-Program
review, while retaining the (then) existing review mechanisms at the project level, wherever

required. This had helped the program to track important program specific measures, while
facilitating the need-driven data drill down at individual projects’ level.
The following table depicts an interesting observation:
Table-5; BSC Usage
BSC Usage Year # Hits
September 2008 1*
October 2008 1*
November 2008 2*
December 2008 41
January 2009 17
February 2009 28
(* - the figures denote user accounts; not number of hits)
The BSC skeleton system was uploaded in September 2008, on the Customer portal but was
kept with just 1 user account (essentially for the administrator, to manage the design,
development and data feed); in November 2008, we had created one more user account for
training and demonstration. Actual ‘going live’ happened in December 2008; we found the
steady state usage from January 2009 onwards.
Given below is the Program BSC (for the sake of confidentiality, we have masked the actual
numbers; data points from April-08 onwards were re-constructed for display).
Sr # Performance Measure Unit KPI Target Frequency Apr '08
Tre
nd May
'08 Tre
nd Jun
'08 Tre
nd
Finance
1 TCO Savings (Direct / Indirect) $ N Half yearly
Customer 0.80 0.80 0.80
2 Customer Satisfaction Index (Overall) % Y 90% Half yearly 84% 84% 84%
3 CSI - Most important parameters rated low % Y 10% Half yearly 11% 11% 11%
4CSI - Most important Service & Business Goals
parameters rated high% Y 80% Half yearly 86% 86% 86%
5 Customer Appreciations # N Monthly 8 9 6
6 Customer Complaints # N Monthly 0 0 3
7 Quality of Service (from annual survey) # N Yearly
Process & Delivery 0.54 0.54 0.66
8 Post Delivery Defects # Y 5 Monthly 2 4 4
9 Steering Committee Meeting % Y 100% Half yearly
10 Monthly Governance % Y 100% Monthly 67% 100% 100%
11 Outages (severity 1 & 2) # Y 3 Monthly 3 3 1
12 Projects delivered on time % Y 95% Monthly
13 Projects Delivered on budget % Y 95% Monthly
14 SLA compliance to response time % Y 95% Monthly 99.7% 99.6% 99.4%
15 SLA compliance to resolution time % Y 95% Monthly 97.0% 96.6% 96.7%
16 Alerts resolved w/o error % Y 95% Monthly 100% 100% 100%
Learning, People & Competency 0.40 0.90 0.90
17 Compliance to minimum competency level % Y 100% Monthly 80% 80% 80%
18 Unplanned Attrition in critical phases # Y 0 Monthly 1 0 0
19 Upload activity of assets into KM system # N Monthly 0 0 0
20 Reference activity of assets in KM system # N Monthly 0 0 0
STP Performance Index 0.58 0.58 0.72
0
Figure –5; STP – BSC Program scorecard
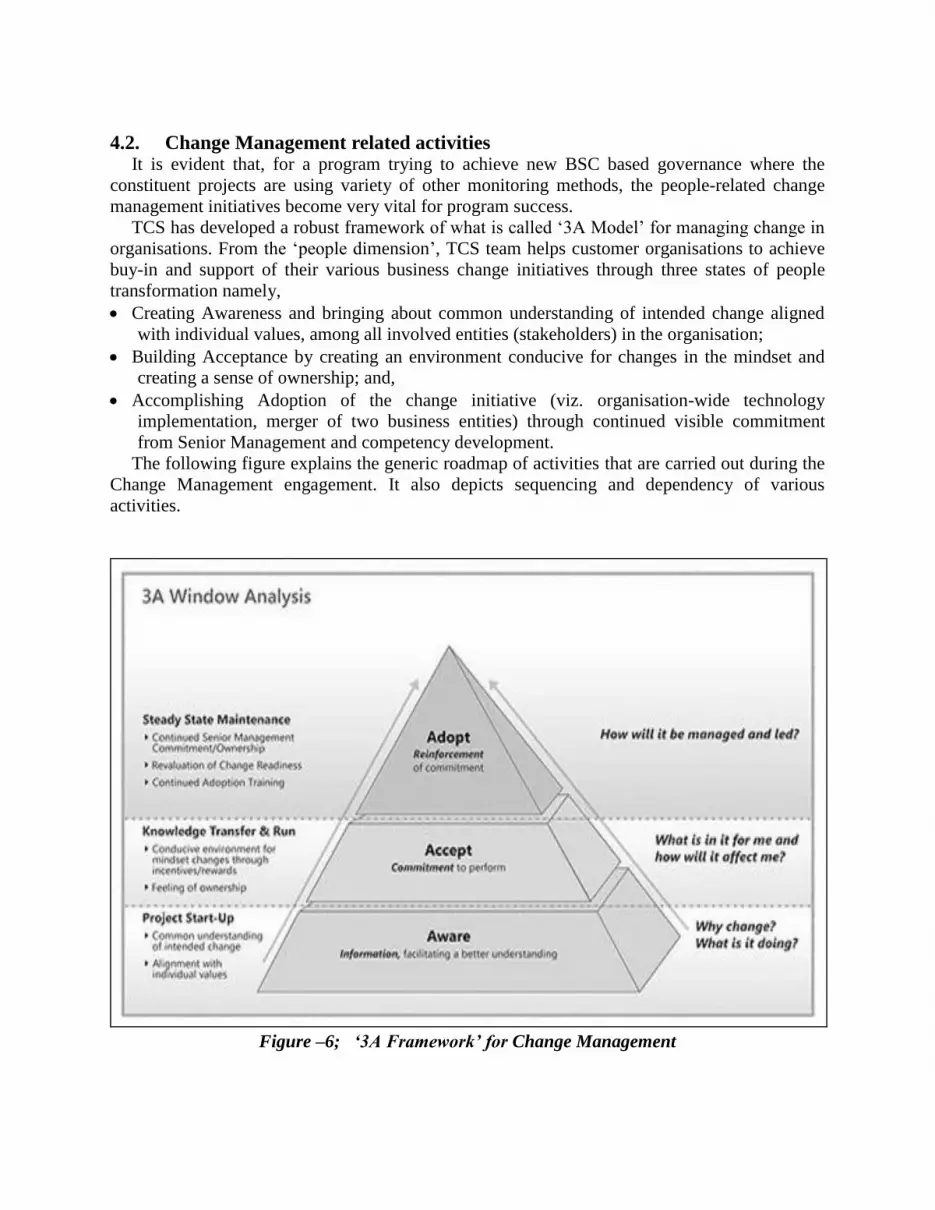
4.2. Change Management related activities It is evident that, for a program trying to achieve new BSC based governance where the
constituent projects are using variety of other monitoring methods, the people-related change
management initiatives become very vital for program success.
TCS has developed a robust framework of what is called ‘3A Model’ for managing change in
organisations. From the ‘people dimension’, TCS team helps customer organisations to achieve
buy-in and support of their various business change initiatives through three states of people
transformation namely,
Creating Awareness and bringing about common understanding of intended change aligned
with individual values, among all involved entities (stakeholders) in the organisation;
Building Acceptance by creating an environment conducive for changes in the mindset and
creating a sense of ownership; and,
Accomplishing Adoption of the change initiative (viz. organisation-wide technology
implementation, merger of two business entities) through continued visible commitment
from Senior Management and competency development.
The following figure explains the generic roadmap of activities that are carried out during the
Change Management engagement. It also depicts sequencing and dependency of various
activities.
Figure –6; ‘3A Framework’ for Change Management

For this STP – BSC program, as part of ‘Awareness’, collaterals were prepared for the
internal marketing campaign. These posters and electronic presentations highlight the
charateristics and the benefits of BSC framework for program monitoring, control, and for
keeping everyone aligned, onto a single page.
The town hall meetings for each project team and the support staff were attended by
respective managers from TCS and from the Customer counter-part team. The commitment of
the top management had thus ensured that the ‘culture’ had taken a solid root, during the
‘Accept’ phase.
The communications around this intiative to the respective teams used phrases like, ‘culture’,
‘vocabulary’, ‘socializing’, besides broadcasting the core message of importance and relevance
of the BSC initiative. Though the steady state condition wasn’t reached then, the ‘Adoption’
phase was very hectic, with mock up reviews, before declaring the program going live.
5. Way Forward We intend to take the lessons learned out of this success story across the Relationship as a
value-add to its maturity level. Also as a ‘continuously learning’ organisation, we have generated
knowledge artifacts for quicker deployment for a similar initiative in future.
5.1. Critical Success Factors Some of the critical success factors for this BSC implementation were as follows:
• By adopting an effective change management approach to implementation, by identifying
early adaptors and champions amongst the project teams; and by maintaining regular
communication through training and town hall meets (we call it ‘socializing’);
• By involving the stake holders and the project managers, through iterative discussions on
the objectives of the program, and on the elements from SLA and the KPIs at the Relationship
level; this would become the leaven for useful scorecards with well defined project management
metrics, well defined delivery performance (quality) metrics, customer satisfaction metrics and
knowledge management metrics;
• By designing scorecards with measures that are independent at their scorecard level
besides the measures whose values of performance are aggregated from those of lower levels;
this has facilitated a quick identification of ‘root causes’ and ‘relationships’ (if any) amongst
scorecard elements, while trouble shooting;
• By evolving the PI (weighted average) based method of monitoring measures, for BSC
perspectives and Scorecards; this had helped in comparing the projects’ performance across the
program;
• By making the scorecards visually ‘pleasing’ (we found this being important, after a
quick deployment of proof of concept!) and useful, by having important measures tracked for
their trends.
***
References
[1] Robert S. Kaplan and David P. Norton, “Putting the Balanced Scorecard to Work”, Harvard
Business Review, September – October 1993, pp139
[2] Robert S. Kaplan and David P. Norton, “The balanced scorecard: measures that drive
performance”, Harvard Business Review, January-February 1992, pp. 71-79

[3] Robert S. Kaplan and David P. Norton, “The Strategy-Focused Organisation: How balanced
scorecard companies thrive in the new business environment”, Harvard Business School Press,
Boston, Mass., 2000
[4] Glen B. Alleman, “Using Balanced Scorecard to Build a Project Focused IT Organization”, in
Balanced Scorecard Conference, IQPC proceedings, San Francisco, Oct. 28, 29, 30 -2003
[5] “Performance Management & 3rd Generation Balanced Scorecard”; ‘www.2gc.co.uk’
[6] Goold, M., Campbell, A. and Alexander, M., “Corporate Level Strategy: Creating value in the
multibusiness organisation”, Wiley, New York, 1994
[7] Andre de Waal, “Strategic Performance Management: A managerial and behavioural
approach”, Palgrave Macmillan, New York, 2007
***