Embed Size (px)
Citation preview
March 27th, 2009
Sponsors: Stäubli, Spartanburg Regional Healthcare System, EPSCoR/IDeA RS grant. 1
Message from the Program Committee:
Welcome to the fifth annual meeting of the SC Upstate Research Symposium! The SC Upstate Research Symposium Series offers faculty and students the opportunity to showcase their current research, scholarly, and creative activities while interacting with other researchers and community leaders from throughout the Upstate. This year’s meeting features presentations and posters from faculty and students from USC Upstate, Converse College, Wofford College, Limestone College, Spartanburg Methodist College, Spartanburg Community College, Southern Wesleyan University, Lander University, Sherman College, and Presbyterian College.
We would like to sincerely thank our community sponsors: Stäubli (our GOLD Sponsor), Spartanburg Regional Healthcare System (our SILVER Sponsor). Such support from prominent regional businesses and institutions is greatly appreciated and essential for the advancement of academic research in the Upstate. We would also like to thank the EPSCoR/IDeA RS state grant program.
This year’s event will include keynote speeches by Mayor William Barnet III, Mayor of Spartanburg and Dr. Jay Moskowitz, President of Health Sciences South Carolina. Special invited guests include Mr. David Root of Converse Motors, who will present his company’s cutting edge Hydrogen Add-on Technology for automobiles during the Poster Session.
If you have any questions or comments about this Symposium Series, or would like to receive an additional printed copy of the most recent Symposium Proceedings, please contact Dr. Sebastian van Delden, (864) 503-5292, [email protected]. More information can also be found on the Symposium website: http://www.uscupstate.edu/symposium.
Once again, welcome!
The Program Committee
Sincere Thanks to our Community Sponsors:
The Stäubli Corporation is the Gold Level Sponsor for the Fifth Annual SC Upstate Research Symposium. Stäubli is a mechatronics solution provider with three dedicated divisions: textile machinery, connectors, and robotics. With a workforce of over 3000, the company generates a yearly turnover surpassing 1 billion Swiss francs. Originally founded 1892 as a small workshop in Horgen / Zurich, today Stäubli is an international group with its head office in Pfäffikon, Switzerland. Visit http://www.staubli.com for more information.
The Spartanburg Regional Healthcare System is the Silver Level Sponsor for the Fifth Annual SC Upstate Research Symposium. The Spartanburg Regional Healthcare System offers a
unique combination of world-class facilities, caring and dedicated professionals, advanced technology, and specialized treatment options. “Spartanburg Regional is more than a hospital, we’re are a family of healthcare providers who live and work in the Upstate. We're here to care for you when you need medical attention, but we're also here to help keep you well. We're your healthcare system, and we're with you for life.” Visit http://www.srhs.com for more information.

Fifth Annual SC Upstate Research Symposium
2 Sponsors: Stäubli, Spartanburg Regional Healthcare System, EPSCoR/IDeA RS grant.
Table of Contents The Program Committee ............................................................................... 7 Keynote Speakers and Tutorial Presenters ................................................... 8 Symposium Schedule Overview .................................................................... 9 Breakout Session 1: Biology ........................................................................ 10 Session Chair: Neval Erturk, Converse College
Comparative Histopathology of the Lungs and Urinary Bladder of Rana pipiens Infected with Parasitic Helminths.................................................... 10 Edna Steele, Stephanie Newton and Baye Williamson Converse College
Ploidy Levels and Genome Sizes of Magnolia L. Species, Hybrids, and Cultivars .... 13 Kevin Parris, Spartanburg Community College; Thomas Ranney, N.C. State University W. Vance Baird and Halina Knap, Clemson University
Messin' with Texas! The genus Isoetes (Isoetaceae) in the Lonestar State .............. 16 C. Matthew Hardman and Kerry Heafner Limestone College
Using Spatial Assessment of Drift Fence Captures to Investigate Juvenile Dispersal of Ranid Frogs ......................................................................... 18 Chelsea Kross and Melissa Pilgrim USC Upstate
Three Allotetraploid Segregates of Isoetes piedmontana (Pfeiffer) Reed ............... 21 Ricky Brannon, Miranda Dornis, Kristen Smith and Kerry Heafner Limestone College
Breakout Session 2: Human and Civil Rights: Around the World............... 24 Session Chair: Jane Watkins, Limestone College
Charles W. Chesnutt and Racial Caricatures in Post-Bellum, ............................... 24 Pre-Harlem America Peter Caster USC Upstate
Child Trafficking - Borderline Slavery .................................................................. 30 Landis Bunch and Carolyn Hooker Spartanburg Community College
Environmental Activism in the Middle East ...........................................................32 Joni Hammond and Lizabeth Zack USC Upstate
Scars of Africa ..................................................................................................... 34 Robin Ivey and Carolyn Hooker Spartanburg Community College
Child Soldiers in Burma....................................................................................... 36 Sam Karns and Carolyn Hooker Spartanburg Community College
Breakout Session 3: Mathematics and Computer Science .......................... 38 Session Chair: Jerome Lewis, USC Upstate
A Novel Robotic Approach to Contour Recovery using Structured Light ................ 38 Nicole Hodge, Robert Mahmoudishad, Mark Parrish, and Sebastian van Delden USC Upstate
March 27th, 2009
Sponsors: Stäubli, Spartanburg Regional Healthcare System, EPSCoR/IDeA RS grant. 3
Multithreaded and Parallel Programming: Problems and the Environments and Tools to Handle Them ............................................................. 41 Edward Stokes and Wayne Smith Presbyterian College
Mining Exceptions as Interesting Knowledge ....................................................... 44 Stephen St. Peter and Rick Chow USC Upstate
Determinants of Information Technology Acceptance: A Review .......................... 48 of Technology Acceptance Model Bilquis Ferdousi Spartanburg Community College
Mathematical Modeling of non-Newtonian Peristaltic Flows ................................. 52 Muhammad Hameed USC Upstate
Poster Session ............................................................................................. 54 Investigation of the Role of Promoter Methylation and Histone Modification in the Down-regulation of the Colon Tumor Suppressor, DRA ...............................54 Derek Griffith and Jeannie Chapman USC Upstate
An In-Depth Study of the Length of Hospital Stays with Regard to Procedures performed on Type II Diabetes Patients ................................................................56 Anneliese Schmidt and Wei Zhong USC Upstate
Implementation of the North American Amphibian Monitoring Program in ......... 58 the Upstate Region of South Carolina Alexsis Ferguson and Melissa Pilgrim USC Upstate
Size of Rank Tests for Location in Linear Models with Repeated Observations ....... 61 Daniel Hagerman and Bernard Omolo USC Upstate
On the Properties and Applications of the Space of Linear Functions L(R) ............ 63 Michael Blackmon and Gamal Elnagar USC Upstate
Action Rule Summaries ........................................................................................65 Cuong Hoang, Anna Novo and Angelina Tzacheva USC Upstate
Transition to Preschool Programs for Young Children with Disabilities ................ 68 Delia Malone, Converse College Peggy Gallagher, Georgia State University
The Effects of Linoleic Acid on Taste Preferences in Rats ....................................... 71 Harry Quedenfield and David Pittman Wofford College
How Water-Replete Rats Respond to Different Tastes under the Influences of benzodiazepines .............................................................................. 74 Lindsey Richardson and David Pittman Wofford College
How Water-Deprived Rats Respond to Different Tastes under the Influence of benzodiazepines ................................................................................ 77 Molly McGinnis and David Pittman Wofford College

Fifth Annual SC Upstate Research Symposium
4 Sponsors: Stäubli, Spartanburg Regional Healthcare System, EPSCoR/IDeA RS grant.
Older Husbands and Younger Wives: The January-May Marriage in Nineteenth-Century British Literature ................................................................. 80 Esther Godfrey USC Upstate
Oil and Western Friendliness, The Cause for Russian Interference in Former Soviet-bloc Nations ................................................................................. 84 Seth Rubenstein and Trevor Rubenzer USC Upstate
Efficient Estimation of Cox Model with Time-Dependent Coefficients with Missing Causes ............................................................................................. 87 Seunggeun Hyun, USC Upstate Yanging Sun, University of North Carolina at Charlotte
Modernism's Egypt "And Other Disorders of a Revolutionary Character" ............. 90 Celena Kusch USC Upstate
Southern Wesleyan University Strategic Human Resource Plan ........................... 93 Beverly Lowe, Felicia Thomas-Adams, Nicole Varnum and Lee Kizer Southern Wesleyan University
Metaphor Familiarity and L2 Instruction ..............................................................95 Quincy Jenkins Spartanburg Community College
The Preparation and Coordination Chemistry of N-2-pyridyl-N-2- (-4-phenylthiazoly)amine .................................................................................... 98 Geoffrey Ford and Edward Gouge Presbyterian College
The Effects of Exposure to Domestic Violence on Child and Adolescent Development ..................................................................................................... 101 Vernette Porter, Jennifer Parker and Stefanie Keen USC Upstate
Implementation of Hierarchical Clustering Algorithm for Type-2 Diabetes Patients ................................................................................................ 104 Nicole Hodge and Wei Zhong USC Upstate
Breakout Session 4: Healthcare ................................................................. 107 Session Chair: Gayle Casterline, USC Upstate
Correlation of Selected Health Determinants and Outcomes in the United States: 2005 ............................................................................................ 107 John Hart Sherman College of Straight Chiropractic
Ukranian Nursing: A Survey of Caring Behaviors ................................................ 109 Gayle Casterline and Nataliya Lishchenko USC Upstate
Prevention of Hospital-Acquired, Catheter-Associated Urinary Tract Infections: A Pilot Study ..................................................................................... 112 Brian Conner Lander University
Classification of Patients with Heart Disease Using Multi-Level Support Vector Machines ................................................................................................. 116 Wei Zhong, Rick Chow, Richard Stolz and Marsha Dowell USC Upstate

March 27th, 2009
Sponsors: Stäubli, Spartanburg Regional Healthcare System, EPSCoR/IDeA RS grant. 5
Evidence of a New Taste Sensation for Dietary Fat............................................... 119 David Pittman Wofford College
Breakout Session 5: Human and Civil Rights: Here At Home .................... 122 Session Chair: Cole Cheek, Spartanburg Methodist College
The Story of a "Typical American Girl" ................................................................ 122 Christen Burrell and Melissa Walker Converse College
Talkin' 'bout South Carolina: Addressing Dialect Diversity in Middle School Classrooms......................................................................................................... 124 George Reed and David Marlow USC Upstate
Race and Class Identity in The Great Gatsby and Passing.................................... 126 John Crocker and Celena Kusch USC Upstate
Meg Barnhouse: A Case Study of Discrimination in the Ministry .......................... 129 Elizabeth Roberds and Melissa Walker Converse College
From Lighting was Born a Man: Myth, Reality and Chief Pushmataha ................. 132 Cole Cheek Spartanburg Methodist College
Breakout Session 6: Education & Pedagogy: Learning & Assessment ........ 136 Session Chair: Jane Watkins, Limestone College
Effect of the 6+1 Trait Writing Model on Student Writing Achievement ............... 136 Nancy DeJarnette, Limestone College
Implementation of Learner-Centered Teaching in Higher Education: A "Customer Service" concept for academia? ...................................................... 139 Joseph Ongeri, Spartanburg Methodist College
The Peer Mentoring Program: A Pilot Program for the USC Upstate School of Education ............................................................................................ 142 Daphine Dawson and Tina Herzberg, USC Upstate
A Study in Cooperative Group Learning Styles at Spartanburg Community College ............................................................................................ 145 William Gelders, Spartanburg Community College
Assessment Beliefs and Practices of South Carolina Teachers.............................. 148 Sharon Feaster-Lewis, Southern Wesleyan University Chris Burkett, Columbia College
Breakout Session 7: Music and The Arts .................................................... 151 Session Chair: Rachel Snow, USC Upstate
Audiation: The Musical Key to a Magical Life .......................................................151 Jarrod Haning Converse College
Playing the Gig You're On: Coltrane Knew How ................................................... 154 Gregg Akkerman USC Upstate

Fifth Annual SC Upstate Research Symposium
6 Sponsors: Stäubli, Spartanburg Regional Healthcare System, EPSCoR/IDeA RS grant.
Parallels of Musical Prosospopoeia in Buxtehude's Frieid und Freudenreiche Hinfahrt (1674) and Jacopo Peri's L'Euridice (1600) ........................................... 158 Ashley Higgins Converse College
Romare Bearden: Contribution and Contrast to the Harlem Renaissance ............ 161 Mckensie Hall and Rachel Snow USC Upstate
Breakout Session 8: Business and Economics ........................................... 166 Session Chair: Royce Caines, Southern Wesleyan University
A Preliminary Discussion of Corporate Social Responsibility .............................. 166 Lilly Lancaster and Megan Creech USC Upstate
Existence of Economies of Scale within Athletic Departments at Private, Four Year Institutions ........................................................................................ 169 John Frazier Southern Wesleyan University
Pro-Israel Campaign Contributions and Congressional Votes ............................... 171 Trevor Rubenzer and Christopher Weidensee USC Upstate
Strategic Human Resources Plan for the SWU Marketing Department ................ 174 Diana West, Joan Burgess, Leesa Inabinet, Susan Jones, Kirk Smith and Lee Kizer, Southern Wesleyan University
Breakout Session 9: Education & Pedagogy: Beyond the Classroom ......... 176 Session Chair: Tina Herzberg, USC Upstate
The Classroom of the Future: Global, Interactive, Narrative ................................ 176 Liezell Bradshaw, Tasha Thomas and York Bradshaw USC Upstate
A Descriptive Analysis of Quality Online Practices as Perceived by West Virgina Higher Education Faculty .............................................................. 179 Michael Murphy Lander University
Undegraduate Community Translators and Interpreters: Professional Foreign Language Practice in Non-Profit, Food Service, and Health Care at Home and Abroad ........................................................................................... 181 Douglas Jackson, Dierrias Booker, William Davis, Kayla Crim, Eric Guerreo and Melissa Trejo, USC Upstate
The Marketing and Enrollment Department for Adult MBA Graduate Studies Strategic Human Resources Plan ............................................................ 183 Barbara Peters, Zeolean Kinard, Deborah Williams, Mamie Whitaker, Howard Green and Lee Kizer, Southern Wesleyan University

March 27th, 2009
Sponsors: Stäubli, Spartanburg Regional Healthcare System, EPSCoR/IDeA RS grant. 7
The 2009 Program Committee
Dr. Sebastian van Delden, Symposium Chair Assistant Professor of Computer Science; Director of Research Support USC Upstate
Dr. Caleb Arrington Associate Professor of Chemistry Wofford College
Susan Hodge, Sponsors Chair Senior Director of Community Engagement USC Upstate
Dr. John Hart Associate Professor of Clinical Sciences; Assistant Director of Research Sherman College of Straight Chiropractic
Dr. Neval Erturk, Student Awards Chair Assistant Professor of Biology Converse College
Dr. Latha Gearheart Associate Professor of Chemistry; Director of PC Summer Fellows Program Presbyterian College
Dr. Royce Caines Dean and Professor School of Business Southern Wesleyan University
Dr. Jane Watkins Assistant Professor of Computer Science Limestone College
Dr. David Slimmer Dean of the College of Science and Math; Professor of Physics Lander University
Dr. Dwight Dimaculangan Professor of Biology; Director of Undergraduate Research in CAS Winthrop University
Sherill Vaughn Vice President of Academic Affairs Spartanburg Community College
Cole Cheek Professor of History and Anthropology Spartanburg Methodist College

Fifth Annual SC Upstate Research Symposium
8 Sponsors: Stäubli, Spartanburg Regional Healthcare System, EPSCoR/IDeA RS grant.
Keynote Speakers
Mayor William Barnet III, Mayor of the City of Spartanburg, South Carolina. Mayor Barnet received a Bachelor of Arts degree from Dartmouth College in 1964 and a Master of Business Administration degree from Amos Tuck School at Dartmouth College in 1965. He was a 1st Lieutenant in the US Army and Adjutant General’s Corps in 1967/1968. Mayor Barnet joined the family business, William Barnet & Son, Inc. (founded 1898) on December 1, 1968. He was elected President and CEO in 1976 and sold the company to a management team in April 2001. He is currently CEO of The Barnet Company and Barnet Development Company. He has served on several public and civic boards, including: Bank of America, Duke Energy, Palmetto Business Forum, ETV Endowment, Palmetto Institute, The Duke Endowment, Girl Scouts of South
Carolina – Mountains to Midlands Council, Education Oversight Committee (Chairman), Leadership Spartanburg (Past Chairman), South Carolina Textile Manufacturers Association (Past President), Spartanburg County Foundation (Past Trustee). Mayor Barnet has received several Honors, including the Al Willis Award, Business Leader of the Year – 2001, the Dexter Edgar Converse Award, The Daniel Morgan Award, The Neville Holcombe Distinguished Citizen Award, the Order of the Palmetto, Paul Harris Fellow, South Carolina Business Hall of Fame, Citizen of the Year, Drummond Award for Statesmanship, and the National Alumni Association – Distinguished Citizen Award.
Dr. Jay Moskowitz, President of Health Sciences South Carolina. Dr. Moskowitz attended Queens College (City University of New York) from 1960-65, graduating from Brown University, in 1969, with a Ph.D. from the Division of Biological and Medical Sciences. Dr. Moskowitz joined the National Institutes of Health in 1969 and for over 26 years served in a number of capacities from Postdoctoral Research Associate, to Director, National Institute of Deafness and Other Communication Disorders, to Principal Deputy Director and Deputy Director for Science, Policy and Technology Transfer. In 1995, Dr. Moskowitz joined Wake Forest University School of Medicine (formerly Bowman Gray School of Medicine) as Senior
Associate Dean (Science and Technology) and tenured Professor of Public Health Sciences serving in that capacity until January 2002. In January 2002, Dr. Moskowitz joined The Pennsylvania State University as Associate Vice President for Health Sciences Research, Vice Dean for Research and Graduate Studies, Penn State College of Medicine, and Chief Scientific Officer, Milton S. Hershey Medical Center. He was a Professor of Medicine in the College of Medicine and Professor of Health Policy and Administration in the College of Health and Human Development. In September 2007, Dr. Moskowitz accepted the positions of President and CEO of Health Sciences South Carolina, Endowed Chair and Professor of Translational Clinical Research in the Arnold School of Public Health, University of South Carolina. He also serves as Professor of Medicine, Medical University of South Carolina, and Adjunct Professor of Public Health, Clemson University. He has received numerous national, scientific, and community awards throughout his career.
Tutorial Presenters
Granting Writing Elaine Marshall Director of Sponsored Awards USC Upstate
Engaging Undergraduates in Research Julie Morris Director of Undergraduate Research USC Columbia
New Technology for Increasing Research Productivity Cindy Jennings Director of Instructional Technology USC Upstate

March 27th, 2009
Sponsors: Stäubli, Spartanburg Regional Healthcare System, EPSCoR/IDeA RS grant. 9
PROGRAM SCHEDULE Fifth Annual SC Upstate Research Symposium
March 27th, 2009 - Spartanburg Marriott
8:00-8:30 Registration, Poster Set-up
8:30-8:40 Opening Remarks, Sebastian van Delden, Symposium Chair
8:40-9:00 Welcome Address, Mayor William Barnet III, Mayor of Spartanburg
9:00-10:15 BREAKOUT SESSIONS I
Tutorial Session 1: New Technology for Research (Ballroom) Cindy Jennings, USC Upstate
Breakout Session 1: Biology (Salon A) Breakout Session 2: Human and Civil Rights: Around the World (Salon B) Breakout Session 3: Math and Computer Science (Salon C)
10:15-11:15 POSTER SESSION, Coffee Break
11:15-12:30 BREAKOUT SESSIONS II
Tutorial Session 2: Engaging Undergraduates in Research Julie Morris, USC Columbia
Breakout Session 4: Healthcare (Salon A) Breakout Session 5: Human and Civil Rights: Here At Home (Salon B) Breakout Session 6: Education & Pedagogy: Learning & Assessment (Salon C)
12:30-1:30 LUNCH; Keynote Speaker: Dr. Jay Moskowitz, President of Health Sciences South Carolina; Student Awards - Best Paper and Poster Awards
1:30-2:30 BREAKOUT SESSIONS III
Tutorial Session 3: Grant Writing Elaine Marshall, USC Upstate
Breakout Session 7: Music and The Arts (Salon A) Breakout Session 8: Business and Economics (Salon B) Breakout Session 9: Education & Pedagogy: Beyond the Classroom (Salon C)
2:30-2:45 Poster break-down
Fifth Annual SC Upstate Research Symposium
10 Sponsors: Stäubli, Spartanburg Regional Healthcare System, EPSCoR/IDeA RS grant.
Comparative Histopathology of the Lungs and Urinary Bladder of Rana pipiens Infected with Parasitic Helminths
Stephanie Newton, Baye Williamson, and Edna Steele Department of Biology
Converse College 580 E. Main St., Spartanburg, SC 29302
{Stephanie.newton, Baye.williamson, Edna.steele}@converse.edu
Abstract — A total of 37 leopard frogs (Rana pipiens), obtained in August and October 2006 from Nashville, Tennessee, were examined for the presence of parasitic helminths. Seventy six percent of the lungs examined were infected with digenetic trematodes, Haematoloechus medioplexus, with a mean parasite intensity of 7.45. Rhabdias spp., a parasitic nematode, was also found inhabiting the lungs, with parasite prevalence of 89% and mean parasite intensity of 8.45. In some of the lungs that were concurrently infected with Haematoloechus and Rhabdias, significant hemorrhage and copious mucus were observed. The urinary bladder was infected with another digenetic trematode, Gorgodera amplicava, with a parasite prevalence of 50% and mean intensity of 0.69. Unlike the lungs, no nematodes and no hemorrhaging or copious mucus secretions were observed in the bladder. To determine if the helminth parasites cause any significant damage to the frog’s lung and bladder at the tissue level, the histology of infected and uninfected organs were compared. Results of this study showed minor localized erosion and blood infiltration in tissues due to the parasites. However, the extent of damage is minimal. This study suggests that the parasitic helminths have very little histopathological effect on lung and bladder of their amphibian host.
Keywords — Histopathology, Rana, Haematoloechus, Rhabdias, Gorgodera
INTRODUCTION
Frogs play an important role as predators in food webs. They also serve as hosts to various species of parasitic helminths. The most commonly encountered parasites of the frog are the lung flukes, Haematoloechus spp. The adult flukes are dorsoventrally flattened worms with an inconspicuous acetabulum, about 1/4 - 1/5 the size of the oral sucker. This parasite utilizes two intermediate hosts, a snail and an odonate insect, to complete its larval development prior to its maturation into adult in the frog [1]. The frog becomes infected by ingestion of the adult odonate insect (dragonfly) containing infective metacercariae. Within the frog’s gut, the
metacercariae excyst and release the young flukes which then migrate to the esophagus, trachea, and finally to lungs where they mature into adults [2].
Another parasite that inhabits the lung of frogs is the nematode, Rhabdias spp. The infective filariform larvae of this nematode penetrate the skin of an anuran, such as R. pipiens. They lodge within various tissues in the host. However, only those that reach the lungs are able to survive. Within the lungs, the nematodes mature into hermaphroditic adults [3].
The urogenital system of frogs is also frequently inhabited by parasitic flukes, particularly the members of the Gorgoderidae family [4]. Gorgodera amplicava inhabits the urinary bladder of Rana pipiens. The adult fluke is 3 - 5mm long. The anterior portion is smaller than the posterior. The ventral sucker is 2 – 3 times larger than the oral sucker. Its first intermediate host is a clam which serves as the host for the egg, miracidium, sporocyst, and cercariae stages. Cercariae are expelled from the clam and eaten by the second intermediate host, usually tadpoles, larvae of salamanders, and crayfish. The frog becomes infected by ingestion of the second intermediate host containing infective metacercariae (5).
Helminth parasites affect a wide range of amphibians and reptiles. However, the definitive hosts for these parasites usually show no obvious symptoms of disease. The purpose of this study is to examine, at the histological level, the infected lungs and bladder to determine if any significant damage is inflicted by the parasite to their amphibian hosts.
MATERIALS AND METHODS
A total of thirty seven leopard frogs (Rana pipiens) were obtained from Sullivan’s Supply in Nashville, Tennessee in August and October 2006. The frogs were maintained alive in the laboratory until ready for examination. The frogs were euthanized according to the guidelines set by the Institutional Animal Care and Use Committee and dissected
March 27th, 2009
Sponsors: Stäubli, Spartanburg Regional Healthcare System, EPSCoR/IDeA RS grant. 11
immediately. The length and sex of the frog were recorded and the lungs and bladder were examined for the presence of parasitic helminths. The parasite prevalence and intensity of infection were determined. Infected and uninfected lungs and bladders were removed and immediately fixed in 10% phosphate buffered formalin. Routine histological processing of the lungs and bladders were performed at the Spartanburg Pathology Consultants. The slides were examined using compound light microscope.
RESULTS
All 37 frogs examined in this study appeared to be healthy, showing no external signs of disease. However, dissection of the lungs and urinary bladders revealed presence of parasitic helminths. Seventy six percent were infected with Haematoloechus medioplexus, 89% with Rhabdias spp., and 50% with Gorgodera amplicava. The mean parasite intensity was 7.45, 8.45, and 0.69 respectively. Haematoloechus and Rhabdias were found in the lungs while Gorgodera was found in the urinary bladder. Some of the lungs were concurrently infected with Haematoloechus and Rhabdias. Significant hemorrhage and copious mucus were observed in some of these lungs. In particular, a lung heavily infected with thirty three H. medioplexus appeared shriveled compared to its healthier counterpart. The lung tissue was less elastic and resistant to return to its original shape upon being compressed. Histological examination of the infected lungs revealed sections of parasites in situ. Tissues adjacent to the parasite showed infiltration of blood cells, and slight erosion of epithelial tissue accompanied by hemorrhage. Epithelial cells adjacent to the parasite (Haematoloechus or Rhabdias) lack the cilia normally found in uninfected cells (Fig. 1, 2). However, the damage does not appear to be extensive and are restricted only to areas that are in direct contact with the parasites.
Examination of infected bladders also showed several parasites with a plug of host tissue within the muscular sucker (Fig. 3, 4), Interestingly, no visible hemorrhage is apparent. Other than severe stretching of the bladder epithelial and smooth muscle tissue, no apparent epithelial erosion was observed.
DISCUSSION
Flukes and nematodes are known to feed off the host tissue fluid or blood. Thus, hemorrhaging of the infected tissue is expected. The copious mucus could be attributed to the host response in their attempt to rid themselves of the parasites. Bolek and Janovy [6] reported that parasitism in juvenile frog results in decreased host performance and negatively impacts growth. This is an important point to consider in future studies. The insignificant damage observed in the lungs and bladder may be attributed to the fact that all frogs examined were adults. It should be taken into consideration that adult frogs may have developed resistance to the damaging effect of the parasites.
In a study by Gendron [7], it is noted that adult frogs can tolerate moderate levels of lung worm infection without much obvious impact on their health. Rhabdias parasites are not considered highly virulent pathogens in adults but the effects on young anurans can be much more detrimental.
Lung and bladder tissue are known for being particularly stretchy and flexible. This fact may allow the organs to accommodate these parasitic invaders. The fact that amphibians employ multiple methods of breathing may also lessen the effect of the parasites residing in the lungs. The seemingly minimal effect on the host is beneficial to the parasite, as it would be fatal to the parasites to kill the host.
CONCLUSION
Results of this study showed that the histopathological effect of Haematoloechus medioplexus, Rhabdias spp. and Gorgodera amplicava on the lungs and urinary bladder of their amphibian host is only minimal and does not cause serious damage to the host organs.
ACKNOWLEDGMENTS
Special thanks are extended to Nita Russell of Spartanburg Pathology Consultants for technical assistance with histological processing of tissues and Converse College for the use of its facilities. This research was supported by a grant from the South Carolina Independent Colleges and Universities.

Fifth Annual SC Upstate Research Symposium
12 Sponsors: Stäubli, Spartanburg Regional Healthcare System, EPSCoR/IDeA RS grant.
REFERENCES
[1] S. Snyder, and J. Janovy, Jr. Second intermediate host-specificity of Haematoloechus complexus amd Haematoloechus medioplexus (Digenea:Haematoloechidae). Journal of Parasitology, vol 80(6), pp1052-1055, 1994.
[2] Haematoloechus medioplexus, University of Michigan Museum of Zoology, Animal Diversity Web. http://animaldiversity.ummz.umich.edu/site/accounts/information/Haematoloechus_medioplexus.html
[3] The Rhabditid Nematodes (Order Rhabditida) http://www.k-state.edu/parasitology/classes/ 625nematode19.html
[4] K. Kim, K. Joo, and H. Rim. Gorgoderid trematodes (Digenea:Gorgoderidae) from the urinary bladder of frogs in Korea. Korean Journal of Parasitology, vol 33(2), pp 75-83, 1995
[5] O. Olsen. “Animal Parasites: Their Life Cycles and Ecology”. University Park Press, Baltimore, Maryland, 1974
[6] M, Bolek and J. Janovy, Jr. Small frogs get their worms first: the role of nonodonate arthropods in the recruitment of Haematoloechus coloradensis and Haematoloechus complexus in newly metamorphosed northern leopard frogs, Rana pipiens, and Woodhouse’s toads, Bufo woodhousii. The Journal of Parasitology vol (93), pp 300-312
[7] A. Gendron, D. Marcogliese, S. Barbeau, M. Christin, P. Brousseau, S. Ruby, D. Cyr, and M Fournier. Exposure of leopard frogs to a pesticide mixture affects life history characteristics of the lungworm, Rhabdias ranae. Conservation Ecology, vol. 135, pp 469-476, 2003
March 27th, 2009
Sponsors: Stäubli, Spartanburg Regional Healthcare System, EPSCoR/IDeA RS grant. 13
Ploidy Levels and Genome Sizes of Magnolia L. Species, Hybrids, and Cultivars
J. Kevin Parris1, Thomas G. Ranney2, W. Vance Baird1, and Halina T. Knap3 1Clemson University, Department of Horticulture, 164 Poole Agricultural Center, Clemson, SC 29634
2N.C. State University, Dept. of Horticultural Science, 455 Research Dr., Fletcher NC, 28732 3Clemson University, Dept. of Entomology, Soils, and Plant Sciences and Dept. of Genetics and
Biochemistry, 276 P&AS Bldg., Clemson, SC 29634; [email protected]
Key Words: Cytology, Flow Cytometry, Genome Size, Magnolia, Polyploidy
INTRODUCTION The genus Magnolia L. includes a broad range of valuable nursery and landscape plants. In 1980, The Journal of the American Magnolia Society posthumously quoted E.H. Wilson, the great 19th century British plant explorer as saying: “No group of trees and shrubs is more favorably known or more highly appreciated in gardens than magnolias, and no group produces larger or more abundant blossoms.” [9]. Considerable progress has been made breeding improved Magnolias; however, a greater understanding of polyploidy in this genus would greatly enhance future breeding efforts. Polyploidy is an important factor in plant breeding as it can influence reproductive compatibility, fertility, and gene expression [7]. This research provides an extensive survey of polyploidy and determination of genome sizes in the genus Magnolia and will provide a valuable database for Magnolia breeders.
NATURE OF WORK The genus Magnolia contains more than 250 species belonging to various sections within three subgenera [3]. Although basic information on chromosome counts and ploidy levels of different magnolia species have been compiled [1, 2], sampling has been limited and little is known about ploidy levels of specific hybrids and cultivars. The base chromosome number for Magnolia is 1n=1x=19. However, different subgenera contain species with a variety of ploidy levels from 2n=2x=38 to 2n=6x=114. Crosses of species with varying ploidy levels may yield hybrids with odd ploidy levels, which often result in reduced fertility or sterility [7]. Because of these constraints, Magnolia breeders with a desire to incorporate the best features of these hybrids have attempted to induce new polyploids to overcome these limitations, yet most of these putative polyploids have never been confirmed. The range in ploidy levels within this genus also provides an opportunity to indirectly substantiate hybridity of distant hybrids, based on chromosome number and genome size, when parents differ in ploidy levels.
Because many species with significant ornamental appeal are polyploids with high chromosome counts, traditional cytology with light microscopy is extremely difficult. Diploid counts are more feasible, but still require considerable skill and effort. Flow cytometry has proved to be an efficient means of estimating genome size and allows for elucidation of ploidy level [5]. The objectives of this study were to determine the genome sizes and relationships to ploidy levels of a diverse collection of species, hybrids, and cultivars of Magnolia by using flow cytometry in order to: 1) increase sampling among and within species to develop an extensive database for use by magnolia breeders; 2) determine the ploidy level of suspected, but unconfirmed, polyploid taxa (both naturally occurring and chemically induced); and 3) confirm hybridity in interploid crosses and interspecific hybrids that vary in genome size.
Over 275 diverse species and cultivars were sampled from various sources that included taxa from each subgenera of Magnolia as well as both species of genus Liriodendron. Nuclei, from newly expanded leaf or tepal tissue, were extracted, stained (with DAPI), and then analyzed (minimum 2500 events) using a flow cytometer (PA-I, Partec, Münster, Germany) to determine relative DNA content. Genome sizes were determined by comparing mean relative fluorescence of each sample with an internal standard, Pisum sativum L. ‘Ctirad’, with a known genome size of 8.76 ρg [4]. To increase resolution of genome size, tetraploid Magnolias which have similar genome sizes to Pisum sativum ‘Ctirad’. M. virginiana ‘Jim Wilson’ (3.73 ρg) and M. grandiflora ‘Little Gem’ (10.92 ρg) were used as secondary standards. Genome sizes for the secondary standards were calculated as the mean of 10 separate subsamples determined with the Pisum sativum ‘Ctirad’ as an internal standard. Holoploid, 2C DNA contents were calculated as: 2C = DNA content of standard (mean fluorescence value of sample/ mean fluorescence value of standard). The relationship between ploidy levels and genome sizes was determined for plants with documented chromosome numbers. Mean 1Cx monoploid genome size (i.e., DNA content of the non-replicated base set of chromosomes with x = 19)

Fifth Annual SC Upstate Research Symposium
14 Sponsors: Stäubli, Spartanburg Regional Healthcare System, EPSCoR/IDeA RS grant.
Table 1. Summary of means and ranges for 2C, holoploid genome size (ρg) of Magnolia species grouped by section and ploidy level. 1Numbers in parenthesis, following classifications, indicated the number of species sampled, and the total number of taxa within those species sampled. 2Values represent means followed by (ranges) for all magnolia species sampled. Means for 2C genome size followed by different letters, within a column, are significantly different, P<0.05
Ploidy Level
Classification 2n=2x=38 2n=4x=76 2n=6x=114 2n=8x=152 Subgenus Magnolia Section Magnolia (including Theorhodon,5,401)
2C=3.792 D (3.43-4.40)
NA 2C=11.16 C (10.83-11.63)
NA
Section Gwillimia (2,3)
2C=5.34 A (5.1-5.47)
NA NA NA
Section Oyama (1,7) 2C=4.52 C (4.35-4.62)
NA NA NA
Section Manglietia (6,12) 2C=4.78 B (4.65-5.07)
NA NA NA
Section Rhytidospermum (4,8) 2C=3.96 D (3.66-4.69)
NA NA NA
Section Macrophylla (1,5) 2C=4.56 BC (4.41-4.87)
NA NA NA
Section Auriculata (1,2) 2C=3.83 D (3.74-3.92)
NA NA NA
Section Kmeria (1,1) 2C=5.51 A (5.48-5.54)
NA NA NA
Subgenus Yulania Section Yulania (including Beurgaria and M. liliiflora, 13,46)
2C=4.07 D (3.84-4.16)
2C=8.43 A (7.71-8.88)
2C=12.74 A (11.49-13.22)
2C=17.34 (17.07-17.49
Section Tulipastrum (1,3) NA 2C=8.01 A (7.86-8.26)
NA NA
Section Michelia (14,22) 2C=4.55 BC (4.27-4.87)
NA NA NA
Subgenus Gynopodium
Section Gynopodium (1,3) NA NA 2C=11.57 B (11.44-11.72)
NA
Genus Liriodendron (2,2) 2C=3.39 E (3.35-3.43)
NA NA NA
March 27th, 2009
Sponsors: Stäubli, Spartanburg Regional Healthcare System, EPSCoR/IDeA RS grant. 15
was calculated as (2C genome size / ploidy level) to assess variability in base genome size. A minimum of two subsamples were tested to derive a mean relative genome size for each taxa. Data were subjected to analysis of variance and means separation using the Waller procedure.
CONCLUSIONS
Flow cytometry was an efficient and effective method of estimating genome size. Genome size varied significantly among taxonomic sections (Table 1), indicating that these groups have undergone considerable evolutionary divergence [8]. Furthermore, this indicates that it is necessary to calibrate ploidy level with genome size for each section, in order to estimate ploidy level from genome size in Magnolias. However, within a section, genome sizes for a given ploidy level had narrow ranges and could clearly be used to determine ploidy levels (Table 1). In general, the ploidy levels determined for different species was consistent with past reports, with a few exceptions. Magnolia cylindrica was found to be a tetraploid here, while past reports have indicated it is a diploid [1, 2].
The results of this study also verified that M. stellata and M. cylindrica accessions from the Holden Arboretum were induced polyploids. Phenotypic characteristics such as thickened foliage and increased width to length ratio in foliage [6,7] were suggestive of polyploidy in M. seiboldii ‘Colossus’, a reported hexaploid. In this study, samples of M. seiboldii ‘Colossus’ from multiple sources had genome sizes (2C =4.35 ρg -4.62 ρg) consistent with a diploid. This unexpected lack of congruency between phenotypic characteristics and ploidy level will require further investigation.
Analysis of various putative interploid hybrids also had mixed findings. Magnolia (virginiana var. australis (2x) x M. grandiflora ‘Samuel Sommer’ (6x)) ‘Sweet Summer’ has been described as an allotetraploid cultivar since its introduction in 1990. Samples collected from two different sources were tested and had estimated genome sizes (2C =11.11 ρg and 11.54 ρg) consistent with a hexaploid, bringing the hybridity of M. ‘Sweet Summer’ into question. This result remains enigmatic given the reported direction of the cross indicating that M. virginiana var. australis was the maternal parent (1). Flow cytometry did provide confirmation of hybridity between taxa of varying genomic size in the case of Magnolia (figo(2x) x acuminata (4x)). This is an important cross that was once considered to be intergeneric before Michelia was given sectional status within
subgenus Yulania. Relative genome size (2C =6.16 ρg) of this hybrid is consistent with a triploid condition, confirming it to be intermediate between the diploid and tetraploid parents. M. (insignis x virginiana) ‘Katie-0’ is another important intersectional cross that demonstrates pigmentation of tepals can be introgressed into white flowered species of subgenus Magnolia. Hybridity of M.‘Katie-O’ is suggested based on morphological appearance, but intermediate genome size (2C= 4.33 ρg) further substantiated its hybrid origin. The difference in mean relative genome size for diploids in section Manglietia (2C=4.78 ρg) and section Magnolia (2C=3.79 ρg) allow for this distinction to be made. Flow cytometry did not allow for distinction of cultivars or interspecific hybrids within a given section due to highly conserved genome sizes within sections.
Overall, flow cytometry provides an extremely useful tool to study polyploidy and provides an entry to the investigation of reproductive biology in the genus Magnolia. This research provides a foundation and database for breeders that will facilitate the development of hybrids in the future.
REFERENCES [1] Callaway, D.J. 1994. The World of Magnolias.
Timber Press, Portland. [2] Chen Zhong-yi, X. Huang, R. Wang, S. Chen. 2000.
Chromosome Data of Magnoliaceae. Proceedings of The International Symposium on the Family Magnoliaceae. Beijing: Science Press. 192-201.
[3] Figlar, R.B. 2004 Classification of Magnoliaceae. Magnolia Society International. Nov. 2008. <http://www.magnoliasociety.org/classifications_ndx.html.>
[4] Greilhuber, J., E.M. Temsch, and J.C.M. Loureiro. 2007. Nuclear DNA content measurement, 67-101. In: J. Doležel, J. Greilhuber, and J. Suda (eds.). Flow cytometry with plant cells: Analysis of genes, chromosomes and genomes. Wiley- VCH, Weinheim.
[5] Jones, J.R., T.G. Ranney, N.P. Lynch, S.L. Krebs. 2007. Ploidy Levels and Genome Sizes of Diverse Species, Hybrids, and Cultivars of Rhododendron L. Journal of the American Rhododendron Society. 61(4):220-227.
[6] Kehr, A.E. 1985. Inducing Polyploidy in Magnolias. The Journal of the American Magnolia Society. Vol. XX, No. 2 p.6-9.
[7] Kehr, A. E. 1996. Woody plant polyploidy. American Nurseryman 183, no. 3: 38. Business Source Premier, EBSCOhost (accessed February 8, 2009).
[8] Soltis, D. E., P. S. Soltis, M. D. Bennett, and I. J. Leitch. 2003. Evolution of Genome Size in the Angiosperms. American Journal of Botany 90(11): 1596–1603.
[9] Wilson, E.H. 1980. Magnolias. The Journal of the American Magnolia Society. Vol. XVI No. 2 p. 5-8.
Fifth Annual SC Upstate Research Symposium
16 Sponsors: Stäubli, Spartanburg Regional Healthcare System, EPSCoR/IDeA RS grant.
Messin’ With Texas! The genus Isoetes (Isoetaceae) in the Lonestar State
C. Matthew Hardman and Kerry D. Heafner Department of Biology
Limestone College 1115 College Drive, Gaffney, SC 29340
Abstract — Isoetes is a genus of heterosporous lycopods with 300 to 400 species worldwide. Approximately ten percent of these species occur in North America. Based on megaspore ornamentation, four Isoetes species were recently recognized from the Llano Uplift region of central Texas: Isoetes butleri Engelmann, I. lithophila Pfeiffer, I. melanopoda Gay & Durieu, and I. piedmontana (Pfeiffer) Reed. Historically, I. piedmontana has been regarded as endemic to granite flatrocks of the southeastern United States Piedmont region. These Texas populations are of interest because of their significant geographic separation from the closest rock outcrop Isoetes populations in eastern Alabama. Collections of rock outcrop Isoetes from the Llano Uplift region of central Texas were made in May, 2008. Material for chromosome counts was obtained from populations in Burnet, Llano, and Mason Counties. Specimens from Bell and Coryell Counties are I. butleri. All plants sampled were diploid and more closely resembled I. melanopoda in terms of morphology. We also sampled populations historically identified as I. lithophila. However, our material did not match Pfeiffer’s original description which brings the identity of this species into question.
Keywords — Isoetes, quillwort, Llano Uplift, Texas.
INTRODUCTION
Isoetes, the quillworts (Isoetaceae) is a genus of heterosporous lycopods that represents an ancient lineage in vascular land plant evolution. The genus is cosmopolitan and is composed of approximately 300 to 400 species. The southeastern United States is a significant center of diversity for this genus in North America, especially in terms of the number of allopolyploid species, many of which have been described in the last decade.
Correll and Johnston [1] recognized two species of Isoetes in Texas: Isoetes lithophylla [sic] Pfeiffer, and I. melanopoda Gay and Durieu. Pfeiffer [2] described I. lithophila as producing megaspores that are grey when dry and brown when wet, and having sporangia that are completely covered by the velum. This description is strikingly similar to that of I. melanospora Engelmann, which is endemic to central Georgia.
Isoetes melanopoda is a wide-ranging diploid that occurs throughout much of the eastern two-thirds of the United States in a variety of ephemerally wet habitats.
Most recently, Holmes et al. [3] used megaspore surface ornamentation patterns to distinguish four Isoetes species in Texas, all of which were collected from the Llano Uplift and Edwards Plateau regions of central Texas. In addition to I. lithophila and I. melanopoda, Holmes et al. [3] recognized I. butleri Engelmann, a diploid species typically occurring on limestone seeps and on the much-studied cedar barrens of central Tennessee, and I. piedmontana (Pfeiffer) Reed, a species historically considered endemic to the granite flatrocks of the southeastern U.S. Piedmont.
The Llano Uplift region of central Texas is composed of Precambrian granite and protrudes through the larger region of Cretaceous limestone that makes up the Edwards Plateau. The occurrence of I. piedmontana in the Llano Uplift region of central Texas seems unlikely for two major reasons. First, habitats that would support I. piedmontana do not occur between eastern Alabama and central Texas, a distance of approximately 800 air miles. Because the spores of Isoetes are produced in subterranean sporangia, and because Isoetes produces the largest megaspores of the vascular land plants, dispersal by wind, such as that documented in homosporous ferns, does not provide a plausible explanation for the occurrence of I. piedmontana in Texas. Second, the different geochemistries of the Llano Uplift and southeastern U.S. Piedmont would support the hypothesis of independent colonization events and adaptations to substrates of different mineral compositions as evidenced by the red or pink granite of the Llano Uplift versus the lighter grey granite of the southeastern Piedmont.
Our study attempts to address three questions: 1) Does I. piedmontana occur in Texas? 2) If so, do populations of I. piedmontana in Texas occur at more than one ploidy level, and do these different ploidy levels represent previously-unrecognized species? 3) How diverse is the genus Isoetes in the Llano Uplift region of central Texas?
March 27th, 2009
Sponsors: Stäubli, Spartanburg Regional Healthcare System, EPSCoR/IDeA RS grant. 17
MATERIALS AND METHODS
Specimens previously identified as I. piedmontana, I. lithophila, and I. melanopoda were collected from sites in Bell, Burnet, Gillespie, Llano, and Mason Counties, Texas. Seventeen individual populations were sampled, and roots were used to obtain chromosome counts. Sites sampled included Fort Hood Military Installation, Inks Lake State Park, enchanted rock State Park, property adjacent to Ferguson Power Plant, and Mason Mountain Wildlife Management Area.
For chromosome squashes, roots were harvested and fixed for 3 hrs. in aqueous paradichlorobenzene (PDB) followed by 1 hr. in a 3:1 solution of absolute ethanol/glacial acetic acid. For squashing, roots were hydrolyzed in 1N HCl for 12 min. followed by a 10 min. wash in 95% ethanol. Roots were stained in Wittman’s hemotoxylin for 1 hr. then destained in glacial acetic acid for less than 1 min. Root apices were excised and placed on a glass slide in a drop of Hoyer’s Medium, and squashed under a glass cover slip. Countable figures were photographed at 1000X.
RESULTS
Plants collected in Bell and Coryell Counties on Ft. Hood were actually I.butleri and not I. piedmontana. Because I. butleri is so morphologically distinctive, no chromosome counts were obtained from the Fort Hood plants. All plants counted from the other sites were diploid (2n=22), and were more similar morphologically to I. melanopoda.
DISCUSSION
In the Llano Uplift region of central Texas, both I. butleri and I. melanopoda have been incorrectly identified as I. piedmontana. Isoetes butleri is the common quillwort of limestone glades and seeps in the central and eastern portions of the United States. Historical collections of I. butleri from as far north in Texas as Dallas and Tarrant Counties suggest that I. butleri may be more widespread in Texas than currently realized. Morphologically, material that we examined from granitic habitats on the Llano Uplift more closely resemble I. melanopoda, a diploid species of ephemerally wet habitats ranging over most of the central and eastern portions of the United States. Until its systematic relationships to I. melanopoda can be adequately assessed, I. piedmontana should be interpreted as the common diploid quillwort of only the granite flatrocks of the southeastern United States Piedmont. Three allotetraploid
populations in Alabama and North Carolina have recently been separated out of I. piedmontana [4].
Isoetes lithophila was described by Pfeiffer in her 1922 monograph of the genus. The type material was collected in 1914 on a granite dome in Burnet County. Pfeiffer cited grey or brown megaspores and sporangia that are completely covered by vela as distinguishing features of I. lithophila. Based on this description, I. lithophila is most morphologically similar to the federally endangered I. melanospora Engelmann of central Georgia. The identity of I. lithophila should be re-examined not only due to its resemblance to I. melanospora, but also because none of the material we collected from the Llano Uplift region of central Texas matched Pfeiffer’s description of I. lithophila. At present, three species of Isoetes can be recognized from Texas: I. butleri, I. lithophila, and I. melanopoda.
ACKNOWLEDGMENTS
We acknowledge funding from South Carolina Independent Colleges and Universities, Inc. (SCICU). J.L. Pridmore, Limestone College, began this project. We acknowledge the assistance of Laura Sanchez-Hansen and Eric Runfeldt at Fort Hood, Jason Singhurst of the Texas Department of Parks and Recreation, Dr. Walter Holmes at Baylor University, the herbarium at The University of Texas at Austin, and Steve Leonard of The Nature Conservancy in Mississippi.
REFERENCES
[1] D.S. Correll and M.C. Johnston. Manual of the Vascular Plants of Texas. Texas Research Foundation, Renner, Texas. 1970.
[2] N.E. Pfeiffer. Monograph of the Isoetaceae. Annals of the Missouri Botanical Garden, vol. 9, pp.79-232, 1922.
[3] W.C. Holmes, A.E. Rushing, and J.R. Singhurst. Taxonomy and identification of Isoetes (Isoetaceae) in Texas based on megaspore features. Lundelia, vol. 8, pp. 1-6, 2005.
[4] K.D. Heafner, R.D. Brannon, M.L. Dornis, and K.M. Smith. Three allotetraploid segregates of Isoetes piedmontana (Pfeiffer) Reed. Manuscript submitted, Castanea, 2009.
Fifth Annual SC Upstate Research Symposium
18 Sponsors: Stäubli, Spartanburg Regional Healthcare System, EPSCoR/IDeA RS grant.
Using Spatial Assessment of Drift Fence Captures to Investigate Juvenile Dispersal of Ranid Frogs
Chelsea Kross and Melissa Pilgrim Division of Natural Sciences and Engineering
University of South Carolina Upstate 800 University Way, Spartanburg, SC 29303
[email protected], [email protected]
Abstract - In spring of 2007 we started a drift fence study evaluating the use of an abandoned homestead by herpetofauna (reptiles and amphibians). When evaluating data collected during 2007, we noticed that the majority of our ranid frog captures were of individuals weighing less than 5grams. We suspected that we were documenting a wave of juvenile dispersal from nearby aquatic habitats. A retention pond is located approximately 150m from the drift fence site and Lawsons Fork Creek is located approximately 125m from the drift fence site. We hypothesized that the majority of ranid frogs entering the drift fence site were captured in traps oriented towards the nearby aquatic habitats. Evaluation of the spatial distribution of ranid frog captures revealed that we captured 91% of the ranid frogs in traps facing the aquatic habitats and only 9% of the ranid frogs in traps facing the forest habitats. In addition, ranid frogs captured at our site represented four different species. We hypothesized that there would be interspecific variation in the timing of ranid frog captures at the drift fence site. In fact, we did observe temporal variation in the arrival dates of ranid species at the fence. Our drift fence site lies < 200m away from the aquatic habitats and would be considered part of their “buffer zone”. Thus, as our data set grows, the drift fence site has the potential to contribute useful data relevant to increasing our understanding of how buffer zones impact amphibian population persistence.
INTRODUCTION
Drift fence arrays are a standard technique used to inventory and monitor many wildlife species, including reptiles and amphibians [1,2,3]. In addition to allowing documentation of species richness in an area, drift fence arrays can assess seasonal movement patterns of a species or movement patterns of animals relative to specific habitat features within a landscape [4,5]. In spring of 2007 we started a drift fence study evaluating the use of an abandoned homestead by herpetofauna (reptiles and amphibians). When evaluating data collected during 2007, we noticed that the majority of our ranid frog captures were of
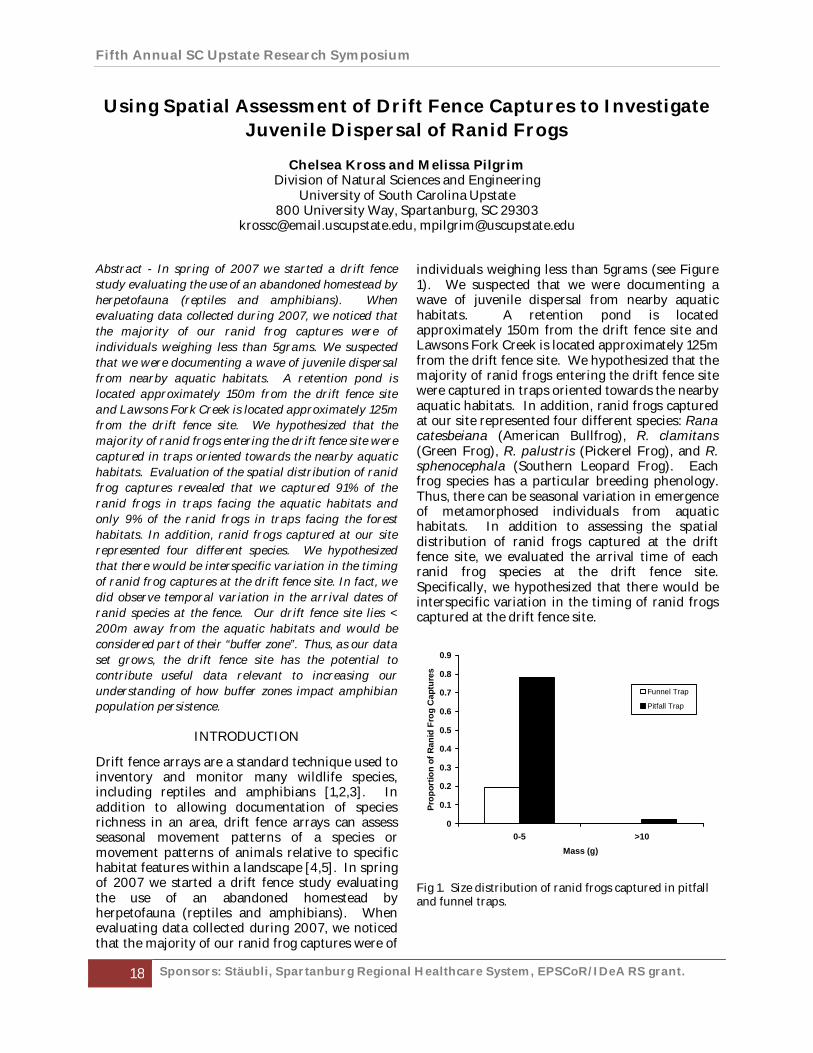
individuals weighing less than 5grams (see Figure 1). We suspected that we were documenting a wave of juvenile dispersal from nearby aquatic habitats. A retention pond is located approximately 150m from the drift fence site and Lawsons Fork Creek is located approximately 125m from the drift fence site. We hypothesized that the majority of ranid frogs entering the drift fence site were captured in traps oriented towards the nearby aquatic habitats. In addition, ranid frogs captured at our site represented four different species: Rana catesbeiana (American Bullfrog), R. clamitans (Green Frog), R. palustris (Pickerel Frog), and R. sphenocephala (Southern Leopard Frog). Each frog species has a particular breeding phenology. Thus, there can be seasonal variation in emergence of metamorphosed individuals from aquatic habitats. In addition to assessing the spatial distribution of ranid frogs captured at the drift fence site, we evaluated the arrival time of each ranid frog species at the drift fence site. Specifically, we hypothesized that there would be interspecific variation in the timing of ranid frogs captured at the drift fence site.
Fig 1. Size distribution of ranid frogs captured in pitfall and funnel traps.
0
0.1
0.2
0.3
0.4
0.5
0.6
0.7
0.8
0.9
0-5 >10Mass (g)
Prop
ortio
n of
Ran
id F
rog
Cap
ture
s
Funnel Trap
Pitfall Trap

March 27th, 2009
Sponsors: Stäubli, Spartanburg Regional Healthcare System, EPSCoR/IDeA RS grant. 19
METHODS
DRIFT FENCE DESIGN
To assess the use of the abandoned homestead by herpetofauna, we surrounded the homestead with a 62m drift fence in March of 2007. We dug a 15cm deep trench around the homestead. We erected pre-staked silt fencing (61cm high) in the trench and buried the bottom of the fence. We placed a pair of traps every 3m around the fence. We placed one trap of a pair on the inside of the fence and one trap of a pair on the outside of the fence. In total, we surrounded the fence with 20 pitfall traps and 20 funnel traps. We used 18.9L buckets as pitfall traps. We drilled holes in the bottom of each bucket for drainage and then buried the buckets flush with the fence and the surface of the ground. We placed a sponge in each bucket to act as a flotation device for animals captured during periods with heavy rain. We constructed our funnel traps using 0.64cm hardware cloth, following the design of Fitch [1]. Our funnel traps were covered with extra silt fencing to provide shade for captured animals.
DATA COLLECTION AND ANALYSIS
During time periods when the fence was open, we checked the fence daily for trapped animals. We recorded the trap number and species name for each captured animal. We transported captured animals to the laboratory for data collection. We recorded the length (to 0.1cm) and mass (to 0.1g) of each reptile and amphibian captured. We permanently marked snakes weighing more than 20g with passive integrated transponders (PIT-tags). In addition, we used probes to determine the gender of each snake and used palpation to determine the reproductive condition of female snakes. Following data collection, we transported captured animals back to the fence for release. We released animals five meters from the fence in the direction they were heading when trapped (i.e., we released animals captured in outside traps within the fenced area, and we released animals captured in inside traps outside of the fenced area).
To assess the spatial distribution of ranid frogs captured entering the homestead site, we divided the fence in half along its north to south axis. Traps lying west of the division faced aquatic habitats, while traps lying east of the division faced forest habitat. We compared the number of ranid frogs
captured entering the homestead from each direction simply by calculating the percentages of total ranid frogs captured in each of the two divisions. We used EXCEL (version 2003) for data management and analyses.
RESULTS
Between 4/26/07 and 6/15/2008, we captured 33 ranid frogs entering the drift fence site (Table 1). We captured 91% of the ranid frogs in traps facing the aquatic habitats and only 9% of the ranid frogs in traps facing the forest habitats. We observed interspecific differences in the timing of frog captures (Table 1). We captured 16 R. sphenocephala (Southern Leopard Frogs) in July of 2007; thus July represented the peak month of ranid frog arrival at the drift fence site.
Table 1. Ranid Frogs Captured Entering the Upstate Homestead
Drift Fence Site. N = the number of individual frogs.
Species: N: Dates Captured: Rana catesbeiana (American Bullfrog)
2 10/9 – 10/24/2007
Rana clamitans (Green Frog)
4 6/26 – 6/27/2007
Rana palustris (Pickerel Frog)
1 3/5/2008
Rana sphenocephala (Southern Leopard Frog)
26 5/13 – 9/ 16/2007
CONCLUSIONS
Evaluation of the spatial distribution of traps that captured ranid frogs entering the drift fence site supported our hypothesis that ranid frogs in our study were predominantly arriving at the homestead site from the direction of the closest aquatic habitats. In addition, assessing differences in the arrival time of each ranid species at the drift fence site supported our hypothesis that arrival at the drift fence site would show interspecific variation. Our expectation is that as our data set grows, we will be able to further assess temporal and spatial variability in use of our terrestrial site by amphibian species. In addition, we hope to implement a study that uses frogloggers (automated data acquisition systems) to record breeding choruses at the aquatic habitats. We

Fifth Annual SC Upstate Research Symposium
20 Sponsors: Stäubli, Spartanburg Regional Healthcare System, EPSCoR/IDeA RS grant.
would then be able to assess whether or not there is an association between specific breeding events and waves of ranid frogs arriving at the drift fence site. The importance of terrestrial habitats surrounding wetlands to the survival of amphibian populations is well-recognized [6,7,8,9]. Our drift fence site lies < 200m away from aquatic habitats and would be considered part of the “buffer zone” for both the retention pond and Lawsons Fork Creek. Thus, our site has the potential to contribute useful data relevant to increasing our understanding of how buffer zones impact amphibian population persistence.
REFERENCES
[1] H. Fitch, H.S. “Collecting and life-history techniques,” In Snakes: Ecology and Evolutionary Biology. R. Seigel, J. Collins, and S. Novak (Eds). McGraw-Hill, Inc., New York, pp 143-164, 1987.
[2] W. Heyer, M. Donnelly, R. McDiarmid, L. Hayek and M. Foster (Eds), “Standard techniques for inventory and monitoring,” In Measuring and Monitoring Biological Diversity: Standard methods for amphibians. Smithsonian Institution Press, Washington, pp 75-141, 1994.
[3] B. Todd, C. Winne, J. Willson, and J. Gibbons. “Getting the drift: examining the effects of timing, trap type, and taxon on herpetofaunal drift fence surveys,” American Midland Naturalist 158, pp 292-305, 2007.
[4] X. Glaudas, K. Andrews, J. Willson, and J. Gibbons. “Migration patterns in a population of cottonmouths (Agkistrodon piscivorus) inhabiting an isolated wetland,” Journal of Zoology 271, pp 119-124, 2007.
[5] D. Patrick, M. Hunter, Jr., and A. Calhoun. “Effects of experimental forestry treatments on a Maine amphibian community,” Forest Ecology and Management 234, pp 323-332, 2006.
[6] R. Semlitsch, “Biological delineation of terrestrial buffer zones for pond-breeding salamanders,” Conservation Biology 12, pp 1113-1119, 2001.
[7] J. Gibbons, “Terrestrial habitat: a vital component for herpetofauna of isolated wetlands,” Wetlands 23, pp 630-635, 2003.
[8] R. Semlitsch and J. Bodie, “Biological criteria for buffer zones around wetlands and riparian habitats for amphibians and reptiles,” Conservation Biology 17, pp 1219-1228, 2003.
[9] T. Rittenhouse and R. Semlitsch, “Distribution of amphibians in terrestrial habitat surrounding wetlands,” Wetlands 27, pp 153-161, 2007.
March 27th, 2009
Sponsors: Stäubli, Spartanburg Regional Healthcare System, EPSCoR/IDeA RS grant. 21
Three Allotetraploid Segregates of Isoetes piedmontana (Pfeiffer) Reed
Ricky D. Brannon, Miranda L. Dornis, Kristen M. Smith, and Kerry D. Heafner Department of Biology
Limestone College 1115 College Drive, Gaffney, SC 29340
Abstract — Isoetes piedmontana (Pfeiffer) Reed (Isoetaceae) has historically been recognized as the common quillwort of the much-studied granite flatrocks of the southeastern United States Piedmont Region. Cytological studies have confirmed diploid (2n=22) and tetraploid (2n=44) populations included in this species. We present the results of a study comparing thirteen morphological features in plants from three tetraploid populations in Alabama and North Carolina that have historically been identified as I. piedmontana. The Alabama population differed significantly from both North Carolina populations in seven characters. The two North Carolina populations differed significantly from each other in twelve of thirteen characters. Based on previously published genetic evidence and the results of the present morphological study, we recognize three allotetraploid segregates of I. piedmontana: Isoetes alabamensis sp. nov. from Randolph County, Alabama; Isoetes carolinae-septentrionalis sp. nov. from Wake County, North Carolina, and Isoetes analogous sp. nov. from Franklin County, North Carolina. Isoetes piedmontana sensu stricto should be interpreted as the common diploid quillwort found on granite flatrocks in the southeastern United States Piedmont Region.
Keywords — Isoetes, quillwort, tetraploid.
INTRODUCTION
Isoetes piedmontana (Pfeiffer) Reed was originally described as a variety of Isoetes virginica Pfeiffer based on having shorter and more numerous leaves per plant and megaspores with a different ornamentation pattern [1]. Reed [2] subsequently elevated I. virginica var. piedmontana to species status in a treatment of Isoetes of the southeastern United States. Populations presently recognized as I. piedmontana have been collected on granitic outcrops ranging from eastern Alabama, through central Georgia, through central South and North Carolina, and to east-central Virginia.
Genetic evidence, derived from chromosome counts and allozymes, suggests that I. piedmontana may contain more than one species. Matthews and Murdy[3] confirmed the diploid (2n=22) status of fifteen populations, including the
type population in Georgia, as well as the tetraploid (2n=44) status of a population in Randolph County, Alabama. Subsequent cytological analyses have also revealed additional tetraploid populations in Hancock County, Georgia, Franklin and Wake Counties, North Carolina, and Powhatan County, Virginia [4], [5]. A cursory examination of the enzyme triosephosphate isomerase (TPI) demonstrated that tetraploid populations of I. piedmontana in Randolph County, Alabama, and Franklin and Wake Counties, North Carolina exhibit additive, yet different, allele compositions at TPI-2 and TPI-2 [5].
While there is sufficient genetic evidence to warrant recognition of the Alabama and North Carolina tetraploid populations at the species level, no analyses testing the morphological distinctness of tetraploid populations included in I. piedmontana have been conducted until the present study. The goals of this paper are to 1) report the results of a morphological study comparing Alabama and North Carolina allotetraploid populations of I. piedmontana and 2) provide names for these newly delineated allotetraploid taxa.
MATERIALS AND METHODS
The three populations of I. piedmontana examined in this study have previously been confirmed as being tetraploid [5]. All data were derived from plants collected in the 2007 field season. Thirteen morphological features were examined from a total of 58 pressed and alcohol-preserved plants. Sample sizes for each character varied among the three populations. Microphylls were delineated into subulate and alate portions [5]. Total leaf length was measured from the point of attachment on the corm to the subla apex. Alate lengths were measured from the leaf base to either the longer of the two ala apices or to the ala apex that was most accessible. Subulate length was calculated as the difference between total leaf length and alate
Fifth Annual SC Upstate Research Symposium
22 Sponsors: Stäubli, Spartanburg Regional Healthcare System, EPSCoR/IDeA RS grant.
length. Subulate width was measured at mid-subula, and alate width was measured at the ala’s widest point above the sporangium. Sporangial features were measured at either 400 or 500X with an ocular micrometer. Sporangium length and width, as well as velum coverage and ligule and labium features were measured on plants preserved in 91% isopropyl alcohol. Ligule width was measured across the base of the ligule; ligule length was measured from the bottom of the base to the apex. Labium width was measured across the lower lip of the foveola, the pit from which the ligule arises; labium length was measured from the edge of the lower lip of the foveola to the labium’s highest point. Selected ligules and labia were drawn with camera lucida. Megaspore diameters were measured from air-dried spores at 500X with an ocular micrometer oriented parallel to the equatorial ridge of the spore. Microspore lengths were measured from spores mounted in Hoyer’s medium at 1,000X with the micrometer parallel to the spore’s hylar ridge.
Means and standard deviations were calculated for each character in each population. Statistical analyses were conducted on standardized data using SYSTAT Version 10.2 [6]. First, pair-wise two sample t-tests were used to assess which characters differed significantly among the three populations. Then, twenty samples for which all thirteen morphological variables could be measured from each of the three populations were used for principal components analysis (PCA). Finally, two separate discriminant function analyses (DFAs) were conducted to assess the degree to which individuals from each population could be correctly assigned to their respective population. The first DFA was run using the two characters with the heaviest component loadings in PC 1. The second DFA was run using all thirteen morphological features because plants from each population could be classified a priori based on geography. Jack-knifed classification matrices and canonical scores plots demonstrating the best possible delineation among the three populations were generated by the DFAs.
RESULTS Pair-wise two sample t-tests revealed that the Alabama plants differed significantly from both North Carolina populations in seven characters, some of which were the same for both populations. The Franklin County population, however, differed significantly from the Wake County population in twelve of thirteen characters. Ligules and labia were among the most variable features among the three populations. Ligules from all three populations are auriculate. Leaves from plants in
the Randolph County Alabama population had triangular to deltate ligules and labia that were commonly bifid. Leaves from plants in the Wake County, North Carolina population had variously triangular ligules and irregularly undulate labia. Leaves from plants in the Franklin County, North Carolina population had triangular to broadly deltate ligules and had labia that are mostly spatulate.
Four significantly different principal components were generated which accounted for 61% of the total variation explained in the data set. Characters with the most heavily weighted component loadings in PC 1 were percent velum coverage (-0.789), ligule width (0.742), and labium length (0.620). In PC 2, alate length, sporangium width and megaspore diameter had the three most heavily weighted component loadings (-0.740, 0.489, and 0.452, respectively). The jack-knifed classification matrix that resulted from the DFA using percent velum coverage and ligule width from PC 1 revealed that 90% of the plants from the Randolph County, Alabama population whereas plants from Wake and Franklin Counties, North Carolina were correctly classified while 85% and 100% of the time, respectively. Using all thirteen morphological characters, 90% of the plants from Alabama were correctly classified, whereas plants from Wake and Franklin Counties, North Carolina were correctly classified 85% and 95% of the time, respectively.
DISCUSSION
Based on the results of this morphological study and on previously published genetic evidence, we recognize three new allotetraploid segregates of I. piedmontana: Isoetes alabamensis sp. nov. from Randolph County, Alabama; Isoetes carolinae-septentrionalis sp. nov. from Wake County, North Carolina; and Isoetes analogous sp. nov. from Franklin County, North Carolina. Formal descriptions of these new taxa have been submitted to Castanea, the journal of the Southern Appalachian Botanical Society. While not necessarily a useful field character, the importance of obtaining chromosome counts from any Isoetes population cannot be overemphasized. Identifications based on a single morphological feature, such as megaspore ornamentation, are tenuous at best and need to be supported with either multiple morphological features, chromosome counts, or both. Assessing spore size alone may allow only an estimation of ploidy level. The simple task of counting chromosomes led to the realization that the entity long thought to be I.

March 27th, 2009
Sponsors: Stäubli, Spartanburg Regional Healthcare System, EPSCoR/IDeA RS grant. 23
lacustris L., a decaploid (2n=110) in southeastern Tennessee is actually an octaploid (2n=88) [7].
Isoetes piedmontana sensu stricto should be interpreted as the common diploid quillwort of the southeastern U.S. granitic flatrocks until its systematic relationship to the wide-ranging diploid species I. melanopoda can be thoroughly examined.
ACKNOWLEDGMENTS
This research was funded by South Carolina Independent Colleges and Universities (SCICU), Inc. We acknowledge the assistance of C.M. Hardman, J.L. Pridmore, D. Drmač, A. Cox, and W. Knapp. We extend special thanks to R.D. Bray.
REFERENCES
[5] N.E. Pfeiffer. A new variety of Isoetes virginica. Bulletin of the Torrey Botanical Club, vol.66, pp. 411-413, 1939.
[6] C.F. Reed. Isoetes in the southeastern United States. Phytologia, vol 12, pp. 369-400, 1965.
[7] J.F. Matthews and W.H. Murdy. A study of the Isoetes common to the granite outcrops of the southeastern piedmont, United States. Botanical Gazette, vol. 130, pp. 53-61, 1969.
[8] L.J. Musselman and D.A. Knepper. Quillworts of Virginia. American Fern Journal, vol. 84, pp. 48-68.
[9] K.D. Heafner and R.D. Bray. Taxonomic reassessment of North American granite outcrop Isoetes species with emphasis on vegetative morphology and I. piedmontana (Pfeiffer) Reed sensu lato. Castanea, vol. 70, pp. 204-221.
[10] SYSTAT Software Inc., Richmond, CA. [11] N.T. Luebke and J.M. Budke. Isoetes tennesseensis
(Isoetaceae), an octaploid quillwort from Tennessee. American Fern Journal, vol. 93, pp. 184-190.
Fifth Annual SC Upstate Research Symposium
24 Sponsors: Stäubli, Spartanburg Regional Healthcare System, EPSCoR/IDeA RS grant.
Charles W. Chesnutt and Racial Caricature in Post-Bellum, Pre-Harlem America
Peter Caster Languages, Literature, and Composition
University of South Carolina Upstate 800 University Way, Spartanburg, SC 29303
Abstract - Charles W. Chesnutt’s plantation fiction of the late nineteenth century for the Atlantic Monthly and The Conjure Woman operate in a register that capitulated to white stereotypes of blackness, even as his deft narrative strategies both extend beyond folklore to historical precedent and humanize African American men and women. However, a combination of factors led him to abandon plantation narrative, namely his middle-class assimilationist disdain for dialectic fiction, the rise of racist violence in South and North during the 1880s and 1890s, and his suspicion that comic depictions did not deflect that violence, but instead legitimized it. The House Behind the Cedars, The Marrow of Tradition, and a number of his short stories reconfigure the racist stereotypes of black men, no longer furthering minstrelsy tropes, but reinterpreting the servility of Sambo and the violent threat of Nat as a white construction and black masculine heroism, respectively. Chesnutt’s portrayals offer an alternate discourse to the caricatures common to popular periodicals such as Harper’s Weekly. Reformulating these stereotypes celebrated the black middle and working classes and integrities of black selfhood, family, community..
Keywords — African-American, Charles W. Chesnutt, caricature, Harper’s Weekly
INTRODUCTION
All over the United States the Associated Press had flashed the report of another dastardly outrage by a burly black brute,--all black brutes it seems are burly,--and of the impending lynching with its prospective horrors. This news, being highly sensational in its character, had been displayed in large black type on the front pages of the daily papers.
Charles W. Chesnutt
The epigraph, a provocative passage from Charles W. Chesnutt’s novel The Marrow of Tradition (1901), sardonically lances the popular expectation of the “burly black brute” even as the passage
demonstrates how that racist visions appear in the “large black type” of print journalism, thus staging the complementary nature not only of history and fiction, but visual image and printed text in producing black masculinity in the national imagination. Chesnutt’s 1901 novel joins the irony and use of dialect from his tragicomic plantation tales of the previous fifteen years with the sentimentality of his passing narrative The House Behind the Cedars (1900) in a sensationalist plot, which culminates in a fictionalization of the 1898 Wilmington massacre as white rioters killed many African American citizens and overthrew the elected Republican government in North Carolina’s then-largest city. That event, related to the novelist by many of his friends and family who had seen it firsthand, joined with his longstanding frustration with plantation fiction, leading him to reconfigure the racial caricatures of black men. In The Marrow of Tradition, he recasts the threatening “buck” figure of Nat and the servility of the Rastus type as, respectively, heroic and a white construction. These literary depictions contrast with the illustrations of Harper’s Weekly’s Thomas Nast and lesser-known artists such as Sol Eytinge Jr., S.G. McCutcheon, and others, wherein African American men often appeared as simple, submissive, even childlike, whether in that magazine or the others published during and after reconstruction, some of them the very periodicals in which much of Chesnutt’s short fiction initially appeared. This essay demonstrates how the illustrations of the nationally popular middle-class weekly Harper’s Weekly helped naturalize and promulgate stereotypical images of black men in the decade following reconstruction, the very caricatures Chesnutt contested through reconfiguring them.
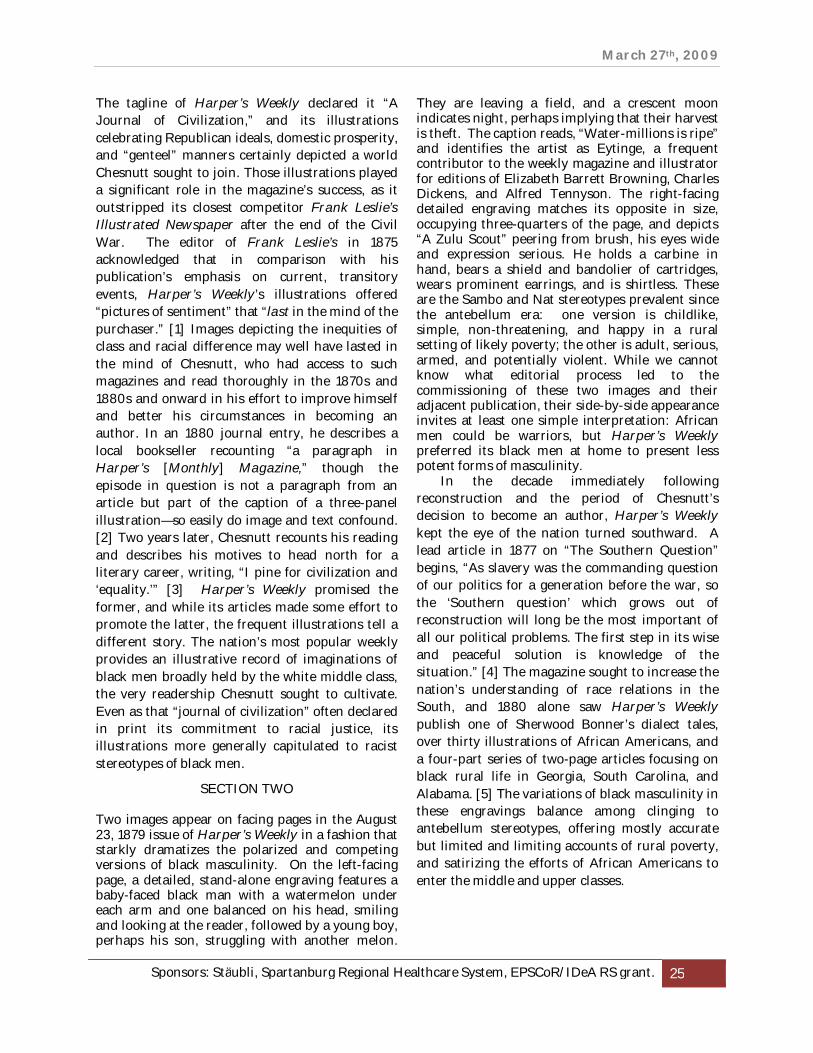
March 27th, 2009
Sponsors: Stäubli, Spartanburg Regional Healthcare System, EPSCoR/IDeA RS grant. 25
The tagline of Harper’s Weekly declared it “A Journal of Civilization,” and its illustrations celebrating Republican ideals, domestic prosperity, and “genteel” manners certainly depicted a world Chesnutt sought to join. Those illustrations played a significant role in the magazine’s success, as it outstripped its closest competitor Frank Leslie’s Illustrated Newspaper after the end of the Civil War. The editor of Frank Leslie’s in 1875 acknowledged that in comparison with his publication’s emphasis on current, transitory events, Harper’s Weekly’s illustrations offered “pictures of sentiment” that “last in the mind of the purchaser.” [1] Images depicting the inequities of class and racial difference may well have lasted in the mind of Chesnutt, who had access to such magazines and read thoroughly in the 1870s and 1880s and onward in his effort to improve himself and better his circumstances in becoming an author. In an 1880 journal entry, he describes a local bookseller recounting “a paragraph in Harper’s [Monthly] Magazine,” though the episode in question is not a paragraph from an article but part of the caption of a three-panel illustration—so easily do image and text confound. [2] Two years later, Chesnutt recounts his reading and describes his motives to head north for a literary career, writing, “I pine for civilization and ‘equality.’” [3] Harper’s Weekly promised the former, and while its articles made some effort to promote the latter, the frequent illustrations tell a different story. The nation’s most popular weekly provides an illustrative record of imaginations of black men broadly held by the white middle class, the very readership Chesnutt sought to cultivate. Even as that “journal of civilization” often declared in print its commitment to racial justice, its illustrations more generally capitulated to racist stereotypes of black men.
SECTION TWO
Two images appear on facing pages in the August 23, 1879 issue of Harper’s Weekly in a fashion that starkly dramatizes the polarized and competing versions of black masculinity. On the left-facing page, a detailed, stand-alone engraving features a baby-faced black man with a watermelon under each arm and one balanced on his head, smiling and looking at the reader, followed by a young boy, perhaps his son, struggling with another melon.
They are leaving a field, and a crescent moon indicates night, perhaps implying that their harvest is theft. The caption reads, “Water-millions is ripe” and identifies the artist as Eytinge, a frequent contributor to the weekly magazine and illustrator for editions of Elizabeth Barrett Browning, Charles Dickens, and Alfred Tennyson. The right-facing detailed engraving matches its opposite in size, occupying three-quarters of the page, and depicts “A Zulu Scout” peering from brush, his eyes wide and expression serious. He holds a carbine in hand, bears a shield and bandolier of cartridges, wears prominent earrings, and is shirtless. These are the Sambo and Nat stereotypes prevalent since the antebellum era: one version is childlike, simple, non-threatening, and happy in a rural setting of likely poverty; the other is adult, serious, armed, and potentially violent. While we cannot know what editorial process led to the commissioning of these two images and their adjacent publication, their side-by-side appearance invites at least one simple interpretation: African men could be warriors, but Harper’s Weekly preferred its black men at home to present less potent forms of masculinity.
In the decade immediately following reconstruction and the period of Chesnutt’s decision to become an author, Harper’s Weekly kept the eye of the nation turned southward. A lead article in 1877 on “The Southern Question” begins, “As slavery was the commanding question of our politics for a generation before the war, so the ‘Southern question’ which grows out of reconstruction will long be the most important of all our political problems. The first step in its wise and peaceful solution is knowledge of the situation.” [4] The magazine sought to increase the nation’s understanding of race relations in the South, and 1880 alone saw Harper’s Weekly publish one of Sherwood Bonner’s dialect tales, over thirty illustrations of African Americans, and a four-part series of two-page articles focusing on black rural life in Georgia, South Carolina, and Alabama. [5] The variations of black masculinity in these engravings balance among clinging to antebellum stereotypes, offering mostly accurate but limited and limiting accounts of rural poverty, and satirizing the efforts of African Americans to enter the middle and upper classes.
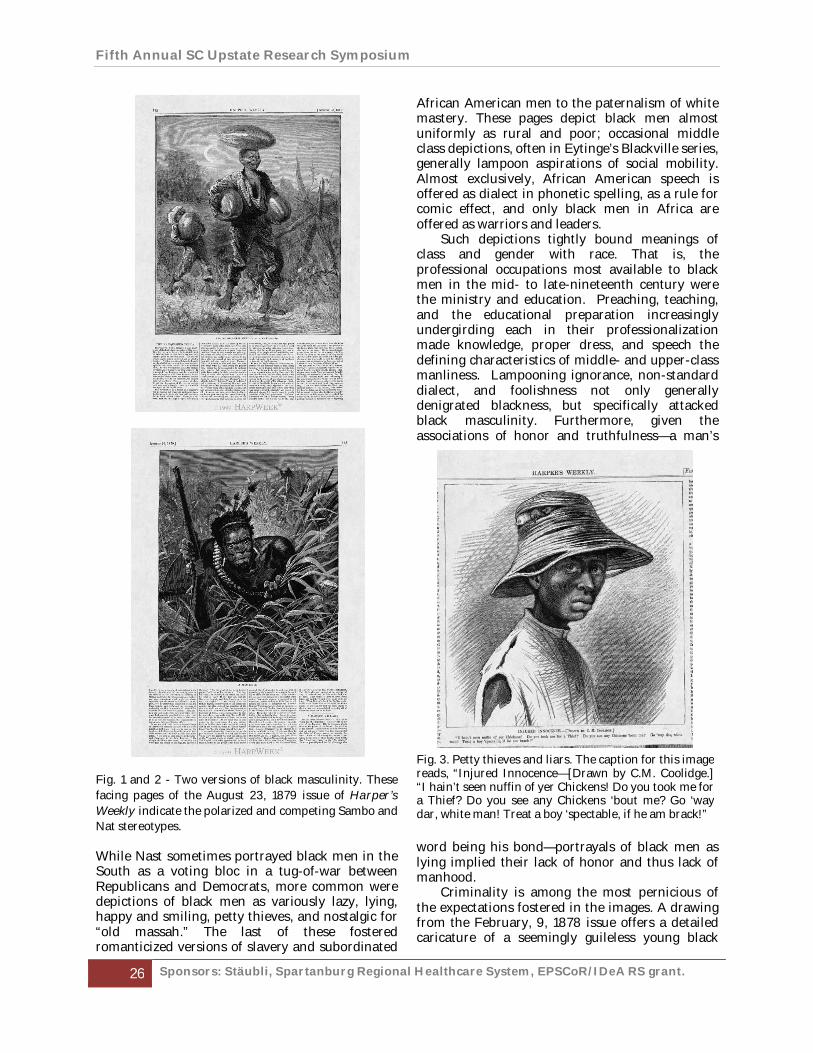
Fifth Annual SC Upstate Research Symposium
26 Sponsors: Stäubli, Spartanburg Regional Healthcare System, EPSCoR/IDeA RS grant.
Fig. 1 and 2 - Two versions of black masculinity. These facing pages of the August 23, 1879 issue of Harper’s Weekly indicate the polarized and competing Sambo and Nat stereotypes.
While Nast sometimes portrayed black men in the South as a voting bloc in a tug-of-war between Republicans and Democrats, more common were depictions of black men as variously lazy, lying, happy and smiling, petty thieves, and nostalgic for “old massah.” The last of these fostered romanticized versions of slavery and subordinated
African American men to the paternalism of white mastery. These pages depict black men almost uniformly as rural and poor; occasional middle class depictions, often in Eytinge’s Blackville series, generally lampoon aspirations of social mobility. Almost exclusively, African American speech is offered as dialect in phonetic spelling, as a rule for comic effect, and only black men in Africa are offered as warriors and leaders.
Such depictions tightly bound meanings of class and gender with race. That is, the professional occupations most available to black men in the mid- to late-nineteenth century were the ministry and education. Preaching, teaching, and the educational preparation increasingly undergirding each in their professionalization made knowledge, proper dress, and speech the defining characteristics of middle- and upper-class manliness. Lampooning ignorance, non-standard dialect, and foolishness not only generally denigrated blackness, but specifically attacked black masculinity. Furthermore, given the associations of honor and truthfulness—a man’s
word being his bond—portrayals of black men as lying implied their lack of honor and thus lack of manhood.
Criminality is among the most pernicious of the expectations fostered in the images. A drawing from the February, 9, 1878 issue offers a detailed caricature of a seemingly guileless young black
Fig. 3. Petty thieves and liars. The caption for this image reads, “Injured Innocence—[Drawn by C.M. Coolidge.] “I hain’t seen nuffin of yer Chickens! Do you took me for a Thief? Do you see any Chickens ‘bout me? Go ‘way dar, white man! Treat a boy ‘spectable, if he am brack!”
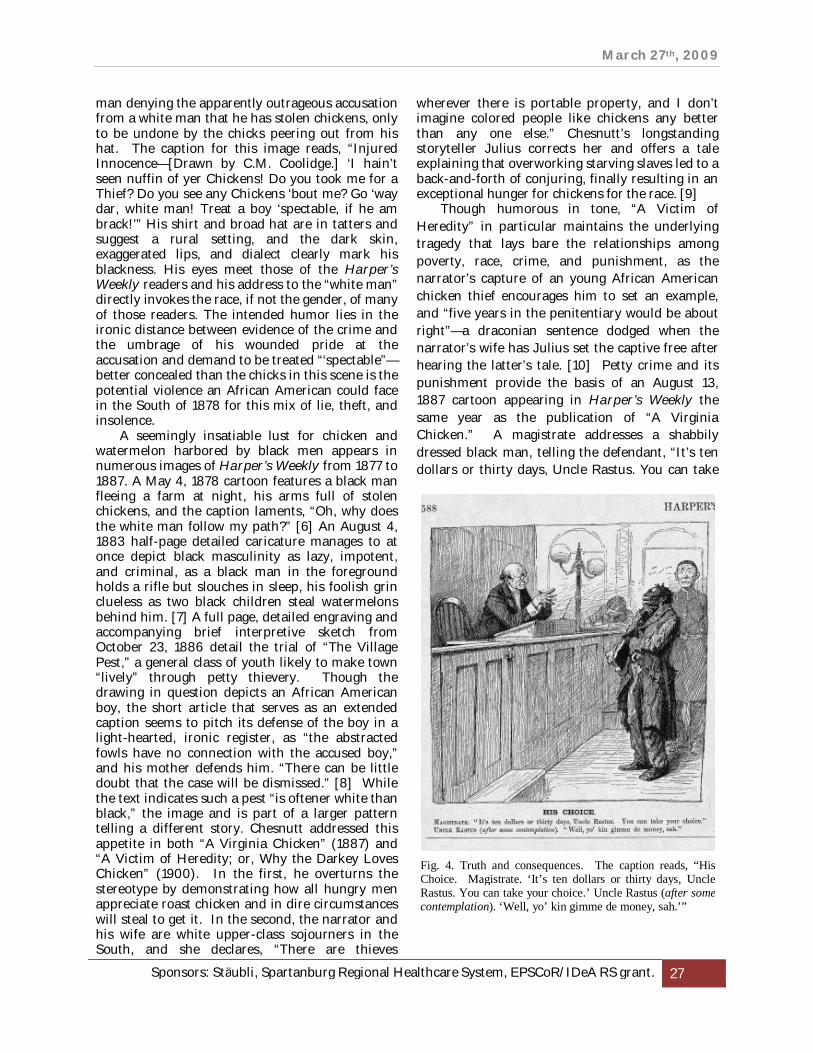
March 27th, 2009
Sponsors: Stäubli, Spartanburg Regional Healthcare System, EPSCoR/IDeA RS grant. 27
man denying the apparently outrageous accusation from a white man that he has stolen chickens, only to be undone by the chicks peering out from his hat. The caption for this image reads, “Injured Innocence—[Drawn by C.M. Coolidge.] ‘I hain’t seen nuffin of yer Chickens! Do you took me for a Thief? Do you see any Chickens ‘bout me? Go ‘way dar, white man! Treat a boy ‘spectable, if he am brack!’” His shirt and broad hat are in tatters and suggest a rural setting, and the dark skin, exaggerated lips, and dialect clearly mark his blackness. His eyes meet those of the Harper’s Weekly readers and his address to the “white man” directly invokes the race, if not the gender, of many of those readers. The intended humor lies in the ironic distance between evidence of the crime and the umbrage of his wounded pride at the accusation and demand to be treated “‘spectable”—better concealed than the chicks in this scene is the potential violence an African American could face in the South of 1878 for this mix of lie, theft, and insolence.
A seemingly insatiable lust for chicken and watermelon harbored by black men appears in numerous images of Harper’s Weekly from 1877 to 1887. A May 4, 1878 cartoon features a black man fleeing a farm at night, his arms full of stolen chickens, and the caption laments, “Oh, why does the white man follow my path?” [6] An August 4, 1883 half-page detailed caricature manages to at once depict black masculinity as lazy, impotent, and criminal, as a black man in the foreground holds a rifle but slouches in sleep, his foolish grin clueless as two black children steal watermelons behind him. [7] A full page, detailed engraving and accompanying brief interpretive sketch from October 23, 1886 detail the trial of “The Village Pest,” a general class of youth likely to make town “lively” through petty thievery. Though the drawing in question depicts an African American boy, the short article that serves as an extended caption seems to pitch its defense of the boy in a light-hearted, ironic register, as “the abstracted fowls have no connection with the accused boy,” and his mother defends him. “There can be little doubt that the case will be dismissed.” [8] While the text indicates such a pest “is oftener white than black,” the image and is part of a larger pattern telling a different story. Chesnutt addressed this appetite in both “A Virginia Chicken” (1887) and “A Victim of Heredity; or, Why the Darkey Loves Chicken” (1900). In the first, he overturns the stereotype by demonstrating how all hungry men appreciate roast chicken and in dire circumstances will steal to get it. In the second, the narrator and his wife are white upper-class sojourners in the South, and she declares, “There are thieves
wherever there is portable property, and I don’t imagine colored people like chickens any better than any one else.” Chesnutt’s longstanding storyteller Julius corrects her and offers a tale explaining that overworking starving slaves led to a back-and-forth of conjuring, finally resulting in an exceptional hunger for chickens for the race. [9]
Though humorous in tone, “A Victim of Heredity” in particular maintains the underlying tragedy that lays bare the relationships among poverty, race, crime, and punishment, as the narrator’s capture of an young African American chicken thief encourages him to set an example, and “five years in the penitentiary would be about right”—a draconian sentence dodged when the narrator’s wife has Julius set the captive free after hearing the latter’s tale. [10] Petty crime and its punishment provide the basis of an August 13, 1887 cartoon appearing in Harper’s Weekly the same year as the publication of “A Virginia Chicken.” A magistrate addresses a shabbily dressed black man, telling the defendant, “It’s ten dollars or thirty days, Uncle Rastus. You can take
Fig. 4. Truth and consequences. The caption reads, “His Choice. Magistrate. ‘It’s ten dollars or thirty days, Uncle Rastus. You can take your choice.’ Uncle Rastus (after some contemplation). ‘Well, yo’ kin gimme de money, sah.’”
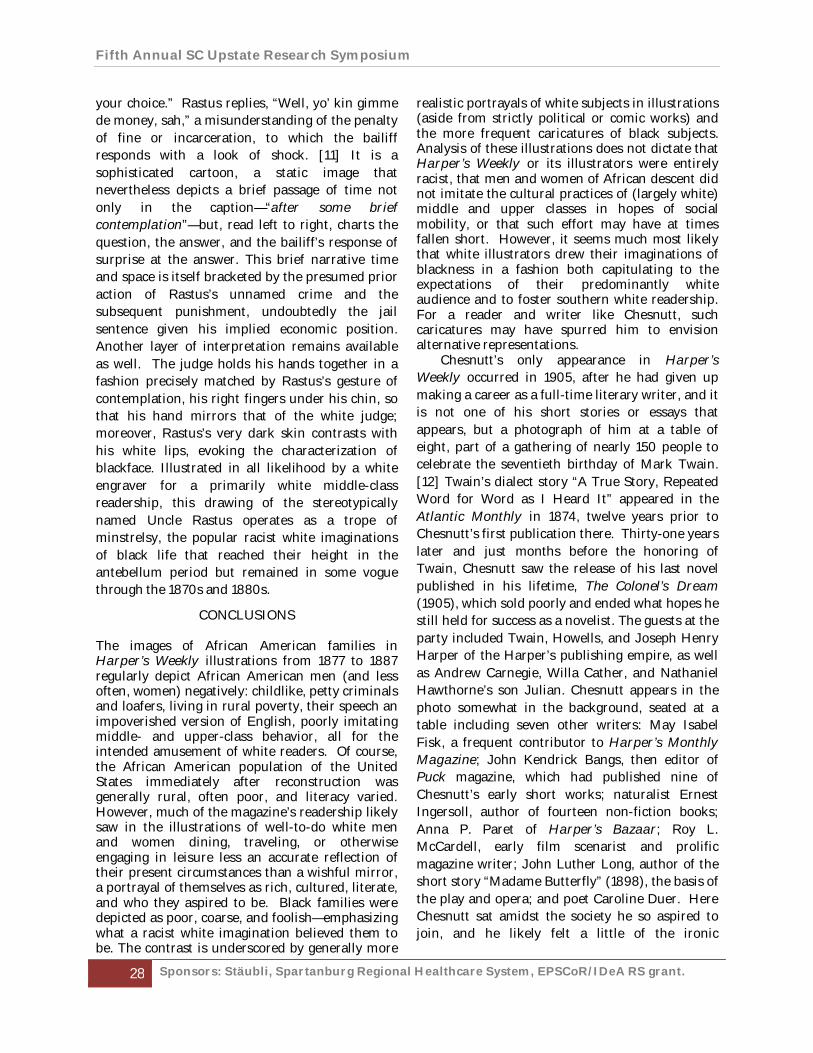
Fifth Annual SC Upstate Research Symposium
28 Sponsors: Stäubli, Spartanburg Regional Healthcare System, EPSCoR/IDeA RS grant.
your choice.” Rastus replies, “Well, yo’ kin gimme de money, sah,” a misunderstanding of the penalty of fine or incarceration, to which the bailiff responds with a look of shock. [11] It is a sophisticated cartoon, a static image that nevertheless depicts a brief passage of time not only in the caption—“after some brief contemplation”—but, read left to right, charts the question, the answer, and the bailiff’s response of surprise at the answer. This brief narrative time and space is itself bracketed by the presumed prior action of Rastus’s unnamed crime and the subsequent punishment, undoubtedly the jail sentence given his implied economic position. Another layer of interpretation remains available as well. The judge holds his hands together in a fashion precisely matched by Rastus’s gesture of contemplation, his right fingers under his chin, so that his hand mirrors that of the white judge; moreover, Rastus’s very dark skin contrasts with his white lips, evoking the characterization of blackface. Illustrated in all likelihood by a white engraver for a primarily white middle-class readership, this drawing of the stereotypically named Uncle Rastus operates as a trope of minstrelsy, the popular racist white imaginations of black life that reached their height in the antebellum period but remained in some vogue through the 1870s and 1880s.
CONCLUSIONS
The images of African American families in Harper’s Weekly illustrations from 1877 to 1887 regularly depict African American men (and less often, women) negatively: childlike, petty criminals and loafers, living in rural poverty, their speech an impoverished version of English, poorly imitating middle- and upper-class behavior, all for the intended amusement of white readers. Of course, the African American population of the United States immediately after reconstruction was generally rural, often poor, and literacy varied. However, much of the magazine’s readership likely saw in the illustrations of well-to-do white men and women dining, traveling, or otherwise engaging in leisure less an accurate reflection of their present circumstances than a wishful mirror, a portrayal of themselves as rich, cultured, literate, and who they aspired to be. Black families were depicted as poor, coarse, and foolish—emphasizing what a racist white imagination believed them to be. The contrast is underscored by generally more
realistic portrayals of white subjects in illustrations (aside from strictly political or comic works) and the more frequent caricatures of black subjects. Analysis of these illustrations does not dictate that Harper’s Weekly or its illustrators were entirely racist, that men and women of African descent did not imitate the cultural practices of (largely white) middle and upper classes in hopes of social mobility, or that such effort may have at times fallen short. However, it seems much most likely that white illustrators drew their imaginations of blackness in a fashion both capitulating to the expectations of their predominantly white audience and to foster southern white readership. For a reader and writer like Chesnutt, such caricatures may have spurred him to envision alternative representations.
Chesnutt’s only appearance in Harper’s Weekly occurred in 1905, after he had given up making a career as a full-time literary writer, and it is not one of his short stories or essays that appears, but a photograph of him at a table of eight, part of a gathering of nearly 150 people to celebrate the seventieth birthday of Mark Twain. [12] Twain’s dialect story “A True Story, Repeated Word for Word as I Heard It” appeared in the Atlantic Monthly in 1874, twelve years prior to Chesnutt’s first publication there. Thirty-one years later and just months before the honoring of Twain, Chesnutt saw the release of his last novel published in his lifetime, The Colonel’s Dream (1905), which sold poorly and ended what hopes he still held for success as a novelist. The guests at the party included Twain, Howells, and Joseph Henry Harper of the Harper’s publishing empire, as well as Andrew Carnegie, Willa Cather, and Nathaniel Hawthorne’s son Julian. Chesnutt appears in the photo somewhat in the background, seated at a table including seven other writers: May Isabel Fisk, a frequent contributor to Harper’s Monthly Magazine; John Kendrick Bangs, then editor of Puck magazine, which had published nine of Chesnutt’s early short works; naturalist Ernest Ingersoll, author of fourteen non-fiction books; Anna P. Paret of Harper’s Bazaar; Roy L. McCardell, early film scenarist and prolific magazine writer; John Luther Long, author of the short story “Madame Butterfly” (1898), the basis of the play and opera; and poet Caroline Duer. Here Chesnutt sat amidst the society he so aspired to join, and he likely felt a little of the ironic

March 27th, 2009
Sponsors: Stäubli, Spartanburg Regional Healthcare System, EPSCoR/IDeA RS grant. 29
ambivalence so common to his narratives as he joined his esteemed company to honor a white southern writer who earned his literary reputation and wealth in part through incorporating African American dialect and depicting black life.
ACKNOWLEDGMENTS
I would like to thank the USC Upstate Office of Sponsored Awards and Research Support for their generous financial assistance Fall 2008.
REFERENCES
[1] J. Brown. Beyond the Lines: Pictorial Reporting, Everyday Life, and the Crisis of Gilded Age America. University of California Press, pp 4, 62, 2005.
[2] C. Chesnutt. The Journals of Charles W. Chesnutt. Duke University Press, pp 126, 1993.
[3] C. Chesnutt, The Journals, pp 172. [4] Harper’s Weekly vol. 21(1051), pp 122, 1877. [5] Harper’s Weekly vol. 24(1251), pp 816-817, 1880;
Harper’s Weekly 24(1246), pp 733-734, 1880; Harper’s Weekly 24(1247), pp 749-750, 1880; Harper’s Weekly 24(1248), pp 765-766, 1880; Harper’s Weekly 24(1249), pp 781-782, 1880.
[6] Harper’s Weekly 22(1114), pp 360, 1878. [7] Harper’s Weekly 27(1389), pp 1389, 1883. [8] Harper’s Weekly 30(1557), pp 1557, 1886. [9] C. Chesnutt. The Short Fiction of Charles W.
Chesnutt. Howard University Press, pp 125, 1981. [10] C. Chesnutt. The Short Fiction, pp 123, 131. [11] Harper’s Weekly 31(1598), pp 588, 1887. [12] Harper’s Weekly 44(2557), pp 1884, 1905.
Fig 5. Chesnutt in the background. In this 1905 photograph from Harper’s Weekly, Charles W. Chesnutt joined his contemporary authors at a party celebrating Mark Twain’s seventieth birthday. Chesnutt is seated in the back of the table in the very center of the photo, the fourth person from the left.
Fifth Annual SC Upstate Research Symposium
30 Sponsors: Stäubli, Spartanburg Regional Healthcare System, EPSCoR/IDeA RS grant.
Child Trafficking - Borderline Slavery Landis Bunch and Carolyn Hooker
Spartanburg Community College 523 Chesnee Hwy, Gaffney, SC 29341
[email protected], [email protected]
Abstract - In some Middle Eastern countries, such as Africa, China, and Japan, children are sold by their parents or voluntarily go with child traffickers. They are sent away from their families, do not get paid much, and often work in terrible conditions. Families are often tricked or are in such terrible debt, that they have to find a way to support themselves. They agree to send their children to work. Child trafficking has become a popular way for countries to have legal borderline slavery and has become a tragic form of human rights abuse.
Keywords – Child trafficking, human rights abuse
INTRODUCTION
Child trafficking is an ongoing crisis in many parts of the world, especially in Eastern countries, such as Africa, China, and Japan. Child trafficking begins between a family and a trafficker, a typically private arrangement. Most families traffic their children because of economic troubles. Other families traffic their children without realizing they have done it. Most traffickers go around to small villages and claim that they have well-paying jobs available for these children. Yet, in reality, the parents are giving the children to a life of servitude. The traffickers traffic children because they can make a profit and the children work for little to no pay [1]. Children who are victims of this atrocious practice lose their childhood and are often scarred for life. Their lives border on slavery.
SECTION TWO
Etse is a young boy from Togo who told his story of being harassed by child traffickers to leave his family and come with them to Nigeria. They promised him that he could help his family and make lots of money. According to Etse, he was living in Togo and his family was very poor. He said, “Life was hard, and a friend told me I should go to Nigeria, because I was not doing anything here. I thought if I could go to Nigeria and get rich, I could come back and learn a trade”[2].
Fortunately for Etse, he didn’t go because he saw what had happened to his friends who had believed the traffickers. Etse said of his friends, “They told me they worked in the fields…, but none of them wanted to go back. They said the traffickers deceived them”[2].
Africa, China, and Japan are a few of the countries that engage in child trafficking. In these countries, trafficking has also come to mean that children could possibly be forced into an unwanted marriage. Countries have made trafficking “forms of forced labor and servitude” [2]. Some governments, such as Thailand, target and punish the victims, not the perpetrators. This allows these countries to continue to traffic children. Most of the time, the children are smuggled into countries [3].
The European Commission is an organization that tries to control child trafficking. When they find other organizations involved or associated with the trafficking, they immediately start investigating and freezing funds to prevent any other illegal trafficking. The European Commission has been around since 2000 [4], and has found “serious abuse [of] migrants and asylum seekers at the hands of human traffickers” [4]. The group focuses on vulnerable children who are victims of trafficking. The victims are “considered useful for the purpose of investigating, arresting, and prosecuting traffickers” [4].
Child trafficking causes problems for every person involved in the process. The governments of some countries allow the trafficking, but some, such as the European Commission groups, try to protest against this human rights violation. So far, these groups have been able to stop a some of the countries that traffic in children but have made only a dent into the others. Families are not helping the violation issue either. Some families send their children away to earn money. Others are tricked into letting their children go with traffickers. Trafficking does not benefit anyone except the traffickers and the families, but for only a little while. The families briefly profit, but the money lasts for only so long. The traffickers are the ones who get the most out of trafficking. They are the ones who benefit from the cheap labor and get the servitude from the children [5].

March 27th, 2009
Sponsors: Stäubli, Spartanburg Regional Healthcare System, EPSCoR/IDeA RS grant. 31
CONCLUSION
The basic human rights of children are abused through child trafficking. The children end up in a life of servitude. All of their rights are taken away; they have no life; they are not allowed to move on and have families. If they do not get out, their lives are scarred forever. For those who do get out, their lives are often scarred by the memories of their lives in servitude. This violation needs to be stopped in all countries. The perpetrators should be punished for taking away children’s rights. The victims should not be punished for crimes committed against them.
REFERENCES
[1] “Trafficking.” Human Rights Watch. Human Rights Watch. 20 October 2008 <http://www.hrw.org>.
[2] “Children’s Testimony From Borderline Slavery: Child Trafficking in Togo.” Human Rights Watch. Human Rights Watch. 26 October 2008 <http://www.hrw.org>.
[3] “Saudi Arabia: Implement Proposed Labor Reforms.” Human Rights Watch. 21 July 2008. Human Rights Watch. 20 October 2008 http://www.hrw.org.
[4] “Human Rights Watch Briefing Paper.” Human Rights Watch. 1 July 2008. Human Rights Watch. 20 October 2008 <http://www.hrw.org>.
[5] “Background On Child Trafficking.” Human Rights Watch. April 2003. Human Rights Watch. 20 October 2008 <http://www.hrw.org>.
Fifth Annual SC Upstate Research Symposium
32 Sponsors: Stäubli, Spartanburg Regional Healthcare System, EPSCoR/IDeA RS grant.
Environmental Activism in the Middle East Lizabeth Zack and Joni Hammond
Department of Sociology, Criminal Justice, Women’s Studies University of South Carolina Upstate
800 University Way, Spartanburg, SC 29303 [email protected], [email protected]
Abstract - In the last twenty years, civil society and community-based groups have emerged across the Middle East to address a variety of environmental challenges, from water scarcity and waste disposal to industrial pollution and coastal degradation. Despite evidence of the trend, little scholarly research exists on this relatively new kind of political activism. Research on the Middle Eastern environment has examined the prominent environmental issues facing the region and the varying policies and protections states have instituted in response to those challenges, while research on political activism in the Middle East has focused on Islamist movements and other popular campaigns against authoritarian rule. Neither approach accounts very well for the patterns of environmental activism that have emerged in recent years. This project addresses that gap in our understanding by looking closely at grassroots and civil society campaigns around environmental issues in Jordan in recent years. The project draws on information from newspapers, organizational websites, interviews, and government documents. The analysis pays close attention to the groups involved, their complaints and demands, how they mobilize, and the outcomes and impact of their efforts. This analysis of environmental activism in Jordan should shed light on the varying patterns of mobilization around environmental issues across the Middle East and the role civil society plays in addressing environmental concerns in the region.
Keywords — environment; politics; Middle East
INTRODUCTION
In the last twenty years, civil society and community-based groups have emerged across the Middle East to address a variety of environmental challenges, from water scarcity and waste disposal to industrial pollution and coastal degradation. Local branches of Greenpeace-Mediterranean were established in Turkey, Lebanon and Israel. Neighborhood groups in Cairo pushed for better sewage systems and parks and campaigned against cement and lead smelter factories. More recently, Iraqis have mobilized to save the southern Marshes that were nearly destroyed in the first Gulf War.
And organizations in Jordan have begun to raise environmental awareness through the schools and businesses.
Despite evidence of this trend, little scholarly research exists on this relatively new kind of political activism. During the 1990s, after international agencies and NGOs, along with scientists, academics, and local residents, pointed to an impending environmental crisis in the Middle East, scholars produced a number of books and articles on the Middle Eastern environment. They reported on the variety of environmental challenges facing the region, from water issues to industrial pollution to coastal degradation [1]. Some analyzed the variation in environmental policy and protection structures created across different Middle Eastern countries; others examined the impact of traditional and eco-friendly forms of tourism on the natural environment [2]. Most of the research followed the state-centered, top-down approach to addressing environmental issues and paid less attention to organized efforts to address environmental concerns in the civil society sector and at the grassroots level. Moreover, the recent burst of research on political activism in the Middle East has tended to focus on Islamic activism and popular movements against authoritarian rule, with some analysts rendering environmental causes a luxury issue for the elites. None of these approaches accounts very well for the patterns of environmental activism emerging in recent years.
What accounts for this type of political activism in the Middle East? Who mobilizes around environmental causes and how and why they do it? In a region where national security and economic development usually dominate governmental agendas and where issues of human rights, religion and democratization preoccupy opposition movements, why and how do people join campaigns to protect the environment? This project seeks to address these questions about environmental activism by examining the level and type of activity, the groups and communities involved, how they organize, the factors prompting activism, and the outcomes of their efforts. Broadly speaking, the project seeks to expand our understanding about the impact of environmental
March 27th, 2009
Sponsors: Stäubli, Spartanburg Regional Healthcare System, EPSCoR/IDeA RS grant. 33
change from the perspective of residents and local communities across the region and the role that grassroots campaigns have in addressing environmental challenges in the Middle East.
RESEARCH PLAN
The goal of our research is to better understand how grassroots and community-based groups respond to environmental change in the Middle East. We examine environmental activism in Jordan, a country that is notable for the level of citizen-based mobilization around environmental issues. The project is an extension of preliminary research conducted in Jordan in 2006-07 that focused closely on an organized campaign against a cement factory in a community just outside the capital city of Amman. The campaign was striking in its history, sophisticated organizational structure, and degree to which it functioned at the grass-roots level. It also appeared to be part of a broader pattern of popular interest and political activity around environmental issues. The project suggests that, despite the authoritarian restrictions on political life in Jordan, civil society does have a role to play in addressing environmental concerns in the country.
Our current research examines these broader patterns across Jordan and expands the scope of the preliminary research beyond the single case study to include other environmental campaigns, issues and groups. Our data analysis will pay close attention to the groups involved, their concerns and demands, how they mobilize, and the impact of their efforts. Our analysis will rely on the following sources:
Newspapers - The Jordan Times is the on-line
English language newspaper, and has a history of reporting on environmental issues.
Websites of Environmental organizations – organizations with websites include the Royal Society for the Conservation of Nature (www.rscn.org.jo), International Union for the Conservation of Nature-West Asia/Middle East Regional Office (www.iucn.org), Friends of Environment Society (www.foe.org.jo), and Jordan Environment Society (www.jes.org.jo); these websites offer information on the history, mission, activities, and other aspects of the organization.
Blogs – Jordan Environment Watch (www.arabenvironment.net)
Government documents – Jordan Ministry of Environment (www.moenv.gov.jo).
SIGNIFICANCE
A study of environmental activism in Jordan should give us a better understanding of the conditions under which people collectively mobilize to address consequential changes in the local and regional environment. It should offer a clearer picture of which groups become involved, the issues they choose to address, the types of activities they organize, and the effects of their efforts. An in-depth look at the case of Jordan should also give us a better sense of how and why mobilization around environmental issues varies across the Middle East and the conditions that both promote and inhibit it. The project should also broaden our knowledge about the role civil society has played, and can potentially play, in addressing environmental challenges and problems in the region and the impact it can have in shaping policies and protection structures meant to mitigate those problems.
A study of environmental activism in Jordan can also expand our knowledge of popular political life in the Middle East. The Middle East is a region where authoritarian rule persists to varying degrees in most countries, and where political participation is restricted in myriad ways and can incur high personal costs, making it especially important to understand how and why people mobilize collectively and publicly to address their grievances. In recent years, the heightened interest in Islamic activism and the Islamist parties, organizations, networks and movements that operate across the region has meant that attention to other forms of political activism, including campaigns around women’s issues, human rights, economic distress and the environment, has waned. A project that helps to capture the diverse types of political activism should certainly enhance our knowledge of political life in the region.
ACKNOWLEDGMENTS
The authors would like to thank the CURS Research Assistant Program for their support.
REFERENCES [1] J.G. Jabbra, N.W. Jabbra. “Challenging
Environmental Issues,” E.J. Brill, 1997. [2] E. Watkins. “The Middle Eastern Environment,”
Cambridge: St. Malo, 1995.
Fifth Annual SC Upstate Research Symposium
34 Sponsors: Stäubli, Spartanburg Regional Healthcare System, EPSCoR/IDeA RS grant.
Scars of Africa Robin Ivey and Carolyn Hooker
English Department Spartanburg Community College
523 Chesnee Hwy, Gaffney, SC 29341 {rkkirby, hookerc}@sccsc.edu
Abstract - Young women in Ethiopia are victims of female genital mutilation. There are three different types of female genital mutilation; Ethiopia practices the most horrific kind. Some countries forbid this practice, unless it is done in a clinical setting, but it is still legal in Ethiopia. It is referred to as “circumcision.” Women are said to be impure and unfit for marriage if they have not been circumcised. After enduring the torture of female circumcision, some women have a lifetime of adverse physical effects from the procedure. In some countries, groups are trying to educate people to perform the procedure under sterile conditions.
Keywords — Female, mutilation, Ethiopia
INTRODUCTION
Today, there are at least 130 million victims of female genital mutilation. Some eight to ten million of these occur in the Middle East and Africa. In addition, there are thousands of victims in the United States[1]. Laws are in place in Kenya and other areas of Africa that make this practice illegal; however, in Ethiopia the practice is still legal. Males predominantly rule Ethiopia while women and children have very few rights. When a girl is born in Ethiopia, she represents a dowry for her family. Her father prearranges her marriage. In many cases, she must marry someone that is 20-30 years older than she is. Female genital mutilation is a ritual that takes place before marriage. Women are said to be impure and unfit for marriage unless they have been circumcised[2]. This female circumcision or female genital mutilation is a violation of human rights and in Ethiopia; however, this practice is still legal. This practice is one of the most horrifying examples of a violation of a woman’s human rights.
SECTION TWO
Female genital mutilation involves the cutting of female genitalia to reduce a woman’s sexual enjoyment. There are three main types of female genital circumcision. Type I, also referred to as Sunna circumcision, involves the removal of the tip of the clitoris. 80% of all incidents are done using this method. Type II involves the removal of all of the clitoris and scraping away the parts of the labia majora and minora. Type II is mainly done in areas where infibulation is discouraged. Type III includes infibulation, which includes the complete removal of the clitoris, labia majora and minora, and the sewing of the sides and vulva with thorns or some other suturing material. A very small opening is left for passing urine and menstrual fluids. Infibulation is widely used in the areas of Ethiopia, Kenya and Djibouti. It is also used throughout the Nile Valley, Southern Egypt, and along the red sea. Type III is considered to be the most brutal form of female genital mutilation[3].
The reasons for female genital mutilation are complex. It is important to note that female genital mutilation or female circumcision is not a religious practice, but more a cultural practice. Jews, Christians, Muslims, and members of other religions, practice female genital mutilation. In Ethiopia, none of these religions requires the practice of female genital mutilation. Female circumcision has been referred to as the “coming-of-age ritual”[4]. Others believe the female genitalia will continue to grow, becoming a grotesque penislike organ dangling between a woman’s legs[4]. However, the main reason for this culture ritual is to ensure purity. An uncircumcised female is considered unclean and impure. Female genital mutilation is a ritual performed on female children between the ages of four and twelve[4]. Often times the
March 27th, 2009
Sponsors: Stäubli, Spartanburg Regional Healthcare System, EPSCoR/IDeA RS grant. 35
girls are held with such force that if they struggle to escape, they end up breaking their own bones[5].
One of the most horrifying examples is of a young six-year-old child, Aisha Majid. Early one morning her mother told her they were going to visit a sick relative. They arrived at a red brick house, which the young child did not recognize. By the time the child realized where she was, it was too late. Young Aisha tried to escape, but was subdued by her mother and aunt. Aisha referred to the midwife performing the circumcision as the cruelest person she had ever seen. Aisha still remembers catching a glimpse of the razor that the midwife used. It was wrapped in a purple envelope with crocodiles drawn on it. The midwife instructed Aisha to lie down on a bed made of ropes. The bed had a hole in the middle of it. Aisha’s mother and aunt held her down as the midwife started to cut her without anesthetics. There was nothing to ease the pain and Aisha had already screamed until she had no voice left. Aisha was told to be brave that crying would be a disgrace to her father. Not only did Aisha endure the pain of having her female genitalia being cut and scraped away, the midwife used hot scalding water to stop the bleeding. The midwife then used thorns to suture Aisha back together. Aisha did not eat or drink for days after the procedure[6].
CONCLUSIONS This story is repeated millions of times each year. Some girls endure the torture and then have a lifetime of effects, including chronic pelvic pain and urinary-tract infections, extreme pain during intercourse, back pain, kidney damage, severe uterine cramping, complications during pregnancy and childbirth, and even death[6]. Female genital mutilation is one of the most widespread tortures in the world. Some eighty million girls find themselves victims of this trauma. This number increases every year[7]. Aisha
Majid and women like her are trying to educate people about the horrific dangers of performing this ritual. Still, education will take time and the people of Ethiopia will be hard to convince. This is the only way of life that they know and changing their cultural rituals will be hard. One suggestion for now might be to have a licensed professional perform these procedures under sterile conditions with the use of anesthesia.
REFERENCES [1] J. Carroll. “Circumcision of young girls violates their
rights.” Do children have rights?. Jamuna Carroll. Detroit: Greenhaven. 2006 Opposing Viewpoints Resource Center. Gale. Spartanburg Community Coll. Lib. 12 Oct 2008 <http://find.galegroup.com/ips/start.do?prodid=IPS>
[2] M. Barre. “Wounds that never heal.” Essence 26 (March 1996) 54.General Onefile. Gale. Spartanburg Community Coll. Lib. 12 Oct. 2008 <http://find.ga legroup.com/ips/start.do?prodid=IPS>.
[3] J. Carroll. “Circumcision of young girls violates their rights.” Do children have rights?. Jamuna Carroll. Detroit: Greenhaven. 2006 Opposing Viewpoints Resource Center. Gale. Spartanburg Community Coll. Lib. 12 Oct 2008 <http://find.galegroup.com/ips/ start.do?prodid=IPS>
[4] R. Abusharaf. “Unmasking the tradition of female circumcision.” Contemporary Issues Companion: Woman’s Rights. Shasta Gaughen. San Diego: Greenhaven 2003. Opposing Viewpoints Resource Center. Gale Spartanburg Community Coll. Lib. 12 Oct 2008 <http://find galegroup.com/lps/start.do ?prodid=ips>.
[5] C. Walsh. “Freedom from FGM: female genital mutilation violently robs girls of their physical and emotional integrity. And there is something you can do to stop it. (Female Genital Mutilation).” Mothering 140. (Jan-Feb 2007) 38. General OneFile. Gale. Spartanburg Community Coll. Lib. 12 Oct 2008 <http://find. galegroup.com/ips/start.do?prodid=IPS>
[6] R. Abusharaf. “Unmasking the tradition of female circumcision.” Contemporary Issues Companion: Woman’s Rights. Shasta Gaughen. San Diego: Greenhaven 2003. Opposing Viewpoints Resource Center. Gale Spartanburg Community Coll.Lib. 12 Oct 2008 <http://find galegroup.com/lps/start.do? prodid=ips>.
[7] “NCTPE: National committee on traditional practices in ethiopia.” WIN 21. (Wntr 1995) 34. General OneFile. Gale.Spartanburg Community Coll. Lib. 12 Oct. 2008 <http://find.galegroup.com/ips/start.do? prodid=IPS>

Fifth Annual SC Upstate Research Symposium
36 Sponsors: Stäubli, Spartanburg Regional Healthcare System, EPSCoR/IDeA RS grant.
Child Soldiers in Burma Sam Karns and Carolyn
English Department Spartanburg Community College
523 Chesnee Hwy, Gaffney, SC 29341 [email protected]
Abstract – Burma, a country located in Southeastern Asia, has had a long history of turmoil. After winning its independence from Britain’s Indian Empire, a junta forcefully took over the country and has controlled it since. Refusals by the junta to liberalize the government have kept the country in poverty – an issue that inevitably led to the problem of poor children being recruited by the army. As a result, Burmese children well under the age of eighteen are forced to fight and commit atrocities that will physically and mentally scar them for the rest of their lives. Keywords – Burma, Child Soldiers, Abuse
INTRODUCTION Burma is a country in Southeastern Asia bordered by the Bay of Bengal, Bangladesh, and Thailand. The country won its independence from Britain’s Indian Empire in 1937 and has been run by a military junta since that time. Due to mismanagement by the junta and refusal to liberalize their system of government, Burma’s economy has been dwindling. Further contributing to the country’s less than desirable economic status is the government’s hostile attitude towards democracy exemplified in their attacks on pro-democracy demonstrators. All of these factors keep the majority of Burma in a perpetual state of poverty, causing children with nothing else to turn to to join, either voluntarily or involuntarily, the army[1]. This issue of child soldiers in Burma is a most unfortunate situation and is a major violation to children’s rights.
SECTION TWO Burma’s army forces unwilling children into enlisting, many of whom are well under the age of eighteen. In the Burmese military, which consists of 350,000 people, about twenty percent of those enlisted are under the age of eighteen[2]. While the age of eighteen does not seem like a terribly unreasonable age, Burma delves lower to ages as low as eight for being eligible for the military[3]. In fact, the age of the children is not what concerns recruitment officers; instead, the children who “[stand] as tall as a rifle [are] often deemed eligible for military service”[4]. The children that are
recruited are often poor and separated from their family and are picked up at public places by military personnel who are rewarded for bringing in new soldiers[2]. When it comes to age in the Burmese army, morals do not play a role in deciding who is too young to enlist.
While in the Burmese army, child soldiers are subjected to various kinds of atrocities. When approached and told to join the military, children who refuse are put in jail and continually beaten until they agree to join[2]. Other, grimmer ways of persuading children to enlist are also used such as cutting off the lips and ears of those that refuse[4]. To make sure that the children remain loyal to the army, many officers force the new recruits to kill their own families so they will have no incentive to return home[3]. Training of the soldiers often includes what is known as “the ram” which involves the children rolling almost nude on a stony surface while being kicked by officers[4]. Also included in training are long runs while carrying heavy machine guns – no easy task for the younger soldiers who can barely lift the guns[5]. In battle, children are given numbing drugs to dull their pain and fear and forced to go on suicide missions[4]. At other times they are told to walk through questionable fields and become human land mine “detectors”[4]. Burmese army officers choose adolescents for such terrible tasks because they are too young to refuse or comprehend what they are doing[3].
Some children either escape or are relieved of their military duty and go on to tell their horrific tales of being in the army. Sai Seng of Burma describes his experience of watching his friend, who unsuccessfully tried to escape, being beaten with a bamboo stick by the entire training camp[5]. Seng recalls his friend “being bloody because sometimes the sticks broke when they hit him[5]. His friend died the same night after officers coldly “laid him on the cement floor without a mat” and let him bleed profusely without treatment[5]. Seng witnessed horrible events that no one should ever be subjected to – especially not children.

March 27th, 2009
Sponsors: Stäubli, Spartanburg Regional Healthcare System, EPSCoR/IDeA RS grant. 37
CONCLUSION
Enlisting children under the age of eighteen in the Burmese army is a serious issue that should not be overlooked. Beyond the fact that this practice is morally wrong, Burma is ruining its chance at having a peaceful future. By placing children on the frontlines of war, Burma is subjecting them to extreme brutality as well as to a culture that promotes senseless killing. These children, assuming they survive their military service, are the same people who will grow up and take part in society – a society that will continue the cycle of militarization and violence[4]. For the country’s sake and for the rest of the world’s safety, some action should be taken immediately to stop Burma’s use of children in its army.
REFERENCES
[1] “Burma,” Central Intelligence Agency, https://www.cia.gov/library/publications/the-world-factbook/geos/bm.html.
[2] A. Kazmin. “Burma ‘Forcing Children into Army,’” General OneFile, Gale, Spartanburg Community Coll. Lib., http://find.galegroup.com.
[3] “Facts about Child Soldiers,” Human Rights Watch, http://hrw.org/campaigns/crp/fact_sheet.html.
[4] M. Wessells. “Child Soldiers: In Some Places, if You’re as Tall as a Rifle, You’re Old Enough to Carry One,” General Onefile, Gale, Spartanburg Community Coll. Lib., http://find.galegroup.com.
[5] “Sold to Be Soldiers: The Recruitment and Use of Child Soldiers in Burma,” Human Rights Watch, http://hrw.org/reports/2007/burma1007.
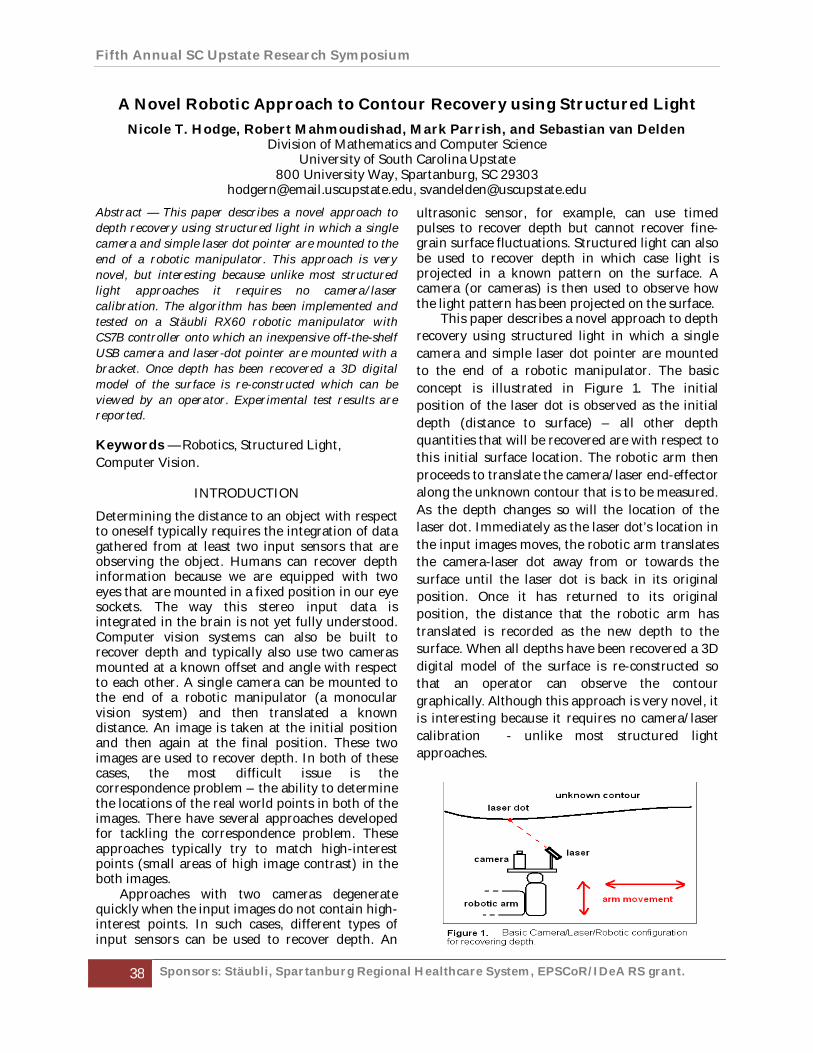
Fifth Annual SC Upstate Research Symposium
38 Sponsors: Stäubli, Spartanburg Regional Healthcare System, EPSCoR/IDeA RS grant.
A Novel Robotic Approach to Contour Recovery using Structured Light
Nicole T. Hodge, Robert Mahmoudishad, Mark Parrish, and Sebastian van Delden Division of Mathematics and Computer Science
University of South Carolina Upstate 800 University Way, Spartanburg, SC 29303
[email protected], [email protected]
Abstract — This paper describes a novel approach to depth recovery using structured light in which a single camera and simple laser dot pointer are mounted to the end of a robotic manipulator. This approach is very novel, but interesting because unlike most structured light approaches it requires no camera/laser calibration. The algorithm has been implemented and tested on a Stäubli RX60 robotic manipulator with CS7B controller onto which an inexpensive off-the-shelf USB camera and laser-dot pointer are mounted with a bracket. Once depth has been recovered a 3D digital model of the surface is re-constructed which can be viewed by an operator. Experimental test results are reported.
Keywords — Robotics, Structured Light, Computer Vision.
INTRODUCTION
Determining the distance to an object with respect to oneself typically requires the integration of data gathered from at least two input sensors that are observing the object. Humans can recover depth information because we are equipped with two eyes that are mounted in a fixed position in our eye sockets. The way this stereo input data is integrated in the brain is not yet fully understood. Computer vision systems can also be built to recover depth and typically also use two cameras mounted at a known offset and angle with respect to each other. A single camera can be mounted to the end of a robotic manipulator (a monocular vision system) and then translated a known distance. An image is taken at the initial position and then again at the final position. These two images are used to recover depth. In both of these cases, the most difficult issue is the correspondence problem – the ability to determine the locations of the real world points in both of the images. There have several approaches developed for tackling the correspondence problem. These approaches typically try to match high-interest points (small areas of high image contrast) in the both images.
Approaches with two cameras degenerate quickly when the input images do not contain high-interest points. In such cases, different types of input sensors can be used to recover depth. An
ultrasonic sensor, for example, can use timed pulses to recover depth but cannot recover fine-grain surface fluctuations. Structured light can also be used to recover depth in which case light is projected in a known pattern on the surface. A camera (or cameras) is then used to observe how the light pattern has been projected on the surface.
This paper describes a novel approach to depth recovery using structured light in which a single camera and simple laser dot pointer are mounted to the end of a robotic manipulator. The basic concept is illustrated in Figure 1. The initial position of the laser dot is observed as the initial depth (distance to surface) – all other depth quantities that will be recovered are with respect to this initial surface location. The robotic arm then proceeds to translate the camera/laser end-effector along the unknown contour that is to be measured. As the depth changes so will the location of the laser dot. Immediately as the laser dot’s location in the input images moves, the robotic arm translates the camera-laser dot away from or towards the surface until the laser dot is back in its original position. Once it has returned to its original position, the distance that the robotic arm has translated is recorded as the new depth to the surface. When all depths have been recovered a 3D digital model of the surface is re-constructed so that an operator can observe the contour graphically. Although this approach is very novel, it is interesting because it requires no camera/laser calibration - unlike most structured light approaches.
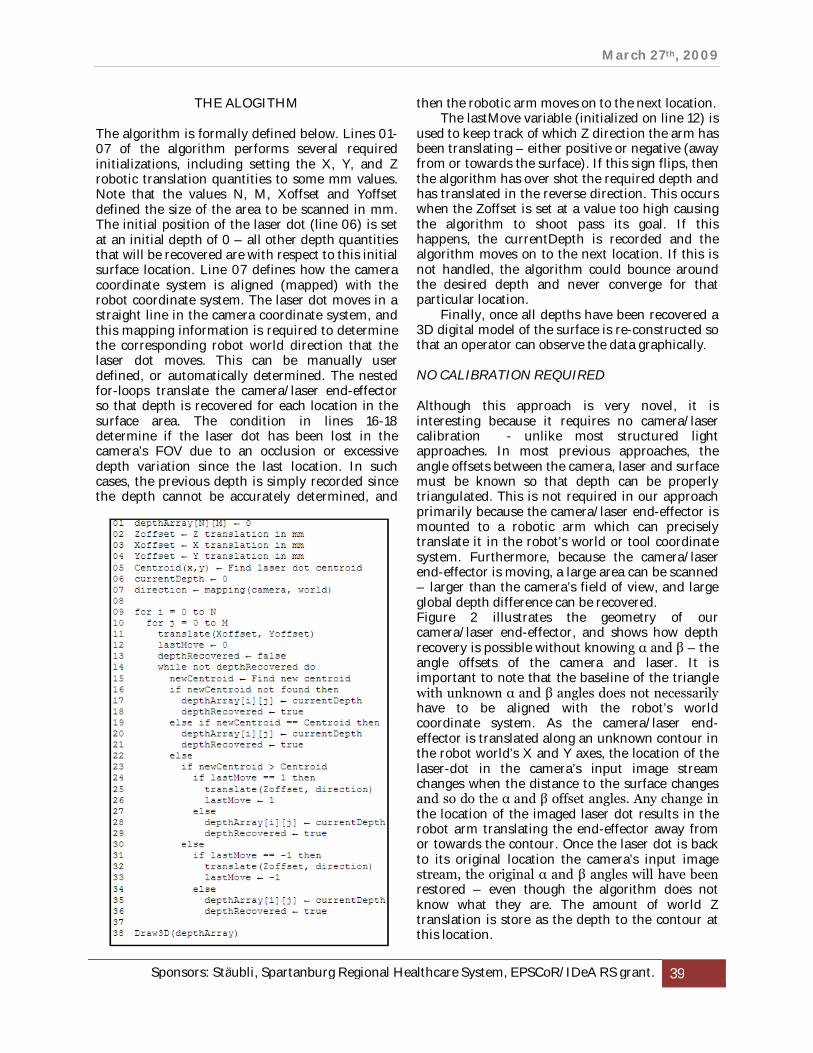
March 27th, 2009
Sponsors: Stäubli, Spartanburg Regional Healthcare System, EPSCoR/IDeA RS grant. 39
THE ALOGITHM
The algorithm is formally defined below. Lines 01-07 of the algorithm performs several required initializations, including setting the X, Y, and Z robotic translation quantities to some mm values. Note that the values N, M, Xoffset and Yoffset defined the size of the area to be scanned in mm. The initial position of the laser dot (line 06) is set at an initial depth of 0 – all other depth quantities that will be recovered are with respect to this initial surface location. Line 07 defines how the camera coordinate system is aligned (mapped) with the robot coordinate system. The laser dot moves in a straight line in the camera coordinate system, and this mapping information is required to determine the corresponding robot world direction that the laser dot moves. This can be manually user defined, or automatically determined. The nested for-loops translate the camera/laser end-effector so that depth is recovered for each location in the surface area. The condition in lines 16-18 determine if the laser dot has been lost in the camera’s FOV due to an occlusion or excessive depth variation since the last location. In such cases, the previous depth is simply recorded since the depth cannot be accurately determined, and
then the robotic arm moves on to the next location. The lastMove variable (initialized on line 12) is
used to keep track of which Z direction the arm has been translating – either positive or negative (away from or towards the surface). If this sign flips, then the algorithm has over shot the required depth and has translated in the reverse direction. This occurs when the Zoffset is set at a value too high causing the algorithm to shoot pass its goal. If this happens, the currentDepth is recorded and the algorithm moves on to the next location. If this is not handled, the algorithm could bounce around the desired depth and never converge for that particular location.
Finally, once all depths have been recovered a 3D digital model of the surface is re-constructed so that an operator can observe the data graphically.
NO CALIBRATION REQUIRED
Although this approach is very novel, it is interesting because it requires no camera/laser calibration - unlike most structured light approaches. In most previous approaches, the angle offsets between the camera, laser and surface must be known so that depth can be properly triangulated. This is not required in our approach primarily because the camera/laser end-effector is mounted to a robotic arm which can precisely translate it in the robot’s world or tool coordinate system. Furthermore, because the camera/laser end-effector is moving, a large area can be scanned – larger than the camera’s field of view, and large global depth difference can be recovered. Figure 2 illustrates the geometry of our camera/laser end-effector, and shows how depth recovery is possible without knowing α and β – the angle offsets of the camera and laser. It is important to note that the baseline of the triangle with unknown α and β angles does not necessarily have to be aligned with the robot’s world coordinate system. As the camera/laser end-effector is translated along an unknown contour in the robot world’s X and Y axes, the location of the laser-dot in the camera’s input image stream changes when the distance to the surface changes and so do the α and β offset angles. Any change in the location of the imaged laser dot results in the robot arm translating the end-effector away from or towards the contour. Once the laser dot is back to its original location the camera’s input image stream, the original α and β angles will have been restored – even though the algorithm does not know what they are. The amount of world Z translation is store as the depth to the contour at this location.
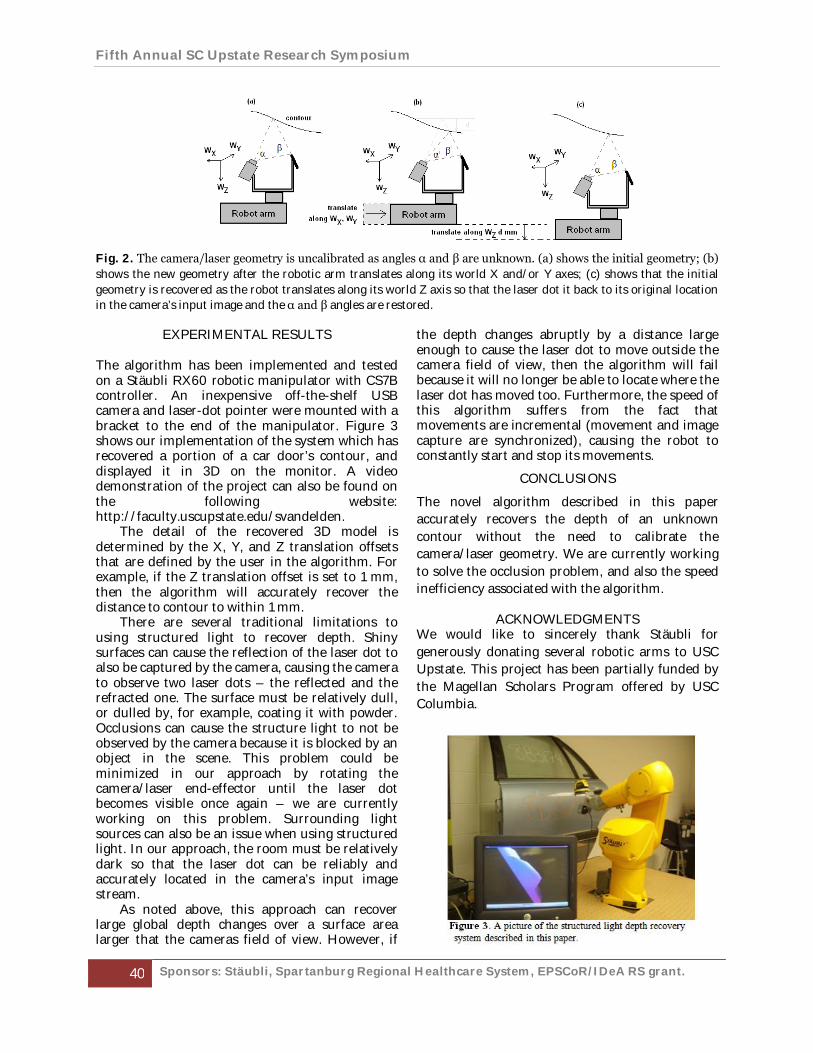
Fifth Annual SC Upstate Research Symposium
40 Sponsors: Stäubli, Spartanburg Regional Healthcare System, EPSCoR/IDeA RS grant.
Fig. 2. The camera/laser geometry is uncalibrated as angles α and β are unknown. (a) shows the initial geometry; (b) shows the new geometry after the robotic arm translates along its world X and/or Y axes; (c) shows that the initial geometry is recovered as the robot translates along its world Z axis so that the laser dot it back to its original location in the camera’s input image and the α and β angles are restored.
EXPERIMENTAL RESULTS
The algorithm has been implemented and tested on a Stäubli RX60 robotic manipulator with CS7B controller. An inexpensive off-the-shelf USB camera and laser-dot pointer were mounted with a bracket to the end of the manipulator. Figure 3 shows our implementation of the system which has recovered a portion of a car door’s contour, and displayed it in 3D on the monitor. A video demonstration of the project can also be found on the following website: http://faculty.uscupstate.edu/svandelden.
The detail of the recovered 3D model is determined by the X, Y, and Z translation offsets that are defined by the user in the algorithm. For example, if the Z translation offset is set to 1 mm, then the algorithm will accurately recover the distance to contour to within 1 mm.
There are several traditional limitations to using structured light to recover depth. Shiny surfaces can cause the reflection of the laser dot to also be captured by the camera, causing the camera to observe two laser dots – the reflected and the refracted one. The surface must be relatively dull, or dulled by, for example, coating it with powder. Occlusions can cause the structure light to not be observed by the camera because it is blocked by an object in the scene. This problem could be minimized in our approach by rotating the camera/laser end-effector until the laser dot becomes visible once again – we are currently working on this problem. Surrounding light sources can also be an issue when using structured light. In our approach, the room must be relatively dark so that the laser dot can be reliably and accurately located in the camera’s input image stream.
As noted above, this approach can recover large global depth changes over a surface area larger that the cameras field of view. However, if
the depth changes abruptly by a distance large enough to cause the laser dot to move outside the camera field of view, then the algorithm will fail because it will no longer be able to locate where the laser dot has moved too. Furthermore, the speed of this algorithm suffers from the fact that movements are incremental (movement and image capture are synchronized), causing the robot to constantly start and stop its movements.
CONCLUSIONS
The novel algorithm described in this paper accurately recovers the depth of an unknown contour without the need to calibrate the camera/laser geometry. We are currently working to solve the occlusion problem, and also the speed inefficiency associated with the algorithm.
ACKNOWLEDGMENTS We would like to sincerely thank Stäubli for generously donating several robotic arms to USC Upstate. This project has been partially funded by the Magellan Scholars Program offered by USC Columbia.
March 27th, 2009
Sponsors: Stäubli, Spartanburg Regional Healthcare System, EPSCoR/IDeA RS grant. 41
Multithreaded and Parallel Programming: Problems and the Environments and Tools to Handle Them
Andrew Stokes Physics and Computer Science
Presbyterian College 503 South Broad Street, Clinton, South Carolina 29325
Abstract — Multithreaded applications and parallel programming have been pushed greatly for increased efficiency, especially as multi-core and multiple processors become cheaper and more accessible. However, there are some complex issues that spring from these techniques including race conditions (where a program behaves differently if one piece of it runs faster than another), deadlocks (where multiple pieces of a program are unable to do anything as they wait on each other), and memory leak (where the longer an application runs the more resources it claims though it does so unnecessarily). To the programmer who is new to these application styles, some of these problems can be dealt with easily while others seem unavoidable. Many have trouble debugging their applications as the tools they have used up until this point no longer give them enough information and time is lost as they search through code with a fine toothed comb. To help combat these issues special development environments have been created and a handful of tools have been assembled. However, many programmers find themselves armed with discovering their own solutions and learning only through experience. Through the use of various applications, development environments, and literature, this paper surveys some of these problems and looks at some solutions from literature and from developers used in theory and in practice as well as some of the environments designed for the development of these applications.
Keywords —Parallel, Multithreaded, Deadlock
INTRODUCTION
As processors with multiple cores get cheaper the demand for applications that can be executed in a parallel fashion is increasing quickly, both in the private and public sector. Programmers are being asked to write complex applications that do many things simultaneously, both in dependent and independent fashions, that all work towards a common goal. These applications can be upwards of millions of lines long and being developed by hundreds of different developers. As any manager for a big convention can tell you this is a logistics nightmare and it is no easier when you are working on separate processes instead of people and, in fact, it can be much harder.
ANALYSIS With these increased complexities come more difficulties in debugging these applications. Several problems arise, or become much worse, due to the parallel nature of these applications. Deadlock (where an application locks up because multiple processes are waiting on each other), race conditions (where undesirable behaviour can arise when processes or threads run in an unexpected order), and memory leak (where an application unnecessarily claims resources) are all problems that parallel programmers face when they try to write their applications.
PROBLEMS Deadlock is a problem often found in parallel processing applications but it is also usually easily fixed. When a deadlock occurs the developer must look back at the application and see which resources became locked. This can sometimes be found by looking at when the deadlock occurred in an application but often deadlocks are much subtler than that. According to Herlihy and Shavit, “the heart of the problem with deadlocks is that no one really knows how to organize and maintain large systems that rely on locking. The association between locks and data is established mostly by convention.” In the past, companies often simply paid a dedicated team of highly skilled programmers to write the parts of applications that locked data so as to avoid deadlock. However, applications today are too large and need to be too scalable to do that affordably. [1]
Race conditions happen whenever it is assumed that an application’s commands will run in a certain order but unique circumstances cause them to run in a different order. Often this issue comes around because of scheduling in a multitasking system or because the developers write their code with a particular flow of commands in mind and something delays one of the threads or processes causing it to become out of step. These issues are usually fixed by locking down data in such a way that it must be done in the order imagined by the developer. However, this can cause the program to be inefficient and may not even be possible if the particulars of the data are not known beforehand. Also,
Fifth Annual SC Upstate Research Symposium
42 Sponsors: Stäubli, Spartanburg Regional Healthcare System, EPSCoR/IDeA RS grant.
one of the things that make race conditions so difficult to work with is that they may not occur very often or consistently. Common developer tricks, such as using command line output, can cause the race condition to not occur as it changes the timing of the data flow.
Memory leak is not just a problem for multi threaded applications but it is a lot more prevalent in them. Memory leak occurs when some memory is no longer needed but it is also not freed either. In programming languages that do not have a garbage collector, such as C, a programmer must be very careful to free any memory when it is no longer necessary. Even in languages that have a garbage collector memory leak can still be a problem if the garbage collector thinks that the referenced memory can still be useful. In a non-multithreaded application that runs for a relatively short time memory leak is not usually a problem as the applications resources are freed when it finishes. However, in multithreaded applications, the resources will not be freed until the entire application finishes, rather than the individual threads. According to Hughes and Hughes, the key difference between threads and processes is that processes have their own encapsulated address space while threads all share one address space. [2]
Memory leak can also be a problem in an application that is supposed to run for long periods of time, such as most server applications. Memory leak is hard to find or notice as well because the developer would have to find when a resource is no longer being used but is still being referenced. This can be nearly impossible in situations where the developer does not specifically know the particulars of the data they will be handling.
Several techniques have been developed to try and combat memory leak. One such technique is called Resource Acquisition Is Initialization (RAII). RAII says that a programmer should have their objects acquire their resources when they are initialized and they should always free them when the object is destroyed. This technique can greatly help reduce or eliminate memory leak but if the programmer is too zealous in destroying their objects or freeing their memory then they can create dangling pointers. TOOLS These problems are often hard to locate and some of them may not even show up except in very specific conditions. Several things have been done to try and overcome these problems including textbooks, development tools, and special working environments. These tools include IBM Rational Purify, Memwatch, Valgrind, and BoundsChecker. By looking at what conditions these tools can specifically detect, the methods in which they detect them, the performance
loss they cause, and the amount of information they give to the developer this paper surveys these tools and how they aid the developer with these tasks and problems.
BoundsChecker, for example, monitors all calls from API modules, COM objects, and software libraries. Because of this it can find memory out of bounds errors, memory leaks, and even detecting deadlocks. However, it is only for C++ and only usable with the Microsoft Visual C++ compiler, which limits its possible use quite a bit.
IBM Rational Purify inserts code into the application during the linking step of the program compilation. After a program has been linked to Purify, if there is an error Purify can give the location of the error and the memory address at which it occurred. Purify can detect memory leaks, array out of bounds errors, attempts to access unallocated memory as well as attempts to free memory that is not allocated. IBM Rational Purify may be run with Microsoft Visual Studio and gcc/g++ for Unix/Linux and is compatible with C/C++, Java, and .NET.
Valgrind is unusual as it could possibly be considered an environment rather than a tool. Valgrind reads the machine code of a compiled application and then translates the code into a processor neutral, single-static assignment language it calls Intermediate Representation (IR). It then allows tools, both native to the environment and created by third parties, to inspect and modify the code before the code is translated back into machine code and run in the Valgrind environment. This process causes a great deal of performance loss but it has a great deal of customizability. It can detect race conditions, memory leaks, and reading and writing to unallocated and uninitialized memory as well as having a heap and cache profiler. One other advantage of Valgrind is that because it reads an application from machine language the original code can be written using any language on any compiler. However, Valgrind itself has only been made available for Linux but it has unofficial ports to Unix as well as an experimental port to Wine. ENVIRONMENTS Along with these tools come development environments, such as nVidia’s CUDA environment. CUDA is a development environment for the C language (though there are several third party wrappers for other languages) that is designed to help developers write applications that utilize nVidia’s Graphical Processing Units, or GPUs. GPUs are particularly good at doing simultaneous data operations and as such are often used for large amounts of numerical calculations. According to Dr. Thomas Kurfess, BMW Chair of Manufacturing of ICAR, even the automotive industry is looking into using GPUs and CUDA for parallel data
March 27th, 2009
Sponsors: Stäubli, Spartanburg Regional Healthcare System, EPSCoR/IDeA RS grant. 43
processing (personal communication, February 10, 2009).
OpenMP is another environment for developing parallel processing applications in a shared memory environment. Since it is an API package it can be used in a variety of compilers for the C, C++, and Fortran languages. OpenMP is praised because it allows a developer to make an application multithreaded without having to make very many code changes. In essence, a developer can mark sets of code as being threads with a particular style of work (such as splitting up looping work, consecutive but independent work, and making sure a particular piece of code is only executed once). Also, if the code is compiled in a non-multithreading system then the compiler will ignore the lines of OpenMP code, meaning that only one version of the code needs to be written. OpenMP does have some drawbacks, however. It lacks a reliable error handler, which can be a bit problematic. Also, it only runs efficiently on shared memory systems.
OpenCL is another environment and it can be considered the new OpenMP. OpenCL is an environment for working with GPUs, CPUs, and multicore processors. It allows for both task based parallelism (which is usually what CPUs and multicore processors are used for) and data based parallelism (which is what GPUs are commonly used for). However, any discussion of OpenCL is merely theoretical as it will see its first usage in Mac OS 10.6 [3]
CONCLUSION
As more and more developers are being called upon to create multithreaded and parallel processing applications they are looking for more and more help in creating them faster and with less faults. Some new issues arise from the very nature of multithreaded and parallel processing and the resources that are available to the common developer can seem very limited. There are tools and environments available but their ability to detect these conditions are usually limited or come at a high price. It would seem that, despite the availability of these tools and environments, what developers use the most is simply experience. Each developer seems to have their own method and set of tools for avoiding, finding, and fixing these problems.
REFERENCES
[1] Herlihy, M., & Shavit, N. The Art of Multiprocessor Programming. Elsevier Inc, 2008
[2] Hughes, C., & Hughes, T. Professional Multicore
Programming: Design and Implementation for C++ Developers. Wiley Publishing Inc., 2008.
[3] Riegel, E. The Khronos Group Releases OpenCL 1.0
Specification. Khronos Press Releases. Retrieved February 09, 2009, from http://www.khronos.org/news/press/
Fifth Annual SC Upstate Research Symposium
44 Sponsors: Stäubli, Spartanburg Regional Healthcare System, EPSCoR/IDeA RS grant.
Mining Exceptions as Interesting Knowledge Stephen St. Peter1, Rick Chow2
Division of Mathematics and Computer University of South Carolina Upstate
800 University Way, Spartanburg, SC 29303 [email protected]
Abstract — Exceptions are interesting but unexpected knowledge that may exist in transaction databases. Suzuki et al. proposed a formal definition of exception as a rule triplet and an algorithm to mine for those exceptions using probabilities of item sets in the transactions [1, 2]. However, the algorithm does not address how some of those crucial probabilities can be computed effectively and efficiently. This research focuses on the implementation of an exception mining algorithm that combines the exception definitions by Suzuki and an item set discovery algorithm by Rácz et. al. [3]. The algorithm utilizes a prefix tree structure call a trie to facilitate the computations of certain probability based interestingness measures. The efficacy of the algorithm is tested using a national healthcare dataset.
Keywords — Data mining, exception mining, interestingness measures.
INTRODUCTION
Hilderman and Hamilton define data mining as “the efficient discovery of previously unknown, valid, novel, potentially useful, and understandable patterns in large databases” [4]. Current research has been attempting to define various interestingness measures which are designed to select and rank discovered patterns according to their potential interest to a target end user [1, 4, 5]. Some of the interestingness measures focus on the surprisingness of the knowledge – surprising patterns contradict a person’s previous knowledge or expectations. Patterns that are exceptions to previously discovered patterns can also be considered surprising. Exceptions are interesting because they challenge existing knowledge and encourage further research in new directions [1]. A real-world example of an exception discovered in car accident data is that the common knowledge general rule of [IF used_seat_belt = yes THEN injury = no] has a surprising exception of [IF used_seat_belt = yes AND passenger = child THEN injury = yes] [2].
Suzuki et. al. proposed a probability based exception algorithm that does not depend on
predefined knowledge. The algorithm requires the computations of probabilities of certain items, such as used_seat_belt and injury, or sets of items that occur in a dataset [1, 2]. However, Suzuki’s work does not include an algorithm to compute those probabilities effectively and efficiently. This research focuses on adopting an item set mining algorithm proposed by Rácz [3] to compute the probabilities of item sets and mine for exceptions as defined in Suzuki’s papers [1, 2].
DEFINING EXCEPTION RULES
In data mining, an association rule is a presentation of knowledge that is expressed as y → x where x and y are items in a dataset of transactions. The item y is called the antecedent and x is called the consequent. Let P(z) be the probability that an item z occurs in a transaction; in other words, it is the percentage of transactions in which z appears. Hence, the Support of a rule y → x is defined to be P(y) and the Confidence of the rule is defined to be P(x | y), which is the conditional probability of x occurring in a transaction given the presence of y. The Support of a rule measures the rule’s generality as P(y) must exceed a certain threshold θS. The higher the threshold θS, the more general the rule will be, meaning more transactions involving this rule are present in the transaction file. On the other hand, Confidence models the conditional probability P(x | y) to measure the accuracy of a rule. The higher the Confidence, the greater the chance that x will occur if y occurs. Similarly, Confidence is expected to exceed a threshold θF, i.e., P(x | y) > θF. A negative rule, u
v, is for measuring the lack of association between the items u and v. For a negative rule to be interesting, P(u) is expected to exceeds θS while P(v | u) is expected to be less than another threshold θI.
An exception rule is defined as a triplet of three rules: A common sense rule, a negative rule, and a reference rule. For example, the seatbelt exception can be presented as a special type of triplet as follow:

March 27th, 2009
Sponsors: Stäubli, Spartanburg Regional Healthcare System, EPSCoR/IDeA RS grant. 45
Table 1: Triplets with a Single Antecedent in the Exception Rule
Type 1 Type 2
Type 3
Type 4
Type 5
Type 6
Type 7
Type 8
Type 9
Type10 Type11
y → x
z x
y → z
y → x
z x
z → y
y → x
x z
z → y
y → x
y z
z → x
y → x
xy z
y → z
y → x
xz y
y → z
y → x
xy z
z → y
y → x
xz y
z → y
y → x
yz x
z → y
y → x
xy z
z → x
y → x
yz x
z → x
Common Sense Rule: seatbelt → no_injury Negative Rule: seatbelt, child no_injury Reference Rule: child → seatbelt In this paper, the common sense rules and reference rules are restricted to having just one antecedent while the negative rules are allowed to have one or two antecedents. Furthermore, all rules are allowed to have exactly one consequent. The simplicity of the triplets allows users to have better comprehension of the rule and hence, enables easier decision making based on the rule. Under the above constraints, eleven different types of triplets can be enumerated. If only one antecedent is allowed in the negative rule, four different types of triplets can be generated as shown in Table 1. If two antecedents are allowed in the negative rules, seven more triplets types (Type 5 to Type 11) can be enumerated.
For example, the triplet for the seatbelt example is a Type 9 triplet. In general, a triplet can be defined formally as a tuple t with three rules: t(y → x, α β, γ → δ), where
(α, β, γ, δ) ϵ {(z, x, y, z), (z, x, z, y), (x, z, z, y), (y, z, z, x), (xy, z, y, z), (xz, y, y, z), (xy, z, z, y), (xz, y, z, y), (yz, x, z, y), (xy, z, z, x), (yz, x, z, x)}
MINING INTERESTING EXCEPTION RULES
If a triplet t(y → x, α β, γ → δ) satisfies the constraints P(y) > θS, P(α) > θS, P(γ) > θS, P(x | y) > θF, P(δ | y) > θF, and P(β | α) < θI, where θS , θF , and θI are the thresholds for Support, Confidence, and negative rule, respectively, the exception rule triplet is considered to be interesting. However, the
calculation of the probabilities P(y), P(α), P(γ), P(x | y) , P(δ | y), and P(β | α) requires an effective and efficient algorithm since the item variables x, y, and z can be mapped to hundreds if not thousands of items. Rácz suggested the use of a prefix tree or trie for computing the probabilities of item sets [3]. Item sets of one, two, and three or more items are represented in a trie, which allow quick calculations of support and confidence. This research adopts Rácz’s algorithm, instead of Suzuki’s, as a framework to generate the items in a rule template.
TRIE Data Structure
Consider Figure 1 in which five transactions with items a, b, c, and d. Rácz’s trie is structured so that the root of the trie holds the number of transactions in the dataset. The nodes at the first level store the occurrences of single items. In this example, the single items a, b, c, and d occur 2, 3, 3, and 1 times in the transactions, respectively. Nodes at the second level store the occurrences of the 2-item sets. The item sets {a, b}, {a, c}, {b, c} and {c, d} occur 2, 1, 1, and 2 times, respectively. Likewise, the third level holds the occurrences of the only 3-item set {a b c}. Using this trie, the support and confidence of a rule can be calculated easily. For instance, Support for the rule c → d is calculated as P(c) = 3/5. The Confidence of the rule
is P(d | c) = P(c d) / P(c) = 32
5/35/2 .

Fifth Annual SC Upstate Research Symposium
46 Sponsors: Stäubli, Spartanburg Regional Healthcare System, EPSCoR/IDeA RS grant.
Transactions
Trie
1. a b c 2. c d 3. a b 4. b 5. c d
Fig. 1. Transactions and the Corresponding Trie Structure
EXPERIMENTAL RESULTS
This study utilizes the Healthcare Cost & Utilization Project (HCUP-3) database, which is the largest and most robust U.S. national inpatient database [6]. In this paper, a subset of patient records from 2004 is selected by restricting the patient’s age to 65 years or older, the main diagnosis to diabetes only, and the number of procedures to two or more. A data cleaning step is also applied to the dataset to remove records that have incomplete information or noisy data. The resulting dataset consists of 6765 transactions. In this experiment, the transactions include only the diagnosis codes for the patients’ complications and the length of stay labels, which indicate whether or not a patient stays 9 or more days in the hospital. With the following threshold settings, θS = 0.05, θF = 0.8, and θI = 0.2, five Type 4 rules are discovered and listed below.
The descriptions of the diagnosis codes are listed in Table 2. The rules are subject to further studies by healthcare professionals.
CONCLUSIONS
This research implements an exception mining algorithm using Rácz’s trie and Suzuki’s definition of exception rule triplets. The efficacy of the algorithm is tested against a healthcare dataset. Even though the algorithm is effective in finding some exceptions in the data set, the algorithm still needs further improvements to increase the number of antecedents and consequents in the rules for mining more complex exceptions. However, the increase number of items in a rule triplet also requires additional optimization techniques to reduce processing time.
Table 2. Descriptions of Diagnosis Codes
Diagnosis Codes Descriptions
2 Septicemia (except in labor)
157 Acute and unspecified renal failure
238 Complications of surgical procedures or medical care
Rule 1:
238 → ≥ 9 days
238 2
2 → ≥ 9 days
Rule 2:
2→ ≥ 9 days
2 238
238 → ≥ 9 days
Rule 3: 238→ ≥ 9 days
238 157
157 → ≥ 9 days
Rule 4:
157 → ≥ 9 days
157 238
238 → ≥ 9 days
Rule 5:
157 → ≥ 9 days
157 2
2 → ≥ 9 days
2 a 3 1 3 d c b
b 2 c 1 c 1
c 1
2 d
5

March 27th, 2009
Sponsors: Stäubli, Spartanburg Regional Healthcare System, EPSCoR/IDeA RS grant. 47
ACKNOWLEDGMENTS
This research is supported by the Student Research Assistant Program and Research Incentive Award from University of South Carolina Upstate and the Healthy Living Initiative Faculty Research Grant from the ReGenesis Community Health Center (RCHC).
REFERENCES
[1] E. Suzuki and J.M. Żytkow, “Unified algorithm for undirected discovery of exception rules: Research Articles,” Int. J. Intell. Syst. 20, 7, pp. 673-691, Jul. 2005.
[2] E. Suzuki, “Discovering interesting exception rules with rule pair,” In Proc. Workshop on Advances in Inductive Rule Learning, PKDD-2004, pp.163-178, 2004.
[3] Balázs Rácz, Ferenc Bodon, Lars Schmidt-Thieme, Benchmarking Frequent Itemset Mining Algorithms: from Measurement to Analysis, ACM SIGKDD Workshop on Open Source Data Mining Workshop (OSDM'05), in Bart Goethals and Siegfried Nijssen and Mohammed J. Zaki editors, pp. 36 - 45, Chicago, IL, USA. 2005.
[4] R.J. Hilderman and H.J. Hamilton. “Knowledge Discovery and Interestingness Measures: A Survey,” Technical Report, University of Regina, 1999.
[5] L. Geng and H.J. Hamilton, “Interestingness measures for data mining: A survey,” ACM Comput. Surv. 38, 3, Sept. 2006.
[6] M. Dowell, B. Rozell, D. Roth, H. Delugach, P. Chaloux, and J. Dowell, “Economic and Clinical Disparities in Hospitalized Patients with Type-2 Diabetes,” Journal of Nursing Scholarship, 36, pp. 66–72, 2004.
Fifth Annual SC Upstate Research Symposium
48 Sponsors: Stäubli, Spartanburg Regional Healthcare System, EPSCoR/IDeA RS grant.
Determinants of Information Technology Acceptance: A Review of Technology Acceptance Model
Bilquis Ferdousi
Business Technology Spartanburg Community College
800 Brisack Road, Spartanburg, SC 29303 [email protected]
Abstract — The expected productivity gains and organizational benefits delivered by IT cannot be realized unless IT is actually accepted and used in optimal level. Despite advances in computer hardware and software, the troubling problem of underutilized IT continues. For that reason, the mainstream IS research relentlessly attempts to understand and explain the determinants of IT acceptance. In such an effort, Davis (1989) developed Technology Acceptance Model (TAM), the most researched and widely used theory in IS literature to study the factors that affect people’s acceptance of IT. Davis proposed that Perceived Usefulness (PU) and Perceived Ease of Use (PEOU) of IT form people’s belief on IT and therefore, predict their attitude toward IT, which in turn predicts acceptance of IT. Thus, PU and PEOU determine the acceptance of an IT. Extensive research supports the notion that PU and PEOU are primary drivers of people’s acceptance of an IT. Nevertheless, the findings on TAM are mixed in terms of statistical significance, direction, and magnitude. The inconsistent results of empirical researches suggest that not all significant factors were explained in TAM. Further research revealed that additional factors have effect on people’s IT acceptance. Besides, the effects of PU and PEOU are not same in significance.
Keywords — Acceptance of Information Technology, Technology Acceptance Model, Perceived usefulness, Perceived ease of use.
INTRODUCTION
Use of IT has been demonstrated to be a key driver of organizational performance and organizations are making significant investments in IT [1]. However, if people do not use IT as anticipated, successful productivity gain from IT can be hard to achieve. Despite advances in computer hardware and software capabilities, the troubling problem of underutilized IT continues. The low use of installed IT has been identified as a major factor underlying the lackluster returns from organizational
investments in IT. The expected productivity gains and organizational benefits delivered by IT cannot be realized unless IT is actually accepted and used in optimal level. For that reason, the acceptance of IT has been a major focus of Information Systems (IS) research for more than two decades [1]. According to Compeau and Higgins [2], understanding the factors that influence people’s use of IT has been a goal of IS research since the mid-1970s. Since then, people’s IT acceptance has been a focal research topic in IS and is considered as “one of the most mature research areas in the contemporary IS literature” [3, p. 426].
TECHNOLOGY ACCEPTANCE MODEL
The mainstream IS research relentlessly attempts to understand and explain the determinants of IT acceptance [4]. In such an effort, Davis (1989) [5] developed his Technology Acceptance Model (TAM) to study the factors that affect people’s acceptance of IT. TAM, a refinement of Ajzen and Fishbern’s [6] Theory of Reasoned Action, provided a foundation for research on why people accept or reject IT. TAM is the most researched and widely used theory among several models in the IS literature to explain people’s acceptance of IT. Although prolific stream of research on acceptance of IT uses a variety of theoretical models, of all theories, the TAM is considered the most influential and commonly employed theory for explaining people’s use of IT. TAM still continues to be most widely applied theoretical model in the IS research field [7].
Davis in his TAM proposed that Perceived Usefulness (PU) and Perceived Ease of Use (PEOU) of IT form people’s belief on IT and therefore, predict their attitude toward IT, which in turn predicts acceptance of IT [8]. Thus, Davis explained, people’s intention to use an IT primarily is the product of a rational analysis of desirable perceived outcome, namely PU and PEOU of an IT, which finally determine the acceptance of that IT.
March 27th, 2009
Sponsors: Stäubli, Spartanburg Regional Healthcare System, EPSCoR/IDeA RS grant. 49
Thus, the constructs - PU and PEOU - are theoretical base of TAM.
The conclusions and implications drawn from Davis’ research have already been highly relevant in IT acceptance research and are providing important direction in investigation on this issue. In IS research, the TAM has been frequently used to analyze people’s intention and actual use of different IT [9]. PU and PEOU are important constructs and probably two of the most widely cited correlates of IT acceptance and usage [10]. Since its inception, the TAM has been validated with various applications in different studies and has become the most widely applied model on IT acceptance and usage [8]. Extensive research supports the notion that PU and PEOU are primary drivers of people’s intentions to adopt an IT. Results of numerous studies are consistent with these two factors to explain people’s IT acceptance and usage [11].
Nevertheless, the reported findings on TAM are mixed in terms of statistical significance, direction, and magnitude [8]. The inconsistent results of empirical researches suggest that not all significant factors were explained in TAM [9]. Consequently, it is important to know whether two aforementioned constructs in TAM are enough for complete explanation of people’s IT acceptance. It is also important to know if both constructs have same significance in predicting people’s IT acceptance.
CONSTRUCTS IN TAM NOT EXHAUSTIVE
TAM, which has been widely applied to a diverse set of technologies and users, allow only two core constructs - PU and PEOU [3]. Using only two constructs, it is assumed that when people intended to use an IT, they are free to use that without limitation. In the real world, there are many constraints, such as limited ability, time constraints, environmental or organizational limits, or unconscious habits, which limit users’ freedom to use an IT. Thus, it is obvious that the PU and PEOU are not only factors that can have effect on people’s use of an IT [12, 13]. The inclusion of more factors to explain people’s IT acceptance and usage based on findings in further studies lead to develop TAM2 or combine original TAM with other theoretical model or variables. EXTENTION OF TAM – TAM2 Davis (1989) defined Perceived Usefulness (PU) as “the degree to which a person believes that using a particular system would enhance his or her job performance” and Perceived Ease of Use (PEOU)
as “the degree to which a person believes that using a particular system would be free of effort.” (p. 320). But these perceptions may change with time as users gain first-hand experience with IT usage, which in turn, may change their subsequent IT usage behavior. It is difficult to tell whether people use an IT because of favorable perceived characteristics or whether favorable perception, in fact, emerged over the course of using the IT. Experience plays an important role, which was not explicitly included in the original TAM. Empirical evidences that show PEOU becomes non-significant with increased experience [12], and PU and prior use of an IT has a significant impact on actual use of that IT lead researchers to include experience, voluntariness, and gender as constructs in TAM2.
Like experience, voluntariness and gender issues were not explicitly included in TAM. TAM2 extended original TAM by including subjective norm as an additional predictor of intention to use an IT in the mandatory situation [14]. When an IT use is mandated, as it is in many organizations, the underline relationships of original TAM will be different. That is, when people must use a specific IT, the importance of their beliefs and attitudes as antecedents to the acceptance of IT is likely to be minimized. Users might not like to use an IT but they use it anyway because they are required to do so [15]. In addition, PU is more salient for men while PEOU is more salient for women [14]. Again, the effect of subjective norm is more salient for women in the early stages of experience [3].
In IT acceptance, TAM focused more on PU; even then, the length of that PU has not been addressed. PU can be of two distinct types – long-term usefulness and near-term usefulness. Perceived near-term usefulness has the most significant influence on people’s IT acceptance while perceived long-term usefulness has positive but lesser impact [8].
Extending the theoretical constructs, empirical researches found more factors such as force of habit, management support, trust and enjoyment, perceived compatibility and perceived fit have influence on people’s IT acceptance. Again, PEOU along with some other factors such as experience and frequency of use positively correlated with PU [11]. Further researches demonstrate that computer self-efficacy (CSE) is one of the individual factors consistently supported in IS literature as an important factor to predict people’s IT acceptance [18]. CSE implies that individuals who consider computers too complex and believe that they will never be able to control these computers will prefer to avoid them and are less likely to use them [16]. CSE explains considerable

Fifth Annual SC Upstate Research Symposium
50 Sponsors: Stäubli, Spartanburg Regional Healthcare System, EPSCoR/IDeA RS grant.
proportion of variance (48%) of PEOU; and CSE and PEOU together explain 50% of PU [8]. Therefore, understanding CSE is important for the successful implementation of IT in organizations [2].
USEFULNESS VS. EASE OF USE
Different researches found the applicability of Davis’ (1989) proposition about the role of Perceived Usefulness (PU) and Perceived Ease of Use (PEOU) in people’s acceptance of different IT [3]. However, while PU has been identified consistently in the literature as significant in people’s IT acceptance, the evidence for PEOU has been inconsistent [20]. Some studies suggest that PEOU does not have an effect on intention to use an IT [8], while others show that PEOU has significant effect on intention to use or actual use of IT [9, 3].
Most research found that PU has a strong persistent effect on individuals’ intention to use IT, and PEOU has a smaller effect [1]. Davis himself found that PU is significantly correlated with both self-reported current use and self-predicted future use of an IT. PEOU is also significantly correlated with current use and future use of IT but, PU has a significantly greater correlation with use of IT than does PEOU. Emphasizing on the greater influence of PU on people’s IT acceptance, Davis made a major conclusion, “perceived usefulness is a strong correlate of user acceptance and should not be ignored by those attempting to design or implement successful systems.” (p.334). Thus, Davis implied that the importance of PU should not be sacrificed for PEOU. It makes sense that user will not accept an IT that is easy to use but not useful. Rather they will accept an IT that is useful, even if that requires some degree of efforts to learn how to use that IT [19, 8]. Davis suggested that from a causal perspective “ease of use may be an antecedent to usefulness, rather than a parallel, direct determinant of usage.” (p.334). That is, PEOU affects PU, which in turn, influences the IT acceptance. Davis admitted that this intriguing interpretation, which conceptually explains that there might have causal influence of PEOU on PU, underscores the theoretical importance of PU. Obviously, this interpretation contradicts his conclusion that PU has stronger relationships with people’s IT acceptance, and PU has prominences over PEOU, the factor “overemphasized” by the human-computer interaction designers (5, p.334).
Admitting this contradiction, Davis left the issue for further research. Further research, consistent with Davis’ finding, found that PU is more influential than PEOU in driving people’s IT acceptance and is a more important predictor than
PEOU [19]. Researches demonstrate that there is strong correlation both between PU and IT acceptance and between PU and PEOU, but the direct relationship between PEOU and IT acceptance is weak [8]. Again, although PU has a direct positive relationship with IT acceptance and PEOU has an indirect positive relationship (via PU) with IT acceptance, PEOU has no significant direct relationship with people’s intention to use IT [10]. While some researchers found that PEOU has no relationship with PU and PU has direct relationship with IT acceptance [19], some found that PEOU has a positive impact on PU of an IT. Again, PEOU affects PU, which in turn, has an influence on duration and frequency of use of the IT [20]. Davis emphasized on further research to address the possibility of halo effect between the PEOU, PU, and acceptance of IT.
CONCLUSIONS
IS researchers have investigated and replicated TAM, and agreed that it is valid in predicting people’s acceptance of various IT. TAM is a representative model in the stream of IS research, which has experienced improvements and refinement over the years, and is considered the most well known model. Yet the existing empirical findings on TAM are neither consistent nor conclusive, and provide relatively low explanation. As a result, researchers have started to question the generalizability of TAM [14]. Scholars argued that despite the plethora of literature on TAM, the empirical researches have so far produced significantly mixed and inconclusive results. Although they are not uncommon in social sciences where human behavior is difficult and complex to explain, the mixed findings not only undermine the precision of TAM, but also complicate efforts for IT practitioners and researchers to identify the antecedents to people’s acceptance of IT [8].
According to Davis, Bagozzi, and Warshaw [21], TAM was developed
to provide an explanation of the determinants of computer acceptance that is generally capable of explaining user behavior across a broad range of end-user computing technologies and user populations, while at the same time being both parsimonious and theoretically justified. (p. 985)
TAM is often employed because of its parsimony and robustness, allowing the researcher to explain considerable variance of IT acceptance while using

March 27th, 2009
Sponsors: Stäubli, Spartanburg Regional Healthcare System, EPSCoR/IDeA RS grant. 51
only two constructs, PU and PEOU [10]. However, although parsimony is an important consideration in scientific research, people’s use of new IT is likely to differ depending on the context within which such IT is encountered. Complete understanding of people’s use of IT requires a model that includes different factors that affect the IT acceptance process across many different contexts [22]. The PU and PEOU constructs are useful to explain IT acceptance, but has to be integrated into a broader model, which would include factors related to both human and social change process [9].
REFERENCES
[1] A. Bhattacherjee, and G. Premkumar. “Understanding changes in belief and attitude toward information technology usage: A theoretical model and longitudinal test,” MIS Quarterly, vol. 28(2), pp 229-254, 2004.
[2] D. R. Compeau, and C. A. Higgins. “Computer self-efficacy: Development of a measure and initial test,” MIS Quarterly, vol. 19, pp 189-211, 1995.
[3] V. Venkatesh, G. M. Morris, B. G. Davis, and D. F. Davis. “User acceptance of information technology: Toward a unified view,” MIS Quarterly, vol. 27(3), pp 425-478, 2003.
[4] H. M. Selim. “An empirical investigation of student acceptance of course websites,” Computers & Education, vol. 40, pp 343-360, 2003.
[5] F. D. Davis. “Perceived usefulness, perceived ease of use, and user acceptance of information technology,” MIS Quarterly, vol. 13(3), pp 319-340, 1989.
[6] I. Ajzen, and M. Fishbein. “Understanding attitudes and predicting social behavior,” Prentice-Hall publishers, 1980.
[7] E.M. van, Raaij, and J. J. L. Schepers. “The acceptance and use of a virtual learning environment in China,” Computers and Education, vol. 50(3), pp 838-852, 2008.
[8] Q. Ma, and L. Liu. “The technology acceptance model: A meta-analysis of empirical findings.” Journal of Organizational and End User Computing, vol. 16(1), pp 59-72, 2004.
[9] P. Legris, J. Ingham, and P. Collerette. “Why do people use information technology? A critical review of the technology acceptance model,” Information & Management, vol. 40, pp 191-204, 2003.
[10] O. N. Ndubisi, K. O. Gupta, and C. G. Ndubisi. “The moguls’ model of computing: Integrating the moderating impact of users’ persona into the technology acceptance model,” Journal of Global Information Technology Management, vol. 8(1), pp 27-47, 2005.
[11] M. Zviran, N. Pliskin, and R. Levin. “Measuring user satisfaction and perceived usefulness in the ERP
context,” The Journal of Computer Information Systems, vol. 45(3), pp 43-52, 2005.
[12] R. Agarwal, and J. Prasad. “Is individual differences germane to the acceptance of new information technologies?” Decision Science, vol. 30(2), pp 361-391, 1997.
[13] B. Szajna. “Empirical evaluation of the revised technology acceptance model,” Management Science, vol. 42(1), pp 85-92, 1996.
[14] V. Venkatesh, and M. G. Morris. “Why don't men ever stop to ask for directions? Gender, social influence, and their role in technology acceptance and usage behavior,” MIS Quarterly, vol. 24(1), pp 115-139, 2000.
[15] A. S. Brown, P. A. Massey, M. M. Weiss, and R. J. Burkman. “Do I really have to? User acceptance mandated technology,” European Journal of Information Systems, vol. 11, pp 283-295, 2002.
[16]Hasan, B. “The influence of specific computer experiences on computer self efficacy beliefs,” Computers in Human Behavior, vol. 19, pp 443-450, 2003.
[17] M. Igbaria, and J. Ivari. “The effects of self-efficacy on computer usage,” Omega - International Journal of Management Science, vol. 23(6), pp 587-605, 1995.
[18] M. I. Klopping, and E. McKinney. “Extending the technology acceptance model and the task-technology fit model,” Information Technology, Learning, and Performance Journal, vol. 22(1), pp 35-48, 2004.
[19] M. Koufaris. “Applying the technology acceptance model and flow theory to
online consumer behavior,” Information Systems Research, vol. 13(2), pp 205-224, 2002.
[20]D. McCloskey. “Evaluating electronic commerce acceptance with the technology acceptance model,” The Journal of Computer Information Systems, vol. 44(2), pp 49-57, 2003.
[21] F. D. Davis, R. P. Bagozzi, and P. R. Warshaw. “User acceptance of computer technology: A comparison of two theoretical models,” Management Science, vol. 35(8), pp 982-1003, 1989.
[22] R. C. Plouffe, S. J. Hulland, and M. Vandenbosch. “Research report: Richness
versus parsimony in modeling technology adoption decisions—understanding merchant adoption of a smart card-based payment system,” Information Systems Research, vol. 12(2), pp 208-220, 2001.
Fifth Annual SC Upstate Research Symposium
52 Sponsors: Stäubli, Spartanburg Regional Healthcare System, EPSCoR/IDeA RS grant.
Mathematical Modeling of non-Newtonian Peristaltic Flows Muhammad Hameed
Division of Mathematics & Computer Science University of South Carolina Upstate
800 University Way, Spartanburg, SC 29303 [email protected]
Abstract — We have analyzed the peristaltic transport of a heat conducting non-Newtonian fluid through an axi-symmetric tube and in a planner channel. Governing equations for the flow system are derived using longwave length approximations on the walls of the boundary. Analytical results are obtained using regular perturbation analysis. Numerical computations are performed and the numerical results are compared with the analytical solutions to determine the validity of results. Various quantities of interest are evaluated and discussed. The expressions for the pressure rise, frictional force and the relation between the flow rate and pressure gradient are obtained.
Keywords — List no more than 5 keywords here.
INTRODUCTION
Peristalsis is a mechanism of pumping fluids in cylinederical tubes and channels when a progressive wave of contraction or expansion propagates along the walls of a distensible tube containing liquids. In general, it includes propulsive and mixing movements and pumps the fluid against pressure rise. Physiologically, peristaltic action is an inherent property of smooth muscle contraction. It is an automatic and vital process that drives the urine from the kidney to the bladder, food through the digestive tract, blood in small vessels and many other situations.
Mathematical and computer modeling of the peristaltic motion has attracted the attention of many researchers starting with the work of Latham [1] and Shapiro [2]. Since then, several investigators have contributed to the study of peristaltic motion in both mechanical and physiological situations. Provost & Schwarz [3] did a theoretical investigation to study the viscous effects in peristaltic pumping and assumed that the flow is free of interial effects. Later on, Pozrikidis [4] extended the idea and used boundary integral method to study the peristaltic flow in a channel for Stokes flow and studied the relationship of molecular convective-transport to the mean pressure gradient. After the pioneering work of the above researchers, studies of peristaltic flows in different flow geometries have been reported analytically, numerically and experimentally by a number of researchers. In most of the studies, the
fluid is assumed to be viscous and Newtonian, mostly for mathematical simplicity. This assumption is not valid everywhere because most of the industrial and biological fluids are non-Newtonian in nature.
Non-Newtonian fluids are of great interest because of their practical importance in engineering and industry. The classical Navier-Stokes equations have been proved inadequate to describe and capture the characteristics of complex rheological fluids as well as polymer solutions. These kinds of fluids are generally known as non-Newtonian fluids. Most of the biological and industrial fluids are non-Newtonian in nature. Few examples of such fluids are blood, tomato ketchup, honey, mud, plastics and polymer solutions. The inadequacy of the classical theories to describe these complex fluids has led to the development of different new theories to study non-Newtonian fluids. There are different models which have been proposed to describe the non-Newtonian flow behavior. Among these, the fluids of differential type [5] have received considerable attention. Fluid of second grade is a subclass of fluids of differential type, which has been studied successfully in various types of flow situations and is known to capture the non-Newtonian affects such as shear thinning or shear thinking.
MATHEMATICAL FORMULATION
We consider the motion of a second order fluid through a two-dimensional channel of width 2L with flexible wall. Using Cartesian coordinates, we take X along the centerline and Y normal to the channel. The components of velocity V are longitudinal velocity U and transverse velocity V. We assume an infinite train of sinusoidal waves which progress with velocity c along the walls of the channel.
The height of the wall for peristaltic flow is defined by
2( , ) sin ( ),h x t a b X ct
where b is the amplitude of the wave, a is the mean half width of the channel and represents the

March 27th, 2009
Sponsors: Stäubli, Spartanburg Regional Healthcare System, EPSCoR/IDeA RS grant. 53
wavelength. Furthermore, we assume that there is no longitudinal motion of the wall.
The basic governing equations for the flow of a second order non-Newtonian fluid neglecting thermal effects are the field equations, known as the continuity equation and the momentum equation given as
2
0
,p
VdV f divdt
dTC k T grad Vdt
where represents the density, V represents the
velocity vector, T is the temperature, pC is the
specific heat and f represents the body force per unit mass. The constitutive equation for the extra stress tensor is give as
21 1 2 2 1 .pI A A A
The Rivilin-Erickson tensors 1A , 2A are defined as
1
2 1 1 1 1
( ) ( )
( ) ( ) .
T
Tt
A gradV gradVA A V grad A A gradV A gradV
The above equations are non-dimensionalized and solved using a regular perturbation technique
based on the small parameter 2 a , which is the
ratio of mean half width a to the wavelength .
CONCLUSIONS Considering the importance of heat transfer in peristalsis and keeping in mind the sensitivity of liquid viscosity to temperature, an attempt is made to study the effect of heat transfer on peristaltic flow of a non-Newtonian fluid. The non-dimensional problem is formulated in the wave frame under the long wavelength limits with finite Reynolds number. By using perturbation expansion method, asymptotic solutions for velocity and temperature fields are obtained
accurate to 2 2 2( ) ( Re )o and o . The results for the viscous case become a special case of our work. Furthermore, to check the validity of analytical
solutions, we have computed numerical solutions using finite difference scheme to find the flow and energy fields. In order to study the quantitative effects, graphical results are obtained and discussed for different physical quantities. The results are analyzed for an adequate range of influential physical parameters.
REFERENCES [1] T. W. Latham, “Fluid motions in a peristaltic pump,”
M.S. Thesis, MIT, Cambridge, MA, 1966. [2] A. H. Shapiro, M.Y. Jaffrin and S. L. Weinberg,
Peristaltic pumping with long wavelengthA t low Reynolds number. J. Fluid Mech. Vol. 37, pp 799-825, 1969.
[3] A. M. Provost, W. H. Schwarz: A theoretical study of viscous effects in peristaltic pumping, J. Fluid. Mech. Vol. 279, pp. 177–195, 1994.
[4] C. A. Pozrikidis, C. A study of peristaltic flow. J. of Fluid Mechanics, vol. 180 pp 515- 527, 1987.
[5] C. Truesdell, W. Noll, “The non-linear fields theories of Mechanics (3 Ed.)”, Springer, 2004.
Fifth Annual SC Upstate Research Symposium
54 Sponsors: Stäubli, Spartanburg Regional Healthcare System, EPSCoR/IDeA RS grant.
Investigation of the Role of Promoter Methylation and Histone Modification in the Down-regulation of the Colon Tumor Suppressor, DRA
Derek L. Griffith and Jeannie M. Chapman Division of Natural Sciences and Engineering
University of South Carolina Upstate 800 University Way, Spartanburg, SC 29303
[email protected], [email protected]
Abstract — Expression of the tumor suppressor, DRA, is aberrantly lost in tumors of the colon. The mechanism by which this occurs has not been investigated. It is known that loss of expression is not due to gene deletion or major chromosomal rearrangements. Since DRA mRNA cannot be detected in colon cancer tumors, down-regulation is likely at the transcriptional level. The goal of this project was to determine if either histone modification or promoter methylation is responsible for loss of DRA expression. Both of these processes are common mechanisms for loss of tumor suppressor expression. Re-expression of DRA mRNA was assessed by RT-PCR in two colon adenocarcinoma cell lines, DLD-1 and Caco-2, after treatment with inhibitors of histone deacetylation and/or promoter methylation.
Keywords — DRA, tumor suppressor, methylation, histone deacetylation, colorectal cancer
INTRODUCTION
There are two main types of genes that play a role in cancer progression—oncogenes and tumor suppressors. Oncogenes promote cell growth, so their overexpression in cells can lead to tumor formation. Tumor suppressors, as their name suggests, prevent cell growth. Cells that lose expression of these types of genes are susceptible to tumor formation. DRA, for down-regulated in adenoma, is a putative tumor suppressor that was originally identified in a search for genes that were underexpressed in colon cancer [1]. Expression of DRA is either lowered or absent altogether in tumors from colorectal cancer patients as well as colorectal cancer cell lines maintained in the laboratory [1, 2]. It has been demonstrated that restoring DRA expression can suppress the growth of colon cancer cells [2]. Additionally, mice that have been genetically engineered not to express DRA (DRA -/- mice) exhibit an increase in cell proliferation in the colon, suggesting that DRA truly regulates cell proliferation in vivo [3]. The mechanism by which DRA expression is lost in colorectal cancer is not understood and has
not been investigated. It is not likely due to deletion of the gene since DRA DNA (but not RNA or protein) has been detected in colon carcinoma cell lines [1]. Rather, it is more likely that one or more elements associated with the promoter of DRA are altered or missing in colorectal cancer. Since there is evidence that DRA plays a role in controlling cellular proliferation in the colon [3], and, since down-regulation of this gene is observed in colorectal cancer [1], understanding the mechanism of down-regulation may be an important step in understanding the overall molecular basis of this form of cancer. The current study is an investigation into the mechanism by which DRA is down-regulated in two colon cancer cell lines, DLD-1 and Caco-2. Two common mechanisms of gene down-regulation, promoter hypermethylation and histone deacetylation, are investigated.
MATERIALS AND METHODS
CELL CULTURE The human colorectal cancer cell lines DLD-1 and Caco-2 were grown in RPMI 1640 and DMEM supplemented with 10% and 20% fetal bovine serum, respectively. Both media were supplemented with 100 units/mL penicillin, 100 g/mL streptomycin, and 292 g/mL glutamine. Incubation took place at 37˚C in a 5% CO2
atmosphere. Cells were allowed to reach 75-80% confluency before being subcultured. Cell counts were carried out using a hemacytometer. As a positive control for DRA mRNA expression [4], Caco-2 cells were allowed to grow at the post-confluent state for 12 days before RNA harvest. DRUG TREATMENTS Cells were seeded on day 0 in 6-well plates at ~50,000 cells per well in 2 mL of the appropriate medium. Drug treatments were performed on days 1, 3, and 5. Cells were treated with 2 µM 5-aza-2-deoxycytidine (azaC), 2 mM sodium butyrate, or a combination of both. One well in each plate

March 27th, 2009
Sponsors: Stäubli, Spartanburg Regional Healthcare System, EPSCoR/IDeA RS grant. 55
received no drug treatment and served as a negative control. RNA HARVEST RNA harvests were performed on days 2, 4, and 6 using the RNA isolation reagent RNA STAT-60 according to the manufacturer’s protocol. In brief, medium was aspirated and 500 µL of RNA STAT-60 reagent was added. The wells were scraped and the contents were placed in microcentrifuge tubes. After a 3 minute incubation at room temperature, 100 µL of chloroform were added. The contents were centrifuged for 15 minutes at 4°C, followed by retention of the aqueous layer which contained the RNA. This layer was then mixed with 250 µL of isopropanol at room temperature for 5-10 minutes. Centrifugation at 4°C for 10 minutes followed. The pellet was retained and washed with 500 µL of ethanol. After a brief centrifugation, the ethanol was aspirated, and the pellets were thoroughly dried. RNase-free water was used to dissolve the RNA pellet, and the samples were stored at -80˚C. RT-PCR AND GEL ELECTROPHORESIS Semi-quantitative reverse transcriptase polymerase chain reaction (RT-PCR) using the Protoscript® II RT-PCR Kit was performed according to manufacturer’s protocol. mRNA was first mixed with dT23VN primer and dNTPs and heated for 5 minutes at 70°C. First-strand cDNA synthesis carried out at 42°C for one hour with M-MuLV Reverse Transcriptase in the presence of RNase inhibitor. PCR amplification of cDNA utilized gene-specific primers, and PCR products were analyzed by agarose gel electrophoresis.
RESULTS
Cell morphology and confluency were monitored daily during azaC and sodium butyrate treatment. No changes were apparent until the sixth day when significant cell death was observed in both cell types. In Caco-2 and DLD-1 cells treated with the combination of azaC and sodium butyrate, a reduction in cell number of ~80-85% was observed. Cell death was also observed in both cell types treated with sodium butyrate alone, but it was significantly less than that seen in cells treated with both drugs. There was little cell death observed in cells treated with azaC alone. Gel electrophoresis confirmed that PCR amplification was successful in all samples for GAPDH cDNA and in post-confluent Caco-2 cells for DRA cDNA. Amplification of p14 and p16 cDNA was not apparent, however.
CONCLUSIONS
The cell death observed in DLD-1 and Caco-2 cells treated with both azaC and sodium butyrate suggests a synergistic effect for these two drugs. The exact mechanism of cell death is unknown at this time. Further investigation could reveal whether cell death was via apoptosis or necrosis or simply a toxic event.
GAPDH PCR results confirm successful isolation and purification of mRNA from all cell treatments as well as successful amplification of cDNA from this gene. Because DRA cDNA was detected in post-confluent Caco-2 cells, PCR primers and parameters were appropriate for this gene. However, because we were unable to detect p14 and p16 cDNA, we were unable to determine if the drug treatments were effective for re-expression of these genes or if primer design and/or PCR parameters were appropriate. Human genomic DNA could serve as a positive control for p14 and p16 cDNA amplification by PCR in future experiments. Until p14 and p16 cDNA are detected following drug treatment, we are unable to definitively conclude what, if any, effect these drugs had on DRA mRNA expression.
ACKNOWLEDGMENTS
The authors wish to thank the University of South Carolina Upstate Office of Sponsored Awards and Research Support for a research assistantship awarded to D. L. G.
REFERENCES [1] C.W. Schweinfest, K.W. Henderson, S. Suster, N.
Kondoh, and T.S. Papas, “Identification of a colon mucosa gene that is down-regulated in colon adenomas and adenocarcinomas.” Proceedings of the National Academy of Science U S A, 1993, vol. 90(9): p. 4166-70.
[2] J.M. Chapman, S.M. Knoepp, M.K. Byeon, K.W. Henderson, and C.W. Schweinfest, “The colon anion transporter, down-regulated in adenoma, induces growth suppression that is abrogated by E1A.” Cancer Research, 2002, vol. 62(17): p. 5083-8.
[3] C. W. Schweinfest, D.D. Spyropoulos, K.W. Henderson, J.H. Kim, J.M. Chapman, S. Barone, R.T. Worrell, Z. Wang, and M. Soleimani, “slc26a3 (dra)-deficient mice display chloride-losing diarrhea, enhanced colonic proliferation, and distinct up-regulation of ion transporters in the colon.” Journal of Biological Chemistry, 2006, vol. 281(49): p. 37962-71.
[4] D.G. Silberg, W. Wang, R.H. Moseley, and P.G. Traber, “The Down regulated in Adenoma (dra) gene encodes an intestine-specific membrane sulfate transport protein.” Journal of Biological Chemistry, 1995, vol. 270(20): p. 11897-902.
Fifth Annual SC Upstate Research Symposium
56 Sponsors: Stäubli, Spartanburg Regional Healthcare System, EPSCoR/IDeA RS grant.
An in Depth Study of the Length of Hospital Stays with Regard to Procedures Performed on Type II Diabetes Patients
Anneliese Schmidt and Wei Zhong Computer Science
University of South Carolina Upstate 800 University Way, Spartanburg, SC 29303
[email protected], [email protected]
Abstract — The initial data provided moderate results with error rates ranging from 17-29% with corresponding predicted error rates ranging from 32-40%. For the revised data, the unfiltered files resulted in predicted error rates ranging from 23.9-52.3%, whereas the actual error rates ranged from 17.3-70.0%. The filtered files, from the revised data, resulted in the predicted error rates ranging from 23.9-52.3%, whereas the actual error rates ranged from 0.0-75.0%. Keywords — Data mining, Type II Diabetes, C4.5, SVMlight.
INTRODUCTION This data mining project was an investigation of patients diagnosed with Type II Diabetes. Specifically, it was an exploration into the length of time a patient remained in the hospital, nine plus days or less, with regard to the procedures the patient may have received. The study was conducted using data from the Nationwide Inpatient Sample (NIS), a nationwide database of hospital inpatient stays, provided by the Healthcare Cost and Utilization Project (HCUP) [1]. The ultimate goal of the ongoing project is to help reduce overall healthcare costs by providing a base from which doctors can determine how long a patient will need to remain in the hospital.
Two statistically based programs C4.5, written by Ross Quinlan [2], and SVMlight, written by Thorsten Joachims [3], were used to analyze data extracted from the NIS. C4.5 was designed to generate decision trees, and rule sets based on the decision trees produced, from a set of training data. C4.5 builds a decision tree using the concepts of Information Entropy, a measure of the uncertainty associated with a random variable, and Information Gain, the difference in entropy [54]. C4.5 produces statistical and probabilistic results, as well as provides an estimate of the error rate on new data based on the tree and rule set generated. SVMlight is an implementation of Vapnik’s Support Vector Machine [5] and is designed for pattern recognition and optimization. Similar to Quinlan’s C4.5, SVMlight uses a set of training data to create a model file and provides estimates for error, precision, and recall rates. SVMlight then uses the learned model to make predictions on test
examples creating a file that line for line shows whether each case was correctly or incorrectly predicted and provides the actual error, precision, and recall rates corresponding to the test data.
SECTION TWO First, it was necessary to extract the cases regarding Type II diabetes from the NIS. Dr. Wei Zhong wrote and executed the programs necessary for this stage. Not only did these programs extract the appropriate cases, they trimmed the cases’ data to provide only the relevant information including procedures performed and length of hospital stay. Secondly, Dr. Zhong prepared files containing either training sets of data or testing sets of data.
In the next stage, several C based programs were written in order to convert these data sets to the proper format necessary to run C4.5. The first version of the program explicitly listed the attributes, procedure code numbers, pertaining to a particular cluster to write the ~.data file used by C4.5. The second version of the converter program combined two input files, a test file and its cross-validation file, into one ~.data file. The third version of the converter program extracted the attributes from the training file, created an attribute file, ~.names, and created the ~.data file. The fourth version of the converter program added a conversion of the procedure code numbers to the procedure code names. A similar program was written to convert the testing data sets into the ~.test file. These programs were then executed on all the data sets provide by Dr. Zhong.
At this stage, the data clusters were tested using C4.5 and the results were interpreted. C4.5 provides numerous options that can be invoked to improve the error rates produced by the induced decision tree on both the training data and the testing data. For example, when many cases have the same outcome it can lead to odd trees and therefore reduce the predictive power of that tree. Weighting is an option that attempts to improve the predictive power by ensuring that the sum of the weights of cases must meet some minimum. The options were tested with several degrees of rigorousness. Each option was tested singly as well as in conjunction with others, and none of the
March 27th, 2009
Sponsors: Stäubli, Spartanburg Regional Healthcare System, EPSCoR/IDeA RS grant. 57
combinations of options made a significant improvement to the results. The initial data sets provided moderate results with error rates ranging from 17-29% and predicted error rates ranging from 32-40% (i.e. only 60-68% accuracy on new data).
The next stage of the project was to produce somewhat larger training sets of data. A new C based program was written to combined two related sets of data and proportionally redistributed the combined data into four different files. A separate program was written that combined three of the four newly redistributed files creating the training data file while leaving the fourth as the corresponding test data file. This program was executed such that each of the four files was used as a test data file, essentially quadrupling the number of data and test files.
The subsequent stage of the project was to use SVMlight as a tool to determine which cases were accurately predicted. Also, an optimization program written by Dr. Zhong was used to evaluate three parameters used by SVMlight: trade-off between training error and margin; cost-factor by which training errors on positive examples outweigh errors on negative examples; and the gamma parameter in the rbf kernel. These parameters provided somewhat low results for accuracy, precision, and recall rates were, around 60%. After these new training/test files were evaluated with SVMlight, another C program was written that created filtered data files by comparing the prediction file that SVMlight created to the corresponding test file.
Finally, the converter program was used on these redistributed, filtered and unfiltered, files and then the files were tested using C4.5. The error rates on both the data and test files varied widely. For the unfiltered files the predicted error rates ranged from 23.9-52.3%, whereas the actual error rates ranged from 17.3-70.0%. There was one outlier from the unfiltered data whose actual error rate was 100% for which it is believe that the data set was simply too small. For the filtered files the predicted error rates ranged from 23.9-52.3%, whereas the actual error rates ranged from 0.0-75.0%. The range for the predicted error rate remained unchanged for the filtered data but the range for the actual error rate increased. When looked at more closely, 82.7% of the data files improved in actual error rate for the filtered files but the predicted error rate remained unchanged for all of the filtered files.
CONCLUSIONS The attempt to improve the results of this project through in depth study by producing a trimmed the data set showed a slight improvement but also broadened the range of error rates. There are an extensive number of procedures that can be performed on any given patient. In other words, there is a large number of attributes that must be considered for each case provided to C4.5. This component seems to be a large factor in producing reasonable actual and predicted error rates. To increase the size of the training clusters would be the most practical next stage of testing for this project. Larger clusters would provide enough cases so that more of the attributes, with a paired outcome, would be represented. It may even be necessary to do another in depth study of these larger training clusters to determine which attributes appear to have the most significance, and then to trim the insignificant ones, as attempted here.
Once an acceptable accuracy rate is achieved, the next stage of this project would be to scale the converter program to handle exceptionally large sets of data and test these sets using C4.5. The final stage of development would be to create a user friendly interface for a physician to input information regarding a current patient to predict whether that patient will remain in the hospital for nine plus days or less.
ACKNOWLEDGMENTS Dr. Wei Zhong, assistant professor, Department of Computer Science, University of South Carolina Upstate.
REFERENCES
[1] The HCUP Nationwide Inpatient Sample; Agency for Healthcare Research and Quality Healthcare Cost and Utilization Project: Rockville, Maryland, 2004.
[2] Quinlan, J.R.; C4.5: Programs for Machine Learning. Elsevier, 1992.
[3] Joachims, T. Making large-Scale SVM Learning Practical. In Schölkopf, B., Burges, C., and Smola, A., editors, Advances in Kernel Methods – Support Vector Learning. MIT Press, 1999a.
[4] Han, Jiawei; Kamber, Micheline; Classification and Prediction. Data Mining: Concepts and Techniques, Second Edition; Jim Gray, Microsoft Research, Series Editor; The Morgan Kaufmann Series in Data Management Systems; Morgan Kaufmann Publishers: San Francisco, 2006; pp 285-310, 318-327, 337-347, 354-366.
[5] Vapnik, V. Statistcal Learning Theory. Wiley, 1998.
Fifth Annual SC Upstate Research Symposium
58 Sponsors: Stäubli, Spartanburg Regional Healthcare System, EPSCoR/IDeA RS grant.
Implementation of the North American Amphibian Monitoring Program in the Upstate Region of South Carolina
Alexsis Ferguson and Melissa Pilgrim Division of Natural Sciences and Engineering
University of South Carolina Upstate 800 University Way, Spartanburg, SC 29303
[email protected], [email protected]
Abstract - The North American Amphibian Monitoring Program (NAAMP) was developed in 1995 as an initiative to monitor amphibian population trends in Canada, Mexico and the United States (see www.pwrc.usgs.gov/naamp). NAAMP uses breeding call surveys to inventory and monitor presence and persistence of amphibian species in a region. South Carolina joined NAAMP in 2008. USC Upstate’s research group, Upstate Herpetology, is responsible for collecting NAAMP data for the Upstate region of South Carolina. Specifically, we are responsible for conducting call surveys along 11 routes that span 7 counties in the Upstate. Our objectives for the 2008 season were to evaluate the productivity of Upstate calling routes, the species richness of our region and seasonal impacts on breeding phenology. We followed standard NAAMP protocol (see http://www.pwrc.usgs.gov/ NAAMP/protocol/index.html) for data collection along each route; for the 2008 season we were able to collect data for NAAMP sampling window 2 (March 15 – April 30) and NAAMP sampling window 3(May 15 – June 30). Our objectives for the 2008 season were to evaluate the productivity of Upstate calling routes, the species richness of our region and seasonal impacts on breeding phenology. Of the 110 potential breeding sites surveyed, 91 had anuran calling activity. The number of species calling per site varied from 1-5, with per site species richness increasing during sampling window 3. In total, we recorded 12 anuran species calling along Upstate routes. We documented both interspecific and intraspecific variation in calling activity between sampling windows.
INTRODUCTION Humanity currently faces an environmental crisis: the loss of biodiversity [see 1 and 2]. Biodiversity refers to the variety of life on Earth. To date, there are approximately 1.4 million identified living species [3]. We are losing these species to extinction at a rate 100 –10,000 times faster than the background extinction rate observed in the fossil record [4]. In fact, the fossil record is dominated by five mass extinction events, and some scientists label the current trend in biodiversity loss as a sixth mass extinction [5]. Unlike the previous five mass extinction events, the current event is largely the result of human impacts on the environment [5].
In both scientific and public communities, one of the most publicized outgrowths of the biodiversity crisis is the issue of global amphibian decline. Of the 5,743 described species of amphibians, 32.5% are listed as threatened by the World Conservation Union [6]. In addition, the most conservative estimate of the current amphibian extinction rate is 211 times greater than the background extinction rate for amphibians [3]. The disappearance of this group draws much attention for good reason. In many ecosystems amphibians are critical to energy/nutrient cycling within the system [7]. Amphibians make up the bulk of the vertebrate biomass in many ecosystems. For example, in a single Carolina Bay over the course of one year, there was the exchange of more than a ton (over 400,000 individual captures) of amphibian biomass between the wetland and surrounding forest [8]. In addition to their role in ecosystem function, amphibians are often viewed as measures of ecosystem quality. Because of their sensitivity to environmental perturbation (e.g., thin skin makes them susceptible to pesticide poisoning), they are viewed as bioindicators that reflect the health of an ecosystem. Amphibian loss is perceived as a factor that can destabilize ecosystem function and represents environmental degradation. Thus, from a human perspective, global amphibian declines are often viewed to represent overall environmental degradation likely associated with a reduction in ecosystem services and direct health risks. In response to the global amphibian decline issue, the World Conservation Union (IUCN)/SSC) developed the Declining Amphibian Task Force. One goal of the task force is to identify geographic areas where amphibian declines are happening. Thus, some of their work involves conducting inventories delineating the location of current amphibian populations and monitoring the identified populations for persistence through time. One large scale inventory and monitoring program developed through the task force is the North American Amphibian Monitoring Program (NAAMP). NAAMP was developed in 1995 as an initiative to monitor amphibian population trends

March 27th, 2009
Sponsors: Stäubli, Spartanburg Regional Healthcare System, EPSCoR/IDeA RS grant. 59
in Canada, Mexico and the United States (see www.pwrc.usgs.gov/naamp). NAAMP takes advantage of a particular behavior associated with anuran breeding events. Each species of frog or toad has a unique breeding call (vocalization/song). NAAMP uses breeding call surveys to inventory and monitor presence and persistence of amphibian species in a region. South Carolina joined NAAMP in 2008. USC Upstate’s research group, Upstate Herpetology, is responsible for collecting NAAMP data for the Upstate region of South Carolina. Our objectives for the 2008 season were to evaluate the productivity of Upstate calling routes, the species richness of our region and seasonal impacts on breeding phenology.
METHODS The USGS assigned 11 routes that spanned 7 counties to the Upstate region of South Carolina. We followed standard NAAMP protocol (see http://www.pwrc.usgs.gov/ NAAMP/protocol/index.html) for data collection along each route. Each route had ten stops. Each stop represented a potential amphibian breeding site for our region; thus, there were 110 potential breeding sites in the Upstate of South Carolina. Potential breeding sites represented a variety of habitats, such as flooded wetlands, farm ponds, creeks, and road ditches. We conducted anuran calling surveys at each stop during NAAMP sampling windows 2 and 3. Sampling window 2 was March 15 through April 30, while sampling window 3 was May 15 through June 30. At each stop, we recorded the time, temperature, noise factor (e.g., traffic) and moon visibility. Then we recorded any species calling during a five minute period. We used a numerical scale to score anuran calling activity. The scale ranged from 1 to 3, with one representing low calling activity (e.g., hearing individual frog calls) and three representing high calling activity (e.g., full breeding chorus of many overlapping calls). We used EXCEL (version 2003) for data management.
RESULTS Of the 110 potential breeding sites surveyed, 91 had anuran calling activity. The York county route was our least productive route, with 6 of 10 stops having no calling activity. Our Spartanburg county route was the most productive route, with 8 of 10 stops having calling activity in both sampling windows. The number of species calling per stop varied from 1-5, with per stop species richness being higher during sampling window 3. We recorded 12 anuran species calling along Upstate routes (Table 1). During sampling window
2, we recorded calling activity for only 10 of the 12 species. The three dominant callers during window 2 were Spring Peepers, Northern Cricket Frogs, and Fowler’s Toads. During window 3, we recorded calling activity for only 9 of the 12 species. The three dominant callers during window 3 were Fowler’s Toads, Green Treefrogs, and Northern Cricket Frogs. In addition to documenting interspecific variation in calling activity between sampling windows, we recorded intraspecific variation in calling activity. For example, we recorded a 50% increase in American Bullfrog calling activity between windows 2 and 3. We recorded at least 1 full chorus for 9 out of the 12 species. In sampling window 2, we scaled over 70% of Spring Peeper calling activity as full breeding choruses. In sampling window 3, we scaled over 50% of American Toad and Green Treefrog calling activity as full breeding choruses.
Table 1. Anurans recorded calling along Upstate NAAMP routes during sampling windows 2 and 3. Scientific Name: Common Name: Acris crepitans Northern Cricket Frog Bufo americanus American Toad Bufo fowleri Fowler’s Toad Gastrophryne carolinensis
Eastern Narrow-Mouthed Toad
Hyla chrysoscelis Cope’s Gray Treefrog Hyla cinerea Green Treefrog Pseudacris crucifer
Spring Peeper
Pseudacris feriarum Southeastern Chorus Frog Rana catesbeiana American Bullfrog Rana clamitans Green Frog Rana palustris Pickerel Frog Rana sphenocephala Southern Leopard Frog
CONCLUSIONS Overall, our 11 Upstate routes were very productive. In our first year of NAAMP participation, we documented the presence of 12 of the 15 anuran species expected to occur in the Upstate region. Two of the 12 species (i.e., Northern Cricket Frogs and Pickerel Frogs) are listed as species of concern by the South Carolina Department of Natural Resources (https://www.dnr.sc.gov). Our hope is that data collected in the Upstate will be useful when developing management plans targeting conservation of these species statewide. Often the numerical score for calling activity is used as an index of species abundance at a site. For example, Nelson and Graves [9] found there was a positive correlation between the number of individual Green Frogs captured at farm ponds in

Fifth Annual SC Upstate Research Symposium
60 Sponsors: Stäubli, Spartanburg Regional Healthcare System, EPSCoR/IDeA RS grant.
Michigan and the numerical score recorded for calling activity in the ponds. Nine of the 12 species we recorded had at least one site where we scored their calling activity as a full breeding chorus (i.e., a numerical score of 3). Thus, it appears several species have sites in the Upstate where they are locally abundant. NAAMP protocol has received some criticism [10, 11 and 12]. For example, NAAMP protocol specifies that call surveys are to be conducted in the time window spanning half an hour following sunset until 1am. The concern is that the protocol will underestimate the presence of species that call during other times of the day. For example, Bridges and Dorcas [13] demonstrated that the NAAMP protocol would likely underestimate Southern Leopard Frog occurrence on the Savannah River Site (SRS; Aiken, South Carolina) during certain times of the year. On the SRS in July, Southern Leopard Frogs had peak calling activity between midnight and dawn. NAAMP data sets do have certain limitations. However, if viewed as a long term inventory and monitoring program, NAAMP can contribute useful information on both presence and persistence of anuran species in a region. Our expectation is that through time our NAAMP data set will allow us to evaluate how global climate change variables (e.g., precipitation and temperature patterns) impact anuran range expansion, range contraction, breeding phenology and community assemblages in the Piedmont of South Carolina.
ACKNOWLEDGEMENTS We would like to thank the following volunteers for helping us collect NAAMP data during the 2008 season: Jared Ballenger, David Brothers, Lauren Horton, Sanjana Iddyadinesh, Martha Miller, Dr. Gill Newberry, Matt Phillips, Will Reid, and Maria Sarkozi. We are grateful to our state coordinators (Dr. Eran Kilpatrick and Steve Bennett) for assistance with implementing NAAMP in Upstate region of South Carolina. We would like to thank J.D. Willson and Chelsea Kross for providing the photographs used in the poster.
LITERATURE CITED [1] E. Wilson. “The Diversity of Life,” Norton and
Company, 1992. [2] E. Wilson. “The Future of Life”, Random House
Incorporated, 2002. [3] M. McCallum. “Amphibian decline or extinction?
Current declines dwarf background extinction rates,” Journal of Herpetology 41:483-491, 2007.
[4] R. Hassan, R. Scholes and N. Ash, “Ecosystems and Human Well-Being, Volume 1, Current state and trends: findings of the conditions and trends working group,” Island Press, 2005.
[5] R. Frankham. “Stress and adaptation in conservation genetics,” Journal of Evolutionary Biology 18:750-755, 2005.
[6] S. Stuart, J. Chanson, N. Cox, B. Young, A. Rodrigues, D. Fischman and R. Waller, “Status and trends of amphibian declines and extinctions worldwide,” Science 306:1783-1786, 2004.
[7] K. Regester, K. Lips, and M. Whiles, “Energy flow and subsidies associated with the complex life cycle of ambystomatid salamanders in ponds and adjacent forest in southern Illinois,” Oecologia 147:303-314, 2006.
[8] J. Gibbons, C. Winne, D. Scott, J. Willson, X. Glaudas, K. Andrews, B. Todd, L. Fedewa, L. Wilkinson, R. Tsaliagos, S. Harper, J. Greene, T. Tuberville, B. Metts, M. Dorcas, J. Nestor, C. Young, T. Akre, R. Reed, K. Buhlmann, J. Norman, D. Croshaw, C. Hagen and B. Rothermel, “Remarkable amphibian biomass and abundance in an isolated wetland: implications for wetland conservation,” Conservation Biology 20:1457:1465, 2006.
[9] G. Nelson and B. Graves. “Anuran Population Monitoring: Comparison of the North American Amphibian Monitoring Program’s Calling Index with Mark-Recapture Estimates for Rana clamitans,” Journal of Herpetology 38:355-359, 2004.
[10] R. Alford and S. Richards. “Global Amphibian Declines: A Problem in Applied Ecology,” Annual Reviews 30: 33-165, 1999.
[11] W. Crouch III and W. Paton. “Assessing the Use of Call Surveys to Monitor Breeding Anurans in Rhode Island,” Journal of Herpetology 36:185-192, 1999.
[12] K. Genet and L. Sargent. “Evaluation of Methods and Data Quality from a Volunteer—Based Amphibian Call Survey,” Wildlife Society Bulletin 31: 703-714, 2003.
[13] A. Bridges and M. Dorcas, “Temporal Variation in Anuran Calling Behavior: Implications for Surveys and Monitoring Programs,” Copeia 2000: 587-592, 2000.
March 27th, 2009
Sponsors: Stäubli, Spartanburg Regional Healthcare System, EPSCoR/IDeA RS grant. 61
Size of Rank Tests for Location in Linear Models with Repeated Observations
Bernard Omolo, Ph.D, and Daniel Hagerman Division of Mathematics and Computer Science
University of South Carolina Upstate 800 University Way, Spartanburg, SC 29303
[email protected], [email protected]
Abstract - An aligned rank test for location in a linear model is considered. The power of the test under the null hypothesis model is examined when repeated observations are present, via Monte Carlo simulations. We conclude that the test achieves the nominal significant levels for finite samples, as is expected from statistical theory.
Keywords – Linear model; rank test; orthonormal matrix; Type I error; statistical power.
INTRODUCTION
Rank statistics have been used extensively in developing tests for location in linear models ([1], [2]). In these and other situations, the centered design matrices for the full and the null hypothesis models have been assumed to have full rank. When this requirement is violated, standard approaches for derivation of null distribution of the rank tests cannot be applied.
Omolo et al. developed an aligned rank test for location in linear models with centered design matrices with less than full rank [3]. The case when repeated observations are present was considered. This kind of linear model can also be obtained when observations are grouped, even if no repetitions are present, as in testing for linearity of a partly linear model.
In subsection 2.1 we present the model of analysis, the statement of hypothesis and the test statistic. The procedure and results from Monte Carlo simulations are described in subsection 2.2. In section 3, we provide a summary of the conclusions from the Monte Carlo study above.
METHODS
LINEAR MODEL We consider a population consisting of 푁 = 푣푛 observations, which can be grouped into 푣 groups, each of size 푛, based on some common characteristics. Let 푦 denote the i-th observation from the j-th group. Assuming that these
observations are defined on the unit interval, with Cauchy errors, we can express 푦 as follows:
푦 = 2푗푣 +
푐√푛
푗푣 + 휀
푖 = 1, 2, … ,푛; 푗 = 1, 2, … , 푣. Our interest is in testing if the function generating these observations is linear in [0, 1]. Using matrix notation, the observations can be expressed as
풀풏 = 푿풏휣 + 휺풏
= [푯풏 푨풏] 휣휣 + 휺풏
= 푯 휣 + 푨 휣 + 휺 . The null hypothesis to be tested is: 퐻 : 훩 = ퟎ vs 퐻 : 훩 ≠ ퟎ. As shown in [3], the test statistic for this hypothesis is
푄 =1휎 푇
where 푻 = 푿 ∙푾, 푿 being the (orthonormal) design matrix and 푾 the vector of aligned ranks of the observations, and 휎 is the variance of the score function used.
By the Chernoff-Savage theorem(s), the statistic 푄 has an asymptotic chi-square distribution with degrees of freedom 푣 − 2 under the null hypothesis. MONTE CARLO SIMULATIONS Simulations for the size of the test were performed to assess its behavior under finite samples. Samples of sizes 푛 = 20, 50 and 100 and significance levels α = .01, .05 and .10 were used. The number of groupings, 푣, was fixed at 10. One thousand (1000) values of the test statistic, 푄, were obtained using an R – 2.5.1 program [4].
To estimate the Type І error rate (size), the number of values of the statistic that exceeded the corresponding quantile of the chi-square

Fifth Annual SC Upstate Research Symposium
62 Sponsors: Stäubli, Spartanburg Regional Healthcare System, EPSCoR/IDeA RS grant.
distribution with 8 degrees of freedom was divided by the total number of simulations.
Table 1 below displays the results of the simulations. Table 1. Size of the test α n = 20 n = 50 n = 100 .01 .05 .10
.0107
.0522
.1092
.0095
.0493
.1012
.0102
.0496
.0960
CONCLUSIONS It can be observed from Table 1 above that as the sample size (n) increases, the estimates of Type І error rate approach the true α - levels. This implies that the test statistic 푄 converges in distribution to the chi-square with 8 degrees of freedom as is expected from statistical theory. The distribution of the test statistic under the full model, 퐻 , would be the non-central chi-square, which would be useful in simulating power and is the subject of a future study.
ACKNOWLEDGEMENTS This work was supported by the USC Upstate Student Research Assistant Grant during the summer of 2008. We are grateful for this grant from the Office of Sponsored Awards and Research Support, USC Upstate.
REFERENCES [1] J.N. Adichie. “Rank tests for subhypothesis in the
general linear regression,” Ann Math. Statist. vol. 6, pp 1012-1026, 1978.
[2] C.Y. Chiang and M.L. Puri. “Rank procedures for testing subhypothesis in linear regression,” Ann. Inst. Statist. Math., vol. 36(A), pp 35-60, 1984.
[3] J. Einmahl, B. Omolo, M. Puri, and F. Ruygaart.” Aligned Rank statistics for repeated measurement models with orthonormal design employing a Chernoff-Savage approach,” Journal of Statistical Planning and Inference, vol. 130, pp 167-182, 2005.
[4] R Development Core Team, “R: A Language and Environment for Statistical Computing,” R Foundation for Statistical Computing, Vienna, Austria, 2007.
March 27th, 2009
Sponsors: Stäubli, Spartanburg Regional Healthcare System, EPSCoR/IDeA RS grant. 63
On the Properties and Applications of the Space of Linear Functions L(R)
Michael Blackmon and Gamal Elnagar Department of Mathematics and Computer Science
University of South Carolina Upstate 800 University Way, Spartanburg, SC 29303
[email protected], [email protected] Abstract — In this paper, we develop the space of linear functions (푦 = 푚푥 + 푏) as an algebra over a general ring R, which we denote 퐿(푅) = {푎+ 휏푏: (푎, 푏) ∈ 푅 }. We give necessary and sufficient conditions for a general continuous function 퐺(푥 + 휏푦) = 푔 (푥,푦) + 휏푔 (푥,푦) to be differentiable on L(R). With our definition of differentiability, we give conditions on which a first order differential equation defined on L(R) must hold in order for it to be solvable. In addition to the algebraic and analytical characterization of L(R) one of the applications of this algebra is numerical computation of derivatives for a certain class of functions. Keywords —differentiability, differential equations, numeric differentiation, function spaces.
INTRODUCTION While the work on the theory of dual numbers is not recent (see [1, 2, 3, 4, 5, 6].) However this theory is interesting in that it provides an example of an algebraic structure which can be extended to possess an analytic structure. Moreover, this extension provides very interesting applications and serves as an example of a space in which the notion of differentiability can be defined and exploited. The purpose of this paper is three fold: first; to characterize the algebraic and analytical properties of L(R); second; provide an example of a space in which the notion of differentiability exist; and third; outline a methodology for the construction of the space L(R).
In Section 2 we begin by defining the space L(R) for an arbitrary ring R using the definition given in [2]. From there we begin to characterize the algebraic properties of L(R) as a ring. From the construction process and assumptions imposed on R we derive properties of L(R). After this we take up an analytical characterization of L(R). We focus on the case with the base ring the set of real numbers and proceed to develop some of the results contained in [1, 4, 6] concerning continuous and L(R)-differentiable functions. Moreover, we offer an alternative proof of the necessary and sufficient conditions for differentiability on L(R) (see [1, 4, 6]). Having established the basic characteristics of differentiable functions defined on L(R) we move to take up the question of L(R)-
differential equations. We first develop a method of anti-differentiation which allows us to establish a method to solve elementary differential equations. Second we give necessary and sufficient conditions for the existence and uniqueness of solutions to a much larger class of L(R)-differential equations.
In section 3 we deviate from our current path and take a turn toward application. We provide an application of the space 퐿(ℝ) to numeric differentiation. We define a scheme which can be used to efficiently and compactly produce highly accurate approximations of the value of a functions derivative. We then conclude the paper with a collection of numerical results comparing the traditional finite-difference methods with ours.
ANALYTICAL AND ALGEBRAIC CHARACTERIZATION OF 퐿(푆)
Before we can characterize this space, we need to define it. For this purpose suppose that S is a commutative ring with unity 1. Then, we can construct the free module over the set of generators, {(0,1), (1,0)}, by defining the product of an element x in S with a generator as 푥(1,0) =(푥, 0) = (1,0)푥 and 푥(0,1) = (0,푥) = (0,1)푥. Moreover, we will define a product on the two generators given by (1,0) ∙ (1,0) = (1,0), (1,0) ∙(0,1) = (0,1) ∙ (1,0) = (0,1), and (0,1) ∙ (0,1) =(0,0). With this we can define the space 퐿(푆) =span {(1,0), (0,1)}. Now, throughout the rest of this paper we will denote the generators {(1,0), (0,1)} as 1 and 휏 respectivly when speaking of values in 퐿(푅).
We now move to take up a quick algebraic characterization of the space 퐿(푆). Given a commutative ring S, with unity 1, we can extract the following isomorphism, which characterizes the behavior of 퐿(푆) as a ring. Suppose S is a commutative ring with unity 1. Then, we have 퐿(푆) ≃ 푆[푥]/⟨푥 ⟩. With that we move to consider what happens when a point x in 퐿(푆) is used to evaluate an arbitrary polynomial in 푆[푥]. To this end: Suppose S is a commutative ring with unity 1, and 훼 = 푥 + 휏푦. Then, for every 푓 ∈ 푆[푥], we can extract that 푓(훼) = 푓(푥) + 휏 푦 푓′(푥). Given the algebraic structure of 퐿(푆), it is possible to

Fifth Annual SC Upstate Research Symposium
64 Sponsors: Stäubli, Spartanburg Regional Healthcare System, EPSCoR/IDeA RS grant.
impose an analytical structure on 퐿(푆) with the tactful assumption that 푆 also has an analytical structure. This can be seen when we assume S is a Banach Space under the norm ‖∙‖: 푆 → ℝ. Then, 퐿(푆) is a Banach Space with norm ‖푥 + 휏푦‖ =‖푥‖ + ‖푦‖. With this norm comes a metric and with a metric we can define convergence in 퐿(푆).
We will now specialize to the case when 푆 = ℝ, which under the absolute value norm, is a Banach Space. It follows that we can define continuous functions taking 퐿(ℝ) into 퐿(ℝ), and moreover we can define the notion of differentiability in 퐿(ℝ) by the usual limit of the difference quotient. With that we can establish that a continuous function 퐺(푥 + 휏푦) = 푔 (푥,푦) + 휏푔 (푥, 푦) is differentiable at a point 훼 = 푥 + 휏푦 if and only if
⎩⎪⎨
⎪⎧휕푔휕푥 =
휕푔휕푦
휕푔휕푦 = 0
at the point 훼 = 푥 + 휏푦. With our definition of differentiability, we can establish an existence and uniqueness result for differential equations defined over 퐿(ℝ). However, before we can do so, we must define the operation of integration.
Suppose that 퐴 ⊂ 퐿(ℝ) and that we are given a curve 훾 ∈ 퐶 ([0,1],퐴), with 훾(0) = 푠 and 훾(1) = 푠. We can define integration of the function 퐺(푥 +휏푦) = 휓(푥) + 휏 푦휓′(푥) + 휑(푥) over the smooth curve 훾 as
퐺 (푧)푑푧 = 휏[푦 휓(푥) − 푦 휓(푥 )]
+ 휓(푡) + 휏휑(푡)푑푡.
Using this definition of integration, we can exploit Piccard’s method of successive approximation to obtain our desired result, which states: Suppose 푈,푉 ⊂ 퐿(ℝ) are open, convex, and bounded, and that 퐹 ∈ 퐶 푈 × 푉, 퐿(ℝ) is bounded by M and satisfies the Lipchitz condition in its second argument with constant 푘. Then, for any 푠 ∈ 푈 and 푔 ∈ 푉 there exists a unique solution to the initial value problem:
퐺′(푧) = 퐹 푧,퐺(푧)퐺(푠) = 푔
.
APPLICATIONS AND NUMERICAL RESULTS While abstract in its definition the space 퐿(ℝ) provides a very elegant method for numerical differentiation. This method is more symbolic than numeric. However, it requires no explicit equation parser and can be implemented in roughly 200 lines of C++ by taking advantage of operator overloading.
What follows is a table comparing the traditional methods of numerical differentiation, and this method, for the function 푓(푥) = sin (x ) on the interval (0.01,1) with ℎ = 0.00009. Method/Norm 푓′(푥 )
− 푢 ‖∞ 푓′(푥 )− 푢 ‖
푓′(푥 )− 푢 ‖
Left Diff. 4.40e+3 1.04e+5 1.28e+4 Right Diff. 3.91e+3 1.05e+5 1.32e+4 Central Diff. 1.11e+3 1.94e+4 3.20e+3 퐿(ℝ) Method 6.37e-11 1.12e-9 3.20e+3 Next we do the same for the function 푓(푥) =∑ ((1− (−1) ) (푛휋⁄ )) sin (푘휋푥) on the interval (−1,1) with ℎ = 0.0002. Method/Norm 푓′(푥 )
− 푢 ‖∞ 푓′(푥 )− 푢 ‖
푓′(푥 )− 푢 ‖
Left Diff. 2.19e-1 2.44e+2 4.58e+0 Right Diff. 2.19e-1 2.44e+2 4.59e+0 Central Diff. 1.40e-3 1.80e+0 2.97e-2 퐿(ℝ) Method 2.55e-13 2.34e-10 3.86e-12
REFERENCES [1] M. A. B. Deakin. “Functions of a dual or duo
variable,” Mathematics Magazine, vol. 39, pp 215–219, 1966.
[2] M. S. P. Eastham. “2968. on the definition of dual numbers ,” The Mathematical Gazette, vol. 45, pp 232–233, 1961.
[3] Andreas Griewank. “Evaluating derivatives: principles and techniques of algorithmic differentiation,” Society for Industrial and Applied Mathematics, Philadelphia, PA, USA, 2000.
[4] Anthony A. Harkin and Joseph B. Harkin. “Geometry of generalized complex numbers ,” Mathematics Magazine, vol. 77, pp 118–129, 2004.
[5] Anders Kock. “Differential calculus and nilpotent real numbers,” The Bulletin of Symbolic Logic, vol. 9, pp 225–230, 2009.
[6] Edna E. Kramer. “Polygenic functions of the dual variable w = u + jv,” American Journal of Mathematics, vol. 52, pp 370–376, 1930.
March 27th, 2009
Sponsors: Stäubli, Spartanburg Regional Healthcare System, EPSCoR/IDeA RS grant. 65
Action Rule Summaries Cuong Hoang, Anna Novo, and Angelina A. Tzacheva
Department of Informatics University of South Carolina Upstate
800 University Way, Spartanburg, SC 29303 { hoangc, novo}@email.uscupstate.edu, [email protected]
Abstract - Most of the mined knowledge with KDD is presented in a form of rules. In addition to uncovering important patterns, action rules may suggest actions to be taken based on that knowledge. In this way contributing to business strategies and scientific research. The large amounts of knowledge in the form of rules presents a challenge of identifying the essence, the most important or interesting part, of high usability. In this paper, we propose an improved method for discovering short descriptions of action rules, with agglomerative clustering. Keywords — action rules, knowledge discovery, summaries, clustering
INTRODUCTION With KDD (knowledge discovery of databases) we extract previously unknown patterns from large amounts of data. Patterns are of interest if they are being useful, meaningful, or otherwise have applications in business, medicine, science, and similar organizations.
Action rules are of interest since they suggest actionable patterns. In other words, the user can act on them to his/her advantage. For instance, an actionable pattern can be used in the decision making process of a business to increase profit.
With large amounts of data, comes large amounts knowledge generated by the pattern discovery techniques. They often require time consuming post-processing of the mined results, in order to identify patterns meaningful to the user in the context he/she is interested.
A challenging research problem in the field relates to reducing the volume of the discovered patterns, and selecting the interesting ones.
In this paper, we propose an improved method which decreases the space of action rules. We discover short descriptions of action rules, by agglomerative clustering. We define a distance measure based on granularity, and the overlap between sets. We, therefore, provide means for reducing the volume of the mined results, and supply the user with short general descriptions of high interest actionable knowledge.
RELATED WORK In recent research, we have observed a focus
on: facilitating the user with grasping the
significance of the mined rules, in the context of a business action plan [1, 3, 4, 5, 6, 7].
An action rule, provides hints to a business user to what changes within attributes are needed in order to re-classify customers from low profitability to high profitability class, introduced by Ras an Wieczorkowska [6]. It is assumed that attributes in a database are divided into two groups: stable and flexible. By stable we mean attributes whose values cannot be changed (age, place of birth, number of children). On the other hand, attributes (like interest rate, or loan approval) whose values can be changed or influenced are called flexible. Each action rule was originally constructed from certain pairs of association rules.
A new simplified strategy for action rule extraction was proposed by Ras and Wyrzykowska in [4]. In that work, we no longer use pairs of classification rules, but rather "grab" the objects. In this sense the action rules are mined directly from the database.
Tzacheva [2] introduced a generalization technique, which creates summaries of action rules, by utilizing an exhaustive method. The author provided great means for reducing the space and furnished the user with the essence of the actionable knowledge. The author also introduced the notion of diversity of action rule summaries [2]. Their clustering method, partitioned the action rule space based on supporting objects of an action rule. This method did not address the possibility of certain objects being moved to an unpredicted class.
In this work, we present an improved clustering method, which is based on the decision attribute, the left hand side, and next the right hand side of the rule. By incorporating the right hand side of the rule, we are better able to control such unexpectedness, as we attach descriptions to each tuple, specifying how the object will change.
ACTION RULES By using ARAS [5] we discover action rules of the form:
[header] ^ [] (d , di)

Fifth Annual SC Upstate Research Symposium
66 Sponsors: Stäubli, Spartanburg Regional Healthcare System, EPSCoR/IDeA RS grant.
where d is fixed, however di (right hand side) can be any value, which belongs to the domain of d. For simplicity reason, we assume that Vd = {d1, d2, d3}.
DISTANCE We assume hierarchical attributes. We define a
distance measure based on granularity. The distance is equal to the number of different atomic terms between two rules.
For instance, the distance between a1 ^ b1 a1 ^ b2
is equal to 1 . While the distance between:
a1 ^ b1
a1 ^ b would be 0 since a1 ^ b1 is included in a1 ^ b because of the hierarchical structure.
CLUSTERING
If we combine two sets together, some elements will move into the new (merged) set, which should not be there, i.e. there will be an overlap.
For instance,
A is a generalization of A1 and A2 . We would like to have the smallest generalized A . So, we will calculate the distance next.
The distance d(A1, A2) = calculated as negative distance between A and other clusters outside of A group, i.e. with label different than d1 , such as d2 or d3 . For example, if the:
overlap of A ^ B3 = 5 elements overlap of A ^ C2 = 4 elements
then after we calculate all overlaps, we will choose the set with the maximum number of elements overlapping. Let’s assume that is overlap of A ^ B3 = 5 elements , and that the number of elements in A is = 85. Then the distance
d(A1, A2) = 5 / 85
Analogically, we will compute the distance of all other sets of the same label. The two sets, which have the smallest distance we will choose to merge. This agglomerative clustering is illustrated below.
The smallest distance is d(B2, B3) = 2/85 , so we will merge (B2, B3) - into B, and re-compute the table.
For a stopping condition, we will use a generalization threshold , and monitor for dense groups, and jumps in the distance. If we do not meet the generalization threshold value, we stop.
CONCLUSION
In this work, we present an improved method for to decrease the space of action rules, through the creation of summaries, and the use of hierarchical attributes.
This agglomerative clustering method generates summaries, or short descriptions of action rules.
This method provides improved means for reducing the volume of mined action rules. It supplies the user with short general descriptions of high interest actionable knowledge.
Directions for the future include implementation and testing with real-life datasets. Applicable fields are: business, financial, medical, industrial.
REFERENCES [1] He, Z., Xu, X., Deng, S., and Ma, R. (2005). “Mining
action rules from scratch”, Expert Systems with Applications, 29(3): 691-699.
[2] Tzacheva, A.A., "Diversity of Summaries for Interesting Action Rule Discovery", in Proceedings of: Intelligent Information Systems (IIS 2008), Springer-Verlag, 2008, pp. 181-190 .
[3] Wang, K., Zhou, S., and Han, J. (2002). “Profit Mining: From Patterns to Actions”, In: Proceedings of the 8th International Conference on Extending Database Technology: Advances in Database Technology.
[4] Ras, Z., Wyrzykowska, E., and Wasyluk, H. (2007). “ARAS: Action Rules discovery based on

March 27th, 2009
Sponsors: Stäubli, Spartanburg Regional Healthcare System, EPSCoR/IDeA RS grant. 67
Agglomerative Strategy”, In: Post-Proceedings of 2007 ECML / PKDD Third International Workshop on Mining Complex Data (MCD 2007).
[5] Tzacheva, A. A. and Ras, Z. W. (2005). “Action rules mining.” International Journal Of intelligent Systems, 20(6):719-736.
[6] Ras, Z. and Wieczorkowska, A. (2000). “Action Rules: how to increase profit of a company”, In: Principles of Data Mining and Knowledge Discovery, (Eds. D.A. Zighed, J. Komorowski, J. Zytkow), Proceedings of PKDD'00, Lyon, France, LNAI, No. 1910, Springer, 587-592.
[7] Jiang, Y., Wang, K., Tuzhilin, A., and Fu, A. W.-C. (2005). “Mining patterns that respond to actions”, In: Proceedings of the Fifth IEEE International Conference on Data Mining (ICDM'05).
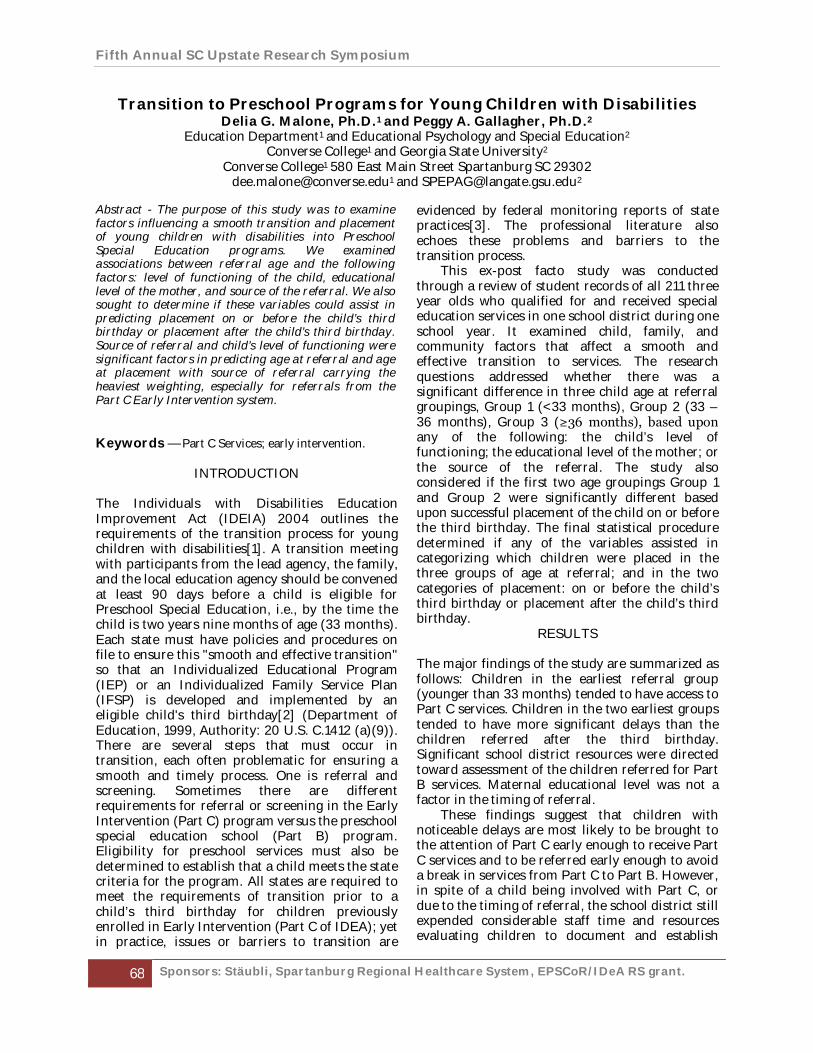
Fifth Annual SC Upstate Research Symposium
68 Sponsors: Stäubli, Spartanburg Regional Healthcare System, EPSCoR/IDeA RS grant.
Transition to Preschool Programs for Young Children with Disabilities Delia G. Malone, Ph.D.1 and Peggy A. Gallagher, Ph.D.2
Education Department1 and Educational Psychology and Special Education2 Converse College1 and Georgia State University2
Converse College1 580 East Main Street Spartanburg SC 29302 [email protected] and [email protected]
Abstract - The purpose of this study was to examine factors influencing a smooth transition and placement of young children with disabilities into Preschool Special Education programs. We examined associations between referral age and the following factors: level of functioning of the child, educational level of the mother, and source of the referral. We also sought to determine if these variables could assist in predicting placement on or before the child’s third birthday or placement after the child’s third birthday. Source of referral and child’s level of functioning were significant factors in predicting age at referral and age at placement with source of referral carrying the heaviest weighting, especially for referrals from the Part C Early Intervention system. Keywords — Part C Services; early intervention.
INTRODUCTION The Individuals with Disabilities Education Improvement Act (IDEIA) 2004 outlines the requirements of the transition process for young children with disabilities[1]. A transition meeting with participants from the lead agency, the family, and the local education agency should be convened at least 90 days before a child is eligible for Preschool Special Education, i.e., by the time the child is two years nine months of age (33 months). Each state must have policies and procedures on file to ensure this "smooth and effective transition" so that an Individualized Educational Program (IEP) or an Individualized Family Service Plan (IFSP) is developed and implemented by an eligible child's third birthday[2] (Department of Education, 1999, Authority: 20 U.S. C.1412 (a)(9)). There are several steps that must occur in transition, each often problematic for ensuring a smooth and timely process. One is referral and screening. Sometimes there are different requirements for referral or screening in the Early Intervention (Part C) program versus the preschool special education school (Part B) program. Eligibility for preschool services must also be determined to establish that a child meets the state criteria for the program. All states are required to meet the requirements of transition prior to a child’s third birthday for children previously enrolled in Early Intervention (Part C of IDEA); yet in practice, issues or barriers to transition are
evidenced by federal monitoring reports of state practices[3]. The professional literature also echoes these problems and barriers to the transition process.
This ex-post facto study was conducted through a review of student records of all 211 three year olds who qualified for and received special education services in one school district during one school year. It examined child, family, and community factors that affect a smooth and effective transition to services. The research questions addressed whether there was a significant difference in three child age at referral groupings, Group 1 (<33 months), Group 2 (33 – 36 months), Group 3 (≥36 months), based upon any of the following: the child’s level of functioning; the educational level of the mother; or the source of the referral. The study also considered if the first two age groupings Group 1 and Group 2 were significantly different based upon successful placement of the child on or before the third birthday. The final statistical procedure determined if any of the variables assisted in categorizing which children were placed in the three groups of age at referral; and in the two categories of placement: on or before the child’s third birthday or placement after the child’s third birthday.
RESULTS
The major findings of the study are summarized as follows: Children in the earliest referral group (younger than 33 months) tended to have access to Part C services. Children in the two earliest groups tended to have more significant delays than the children referred after the third birthday. Significant school district resources were directed toward assessment of the children referred for Part B services. Maternal educational level was not a factor in the timing of referral.
These findings suggest that children with noticeable delays are most likely to be brought to the attention of Part C early enough to receive Part C services and to be referred early enough to avoid a break in services from Part C to Part B. However, in spite of a child being involved with Part C, or due to the timing of referral, the school district still expended considerable staff time and resources evaluating children to document and establish

March 27th, 2009
Sponsors: Stäubli, Spartanburg Regional Healthcare System, EPSCoR/IDeA RS grant. 69
their eligibility for Part B services. The eligibility requirements for Part B and Part C for this state were very similar. SOURCE OF REFERRAL Source of referral was a significant factor in this research. Specifically, the majority (75.6%) of the children referred from Part C were referred in the earliest group, Group 1. The remaining sources of referral, Private, Parent, or Other, had the majority of their referrals in the oldest group, as indicated by their respective percentages of 50.0%, 64.9%, and 60.7%. The majority of referrals in this study were from Part C. These also represented the earliest referrals, constituting 86.6% of the referrals within Group 1. In these data, referral through Part C was the most likely source for early referral to the school district for children with suspected disabilities.
In the discriminant analyses, source of referral was the highest predictor (specifically Part C referral) of age at referral, accounting for 90% of the between group variance for that discriminant analysis. It remained the strongest weighted predictor for determining age of placement groupings (on or before age 3 or after age 3) in combination with level of functioning scores. Parent referral remained the second highest in the ordering of the structure matrix at -.54 after Part C referral at .94. It is noteworthy that the majority of referrals from parents occurred after age 3 rather than earlier.
AGE OF REFERRAL AND PLACEMENT AGE Analysis by Pearson Chi-Square (1, N= 152)=15.30, p<.001 showed a significant relationship between age at referral and placement on or after the child’s third birthday. For the 48 children placed on or before the third birthday 45, (93.8%) were referred prior to 33 months (Group 1) and 3 (6.3%) were referred from 33 through 36 months (Group 2). Of the group of 104 children placed after the child’s third birthday, 66 (63.5%) were from Group 1 and 38 (36.5%) were from Group 2.
When the percentages are considered within each referral age grouping, the earlier group of referrals Group 1 (<33 months) had 40.5% of its group in the program on or before the third birthday and 59.5% were placed after the third birthday. The next referral age Group 2 had 7.3% of its group in the program on or before the third
birthday while 92.7% were placed after the third birthday.
PREDICTING AGE AT REFERRAL AND AGE OF PLACEMENT As indicated above, the source of referral and the child’s level of functioning both played a role in predicting age at referral and age of placement as evidenced by the discriminant analyses. Source of referral, however was the predictor with the heaviest weighting, especially for referrals from Part C.
CONCLUSIONS While there are many areas to explore in seeking resolution to problems that remain in early transition, it is important to remember that it is ultimately in the child’s best interest that persons in the community are aware of services available in order to expedite access to intervention during the critical stages in a child’s development. These data suggest that early referral through Part C is more likely to assure Part B services by the time of the child’s third birthday than referrals through other sources in the community.
ACKNOWLEDGMENTS
We would like to acknowledge Sage Publications for publishing this work (see reference below)[4], all rights reserved.
REFERENCES
[1] Individuals with Disabilities Education Improvement Act (IDEIA) of 2004, PL 108-446, U. S. C. § 1400 et seq.
[2] Department of Education, 34 CFR Parts 300 and 303 (March 12, 1999). Assistance to states for the education of children with disabilities and the Early Intervention program for infants and toddlers with disabilities: Final regulations. Federal Register, 64(48), § 300.132.
[3] U. S. Department of Education: Office of Special Education Services (OSEP), State Annual Performance Reports, Letters to States. Retrieved October 20, 2004 from http://www.ed.gov/fund/data/report/idea/partbapr/index.html
[4] D. G. Malone and P. A. Gallagher. “Transition to preschool programs for young children with disabilities,” Journal of Early Intervention, vol.30(4), pp.341-356, 2008.
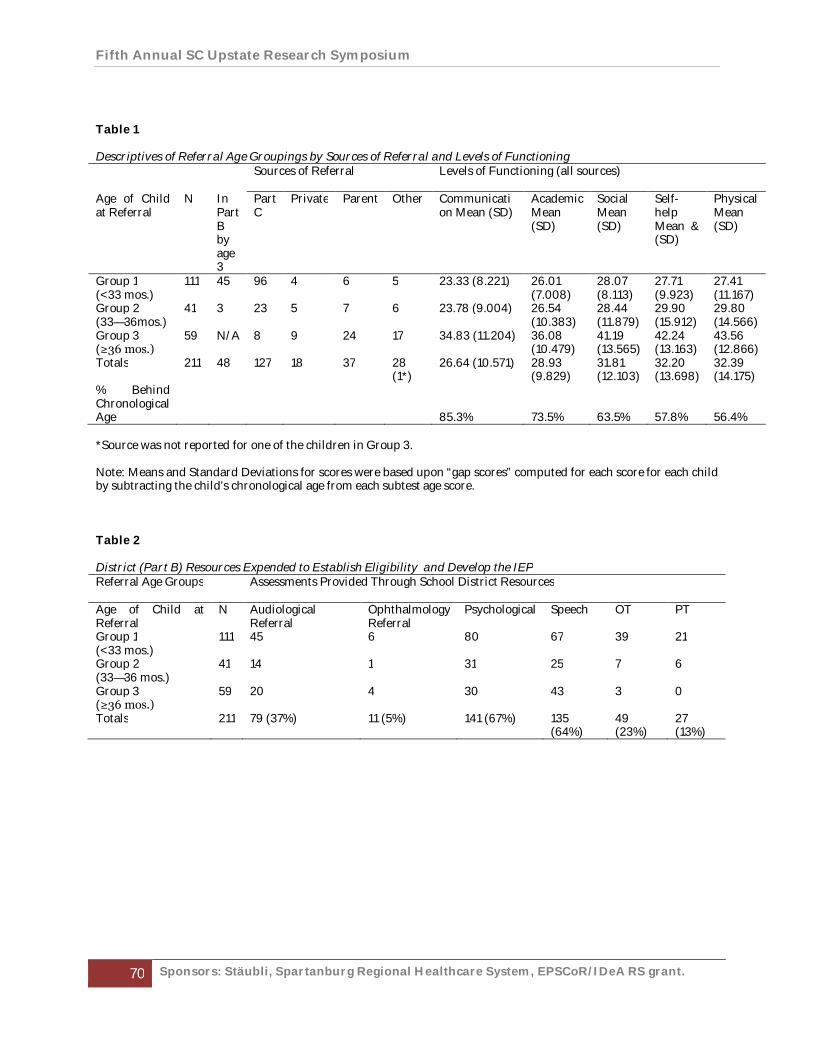
Fifth Annual SC Upstate Research Symposium
70 Sponsors: Stäubli, Spartanburg Regional Healthcare System, EPSCoR/IDeA RS grant.
Table 1 Descriptives of Referral Age Groupings by Sources of Referral and Levels of Functioning
Sources of Referral Levels of Functioning (all sources)
Age of Child at Referral
N
In Part B by age 3
Part C
Private Parent Other Communication Mean (SD)
Academic Mean (SD)
Social Mean (SD)
Self-help Mean & (SD)
Physical Mean (SD)
Group 1 (<33 mos.)
111 45 96 4 6 5 23.33 (8.221) 26.01 (7.008)
28.07 (8.113)
27.71 (9.923)
27.41 (11.167)
Group 2 (33—36mos.)
41 3 23 5 7 6 23.78 (9.004)
26.54 (10.383)
28.44 (11.879)
29.90 (15.912)
29.80 (14.566)
Group 3 (≥36 mos.)
59 N/A 8 9 24 17 34.83 (11.204) 36.08 (10.479)
41.19 (13.565)
42.24 (13.163)
43.56 (12.866)
Totals 211 48 127 18 37 28 (1*)
26.64 (10.571) 28.93 (9.829)
31.81 (12.103)
32.20 (13.698)
32.39 (14.175)
% Behind Chronological Age 85.3% 73.5% 63.5% 57.8% 56.4% *Source was not reported for one of the children in Group 3. Note: Means and Standard Deviations for scores were based upon “gap scores” computed for each score for each child by subtracting the child’s chronological age from each subtest age score. Table 2 District (Part B) Resources Expended to Establish Eligibility and Develop the IEP Referral Age Groups
Assessments Provided Through School District Resources
Age of Child at Referral
N Audiological Referral
Ophthalmology Referral
Psychological Speech OT PT
Group 1 (<33 mos.)
111 45 6 80 67 39 21
Group 2 (33—36 mos.)
41 14 1 31 25 7 6
Group 3 (≥36 mos.)
59 20 4 30 43 3 0
Totals 211 79 (37%) 11 (5%) 141 (67%) 135 (64%)
49 (23%)
27 (13%)

March 27th, 2009
Sponsors: Stäubli, Spartanburg Regional Healthcare System, EPSCoR/IDeA RS grant. 71
The Effects of Linoleic Acid on Taste Preferences in Rats Harry Quedenfeld and David Pittman
Psychology Department Wofford College
429 North Church Street, Spartanburg, SC 29303 {Quedenfeldhb, Dave.Pittman}@wofford.edu
Abstract - The free fatty acid (FFA) linoleic acid (LA), commonly found in dietary fats such as corn oil, can be detected by rats on the basis of gustatory cues as evidenced by 20s brief-access tests and following conditioned taste aversion pairings. FFAs depolarize the membrane potential of rat taste receptor cells by inhibiting delayed rectifying potassium channels. Trpm5 and CD36 have both shown to have roles in membrane depolarization by FFAs as well. This study examined licking responses of Sprague-Dawley rats to sweet, salt, sour, bitter and umami taste solutions with and without 200µM linoleic acid. When compared to solutions with the absence of LA, licking responses in the first day of testing for sucrose and monosodium glutamate increased whereas licking for NaCl decreased. It is suggested that LA may depolarize taste receptor cells and increase the perceived intensity of concomitant tastants. The increased palatability associated with foods in high dietary fats may be accounted for by detectable levels of LA. Keywords — Dietary fat, free fatty acids, gustatory, tastants, preference
INTRODUCTION
Palatable food is often eaten because food choices are closely associated with taste. Previous research has shown that animals [1-4] and humans [5] are attracted to dietary fats. This is reasonable because fats are high-energy foods; however, if they are over consumed it may lead to obesity. A multitude of health conditions are more likely in obese individuals including cardiovascular disease, stroke, hypertension, dyslipidemia, type II diabetes mellitus, osteoarthritis, asthma, and certain cancers [9]. More than 30% of Americans exceed a body mass index of 30 and are considered obese [10].Obesity can be attained with high levels of dietary fat consumption [11-12]. Taste palatability and postingestive signals both strongly influence overconsumption of dietary fat [13-15]. Recent reports of the detection of fatty acids based on gustatory cues in humans [16-20] and the issue of obesity evidences the importance to understanding an animal model in which we can explore the role of free fatty acids (FFAs) in taste.
Based on research that evidences transduction of FFAs, it is hypothesized that rats will more intensely perceive concomitant tastants in
solutions with linoleic acids than in solutions without it. This study tests this hypothesis by examining licking responses of rats in a two-bottle preference test over daily 1 hour testing sessions. One bottle in each cage contains 200 µM linoleic acid (LA) added to sucrose (sweet, nutritive), saccharin (sweet, nonnutritive), citric acid (sour), NaCl (salt) monosodium glutamate (MSG, umami) or quinine (bitter) taste solutions and the other bottle does not (NLA). Sixty-six µM LA is detectable and avoidable by rats, so 200µM was chosen to be sure of its detection [21]. In theory, linoleic acid depolarizes TRCs’ membranes and increases the perceived intensity of concomitant tastants, thus altering the licking responses to tastants.
RESULTS APPETITIVE STIMULI On day 1, the addition of 200µM LA to the appetitive stimuli sucrose and MSG increased licking responses. There were significantly more licks per burst for sucrose solutions with LA (t11=5.044, p=0.000), along with longer burst durations (t11=5.242, p=0.000). Sucrose solutions with LA also had more licks in the first minute (t11=2.666, p=0.022). There were also significant effects of LA on MSG solutions, with significantly more meal licks for LA solutions (t10=5.571, p=0.000). MSG with LA also had significantly longer session durations (t10=2.564, p=0.028), meal durations (t10=3.287, p=0.008), more bursts of licking (t10=2.611, p=0.026) and more last minute licks (t10=2.836, p=0.018). There were approximately twice as many meal licks for LA solutions than for those without, but they were not significantly different due to variability (t11=1.416, p=0.185).
The second day of testing for sucrose, MSG and saccharin resulted in no significant differences in licking responses between any variables of LA versus NLA solutions. Within-side comparisons revealed the licking responses within the left and ride side for sucrose, MSG and saccharin were not significantly different between LA and NLA solutions.
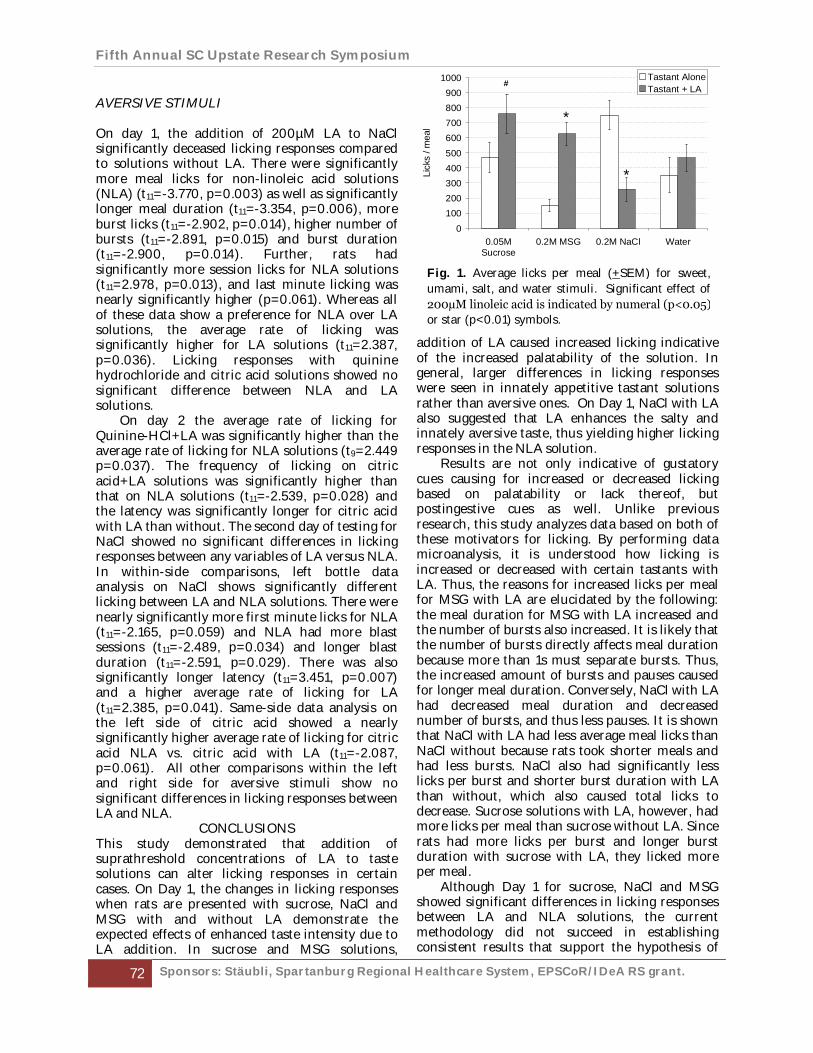
Fifth Annual SC Upstate Research Symposium
72 Sponsors: Stäubli, Spartanburg Regional Healthcare System, EPSCoR/IDeA RS grant.
AVERSIVE STIMULI On day 1, the addition of 200µM LA to NaCl significantly deceased licking responses compared to solutions without LA. There were significantly more meal licks for non-linoleic acid solutions (NLA) (t11=-3.770, p=0.003) as well as significantly longer meal duration (t11=-3.354, p=0.006), more burst licks (t11=-2.902, p=0.014), higher number of bursts (t11=-2.891, p=0.015) and burst duration (t11=-2.900, p=0.014). Further, rats had significantly more session licks for NLA solutions (t11=2.978, p=0.013), and last minute licking was nearly significantly higher (p=0.061). Whereas all of these data show a preference for NLA over LA solutions, the average rate of licking was significantly higher for LA solutions (t11=2.387, p=0.036). Licking responses with quinine hydrochloride and citric acid solutions showed no significant difference between NLA and LA solutions.
On day 2 the average rate of licking for Quinine-HCl+LA was significantly higher than the average rate of licking for NLA solutions (t9=2.449 p=0.037). The frequency of licking on citric acid+LA solutions was significantly higher than that on NLA solutions (t11=-2.539, p=0.028) and the latency was significantly longer for citric acid with LA than without. The second day of testing for NaCl showed no significant differences in licking responses between any variables of LA versus NLA. In within-side comparisons, left bottle data analysis on NaCl shows significantly different licking between LA and NLA solutions. There were nearly significantly more first minute licks for NLA (t11=-2.165, p=0.059) and NLA had more blast sessions (t11=-2.489, p=0.034) and longer blast duration (t11=-2.591, p=0.029). There was also significantly longer latency (t11=3.451, p=0.007) and a higher average rate of licking for LA (t11=2.385, p=0.041). Same-side data analysis on the left side of citric acid showed a nearly significantly higher average rate of licking for citric acid NLA vs. citric acid with LA (t11=-2.087, p=0.061). All other comparisons within the left and right side for aversive stimuli show no significant differences in licking responses between LA and NLA.
CONCLUSIONS This study demonstrated that addition of suprathreshold concentrations of LA to taste solutions can alter licking responses in certain cases. On Day 1, the changes in licking responses when rats are presented with sucrose, NaCl and MSG with and without LA demonstrate the expected effects of enhanced taste intensity due to LA addition. In sucrose and MSG solutions,
addition of LA caused increased licking indicative of the increased palatability of the solution. In general, larger differences in licking responses were seen in innately appetitive tastant solutions rather than aversive ones. On Day 1, NaCl with LA also suggested that LA enhances the salty and innately aversive taste, thus yielding higher licking responses in the NLA solution.
Results are not only indicative of gustatory cues causing for increased or decreased licking based on palatability or lack thereof, but postingestive cues as well. Unlike previous research, this study analyzes data based on both of these motivators for licking. By performing data microanalysis, it is understood how licking is increased or decreased with certain tastants with LA. Thus, the reasons for increased licks per meal for MSG with LA are elucidated by the following: the meal duration for MSG with LA increased and the number of bursts also increased. It is likely that the number of bursts directly affects meal duration because more than 1s must separate bursts. Thus, the increased amount of bursts and pauses caused for longer meal duration. Conversely, NaCl with LA had decreased meal duration and decreased number of bursts, and thus less pauses. It is shown that NaCl with LA had less average meal licks than NaCl without because rats took shorter meals and had less bursts. NaCl also had significantly less licks per burst and shorter burst duration with LA than without, which also caused total licks to decrease. Sucrose solutions with LA, however, had more licks per meal than sucrose without LA. Since rats had more licks per burst and longer burst duration with sucrose with LA, they licked more per meal.
Although Day 1 for sucrose, NaCl and MSG showed significant differences in licking responses between LA and NLA solutions, the current methodology did not succeed in establishing consistent results that support the hypothesis of
0100200300400500600700800900
1000
0.05MSucrose
0.2M MSG 0.2M NaCl Water
Lick
s / m
eal
Tastant AloneTastant + LA#
*
*
Fig. 1. Average licks per meal (+SEM) for sweet, umami, salt, and water stimuli. Significant effect of 200µM linoleic acid is indicated by numeral (p<0.05) or star (p<0.01) symbols.
March 27th, 2009
Sponsors: Stäubli, Spartanburg Regional Healthcare System, EPSCoR/IDeA RS grant. 73
LA enhancing taste. Side preferences may have significantly affected licking responses, as the rats had licked on right-sided bottles their entire lives until November 2008. There was not enough time to eliminate their side preference before testing, so it was still a factor. When side-specific analysis was conducted on left and right sides between LA and NLA with NaCl, only the left showed significant differences in licking because the rats were accustomed to licking to the right. In this instance, licking on the left side more purely shows the effects of palatability on licking responses. On Day 1 of testing for sucrose, NaCl and MSG, all of the more appetitive tastants were on the right side, sucrose and MSG with LA and NaCl without LA were all on the right. The side-specific analysis reveals that there was no significant licking between LA and NLA on either side for sucrose or MSG on day 1, however. The significant differences in licking responses are confounded by side preference.
The concentration of 5µM Q-HCl on Day 1 was not high enough to be detected, for the rats licked abundantly on both sides, with the highest mean licking of all tastants (mean NLA meal licks= 636.106). On Day 2, a concentration of 50µM Q-HCl was presented to the rats with and without LA. Mean meal licks decreased greatly from Day 1, with 219.667 average meal licks for NLA as opposed to 636.106. Though licking decreased, the 50µM concentration might not be high enough to cause significantly higher aversion with addition of LA, so a proposed concentration of 75µM Q-HCl might be used in the future.
Future 2-bottle preference tests should consider testing for more than 1-h because unlike 20s studies conducted with 1 bottle, rats must choose between two tastants. Thus, the longer the test the more likely it is to show a more accurate representation of tasting preference. One-hour two-bottle preference tests likely may not be enough time for the rats to adequately sample both solutions. In a future study, a 23-h test could be conducted to ensure a large amount of licking and enough time to show preference. A 23-h study is more naturalistic because their exposure to water is almost all day, nigh the same as the 24-h drinking ad libitum. Further, this would avoid the issue of having water-replete or water-restricted rats. Though the rats in this study were water-replete, they had not drank for 2-h prior to testing and would lick unnaturally more on the first bottle they sampled, as opposed to a 23-h test where the tastant solutions are all they have to drink and they would not be without water for more than 1-h. Since the solutions are all the rats have to drink for
the day, they will choose the most appetitive solution.
REFERENCES [1] Imaizumi M, Takeda M, Fushiki T. Effects of oil
inftake in the conditioned place preference test in mice. Brain Res 870:150-6, 2000.
[2] Takeda M, Imazizumi M, Sawano S, Manabe Y, Fushiki T. Long-Term optional ingestion of corn oil induces excessive caloric intae and obesity in mice. Nutrition 17:117-20, 2001.
[3] Takeda M, Sawano S, Imaizumi M, Fushiki T. Preference for corn oil in olfactory-blocked mice in the conditioned place preference test and the two-bottle choice test. Life Sci 69:847-54, 2001.
[4] Yoneda T, Taka Y, Okamura M, Mizushige T, Matsumura S, Manabe T, et al. Reinforcing effect for corn oil stimulus was concentration dependent in an operant task in mice. Life Sci 81:1585-92, 2007.
[5] Drewnowski A. Why do we like fat? J Am Diet Assoc 97:S58-62, 1997.
[9] Mokdad AH, Ford ES, Bowman BA, Dietz WH, Vinicor F, Bales VS, Marks JS. 2003. Prevalence of obesity, diabetes and obesity-related health risk factors, J Am Med Assoc 289:76-9, 2001.
[10] Ogden CL, Carroll MD, Curtin LR, McDowell MA, Tabak CJ, Flegal KM. 2006. Prevalence of overweight and obesity in the United States, J Am Med Assoc 295:1549-55, 1999-2004.
[11] Miller WC, Lindeman AK, Wallace J, Niederpruem M. Diet composition, energy intake, and exercise in relation to body fat in men and women. Am J Clin Nutr 52:426-30, 1990.
[12] Miller WC, Niederpruem MG, Wallace JP, Lindeman AK. Dietary fat, sugar, and fiber predict body fat content. J Am Diet Assoc 94:612-5, 1994.
[13] Drewnowski A, Greenwood MR. Cream and sugar: human preferences for high-fat foods. Physiol Behav 30:629-33, 1983.
[14] Elizalde G, Sclafani A. Fat appetite in rats: flavor preferences conditioned by nutritive and non-nutritive oil emulsions. Appetite 15:189-97, 1990.
[15] Warwick ZS, Schiffman SS. Sensory evaluations of fat-sucrose and fat-salt mixtures: relationship to age and weight status. Phsiol Behav 48:633-6, 1990.
[16] Chale-Rush, A., Burgess, J.R. and Mattes, R.D. Multiple routes of chemosensitivity to free fatty acids in humans. Am. J. Phsiol Gastrointest. Liver Physiol, 292, G1206-G1212, 2007b.
[17] Mattes, R.D. Oral exposure to butter, but not fat replacers elevates postprandial triacylglycerol concentration in humans. J. Nutr., 131, 1491-1496, 2001a.
[18] Mattes, R.D. The taste of fat elevates postprandial triacylglycerol. Phsyiol Behav., 74, 343-348, 2001b.
[19] Mattes, R.D. Fat taste and lipid metabolism in humans. Physiol Behav., 86, 691-697, 2005.
[20] Mattes, R.D. Effects of linoleic acid on sweet, sour, salty, and bitter taste thresholds and intensity of ratings of adults. Am. J. Physiol Gastroinstest. Liver Physiol, 292, G1243-G1248, 2007.
[21] Fukuwatari T, Shibata K, Iguchi K, Saeki T, Iwata A, Tani K, Sugimoto E, Fushiki T. Role of gustation in the recognition of oleate and triolein in anosmic rats. Physiol Behav 78:579-83, 2003.
Fifth Annual SC Upstate Research Symposium
74 Sponsors: Stäubli, Spartanburg Regional Healthcare System, EPSCoR/IDeA RS grant.
How Water-Replete Rats Respond to Different Tastes under the Influence of benzodiazepines Lindsey Richardson and David Pittman
Psychology Wofford College
429 North Church Street, Spartanburg, SC 29303 {RichardsonLM, Dave.Pittman}@wofford.edu
Abstract - Benzodiazepines such as chlordiazepoxide (CDP) are known to cause hyperphagia in rats when given sweet tastants and rat chow. We hypothesize that this increase in feeding is produced by an increase in palatability. In this experiment we examined the effects of CDP on the licking for water-replete rats across sweet, sour, bitter, and salt solutions during 60-min tests. Microanalysis of the licking patterns during testing identified specific variables associated with either changes in taste-evaluation (first minute licks, meal licks) and motivational influences on ingestion (latency, meal duration). We found that CDP significantly increased the total number of meal licks for water, both sweet stimuli, and bitter. CDP also significantly increased the number of first minute licks for water, both sweet tastants, bitter, and salt. CDP did not affect the meal duration data indicating an absence of post-ingestive effects. The latency was not affected by CDP either meaning the amount of time that passed before the first lick was not significantly affected. This research can be related to people taking anti-anxiety medications. People should be warned that benzodiazepines may increase their food consumption because appetitive and aversive foods become more palatable, even though they are not food deprived. Keywords — Gustatory, GABA, Behavior, Ingestion, Rat.
INTRODUCTION Benzodiazepines are drugs that are most commonly prescribed as an anti-anxiety medication. The drug increases the effects of a particular neurotransmitter, GABA, which is found in areas of hindbrain involved in processing taste information as the signals travel from our mouth to the brain. GABA functions as an inhibitory neurotransmitter in the gustatory region of the parabrachial nucleus (PBN), mediated mostly by GABAA receptors [1]. There have been many studies in the past that have demonstrated an increase in food consumption due to benzodiazepine use [2-4]. The common thought is that these drugs may actually make foods taste better. It is suggested that benzodiazepines reduce the aversive components of an aversive stimulus which enhances palatability and increases positive behavioral responses [5]. The study I conducted involved testing whether benzodiazepines cause an increase in palatability across 5 different tastants
in a naturalistic setting, meaning they had free access to food and water. The data was recorded with a lickometer that was connected to a computer allowing the measurement of the time of each lick. We hypothesized that injections of benzodiazepines will cause water-replete rats to increase their licking to aversive and appetitive stimuli by increasing the palatability across all tastants.
METHODS 16 male Sprague-Dawley rats were used in this experiment. One concentration of five taste stimuli were used to test the effects of benzodiazepines on ingestion patterns. Water was also tested as a non-taste control solution. The testing rig contained eight AC-108 gustometer cages each of which tested an individual rat. CDP (10 mg/1 ml/1 kg) and saline injections were given twenty minutes prior to each testing session in order for the drug to produce its maximal effects. The groups were counterbalanced by alternating days of CDP and saline injections. Bottle weight was measured before and after testing sessions in order to determine consumption and the AC-108 measured the time of each lick during the one hour test session. Complex microstructural analyses were conducted to examine meal analysis (meal licks and meal duration), licking pattern analysis (number of bursts, size of bursts, burst duration and pause duration), and taste-mediated analysis (first minute licks and average rate). A mixed factorial ANOVA was conducted in order to examine the main effects of drug and concentration as well as any interactions. Post-hoc paired t-tests were used to determine significant effects of CDP within each concentration. Significance was defined at p < 0.05.
RESULTS CDP significantly increased the number of meal licks for water, both sweet stimuli, and bitter as shown in Figure 1A. The increase in licking to the sweet stimuli was two to three times the amount of licking when the control saline injection was given. This increase in meal licks signifies the stimulus is
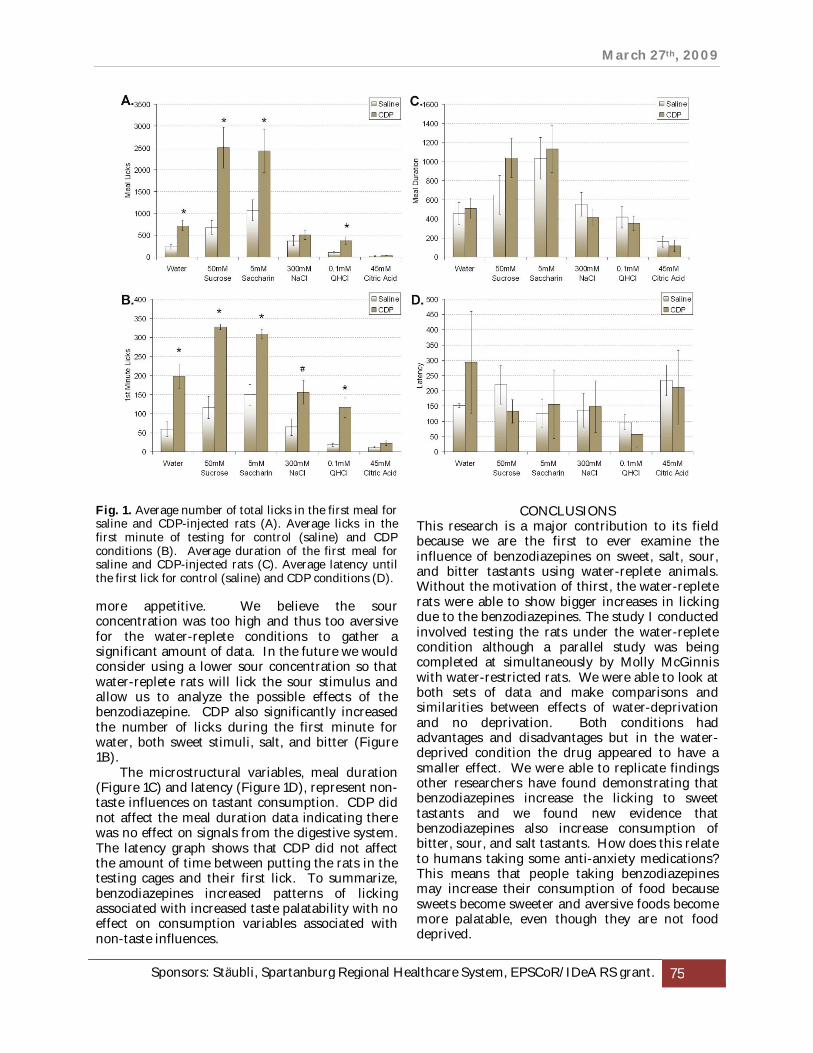
March 27th, 2009
Sponsors: Stäubli, Spartanburg Regional Healthcare System, EPSCoR/IDeA RS grant. 75
Fig. 1. Average number of total licks in the first meal for saline and CDP-injected rats (A). Average licks in the first minute of testing for control (saline) and CDP conditions (B). Average duration of the first meal for saline and CDP-injected rats (C). Average latency until the first lick for control (saline) and CDP conditions (D).
more appetitive. We believe the sour concentration was too high and thus too aversive for the water-replete conditions to gather a significant amount of data. In the future we would consider using a lower sour concentration so that water-replete rats will lick the sour stimulus and allow us to analyze the possible effects of the benzodiazepine. CDP also significantly increased the number of licks during the first minute for water, both sweet stimuli, salt, and bitter (Figure 1B).
The microstructural variables, meal duration (Figure 1C) and latency (Figure 1D), represent non-taste influences on tastant consumption. CDP did not affect the meal duration data indicating there was no effect on signals from the digestive system. The latency graph shows that CDP did not affect the amount of time between putting the rats in the testing cages and their first lick. To summarize, benzodiazepines increased patterns of licking associated with increased taste palatability with no effect on consumption variables associated with non-taste influences.
CONCLUSIONS
This research is a major contribution to its field because we are the first to ever examine the influence of benzodiazepines on sweet, salt, sour, and bitter tastants using water-replete animals. Without the motivation of thirst, the water-replete rats were able to show bigger increases in licking due to the benzodiazepines. The study I conducted involved testing the rats under the water-replete condition although a parallel study was being completed at simultaneously by Molly McGinnis with water-restricted rats. We were able to look at both sets of data and make comparisons and similarities between effects of water-deprivation and no deprivation. Both conditions had advantages and disadvantages but in the water-deprived condition the drug appeared to have a smaller effect. We were able to replicate findings other researchers have found demonstrating that benzodiazepines increase the licking to sweet tastants and we found new evidence that benzodiazepines also increase consumption of bitter, sour, and salt tastants. How does this relate to humans taking some anti-anxiety medications? This means that people taking benzodiazepines may increase their consumption of food because sweets become sweeter and aversive foods become more palatable, even though they are not food deprived.

Fifth Annual SC Upstate Research Symposium
76 Sponsors: Stäubli, Spartanburg Regional Healthcare System, EPSCoR/IDeA RS grant.
ACKNOWLEDGMENTS This work was funded by the Fullerton Foundation through the Community of Scholars program at Wofford College.
REFERENCES [1] T. Yamamoto. “Central mechanisms of taste:
Cognition, emotion and taste-elicited behaviors.” Japanese Dental Science Review. pp 91-99, 2008.
[2] S. Higgs and SJ Cooper. “Hyperphagia induced by direct administration of midazolam into the parabrachial nucleus of the rat,” European Journal of Pharmacology vol. 313, pp 1-9, 1996.
[3] S. Higgs and S.J. Cooper. “Increased food intake following injection of the benzodiazepine receptor agonist midazolam into the IVth ventricle.” Pharmacol Biochem Behav, vol. 55, pp 81-86, 1996.
[4] S.J. Cooper. “Palatability-dependent appetite and benzodiazepines: new directions from the pharmacology of GABA(A) receptor subtypes.” Appetite, vol. 44, pp 133-150, 2005.
[5] Berridge and Treit. “Chlordiazepoxide directly enhances positive ingestive reactions in rats.” Pharmacology, Biochemistry & Behavior, vol. 24(2), pp 217-21, 1986.
March 27th, 2009
Sponsors: Stäubli, Spartanburg Regional Healthcare System, EPSCoR/IDeA RS grant. 77
How Water-Deprived Rats Respond to Different Tastes under the Influence of benzodiazepines
Molly McGinnis and David Pittman Psychology Department
Wofford College 429 North Church St. Spartanburg, SC 29303 {McGinnisMR, Dave.Pittman}@wofford.edu
Abstract - Previous research has shown that CDP, a benzodiazepine, causes hyperphagia in rats. We hypothesize that the hyperphagia is due to an increase in the palatability of taste by CDP. A counterbalanced design was used to test the effect of CDP on the licking patterns of water-deplete rats to sweet, salt, and bitter tastants during 60-min tests. Microanalysis of the licking patterns identified specific variables associated with either changes in taste-evaluation (meal licks, average rate) or motivational influences on ingestion not linked to taste (latency, meal duration). It was found that while under the influence of CDP, rats licked significantly more and at a faster rate to all tastants except sour. Increases in these variables reflect an increase in taste palatability. No significant differences were found in the non-taste motivational state variables, meal duration and latency. Weight gain is one of the side-effects and can be explained by this hyperphagia in rats. The reason people are over-eating can be attributed to the fact that the palatability of the tastants is increased. This information may be used by physicians to warn patients to be mindful of what they are eating while using these drugs in order to avoid weight gain. Keywords — Gustatory, GABA, Behavior, Ingestion, Rat.
INTRODUCTION Benzodiazepines, which are most-widely known as being used for anti-anxiety purposes, have been shown to make certain foods appear to be more palatable to people [1]. A known side-effect to taking this anti-anxiety medication is weight-gain. Scientists have found that rats consume more foods when under the influence of benzodiazepines [2]. There are areas in the hindbrain where taste signals are processed as they are sent from our mouth to our brain [3]. It is thought that GABA is a neurotransmitter used in the processing of this taste information, and benzodiazepines are known to increase the effectiveness of this neurotransmitter. Thus, increased consumption of food may be due to benzodiazepines making the food taste better.
Previous research has shown that benzodiazepines increase rat consumption of sweet stimuli [4]. The purpose of our research is to test benzodiazepine’s influence across the four different basic tastes: sweet, sour, salty, and bitter. The
research we aim to do is unique in that it includes a wider range of tastants including aversive tastes in addition to the previously tested sweet tastants, an appetitive stimuli to rats. It is hypothesized that the rats will increase their consumption of a wider array of tastants, including the more unpleasant tastes (sour and salty) based on the effect that benzodiazepine has on the gustatory system.
METHODS
16 male Sprague-Dawley rats were used in this experiment. One concentration of five taste stimuli were used to test the effects of benzodiazepines on ingestion patterns. Water was also tested as a non-taste control solution. The testing rig contained eight AC-108 gustometer cages each of which tested an individual rat. Prior to testing, rats were placed on a 23-hour water restriction schedule. CDP (10 mg/1 ml/1 kg) and saline injections were given twenty minutes prior to each testing session in order for the drug to produce its maximal effects. The groups were counterbalanced by alternating days of CDP and saline injections. Bottle weight was measured before and after testing sessions in order to determine consumption and the AC-108 measured the time of each lick during the one hour test session. Complex microstructural analyses were conducted to examine meal analysis (meal licks and meal duration), licking pattern analysis (number of bursts, size of bursts, burst duration and pause duration), and taste-mediated analysis (first minute licks and average rate). A mixed factorial ANOVA was conducted in order to examine the main effects of drug and concentration as well as any interactions. Post-hoc paired t-tests were used to determine significant effects of CDP within each concentration. Significance was defined at p < 0.05.
RESULTS We found that while under the influence of the drug, the rats licked more to all taste solutions (see Figure 1A). To tell us how they licked more, we looked at the pattern of consumption provided by the microanalysis of the data. Looking at the data
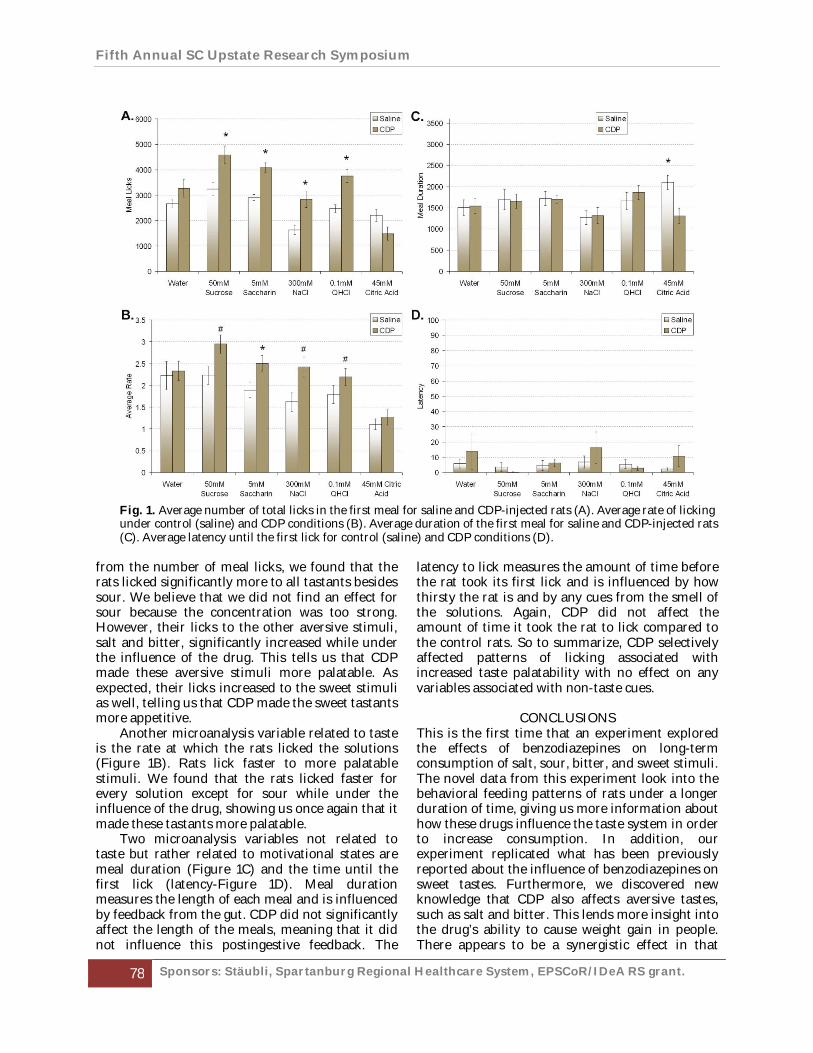
Fifth Annual SC Upstate Research Symposium
78 Sponsors: Stäubli, Spartanburg Regional Healthcare System, EPSCoR/IDeA RS grant.
Fig. 1. Average number of total licks in the first meal for saline and CDP-injected rats (A). Average rate of licking under control (saline) and CDP conditions (B). Average duration of the first meal for saline and CDP-injected rats (C). Average latency until the first lick for control (saline) and CDP conditions (D).
from the number of meal licks, we found that the rats licked significantly more to all tastants besides sour. We believe that we did not find an effect for sour because the concentration was too strong. However, their licks to the other aversive stimuli, salt and bitter, significantly increased while under the influence of the drug. This tells us that CDP made these aversive stimuli more palatable. As expected, their licks increased to the sweet stimuli as well, telling us that CDP made the sweet tastants more appetitive.
Another microanalysis variable related to taste is the rate at which the rats licked the solutions (Figure 1B). Rats lick faster to more palatable stimuli. We found that the rats licked faster for every solution except for sour while under the influence of the drug, showing us once again that it made these tastants more palatable.
Two microanalysis variables not related to taste but rather related to motivational states are meal duration (Figure 1C) and the time until the first lick (latency-Figure 1D). Meal duration measures the length of each meal and is influenced by feedback from the gut. CDP did not significantly affect the length of the meals, meaning that it did not influence this postingestive feedback. The
latency to lick measures the amount of time before the rat took its first lick and is influenced by how thirsty the rat is and by any cues from the smell of the solutions. Again, CDP did not affect the amount of time it took the rat to lick compared to the control rats. So to summarize, CDP selectively affected patterns of licking associated with increased taste palatability with no effect on any variables associated with non-taste cues.
CONCLUSIONS
This is the first time that an experiment explored the effects of benzodiazepines on long-term consumption of salt, sour, bitter, and sweet stimuli. The novel data from this experiment look into the behavioral feeding patterns of rats under a longer duration of time, giving us more information about how these drugs influence the taste system in order to increase consumption. In addition, our experiment replicated what has been previously reported about the influence of benzodiazepines on sweet tastes. Furthermore, we discovered new knowledge that CDP also affects aversive tastes, such as salt and bitter. This lends more insight into the drug’s ability to cause weight gain in people. There appears to be a synergistic effect in that

March 27th, 2009
Sponsors: Stäubli, Spartanburg Regional Healthcare System, EPSCoR/IDeA RS grant. 79
benzodiazepines make sweets taste better and at the same time increase the palatability of normally aversive stimuli. This information should be used by physicians to warn patients to pay more attention to what they eat while using these drugs in order to avoid weight gain.
Information from this research was compared to another study conducted in our laboratory done by Lindsey Richardson, who used a similar procedure but tested water-replete rats. Comparing our results showed that when rats are not thirsty there is a bigger drug effect. Together both studies show that by making food tastier, benzodiazepines have the ability to stimulate over-eating, and consequently promote weight gain.
ACKNOWLEDGMENTS This work was funded by the Fullerton Foundation through the Community of Scholars program at Wofford College.
REFERENCES
[1] L. Longo. “Addiction: Part I. Benzodiazepines--Side Effects, Abuse Risk and Alternatives,” 2000.
[2] S. Higgs and S. Cooper. “Hyperphagia induced by direct administration of midazolam into the parabrachial nucleus of the rat,” European Journal of Pharmacology, vol. 313, pp 1-9, 1996.
[3] T. Yamomoto. “Central mechanisms of taste: Cognition, emotion and taste-elicited behaviors,” Japanese Dental Science Review, vol. 44(2), pp 91-99, 2008
[4] K. Berridge and D. Treit. “Chlordiazepoxide directly enhances positive ingestive reactions in rats,” Pharmacology, Biochemistry & Behavior, vol. 24(2), pp 217-221, 1986.

Fifth Annual SC Upstate Research Symposium
80 Sponsors: Stäubli, Spartanburg Regional Healthcare System, EPSCoR/IDeA RS grant.
Older Husbands and Younger Wives: The January-May Marriage in Nineteenth-Century British Literature
Esther Godfrey Department of Languages, Literature, and Composition
University of South Carolina Upstate 800 University Way, Spartanburg, SC 29303
[email protected] Abstract - My presentation summarizes the theories and research of my first book, The January-May Marriage in Nineteenth-Century British Literature, which is scheduled to be released by Palgrave Macmillan in February 2009. This book offers the first substantial study on a theme that has been so much a part of nineteenth-century literature that it has been ignored—so obvious, in truth, that it has been overlooked. Despite its frequent emergence in the literature of the period, the January-May marriage has received very little scholarly treatment. Perhaps because such marriages remain common in the twenty-first century and because their existence has a long history in Western societies, these relationships appear to have been too commonplace to deserve much critical attention. Keywords — Marriage, British Literature, Age, Gender
INTRODUCTION Over the past several decades, increasing attention has been given to the impact of historical and cultural factors such as race, class, and gender on the interpretation of nineteenth-century literature. Critics like Gayatri Spivak, Mary Poovey, Sandra Gilbert and Susan Gubar have demonstrated that these three aspects of identity are crucial to negotiations of power within literary texts, and the continued popularity of these critical themes attests to the rich potential that such readings afford. And yet, an emphasis on the triad of race, class, and gender can overlook other important facets of identity formation in the literature. Despite the recent increase of attention on the figure of the child in literature, age has largely been neglected as an important component of social mechanisms of power, but an analysis of the literature reveals that age can work in conjunction with race, class, and especially gender to destabilize or to reinforce hegemonic systems of control and influence.
Despite the popularity of the January-May theme in the Victorian period, academic scholarship has missed the theme’s importance as social commentary. There are a handful of articles that specifically address the concept of young wives in relation to certain nineteenth-century works, and Robert Polhemus alludes to the theme in
sections of his influential Lot’s Daughters, but, to my knowledge, no substantial study has been offered to address the larger Victorian phenomenon.
Even when January-May marriages do arise as side-issues in critical discussions, critics have traditionally followed the lead of second wave feminist critics and enlisted such marriages as further evidence of the oppression of women in the nineteenth century, with the beautiful and saint-like heroine suffering under the unreasonable domination of a patriarchal husband. This critical perspective emphasizes the powerlessness of the young wife and laments her experiences within the confines of society and marriage. Speaking of the famous literary marriage between Dorothea Brooke and Edward Casaubon in George Eliot’s Middlemarch, Barbara Hardy expresses this view with a particular nod to the age difference in the marriage; she claims that such fictional suffering heroines
are all brought up in a culture where marriage is what is expected of them and is all that is expected of them. The horror and misery of such asystem is demonstrated in marriages with men who are old enough to be their fathers, who have little in common with them, and who in various ways fail in sexuality and love. Casaubon is over forty-five, Dorothea nineteen. (70)
I do not claim that Hardy is entirely wrong in her assessment of these types of marriages. Certainly Dorothea and other young brides sometimes feel “horror and misery” from their marriages that they never expected in their engagements and that are related to the generational gaps that divide the spouses. Yet the distribution of power in these marriages is far from unidirectional, and January-May marriages are neither wholly libratory nor wholly conservative in their approaches to gender. Rather than displaying simplistic power structures, these marriages often reveal complex systems of gendered control, and age proves a crucial, though complex, marker of the division of power between
March 27th, 2009
Sponsors: Stäubli, Spartanburg Regional Healthcare System, EPSCoR/IDeA RS grant. 81
husbands and wives. My book explores the multiple possibilities that these relationships explore through the themes of incest, aesthetics, horror, economics, and love.
SECTION TWO In Charlotte Brontë’s 1848 Jane Eyre, Rochester’s housekeeper Mrs. Fairfax responds to Jane with certain dismay at the thought of her forty-year-old master marrying the twenty-five-year-old Blanche Ingram: “I should scarcely fancy Mr. Rochester would entertain an idea of the sort” (163). Yet to Mrs. Fairfax’s great surprise, Rochester later makes an “unequal match” with an even greater disparity in age to Jane, ultimately bringing the novel to a sentimental close. Marriages with large age differences form an important narrative frame in Victorian British literature, and they conveniently merge disruptive and conservative forces. Although they play with normative codes of sexual propriety and gender identity, they find legitimacy and acceptance through their allegiances to literary, social, and legal conventions.
Boasting a long literary history, the January-May marriage had proven to be an effective plot structure that could evoke a wealth of unspoken cultural assumptions concerning male potency, female fidelity, economic exchange, and gender-based power. Able to meet a wide range of objectives, the January-May theme could work subversively or conservatively, through humor or through melodrama. The unique possibilities of the January-May marriage thus offers an important tool for authors and readers attempting to negotiate specifically nineteenth-century concerns regarding gender and sexuality, and the theme resurfaces with newfound energy and intent throughout the period. Without becoming trite, January-May relationships become central to the plots of dozens of canonical nineteenth-century texts, and they shade the experiences of characters and readers through countless other works. It appears that peculiar circumstances converge in the nineteenth century to encourage a heightened interest in the theme’s potential, and consequently, while January-May marriages pervade British literature, I maintain that the popularity of this theme emerges in response to numerous social, industrial, political and economic factors that heightened anxieties over the identities of men and women.
CHAPTER ONE My first chapter gives an overview of the literary and historical tradition of this theme. I present a general description of the theme’s evolution over time, focusing on particularly intriguing examples from the tradition from authors such as Chaucer, William Shakespeare, and Aphra Behn. Because I contend that the number of these marriages in nineteenth-century literature does more than reflect the prevalence of these relationships in real life, I describe some of the social and legal changes that made these marriages provocative to the nineteenth-century imagination. I also describe the two dominant patterns that I find in the theme—a love triangle and a parody of traditional marriage—and I discuss the ways these patterns can affect meaning in the texts. I conclude this chapter with a discussion of Canto I of Byron’s Don Juan as a case study of literary January-May marriages. CHAPTER TWO The second chapter of the book addresses the “daddy-daughter” element of January-May marriages through detailed readings of Dickens’s texts, including Nicholas Nickleby, The Cricket on the Hearth, David Copperfield, and Bleak House. Initially, my attention here appears to cover well-traveled critical ground; as Robert M. Polhemus observes, “Ever since people learned that David Copperfield was a favorite of Freud’s...readers have found illuminating signs of the Oedipus complex in the book” (“The Favorite Child” 10). While the incestuous implications of January-May marriages remain obvious to most readers of these works, I believe that this psychological approach has been vastly oversimplified. Since I read marriage as psychologically and legally essential to Dickens’s understanding of family and patriarchy, I claim that the introduction of the incestuous element into marriage (however legitimized by the lack of familial blood) proves to be a destabilizing force for larger social constructions. Ultimately, this chapter suggests that the daddy-daughter aspect of these intergenerational relationships undermines patriarchal authority and argues for reading these incestuous marriages as opportunities for gender play rather than as inherent victimization. CHAPTER THREE The third chapter explores the visualization of power in January-May marriages and the attention to the effects of aging on the body; an examination of the aesthetics of January-May images sharpens
Fifth Annual SC Upstate Research Symposium
82 Sponsors: Stäubli, Spartanburg Regional Healthcare System, EPSCoR/IDeA RS grant.
a critical understanding of the theme’s mechanics. Critically, this chapter is aligned with recent efforts by theorists like Elizabeth Grosz to reassess the corporeality of the physical body without essentialzing the body as a site for gender difference. This chapter develops in three sections how Victorian perceptions of vision and aesthetics respond to aging and how those perceptions relate to power. The first section of this chapter examines four paintings from the Victorian period that engage the theme of the January-May marriage: William Quiller Orchardson’s series, The First Cloud, Mariage de Convenance, and After!, as well as Edmund Blair-Leighton’s Until Death Do Us Part. All four paintings use the bodies of older men and younger women to visualize power, destabilizing and returning agency along gendered divides. This chapter concludes with a third section that discusses male embodiment in Middlemarch, focusing specifically on the attention given to Casaubon’s physical appearance. The novel’s vivid, however unkind or grotesque, descriptions of Casaubon heighten the text’s dalliances with sexual deviancy and its play with marital power, creating aesthetic images of “Old and Young” that both titillate and repulse readers’ sentimental and sexual expectations. CHAPTER FOUR The fourth chapter addresses the Gothic element within the January-May marriage theme. I argue that the January-May marriage itself presents a historical anachronism, merging past and present with a condition just as horrifying as a nineteenth-century venture into a medieval castle. As historical anachronism, the “horror” of the January-May marriage caters to broader nineteenth-century fears of aging and proves all the more terrible (and exciting) because of its associations with sexuality in the marriage theme. This perceived threat of older men penetrating young women corresponds with social anxieties about potential emotional and economic burdens of what was thought to be an increasingly aged population. In texts like Hardy’s Jude the Obscure, January-May marriages become a form of Gothic nightmare, indicating a direct correlation between the popularity of the January-May theme in the nineteenth century and the rise of the vampire legend in literature. I read three vampire texts—The Vampyre, Varney the Vampire, and Dracula—as contributors to and participants in the January-May marriage theme.
CHAPTER FIVE Focusing on Sense and Sensibility, Jane Eyre, and Lady Audley’s Secret, the fifth chapter probes the sexual economies that shape the January-May marriage theme. Unfortunately, many of these assumptions about this market have become so familiar that they are taken for granted and hence misunderstood. Because the traffic in young women has been so prevalent in Western society and its literature, one must actively defamiliarize the text from a male-dominated sexual economy that one has been taught to expect in order to appreciate the complexities that such exchanges encapsulate. I demonstrate how the emphasis on age in January-May texts reveals that these interrelated systems also contribute to a traffic in men.
CHAPTER SIX My final chapter negotiates how intergenerational love functions despite the economics of marriage. Austen’s Emma potentially reconciles a difference in age with an overwhelming love, and several of the marriages that are not fulfilled offer other examples. In An Old Man’s Love, a man who is initially concerned with gaining the affections of his ward, who “did receive from his hands all that she had—her bread and meat, her bed, her very clothes,” ultimately surrenders his desire for her, dissolves their engagement, and even provides a dowry so that she can marry another lover (who is closer to her age). John Jarndyce in Bleak House also elects to withdraw his marital prospects with Esther, establishing her and her young love Woodcourt in their own “Bleak House.” And Sydney Carton makes the ultimate sacrifice of his life to free the lover of Lucy in A Tale of Two Cities. Rather than suggesting that a submissive nature is vital to true love, I claim that such texts support a genderless sacrifical ideal that is far removed from the self-centered practices of the older husbands in Middlemarch or The Woman in White. These examples also counter conventional associations of individuality with masculinity and sacrifice with femininity, challenging nineteenth-century concepts of gender and power yet again.
CONCLUSIONS The aim of my book is to theorize about what these marriages reveal about age, gender and power. The danger inherent to such an endeavor, it appears to me, resides in unnecessarily limiting the implications of this line of argument. Certainly, I do not intend to argue that women must be young

March 27th, 2009
Sponsors: Stäubli, Spartanburg Regional Healthcare System, EPSCoR/IDeA RS grant. 83
to wield power, or that such power must be sexual or romantic. Any identity that originates from age and its influence on gender is a slippery one. Much work remains to be done to elucidate how age affects gender throughout various ethnic, economic, and historical conditions.
ACKNOWLEDGMENTS I thank the SARS program for the released time grant that allows me to continue my work on nineteenth-century marriage and the Department of Languages, Literature and Composition for its continued support.
REFERENCES [1] Brontë, Charlotte. Jane Eyre. 1847. Boston: Bedford,
1996. [2] Hardy, Barbara. “The Miserable Marriages in
Middlemarch, Anna Karenina, and Effi Briest.” George Eliot and Europe. Ed. John Rignall. Aldershot, England: Scolar,1997. 64-83.
Fifth Annual SC Upstate Research Symposium
84 Sponsors: Stäubli, Spartanburg Regional Healthcare System, EPSCoR/IDeA RS grant.
Oil and Western Friendliness, The Cause for Russian Interference in Former Soviet Republic Nations
Seth Rubenstein and Trevor Rubenzer History, Political Science
University of South Carolina Upstate 800 University Way, Spartanburg SC 29303
[email protected], [email protected] Abstract - At what level of international energy importance and friendliness to the west does Russia feel the necessity to interfere in former soviet republics and to what degree do they do so, is it covert like Yushenko or overt and highly aggressive like in Georgia in an effort to create a bi-spheral world with Russia on one end an the United States on the other. Existing research into the matter of Russian interference in FSR’s does not account for both oil importance and western friendliness or independence as causes this research does however look at isolated cases of just oil importance and just western friendliness in Belarus, Poland, the Ukraine, and Georgia as reasons for internal hostile interference by the Russian Federation. What we find is that with an increase in western friendliness and strategic oil importance so does the likelihood of Russian interference in a countries internal affairs. Furthermore as those two variables increase so does the force of action taken ranging from political assassination to war. Keywords — Political Science, Russia, Oil, NATO, West
INTRODUCTION Many “Russian observers” have postulated that the reason for recent Russian aggression in Georgia has not been the stated goal of protection of Russian citizens in South Ossetia but rather to Punish Georgia for its Pro-Western policies in particular its friendly status with The United States of America [1]. Other scholars over the past decade have pointed out the Russian Federations increasing reliance on Oil as its main revenue source as it today account for 60+% of the revenue for their federal budget. Legvold, Wallander, and Bater in particular have explored whether or not oil control has caused Russia to intervene in the affairs of its former Republics. What my comparative case study tries to do is to link the two. In an age where oil is the most precious commodity and most needed resource for the industrial world it along with the historical tendencies of Russian nationalism and Russian Slavic nationalism undoubtedly go hand in hand rather than separate entities when asking the question what causes Russia to pursue a foreign policy of interference in former republics.
LITERATURE REVIEW
Previous scholars namely Legvold [2], Wallander [2], and Bater [3] made great strides in recognizing that post-Soviet Russia’s relationship with former Soviet republics (FSR’s) was re-emerging as a Sovietesque model. Russia was more than willing to dictate the terms of foreign policy and more importantly regional economic policy to its former regional possessions. Rosefielde [4], Vatansever [5], Snakelina [6], and Melville [6] explored the importance of oil to Russia and her relationship with her former enemy The United States in the coming century. Prior literature does not however, link the importance of oil and the relationship with the west to how Russia interacts with its neighbors.
RESEARCH DESIGN In this qualitative comparative case study I examined a spectrum of Russian hostile interference through Belarus and Poland on one end of the spectrum to the Ukraine in the middle and Georgia on the other end of the spectrum. The measure of western friendliness (variable 1) is measured in terms of US Foreign Military Aid. With the criteria for being friendly as foreign aid per capita in excess of $.30 USD/per capita. The data coming from USAID[7]. For measurement of strategic oil importance (variable 2) I will be measuring the total oil control of each country that combines both oil exports and the flow of oil through regional pipelines. The criteria for strategic oil Importance will be what I’m coding “Total Oil Control” in excess of 1 million barrels a day. The data for this measure comes from a variety of sources [8] [9] [10] [11] [12] [13] and [14]. Lastly to test whether or not Russia has interfered in one of the case study nations I created a simple data set using the Google Search Algorithm. By simply typing the search query “(country name) + interference by Russia” and using the first result as a yes or no to that question.
To test the hypothesis I constructed a Boolean truth table to input a true or false count on the variables of oil importance true or false, friendly to the west true or false, and the result Russian interference true or false. The results are coded
March 27th, 2009
Sponsors: Stäubli, Spartanburg Regional Healthcare System, EPSCoR/IDeA RS grant. 85
using the Boolean logic in Binary with 0 equaling False and 1 equaling True.
FINDINGS My findings for US Foreign Aid shows that Georgia a country of roughly 4 million 630 thousand has the highest per capita share of US Military Assistance even with Poland’s inclusion of the multimillion dollar Missile Defense Shield. Georgians get about $2.93 per person of the 13 million dollars allocated by USAID the closest country to that number is Poland with $0.83. The Ukraine ranks 3rd with $0.34 per person. The lowest number for all of Eurasia is Belarus with $0.01 per person! What’s clear is that Belarus is not on the United States’ list of friendly countries. If we dive into the source numbers even further we find that the 100,000 given through USAID is almost entirely for counterterrorism and policing; so it’s entirely in the United States interests and purely self motivated. So what can be extracted from these numbers is that Georgia is a very friendly country as is Poland and Ukraine.
The results for the second test with regards to strategic oil importance shows that Poland lacks any substantial oil resources and is reliant on others for its oil security. For that reason its coded as being non-important or as I have labeled it in the table strategically unimportant. However Georgia, Ukraine, and Belarus all have oil control in the upwards of 1 million barrels a day a very significant number. While both the Ukraine and Belarus don’t export their oil directly to the United States the oil that they export or run through a pipeline does feed Western Europe i.e the West. The data from the Georgia case shows that perhaps the most important thing in determining strategic oil security are pipelines as they control the flow of oil and without them where the oil comes from is pointless.
Lastly the when answering the most important question of all is there hostile interference by Russia using the Google data set what we find is that both the Ukraine and Georgia have had interference by Russia in its internal affairs. Where as Belarus and Poland have not. What now becomes clear is that a connection exists between oil importance and Western Friendliness of which the Ukraine and Georgia both scored highly on. What this truth table also demonstrates is that either Friendliness to the West or just Oil Importance independently are not reasons on their own for Russian interference as Russia has not interfered in the internal affairs of countries with just one true score.
CONCLUSIONS What we can conclude from the results of the truth table and the strategic oil importance and western friendliness tables is that in a sample of Former Soviet Republics that countries with both high levels of oil importance and high levels of friendliness to the west will inevitably lead to some sort of hostile interference by Russia. We can also deduce from the numbers that there is a scale of interference that as the two independent variables go up so does the forcefulness of the interference. In the case of the Ukraine which elected a Pro-Western candidate that was still willing to “play ball” with the Kremlin on some oil issues the interference was aimed directly at him in attempt to get rid of him before an election against a Kremlin backed candidate. With the case of Georgia the force was much greater, full out open war or an “interstate dispute” with that country for their strong support and relations with the United States and its extraordinarily strategic pipeline that was in part funded by US companies that supplied oil from many US companies located in Caspian Sea that eventually fed the United States with that oil. It has become clear through source documents and the correlation between Friendliness to the West and Oil Importance that the old Soviet Union is back in spirit and the politick of the Cold War is now policy of the Russian Federation and it’s seeking to control oil resources for its own gain.
REFERENCES [1] "War In Georgia." GlobalSecurity.org. Ed. John Pike.
2 Dec. 2008. 12 Dec. 2008 <http://www.globalsecurity.org/military/world/war/georgia.htm>.
[2] Legvold, Robert and Wallander, Celeste. 1996. Swords and Sustenance The Economics of Security in Belarus and Ukraine. American Academyof Arts and Sciences. Cambridge, Mass: MIT Press.
[3] Bater, James H. Russia And The Post Soviet Scene. London: Arnold, 1996.
[4] Rosefielde, Steven. Russia In The 21st Century: The Prodigal Superpower. Cambridge, UK: Cambridge Univeristy Press, 2005.
[5] Vatansever, Andan. Russian Involvement in Eastern Europe's Petroleum Industry : The Case of Bulgaria. Ed. Kevin Rosner, Dr. Global Market Briefings Ltd, 2005. NetLibrary. OCLC. 14 Oct. 2008 <http://www.netlibrary.com/>.
[6] Melville, Andrei and Snakleina, Tatiana. Russian Foreign Policy in Transition: Concepts and Realities.New York. Central European University Press, 2005.
[7] U.S Overseas Loans and Grants "The Green Book." Nov.-Dec. 2008. USAID. 4 Dec. 2008 <http://qesdb.usaid.gov/gbk/>.

Fifth Annual SC Upstate Research Symposium
86 Sponsors: Stäubli, Spartanburg Regional Healthcare System, EPSCoR/IDeA RS grant.
[8] "Georgia." CIA World Factbook. 20 Nov. 2008. Central Intelligence Agency. 4 Dec. 2008 <https://www.cia.gov/library/publications/the-world-factbook/geos/gg.html>.
[9] "Russia." CIA World Factbook. 20 Nov. 2008. Central Intelligence Agency. 4 Dec. 2008 <https://www.cia.gov/library/publications/the-world-factbook/geos/rs.html>.
[10] "Belarus." CIA World Factbook. 20 Nov. 2008. Central Intelligence Agency. 4 Dec. 2008 <https://www.cia.gov/library/publications/the-world-factbook/geos/bo.html>.
[11] "Ukraine." CIA World Factbook. 20 Nov. 2008. Central Intelligence Agency. 4 Dec. 2008 <https://www.cia.gov/library/publications/the-world-factbook/geos/up.html>.
[12] "Poland." CIA World Factbook. 20 Nov. 2008. Central Intelligence Agency. 4 Dec. 2008 <https://www.cia.gov/library/publications/the-world-factbook/geos/pl.htm>.
[13] Faucon, Benoit. "Russia-Georgia War Shows Risks Of Caucasus Oil Route." Dow Jones Newsire 11 Aug. 2008. Downstream Today. 4 Dec. 2008. Rigzone.com. 4 Dec. 2008 <http://www.downstreamtoday.com/News/Articles/200808/Russia_Georgia_War_Shows_Risks_Of_Caucas_12315.aspx?AspxAutoDetectCookieSupport=1>.
[14] "Ukraine Energy Data, Statistics and Analysis." Official Energy Statistics from the U.S Government. Dec. 2008. Energy Information Administration - Department of Energy. 4 Dec. 2008 <http://www.eia.doe.gov/emeu/cabs/Ukraine/Oil.html>.
March 27th, 2009
Sponsors: Stäubli, Spartanburg Regional Healthcare System, EPSCoR/IDeA RS grant. 87
Efficient Estimation of Cox Model with Time-Dependent Coefficients with Missing Causes
Yanqing Sun1 and Seunggeun Hyun2 1Department of Mathematics and Statistics University of North Carolina at Charlotte
9201 University City Blvd. Charlotte, NC 28223
2Division of Mathematics and Computer Science University of South Carolina Upstate
800 University Way, Spartanburg, SC 29303 [email protected]
Abstract —In many medical and engineering studies, time to an event, such as the time from onset of a disease to death, is being frequently studied. However, in many situations, the items or the individuals fail due to more than one failure mechanism, commonly referred to as competing risks. For example, a patient can die due to cause unrelated to the disease of the interest. Moreover, it is common that the exact cause of failure may not be observed although the failure time is observed. In this research, new statistical inferential methods for estimating the regression parameters of interest in the competing risks problem with missing causes will be developed. This paper investigates the cause-specific hazard model with time-dependent coefficients. A two-stage estimation procedure is proposed. An extensive numerical and graphical investigation will be presented to evaluate the performance of the proposed method and to ensure that the proposed method is appropriate for practical use. Keywords — cause-specific hazard rate, competing risks model, Cox model with time-dependent coefficients, weak convergence
INTRODUCTION Survival analysis in medical studies, also called event history analysis in social science, or reliability analysis in engineering, deals with time until occurrence of an event of interest. For example, in order to determine the incidence of death due to breast cancer among breast cancer patients, every patient will be followed from a baseline date (such as date of diagnosis or date of surgery) until the date of death due to breast cancer or study closing date. A patient who dies of breast cancer during the study period would be considered to have an “event” at their date of death. A patient who is alive at the end of the study would be considered to be “censored.” Thus, every patient provides two pieces of information: follow-up time and censoring indicator. When the data consist of patients who experience an event and censored individuals, a nonparametric estimate of
the cumulative incidence can be obtained using the well-known Kaplan-Meier method [1]. Under this approach, the censoring mechanism is assumed to be noninformative. In other words, the survival time of an individual is assumed to be independent of a mechanism that would cause the patient to be censored. However, a patient can experience an event different from the event of interest. For example, a breast cancer patient may die due to causes unrelated to the disease. Such events are termed competing risks events. In this setting, it would often be of interest to calculate the cumulative incidence of a specific event of interest. Any subject who does not experience the event of interest can be treated as censored. However, a patient experiencing a competing risk event is censored in an informative manner. Hence the Kaplan-Meier estimation procedure may not be directly applicable. The cumulative incidence function for an event of interest must be calculated by appropriately accounting for the presence of competing risk events. Under investigation, what is observed for each subject is a time to failure and an indicator that tells us which of the competing risks caused the failure. Thus to analyze competing risks data it is natural to consider models for the relationship of the cause-specific hazard function, the rate of occurrence of the cause of failure in the presence of all causes of failure, as a function of covariates [2].
A lot of methods have been developed to analyze the competing risks data. In many clinical trials, however, the time to failure is recorded but the cause of failure may not always be available. Statistical inference based on ignoring missing data will be inefficient and biased. This renders well known models such as the Cox proportional hazard model and the proportional odds models inapplicable and the traditional approach can not be adopted [3,4]. This is the reason why anaysis of competing risks data with missing cause of failure has received considerable attention recently. In

Fifth Annual SC Upstate Research Symposium
88 Sponsors: Stäubli, Spartanburg Regional Healthcare System, EPSCoR/IDeA RS grant.
this paper, new estimating equation approachs using the inverse probability weighted technique and double robust technique will be proposed for estimating the regression parameters of interest. Furthermore, the standard Cox proportional hazard model assumes that the regression coefficients are constant over time [5]. Often, however, the regression parameters may vary over time. For instance, in an HIV-AIDS study comparing a new treatment with an active control, the new drug may work well in the initial treatment period, but may gradually lose its potency due to mutation of the virus. If the drug does have the potential to lose its efficacy, then it is crucial to know when and how fast the drug becomes ineffective. Thus to overcome the strong restriction of proportionality assumption of the Cox proportional hazard model, we propose the extended model which has time-varying coefficients. Consistent and robust estimators will be proposed.
SECTION TWO Let T be the failure time of interest, V be the cause of failure and Z be a possibly time-dependent pdimensional covariate. In this paper we consider the Cox model with time-dependent coefficients for the cause-specific hazard model
0( | ) ( ) exp( ( ) )T
j j jt Z t a t Z , where 0 ( )j t is the
baseline hazard function and
1( ) ( ), , ( )j j jpa t a t a t is the regression coefficient
[6]. In a complete-case scenario, the cause of failure V is observed if a patient is dead, and is missing if the failure time T is censored. We define R as the complete-case indicator, 1R if V is known or T is censored, and 0R otherwise. In addition to the covariate Z used in the cause-specific hazard rate, we also consider auxiliary covariate A that may help to describe the missingness of the cause of failure. Let C be the censoring time, X be the right-censored failure time min( , )X T C , and be the indicator of non-censorship. We assume that the censoring time Cand ( , )T V are conditionally independent, given Z . We also assume that the cause V is missing at random. This can be expressed by
( ) ( 1 | 1, ) ( 1 | , 1, )r W P R W P R V W ,
where ( , , )W T Z A . The observed data consist of
iid replicates , , , , ,i i i i i i i i iO X Z R R V A of
, , , , ,O X Z R R V A . We consider a parametric
model ( , )r W for ( )r W , where is the regression parameter vector.
When there is no missing cause, under the local linear model we obtain the local linear partial likelihood function. The local linear partial maximum likelihood estimator, called the full data estimator (FULL), is the vector that maximizes the local linear partial likelihood function. The local linear partial maximum likelihood estimates can be realized by using the Newton-Raphson iterations until converges. When we have missing causes in data, a naïve method for estimating the regression parameter is to simply ignore the missing data and apply the local linear partial likelihood function to the complete data only. Such a procedure (called the complete case estimator, COMP) is clearly inefficient if there is a significant amount of missing causes in data. As pointed out by Gao and Tsiatis [7], the inverse probability weighted estimator uses only complete case. So it is inefficient and relies on correct modeling of the
probability ( , )ir W . Gao and Tsiatis proposed the
augmented inverse probability weighted complete-case estimators (AUG). We show that the augmented inverse probability weighted complete-case estimator converges to true parameter in a normal distribution with a variance which can be consistently estimated.
SIMULATION STUDY Simulation study will be conducted to evaluate the performance of the proposed method. An extensive numerical and graphical investigation will be presented to ensure that the proposed method is appropriate for practical use. We considered a competing risks model with two causes and with the cause specific hazard functions equal to
1 1 2( ) exp( )t tZ Z and
2 1 2( ) exp( log( 1) )t Z t Z , where 1Z is a
Bernoulli random variable with success probability
0.5 and 2Z has a uniform distribution on [0,1] .
The simple random right censoring C is taken to be exponentially distributed, with parameter specified so that approximately 25% of the observations are censored.
Table 1 indicates overall smaller biases of the proposed AUG estimator than COMP estimator and sampling standard errors as well. The biases and standard errors decrease as the sample size increases.
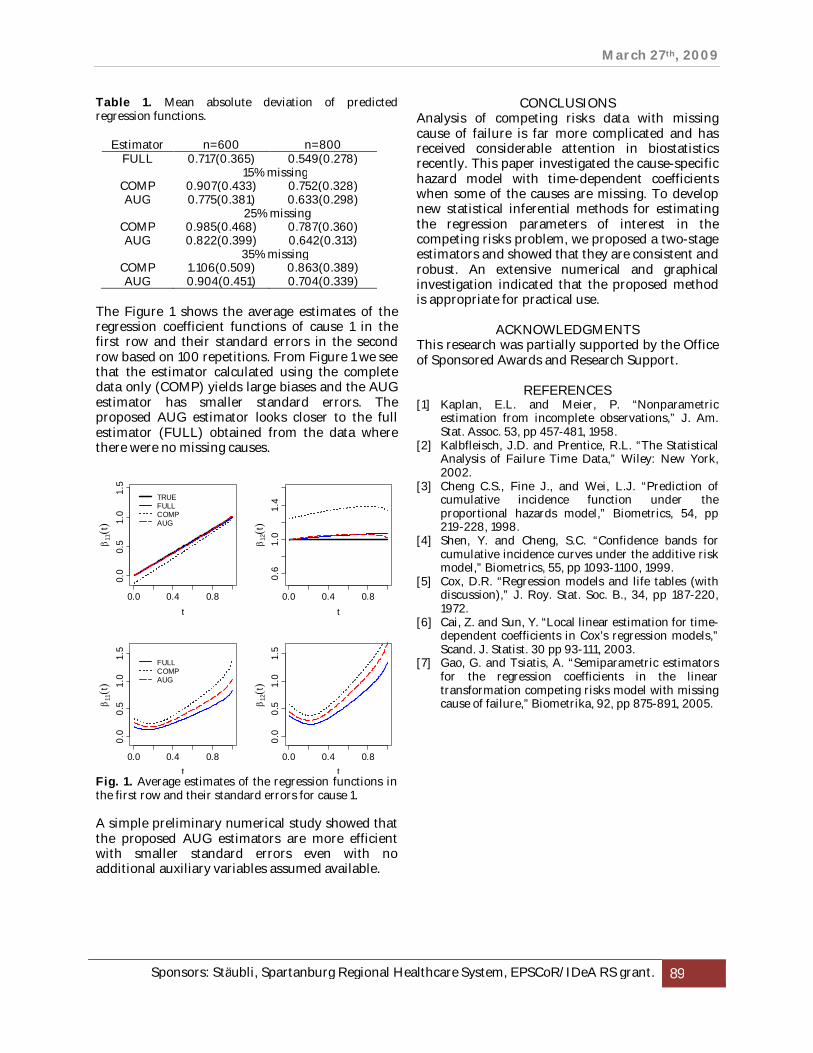
March 27th, 2009
Sponsors: Stäubli, Spartanburg Regional Healthcare System, EPSCoR/IDeA RS grant. 89
Table 1. Mean absolute deviation of predicted regression functions.
Estimator n=600 n=800 FULL 0.717(0.365) 0.549(0.278)
15% missing COMP 0.907(0.433) 0.752(0.328) AUG 0.775(0.381) 0.633(0.298)
25% missing COMP 0.985(0.468) 0.787(0.360) AUG 0.822(0.399) 0.642(0.313)
35% missing COMP 1.106(0.509) 0.863(0.389) AUG 0.904(0.451) 0.704(0.339)
The Figure 1 shows the average estimates of the regression coefficient functions of cause 1 in the first row and their standard errors in the second row based on 100 repetitions. From Figure 1 we see that the estimator calculated using the complete data only (COMP) yields large biases and the AUG estimator has smaller standard errors. The proposed AUG estimator looks closer to the full estimator (FULL) obtained from the data where there were no missing causes.
Fig. 1. Average estimates of the regression functions in the first row and their standard errors for cause 1. A simple preliminary numerical study showed that the proposed AUG estimators are more efficient with smaller standard errors even with no additional auxiliary variables assumed available.
CONCLUSIONS Analysis of competing risks data with missing cause of failure is far more complicated and has received considerable attention in biostatistics recently. This paper investigated the cause-specific hazard model with time-dependent coefficients when some of the causes are missing. To develop new statistical inferential methods for estimating the regression parameters of interest in the competing risks problem, we proposed a two-stage estimators and showed that they are consistent and robust. An extensive numerical and graphical investigation indicated that the proposed method is appropriate for practical use.
ACKNOWLEDGMENTS This research was partially supported by the Office of Sponsored Awards and Research Support.
REFERENCES [1] Kaplan, E.L. and Meier, P. “Nonparametric
estimation from incomplete observations,” J. Am. Stat. Assoc. 53, pp 457-481, 1958.
[2] Kalbfleisch, J.D. and Prentice, R.L. “The Statistical Analysis of Failure Time Data,” Wiley: New York, 2002.
[3] Cheng C.S., Fine J., and Wei, L.J. “Prediction of cumulative incidence function under the proportional hazards model,” Biometrics, 54, pp 219-228, 1998.
[4] Shen, Y. and Cheng, S.C. “Confidence bands for cumulative incidence curves under the additive risk model,” Biometrics, 55, pp 1093-1100, 1999.
[5] Cox, D.R. “Regression models and life tables (with discussion),” J. Roy. Stat. Soc. B., 34, pp 187-220, 1972.
[6] Cai, Z. and Sun, Y. “Local linear estimation for time-dependent coefficients in Cox’s regression models,” Scand. J. Statist. 30 pp 93-111, 2003.
[7] Gao, G. and Tsiatis, A. “Semiparametric estimators for the regression coefficients in the linear transformation competing risks model with missing cause of failure,” Biometrika, 92, pp 875-891, 2005.
0.0 0.4 0.8
0.0
0.5
1.0
1.5
t
11
t
TRUEFULLCOMPAUG
0.0 0.4 0.8
0.6
1.0
1.4
t
12
t
0.0 0.4 0.8
0.0
0.5
1.0
1.5
t
11
t
FULLCOMPAUG
0.0 0.4 0.8
0.0
0.5
1.0
1.5
t
12
t
Fifth Annual SC Upstate Research Symposium
90 Sponsors: Stäubli, Spartanburg Regional Healthcare System, EPSCoR/IDeA RS grant.
Modernism’s Egypt “And Other Disorders of a Revolutionary Character”
Celena E. Kusch Department of Languages, Literature, and Composition
University of South Carolina Upstate 800 University Way, Spartanburg, SC 29303
[email protected] Abstract — For early twentieth-century writer, H.D. (Hilda Doolittle), the contemporary Egyptian colony and ancient Egyptian empire figure prominently within her published poetry and prose. Throughout all of her Egyptian texts, H.D.—like most literary modernists who reference Egypt—makes no reference whatever to the revolutionary political changes taking place in the newly independent colony at this time. The archaeological trace of the past empire and its people so dominates the modernist imagination that the reality of the living, modern Egyptian nation becomes a blank space within the texts. For H.D. as for other modernists, the narrative repression of the Egyptian colonial landscape highlights the vexed relationship between literary modernism and the modernizing colonies which challenge the Anglo-American confidence in science, progress, and even national identity. The absence of contemporary Egypt speaks back from the silence to reveal the fundamental challenge to American and British identity it posed. Keywords — modernism, Egypt, H.D., Hilda Doolittle
INTRODUCTION As critics like Marianna Torgovnick and Simon Gikandi have argued, Anglo-American literary modernism is often associated with narratives of progress and development made all the more progressive and developed by their contrast to the “primitive” or “undeveloped” landscapes of colonies [1, 2]. This relationship between modern empire and unmodernized colony can be viewed in its two extremes. On one end of the spectrum, texts like Joseph Conrad’s Heart of Darkness (1899) are based on the author’s contemporary experience within a colonial landscape whose lack of modernization seems to return him to a “prehistoric” time [3]. On the other end, texts like Virginia Woolf’s The Voyage Out (1915) imagine entirely fictionalized colonial spaces where British and American characters escape the march of history and buy time away from their modern lives [4]. Despite the differences between narratives based on real travel and those based on fiction alone, both types of texts represent the colonies as blank spaces awaiting content from modernized, Anglo-American observers. Conrad’s Congo is literally uncharted territory, which the characters’ voyage does little to map or comprehend. Woolf’s fictional Santa Marina in Brazil makes the
characters’ voyage up the Amazon little more than a reflection of their internal confusion about their futures in Europe or the U.S. By shifting the focus to the traveling characters’ subjective experiences of colonial landscapes, these modernist texts ignore or distort the colonies’ historical and cultural contexts. Yet, the value of colonies as a rich source for literary modernism comes precisely from those landscapes’ enduring traces of forgotten or effaced peoples of both their present and their past.
Like Africa for Conrad, India for E. M. Forster, and Brazil for Woolf, for H.D. (Hilda Doolittle), the contemporary Egyptian colony and ancient Egyptian empire figure prominently within her published poetry and prose. For H.D. more than for any of these other writers, the use of the Egyptian colonial landscape highlights the vexed relationship between literary modernism and the modernizing colonies that are neither blank nor primitive, but rather overflow with resurgent history and culture that challenge the Anglo-American confidence in science, progress, and even national identity.
NATION, COLONY, AND EMPIRE Between 1922 and 1923, a number of historical and literary events converge to make Egypt a significant part of the modernist imagination. The years 1922-1923 are widely seen as the apex of literary modernism, marked by the publication of such texts as The Waste Land (T. S. Eliot), Ulysses (James Joyce), Cane (Jean Toomer), Jacob’s Room (Virginia Woolf), The Hairy Ape (Eugene O’Neill), Spring and All (William Carlos Wiliams), Geography and Plays (Gertrude Stein), and The Beautiful and the Damned (F. Scott Fitzgerald). At the same time that British and American modernists announced their modernity with a flurry of experimental publications, Egypt was registering the paradox of its national identity as at once a modern, living colony and an ancient, buried empire. In the same two years, Egypt achieved its initial, though limited, independence from Great Britain and established its first parliamentary constitution, while Howard Carter and Lord Carnarvon located and excavated the ultimate archaeological symbol of ancient Egypt, King Tutankhamun’s tomb.
March 27th, 2009
Sponsors: Stäubli, Spartanburg Regional Healthcare System, EPSCoR/IDeA RS grant. 91
In the midst of this cultural moment, H.D. travelled to Egypt, arriving at the end of January 1923 and staying long enough to view the entrance to Tutankhamun’s tomb and to witness the removal of several artifacts from the archaeological site. This experience figures in H.D.’s prose and poetry throughout her life: Egyptian hieroglyphics and myths are at the heart of Trilogy (1944-1946), which refers to Karnak, 1923, in its dedication; Egyptian concepts of the soul serve as the premise for Kora and Ka (1934); Egypt is the primary setting for Helen in Egypt (1961), her last long poem; and the 1923 journey forms the basis for the plot of two stories about an archaeologist’s assistant—“Secret Name: Excavator’s Egypt” (1926) and “Hesperia” (unpublished). Remarkably, throughout all of these Egyptian texts, H.D.—like most modernists who reference Egypt—makes no reference whatever to the revolutionary political changes taking place in the newly independent colony at this time. The archaeological trace of the past empire and its people so dominates the modernist imagination that the reality of the living, modern Egyptian nation becomes a blank space within the texts.
Despite this literary gap, news reports from the 1920s reveal that the living Egypt was modernizing so rapidly that the famed efficiency and order of the occupying British military could not contain its growing nationalism. A 1922 article in Outlook magazine, notes that the British are attempting to create “a new nation” out of Egypt based on the recent models of Ireland and South Africa, but “there are misguided Egyptians, as there are misguided Americans, who think that what is called self-determination is more important than health, education, justice, and family life” [5]. The article complains that Egyptians will not wait to let the independence unfold in an orderly fashion and instead have staged riots, “ignorant or forgetful of the fact that republics are not made by the stroke of a pen, but are the product of long evolutionary processes” [5]. Yet, while this and other articles like it patronize the Egyptians for their naïveté in grasping for too advanced a step in their national evolutionary development toward modernity, they simultaneously point out the highly effective political strategies of strikes, negotiations, alliances, and general nation-building that have made the British attempt to rule them so difficult. Just as in the literature, however, the ancient legacy of Egypt subsumes and negates the modern Egyptian. Reflecting on a demonstration of airplane technology in Egypt in 1914, “A French Resident” observes that an Egyptian Bedouin watched the spectacle with disdain: “far from admiring our civilization and progress, they view
them with crushing contempt” [6]. The reason, the article explains, is that Egyptians in the twentieth century “seem to feel that they have all eternity before them, and that the passing civilizations imposed upon their country from time to time are merely minor episodes in their history. They remained what they were . . .” [6]. In the popular British and American imagination, therefore, there are no contemporary Egyptians, only the “shell” of a once-great civilization with “nothing inside” [7].
In many ways, H.D.’s literary representations of Egypt repeat this refusal to acknowledge a modern Egyptian nation. Very few living Egyptians speak in H.D.’s texts, and the poems and prose are preoccupied with ruined temples, monuments, and tombs. In her Egyptian stories, the modernist gaze remains fixed on the lost Egyptian empire, even as the female protagonists attempt to tap into the ancient aesthetic power of the ruins in order to define a new space for their own, rebelliously modern lives. In fact, “Secret Name: Excavator’s Egypt,” ends with a moment of epiphany achieved because the modernist protagonist imaginatively bridges the temporal divide between her contemporary Anglo-American life and Egypt’s imperial past. On a tour of the ruins at Karnak at night, the character discovers an ancient birth house dedicated to Isis and believes she has achieved a new knowledge of the lost Egyptian empire, exclaiming to herself, “The Greeks came to Egypt to learn” [8]. Echoing the kinds of modernist revelations inspired by blank colonial landscapes in Conrad and Woolf, H.D.’s text focuses on the subjective gains of the modern outsider; she does not even see the modern Egypt around her. However, H.D.’s stories further reveal that the Egyptian landscape erupts with cultural content and resist modernism’s attempt to relegate Egypt’s culture to the past. “Hesperia” begins by undoing the moment of epiphany in “Secret Name.” In “Hesperia,” the protagonist’s discovery of this imaginary ruin is quickly debunked as mere hallucination, possibly even a symptom of the “hysteria” that has been affecting several (historically real) tourists who visited Karnak at night [9]. Repeatedly tourists, soldiers, and British officials throughout the stories are expelled from the country or threatened with disease. Through landscapes, weather, plants, skyscapes, and art, Egyptian culture and power disrupt and defy the British and American characters who cannot even count on a landscape to appear the same way from day to day. Overwhelmed by their emotional reactions to the colony, the characters in H.D.’s stories repeatedly confront evidence that modern Egypt is not frozen in the past by some arrested development or even devolution from the ancient
Fifth Annual SC Upstate Research Symposium
92 Sponsors: Stäubli, Spartanburg Regional Healthcare System, EPSCoR/IDeA RS grant.
civilization, but it is unruly, living, chaotic, and imbued with agency in the present. Without telling the story of the struggle for modern Egyptian nationalism and independence, “Hesperia” still reveals that the colonial landscape does cause “hysteria” in Anglo-American visitors who think they will order, structure, and enlighten Egypt in the present.
CONCLUSIONS To understand literary modernism without understanding its colonial context, is to miss the point. Modernism is fascinated by exotic, ancient, colonial spaces and dependent upon them in order to manufacture its own identity as modernized, progressive, knowledgeable, and new. Yet modernism is written at the very moment that the world’s colonies refuse to be labeled primitive and organize modern, nationalist political movements to achieve independence and self-rule. Poised as it is between Africa and the Mideast, Egypt poses a particularly pointed problem for modernists who would like to construct it as an open-air museum for the modern world. Its ancient empire made indisputably significant contributions to human civilization in all areas of science, politics, and the arts. At the same time its modern colony reached, at least temporarily, a level of independence from the British empire that only white settler colonies up to that point had achieved. Despite these gains, however, modernist literature and modern popular culture continually attempt to erase the modern Egyptians and refuse to write a space for them in narratives of progress and twentieth-century national identity. Based on H.D.’s fiction about Egypt and contemporary journalistic reports of its independence movement, we can see that the Anglo-American narrative strategies are thoroughly invested in asserting modernism’s newness through its difference from the exotic, underdeveloped Egyptian past, but within the text’s encounters with modern Egypt that difference becomes as disruptive as the Egyptian nationalist movement itself. The absence of contemporary Egypt speaks back from the silence to reveal the fundamental challenge to American and British identity it posed.
ACKNOWLEDGMENTS This paper is based on archival work completed with generous funding from the University of South Carolina Upstate Research Incentive Award. I also wish to thank the USC Upstate Office of Sponsored Awards and Research Faculty Release Program for supporting my research project this semester.
REFERENCES
[1] M. Torgovnick. Primitive passions: Men, women, and the quest for ecstasy, Knopf, 1997.
[2] S. Gikandi. “Picasso, Africa, and the schemata of difference,” Modernism/Modernity, vol. 10(3), pp 455-480, 2003.
[3] J. Conrad. Heart of Darkness, Ed. Paul B. Armstrong, W. W. Norton, 2006.
[4] V. Woolf. The Voyage Out, The Modern Library, 2001.
[5] “Egypt.” The Outlook, pp 49-50, 11 Jan. 1922. [6] A French Resident. “Egyptian Memories.” The
Living Age, vol. 313(4061), pp 328-334, 1922. [7] M. Maeterlinck. “What is Civilization? VI: Ancient
Egypt, Part One.” Forum, vol. 73(6), pp 784-795, 1925.
[8] H.D. “Secret Name: Excavator’s Egypt.”In Palimpsest, pp 173-244, Southern Illinois University Press, 1968.
[9] H.D. “Hesperia,” Box 37 Folder 971. Beinecke Special Collections Library, Yale University, 1924, 1948.
March 27th, 2009
Sponsors: Stäubli, Spartanburg Regional Healthcare System, EPSCoR/IDeA RS grant. 93
Southern Wesleyan University Strategic Human Resource Plan Beverly Lowe, Felicia Thomas-Adams, Nicole Varnum, Lee Kizer
Adult and Graduate Studies Southern Wesleyan University
Central, SC {beverly.lowe, felicia.thomas, nicole.varnum, lkizer}@swu.edu
Abstract - Southern Wesleyan University is currently outsourcing the marketing for its Adult and Graduate Studies Programs. The University plans to internalize the marketing by August 31, 2009 in order to increase enrollment in the programs. Using the departments and information already in place at Southern Wesleyan University, this Strategic Human Resource Plan was designed to aid in the process of developing and implementing the strategies necessary to successfully internalize the marketing for the Adult and Graduate Studies Programs. Keywords: Southern Wesleyan University, Adult and Graduate Studies, Marketing department, Enrollment and recruitment, Job analysis and design
INTRODUCTION Southern Wesleyan University (SWU) places special focus on God and the surrounding community in order to foster a desire to learn and become prepared to follow God’s will. “Southern Wesleyan University is a Christian community of learners, all seeking to fulfill God’s plan for their lives.” The Adult and Graduate Studies Programs of SWU, offered at six learning centers, are designed to assist adult students in obtaining their degree while still meeting their personal and professional responsibilities. [1] The Marketing Department will be responsible for enhancing and maintaining the programs to enrich the student population while adhering to the University’s Christian mission and values.
OBJECTIVES The Marketing Department will focus on highlighting the Adult and Graduate Studies Programs in advertising and media using team work to attain the strategic planning goals. It will budget funds to include short and long-range marketing including any necessary technology. It will collaborate with the Information Technology (IT) Department to develop Web-based communication strategies and service, Advancement Services and Alumni Relations to target business majors, and will be a part of all institutional activities and University-wide events to contribute to the overall image of SWU and
promote Adult and Graduate School Programs. The Marketing Department will use training seminars to provide the staff with the tools needed to be more effective in working with the media and develop opportunities by providing resources and encouragement for conferences, networking and personal skill enhancement. [2]
SWOT ANALYSIS SWU is committed to offering outstanding, Southern Association of Colleges and Schools (SACS) accredited programs, activities and services for the diverse groups of people they serve. The departments within the University to be utilized by the Marketing Department are staffed by intelligent, professional, Christian people of good judgment with the desire for University-wide success. The Marketing Department will, however, face certain challenges due to the lack of experience of a new team and the lack of an on-line program to compete with other institutions. It will have to rebuild the share of the marketplace lost when changing from external to internal marketing and build brand awareness for the Adult and Graduate Studies Programs. This may not be realized if the right people are not hired within the Marketing Department.
The Marketing Department has the opportunity to succeed because jobs require a higher level of skills and education level than ever before due to changes in technology. It will be able to utilize the diversity of experiences, needs and priorities of those people who are entering higher education later in life and also the challenges presented by rising tuition costs, time to graduation and decisions about careers that affect the decision-making process of graduate school. The Marketing Department will be threatened by the current economic crisis, the competition from other educational institutions and the increase in on-line programs. It will also face the challenges presented by the demand for technology and the trends in technology that are dramatically changing the nature of instruction inside and outside of the classroom. [3]

Fifth Annual SC Upstate Research Symposium
94 Sponsors: Stäubli, Spartanburg Regional Healthcare System, EPSCoR/IDeA RS grant.
HUMAN RESOURCE SWU will incorporate the following positions to develop the Marketing Department:
Director of Marketing and Enrollment Development to head the Marketing Department
(2) Recruiters to cover Charleston, North Augusta, Columbia and Central, Greenville and Greenwood
Accounting Clerk for general accounting and other duties as needed
Enrollment Specialist for communication and follow-up with prospective students.
Job design and description, selection and compensation will be determined by the Dean of the School of Business in collaboration with the Human Resource Department. All employees must demonstrate values and beliefs consistent with the evangelical Christian mission of the university and its community lifestyle standards. A high percentage of employee retention is achieved through development including identifying, promoting and implementing improved policies and practices that demonstrate recruiting success, monitoring individual performance and encouraging feedback for analysis and improvement, and increasing staff participation in development programs. [4] SWU offers a competitive compensation package with salary (commensurate with qualifications, experience and ability) and bonus incentives; complete medical, dental and life insurance programs; and 401(k) retirement plan. SWU is an equal opportunity employer. [5]
CONCLUSION Southern Wesleyan University Adult and Graduate Studies Programs are designed to enhance skills in communication, information processing, and problem solving. The Marketing Department will be devoted to providing high quality recruiting services for the University’s mission, values, and long-term goals. It will develop a system that encourages open communication and a strong commitment to the University’s Christian values in order to gain a competitive advantage when recruiting for the Adult Graduate and Studies Programs.
REFERENCES [1] “Mission Statement.” 29 Dec 2008. Southern
Wesleyan University. <http://www.swu.edu/about/histoiry.htm>. [2-4] “University Marketing and Communications 2005-
2009 Strategic Plan.” 9 Jan 2009 Eastern Michigan University. <http://www.emich.edu/strategicplanning/pdf/05%20Plans/umc_stratplan0506.pdf>.
[5] “Vice President for Marketing and Enrollment
Development.” 2 Jan 2009. Southern Wesleyan University. <http://swu.edu/hr/1-openings_staff/vp_marketing_enrollment.htm>.
March 27th, 2009
Sponsors: Stäubli, Spartanburg Regional Healthcare System, EPSCoR/IDeA RS grant. 95
Metaphor Familiarity and L2 Instruction Quincy Jenkins
Department of Humanities Spartanburg Community College Spartanburg, SC, P.O. Box 4386
[email protected] Abstract — The use of metaphor in written language has created many great works in literature and although the definition of ‘conceptual’ metaphor has already been established, little has been done in relation to its literary appreciation or language instruction. The intent of this paper is to show the more broad impact of metaphor as it affects standard and figurative language usage and its importance/implication on L2 instruction. This paper will provide a standard overview of conceptual metaphor and make a case for its use in language pedagogy. Keywords — Target domain, Source domain
INTRODUCTION The publication of the investigative research, Metaphors We Live By, 1980 by Lakoff and Johnson, demonstrated the presence and commonness of metaphor in common language usage. This study showed that we speak about things as we conceptualize them to be and the underlining theory being that there are two types of metaphor, linguistic and conceptual. The latter being very-well ordered, with mappings created to connect two different domains to one another (on one domain onto another); TARGET DOMAIN and SOURCE DOMAIN. “Linguistic metaphors are motivated by conceptual metaphors and are the realisations that appear in everyday written and spoken forms”. [1] LOVE (target) is JOURNEY (source) is often the pretense for such metaphors as my heart grows fonder, we’ll grow our relationship together, love takes time, etc. These are seen in everyday language and detailed more elegantly through linguistic devices in poetry and prose. After all, metaphors is primarily conceptual and not just a linguistic device because if it were, one would be able to discuss all the different metaphors as relating to the same over-arching idea. According to Lakoff and Johnson, they describe metaphors "understanding and experiencing one kind of thing in terms of another" [2]; the Greek term meta-phora meaning ‘to carry across’ (meta ‘across’ and phora ‘to carry’ or Latin its counterpart being trans-fer).
The importance to the understanding of metaphors to L2 speakers would then need to focus more on the practical, everyday and pragmatic uses and not necessarily on the literary ones. If a L2 English student understands that LIFE/LOVE are
JOURNEYS in English, then common metaphors such as we’re on the right path, he’s going down the wrong road or he took my heart with him would make comprehension of daily interaction with L1 much easier as it would not be taken as “literal” and come across as being familiar (if not already since many concepts may be cross-cultural).
Having said that, there are instances where parts of speech could be seen as purely linguistic and would require background knowledge or schemata. Metonymy is where an individual word is used to relate to a broader idea, however with both the ‘speaker’ and ‘audience’ sharing the same background knowledge. Being born and raised in Georgia, I have been raised with a certain amount of likeness (and respect) for Coca-Cola products. Many native Georgians go to a restaurant and ask for a “coke”. However, an outsider must not be confused by this request. Most likely if the server brings the customer any soft drink or asks (for clarification), “What kind of Coke?” the answer may very well be an answer different from any product made by Coca-Cola. What has happened is that customer has employed metonymy; he/she has replaced the manufactured for the manufacturer. This may show other information as well such as what type of soft drink the consumer tends to choose (darker types) relative to others and/or it can imply similar cultural backgrounds since the server would have to just “know” that I was not really asking for a “coke”.
Though linguistic devices such as metonymy may occur, this paper will focus on the far-reaching concepts of metaphors and later how it may help in L2 instruction.
METAPHOR FAMILIARITY Lakoff divided metaphors into subcategories in his 1993 paper: specific-level and generic-level. Generic-level metaphor are those that are employed on a daily basis and whose conceptualization can be understood regardless of cultural boundaries. For example, MORE IS UP/LESS IS DOWN. These metaphors are likely to occur across cultures and be the most intuitively recognizable to L2 learners with cross-linguistic correspondences which can be elicited and discussed in the learning context [3]. Metaphors
Fifth Annual SC Upstate Research Symposium
96 Sponsors: Stäubli, Spartanburg Regional Healthcare System, EPSCoR/IDeA RS grant.
such as my money is piling, the stock market is down, my costs are rising are examples of generic-level metaphor due to the fact that they speak to a seemingly universal concept. Another example could be seen in another broader conceptual metaphor where ‘IDEAS ARE FOOD’. Although I may have never heard the expression a casserole of promises, I am still able to understand the meaning or concept because it is not specifically linguistic, but belongs to a much broader context just as digest the information, troubles brewing or swallowing the lies. Specific-level metaphors are those that are still completely able to be conceptualized, but are not as common in practice as the others. These tend to be more employed in figurative and/or poetic environments. From personal experience, I can recall reading poetry in Spanish and Italian in during my graduate studies and feeling a total sense of admiration for the poets (most of whom have been long deceased) who conveyed images and stories through linguistic metaphorical devices. Though I had never read or much less seen these poems previously, the domains still allowed for me to conceive of the metaphor that was used by the author; linguistic metaphors could not be separated from the far-reaching concept. Guy Deutscher points out that good poets have a unique ability to create unfamiliar metaphors while still keeping within a larger context that is familiar. In his book, The Unfolding of Language, 2005, Deutscher cites a poem by Pablo Neruda where the poet is trying to explain to a younger apprentice what a poetic metaphor really is. At the end of the poem that Neruda tells the young man, he states: ‘I have spread my dreams under your feet; Tread softly because you tread on my dreams’ [4]. At first glance, the beauty of poetic genius would seem to be irrelevant to the day-to-day oral communication of most language speakers. However, if we look closer we will see that not only does one have to be Pablo Neruda to employ metaphors, but rather we all do so daily to some degree.
To further explain the common use or ubiquity of metaphors, read the following paragraph:
At the last PTA meeting, there were ground-breaking new rules meant to make the new board bend to the will of the parents. Tough talk and quick thinking on behalf of the organization made the board rise to action. News of the new rules was leaked to a local paper through an unknown source. For years, the public school system has been drowning in problems that included sinking salaries, rising taxes and complaints that the
current board had been holding back progress. Records show that the budget for the past three school years had been riddled with inaccuracies. The board, however, defended the budget by stating that the inaccuracies were simply due to a jump in salaries and kept changing in order to ensure that those salaries stayed in line with current trends and inflation.
Through this paragraph, though not poetic, one can immediately see that it is riddled with metaphors. If starting at the initial sentence, we know that the literal meaning of ‘ground-breaking’ is not conveyed nor is it meant to be. It is something that is done with dirt and a hoe. ‘Bend’ is the physical alteration of a solid object. I can bend a metal pipe, for example, but I can not physically bend a situation. I can try to tear tough leather or recognize that hot air is something that rises; water ‘leaks’ through pipes, not newspapers; living organisms ‘drown’; kangaroos ‘jump’ and first graders stay ‘in line’. What is important to state here is that every metaphor, though familiar and nearly unrecognizable as a metaphor, have transferred linguistic meaning from one domain to another. The usual tendency is to move from the concrete or SOURCE domain to the abstract or TARGET domain.
In some literary research studies and investigations, those metaphors that have lost the power to influence and evoke emotion/image have come to be known as ‘dead metaphors’. These are so commonplace that they are seen simply as parts of speech and hence a standard part of ordinary language. All former knowledge of their abstractness has been lost in usage and ubiquity.
L2 INSTRUCTION In the classroom, the use of generic-level metaphors is often ignored during instruction. However, if the principle goal of any L2 instruction is to eventually have the student arrive at a L1 or native-like competence, then it must be included as a vital part of instruction. Competence usually entails both skill and proficiency, but another aspect to this is the linguistic knowledge that encompasses socio-linguistic skill. Metaphors at the generic-level are more transparent and therefore understood easier by L2 learners. The problems arise when trying to employ linguistic metaphors. In specific situations (such as an L2 learner of English studying business) there are specific-level metaphors that may need to be taught. For example, if the conceptual metaphor BUSINESS IS WAR is taught during language instruction in an English business class, students
March 27th, 2009
Sponsors: Stäubli, Spartanburg Regional Healthcare System, EPSCoR/IDeA RS grant. 97
may then be able to better interpret linguistic metaphors relating to stock market situations as they arise. On the other hand, for more generic-level metaphors students may need to know the following to achieve even greater proficiency in L1: Knowing the boundaries of conventional metaphors; understanding what is heard in terms of conventional metaphors but also knowing what is not said. What are acceptable extensions of conventional metaphor? When can speakers acceptably innovate? When can metaphors be acceptably mixed? (This can be addressed by reference to the … constraints of metaphorical use described in the contemporary theory) (metaphoric competence/metaphoric extension and innovation) [5], Awareness of metaphorical layering; many utterances and expressions can be interpreted on a number of levels easily perceivable in the L1 but require more explanation in L2 (metaphorical understanding) and Sensitivity in the use of metaphor in terms of social and political correctness. This is important when learners come from diverse social and cultural backgrounds (inter-cultural pragmatics and sensitivity) [6].
As any good L2 instructor knows, language and culture are very much intertwined. The instruction of conceptual metaphor may illuminate the commonalities between the two cultures help with the acquisition of L2. More importantly, for those students who are high-intermediate to advanced the development of this particular competence will help in linguistic environments that call for various levels of language usage, especially in professional settings where culture, language, pragmatics and awareness all overlap.
CONCLUSIONS This paper explained the importance and usage of metaphors in everyday language. Though we may not all be poets, we all employ metaphors on a daily basis. The systematic mappings of these from one domain to another have made it possible for us to think in terms of the abstract. The L2 instruction of the metaphor, mainly at the generic-level, has a great deal of importance in understanding not only achieving L1 or native-like competence, but also intercultural communication and similarities. Future investigations for possible research may include evaluating L2 textbooks for any, if at all, explanations of metaphors or similarities of conceptual metaphors between an L1 and L2 and how that has a direct affect on L2 acquisition.
REFERENCES [1] R Bailey. “Conceptual Metaphor, Language,
Literature, and Pedagogy” Journal of Language and Learning, vol. 1(2), 2003.
[2] G. Lakoff and M. Johnson. “Metaphors We Live By.” Chicago Press. 1980.
[3] R Bailey. “Conceptual Metaphor, Language, Literature, and Pedagogy” Journal of Language and Learning, vol. 1(2), 2003.
[4] G. Deustcher. “The Unfolding of Languge,” Henry Holt and Company, 2005.
[5] G. Lakoff and M. Johnson. “Metaphors We Live By.” Chicago Press. 1980.
[6] G. Lakoff and M. Johnson. “Metaphors We Live By.” Chicago Press. 1980.
Fifth Annual SC Upstate Research Symposium
98 Sponsors: Stäubli, Spartanburg Regional Healthcare System, EPSCoR/IDeA RS grant.
The Preparation and Coordination Chemistry of N-2-pyridyl-N-2-(-4-phenylthiazolyl)amine
Mr. Geoffrey Ford, Dr. Edward Gouge Department of Chemistry
Presbyterian College 503 South Broad Street, Clinton, SC 29325
{gtford, egouge}@mail.presby.edu Abstract - The study of complex compounds is a growing field in the area of Coordination Chemistry. However, there are few studies on four-coordinate complex compounds. This study aims to further the development of a comprehensive set of data that will show the effect of steric strain on the dihedral angle of the two ligand fields in a set of four CuN4 chromatophore compounds. These four compounds will differ by a single functional group on the #4 position of a thiazole ring. Our goal is to create the fourth complex compound, bis[N-2-pyridyl-N-2-(4-phenylthiazolyl)amine]copper2+, via organic chemical syntheses with the last step making the complex ion. UV-Vis Spectroscopy is the method of choice to show the effect of steric strain. We expect that with increasing bulk of the group at the #4 position, the magnitude of the dihedral angle will also increase. Keywords: Ligands, 2-aminopyridine, 4-phenyl-2-chlorothiazole, phenacylthiocyanide
INTRODUCTION Coordination chemistry is the area of chemical science concerning molecular species that are composed of a central metal cation or atom bound to a group of surrounding molecules or ions by coordinate covalent bonding. These surrounding molecules or ions are also know as ligands. For example, a naturally forming complex molecule is the heme porphyrin group of the protein Hemoglobin that is found in red blood cells; in this compound, an Fe2+ metal cation is located at the center and the protein “heme” is the ligand that surrounds it. Another and much more common example of ligand bonding can be found with the dissolution of any metal cation in water, resulting in water molecules binding to the metal cation. Coordination chemistry has been a subject long studied, but only recently better understood. Today, many compounds are now assigned a coordination number, reflecting the number of ligand bonds to the central atom in each complex. Normally, these numbers are 2 through 9, even though more bonds may be formed.
Prior to this study, the research group of Dr. Ed Gouge using similar unsymmetrical, heterocyclic secondary amines, which only differed via a particular ring substituent, undertook similar
projects. These compounds were N-2-pyridyl-N-2-pyrimidylamine (HPPA), N-2-pyridyl-N-2-thiazolylamine (HPTA), N-2-pyridyl-N-2-(-4-methylthiazolyl)amine (HMPTA), and N-2-(-6-Methylpyridyl)-N-2-(-4-methylthiazolyl)amine (HDMPTA)[1]. Each of these compounds were synthesized and their properties studied and compared respectively. This current study seeks to produce similar compounds to N-2-pyridyl-N-2-thiazolylamine and N-2-pyridyl-N-2-(-4-methylthiazolyl)amine[2]. The goal of this research is the successful synthesis and characterization of two more compounds, N-2-pyridyl-N-2(-4-tertbutylthiazolyl)amine and N-2-pyridyl-N-2(-4-phenylthiazolyl)amine. Together, these four compounds vary only by the functional group located at the #4 position on the thiazole ring. Once all these compounds have been created and studied, the resultant data will be used to compile a general comparison of other like compounds that may be made in future studies.
METHODS AND MATERIALS
The study in which I am currently engaged involves three separate parts: 1) the creation of the 4-phenyl-2-chlorothiazole constituent, 2) the synthesis of an unsymmetrical, heterocyclic secondary amine using the 4-phenyl-2-chlorothiazole as a reactant, and 3) the combination of that amine with a specific metal cation to create a ligand-bound organometallic compound, otherwise known as a coordination compound. Significance of this study will help to further the knowledge of coordination chemistry, as well as further the knowledge of the specific properties of the organometallic complex. Such properties include acid/base characteristics, dihedral angles of the ligand planes, steric hindrance in the ligand field, isomerism, and differences resulting from the use of different metal cations as the central species.
Unique to this study, the targeted secondary amine to be created is N-2-pyridyl-N-2-(-4-phenylthiazoly)amine, as seen in Figure #1.
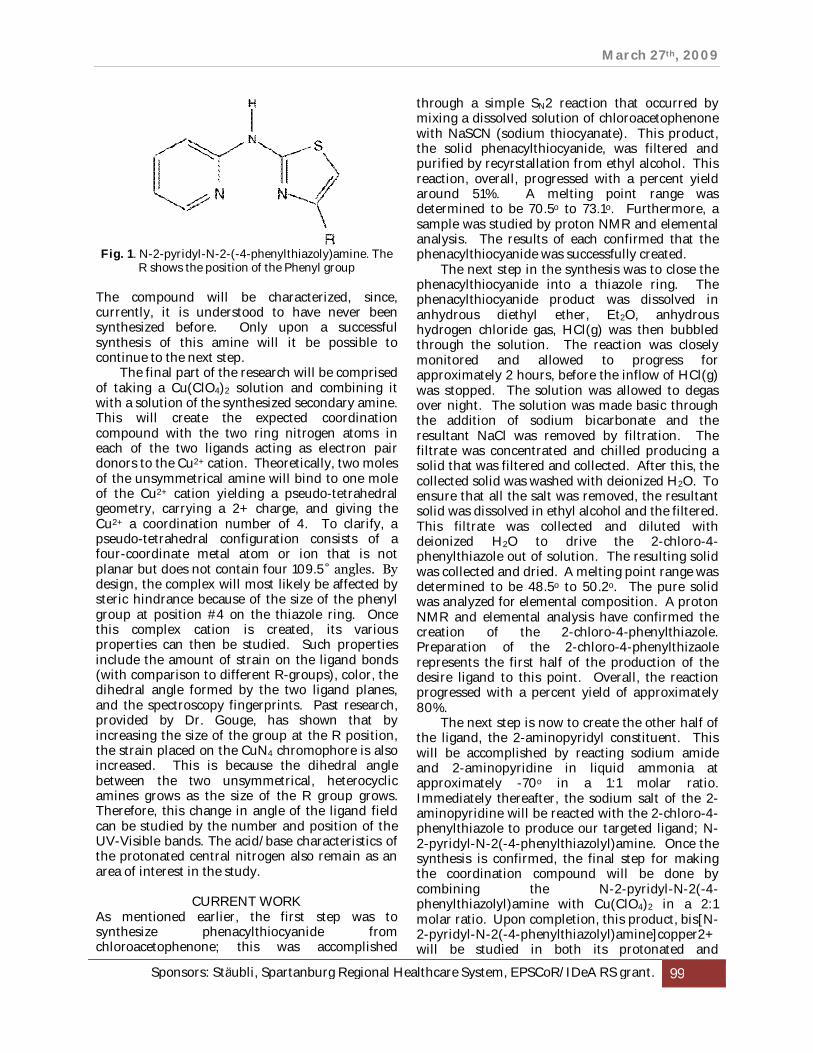
March 27th, 2009
Sponsors: Stäubli, Spartanburg Regional Healthcare System, EPSCoR/IDeA RS grant. 99
Fig. 1. N-2-pyridyl-N-2-(-4-phenylthiazoly)amine. The
R shows the position of the Phenyl group The compound will be characterized, since, currently, it is understood to have never been synthesized before. Only upon a successful synthesis of this amine will it be possible to continue to the next step.
The final part of the research will be comprised of taking a Cu(ClO4)2 solution and combining it with a solution of the synthesized secondary amine. This will create the expected coordination compound with the two ring nitrogen atoms in each of the two ligands acting as electron pair donors to the Cu2+ cation. Theoretically, two moles of the unsymmetrical amine will bind to one mole of the Cu2+ cation yielding a pseudo-tetrahedral geometry, carrying a 2+ charge, and giving the Cu2+ a coordination number of 4. To clarify, a pseudo-tetrahedral configuration consists of a four-coordinate metal atom or ion that is not planar but does not contain four 109.5˚ angles. By design, the complex will most likely be affected by steric hindrance because of the size of the phenyl group at position #4 on the thiazole ring. Once this complex cation is created, its various properties can then be studied. Such properties include the amount of strain on the ligand bonds (with comparison to different R-groups), color, the dihedral angle formed by the two ligand planes, and the spectroscopy fingerprints. Past research, provided by Dr. Gouge, has shown that by increasing the size of the group at the R position, the strain placed on the CuN4 chromophore is also increased. This is because the dihedral angle between the two unsymmetrical, heterocyclic amines grows as the size of the R group grows. Therefore, this change in angle of the ligand field can be studied by the number and position of the UV-Visible bands. The acid/base characteristics of the protonated central nitrogen also remain as an area of interest in the study.
CURRENT WORK
As mentioned earlier, the first step was to synthesize phenacylthiocyanide from chloroacetophenone; this was accomplished
through a simple SN2 reaction that occurred by mixing a dissolved solution of chloroacetophenone with NaSCN (sodium thiocyanate). This product, the solid phenacylthiocyanide, was filtered and purified by recyrstallation from ethyl alcohol. This reaction, overall, progressed with a percent yield around 51%. A melting point range was determined to be 70.5o to 73.1o. Furthermore, a sample was studied by proton NMR and elemental analysis. The results of each confirmed that the phenacylthiocyanide was successfully created.
The next step in the synthesis was to close the phenacylthiocyanide into a thiazole ring. The phenacylthiocyanide product was dissolved in anhydrous diethyl ether, Et2O, anhydrous hydrogen chloride gas, HCl(g) was then bubbled through the solution. The reaction was closely monitored and allowed to progress for approximately 2 hours, before the inflow of HCl(g) was stopped. The solution was allowed to degas over night. The solution was made basic through the addition of sodium bicarbonate and the resultant NaCl was removed by filtration. The filtrate was concentrated and chilled producing a solid that was filtered and collected. After this, the collected solid was washed with deionized H2O. To ensure that all the salt was removed, the resultant solid was dissolved in ethyl alcohol and the filtered. This filtrate was collected and diluted with deionized H2O to drive the 2-chloro-4-phenylthiazole out of solution. The resulting solid was collected and dried. A melting point range was determined to be 48.5o to 50.2o. The pure solid was analyzed for elemental composition. A proton NMR and elemental analysis have confirmed the creation of the 2-chloro-4-phenylthiazole. Preparation of the 2-chloro-4-phenylthizaole represents the first half of the production of the desire ligand to this point. Overall, the reaction progressed with a percent yield of approximately 80%.
The next step is now to create the other half of the ligand, the 2-aminopyridyl constituent. This will be accomplished by reacting sodium amide and 2-aminopyridine in liquid ammonia at approximately -70o in a 1:1 molar ratio. Immediately thereafter, the sodium salt of the 2-aminopyridine will be reacted with the 2-chloro-4-phenylthiazole to produce our targeted ligand; N-2-pyridyl-N-2(-4-phenylthiazolyl)amine. Once the synthesis is confirmed, the final step for making the coordination compound will be done by combining the N-2-pyridyl-N-2(-4-phenylthiazolyl)amine with Cu(ClO4)2 in a 2:1 molar ratio. Upon completion, this product, bis[N-2-pyridyl-N-2(-4-phenylthiazolyl)amine]copper2+ will be studied in both its protonated and

Fifth Annual SC Upstate Research Symposium
100 Sponsors: Stäubli, Spartanburg Regional Healthcare System, EPSCoR/IDeA RS grant.
deprotonated forms, mainly through the use of UV-Vis Spectroscopy. The key area of interest is the measure of the dihedral angle between the two ligand planes.
REFERENCES [1] E. M. Gouge, J. F. Geldard, and E. Sinn.
“Relationship between the Structure and Spectra of Pseudotetrahedral CuN4 Complexes and the Crystal Structure of [CuL2](ClO4)2, L=2-Pyridyl-2- Pyrimidylamine.” Inorganic Chemistry, Vol. 19, November, 1980
[2] E. M. Gouge and J. F. Geldard. Bidentate Chelate Compounds. 1. Pseudotetrahedral Copper(II) Complexes of Heterocyclic Secondary Amines.” Inorganic Chemistry, Vol. 17, February, 1978
March 27th, 2009
Sponsors: Stäubli, Spartanburg Regional Healthcare System, EPSCoR/IDeA RS grant. 101
The Effects of Exposure to Domestic Violence on Child and Adolescent Development
Vernette C. Porter, Jennifer S. Parker, Ph.D., Stefanie M. Keen, Ph.D. Department of Psychology
University of South Carolina Upstate 800 University Way, Spartanburg, SC 29303
{[email protected]} {jparker, skeen}@uscupstate.edu
Abstract - Domestic violence is prevalent in the United States as well as other parts of the world. Prior research has indicated that children and adolescents who are exposed to domestic violence are at greater risk of developing behavioral, cognitive, and social problems. Although these problems can affect children and adolescents into their adulthood, research on short term effects has mixed results. This study will evaluate the short term characteristics of children and adolescents exposed to domestic violence and assess whether factors associated with exposure to domestic violence affect their development. Keywords - children, adolescents, domestic violence
INTRODUCTION Domestic violence (DV) refers to violent behaviors that one intimate partner perpetrates to threaten, intimidate, or control another. Women are more likely to be victims of DV; although, there have been some incidents in which men have been abused by their partners. In recent years, this type of violence has become an epidemic in communities across the nation. According to the South Carolina Coalition Against Domestic Violence & Sexual Assault (SCCADVASA) [1], four million women are abused by their partners each year. Moreover, the SCCADVASA [2] estimates that one in four women will become a victim of DV during her lifetime.
DV is a prominent public health issue. Approximately four million dollars are spent on medical and mental health services to treat victims each year [1]. Victims of DV may experience a variety of health problems including stomach ulcers, gastrointestinal problems, chronic neck and back pain, and migraines and frequent headaches [11]. In addition, victims of DV may suffer from psychological problems such as depression, anxiety, and posttraumatic stress disorder (PTSD) [11]. For some of these victims, their injuries are so severe as to be fatal. Each year, up to 1,600 women die from DV-related injuries [12].
DV is especially prevalent in South Carolina. The state is ranked 7th in the nation for women murdered by their intimate partners, and has ranked in the top 10 since 2000 [9]. In 2006,
35,301 incidents of DV were reported, of which 81.6% of the victims were women [10]. Spartanburg County is certainly no exception to this serious issue; 1,723 incidents of DV were reported in 2006, of which 81.1% of the victims were women [10]. With these figures in mind, the current Attorney General for South Carolina has named DV as the number one problem in the state [10]. DV not only affects the lives of the women who are abused, but also impacts the development of the children and adolescents who are exposed to the abuse.
Graham-Bermann and Edleson [13] state that an estimated 10 million children and adolescents witness acts of DV each year. Prior research has documented the negative long-term effects of exposure to DV on child and adolescent development. Some of these effects include anxiety, depression, PTSD, as well as behavioral, cognitive, and social problems [3-8]. In addition, children and adolescents living in homes with DV have a greater risk of becoming victims of abuse. According to Graham-Bermann and Edleson [13], the co-morbid rate of child maltreatment and DV is between 30 and 60%.
Although there is a substantial body of research regarding the negative effects of exposure to DV on children and adolescents, there remain several gaps in the research literature that need to be addressed. First, much of what we know about the effects of DV exposure on children has come from maternal reports and not from the children and adolescents themselves [4]. Second, the majority of the studies are conducted with children and adolescents living with their mothers in battered women’s shelters [4]. There is less research on the exposure and effects of DV on children and adolescents living outside of shelters. Given these gaps, one goal of the present study is to include direct assessments of children exposed to DV. Another goal is to identify the effects on children and adolescents who are living outside of shelters. Furthermore, this study will examine whether exposure to community violence and substance abuse have differential effects on these children and adolescents.

Fifth Annual SC Upstate Research Symposium
102 Sponsors: Stäubli, Spartanburg Regional Healthcare System, EPSCoR/IDeA RS grant.
METHOD PARTICIPANTS – Approximately 50 children and adolescents between the ages of 6 and 16 and their mothers are expected to participate in the study. The participants are recruited through Safe Homes-Rape Crisis Coalition and P.A.C.E. Center in Spartanburg, S.C. While preliminary, the current sample includes 7 mothers and 12 children (5 male and 7 female). The mothers’ ages range from 28 to 45, and the families represent diverse ethnic backgrounds. PROCEDURE – Data collection is ongoing. Participants are provided detailed consent forms and, once they agree to participate in the study, they are administered a series of questionnaires over a two hour period. The child and adolescent measures assess exposure to violence, depression, anxiety, anger, self-concept, trauma symptoms, coping, emotion regulation, and social support. The adult measures evaluate violence exposure, depression, anxiety, trauma symptoms, and alcohol/drug abuse. After the participants complete their assessments, the mothers receive $25 and the children and adolescents receive a gift card. MEASURES Child and Adolescent
Beck Youth Inventory-II (BYI) Trauma Symptoms Checklist Conflict Tactics Scales-Parental DV
(CTS-DV) Juvenile Violence Questionnaire (JVQ) Self-Report Coping Measure (SRCM) Social Support Appraisals Scale (SSAS) The Emotion Questionnaire (EQ)
Adult Beck Depression Inventory-II (BDI) Beck Anxiety Inventory (BAI) Conflict Tactics Scales-2 (CTS-2P) Conflict Tactics Scales- General
Violence (CTS-G) PTSD Checklist/Life Events Checklist
(LE) Michigan Alcoholism Screening Test
(MAST) Drug Abuse Screening Test (DAST)
PRELIMINARY RESULTS
In the present study, seven mothers and twelve children were evaluated. Although the preliminary sample is too small for statistical analysis, the data thus far indicate that many of these children have
high levels of anxiety, anger and trauma related symptoms. Additionally, the sample appears to have high exposure to familial and community violence. All of the children reported exposure to violence in the past year, and the majority reported exposure to multiple acts of violence.
Each of the twelve children completed the Beck Youth Inventory (BYI); a self-report multi-scale measure that assesses self-concept, anxiety, depression, anger and disruptive behavior. National norms by gender and age were used to score each measure. Anxiety scores were elevated for six of the children and two reported moderate to extreme elevations on the anger scale. One child reported a moderately high score on the depression scale. Eleven of the children have above average self-concept and one child has very low self-concept. The mothers when rating their children on the Trauma Symptom Checklist for Young Children reported similar findings.
In the assessment of the mothers, they all reported severe levels of anxiety. Furthermore, they all reported high levels of posttraumatic stress symptoms, with five of the mothers reporting clinically significant levels. Reports of depressive symptoms were less consistent, as two mothers reported symptoms in the severe range, two in the moderate range, and three reported minimal depressive symptomatology. Four of the mothers reported high levels of problematic alcohol use. High levels of alcohol and drug use were reported for five of the partners.
CONCLUSIONS
DV is a serious crime that affects the lives of everyone involved. Recently, children and adolescents who are exposed to DV have become a subject of interest for researchers. Recognition of this high risk population is important because DV can have a great impact on their development. Therefore, children and adolescents who witness acts of DV or who are victims may become violent during adulthood whereas other children and adolescents may show resilience toward DV during adulthood.
Although researchers are interested in children and adolescents who are exposed to DV, they often experience problems in working with this population. One problem is that researchers may not have the availability of assessing these children and adolescents. Many DV cases do not get reported; therefore, children and adolescents do not get the opportunity to discuss their experiences. Another problem is that some children and adolescents may not be willing to share their experiences, and as a result, they do not

March 27th, 2009
Sponsors: Stäubli, Spartanburg Regional Healthcare System, EPSCoR/IDeA RS grant. 103
receive the help that they need. Currently, more efforts are being made by researchers as well as practitioners to provide help for children and adolescents who are exposed to DV. They often suffer in silence, but with the help of intervention programs and therapy, they will receive the services that they need so that they can get their lives back together.
ACKNOWLEDGEMENTS We would like to thank Safe Homes-Rape Crisis Coalition and P.A.C.E. Center for their cooperation. This project is funded by a Healthy Living Initiative Faculty Mini-Grant and the Center for Undergraduate Research and Scholarship.
REFERENCES [1] South Carolina Coalition Against Domestic
Violence & Sexual Assault (SCCADVASA). Prevalence of Domestic Violence. Retrieved January 20, 2009 from http://www.sccadvasa.
org/articles/59.pdf. 2005. [2] South Carolina Coalition Against Domestic
Violence & Sexual Assault (SCCADVASA). Domestic Violence 101: Defining Domestic Violence. Retrieved January 21, 2009 from http://www.sccadvasa.org/articles/58.pdf. 2005.
[3] D. Fowler and A. Chanmugam. “A Critical Review of Quantitative Analyses of Children Exposed to Domestic Violence: Lessons for Practice and Research”, Brief Treatment and Crisis Intervention, vol. 7(4), 322-344, 2007.
[4] S. Holt, H. Buckley, and S. Whelan. “The impact of exposure to domestic violence on domestic violence on children and young people: A review of the literature”, Child Abuse andNeglect, vol. 32, 797-810, 2008.
[5] G. Margolin and K. Vickerman. “Posttraumatic Stress in Children and Adolescents Exposed to Family Violence: I. Overview and Issues”, Professional Psychology: Research and Practice, vol. 38(6), 613-619, 2007.
[6] K. Sternberg, M. Lamb, C. Greenbaum, D. Cicchetti, S. Dawud, R. Cortes, O. Krispin, and F. Lorey. “Effects of Domestic Violence on Children’s Behavior Problems and Depression”, Developmental Psychology, vol. 29(1), 44-52, 1993.
[7] P. Von Steen. “Adults With Witnessing Histories: The Overlooked Victims of Domestic Violence”, Psychotherapy, vol. 34(4), 478-484, 1997.
[8] S. Evans, C. Davies, and D. DiLillo. “Exposure to domestic violence: A meta-analysis of child and adolescent outcomes”, Aggression and Violent Behavior, vol. 13, 131-140, 2008.
[9] National Coalition Against Domestic Violence (NCADV). Domestic Violence Facts: South Carolina. Retrieved January 22, 2009 from http://www.ncadv.org/files/SouthCarolina.pdf2005.
[10] H. McMaster. “Criminal Domestic Violence in South Carolina: 2006 Statistics”. Retrieved January 20, 2009 from http://www/scattorneygeneral.org/fraud/cdv/pdf/2006cdvstats.pdf. 2008.
[11] B. McAlister-Groves, M. Augustyn, D. Lee, and P. Sawires. “Identifying and Responding to Domestic Violence: Consensus Recommendations for Child and Adolescent Health”, Family Violence Prevention Fund. Retrieved January 20, 209 from http://www. uihealthcare.com/depts/…/childprotection/PediatricConsensus.pdf. 2001.
[12] N. Websdale. “Reviewing Domestic Violence Deaths”, National Institute of Justice, (250). Retrieved January 20, 2009 from http://www.ncjrs.gov/pdffiles 1/ jr00025.pdf. 2003.
[13] S. Graham-Bermann and J. Edleson. “Domestic Violence in the Lives of Children: The Future of Research, Intervention, and Social Policy”, Washington, DC: American Psychological Association, 2001.

Fifth Annual SC Upstate Research Symposium
104 Sponsors: Stäubli, Spartanburg Regional Healthcare System, EPSCoR/IDeA RS grant.
Implementation of Hierarchical Clustering Algorithm for Type-2 Diabetes Patients
Nicole Tobias Hodge and Wei Zhong Division of Mathematics and Computer Science
University of South Carolina Upstate 800 University Way, Spartanburg, SC 29303
[email protected], [email protected] Abstract — Clustering the national healthcare database into multiple clusters at multiple levels of a tree-structure is very important for healthcare experts to analyze the underlying distribution patterns for various subpopulations. This study utilizes the agglomerative hierarchical clustering algorithm to partition the whole dataset. We have implemented the average distance method and the centroid method to calculate the distance between two clusters during the clustering process. Both implementations for distance calculation produced multiple levels of partitions with different interesting distribution patterns. Information from the lower levels and upper levels of the tree structure provides comprehensive knowledge for healthcare experts to analyze underlying features from different subpopulation. Keywords — Hierarchical Clustering, Distance Calculations, Type-2 Diabetes
INTRODUCTION There are 23.6 million children and adults in the United States (7.8% of the population) who have diabetes, however, only 17.9 million people have been diagnosed with the disease. Type-2 diabetes accounts for about 90% to 95% of all diagnosed cases of diabetes in adults. This type of diabetes mostly affects those people of older age, obesity, family history of diabetes, physical inactivity, and certain race/ethnicity. The total estimated cost of diabetes in 2007 was $174 billion, according to the American Diabetes Association [1]. Clustering of patients diagnosed with type-2 diabetes based on the procedural codes is an important aspect of public health policy. Good understanding about distribution patterns in each clustered subpopulation will provide relevant clinical knowledge for clinicians and health policy experts to identify and evaluate important factors affecting the length of stay and charges.
Previous studies for diabetes are based on small and localized data sets. Typically, only local benchmarks are used in these models [2], reducing their applicability to the larger and more general population. In contrast, this study uses The Healthcare Cost & Utilization Project (HCUP-3) databases [3] which are the largest and most robust U.S. inpatient databases. The national
database can be very useful to generate healthcare policies at the local, state and national level.
IMPLEMENTATION OF HIERARCHIAL
CLUSTERING This study utilizes the agglomerative hierarchical clustering algorithm. Agglomerative hierarchical clustering algorithm takes a lot of data samples, puts them in individual clusters, and, through iterations, groups the most similar clusters together. The iterations are continued until the desired final number of clusters is obtained. As a result, the whole dataset is partitioned into multiple clusters at multiple levels of a tree-structure. Each level of the tree structure can capture data distribution patterns for a particular sample subspace [4]. The distance between clusters is the determining factor of their similarity. The more similar one cluster is to another, the smaller the distance is between the clusters. Distance between two clusters can be defined by average distance or centroid distance. METHOD 1: AVERAGE DISTANCE The average distance method calculates the distance between each data sample from one cluster to another and takes the average of those distances. The distance is defined by equation 1 where Ci and Cj are the two clusters and likewise
pp is the distance between the data samples p
and the data sample p [4]. The average distance is then deemed to be the distance between the clusters. This is computed by taking the distance from every data sample in one cluster to every data sample in the other cluster and then dividing it by the total number of distances taken. The average distance for clusters is defined as:
i jCp Cpji
jiavg ppnn
CCdist 1),( (1)
Figure 2 shows the pseudocode for the algorithm to calculate the average distance between two

March 27th, 2009
Sponsors: Stäubli, Spartanburg Regional Healthcare System, EPSCoR/IDeA RS grant. 105
float_distance CalculateDistanceForCluster(Cluster A, Cluster B) { for every data sample in A for every data object in B
distance += CalculateDistanceForProcedure(data_sampleInA, data_sampleInB) average_distance = distance / number of total distances taken return average_distance } float_distance CalculateDistanceForProcedure(data_sample X, data_sample Y) { for each procedure code if(X and Y had procedure) increment numOfMatch by 1 else if(X or Y had procedure) increment numOfMismatch by 1 distance = numOfMatch / numOfMismatch return distance } Fig. 2: Method of calculating the distance between clusters using the average distance method. clusters. Figure 3 shows the graphic diagram of average distance calculation.
Fig. 3. Diagram for calculating average distance method between two clusters METHOD 2: CENTROID DISTANCE This method calculates the distance between two clusters based on the cluster centroid. At the beginning of the program, the centroids are the coordinates of the data samples themselves. With
this method, the distance would only be calculated once from one centroid to the other. The distance is defined by equation 2 where Ci and Cj are the two clusters likewise mi and mj are the respective means (centroids) of the clusters [4]. The centroid is calculated from the coordinate values of each data object that is in the cluster. The coordinate values of the centroid are the averages of the respective coordinate values of each data object. Distance between clusters is determined by taking the dot product of the coordinate values of the two clusters’ centroids.
jijimean mmCCdist ),( (2)
Figure 4 shows the pseudocode for the algorithm to calculate the centroid distance between two clusters. Figure 5 shows the graphic diagram of centroid distance calculation.
centroid CalculateCentroidOfCluster(Cluster A) { for each procedure code for each data sample in A ProcedureSum += data object’s value at that procedure CentroidOfA’s value at that procedure = ProcedureSum / number of data samples in A } float_distance CalculateDistanceBetweenCentroids(Cluster A, Cluster B) { for each procedure code distance = dot product of the Centroid values of A and B at each procedure return distance } Fig. 4. Method of calculating the centroid of a cluster and method of computing the distance between two centroids.

Fifth Annual SC Upstate Research Symposium
106 Sponsors: Stäubli, Spartanburg Regional Healthcare System, EPSCoR/IDeA RS grant.
Fig. 5: Diagram for calculating centroid distance between two clusters DATASET FOR THIS STUDY The Health Cost & Utilization Project (HCUP) database was used as the dataset for this study. HCUP is the largest U.S. inpatient database. The dataset in this study consisted of over 9,000 samples of patients with diabetes that had at least two procedural codes [3]. Since diagnostics and procedural profile produces the best hierarchical clustering prediction results, these two profiles are used for the clustering process.
RESULTS ANALYSIS AND CONCLUSION The running time for centroid method implementation is very similar to that for average distance implementation. The upper level of the tree structure has 35 clusters while the lower level of the tree has 101 clusters. Both implementations for distance calculation produced multiple levels of partitions with different interesting distribution patterns. Information from the lower levels and upper levels of the tree structure provides comprehensive knowledge for healthcare experts to analyze underlying features from different subpopulation.
ACKNOWLEDGMENTS This research was supported in part by Student Research Assistant Program and Research Incentive Award from University of South Carolina Upstate. This research was also supported in part by Healthy Living Initiative Faculty Research Grant from the ReGenesis Community Health Center (RCHC).
REFERENCES
[1] American Diabetes Association (ADA) Diabetes Information, American Diabetes Association, http://www.diabetes.orgs/about-diabetes.jsp
[2] J. L. Breault, C. R. Goodall and P. J. Fos, “Data Mining a Diabetic Data Warehouse,” Artificial Intelligence in Medicine, vol. pp. 26, 37–54, 2002.
[3] Health Cost and Utilization Project (HCUP), Agency for Healthcare Research and Quality (AHRQ), http://www.hcup-us.ahrq.gov/
[4] J. Han and M. Kamber. Data Mining, Concepts and Techniques. Second Edition. Elsevier publishers, 2006.
March 27th, 2009
Sponsors: Stäubli, Spartanburg Regional Healthcare System, EPSCoR/IDeA RS grant. 107
Correlation of Selected HealthDeterminants and Outcomes in the United States: 2005
John Hart Sherman College of Straight Chiropractic
P.O. Box 1452, Spartanburg, SC 29304 [email protected]
Abstract - Selected determinants of health and health outcomes in the United States in 2005 were correlated. The determinants consisted of obesity, physical activity, diet, smoking, health insurance, chiropractors per capita, medical doctors per capita, and per capita health care expenditures (in 2004). The outcomes consisted of health perception and age-adjusted death rates for: a) all causes, b) cancer, c) heart disease, and d) cerebrovascular disease. The Spearman test for correlation was used along with a Bonferroni-adjusted alpha set at 0.001 for statistical significance of the correlation coefficients. The determinants of obesity, education, smoking, and physical activity showed statistically significant correlations with all outcomes. The average correlation for each determinant, from strongest to weakest, was: obesity, education, smoking, physical activity, diet, number of chiropractors per capita, no health insurance, number of medical doctors per capita, and health care expenditures. Keywords: outcomes research
INTRODUCTION This study assesses the correlation between selected determinants and outcomes in the U.S. for the year 2005. Determinants and outcomes were selected on the basis of the author’s interest, also known as “data-snooping” which can be helpful in developing a hypothesis [1]. Increased death rates have been linked with determinants such as obesity [2-3] and smoking [4].
METHODS The following determinants of health were selected (n=9): Percent of population in 2005 having moderate physical activity on a regular basis [5], percent of population who are obese (BMI 30.0-99.8) [5], percent of population in 2005 who smoke every day [5], percent of population in 2005 who lack health insurance [5], percent of population in 2005 who consume fruits and vegetables 5 or more times per day [5], percent of population 25 years or older who have achieved a bachelor’s degree or higher in 2005 [6], number of DCs (chiropractors) per capita in 2005 [7-8], number of MDs (medical doctors) per capita in
2005 [9], and per capita health care expenditures in 2004 [10].
The following outcomes (n=5) were selected: Percent of population having a self-rated health perception as “excellent” in 2005 [5]; age-adjusted death rates in 2005 for: all causes [11], and for the top three individual causes of death (which were cancer, [11] heart disease, [11] and cerebrovascular disease [11].
DATA ANALYSIS When checking assumptions, most of the correlations lacked linearity to the extent that a larger r-squared value was observed using a quadratic line (one bend) versus a linear line. Consequently, predictor-type statistics such as partial correlation and linear regression were not considered appropriate for these data. In addition, some of the data displayed skewed values that suggested an abnormal distribution (outside of skewness values of -1 and 1). Consequently, the Spearman correlation test was used for analysis. The various strengths of the correlation coefficients were considered as follows: < 0.2 = negligible; 0.20 to 0.40 = low; 0.40 to 0.70 = moderate; 0.7 to 0.90 = high; and > 0.90 = very high [12]. Since multiple tests for significance were performed (9 determinants x 5 outcomes = 45 correlation tests), a Bonferroni-adjusted alpha value was used where the traditional alpha level of 0.05 is divided by the number of tests performed (alpha= 0.05/45 = 0.001).
RESULTS Each determinant, except for health care spending and health insurance, had at least one correlation coefficient that was statistically significant (p < 0.001). All significant correlations occurred in the expected direction, i.e., increased obesity increased mortality and increased health care providers (DCs and MDs) decreased mortality. The determinants of obesity, education, smoking, and physical activity showed all five of their outcomes correlations having at least moderate strength and being statistically significant. The

Fifth Annual SC Upstate Research Symposium
108 Sponsors: Stäubli, Spartanburg Regional Healthcare System, EPSCoR/IDeA RS grant.
average correlation for each determinant, from strongest to weakest, was: obesity, education, smoking, physical activity, diet, DCs per capita, no health insurance, MDs per capita, and health care expenditures.
DISCUSSION Correlation does not in itself indicate causation but it can show clues. For the most part there are no big surprises in this brief inquiry. Eyebrows may be raised on a couple of the correlations. For example, DCs per capita showed stronger correlations than MDs per capita showed. While DCs may be known for taking care of patients with back pain, there are a number of theories emerging on the deeper neurophysiological relationship between the spine and visceral function [13-15].
The present study assumes that more health care providers (DCs and MDs) = more health care delivered. The literature does not consistently support the notion that more health care = improved outcomes [16-17]. Consequently, improved outcomes correlated with increased number of providers per capita may be due to other factors. The relatively low correlation observed between death rates and health care spending is consistent with findings elsewhere [16, 18-19].
CONCLUSION This study reveals that different determinants show different strengths of correlation, with obesity showing the strongest while health care spending showed the weakest. Future study could utilize predictive statistics such as regression or structural equation modeling. This will help to verify or refute the present findings.
REFERENCES [1] R. Ott, M. Longnecker. An introduction to statistical
methods and data analysis. Pacific Grove, CA: Duxbury; 2001.
[2] D. Allison, K. Fontaine, J. Manson, J. Stevens, T. VanItallie. Annual deaths attributable to obesity in the United States. Journal of the American Medical Association 1999; 282:1530-1538.
[3] E. Calle, M. Thun, J. Petrelli, Ca. Rodriguez, C. Heath. Body-mass index and mortality in a prospective cohort of U.S. adults. New England Journal of Medicine 1999; 341(15): 1097-1105.
[4] Centers for Disease Control and Prevention (CDC). State-specific smoking-attributable mortality and years of potential life lost--United States, 2000-2004. Morbidity and Mortality Weekly Report 2009; 58(2):29-33.
[5] Behavioral Risk Factor Surveillance System. Centers for Disease Control and Prevention. [Cited 2008 Dec 7]. Available from: http://www.cdc.gov/brfss/index.htm
[6] Table 13. U.S. Census Bureau. [Cited 2008 Dec 10]. Available from: http://www.census.gov/population/www/socdemo/education/cps2005.html
[7] Federation of Chiropractic Licensing Boards (FCLB). [Cited 2007 Dec 10]. Available from www.fclb.org.
[8] Email to author from FCLB with corrections for Tennessee and Wisconsin for 2005. July 31, 2008.
[9] D. Smart. Physician characteristics and distribution in the U.S. American Medical Association; 2007.
[10] 2004 state estimates. Per capita personal health care. Department of Health and Human Services. September 2007. [Cited 2009 Jan 30]. Available from: http://www.cms.hhs.gov/NationalHealthExpendData/downloads/res-us.pdf
[11] National Vital Statistics Report. CDC. [Cited 2008 Dec 7]. Available from: http://www.cdc.gov/nchs/products/pubs/pubd/nvsr/nvsr.htm
[12] U.S. Department of Health and Human Services. Guilford’s suggested interpretation for correlation coefficient values. (2006). [updated 2006 Feb 16; cited 2007 May 11]. Administration for Children and Families. Available from: www.acf.hhs.gov/programs/cb/pubs/cwo02/appendix/appendixG.htm
[13] B. Budgell. Reflex effects of subluxation: the autonomic nervous system. Journal of Manipulative and Physiological Therapeutics 2000; 23(2):104-106.
[14] L. Briggs, R. Boone. Effects of a chiropractic adjustment on changes in pupillary diameter: a model for evaluating somatovisceral response. Journal of Manipulative and Physiological Therapeutics 1988 Jun;11(3):181-9.
[15] J. Pickar. Neurophysiological effects of spinal manipulation. Spine J 2002; 2(5):357-371.
[16] E. Fisher, D. Wennberg, T. Stukel, D. Gottlieb, F. Lucas, E. Pinder. The implications of regional variations in medicare spending. Part 2: health outcomes and satisfaction with care. Annals of Internal Medicine 2003; 138:288-298.
[17] E. Fisher, H. Welch. Avoiding the unintended consequences of growth in medical care. Journal of the American Medical Association 1999;281:446-453.
[18] D. Filmer, L. Pritchett. The impact of public spending on health: does money matter? Social Science and Medicine 1999; 49: 1309-1323.
[19] G. Anderson, J. Poullier. Health spending, access, and outcomes: trends in industrialized countries. Health Affairs 1999; 18(3): 178-192.
March 27th, 2009
Sponsors: Stäubli, Spartanburg Regional Healthcare System, EPSCoR/IDeA RS grant. 109
Ukrainian Nursing: A Survey of Caring Behaviors Gayle L. Casterline and Nataliya Lishchenko
Mary Black School of Nursing University of South Carolina Upstate 800 University Way, Spartanburg, SC
Abstract - Since 2004, faculty of the school of nursing at the University of South Carolina Upstate has worked to develop an effective international link between its program and the nursing program at Ternopil State Medical University, Ukraine, including educational and research collaboration. The authors were invited to speak on Human Caring Science at the 3rd annual National Ukrainian Nursing Conference to more than 150 directors of nursing practice and curriculum in June 2008. Following the conference, the authors visited Ternopil Regional Municipal Hospital and Ternopil Children’s Hospital. As a result of the interest expressed by the nurses, the Caring Efficacy Scale (Coates, 1995, 1997) was translated with permission and used as a pilot survey on a volunteer sample of 75 nurses in clinical practice. Results indicated a high sense of efficacy in establishing caring relationships with patients in the Ukrainian nurses surveyed. The mean score of the CES was 4.89, which compares closely with Coates’ original research results on staff nurses in the US (X = 4.9). Presenters will discuss the cultural and political characteristics influencing Ukrainian nursing, as well as the importance of international research efforts in exploring the nature of caring behaviors as Ukrainian nursing education continues to reform. Keywords — Caring Science, Ukraine, Caring Efficacy Scale, International Nursing Practice
INTRODUCTION Ukraine is a post-Soviet independent country and the largest country in Europe with a population of 46 million. Ukraine borders with Russia on the East, Belorussia and Poland on North, and Moldova, Hungary and Slovakia on the West. Ukraine has fertile agricultural land, expansive mountain ranges and the breath-taking Black and Azov Seas, and is in the geographic center of the Europe.
Globalization of a worldwide educational environment calls for the new ways of informational exchange and professional development. Ukrainian/American cooperation has existed between USC Upstate and Ternopil State Medical University (TSMU) for more than four years. This international collaboration has resulted in a student and faculty exchange, a variety of scholarship activities, and the development of strong professional relationships between the two universities [1]. The importance of
such an international connection is even more valuable because Ukrainian nursing education is undergoing a new wave of reform. The administration and faculty of the USC Upstate Mary Black School of Nursing have been role models for the Ukrainian Nursing School [2].
NURSING IN UKRAINE
The nursing shortage spans the world. As in the United States, careers in health care and nursing specifically are highly sought after in the Ukraine. There are 122 state owned nursing schools financed from state and local budgets. Private schools are not as popular in the country. As of year 2007, 24,667 students were enrolled into Nursing Programs statewide. Nursing education in Ukraine is part of a unified national nursing curriculum taught in all nursing programs and approved by the Ukrainian Ministry of Health and Education.
In 2007 there were 433,400 nurses in Ukraine; approximately 60% associate degrees in nursing, 10% have bachelor degrees in nursing, and the rest are trained specifically as midwives and “feldshers” (equivalent to a physician assistant in the US) [3]. Nursing education at the associates level takes three years after full secondary education and four years after basic secondary education. This program is obligatory for all students who want to continue toward the Baccalaurean Program, which is one year. A Masters program in nursing was introduced for first time at two Ukraine universities in September 2008. Introducing of Master’s program was very important for Ukraine, since today most of the nursing schools faculty are physicians and pedagogical specialists but not nurses. The main goal of the new Master’s program in Ukraine is to prepare a new generation of instructors and professors for nursing schools who are nurses.
The scope of nursing practice in Ukraine is generally the same as in the US with several differences. First, nurses in Ukraine are not expected to act as autonomously as they are in the US. Secondly, the range of nursing skills is narrower comparable to the US nursing. Some of the US nursing skills are prerogative of MDs in
Fifth Annual SC Upstate Research Symposium
110 Sponsors: Stäubli, Spartanburg Regional Healthcare System, EPSCoR/IDeA RS grant.
Ukraine (some types of resuscitation, patient admission to the hospital, etc.).
The Nursing Association in Ukraine is a very young organization, but it already plays an important and instrumental role in mentoring nurses in Ukraine. Founded by Dr. Tatyana Chernyshenko, Chief Nurse in the Ministry of Health of Ukraine, the Nursing Association is beginning to act as an organized voice for all Ukrainian nurses. UKRAINIAN CONFERENCE ON “PHILOSOPHY
IN NURSING” The authors of the article were invited to present at the Annual Ukrainian Nursing Conference in Ternopil in June 2008. Nearly 150 nursing school directors, hospital administrators, nurse managers and clinicians were present at the conference. Dr. Casterline made a presentation on Caring Science as developed by three well-known nurse theorists, Dr. Jean Watson [3], Dr. Anne Boykin [4], and Dr. Kristin Swanson [5]. Watson’s theory of caring emerged to shed light on the unique knowledge, practice, and values of the discipline of nursing. The basic core of nursing, which complemented but stood in stark contrast to conventional medicine, is the philosophy and science of caring. The success of nursing in the new millennium will be its commitment to a covenantal ethic of human service and respect for the sacredness of life.
Both authors were impressed by the overwhelming response demonstrated by conference participants to the caring topic. Nurses from all parts of the Ukraine wanted to talk about their experiences with caring and to express how they identified closely with the theories that they had not necessarily been exposed to educationally but felt in their hearts.
THE SURVEY Following the conference, the authors visited the Ternopil Regional Hospital and the Ternopil Children’s Hospital. They were invited by hospital administrators and unit managers to tour the facilities and talk with groups of nurses about caring theory. Coates’ Caring Efficacy Scale (CES) was translated to Ukrainian with permission and distributed to the hospital nurses (N=75). The CES is a valid and reliable tool which identifies 30 caring behaviors using a Likert scale ranging from –3 to +3. Researchers have used the CES in the United States to quantify caring behaviors in medical-surgical nurses. According to Coates, this was the first time the tool had been used in Ukraine. The authors also asked volunteer Ukrainian nurse participants to indicate their age and years of nursing experience on the survey.
RESULTS
Seventy-five nurses agreed to participate in the survey. They ranged in age from 20 years to 60 years, with an average of 35 years. Years of nursing experience ranged from 1-39 years, with an average of 16 years. The mean score on the survey was 4.89, indicating a high degree of efficacy in building relationships with patients. This compares with Coates’ mean of 4.9 for medical-surgical nurses and Amendolair’s unpublished research in nurses in South Carolina of 4.84. Nurses in Ukraine appear to perceive similar confidence in their ability to connect in a caring way to their patients as nurses in the United States.
CONCLUSIONS Caring science continues to be a strong theoretical framework for nursing education and clinical nursing healthcare delivery. An International Caritas Consortium has been created by Dr. Watson to explore strategies for bringing caring science to life in academic and clinical practice settings throughout the world [3]. International partnerships strengthen and facilitate the development of quality global healthcare and provide a forum for sharing original scholarship and diverse forms of caring inquiry.
REFERENCES
[1] T. Chernyshenko, L. Kovalchuk, N. Lishchenko, and O. Usynska Prospective for the International Cooperation in Nursing Education In Nursing Education In Ukraine: From the Experience of Ternopil State Medical University Institute of Nursing, Nursing, vol 2, pp. 5-9, 2007.
[2] V. Martsenyuk, N.Lishchenko, A. Prokopchuk et al. Nursing Education in the University of South Carolina Upstate. Ukrmedkniga, Ternopil, Ukraine, pp. 31-250, 2006.
[3] J. Watson. Nursing: The Philosophy and Science of Caring. Boulder CO: University Press of Colorado. 2008.
[4] A. Boykin, S. Schoenhofter. Nursing as Caring: A Model for Transforming Practice. Boston: Jones and Bartlett. 2001.
[5] K. Swanson. What is Known about Caring in Nursing Research. In A.S. Hinshar, S. Feetham, J. Sharer, eds., Handbook of Clinical Research. Thousand Oaks, CA: Sage. 1999.
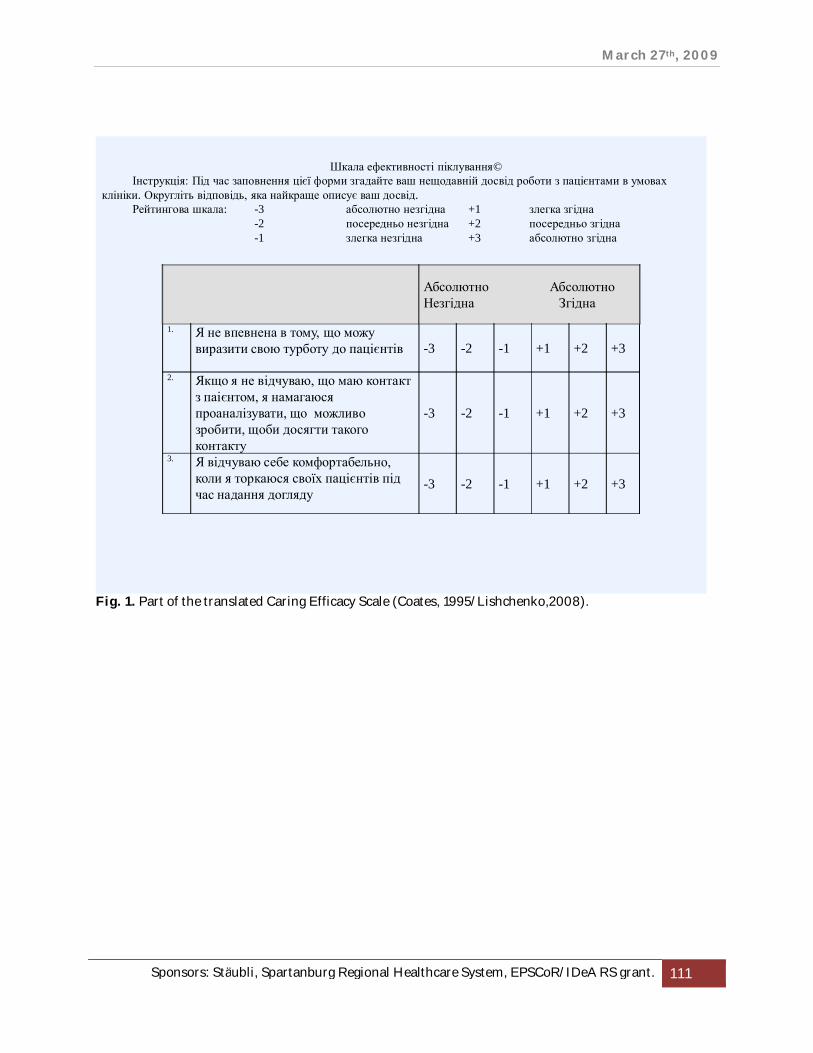
March 27th, 2009
Sponsors: Stäubli, Spartanburg Regional Healthcare System, EPSCoR/IDeA RS grant. 111
Абсолютно АбсолютноНезгідна Згідна
1. Я не впевнена в тому, що можу виразити свою турботу до пацієнтів -3 -2 -1 +1 +2 +3
2. Якщо я не відчуваю, що маю контакт з паієнтом, я намагаюся проаналізувати, що можливо зробити, щоби досягти такого контакту
-3 -2 -1 +1 +2 +3
3. Я відчуваю себе комфортабельно, коли я торкаюся своїх пацієнтів під час надання догляду
-3 -2 -1 +1 +2 +3
Шкала ефективності піклування©Інструкція: Під час заповнення цієї форми згадайте ваш нещодавній досвід роботи з пацієнтами в умовах
клініки. Округліть відповідь, яка найкраще описує ваш досвід.Рейтингова шкала: -3 абсолютно незгідна +1 злегка згідна
-2 посередньо незгідна +2 посередньо згідна-1 злегка незгідна +3 абсолютно згідна
Fig. 1. Part of the translated Caring Efficacy Scale (Coates, 1995/Lishchenko,2008).
Fifth Annual SC Upstate Research Symposium
112 Sponsors: Stäubli, Spartanburg Regional Healthcare System, EPSCoR/IDeA RS grant.
Prevention of Hospital-Acquired, Catheter-Associated Urinary Tract Infections: A Pilot Study
Brian T. Conner Department of Nursing
Lander University 320 Stanley Avenue, Greenwood, SC 29646
Abstract - Hospital-acquired urinary tract infections (HA-UTI) are well-documented adverse events that constitute the most common type of healthcare acquired infections around the world [2]. Strikingly, over 1 million HA-UTIs are diagnosed each year and approximately 80% of those are linked with urinary catheterization [3]. Evidence has shown that many of these nosocomial infections are preventable. Unfortunately, these unintended clinical outcomes often lead to delays in recovery, extended hospital stays, and increased healthcare costs for hospitalized patients. Moreover, the Centers for Medicare and Medicaid Services’ (CMS) decision to halt payments on additional costs generated by HA-UTIs will result in increased hospital costs as well. The overall objective of this quasi-experimental pilot feasibility study is to investigate the effects of a new UTI prevention (UTIP) protocol on hospital-acquired, catheter-associated urinary tract infections (HA-CAUTI). The UTIP protocol involves several prevention measures bundled together in the manner of other prevention bundles documented by the Institute for Healthcare Improvement such as those for ventilator-associated pneumonia and central line blood stream infections. A number of published studies have indicated a variety of simple but effective HA-CAUTI prevention strategies; however, extremely limited research exists on the effectiveness of combined strategies for a comprehensive prevention protocol. Keywords: catheter-associated urinary tract infections, hospital-acquired conditions, nosocomial infections, prevention
INTRODUCTION Hospital-acquired urinary tract infections (HA-UTI) are well-documented adverse events that constitute the most common type of healthcare acquired infections around the world [2]. Strikingly, over 1 million HA-UTIs are diagnosed each year and approximately 80% of those are linked with urinary catheterization [3]. Evidence has shown that many of these nosocomial infections are preventable. Unfortunately, these unintended clinical outcomes often lead to delays in recovery, extended hospital stays, and increased healthcare costs for hospitalized patients. Moreover, the Centers for Medicare and Medicaid Services’ (CMS) decision to halt payments on additional costs generated by HA-UTIs will result in increased hospital costs as well. The overall
objective of this quasi-experimental pilot feasibility study is to investigate the effects of a new UTI prevention (UTIP) protocol on hospital-acquired, catheter-associated urinary tract infections (HA-CAUTI). The UTIP protocol involves several prevention measures bundled together in the manner of other prevention bundles documented by the Institute for Healthcare Improvement such as those for ventilator-associated pneumonia and central line blood stream infections. A number of published studies have indicated a variety of simple but effective HA-CAUTI prevention strategies; however, extremely limited research exists on the effectiveness of combined strategies for a comprehensive prevention protocol. The UTIP bundle protocol is adapted from a proposed “bladder bundle” protocol developed by members of the Keystone Center for Patient Safety & Quality associated with the Michigan Health & Hospital Association [1]. A recent study conducted among 719 hospitals across America revealed that no standard UTI prevention methods currently exist and a very low percentage of the respondent facilities reported having any strategic approach [4]. Thus, this study breaks new ground by developing a comprehensive strategy for UTI prevention that, if successful, can be replicated and standardized throughout any acute care inpatient setting. Prior to developing a definitive efficacy study of the proposed bundle protocol intervention, this pilot study is intended to evaluate and refine the protocol measures, demonstrate clinical feasibility of implementing the protocol, and obtain pilot data. Through this study each measure within the protocol will be evaluated for effectiveness as well as validity with relation to the intended outcomes. Additionally, power and effect sizes will be calculated for development of a larger clinical trial that will be generalizable to any hospital. This pilot study using the UTIP bundle protocol will be conducted in a sample of patients with indwelling catheters on a 32-bed telemetry nursing unit within a local hospital and compared to patients with indwelling catheters on a similar 32-bed telemetry unit within the same hospital who will receive routine care. Routine care consists of
March 27th, 2009
Sponsors: Stäubli, Spartanburg Regional Healthcare System, EPSCoR/IDeA RS grant. 113
the hospital’s current standard polices and procedures related to insertion and care of indwelling catheters without the provision of the UTIP bundle protocol. All patients admitted to the units over a three month period and who agree to participate in the study will be included. A sample size of 45 patients per group is anticipated based on the average daily census of 20 and the average number of patients with indwelling catheters of 6 (30%). The primary outcome measure is the incidence of HA-CAUTI and the expected outcome is an 80% reduction in the rate, which is based a standard measure using the number of patients with HA-CAUTI divided by the number of indwelling urinary catheter-days multiplied by 1,000 [5]. The secondary measures include length of hospital stay and unpaid hospital costs due to HA-CAUTI. The study hypothesis is as follows: Patients who receive the UTIP bundle protocol admitted to hospital unit 1 will have 80% fewer HA-CAUTI compared to patients who receive usual care admitted to unit 2, reduced or no delays in recovery or extended hospital stays, and reduced or no unpaid hospital costs due to HA-CAUTI.
RESEARCH DESIGN AND METHODS OVERVIEW, SETTING, AND SAMPLE This pilot study will use formative protocol development methods and a two-group longitudinal study design featuring an intervention group on one telemetry unit (unit 1) and a control group on another telemetry unit (unit 2). Patients will be assigned to a group based on the unit to which they are admitted or transferred. Randomization of participants will not occur in the pilot study due to feasibility issues related to the intervention protocol. Institutional Review Board (IRB) approval will be gained prior to implementation of the study and informed consent will be obtained from each patient or legal guardian/healthcare power of attorney (HC-POA). Those patients in the intervention group will be informed of the experimental protocol being used in their care while those patients in the control group will be informed that they will receive the usual hospital care for patients with urinary catheters. This study will be conducted on two similar 32-bed telemetry units within a 400-bed acute care hospital located in rural South Carolina. Specific admission criteria exist for each of the units and the majority of the patients are attended by the same physicians. The main diagnoses of the patients admitted to each of the units involve cardiac, respiratory, and renal disorders. For this pilot study, the projection is for the ability to
recruit a sample size of approximately 45 patients per group (total N=90). The pilot study will be conducted over three months with the following inclusion criteria: male or female inpatients ≥ 18 years of age who require insertion (by a registered nurse working on the specified unit) and maintenance of an indwelling urinary catheter for more than 48 hours with a total stay within the same unit of at least five days post-catheter insertion. Data will be collected on those patients who have had a catheter in place for 48 hours or more. Exclusion criteria include: patients admitted and/or transferred into the specified unit with an indwelling catheter already inserted, patients already receiving antibiotic therapy for any purpose prior to catheter insertion, patients who were previously catheterized and/or receiving antibiotic therapy within 72 hours of admission/transfer to the specified unit, and/or documented evidence of UTI in a patient prior to admission/transfer to the unit. Patients will be removed from the study if any of the following events occur prior to the fifth day post-catheterization; (a) the catheter is removed for any reason, (b) they are transferred or discharged from the unit, or (c) antibiotic therapy is initiated SAMPLE SIZE DETERMINATION While not designed to confirm or refute the hypotheses about the intervention effectiveness, the purpose of this pilot study is to evaluate the feasibility of the interventions, to obtain estimates of variability for the outcome measures, and to obtain preliminary indicators of intervention effectiveness (e.g. estimates of effect size) as necessary input for the design of future efficacy/effectiveness studies. The sample size to be used for this study was determined using Cohen’s statistical table and is based on achieving 80% power to detect an 80% reduction in the incidence of HA-CAUTI with a significance level of P < 0.05 (2-sided). This information will steer the design of further large scale studies for evaluating the effectiveness of the UTIP bundle protocol. INTERVENTION FOR EXPERIMENTAL GROUP PARTICIPANTS The experimental intervention being tested in this pilot study is the UTIP bundle protocol which consists of five nursing measures related to indwelling urinary catheter usage to be implemented within the specified unit and applied to all eligible participants. Each of these measures has been documented in various studies as individually contributing to the prevention of HA-

Fifth Annual SC Upstate Research Symposium
114 Sponsors: Stäubli, Spartanburg Regional Healthcare System, EPSCoR/IDeA RS grant.
CAUTIs; however, the purpose of this experimental intervention is to evaluate the efficacy of combining the measures into a comprehensive bundled protocol and set of guidelines. The five measures of the protocol include the following: 1. Use of the smallest possible antimicrobial-
impregnated catheter (preferably 14 or 16 Fr). 2. Development and daily use of a specific audit
tool to document the number of patients with indwelling catheters inserted on the specified unit as well as the type, size, and duration of each.
3. Development and use of a specified area within nurses’ bedside charts for documentation of daily assessment of catheter condition and securement method, and documentation of daily assessment of potential for discontinuation of catheter.
4. Development and use of a physician-approved RN-based catheter discontinuation protocol.
5. Development and use of a physician reminder system to alert physicians on a daily basis of the necessity to evaluate the patient’s urinary status and consider catheter removal.
In addition to the five nursing measures of the bundle protocol, development and implementation of training for all nursing personnel related to the measures will be conducted on the specified unit and evaluation of the protocol implementation and compliance rates with all five measures will be analyzed. THE ROUTINE CARE CONTROL GROUP Eligible participants within the control group will receive the usual routine hospital care for patients with urinary catheters established by the existing policies and procedures but will not receive the experimental intervention. The routine care consists of catheterizations using standard silicone catheters (16 or 18 Fr) and the standard documentation on the existing nursing flow sheet. DATA COLLECTION METHODS The overall responsibility for data collection rests with the principle investigator (PI) and will be accomplished in collaboration with the Nursing Directors of the specified units. The Nursing Directors may delegate the data collection responsibilities but will remain accountable for producing the necessary and appropriate information to the PI on a weekly basis throughout the three month study period. The following data will be collected:
Participant identification forms including name, age, gender, race/ethnicity, medical diagnosis, and clinical symptomology for all patients approached about potential enrollment in the study.
Demographic and health data will be collected on a Demographic Questionnaire for all patients enrolled in the study in both the intervention and the control groups.
Data related to the UTIP bundle protocol measures will be collected daily and recorded on the audit tool which will include compliance rate audits of nursing documentation on the bedside flow sheets.
Data will be collected on a separate form accounting for the number of catheters discontinued based on the physician-approved protocol.
Data will also be collected on the compliance rates with the daily physician reminder system as well as the number of catheters discontinued related to the reminder system.
THREATS TO THE VALIDITY OF THE STUDY Several potential threats to validity of the study exist with the primary issue being related to RN staffing. During the statistical analysis process the researchers will control for staffing issues related to having either less or more than the allocated amount of RNs for a given census. In addition, the researchrs will control for RNs who are floated or assigned to the intervention unit from other nursing units on any given shift without having attended the education and training for the pilot study. Two other threats to validity include a lack of availability on any given shift of the appropriate and approved antimicrobial catheters and/or the physician reminder system chart appliqués.
DATA MANAGEMENT PLAN All data will be entered into an SPSS database having integrated data quality and consistency checks (e.g. data-range) as part of the data procedure. Data quality will be monitored and assured: 1) as reported; and 2) as entered into the database. For the former, all hardcopy forms will be visually inspected before data entry. Further, a manual comparison of randomly selected data hardcopy forms with data output listing generated from the study database will be performed, and consistency checks will be generated by SPSS programs as part of routine data cleaning procedures. All patients eligible for enrollment will be registered and entered into the study database

March 27th, 2009
Sponsors: Stäubli, Spartanburg Regional Healthcare System, EPSCoR/IDeA RS grant. 115
designed by the PI. In addition to the use of passwords and other security measures, all documents containing identifying information are considered confidential materials and are safeguarded to the greatest possible extent. No individually identifying information will be released or discussed with anyone other than study staff which includes the PI, the nursing directors from both units, the involved nursing staff members, and the involved physicians. Statistical analysis will be performed using standard tests as appropriate. Univariate descriptive statistics and frequency distributions will be calculated as appropriate for all variables for the total sample and within groups. Categorical data will be presented as absolute values and percentages while continuous variables will be expressed as means + standard deviation. Chi-square tests will be used for categorical variables and a two-tailed Students t test will be performed for comparison of continuous variables. Other tests will be used as appropriate for the data.
CONCLUSION The occurrence of hospital-acquired conditions and their resulting effects are for the most part preventable. Building upon previous research of various individual prevention measures, this pilot study seeks to explore a new intervention bundle protocol to improve the prevention of HA-CAUTIs. This study is scheduled to begin in May, 2009 and the intent is to publish results of the study by December, 2009.
REFERENCES [1] Hospital infection control. (2008, February).
Keystone provides keys to preventing UTIs: ‘Bladder bundle’ team includes ICPs, 35(2), 21-23.
[2] Nazarko, L. (2008). Reducing the risk of catheter-related urinary tract infection. British Journal of Nursing, 17(16), 1002-1010.
[3] Newman, D.K. (2007). The indwelling urinary catheter: Principles for best practice. Journal of Wound Ostomy Continence Nursing, 34(6), 655-661.
[4] Saint, S., Kowalski, C.P., & Kaufman, S.R. (2008). Preventing hospital-acquired urinary tract infection in the United States: A national study. Clinical infectious Diseases, 46, 243-250.
[5] Stensballe, J., Tvede, M., Looms, D., Lippert, F.K., Dahl, B., Tennesen, E., & Rasmussen, L.S. (2007). Infection risk with nitrofurazone-impregnated urinary catheters in trauma patients. Annals of Internal Medicine, 147(5), 285-293.

Fifth Annual SC Upstate Research Symposium
116 Sponsors: Stäubli, Spartanburg Regional Healthcare System, EPSCoR/IDeA RS grant.
Classification of Patients with Heart Disease Using Multi-Level Support Vector Machines
Wei Zhong1, Rick Chow1, Richard Stolz3, Marsha Dowell2 1Division of Math and Computer Science, 2School of Nursing
3School of Business Administration and Economics University of South Carolina Upstate
800 University Way, Spartanburg, SC 29303 {wzhong, rchow, rstolz and mdowell}@uscupstate.edu
Abstract — Solving classification problems using a single classifier can be enhanced by ensemble methods such as bagging and boosting. Although bagging and boosting have shown promising results, both methods have their weaknesses. In this paper, Support Vector Machine (SVM) is selected as the classifier due to its outstanding properties. In order to produce a new clustering-based ensemble method, we proposed the Multi-level Support Vector Machines (MLSVMs). MLSVMs from different levels of a tree cooperatively decide class assignment of a given sample based on a decision fusion algorithm. Three novel decision fusion algorithms are compared to select the best decision fusion strategy for SVM learning maximization. The heart disease dataset from national biomedical and healthcare databases is used for testing the classification performance of our new model. Our preliminary experimental results indicate that the performance of MLSVMs is superior to a single SVM, one-level clustering-based SVMs, bagged SVMs and boosted SVMs. MLSVMs proposed in this study provide a new and effective ensemble method to improve the single classifier approach in addition to the popular boosting and bagging methods. Keywords — Classification, Boosting, Bagging, Support Vector Machine, Clustering.
INTRODUCTION Support Vector Machine (SVM) [1] can be used as a robust classifier for solving difficult classification problems. Similar to other training algorithms, the traditional SVM training algorithm produces a number of SVM classifiers based on different training parameter settings. The most effective SVM classifier is selected as the final classification model using specific performance evaluation criteria. Even though the rest of the SVM classifiers produced by the training algorithm are discarded, many of them may have better classification performance than the selected classifier in certain regions of the sample space. Hence, many researchers have proposed various ensemble methods to combine different classifiers to further improve the classification performance of a single classifier [2]. The combined classifiers perform better than any of the individual member
classifiers working alone as long as the member classifiers are diverse [3]. Diverse classifier ensembles can be developed using different feature sets, training sets, or different classification algorithms [4,5,6].
PREVIOUS WORK Bagging [7] and boosting [8] are two of the most popular ensemble methods for combining different classifiers. In the bagging algorithm, the bootstrap method is used to create training samples for generating multiple classifiers [7]. A bagged classifier is then used to tally the votes from the ensemble of classifiers. The bagged classifier can enhance the classification performance because the bagging algorithm reduces the variance of the individual classifiers. In theory, boosting can significantly improve the performance of a classifier that performs just a little better than random guessing [8]. Since boosting concentrates on misclassified samples, the final boosted model may have problems with over-fitting. In contrast, bagging is less susceptible to the over-fitting problem [2]. In our previous work to produce a clustering-based ensemble method, the one-level Clustering Support Vector Machines (CSVMs) were proposed [9]. One-level CSVMs can improve the effectiveness and efficiency of SVM training by dividing large datasets into multiple clusters and training a SVM for each cluster. A weakness of one-level CSVMs is that partitioning datasets into one level may not be satisfactory; Consequently, SVM training for some clusters may be hindered due to improper clustering.
NEW APPROACH To overcome this weakness of one-level CSVMs, Multi-level SVMs (MLSVMs) are proposed to effectively capture the complex underlying distribution patterns and to enhance the classification performance of a single SVM. The advantage of multi-level clusters is that some clusters at the lower levels may provide more suitable samples subspaces for SVM trainings than
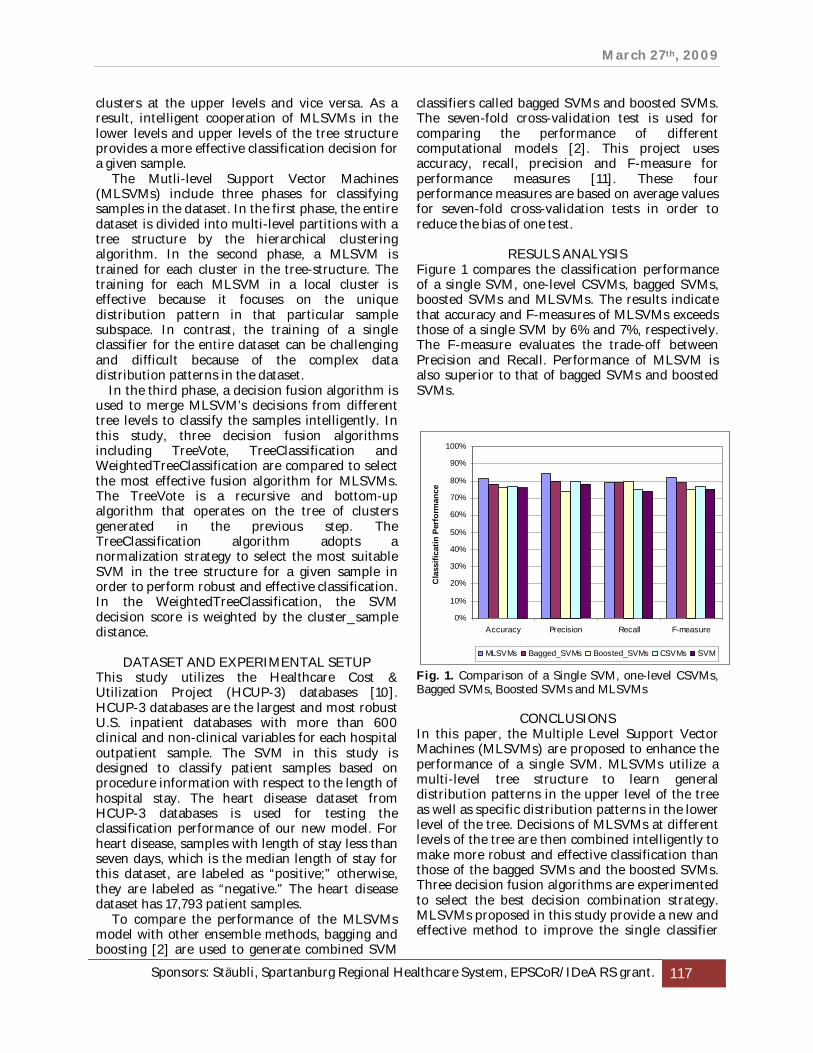
March 27th, 2009
Sponsors: Stäubli, Spartanburg Regional Healthcare System, EPSCoR/IDeA RS grant. 117
clusters at the upper levels and vice versa. As a result, intelligent cooperation of MLSVMs in the lower levels and upper levels of the tree structure provides a more effective classification decision for a given sample. The Mutli-level Support Vector Machines (MLSVMs) include three phases for classifying samples in the dataset. In the first phase, the entire dataset is divided into multi-level partitions with a tree structure by the hierarchical clustering algorithm. In the second phase, a MLSVM is trained for each cluster in the tree-structure. The training for each MLSVM in a local cluster is effective because it focuses on the unique distribution pattern in that particular sample subspace. In contrast, the training of a single classifier for the entire dataset can be challenging and difficult because of the complex data distribution patterns in the dataset. In the third phase, a decision fusion algorithm is used to merge MLSVM’s decisions from different tree levels to classify the samples intelligently. In this study, three decision fusion algorithms including TreeVote, TreeClassification and WeightedTreeClassification are compared to select the most effective fusion algorithm for MLSVMs. The TreeVote is a recursive and bottom-up algorithm that operates on the tree of clusters generated in the previous step. The TreeClassification algorithm adopts a normalization strategy to select the most suitable SVM in the tree structure for a given sample in order to perform robust and effective classification. In the WeightedTreeClassification, the SVM decision score is weighted by the cluster_sample distance.
DATASET AND EXPERIMENTAL SETUP This study utilizes the Healthcare Cost & Utilization Project (HCUP-3) databases [10]. HCUP-3 databases are the largest and most robust U.S. inpatient databases with more than 600 clinical and non-clinical variables for each hospital outpatient sample. The SVM in this study is designed to classify patient samples based on procedure information with respect to the length of hospital stay. The heart disease dataset from HCUP-3 databases is used for testing the classification performance of our new model. For heart disease, samples with length of stay less than seven days, which is the median length of stay for this dataset, are labeled as “positive;” otherwise, they are labeled as “negative.” The heart disease dataset has 17,793 patient samples. To compare the performance of the MLSVMs model with other ensemble methods, bagging and boosting [2] are used to generate combined SVM
classifiers called bagged SVMs and boosted SVMs. The seven-fold cross-validation test is used for comparing the performance of different computational models [2]. This project uses accuracy, recall, precision and F-measure for performance measures [11]. These four performance measures are based on average values for seven-fold cross-validation tests in order to reduce the bias of one test.
RESULS ANALYSIS Figure 1 compares the classification performance of a single SVM, one-level CSVMs, bagged SVMs, boosted SVMs and MLSVMs. The results indicate that accuracy and F-measures of MLSVMs exceeds those of a single SVM by 6% and 7%, respectively. The F-measure evaluates the trade-off between Precision and Recall. Performance of MLSVM is also superior to that of bagged SVMs and boosted SVMs.
Fig. 1. Comparison of a Single SVM, one-level CSVMs, Bagged SVMs, Boosted SVMs and MLSVMs
CONCLUSIONS In this paper, the Multiple Level Support Vector Machines (MLSVMs) are proposed to enhance the performance of a single SVM. MLSVMs utilize a multi-level tree structure to learn general distribution patterns in the upper level of the tree as well as specific distribution patterns in the lower level of the tree. Decisions of MLSVMs at different levels of the tree are then combined intelligently to make more robust and effective classification than those of the bagged SVMs and the boosted SVMs. Three decision fusion algorithms are experimented to select the best decision combination strategy. MLSVMs proposed in this study provide a new and effective method to improve the single classifier
0%
10%
20%
30%
40%
50%
60%
70%
80%
90%
100%
Accuracy Precision Recall F-measure
Cla
ssifi
catin
Per
form
ance
MLSVMs Bagged_SVMs Boosted_SVMs CSVMs SVM

Fifth Annual SC Upstate Research Symposium
118 Sponsors: Stäubli, Spartanburg Regional Healthcare System, EPSCoR/IDeA RS grant.
approach in addition to the popular boosting and bagging methods.
ACKNOWLEDGMENTS This research was supported in part by Student Research Assistant Program and Research Incentive Award from University of South Carolina Upstate. This research was also supported in part by Healthy Living Initiative Faculty Research Grant from the ReGenesis Community Health Center (RCHC).
REFERENCES [1] V. Vapnik. Statistical Learning Theory. John
Wiley&Sons, Inc., New York, 1998. [2] J. W. Han and M. Kamber. Data Mining: Concepts
and Techniques, 2nd ed.,Morgan Kaufmann, 2006. [3] L. K. Hansen and P. Salamon. “Neural Network
Ensembles,” IEEE Transactions on Pattern Analysis and Machine Intelligence. vol.12, pp. 993 – 1001, 1990.
[4] J. Kittler, M. Hatef, R. P. W. Duin and J. Matas. “On Combining Classifiers,” IEEE Transactions on Pattern Analysis and Machine Intelligence. vol. 20, pp. 226 – 239, 1998.
[5] T. K. Ho, J. J. Hull and S. N. Srihari. “Decision Combination in Multiple Classifier Systems,” IEEE Transactions on Pattern Analysis and Machine Intelligence. vol.16, pp. 66-75, 1994.
[6] L. Xu, A. Krzyzak and C. Y. Suen. “Methods of Combining Multiple Classifiers and Their Applications to Handwriting Recognition,” IEEE Transactions on Systems, Man and Cybernetics. vol 22, pp. 418 – 435, 1992.
[7] L. Breiman. “Bagging Predictors. Machine Learning,” vol. 24, pp. 123-140, 1996.
[8] Y. Freund and R.E. Schapire. “Experiments with a New Boosting Algorithm,” In Machine Learning: Proceedings of the Thirteenth International Conference, pp. 334—343, 1997.
[9] W. Zhong, J. He, R. Harrison,, P. C. Tai and Y. Pan. “Clustering Support Vector Machines for Protein Local Structure Prediction,” Expert Systems with Applications, vol. 32, pp. 518-526, 2007.
[10] M. Dowell, B. Rozell, D. Roth, H. Delugach, P. Chaloux and J. Dowell. “Economic and Clinical Disparities in Hospitalized Patients with Type-2 Diabetes,” Journal of Nursing Scholarship, vol. 36, pp. 66–72, 2004.
[11] A. Singhal. “Modern Information Retrieval: a Brief Overview,” Bulletin of the IEEE Computer Society Technical Committee on Data Engineering, vol. 24, pp. 35-43, 2001.
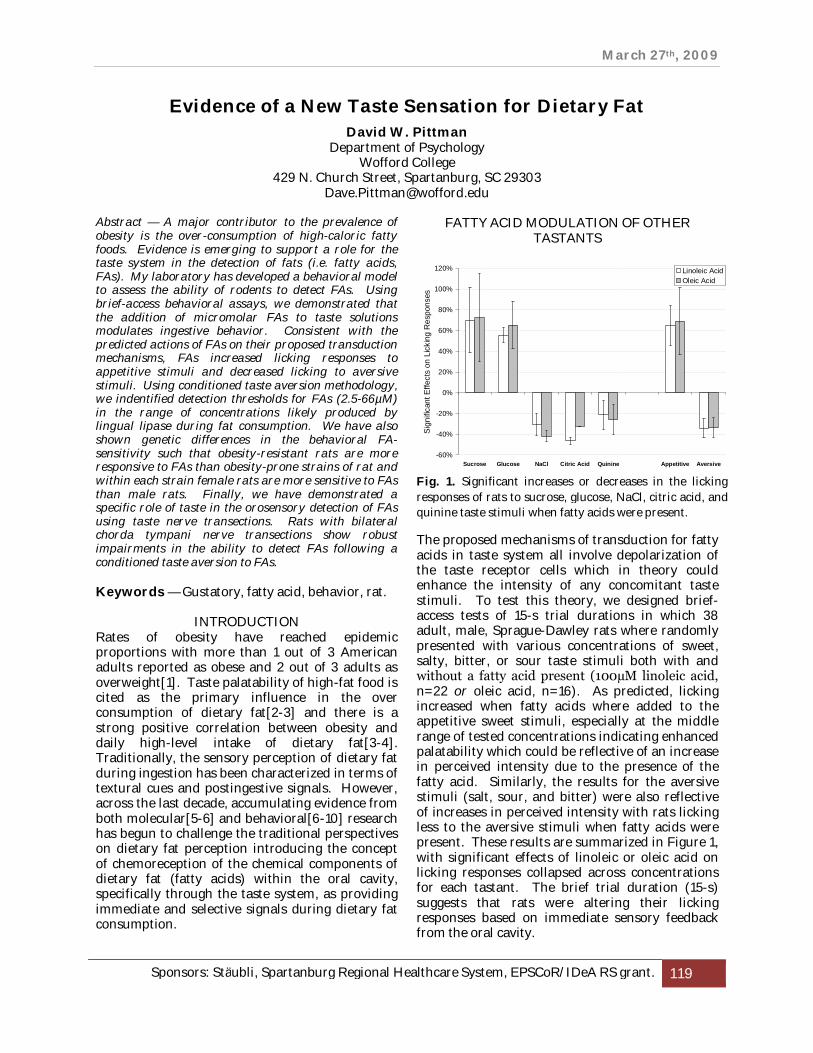
March 27th, 2009
Sponsors: Stäubli, Spartanburg Regional Healthcare System, EPSCoR/IDeA RS grant. 119
-60%
-40%
-20%
0%
20%
40%
60%
80%
100%
120%
Sucrose Glucose NaCl Citric Acid Quinine Appetitive Aversive
Sig
nific
ant E
ffect
s on
Lic
king
Res
pons
es
Linoleic AcidOleic Acid
Fig. 1. Significant increases or decreases in the licking responses of rats to sucrose, glucose, NaCl, citric acid, and quinine taste stimuli when fatty acids were present.
Evidence of a New Taste Sensation for Dietary Fat David W. Pittman
Department of Psychology Wofford College
429 N. Church Street, Spartanburg, SC 29303 [email protected]
Abstract — A major contributor to the prevalence of obesity is the over-consumption of high-caloric fatty foods. Evidence is emerging to support a role for the taste system in the detection of fats (i.e. fatty acids, FAs). My laboratory has developed a behavioral model to assess the ability of rodents to detect FAs. Using brief-access behavioral assays, we demonstrated that the addition of micromolar FAs to taste solutions modulates ingestive behavior. Consistent with the predicted actions of FAs on their proposed transduction mechanisms, FAs increased licking responses to appetitive stimuli and decreased licking to aversive stimuli. Using conditioned taste aversion methodology, we indentified detection thresholds for FAs (2.5-66µM) in the range of concentrations likely produced by lingual lipase during fat consumption. We have also shown genetic differences in the behavioral FA-sensitivity such that obesity-resistant rats are more responsive to FAs than obesity-prone strains of rat and within each strain female rats are more sensitive to FAs than male rats. Finally, we have demonstrated a specific role of taste in the orosensory detection of FAs using taste nerve transections. Rats with bilateral chorda tympani nerve transections show robust impairments in the ability to detect FAs following a conditioned taste aversion to FAs. Keywords — Gustatory, fatty acid, behavior, rat.
INTRODUCTION Rates of obesity have reached epidemic proportions with more than 1 out of 3 American adults reported as obese and 2 out of 3 adults as overweight[1]. Taste palatability of high-fat food is cited as the primary influence in the over consumption of dietary fat[2-3] and there is a strong positive correlation between obesity and daily high-level intake of dietary fat[3-4]. Traditionally, the sensory perception of dietary fat during ingestion has been characterized in terms of textural cues and postingestive signals. However, across the last decade, accumulating evidence from both molecular[5-6] and behavioral[6-10] research has begun to challenge the traditional perspectives on dietary fat perception introducing the concept of chemoreception of the chemical components of dietary fat (fatty acids) within the oral cavity, specifically through the taste system, as providing immediate and selective signals during dietary fat consumption.
FATTY ACID MODULATION OF OTHER TASTANTS
The proposed mechanisms of transduction for fatty acids in taste system all involve depolarization of the taste receptor cells which in theory could enhance the intensity of any concomitant taste stimuli. To test this theory, we designed brief-access tests of 15-s trial durations in which 38 adult, male, Sprague-Dawley rats where randomly presented with various concentrations of sweet, salty, bitter, or sour taste stimuli both with and without a fatty acid present (100µM linoleic acid, n=22 or oleic acid, n=16). As predicted, licking increased when fatty acids where added to the appetitive sweet stimuli, especially at the middle range of tested concentrations indicating enhanced palatability which could be reflective of an increase in perceived intensity due to the presence of the fatty acid. Similarly, the results for the aversive stimuli (salt, sour, and bitter) were also reflective of increases in perceived intensity with rats licking less to the aversive stimuli when fatty acids were present. These results are summarized in Figure 1, with significant effects of linoleic or oleic acid on licking responses collapsed across concentrations for each tastant. The brief trial duration (15-s) suggests that rats were altering their licking responses based on immediate sensory feedback from the oral cavity.
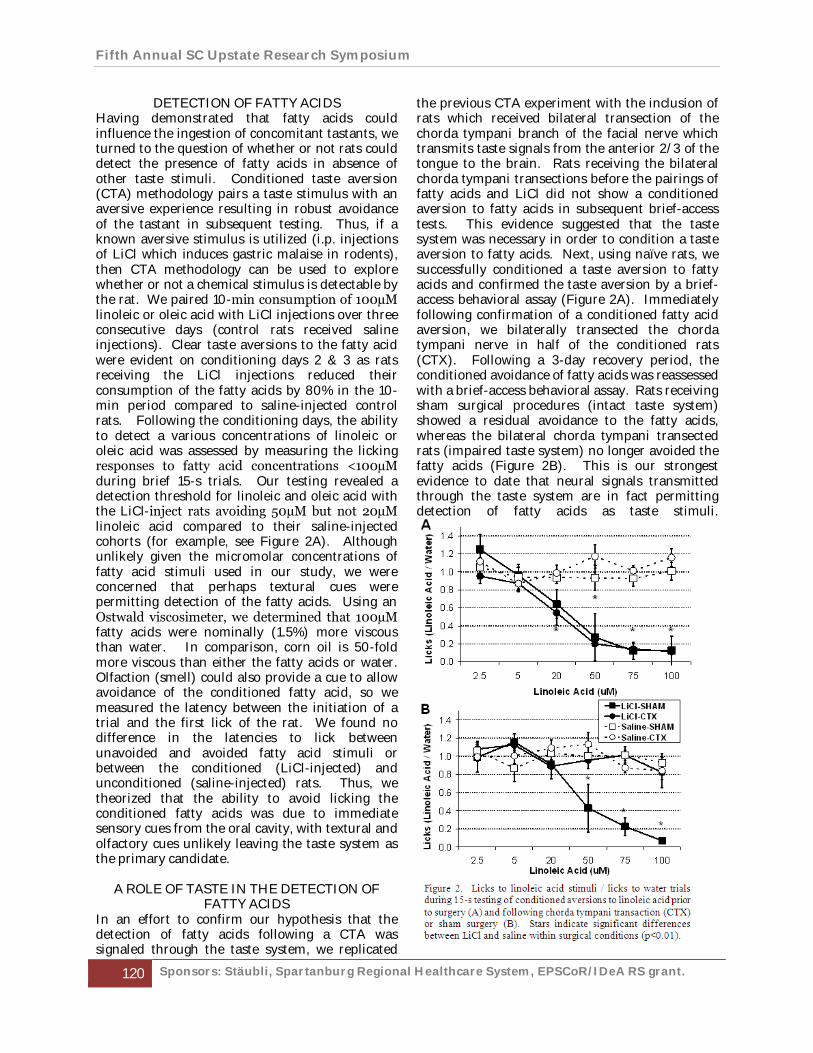
Fifth Annual SC Upstate Research Symposium
120 Sponsors: Stäubli, Spartanburg Regional Healthcare System, EPSCoR/IDeA RS grant.
DETECTION OF FATTY ACIDS Having demonstrated that fatty acids could influence the ingestion of concomitant tastants, we turned to the question of whether or not rats could detect the presence of fatty acids in absence of other taste stimuli. Conditioned taste aversion (CTA) methodology pairs a taste stimulus with an aversive experience resulting in robust avoidance of the tastant in subsequent testing. Thus, if a known aversive stimulus is utilized (i.p. injections of LiCl which induces gastric malaise in rodents), then CTA methodology can be used to explore whether or not a chemical stimulus is detectable by the rat. We paired 10-min consumption of 100µM linoleic or oleic acid with LiCl injections over three consecutive days (control rats received saline injections). Clear taste aversions to the fatty acid were evident on conditioning days 2 & 3 as rats receiving the LiCl injections reduced their consumption of the fatty acids by 80% in the 10-min period compared to saline-injected control rats. Following the conditioning days, the ability to detect a various concentrations of linoleic or oleic acid was assessed by measuring the licking responses to fatty acid concentrations <100µM during brief 15-s trials. Our testing revealed a detection threshold for linoleic and oleic acid with the LiCl-inject rats avoiding 50µM but not 20µM linoleic acid compared to their saline-injected cohorts (for example, see Figure 2A). Although unlikely given the micromolar concentrations of fatty acid stimuli used in our study, we were concerned that perhaps textural cues were permitting detection of the fatty acids. Using an Ostwald viscosimeter, we determined that 100µM fatty acids were nominally (1.5%) more viscous than water. In comparison, corn oil is 50-fold more viscous than either the fatty acids or water. Olfaction (smell) could also provide a cue to allow avoidance of the conditioned fatty acid, so we measured the latency between the initiation of a trial and the first lick of the rat. We found no difference in the latencies to lick between unavoided and avoided fatty acid stimuli or between the conditioned (LiCl-injected) and unconditioned (saline-injected) rats. Thus, we theorized that the ability to avoid licking the conditioned fatty acids was due to immediate sensory cues from the oral cavity, with textural and olfactory cues unlikely leaving the taste system as the primary candidate.
A ROLE OF TASTE IN THE DETECTION OF FATTY ACIDS
In an effort to confirm our hypothesis that the detection of fatty acids following a CTA was signaled through the taste system, we replicated
the previous CTA experiment with the inclusion of rats which received bilateral transection of the chorda tympani branch of the facial nerve which transmits taste signals from the anterior 2/3 of the tongue to the brain. Rats receiving the bilateral chorda tympani transections before the pairings of fatty acids and LiCl did not show a conditioned aversion to fatty acids in subsequent brief-access tests. This evidence suggested that the taste system was necessary in order to condition a taste aversion to fatty acids. Next, using naïve rats, we successfully conditioned a taste aversion to fatty acids and confirmed the taste aversion by a brief-access behavioral assay (Figure 2A). Immediately following confirmation of a conditioned fatty acid aversion, we bilaterally transected the chorda tympani nerve in half of the conditioned rats (CTX). Following a 3-day recovery period, the conditioned avoidance of fatty acids was reassessed with a brief-access behavioral assay. Rats receiving sham surgical procedures (intact taste system) showed a residual avoidance to the fatty acids, whereas the bilateral chorda tympani transected rats (impaired taste system) no longer avoided the fatty acids (Figure 2B). This is our strongest evidence to date that neural signals transmitted through the taste system are in fact permitting detection of fatty acids as taste stimuli.
March 27th, 2009
Sponsors: Stäubli, Spartanburg Regional Healthcare System, EPSCoR/IDeA RS grant. 121
In a follow-up experiment, we conditioned taste aversions to 100µM linoleic acid in rats with no surgical manipulation and then measured the avoidance of linoleic acid, sweet, salt, sour, and bitter stimuli using brief-access (15-s) trials. The conditioned rats showed selective avoidance of linoleic acid with no difference in their licking responses to the other prototypical taste stimuli compared to control, saline-injected animals. This suggests that not only are fatty acids recognized by the taste system but that their perception is likely unique from the typical taste perceptions associated with sweet, salt, sour, and bitter tastants.
GENETIC AND ENVIRONMENTAL INFLUENCES ON FATTY ACID SENSITIVITY
We have since expanded our investigations into the taste sensitivity of rats to fatty acids to include comparisons of male and female rats as well as obesity-prone (Osborne-Mendel) and obesity-resistant (S5B/Pl) genetically inbred strains of rat. Across all strains of rat tested, female rats were consistently more sensitive to fatty acids than their male counterparts as measured by lower detection thresholds of fatty acids following a CTA. Furthermore, obesity-prone rats were more sensitivity to fatty acids than obesity-resistant rats perhaps suggesting a role for increased fatty acid taste sensitivity in the over-consumption of food and subsequent obesity. Interestingly, placement of the obesity-prone and obesity-resistant rats on a high-fat (60%) diet for 5-weeks did not affect the fatty acid sensitivity of obesity-prone rats but rather increased the sensitivity of obesity-resistant rats such that their detection threshold for fatty acids was then equivalent to the obesity-prone rats. Thus, we have begun to identify potential genetic and environmental influences on the ability to detect fatty acids.
CONCLUSIONS We have demonstrated that fatty acids appear to increase the perceived intensity of other taste stimuli, fatty acids can be detected in isolation from other taste stimuli, and fatty acid detection sensitivities are likely influenced by both genetic and environmental factors. Perhaps more importantly, we have successfully established a behavioral model allowing accurate assessment of the taste sensitivity to fatty acids in a rat animal model. Recent reports of the detection of fatty acids on the basis of taste cues in humans[11-12] has given increased importance to our ability to fully characterize the taste sensations and perceptions produced by dietary fat. Currently, we are focused on clarifying how fatty acids influence
preferences of other taste stimuli and characterizing the taste neural code for fatty acids through neural recordings of the afferent taste pathways from the oral cavity to the brain.
ACKNOWLEDGMENTS This work was funded in part by the South Carolina Independent Colleges and Universities summer research grant program and the Fullerton Foundation through the Community of Scholars program at Wofford College.
REFERENCES [1] Obesity and Overweight, Centers for Disease
Control and Prevention, http://www.cdc.gov/nccdphp/dnpa/obesity.
[2] Drewnowski,A. “Why do we like fat?” J. Am. Diet. Assoc., 97, S58-S62, 1997.
[3] McCrory,M.A., Fuss,P.J., McCallum,J.E., Yao,M., Vinken,A.G., Hays,N.P. and Roberts,S.B.“Dietary variety within food groups: association with energy intake and body fatness in men and women.” Am. J. Clin. Nutr., 69, 440-447, 1999.
[4] Miller,W.C., Niederpruem,M.G., Wallace,J.P. and Lindeman,A.K. “Dietary fat, sugar, and fiber predict body fat content.” J. Am. Diet. Assoc., 94, 612-615, 1994.
[5] Gilbertson,T.A., Fontenot,D.T., Liu,L., Zhang,H. and Monroe,W.T. “Fatty acid modulation of K+ channels in taste receptor cells: gustatory cues for dietary fat.” Am. J. Physiol, 272, C1203-C1210, 1997.
[6] Gilbertson,T.A., Liu,L., Kim,I., Burks,C.A. and Hansen,D.R. “Fatty acid responses in taste cells from obesity-prone and -resistant rats.” Physiol Behav., 86, 681-690, 2005.
[7] Pittman,D.W., Labban,C.E., Anderson,A.A. and O'Connor,H.E. “Linoleic and oleic acids alter the licking responses to sweet, salt, sour, and bitter tastants in rats.” Chem. Senses, 31, 835-843, 2006.
[8] McCormack,D.N., Clyburn,V.L. and Pittman,D.W. “Detection of free fatty acids following a conditioned taste aversion in rats.” Physiol Behav., 87, 582-594, 2006.
[9] Pittman,D., Crawley,M.E., Corbin,C.H. and Smith,K.R. “Chorda tympani nerve transection impairs the gustatory detection of free fatty acids in male and female rats.” Brain Res., 1151, 74-83, 2007.
[10] Pittman,D.W., Smith,K.R., Crawley,M.E., Corbin,C.H., Hansen,D.R., Watson,K.J. and Gilbertson,T.A. “Orosensory Detection of Fatty Acids by Obesity-Prone and Obesity-Resistant Rats: Strain and Sex Differences.” Chem. Senses, 33(5), 449-460, 2008.
[11] Chale-Rush,A., Burgess,J.R. and Mattes,R.D. “Evidence for human orosensory (taste?) sensitivity to free fatty acids.” Chem. Senses, 32, 423-431, 2007.
[12] Mattes, R.D. “Oral Detection of Short-, Medium-, and Long-Chain Free Fatty Acids in Humans.” Chem Senses. 2008 Dec 16. [Epub ahead of print]
Fifth Annual SC Upstate Research Symposium
122 Sponsors: Stäubli, Spartanburg Regional Healthcare System, EPSCoR/IDeA RS grant.
The Story of a “Typical American Girl” Christen Burrell and Melissa Walker
History Converse College
580 East Main Street, Spartanburg, SC 29302 {Victoria.burrell, Melissa.Walker}@converse.edu
Keywords: Women’s History, World War II Regardless of women's status at particular times in American history, the citizens of America have always had the idea of a “typical American girl.” Whether that idea stems from the ideology of Republican Motherhood, the ideal of a southern belle, or the lofty expectations of a stay-at-home mother, women in the United States have always had a set of standards to live up to. However, as it has been seen throughout history, in times of crisis, women have stepped out of their stereotypical roles. In World War II women played a part in the fighting on both foreign soil and at home. Through the stories and memories of Mary Wentling Walsh, one can glimpse back into time and see the life of a woman during the World War II era, including the discrimination, the opportunities, and the breaking away from that particular decade's image of a “typical American girl.”
Mary Wentling Walsh was born September 11, 1917 to Joseph and Mary Lynch Wentling. She was raised in Greensburg, Pennsylvania, next door to the house where she was originally born and where her father was superintendent of a local coal mine. Mary's mother died unexpectedly when she was four years old due to a case of botulism caused by poison olives served at a family birthday party. Her father later remarried another woman, whom the family referred to as Allah [2].
During the 1930's, women's educational opportunities were on the rise, but those who did attend college risked getting a poor education, and were regulated to “feminine” majors, like home economics and education. Women were seen as homemakers by most of society, and at times, even by their fellow female peers. Furthermore, many young women at the time feared that too much education would interfere with their marital appeal [1]. As Mary Walsh grew older, however, she did not share this common view of college, and she enrolled at Smith, a highly acclaimed school at the time. At Smith she majored in government, which was a cross between history and political science [2].
After she graduated from Smith, Mary was ready to go out and “conquer the world.” Sadly
however, the discrimination of women in the workforce brought her enthusiasm to a screeching halt. When she applied for jobs, Mary stated:
Nobody would pay me any mind whatsoever. It was in the midst of the depression, and- our family was prominent, so they certainly didn't want to waste their money on somebody who didn't need it. I graduated from Smith, which was the leading women’s college in the nation at the time, so you know, it was cracker jack, and it wasn’t good enough for the interviewer [2]. Racial and sexual discrimination ran rampant throughout the work force of the Great Depression [3]. While the depression did indeed drive women to look for ways to help provide for their families through the work force, they still faced similar types of discrimination, much like that Mary Walsh experienced in trying to find a job after college. In some circumstances women were forced to put off getting married in order to keep their current jobs [3]. Not only were personal career goals sacrificed, but women who did have jobs were forced to work longer and harder for the same pay as before the Depression [3]. Furthermore, working conditions often proved intolerable as women were even followed to the restrooms to make sure that they did not waste too much of the company's time [3]. Due to the lack of jobs available to her, Mary spent most of her time after college volunteering.
As Mary continued her life in Greensburg, Pennsylvania, the Second World War continued going on around the globe. Thinking back, Mary commented, “Nobody was particularly enthused about going in such a- I don’t know. They were just trying to stay out of the war.” But, despite the prior avoidance of the war, Pearl Harbor occurred, and America was thrown into the heat of the conflict [2].
With American involvement in World War II, new doorways were opened to women all over the country. In fact, instead of discouraging women from entering the work force, the government pleaded with them, using propaganda and plays on emotions to motivate women to go out and find jobs. Phrases like “Women in War: We Can't Win Without Them” and “Victory is in Your Hands” propelled women into the workforce, luring them into jobs that were formerly reserved for men [4].
March 27th, 2009
Sponsors: Stäubli, Spartanburg Regional Healthcare System, EPSCoR/IDeA RS grant. 123
Women were placed in a variety of roles; some operated cranes, while others tested guns. Some continued in predominantly “feminine” positions, while others traded that status in for welding and building fighter jets [4]. Discrimination, however, did not vanish, and not only did women have to deal with their new world of work, they also had to deal with the discrimination that came with it. They received less pay than their male counterparts and in some cases they were simply not allowed to hold jobs previously held by these same male counterparts. Other places just refused to hire them [4].
Doors were opened to Mary during World War II and she had the opportunity to join the Red Cross in traveling overseas to work in England. After a few brief weeks of training, Mary was squished “like sardines” with other workers onto a ship that would carry her to England where her work would begin[2]. Many citizens would join the Red Cross during World War II. During this time period, the Red Cross saw the enlistment of one hundred and four thousand nurses, the making of twenty-seven thousand packages, 13.3 million pints of blood donated, and 300,000 tons of supplies shipped overseas [5]. Often the Red Cross set up places where the military personnel could stop, eat, and relax. These stations included food and many other various forms of entertainment. Working at these provision stations was Mary Walsh's job. Once Mary made it overseas, she became part of the Club Mobile. The Club Mobile was a regular bus that was converted to carry supplies, like coffee, doughnuts, and other items to the men. Commenting on her job, Mary said,
...so when they went on to the airfields, we made the coffee and doughnuts there, and then [went] on out to where the men actually were and served them the doughnuts and so forth. And you know any American girl was just worth her weight in gold as far as the guys were concerned [2]. Not only did Mary bring supplies to the troops, but she also brought entertainment. Through the Red Cross, Mary, along with many other volunteers kept an open house for all the soldiers to visit and relax in while they were overseas. Besides this house, Mary and her co-workers used sports as a way to provide the soldiers with entertainment. While overseas she participated in horseback riding, golf, tennis, and even hound hunts. Shortly after VJ Day, Mary returned home to Greensburg, Pennsylvania [2].
When asked about her activities after returning home, Mary said, “I don’t think I did anything [2].” Just like the many other women who were
encouraged to go back to the home after the war was over, Mary returned to her home and took care of her elderly father for the following year. Just as the propaganda used at the beginning of the war encouraged women to enter the workforce, advertisement was once again employed to hopefully urge women to return to their former roles in the home, or to convince them that they preferred the housework better anyways [6]. It would seem that Mary followed this trend, for within a year she was married, and never held a job again. She said, “Oh, I considered it [getting a job], but I didn't do anything toward getting one [2].”
While in Europe, a chance meeting with a family friend introduced Mary to people she never would have met otherwise. Claiming that they wanted to see a “typical American girl,” Mary was introduced to them [2]. In many ways, Mary was a typical American girl. She worried about whether or not her fiancé had found another person while they both were separated by war, she became addicted to Cadbury chocolate, and when she returned home, she dove headfirst into marriage and motherhood [2]. However, there is much more than just “typical” about Mary Walsh. When World War II opened doors for women in society, she quickly walked through them, and through her involvement, she helped gain opportunities never seen for women before. Although at the end of the war some of these opportunities may have been stripped from women, these opportunities did however, open up a side of life that that particular generation had not seen, and would later go on to be the inspiration that was needed for women to realize that there was more to life than just being the housewife.
REFERENCES [1] Moran, Mickey. "1930s, American- Feminist Void?"
20 Nov. 2008 <http://www.loyno.edu/ history/journal/1988-9/moran.htm>.
[2] "The Story of a "Typical American Girl"" Personal interview. 1 Nov. 2008.
[3] Kerber, Linda K. Women's America : Refocusing the Past. Ed. Linda K. Kerber and Jane Sherron De Hart. New York: Oxford UP, Incorporated, 2003.
[4] Giampaoli, Cristina. "A Call to Arms." 20 Nov. 2008 <http://history.sandiego.edu/gen/st/~cg3/pagetwo.html>.
[5] "A Brief History of the American Red Cross." American Red Cross. 20 Nov. 2008 <http://www.redcross.org/museum/history/brief.asp>.
[6] Preston, Peggy. "Advertisings Portrayal of Women in the Workplace from 1930s to the 1950s." 20 Nov. 2008 http://www.loyno.edu/history/journal/ 1988-9/preston.htm>.
Fifth Annual SC Upstate Research Symposium
124 Sponsors: Stäubli, Spartanburg Regional Healthcare System, EPSCoR/IDeA RS grant.
Talkin’ ’bout South Carolina: Addressing Dialect Diversity in Middle School Classrooms
George Reed1 and David Marlow2
1School of Education and 2Languages, Literature & Composition
University of South Carolina Upstate 800 University Way, Spartanburg, SC 29303
[email protected], [email protected]
Abstract – Discrimination based on dialect is one of the most insidious forms of prejudice in our society. From the beginning of history, humans have judged others according to how they speak, sometimes knowingly, but often without intention. Because change is predicated upon knowledge, dialect discrimination must be confronted through education. This paper describes a work-in-progress which targets dialect awareness and tolerance in 8th grade English Language Arts and Social Studies classrooms throughout our state. Keywords – diversity, dialect, middle school, English, Social Studies
INTRODUCTION
Diversity and tolerance are focal areas for many social initiatives in the US today. While the work progresses through exposing prejudice and openly discussing bias, much room for improvement remains. This paper addresses one of the most insidious forms of bigotry: dialect discrimination. People judge others according to how they speak, often without awareness of their own prejudice. Wolfram, a prominent dialect researcher, observes that “often, people who hear a vernacular dialect make erroneous assumptions about the speaker’s intelligence, motivation and even morality” [1]. Although this type of discrimination seldom appears on the evening news, it is recognized not only by scholars but also by the US government's bureau of Housing and Urban Development [2]. Business is also affected as demonstrated in a 1973 study which found that while employers denied linguistic bias they were actually quite consistent in assigning tasks based on people’s speech alone [3].
For the linguist, dialect is defined simply as a variety of a language shared by a group of speakers. This entails the supposition that no single variety is any better or more valuable than another, but many in our society do not share this view. Most innocuously for the non-linguist, dialect may refer simply to people who speak differently. Less impartially, dialect may refer to a stigmatized conception of the way people speak in a certain region of the country. Southerners, for example, are expected to have a drawl and New Yorkers have the reputation of speaking brusquely. Most damaging is the perception that people who say
things like "Imma fixin' to" or "She aks for it" are ignorant and uneducated or, worse, uneducatable.
Sadly, this final, most damaging stigmatization of speakers of certain dialects is common not only in society in general, but also in our education system. Godley, et al comment on this phenomenon in K-12 schools, citing teachers who say things like “Rajid can’t do challenging work—just listen to the way he talks” [4]. Students need teachers who believe they can succeed without dialect bias.
DIALECT IN EDUCATION
Issues of dialect discrimination are not limited to isolated communities in other areas of the country. South Carolina is home to high concentrations of several highly stigmatized dialects including African American English, Appalachian dialects, Native American language influence, and Gullah creole. Additionally, the Upstate region has one of the highest immigrant population growth rates in the United States. Diversity and tolerance need to be stressed not only in terms of race and ethnicity but also with regard to dialect. In fact, since dialect intolerance is more resistant to change than other types of prejudice [5], dialect diversity deserves a focal position.
Perceptions based on dialect not only lead students to associate with some of their peers and shun others, but also have a significant impact on self-image and accordingly on students’ likelihood of academic success. In an effort to address these issues by promoting linguistic tolerance, we are working to introduce dialect diversity into the South Carolina middle schools though a set of curricula which teachers can use in their classrooms. Our model is based on a similar project in North Carolina which provides teachers of that state with detailed dialect awareness curricula. Unfortunately, due to differences in both resident dialects and state standards, the North Carolina materials are not suitable for our state.
Because of the value of cross-curricular materials and the make-up of South Carolina State Education Standards, our dialect diversity materials target an interdisciplinary approach involving both Social Studies (SS) and English
March 27th, 2009
Sponsors: Stäubli, Spartanburg Regional Healthcare System, EPSCoR/IDeA RS grant. 125
Language Arts (ELA) classrooms. While dialect diversity should be addressed at all levels, it is often in middle school that students become most aware of dialectal differences, and as the eighth grade SS curriculum focuses on the history of South Carolina, we are designing our materials for this audience.
THE PROJECT As part of this project we are soliciting input from members of the Education departments at Furman University and the University of South Carolina Upstate, as well as practicing eighth grade teachers in creating cross-curricular lesson plans. Our lesson plans include subtle treatment of the dialects of the people central to the historical development of South Carolina. Dialect issues are integrated with other materials in an effort to induce understanding and tolerance. Our plans are created as stand-alone units, designed to be integrated into teachers’ yearly plans as appropriate, and reflect current best practice by addressing multiple-learning styles and incorporating “living language” via primary documents and multimedia. Our preliminary approach includes five units based on historical periods (dialect foci are noted parenthetically): Early Settlement (Cherokee), the Revolutionary War (Appalachian dialect), slavery and the Civil War (Gullah), late 20th century immigration (ESOL), and modern times (African American English). Primary goals include increasing student awareness of the legitimacy and merit of various dialects, and instilling an appreciation of the flexible structure of English.
One lesson plan utilizes excerpts from a primary source document first published in 1913: Our Southern Highlanders by Horace Kephart. Students examine excerpts from the text exploring Appalachian culture and then read a local tale presented in the rich dialect of the southern foothills of the Appalachian Mountains. SS standards are addressed through investigation of the Highlanders’ contributions to South Carolina’s Revolutionary War efforts and with the conflict of cultures resulting from the migration of these mountaineers into the developing mill communities of early twentieth century.
As they explore the mountain culture in its speakers’ native dialect, students discover both a sympathetic portrayal of the Highlanders’ language and the dialect-based bias they faced. The changing nature of language and the potential for dialect-based prejudice are examined in this impersonal, socio-historical context. This lesson is cross-
curricular in that it addresses ELA standards involving communication with differing audiences and recognition of bias in a variety sources. Students also rewrite segments of the primary source in Standard American English and in TXT. Demonstration of the mechanisms of changing language and discussion of the bias some have against TXTing indirectly advocates tolerance and appreciation of dialect diversity.
CONCLUSIONS Our goal is to have a complete set of lesson plans developed, reviewed, tested and available to South Carolina teachers by May of this year for possible integration into eighth grade classrooms by August. These materials complement instruction in standard grammar; they do not supplant it. The importance of Standard English for success in students’ future academic and career goals cannot be denied, but a student who feels in adequate linguistically is unlikely to succeed in any academic area. Hence tolerance of dialect diversity serves not only the community at large, but also the individual. By imbedding linguistically diverse lessons in the curriculum, we hope to brighten the future of South Carolina middle school students as they grow to understand, tolerate, and even embrace the diversity of South Carolina dialects.
ACKNOWLEDGEMENTS
We gratefully acknowledge the USC Upstate Office of Sponsored Awards and Student Support as well as the USC Magellan Scholarship program. Both programs have contributed significantly to the success of this project.
REFERENCES [1] W. Wolfram and N. Schilling-Estes, American
English: Dialects and variation, Blackwell, 1998. [2] D. Pager and H. Shepard. “The Sociology of
Discrimination: Racial Discrimination in Employment, Housing, Credit, and Consumer Markets,” Annual Review of Sociology: 34, pp. 181-209, 2008.
[3] R. W. Shuy and F. Williams, “Stereotyped Attitudes of Selected English Dialect Communities," in R. W. Shuy and R. W. Fasold (eds), Language Attitudes: Current Trends and Prospects. Georgetown Univ. Press, 1973.
[4] A. Godley, J. Sweetland, R. Wheeler,A. Minnici, and B. Carpenter, “Preparing teachers for dialectically diverse classrooms.” Educational Researcher, 35, pp. 30-37. 2006.
[5] W. Wolfram, C. T. Adger, and D. Christian, Dialects in Schools and Communities, Erlbaum, 1999.
Fifth Annual SC Upstate Research Symposium
126 Sponsors: Stäubli, Spartanburg Regional Healthcare System, EPSCoR/IDeA RS grant.
Race and Class Identity in The Great Gatsby and Passing John Crocker and Celena Kusch
Department of Languages, Literature, and Composition University of South Carolina Upstate
800 University Way, Spartanburg, SC 29303 [email protected], [email protected]
Abstract — During the 1920s, scientific studies that viewed the African American race as biologically inferior were being contested and replaced by various sociological studies of American society, which examined American culture and its hierarchical nature, concluding that inferiority was determined not by scientific evidence, but rather by the dominant race or group. This paper uses these scientific and sociological studies to analyze F. Scott Fitzgerald’s The Great Gatsby and Nella Larsen’s Passing, in order to show how these texts reflect this changing idea of racial identity, while also exploring the implications of class identity and its relationship to race within these two texts. By examining Larsen’s Clare Kendry and John Bellew, as well as Fitzgerald’s Jay Gatsby and Tom Buchanan, this essay highlights the complexities of race, class, and cultural identity found during the modernist period. The focus on the deaths of the “passing” characters of Clare Kendry and Jay Gatsby shows the various modes of social control that are inherent within the novels and how they relate to American modernist society. This paper concludes that white racial dominance proves to be the most explicit form of social control within the two works. Fitzgerald and Larsen address this issue by agreeing with sociological studies that viewed African Americans as biological and intellectual equals, rather than inferiors, while both parodying and critiquing characters hostile to these emerging ideas. Keywords — Race, Class, The Great Gatsby, and Passing
INTRODUCTION Tom Buchanan, when speaking to Nick Caraway in The Great Gatsby, alludes to the racial fears and anxieties prevalent during the modernist period. Tom states, “Civilization’s going to pieces. [. . . ] the white race will be – will be utterly submerged. It’s all scientific stuff; it’s been proved” [1]. This fear of the submergence of the white race echoes “Danger in Race Mixture,” a study published in The Science News-Letter (1927), which states that the “negro-white” combinations “seem, on the whole, socially inferior to the parent races,” because they combine “something of a white man’s intelligence and ambition with an insufficient intelligence to realize that ambition” [2]. Therefore, scientific discoveries during the early part of the modernist period shunned the mixing of races, mostly because African Americans were viewed as biologically and intellectually inferior to whites. However, as
pointed out by James Reinhardt in “The Negro: Is He a Biological Inferior” (1927), racial superiority is assumed by “peoples who happen to occupy, for the time, a favorable position; and [. . .] these arguments have had an emotional, rather than a scientific and rational, background” [3]. Reinhardt’s comments represent the growing group of early twentieth-century scientists who argued that society’s beliefs about racial inferiority were not based on science or rationale, but rather on racial dominance, and it was the white race that had been in control throughout the history of the United States. This transition of thought, in which popular notions of racial identity were challenged, allowed the literature from this period to reflect and struggle with these ideas, which is evident in F. Scott Fitzgerald’s The Great Gatsby (1925) and Nella Larsen’s Passing (1929). These texts reflect the scientific and sociological studies on race that were being performed during the modernist period, allowing us to see the contradiction of views regarding race, while siding more with the sociological studies that viewed African Americans as biologically equal, rather than inferior.
MODERNIST SOCIOLOGICAL VIEWS OF RACE
Modernist sociologists, like Reinhardt, discredited the biological determinism adopted by earlier scientists, pointing out instead that racial inferiority is determined by sociological factors. Similarly, Wilson Wallis argues that differences among human beings can be attributed to culture, rather than race. Wallis writes that differences among races fluctuate as the surrounding culture changes. Because of this fluctuation of racial changes, Wallis insists that there is no reason to believe that “one race differs from another in innate psychic equipment,” but rather can attribute all differences to the particular culture and environment of a certain group [4]. Sociologists found that African American inferiority was determined, not on the basis of scientific or rational thought, but by the dominant white race, who had historically been in a favorable position, allowing them to claim racial superiority by maintaining cultural and social power. Because of this growing trend away from biological determinism, early twentieth-century researchers studied a variety of sociological factors, such as
March 27th, 2009
Sponsors: Stäubli, Spartanburg Regional Healthcare System, EPSCoR/IDeA RS grant. 127
culture, society, race, and class, in order to better understand African American identity.
BIOLOGICAL AND SOCIOLOGICAL IMPLICATIONS OF “PASSING”
The issue of “passing,” where a member of one race poses as another, combines elements of both race and class, which as Herbert Miller states in his essay “Race and Class Parallelism” (1928), became intertwined during the modernist period, due to the fact that class supremacy became much more visible. Miller states, “class formulations were developed first, and merely appropriated when race consciousness in its modern form appeared,” which means that the “racial cult and the accompanying vocabulary have been built up for the purpose of maintaining class supremacy” [5]. Therefore, class takes precedence over race, and racism is simply a means to maintain class supremacy. In Nella Larsen’s Passing, social class and privilege take precedence over race for Clare Kendry, a character who “passes” constantly, even marrying a wealthy and racist white husband, John Bellew, as opposed to Irene Redfield, who only passes occasionally and lives in the middle of Harlem with her very darkskinned husband and children. “Passers,” like Clare, were able to gain a desired class identity by subverting their racial identity.
In addition to showing the class privileges that result from “passing,” Larsen also puts an emphasis on racial identity, which allows us to question Clare’s decision to “pass” as white. Irene, when asking herself why she did not “take up the defence of the race to which she belonged” after Clare’s white husband insulted the African American race, thinks, “She had to Clare Kendry a duty. She was bound to her by those very ties of race, which, for all her repudiation of them, Clare had been unable to completely sever” [6]. This passage places racial identity above class identity by narrating to us Irene’s feeling of racial solidarity with Clare, as well as showing that Clare too felt those same feelings of racial solidarity, despite her “passing” and desire for class identity.
Larsen, by giving Clare and Irene feelings of racial solidarity despite their obvious physical differences from darker skinned African Americans, is seemingly disputing the modernist idea that there is a biological difference between what Robert Terry, in his essay “The American Negro” (1929), calls the “negro and the brown” [7]. Because of this biological difference between African Americans and darker skinned whites, Terry writes that race can impact the African American’s ability to survive in an urban environment, as opposed to the rural areas from
which many African Americans migrated during the early part of the 20th century. Larsen focuses on this issue in Passing, choosing to set her story within the urban environments of Chicago and Harlem, while exposing the absurd logic of Terry’s idea of biological difference being a hindrance in the urban environment of Harlem. Overturning Terry’s warning against African Americans in the cities, Irene attempts to convince the white-skinned, “passing” Clare “of the folly of Harlem for her,” stating, “I can’t help thinking that you ought not to come up here, ought not to run the risk of knowing Negroes” [6]. This statement from Irene contradicts her earlier statements about racial solidarity and the duty that she feels towards Clare. Her concerns for Clare’s safety in this passage do not emanate from the bond of race, but rather from her loyalty to childhood friendship and her simultaneous selfish desire to permanently rid herself of Clare. Irene is setting Clare apart from the race, which is ultimately what Clare has done to herself, and any ties to race have been severed for Clare, although Irene believes that Clare cannot genuinely sever those ties.
According to Irene, Harlem would be an unfriendly environment for Clare, a “passing” African American. The biological differences that allow Clare to “pass” would affect her ability to live comfortably within the urban environment of Harlem, which is the basis of Terry’s argument. However, the real threat to Clare’s survival in Harlem is less biological than it is sociological, seeing that the true threat would come from society, either the African American society of Harlem, or the white society of her husband. This dichotomy of sociological threats to Clare is represented when Irene tells Clare, “Brian and I have talked the whole thing over carefully and decided that it isn’t wise. He says it’s always a dangerous business, this coming back. He’s seen more than one come to grief because of it. And, Clare, considering everything – Mr. Bellew’s attitude and all that – don’t you think you ought to be as careful as you can?” [6]. Brian’s views of “coming back” as dangerous represent the threat that would come from African American society, while Irene points out that Clare’s husband’s racist attitude could also lead to her ruin if he ever found out. This debate between the two Harlem-based characters, Irene and Brian, illustrates the ambiguous relationship between Clare and the two societies in which she belongs, an ambiguity that becomes even more crucial at the end of the novel.
Passing ends with Clare dying after falling six stories from an open window. Her husband, who has found out the truth about Clare’s racial identity, arrives at the party, hurling racial insults
Fifth Annual SC Upstate Research Symposium
128 Sponsors: Stäubli, Spartanburg Regional Healthcare System, EPSCoR/IDeA RS grant.
towards her. Clare’s indifferent “faint smile from her full, red lips” infuriates Irene to the point that she runs toward Clare and grabs her arm, with Clare’s white husband standing right in front of them and Brian, Irene’s African American husband, stepping out from the crowd [6]. What really happens to Clare after that is unknown, because the narrator, who is focalized through Irene, states, “What happened next, Irene Redfield never afterwards allowed herself to remember. Never clearly. One moment Clare had been there, a vital glowing thing, like a flame of red and gold. The next she was gone” [6]. The ambiguity regarding Clare’s death is related to the ambiguity of Clare’s relationship with Harlem, in that the two societies to which Clare belongs are present at the moment she fell from the window. Her husband represents the white society, while Irene and Brian represent the African American society, both of which are hostile to “passing” people in this novel. Therefore, the threat to Clare’s existence in the urban environment of Harlem is purely sociological, rather than biological, which dictates only Clare’s ambiguous skin color. However, it is the color of her skin that allows her to choose between the two societies, and therefore, biology plays an important role in the act of “passing.” If Clare had not attempted to move within the two societies, then she may have been able to survive the urban environment in which she found herself, which allows us to view sociological factors as the leading cause of her demise.
CONCLUSIONS
The need for social dominance and control proves to be the real threat for both Fitzgerald and Larsen. The irrational maintenance of white biological dominance is the fatal force in both books. The novels address these issues of social control by questioning modern scientific studies that viewed African Americans as biologically inferior, and instead force us to see the emerging views of race as a social construction that were coming to light during the 1920s. At the end of both novels, the “passing” characters die, representing the modernist attitudes towards the racial and socioeconomic “other.” Tom Buchanan and John Bellow, both “nativists,” are threatened by the “other,” and are fearful that the dominant white race will lose control. This same “nativist” thought influenced scientific studies like “Danger in Race Mixture,” which attempted to point out the threats that would arise from interracial marriages and relationships [2]. However, the novels use nativists
to introduce the purportedly scientific evidence of that threat, causing our sympathies to lie with the victims of the racist ideologies.
Based on these novels, Fitzgerald and Larsen seem to agree with the progressive sociological studies that were being performed during the 1920s. While both Tom Buchanan and John Bellew agree with the scientific studies that warned against interracial marriages and relationships, the narration, however, does not. By focalizing the narrative through Irene, we are able to see John Bellew as a person who hurls racial insults because of his extreme racist attitude. The same is true for Tom, in that the narrator, Nick Carraway, constantly remarks about Tom’s pathetic demeanor, presenting Tom as a racist, rather than a “nativist” hero. These narrators allow us to see both novels as disagreeing with the scientific idea that African Americans are biologically inferior to whites, and instead allow us to see the complexities of race and class inherent in the modernist period. The struggle for an African American identity, apart from the given identity as biological and intellectual inferior, was a primary aim of the 1920s Harlem Renaissance. By situating both novels within this important decade of racial thought and liberation, we can see that Fitzgerald and Larsen are not only struggling with the complexities, but are also making statements that reflect the shifting attitudes towards race and African American identity.
REFERENCES [1] F. S. Fitzgerald. The Great Gatsby, Charles
Scribner’s Sons, New York, 1925. [2] “Danger in race mixture,” The Science News-Letter,
vol. 12(337), pp. 205-206, 1927. [3] J. M. Reinhardt. “The negro: Is he a biological
inferior,” The American Journal of Sociology, vol. 33(2), pp. 248-261, 1927.
[4] W. D. Wallis. “Race and culture,” The Scientific Monthly, vol. 23(4), pp. 313-321, 1926.
[5] H. A. Miller. “Race and class parallelism,” Annals of the American Academy of Political and Social Science, vol. 140, pp. 1-5, 1928.
[6] N. Larsen. Passing, Penguin Books, New York, 1997. [7] R. J. Terry. “The American negro,” Science, vol.
69(1787), pp. 337-341, 1929.
March 27th, 2009
Sponsors: Stäubli, Spartanburg Regional Healthcare System, EPSCoR/IDeA RS grant. 129
Meg Barnhouse: A Case Study of Discrimination in the Ministry Elizabeth Roberds and Melissa Walker
History and Politics Converse College
580 E. Main St., Spartanburg, SC 29302 {Elizabeth.Roberds, Melissa.Walker}@converse.edu
Abstract — The first women were ordained as ministers in the United States in 1955. While some denominations have approved the ordination of women, there are still many in which the question is still unsettled. Although many denominations have approved the ordination of women, women interested in pursuing such a career face discrimination from family, classmates, employers, and co-workers. This case study of ordained minister Meg Barnhouse’s experience, based on an oral history interview, reveals one woman’s experiences with sexual discrimination in the church in her pursuit of a life in the ministry. Barnhouse has served as a college chaplain. She also changed denominations in her pursuit of an open environment for a female minister. Keywords — Women, Religion, Ministry, Sexual Discrimination.
INTRODUCTION The role of women in the church has been debated since the early days of Christianity and arguments both for and against the ordination of women have been drawn from the Bible. Those who opposed female ministers turned to Paul. Those who believed that women had the right to preach turned to Acts, where women are listed among those gathered in the upper room when the Holy Spirit descended and gave them the ability to prophesy. Historians argue that the debate over whether or not to include women in the ministry began to be raised during the nineteenth century [1]. Not all denominations approved the ordination of women at the same time. While denominations such as the Presbyterians and Episcopalians consented to female ordination in 1955 and 1976 respectively, in Roman Catholic churches, the question is still unsettled. Although many denominations have formally accepted female ordination, it does not mean that the women are not discriminated against during their pursuit of a career in the ministry. One such woman who has experienced this discrimination is ordained minister Meg Barnhouse who graduated from Princeton Seminary in 1977. A case study of her life reveals ways in which women face discrimination within the church as well as methods some have found for coping with this discrimination.
SECTION TWO Meg Barnhouse is a Unitarian minister at the Unitarian Universalist Church of Spartanburg. Growing up in a religious family, Meg remembers that they “couldn’t have a conversation without the Lord being in there somehow.”[2] Her father, who was the news anchor on CBS news in Philadelphia, also worked as a preacher on the side. In her mother’s family, there was a minister in every generation. With religion playing such a large role in her childhood, it is not surprising that she would pursue a career in the field. According to Meg, what she wanted to do was “write and help people with their problems and preach and sing…and all of that was encapsulated in the ministry job.”[3]
When she went to Duke University to study psychology, she continued to surround herself with Christian/religious influences, joining a group of Campus Christian Intervarsity students. She also got involved with a singing group, performing in a Christian trope group and Christian rock band. Following graduation from Duke, Meg attended Princeton Seminary, where her parents had met and where she was born. Unlike many women interested in ministry who majored in Christian education, Meg got her degree in preaching. This decision would later pose a problem during her job search following graduation from seminary. While interviewing for jobs she found that most people seriously interviewing women were looking for a Christian education minister. Many assumed that because she was a woman in ministry, she was a Christian education minister. After many disappointing interviews, she saw an advertisement about an opening for a chaplain at Converse College, which is an all women’s college.
At the age of twenty-six, Meg began working as the chaplain of Converse College, where she would remain for about six years. As chaplain, Meg was able to teach and lead worship for the students. While she found most of the students at Converse to be great, she also found that the more conservative students, who thought she was too liberal, didn’t want to associate with her. In recalling her experience at Converse, Meg remarked that “‘I had a great time there basically. I didn’t have that much discrimination and everybody was very- people in Spartanburg were
Fifth Annual SC Upstate Research Symposium
130 Sponsors: Stäubli, Spartanburg Regional Healthcare System, EPSCoR/IDeA RS grant.
very nice and mostly the discrimination I faced was because I was a Yankee.’”[4]
Although Meg loved her job at Converse, when her first son was born she did not feel that she could bear to leave him in daycare all day and resigned in order to find a part-time job. It was at this point that Meg opened a pastoral counseling service, offering her clients marriage counseling.
Although Meg’s husband was a Presbyterian minister and she attended his church, she began meeting people in the Spartanburg area who were Unitarians. Upon learning about the denomination, she found that she shared many of its beliefs. Among these were the belief in the inherent worth and dignity of every person and the belief that Jesus was a really great teacher and good person, who was perhaps enlightened; however, he was not the only enlightened one [5]. Over time, she began attending more and more Unitarian services, and was even invited to speak on a number of occasions. With her growing interest in the Unitarian Church, Meg faced a dilemma. If she joined the Unitarian Church where she felt more comfortable, it would end her husband’s preaching career because the Presbyterian Church forbade its ministers to be married to Unitarians. However, Meg felt more spiritually at home among the Unitarians. At the same time, Meg found that her marriage was coming to an end. She began making the shift to the Unitarian Church. As Meg and her husband began divorce proceedings, she discontinued her counseling practice, finding it too difficult to counsel other married couples while going through a divorce herself. As she was ending her counseling practice, however, the Spartanburg Unitarian Church was in search of a new minister and Meg was offered the job.
Because she was a woman, Meg faced discrimination throughout her life in the ministry. According to Meg, the denomination she grew up in was a conservative Scottish denomination called the Associate Reformed Presbyterian church, which did not and still does not allow women to be ministers. Therefore, when she became a minister, her family was a little disconcerted and unnerved by her decision. She recalled one instance at a family reunion when her aunt on her mother’s side told her that her “grandfather [had] a desk that’s supposed to go to the next minister in the family, but, [she] just [didn’t] know if [she] (Meg) [would get] that or not.”[6] Meg’s family were not the only people who were uncomfortable with the idea of a female preacher.
Many women interested in pursuing a life in the ministry were also discouraged by college and
seminary recruiters. According to Meg, if a man expresses an interest in seminary:
everybody’s like ‘oh, you’re going to be such a great minister, I love your voice, you have such a lovely voice.’ And they will push the applications on them. I mean if you’re a high school student or a college student and you think you might want to be a minister, everybody is there to help you. You know they’re like ‘oh yeah let me get you the application; let me help you fill it out.’[7]
However, if a female expresses an interest in ministry, Meg went on, “everybody says, ‘Why do you want to do this? Justify yourself. What do you think you- what are you trying to accomplish? What are you doing? What are you- who do you think you are?’ And nobody helps you.”[8]
While Meg was studying at Princeton, the discrimination continued; however, she found that the discrimination came from her fellow students and not the professors. According to Meg, the women in the class ahead of her were “hard-nosed, old-school feminists.”[9] In the one year they were at school before Meg started attending, the women had gotten all the professors to use inclusive language, which also opened up people’s thinking about God. Although professors were making changes to include the women in Seminary and appeared open to their attendance, the male students were not so accepting. Meg remembered one student who would approach the women and say “Does it not concern you that your call is from the Devil?--your call to the ministry is from the Devil?”[10] To this, the women would simply reply, “‘yeah, yeah whatever- get away.’”[11]
Once out of seminary, women had to find employment. Following graduation in 1980, Meg experienced more discrimination in her attempt to find a job. According to her, Presbyterian churches hiring a minister were required to interview a certain number of women. Therefore, she and all her female classmates would attend interview after interview but would not get hired. She recalled one church in Cape May, New Jersey, where she drove two hours in a snowstorm to interview at the church. Upon arriving, the people conducting the interview said, “‘well we heard of your grandfather,’ because my grandfather…was a famous radio evangelist… ‘we just wanted to meet you and plus we had to interview a couple of women anyway so… we are so glad to of met you- okay good night!’”[12] On other occasions, she would go into an interview and say, “‘I’m a

March 27th, 2009
Sponsors: Stäubli, Spartanburg Regional Healthcare System, EPSCoR/IDeA RS grant. 131
preaching major.’ And a guy would look at me and say, ‘that’s what I do; I need an educator.’”[13]
Even after women manage to secure a position as a minister in a church, they still encounter greater difficulties than men. According to Meg, when a minister is a woman, people have certain expectations for a female minister. The minister takes on a motherly role to the congregation, which causes problems if the minister has her own child. Although Meg did not express any personal difficulties of this kind, she did explain that one of her friends, who was also a minister, had a baby and while the congregation was happy for her, the birth of the child also created a kind of sibling rivalry between the church and the baby. The congregation felt that it would no longer get as much attention because of the baby. Meg remarked that it also created problems because “it means that she’s having sex, which nobody wants to think about.”[14] Therefore, even if a woman does manage to secure a position as a minister, she still might have other problems which are the result of her sex.
CONCLUSIONS In conclusion, women interested in becoming ministers are faced with discrimination and obstacles throughout their lives. For some, such as Meg Barnhouse, it begins with family members who struggle to accept the woman’s decision. Others get their first taste when they start looking into colleges and speaking with recruiters. When they get to seminary, the women are sometimes ridiculed by fellow students and, although not in the case of Meg Barnhouse, in some cases perhaps even discouraged by professors. Following graduation from seminary, women then had the difficult task of finding a job. Finally, even when a female minister did manage to procure a job in a church, there were still struggles these women faced due to their sex. For women such as Meg Barnhouse, life as a female minister was difficult. According to Meg, “a woman, when [she] came out of seminary, women lasted an average of three years in the parish.”[15] Women like Meg Barnhouse, who are interested in pursing a life in the ministry, have found many methods of coping with the sexual discrimination they face. For some, such discrimination would not be tolerated and
they made a practice of expressing their disapproval to bring about change. Others simply kept pushing past the discrimination as best they could, laughing off comments and searching for jobs in women’s colleges and among more liberal denominations. Although much ground has been gained for women in the ministry, today these women still face hardships unknown to their male counterparts, which leaves much progress still to be gained.
ACKNOWLEDGMENTS I would like to thank Rev. Meg Barnhouse for her participation in this case study. I would also like to thank Dr. Melissa Walker for her help and encouragement in preparing this case study.
REFERENCES [1] For more on debates over the role of women in the
church, see Rosemary Ruether and Rosemary Keller, eds., In Our Own Voices (Westminster John Knox Press, 2000). And for more on the history of women in the ministry, see Susan H. Lindley, You Have Stept Out of your Place (Westminster John Knox Press, 1996) and Rosemary Ruether and Rosemary Keller, eds., Encyclopedia of Women and Religion in North America (Bloomington: Indiana University Press, 2006).
[2] M. Barnhouse. "Ordinary Women, Extraordinary Experiences," Personal interview by Elizabeth Roberds, 22 Oct. 2008.
[3] Ibid. [4] Ibid. [5] For more on beliefs and principles of the Unitarian
Church, see “Visitors.” Unitarian Universalist Association of Congregations, 1996. Unitarian Universalist Association of Congregations. 21 Oct. 2008 <http://uua.org/visitors/index.shtml>.
[6] M. Barnhouse. "Ordinary Women, Extraordinary Experiences," Personal interview by Elizabeth Roberds, 22 Oct. 2008.
[7] Ibid. [8] Ibid. [9] Ibid. [10] Ibid. [11] Ibid. [12] Ibid. [13] Ibid. [14] Ibid. [15] Ibid.
Fifth Annual SC Upstate Research Symposium
132 Sponsors: Stäubli, Spartanburg Regional Healthcare System, EPSCoR/IDeA RS grant.
From Lighting was Born a Man: Myth, Reality and Chief Pushmataha
Cole Cheek Spartanburg Methodist College
1000 Powell Mill Road, Spartanburg, SC 29301 [email protected]
Historians enjoy good stories and especially debunking them, particularly those about famous individuals of the past. Tales of the unbelievable, true or not, range from a President named George chopping down a cherry tree to another, also named George, nearly choking on a pretzel. Often such myths are considered separate entities, two unrelated worlds of truth and fiction. For the Choctaw Indians of Mississippi, myth and reality are intertwined. Such is the case with their most famous chief Pushmataha, “born from lightning,” military hero, and a leader unwilling to relent to political threats from a foreign nation. Ironically, the myths and truths that combined to bring Pushmataha prowess, a political office and respect were forged not only in tradition but also in cultural change.
In December 1824, a few days before Christmas, a strong, short man of about sixty years old walked the streets of Washington City. He had arrived there as part of the Choctaw Delegation, a group of diplomats and headmen who had made the arduous journey the previous October to negotiate a fair treaty with President Monroe. On the 23rd, the old chief contracted a respiratory illness and passed away before the treaty could be signed. Although a sad end, his funeral honored the life that had been, both the legendary and real one. Buried in the uniform of an American colonel and followed by a procession of 3,000 persons, Pushmataha’s remains were laid to rest in the Congressional Cemetery on December 24th. On his tombstone were carved his final request: “When I am dead let the big guns be fired over me.” At his funeral, canons fired to honor the late warrior [1].
Choctaws in Mississippi and Oklahoma celebrate this occasion in remembrance of the bravery and ideals Pushamataha represented in life, death and myth. Historians do not know much about his birth origins. Andrew Jackson once posed the question to Pushmataha, who replied, “Tell the white chief it’s none of his business.” When pressed, the Choctaw leader stated that he had neither a mother nor a father. A dark cloud arose on the western horizon, blanketing the sky and covering the earth in darkness. Thunder boomed and a bolt of lightning blazed towards a mighty oak, cleaving it from top to bottom. From
the between the split in the tree “leaped a mighty man; in stature, perfect; in wisdom, profound; in bravery, unequalled—a fullfledged warrior.” [2]
In reality, Pushmataha had a humble birth on the banks of the Noxubee River in Noxubee County, Mississippi on what was later named the Howard Plantation. Traditional Choctaw culture dictated that individuals of particular lineages would receive high status within society, but persons might also earn social status, prestige and power. Pushmataha was unique in this respect. As a child, a boy did not receive a name until he had performed some daring deed, often the killing of an enemy male warrior or achieving significant successes in hunting. [3] Not of royal blood, Pushmataha became a chief. He led multiple hunting excursions throughout the Southeast and west of the Mississippi and killed multiple enemies with quick, merciless efficiency. [4]
Most notably, Pushmataha gained fame as a powerful, tactful warrior, whose victory on the battlefield earned him the position of District Chief of which there were three. His earliest success occurred during his childhood. During an expedition against the Osage, several fellow warriors called him a coward and weak, but to their surprise the boy produced more scalps than any of the adults. Over the following years, victory followed in expeditions against the Creek and Tawakoni, and legend tells that he killed seven of the latter in one skirmish. [5]
Stories about Pushmataha’s valor disseminated throughout villages in Choctaw Territory . Whether fiction or truth, the stories themselves apotheosized the chief in the eyes of his followers and demanded awe from the neighboring two districts. During the nineteenth century, the chief’s prestige and stories about him extended beyond the borders of the Choctaw Nation for two specific reasons. First, he was known as great orator. Second, he honored his people’s allegiance to the United States in time of war. One particular event portrayed both characteristics.
In 1811, Shawnee chief Tecumseh traveled throughout the Southeastern United States with his brother, the prophet Tenskwatawa. The Chief forged a pact with the British government and agreed to aid in war against the fledgling American
March 27th, 2009
Sponsors: Stäubli, Spartanburg Regional Healthcare System, EPSCoR/IDeA RS grant. 133
Nation. To the British, the states still were nothing more than rebelling colonies. Tecumseh traveled to present-day Mississippi, where he met with the leaders and thousands of followers of the Choctaw Nation, including Pushmataha. Debates arose over whether or not the Choctaw should join the Shawnee and their allies to push the supposedly land-hungry Americans out of North America. Headmen and chiefs made speeches. Pushmataha then rose and spoke with eloquence, force, and conviction. His words carried weight, his prestige obtained through warfare and legend demanded respect and attention, and Choctaws listened. He threatened the lives of those who might side with Tecumseh and noted the agreements of peace made with the United States. Tecumseh did not obtain allies that day, left, and forged alliances with the Creek instead. [6]
Without Pushamataha’s dedication to honor and peace with Americans and his skill in oratory, convincing his followers to side with the Americans would not have been possible, and the Choctaw did side with Americans. With their Indian allies, including Tecumseh’s pan-Indian alliance, the British waged another war against Americans, who had their own Native allies. Under the command of General Andrew Jackson, Pushmataha led 500 Choctaw warriors against the Creek and British at various military conflicts, including those at Holy Ground, Pensacola, and Talladega. To some American politicians, Pushamataha became a legend. To fellow Choctaws, the leader upheld the values and portrayed the qualities of a traditional warrior. [7]
From the Creek War, which lasted from 1813-1814, emerged a new story that supported Pushmataha brave. Supposedly in 1814, a soldier who had been placed under the command of Pushmataha insulted Andrew Jackson’s wife. The Choctaw Chief knocked the man down, slapped him with the butt of his sword, and called him an “insolent dog.” Jackson asked the chief what he would have done if Jackson himself had insulted Pushmataha’s wife. Pushmataha stated that he would have run the general through because only a fellow leader was truly worthy of being killed by Pushmataha’s blade and said he also would have no problem doing so to take vengeance on such an insult from Jackson. Jackson, like Pushmataha, was seen by Choctaws as an important, powerful military leader, a strong and vicious warrior in his own right. Few people would dare threaten Jackson with such an insult. The story has been perpetuated through many generations to today. Despite being a legend from almost 200 years ago, Choctaws still consider it important for teaching others how to live and behave. [8] By
disseminating the story, Choctaws remembered for what rights and privileges they fought during the Creek War, War of 1812 in general, and throughout their history. Pushmataha thus became a symbol for Indian rights in short term and the long one.
Certainly, the Choctaw Chief embodied traditional ideas, reveled and drew his power as a leader from them, but he also understood the importance of change. By the end of the eighteenth century, American Indians in present-day Mississippi, Louisiana, Alabama, and Western Tennessee had overhunted deer populations drastically. [9] To solve the problem of food shortages, Pushmataha became a supporter of acculturation, a process by which one culture takes aspects of a foreign “Other” and integrates those aspects into one’s own. For example, Pushmataha promoted the shift from subsistence on hunting, gathering and horticulture to husbandry and agriculture. Between 1800 and 1820 with aid of leaders, including Pushmataha, Choctaws raised cattle and hogs and entered the American market economy by selling cash crops to settlers. Cattle and hogs replaced deer as the primary meat in diets, and individuals used money obtained from the sale of them to buy other food goods such as coffee and sugar, items that Americans had previously traded to Amerindians for skins. [10]
Taking acculturation a step further, Pushmataha also promoted the establishment and expansion of Presbyterian missionary schools in the Choctaw Nation. These schools taught about American business, literacy, and most importantly the interpretation of laws. With other chiefs, Pushmataha hoped that the education of future generations would create individuals knowledgeable enough to fight corrupt business practices and prevent land cessions. In 1819, the first Presbyterians arrived and established Eliot, the first mission school to Choctaws. Over the next decade other schools appeared throughout Choctaw Territory, supported by the money, resources, and blessings of headmen throughout the Nation. Those same headmen sent sons, daughter, nieces and nephews to Presbyterian schools to receive educations and learn new leadership abilities that would aid in the preservation of Choctaw autonomy [11].
For Pushmataha, whose life had been stepped in tradition, educated Choctaws represented something new, living tools full of knowledge and necessary in the fight against corrupt American political practices, especially treaties. In 1820 at Doak’s Stand located off the Natchez Trace, Pushmataha witnessed that corruption when Andrew Jackson, serving as a treaty commissioner, threatened to attack the Choctaw if chiefs did not

Fifth Annual SC Upstate Research Symposium
134 Sponsors: Stäubli, Spartanburg Regional Healthcare System, EPSCoR/IDeA RS grant.
agreed to the terms presented by the United States. Pushmataha himself had signed several treaties to extinguish debts, protect his followers’ welfare, and provide education, but he had never experienced outright threats from Americans. Pushmataha considered a more tactful approach. They would use the new, educated generation against the United States to negotiate directly with the President.
In October 1824, the three District Chiefs of the Choctaw created a delegation to travel to Washington. Within this delegation were family members of chiefs who had received American educations. Most important, David Folsom, whose British father had married into an important Choctaw family in the eighteenth century, and James McDonald, a Choctaw who had received an education in law, traveled with the group to Washington. Through Folsom and McDonald and with some aid from the other delegates, the Choctaw negotiated a better treaty. They protected their Indian autonomy, extinguished debts, and received the largest annuity ever obtained through a treaty. Aspects of the trip also had disadvantages: more land was ceded, Puckshenubbee (one of the three district chiefs) had died en route to Washington, Folsom’s son died in Choctaw Territory during the trip, and Pushmataha died in Washington before seeing the fruits of labors [12].
For Choctaws, life was changing at the beginning of the nineteenth century. Although Pushmataha only lived through the first quarter of that era, truth and legend about him live on. His name, deeds, accomplishments made him a rallying symbol for Choctaw rights from his death in 1824 to present. He is remembered through myth because he embodied virtues that other Choctaws wanted to embody, and he is remembered in history for the deeds he accomplished.
If a person visits Mississippi, he or she might still see references to the famed leader. On the Choctaw reservation, the lake adjacent to Geyser Falls family water park boasts his name, Pushmataha Lake. One of the three districts of the Oklahoma Choctaw Nation bears his name. In the silent halls of the Old Capitol Museum, a contemporary painting of Pushmataha hangs depicting the leader in traditional garb and starring at onlookers with the same patriotism and fiery personality he had in life. Regardless of the imagery and name, for Choctaws the myth and the reality are the same, intertwined, connected. Hearing the name Pushmataha, the legend and the man, reminds historians, Choctaws, and the “average Joe” why humans should and do value the study of individuals of the past.
WORK CITED [1] Gideon Lincecum, Pushmataha: A Choctaw Leader
and His People, intro. Greg O’Brien (Tuscaloosa: The University of Alabama Press, 2004), 98-100; and Typscript excerpt from the Bureau of American Ethnology regarding the life of Pushmataha and the Choctaw, Walter Stanley Campbell (1877-1957) Collection, Box 117, Folder 21, Western History Collections, University of Oklahoma, Norman, Oklahoma (hereafter UOKWHC).
[2] Horatio Bardwell Cushman, History of the Choctaw, Chickasaw and Natchez Indians, ed. Angie Debo, intro. Clara Sue Kidwell (Greenville, TX: Headlight Printing House, 1899; first reprint, Stillwater, OK: Redlands Press, 1962; second reprint, Norman: University of Oklahoma Press, 1999), 263-64 (page citations are to the second reprint edition).
[3] Jean-Bernard Bossu, Travels in the Interior of North America, 1751-1762, trans. and ed. Seymour Feiler (Paris, 1768; reprint, Norman: University of Oklahoma Press, 1962), 163, 166; Grayson Noley, “The Early 1700s: Education, Economics, and Politics,” The Choctaw before Removal, ed. Carolyn Keller Reeves (Jackson: University Press of Mississippi, 1985), 74-75; and Margaret Zehmer Searey, “Choctaw Subsistence, 1540-1830: Hunting, Fishing, Farming, and Gathering,” in Before Removal, 43.
[4] Lincecum, Pushmataha, 27. [5] Typscript excerpt, Campbell Collection, UOKWHC. [6] Lincecum, Pushmataha, 90, 100-101; Stephen P.
Van Hoak, “The Poor Red Man and the Great Father: Choctaw rhetoric, 1540-1860,” Chronicles of Oklahoma 81:3 (2003): 308; Col. John McKee to George S. Gaines, 16 May 1814, 209, Records of the Old Southwest in the National Archives: Abstracts of Records of the Choctaw Indian Agency and Related Documents, 1794-1841, comp. and ed. James R. Atkinson, appendices Jan Hillegas (Cobb Institute of Archaeology, 2005), 209; and Tecumseh’s Visit to the Choctaw Nation, 1811, Henry S. Halbert Papers, microfilm copy (Montgomery, AL: Alabama Department of Archives and History, n.d.), available at Mississippi Department of Archives and History, Jackson, MS, reel 4294.
[7] Lincecum, Pushmataha, 98. [8] Dr. Kennith York, Mississippi band of Choctaw
Indians, interviewed by author, 20 March 2008; and Dr. Kennith York, personal communication, 6 August 2008.
[9] James Adair, The History of the American Indians: Particularly those Nations Adjoining to the Mississippi East and West Florida, Georgia, South and North Carolina, and Virginia, rep. ed., intro. Robert F. Berkhofer, Jr. (1775; reprint, New York and London: Johnson Reprint Corporation, 1968), 285, 317.
[10] Daybooks, Letter from the Secretary of War: List of goods orders and of whom purchased, 8 April 1805, and Invoice, 30 September 1807, Records of the Choctaw Trading House, Under the Office of Indian

March 27th, 2009
Sponsors: Stäubli, Spartanburg Regional Healthcare System, EPSCoR/IDeA RS grant. 135
Trade, 1803-1819, The National Archives and Records Service General Services Administration, Record Group 75 (Washington, D.C., 1960), microfilm publication T500, reel 1.
[11] Excerpt from David Folsom to Rev. Elias Cornelius, Chahtah Nation, Pigeon Roost, 3 November 1818, David Folsom to Rev. Byington, Chahtah Nation, Pigeon Roost, 6 July 1822, and David Folsom to Rev. C. Byington, 7 January 1829, Aiikhuna, all in Cushman, History, 292-95; James Taylor Carson, Searching for the Bright Path: The Mississippi Choctaws from Prehistory to Removal (Lincoln and London: University of Nebraska Press, 1999), 112, 115-17, 119-20; Clara Sue Kidwell, Choctaws and Missionaries, 1818-1918 (Norman and London: University of Oklahoma Press, 1995), , 84-85, 87-88; and Kingsbury to Evarts, Mayhew, July 1829, Papers of the American Board of Commissioners for Foreign Missions (Woodbridge, CT: Houghton Library of Harvard University, 1984-1985), microfilm, reel 756, 224-227.
[12] See Gary Coleman Cheek Jr., “Cultural Flexibility: Assimilation, Education and the Evolution of Choctaw Identity in the Age of Transformation, 1800-1830” (M.A. Thesis, Mississippi State University, 2005), 38-68.
Fifth Annual SC Upstate Research Symposium
136 Sponsors: Stäubli, Spartanburg Regional Healthcare System, EPSCoR/IDeA RS grant.
Effect of the 6+1 Trait Writing Model on Student Writing Achievement
Nancy K. DeJarnette Elementary Education
Limestone College 1115 College Drive, Gaffney, SC 29340
Abstract — The focus of this study was to determine the difference between teaching the 6+1 Trait Writing Model to fifth graders and the traditional writing workshop method of teaching writing on overall student writing achievement according to the data supplied by a writing rubric. The study involved 8 classes of fifth graders in 2 different schools. One school provided instruction according to the 6+1 Trait Writing Model, and the other school provided instruction using the traditional writing workshop method of teaching writing. It was hypothesized that students receiving instruction using the 6+1 Trait Writing Model would exhibit greater gains in writing achievement and quality according to the data supplied by a writing rubric. Significant differences were found in two out of four component areas on the rubric used for scoring student papers. Results indicated that the type of method used to teach writing is not as significant as providing structured instruction as well as time for student writing. Keywords — Writing Instruction, Language Arts, 6+1 Trait Writing Model
INTRODUCTION Inconsistencies in instructional methods for teaching writing abound in elementary schools across the United States [1]. When elementary school schedules get filled with too many subjects, usually writing is the first content area to suffer from benign neglect. Finding quality writing instruction and time committed for writing instruction and practice are rare in elementary schools. Elementary schools often do not have a designated writing curriculum or a specific method mandated by the district. There can be inconsistencies within schools and even from teacher to teacher in the selection and implementation of writing instructional methods. Both veteran and beginning elementary teachers can feel inadequate when deciding how to teach writing to their students. In 2008, as a result of the No Child Left Behind Act (NCLB), most states have adopted demanding writing standards for grades K-12. Teachers are now required to teach writing but rarely are given instruction on how to do so effectively. The goal of this study was to look at
specific ways in which to improve the overall quality of writing instruction for students.
This study focused on two specific instructional writing methods for fifth grade students. Both methods required process writing involving prewriting, drafting, editing, revision, and publishing. The 6+1 Traits Writing Model provided direct instruction on the craft of writing, or specific traits, the writing workshop method did not address. The goal of this study was to determine if teaching the individual traits would improve overall writing achievement.
BACKGROUND Writing instruction has taken on new meaning in education over the past two decades or so. Since the emphasis of writing instruction has changed, many veteran and novice teachers do not have adequate skills to teach the craft of writing. School districts do not usually purchase a formal writing curriculum which leaves the choice of how to teach writing to each individual school or each teacher in the school.
There are numerous instructional methods available and teachers may approach the same method in different ways, creating inconsistencies in the methodology for writing instruction in American elementary schools. This study researched two previously-tested writing instructional methods to see which method yielded greater student writing quality and achievement.
The 6+1 Trait Writing Model is a method of teaching writing and assessing students’ writing using the distinct vocabulary of a professional writer. The traditional writing workshop method of instruction focuses on sentence and paragraph structure, conventions, and organization, emphasizing a beginning, middle, and an end. The 6+1 Trait Writing Model adds emphasis on additional writing skills such as ideas, voice, word choice, sentence fluency, and presentation. The traits introduce new writing vocabulary to students that will help give them a vision for what “good writing” looks and sounds like by using children’s literature as a model. This writing model has been
March 27th, 2009
Sponsors: Stäubli, Spartanburg Regional Healthcare System, EPSCoR/IDeA RS grant. 137
shown to help students add depth and style to their writing that would not normally happen alone.
STATEMENT OF THE PROBLEM What is the difference between the 6+1 Trait Writing Model and the traditional writing workshop method of teaching writing on fifth grade student overall writing achievement as measured by the use of a rubric?
STATEMENT OF THE HYPOTHESIS There will be significantly higher achievement in four component areas (as determined by the rubric utilized for this study) of the treatment group, following the 6+1 trait writing model, as compared to the control group, following the traditional writing workshop model.
PROFESSIONAL SIGNIFICANCE The significance of this study emphasized the importance of instructional methods for teaching elementary writing. For many children writing does not come naturally and can be quite difficult. The 6+1 Trait Writing Model provides direct instruction in the different crafts of writing. These crafts, or traits, can be taught and emphasized to greatly improve the quality of students’ writing. This experimental method also closely relates writing to reading. Examples from children’s literature were used to introduce and teach each of the individual writing traits. Using children’s literature provides a model for students and gives them ideas for their own writing. As students study the 6+1 traits in their reading and writing, the traits become part of their vocabularies which give them the capability to apply the traits to both reading and writing. Jarmer, Kozol, Nelson, and Salsberry discovered that familiarity and emphasis on the traits raise student achievement scores on writing standardized assessment measures [2]. This study yielded some useful methodological findings about how the instruction of writing should be addressed in schools. The 6+1 Trait Writing Model has not been widely used in elementary schools in the Eastern United States; however the results of this study may bring attention to this writing method.
REVIEW OF THE LITERATURE THE 6+1 TRAIT WRITING MODEL Nearly twenty years ago, the Northwest Regional Educational Laboratories (NWREL) launched an effort to improve writing in the elementary classroom [3]. The researchers identified six traits of good writing. They knew that the writing programs in the American classrooms were not
effective. The goal was to develop a writing program that went beyond grammar and mechanics and holistic grading. NWREL explains that they “compared reams of student work and discussed the qualities or traits that all ‘good’ writing samples shared. Six traits emerged as the cornerstones of quality writing: ideas, organization, voice, word choice, sentence fluency, and conventions. Later, presentation was added to the list” (para.3).
Considering the 6+1 Trait Writing Model’s growing popularity, it is surprising that there has not been more research done on the method to ensure its effectiveness. Arter, Spandel, Culham, and Pollard conducted a study very similar to the one proposed by this researcher [4]. They tested the 6 Trait Writing Model against traditional methods in six fifth grade classrooms. The study consisted of a pretest, instruction over six months, and a posttest. In this study, a 6+1 Trait Writing Model rubric was used to score student papers. These researchers concluded that students in the treatment group (6 Trait Method) received significant gains in only one out of six areas, the ideas trait. Two other areas approached significance. However, Jarmer et al. reported in their study at Jennie Wilson Elementary School, that after 3 years of implementation of the 6 Trait Writing Method in all the grades, student standardized test scores increased each consecutive year [5].
THE STUDY METHODOLOGY This study used a quasi-experimental design with cluster sampling. The task of the experimental writing instructional method was assigned randomly between two different, but similar, schools. Four fifth grade classes in each of two schools were used for the study. The instrument used to evaluate student progress in writing was a rubric consisting of five levels and four elements: content development, organization, voice/word choice, and conventions. The rubric for this study was similar to the South Carolina Palmetto Achievement Challenge Test (PACT) rubric which is a standards-based accountability measurement of student writing achievement [6]. All students in the study were given a writing pretest that was evaluated by three raters. The raters were trained by the researcher on the use of the rubric for evaluation with anchor papers. The anchor papers chosen for training represented each of the rating levels on the rubric. A pretest consisting of a narrative writing prompt was given to all students first. Four fifth grade classes in one school were

Fifth Annual SC Upstate Research Symposium
138 Sponsors: Stäubli, Spartanburg Regional Healthcare System, EPSCoR/IDeA RS grant.
then instructed according to the 6+1 Trait Writing Model using a writing unit provided by the researcher for a total of 22 lessons. Four classes in the second school were instructed according to the traditional writing workshop method using a writing unit provided by the researcher for a total of 22 lessons. A posttest writing prompt consisting of a narrative writing prompt was given at the end of the study and was evaluated by the same three raters. These raters used a blind review process when evaluating students’ writing. The researcher looked for differences in means between student gains from pretest to posttest between the two different method groups using an analysis of covariance (ANCOVA).
PROCEDURES Two schools were chosen for this study because they were similar in area, size, student demographics, and proximity according to the Annual School Report Card produced by the South Carolina Department of Education [7]. Each school had four classes of fifth grade students, averaging 20 students in each class. A coin was flipped to determine which school would be the control group and teach the traditional approach to writing workshop and which school would teach the manipulated study or the 6+1 Trait Writing Method. The two methodologies were separated into different school buildings to help maintain the reliability of the study by preventing teachers from discussing the content of the instruction. Students were identified by number rather than name. This coding helped maintain validity when the papers were scored by the raters. Both groups began with a pretest and ended with a posttest writing assignment using a writing prompt. The pretest topic and posttest topic were different.
FINDINGS An analysis of covariance (ANCOVA) test of significance for a quasi-experimental design was used to show a difference of means between the two research groups in each of the four component areas. This test was chosen because a difference in pretest scores existed between the two schools. The 6+1 Trait group (treatment group) scored higher on the pretest than the writer’s workshop group (control group).
The ANCOVA test accounted for the differences in pretest scores that existed between the two groups. The main effect for content development was found to be significantly greater gains for the 6+1 Trait method F(1,128) = 8.877, p = .003. Results also indicated that the 6+1 Trait method was significant over the traditional method
for the conventions component F(1,128) = 7.828, p = .006. A strong relationship did exist in these two component areas between the method used and the posttest scores when pretest scores were adjusted. The voice/word choice component area was not found to be significant for the treatment method F(1,128) = 3.474, p = .065. The organization component area was not found to be significant for the treatment method used F(1,128) = 2.473, p = .118. All tests were conducted using alpha = .05.
CONCLUSIONS The 6+1 method yielded greater gains in two component areas, content development and conventions. The traditional writing workshop method yielded greater gains in two other component areas, organization and voice/word choice. Since the gains are evenly split, the hypothesis cannot be confirmed. However, two out of the four component areas for this study did indicate a difference in instructional method in favor of the 6+1 Trait Writing Model.
Although the hypothesis could not be confirmed in this study, several implications can be made. Providing time for writing, implementing quality instruction which includes literature, and using a scoring rubric during instruction all help to increase student writing achievement. The fact that each of these things were provided for both groups may have contributed to the inconclusive findings of this study. Both groups experienced similar gains in writing achievement.
REFERENCES [1] S. Graham, C. MacArthur, and H. Fitzgerald. “Best
practices in writing instruction,” The Guilford Press, 2007.
[2] D. Jarmer, M. Kozol, S. Nelson, and T. Salsberry, “Six-trait writing model improves scores at Jennie Wilson Elementary.” Journal of School Improvement,1(2), pp 29-32, 2000.
[3] Northwest Regional Educational Laboratory, http://www.nwrel.org/.
[4] J. Arter, V. Spandel, R. Culham, and J. Pollard. “The impact of training students to be self-assessors of writing.”
Paper presented at the American Education Research Association, New Orleans, LA, 1994.
[5] D. Jarmer, M. Kozol, S. Nelson, and T. Salsberry. “Six-trait writing model improves scores at Jennie Wilson Elementary.” Journal of School Improvement,1(2), pp 29-32, 2000.
[6] South Carolina Department of Education, Palmetto Achievement Challenge Tests (PACT) Rubric information,http://ed.sc.gov/agency/offices/assessment/PACT/ERrubric032204.doc.
[7] South Carolina Department of Education, Annual School Report Card, http://ed.sc.gov/topics/assessment/scores.
March 27th, 2009
Sponsors: Stäubli, Spartanburg Regional Healthcare System, EPSCoR/IDeA RS grant. 139
Implementation of Learner-Centered Teaching in Higher Education: A “Customer Service” concept for academia?
Joseph D. Ongeri Computer Science, Math, and Business Division
Spartanburg Methodist College 1000 Powell Mill Road, Spartanburg, SC 29301
Abstract - Improving learning in colleges and universities has been an objective of both Federal and State Department of higher education. Given the changing characteristics of learners over time, learner-centered teaching has become a method of choice for many colleges and universities in US. Weimer (2002), maintains that in order to be learner-centered, there should be at least five key areas’ change to practice, and she identifies these areas as; i.) the balance of power, ii.) the function of content, iii.) the role of the teacher, iv.) the responsibility for learning, and v.) the purpose and processes of evaluation. An action research was conducted on the implementation of LCT at Spartanburg Methodist College, during the spring semester of 2008. The findings of this research indicated that students may initially resist the implementation due to the fears of added responsibilities and the fear of losing subject authority’s guidance. However, with persistence by the implementing instructor, building positive student-teacher relationships, caring for the students’ emotional concerns, respecting and giving genuine voice in students’ learning improves learning. Keywords: Learner-centered Teaching in Higher Education
INTRODUCTION Reforming the American system of education has been in the forefront of most educators, policymakers and researchers since the “Nation at risk” report came out in 1983. Efforts have been numerous in reforming both state and federal educational standards to higher levels. The main purpose of all these efforts has been to improve schools to levels that increase students’ learning standards [1]. Research has also found that current students have very different characteristics from the characteristics of their teachers as when they were students. Some of the current student expect to be entertained, and/or get easily bored. They are not into books, not impressed with science, data, or credentials. They have a consumer mentality and want to negotiate for everything including grades. They view education as a commodity to be acquired through purchase; and believe that they are entitled to good grades [2]. Given these characteristics, can learner-centered teaching improve learning in our colleges?
SECTION TWO Guided by the characteristics of the current and future student generations, the American psychological association (APA) is one entity that has been in the forefront in looking for a framework that can improve learning in higher education. In 1990, APA, appointed a task force for psychology and education, with one of its primary task was to review over a century’s research that was relevant to education. In particular, these researches were to be mainly addressing the learning, motivation, development, and individual learner differences. From this task force, there emerged the learner-centered teaching (LCT) psychological principles. Initially, the task force had identified twelve principles, which were later revised to fourteen [3].
The fourteen learner centered psychological principles pertain to the learner and the learning process. These principles focus on psychological factors that are primarily internal to and under the control of the learner rather than conditioned habits by the educator, or physiological factors. The principles also attempt to acknowledge external environment or contextual factors that interact with these internal factors in learning. Thus, learner-centered teaching may be defined as a perspective that couples a focus on individual learner (their heredity, experiences, perspectives, backgrounds, talents, interests, capacities, and needs) with a focus on learning (the best available knowledge about learning and how it occurs and about teaching practices that are effective in promoting the highest levels of motivation, learning, and achievement for all learners). This dual focus then informs and drives educational decision-making. The learner – centered perspective is a reflection of the twelve learner-centered psychological principles in the programs, practices, policies, and people that support learning for all. [4].
Many colleges have adapted this teaching style because it has been argued that there is abundant and accumulating evidence that motivation, learning, and achievement are highly enhanced where learner-centered principles and practices are in place. These are practices that address the
Fifth Annual SC Upstate Research Symposium
140 Sponsors: Stäubli, Spartanburg Regional Healthcare System, EPSCoR/IDeA RS grant.
personal domain of the learner, that are often ignored. The benefits of learner-centered practice extend not only to students, but also to educators, administrators, parents, and all other participants in the educational system as well. It is also with the realization that the changes in our society are necessitating a change in the role and function of schools so that they better meet the needs of the learner as a whole person, regardless of whether that person is a student, teacher, administrator, or parent.
This change requires a total transformation in thinking, and thus in the process of learning, that is transformative and can be facilitated by the understanding of the basic principles of learning and by the learners. As [5] have eloquently put it, “Learning is not a spectator sport. Students do not learn much just by sitting in class listening to teachers, memorizing repackaged assignments, and spitting out answers. They must talk about what they are learning, write about it, relate it to past experiences, and apply it to their daily lives. They must make what they learn part of themselves” (p. 3).
IMPLEMENTING LEARNER-CENTERED TEACHING (LCT) To implement LCT, Weimer (2002) [6] recommends that, there should be at least five key areas’ change to practice. These areas include; balance of power, the function of subject content, the role of the teacher, the responsibility for learning, and the purpose and processes of evaluation. During the spring 2008 semester, I conducted an action research to implement LCT in teaching a principle of economics class at Spartanburg Methodist College. The remaining section of this paper describes the method, finding and the conclusions drawn from the study. Method
In action research, teachers are provided with the opportunity to apply traditional research’s findings to their own classroom teaching and to apply theory to practice. Action research also involves teachers as active participants in the educational process that assists them to improve their critical and reflective thinking for their own instructional improvement processes, with their learners and colleagues.
This study used action research as the research methodology where by the five areas of change where implemented and learners’ reaction were collected through discussions, learners’ journals and interviews to restructure instruction on an ongoing basis. Thus, changes to areas of teaching that are recommended for learner-centered
teaching (classroom power sharing, role of the teacher, contents, learner, and assessment) were changed and reflected on. Using spiraling cycles of reflecting, planning, and acting, data was collected for active reflection through journal writing. FINDINGS The syllabus is one of the first points of contact between a teacher and students. This study found that in setting the appropriate tone for the course, teachers may benefit in showing the learners how they care about their learning, and share the humane and warm learning environment that the teacher intends to have. By incorporating the language of LCT into the syllabus, students would be able to see the type of classroom experiences they could expect. Building positive student-teacher relationships was found to help students feel cared for, respected, and appreciated as individuals. Showing students that they belonged and that the learning environment was safe goes a long way in improving learning. This may be accomplished by fostering a personal and caring relationship with each student. In creating caring relationships, teachers help students become connected to the academic environment.
Human beings feel good about themselves when they are appreciated and are recognized for their efforts. Students respond well to positive reinforcement, especially when it is for doing something right. Psychologists state that people react well when positive things are said about them [4]. Complementing a student for just trying often goes a long way towards encouraging future participation. I always tried to be positive with students, even when they were wrong. Appreciating and accommodating individual developmental differences is very important to student learning. I tried to adjust my teaching style in order to meet the educational needs of my students I did this, by focusing my attention on learning the students’ names, where they come from, and what their future goals are. I adjusted assignments whenever students showed a lack of understanding. I also encouraged students to work in study groups, and to use peers as tutors.
CONCLUSION
The implementation of learner-centered teaching principles perspective may be made with learner resistance initially, but will yield better result as learners are given control of their learning and take more responsibilities for their learning. Teachers need to realize that current and future students are not socialized in the same way most of the current teachers were socialized when they were students
March 27th, 2009
Sponsors: Stäubli, Spartanburg Regional Healthcare System, EPSCoR/IDeA RS grant. 141
themselves. Colleges and Universities are currently competing for a small pool of students. Unless, teachers are able to improve their teaching on the students’ terms, they will lose them to other subject disciplines or all together to other colleges. It is just like a business which does not give good customer service, is likely to lose its customers to competing businesses.
ACKNOWLEDGEMENTS It could have not been possible for this study to be conducted if it were not with the support given by the President, Spartanburg Methodist College, Dr. Charles Teague, and the Vice President Academic Affair; Dr. Ann Bowles. I sincerely thank them for allowing me to conduct this research in the institution, and any encouragements that they regularly accorded me.
REFERENCES
[1] H. S. Furhman, & A. Odden. “A Kappan
Special Section on School Reform: introduction.” Phi Delta Kappan, September 2001, 83(1), 59-61.
[2] M. Taylor. “Generation NeXt Comes to College Understanding, Teaching and Serving Today's Students”, http://www.taylorprograms.org.
[3] APA. Work Group of the Board of Educational Affairs. (1997, November). “Learner-centered psychological principles: A framework for school reform and redesign”. Washington, DC: American Psychological Association.
[4] B. L. McCombs, and J. S. Whisler. “The learner-centered classroom and school: Strategies for increasing student motivation and achievement”. San Francisco: Jossey-Bass, 1997.
[5] A. W. Chickering, and Z. F. Gamson. “Seven principles for good practice in undergraduate Education”. AAHE, Bulletin, 39(7), 3-7, 1987.
[6] M. G. Weimer . “Learner-centered teaching: Five key changes to practice”. San Francisco: Jossey-Bass, 2002.
Fifth Annual SC Upstate Research Symposium
142 Sponsors: Stäubli, Spartanburg Regional Healthcare System, EPSCoR/IDeA RS grant.
The Peer Mentoring Program: A Pilot Program for the USC Upstate School of Education
Daphne Dawson and Tina Herzberg School of Education
University of South Carolina Upstate 800 University Way, Spartanburg, SC 29303
[email protected], [email protected]
Abstract — Over the last three previous years, approximately 30% of freshman at USC Upstate who had declared education as their major did not return for their sophomore year. Thus, in an effort to increase student retention, the Peer Mentoring Program was designed to ease the transition to college by providing freshman with a connection to the School of Education through routine contact with an assigned upperclassmen mentor. When freshmen become involved in the School of Education early, it is hoped that more students will be retained to the third semester, be accepted to the Professional Program, and graduate with a degree in education. Although it is too early in the program to determine if student retention will be positively impacted by the program, feedback from the mentors and freshmen has been positive. KEYWORDS – freshmen, higher education, college students, mentoring, success in college
INTRODUCTION
The transition to college is sometimes difficult for students. When freshmen initially arrive at a college campus, they are confronted with numerous changes ranging from adapting to new living spaces and social networks to increased academic and financial pressures. Additionally, many freshmen are young adults who are still developing their identity and determining how to manage the total rearrangement of their personal environment. These contexts do not exist in static isolation; instead they are constantly changing. Students are affected by their previous experiences as well as the current decisions they are making. Likewise, these individuals are influenced by the new world that surrounds them. An excellent representation of these complex relationships is Urie Bronfenbrenner’s ecological systems theory.
This system illustrates the interdependent relationship between an individual and his environment by forming concentric circles around the student. In the center is the microsystem which consists of individual activities and bidirectional, reciprocal interactions with others in the student’s immediate environment. When freshmen begin college, the microsystem is temporarily disrupted. It takes time to build new relationships and adjust to the new activities such as living in a dormitory
and studying for college exams. The mesosystem represents the connections between the settings in which the student operates. For many freshmen, it is their first time living away from home and family, and they become homesick. Others must learn to balance social and study time while others search for part time jobs that will accommodate their school schedules. Social networks such as church, school and work that can either positively or negatively impact a student’s collegiate experience are the components of the exosystem. For some students, participating in a school club or organization helps the student feel connected to the university and opens the doors to positive friendships. In contrast, work or family demands may force the student into making a difficult decision between work and school. The outermost circle is the macrosystem which consists of society’s social climate, attitudes, programs and laws along with the student’s cultural values and customs. Many college students could not continue their education without financial aid, affordable housing, safe neighborhoods, and health care. For example, when students do not meet the performance guidelines for federal grants, state assistance, and/or scholarships, funding may be withheld and the students’ ability to continue to seek a college degree is affected. Cultural values also play a significant role in the level of education attained and which jobs are customary for particular ethnicities or sexes [1].
For many students, the shift to a college environment is a sudden and sometimes overwhelming transition that can result in the breakdown of this ecological system on every level. To assist freshmen with the process of rebuilding the environment, the Peer Mentoring Program was initiated in the fall of 2008. As students develop new personal routines and relationships with their professors, fellow college students, and roommates, a Peer Mentor is available to field questions and ease concerns. Brandon Craig, a freshman majoring in early childhood education, was glad to make personal contact with faculty members in the School of Education through the Peer Mentoring Program. “I learned how to get help from the teachers and that if you're struggling go talk to that teacher outside of class.” Peer
March 27th, 2009
Sponsors: Stäubli, Spartanburg Regional Healthcare System, EPSCoR/IDeA RS grant. 143
Mentors can also introduce freshmen to campus life, campus resources, and the local community.
Peer mentoring can provide support for freshmen as they rebuild their personal and social environments. When support is not adequate, there is a possibility that students will drop out within the first few weeks of school, engage in risky behavior that can lead to an unsatisfying college experience or worse yet, have poor academic performance that may result in them leaving school. Conversely, when there is a positive influence like a peer mentor, freshmen can build a connection with the university, discover their sense of identity, and increase their confidence which directly affects their attitude towards school and life.
METHODS AND RESULTS Once a freshman attends a registration session, they are assigned a Peer Mentor by the coordinator of the program. Every effort is made to match the freshman’s and mentor’s major. This year, each peer mentor initially made contact via email with their assigned freshmen the second week of the fall semester. Once a week, the peer mentors email their freshmen. The content of the emails varies and includes antidotes from student teaching, registration reminders, teaching jokes, and thoughtful, reflective stories. During the fall semester, two Freshman Mixers were held in the School of Education complex and in the spring the program will sponsor Movie Night. These events are designed so that the freshmen can meet their mentor and faculty members as well as foster a sense of community among education majors.
Eighty eight freshmen enrolled as education majors in the fall of 2008. At the beginning of October, the mentors were surveyed to determine how many return emails they had received from the freshmen. Of the 88 freshmen, 34% had emailed their mentors between one and four times, 8% had emailed their mentors between five and nine times, and nearly 7% had emailed their mentors more than 10 times.
CONCLUSION/REFLECTION
It is the philosophy of the USC Upstate School of Education to prepare teachers who are reflective practitioners and professionals. Therefore it is imperative to reflect on the program from the perspective of its leaders and consider some of the most important lessons learned. Using a variety of approaches to recruit upperclassmen mentors and instituting required training for mentors were effective. Mentors were recruited during meetings,
recommendations of School of Education faculty and via the departmental student newsletter. On the other hand, the recruiting process should have been initiated earlier so it could have been completed before the end of the spring semester. Beginning earlier will ensure that the freshmen are matched to their mentor as early as possible and initial contact can be made over the summer. Program leaders are also considering measures such as having mentors register for one credit hour of service learning through the School of Education so the mentors can be held accountable for their work with the freshmen. In addition, the program will have a freshman meeting the first week of school where the freshmen will be able to meet advisors and their mentors.
University officials are hopeful that this program will assist freshman navigate the new territory of college life successfully and lead to improved student retention. “The School of Education is very excited about the potential of this program,” said Dr. Charles Love, dean of the School of Education at USC Upstate. “By building connections with freshmen during their first semester at USC Upstate, we believe that more students will be successful in their studies, be accepted into the Professional Program, and ultimately join the teaching field.”
During the first semester of the program, there were small victories with freshmen. After sending a weekly email to her assigned freshmen, one mentor received a reply that indicated the freshman was “bummed” about having to drop Biology 110. The very next day, the mentor sent her a note that read, “Don't be bummed out over dropping a class... especially if it's Biology. We all have to drop classes at some point. My first one was…Physics.” In addition to this encouragement, this email also contained information about tutoring and Supplemental Instruction available at USC Upstate. Every freshman is worth saving.
While in this program, peer mentors are allowed to use their service to the Peer Mentoring Program as evidence of meeting the standard related to fulfilling professional responsibilities but more importantly they grow as educators. Recently, the mentors were asked what they have learned from this experience. One mentor responded that, “…I began reflecting on the things that I have been through during my fours years of college. I realized how far I have come and how proud of myself I should be. I know that I have a lot to offer my future students…” She is becoming the teacher that she was trained to be. Reflective mentors make great teachers.

Fifth Annual SC Upstate Research Symposium
144 Sponsors: Stäubli, Spartanburg Regional Healthcare System, EPSCoR/IDeA RS grant.
ACKNOWLEDGEMENTS
This program would not have been possible without the support of many great educators at USC Upstate. First and foremost, we would like to thank Dr. Love, Dean of the School of Education, for his support and his staff who assisted with administrative functions. Dr. Hinton and the TEACh organization played a key role in recruiting mentors, and we appreciate your support. We are also indebted to the First Assistant Coordinator, Kevin Hand, who did a fantastic job training the mentors and the Second Assistant Coordinator, Jessica Hammond, who stood at the helm this spring semester. And, last but not least, we would like to recognize the mentors who made it all possible. They are the ones who brought this program to life, who believe in its mission, and whose effort is practically impossible to measure. Thank you all for a terrific first year.
REFERENCES
[1] L. Berk. “Development through theLlifespan” (4rd Ed), Allyn and Bacon, 2007.
March 27th, 2009
Sponsors: Stäubli, Spartanburg Regional Healthcare System, EPSCoR/IDeA RS grant. 145
A Study in Cooperative Group Learning Styles at Spartanburg Community College
William K. Gelders Biology Department
Spartanburg Community College Spartanburg, SC 29305
[email protected] Abstract — Most current college communities exhibit a competitive or individualistic interaction between students that does not adequately promote the environment necessary to enhance overall learning in student populations. Instruction is for the most part currently deductive-style lectures, despite overwhelming evidence that shows cooperative based learning group-work has resulted in significantly increased student comprehension and long-term retention of required material. In addition, studies also indicate the better a student’s knowledge of their own learning styles and personal typology the better chance the student has to learn and succeed in their personal career goals as well as in life’s problems and relationships.
This article presents a current retention problem faced at Spartanburg Community College in pre-nursing students and reviews the literature on techniques that could possibly enhance learning styles in hopes of decreasing attrition and increasing long-term success. To address this, an experiment has been developed and implemented that could hopefully allow students to improve their overall performance in college. Finally the setup and initiation of the experiment is briefly presented which will introduce cooperative learning as a class technique. The data is currently being collected. Keywords — Cooperative learning, typology, learning styles
INTRODUCTION
Instructors today commonly present their course material in a lecture-style deductive manner – fundamental principles to experimentation and application – which only addresses certain students’ styles of perception and processing of information. As attrition rates remain high, it seems that many students simply do not understand how to approach the overwhelming amount of new material and/or how to adequately learn and process that information. In an attempt to understand these issues, instructors must explore alternatives that allow more students to learn and utilize techniques than will allow them to succeed.
Retention data at Spartanburg Community College of Associate Degree programs from 2003 to 2005 in Arts & Sciences seem to be relatively
constant at approximately 48 to 51%. [1] My personal withdrawal/failure rate has varied from 46 to 73 percent in A&P courses, which is not statistically significant considering the small number of students.
Studies have shown that how well students learn can be a result of innate ability, prior preparation and “the compatibility of his or her learning style and the instructor’s teaching style” [2, p 674]. Mismatches inhibit success and other studies indicate the better the instructor understands student differences the better they can meet the “diverse learning needs of all their students” [3, p. 57]. “Instruction designed to address a broad spectrum of learning styles has consistently proved to be more effective than traditional instruction” [3, p. 59], which the authors consider a deductive style lecture-based format. Their studies have shown that inductive instruction “whether it be called problem-based, discovery learning, inquiry learning” [4, p. 1] appears to be more successful in teaching engineering students than does the commonly used deductive instruction.
Personality types and learning styles have been intensely studied for years by numerous authors. A 20th century psychoanalyst Carl Jung felt people “were born with a predisposition to certain personality preferences” [5, p. 281]. He and a student of his, Katherine Briggs and her daughter, Isabel Myers classified sixteen personality types based on observed preferences people have in their source of energy, gathering information, decision making, and life-style orientation of the world around them. An individual falls on a continuum within each, but expresses dominant traits measured by testing that can help both the teacher and student better understand an individual’s behavior as the profiles have been published and made readily available.
Richard Felder at North Carolina State and Linda Silverman, an educational psychologist in Denver, in the late 20th century developed a model that divided students into sixteen major groups based on the different ways students “receive and process information.” [2, p 674]. They divided students based on the type of information they
Fifth Annual SC Upstate Research Symposium
146 Sponsors: Stäubli, Spartanburg Regional Healthcare System, EPSCoR/IDeA RS grant.
preferentially perceive, the sensory technique most effective, the way they process, and the way they move towards understanding the information. [2, p 60] Most current deductive-based instruction addresses only certain learning styles, though students studied fell on a continuum within the four categories. Their results indicated a large number of students were not being taught using the best instruction techniques for their learning style. They wanted to increase success in engineering and have addressed the diversity of learning styles within their own classes. They feel instructors must educate students about “their possible strengths and weaknesses and indicate ways they might improve their academic performance” [3, p. 62].
There are three ways students interact within the classroom and college. These ways include competing to see who is best, working as an individual without paying attention to others, and cooperatively “with a vested interest in each other's learning as well as their own” [6, p. 1] . Competition is the most prevalent today, even though over 600 studies in the last 100 years conducted with diverse populations including many academic subject areas have all demonstrated, “the more one works in cooperative learning groups, the more the person learns, the better he understands what he is learning, the easier it is to remember what he learns, and the better he feels about himself, the class, and his classmates.” [7, p. 4]
Cooperative learning techniques involve using small groups of students working together to optimize their own learning style and reinforcing the learning styles of others. Three types include formal learning groups, informal learning groups, and base groups. Formal groups last for one to many class periods to complete a specific task or assignment. Informal are temporary ad hoc groups that last for a single discussion for one period. Base groups are long-term with stable membership “whose primary responsibility is to provide each student the support, encouragement, and assistance needed to progress academically.” [7, p. 3-4] These groups remain together during the entire course.
To be a functioning cooperative group “a group must have clear positive interdependence, members must promote each other’s learning and success face to face, hold each other personally and individually accountable to do his or her fair share of the work, use appropriately the interpersonal and small group skills needed for cooperative effects to be successful, and process as a group how effectively members are working together.” [7, p.3]
No one-size fits-all approach to learning has been successful for all student populations, nor can it be. But adjustments can be made in our approach to meet the needs of a broader range of students that could hopefully improve their retention and overall success in their career-oriented goals. Students working cooperatively is important not only in the classroom, but is
“the keystone to building and maintaining stable marriages, families, careers, and friendships. Being able to perform technical skills, such as reading, speaking, listening, writing, computing, and problem solving, are valuable but of little use if the person cannot apply those skills in cooperative interaction with other people in career, family, and community environments. The most logical way to emphasize the use of students' knowledge and skills within a cooperative framework, such as they will meet as members of society, is to spend much of the time learning those skills in cooperative relationships with each other. We need to get back to the basics, reconcile school practices with current research, and encourage that a healthy portion of instruction is cooperative.” [6, p7].
EXPERIMENT
My hypothesis is that educating students on their unique personality type and learning styles and use cooperative base-group instructor-guided learning techniques in pre-Anatomy and Physiology courses, I will be able to improve retention and ultimately successful completion of the pre-nursing and nursing curriculum. My hope is to identify individual strengths and weaknesses and educate students so they have a better self-awareness of their personality traits and are able to develop study techniques that enhance retention of information. I also plan to introduce and use cooperative base-group techniques so students can harvest their own strengths.
The instructor will direct, encourage, and engage students in the corporative team-learning techniques and will work to increase interest and excitement in the course material and help ensure a better and clearer understanding of that material. The students will be engaged in self-teaching techniques that will focus on diversity and interdependence through team-oriented goals projects.
March 27th, 2009
Sponsors: Stäubli, Spartanburg Regional Healthcare System, EPSCoR/IDeA RS grant. 147
All students take the Myers-Briggs Type Indicator [8] and the Index of Learning Style Questionnaire [9] and the results are printed for the instructor and student [10, different types] to increase self-awareness and to allow the instructor to assign base-groups in each class based on student diversity. Once assigned, objectives will be presented to each group and they will be allowed time to learn the objectives in and out of class. Each group will be assigned a checker to ensure group comprehension of information. When completed, base-groups will be randomly divided to allow simultaneous explaining to all class members within second groups. Once the information is exchanged, the base groups will reform and conduct a summation presentation for the entire class. Finally, individual examinations will be given and time allowed for evaluation and reflection of the previous group work. All communication will be positive and groups will be individually rewarded depending on the combined performance of all members. The same will occur for successful overall class performance.
When the semester is drawing to a close, information will be presented to the classes using the commonly deductive-based PowerPoint lecture approach. Base groups will be allowed to meet and learn together before being given individual examinations on the information.
The experiment was instituted beginning in January 2009. Data is being collected and adjustments are being made as necessary, using suggestions from previous studies, in hopes of guiding the classes to a successful cooperative learning experience.
CONCLUSION
The fifty-six students enrolled in the four courses show a great diversity in typology, learning styles, and overall background. The groups are beginning to understand the corporative learning techniques and are for the most part responding positively and seem to be making progress at varying rates in the different classes. However, the experiment remains in its early stages and the results of the first lecture test are not yet available at the writing of this initial summary. Final data collection will not only require a student’s success in this class, but in the subsequent classes that follow with different instructors using different teaching techniques.
REFERENCES
[1] Spartanburg Community College Institutional Research Reports and Results, Spartanburg
Community College, Retrieved from http://www.sccsc.edu/IR/, December 8th, 2008
[2] Felder, R, and Silverman, L., “Learning and Teaching Styles in Engineering Education, Journal of Engineering Education, Vol 76, No 7 1988, pp 674-681.
[3] Felder, R., and Brent, R., “Understanding Student Differences”, Journal of Engineering Education, Vol. 94, No. 1 2005, pp 57-72.
[4] Felder, R., Authors preface – June 2002 to “Learning and Teaching Styles in Engineering Education, Journal of Engineering Education, Vol 76, No 7 1988, pp 674-681.
[5] Kroeger, O and Thuesen, J, Type Talk: The 16 Personality Types That Determine How We Live, Love and Work, 1988. Dell Publishing, New York, NY.
[6] Johnson, R.T. and Johnson D.W.; An Overview of Cooperative Learning, 1994. Creativity and Collaborative Learning; Brookes Press, Baltimore MD. Retrieved December 24, 2008 from: http://www.co-operation.org/pages/overviewpaper.html.
[7] Johnson, David W., Cooperative Learning: Increasing College Faculty Instructional Productivity. Eric Digest. Eric Clearing house on Higher Education, Washington, D.C. 1992.
[8] 1998-2008 Humanmetrics.com , Retrieved December 8, 2008 from: http://www.humanmetrics.com/cgi-win/JTypes1.htm
[9] Soloman, B and Felder, R., Index of Learning Styles Questionnaire. Retrieved December 8, 2008 from: http://www.engr.ncsu.edu/learningstyles/ilsweb.html
[10] 1998-2006 BSM Consulting, The Personality Page, Retrieved Personality Types and Careers from http://www.personalitypage.com/home.html and other pages of same website.
Fifth Annual SC Upstate Research Symposium
148 Sponsors: Stäubli, Spartanburg Regional Healthcare System, EPSCoR/IDeA RS grant.
Assessment Beliefs and Practices of South Carolina Teachers Sharon A. Feaster-Lewis
Department of Education Southern Wesleyan University PO Box 1020 Central SC 29630
Christopher Burkett Assistant Director, M. Ed. in Divergent Learning
Assistant Professor of Education Columbia College
Columbia SC [email protected]
Abstract — The purpose of this survey was to investigate the assessment beliefs and practices of practicing South Carolina teachers who were or had recently been enrolled in graduate education courses or the Program of Alternative Certification for Educators (PACE). This study sheds light on what student grades actually represent, and whether it is appropriate to compare grades across teachers, schools, or districts. The survey questioned respondents about beliefs and practices related to non-academic factors which may play a role in determining an academic grade. Data revealed that teachers hold varying views of what assessment beliefs and practices they believe are appropriate. These results showed there are differences in the assessment practices of traditionally-trained teachers and alternatively-trained teachers. Data also revealed mixed opinions about whether an individual campus or the district as a whole should enforce consistent assessment beliefs and practices by teachers. Data from the written comments illuminated the variety of disagreement in assessment beliefs and practices among teachers. Keywords — student assessment, teacher practices
INTRODUCTION Teachers informally describe a wide variety of beliefs and practices related to student assessment and determination of grades. Experiences and conversations with PK-12 teachers (and their students) indicate that teachers sometimes “give” one or two points to a student who is on the border between two letter grades to boost the grade to the next level (e.g., D to a C). This “gift” is usually provided for students who have “tried hard,” “done their best,” or “put a lot of effort” into their work. Some teachers provide “extra credit” work for students to help them boost their letter grade to the next level, especially if the boost is from an F to a D.
The purpose of this survey was to investigate the assessment beliefs and practices of practicing South Carolina teachers who were or had recently been enrolled in graduate education courses or the Program of Alternative Certification for Educators (PACE). The survey questioned respondents about beliefs and practices related to non-academic factors which may play a role in determining an academic grade.
There is a need to determine whether assessment beliefs and practices are widely held and consistent across teachers. Results will have implications for decision-makers regarding comparison of students grades across teachers, schools, and districts, e.g., is an “A” for Mr. Jones the same as an “A” for Ms. Rodriguez, is a GPA from one school equal in weight to a GPA from another school? Results will also relate to the question of exactly what a final grade of “A” represents – is it clearly representative of mastery of state and national content standards, or is it “flavored” with the effects of effort and behavior?
RESEARCH QUESTIONS 1. What are current teachers’ beliefs and practices related to grading, including: factors teachers use in determining student grades, practices relating to work submitted late, practices relating to allowing students to resubmit work for a better grade, the effect of effort on grades, the effect of behavior on grades, the role of peer ratings on grades, and the role of the school and district in addressing teacher assessment attitudes and beliefs. 2. Do teachers’ stated beliefs agreed with their stated practices? 3. Do assessment beliefs and practices differ between traditionally- and alternatively-certified teachers?
DEFINITIONS “Traditionally-certified” means teachers who have completed an approved education program from an accredited college or university. “Alternatively-certified” means teachers who have completed the South Carolina PACE (Program for Alternative Certification of Teachers) program.
REVIEW OF THE LITERATURE The idea for this study developed from an article entitled “Ethics in Classroom Assessment Practices: Issues and Attitudes,”[1]. Their ethics
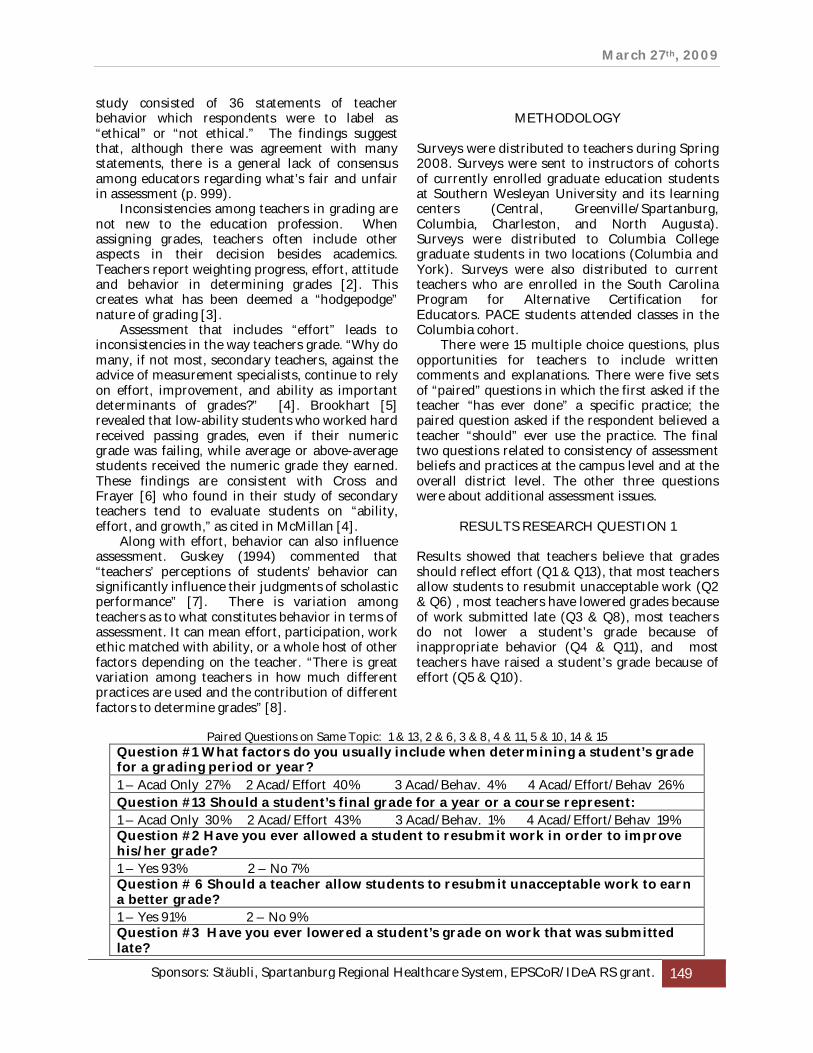
March 27th, 2009
Sponsors: Stäubli, Spartanburg Regional Healthcare System, EPSCoR/IDeA RS grant. 149
study consisted of 36 statements of teacher behavior which respondents were to label as “ethical” or “not ethical.” The findings suggest that, although there was agreement with many statements, there is a general lack of consensus among educators regarding what’s fair and unfair in assessment (p. 999).
Inconsistencies among teachers in grading are not new to the education profession. When assigning grades, teachers often include other aspects in their decision besides academics. Teachers report weighting progress, effort, attitude and behavior in determining grades [2]. This creates what has been deemed a “hodgepodge” nature of grading [3].
Assessment that includes “effort” leads to inconsistencies in the way teachers grade. “Why do many, if not most, secondary teachers, against the advice of measurement specialists, continue to rely on effort, improvement, and ability as important determinants of grades?” [4]. Brookhart [5] revealed that low-ability students who worked hard received passing grades, even if their numeric grade was failing, while average or above-average students received the numeric grade they earned. These findings are consistent with Cross and Frayer [6] who found in their study of secondary teachers tend to evaluate students on “ability, effort, and growth,” as cited in McMillan [4].
Along with effort, behavior can also influence assessment. Guskey (1994) commented that “teachers’ perceptions of students’ behavior can significantly influence their judgments of scholastic performance” [7]. There is variation among teachers as to what constitutes behavior in terms of assessment. It can mean effort, participation, work ethic matched with ability, or a whole host of other factors depending on the teacher. “There is great variation among teachers in how much different practices are used and the contribution of different factors to determine grades” [8].
METHODOLOGY
Surveys were distributed to teachers during Spring 2008. Surveys were sent to instructors of cohorts of currently enrolled graduate education students at Southern Wesleyan University and its learning centers (Central, Greenville/Spartanburg, Columbia, Charleston, and North Augusta). Surveys were distributed to Columbia College graduate students in two locations (Columbia and York). Surveys were also distributed to current teachers who are enrolled in the South Carolina Program for Alternative Certification for Educators. PACE students attended classes in the Columbia cohort.
There were 15 multiple choice questions, plus opportunities for teachers to include written comments and explanations. There were five sets of “paired” questions in which the first asked if the teacher “has ever done” a specific practice; the paired question asked if the respondent believed a teacher “should” ever use the practice. The final two questions related to consistency of assessment beliefs and practices at the campus level and at the overall district level. The other three questions were about additional assessment issues.
RESULTS RESEARCH QUESTION 1
Results showed that teachers believe that grades should reflect effort (Q1 & Q13), that most teachers allow students to resubmit unacceptable work (Q2 & Q6) , most teachers have lowered grades because of work submitted late (Q3 & Q8), most teachers do not lower a student’s grade because of inappropriate behavior (Q4 & Q11), and most teachers have raised a student’s grade because of effort (Q5 & Q10).
Paired Questions on Same Topic: 1 & 13, 2 & 6, 3 & 8, 4 & 11, 5 & 10, 14 & 15
Question #1 What factors do you usually include when determining a student’s grade for a grading period or year? 1 – Acad Only 27% 2 Acad/Effort 40% 3 Acad/Behav. 4% 4 Acad/Effort/Behav 26% Question #13 Should a student’s final grade for a year or a course represent: 1 – Acad Only 30% 2 Acad/Effort 43% 3 Acad/Behav. 1% 4 Acad/Effort/Behav 19% Question #2 Have you ever allowed a student to resubmit work in order to improve his/her grade? 1 – Yes 93% 2 – No 7% Question # 6 Should a teacher allow students to resubmit unacceptable work to earn a better grade? 1 – Yes 91% 2 – No 9% Question #3 Have you ever lowered a student’s grade on work that was submitted late?

Fifth Annual SC Upstate Research Symposium
150 Sponsors: Stäubli, Spartanburg Regional Healthcare System, EPSCoR/IDeA RS grant.
1 – Yes 67% 2 – No 32% Question # 8 Should a teacher lower a student’s grade on work that he or she submits late? 1 – Yes 52% 2 – No 12% Question #4 Have you ever lowered a student’s grade for a grading period or the year because of inappropriate behavior? 1 – Yes 11% 2 – No 88% Question #11 For students who are on the border between two letter grades, should behavior be considered in determining the student’s final grade for a grading period or the year? 1 – Yes 19% 2 – No 79% Question #5 – Have you ever raised a student’s grade for a grading period or the year because he/she put forth good or extra effort? 1 – Yes 91% 2 – No 8% Question #10 – For students who are on the border between two letter grades, should effort be considered in determining the students final grade for a grading period or the year? 1 – Yes 80% 2 – No 19%
RESULTS RESEARCH QUESTIONS 2 and 3
Results indicate that most teachers within their survey group are consistent between their beliefs and practices, as indicated by consistency of answers to the paired questions. The lowest level of consistency for both groups was Q1 and Q13, followed by Q3 and Q8.
Results between survey groups indicated a large difference for answers to Q1 and Q 13.
Quest. Pairs
Q1 & Q13
Q2 & Q6
Q3 & Q8
Q4 & Q11
Q5 & Q10
Q14 & Q15
Traditional
35.8
89.9
48.9
80.1
75.9
83.9
Alternative
64.5
89.7
58.1 76.9
83.7
79.8
CONCLUSIONS
Individual teachers are not always consistent in their assessment beliefs and practices. There is no clear-cut agreement on what factors should or should not be included in academic grades. Assessment beliefs and practices differ across the state and across certification routes. There is a need for statewide discussion about what constitutes “fair” assessment practices in a classroom. There is a need for discussion about whether all teachers in a school (or in a district) should use the same factors in determining academic grades.
There is a need for discussion about what role teacher preparation programs have in teaching pre-service candidates about assessment practices.
REFERENCES
[1] Green, C., Johnson, R., Kim, D., & Pope, N. (2006). Ethics in classroom assessment practices: Issues and Attitudes. Teaching and Teacher Education, (23), 999-1011.
[2] Boston, C. (2003). High school report cards. (ERIC Document Reproduction Services, No. ED481815; Brookhart, S. (1994). Teachers grading: Practice and Theory. Applied Measurement in Education, 7, (4), 279-301; Cross, L. & Frayer, R. (1999). “Hodgepodge grading: Endorsed by students and teachers alike.” Applied Measurement in Education, 12, (1), 55-72.
[3] Brookhart, S. (1991). Grading practices and validity. Educational Measurement: Issues and Practice, 10, 35-36; Truog, A.& Friedman, S. (1996, April). Evaluating high school teachers’ written grading policies. Presented at the annual meeting of the National Council on Measurement in Education, NY
[4] McMillan, J. (2001). Secondary teachers’ classroom assessment and grading practices. Educational Measurements: Issues and Practices, 20, (1), 20-33.
[5] McMillan, J., Myran, S., & Workman, D. (2002). Elementary teachers’ classroom assessment and grading practices. The Journal of Educational Research, 95, (4), 203-213.
[6] Cross, L. & Frayer, R. (1999). “Hodgepodge grading: Endorsed by students and teachers alike.” Applied Measurement in Education, 12, (1), 55-72.
[7] Guskey, T. (1994). Making the grade: What benefits students? Educational Leadership, 52, 15-20.
[8] MERC ( n.d.). Teachers’ classroom assessment and grading practices: Phase 1. Retrieved March, 19, 2008, from http://www.soe.vcu.edu/merc/briefs/brief38_grading_assess_pl.htm.
March 27th, 2009
Sponsors: Stäubli, Spartanburg Regional Healthcare System, EPSCoR/IDeA RS grant. 151
Audiation: the Musical Key to a Magical Life Jarrod Haning
Petrie School of Music Converse College
580 E Main St., Spartanburg SC 29302 [email protected]
Abstract - Many people can recall a time in their life when listening to music put them in a peak emotional state. These states are often described as feeling “inspired” or “fully alive.” The process that governs our emotional experience with music is also available to influence our other experiences in life. Uncovering this phenomenon and applying it to the interactions of our daily life is the key to experiencing a quality of life that many people only dream about. Keywords — Music, Audiation, Life, Experience
THE MAGIC OF MUSIC Imagine leaving work one day after a very stressful and frustrating conversation. As you start your car to drive home, the radio is already on. Just when you begin to drive off you hear the opening lines to one of your favorite songs in the whole world. It is the song that carried you through all the tough times in high school. It is the song that represents all the wonderful moments with your friends. It is the song that has always put you in a peak state no matter how bad your day was going. And just like clockwork, the stress of your day vanishes within a few notes of this song and you find yourself in a peak emotional state. This emotional state is more than just happiness or being stress free. This emotional state is empowering.
Recall the last time you experienced a similar state of elation as the result of some music you were listening to. In that state did you feel more alive? Would you say you were more creative? Did you feel more confident? While feeling these things, what was the quality of your workmanship? How do conversations go with friends and family when you are in that peak state?
Music has an almost magical influence on our emotions. In one minute your emotional state can shift from frustrated to euphoric. This shift is reliable and predictable. What if you could create this mysterious effect on purpose, whenever you wanted? What would your life be like? What might you accomplish?
THE MYSTERY OF LISTENING Edwin Gordon from the University of South Carolina coined a term to describe the workings of our brain while we are listening to music [1]. According to the term audiation, three things are
happening simultaneously while our brain is processing musical stimuli. At any given moment we are 1) recalling what we have just heard 2) comparing it to what we are currently hearing 3) forming an expectation of what we are going to hear next.
Comparing what we just heard with what we are hearing begins to give us insight into why music affects us the way it does. The past sets up the present. What you have just heard creates a context what for you are currently hearing. A single note is meaningless if played alone. However, the same note played after the hearing of a series of notes can be the crown jewel. Comparing what we have “heard” with what we are “hearing” is only a small part of the equation that governs our experience with music. The most important element is what we are expecting to hear next.
THE SURPRISING TRUTH The note we expect to hear next almost completely controls our immediate emotional state. On the surface this might seem silly. How can a note we haven’t even heard make us feel anything? Shouldn’t what we are actually hearing have the biggest influence? This is one of the great mysteries of music and life. It is like asking the question “why should my thoughts about tomorrow affect my feelings about today?”
When you are familiar with a piece of music, then you are expecting to hear certain things. You could have a favorite passage, section, or even a favorite note. While you are anticipating the arrival of your favorite section, your emotional state begins to change before your favorite section arrives.
If you have heard a group of musicians before, then you have formed a set of expectations on how they will perform. If the group consistently botches your favorite solo, then right before the solo arrives you start to wince in dreadful expectation. If you have heard a soloist before who consistently delivers the perfect note at the perfect time, you also bring that expectation into your current listening. Right before the perfect note is played, you relax and allow yourself to feel a bit of elation. What you think is going to happen causes

Fifth Annual SC Upstate Research Symposium
152 Sponsors: Stäubli, Spartanburg Regional Healthcare System, EPSCoR/IDeA RS grant.
you to feel a certain way before anything actually happens.
Even when listening to a piece of music for the first time you are still formulating expectations of how the piece will unfold. In the first couple of moments you are comparing the few notes you have just heard with the notes you are currently hearing. Based on this comparison you create an expectation of what you are going to hear next.
This third element, what you expect to hear, explains why a song still affects us the way it does even after hearing it a hundred times. We love knowing what is about to happen. It also explains how we can instantly fall in love with a song even when hearing it for the first time. We love pleasant surprises that fit with our expectations. But how does this musical concept affect our quality of life in other areas?
THE DIFFERENCE IT MAKES Imagine you have just had a car wreck and you are still sitting in the car when someone asks “how are you feeling right now?” Before you answer, remember that what has just happened and what is happening now is not the determining factor in how you are feeling. The determining factor is what you expect to happen next. If you are feeling pretty irritable, then you need to look at the events that you are expecting to happen next.
If based on your past experience with cars you know that mechanics are a hassle to deal with and charge a lot of money, then you might be expecting troublesome expenses in your near future. If based on your past experiences with insurance carriers and court cases you know that you have a 50% chance of your insurance company fixing your car, then your expectations for what is coming next are going to be pretty grim.
Sitting in a car that has just been in a wreck doesn’t make you feel anything. This bears repeating, what you are expecting to happen in the near future will determine how you are feeling right now.
Have you ever heard of someone who had a car wreck, met the love of their life, married into wealth, and lived happily ever after? Sure you have. Now, how would you feel if they were sitting in a car that had just been hit, but you were expecting that somehow this would result in meeting the love of your life, gaining access to a pile of money, and ending up 10x happier than you have ever been before?
THE OPPORTUNITY FOR YOU Pick an area in life (golf, family, work) and note your past experiences in that area. Now take time to note your current emotional experiences in that
area. How are you feeling right now? How you are feeling right now is an indication of what you are expecting to happen next. Are you expecting things to keep on going like they have been? Are you expecting things to be difficult for awhile? Are you hoping for a miraculous change?
Getting a handle on what you have put in your future takes all of the mystery out of how you are feeling today. Once you are able to see that you have really “put” expectations in your future, then you are able to create the life you have always wanted. This time your daily experiences will be by design and not by happenstance.
Here is a list of 4 questions designed to act as primer for creating the life you truly desire. Start with a blank card and “put” the answers to these questions in your future as things you are expecting to happen. Think of the blank card as representing your future from the standpoint of “anything is possible.”
1. What is something that would make a huge difference in your present state? A windfall blessing (i.e. a big raise at work, being debt free, being healed from a nagging ailment)
2. What is something that would stretch you as a person? (i.e. going from $100,000 in yearly sales to $5 million, going from store manager to CEO, becoming a role model for the other marriages in your neighborhood)
3. What is something that would represent the highest and best use of your life? (i.e. writing a book, taking a mission trip, starting a business, taking an audition)
4. What is something that would leave a legacy for others to follow? (i.e. seeing your grandkids live inspiring lives that impact the world because of the role model you were for your kids, knowing the children of your employees are experiencing meaningful dinner table conversations because of the difference you have made in their parents lives)
If these things were in your future, how would you feel today? Would you be feeling inspired? Would you feel empowered to “take on” some big things in life? Would you feel courageous? As a result of these feelings, what kind of actions would you take today? As a result of those actions, what kind of a future would you be experiencing? You see, there is nothing on that list that you can’t influence and bring into your life.
March 27th, 2009
Sponsors: Stäubli, Spartanburg Regional Healthcare System, EPSCoR/IDeA RS grant. 153
THE PROVEN RESULTS Probably one of the most famous examples of this principle in action comes from the author Viktor Frankl. He was one of the few people to survive a Nazi concentration camp. While he was there he mastered the art of living into the future. He credits this principle with giving him the strength to endure the horrors of the Holocaust. “It did not really matter what we expected of life, but what life expected of us” [2]. Viktor Frankl explained that while he was presently experiencing the suffering of a concentration camp, he saw himself in the future teaching the principles he learned there. He saw himself with a finished book. He saw himself with classrooms filled with students. He saw himself making a difference and not wasting the experience of being imprisoned.
While he was there, he began to share this powerful concept with the other prisoners. For those who understood what he was saying it was the difference between life and death. Some prisoners were able to acknowledge that there were still great works waiting in their future to be finished by them. There were businesses to be started and books to be written. There was a future that was calling them forth. This concept is what empowered many prisoners to rise above their present circumstances and receive the strength to overcome. Sadly there were other prisoners who did not want to answer the “call” of their future. Instead, they focused on surviving their present conditions. Oftentimes these prisoners died in their sleep for no other reason than a lack of purpose or meaning.
THE FUTURE IS NOW
In music the term audiation explains the mysterious power that sound has on our emotional state. In life the same term gives us the ability to live powerfully despite any circumstance. The principle is simple: our emotional state is never found in what is presently happening, it is found in the events we are expecting to come. Applying this principle to our daily routine is like using a lever which is capable of moving the future. Those who understand this will be found marching to the beat of a different drum. They will be found dancing through life and showing us the steps to endless possibilities.
REFERENCES [1] Learning Sequences in Music: Skill, Content, and Patterns (1997) by Edwin E. Gordon [2] V. Frankl. “Man’s Search for Meaning, ” Beacon Press, 1959, pg 77.
Fifth Annual SC Upstate Research Symposium
154 Sponsors: Stäubli, Spartanburg Regional Healthcare System, EPSCoR/IDeA RS grant.
Playing the Gig You’re On: Coltrane Knew How Gregg Akkerman
Fine Arts and Communication Studies University of South Carolina Upstate
800 University Way, Spartanburg, SC 29303 [email protected]
Abstract - Aspiring jazz musicians are often tempted to display their full arsenal of improvisational abilities in settings where restraint would be the wiser choice. Saxophonist John Coltrane is considered one of the most technically gifted players on his instrument and yet analysis shows that he was capable of governing his improvisational choices in ways appropriate to the performance situation. As an example of this skill, a transcription and comparative analysis of the sound, harmony, and melody of Coltrane’s solo and the vocals of Johnny Hartman on their recording of Irving Berlin’s “They Say It’s Wonderful” is provided. Keywords — jazz, jazz history, John Coltrane, musicology, music analysis.
INTRODUCTION An extended, successful career as a commercial musician requires knowing when and where to draw your various improvisational weapons. An excellent example of this ability to self-edit is the playing of John Coltrane on Irving Berlin’s They Say It’s Wonderful from the album John Coltrane and Johnny Hartman (GRP Records B000003N7K, originally released on Impulse in 1963) . On this vocal ballad Coltrane (with pianist McCoy Tyner, bassist Jimmy Garrison, and drummer Elvin Jones) does an extraordinary job of playing the gig. Instead of the ten minute “sheets of sound” solos or third-relation “matrix” ii-V substitutions he was capable of, Coltrane finds inspiration in the inherent beauty of the original melody and chord changes as well as the sinewy velvet phrasing of Hartman’s vocal. Coltrane’s willingness to act as an equal “second voice” to Hartman rather than his improvisational superior is a testament to the legacy of both artists. Recorded in just one take, They Say It’s Wonderful is the first cut on the album and analysis of Coltrane’s solo when compared to Hartman’s vocal reveals a jazz legend willing and able to play the gig he’s on.
SECTION TWO: SOUND Coltrane’s timbre on this recording is plaintiff, somewhat dry, and greatly complements the beautiful baritone quality of Hartman’s voice. Although Coltrane exploits the full conventional range of his tenor saxophone, he only just grazes the edges of altissimo on one phrase (mm. 15-16).
He seems content to confine his tessitura to the more masculine, vocal-like area of the instrument, especially in the cascading dive in mm. 6-7. Showing similar restraint, his dynamics throughout the improvisation do not stray beyond the mp-f range. Coltrane’s idiomatic glisses and ghost notes consistently remind the listener that although the song originated as a show tune from “Annie Get Your Gun,” it has been effectively absorbed into the jazz canon.
SECTION THREE: HARMONY
Based in Eb major, the harmony in They Say It’s Wonderful is comprised of standard ii-V-I progressions completing a thirty-two bar AABA form. The bridge modulates briefly to Ab major before moving to g minor in the second half of m. 20. The bridge finds its way back to the Fmin7 in the final A section by a clever descending sequence of Gmi7-C7 to F#mi7-B7 (mm. 23-4).
There are a few notable harmonic differences between the vocal chorus and Coltrane’s single solo chorus. In m. 5 the vocal melody dictates the need for a flatted 5th on the Fmi7 but this is ignored during the solo. Then in m. 8 the bassist and pianist deviate from the original progression by extending the tonic chord two beats and compressing the ii-V of f minor into the end of the measure. The flatted fifth of the Fmi7 in m. 10 is again ignored both harmonically and melodically. The vocal chorus uses a harmonically interesting Db7(b5) in m. 12 that is replaced by the more mundane Gmi7 for Coltrane. It is interesting that in m. 13 Coltrane, through the pronounced use of the same Cb note as found in the vocal melody, makes ignoring the flatted fifth on Fmi7 impossible although the rhythm section returns to the unaltered version in m. 26.
Coltrane is considered a master of reharmonization but on only two occasions does he employ that skill in this solo. Beats 3 and 4 of m. 8 outline an F# minor scale including the B natural that creates dissonance with the C7 in the rhythm section. In the second instance he plays a C natural on the downbeat of m. 28 against the Db7 chord. It is notable that both of these reharmonizations incorporate the major 7th pitch against a dominant 7th chord.
March 27th, 2009
Sponsors: Stäubli, Spartanburg Regional Healthcare System, EPSCoR/IDeA RS grant. 155
SECTION FOUR: MELODY When a jazz quartet accompanies a vocalist during a ballad, it is common procedure for the horn player to “riff” between the vocal phrases. Coltrane appears to use this procedure as melodic inspiration during his own solo. As noted throughout the following analyzed transcription, Coltrane consistently plays improvised lines that refer to the melody while, in between these phrases, delivering riffs that serve as filler. It is as if he has cast himself in the roles of both melodist and soloist. A good example is mm. 1-3 where several of Coltrane’s note choices are clearly inspired by the vocal melody while m. 4 contains a riff that fills the space normally left between the vocal phrases. The only deviation from this procedure throughout the entire solo is m. 6 where Coltrane plays an extended line featuring the #9 and b9 over the Bb7 chord. But even this line eventually resolves to a sustained Bb note in m. 7 just as heard in the vocal melody.
In what serves as the melodic climax of the solo, Coltrane creates a four-note motif in mm. 14-15 and then transposes it up a perfect 4th in mm. 15-16. Even though this motif is melodically unrelated to the vocal melody, the rhythm and stepwise movement of the four notes would easily accommodate the lyric and it is tempting to assume Coltrane was aware of this.
A second motif is played by Coltrane in m. 23 during the bridge. This simple three-note figure not only incorporates a vocal melody note but also follows the descending contour of the harmonic sequence when it is transposed down ½ step in m. 24.
The final measures of Hartman’s vocal melody resolves upward from the dominant to tonic notes while Coltrane chooses a different path. Although he plays a dominant note in his cadence, Coltrane resolves his final phrase from the 3rd of the key downward to the tonic. But, once again, his melodic deviation in m. 30 would still accommodate the syllables of the lyric.
CONCLUSIONS This analysis of the sound, harmony, and
melody of John Coltrane’s solo compared to the vocal of Johnny Hartman on They Say It’s Wonderful demonstrates that this visionary saxophonist knew how to self-edit and use the tools of improvisation appropriate to the gig he was on. Although technically capable of greatly extended improvisation featuring copious reharmonization and altissimo playing, Coltrane impresses the listener all the more by finding beauty in the original chords, following a proven improvisational procedure used in ballads, and seeking inspiration
from the vocals rather than taking the lower road of merely tolerating the presence of a vocalist as a means to fill the spaces between solos. John Coltrane knew the gig he was on and played it perfectly. NOTES ON THE TRANSCRIPTION Early drafts of this transcription were made by the author and only afterwards compared to a published transcription. Discrepancies were reviewed and, while some edits were made, the author has decided to differ with the earlier published version at several points in hopes of providing the reader the most current and accurate representation of Coltrane’s solo and Hartman’s vocal.
REFERENCES
[1] Coltrane, John. John Coltrane and Johnny Hartman. GRP Records B000003N7K, 1995. CD.
[2] Coltrane Plays Standards. Milwaukee: Hal Leonard (no year of publication provided).

Fifth Annual SC Upstate Research Symposium
156 Sponsors: Stäubli, Spartanburg Regional Healthcare System, EPSCoR/IDeA RS grant.
Fig. 1. Transcription analysis of John Coltrane and Johnny Hartman's recording of "They Say It's Wonderful"

March 27th, 2009
Sponsors: Stäubli, Spartanburg Regional Healthcare System, EPSCoR/IDeA RS grant. 157
Fig. 2. Transcription analysis of John Coltrane and Johnny Hartman's recording of "They Say It's Wonderful" cont.

Fifth Annual SC Upstate Research Symposium
158 Sponsors: Stäubli, Spartanburg Regional Healthcare System, EPSCoR/IDeA RS grant.
Parallels of Musical Prosospopoeia in Buxtehude’s Frieid und Freudenreiche Hinfahrt (1674) and Jacopo Peri’s L’Euridice (1600)
Ashley Higgins Department of Music Theory
Converse College 580 East Main Street Spartanburg, SC 29302
Abstract- Drawing cultural studies into musical analysis, I have paralleled musical prosopopoeia between Jacopo Peri’s L’Euridice (1600) and Dieterich Buxtehude’s Fried und Freudenreiche Hinfahrt BuxWV76 (1674).
Like much German funeral music of its time, Buxtehude’s Fried und Freudenreiche Hinfarht was composed for a singer to personify the deceased: the rhetorical figure prosopopoeia. Also using prosopopoeia, the early Italian opera L’Euridice has comparable content and themes, it focuses on the revivification of the dead. Considering that the two works differ in cultural settings, they were an ideal juxtaposition of works for my purposes.
Figures used prosopopoetically such as anabasis, catabasis, gradatio and interrogatio concurred with textual affections in both works that were very similar. The temporal positioning of the musical figures within the works was also similar. All correlations between Fried und Freudenreiche Hinfahrt and L’Euridice reveal more about the nature of musical prosopopoeia.
In score study, I used a synthesis of techniques of Baroque theorists Joachim Burmeister (1566-1629) and Christoph Bernhard (1627-1692) as my method for musical/textual analysis. I found parallels between the composers’ tactics to augment rhetorical prosopopoeia, despite cultural differences. Studying the similar function of prosopopoeia in the works provided insight into musically transcendent qualities of the figure. Keywords- prosopopoeia, musical/textual analysis, opera, funeral music, culture
INTRODUCTION
Plenty of music conveys life followed by death. Music of the seventeenth century deals with death quite often using the rhetorical device prosopopoeia: the actual voicing of a deceased, absent or even imaginary person[1]. In this device, the notion of life preceding death is completely
turned on its head. The dead talk about life! The Thirty Years’ War, outbreaks of plagues and shorter life spans caused a widespread preoccupation with death known as the ars moriendi[2]. Confronted with death on a daily basis, individuals became cognizant of their own precarious mortality. Assurance of life beyond death was important. Dieterich Buxtehude’s Fried und Freudenreiche Hinfahrt (1674) and Jacopo Peri’s L’Euridice (1600) express the act of resurrection musically using prosopopoeia.
The strong parallels of musical treatment of prosopopoeia in Fried und Freudenreiche Hinfahrt and L’Euridice evidence the power of musical messages to surpass boundaries of distant European cultures. They also shed light on particulars of the infrequently studied device. The notion of life after death is captivating; the study of its place amongst pitches and rhythms is revelatory of the transcendent and evocative power of music.
SECTION TWO
These two cultures seem to have more in common musically than previously thought. This is proved by showing that certain sections of the works have parallel affections and these occur in parallel order within each piece. An affection, in this context, is an emotion or feeling. Each of the affectively corresponding sections also has very similar specific musical-rhetorical expression of those affections within them. The musical-rhetorical expressions occur at very similar positions within each section. The following table shows the sections of Fried und Freudenreiche Hinfahrt and L’Euridice as they occur in time and the affections they share.
Table 1 Affection Fried und Freud L’Euridice Affection
lament “Klagelied” “Funeste Piagge” lament comfort Contrapunctus I “Trionfi Oggi” comfort
appeal to logos (reason)
Evolutio I “Quand’al” appeal to logos (reason)
joy Contrapunctus II “Gioite al Canto” joy completeness Evolutio II “Per Quest’aer” completeness
March 27th, 2009
Sponsors: Stäubli, Spartanburg Regional Healthcare System, EPSCoR/IDeA RS grant. 159
It is necessary to define the specific musical-rhetorical figures used within the sections of both works. Rhetoric in music governs the arrangement and elaboration of ideas in a piece of music [3]. The following list provides definitions of the figures in the musical-rhetoric of Fried und Freudenreiche Hinfahrt and L’Euridice.
List 1
Interrogatio: This expresses a question. In music, it is a leading tone sonority or a line of notes that rises stepwise at the end. Saltus Duriusculus: This expresses pain. It is a very dissonant melodic leap. Catabasis: This expresses burden or woeful human emotion. It is a descending musical line. Subjectum Catabatum: This is a recurring motive that contains catabasis. It implies an overall theme of lament. Anabasis: This is an expression of elevated emotion through an ascending musical line. Gradatio: This is a sequence of notes in one voice repeated either at a higher or lower pitch. It indicates growth in intensity of expression. These musical-rhetorical figures occur with similar words and even entire phrases in both works. For example, in the last section of both pieces, the figure gradatio occurs on words describing vision, such as “illuminate”, “visibility”, “ mirror” and “look”. Another example is that words dealing with movement, such as “go” and “take”, typically occur with anabasis. The figures even line up temporally within each section. Also notice that the first sections of both works convey sad human emotions while the remaining four convey elevated, joyful and heavenly emotions. Composers of prosopopoetic music typically divided affections in this manner to balance the two very different, somewhat extreme emotions[4]. PROSOPOPOEIA IN GERMAN FUNERAL REPERTORY In Lutheran funeral repertory such as Fried und Freudenreiche Hinfahrt this division was especially pronounced. The theological purpose of the prosopopoetic sermon was not only to strike a chord in the hearts of listeners, but also to solidify the concept of life after death in their minds[5]. The life desired was a stable, God-ordained state of balance. In Lutheran sermons, this heaven was a place where worldly pain held no bearing[6].
Funeral orators of prosopopoetic sermons often modeled their vocal inflections after the deceased’s[7]. Many people prepared parts of their own funeral ceremonies[8]. Scripture and music
were usually chosen by the deceased for the ceremony several months in advance of their death[9]. Fried und Freudenreiche Hinfarht or Peaceful and Joyful Journey was music for the funeral of Dieterich Buxtehude’s father Johannes Buxtehude. It was published in Lübeck, Germany. The first section, “Mit Fried und Freud Ich Fahr Dahin” is four sections of invertible counterpoint.
“Mit Fried und Freud Ich Fahr Dahin was originally written for the funeral of the superintendent of the churches of Lübeck, Meno Hanneken, Sr. Buxtehude later incorporated “Mit Fried” into his fathers funeral in 1674. “Klagelied,” a grief-centered lied, was published alongside “Mit Fried”[10]. Dieterich Buxtehude himself probably wrote the poetry for “Klagelied”[11]. “Klagelied” has a monodic texture: a melody accompanied by simple chord accompaniment. This texture was quite different from the invertible counterpoint of “Mit Fried.”
Invertible counterpoint is counterpoint in which the intervals or chords may be inverted and remain correct as counterpoint[12]. In “Mit Fried” Buxtehude uses the intervals of the soprano in Contrapunctus I in the bass of Evolutio I. He also switches the intervals of the middle voices. In Contrapunctus II, Buxtehude reinstates the soprano from Contrapunctus I, but elaborates the lower voices. He uses the intervals of the soprano in Contrapunctus II in the bass of Evolutio II, also switching the intervals of the middle voices.
Buxtehude’s friend, famous theorist Andreas Werckmeister compared the movement of voices to a final inversion to the movement of the planets[13]. The piece remains aurally consonant after all of its voices have been switched. The concept of the texture of invertible counter point under careful calculation of the composer, runs parallel with the idea that one higher force is in control of the universe[14]. This is part of what makes the sounds of “Mit Fried” comfort the listener while “Klagelied” simply empathizes with their grief. The individual lines of each part of “Mit Fried” still maintain a sense of individuality in expression allowing for comparison to the melodies in L‘Euridice. Transfiguration in the two works conveyed through musical-rhetorical figures is strikingly similar. Although the background of L’Euridice is rather different, the musical elements of resurrection are the same. PROSOPOPOEIA IN EARLY ITALIAN OPERA In the beginning of the Seventeenth-century, the prospect of an unfettered melody line arose with the newly cultivated texture of monody. In L’Euridice, Peri’s usage of musical-rhetorical

Fifth Annual SC Upstate Research Symposium
160 Sponsors: Stäubli, Spartanburg Regional Healthcare System, EPSCoR/IDeA RS grant.
figures in the monodic texture combined with Ottavio Rinuccini’s libretto created a vivid characterization of Orfeo and had a new take on the events surrounding Orfeo’s wife’s demise.
Peri’s opera, with its themes of everlasting love and revival, was first premiered at the wedding of Henri IV of France to Maria de’ Medici in Florence, Italy. Some scholars believe the ending of the opera was meant to pay homage to the marriage[15]. It was common for early Baroque composers to incorporate favorable allegorical implications of their aristocratic employers into their works. L’Euridice tells an inspiring story of a life renewed regardless.
In Peri’s opera, Euridice is resurrected instead of being sent back to Hades on the condition of a forbidden backward glance from Orfeo. Rinuccini’s choice of ending is triumphant in comparison to the tragic end Euridice finds in most versions of the myth, with operas such as Monteverdi’s L’Orfeo and Gluck’s L’Anima del Filosofo[16]. Orfeo makes a brave descent to the underworld in order to save Euridice’s life.
The first instance of prosopopoeia in the opera is the poignant moment when Orfeo sings from the depths of Hades in his lament aria “Funeste piagge” Peri’s “Funeste” resonates the grief of death, as does Buxtehude’s “Klagelied.” All sections that follow these two exclaim the affection of happiness through salvation. The balance of joy with sadness is integral to musical prosopopoeia.
CONCLUSIONS
The “Klagelied” and “Funeste Piagge” make thorough practice of the catabasis or in this case subjectum catabatum, as the device appears with an almost motivic surety in denoting the repeated context. Catabasis and all other figures involved in conveying the depravity of the human condition, such as interrogatio and suspensions, suggest the need for resolution or salvation. We see that mainly anabasis, along with other figures such as gradatio, provide the necessary musical deliverance.
This interesting symbiosis between the affections of earthly lament and heavenly joy resonates in musical prosopopoeia. The strong parallels of musical treatment of prosopopoeia in Fried und Freudenreiche Hinfahrt and L’Euridice evidence the power of musical messages to surpass boundaries of distant European cultures. They also shed light on particulars of the infrequently studied device. The notion of life after death is captivating; the study of its place amongst pitches and rhythms is revelatory of the transcendent and evocative power of music.
ACKNOWLEDGEMENTS Dr. Leon Couch III was an immense help to me, a first time researcher, in the writing and editing processes of this paper. He made himself frequently available for my consultation. He gave many insightful opinions on my ideas and their organization. He also taught me how to analyze music carefully and how in doing so, much that goes unnoticed can be revealed. I truly value and appreciate all of his wonderful knowledge, encouragement and assistance.
REFERENCES [1] G. S. Johnston. “Protestant Funeral Music and
Rhetoric in Seventeenth-century Germany: A Musical-rhetorical Examination of the Printed Sources,” Ph.D. Dissertation: University of British Columbia, p 187, 1987.
[2] W. Zeller, “Leichenpredigt und Erbauungsliteratur,” in Leichenpredigten als Quelle historischer Wissenschaften, ed. Rudolf Lenz pp 67-81 (Cologne, 1975).
[3] The Harvard Dictionary of Music, 4th ed., s.v. “Rhetoric.”
[4] D. Yearsley, “Towards an Allegorical Interpretation of Buxtehude’s Funerary Counterpoints,” Music & Letters 80, no. 2 ,185, 1999.
[5] See Johnston, “Protestant Funeral Music and Rhetoric in Seventeenth-century Germany: A Musical-rhetorical Examination of the Printed Sources,” p 189.
[6] M. Luther, Preface to Burial Hymns, ed. Ulrich S. Leupold and Helmut T. Lehmann (Luther’s Works 53) pp 326-327 (Philadelphia: Fortress Press, 1965).
[7] Quintilian, Institutio oratoria, Loeb Classical Library, pp 41-42 (London, 1921).
[8] O. Brodde, Heinrich Schütz: Weg und Werk , p 131 (Berlin, 1985).
[9] See Johnston, 198. [10] Kerala J. Snyder, Dieterich Buxtehude: Organist in
Lübeck, p 214 (New York, 1987). [11] See Yearsley, “Towards an Allegorical Interpretation
of Buxtehude’s Funerary Counterpoints,” p 187. [12] The Harvard Dictionary of Music, 4th ed., s.v.
“Invertible counterpoint.” [13] A. Werckmeister, Harmonologia musica oder
Kurtze Anleitung zur musicalischen Composition, p 89 (Frankfurt and Leipzig, 1702; repr. Hildesheim, 1970).
[14] See Yearsley, “Towards an Allegorical Interpretation of Buxtehude’s Funerary Counterpoints,” p 201.
[15] A. M. Cummings, The Politicized Muse: Music for Medici Festivals, 1512–1537, p 15–92 (Princeton: Princeton University Press, 1992).
[16] E. Barsham, “The Orpheus Myth in Operatic History” introduction to CW von Gluck: Orfeo, compiled by Patricia Howard, pp 1-9 (New York: Cambridge University Press, 1981).
March 27th, 2009
Sponsors: Stäubli, Spartanburg Regional Healthcare System, EPSCoR/IDeA RS grant. 161
Romare Bearden: Contribution and Contrast to the Harlem Renaissance
Mckensie Hall and Rachel Snow 20th Century Art History
University of South Carolina Upstate 800 University Way, Spartanburg, SC 29303
{hallml, rsnow}@email.uscupstate.edu Abstract - Romare Bearden (1911-1988), a practicing artist during the Harlem Renaissance (1919-1934) and Civil Rights Movement (1955-1968), addressed social issues in his community and surrounding environment concerning the African American identity. Through his artwork he recorded and depicted the movement and change of the African-American community from rural homesteads in the South to the urban lifestyle in the North during the Great Migration (1916-1970). Bearden’s early works in mixed media and painting and his interest in photography and collage led him to develop the style that would lead to his personal fame. Through his use of collage and photomontage, Bearden reinvented a medium and brought originality and creativity to photography. Bearden, a successful artist and innovative thinker of his time, stand outside of the Harlem Renaissance and watched it evolve. Though he helped to initiate the new cause for the artwork of the Harlem Renaissance, he did not consider himself a Harlem Renaissance artist and distinguished himself as different from other artists of the movement. Later, during the Civil Rights Movement, his subdued style and use of standard religious themes allowed his political content to surpass viewers who would have disregarded an aggressively political content. Keywords — Romare Bearden, Harlem Renaissance, Great Migration, Civil Rights Movement, Collage.
INTRODUCTION
Romare Howard Bearden (1911-1988), a renowned artist born and raised in Charlotte, North Carolina, is known for his works that are full of metaphors from his Southern heritage and North Carolina roots. Bearden’s work consists of a body of collages, watercolors, oil paintings, photomontages, and prints that led him to be known as one of the most versatile and creative visual artists of the twentieth century. Although Bearden was a practicing artist during the time of the Harlem Renaissance (1919-1934) and was fairly close in location Harlem Renaissance, Bearden chose not to associate his own work with the movement. Like other successful artists, poets, and writers of this time, Bearden chose to focus more immediately on issues surrounding his African American identity rather than his African heritage.[1] Though he did not focus as heavily on his African heritage as a subject, Bearden did draw many influences from African culture by using limited amounts of information and imagery about his
African heritage to emphasize the relationship between African American identity and African culture. Although he distanced himself from the movement, one paradoxical aspect of Bearden’s work as an artist is that he came to be a visual historian of the Harlem Renaissance. He recorded the Great Migration (1916-1970) of African-Americans from Southern rural life to Northern urban life through his art work in great detail and provided a commemorative, interesting interpretation in which he essentially initiated in an ‘outside’ commentary of the entire movement. [2]
BEARDEN’S CAREER DURING THE HARLEM
RENAISSANCE
Bearden’s early work in painting shows evidence of Bearden’s Southern upbringing as well as his interest in African masks. “The Visitation”, 1941 (Fig. 1) and “Serenade”, 1941 (Fig. 2) are examples of Bearden’s paintings about religious rituals and social interactions between individuals. Both works, are fantastic examples of the style of Social Realism. Social Realism is an artistic movement that depicts daily actions of the working class. The first example, titled “The Visitation”, documents an occurrence in Bearden’s Southern childhood. Growing up in the Bible Belt, Bearden experienced religion in its most popular area in the country. His memories of baptisms, visitations, and church services are essential to some of his most crucial imagery. “The Visitation” depicts a typical event that occurs in the Southern community. Visitations are commonly known in the South as visits shared between people who share the same faith or beliefs. Typically, one person might visit another in order to speak with him/her about religious matters, consult the other’s knowledge, or pray. In conjunction with the previous example, “Serenade” depicts an African American man serenading an African American woman in a rural environment. Commonly known as a form of courting, a man might serenade a woman in order to express fondness of her or to receive her hand in marriage. Bearden has made this image specific to the Southern rural community by placing the figures in an outdoor setting in which the two figures probably worked. This hypothesis can be made by
Fifth Annual SC Upstate Research Symposium
162 Sponsors: Stäubli, Spartanburg Regional Healthcare System, EPSCoR/IDeA RS grant.
reviewing the figure in the background who appears to be working.
The environments in both paintings are most likely Bearden’s Southern memories. This conclusion can be drawn from the rural setting, the barefooted female figure in “Serenade”, and the style of clothing worn by all the figures. Bearden has depicted the figures in a somewhat primitive style that pays homage to African tribal masks such as “Ngady amwaash”,(date unknown) (Fig. 3). African masks such as this, are another of Bearden’s sources for inspiration. These works are examples of Bearden’s paintings that incorporate African heritage into the social contexts of the rural South. He has depicted very traditional African figures into environments and social happenings common to the Southern region of the United States.
During this time, Bearden also initiated the creation of an exhibition that would mark the 1930’s African-American art scene. “Against All Odds”, the exhibition that essentially defined the purpose of the Harlem Renaissance, inferred that the Harlem Renaissance sought to re-conceptualize art and expand it to the entire community as well as to make an impact on visual culture through expansion of media. [3] Author, Michel Feith comments that Romare Bearden’s criticism of the Harlem Renaissance was “the Renaissance was purely imitative of white masters”.[4] Feith is referring to the European Renaissance of the 14th-17th centuries. He said that Bearden opposed being a part of the Harlem Renaissance because he wanted to achieve a completely new and innovative way of thought, rather than recreating a previous Renaissance’s thoughts and ideas. Bearden wanted to express his ideas about African American identity but did not include himself in the body of artists it would comprise. Bearden’s dedication to intellectual thought and innovative ideas proved to be very valuable in his long career as an artist.
During the late 1930’s and early 1940’s Bearden also began to experiment with other influences. Early on in his career, Bearden’s work was constricted to being a hobby. During his time at the Art Students League, Bearden also renewed his respect for European artists such as Picasso, Braque, and Matisse. Work such as “Golgotha”, 1945 (Fig. 4), reflect his early interest in Picasso and other Cubists’ work. Bearden’s work at this time was considered very controversial, bold, and daring.
During the late 1940’s and early 1950’s Bearden’s work took a turn toward the abstract. After being discharged from the army, Bearden created a series of works based on the gospels of Matthew and Mark. This series titled “The Passion
of Christ” was highly applauded and recognized featured works such as that of “Golgotha”, 1945 (Fig. 4) and “He Is Risen”, 1945 (Fig. 5). “Golgotha”, a mixed media work, features Christ’s crucifixion in an abstract style. Bearden’s inspiration for this series came directly from his education at the Art Students League and Christian beliefs. The work features bright colors strategically placed on the sectioned canvas in order to show intentional placement. The brightest color, yellow, is placed strategically behind Christ’s body so that the viewer is instantly drawn toward the subject matter. The bold, black, linear lines indicate the contours of the figures, the spears directed at Christ’s body, and minute details of the work. “He Is Risen” also depicts the biblical story of Christ’s resurrection from the tomb. This work is characterized by somewhat muted colors and organic lines and shapes. Bearden has used the lines to break down the figure’s body into simple shapes, much like Cubist artists aimed to do.
The interesting mix of analytic and synthetic Cubism merged into one work placed Bearden in a category all his own. Analytic Cubism, characterized by simplified forms resulting in geometric shapes and a diluted color scheme, can be seen in the body of Christ in “He Is Risen” as well as the surrounding figures. Synthetic Cubism, which is more evident in “Golgotha” is obvious in the brighter colors and flatter dimensions of the foreground and the background as well as the compacted picture plane which involves less planar shifts. Similarities can be seen between the figures in “He Is Risen”, primarily the main figure placed in the center of the canvas, and Picasso’s “Les Trois Danseuses”, 1925 (Fig. 6) which is a Synthetic Cubist work. The same organic, yet sectioned format for the figure’s bodies can be seen in the three dancers’ bodies in Figure 6. Like Picasso in his African period, Bearden’s work during the 1930’s in somewhat reminiscent of African art. Bearden, while reviewing Picasso’s work, may have been studying another artist’s interpretation of African art, primarily masks, unconsciously.
Bearden is credited with reinventing the medium of collage which was first developed by Japanese calligraphers and later by the Cubists. Bearden’s collages came later and began to feature more recognizable figures alongside a political or social theme. These works which constituted mixing a technological development (photographs and magazine illustrations) that allowed for mass media reproduction, and forms of high art that imply originality, allowed Bearden to create a new context for art to be created within.
Bearden’s work during the 1950’s and 1960’s was at its height. While working almost primarily
March 27th, 2009
Sponsors: Stäubli, Spartanburg Regional Healthcare System, EPSCoR/IDeA RS grant. 163
in collage, his work developed an abstract approach in the 1950’s in which he began to use layers of paint to create subdued, hidden effects. During the 1960’s specifically, his work became more socially oriented and representational because of The Civil Rights Movement (1955-1968). Influenced by his social activist parents, Bearden’s began voicing his opinion about the movement through his artwork.
BEARDEN’S ART IN RELATION TO THE CIVIL RIGHTS MOVEMENT
In 1964, Romare Bearden presented an exhibition titled “Projections”; a collection of 24 black and white photomontages and four collages. The significance of the black and white color scheme in the collection relates to the social historical context that it was presented in. All over America, tension between the black and white citizens created hostility between the races. The choice that Bearden made to depict his photomontages and collages in only black and white reflected this tension sensed between the races.
Dore Ashton, an essayist for the exhibition’s brochure, wrote that the facial expressions in one of the works titled “Mysteries”, 1964 (Fig. 7) were ‘accusing’ and ‘disquieting’. [5] “Mysteries” depicts a scene of jumbled African American faces and bodies. Each figure faces forward as if it is looking at the viewer. This makes the viewer feel accused by the stares/glares and uncomfortable facial expressions some of the figures express. The facial expressions add to the tension created by the black and white contrast relating to the social issues at hand.
Bearden’s involvement as an artist expressing himself during the Civil Rights movement was prompted by his need to create and alliance. “Projections”, Bearden’s afore-mentioned masterpiece, stemmed from Spiral, the artist alliance Bearden founded. Not only was it the first exhibit he had constructed on African American themes since the 1940’s but it became one of the most important recordings of African American identity formation because Bearden chose to represent all aspects of the African American identity. He depicted Northern, Southern, male, female, and religious identities in his photomontages and collages in order to span a broad definition of what it meant to be an African American during the Civil Rights Movement. [1]
Some of the Southern qualities that Romare Bearden commented on in his work were religious rituals, African American lifestyle in general, music, and working conditions. One example of a
Southern religious ritual is a collage titled “Carolina Shout”, 1974 (Fig. 8) that depicts several African American individuals enjoying an uplifted moment of praise as they enjoy the salvation of their fellow Christians. The title, which denotes the location that inspired the work, also gives the viewer an insight into what he/she is viewing. Bearden, who tapped into his past for the inspiration for this work, said that his intent for the new collages was “establishing a world through art in which the validity of (his) Negro experience could live and make its own logic”. [6]
CONCLUSIONS
Bearden’s career, an exemplary work in its own right, blankets two major movements in the African American community and American history. Bearden’s work has discussed issues such as black liberation, the importance of self expression, the artist’s place in the Civil Rights Movement, and the importance of getting one’s name into the galleries and exhibitions in order to permanently stamp history. The significance of this is that Bearden, whether he identified himself with the movement or not, had founded the essential cause for the Harlem Renaissance, Spiral, and a basis for artists of his type during the Civil Rights Movement to speak out against the inequality of opportunity provided for black artists in America. Again, Bearden’s work as an artist and a social activist was very bold, sophisticated, and radical for his time. [7]
ACKNOWLEDGMENTS
I would like to thank Rachel Snow for all her guidance as well as Mallory Long and Derek Ninneman for their support.
REFERENCES [1] Glazer, Lee Stephens. "Signifying Identity: Art and
Race in Romare Bearden's Projections." The Art Bulletin. vol. 76(3), pp. 411-426, 1994.
[2] Jordan, Denise. “Artists in Profile: Harlem Renaissance,” Heinemann Library, 2003.
[3] Trachtman, Paul. "Romare Bearden: Man of Many Parts- From scraps of Photographs, Newspapers and Magazines, the Late African-American Artist Created Masterful Portraits of Contemporary Black Culture." Smithsonian. vol. 34(11), pg. 60, 2004.
[4] Bloom, Harold. ed. “The Harlem Renaissance,” Chelsea House Publishers, 2004.
[5] Patton, Sharon F. “African American Art,” Oxford University Press, 1998.
[6] Powell, Richard J. "What Becomes a Legend Most?" Transition 55, pp. 62-72, 1992. Schramm, Susan L. and Rhonda B. Jeffries. "African American Trickster Representations in the Work of Romare Bearden." Art Education. vol. 53(5) pp.19-24, 2000.

Fifth Annual SC Upstate Research Symposium
164 Sponsors: Stäubli, Spartanburg Regional Healthcare System, EPSCoR/IDeA RS grant.
[7] Bearden, Romare and Same Gilliam Jr., Richard Hunt, Jacob Lawrence, Tom Lloyd,William Williams, and Hale Woodruff. "The Black Artist in America: A Symposium." The Metropolitan Museum of Art Bulletin. vol. 27(5), pp. 245-261, 1969.
Fig. 1. Romare Bearden, The Visitation, 1941, gouache with ink and graphite on brown paper
Fig. 2. Romare Bearden, Serenade, 1941, gouache with ink and graphite on brown paper
Fig. 3. Royal Sister and Wife, Ngady amwaash, Kuba Kingdom, Democratic Republic of the Congo, Wood, paint, beads, cowrie shells, fabric
Fig. 4. Romare Bearden, Golgotha (The Passion of the Christ Series), 1945, watercolor, pen and India ink, pencil on paper

March 27th, 2009
Sponsors: Stäubli, Spartanburg Regional Healthcare System, EPSCoR/IDeA RS grant. 165
Fig. 5. Romare Bearden ,He Is Risen (The Passion of the Christ Series), 1945, oil on gessoed board
Fig. 6. Pablo Picasso, Les Trois Danseuses, 1925, Oil on Canvas
Fig. 7. Romare Bearden, Prevalence of Ritual: Mysteries, 1964, photomontage
Fig. 8. Romare Bearden, Carolina Shout, 1974, collage with acrylic and lacquer on boar
Fifth Annual SC Upstate Research Symposium
166 Sponsors: Stäubli, Spartanburg Regional Healthcare System, EPSCoR/IDeA RS grant.
A Preliminary Discussion of Corporate Social Responsibility Lilly M. Lancaster and Megan Creech Johnson College of Business and Economics
University of South Carolina Upstate 800 University Way, Spartanburg, SC 29303
[email protected], [email protected] Abstract — This paper briefly defines and documents the historical development of corporate social responsibility. Brief examples of efforts in the Upstate are presented. Future directions for research are identified. Keywords — corporate social responsibility, sustainability, environment
INTRODUCTION Climate change, massive job losses, problems in the financial markets, population growth, and conflict between and among nations, firms and religious groups are common topics in the daily news. Admittedly, it is a very difficult time. And many may see it as a difficult time for businesses and business schools. However, a re-emergence of the need for social responsibility in business and industry offers both opportunities and challenges. Business schools are re-evaluating curricula and developing research programs that focus upon growth and profit, while respecting the problems, and seeking solutions to these problems that are facing not only the USA but our planet. The purpose of this paper is to: (1) define and present a brief history of corporate social responsibility (CRS) (2) provide brief examples of local CRS efforts (3) identify opportunities for further CRS research in the Upstate.
DEFINITION AND HISTORY Corporate responsibility was defined by Bowen in 1953 as “the obligation of businessmen to pursue those policies, to make those decisions, or to follow those lines of action which are desirable in terms of the objectives and values of our society” [1]. Furthermore, J.W. McGuire stated that “the idea of social responsibilities supposes that the corporation has not only economical and legal obligations but also certain responsibilities that extend beyond these” [2]. Management legend, Peter Drucker, divided social responsibility into two areas: (a) social impact and (b) social problems [3]. Social impact focuses upon the negative effects of the day-to-day operations of a company in the community. The second area, social problems, addresses areas of opportunity for positive impact by the company.
DRUCKER’S PERSPECTIVE Social problems, according to Drucker, are opportunities for firms to have positive impacts upon society. It is a “function of businesses to satisfy a social need and at the same time serve themselves by making resolution of a social problem into a business opportunity.” He further stated that “None of our institutions exist by itself and is an end in itself. Everyone is an organ of society and exists for the sake of society. Business is no exception. Free enterprise cannot be justified as being good for business; it can be justified only as being good for society” [3].
Drucker suggested that businesses’ negative impact issues be addressed to reduce or eliminate the effects on the community. Methods to minimize negative effects can come either from within the company or from external sources. Drucker made a point that, whenever possible, these methods should produce a solution giving the maximum benefit to the community with the minimum possible cost to the company. Drucker was a driving force behind such concepts as: (a) the balanced scorecard (b) viewing employees as valuable resources and (c) the knowledge-based economy. ECONOMISTS- FRIEDMAN, REICH AND SACHS Some economists, including Milton Friedman and Robert Reich, do not share Drucker’s views. Friedman stated that corporations not only exist to produce earnings for shareholders, but also argued that corporations are only responsible to shareholders and not to the community [4]. Robert Reich echoed Friedman’s ideas stating that “the language and practices of corporate social responsibility have become a mere tool in the hands of managers and public relations experts used to manipulate the beliefs and expectations of citizens” [5].
However, economist, Jeffrey Sachs, discusses the need for a new era of global cooperation to deal with the root cause problems of soaring population and industrial growth [6]. His vision includes a sustainable and equitable future and appears to be consistent with Drucker’s statement that “every
March 27th, 2009
Sponsors: Stäubli, Spartanburg Regional Healthcare System, EPSCoR/IDeA RS grant. 167
single social and global issue of our day is a business opportunity in disguise” [7]. THE BALDRIGE CRITERIA The Baldrige Quality Award 2009-2010 Criteria for Performance Excellence emphasize a growing responsibility for organizations in the area of “societal responsibilities.” Corporate stewardship of environmental and social systems as well as economic systems is described. Examples of areas of “societal responsibility” include: (a) reduced energy consumption, (b) use of renewable energy resources and (c) conservation, as well as the (d) “global use of enlightened labor practices”. Although not listed as an area of “societal responsibility”, innovation is also highlighted elsewhere in the Baldrige Criteria and appears to be an important component of CSR [8].
While some authorities may argue that commerce is governed by the legal and ethical environment in which it conducts business, CSR offers positive tangible results for ethical concerns. “The difference between ethics and social responsibility is the difference between thought and action” [9].
LOCAL EXAMPLES OF CRS PRACTICES Some CSR practices in the Upstate of South Carolina include: (a) business event sponsorship (b) “green” initiatives and (c) practices to develop socially responsible community and business environments. BUSINESS EVENT SPONSORSHIP AIDUpstate, in Greenville, SC is a non-profit organization dedicated to providing medical assistance, food and supplies to those living with HIV and AIDS [10]. At their annual fundraising event, called the Red Party, major contributors such as Verizon Wireless and Budweiser are listed on the AIDUpstate website as well as in advertisements for the event. This endorsement is beneficial to a firm’s public image and shows a commitment to issues affecting both local and global society. “GREEN” INITIATIVES On January 18, 2009, The Spartanburg Herald Journal highlighted a major “green” iniatitive in the Upstate. Coca-Cola Company announced the opening of what may be the “world’s largest “bottle-to-bottle” recycling faculty in Spartanburg County [11].” This joint venture with
Spartanburg’s United Resource Recovery Corporation will create approximately 100 jobs and recycle food-grade polyethylene terephthalate (PET) plastic. Kate Krebs, Director of Sustainable Resources, Climate, Group, stated, “’ …To see Coca-Cola take the issue of climate change head-on is wonderful” [11].
Another local example of “green” initiatives is the methane-to-energy- project at Enoree Landfill [12]. The National Landfill Methane Outreach Program cited the Enoree Landfill Gas to Energy Green Power as its 2008 Project. The Landfill’s partners are Greenville Gas Producers LLC and Duke Energy Carolinas LLC. Other Upstate firms involved in the conversion of methane gas from landfills into electricity include BMW [13] and Milliken and Company [14].
Practices to Develop Socially Responsible Community and Business Environments Sustainability is often viewed in the narrow context of energy and the conservation of the natural environment. However, job creation and a feasible level of production, i.e., “sustainability”, is also an important goal for CSR. Allied Companies LLC president and CEO, Joel Martin, recently announced a plan to turn a former textile plant in the Upstate into a production facility for slip resistant flooring. The raw material for the flooring is recycled flexible polyvinyl chloride (PVC). Not only is the plant using recycled raw materials, but a production facility in the Upstate is being “recycled” and approximately 125 jobs are being created. As Martin stated, “… we’re in a very good position despite headwinds in the economy… we’ve only just scratched the surface” [15].
More traditional areas where employers focus upon employees and responsible business environments include: (a) safety practices (b) employee physical and mental health, and (c) issues such as workplace violence. For example, many local industries, such as Wabtec Passenger Transit, offer free health assessments, blood pressure screening and yearly flu shots to employees [16].
A focus upon employees, environment and the community may not be optional for firms in the future. Grant Thornton’s International Business Report of 2008 states that “while ‘saving the planet’ is a concern, by far and away the main drivers for action on corporate social responsibility are recruitment and retention issues.” Today’s knowledge workers are looking at the CSR practices of potential employers as they make career decisions. If a company wants skilled and knowledgeable workers, they must improve their CSR practices to recruit and retain the best employees [17].

Fifth Annual SC Upstate Research Symposium
168 Sponsors: Stäubli, Spartanburg Regional Healthcare System, EPSCoR/IDeA RS grant.
CONCLUSIONS The term “corporate responsibility” was popularized in the fifties and sixties. Throughout his lifetime, management icon, Peter Drucker, a strong proponent of systems theory and the interconnectedness of firms and society, advocated that societal problems create business opportunities [18]. The technology explosion, international threats and opportunities, concerns about the climate and environment, as well as the current worldwide economic environment have fostered in a new era of CSR.
Indexing CSR efforts in the Upstate, not only for the purpose of developing college coursework case studies, but also for recruiting employers and employees to the Upstate may be an area for further research. As the trend develops, the positive and possible negative impacts of CSR may also be explored.
REFERENCES
[1] Bowen H.R., “Social Responsibilities of the Businessman,” Harper and Row, 1953.
[2] McGuire, J. W., “Business and Society,” McGraw-Hill, 1963.
[3] Drucker, Peter F, “The Essential Drucker,” Harper Collins Publishers Inc, 2003.
[4] Gallagher, “A Strategic Response to Friedman’s Critique of Business Ethics,” Journal of Business Strategy, vol.26, no.6, pp55-56, Nov-Dec, 2005.
[5] Pava, Moses L. “Why Corporations Should Not Abandon Social Responsibility”, Journal of Business Ethics, vol. 83, pp.805-812, 2008.
[6] Sachs, Jeffrey, “Common Wealth: Economics for a Crowded Planet,” Penguin Press, 2009.
[7] Cooperrider, David, “Sustainable Innovation,” BizEd, July/August, pp. 32-36, 2008.
[8] 2009-10 Criteria for Performance Excellence, http://www.baldrige.nist.gov
[9] Bisoux, Tricia, “The Socially Responsible Curriculum,” BizEd, July/August, pp. 22-30, 2008.
[10] www.aidupstate.org [11] Anderson, Trevor, “New Plant will Recycle Millions
of Plastic Bottles,” In Spartanburg Herald Journal, E1-E2, January 18, 2009.
[12] Anderson, Trevor, “Methane-to-Energy Project at Enoree Landfill Honored,” In Spartanburg Herald Journal, C4, January 14, 2009. [13] “Gas to Energy Project: Conservation in Action,”
http: www.bmwusfactory.com/#/environment/278 [14] “Milliken and Spartanburg County Announce
Waste-to-Energy Partnership, 04/21/08”, http://www. Milliken.com
[15] Anderson, Trevor, “Floor-covering Plant Opening,” In Spartanburg, Herald Journal, C4, January 13, 2009.
[16] www.Wabtec.com/transit [17] MacBeath, Alex, “Corporate Social Responsibility:
It’s a Necessity Not a Choice, “International
Business Report 2008, Grant Thorton, http:// www.grantthornton.com
[18] “The Drucker School and Institute Announce the Celebration of Peter Drucker’s 100th,” Business Wire. New York: Nov. 7, 2008.
March 27th, 2009
Sponsors: Stäubli, Spartanburg Regional Healthcare System, EPSCoR/IDeA RS grant. 169
Existence of Economies of Scale within Athletic Departments at Private, Four Year Institutions
John Frazier School of Business
Southern Wesleyan University 907 Wesleyan Drive, Central, SC 29630
[email protected] Abstract—This study investigates the size-cost relationship within college athletic departments using economies of scale as the tool for measurement. It examines data from 578 private four-year institutions. Currently, no information indicates what the optimal size of an institution’s athletic department should be. The data from the study will allow university decision makers to determine if the athletic department should be larger or smaller in an effort to increase efficiency.
The main research question is as follows: Is there a correlation between athletic department size and average total cost per athlete within college athletics of private, four-year schools? Expectations are that there are economies of scale present within college athletic programs. Generally, the hypothesis is supported.
It is possible to model the cost structure in college athletics with a flexible single-product cost function. Using the data for athletic departments for the academic year 2004-2005, the statistical results of the study clearly imply the existence of economies of scale within college athletics. Many athletic departments can reduce their average total cost per athlete by increasing the number of participants in the athletic department, while a few athletic departments may be producing athletic output at a diminishing level of returns. Keywords – Economies of Scale in Athletics
INTRODUCTION
“The costs of colleges and universities continue to be a topic of great concern on local campuses and in legislative and executive agencies of the state and federal governments. Large or small, complex or single purpose, colleges and universities always have greater need for expenditures than they have money to spend” [1]. The major purpose of this study is to estimate an average total cost function for college athletic departments and to investigate the presence and magnitude of economies of scale within athletic departments of institutions of higher education. It is expected that this study will shed light on economic information that may be useful in optimizing the size and structure of college athletic departments. This study provides pertinent information that will allow athletic departments to be sized in a manner that would produce the lowest average total cost per athlete. In theory, this would make the operating expense of the athletic department more efficient.
RESEARCH QUESTION The main research question is as follows: Is there a correlation between athletic department size and average total cost per athlete within college athletics of private, four-year schools?
METHODOLOGY Revenue and expense data is gathered from 578 private, four-year schools. Components of revenue and expenses are verified with several schools’ athletic directors to ensure commonality of the revenue and expense component makeup. Information regarding a school’s athletic department size is also gathered. The number of athletes within the athletic department, the number of athletes as a percentage of the school’s population, and the number of teams within the athletic department are used to determine size. Data is gathered for both men’s and women’s programs. This data is totaled to represent the entire department. The database used is the US Department of Education Office of Postsecondary Education Equity in Athletics Disclosure Act (EADA) expense and revenue data that Shulman and Bowen [2] used in their study.
A flexible single-product cost function is utilized to analyze the average total cost per athlete for each school. The model proposed to define average total cost within college athletics is a combination of a modified version of the model used by Koshal and Koshal [3] and inclusion of the three main cost drivers of expenditures in college athletics suggested by Schulman and Bowen [2] in their book The Game of Life.
The average total cost function utilized is defined as follows: ATC = + β1UNDUP + β2UNDUP2 + β3ENROLLMENT + β4ENDOWMENT + β5SANBODY + β6WINPER + β7BREADTH + β8SATACT + β9FOOTBALL + µ. Where is a constant and β1, β2, β3, β4, β5, β6, β7, β8, and β9 are coefficients of UNDUP, UNDUP2, ENROLLMENT, ENDOWMENT, SANBODY, WINPER, BREADTH, SATACT, and FOOTBALL. ATC is defined as athletic department operating expense divided by the number of unduplicated athletes. UNDUP is the number of athletes that are not counted twice
Fifth Annual SC Upstate Research Symposium
170 Sponsors: Stäubli, Spartanburg Regional Healthcare System, EPSCoR/IDeA RS grant.
for dual sport participation. ENROLLMENT is the number of students enrolled at the institution. ENDOWMENT is included as a wealth factor. It is the actual value of the institution’s endowment. SANBODY is the sanctioning body of the institution. (NCAA I, NCAA II, NCAA III, NAIA II, NAIA I, or Other). WINPER is the winning percentage of the major sport of the institution (i.e. Football or Men's Basketball). BREADTH is the number of different teams representing the institution. FOOTBALL is a utilized to indicate the presence of a football team within the institution. µ is a random error term. In order to obtain a U-shaped average total cost curve, the expected sign of the coefficients of UNDUP and UNDUP2 are β1<0 and β2>0 respectively.
A correlation research method is used to analyze the data for this study. Correlation research can be relational or predictive in nature. A regression analysis is utilized to determine the correlation between athletic department size and average total cost per athlete. “In general, multiple regression is a highly flexible data analysis procedure that may be used whenever a quantitative variable (dependent variable) is to be studied in relationship to, or is a function of, any factors of interest (independent variables)” [4]. The regression analysis is also useful in determining the coefficients for UNDUP, UNDUP2, ENROLLMENT, ENDOWMENT, SANBODY, WINPER, BREADTH, SATACT, and FOOTBALL.
RESULTS The regression results for average total cost was as follows: UNDUP and UNDUP2 are both statistically significant. An examination of the coefficients for UNDUP and UNDUP2 reveal the presence of economies and diseconomies of scale respectively. Other independent variables that are statistically significant are ENROLLMENT, BREADTH, FOOTBALL, NCAA II, NCAA I, NAIA I, and NAIA II. Independent variables that were not statistically significant were ENDOWMENT, SATACT, WINPER, and OTHER. The Adjusted R-Square value is .631 suggesting that the formula accounted for 63.1% of the variation in average total cost.
The coefficient for UNDUP is -31.073, suggesting that each additional athlete added to an athletic department will decrease average total cost by $31.073. The coefficient for UNDUP2 is .024, revealing that for every unit increase in UNDUP2 $.024 is added to average total cost. The coefficient for ENROLLMENT is 1.158, indicating that for every additional student enrolled there is a $1.158
increase in average total cost. The coefficient for BREADTH is 175.948, suggesting that for every additional team added to an athletic department an additional $175.948 in average total cost will be added. The coefficient for FOOTBALL is 1966.129, suggesting that the presence of a football program within an institution adds $1,966.129 to average total cost. Finally, the coefficients for NCAA II, NCAA I, NAIA I and NAIA II were 5398.436, 14201.657, 5251.637, and 1291.167 respectively, indicating that as a sanctioning body an NCAA II affiliation adds $5,398.436 additional to average total cost, while an NCAA I affiliation adds $14,201.657 to average total cost, an NAIA I affiliation adds $5,251.637 to average total cost and an NAIA II affiliation adds $1,291.167 to average total cost.
The ATC curve for intercollegiate athletics is clearly U-shaped, indicating that economies of scale and diseconomies of scale are present. From the data used in the regression and an examination of the cost curve, the optimal average total cost minimizing point can be calculated. Calculating the cost minimizing point will yield the maximum size of the athletic department. Athletic departments under 648 athletes are operating in an area where economies of scale can still exist. Athletic departments operating over 648 athletes are operating in areas of diseconomies of scale. Thus, adding more athletes will cause average total cost to increase.
CONCLUSIONS It is possible to model the cost structure in college athletics with a flexible single-product cost function. Using the data for athletic departments for the academic year 2004-2005, the statistical results of the study clearly imply the existence of economies of scale within college athletics. The statistical results of this study also imply that many athletic departments can reduce their average total cost per athlete by increasing the number of participants in the athletic department. Additionally, the results suggest that there are a few institutions that may be producing athletic output at a diminishing level of returns, that is, at an inefficient level.
REFERENCES [1] McLaughlin, G., Montgomery, J., Smith, A., Mahan, B., &
Broomall, L. (1980). Size and efficiency. Research in Higher Education, 12, (1), 53-66.
[2] Shulman, J., & Bowen, W. (2001). The game of life: College sports and educational values. Princeton: Princeton University Press.
[3] Koshal, R., & Koshal, M. (1995). Quality and economies of scale in higher education. Applied Economics, 27, 773-778.
[4] Martella, R., Nelson, R., & Marchand-Martella, N. (1999). Research Methods: Learning to become a critical research consumer. Needham: Allyn & Bacon.
March 27th, 2009
Sponsors: Stäubli, Spartanburg Regional Healthcare System, EPSCoR/IDeA RS grant. 171
Pro-Israel Campaign Contributions and Congressional Votes Trevor Rubenzer and Christopher Weidensee
Department of History, Philosophy, Political Science and American Studies University of South Carolina Upstate
800 University Way, Spartanburg, SC 29303 [email protected]
Abstract - To what extent are ethnic minority interest groups able to influence U.S. foreign policy? Current case study research has identified several factors that may condition the ability of diasporic groups to influence foreign policy toward “ancestral homelands.” One set of conditions focuses on the ability of ethnic identity groups to mobilize the necessary resources to make significant campaign contributions in the hope of influencing political outcomes. To this point, existing studies have been unable to isolate the impact of campaign contributions from other factors that may influence U.S. foreign policy decision-making. The current study uses a mixture of statistical techniques in an attempt to determine the impact of ethnic minority interest group, specifically pro-Israel political action committee, campaign contributions on foreign policy decisions in the U.S. House of Representatives. Results from the study indicate that ethnic identity groups do not have an impact on U.S. foreign policy toward Iran. Keywords — United States foreign policy; foreign policy; Israel; political action committees
INTRODUCTION In 1959, Lawrence H. Fuchs noted, “Despite general awareness of the mutual impact of foreign affairs and the claims of minority groups, there has been surprisingly little systematic examination of the results of this process” [1]. Several scholars have since responded to Fuch’s call for the advancement of knowledge concerning the impact of ethnic minority interest groups on U.S. foreign policy outcomes. However, there remains a great deal of debate concerning the scope and nature of diasporic influence on U.S. foreign policy. Proponents of ethnic minority influence argue that diasporic communities in the United States are often successful in their efforts to shape foreign policy. Smith argues that “ethnic groups have power to influence American foreign policy, and they have an acknowledged right to exercise this power [2].
In spite of significant progress in the past several decades, the systematic study of ethnic minority influence on U.S. foreign policy remains an incomplete enterprise. The current literature lacks a systematic test of any of the criteria that are thought to condition ethnic minority influence on U.S. foreign policy. The current study is designed to test the proposition that ethnic identity group campaign contributions are capable of influencing
U.S. foreign policy decision-making in Congress. Specifically, we test the impact of campaign contributions by the pro-Israel identity group on congressional foreign policy decisions related to U.S. foreign policy toward Iran. We are interested in the pro-Israel group because they are often highlighted as the most powerful identity group lobby in the United States. [3]
THEORY AND HYPOTHESES We would argue, based on existing evidence that the overall role of Congress on U.S. foreign policy is strong enough to warrant the serious consideration of the impact of PAC contributions on foreign policy decisions. Meernik argues that the end of the Cold War created more opportunities for Congressional influence on U.S. foreign policy. [4] Hersman argues that the rise of individualism and the collapse of pure hierarchy in U.S. foreign policy making have cleared the way for increased congressional entrepreneurship. [5] Carter and Scott argue that foreign policy entrepreneurship in Congress has become an increasingly important determinant of U.S. foreign policy. [6] Overall, it appears that Congress has a strong enough role to play in U.S. foreign policy that the relative permeability criterion is worth further consideration.
On the specific issue of diasporic influence, there are several potential examples of Congressional influence over U.S. foreign policy worth noting. Congress initiated the Turkish embargo in response to the invasion of Cyprus. In the Helms Burton Act, Congress removed much of the presidential flexibility involved with modifying and administering the Cuban embargo. Congress has continued to discuss the Armenian Genocide Resolution at various levels, in spite of presidential requests for Congress not to even consider the resolution based on the fear of angering Turkey. Congress has also blocked or allowed the sale of weapons to Israel and several Arab states. None of these examples are designed to prove directly that diasporic interests are powerful. Rather, they are intended to demonstrate that Congress plays an important role on foreign policy issues that matter to ethnic identity groups.
Should we expect then that campaign contributions have an impact on congressional

Fifth Annual SC Upstate Research Symposium
172 Sponsors: Stäubli, Spartanburg Regional Healthcare System, EPSCoR/IDeA RS grant.
foreign policy decisions relating to diasporic issues? Smith clearly answers the question of influence via contributions in the affirmative by arguing, “Through contributing money to the campaigns of candidates for the presidency and Congress, ethnic activists have another valuable source of access to decision makers.” [7] While no diasporic PAC is among the top ten campaign contributors, scholars often argue that diasporic PAC money is comparatively easy to acquire because of the relatively narrow focus of such PACs and the lack of competition (or at least the lack of concentrated competition) on issues of importance to diasporic PACs. [8] In other words, the political cost of compliance with diasporic interest groups is low compared to the value of their campaign contributions.
Our research hypothesis draws on the basic theoretical proposition made by proponents of diasporic influence that campaign contributions are one way to influence congressional voting behavior. Specifically, we argue that the probability that a Representative will act in a manner consistent with the pro-Israel position will increase as his/her campaign contributions from pro-Israel PACs increases.
DATA AND METHOD The current study draws on a logistic (maximum likelihood) regression to test our hypothesis concerning the impact of campaign contributions on legislative behavior. The unit of analysis in the logistic regression for the Cuban embargo is each Representative's vote on two amendments to the 2007 Defense Bill. One amendment would have specifically blocked an invasion of Iran without prior congressional authorization. The second amendment would have blocked money from the bill for being used to develop contingency plans for an invasion of Iran. Both amendments were opposed by the pro-Israel lobby on the basis that their passage would strengthen Iran. Both Amendments failed. [9] The dependent variable in the Cuban analysis is the vote of each member of the House of Representatives on each of the amendments. We code “yea” votes as 1 and “nay” votes as 0. As a result, we expect the coefficient for pro-embargo PAC contributions to be negative.
The most important independent variable in the analysis is the amount of campaign contributions to each member of the House of Representatives from pro-Israel political actions committees during the 2006 election cycle (the last full election cycle before the vote). We measure campaign contributions in thousands of dollars, which aids in substantive interpretation of the statistical results. Contribution data are drawn
from the Center for Responsive Politics and verified with Federal Elections Commission mandatory filings.
FINDINGS Our most surprising finding is a null finding. Specifically, we found that campaign contributions had no statistically significant impact on the propensity of Representatives to take the pro-Israel position on the two amendments we examined. The coefficient signs, as expected, were negative, indicating that the direction of any relationship is in the predicted direction. However, when we examined the percentage chance of a change in vote for each thousand dollar increase in campaign contributions, we found that the increase amounts to less than one tenth of one percent for each thousand-dollar increase in contributions. Clearly, at least in this case, campaign contributions are not capable of buying votes directly.
Amongst our control variables, only political party affiliation crossed the threshold of statistical significance. As one might expect, the votes on both of these amendments occurred, at least in part, along party lines. Democrats were more likely to vote to restrict the President, while Republicans were more likely to vote against restricting the President. The level of statistical significance for the party variable suggests that it has the single strongest impact on vote choice. We also included a variable measuring the famous freshman effect (the idea that first-term Representatives vote differently than seasoned Representatives). Our results suggest that the freshman effect has little impact on vote choice on the two amendments in question.
CONCLUSIONS Overall, our results suggest that congressional votes may be harder to purchase than is often assumed in the literature. It is important to recognize, however, that our initial analysis for this paper only covered two amendments to a single piece of legislation. Future research must expand the scope of this test by examining other pieces of legislation across multiple sessions of Congress. This is especially true in light of previous findings indicating that political action committee money can have an impact on votes in the House of Representatives. [11]
ACKNOWLEDGMENTS The authors would like to acknowledge the University of South Carolina, Upstate for providing research assistant funds to further this project.

March 27th, 2009
Sponsors: Stäubli, Spartanburg Regional Healthcare System, EPSCoR/IDeA RS grant. 173
REFERENCES [1] Fuchs, Lawrence. H. 1959. “Minority Groups and
Foreign Policy.” Political Science Quarterly 74(2): 161-175.
[2] Smith, Tony. 2000. Foreign Attachments: The Power of Ethnic Groups in the Making of American Foreign Policy. Cambridge, MA: Harvard University Press.
[3] Mearsheimer, John J. and Stephen M. Walt. 2006. “The Israel Lobby.” London Review of Books 28(6).
[4] Meernik, James. 1993. “Presidential Support in Congress: Conflict and Consensus on Foreign and Defense Policy. The Journal of Politics 55(3): 569-587.
[5] Hersman, Rebecca K.C. 2000. Friends and Foes: How Congress and the President Really Make Foreign Policy. Washington, D.C.: Brookings Institution Press.
[6] Carter, Ralph G. and James M. Scott. 2004. “Taking the Lead: Congressional Foreign Policy Entrepreneurs in U.S. Foreign Policy.” Politics and Policy. Vol. 32(1): 34-70.
[7] Smith, Tony 2000. IBID [8] Mearsheimer and Walt, 2006. IBID [9] House of Representative Roll Call Votes 364 and 365.
May 16, 2007
Fifth Annual SC Upstate Research Symposium
174 Sponsors: Stäubli, Spartanburg Regional Healthcare System, EPSCoR/IDeA RS grant.
Strategic Human Resources Plan for the SWU Marketing Department
Diana West, Joan Burgess, Leesa Inabinet, Susan Jones, Kirk Smith, and Lee Kizer School of Business
Southern Wesleyan University 907 Wesleyan Drive, Central, SC 29630
{joan.burgess, leesa.inabinet, susan.jones, kirk.smith, Lee Kizer, diana.west}@mail.swu.edu
Abstract - The publication describes a proposed strategic human resources plan for developing a marketing department to serve the needs of Southern Wesleyan University (SWU), a South Carolina based university with various satellite campuses. The emphasis of the publication is formulation of a plan which enables Southern Wesleyan University to transition from an outsourced marketing department to an internal marketing department. The proposed marketing department would be phased in within a 33 week period using a systematic implementation strategy. Keywords – strategy implementation, marketing department, organizational structure, human resources plan, employee recruitment
INTRODUCTION
The purpose of our work was to guide Southern Wesleyan University (SWU) in the transition from an external marketing department to an internal marketing department in a way that will provide a competitive advantage over regional universities. STRATEGY FORMULATION A SWOT analysis was conducted to determine the current Adult Graduate Student program’s strengths, weakness, opportunities and threats in an effort to discover potentially untapped markets for student recruitment as well as untapped professional markets for recruitment of our proposed marketing department employees [1]. STRATEGY IMPLEMENTATION Our strategy is to develop an internal marketing department for SWU that will be ready to assume marketing responsibilities for the university’s MBA program by August 31, 2009. The proposed organizational structure of SWU’s internal marketing department was developed based on functional similarity to the current structure. This structure reflects our recommendation to place SWU’s internal marketing department under the Vice President for Enrollment Services and Student Affairs. Beyond being a natural fit within this
existing department, this decision would provide the greatest efficiency and functionality in the short term. Currently, the focus of our marketing department is on the MBA program but may expand into marketing all programs offered by the university in the future. This would require adding a Vice President of Marketing position and several additional marketing specialist positions. JOB ANALYSIS AND DESIGN The first step toward our strategy implementation is job analysis and job design necessary to perform the needs of the marketing department. We will take a motivational approach for our job design, focusing on job characteristics that affect psychological meaning and motivational potential [2].
The nine positions we would create in our proposed marketing department include director of marketing, administrative assistant, marketing manager, creative manager, public relations manager, marketing specialist, campus recruiter, graphic design specialist and public relations specialist. If the marketing department grows large enough to include a Vice President of Marketing, we will add the following position to the top of our departmental organizational chart. The Vice President of Marketing would report directly to the University President[3].
HUMAN RESOURCES PLANNING TIMELINE In order to ensure our chances for successfully transitioning from outsourced marketing to internal marketing, we will follow a systematic implementation strategy. This systematic implementation strategy will ensure that we address our true business needs and have all the resources needed to ensure an effective and sustained implementation[4]. The following timeline is provided to ensure that we have a focused project management approach to our implementation:

March 27th, 2009
Sponsors: Stäubli, Spartanburg Regional Healthcare System, EPSCoR/IDeA RS grant. 175
Weeks 1-8: Develop marketing department organizational structure, job analysis and design and job descriptions. Present Human Resource (HR) strategic plan to the Dean of the Business School who will present to upper management for approval. Receive personnel requisition from VP of Enrollment Services (hiring manager) and post Director of Marketing position on SWU website. Advertise in related media sources. Screen candidates who apply online and forward the top ten qualified candidates to the hiring manager[5]. Weeks 9-16: Conduct phone interviews and narrow the applicant pool to the top five applicants. Top five candidates come to SWU campus for tour and interviews. VP of Enrollment Services selects the top two to three candidates for second interview with the peer interview committee. Top three candidates return for the second interview. VP of Enrollment Services conducts reference checks on top two candidates. Hiring decision is made for the Director of Marketing position. VP of Enrollment Services consults with HR on salary offer and makes job offer to top candidate. Weeks 17-24: The remainder of the positions for the proposed Marketing Department will be filled using the same process as described during weeks five to eight. The Director of Marketing begins development of a marketing strategic plan and works with the Director of Facilities to determine options for office space in Columbia, Greenville, Charleston, and Augusta for each Campus Recruiter. Offices for campus recruiters are confirmed and outfitted with furniture, computers, phones and necessary office equipment. Weeks 25-33: Department orientation is planned for new employees who will begin work on August 31, 2009. Marketing Specialist, Campus Recruiters, Graphic Design Specialist and Public Relation Specialist begin work with first day of employment in new employee orientation. Implementation of marketing strategic plan begins with focus on marketing and recruitment of students for the next adult MBA program which begins in January, 2010[6].
CONCLUSIONS
During the process of carrying out our implementation strategies, we hope to generate new competitive advantages. We also plan to further capitalize on SWU’s human capital and
other organizational resources in developing our potential marketing department.
ACKNOWLEDGEMENTS A deep and special thank you to all who contributed to the writing of this paper and to Dean Royce Caines and Dr. Lee Kizer for the opportunity to participate in the 5th Annual SC Upstate Research Symposium.
REFERENCES [1] Hollenbeck, Noe and Gerhart Wright: Human
Resource Management: Gaining a Competitive Advantage.
New York: McGraw-Hill Irwin, 2008. [2] College/University B. Personal Interview, December
17, 2008. [3] College/University A. Personal Interview, December
22, 2008. [4] HR Consultant A. Personal Interview, January 11,
2009. [5] Latham, Debbie – Enrollment Representative, SWU
Central Office, Personal Interview, 15 January 2009. [6] Studer, Quint. Hardwiring Excellence. Florida:
Fire Starter Publishing, 2003.
Fifth Annual SC Upstate Research Symposium
176 Sponsors: Stäubli, Spartanburg Regional Healthcare System, EPSCoR/IDeA RS grant.
The Classroom of the Future: Global, Interactive, Narrative Liezell Bradshaw1, Tasha Thomas2, and York Bradshaw3
1Office of Academic Affairs, 2Department of Languages, Literature & Composition, 3College of Arts and Sciences
University of South Carolina Upstate 800 University Way, Spartanburg, SC 29303
{LBradshaw, TThomas, YBradshaw}@uscupstate.edu
Abstract — Schools, businesses, and other organizations are increasingly aware that the world is more interconnected than ever before. Consequently, they are looking for ways to educate students, employees, and citizens about global processes, cultures, and events. This paper discusses a “global classroom experience” that uses the Internet, digital storytelling, and interactive video conferences to teach students at more than 20 schools in three different countries. The project has produced a number of tangible benefits and also advanced theoretical and pedagogical models related to future classrooms. And, although the global classroom experience has been utilized primarily in educational settings, it also has application to a wide variety of businesses and other organizations. Teachers, managers, organizational leaders, information technology specialists, and social scientists will find the results interesting and important. The paper also discusses how the experience can be expanded in a way that may overcome some of the inequalities (such as lack of Internet access) that prevent many citizens in the developing world from participating in the project. Keywords — Technology, Teaching, Globalization, Poverty
INTRODUCTION There is no question that information technology has altered the world economy in many ways[1]. International capital flows, global trade, education, and the exchange of electronic information have changed the way that companies, schools, and businesses operate. Distance and place are less and less important as information technologies facilitate connections between people and organizations, regardless of their geographic location. The problem, of course, is that not everyone has access to information technology resources.
Global inequalities in information technology raise several important issues: Inequality has produced a global digital divide,
in which some countries have much more access to information technology than other countries. Across Africa, for example, only 3.6 percent of the population is able to use the
Internet on a regular basis, well below the world average of 16.9 percent. By contrast, twenty-four countries (primarily in Europe and North America) have Internet usage rates that exceed 60 percent and five are higher than 70 percent[2].
The digital divide results in unequal access to
resources that promote teaching and learning. Students in developing countries have far less access to computers, the Internet, software, digital cameras, and other technology. Lack of access makes the digital divide even larger, because so many educational resources are available on-line. This also places teachers in developing regions at a disadvantage, as they struggle to gain access to the latest information, much of which is available over the Internet.
“Information poverty” in developing countries
is, according to some scholars, an ethical issue precisely because it is correlated with other types poverty and under-development[3,4,5]. Accordingly, solving the problem of information poverty (a by-product of the digital divide) is a matter of social justice.
This paper discusses a project that is attempting to “level the technology playing field” by including under-represented populations in the U.S. and two other countries.
THE GLOBAL CLASSROOM EXPERIENCE In 2002, a class at the University of Memphis and a class at the University of Pretoria in South Africa initiated a “global classroom” experience that included instruction through the Internet, digital photographs, and interactive video conferencing. The successful project was relocated to the University of South Carolina Upstate in 2004, where a class continued to work with a class at the University of Pretoria. Moreover, in 2005, Spartanburg High School and the Pretoria High

March 27th, 2009
Sponsors: Stäubli, Spartanburg Regional Healthcare System, EPSCoR/IDeA RS grant. 177
School for Girls started a similar project, which has also been very successful.
Then, in an effort to reach even more young people, the global classroom experience began in 2008 to add elementary and junior high students to the list of participating schools. By 2009, the project included more than 800 students (grades 3-12) in the following areas: An elementary school and a junior high school
in Rancho Santa Fe, California. Three elementary schools, two junior high
schools, and two high schools in Spartanburg, South Carolina.
An elementary school and a junior high school in Baltimore, Maryland.
Five elementary schools, five junior high schools, and two high schools in South Africa (in different regions of the country).
An elementary school, a junior high school, and a high school in Nairobi, Kenya.
The students participate in several different types of activities, divided into appropriate age groups (grades 3-4, 5-6, 7-9, high school): Global discussions over the Internet. On
dedicated Blackboard sites, the students participate in regular international discussion on topics related to academics, politics, popular culture, entertainment, sports, and similar topics. Each student is encouraged to participate in such discussions at least once a week. Teachers monitor the discussions and pose appropriate questions. Students learn a great deal from each other on both academic and nonacademic topics.
Compose digital stories that are shared cross-
culturally. For a period of 8-10 weeks, the students formulate digital stories that are shared on the global classroom web site. The theme of the first round of digital stories was, “The Place I’m From” (mini-autobiographies) and the theme of the latest round is, “Improving Our World” (looking at different ways to help the world). The digital stories are an especially effective teaching tool because they improve writing, facilitate cross-cultural communication and learning, and promote technology literacy.
Participate in interactive video conferences.
Once or twice a term, students participate in live, interactive video conferences with other students around the world. These conferences
are particularly valuable because they enable students to dialogue about topics that have emerged during digital storytelling and Internet discussions. The video conferences also enable students to virtually “meet” their colleagues in other regions, an importance fact as we strive to put a “face” on different cultures around the world. Many students report that although they enjoy all aspects of the global classroom experience, they are especially fond of the video conferences.
There three experiences lead to a dynamic multimedia experience that fits into the “standards curriculum” required by schools and teachers.
LESSONS LEARNED On the positive side, the global classroom experience has been embraced by a wide variety of schools. Although our students come from diverse economic, regional, and ethnic backgrounds, the majority of students are from under-represented populations. This experience has provided important instruction in the fields of writing, technology, critical thinking, global knowledge, and cultural diversity. Again, teachers are pleased that they can fit the global classroom experience into the regular curriculum that is assessed by a well-defined set of “standards.”
All of the students, but especially those from economically challenged schools and regions, have benefited from the experience because it has broadened their horizons. Many young students have never been outside of their state or even city, much less to another country. This experience has introduced them to an entirely new world, one that has similarities and differences compared to home. It has also introduced them to a new set of friends and colleagues in different regions of the world. Moreover, teachers have also benefitted from the experience. Instead of asking students to read about different cultures and lifestyles, teachers and students alike experience these differences.
The global classroom experience uses information technology to disseminate knowledge, provide new experiences, and, in a very real sense, shrink the world for young students. The experience teaches that people share many similarities and can appreciate their differences as well.
On the negative side, the digital divide prevents many young people from participating in the global classroom experience. Although we have included large numbers of children from under-represented populations, we are not able to include many others. In South Africa, Kenya, and other

Fifth Annual SC Upstate Research Symposium
178 Sponsors: Stäubli, Spartanburg Regional Healthcare System, EPSCoR/IDeA RS grant.
developing countries, the vast majority of schools do not have adequate computer labs and Internet access. Many rural schools do not even have electricity. So, we are working to provide software, hardware, and Internet access for schools. We are trying to narrow the digital divide and thereby reduce information poverty, but we realize that this is a challenge that is far beyond the scope of this project.
CONCLUSIONS The global classroom experience has introduced a unique learning experience into more than 20 schools across three countries. Information technology has introduced a paradox. On the one hand, it has enabled a number of schools in the U.S. and Africa to become more integrated into the world system. It has also transformed their classrooms, introducing multimedia instruction in a global context. On the other hand, information technology has widened the gap between the “haves” and “have nots” across countries. Schools without access to computers and the Internet are left out, underscoring the information poverty that characterizes the current structure of the world system. This challenge can be addressed through the introduction of critical infrastructure, training, and education, all of which will bring additional opportunity and knowledge to people in developing countries[6].
REFERENCES [1] S. Sassen. Cities in a World Economy, 3rd edition,
Pine Forge Press, 2007. [2] Internet World Stats., 2007, www.internetworldstats
.com/stats.htm [3] R. Capurro, “Ethical Challenges of the Information
Society in the 21st Century,” International Information and Library Review, vol. 32(3-4), pp. 257-276, 2000.
[4] J. Britz, “To Know or not to Know: A Moral Reflection on Information Poverty,” Journal of Information Science, vol. 30(1),pp. 192-204, 2004.
[5] J. Britz and J. Blignaut, “Information Poverty and Social Justice,” South African Journal of Library and Information, vol. 67(2), pp. 63-69, 2001.
[6] Y. Bradshaw, J. Britz, T. Bothma, C. Bester, “Using Information Technology to Create Global Classrooms: Benefits and Ethical Dilemmas,” International Review of Information Ethics, vol. 7(09/2007), pp. 1-9), 2007.
March 27th, 2009
Sponsors: Stäubli, Spartanburg Regional Healthcare System, EPSCoR/IDeA RS grant. 179
A Descriptive Analysis of Quality Online Practices as Perceived by West Virginia Higher Education Faculty
Michael H. Murphy Department of Teacher Education
Lander University 320 Stanley Avenue, Greenwood, SC 29649
Abstract — In 2007, a non-parametric study was conducted that examined the extent West Virginia higher education faculty agreed their online courses reflected quality online practices. These online practices were identified by an extensive literature review for the development, delivery and teaching, in an online educational environment. The identified quality practices were: support, collaboration and teamwork, flexibility, feedback, assessment and adult learning techniques. The study incorporated measures of central tendency and the Kruskal Wallace test for significance to analyze the data. The instrument used in the research was a cross-sectional, self-reporting survey. The participants of the study were West Virginia higher education faculty who taught in online environments during 2006. Results of the survey yielded that overall West Virginia higher education faculty agreed their online courses reflected quality online practices; however, further analysis revealed faculty do not agree with all of the quality online practices targeted within the survey. There is evidence from the study that indicate the areas of institutional support, collaboration and teamwork and areas of assessment are not well utilized by faculty. These areas of disagreement with quality online practices provides valuable information there is an ongoing need for sustainable professional development and mentoring opportunities for online faculty. Keywords — Online education, Quality online practices.
INTRODUCTION The explosive growth of online degree programs in the past few years has fundamentally altered the practice of distance education and has provided new methods for delivering higher education online. The Sloan consortium [1],[2],[3] suggested that over 2.6 million students enrolled in online education courses in the fall of 2004. As more college students turn to online educational environments, it has become necessary for higher education institutions to adjust their delivery methods. Educators are redefining the physical space of the classroom with the World Wide Web and with communities of learning residing within cyberspace.
Thus, instruction is not bound by time and physical space; learning opportunities can exist anywhere, and at any time. This idea can be a cathartic revelation to institutions that are
struggling for classroom space and funding. However, this “new frontier” of learning generates important questions about whether or not the Internet can provide the same quality of learning and academic standards that are prevalent in the traditional institutional setting. In fact, many faculty lament the fact that online educational environments are springing up on the Internet are not reliable resources for accredited degrees. Thus, due to the onset of numerous online educational environments outside of established accredited institutions, inconsistencies in the quality online education have compelled higher education accreditation associations to assess online teaching environments. As far back as 1998, the Council for Higher Education Accreditation (CHEA) [4] made recommendations for online learning environments. In more recent years the Institute for Higher Education Policy (IHEP) [5] and the Southern Regional Education Board (SREB) [6] have proposed recommendations for quality online practices for Internet based learning.
It is important to note that faculty are responsible for the delivery of online instruction and higher education faculty must be rigorous in providing quality educational opportunities to students. Highly effective instructional practices are and will continue to be faculty roles. An extensive review of relevant literature indicates that a limited amount of research has been conducted examining faculty experiences in quality online education. In fact, there has been far more support and research gathered on student experiences in online instruction. If faculty members understand that teaching online can provide a sound educational opportunity and can enhance the learning experience in higher education, then they will value it as a teaching instrument.
This study was conducted to examine the extent to which West Virginia higher education faculty agree their online courses reflect best practices, as identified by the literature, for teaching in an online educational environment. The identified best practices are: (a) support, (b) collaboration and teamwork, (c) flexibility, (d)
Fifth Annual SC Upstate Research Symposium
180 Sponsors: Stäubli, Spartanburg Regional Healthcare System, EPSCoR/IDeA RS grant.
feedback, (e) assessment, and (f) adult learning techniques.
This research was non-parametric and descriptive in nature. Data were acquired from the survey respondents gained from the 12 West Virginia four year colleges that participated in the study. Of the 545 faculty selected to participate in the study, 290 returned the Survey of Online Educational Practices in the first mailing. This represented 53% of the sample population. Although the mailings resulted in 290 returned surveys, the number of responses for each statement on the survey varied due to the nature of a self-reported survey where some of the participants chose not to respond to every item.
The analyses of the data collected from the survey utilized descriptive statistics for measures of central tendency for individual statements and composite groups of statements for testing of the research question. These measurements provided an overall representation of the extent West Virginia higher education faculty agreed their online courses reflected best practices as defined by the literature review.
Furthermore, the demographic data were analyzed across all grouped years of teaching in higher education, grouped years of teaching online, job classification (tenured and non-tenured) and job status (full time and part-time). The Kruskal-Wallis test for significance was used to determine if each of these categories yielded significance between groups on the 24 individual statements and groups within the Survey of Online Educational Practices.
CONCLUSIONS High quality in online teaching requires more than supplying a set of assignments to students and testing their ability to retain information. Quality online practices require practical virtual classroom skills and a deep understanding of various instructional methods and techniques to help students learn. Based on the statistical findings, conclusions yielded that overall West Virginia higher education faculty agreed with the statements on the Survey of Online Educational Practices that their courses reflected quality online practices as supported by the comprehensive literature review. The Likert rating scale utilized in the study yielded a composite mean of 3.75 and a mode of (5) “Agree.
Although there is overall agreement that West Virginia higher education faculty adhere to quality online practices as delineated in the literature; participants in the study indicated a number of disagreements with the literature concerning their use of quality online educational practices. There
was also disagreement that institutions provide the infrastructure and policies needed to have a quality online education. Throughout the data, the respondents to the study appeared to utilize the quality online practices of feedback, flexibility, assessment, faculty support, technological support, and adult learning techniques. Nonetheless, there is evidence from the survey results that indicate the areas of institutional support, collaboration and teamwork and even areas of assessment are not well utilized by faculty. Therefore, although not statistically conclusive, it is implied from this study that these areas of quality online educational practices are not being fully integrated in West Virginia online educational opportunities.
Even though it is true that no solitary online instructional practice or strategy is superior to any other online practice; there are quality online practices that are supported by educational literature [1],[2],[3],[4],[5],[6]. Furthermore, within this study, the areas of institutional support, collaboration and teamwork and areas of assessment are not well utilized by faculty in higher education facilities in West Virginia. These areas of disagreement with quality online practices provide valuable information that there is an ongoing need for sustainable professional development and mentoring opportunities for online faculty. There is also a need for institutions to provide policies and procedures that are reviewed and revised by faculty and other higher education stakeholders on a regular basis due to the ever-changing nature of technology and online education.
REFERENCES [1] Sloan-Consortium (2002) Elements of Quality Online
Education. SCOLE Publishing, Needham, MA. [2] Sloan-Consortium. (2005).Growing by Degrees: Online
Education in the United States, 2005. Retrieved on May 5, 2006 from: http://www.sloan-c.org/publications/survey/pdf/growing_by_degrees.pdf
[3] Sloan-Consortium (2004) Entering the Mainstream: The quality and Extent of Online Education in the United States, 2003 and 2004. Retrieved on January 17, 2005 from: http://www.sloan-c.org/publications/survey/pdf/entering_mainstream.pdf
[4] Council for Higher Education Accreditation [CHEA](1998). Assuring quality in distance learning. Washing, DC: Institute for Higher Education Policy. Retrived April, 8, 2005 from: http://www.chea.org/untitled_folder/Chronicle/vol1/no11/index.cfm.
[5] Institution of Higher Education Policy [IHEP] (2000). Quality on the line: Benchmarks for the success in Internet-base distance education. Retrieved March 25, 2005 from: http://www.ihep.com/Pubs/PDF/Quality.pdf
[6] Southern Regional Education Board (2001). Principles of Good Practice: Educational Technology Cooperative.
March 27th, 2009
Sponsors: Stäubli, Spartanburg Regional Healthcare System, EPSCoR/IDeA RS grant. 181
Undergraduate Community Translators and Interpreters: Professional Foreign Language Practice in Non-Profit,
Food Service, and Health Care at Home and Abroad
Douglas A. Jackson, Instructor of Spanish, USC Upstate Kayla Crim, Spanish Education Major
William Davis, Biology Major & Spanish Minor Dierrias Booker, English Major & Spanish Translation/Interpreting Minor Eric Guerrero, Nursing Major & Spanish Translation/Interpreting Minor Melissa Trejo, Nursing Major & Spanish Translation/Interpreting Minor
Languages, Literature and Composition University of South Carolina Upstate
800 University Way, Spartanburg, SC 29303 [email protected]
Abstract - The ever-increasing Spanish-speaking population of the Upstate of South Carolina is forcing local enterprises to provide bilingual services for community outreach, customer service, and medical purposes. The need for bilingual professionals has never been more in demand. Is your language department addressing this need? Is your nearest competitor doing it for you? Is anyone meeting it?
This presentation will focus on how to establish practical learning experiences for students while simultaneously meeting local demand for community interpreters. Through collaborations between local organizations, technical colleges, and other on-campus departments, students at the University of South Carolina Upstate are serving the Spanish-speaking population, providing bilingual services for businesses, and gaining practical professional experience while completing coursework. Examples of student internships and service projects will be highlighted to exhibit how to develop a sustainable community interpreting program. Keywords — Translation, Interpreting, Foreign Languages.
INTRODUCTION The University of South Carolina Upstate began offering a minor in Spanish Translation and Interpreting in the fall of 2007 after several one-time only courses in translation and interpreting were offered to test the level of student interest in this area of study. Many upper-level Spanish students registered for these developmental courses, so the minor coursework was developed to diversify professional Spanish course offerings in the Language, Literature and Composition Department. Since its inception, student interest in SSPN 311: Introduction to Non-Literary Translation and SSPN 312: Introduction to Interpreting has continued to grow.
The skills necessary to become a professional translator or interpreter are very technical in nature. Therefore, additional training beyond the introductory level is truly necessary to professionalize our students’ ability to become employed in this area. Several local and regional organizations have requested assistance in offering access to their services in Spanish. The presenters have participated in at least one inter-active program that serves to perfect the abilities that the Spanish translator and interpreter must possess.
SECTION TWO USC Upstate has been involved in Habitat for Humanity of Spartanburg for several years. Community outreach and service form the basic elements of our students’ learning experience. During the fall of 2008 Melissa Trejo worked five hours per week to provide translation and Spanish language services to Habitat for Humanity of Spartanburg County. She provided a translation of the handbook, several applications, and other documentation. Additionally, she initiated the process of providing outreach to the Spanish-speaking population in Spartanburg County.
Melissa dedicated another 5 hours per week to provide documentation in Spanish for a non-profit organization in Tucson, AZ. Melissa worked with former Peace Corps volunteers to offer services to victims of domestic violence. The non-profit organization Safety Connections desperately needed to be able to offer applications and questionnaires to its users. Melissa completed these tasks and her documents are now being used by both organizations.
SECTION THREE Anyone who has worked in the food service industry has had to watch a video on how to prep

Fifth Annual SC Upstate Research Symposium
182 Sponsors: Stäubli, Spartanburg Regional Healthcare System, EPSCoR/IDeA RS grant.
the dishes served by their restaurant. A regional fried chicken chain needed to offer their videos in Spanish for the increasing number of Spanish speaking employees working in the kitchen. A local media specialist contacted Douglas A. Jackson regarding the translation of the script and the voice-over for the videos.
In the name of offering a real-life job for the SSPN 311: Introduction to Non-Literary Translation class in the spring of 2008, the job was converted into a class project. Students were assigned short segments of text in groups of two translators. A project manager was assigned to supervise student work, quality control and organization of the translated script. Melissa Trejo provided the voice-over and dubbing and Eric Guerrero focused on finalizing document editing. Students gained a valuable experience in project management, invoicing, and media translation while providing a necessary service to a regional company.
SECTION FOUR For the last four years Greenville Technical College’s Physical Therapy Assistant program has been offering a two-hour intensive Spanish course for its graduates. Douglas A. Jackson began offering this course as a volunteer in 2006 without any USC Upstate student involvement. The teacher-student ratio was 1 to 18. The group proved to be too large. By 2007, two USC Upstate students who were participating in an Honors section of SSPN 312 assisted in providing language training to the Physical Therapy Assistants. The smaller group activities were much more conducive to language acquisition, but were still too large with a ratio of 7 students to each teacher.
For the fall semester of 2008, the entire SSPN 312 class visited the Greer Campus of Greenville Technical College to provide language training. With 12 Spanish students and 24 Physical Therapy Assistant students, the ratio was reduced to two students per teacher; an optimum efficiency proportion. The feedback from Greenville Technical College students and USC Upstate students was very positive. USC Upstate students Dierrias Booker and Kayla Crim both participated in the event and gained verisimilar experience working as interpreters. This seminar will continue to be offered in this format in the future. By placing students in the role of the instructor they achieve mastery level of the bilingual human anatomy and ambulatory phrases section of the seminar curriculum.
SECTION FIVE Studying abroad is key to the success of any student of translation and interpreting. Giving our Spanish students the opportunity to attend any conference is good, however the opportunity to attend and international conference in Spanish in Mexico is best.
The Organización de Traductores Mexicanos holds its annual conference in Guadalajara, Mexico each November. During the fall of 2008 William Davis accompanied Douglas A. Jackson to attend approximately twelve sessions on the intricacies of working in the international translation and interpreting field. Some presentation topics covered Biblical Translation, Quality Control, Teaching Translation, Teaching Simultaneous Interpreting, Legal Interpreting, and Media Translation. Few undergraduates get the opportunity to participate in international conferences, but USC Upstate has already started making these educational opportunities for its students.
CONCLUSIONS
An additional course entitled SSPN 411: Professional Translation should be offered as part of the sequence for the Minor in Translation and Interpreting. Not all students of this program have or will have participated in a professionalization of their skills. For this reason the most logical step is to progress toward a more advanced course in the field that requires some sort of internship or professional practicum.
ACKNOWLEDGMENTS We would like to thank Dr. Sebastian van Delden of the Center for Undergraduate Research and Scholarship at USC Upstate, Dr. Laura Puckett-Boler of the Student and Diversity Affairs Office at USC Upstate, Ms. Alicia Dittmar of The Greenville Technical College Physical Therapy Program, and all participating students for their vision, professionalism and economic support of these projects.
March 27th, 2009
Sponsors: Stäubli, Spartanburg Regional Healthcare System, EPSCoR/IDeA RS grant. 183
The Marketing and Enrollment Department for Adult MBA Graduate Studies Strategic Human Resources Plan
Barbara Peters, Zeolean Kinard, Deborah Williams, Mamie Whitiker, Howard Green, and Lee Kizer
Adult and Graduate Studies Southern Wesleyan University
Business Department 907 Wesleyan Drive, Central, SC 29630
{bpeters, lkizer}@swu.edu
Abstract — After recognizing and categorizing the educational needs in the upstate South Carolina area, a new initiative was proposed to create a department in order to develop, market and grow the adult MBA graduate program at Southern Wesleyan University. This research document outlines the Strategic Plan and the key points that must be addressed in the areas of SWOT Analysis, Best Practice Studies and job design. Keywords —Strategy Formulation, SWOT analysis, best practices, strategy implementation
INTRODUCTION
Southern Wesleyan University’s Institutional Vision and Mission Statements [1] are dynamic documents that provide for a foundation of focus on growth in order to meet the educational and spiritual needs of individuals and upstate communities. After categorizing these needs, a new initiative was proposed to create a department in order to market and grow the Adult Graduate Studies for the MBA Program. This research document outlines the strategic plan and key points that must be addressed in the areas of SWOT Analysis, Best Practice Studies and job design. STRATEGY FORMULATION In order to meet this initiative, certain parameters need to be established and the service area must be defined to properly access the needs of the project. The goal of the new MBA AGS Recruiting Department is to be fully operational by August 31, 2009. In addition, within the first year, the MBA AGS program is to increase enrollment by 25%. To enable a successful implementation of this plan, a start up budget of $3,700,000 is set for the first year. SWOT ANALYSIS The next step in the Strategy Formulation would be to perform a SWOT analysis [2]of the needs in the service area. The strengths, weaknesses,
opportunities and threats would be identified and prioritized. As part of the SWOT analysis, alumni and business/industry managers would be surveyed to properly determine the extent of program interest and the expectations of potential students and businesses in the area. Based on the initial analysis, facilities in five counties would need to be in place to support all programs and activities required. A plan to partner with local technical colleges for facility and desk use would be implemented as part of the initial strategy formulation
BEST-PRACTICES ANALYSIS
Other area institutions that offer an MBA program to adult learners would be researched to determine the “best practices” employed by them in order to complete a successful recruiting program.[3] Support services from the Human Resources Department will be established in order to reach implementation at the most effective pace.
Attention will be focused on the type of databases that are used by other successful universities and colleges in order to collect information and to identify and track prospects. The types of software support systems used to turn recruitment prospects into enrollees of the MBA program will be researched and compared to the initial goals and needs of each institution. This software should ideally contain recruiter support in case management.
STRATEGY IMPLEMENTATION JOB ANALYSIS
The Human Resource Department, in conjunction with the President’s Cabinet, defines the job requirements for the Director of Marketing and Enrollment, MBA AGS Department. The knowledge, skills, and other abilities required for this position will be detailed using the data collected through the SWOT analysis and study of Best Practices.

Fifth Annual SC Upstate Research Symposium
184 Sponsors: Stäubli, Spartanburg Regional Healthcare System, EPSCoR/IDeA RS grant.
The newly appointed Director of the MBA AGS Department will then work with the Human Resource Department to finalize the human resource needs of the department. Similar positions within SWU will be used as a guide for development of the MBA AGS department’s needs. JOB DESIGN Based on the data collected through the process of job analysis, the following positions will be necessary to create the new department that could function effectively as soon as the implementation process was complete.[4]
Director of Marketing and Enrollment of the Master of Business Adult Graduate Studies Program (MBS AGS Program): This position will report directly to the President of the University. This is the key position that will provide direction, leadership and guidance for the new statewide program. Strong marketing skills are necessary along with a knowledge of technology-oriented operations.
Recruitment Coordinator: The position will report to the Director of Marketing and Enrollment. The responsibilities will include the supervision of all recruiters. Compiling and reporting recruiting data will be an important function of this position. Training of recruiters and follow-up student interviews will also be among the primary duties of this position. This position will ensure a transition from a prospective to an enrolled student. Marketing Tech Support Administration: This position will involve website design and maintenance and will communicate all advertisements through all media including web advertising as well as the traditional paths.
Other Positions may be incorporated into the already established support departments within the university. These positions would include the accountant, administrative assistant and help desk support. HUMAN RESOURCE RECRUITMENT, SELECTION AND TRAINING The first priority is to establish a timeline of activities for the August 31st deadline of full departmental implementation. Concurrently, the establishment of an internship program with current SWU students will also be implemented in order to assist in the development of the MBA AGS department.
Recruitment methods will be employed on both an internal and external level in order to maximize awareness to a large portion of the
qualified job seeking market. Alumni will be specifically targeted for these career opportunities along with recommendations from faculty and university supporters. All candidates must complete the SWU application of employment and give evidence of a Christian testimony and of a willingness to support the beliefs and practices of the campus community. Situational interviews with quantitative ratings will be used. The administration of personality tests will be a part of this interview process.
The position of Director will be the only position that will be interviewed by the President’s council in addition to a six-panel team. The Recruitment Coordinator, Recruiters, and other departmental positions will be interviewed by a six-panel team that will include the newly appointed Director.
The orientation program will consist of a study of the Southern Wesleyan University’s policies and procedure manual and review of the Discrimination and Sexual Harassment Policies. Employees are required to attend training in both cultural diversity and technology during first year of employment. As in all orientations, special attention will focus on the universities Mission Statement, Vision, and Christian Values. Specific job duty training and objectives will be conducted by Human Resources and the MBA AGS Department Director. COMPENSATION A regular benefit package is a part of the planed compensation and is the same as offered to all SWU employees that include a competitive pay structure. Incentive raises are based on meeting performance objectives and will be reviewed annually. In addition, a recruiting bonuses [5] will be a part of the performance by objective rewards system. The bonus would only be earned if the specific goal set was met and the funding would be calculated from the result of meeting that goal. Recruiter bonus will be based on a goal of 250-student enrollment increase with each tuition being an average of $16,000.00. The 2.5% bonus would be calculated from the tuition increase.
CONCLUSION Campuses today are made up of traditional students recently graduated from high school as well as adults returning back to campus, or actually beginning their college experience for the first time. There are now a growing number of adults focused on taking their education to the master’s level. The focus of these adult students is different

March 27th, 2009
Sponsors: Stäubli, Spartanburg Regional Healthcare System, EPSCoR/IDeA RS grant. 185
from their traditional counter-parts. The university that successfully captures this market and swells its enrollment will be the one that can adapt the teaching methods and curriculum design to fit into an adult schedule and environment, without compromising on the quality of education offered to the adult student. This package must then be successfully marketed to the potential student. SWU’s strategic plan to create a marketing and enrollment Department for the MBA AGS program will place the university at the cutting edge of this growing adult graduate degree market.
REFERENCES
[1] http://www.swu.edu/about/history.htm [2] Noe, Raymond A., John R. Hollenbeck, Barry
Gerhart, Patrick M. Wright. Human Resource Management Gaining a Competitive Advantage. 6th ed. New York: McGraw-Hill/Irwin, 2008.
[3] http://business.clemson.edu/mba/Career/Guide [4] http://careers.stateuniversity.com/Recruiter.html [5]http://www.indeed.com/salary?q1=College+Recruite
r&l1=South+Carolina+
.