Embed Size (px)
Citation preview

This article appeared in a journal published by Elsevier. The attachedcopy is furnished to the author for internal non-commercial researchand education use, including for instruction at the authors institution
and sharing with colleagues.
Other uses, including reproduction and distribution, or selling orlicensing copies, or posting to personal, institutional or third party
websites are prohibited.
In most cases authors are permitted to post their version of thearticle (e.g. in Word or Tex form) to their personal website orinstitutional repository. Authors requiring further information
regarding Elsevier’s archiving and manuscript policies areencouraged to visit:
http://www.elsevier.com/copyright

Author's personal copy
Oxygen isotope fractionation between human phosphate and water revisited
Valerie Daux a,*, Christophe Lecuyer b, Marie-Anne Heran b, Romain Amiot b, Laurent Simon c,François Fourel b, François Martineau b, Niels Lynnerup d, Herve Reychler e, Gilles Escarguel b
a Laboratoire des Sciences du Climat et de l’Environnement/IPSL, UMR CEA/CNRS 1572, L’Orme des Merisiers, Bat. 701, CEA Saclay, 91191 Gif/Yvette Cedex, Franceb Laboratoire CNRS UMR 5125 ‘‘Paleoenvironnements & Paleobiosphere,’’ Universite Claude Bernard Lyon 1, Campus de la Doua, F-69622 Villeurbanne, Francec Laboratoire CNRS UMR 5023 ‘‘Ecologie des hydrosystemes fluviaux,’’ Universite Claude Bernard Lyon 1, Campus de la Doua, F-69622 Villeurbanne, Franced Laboratory of Biological Anthropology, The Panum Institute, Blegdamsvej 3, DK–2200 Copenhagen, Denmarke Service de Stomatologie et Chirurgie maxillo-faciale, Universite Catholique de Louvain, Cliniques universitaires Saint-Luc, av. Hippocrate 10, 1200 Bruxelles, Belgium
a r t i c l e i n f o
Article history:Received 28 January 2008Accepted 26 June 2008
Keywords:Fractionation equationHomo sapiensTooth enamelClimate
a b s t r a c t
The oxygen isotope composition of human phosphatic tissues (d18OP) has great potential for reconstructingclimate and population migration, but this technique has not been applied to early human evolution. Tofacilitate this application we analyzed d18OP values of modern human teeth collected at 12 sites located atlatitudes ranging from 4�N to 70�N together with the corresponding oxygen composition of tap waters(d18OW) from these areas. In addition, the d18O of some raw and boiled foods were determined and simplemass balance calculations were performed to investigate the impact of solid food consumption on theoxygen isotope composition of the total ingested water (drinking waterþ solid food water). The results,along with those from three, smaller published data sets, can be considered as random estimates ofa unique d18OW/d18OP linear relationship: d18OW¼ 1.54(�0.09)� d18OP�33.72(�1.51) (R2¼ 0.87: p[H0:R2¼ 0]¼ 2� 10�19). The d18O of cooked food is higher than that of the drinking water. As a conse-quence, in a modern diet the d18O of ingested water is þ1.05 to 1.2& higher than that of drinking water inthe area. In meat-dominated and cereal-free diets, which may have been the diets of some of our earlyancestors, the shift is a little higher and the application of the regression equation would slightly over-estimate d18OW in these cases.
� 2008 Elsevier Ltd. All rights reserved.
Introduction
In recent years, the study of prehistoric cultures has benefitedfrom the use of stable isotope analyses. The majority of thesestudies have focused on the Holocene portion of human evolution,however, isotopic investigations may provide critical informationabout our earliest ancestors’ diet and ecological setting (climateand environment). Such information plays a critical role in sce-narios that seek to explain the evolution of early humans. For ex-ample, stable nitrogen and carbon isotope analyses of bonecollagen (e.g., Ambrose and De Niro, 1986; Bocherens et al., 1991;Fizet et al., 1995; Richards et al., 2005) and carbon isotope analysisof bone and tooth carbonate (Lee-Thorp et al., 1994; Van der Merweet al., 2003; Sponheimer et al., 2005) have been used to reconstructthe diet of some of our pre-Holocene ancestors. However, oxygenisotope compositions of human phosphatic tissues, which can beused to reconstruct climatic conditions (e.g., Fricke et al., 1995;Muller et al., 2003; Daux et al., 2005; Evans et al., 2006), identifyforeigners in a population, assess the mobility of human groups
(e.g., White et al., 2000; Dupras and Schwarcz, 2001; White et al.,2007), or reconstruct infant feeding behavior (e.g., Wright andSchwarcz, 1998), have not been applied, to our knowledge, to issuesof early human evolution.
The ratio of oxygen isotopes in mammalian flesh, bones, andteeth reflects the origin of water imbibed as a liquid and ingestedfrom food. The water contained in food has a complicated re-lationship with meteoric water and can be significantly enriched in18O compared to meteoric water. The relative contribution of waterentering the body as a liquid and from food varies from one speciesto another. Animals with low water turnover are expected to derivemore water from isotopically-enriched food sources and less fromdrinking water than are those with high water turnover (Kohnet al., 1996). For the vast majority of terrestrial vertebrates, waterturnover scales to body mass (e.g., Altman and Dittmer, 1968;Eberhardt, 1969). Therefore, the d18O of the tissues of large animalsshould be less affected by their solid food consumption than is thed18O of smaller animals. However, the influence of diet on theisotopic composition of the tissues may not depend only on waterturnover but also on the proportion of water taken up as watercontained in food. By way of example, larger herbivores consumeplants that are highly hydrated (80 to 95% water by weight) andmay contribute up to 50% of the total ingested water (from statistics
* Corresponding author.E-mail addresses: [email protected] (V. Daux), [email protected]
(C. Lecuyer).
Contents lists available at ScienceDirect
Journal of Human Evolution
journal homepage: www.elsevier .com/locate/ jhevol
0047-2484/$ – see front matter � 2008 Elsevier Ltd. All rights reserved.doi:10.1016/j.jhevol.2008.06.006
Journal of Human Evolution 55 (2008) 1138–1147
Author's personal copy
of Agriculture and Agri-food Canada). As a result, large herbivoresobtain a large proportion (up to 50% for wild herbivores; Kohn et al.,1996) of their oxygen from plants that are isotopically enriched. Incontrast, the influence of food on tissue d18O is insignificant inanimals that are fed dry food (Luz et al., 1984).
Humans are medium size mammals with moderate waterturnover. As we are mainly omnivores, we ingest less water fromfood sources than do herbivores. Therefore, the d18O ingested byhumans is strongly imprinted by the composition of our drinkingwater, which is strongly linked to environmental water (Longinelli,1984; Luz et al., 1984; Levinson et al., 1987). Although there isa linear relationship between the oxygen isotope composition ofhuman phosphate and the composition of meteoric water, the threepreviously-published fractionation equations differ in both theirslope and intercept values (Longinelli, 1984; Luz et al., 1984;Levinson et al., 1987). This variation may result from the use ofdifferent analytical techniques among studies, small datasets thatsample a restricted range of variation, or differences in the timingand duration of crown mineralization from one individual toanother. Additionally, although not thought to be a big influence,diet may influence the oxygen isotopic composition of human tis-sues and contribute to the variation among studies. Althoughthought to be small, the effect of specific diets on d18OP is unknown.One can question the impact on d18OP of a vegetarian or a meat-based diet, the effect of cereal consumption, or the consequence ofcooking food. If specific diets prove to have a sizable influence ond18OP, they would need to be considered when reconstructingpaleoclimate from the isotopic signature of phosphatic tissues.Conversely, the d18OP of individuals of known isotopic context(d18OW) can provide information on their dietary practices.
In this study, we refine our knowledge of the oxygen isotopefractionation between water and phosphate in human tooth enamel.We provide a new set of oxygen isotope data for teeth of recenthumans from 4�N to 70�N. We compare regressions between d18OP
and the d18OW of their likely drinking water and of meteoric water.We test whether the differences among the previously publisheddatasets (Longinelli, 1984; Luz et al., 1984; Levinson et al., 1987; thisstudy) are statistically significant. We then investigate the effect ofdiet on d18OP by measuring the oxygen isotope compositions of waterfrom raw and cooked vegetables, fish, and meat by modeling theimpact of variable proportions of these constituents on d18OP.
Materials and methods
Tooth enamel samples
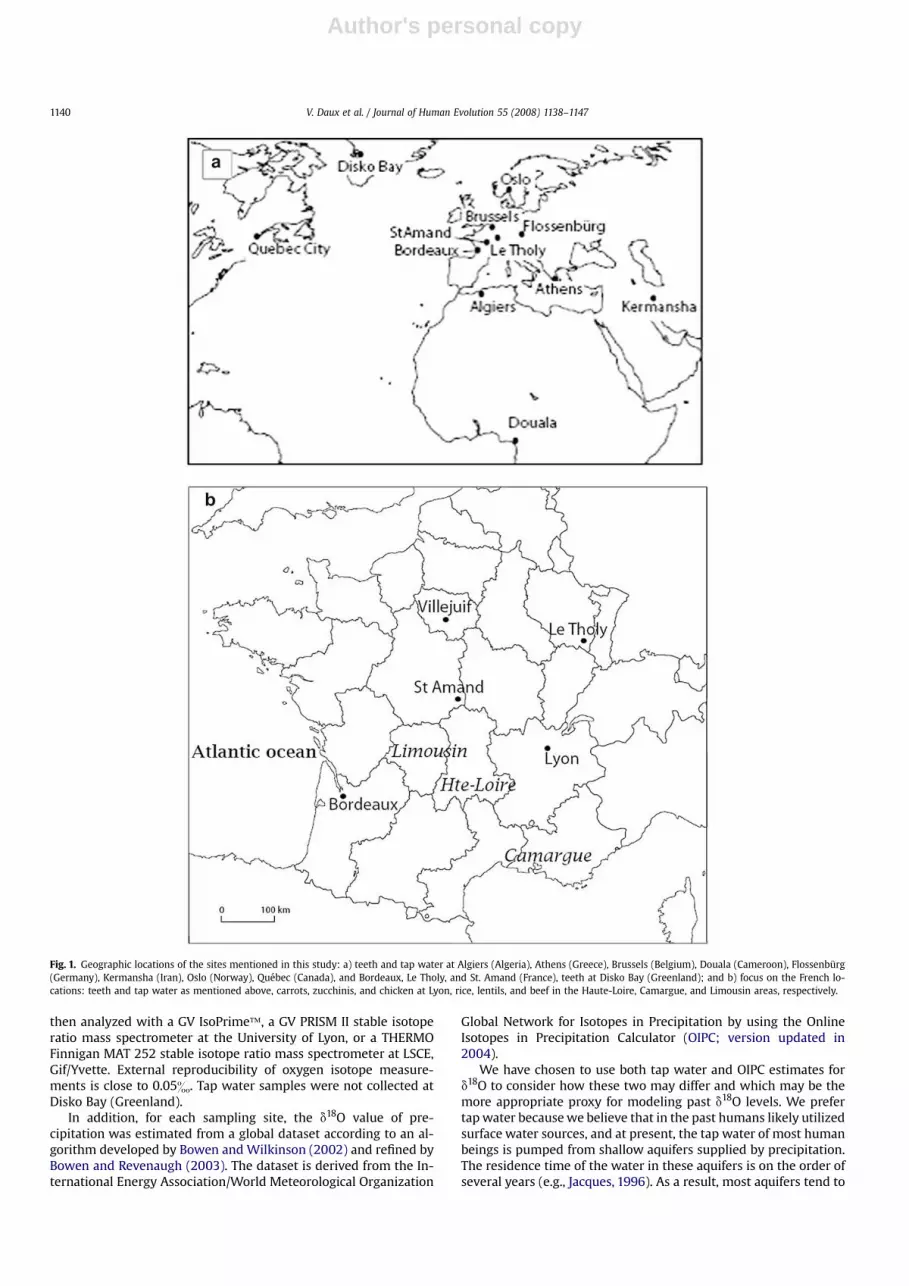
We analyzed the oxygen isotopic ratios of 38 molars (36 M1 andM2; 2 M3) from modern or historical (18th century Inuit) in-dividuals from 12 geographic areas that range from about 4�N(Cameroon) to 70�N (Greenland; Fig. 1). Only one tooth was sam-pled per individual. In the case of living individuals, informedconsent was given by the patients whose teeth were analyzed. Bothmaxillary and mandibular molars were sampled. Teeth of livingindividuals were extracted because of periodontal disease or forprosthodontic reasons. Teeth were selected that met the followingcriteria: 1) the person, according to their own statement, had livedall their childhood in the same place and had drunk local waterduring this time; and 2) the molar exhibited no evidence of decay.
Once obtained, teeth were crushed and enamel was sorted byhandpicking under a microscope. The fragments were cleaned with15% hydrogen peroxide for half an hour in an ultrasonic bath anddried in an oven before being crushed to powder in an agate mortar.
Most studies dedicated to the oxygen isotope composition ofapatite start by isolating PO3�
4 using acid dissolution and anion-exchange resin. The protocol used here is derived from the originalmethod published by Crowson et al. (1991) and slightly modified by
Lecuyer et al. (1993). After dissolution of 15 to 30 mg of powderedtooth enamel in 2 M HF at 25 �C for 24 hours, the CaF2 that pre-cipitates is separated from the solution that includes the phosphateby centrifugation. The CaF2 precipitate is rinsed three times usingdouble deionized water (DDW) and the rinse water is added to thesolution that is neutralized with a 2 M KOH solution. CleanedAmberjet� resin (2 ml) is added to the neutralized solution inpolypropylene tubes. The tubes are placed on a shaker table for12 hours to promote the ion exchange process. Excess solution isdiscarded and the resin is washed five times with DDW to removethe traces of ionic contaminants. To elute the phosphate ionsquantitatively from the resin, 25–30 ml of 0.5 M NH4NO3 is addedto bring the pH of the solution to 7.5–8.5, and the tubes are gentlyshaken for about 5 hours. Silver phosphate is precipitated from theeluted solution following the method of Firshing (1961). The so-lution is placed in a 250 ml Erlenmeyer flask and about 1 ml ofconcentrated NH4OH is added to raise the pH to 9–10. Fifteen ml ofammoniacal AgNO3 solution is added to the flask. Upon heating thissolution to 70 �C in a thermostatic bath, millimeter-size yellowishcrystals of Ag3PO4 are quantitatively precipitated. The crystals ofsilver phosphate are collected on a Millipore filter, washed threetimes with DDW, and air dried at 50 �C.
The 18O/16O ratios are measured after reaction of silver phosphatewith graphite to form CO2 (O’Neil et al., 1994; Lecuyer et al., 1998).Ag3PO4 samples are mixed with pure graphite powder with preciseproportions of 0.5 mg of C to 8 mg of Ag3PO4. They are weighed intotin reaction capsules, loaded into quartz tubes, and degassed for 30minutes at 80 �C in vacuum. The samples are then heated at 1100 �Cfor 1 minute to promote the redox reaction. CO2 samples are ana-lyzed at the University of Lyon with a GV IsoPrime� or a GV PRISM IIstable isotope ratio mass spectrometer using dual inlet systems withautomated cold fingers. Isotopic compositions are quoted in thestandard d notation relative to Standard Mean Ocean Water (SMOW).The reproducibility of measurements carried out on tooth enamelsamples is better than 0.2& (1s). Silver phosphate precipitated fromstandard NBS120c (natural Miocene phosphorite from Florida) wasrepeatedly analyzed (d18O¼ 21.73� 0.20; n¼ 20) along with thesilver phosphate samples derived from the human tooth collection.Calibration of the ‘‘graphite method’’ has been made with oxygenisotope measurements using fluorination. As this technique ensuresa total conversion of apatite oxygen to carbon dioxide, any biasresulting from the so called ‘‘scale compression factor’’ (Vennemannet al., 2002) has been corrected by using two standards of distinctoxygen isotope composition. For NBS120c, we obtained a compara-ble mean d18O value of 21.70� 0.14& (n¼ 21). To bracket the isotopicrange documented in this study, we analyzed the ‘‘Durango apatite’’which gives a mean d18O value ofþ9.45& (n¼ 3) by offline pyrolysisagainst a value ofþ9.6& obtained by fluorination using BrF5 reagent(C. France-Lanord, pers. comm.). It must be taken into account,however, that former studies (Longinelli, 1984; Luz et al., 1984;Levinson et al., 1987) used both BiPO4 chemistry and fluorinationprotocols for isolation of phosphate and extraction of its oxygen. Therobustness of the oxygen isotope measurement by various methodshas been reported by Lecuyer et al. (1996) who used the two kinds ofdata to generate an oxygen isotope fractionation equation for lin-gulids, with the fair and appreciated contribution of Dr. A. Longinelli.
Tap and meteoric waters
At 11 of the geographic locations from which enamel samplingwas undertaken, samples of tap water were collected for oxygenisotope analysis. Oxygen isotope compositions were determinedusing water-carbon dioxide equilibration methods (Epstein andMayeda, 1953; O’Neil et al., 1975). Aliquots of 3 ml of water wereequilibrated with 30 mmoles of CO2 at 25 �C for 48 hours (8 hours atLSCE in the Finnigan equilibration device). Equilibrated CO2 was
V. Daux et al. / Journal of Human Evolution 55 (2008) 1138–1147 1139
Author's personal copy
then analyzed with a GV IsoPrime�, a GV PRISM II stable isotoperatio mass spectrometer at the University of Lyon, or a THERMOFinnigan MAT 252 stable isotope ratio mass spectrometer at LSCE,Gif/Yvette. External reproducibility of oxygen isotope measure-ments is close to 0.05&. Tap water samples were not collected atDisko Bay (Greenland).
In addition, for each sampling site, the d18O value of pre-cipitation was estimated from a global dataset according to an al-gorithm developed by Bowen and Wilkinson (2002) and refined byBowen and Revenaugh (2003). The dataset is derived from the In-ternational Energy Association/World Meteorological Organization
Global Network for Isotopes in Precipitation by using the OnlineIsotopes in Precipitation Calculator (OIPC; version updated in2004).
We have chosen to use both tap water and OIPC estimates ford18O to consider how these two may differ and which may be themore appropriate proxy for modeling past d18O levels. We prefertap water because we believe that in the past humans likely utilizedsurface water sources, and at present, the tap water of most humanbeings is pumped from shallow aquifers supplied by precipitation.The residence time of the water in these aquifers is on the order ofseveral years (e.g., Jacques, 1996). As a result, most aquifers tend to
Fig. 1. Geographic locations of the sites mentioned in this study: a) teeth and tap water at Algiers (Algeria), Athens (Greece), Brussels (Belgium), Douala (Cameroon), Flossenburg(Germany), Kermansha (Iran), Oslo (Norway), Quebec (Canada), and Bordeaux, Le Tholy, and St. Amand (France), teeth at Disko Bay (Greenland); and b) focus on the French lo-cations: teeth and tap water as mentioned above, carrots, zucchinis, and chicken at Lyon, rice, lentils, and beef in the Haute-Loire, Camargue, and Limousin areas, respectively.
V. Daux et al. / Journal of Human Evolution 55 (2008) 1138–11471140

Author's personal copy
resemble the weighted mean rainfall of an area within relativelynarrow limits (Clark and Fritz, 1997; Darling, 2004). In some of ourstudied areas, however, tap water is not derived from local shallowground waters, but from distant lakes higher in altitude than theareas of water use. In Algiers (alt. 25 m), the tap water is suppliedmainly by the Kaddara Dam reservoir that collects water at 350 mabove sea level. In Athens, Greece (alt. 28 m), the Mornos Lake, at435 m above sea level, serves as the main storage reservoir. InBordeaux (France), the tap water is derived from deep groundwater approximately 20,000 years old (water supplier ‘‘Lyonnaisedes Eaux,’’ pers. comm.). Thus, it should prove possible to test ourpredictions of the offset that should result from these differentsources of tap water and the OIPC predictions.
Food water
To examine the contribution of water from food, various types offood were collected. With the exception of mackerel that wascaught in the northern Atlantic, the food came from southeasternand southern Central France in an area relatively close to Lyon,which is also the source of the French tap water used in the ex-periment. The rice is from Camargue; the beef from Limousin; thechicken, zucchini, and carrots from Lyon city; and the lentils fromHaute-Loire (Fig. 1).
Carrots, zucchini, mackerel, beef, and chicken were cut into1 mm diameter pieces. Rice and lentil samples were ground andthe resulting powders were sieved between 100 mm and 500 mm.Five grams of each food sample (called hereafter ‘‘raw food’’)were boiled in 200 ml distilled water (‘‘initial water’’) in openbeakers for 20 minutes. Cooking water (‘‘final water’’) and food(‘‘cooked food’’) were collected after filtration. Sodium azide wasadded to an aliquot of 1 g of food to prevent fermentation. Foodwater was directly equilibrated with 30 mmoles of CO2 for 20hours at 25 �C according to the protocol given by Koehler et al.(2000). Oxygen isotope compositions of distilled and cookingwaters have been measured using the same equilibrationmethod as for tap waters.
Methods for d18OW/d18OP fractionation equations and modelinginfluence of food water on total water
Using a linear regression model, we generated a regressionequation to describe the fractionation of d18OW/d18OP for our sam-ples. We then compared our equation with those published byLonginelli (1984), Luz et al. (1984; human bones), and Levinson et al.(1987; human teeth) using a single classification Analysis of Co-variance (ANCOVA; Sokal and Rohlf, 1995). Statistics were calcu-lated using the BIOMstat program.
Table 1Oxygen isotope compositions (& versus SMOW) of 1) tooth enamel of M1 and M2 teeth of modern or historical (18th century Greenland) individuals, 2) tap water, and 3)atmospheric precipitation at 12 locations
Country Site Lat, Long, Alta d18OP d18OP mean valueb SD (1s) d18OW measuredb d18OW estimatedb D&
Cameroon Douala 4.0, 9.8, 10 18.8‘‘ ‘‘ 18.5‘‘ ‘‘ 18.2 18.5 0.3 �3.4 �3.2 �0.2
Algeria Algiers 36.7, 3.3, 25 17.5‘‘ ‘‘ 16.7‘‘ ‘‘ 17.6 17.3 0.5 �6.1 �4.5 �1.6
Iran Kermanshah 34.3, 47.2, 1320 18.218.4 18.3 0.2 �7.0 �7.3 0.317.7c
17.6c
Greece Athens 37.9, 23.7, 28 16.9 16.9 �7.9 �6.2 �1.7France Le Tholyd 48.1, 6.7, 740 17.0
‘‘ ‘‘ 17.3‘‘ ‘‘ 17.3‘‘ ‘‘ 16.3‘‘ ‘‘ 16.2‘‘ ‘‘ 16.4 16.7 0.5 �8.5 �8.9 0.4
France Bordeaux 44.8, 0.7, 49 18.3 18.3 �8.1 �6.2 �1.9France St. Amand 46.7, 2.5, 162 17.3 17.3 �6.5 �7.3 0.8Belgium Brussels 50.9, 4.5, 55 17.0
‘‘ ‘‘ 15.9‘‘ ‘‘ 16.6‘‘ ‘‘ 16.5‘‘ ‘‘ 16.5‘‘ ‘‘ 17.5‘‘ ‘‘ 16.9‘‘ ‘‘ 16.7‘‘ ‘‘ 16.5 16.7 0.4 �7.6 �8.0 0.4
Germany Flossenburg 49.5, 12.5, 650 16.4 16.4 �10.1 �9.4 �0.7Canada Quebec Cityd 46.7, –71.4, 110 14.1
‘‘ ‘‘ 15.0‘‘ ‘‘ 15.3‘‘ ‘‘ 14.4‘‘ ‘‘ 15.3 14.8 0.5 �11.0 �11.4 0.4
Norway Oslo 59.9, 10.7, 10 15.1 15.1 �10.5 �10.8 0.3Greenland Disko Bay 70.0, –52.0, 1 12.3
‘‘ ‘‘ 12.5‘‘ ‘‘ 11.0 11.9 0.8 n.d. �17.3
a Lat¼ degrees North latitude. Long¼ degrees East longitude. Alt¼ altitude in meters.b d18OP and d18OW in & versus SMOW.c M3 teeth.d published in Daux et al. (2005).
V. Daux et al. / Journal of Human Evolution 55 (2008) 1138–1147 1141

Author's personal copy
Simple mass balance calculations were performed to quantifythe effect of raw and cooked food consumption on the oxygenisotope composition of the total ingested water. We calculatedDd18O, or the difference between the isotopic composition of thedrinking water and of the total ingested water as follows:
Dd18O [ d18Otot L d18OW (1)
where:
d18Otot [ d18OW 3 MW D MF 3 ðfveg$½H2O�veg$d18Oveg
D fcl½H2O�cld18Ocl D fmf ½H2O�mf d18Omf Þ=Mtot; ð2Þ
and
Mtot [ MW D MF 3 fveg½H2O�veg D fcl½H2O�cl D fmf ½H2O�mf : (3)
MF and MW are the masses of daily ingested drinking water and totalfood (assumed to be constant); Mtot is the mass of water ingested(as a liquid plus in solid food); fveg, fcl, fmf are the fractions of veg-etables, cereals and legumes, and of meat and fish in the diet
(fvegþ fclþ fmf¼ 1); and [H2O]veg, [H2O]cl, and [H2O]mf are the watercontents of these food categories.
Results
Oxygen isotope compositions of tooth enamel (d18OP)and drinking water
The oxygen isotope ratios of tooth enamel from human beingsmeasured in this study range from 11.9& (Greenland) to 18.5&
(Cameroon) with a corresponding water isotopic range from�17.3& to �3.4& (Table 1). The 1s standard deviations, calculatedfor the seven sites where at least three individuals have beensampled, range from 0.3& to 0.8&, indicating an isotopic vari-ability larger than the analytical uncertainty (1s¼ 0.2&).
As predicted, the relationship between tap water and OIPC d18Ovalues is generally good (not exceeding 0.8&), but diverges in areaswhere tap water does not sample shallow aquifers. Our samplesfrom Algiers, Athens, and Bordeaux differ by 1.6 and 1.7& betweenthe oxygen isotopic values of their tap waters and of OIPC estimatesof present day rain in each region (Table 1). We discuss the causesof these differences below.
Fractionation equations: d18OW versus d18OP
Because of the differences in tap water and OIPC values, thed18OW versus d18OP regressions yield slightly different isotopicfractionation equations when using tap water values (OIPC esti-mate is used for Disko Bay; equation 4; Fig. 2a; Table 2) or the OIPCprecipitation database (equation 5; Table 2). The ordinary leastsquares analysis of the data produces the following equations:
d18OW [ 1:73ð±0:21Þ3 d18OP L 37:25ð±3:55Þ
ðn [ 12; R2 [ 0:87; p½H0 : R2 [ 0� [ 1 3 10L5Þ; ð4Þand
d18OW [ 1:70ð±0:22Þ3 d18OP L 39:28ð±3:68Þ
ðn [ 12; R2 [ 0:88; p½H0 : R2 [ 0� [ 7 3 10L6Þ ð5Þ
The Greenlandic sample (Disko Bay) lies at the extreme of thecorrelation. Therefore, it exerts a large influence on the slope of theregression line and on the value of the correlation coefficient (seeTable 2). The Greenland sample corresponds to Inuit people wholived during the 18th century. The value of the d18OW at Disko Bay atthis time may have been different from the present day. Wetherefore explore if this uncertainty regarding the d18OW must beseen as a motive for excluding the sample.
The variation through time of the isotopic composition of oxy-gen in Greenland precipitation can be estimated from ice cores. Thedata reported by Andersen et al. (2006), which are calculated bystacking the record at Dye-3, GRIP, and GNIP drilling sites, representan integrated North-South value of the isotopic composition of theprecipitation (data available on http://icecores.dk). These data areexpressed as anomalies, (i.e., differences to the mean calculatedfrom the entire period; S.O. Rasmussen, pers. comm.). The meanvalues of the d18OW during the 18th and 20th centuries (m� 1s:�0.089%� 0.3805 and �0.005� 0.2237, respectively) are not sig-nificantly different at a 95% level of confidence (unequal varianceWelch test: t¼ 1.56, d.f.¼173, p¼ 0.12). Therefore, if differencesexist between the d18OP of the Inuits of the 18th and of the 20thcenturies, they are not due to different oxygen compositions of theprecipitation. In addition, this sample is clearly not an outlier when
y = 1.73x (± 0.21) - 37.25 (±3.55)R2 = 0.87
-20
-18
-16
-14
-12
-10
-8
-6
-4
-2
0
10 11 12 13 14 15 16 17 18 19 20
-25
-20
-15
-10
-5
0
8 10 12 14 16 18 20 22
Longinelli (1984)y=1.53 x -34.30r2 =0.97
Luzetal. (1984)y = 1.19 x -27.42r2 =0.95
Levinson et al. (1987)y = 1.93 x -38.51r2 = 0.92
This studyy = 1.73 x -37.25r2 = 0.87
18 Op (‰ versus SMOW)
18 Op (‰ versus SMOW)
18 O
w (
‰ v
ersu
s SM
OW
)18
Ow
(‰
ver
sus
SMO
W)
a
b
Fig. 2. a) Oxygen isotope fractionation equation computed by using modern humantooth enamel (d18OP) and tap water (d18OW) from Table 1 (IAEA precipitation data forDisko Bay, Greenland). The error bars correspond to the external reproducibility:�0.2& for d18OP and� 0.05& for d18OW (smaller than the symbols); and b) comparisonof the equation shown in (a) with those previously published by Longinelli (1984), Luzet al. (1984), and Levinson et al. (1987).
V. Daux et al. / Journal of Human Evolution 55 (2008) 1138–11471142

Author's personal copy
considering all published data simultaneously (see Discussion). So,we conclude that there is no obvious reason to exclude theGreenlandic samples from our dataset. However, we also provideall the parameters of the regression equations calculated withoutthe Greenlandic sample in Table 2.
The regression equation (4) presented here differs slightlyfrom those published by Longinelli (1984), Luz et al. (1984; hu-man bones), and Levinson et al. (1987; human teeth) (Table 2,Fig. 2b). The application of these various equations to extremeconditions can generate differences of several & in the estimatesof d18OW values. Nevertheless, a single classification Analysis ofCovariance (ANCOVA; Sokal and Rohlf, 1995) indicates that thesefour models do not differ from each other at a a¼ 0.01 signifi-cance level (Table 3), a more secure and preferable type-I errorrate than the usual a¼ 0.05 error rate. This stricter criterion waspreferred because: 1) different analytical techniques have beenused by authors, 2) there are measurement errors and between-measures variability for most points, and 3) the number of pointsavailable in each of the four samples is small.
Consequently, the linear models calculated for the four sets ofd18OW/d18OP values (Longinelli, 1984; Luz et al., 1984; Levinsonet al., 1987; this study) can be considered as random estimates ofa unique d18OW/d18OP linear relation that can be more accuratelyestimated by compiling the four sets into a single super-sample(n¼ 42). The least squares analysis of the whole set leads to thefollowing overall equation (see also Fig. 3):
d18OW [ 1:54ð±0:09Þ3 d18OPL33:72ð±1:51Þ
ðR2 [ 0:87 : p½H0 : R2 [ 0� [ 2 3 10L19Þ ð6Þ
Oxygen isotope composition of food water
The oxygen isotope compositions of the waters used for theexperiment are 18O-depleted (�10. or�11.2&; water a) or enriched(7.8&; water b) relative to SMOW (Table 4). While cooking, twochemical reactions operate: first, the water evaporates and be-comes 18O enriched, and second, there are exchanges of H2O mol-ecules between cooking water and food water. As a result, theoxygen isotopic compositions of the water of the cooked food
(d18Ocf) and of the final water (d18Ofw) are close to each other andhigher than the d18O of the initial water. The d18O of the water of thecooked food is closer to the value of the water of the raw food forinitially highly-hydrated food (zucchinis and carrots; see Table 4)than for drier food (mackerel, beef, chicken, rice, lentils). The ap-parent isotopic fractionation between the water of the cooked foodand the initial water (d18Ocf�d18Oiw in Table 4) ranges from 1.2& to6.2&. The highest values are observed for vegetables.
Modeling the impact of solid food on the oxygen isotopiccomposition of ingested water
The values of Dd18O calculated according to equation 1, using theisotopic compositions of the tap water at Lyon (�10.5&) and theparameters reported in Table 5, are shown in Fig. 4a (raw food) and4b (cooked food). The vegetables, legumes, cereals, meat, and fishanalyzed in this study were grown at some distance from the placewhere the water was collected in Lyon (see Food water). Thus, theiroxygen isotopic composition is not linked to that of the local water(carrots, zucchini, and chicken are excepted as they are grown andfarmed in the Lyon area). However, all foods originate fromsoutheastern and southern Central France and cannot differ muchisotopically from those of the Lyon area.
Discussion
Variability in the oxygen isotopic composition of drinking water
In most cases, the oxygen isotope compositions of measured tapwaters differ only slightly from the yearly mean oxygen isotope
Table 2Regression and correlation parameter estimates for the linear models d18OW¼ (a� d18OP)þ b associated to the available individual sets of d18O-valuesa
N Slope Intercept Correlation
Mean SE SE/Mean % Mean SE SE/Mean % R p-valuea
Longinelli (1984) 10 1.53 0.10 6.5 �34.30 1.81 5.3 0.97 4� 10�7
Luz et al. (1984) 6 1.20 0.19 15.8 �27.42 3.05 11.1 0.95 3� 10�3
Levinson et al. (1987) 14 1.93 0.18 9.3 �38.51 2.53 6.6 0.92 1� 10�7
This study–tap water except for Disko Bay (OIPC estimate) 12 1.73 0.21 12.1 �37.25 3.55 9.5 0.88 1� 10�5
This study without the Disko Bay sample–tap water 11 1.49 0.35 23.5 �33.08 5.87 17.7 0.67 2� 10�3
This study–OIPC estimatesb 12 1.87 0.22 11.8 �39.28 3.68 9.4 0.89 7� 10�6
This study without the Disko Bay sample–OIPC estimatesb 11 1.75 0.37 21.1 �37.21 6.29 16.9 0.71 1� 10�3
Overall equation 42 1.54 0.09 5.8 �33.72 1.51 4.5 0.87 2� 10�19
a SE¼ Standard errors associated to the mean estimates of the slope and intercept. The p-value associated to the coefficient of determination (R2) tests the null hypothesisH0: R2¼ 0.
b Not used in the overall equation.
Table 3Results of the single classification ANCOVAa
Among groups Within groups Statistics
Sum of squares d.f. Sum of squares d.f. Fisher F p-valueb
Slopes 23.678 3 100.338 37 2.91 0.048Intercepts 23.166 3 100.338 40 3.08 0.042
a d.f.¼ degrees of freedom.b Associated to the slope and intercept comparisons indicating that the four in-
dividual d18OP�d18OW linear models do not differ significantly from each other at thea¼ 0.01 significance level (see text for comment).
y = 1.54 x ±0.09 - 33.72 ±1.51R2 = 0.87
-25
-20
-15
-10
-5
0
8 13 18 23
18 OP (‰ versus SMOW)
18 O
w (
‰ v
ersu
s SM
OW
)
Fig. 3. Oxygen isotope fractionation equation resulting from the compilation of all theavailable data. Filled diamonds: this study; open triangles: Longinelli (1984); opencircles: Levinson et al. (1987); open squares: Luz et al. (1984).
V. Daux et al. / Journal of Human Evolution 55 (2008) 1138–1147 1143

Author's personal copy
compositions of precipitation calculated with the OIPC (Table 1). InAthens, Algiers, and Bordeaux there are larger discrepancies. The 1.6and 1.7& differences between the oxygen isotopic values of tapwaters and of OIPC estimates of present day rain at Algiers andAthens (Table 1) may be ascribed, at least partly, to an altitudeinfluence. In the Mediterranean area, an altitude effect of �0.2 to�0.4&/100 m has been measured (Bortolami et al., 1978; Leontiadiset al., 1996). A mean �0.3&/100 m lapse rate would produce a d18Odecrease of 1.0 to 1.3&. The d18O value from Bordeaux (France) is1.6& lower than the OIPC estimates for the area. If a d18O/T gradientof 0.6&/�C (e.g., Von Grafenstein et al., 1996; Fricke and O’Neil, 1999)is considered, this difference corresponds to an atmospheric tem-perature 20,000 years ago that was 3 �C lower than today. During theLast Glacial Maximum, annual temperatures in this area are thoughtto have been ca. 12 �C lower (Jost et al., 2005; Kageyama et al., 2007),but the lack of precision of the dating and the likely mixing of watersof different ages preclude further comparison. In some areas, tapwaters derive from tributaries or rivers that are not buffered by largereservoirs and are characterized by seasonal isotopic variations (e.g.,Chao et al., 1996; Darling, 2004). In those cases, a one-off sampling isnot representative of the yearly mean. The good correlation betweenour measured tap waters and the OIPC estimates (R2¼ 0.89) dem-onstrates that this effect, if any, is limited.
Even though the fractionation equations obtained with the tapwaters and OIPC estimates of precipitations resemble each other,we argue, for the reasons stated above, that local measured waters(equation 4) should be preferred to estimated precipitations. Be-cause drinking water represents from 0.6 to 0.75% of the total wateringested by a human, drinking water has a larger influence on d18OP.As tap water may differ from environmental water in moderncountries, the isotope composition of the oxygen input flux is closerto the composition of the tap water. Therefore, the d18OP/d18OW
fractionation equation based on tap water is more appropriate. Inhistorical and prehistorical times, human beings may have derivedmuch of their water from surface water sources (lakes, rivers,streams), and hence, some of the limitations presented above maynot be significant at these times (deep water catchments are lesslikely for instance). However, a range of factors (e.g., preservation ofthe ‘‘altitude signature’’ downstream for rivers, evaporative frac-tionation) may influence the isotopic composition of surface wa-ters. Therefore, correcting back ancient teeth d18OP signal to localrainfall isotopic composition may not be straightforward.
Compatibility of the different d18OW/d18OP fractionation equations
When compared to the four initial models (Table 2), the overallmodel (equation 6) shows markedly reduced uncertainties allow-ing more accurate predictions (lower associated standard error) ofd18OW values on the entire range of sampled d18OP values (Table 6).For instance, for d18OP values in the range of 12.5–19, where most ofthe individuals have been sampled, using the overall model allowsthe prediction of d18OW values in the range from �4 to �14.5 witha 95% confidence interval <2 d units (i.e., 1s prediction error< 0.5d unit). Let us note that the 18th century Greenlandic sample, therepresentativeness of which was questioned earlier, is not an out-lier in the overall scatter plot (Fig. 3).
Influence of the dietary behavior on the oxygen isotopic compositionof enamel
Although oxygen isotopic signature of tooth enamel is related todrinking water, the inter-individual variability in the enamelcomposition is quite important (SD¼ 0.5& on average, up to 0.8&
at Disko Bay). Food and cooking may play a part in this variationsince the water absorbed by consumers (‘‘total water’’) is the sum ofdrinking water and water ingested from solid food. Some food(cereals, legumes) contains only a few wt % water, whereas mostvegetables are up to 95% water by weight (Table 4). Plants and meatare 18O–enriched compared to meteoric water (e.g., Schmidt et al.,2001; Thiem et al., 2004). Therefore, the total water ingested byconsumers may be 18O–enriched compared to the meteoric waterof their living place.
Kohn (1996) has shown the effect of diet on the oxygen isotopiccomposition of tooth enamel by studying some East African her-bivores. The consumption of C3 versus C4 plants, in particular, ac-counts for at least a part of the isotopic interspecific variability. Inhumans, cooking complicates the relationship. In boiling, food be-comes hydrated from the cooking water, which is 18O–enrichedthrough progressive evaporation. According to our data, the d18O ofraw and cooked food are similar to each other if the food is initiallyhydrated (e.g., carrots, zucchinis). Therefore, the effect of such foodconsumption on the isotopic composition of the total water is moreor less the same whether the food is raw or cooked. Cereals andlegumes (rice, lentils) and meat and fish, which are seldom eatenraw, incorporate significant amounts of 18O-enriched water duringcooking (Tables 4 and 5). Therefore, their consumption is likely toincrease the d18O of a person’s total water.
According to our mass balance calculations, the maximum 18O–enrichment of the total water compared to the drinking water is ca.2& (corresponding to 1.1& in human enamel). This maximumenrichment occurs in a raw food diet with very high proportionsof meat or vegetables, or in diets mainly based on cookedvegetables (Fig. 4). Therefore, at any given place, the water ingestedby human beings via solid foods, whether it is raw or cooked,should not be richer in 18O than is the total water ingested byherbivorous animals of the same place whose diet is composed of
Table 4H2O content of the raw food in wt% (according to US Dept. Agriculture, Agricultural research Service, 2005), and oxygen isotope compositions (d18O& versus SMOW) of thewater in the raw and in the cooked food initial and final waters. Dc-iw¼ d18Ocooked food�d18Oinitial water
Zucchinis Carrots Mackerel Beef Chicken Rice (a) Rice (b) Lentils (a) Lentils (b)
H2O wt% 95 88 63 65 75 10 10 10 10d18ORaw food �4.0 �2.9 �2.1 �1.7 �3.7 �5.9 �5.9 0.8 0.8Initial water �10.5 �10.5 �11.2 �10.5 �10.5 �10.5 7.8 �10.5 7.8Cooked food �4.3 �4.3 �7.5 �7.7 �8.3 �7.9 9.7 �7.9 9.0Final water �6.4 �5.4 �9.5 �8.8 �9.9 �8.4 9.9 �8.4 9.3d18Ocf�d18Oiw 6.2 6.2 3.7 2.8 2.2 2.6 1.9 2.6 1.2
Table 5Parameters of the mass balance calculation shown in Fig. 4
Parameter Raw Cooked Reference
[H2O]veg (weight %) 90 90 US Dept. Agriculture[H2O]cl (weight %) 10 72 US Dept. Agriculture[H2O]mf (weight %) 65 65 US Dept. Agricultured18Oveg (&) �3.5 �4.3 This workd18Ocl (&) �2.6 �7.9 This workd18Omf (&) �2.5 �7.8 This workMW (Kg) 2.0 Howard and Bartram, 2003MF (Kg) 0.982 US Dept. Agriculture
V. Daux et al. / Journal of Human Evolution 55 (2008) 1138–11471144

Author's personal copy
raw plants (tree-leaves, fruits, and grass). Iacumin et al. (2004) havecalculated the oxygen isotopic composition of precipitation (d18OW)5,000 to 500 years ago in European Russia from humans andherbivorous animals (sheep, horse, deer). They observed that thed18OW calculated from the herbivores was higher than that calcu-lated from the human samples. They attributed this discrepancy todifferent drinking water sources or to diets. However, according toour calculations the effects of herbivorous versus omnivorous dietson the isotopic composition of the ingested water may beresponsible for the observed difference.
Current human diet relies mainly on cooked food. Although thepercentages of meat-fish, cereals-legumes, and vegetables-fruitsconsumed vary from individual to individual, mean values of 20–30% for the meat-fish component, 30–40% for the vegetables-fruitscomponent, and 30–50% for the cereals-legumes components (fveg/(fvegþ fcl) of 0.4 to 0.6) are in general agreement with the statisticsproduced by the Food and Agriculture Organization (http://
www.fao.org/). Such a diet induces a difference between thedrinking water and the total ingested water of þ1.05 to þ1.20&
(Fig. 4b). This difference corresponds to a shift in the d18OP rangingfrom þ0.6 to þ0.7&. Although there is the variability in the origin,amount, and proportion of the various types of food consumed,these figures show that the d18OP recorded in tooth enamel ofcontemporaneous people is likely shifted towards values slightlyhigher than the values that would result from their drinking wateralone. It is not possible to correct the measured d18OP data for theeffect of solid food consumption because the diets of the in-dividuals are not known and may differ from one another.According to the estimation presented above, the interindividualvariability of the d18OP values (SD ca.� 0.5& in this study; Table 1)may be ascribed only partly to intraindividual dietary differences(0.7–0.6¼ 0.1& from the calculation above).
The regression of d18OW on d18OP (as in equation 6) implicitlyassimilates the Dd18O shift, which is controlled by the relativeproportions of the food components, to a systematic bias. It followsthat the reconstruction of d18OW from d18OP yields accurate resultsif the proportions of an individual’s diet are similar to modernproportions. If the Dd18O is higher than the contemporaneous value(1.05–1.20&), the application of the regression equation leads to anoverestimation of d18OW. An underestimation would result if Dd18Ois lower.
Archaeological and isotopic evidence suggests that Paleolithicdiets varied considerably through time and space. It is far beyondour goal to retrace the history of human diet. However, we canexplore the effect on Dd18O of some specific diets (meat-rich andcereal-poor) that may approximate the extremes during thePaleolithic.
The influence of carnivory and cereal free diets in Neandertalsand modern humans
The Neandertal diet has been argued to be essentially carnivo-rous (Fizet et al., 1995; Richards et al., 2000; Bocherens et al., 2005;Balter and Simon, 2006). If we take an extreme value, a raw dietcomposed of more than 90% fish and meat would have a Dd18O thatis þ1.9&, or slightly higher than the modern diet (Fig. 4a). For theboiled equivalent, the shift decreases to þ0.6&. Archaeologicalsites deliver few clues about cooking practices. As a result, little isknown about Neandertal recipes, but boiling may not have beena widespread practice. Indeed, it is likely that some meat wascooked on broach or cured (Kozlowski and Kozlowski, 1996; Patou-Mathis, 2006; methods referred to hereafter as ‘‘dry’’). Due to thefact that 18O preferentially remains and is enriched during evapo-ration, the d18O of the meat water increases with drying (Frankeet al., 2007). The consumption of dry cooked meat induces a Dd18Olarger than the shift corresponding to raw meat or to boiled orbraised meat (i.e., > 1.9&). Therefore, if the Neandertal diet is as-sumed to rely mainly on dry-cooked meat, the isotopic enrichmentwould be larger than the modern shift. As a consequence, usingd18OP of Neandertal teeth to reconstruct the oxygen isotopic
Table 6d18OW predicted values for d18OW¼ 10, 15, and 20, illustrating the markedly-better prediction accuracy of the overall model over the four individual models on the full range ofmeasured d18OP-values. Mean and 95% confidence intervals in brackets
d18OP
n 10 15 20
Longinelli (1984) 10 N.A. �11.4 [�12.4; �10.4] �3.8 [�4.9; �2.7]Luz et al. (1984) 6 N.A. �9.5 [�11.8; �7.0] �3.5 [�7.0; 0.1]Levinson et al. (1987) 14 �19.2 [�21.7; �16.7] �9.5 [�11.1; �8.0] N.A.Daux et al. (This Study) 12 N.A. �11.3 [�12.7; �9.8] N.A.
Total 42 �18.3 [�19.9; �16.8] �10.6 [�11.3; �9.9] �2.9 [�4.1; �1.7]
N.A.¼ not available.
Cooked food
0
20
50
90
Raw food
0.0
0.5
1.0
1.5
2.0
2.5
0.0
0.5
1.0
1.5
2.0
2.5
0 0.2 0.4 0.6 0.8 1
90
50
20
0
0 0.2 0.4 0.6 0.8 1
Meat %
Meat %
b
a
18 O
18 O
fveg/(fveg+fcl)
fveg/(fveg+fcl)
Fig. 4. Modeled isotopic enrichment of the total ingested water (Dd180 in & versusSMOW). Three categories of food are considered: meat and fish (mf), vegetables andfruits (veg) and cereals and legumes (cl). The figures on the lines correspond to thefractions of meatþ fish in the total food (fmf). The figures of the x-axis represent thefractions of vegetables in the remaining part of the food (fveg/(fvegþ fcl)).
V. Daux et al. / Journal of Human Evolution 55 (2008) 1138–1147 1145

Author's personal copy
composition of ancient precipitation may overestimate this lastparameter. However, roasting meat and fish on hot stones may alsohave been a common practice among Neandertal humans. Thiscooking method may not influence the water content, and correl-atively the Dd18O, as much as the other drying methods. Clearly,more experiments are needed to measure the extent of the isotopicenrichment induced by different dry cooking methods. Additionalinformation about Neandertal diet would also be very valuable torefine these conclusions.
In some areas, cereals were staple foods as early as 23,000 yearsBP (wild wheat and barley at Ohalo II site, Israel; Weiss et al., 2004).Cooking is necessary for the processing of cereal grains. A dietcontaining cooked cereals induces a lower Dd18O than a cereal-freediet (Fig. 4b). During most of the Paleolithic times, human diet wascereal free (fveg/(fvegþ fcl)¼ 1). In these conditions, the isotopicshift ranges between 1.3 and 1.7& for 50 to 20% meat and fish; thisis 0.10 to 0.65& higher than the modern shift. Therefore, it can beconcluded that the d18OW, deduced from the d18OP of humanswhose diets were cereal free (using equation 6), would be slightlyoverestimated.
Conclusions
The oxygen isotope composition of tooth enamel phosphate(d18OP) is related to the composition of the water ingested duringthe time of tooth mineralization. In this study, we propose a frac-tionation equation (d18OP/d18OW) defined over a large range ofisotopic compositions (equation 6). This new equation is charac-terized by markedly reduced uncertainties allowing lower associ-ated standard error (1s prediction error< 0.5 d unit) of d18OW
values on the entire range (12.5–19) of sampled d18OP values.During historical and prehistorical times, humans probably de-
rived much of their drinking water from surface sources. Thesewaters, however, may be different from the mean d18O of rainfall.Therefore, the paleo-environmental significance of the d18OW
values reconstructed from d18OP may be complicated to infer. Ide-ally, a full understanding of the hydrological factors at the localscale is necessary to be confident in the validity of theinterpretation.
The consumption of solid food (particularly vegetables) tends toincrease the d18O of the total water ingested (drinkþwater insolids) by more than 1&. In meat-rich and cereal-free diets, thedifference between the d18O of the total ingested water and thedrinking water is slightly higher than a modern diet (containingmeat, fish, vegetables, fruits, cereals, and legumes). As a conse-quence, the oxygen isotopic composition of precipitation deducedfrom the d18OP using equation 6 is slightly overestimated when theteeth analyzed belonged to humans whose diets were meat-rich orcereal-free. In the case of a meat-rich diet, this conclusion, however,depends on the type of cooking employed. Only certain kinds ofheating that significantly reduce the water content of the meat(curing, cooking on broach) would have a sizable effect on d18OW.More information is needed to refine the estimation of the in-fluence of specific diets on d18OP.
In addition to other isotopic (d15N, d13C) or archaeologicalmethods, the analysis of the oxygen isotopic composition of teethenamel can be used, in an independent manner, to compare thediets of human groups that lived close to each other (drinkingwater of the same isotopic composition) or to analyze the evolutionof culinary practices at some places over climatically stable periods(constant d18O in the drinking water).
Acknowledgements
We are grateful to Drs. C. Gillet, P. Gaudreault, B. Belmecheri, D.Fontan, T.-P. Brisker, O. Lewden, and N’Tamak; the surgeons of the
‘‘Service de Stomatologie et Chirurgie maxillo-faciale’’ of the Uni-versity of Louvain (B); and to an anonymous Iranian surgeon, forassistance in teeth collection. We thank U. Von Grafenstein, S.Belmecheri, M.–J. N’Tamak-Nida, D. Lewden, G. Matias, A. Bergeron,and Shoukou for helping in teeth collection, and B. Daux, E. Mercier,C. Robin, F. Baudin, B. Malaize, and J.L. Turon for water collection.We are also grateful to M.J. Kohn for providing a comprehensivereview of an early version of the paper, and to anonymous re-viewers and S. Anton for their constructive remarks. This work wasfinancially supported by the CNRS through the ECLIPSE program.
References
Altman, P.L., Dittmer, D.S., 1968. Metabolism. Federation of the American Society ofExperimental Biologists, Bethesda, MD.
Ambrose, S.H., De Niro, M.J., 1986. Reconstruction of African human diet using bonecollagen carbon and nitrogen isotope. Nature 319, 321–324.
Andersen, K.K., Ditlevsen, P.D., Rasmussen, S.O., Clausen, H.B., Vinther, B.M.,Johnsen, S.J., Steffensen, J.P., 2006. Retrieving a common accumulation recordfrom Greenland ice cores for the past 1800 years. J. Geophys. Res. 111 (D15), 11.
Balter, V., Simon, L., 2006. Diet and behavior of the Saint-Cezaire Neanderthal in-ferred from biogeochemical data inversion. J. Hum. Evol. 51, 329–338.
Bocherens, H., Drucker, D.G., Billiou, D., Patou-Mathis, M., Vandermeersch, B., 2005.Isotopic evidence for diet and subsidence pattern of the Saint-Cezaire INeanderthal: review and use of a multi-source mixing model. J. Hum. Evol. 49,71–87.
Bocherens, H., Fizet, M., Mariotti, A., Lange-Badre, B., Vandermeersch, B., Borel, J.P.,Bellon, G., 1991. Isotopic biogeochemistry (13C, 15N) of fossil vertebrate collagen:implications for the study of fossil food web including Neandertal Man. J. Hum.Evol. 20, 481–492.
Bortolami, G.C., Ricci, B., Zuppi, G.M., 1978. Isotope hydrology of Val Corsiglia,Maritime Alps, Piedmont Italy. Isotope Hydrol. 1, 327–350.
Bowen, G.J., Revenaugh, J., 2003. Interpolating the isotopic composition of modernmeteoric precipitation. Water Resour. Res. 39, 1299.
Bowen, G.J., Wilkinson, B., 2002. Spatial distribution of d18O in meteoric pre-cipitation. Geology 30, 315–318.
Chao, Y., Telmer, K., Veizer, J., 1996. Chemical dynamics of the St. Lawrence riverinesystem: dDH2O, d18OH2O, d13CH2O, d34Ssulfate, and dissolved 87Sr/86Sr. Geochim.Cosmochim. Acta 60, 851–866.
Clark, I.D., Fritz, P., 1997. Environmental Isotopes in Hydrogeology. Lewis Publishers,Boca Raton, pp. 328.
Crowson, R.A., Showers, W.J., Wright, E.K., Hoering, T.C., 1991. A method for prep-aration of phosphate samples for oxygen isotope analysis. Anal. Chem. 63,2397–2400.
Darling, W.G., 2004. Hydrological factors in the interpretation of stable isotopicproxy data present and past: a European perspective. Quatern. Sci. Rev. 23, 743–770.
Daux, V., Lecuyer, C., Adam, F., Martineau, F., Vimeux, F., 2005. Oxygen isotopecomposition of human teeth and the record of climate changes in France(Lorraine) during the last 1700 years. Clim. Change 70, 445–464.
Dupras, T.L., Schwarcz, H.P., 2001. Strangers in a strange land: stable isotope evi-dence for human migration in the Dakhleh Oasis, Egypt. J. Archaeol. Sci. 28,1199–1208.
Eberhardt, L.L., 1969. Similarity, allometry and food chains. J. Theor. Biol. 24, 43–55.Epstein, S., Mayeda, T., 1953. Variations of d18O content of water from natural
sources. Geochim. Cosmochim. Acta 4, 213.Evans, J., Stoodley, N., Chenery, C., 2006. A strontium and oxygen isotope assess-
ment of a possible fourth century immigrant population in a Hampshire cem-etery, southern England. J. Archaeol. Sci. 33 (2), 265–272.
Firshing, F.H., 1961. Precipitation of silver phosphate from homogeneous solution.Anal. Chem. 33, 873–874.
Fizet, M., Mariotti, A., Bocherens, H., Lange-Badre, B., Vandermeersch, B., Borel, J.P.,Bellon, G., 1995. Effect of diet, physiology and climate on carbon and nitrogenstable isotopes of collagen in a Late Pleistocene anthropic palaeoecosystem:Marillac, Charente, France. J. Archaeol. Sci. 22, 67–79.
Franke, B., Koslitz, S., Micaux, F., Maury, V., Pfammatter, E., Wunderli, S.,Gremaud, G., Bosset, J.-O., Hadorn, R., Kreuzer, M., 2007. Tracing the geographicorigin of poultry meat and dried beef with oxygen and strontium isotope ratios.Eur. Food Res. Technol, 9. Online.
Fricke, H.C., O’Neil, J.R., 1999. The correlation between 18O/16O ratios of meteoricwater and surface temperature: its use in investigating terrestrial climatechange over geologic time. Earth Planet. Sci. Lett. 170, 181–196.
Fricke, H.C., O’Neil, J.R., Lynnerup, N., 1995. Oxygen isotope composition of humantooth enamel from medieval Greenland: linking climate and society. Geology23, 869–872.
Howard, G., Bartram, J., 2003. Water Supply Surveillance: A Reference Manual.WEDC, Loughborough, UK.
Iacumin, P., Nikolaev, V., Ramigni, M., Longinelli, A., 2004. Oxygen isotopes analysesof mammal bone remains from Holocene sites in European Russia: palae-oclimatic implications. Glob. Planet. Change 40 (1–2), 169–176.
Jacques, G., 1996. Le Cycle de l’Eau. Hachette, Paris, pp. 157.
V. Daux et al. / Journal of Human Evolution 55 (2008) 1138–11471146

Author's personal copy
Jost, A., Lunt, D., Kageyama, M., Abe-Ouchi, A., Peyron, O., Valdes, P.J., Ramstein, G.,2005. High resolution simulations of the last glacial maximum climate overEurope: a solution to discrepancies with continental paleoclimatic re-constructions? Clim. Dyn. 24, 577–590.
Kageyama, M., Laine, A., Abe-Ouchi, A., Braconnot, P., Cortijo, E., 2007. Last glacialmaximum temperatures over the North Atlantic, Europe and Western Siberia:a comparison between PMIP models, MARGO sea-surface temperatures andpollen-based reconstructions. Quatern. Sci. Rev. 25, 2082–2102.
Koehler, G., Wassenaar, L.I., Hendry, M.J., 2000. An automated technique for mea-suring dD and d18O values of porewater by direct CO2- and H2- equilibration.Anal. Chem. 72, 5659–5664.
Kohn, M.J., 1996. Predicting animal d18O: accounting for diet and physiologicaladaptation. Geochim. Cosmochim. Acta 60, 4811–4829.
Kohn, M.J., Schoeninger, M.J., Valley, J.W., 1996. Herbivore tooth oxygen isotopecompositions: effects of diet and physiology. Geochim. Cosmochim. Acta 60,3889–3896.
Kozlowski, J.K., Kozlowski, S.K., 1996. Le paleolitique en Pologne. Prehistoire del’Europe 2. Milton, Grenoble, France, pp. 240.
Lecuyer, C., Grandjean, P., Barrat, J.-A., Nolvak, J., Emig, C., Paris, F., Robardet, M., 1998.d18O and REE contents of phosphatic brachiopods: a comparison between modernand lower Paleozoic populations. Geochim. Cosmochim. Acta 48, 385–390.
Lecuyer, C., Grandjean, P., Emig, C.C., 1996. Determination of oxygen isotope frac-tionation between water and phosphate from living lingulids: potential appli-cation to palaeo-environmental studies. Palaeogeogr. Palaeoclimatol.Palaeoecol. 126, 101–108.
Lecuyer, C., Grandjean, P., O’Neil, J.R., Cappetta, H., Martineau, F., 1993. Thermalexcursions in the ocean at the Cretaceous-Tertiary boundary (northern Mo-rocco): the d18O record of phosphatic fish debris. Palaeogeogr. Palaeoclimatol.Palaeoecol. 105, 235–243.
Lee-Thorp, J.A., van der Merwe, N.J., Brain, C.K., 1994. Diet of Australopithecus robustusat Swartkrans from stable carbon isotopic analysis. J. Hum. Evol. 27, 361–372.
Leontiadis, J.L., Vergis, S., Christodoulou, Th., 1996. Isotope hydrology of areas inEastern Macedonia and Thrace, Northern Greece. J. Hydrol. 182, 1–17.
Levinson, A.A., Luz, B., Kolodny, Y., 1987. Variations in oxygen isotopic compositionsof human teeth and urinary stones. Appl. Geochem. 2, 367–371.
Longinelli, A., 1984. Oxygen isotopes in mammal bone phosphate: a new tool forpaleohydrological and paleoclimatological research? Geochim. Cosmochim.Acta 48, 385–390.
Luz, B., Kolodny, Y., Horowitz, M., 1984. Fractionation of oxygen isotopes betweenmammalian bone-phosphate and environmental drinking water. Geochim.Cosmochim. Acta 48, 1689–1693.
Muller, W., Fricke, H., Halliday, A.N., McCulloch, M.T., Wartho, J.-A., 2003. Origin andmigration of the Alpin Iceman. Science 302, 862–866.
OIPC: The Online Isotopes in Precipitation Calculator. Available from: http://www.waterisotopes.org/, 2008.
O’Neil, J.R., Adami, L.H., Epstein, S., 1975. Revised value for the 18O fractionationbetween CO2 and H2O at 25�C. J. Res. US Geol. Surv. 3, 623–624.
O’Neil, J.R., Roe, J.L., Reinhard, E., Blake, R.E., 1994. A rapid and precise method ofoxygen isotope analysis of biogenic phosphate. Isr. J. Earth Sci. 43, 203–212.
Patou-Mathis, M., 2006. Neanderthal. Une autre humanite. Perrin, Paris, pp. 342.Richards, M.P., Jacobi, R., Cook, J., Pettitt, P.B., Stringer, C.B., 2005. Isotope evidence
for the intensive use of marine foods by Late Upper Paleolithic humans. J. Hum.Evol. 49, 390–394.
Richards, M.P., Pettitt, P.B., Trinkaus, E., Smith, F.H., Paunovic, M., Karavanic, I., 2000.Neanderthal diet at Vindija and Neanderthal predation: the evidence fromstable isotopes. Proc. Nat. Acad. Sci. U.S.A. 97, 7663–7666.
Schmidt, H.-L., Werner, R.A., Roßmann, A., 2001. 18O pattern and biosynthesis ofnatural plant products. Phytochemistry 58, 9–32.
Sokal, R.R., Rohlf, F.J., 1995. Biometry: The Principles and Practice of Statistics inBiological Research. W.H. Freeman and Co., New York, pp. 887.
Sponheimer, M., Lee-Thorp, J., de Ruitter, D., Codron, D., Codron, J., Baugh, A.T.,Thackeray, F., 2005. Hominids, sedges and termites: new carbon isotopedata from the Sterkfontein valley and Kruger National Park. J. Hum. Evol.48, 301–312.
Thiem, I., Lupke, M., Seifert, H., 2004. Factors influencing the 18O/16O ratio in meatjuices. Isot. Environ. Health Stud. 40, 191–197.
U.S. Department of Agriculture, Agricultural Research Service, 2005. USDA NutrientDatabase for Standard Reference, Release 18. Nutrient Data Laboratory HomePage. Available from: http://www.ars.usda.gov/ba/bhnrc/ndl.
Van der Merwe, N.J., Thackeray, J.F., Lee-Thorp, J.A., Luyt, J., 2003. The carbon iso-tope ecology and diet of Australopithecus africanus at Sterkfontein, South Africa.J. Hum. Evol. 44, 581–597.
Vennemann, T.W., Fricke, H.C., Blake, R.E., O’Neil, J.R., Colman, A., 2002. Oxygenisotope analysis of phosphates: a comparison of techniques for analysis ofAg3PO4. Chem. Geol. 185, 321–336.
Von Grafenstein, U., Erlenkeuser, H., Muller, J., Trimborn, P., Alefs, J., 1996. A 200year mid-European air temperature record preserved in lake sediments: anextension of the d18Op-air temperature relation in the past. Geochim. Cosmo-chim. Acta 60, 4025–4036.
Weiss, E., Kislev, M.E., Simchoni, O., Nadel, D., 2004. Small-grained wild grassesas staple food at the 23 000-year-old site of Ohalo II, Israel. Econ. Bot. 58,125–134.
White, C.D., Longstaffe, F.J., Spence, M.W., Law, K.R., 2000. Teotihuacan state rep-resentation at Kaminaljuyu: evidence from oxygen isotopes. J. Anthropol. Res.56, 535–558.
White, C.D., Price, T.D., Longstaffe, F.J., 2007. Residential histories of the humansacrifices at the moon pyramid, Teotihuacan. Ancient Mesoamerica 18, 159–172.
Wright, L.E., Schwarcz, H.P., 1998. Stable carbon and oxygen isotopes in humantooth enamel: identifying breastfeeding and weaning in prehistory. Am. J. Phys.Anthropol. 106, 1–18.
V. Daux et al. / Journal of Human Evolution 55 (2008) 1138–1147 1147


