Embed Size (px)
Citation preview

arX
iv:a
stro
-ph/
0406
599v
1 2
6 Ju
n 20
04Accepted for publication in the ApJ: June 24, 20004Preprint typeset using LATEX style emulateapj v. 7/15/03
MODEL ATMOSPHERES FOR IRRADIATED STARS IN PRE-CATACLYSMIC VARIABLES
Travis S. BarmanDepartment of Physics, Wichita State University, Wichita, KS 67260-0032
Email: [email protected]
Peter H. HauschildtHamburger Sternwarte, Gojenbergsweg 112, 21029 Hamburg, Germany
Email: [email protected]
France AllardC.R.A.L, Ecole Normale Superieure, 69364 Lyon Cedex 7, France
EMail: [email protected]
Accepted for publication in the ApJ: June 24, 20004
ABSTRACT
Model atmospheres have been computed for M dwarfs that are strongly irradiated by nearby hotcompanions. A variety of primary and secondary spectral types are explored in addition to modelsspecific to four known systems: GD 245, NN Ser, AA Dor, and UU Sge. This work demonstratesthat a dramatic temperature inversion is possible on at least one hemisphere of an irradiated Mdwarf and the emergent spectrum will be significantly different from an isolated M dwarf or a blackbody flux distribution. For the first time, synthetic spectra suitable for direct comparison to high-resolution observations of irradiated M dwarfs in non-mass transferring post-common envelope binariesare presented. The effects of departures from local thermodynamic equilibrium on the Balmer lineprofiles are also discussed.Subject headings: stars: atmospheres, binaries: close, radiative transfer
1. INTRODUCTION
Synthetic spectra from model atmospheres are fre-quently used in the analysis of observed spectroscopicand photometric data. For the most part, the modelsare sufficiently detailed to test the current theoreticalunderstanding of stellar and sub-stellar mass objects atvarious stages in their evolution. However, the major-ity of model atmospheres are intended for comparisonsto isolated stars and are not appropriate for many shortperiod binaries. A number of binary systems have or-bital separations small enough so that one of the binarymembers is significantly heated by its companion. In or-der for synthetic spectra to be useful in such cases, thestandard “isolated” modeling approach must be replacedby one that includes the effects of irradiation.
Post-common envelope binaries (PCEBs) are examplesof systems where large effects due to irradiation havebeen observed (e.g. Z Cha, Wade & Horne (1988); GD245, Schmidt et al. (1995); GD 444, Marsh & Duck(1996)). Many PCEBs are cataclysmic variables (CVs)with secondaries that, in addition to being irradiated,have over filled their Roche lobe and transfer mass to theprimary via accretion streams or a disk. CVs, while veryinteresting, are not necessarily the best choice for study-ing the effects of irradiation on cool stars. PCEBs thatdo not have on-going mass exchange offer several advan-tages. The absence of accretion ensures that the primaryis the only major source of external heating for the sec-ondary. CVs have additional sources of radiation energy(e.g., from the accretion disk) that are complicated tomodel and could lead to shadows or bright spots on thesecondary. An additional advantage of PCEBs without
mass exchange is that the secondaries have not over filledtheir Roche lobe and are therefore more spherical. Mostnon-mass transferring PCEBs are labeled pre-CVs andoften contain a main sequence (MS) star in close orbitaround a much hotter white dwarf (WD) or sub-dwarf(sdOB). The current study will be restricted to pre-CVswith orbital periods less than 16 days or orbital sepa-rations less than about 3R⊙ (i.e., those that could pos-sibly become a CV within a Hubble time; Hillwig et al.(2000)). For an excellent review of detached binariescontaining WD primaries, see (Marsh 2000).
The average effective temperature of the primary (theWD or sdOB) in pre-CVs is about 50,000K with a fewreaching 100,000K. At just a few R⊙ away, the muchcooler secondary star is significantly heated by the pri-mary’s radiation. Therefore, the secondary’s irradiatedatmosphere is regulated by both extrinsic radiation fromthe primary and intrinsic energy supplied by internalnuclear reactions (or, in the case of a brown dwarf sec-ondary, leftover gravitational energy from formation).Depending on the temperatures, pressures, and chemicalcomposition of the secondary’s atmosphere, a fractionof the extrinsic radiation will be reflected via scatteringby grains, molecules or electrons (or a combination ofthese) while the remaining is absorbed and re-radiated.Furthermore, the two sources of energy may have spec-tral energy distributions (SEDs) that peak at very dif-ferent wavelengths which implies that a broader categoryof opacity sources (spanning the EUV to the far IR) be-come important in shaping the seconday’s atmosphericstructure and emergent spectrum. The situation is alsocomplicated by the fact that only one hemisphere of theirradiated companion is heated at any given time.

2 Barman et al.
IRRADIATED
INC
IDE
NT
FLU
X R2
R1
Primary
Secondary
NON−IRRADIATED
a CORE
Fig. 1.— An illustration of the irradiation model. The primary(left) is treated as a point source at distance a from the centerof the secondary (right). The secondary is divided into two hemi-spheres: irradiated and non-irradiated. The atmosphere on eitherhemisphere is modeled as a collection of concentric shells with theheight of the atmosphere equal to R2 - R1.
Only a few theoretical studies applicable to the at-mospheres and spectra of pre-CVs have been published.One of the more recent works investigated the effectsof irradiation in the eclipsing binary BE Ursae Ma-joris using CLOUDY (Ferguson & James 1994). A nar-row range of M dwarfs (3400K < Teff < 3800K) lo-cated near a 10,000K black body have also been mod-eled (Brett & Smith 1993, here after BS93). A few ear-lier papers provided critical insight into the problem ofirradiation but did not consider situations relevant forpre-CVs (Vaz & Nordlund 1985; Nordlund & Vaz 1990).In addition, the necessary opacity data and spectral linedatabases needed to compute realistic synthetic spec-tra were not available at the time. Consequently, nosynthetic spectra have been published that are detailedenough to provide useful comparisons to high-resolution,phase-resolved, observations of pre-CVs. Furthermore,most light curve models continue to use black body SEDsor, at best, non-irradiated atmosphere models.
In the following sections, models for a variety of ir-radiated pre-CV secondaries will be presented. Thechanges in the atmospheric structure, the chemical com-position, and the spectra will be described. Detailed,line-blanketed, synthetic spectra will also be presentedfor a few specific pre-CV systems.
2. MODEL CONSTRUCTION
All calculations presented here were pro-duced using the PHOENIX model atmosphere code(Hauschildt & Baron 1999). PHOENIX includes an equa-tion of state and radiative transfer solver that is suitablefor modeling a broad range of both hot (Aufdenberg2001) and cool (Allard et al. 2001) objects across theH-R diagram. This flexibility makes PHOENIX wellsuited for modeling systems that contain two extremelydifferent objects (e.g. M dwarfs and WDs).
The secondary may be conceptually divided into twodistinct hemispheres; irradiated and non-irradiated (seeFigure 1). The irradiated hemisphere receives incomingradiation over all angles between 0◦ and 90◦ with re-spect to the surface normal. The effects of heating bythe primary will vary across the surface with decreasedheating near the boundary between the two hemispheres.In order to simplify the simulations, each hemisphere wasmodeled separately using a 1-D, spherically symmetric,atmosphere designed to represent the average thermal
and spectroscopic properties. Since pre-CVs are non-mass transferring systems, the secondary does not over-flow its Roche lobe and, hence, should be reasonably wellapproximated by a sphere. Consequently, the same massand effective gravity (set at a reference optical depth) wasused for both hemisphere models. However, despite hav-ing the same bulk properties, maintaining a consistenttemperature structure and entropy (S) at the bottomof both atmosphere models for the irradiated and non-irradiated hemispheres is not guaranteed. Differences be-tween the temperature structures at the bottom of eachmodel can exist because the effects of horizontal energyflow have not been included and the two hemisphereshave been essentially decoupled. While horizontal en-ergy flow is very likely to be present, including this in thesimulations would require the solution of the full, multi-D, radiation–hydrodynamical problem that is currentlybeyond the scope of this paper. The standard approachfor dealing with horizontal energy flow is to adjust theeffective temperature of one model so the entropy at thedeepest layer is the same for both hemispheres (Vaz &Nordlund 1985; BS93). The details of this problem andhow it is handled are discussed in a subsequent section.
All models were computed assuming hydrostatic andradiative-convective equilibrium. Convection was in-cluded using the standard mixing length theory withthe mixing length parameter set equal to two. The at-mospheres were divided into 100 concentric shells andthe spherically symmetric radiative transfer equation wassolved while explicitly including the incident, frequencydependent, radiation field from the primary. Sphericalsymmetry, as opposed to the more traditional plane par-allel geometry, was chosen because it provides a morerealistic description of the incoming radiation at graz-ing angles that should not penetrate too deeply intothe atmosphere. At some angles, the radiation can passcompletely through the top of the atmosphere. The de-tails of the radiative transfer solution may be found inHauschildt & Baron (1999) (and refs. therein) and de-tails of the irradiation are found in Barman et al. (2001,2002); however, for clarity, a few of the important pointsare repeated.
A secondary with radius Rs intercepts an incident lu-minosity from a primary of radius Rp at distance d with
flux Fp given by πR2s
(
Rp
d
)2
Fp. This absorbed energy
must be distributed over and re-radiated by some frac-tion of the full secondary surface area (4πR2
s ). Thethree most commonly explored physical scenarios are re-radiation by the full surface area, by the irradiated hemi-sphere only, or by a single point. Since the models mustconserve energy, the incoming luminosity must balancethe out-going luminosity of re-radiated extrinsic energy.
In which case, πR2s
(
Rp
d
)2
Fp = Area × Fout. If one
further assumes that Finc = Fout, the monochromaticincident fluxes can be expressed as,
Finc,λ = α
(
Rp
d
)2
Fp,λ, (1)
where Fp,λ are the monochromatic fluxes from the pri-mary surface, and d is the distance from the primarysurface to the secondary surface (note, d = a−Rp −Rs,where a is the orbital separation). The parameter α sets

Irradiated M dwarfs 3
Fig. 2.— Temperature versus pressure for irradiated (top) andnon-irradiated (bottom) atmosphere models. Solid lines are theresults of PHOENIX simulations while dashed lines are taken fromFig. 3 of Brett & Smith (1993). Filled circles indicate the locationof the radiative-convective boundary in the PHOENIX models. Thedifferences between the two sets of calculation are most likely dueto the different treatments of the equation of state and opacities.
the redistribution of the absorbed incident energy overthe secondary’s surface. All incident energy being ab-sorbed and re-radiated by the heated hemisphere corre-sponds to α = 0.5. Re-radiation by the entire secondarysurface corresponds to α = 0.25 and α = 1.0 is for re-radiation by a single point on the surface. For a moredetailed description of the energy balance in an irradi-ated binary companion and the development of a simi-lar α parameter, see Paczynski (1980). Unless otherwisestated, the models presented below were calculated withα = 0.5. This choice is motivated by the fact that manyshort period binaries have tidally locked secondaries.
In all cases, the incident radiation was approximatedby an isotropic radiation field consisting of 64 in-comingintensities (corresponding to 64 incident angles) at thetop most layer (τ1.2 = 0, where τ1.2 refers to a referenceoptical depth measured at 1.2µm) of the model. Isotropicillumination (instead of heating at a fixed angle) waschosen because it better approximates the situation il-lustrated in Fig. 1. While this is clearly a simplificationof the true incident radiation, isotropy roughly accountsfor the fact that the heated hemisphere receives radiationfrom the primary at all angles between 0 and 90 degrees(with respect to the surface normal). Even when the inci-dent radiation is assumed to be isotropic, there are stillbenefits to using spherical geometry. Spherical geome-try, combined with isotropic irradiation, accounts for thepreferential heating of the upper atmospheric layers com-pared to the deeper layers for regions near the boundarybetween the two hemispheres. Across the heated hemi-sphere, the upper layers always receive extrinsic radia-tion while the deeper layers experience considerably lessheating near the boundary compared to the substellarpoint. By virtue of the translational symmetry inherentin plane parallel models, all inward directed intensitiesare propagating toward the center of the object. Thus,for some situations, plane parallel geometry could overes-timate the heating of deeper atmospheric layers and un-derestimate the heating of upper layers. The differencesbetween plane parallel and spherical models are maxi-
mized when the atmospheric extension is large comparedto the mean free path of a photon (e.g., in low gravityobjects). For a spherical model, a large extension has theeffect of decreasing the range of angles over which inci-dent intensities actually propagate toward the bottom ofthe photosphere. In the future, the heated hemispherewill be modeled as a collection of small annular regionswhere the extrinsic radiation is incident along a single an-gle (or a narrow range). In this case, the advantages ofspherical geometry over plane parallel will be even moresignificant.
Since pre-CV primaries have spectra that are very dif-ferent from black body SEDs, the incident intensitieswere taken from synthetic WD spectra (also calculatedwith PHOENIX; Barman et al. 2000). In this way, a morerealistic, wavelength dependent spectrum was used forthe incoming radiation. Unless otherwise stated, the WDmodels have log(g) = 8.0 (cgs units), 1 M⊙, and 10−2 so-lar metal abundances. When modeling a secondary for aspecific pre-CV, a new model atmosphere and syntheticspectrum were used that closely match the primary spec-tral type and, if available, the observed fluxes.
The model calculations for both the primary and thesecondary included more than 50,000 wavelength pointsbetween 10A and 1000µm with a resolution of about 1Afrom the UV to the near-IR (this resolution may be in-creased as necessary). The equation of state and opacitysetup was similar to that used in the NextGen model at-mosphere grid of Hauschildt et al. (1999) but has sincebeen updated to include more recent chemical and opac-ity data (Allard et al. 2001). Local thermodynamic equi-librium (LTE) was assumed for the majority of the calcu-lations; however, the effects of non-LTE are explored forthe hydrogen atom. All models for the secondaries useda solar composition that included 40 of the most impor-tant atomic elements from H to La (atomic numbers 1through 57) as well as their important ions. The atomicdata for the energy levels and bound-bound transitionsare from Kurucz (1994) and Kurucz & Bell (1995). Themolecular opacities include H2O (Partridge & Schwenke1997), TiO (Schwenke 1998), VO (linelist provided by R.Freedman, 2001, private communication) all diatomicsfrom Kurucz (1993), and all lines from the HITRAN andGEISA databases (Rothman et al. 1992; Husson et al.1992). Collision induced absorption (CIA) opacities arealso included for H2, N2, Ar, CH4, and CO2 according to(Gruszka & Borysow 1997, and references therein). Thetotal number of atomic and molecular lines currentlyavailable in PHOENIX (version 13) is ∼ 700 million. Scat-tering (Thomson, Rayleigh, and Mie) was also includedand assumed to be isotropic.
The PHOENIX model atmosphere code uses the effec-tive temperature as an input parameter that specifies(through the Stefan-Boltzmann formula) the net flux (orluminosity) that the model will have. To avoid confusionbetween the effective temperature of irradiated and non-irradiated models, the variable Teff will be used only torefer to the effective temperature of non-irradiated mod-els. In the case of irradiated models, Tint will be usedto describe the intrinsic effective temperature; i.e. theeffective temperature the model would have if irradiationwas not present.
3. RESULTS
4 Barman et al.
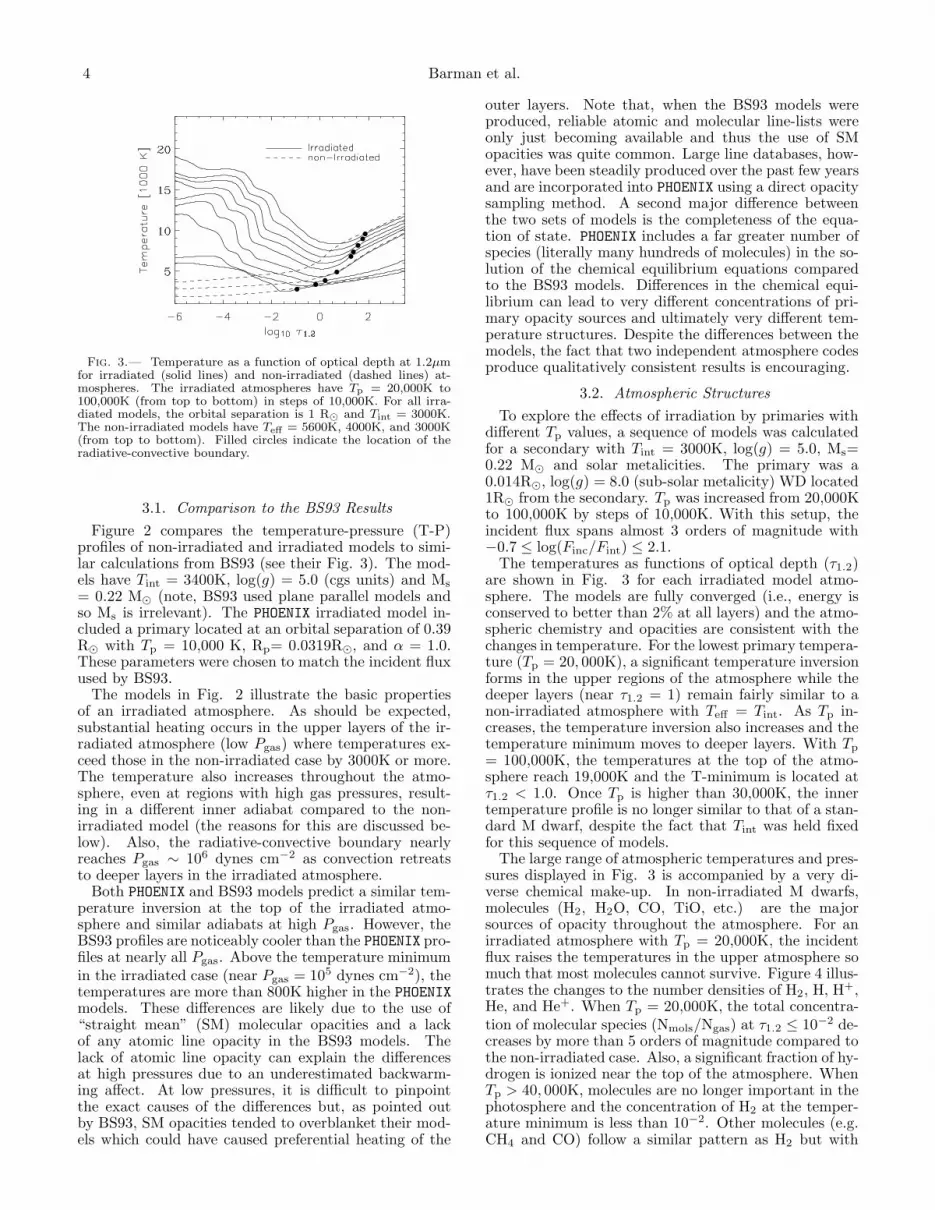
Fig. 3.— Temperature as a function of optical depth at 1.2µmfor irradiated (solid lines) and non-irradiated (dashed lines) at-mospheres. The irradiated atmospheres have Tp = 20,000K to100,000K (from top to bottom) in steps of 10,000K. For all irra-diated models, the orbital separation is 1 R⊙ and Tint = 3000K.The non-irradiated models have Teff = 5600K, 4000K, and 3000K(from top to bottom). Filled circles indicate the location of theradiative-convective boundary.
3.1. Comparison to the BS93 Results
Figure 2 compares the temperature-pressure (T-P)profiles of non-irradiated and irradiated models to simi-lar calculations from BS93 (see their Fig. 3). The mod-els have Tint = 3400K, log(g) = 5.0 (cgs units) and Ms
= 0.22 M⊙ (note, BS93 used plane parallel models andso Ms is irrelevant). The PHOENIX irradiated model in-cluded a primary located at an orbital separation of 0.39R⊙ with Tp = 10,000 K, Rp= 0.0319R⊙, and α = 1.0.These parameters were chosen to match the incident fluxused by BS93.
The models in Fig. 2 illustrate the basic propertiesof an irradiated atmosphere. As should be expected,substantial heating occurs in the upper layers of the ir-radiated atmosphere (low Pgas) where temperatures ex-ceed those in the non-irradiated case by 3000K or more.The temperature also increases throughout the atmo-sphere, even at regions with high gas pressures, result-ing in a different inner adiabat compared to the non-irradiated model (the reasons for this are discussed be-low). Also, the radiative-convective boundary nearlyreaches Pgas ∼ 106 dynes cm−2 as convection retreatsto deeper layers in the irradiated atmosphere.
Both PHOENIX and BS93 models predict a similar tem-perature inversion at the top of the irradiated atmo-sphere and similar adiabats at high Pgas. However, theBS93 profiles are noticeably cooler than the PHOENIX pro-files at nearly all Pgas. Above the temperature minimumin the irradiated case (near Pgas = 105 dynes cm−2), thetemperatures are more than 800K higher in the PHOENIX
models. These differences are likely due to the use of“straight mean” (SM) molecular opacities and a lackof any atomic line opacity in the BS93 models. Thelack of atomic line opacity can explain the differencesat high pressures due to an underestimated backwarm-ing affect. At low pressures, it is difficult to pinpointthe exact causes of the differences but, as pointed outby BS93, SM opacities tended to overblanket their mod-els which could have caused preferential heating of the
outer layers. Note that, when the BS93 models wereproduced, reliable atomic and molecular line-lists wereonly just becoming available and thus the use of SMopacities was quite common. Large line databases, how-ever, have been steadily produced over the past few yearsand are incorporated into PHOENIX using a direct opacitysampling method. A second major difference betweenthe two sets of models is the completeness of the equa-tion of state. PHOENIX includes a far greater number ofspecies (literally many hundreds of molecules) in the so-lution of the chemical equilibrium equations comparedto the BS93 models. Differences in the chemical equi-librium can lead to very different concentrations of pri-mary opacity sources and ultimately very different tem-perature structures. Despite the differences between themodels, the fact that two independent atmosphere codesproduce qualitatively consistent results is encouraging.
3.2. Atmospheric Structures
To explore the effects of irradiation by primaries withdifferent Tp values, a sequence of models was calculatedfor a secondary with Tint = 3000K, log(g) = 5.0, Ms=0.22 M⊙ and solar metalicities. The primary was a0.014R⊙, log(g) = 8.0 (sub-solar metalicity) WD located1R⊙ from the secondary. Tp was increased from 20,000Kto 100,000K by steps of 10,000K. With this setup, theincident flux spans almost 3 orders of magnitude with−0.7 ≤ log(Finc/Fint) ≤ 2.1.
The temperatures as functions of optical depth (τ1.2)are shown in Fig. 3 for each irradiated model atmo-sphere. The models are fully converged (i.e., energy isconserved to better than 2% at all layers) and the atmo-spheric chemistry and opacities are consistent with thechanges in temperature. For the lowest primary tempera-ture (Tp = 20, 000K), a significant temperature inversionforms in the upper regions of the atmosphere while thedeeper layers (near τ1.2 = 1) remain fairly similar to anon-irradiated atmosphere with Teff = Tint. As Tp in-creases, the temperature inversion also increases and thetemperature minimum moves to deeper layers. With Tp
= 100,000K, the temperatures at the top of the atmo-sphere reach 19,000K and the T-minimum is located atτ1.2 < 1.0. Once Tp is higher than 30,000K, the innertemperature profile is no longer similar to that of a stan-dard M dwarf, despite the fact that Tint was held fixedfor this sequence of models.
The large range of atmospheric temperatures and pres-sures displayed in Fig. 3 is accompanied by a very di-verse chemical make-up. In non-irradiated M dwarfs,molecules (H2, H2O, CO, TiO, etc.) are the majorsources of opacity throughout the atmosphere. For anirradiated atmosphere with Tp = 20,000K, the incidentflux raises the temperatures in the upper atmosphere somuch that most molecules cannot survive. Figure 4 illus-trates the changes to the number densities of H2, H, H+,He, and He+. When Tp = 20,000K, the total concentra-tion of molecular species (Nmols/Ngas) at τ1.2 ≤ 10−2 de-creases by more than 5 orders of magnitude compared tothe non-irradiated case. Also, a significant fraction of hy-drogen is ionized near the top of the atmosphere. WhenTp > 40, 000K, molecules are no longer important in thephotosphere and the concentration of H2 at the temper-ature minimum is less than 10−2. Other molecules (e.g.CH4 and CO) follow a similar pattern as H2 but with
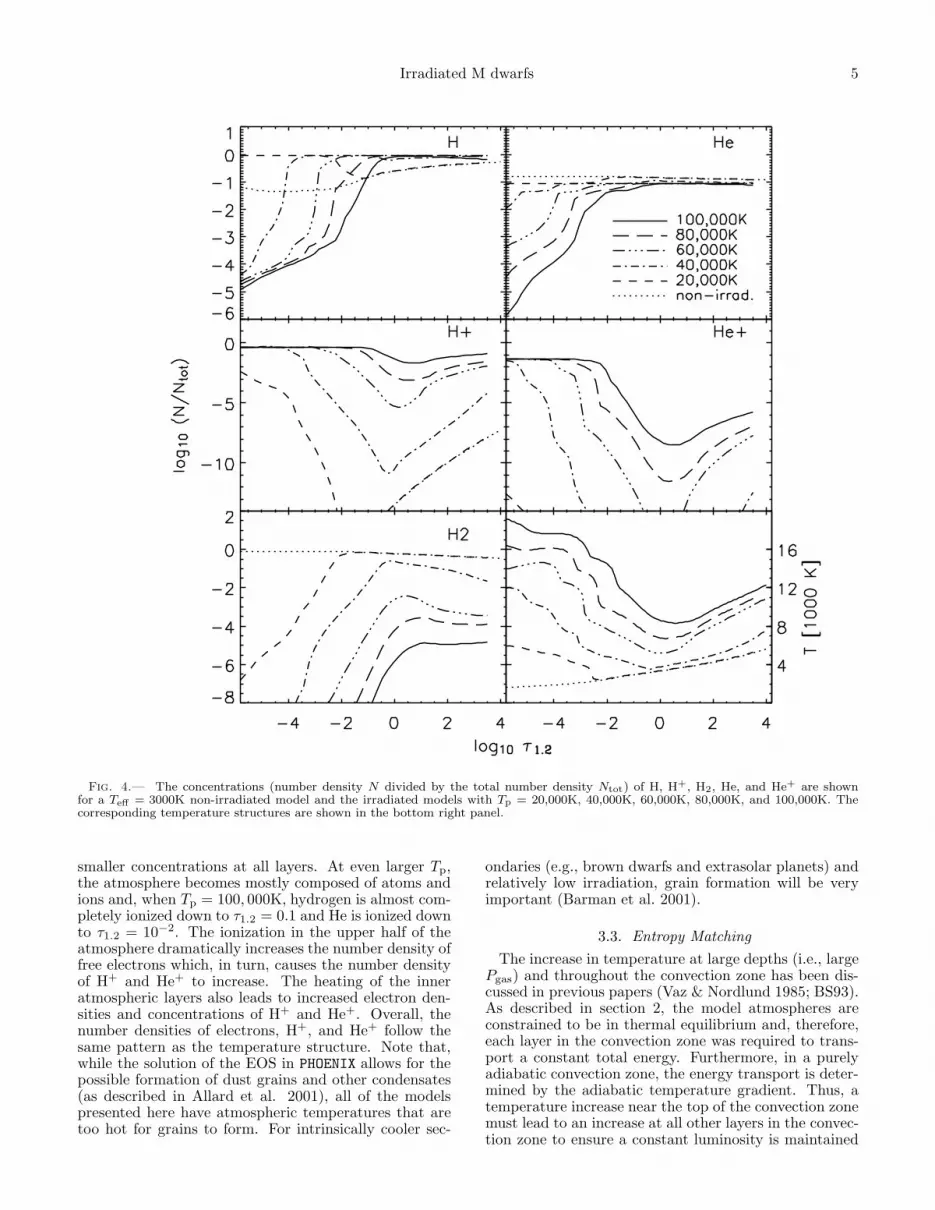
Irradiated M dwarfs 5
Fig. 4.— The concentrations (number density N divided by the total number density Ntot) of H, H+, H2, He, and He+ are shownfor a Teff = 3000K non-irradiated model and the irradiated models with Tp = 20,000K, 40,000K, 60,000K, 80,000K, and 100,000K. Thecorresponding temperature structures are shown in the bottom right panel.
smaller concentrations at all layers. At even larger Tp,the atmosphere becomes mostly composed of atoms andions and, when Tp = 100, 000K, hydrogen is almost com-pletely ionized down to τ1.2 = 0.1 and He is ionized downto τ1.2 = 10−2. The ionization in the upper half of theatmosphere dramatically increases the number density offree electrons which, in turn, causes the number densityof H+ and He+ to increase. The heating of the inneratmospheric layers also leads to increased electron den-sities and concentrations of H+ and He+. Overall, thenumber densities of electrons, H+, and He+ follow thesame pattern as the temperature structure. Note that,while the solution of the EOS in PHOENIX allows for thepossible formation of dust grains and other condensates(as described in Allard et al. 2001), all of the modelspresented here have atmospheric temperatures that aretoo hot for grains to form. For intrinsically cooler sec-
ondaries (e.g., brown dwarfs and extrasolar planets) andrelatively low irradiation, grain formation will be veryimportant (Barman et al. 2001).
3.3. Entropy Matching
The increase in temperature at large depths (i.e., largePgas) and throughout the convection zone has been dis-cussed in previous papers (Vaz & Nordlund 1985; BS93).As described in section 2, the model atmospheres areconstrained to be in thermal equilibrium and, therefore,each layer in the convection zone was required to trans-port a constant total energy. Furthermore, in a purelyadiabatic convection zone, the energy transport is deter-mined by the adiabatic temperature gradient. Thus, atemperature increase near the top of the convection zonemust lead to an increase at all other layers in the convec-tion zone to ensure a constant luminosity is maintained
6 Barman et al.
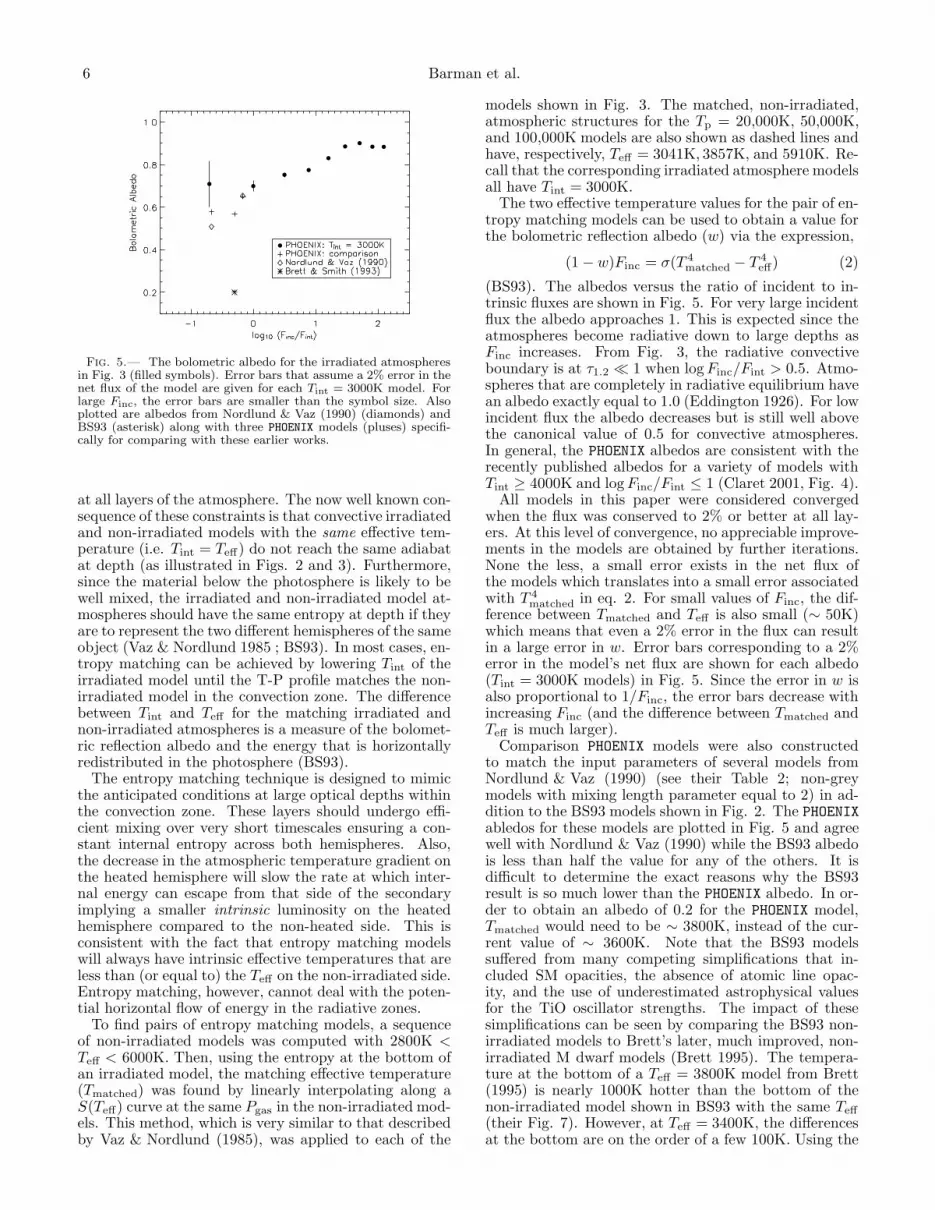
Fig. 5.— The bolometric albedo for the irradiated atmospheresin Fig. 3 (filled symbols). Error bars that assume a 2% error in thenet flux of the model are given for each Tint = 3000K model. Forlarge Finc, the error bars are smaller than the symbol size. Alsoplotted are albedos from Nordlund & Vaz (1990) (diamonds) andBS93 (asterisk) along with three PHOENIX models (pluses) specifi-cally for comparing with these earlier works.
at all layers of the atmosphere. The now well known con-sequence of these constraints is that convective irradiatedand non-irradiated models with the same effective tem-perature (i.e. Tint = Teff) do not reach the same adiabatat depth (as illustrated in Figs. 2 and 3). Furthermore,since the material below the photosphere is likely to bewell mixed, the irradiated and non-irradiated model at-mospheres should have the same entropy at depth if theyare to represent the two different hemispheres of the sameobject (Vaz & Nordlund 1985 ; BS93). In most cases, en-tropy matching can be achieved by lowering Tint of theirradiated model until the T-P profile matches the non-irradiated model in the convection zone. The differencebetween Tint and Teff for the matching irradiated andnon-irradiated atmospheres is a measure of the bolomet-ric reflection albedo and the energy that is horizontallyredistributed in the photosphere (BS93).
The entropy matching technique is designed to mimicthe anticipated conditions at large optical depths withinthe convection zone. These layers should undergo effi-cient mixing over very short timescales ensuring a con-stant internal entropy across both hemispheres. Also,the decrease in the atmospheric temperature gradient onthe heated hemisphere will slow the rate at which inter-nal energy can escape from that side of the secondaryimplying a smaller intrinsic luminosity on the heatedhemisphere compared to the non-heated side. This isconsistent with the fact that entropy matching modelswill always have intrinsic effective temperatures that areless than (or equal to) the Teff on the non-irradiated side.Entropy matching, however, cannot deal with the poten-tial horizontal flow of energy in the radiative zones.
To find pairs of entropy matching models, a sequenceof non-irradiated models was computed with 2800K <Teff < 6000K. Then, using the entropy at the bottom ofan irradiated model, the matching effective temperature(Tmatched) was found by linearly interpolating along aS(Teff) curve at the same Pgas in the non-irradiated mod-els. This method, which is very similar to that describedby Vaz & Nordlund (1985), was applied to each of the
models shown in Fig. 3. The matched, non-irradiated,atmospheric structures for the Tp = 20,000K, 50,000K,and 100,000K models are also shown as dashed lines andhave, respectively, Teff = 3041K, 3857K, and 5910K. Re-call that the corresponding irradiated atmosphere modelsall have Tint = 3000K.
The two effective temperature values for the pair of en-tropy matching models can be used to obtain a value forthe bolometric reflection albedo (w) via the expression,
(1 − w)Finc = σ(T 4matched − T 4
eff) (2)
(BS93). The albedos versus the ratio of incident to in-trinsic fluxes are shown in Fig. 5. For very large incidentflux the albedo approaches 1. This is expected since theatmospheres become radiative down to large depths asFinc increases. From Fig. 3, the radiative convectiveboundary is at τ1.2 ≪ 1 when log Finc/Fint > 0.5. Atmo-spheres that are completely in radiative equilibrium havean albedo exactly equal to 1.0 (Eddington 1926). For lowincident flux the albedo decreases but is still well abovethe canonical value of 0.5 for convective atmospheres.In general, the PHOENIX albedos are consistent with therecently published albedos for a variety of models withTint ≥ 4000K and log Finc/Fint ≤ 1 (Claret 2001, Fig. 4).
All models in this paper were considered convergedwhen the flux was conserved to 2% or better at all lay-ers. At this level of convergence, no appreciable improve-ments in the models are obtained by further iterations.None the less, a small error exists in the net flux ofthe models which translates into a small error associatedwith T 4
matched in eq. 2. For small values of Finc, the dif-ference between Tmatched and Teff is also small (∼ 50K)which means that even a 2% error in the flux can resultin a large error in w. Error bars corresponding to a 2%error in the model’s net flux are shown for each albedo(Tint = 3000K models) in Fig. 5. Since the error in w isalso proportional to 1/Finc, the error bars decrease withincreasing Finc (and the difference between Tmatched andTeff is much larger).
Comparison PHOENIX models were also constructedto match the input parameters of several models fromNordlund & Vaz (1990) (see their Table 2; non-greymodels with mixing length parameter equal to 2) in ad-dition to the BS93 models shown in Fig. 2. The PHOENIXabledos for these models are plotted in Fig. 5 and agreewell with Nordlund & Vaz (1990) while the BS93 albedois less than half the value for any of the others. It isdifficult to determine the exact reasons why the BS93result is so much lower than the PHOENIX albedo. In or-der to obtain an albedo of 0.2 for the PHOENIX model,Tmatched would need to be ∼ 3800K, instead of the cur-rent value of ∼ 3600K. Note that the BS93 modelssuffered from many competing simplifications that in-cluded SM opacities, the absence of atomic line opac-ity, and the use of underestimated astrophysical valuesfor the TiO oscillator strengths. The impact of thesesimplifications can be seen by comparing the BS93 non-irradiated models to Brett’s later, much improved, non-irradiated M dwarf models (Brett 1995). The tempera-ture at the bottom of a Teff = 3800K model from Brett(1995) is nearly 1000K hotter than the bottom of thenon-irradiated model shown in BS93 with the same Teff
(their Fig. 7). However, at Teff = 3400K, the differencesat the bottom are on the order of a few 100K. Using the
Irradiated M dwarfs 7
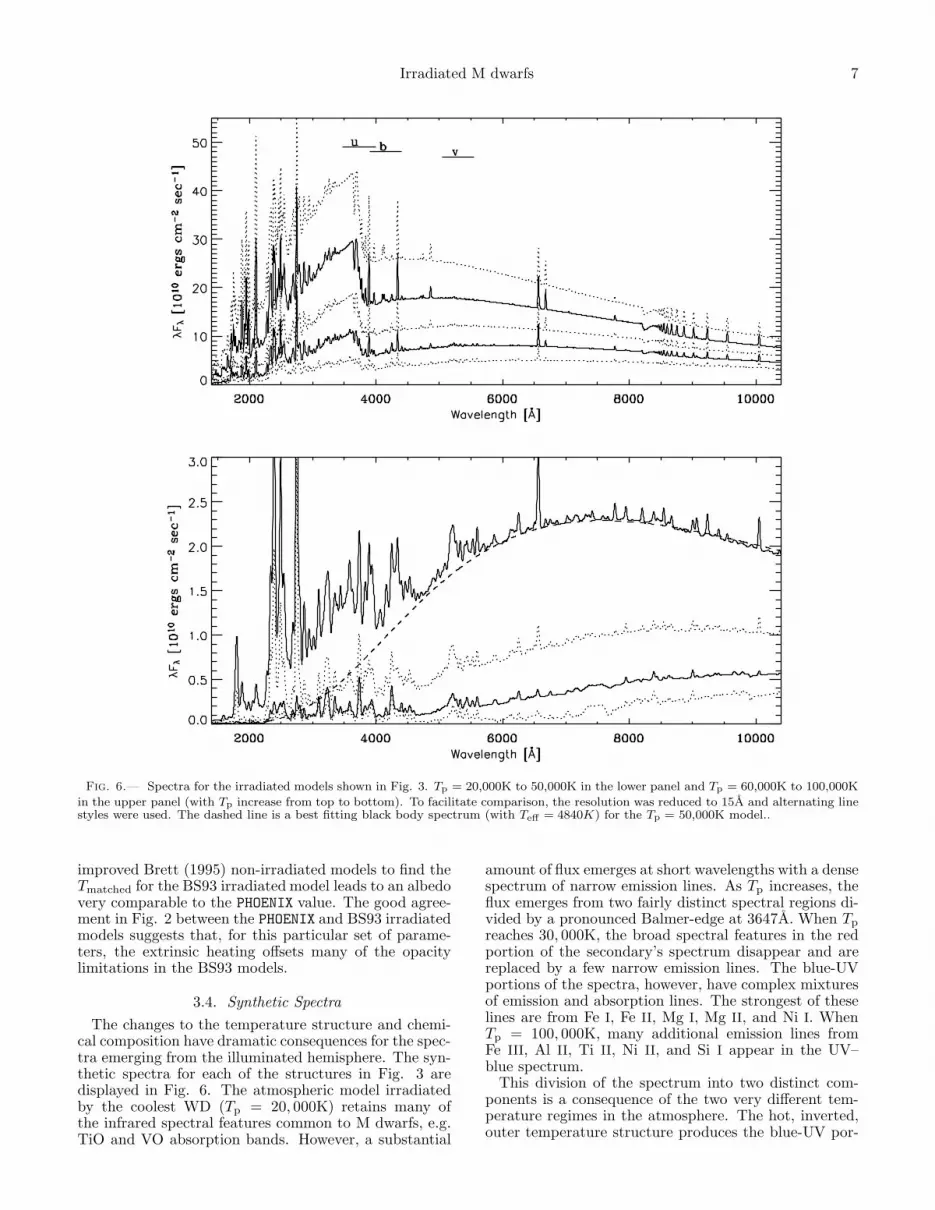
Fig. 6.— Spectra for the irradiated models shown in Fig. 3. Tp = 20,000K to 50,000K in the lower panel and Tp = 60,000K to 100,000K
in the upper panel (with Tp increase from top to bottom). To facilitate comparison, the resolution was reduced to 15A and alternating linestyles were used. The dashed line is a best fitting black body spectrum (with Teff = 4840K) for the Tp = 50,000K model..
improved Brett (1995) non-irradiated models to find theTmatched for the BS93 irradiated model leads to an albedovery comparable to the PHOENIX value. The good agree-ment in Fig. 2 between the PHOENIX and BS93 irradiatedmodels suggests that, for this particular set of parame-ters, the extrinsic heating offsets many of the opacitylimitations in the BS93 models.
3.4. Synthetic Spectra
The changes to the temperature structure and chemi-cal composition have dramatic consequences for the spec-tra emerging from the illuminated hemisphere. The syn-thetic spectra for each of the structures in Fig. 3 aredisplayed in Fig. 6. The atmospheric model irradiatedby the coolest WD (Tp = 20, 000K) retains many ofthe infrared spectral features common to M dwarfs, e.g.TiO and VO absorption bands. However, a substantial
amount of flux emerges at short wavelengths with a densespectrum of narrow emission lines. As Tp increases, theflux emerges from two fairly distinct spectral regions di-vided by a pronounced Balmer-edge at 3647A. When Tp
reaches 30, 000K, the broad spectral features in the redportion of the secondary’s spectrum disappear and arereplaced by a few narrow emission lines. The blue-UVportions of the spectra, however, have complex mixturesof emission and absorption lines. The strongest of theselines are from Fe I, Fe II, Mg I, Mg II, and Ni I. WhenTp = 100, 000K, many additional emission lines fromFe III, Al II, Ti II, Ni II, and Si I appear in the UV–blue spectrum.
This division of the spectrum into two distinct com-ponents is a consequence of the two very different tem-perature regimes in the atmosphere. The hot, inverted,outer temperature structure produces the blue-UV por-
8 Barman et al.
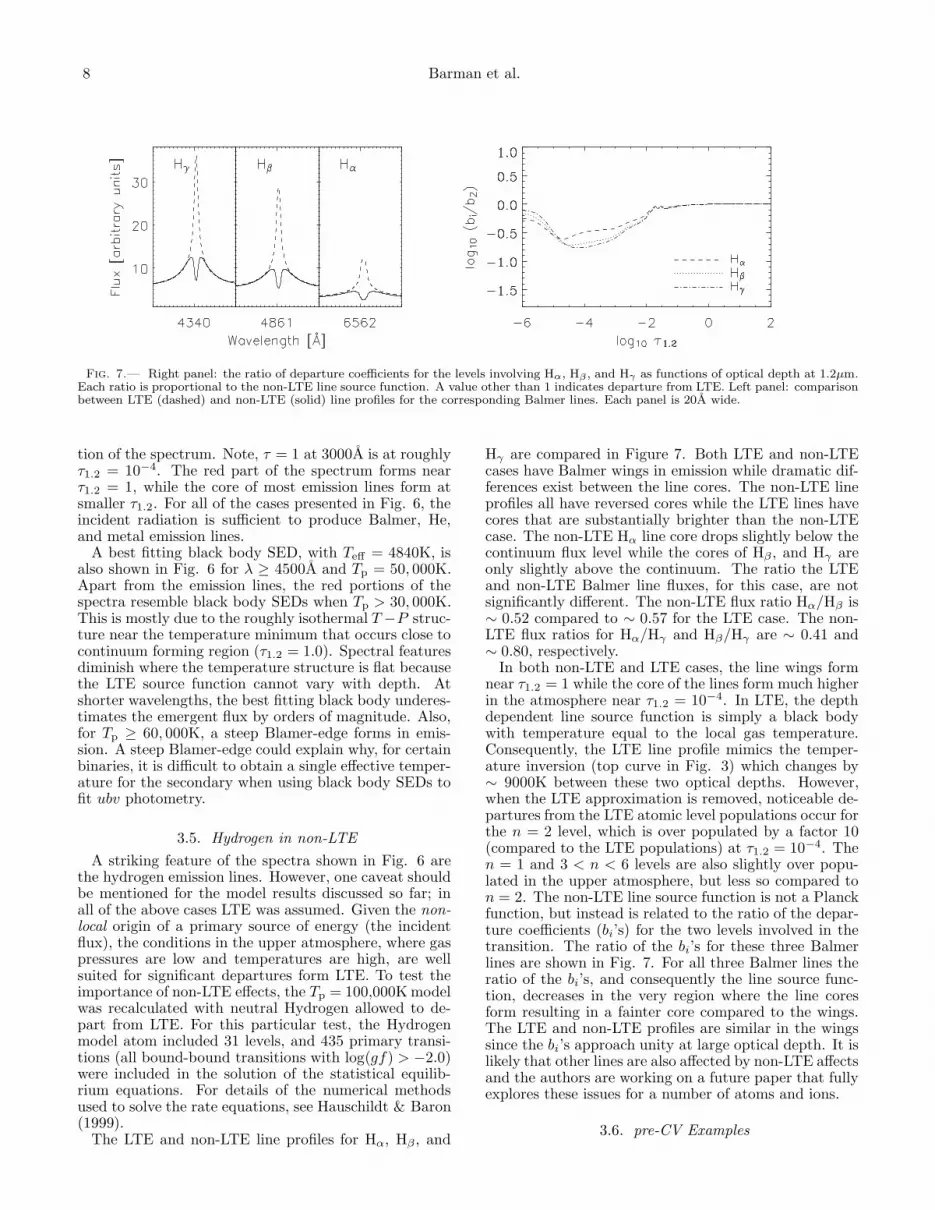
Fig. 7.— Right panel: the ratio of departure coefficients for the levels involving Hα, Hβ , and Hγ as functions of optical depth at 1.2µm.Each ratio is proportional to the non-LTE line source function. A value other than 1 indicates departure from LTE. Left panel: comparisonbetween LTE (dashed) and non-LTE (solid) line profiles for the corresponding Balmer lines. Each panel is 20A wide.
tion of the spectrum. Note, τ = 1 at 3000A is at roughlyτ1.2 = 10−4. The red part of the spectrum forms nearτ1.2 = 1, while the core of most emission lines form atsmaller τ1.2. For all of the cases presented in Fig. 6, theincident radiation is sufficient to produce Balmer, He,and metal emission lines.
A best fitting black body SED, with Teff = 4840K, isalso shown in Fig. 6 for λ ≥ 4500A and Tp = 50, 000K.Apart from the emission lines, the red portions of thespectra resemble black body SEDs when Tp > 30, 000K.This is mostly due to the roughly isothermal T −P struc-ture near the temperature minimum that occurs close tocontinuum forming region (τ1.2 = 1.0). Spectral featuresdiminish where the temperature structure is flat becausethe LTE source function cannot vary with depth. Atshorter wavelengths, the best fitting black body underes-timates the emergent flux by orders of magnitude. Also,for Tp ≥ 60, 000K, a steep Blamer-edge forms in emis-sion. A steep Blamer-edge could explain why, for certainbinaries, it is difficult to obtain a single effective temper-ature for the secondary when using black body SEDs tofit ubv photometry.
3.5. Hydrogen in non-LTE
A striking feature of the spectra shown in Fig. 6 arethe hydrogen emission lines. However, one caveat shouldbe mentioned for the model results discussed so far; inall of the above cases LTE was assumed. Given the non-local origin of a primary source of energy (the incidentflux), the conditions in the upper atmosphere, where gaspressures are low and temperatures are high, are wellsuited for significant departures form LTE. To test theimportance of non-LTE effects, the Tp = 100,000K modelwas recalculated with neutral Hydrogen allowed to de-part from LTE. For this particular test, the Hydrogenmodel atom included 31 levels, and 435 primary transi-tions (all bound-bound transitions with log(gf) > −2.0)were included in the solution of the statistical equilib-rium equations. For details of the numerical methodsused to solve the rate equations, see Hauschildt & Baron(1999).
The LTE and non-LTE line profiles for Hα, Hβ , and
Hγ are compared in Figure 7. Both LTE and non-LTEcases have Balmer wings in emission while dramatic dif-ferences exist between the line cores. The non-LTE lineprofiles all have reversed cores while the LTE lines havecores that are substantially brighter than the non-LTEcase. The non-LTE Hα line core drops slightly below thecontinuum flux level while the cores of Hβ , and Hγ areonly slightly above the continuum. The ratio the LTEand non-LTE Balmer line fluxes, for this case, are notsignificantly different. The non-LTE flux ratio Hα/Hβ is∼ 0.52 compared to ∼ 0.57 for the LTE case. The non-LTE flux ratios for Hα/Hγ and Hβ/Hγ are ∼ 0.41 and∼ 0.80, respectively.
In both non-LTE and LTE cases, the line wings formnear τ1.2 = 1 while the core of the lines form much higherin the atmosphere near τ1.2 = 10−4. In LTE, the depthdependent line source function is simply a black bodywith temperature equal to the local gas temperature.Consequently, the LTE line profile mimics the temper-ature inversion (top curve in Fig. 3) which changes by∼ 9000K between these two optical depths. However,when the LTE approximation is removed, noticeable de-partures from the LTE atomic level populations occur forthe n = 2 level, which is over populated by a factor 10(compared to the LTE populations) at τ1.2 = 10−4. Then = 1 and 3 < n < 6 levels are also slightly over popu-lated in the upper atmosphere, but less so compared ton = 2. The non-LTE line source function is not a Planckfunction, but instead is related to the ratio of the depar-ture coefficients (bi’s) for the two levels involved in thetransition. The ratio of the bi’s for these three Balmerlines are shown in Fig. 7. For all three Balmer lines theratio of the bi’s, and consequently the line source func-tion, decreases in the very region where the line coresform resulting in a fainter core compared to the wings.The LTE and non-LTE profiles are similar in the wingssince the bi’s approach unity at large optical depth. It islikely that other lines are also affected by non-LTE affectsand the authors are working on a future paper that fullyexplores these issues for a number of atoms and ions.
3.6. pre-CV Examples

Irradiated M dwarfs 9
Table 1. System properties for example pre-CVs
Primary Secondary
Object Teff (K) R(R⊙) M(M⊙) Teff (K) R(R⊙) M(M⊙) a(R⊙) log(Finc) refs.
GD 245 22,170 0.015 0.48 3560 0.27 0.22 1.17 9.35 Schmidt et al. (1995)NN Ser 55,000 0.019 0.57 2900 0.17 0.12 0.95 11.32 Catalan et al. (1994)AA Dor 42,000 0.19 0.40 3000 0.10 0.073 1.14 12.69 Hilditch et al. (2003)UU Sge 85,000 0.34 0.63 6250 0.54 0.29 2.46 13.79 Bell et al. (1994)
The models and methods described above were appliedto four example systems (GD 245, NN Ser, AA Dor, andUU Sge) that have been well observed and documented inthe literature. These systems were chosen because theyrepresent the broadest range of properties for PCEBs,spanning 4 orders of magnitude in incident flux. Twosystems, GD 245 and NN Ser, have WD primaries whilethe other two, AA Dor and UU Sge, have hot sub-dwarfstars as primaries. The purpose of this section is notto determine the properties of each system, but insteadto illustrate some of the probable characteristics of theirsecondary’s heated hemisphere. The orbital parametersand the bulk properties for the primary and secondarywere taken from previous works and are listed in Table1.
3.6.1. GD 245 & NN Ser
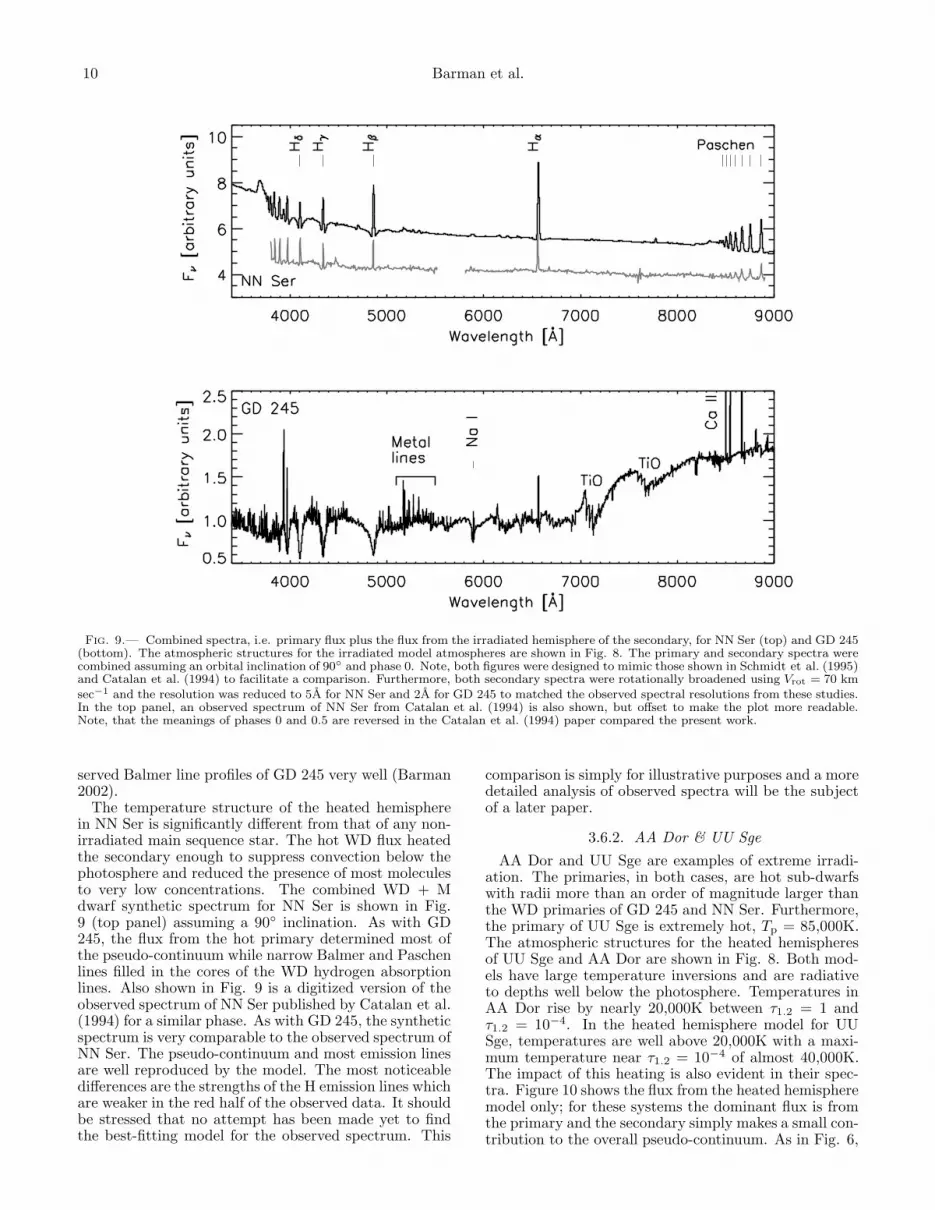
GD 245 and NN Ser are two examples of pre-CVs forwhich phase resolved spectroscopy has been performed(Schmidt et al. 1995; Catalan et al. 1994). Both sys-tems are observed to have Balmer lines composed ofabsorption wings from the primary and narrow emis-sion cores from the heated face of the secondary. Thestrength of the emission peaks at zero phase when theheated hemisphere is most visible. The observations ofGD 245 clearly show the presence of additional emissionlines from the secondary due to various metals (Mg II,Fe I, Na I, and Ca II). The spectra of NN Ser also showthe presence of emission from Ca II and He I. Using theparameters listed in Table 1, model atmospheres werecomputed for the secondary of both GD 245 and NNSer. As described above, a single irradiated model wasused to represent the average properties of the heatedhemisphere.
The temperature structures are shown in Fig. 8. BothGD 245 and NN Ser have substantial temperature inver-sions at the top of the atmosphere and, in the case ofNN Ser, extending down to τ1.2 = 1. Both structuresare compared to that of a non-irradiated M dwarf withlog(g) = 5.0 and Teff = 3500K (lowest dashed curve inFig. 8). Apart from the temperature inversion, the ir-radiated model of GD 245 remains similar to a normalM dwarf atmosphere with convection present at layerswhere τ1.2 < 0.1. However, the model for NN Ser, whichincluded a much hotter primary (Tp = 55,000K) thanGD 245, has a purely radiative atmosphere and is nearlyisothermal down to τ1.2 = 1.
In the lower panel of Fig. 9, a total synthetic spec-trum is shown for the GD 245 system: i.e. the spec-trum of the WD primary and heated face of the sec-ondary were added using the parameters listed in Table1 assuming a 90◦ inclination. At λ<
∼6000A, the pseudo-
Fig. 8.— Temperature versus optical depth (at 1.2µm) fromirradiated models for the example cases listed in Table 1 (solidlines). Dashed lines are non-irradiated models with Teff = 6000K(top) and Teff = 3000K (bottom).
continuum is shaped primarily by the WD’s continuumand broad Balmer absorption lines. The red part of thespectrum is dominated by the flux from the secondary,which retains deep molecular absorption bands despitethe extrinsic heating. In addition, the synthetic spec-trum approximately reproduced the basic collection ofemission lines and relative line strengths shown in pre-viously published observed spectra (see Figs. 2 and 3 ofSchmidt et al. 1995). There are certainly differences be-tween the observed spectrum and the synthetic spectrum(e.g., the number and widths of the metal lines). How-ever, given that only a single 1-D model was used forthe secondary’s heated hemisphere and only Hydrogenwas treated in non-LTE, the similarities are encourag-ing. Also, Schmidt et al. (1995) estimated that GD 245emits about 60 times more Hα flux than predicted bysimply counting the raw number of incident ionizing pho-tons from the WD. Schmidt et al. (1995) suggested thatirradiation might reduce the number densities of molecu-lar and neutral atomic opacity sources and allow for theWD’s Balmer continuum to supply the photons neededto explain the Hα flux. This idea is supported by the cur-rent models, which do show a dramatic decrease in theconcentration of molecules and neutral atomic species.Furthermore, the synthetic spectrum shown in Fig. 9 hasHα flux ∼ 2×10⁻¹⁴ ergs cm−2 sec−1 which is close to theobserved value of 3.7 × 10⁻¹⁴ ergs cm−2 sec−1 at phasezero. Note that a more realistic synthetic spectrum builtfrom many irradiated models that simulate the variableheating across the secondary’s surface reproduces the ob-
10 Barman et al.
Fig. 9.— Combined spectra, i.e. primary flux plus the flux from the irradiated hemisphere of the secondary, for NN Ser (top) and GD 245(bottom). The atmospheric structures for the irradiated model atmospheres are shown in Fig. 8. The primary and secondary spectra werecombined assuming an orbital inclination of 90◦ and phase 0. Note, both figures were designed to mimic those shown in Schmidt et al. (1995)and Catalan et al. (1994) to facilitate a comparison. Furthermore, both secondary spectra were rotationally broadened using Vrot = 70 kmsec−1 and the resolution was reduced to 5A for NN Ser and 2A for GD 245 to matched the observed spectral resolutions from these studies.In the top panel, an observed spectrum of NN Ser from Catalan et al. (1994) is also shown, but offset to make the plot more readable.Note, that the meanings of phases 0 and 0.5 are reversed in the Catalan et al. (1994) paper compared the present work.
served Balmer line profiles of GD 245 very well (Barman2002).
The temperature structure of the heated hemispherein NN Ser is significantly different from that of any non-irradiated main sequence star. The hot WD flux heatedthe secondary enough to suppress convection below thephotosphere and reduced the presence of most moleculesto very low concentrations. The combined WD + Mdwarf synthetic spectrum for NN Ser is shown in Fig.9 (top panel) assuming a 90◦ inclination. As with GD245, the flux from the hot primary determined most ofthe pseudo-continuum while narrow Balmer and Paschenlines filled in the cores of the WD hydrogen absorptionlines. Also shown in Fig. 9 is a digitized version of theobserved spectrum of NN Ser published by Catalan et al.(1994) for a similar phase. As with GD 245, the syntheticspectrum is very comparable to the observed spectrum ofNN Ser. The pseudo-continuum and most emission linesare well reproduced by the model. The most noticeabledifferences are the strengths of the H emission lines whichare weaker in the red half of the observed data. It shouldbe stressed that no attempt has been made yet to findthe best-fitting model for the observed spectrum. This
comparison is simply for illustrative purposes and a moredetailed analysis of observed spectra will be the subjectof a later paper.
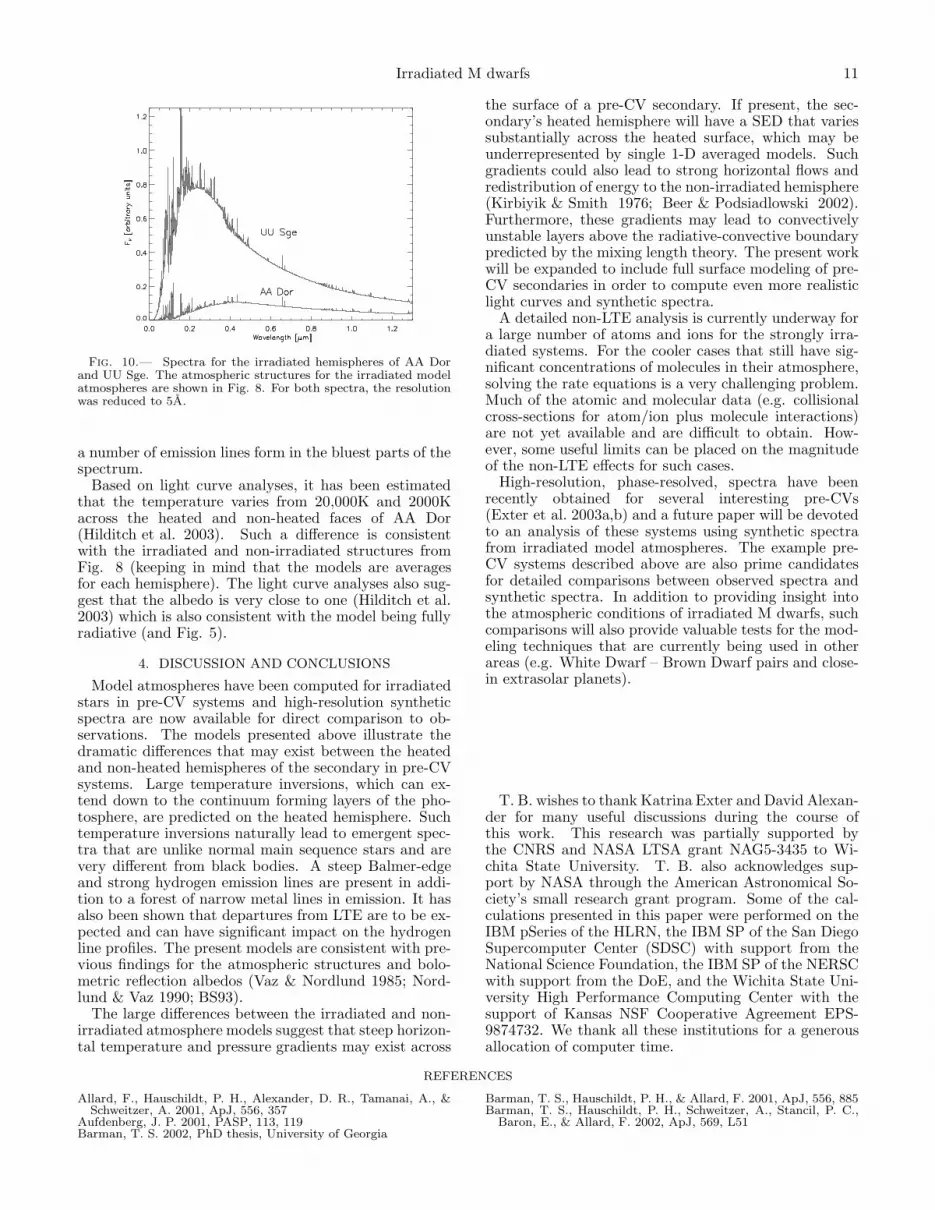
3.6.2. AA Dor & UU Sge
AA Dor and UU Sge are examples of extreme irradi-ation. The primaries, in both cases, are hot sub-dwarfswith radii more than an order of magnitude larger thanthe WD primaries of GD 245 and NN Ser. Furthermore,the primary of UU Sge is extremely hot, Tp = 85,000K.The atmospheric structures for the heated hemispheresof UU Sge and AA Dor are shown in Fig. 8. Both mod-els have large temperature inversions and are radiativeto depths well below the photosphere. Temperatures inAA Dor rise by nearly 20,000K between τ1.2 = 1 andτ1.2 = 10−4. In the heated hemisphere model for UUSge, temperatures are well above 20,000K with a maxi-mum temperature near τ1.2 = 10−4 of almost 40,000K.The impact of this heating is also evident in their spec-tra. Figure 10 shows the flux from the heated hemispheremodel only; for these systems the dominant flux is fromthe primary and the secondary simply makes a small con-tribution to the overall pseudo-continuum. As in Fig. 6,
Irradiated M dwarfs 11
Fig. 10.— Spectra for the irradiated hemispheres of AA Dorand UU Sge. The atmospheric structures for the irradiated modelatmospheres are shown in Fig. 8. For both spectra, the resolutionwas reduced to 5A.
a number of emission lines form in the bluest parts of thespectrum.
Based on light curve analyses, it has been estimatedthat the temperature varies from 20,000K and 2000Kacross the heated and non-heated faces of AA Dor(Hilditch et al. 2003). Such a difference is consistentwith the irradiated and non-irradiated structures fromFig. 8 (keeping in mind that the models are averagesfor each hemisphere). The light curve analyses also sug-gest that the albedo is very close to one (Hilditch et al.2003) which is also consistent with the model being fullyradiative (and Fig. 5).
4. DISCUSSION AND CONCLUSIONS
Model atmospheres have been computed for irradiatedstars in pre-CV systems and high-resolution syntheticspectra are now available for direct comparison to ob-servations. The models presented above illustrate thedramatic differences that may exist between the heatedand non-heated hemispheres of the secondary in pre-CVsystems. Large temperature inversions, which can ex-tend down to the continuum forming layers of the pho-tosphere, are predicted on the heated hemisphere. Suchtemperature inversions naturally lead to emergent spec-tra that are unlike normal main sequence stars and arevery different from black bodies. A steep Balmer-edgeand strong hydrogen emission lines are present in addi-tion to a forest of narrow metal lines in emission. It hasalso been shown that departures from LTE are to be ex-pected and can have significant impact on the hydrogenline profiles. The present models are consistent with pre-vious findings for the atmospheric structures and bolo-metric reflection albedos (Vaz & Nordlund 1985; Nord-lund & Vaz 1990; BS93).
The large differences between the irradiated and non-irradiated atmosphere models suggest that steep horizon-tal temperature and pressure gradients may exist across
the surface of a pre-CV secondary. If present, the sec-ondary’s heated hemisphere will have a SED that variessubstantially across the heated surface, which may beunderrepresented by single 1-D averaged models. Suchgradients could also lead to strong horizontal flows andredistribution of energy to the non-irradiated hemisphere(Kirbiyik & Smith 1976; Beer & Podsiadlowski 2002).Furthermore, these gradients may lead to convectivelyunstable layers above the radiative-convective boundarypredicted by the mixing length theory. The present workwill be expanded to include full surface modeling of pre-CV secondaries in order to compute even more realisticlight curves and synthetic spectra.
A detailed non-LTE analysis is currently underway fora large number of atoms and ions for the strongly irra-diated systems. For the cooler cases that still have sig-nificant concentrations of molecules in their atmosphere,solving the rate equations is a very challenging problem.Much of the atomic and molecular data (e.g. collisionalcross-sections for atom/ion plus molecule interactions)are not yet available and are difficult to obtain. How-ever, some useful limits can be placed on the magnitudeof the non-LTE effects for such cases.
High-resolution, phase-resolved, spectra have beenrecently obtained for several interesting pre-CVs(Exter et al. 2003a,b) and a future paper will be devotedto an analysis of these systems using synthetic spectrafrom irradiated model atmospheres. The example pre-CV systems described above are also prime candidatesfor detailed comparisons between observed spectra andsynthetic spectra. In addition to providing insight intothe atmospheric conditions of irradiated M dwarfs, suchcomparisons will also provide valuable tests for the mod-eling techniques that are currently being used in otherareas (e.g. White Dwarf – Brown Dwarf pairs and close-in extrasolar planets).
T. B. wishes to thank Katrina Exter and David Alexan-der for many useful discussions during the course ofthis work. This research was partially supported bythe CNRS and NASA LTSA grant NAG5-3435 to Wi-chita State University. T. B. also acknowledges sup-port by NASA through the American Astronomical So-ciety’s small research grant program. Some of the cal-culations presented in this paper were performed on theIBM pSeries of the HLRN, the IBM SP of the San DiegoSupercomputer Center (SDSC) with support from theNational Science Foundation, the IBM SP of the NERSCwith support from the DoE, and the Wichita State Uni-versity High Performance Computing Center with thesupport of Kansas NSF Cooperative Agreement EPS-9874732. We thank all these institutions for a generousallocation of computer time.
REFERENCES
Allard, F., Hauschildt, P. H., Alexander, D. R., Tamanai, A., &Schweitzer, A. 2001, ApJ, 556, 357
Aufdenberg, J. P. 2001, PASP, 113, 119Barman, T. S. 2002, PhD thesis, University of Georgia
Barman, T. S., Hauschildt, P. H., & Allard, F. 2001, ApJ, 556, 885Barman, T. S., Hauschildt, P. H., Schweitzer, A., Stancil, P. C.,
Baron, E., & Allard, F. 2002, ApJ, 569, L51

12 Barman et al.
Barman, T. S., Hauschildt, P. H., Short, C. I., & Baron, E. 2000,ApJ, 537, 946
Beer, M. E. & Podsiadlowski, P. 2002, MNRAS, 335, 358Bell, S. A., Pollacco, D. L., & Hilditch, R. W. 1994, MNRAS, 270,
449Brett, J. M. 1995, A&AS, 109, 263Brett, J. M. & Smith, R. C. 1993, MNRAS, 264, 641Catalan, M. S., Davey, S. C., Sarna, M. J., Connon-Smith, R., &
Wood, J. H. 1994, MNRAS, 269, 879Claret, A. 2001, MNRAS, 327, 989Eddington, A. S. 1926, MNRAS, 86, 320Exter, K., Pollacco, D. L., Maxted, P. F. L., Napiwotzki, R., & Bell,
S. A. 2003a, in NATO ASIB Proc. 105: White Dwarfs, 287–+Exter, K. M., Pollacco, D. L., & Bell, S. A. 2003b, MNRAS, 341,
1349Ferguson, D. H. & James, T. A. 1994, ApJS, 94, 723Gruszka, M. & Borysow, A. 1997, Icarus, 129, 172Hauschildt, P. H., Allard, F., & Baron, E. 1999, ApJ, 512, 377Hauschildt, P. H. & Baron, E. 1999, JCAM, 102, 41Hilditch, R. W., Kilkenny, D., Lynas-Gray, A. E., & Hill, G. 2003,
MNRAS, 344, 644Hillwig, T. C., Honeycutt, R. K., & Robertson, J. W. 2000, AJ,
120, 1113
Husson, N., Bonnet, B., Scott, N., & A., C. 1992, JQSRT, 48, 509Kirbiyik, H. & Smith, R. C. 1976, MNRAS, 176, 103Kurucz, R. L. 1993, Molecular Data for Opacity Calculations,
Kurucz CD-ROM No. 15—. 1994, Atomic Data for Fe and Ni, Kurucz CD-ROM No. 22Kurucz, R. L. & Bell, B. 1995, Atomic Line List, Kurucz CD-ROM
No. 23Marsh, T. R. 2000, New Astronomy Review, 44, 119Nordlund, A. & Vaz, L. P. R. 1990, A&A, 228, 231Paczynski, B. 1980, Acta Astronomica, 30, 113Partridge, H. & Schwenke, D. W. 1997, J. Chem. Phys., 106, 4618Rothman, L. S., Gamache, R. R., Tipping, R. H., Rinsland, C. P.,
Smith, M. A. H., Chris Benner, D., Malathy Devi, V., Flaub,J.-M., Camy-Peyret, C., Perrin, A., Goldman, A., Massie, S. T.,Brown, L., & Toth, R. A. 1992, JQSRT, 48, 469
Schmidt, G. D., Smith, P. S., Harvey, D. A., & Grauer, A. D. 1995,AJ, 110, 398
Schwenke, D. W. 1998, Chemistry and Physics of Molecules andGrains in Space. Faraday Discussion, 109, 321
Vaz, L. P. R. & Nordlund, A. 1985, A&A, 147, 281