Embed Size (px)
Citation preview
OCHRE FINGERPRINTS: DISTINGUISHING AMONGMALAWIAN MINERAL PIGMENT SOURCES WITH
HOMOGENIZED OCHRE CHIP LA–ICPMS*
A. M. ZIPKIN,1† J. M. HANCHAR,2 A. S. BROOKS,1,3 M. W. GRABOWSKI,1
J. C. THOMPSON4 and E. GOMANI-CHINDEBVU5
1Center for the Advanced Study of Hominid Palaeobiology, Department of Anthropology, The George Washington University,2110 G Street NW, Washington, DC 20052, USA
2Department of Earth Sciences, Memorial University of Newfoundland, St John’s, NL, A1B 3X5, Canada3Human Origins Program, National Museum of Natural History, Smithsonian Institution, Washington, DC 20560, USA
4School of Social Science, Archaeology Program, University of Queensland, Michie Building (9), Brisbane,QLD 4072, Australia
5Ministry of Tourism, Wildlife, and Culture, Tourism House, Private Bag 326, Lilongwe 3, Malawi
In this study, we compared the effectiveness of instrumental neutron activation analysis (INAA)of bulk ochre to laser ablation-inductively coupled plasma mass spectrometry of homogenizedochre chips (HOC LA–ICPMS) at distinguishing among three ochre sources in northernMalawi. Both techniques upheld the Provenance Postulate; however, HOC LA–ICPMSrequired less sample material than INAA and facilitated fast, inexpensive replicate observa-tions that allowed for more robust statistical analysis. Our results indicated that HOCLA–ICPMS is a maturing technique that will be a valuable option for analysing artefacts thatrequire minimally destructive sampling but are too large to fit into the laser cell for directablation. With regard to the statistical procedures used, stepwise canonical discriminantanalysis was demonstrated to be a highly effective method for distinguishing among ochresources, even in the presence of significant intra-source and intra-sample heterogeneity.Continued development of the HOC sample preparation technique will expand the range ofarchaeological ochre artefacts that can be included in provenance studies and prevent biastowards artefacts of convenient-to-analyse dimensions.
KEYWORDS: OCHRE, MALAWI, LA–ICPMS, INAA, PROVENANCE, CANONICALDISCRIMINANT ANALYSIS
INTRODUCTION
Ochre, a diverse family of iron-containing earth pigments, is a common component of MiddleStone Age (MSA) archaeological assemblages, some of which date to older than the earliestHomo sapiens fossils (e.g., >195 ± 5 ka), and has frequently been linked to the origins ofsymbolic behaviour (McBrearty and Brooks 2000; Barham 2002; McDougall et al. 2005;Henshilwood et al. 2009; Watts 2010). Dependence on visual symbolism to communicate infor-mation and reify group and individual identities is an essential attribute of our species. Over thepast decade, a critical mass of evidence has emerged (e.g., d’Errico et al. 2005; Henshilwoodet al. 2011) indicating a deep temporal origin for symbolic and other aspects of complex humanbehaviour. Archaeologists readily acknowledge unambiguous evidence for symbolic behaviour,
*Received 4 June 2013; accepted 10 January 2014†Corresponding author: email [email protected]
bs_bs_banner
Archaeometry 57, 2 (2015) 297–317 doi: 10.1111/arcm.12090
© 2014 University of Oxford
such as rock art, figurines and musical instruments, as well as older evidence including inciseddesigns and personal ornaments. Claims for an earlier onset of material symbolism in homininsother than Homo sapiens and particularly the use of ochre as a pigment in a symbolic capacity,however, remain contentious (Wadley 2006; d’Errico 2008; Dayet et al. 2013). The presence ofpigments in archaeological sites cannot be treated as an unqualified proxy for modern symbolicbehaviour. Investigating patterns of pigment transport will shed light on the pervasiveness ofochre use in Middle Stone Age cultures and whether ochre collection at a given site wasopportunistic or the result of preferential source exploitation.
Identifying the unique trace element “fingerprint” of ochre artefacts and of extant sources ofochre can facilitate the matching of human-transported pigments to the locations at which theywere collected in antiquity (Popelka-Filcoff 2006). This in turn allows archaeologists to recon-struct transport patterns and detect whether humans exhibited a preference for ochre from aparticular source. By determining the relative representation of various geological sources in anarchaeological ochre assemblage and correlating this with ochre characteristics such as accessi-bility on the landscape, colour, friability, mineralogy and grain size, researchers will gain insightinto the criteria that guided acquisition strategies (e.g., Dayet et al. 2013). Similar provenanceinvestigations focusing on obsidian have a long and intellectually productive legacy in EastAfrican archaeology (e.g., Merrick and Brown 1984; Negash and Shackley 2006; Braun et al.2008), while recent studies have adapted existing methods for use with silcrete (Nash et al. 2013)and chert (Gauthier et al. 2012).
Here, we report new results from a study that compares the efficacy of two approaches to ochretrace element geochemistry. Instrumental neutron activation analysis (INAA) of powdered bulkochre and laser ablation-inductively coupled plasma mass spectrometry (LA–ICPMS) of glue andochre chips were both used to characterize samples from three ochre sources in northern Malawi.The resulting compositional data were used to distinguish amongst the sources. Samples of ochretaken from natural deposits were of no special cultural significance and presented a novel andlow-risk opportunity for development of laboratory techniques and refinement of data analysismethods that can eventually be applied to archaeological artefacts. The goals of this project wereto identify the optimal technique by which to collect trace element data from ochre and toevaluate critically some aspects of the statistical analysis of such data. Subsequent publicationswill address the full geological and geochemical diversity of iron oxide deposits in northernMalawi. The research presented here was undertaken as a result of investigations into the AfricanMSA; however, the techniques used are of broad applicability to provenance studies regardless ofgeographical or temporal specialization and may be adapted for use with a diverse range ofarchaeological materials.
BACKGROUND
Ochre and ochre provenance
Ochre is an inherently problematic term. In their 2008 study of turquoise sourcing, Hull andcolleagues emphasized the distinction between “cultural turquoise (e.g., any blue–green stonethat resembles turquoise such as chrysocolla) and chemical turquoise (copper–aluminum hydrousphosphate)”. A similar and perhaps more complex relationship exists amongst materials labelledas “ochre”. Ochres are generally oxidized alteration or weathering products of iron ores, sulphideminerals or other iron-rich rocks (Harben and Kužvart 1996). Using the categories of Hull et al.(2008) as a guide, cultural ochre can be defined as rocks, clays and soils united by their
298 A. M. Zipkin et al.
© 2014 University of Oxford, Archaeometry 57, 2 (2015) 297–317
ferruginous nature and suitability for use as a pigment, particularly by producing red, orange,yellow, violet and brown streaks (SI 1). The most common chromophores in ochreous rocks arethe iron oxide hematite (α-Fe2O3) and the iron oxyhydroxide goethite (α-FeOOH); other lesscommon chromophores include ferrihydrite (Fe5O8H · H2O), lepidocrocite (γ-FeOOH; Cornelland Schwertmann 2003) and jarosite (KFe3[SO4]2(OH)6; Jercher et al. 1998). Common accessoryminerals in ochre include quartz and other silicate minerals, hydrous aluminium phyllosilicates(clays), micas, carbonates, evaporites and organic matter (Watts 2002; Green and Watling 2007).Unlike turquoise, there is no single chemical formula for sensu stricto ochre. For the purposes ofprovenance studies where the goal is the reconstruction of human behaviour, the term ochre mustinclude all ferruginous materials that could plausibly have been used as pigment.
A wide range of analytical methods have been applied to provenance studies of archaeologicalochre (SI 2); the most successfully applied approach has been trace element “fingerprinting”. TheProvenance Postulate states that some measurable qualitative or quantitative difference must existbetween geological sources of the material of interest and that this inter-source variation mustexceed the variation within each source (Weigand et al. 1977; Neff 2000). Trace element finger-printing entails obtaining precise measurements of a few to a few dozen elements whoseconcentrations are less than 1000 parts per million (ppm) (Glascock 1992) and which ideally haveremained immobile from their source in the weathering environment. The concentrations of thesetrace elements are often source specific and can be used to distinguish among ochre deposits.Previous ochre fingerprinting studies (e.g., Popelka-Filcoff et al. 2007a; Iriarte et al. 2009;MacDonald et al. 2011) have focused on the rare earth elements (REE) and transition metals thatare present at trace amounts in ochre and found them to be effective at chemically differentiatinggeological sources.
Instrumental neutron activation analysis
The INAA methods used with archaeological materials such as obsidian and ceramics (Glascock1992; Neff 2000) were first adapted for use with ochre by Popelka-Filcoff (2006). Popelka-Filcoff and colleagues have since used INAA to analyse ochres from Missouri (Popelka-Filcoffet al. 2007a), Peru (Popelka-Filcoff et al. 2007b) and Arizona (Popelka-Filcoff et al. 2008).Similar publications include the sourcing of ochre at the Hohokam and O’odham sites in Arizonaby Eiselt et al. (2011), MacDonald’s (2008) study of ochre provenance in British Columbia andthe Kiehn et al. (2007) study fingerprinting specularite sources in Botswana. These efforts havegenerally been successful, though often with qualifications such as difficulty in distinguishingbetween sources at the local scale (e.g., Kiehn et al. 2007). Estimated Limit of Detection (LOD)values for INAA (Table S1) and LOD values for LA–ICPMS (Table S2) are provided; however,a direct comparison would probably be misleading because there are other advantages anddisadvantages to each method. INAA is a destructive technique that requires homogenizing thesample and exposing it to a neutron source such as the neutron flux from a fission reactor.Although the sample size for INAA is relatively small at 170–190 mg (SI 2), it can still beprohibitively large for some artefacts.
Laser ablation – inductively coupled plasma mass spectrometry
Several studies in recent years (e.g., Iriarte et al. 2009; Russ et al. 2012; Bu et al. 2013) haveemployed solution or laser ablation ICPMS to measure the trace element composition of ochrepigments. Unlike INAA, which requires up to 6 weeks of decay time after sample irradiation
Distinguishing among ochre fingerprints with HOC LA–ICPMS 299
© 2014 University of Oxford, Archaeometry 57, 2 (2015) 297–317
before short, middle and long measurements can be completed, LA–ICPMS yields results thatare effectively instantaneous (Pollard et al. 2007). One potential application of LA–ICPMS isthe minimally destructive analysis of rare pigment artefacts which must be preserved intact formuseum display or future research. If a whole artefact can be fitted into the laser chamber andablated directly, far less ochre per analysis (e.g., a typical LA pit is ∼40 μm in diameter and∼45 μm deep) would be required and almost no visible damage to the artefact would occur.Progressive ablation at one location could be used to build a concentration depth profile anddetect compositional heterogeneity (Sarah et al. 2007). Alternatively, Green and Watling (2007)proposed a variant of LA–ICPMS that uses “paint chips”, referred to here as homogenizedochre chips (HOCs), made of ground ochre and a glue binder as the target for ablation. Thistechnique was used in a modified form in this study and can be used in future research toanalyse artefacts, that are too large to fit into an ablation chamber and analyse directly.Although not entirely non-destructive, drilling an artefact to extract ∼10 mg of powder formaking a HOC will be significantly less destructive than sampling an artefact for INAA. Whilemaintaining a geological source differentiating capability comparable to direct ablation, HOCsample preparation will expand the range of pigments for which it is possible to do composi-tional analysis and will help prevent an overemphasis in future provenance studies on materialsthat are easy to analyse.
Regional setting and source sampling
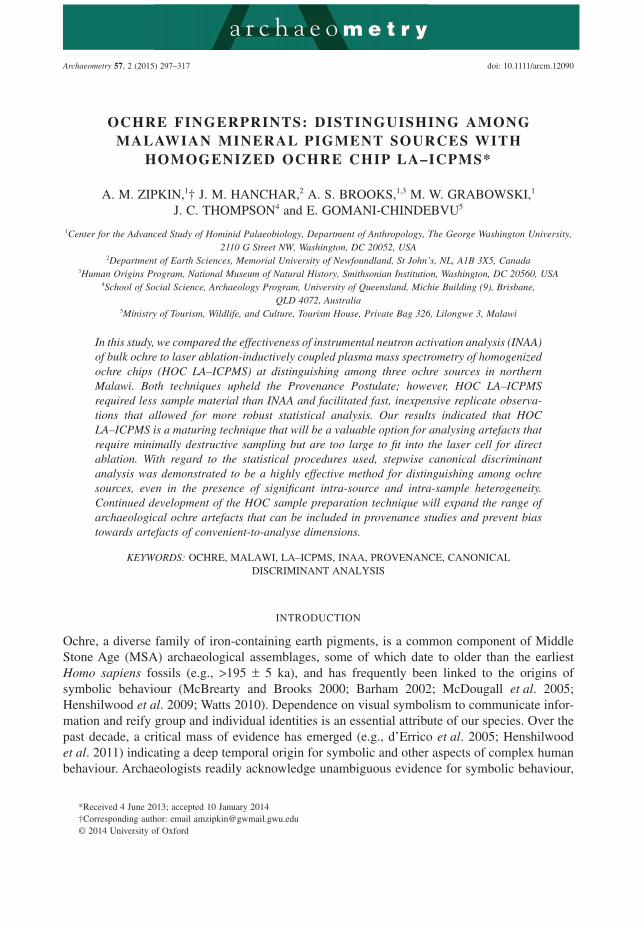
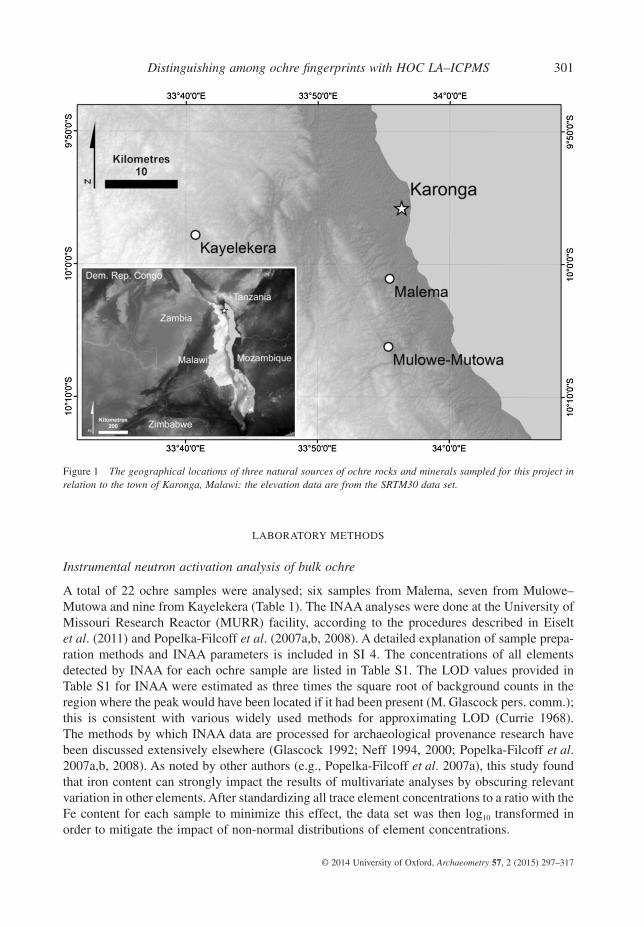
This project’s study area was based around the town of Karonga, Northern Region, Malawi,located on the western shore of Lake Malawi at UTM coordinates 36 L, 602314 m east,8901814 m south (Fig. 1). Geologically, the whole of Malawi falls within the western branch ofthe East African Rift system, which includes the Albertine, Tanganyika, Rukwa and Malawi rifts(Ebinger 1989). The Malawi Rift is composed of a sequence of north–south orientated half-grabens with a sharp escarpment on the eastern side and a segmented ramp opposite to it (Betzlerand Ring 1995). The northernmost Tukuyu–Karonga half-graben is bounded to the east by theLivingstone Fault. Quaternary sediments have infilled the hanging wall to the west, between theTanzanian border and the Chiweta Escarpment (Biggs et al. 2010). The sequence includesthe Middle–Late Pleistocene Chitimwe Beds, which are predominately alluvial fan depositscontaining abundant MSA artefacts (Thompson et al. 2012). These unconformably overlie thefossiliferous Pliocene lacustrine/nearshore Chiwondo Beds (Kaufulu et al. 1981).
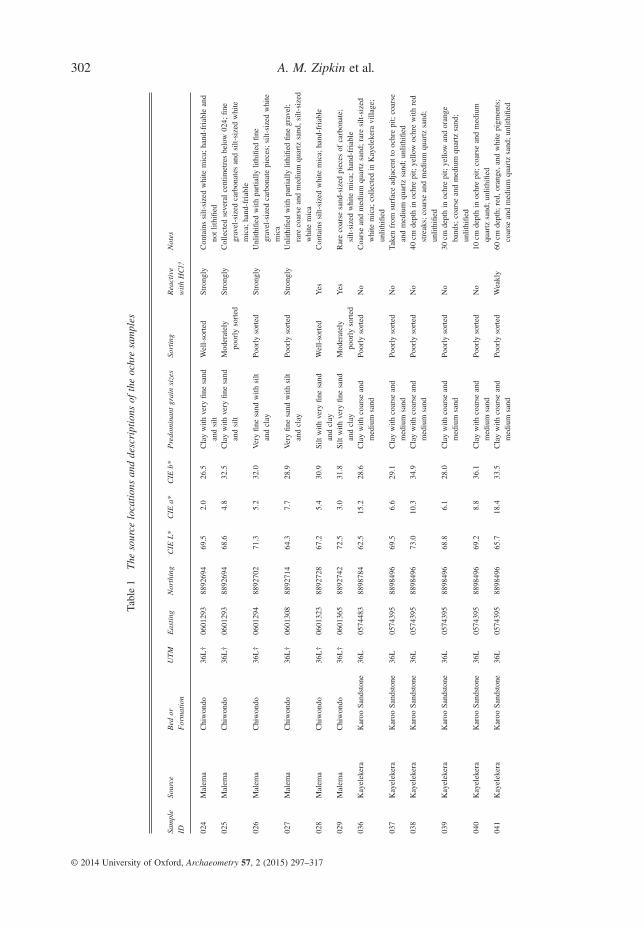
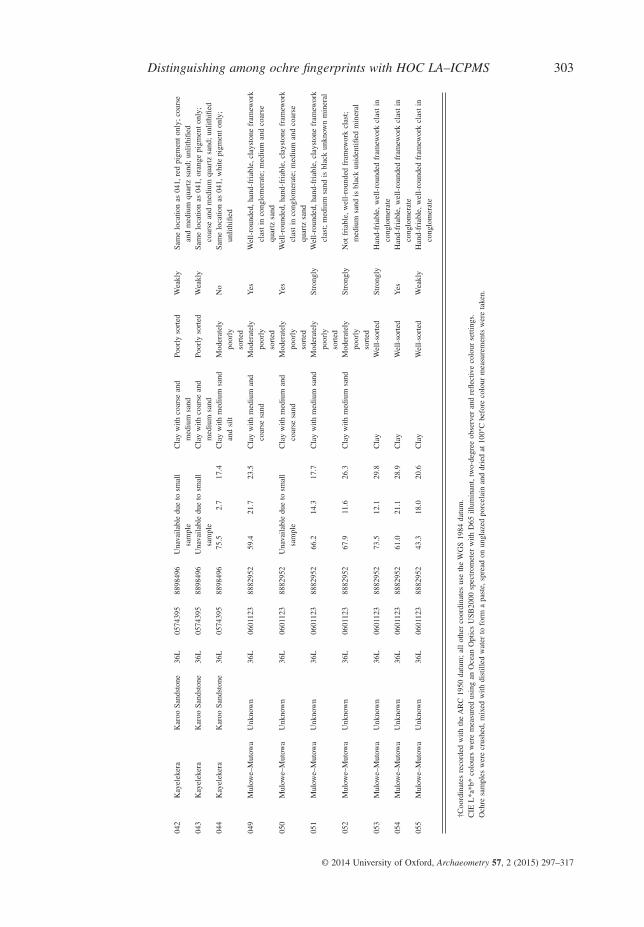
During the 2011 Malawi Earlier-Middle Stone Age Project (MEMSAP) field season, sourcesof ferruginous earth pigments were sought throughout northern Malawi, primarily throughdiscussions with Karonga District residents about the origin of red, orange and yellow paints seenon the external walls of homes or decorating locally produced pottery. A total of seven sources ofochreous minerals were identified during the field season, but budgetary limitations restricted thismethodological study to analyses of three sources: Malema (Fig. S1), Mulowe–Mutowa (Fig. S2)and Kayelekera (Fig. S3), shown in geographical context in Figure 1 and described in greaterdetail in SI 3. These three sources were selected because they were the most thoroughly sampledand provided the best opportunity for characterizing intra-source variation. Multiple sampleswere collected from each source, with particular attention paid to acquiring ochre from differentdepths within a deposit and representing different colours of ochre when applicable. GPScoordinates, CIE L*a*b* (CIE 1978) measurements of sample colour and descriptions for all 22ochre samples are provided in Table 1.
300 A. M. Zipkin et al.
© 2014 University of Oxford, Archaeometry 57, 2 (2015) 297–317
LABORATORY METHODS
Instrumental neutron activation analysis of bulk ochre
A total of 22 ochre samples were analysed; six samples from Malema, seven from Mulowe–Mutowa and nine from Kayelekera (Table 1). The INAA analyses were done at the University ofMissouri Research Reactor (MURR) facility, according to the procedures described in Eiseltet al. (2011) and Popelka-Filcoff et al. (2007a,b, 2008). A detailed explanation of sample prepa-ration methods and INAA parameters is included in SI 4. The concentrations of all elementsdetected by INAA for each ochre sample are listed in Table S1. The LOD values provided inTable S1 for INAA were estimated as three times the square root of background counts in theregion where the peak would have been located if it had been present (M. Glascock pers. comm.);this is consistent with various widely used methods for approximating LOD (Currie 1968).The methods by which INAA data are processed for archaeological provenance research havebeen discussed extensively elsewhere (Glascock 1992; Neff 1994, 2000; Popelka-Filcoff et al.2007a,b, 2008). As noted by other authors (e.g., Popelka-Filcoff et al. 2007a), this study foundthat iron content can strongly impact the results of multivariate analyses by obscuring relevantvariation in other elements. After standardizing all trace element concentrations to a ratio with theFe content for each sample to minimize this effect, the data set was then log10 transformed inorder to mitigate the impact of non-normal distributions of element concentrations.
Figure 1 The geographical locations of three natural sources of ochre rocks and minerals sampled for this project inrelation to the town of Karonga, Malawi: the elevation data are from the SRTM30 data set.
Distinguishing among ochre fingerprints with HOC LA–ICPMS 301
© 2014 University of Oxford, Archaeometry 57, 2 (2015) 297–317
Tabl
e1
The
sour
celo
cati
ons
and
desc
ript
ions
ofth
eoc
hre
sam
ples
Sam
ple
IDSo
urce
Bed
orF
orm
atio
nU
TM
Eas
ting
Nor
thin
gC
IEL
*C
IEa*
CIE
b*P
redo
min
ant
grai
nsi
zes
Sort
ing
Rea
ctiv
ew
ith
HC
l?N
otes
024
Mal
ema
Chi
won
do36
L†
0601
293
8892
694
69.5
2.0
26.5
Cla
yw
ithve
ryfin
esa
ndan
dsi
ltW
ell-
sort
edSt
rong
lyC
onta
ins
silt-
size
dw
hite
mic
a;ha
nd-f
riab
lean
dno
tlit
hifie
d02
5M
alem
aC
hiw
ondo
36L
†06
0129
388
9269
468
.64.
832
.5C
lay
with
very
fine
sand
and
silt
Mod
erat
ely
poor
lyso
rted
Stro
ngly
Col
lect
edse
vera
lce
ntim
etre
sbe
low
024;
fine
grav
el-s
ized
carb
onat
esan
dsi
lt-si
zed
whi
tem
ica;
hand
-fri
able
026
Mal
ema
Chi
won
do36
L†
0601
294
8892
702
71.3
5.2
32.0
Ver
yfin
esa
ndw
ithsi
ltan
dcl
ayPo
orly
sort
edSt
rong
lyU
nlith
ified
with
part
ially
lithi
fied
fine
grav
el-s
ized
carb
onat
epi
eces
;si
lt-si
zed
whi
tem
ica
027
Mal
ema
Chi
won
do36
L†
0601
308
8892
714
64.3
7.7
28.9
Ver
yfin
esa
ndw
ithsi
ltan
dcl
ayPo
orly
sort
edSt
rong
lyU
nlith
ified
with
part
ially
lithi
fied
fine
grav
el;
rare
coar
sean
dm
ediu
mqu
artz
sand
,silt
-siz
edw
hite
mic
a02
8M
alem
aC
hiw
ondo
36L
†06
0132
388
9272
867
.25.
430
.9Si
ltw
ithve
ryfin
esa
ndan
dcl
ayW
ell-
sort
edY
esC
onta
ins
silt-
size
dw
hite
mic
a;ha
nd-f
riab
le
029
Mal
ema
Chi
won
do36
L†
0601
365
8892
742
72.5
3.0
31.8
Silt
with
very
fine
sand
and
clay
Mod
erat
ely
poor
lyso
rted
Yes
Rar
eco
arse
sand
-siz
edpi
eces
ofca
rbon
ate;
silt-
size
dw
hite
mic
a;ha
nd-f
riab
le03
6K
ayel
eker
aK
aroo
Sand
ston
e36
L05
7448
388
9878
462
.515
.228
.6C
lay
with
coar
sean
dm
ediu
msa
ndPo
orly
sort
edN
oC
oars
ean
dm
ediu
mqu
artz
sand
;ra
resi
lt-si
zed
whi
tem
ica;
colle
cted
inK
ayel
eker
avi
llage
;un
lithi
fied
037
Kay
elek
era
Kar
ooSa
ndst
one
36L
0574
395
8898
496
69.5
6.6
29.1
Cla
yw
ithco
arse
and
med
ium
sand
Poor
lyso
rted
No
Take
nfr
omsu
rfac
ead
jace
ntto
ochr
epi
t;co
arse
and
med
ium
quar
tzsa
nd;
unlit
hifie
d03
8K
ayel
eker
aK
aroo
Sand
ston
e36
L05
7439
588
9849
673
.010
.334
.9C
lay
with
coar
sean
dm
ediu
msa
ndPo
orly
sort
edN
o40
cmde
pth
inoc
hre
pit;
yello
woc
hre
with
red
stre
aks;
coar
sean
dm
ediu
mqu
artz
sand
;un
lithi
fied
039
Kay
elek
era
Kar
ooSa
ndst
one
36L
0574
395
8898
496
68.8
6.1
28.0
Cla
yw
ithco
arse
and
med
ium
sand
Poor
lyso
rted
No
30cm
dept
hin
ochr
epi
t;ye
llow
and
oran
geba
nds;
coar
sean
dm
ediu
mqu
artz
sand
;un
lithi
fied
040
Kay
elek
era
Kar
ooSa
ndst
one
36L
0574
395
8898
496
69.2
8.8
36.1
Cla
yw
ithco
arse
and
med
ium
sand
Poor
lyso
rted
No
10cm
dept
hin
ochr
epi
t;co
arse
and
med
ium
quar
tzsa
nd;
unlit
hifie
d04
1K
ayel
eker
aK
aroo
Sand
ston
e36
L05
7439
588
9849
665
.718
.433
.5C
lay
with
coar
sean
dm
ediu
msa
ndPo
orly
sort
edW
eakl
y60
cmde
pth;
red,
oran
ge,a
ndw
hite
pigm
ents
;co
arse
and
med
ium
quar
tzsa
nd;
unlit
hifie
d
302 A. M. Zipkin et al.
© 2014 University of Oxford, Archaeometry 57, 2 (2015) 297–317
042
Kay
elek
era
Kar
ooSa
ndst
one
36L
0574
395
8898
496
Una
vaila
ble
due
tosm
all
sam
ple
Cla
yw
ithco
arse
and
med
ium
sand
Poor
lyso
rted
Wea
kly
Sam
elo
catio
nas
041,
red
pigm
ent
only
;co
arse
and
med
ium
quar
tzsa
nd;
unlit
hifie
d04
3K
ayel
eker
aK
aroo
Sand
ston
e36
L05
7439
588
9849
6U
nava
ilabl
edu
eto
smal
lsa
mpl
eC
lay
with
coar
sean
dm
ediu
msa
ndPo
orly
sort
edW
eakl
ySa
me
loca
tion
as04
1,or
ange
pigm
ent
only
;co
arse
and
med
ium
quar
tzsa
nd;
unlit
hifie
d04
4K
ayel
eker
aK
aroo
Sand
ston
e36
L05
7439
588
9849
675
.52.
717
.4C
lay
with
med
ium
sand
and
silt
Mod
erat
ely
poor
lyso
rted
No
Sam
elo
catio
nas
041,
whi
tepi
gmen
ton
ly;
unlit
hifie
d
049
Mul
owe–
Mut
owa
Unk
now
n36
L06
0112
388
8295
259
.421
.723
.5C
lay
with
med
ium
and
coar
sesa
ndM
oder
atel
ypo
orly
sort
ed
Yes
Wel
l-ro
unde
d,ha
nd-f
riab
le,c
lays
tone
fram
ewor
kcl
ast
inco
nglo
mer
ate;
med
ium
and
coar
sequ
artz
sand
050
Mul
owe–
Mut
owa
Unk
now
n36
L06
0112
388
8295
2U
nava
ilabl
edu
eto
smal
lsa
mpl
eC
lay
with
med
ium
and
coar
sesa
ndM
oder
atel
ypo
orly
sort
ed
Yes
Wel
l-ro
unde
d,ha
nd-f
riab
le,c
lays
tone
fram
ewor
kcl
ast
inco
nglo
mer
ate;
med
ium
and
coar
sequ
artz
sand
051
Mul
owe–
Mut
owa
Unk
now
n36
L06
0112
388
8295
266
.214
.317
.7C
lay
with
med
ium
sand
Mod
erat
ely
poor
lyso
rted
Stro
ngly
Wel
l-ro
unde
d,ha
nd-f
riab
le,c
lays
tone
fram
ewor
kcl
ast;
med
ium
sand
isbl
ack
unkn
own
min
eral
052
Mul
owe–
Mut
owa
Unk
now
n36
L06
0112
388
8295
267
.911
.626
.3C
lay
with
med
ium
sand
Mod
erat
ely
poor
lyso
rted
Stro
ngly
Not
fria
ble,
wel
l-ro
unde
dfr
amew
ork
clas
t;m
ediu
msa
ndis
blac
kun
iden
tified
min
eral
053
Mul
owe–
Mut
owa
Unk
now
n36
L06
0112
388
8295
273
.512
.129
.8C
lay
Wel
l-so
rted
Stro
ngly
Han
d-fr
iabl
e,w
ell-
roun
ded
fram
ewor
kcl
ast
inco
nglo
mer
ate
054
Mul
owe–
Mut
owa
Unk
now
n36
L06
0112
388
8295
261
.021
.128
.9C
lay
Wel
l-so
rted
Yes
Han
d-fr
iabl
e,w
ell-
roun
ded
fram
ewor
kcl
ast
inco
nglo
mer
ate
055
Mul
owe–
Mut
owa
Unk
now
n36
L06
0112
388
8295
243
.318
.020
.6C
lay
Wel
l-so
rted
Wea
kly
Han
d-fr
iabl
e,w
ell-
roun
ded
fram
ewor
kcl
ast
inco
nglo
mer
ate
†Coo
rdin
ates
reco
rded
with
the
AR
C19
50da
tum
;al
lot
her
coor
dina
tes
use
the
WG
S19
84da
tum
.C
IEL
*a*b
*co
lour
sw
ere
mea
sure
dus
ing
anO
cean
Opt
ics
USB
2000
spec
trom
eter
with
D65
illum
inan
t,tw
o-de
gree
obse
rver
and
refle
ctiv
eco
lour
setti
ngs.
Och
resa
mpl
esw
ere
crus
hed,
mix
edw
ithdi
still
edw
ater
tofo
rma
past
e,sp
read
onun
glaz
edpo
rcel
ain
and
drie
dat
100°
Cbe
fore
colo
urm
easu
rem
ents
wer
eta
ken.
Distinguishing among ochre fingerprints with HOC LA–ICPMS 303
© 2014 University of Oxford, Archaeometry 57, 2 (2015) 297–317
Laser ablation-inductively coupled plasma mass spectrometry of homogenized ochre chips
The variant of HOC LA–ICPMS used in this study was modified from the technique described inGreen and Watling (2007). In our procedure, ochre samples were dried overnight at 85°C andthen manually ground in dry form using an agate mortar and pestle; samples containing coarsesand-sized grains were crushed with a hardened steel die. For each sample, ground ochre wascombined with Lineco Neutral pH Adhesive glue in a ratio of roughly 1.5 g of glue to 1 g ofsample. This ratio was varied as necessary in order to prevent the formation of unmixed clumps;the mixture was stirred until uniform and then spread evenly throughout a 4 cm diameter plasticPetri dish and allowed to dry overnight. Once dry, two ∼1 mm2 HOCs were cut from each Petridish with a steel scalpel; each chip was mounted on a 25 mm diameter, 6 mm tall, double-polished epoxy disc using Scotch® 3M clear double-sided adhesive tape. For each of the 22 ochresamples, two duplicate HOCs were produced in order to monitor the consistency of the traceelement results; these are referred to here as Series A and Series B chips. A single epoxy disc (Fig.S5) was used to mount 46 HOCs; 22 Series A HOCs, 22 Series B HOCs and two chips of driedglue containing no ochre that were analysed to identify which elements were present at thegreatest concentrations in the glue.
The in situ LA–ICPMS analyses were done at the MicroAnalysis Facility – Bruneau Innova-tion Centre (MAF–IIC) at the Memorial University of Newfoundland using a Finnigan ElementXR, a high-resolution double-focusing magnetic-sector inductively coupled plasma mass spec-trometer (HR-ICPMS), coupled to a GeoLas 193 nm Excimer laser system. The ablated materialwas transported to the ICP–MS using He gas with a flow rate of about 1 l min–1, with additionalAr make-up gas added after the ablation cell and before introduction to the ICPMS. A laser spotsize of 49–79 μm was used, with an energy density of approximately 4 J cm–2 and a laserrepetition rate of 8 Hz. Intensity data were acquired by peak-jumping in a combination ofpulse-counting and analogue modes, depending on signal strength, with one point measured perpeak. Elements in high abundance were analysed in analogue mode, whereas true trace elementswere analysed using digital pulse counting mode. The data were acquired in time-resolvedanalysis (TRA) mode and the concentrations were calculated using the Iolite software package(http://www.iolite.org.au/; Paton et al. 2011), as is standard practice for LA–ICPMS when usingNIST 612 as the primary standard. Each analysis was monitored in real time during acquisitionfor “spikes” in the background and integrated intensity signal.
The data acquisition methodology employed an analytical sequence of between two and fourcalibrant analyses, using the NIST 612 glass as the primary calibration standard, followed by 10unknowns, and then a repeat of between two and four analyses of the calibrant. The NIST 610glass and the United States Geological Survey (USGS) reference material BCR-2G were used assecondary standards (Jochum and Stoll 2008). BCR-2G was used as a proxy for the HOCunknowns because no matrix-matched secondary standard was available for this study. Data wereacquired to monitor the accuracy and precision of the analyses for this project and for long-termmonitoring of BCR-2G analyses done over several years (1996–2013) by the second author. Theinternal error for the LA–ICPMS analyses when measuring homogeneous materials is estimatedto be ∼2–3% relative, based on the reproducibility of results for various reference materialsmeasured from day to day over several months in the MUN laboratory. LODs for all elementsmeasured by LA–ICPMS (Table S2) were estimated according to the procedure described inLongerich et al. (1996).
The LA–ICPMS data were reduced using Iolite, with each analysis processed individually andmass bias and mass fractionation corrected. Iolite allows for the selection of representative signal
304 A. M. Zipkin et al.
© 2014 University of Oxford, Archaeometry 57, 2 (2015) 297–317
intervals, background subtraction and internal standard correction for ablation yield differencesand instrument sensitivity drift during the analytical session. The LA–ICPMS data were acquiredas counts per second (cps); Iolite performs calculations reducing count rates into part per million(ppm) concentrations (Paton et al. 2011). Iron concentration, as measured by INAA for each bulkochre sample, was considered representative of the Fe content in each HOC created from a givensample and was used as the internal standard during data reduction. The ICPMS was run for about30–35 s before the laser was fired to collect adequate background readings. Since the laser ablatesinto the sample over time, the x-axis is a proxy for depth as well as time. Thus if there is a mineralinclusion in the sample despite manual homogenization, it will show up as spikes of theconstituent elements of that mineral. If this is the case, then the interval to integrate can beselected in such a way to avoid the “contamination” effect of the inclusion.
A total of 225 LA–ICPMS analyses of experimental samples were completed and included inthe final data set; each HOC was ablated approximately five times. The following 34 elementswere measured by LA–ICPMS: As, Ba, Ce, Co, Cu, Dy, Er, Eu, Gd, Hf, Ho, La, Lu, Mg, Mn, Nb,Nd, Ni, Pr, Sc, Sm, Sn, Sr, Ta, Tb, Th, Ti, Tm, U, V, Y, Yb, Zn and Zr. The results of eachLA–ICPMS analysis are presented in Table S2. After reducing the “raw” data from cps toconcentration (ppm) format in Iolite using the Fe values obtained from INAA of bulk ochresamples, negative values resulting from high background “noise” were manually replaced with a0 ppm value. Next, the element concentrations were all standardized to the Fe concentrationmeasured by INAA for the relevant sample. Subsequent applications of HOC LA–ICPMS willuse the more cost-effective electron probe microanalysis (EPMA) to measure iron content forindividual HOCs.
Trace element composition of glue binder
The two control chips composed only of the Lineco Neutral pH Adhesive were ablated a total of11 times to determine whether any elements were detectable that could act as contaminants andobscure the trace element composition of the ochre in the HOCs. All but two of the elementsmeasured were found to be present at levels below the relevant LOD (Table S2). The twodetectable elements, Mg and Sn, were present in the glue at mean concentrations of 0.91 ppm and0.242 ppm, respectively. The highest single Mg concentration measured in a glue-only chip,1.15 ppm, was approximately 190 times smaller than the lowest Mg concentration measured inan HOC (217.2 ppm). The greatest single Sn concentration found in a glue-only chip, 0.37 ppm,was approximately 20 times smaller than the lowest Sn concentration measured in an HOC(6.88 ppm). The contamination potential of the glue binder was thus considered to be negligible,and these elements were included as variables in subsequent statistical analyses of data fromHOCs.
RESULTS AND STATISTICAL ANALYSIS
Pearson correlation of trace elements with iron content
This project also sought to scrutinize the practice of excluding certain elements from multivariatestatistical explorations of intra- and inter-source variation. According to Popelka-Filcoff et al.(2007a, 2008), elements that correlate positively with Fe concentration form the “Fe oxidesignature” of the ochre, and these elements should be relied upon to distinguish one source fromanother. Popelka-Filcoff and colleagues (2007a, 2008) assert that elements that are negatively
Distinguishing among ochre fingerprints with HOC LA–ICPMS 305
© 2014 University of Oxford, Archaeometry 57, 2 (2015) 297–317
correlated with Fe are associated with quartz or clay minerals that often account for a significantpart of ochre composition. In this approach, the non-Fe oxide signature elements are dropped andonly the elements that are significantly positively correlated with Fe are included in multivariateanalyses of INAA data (e.g., Eiselt et al. 2011). However, it remains unclear if negativelycorrelated elements should always be removed from consideration.
Pearson correlation coefficients were calculated for all elements in the INAA (Table S3) andLA–ICPMS (Table S4) data sets to determine which elements make up the iron oxide signature.A Pearson’s correlation was done on the INAA elemental concentrations in ppm form, withoutany transformation or standardization, using JMP 9 (SAS Institute) statistical software. Nineelements—Al, Ba, Ce, K, La, Mn, Rb, Sr and Ta—were found to be negatively correlated withiron; of these elements, Ba, K and Sr were significantly negatively correlated (α = 0.05). The 22positively correlated elements included As, Co, Cr, Cs, Dy, Eu, Hf, Lu, Na, Nd, Ni, Sb, Sc, Sm,U, Tb, Th, Ti, V, Yb, Zn and Zr. Significantly positively correlated elements at the 95% confi-dence level included As, Co, Cr, Lu, Sb, Sc, V, Yb and Zn.
For the HOC LA–ICPMS data, the results of all 225 ablations were pooled and negative valuesconverted to zero before calculating Pearson coefficients; correlations were determined usingtrace element values from LA–ICPMS and Fe values from INAA. The elements Dy, Eu, Gd, Ho,Mn, Nd, Sm, Sr and Tb were found to be negatively correlated with Fe content; of these, only Mnwas significantly negatively correlated with Fe (α = 0.05). The elements As, Ba, Ce, Co, Cu, Er,Hf, La, Lu, Mg, Nb, Ni, Pr, Sc, Sn, Ta, Th, Ti, Tm, U, V, Y, Yb, Zn and Zr were all positivelycorrelated with iron content, while Co, Cu, Hf, Mg, Sc, Th, V and Y in particular were signifi-cantly positively correlated with Fe (α = 0.05). Of the 24 trace elements detected by both INAAand LA–ICPMS, nine elements exhibited disparate Pearson correlation signs for the two datasets. In summary, the elements Ba, Ce, Dy, Eu, La, Nd, Sm, Ta and Tb yielded positivecorrelations with Fe in one method’s data set and a negative correlation in the other data set.
Reproducibility of LA–ICPMS analyses
To calculate the reproducibility between different mean measurements for the same ochre sample(i.e., the mean element concentrations for HOC A and for HOC B), we first did an ANOVA testusing concentrations for all elements measured as the dependent variable and the HOC numberas the independent variable. The mean square errors among groups (due to different HOCs) andwithin groups (due to the different trials on the same HOC) were used to estimate the variancecomponent among groups (Sokal and Rohlf 1995, 214). Taking the ratio of the among-groupvariance component to the within-group component plus the among-group variance componenttimes 100 (Sokal and Rohlf 1995, 214) reveals how much of the total variation is due to variationbetween different HOCs rather than between different trials on the same HOC, and gives therepeatability of the method for each element. All repeatability calculations were done in the Rstatistical programming language (R Core Team 2013).
The results indicate that the variant of LA–ICPMS used here to collect element concentrationdata, or perhaps the nature of the material being ablated, did not yield strong reproducibility foranalyses done on the same HOC (Table S5). In fact, for 16 out of 34 elements the reproducibilityscores are negative, indicating that the variation within the observations made on a single HOCis actually greater than the variation among the different HOCs. Looking at the data directly, thisis probably due to large differences between the mean element concentrations for the two HOCsproduced from the same ochre sample, sometimes of an order of magnitude or more for a givenelement due to intrinsic heterogeneity of the material.
306 A. M. Zipkin et al.
© 2014 University of Oxford, Archaeometry 57, 2 (2015) 297–317
Multivariate statistical analyses and testing the provenance postulate
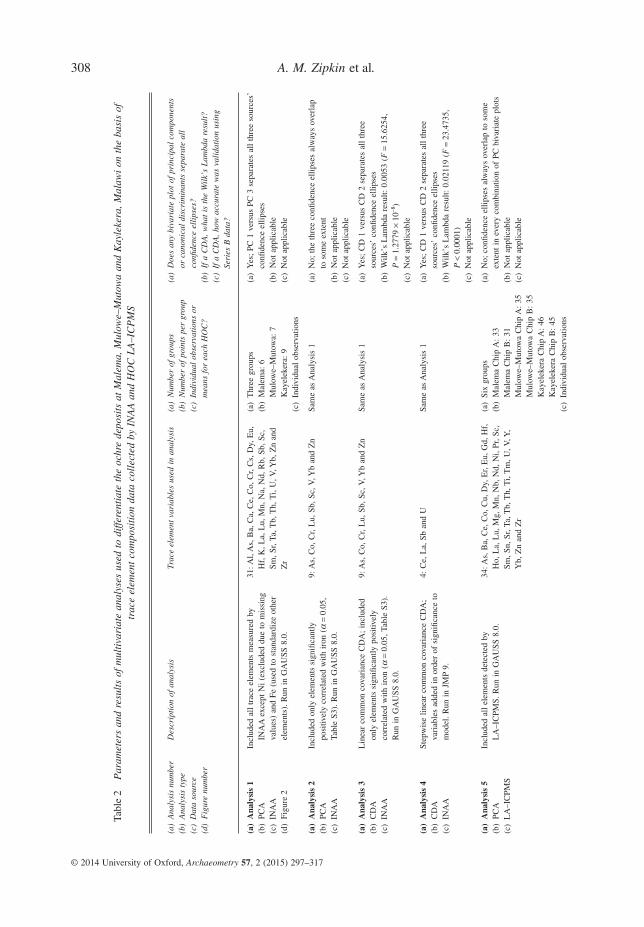
In Table 2, the parameters and results of some multivariate statistical analyses are provided inorder to illustrate successful and unsuccessful approaches to differentiating source groups. Theonly two methods used were principal component analysis (PCA) and canonical discriminantanalysis (CDA), but as illustrated by the table, these two routines can be customized extensively.The parameters modified included: (1) which trace element variables to include; (2) how to groupthe observations (by source or source and HOC); and (3) whether to use individual observationsor mean values obtained by averaging replicate analyses. Principal component analyses of INAAand LA–ICPMS analyses were done using GAUSS 8.0 and followed the well-established statis-tical functions described in Glascock (1992) and Neff (1994). The transformation matrix gener-ated for each PCA listed in Table 2 was applied to the associated set of analyses and the clusteringof samples observed using bivariate plots with 90% confidence ellipses for each source group. Ifthe confidence ellipses overlap, this indicates high intra-source variability, low inter-sourcevariability or both. The goal of these analyses was to explore overall variation in the INAA andLA–ICPMS data sets and to identify any outlier observations.
Although mathematically similar to a PCA, a canonical discriminant analysis (CDA) onlymaximizes variation between groups rather than for the data set as a whole (Glascock 1992). Thismakes it particularly well suited to assigning samples of unknown origin to source groups. TheCDAs done in GAUSS used the direct variant where all the variables entered are evaluatedsimultaneously. JMP offers the option of building a stepwise CDA, a process in which thevariables with the largest F-ratio and smallest P-value are added consecutively. Stepwise con-struction expedites the process of identifying which variables are most effective at distinguishingamongst source groups. The ideal way to apply a CDA in a provenance study is to collectreplicate observations of ochre source samples and reserve a selection of these replicates for usein validating the discriminant function. This approach was not applied here for the INAA analysesdue to limited sample size, but for the LA–ICPMS data several CDAs were built using onlyanalyses from Series A HOCs, while the Series B analyses were excluded for later use invalidating the function. By treating the Series B analyses as “pseudo-unknown specimens”, it waspossible to evaluate how effective a function would be in assigning analyses of actual unknowns(e.g., ochre artefacts) to a source group. Analyses conducted in both GAUSS (M. Glascock pers.comm.) and JMP used a linear, common covariance discriminant method.
DISCUSSION
The primary objective of this study was to compare the efficacy of INAA and HOC LA–ICPMSin distinguishing amongst three sources of ochreous rocks from northern Malawi. INAA-derivedtrace element data were clearly effective at distinguishing between the sources; both PCAs andCDAs using the data obtained from INAA yielded plots (Table 2: Analyses 1, 3 and 4; e.g., Fig. 2)in which the confidence ellipses for each group did not overlap. For the INAA data set, theabsence of replicate analyses of each ochre sample prevented the validation of canonical dis-criminant functions through post-classification analysis. While it was possible to have simplyanalysed a duplicate of each bulk ochre sample and created a data set exclusively for use inpost-classification analysis, this would have doubled the cost of the INAA study. In contrast, thecost of producing replicate observations in a LA–ICPMS study is negligible, since each ablationcan be performed on the same HOC, requiring only a few extra minutes; usually, LA–ICPMSinstrument time is charged at a daily rate versus a per-sample rate.
Distinguishing among ochre fingerprints with HOC LA–ICPMS 307
© 2014 University of Oxford, Archaeometry 57, 2 (2015) 297–317
Tabl
e2
Par
amet
ers
and
resu
lts
ofm
ulti
vari
ate
anal
yses
used
todi
ffer
enti
ate
the
ochr
ede
posi
tsat
Mal
ema,
Mul
owe–
Mut
owa
and
Kay
leke
ra,M
alaw
ion
the
basi
sof
trac
eel
emen
tco
mpo
siti
onda
taco
llec
ted
byIN
AA
and
HO
CL
A–I
CP
MS
(a)
Ana
lysi
snu
mbe
r(b
)A
naly
sis
type
(c)
Dat
aso
urce
(d)
Fig
ure
num
ber
Des
crip
tion
ofan
alys
isTr
ace
elem
ent
vari
able
sus
edin
anal
ysis
(a)
Num
ber
ofgr
oups
(b)
Num
ber
ofpo
ints
per
grou
p(c
)In
divi
dual
obse
rvat
ions
orm
eans
for
each
HO
C?
(a)
Doe
san
ybi
vari
ate
plot
ofpr
inci
pal
com
pone
nts
orca
noni
cal
disc
rim
inan
tsse
para
teal
lco
nfide
nce
elli
pses
?(b
)If
aC
DA
,wha
tis
the
Wil
k’s
Lam
bda
resu
lt?
(c)
Ifa
CD
A,h
owac
cura
tew
asva
lida
tion
usin
gSe
ries
Bda
ta?
(a)
Ana
lysi
s1
(b)
PCA
(c)
INA
A(d
)Fi
gure
2
Incl
uded
all
trac
eel
emen
tsm
easu
red
byIN
AA
exce
ptN
i(e
xclu
ded
due
tom
issi
ngva
lues
)an
dFe
(use
dto
stan
dard
ize
othe
rel
emen
ts).
Run
inG
AU
SS8.
0.
31:A
l,A
s,B
a,C
a,C
e,C
o,C
r,C
s,D
y,E
u,H
f,K
,La,
Lu,
Mn,
Na,
Nd,
Rb,
Sb,S
c,Sm
,Sr,
Ta,T
b,T
h,T
i,U
,V,Y
b,Z
nan
dZ
r
(a)
Thr
eegr
oups
(b)
Mal
ema:
6M
ulow
e–M
utow
a:7
Kay
elek
era:
9(c
)In
divi
dual
obse
rvat
ions
(a)
Yes
;PC
1ve
rsus
PC3
sepa
rate
sal
lth
ree
sour
ces’
confi
denc
eel
lipse
s(b
)N
otap
plic
able
(c)
Not
appl
icab
le
(a)
Ana
lysi
s2
(b)
PCA
(c)
INA
A
Incl
uded
only
elem
ents
sign
ifica
ntly
posi
tivel
yco
rrel
ated
with
iron
(α=
0.05
,Ta
ble
S3).
Run
inG
AU
SS8.
0.
9:A
s,C
o,C
r,L
u,Sb
,Sc,
V,Y
ban
dZ
nSa
me
asA
naly
sis
1(a
)N
o;th
eth
ree
confi
denc
eel
lipse
sal
way
sov
erla
pto
som
eex
tent
(b)
Not
appl
icab
le(c
)N
otap
plic
able
(a)
Ana
lysi
s3
(b)
CD
A(c
)IN
AA
Lin
ear
com
mon
cova
rian
ceC
DA
;in
clud
edon
lyel
emen
tssi
gnifi
cant
lypo
sitiv
ely
corr
elat
edw
ithir
on(α
=0.
05,T
able
S3).
Run
inG
AU
SS8.
0.
9:A
s,C
o,C
r,L
u,Sb
,Sc,
V,Y
ban
dZ
nSa
me
asA
naly
sis
1(a
)Y
es;
CD
1ve
rsus
CD
2se
para
tes
all
thre
eso
urce
s’co
nfide
nce
ellip
ses
(b)
Wilk
’sL
ambd
are
sult:
0.00
53(F
=15
.625
4,P
=1.
2779
×10
–8)
(c)
Not
appl
icab
le
(a)
Ana
lysi
s4
(b)
CD
A(c
)IN
AA
Step
wis
elin
ear
com
mon
cova
rian
ceC
DA
;va
riab
les
adde
din
orde
rof
sign
ifica
nce
tom
odel
.Run
inJM
P9.
4:C
e,L
a,Sb
and
USa
me
asA
naly
sis
1(a
)Y
es;
CD
1ve
rsus
CD
2se
para
tes
all
thre
eso
urce
s’co
nfide
nce
ellip
ses
(b)
Wilk
’sL
ambd
are
sult:
0.02
119
(F=
23.4
735,
P<
0.00
01)
(c)
Not
appl
icab
le
(a)
Ana
lysi
s5
(b)
PCA
(c)
LA
–IC
PMS
Incl
uded
all
elem
ents
dete
cted
byL
A–I
CPM
S.R
unin
GA
USS
8.0.
34:A
s,B
a,C
e,C
o,C
u,D
y,E
r,E
u,G
d,H
f,H
o,L
a,L
u,M
g,M
n,N
b,N
d,N
i,Pr
,Sc,
Sm,S
n,Sr
,Ta,
Tb,
Th,
Ti,
Tm
,U,V
,Y,
Yb,
Zn
and
Zr
(a)
Six
grou
ps(b
)M
alem
aC
hip
A:
33M
alem
aC
hip
B:
31M
ulow
e–M
utow
aC
hip
A:
35M
ulow
e–M
utow
aC
hip
B:
35K
ayel
eker
aC
hip
A:
46K
ayel
eker
aC
hip
B:
45(c
)In
divi
dual
obse
rvat
ions
(a)
No;
confi
denc
eel
lipse
sal
way
sov
erla
pto
som
eex
tent
inev
ery
com
bina
tion
ofPC
biva
riat
epl
ots
(b)
Not
appl
icab
le(c
)N
otap
plic
able
308 A. M. Zipkin et al.
© 2014 University of Oxford, Archaeometry 57, 2 (2015) 297–317
(a)
Ana
lysi
s6
(b)
PCA
(c)
LA
–IC
PMS
Incl
uded
only
elem
ents
sign
ifica
ntly
posi
tivel
yco
rrel
ated
with
iron
(α=
0.05
,Ta
ble
S4).
Run
inG
AU
SS8.
0.
8:C
o,C
u,H
f,M
g,Sc
,Th,
Van
dY
(a)
Six
grou
ps(b
)M
alem
aC
hip
A:
6M
alem
aC
hip
B:
6M
ulow
e–M
utow
aC
hip
A:
7M
ulow
e–M
utow
aC
hip
B:
7K
ayel
eker
aC
hip
A:
9K
ayel
eker
aC
hip
B:
9(c
)M
ean
obse
rvat
ions
(a)
No;
PC1
vers
usPC
3di
ffer
entia
tes
Mul
owe–
Mut
owa
Seri
esA
and
Bgr
oups
from
Mal
ema
Seri
esA
and
Bgr
oups
;PC
2ve
rsus
PC3
diff
eren
tiate
sM
alem
aSe
ries
Aan
dB
grou
psfr
ombo
thK
ayel
eker
aan
dM
ulow
e–M
utow
aSe
ries
Aan
dB
grou
ps;
noco
mbi
natio
nof
PCs
isco
mpl
etel
ysu
cces
sful
atse
para
ting
the
thre
eso
urce
s(b
)N
otap
plic
able
(c)
Not
appl
icab
le
(a)
Ana
lysi
s7
(b)
CD
A(c
)L
A–I
CPM
S
Lin
ear
com
mon
cova
rian
ceC
DA
;in
clud
edal
ltr
ace
elem
ents
dete
cted
byL
A–I
CPM
S.Fu
nctio
nbu
iltus
ing
Seri
esA
chip
data
;Se
ries
Bda
taus
edfo
rva
lidat
ion.
Run
inG
AU
SS8.
0.
34:A
s,B
a,C
e,C
o,C
u,D
y,E
r,E
u,G
d,H
f,H
o,L
a,L
u,M
g,M
n,N
b,N
d,N
i,Pr
,Sc,
Sm,S
n,Sr
,Ta,
Tb,
Th,
Ti,
Tm
,U,V
,Y,
Yb,
Zn
and
Zr
Sam
eas
Ana
lysi
s5
(a)
Yes
;C
D1
vers
usC
D2
sepa
rate
sco
nfide
nce
ellip
ses
for
each
ofth
eth
ree
Seri
esA
sour
cegr
oups
;Se
ries
Bob
serv
atio
nsw
ere
used
asps
eudo
-unk
now
nsan
dw
ere
plot
ted
onto
Seri
esA
ellip
ses
(b)
Wilk
’sL
ambd
are
sult:
0.00
24(F
=44
.552
2,P
<0.
001)
(c)
108/
111
Seri
esB
poin
tsco
rrec
tlyas
sign
edM
iscl
assi
fied:
one
Kay
elek
era
asM
ulow
e–M
utow
a,on
eM
ulow
e–M
utow
aas
Mal
ema
(a)
Ana
lysi
s8
(b)
CD
A(c
)L
A–I
CPM
S(d
)Fi
gure
3
Step
wis
elin
ear
com
mon
cova
rian
ceC
DA
;va
riab
les
adde
din
orde
rof
sign
ifica
nce
tom
odel
.Fun
ctio
nbu
iltus
ing
Seri
esA
chip
data
;Se
ries
Bda
taus
edfo
rva
lidat
ion.
Run
inJM
P9.
8:A
s,C
o,C
u,L
a,M
g,M
n,Sm
and
VSa
me
asA
naly
sis
5(a
)Y
es,s
ame
asA
naly
sis
7(b
)W
ilk’s
Lam
bda
resu
lt:0.
0128
(F=
100.
8481
,P
<0.
0001
)(c
)10
9/11
1Se
ries
Bpo
ints
corr
ectly
assi
gned
Mis
clas
sifie
d:on
eM
alem
aas
Mul
owe–
Mut
owa
(a)
Ana
lysi
s9
(b)
CD
A(c
)L
A–I
CPM
S(d
)Fi
gure
4
Step
wis
elin
ear
com
mon
cova
rian
ceC
DA
;va
riab
les
adde
din
orde
rof
sign
ifica
nce
tom
odel
.Fun
ctio
nbu
iltus
ing
Seri
esA
chip
data
;Se
ries
Bda
taus
edfo
rva
lidat
ion.
Run
inJM
P9.
5:M
g,N
b,N
d,Ta
and
VSa
me
asA
naly
sis
6(a
)Y
es,s
ame
asA
naly
sis
7(b
)W
ilk’s
Lam
bda
resu
lt:0.
0078
(F=
30.8
672,
P<
0.00
01)
(c)
22/2
2Se
ries
Bm
ean
obse
rvat
ions
corr
ectly
assi
gned
(a)
Ana
lysi
s10
(b)
CD
A(c
)L
A–I
CPM
S(d
)Fi
gure
5
Lin
ear
com
mon
cova
rian
ceC
DA
;in
clud
edon
lyel
emen
tssi
gnifi
cant
lypo
sitiv
ely
corr
elat
edw
ithir
on(α
=0.
05,T
able
S4).
Func
tion
built
usin
gSe
ries
Ach
ipda
ta;
Seri
esB
data
used
for
valid
atio
n.R
unin
GA
USS
8.0.
8:C
o,C
u,H
f,M
g,Sc
,Th,
Van
dY
Sam
eas
Ana
lysi
s6
(a)
Yes
,sam
eas
Ana
lysi
s7
(b)
Wilk
’sL
ambd
are
sult:
0.00
35(F
=23
.729
4,P
=6.
6242
×10
–11 )
(c)
22/2
2Se
ries
Bm
ean
obse
rvat
ions
corr
ectly
assi
gned
Distinguishing among ochre fingerprints with HOC LA–ICPMS 309
© 2014 University of Oxford, Archaeometry 57, 2 (2015) 297–317
The larger data set facilitated by LA–ICPMS presented its own challenges. The replicateanalyses for each HOC were generated using approximately five individual ablations scatteredacross the surface of each chip. Despite the manual homogenization of ochre, it is likely that atleast some ablations struck individual mineral grains rather than a uniform mixture of groundochre, causing the low repeatability described above and illustrated in Table S5. The PCAs ofLA–ICPMS data were unsuccessful at separating source groups (Table 2: Analyses 5 and 6),regardless of the use of individual or mean observations and the use of all elements measured oronly iron oxide signature elements. This will be rectified in future studies by mechanicallyhomogenizing all ochre samples into clay-sized particles using a ring-mill. Although there isscant evidence to support this, it is possible that the use of scan-line ablation to analyse a largersurface area of each HOC may yield results with better repeatability. However, should the HOCtechnique continue to be applied to manually ground samples, the use of single-point ablation isstill recommended, so that the LA–ICPMS operator can actively avoid any large, visible grainsthat failed to be homogenized. Subsequent studies using HOC LA–ICPMS may benefit from thedevelopment of matrix-matched ochre and adhesive standards, but for the purposes of mostprovenance research, the relative compositions of artefact and source samples analysed withouta matrix matched standard will probably continue to prove effective.
In marked contrast to the intra-source variation that clouded the PCA results, CDAs, whichonly enhance inter-group variation as opposed to overall variation, proved highly effective usinga range of elemental variables and both individual and mean observations (Table 2: Analyses7–10, Figs 3–5). Despite the low reproducibility of trace elements measured by LA–ICPMS,Analyses 7 and 8 were able to assign individual Series B observations to the correct sourcegroup with 99% accuracy; this underscores the fundamental robustness of this sample prepa-ration technique. Although the majority of individual observations in CD Analysis 8 (Fig. 3)
0.50.40.30.20.10.0-0.1-0.2-0.3-0.4-0.5-0.3
-0.2
-0.1
0.0
0.1
0.2
PC
#3
PC #1
Malema Bulk SampleKayelekera Bulk SampleMulowe-Mutowa Bulk Sample
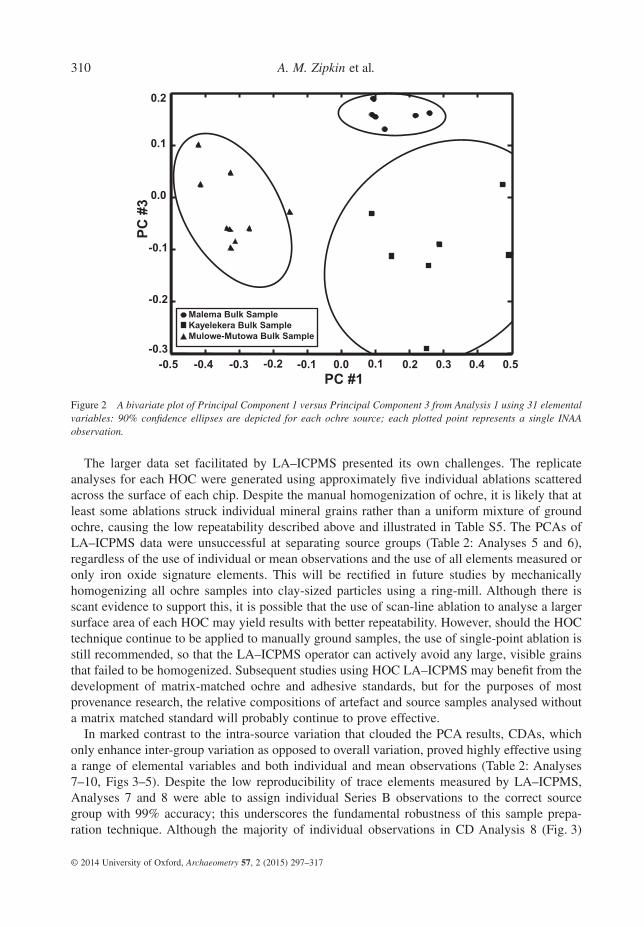
Figure 2 A bivariate plot of Principal Component 1 versus Principal Component 3 from Analysis 1 using 31 elementalvariables: 90% confidence ellipses are depicted for each ochre source; each plotted point represents a single INAAobservation.
310 A. M. Zipkin et al.
© 2014 University of Oxford, Archaeometry 57, 2 (2015) 297–317
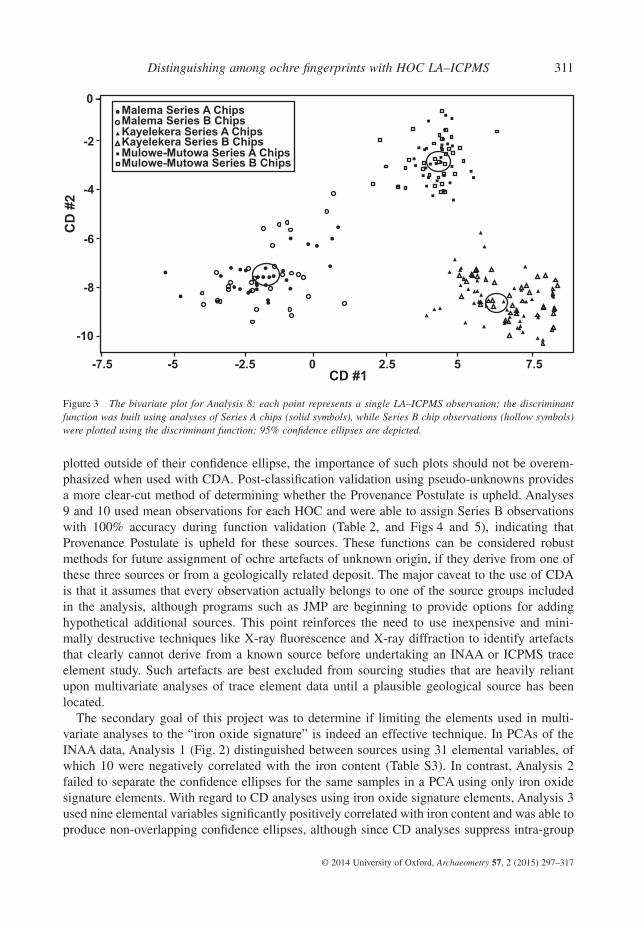
plotted outside of their confidence ellipse, the importance of such plots should not be overem-phasized when used with CDA. Post-classification validation using pseudo-unknowns providesa more clear-cut method of determining whether the Provenance Postulate is upheld. Analyses9 and 10 used mean observations for each HOC and were able to assign Series B observationswith 100% accuracy during function validation (Table 2, and Figs 4 and 5), indicating thatProvenance Postulate is upheld for these sources. These functions can be considered robustmethods for future assignment of ochre artefacts of unknown origin, if they derive from one ofthese three sources or from a geologically related deposit. The major caveat to the use of CDAis that it assumes that every observation actually belongs to one of the source groups includedin the analysis, although programs such as JMP are beginning to provide options for addinghypothetical additional sources. This point reinforces the need to use inexpensive and mini-mally destructive techniques like X-ray fluorescence and X-ray diffraction to identify artefactsthat clearly cannot derive from a known source before undertaking an INAA or ICPMS traceelement study. Such artefacts are best excluded from sourcing studies that are heavily reliantupon multivariate analyses of trace element data until a plausible geological source has beenlocated.
The secondary goal of this project was to determine if limiting the elements used in multi-variate analyses to the “iron oxide signature” is indeed an effective technique. In PCAs of theINAA data, Analysis 1 (Fig. 2) distinguished between sources using 31 elemental variables, ofwhich 10 were negatively correlated with the iron content (Table S3). In contrast, Analysis 2failed to separate the confidence ellipses for the same samples in a PCA using only iron oxidesignature elements. With regard to CD analyses using iron oxide signature elements, Analysis 3used nine elemental variables significantly positively correlated with iron content and was able toproduce non-overlapping confidence ellipses, although since CD analyses suppress intra-group
-7.5 -5 -2.5 0 2.5 5 7.5
0
-2
-4
-6
-8
-10
CD #1
CD
#2
Malema Series A ChipsMalema Series B ChipsKayelekera Series A ChipsKayelekera Series B ChipsMulowe-Mutowa Series A ChipsMulowe-Mutowa Series B Chips
Figure 3 The bivariate plot for Analysis 8: each point represents a single LA–ICPMS observation; the discriminantfunction was built using analyses of Series A chips (solid symbols), while Series B chip observations (hollow symbols)were plotted using the discriminant function; 95% confidence ellipses are depicted.
Distinguishing among ochre fingerprints with HOC LA–ICPMS 311
© 2014 University of Oxford, Archaeometry 57, 2 (2015) 297–317
variation, this is unsurprising. Analysis 4 also upheld the provenance postulate and did sousing only four elements, of which two (Ce and La) were negatively correlated with iron content(Table S3).
When the LA–ICPMS data set is considered, it becomes clearer which statistical techniquesand parameters are more effective for use with large and highly variable data sets. PCA 5, whichused all of the trace elements measured, was unable to separate the confidence ellipses for thethree sources. PCAs are useful for exploring overall variation within the data, but may not beeffective for upholding the Provenance Postulate; in PCA 6, even with selection of only ironoxide signature elements and the use of mean observations to mitigate the effects of intra-groupvariability, it was not possible to distinguish among sources. As noted previously, and in contrastto the ineffectiveness of PCAs, all CDAs were able to differentiate the sources, regardless of theparameters used (Table 2: Analyses 7–10).
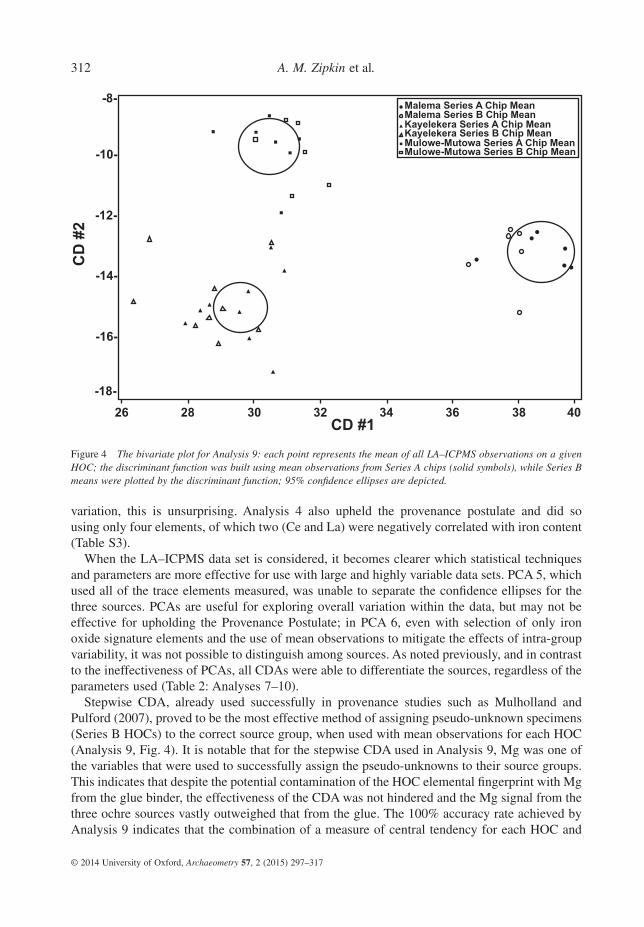
Stepwise CDA, already used successfully in provenance studies such as Mulholland andPulford (2007), proved to be the most effective method of assigning pseudo-unknown specimens(Series B HOCs) to the correct source group, when used with mean observations for each HOC(Analysis 9, Fig. 4). It is notable that for the stepwise CDA used in Analysis 9, Mg was one ofthe variables that were used to successfully assign the pseudo-unknowns to their source groups.This indicates that despite the potential contamination of the HOC elemental fingerprint with Mgfrom the glue binder, the effectiveness of the CDA was not hindered and the Mg signal from thethree ochre sources vastly outweighed that from the glue. The 100% accuracy rate achieved byAnalysis 9 indicates that the combination of a measure of central tendency for each HOC and
-18-
-16-
-14-
-12-
-10-
-8-
26 28 3 0 3 2 3 4 3 6 3 8 40
Malema Series A Chip MeanMalema Series B Chip MeanKayelekera Series A Chip MeanKayelekera Series B Chip MeanMulowe-Mutowa Series A Chip MeanMulowe-Mutowa Series B Chip Mean
CD #1
CD
#2
Figure 4 The bivariate plot for Analysis 9: each point represents the mean of all LA–ICPMS observations on a givenHOC; the discriminant function was built using mean observations from Series A chips (solid symbols), while Series Bmeans were plotted by the discriminant function; 95% confidence ellipses are depicted.
312 A. M. Zipkin et al.
© 2014 University of Oxford, Archaeometry 57, 2 (2015) 297–317
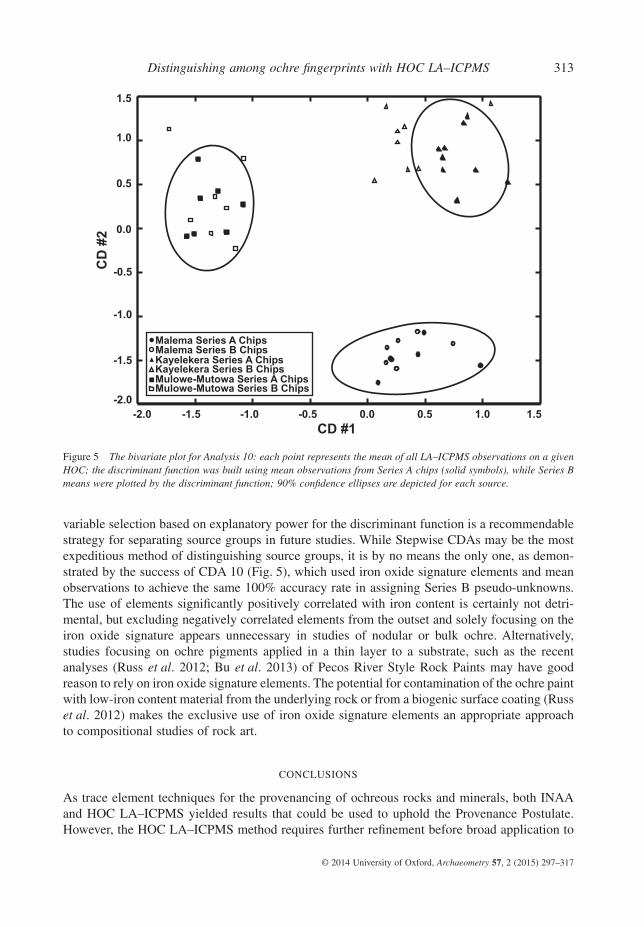
variable selection based on explanatory power for the discriminant function is a recommendablestrategy for separating source groups in future studies. While Stepwise CDAs may be the mostexpeditious method of distinguishing source groups, it is by no means the only one, as demon-strated by the success of CDA 10 (Fig. 5), which used iron oxide signature elements and meanobservations to achieve the same 100% accuracy rate in assigning Series B pseudo-unknowns.The use of elements significantly positively correlated with iron content is certainly not detri-mental, but excluding negatively correlated elements from the outset and solely focusing on theiron oxide signature appears unnecessary in studies of nodular or bulk ochre. Alternatively,studies focusing on ochre pigments applied in a thin layer to a substrate, such as the recentanalyses (Russ et al. 2012; Bu et al. 2013) of Pecos River Style Rock Paints may have goodreason to rely on iron oxide signature elements. The potential for contamination of the ochre paintwith low-iron content material from the underlying rock or from a biogenic surface coating (Russet al. 2012) makes the exclusive use of iron oxide signature elements an appropriate approachto compositional studies of rock art.
CONCLUSIONS
As trace element techniques for the provenancing of ochreous rocks and minerals, both INAAand HOC LA–ICPMS yielded results that could be used to uphold the Provenance Postulate.However, the HOC LA–ICPMS method requires further refinement before broad application to
Malema Series A ChipsMalema Series B ChipsKayelekera Series A ChipsKayelekera Series B ChipsMulowe-Mutowa Series A ChipsMulowe-Mutowa Series B Chips
-2.0 -1.5 -1.0 -0.5 0.0 0.5 1.0 1.5 CD #1
1.5
1.0
0.5
0.0
-0.5
-1.0
-1.5
-2.0
CD
#2
Figure 5 The bivariate plot for Analysis 10: each point represents the mean of all LA–ICPMS observations on a givenHOC; the discriminant function was built using mean observations from Series A chips (solid symbols), while Series Bmeans were plotted by the discriminant function; 90% confidence ellipses are depicted for each source.
Distinguishing among ochre fingerprints with HOC LA–ICPMS 313
© 2014 University of Oxford, Archaeometry 57, 2 (2015) 297–317
the sourcing of ochre artefacts. The weak reproducibility of LA–ICPMS observations couldpotentially result in enough intra-source or even intra-sample variability to prevent discriminationamongst sources, although that did not occur here. The benefits of LA–ICPMS include the abilityto generate low-cost, fast, replicate analyses of ochre samples and increase the number ofanalyses per sample such that robust multivariate statistics, including discriminant functionvalidation using pseudo-unknowns, are possible. In addition, the HOC sample preparationmethod in particular makes it possible to obtain LA–ICPMS data for artefacts both too large fordirect ablation and unsuitable for destructive INAA sampling; this will facilitate provenancestudies of artefacts previously considered ineligible for such research. Finally, the addition of abinding agent (the glue used to make the HOCs) to the homogenized ochre produced noidentifiable obstacle to distinguishing amongst multiple sources using their trace element finger-prints. When combined with complementary analytical techniques and geological investigationsof the parent rocks from which the ochre was derived, HOC LA–ICPMS will be an effectiveapproach to the investigation of patterns in mineral pigment acquisition and transport duringantiquity.
ACKNOWLEDGEMENTS
The authors wish to thank the many individuals who contributed to this project: in Malawi,Menno Welling, Harrison Simfukwe and Simon Kumwenda; at the University of Missouri,Michael Glascock and Jeffrey Ferguson; at Memorial University of Newfoundland, WilfredoDiegor and Erin Mundy; at Arizona State University, Marina Bravo Foster and Scott Robinson;at The George Washington University, Catherine Forster, Chris Cahill, Andrew Kerr and NeilRoach; and at Cornell University, Erica Jane Secor. Special thanks are given to the MalawiMinistry of Tourism, Wildlife and Culture. This paper also benefited from the comments andsuggestions of two anonymous reviewers; the authors thank them for their valuable contributionto this project.
Financial support for this project was provided by National Science Foundation (NSF) Gradu-ate Research Fellowship 2011116368, NSF Doctoral Dissertation Improvement Grant BCS-1240694, NSF IGERT DGE-0801634, a Natural Sciences and Engineering Research Council ofCanada Discovery Grant (to JMH), Wenner-Gren Foundation Dissertation Fieldwork Grant 8623,a Cosmos Club Foundation Cosmos Scholars Grant, an Explorers Club Washington GroupExploration and Field Research Grant, an Australian Research Council Discovery Projects Grantand Australian Postdoctoral Fellowship, a National Geographic Society/Waitt Foundation Grantand a University of Queensland Early Career Researcher Grant.
REFERENCES
Barham, L. S., 2002, Systematic pigment use in the Middle Pleistocene of south-central Africa, Current Anthropology,43, 181–90.
Betzler, C., and Ring, U., 1995, Sedimentology of the Malawi Rift—facies and stratigraphy of the Chiwondo Beds,northern Malawi, Journal of Human Evolution, 28, 23–35.
Biggs, J., Nissen, E., Craig, T., Jackson, J., and Robinson, D. P., 2010, Breaking up the hanging wall of a rift-border fault:the 2009 Karonga earthquakes, Malawi, Geophysical Research Letters, 37(L11305), doi:10.1029/2010GL043179.
Braun, D. R., Plummer, T., Ditchfield, P., Ferraro, J. V., Maina, D., Bishop, L. C., and Potts, R., 2008, Oldowan behaviorand raw material transport: perspectives from the Kanjera Formation, Journal of Archaeological Science, 35,2329–45.
Bu, K., Cizdziel, J. V., and Russ, J., 2013, The source of iron-oxide pigments used in Pecos River style rock paints,Archaeometry, 55, 1088–100.
314 A. M. Zipkin et al.
© 2014 University of Oxford, Archaeometry 57, 2 (2015) 297–317
CIE (Commission Internationale de l’Eclairage), 1978, Recommendations on uniform color spaces, color differenceequations, psychometric color terms, in Supplement No. 2 to CIE publication No. 15 (E-1.3.1) 1971/(TC-1.3),9–12.
Cornell, R. M., and Schwertmann, U., 2003, The iron oxides: structure, properties, reactions, occurrences and uses, 2ndedn, Wiley-VCH, Weinheim.
Currie, L. A., 1968, Limits for qualitative detection and quantitative determination: application to radiochemistry,Analytical Chemistry, 40, 586–93.
Dayet, L., Texier, P.-J., Daniel, F., and Porraz, G., 2013, Ochre resources from the Middle Stone Age sequenceof Diepkloof Rock Shelter, Western Cape, South Africa, Journal of Archaeological Science, 40, 3492–505.
d’Errico, F., 2008, Le rouge et le noire; implications of early pigment use in Africa, the Near East, and Europe for theorigin of cultural modernity, South African Archaeological Society Goodwin Series, 10, 168–74.
d’Errico, F., Henshilwood, C., Vanhaeren, M., and Van Niekerk, K., 2005, Nassarius kraussianus shell beadsfrom Blombos Cave: evidence for symbolic behaviour in the Middle Stone Age, Journal of Human Evolution, 48,3–24.
Ebinger, C. J., 1989, Tectonic development of the western branch of the East African rift system, Geological Society ofAmerica Bulletin, 101, 885–903.
Eiselt, B. S., Popelka-Filcoff, R. S., Darling, J. A., and Glascock, M. D., 2011, Hematite sources and archaeologicalochres from Hohokam and O’odham sites in central Arizona: an experiment in type identification and characteriza-tion, Journal of Archaeological Science, 38, 3019–28.
Gauthier, G., Burke, A. L., and Leclerc, M., 2012, Assessing XRF for the geochemical characterization of radiolarianchert artifacts from northeastern North America, Journal of Archaeological Science, 39, 2436–51.
Glascock, M. D., 1992, Characterization of archaeological ceramics at MURR by neutron activation analysis andmultivariate statistics, in Chemical characterization of ceramic pastes in archaeology (ed. H. Neff), 11–26, PrehistoryPress, Madison, WI.
Green, R. L., and Watling, R. J., 2007, Trace element fingerprinting of Australian ocher using laser ablation inductivelycoupled plasma-mass spectrometry (LA–ICP–MS) for the provenance establishment and authentication of indigenousart, Journal of Forensic Sciences, 52, 851–9.
Harben, P. W., and Kužvart, M., 1996, Industrial minerals: a global geology, Industrial Minerals Information Ltd,London.
Henshilwood, C. S., d’Errico, F., and Watts, I., 2009, Engraved ochres from the Middle Stone Age levels at BlombosCave, South Africa, Journal of Human Evolution, 57, 27–47.
Henshilwood, C. S., D’Errico, F., Van Niekerk, K. L., Coquinot, Y., Jacobs, Z., Lauritzen, S.-E., Menu, M., andGarcía-Moreno, R., 2011, A 100,000-year-old ochre-processing workshop at Blombos Cave, South Africa, Science,334, 219–22.
Hull, S., Fayek, M., Mathien, F. J., Shelley, P., and Durand, K. R., 2008, A new approach to determining the geologicalprovenance of turquoise artifacts using hydrogen and copper stable isotopes, Journal of Archaeological Science, 35,1355–69.
Iriarte, E., Foyo, A., Sánchez, M. A., and Tomillo, C., 2009, The origin and geochemical characterization of red ochresfrom the Tito Bustillo and Monte Castillo Caves (northern Spain), Archaeometry, 51, 231–51.
Jercher, M., Pring, A., Jones, P., and Raven, M., 1998, Rietveld X-ray diffraction and X-ray fluorescence analysis ofAustralian aboriginal ochres, Archaeometry, 40, 383–401.
Jochum, K. P., and Stoll, B., 2008, Reference materials for elemental and isotopic analyses by LA–(MC)–ICP–MS:successes and outstanding needs, in Laser ablation ICP–MS in the earth sciences: current practices and outstandingissues (ed. P. J. Sylvester), 147, Mineralogical Association of Canada, Quebec.
Kaufulu, Z. M., Vrba, E. S., and White, T. D., 1981, Age of the Chiwondo Beds, northern Malawi, Annals of the TransvaalMuseum, 33, 1–8.
Kiehn, A. V., Brook, G. A., Glascock, M. D., Dake, J. Z., Robbins, L. H., and Campbell, A. C., 2007, Fingerprintingspecular hematite from mines in Botswana, Southern Africa, in Archaeological chemistry: analytical techniques andarchaeological interpretation (eds. M. D. Glascock, R. J. Speakman and R. S. Popelka-Filcoff), 460–79, AmericanChemical Society, Washington, DC.
Longerich, H. P., Jackson, S. E., and Gunther, D., 1996, Laser ablation inductively coupled plasma mass spectrometrictransient signal data acquisition and analyte concentration calculation, Journal of Analytical Atomic Spectrometry, 11,899–904.
McBrearty, S., and Brooks, A. S., 2000, The revolution that wasn’t: a new interpretation of the origin of modern humanbehavior, Journal of Human Evolution, 39, 453–563.
Distinguishing among ochre fingerprints with HOC LA–ICPMS 315
© 2014 University of Oxford, Archaeometry 57, 2 (2015) 297–317
MacDonald, B. L., 2008, Ochre procurement and distribution on the central coast of British Columbia, M.A. thesis,Department of Anthropology, McMaster University.
MacDonald, B. L., Hancock, R. G. V., Cannon, A., and Pidruczny, A., 2011, Geochemical characterization of ochre fromcentral coastal British Columbia, Canada, Journal of Archaeological Science, 38, 3620–30.
McDougall, I., Brown, F. H., and Fleagle, J. G., 2005, Stratigraphic placement and age of modern humans from Kibish,Ethiopia, Nature, 433, 733–6.
Merrick, H. V., and Brown, F. H., 1984, Obsidian sources and patterns of source utilization in Kenya and northernTanzania: some initial findings, The African Archaeological Review, 2, 129–52.
Mulholland, S. C., and Pulford, M. H., 2007, Trace-element analysis of native copper: the view from northern Minnesota,USA, Geoarchaeology, 22, 67–84.
Nash, D. J., Coulson, S., Staurset, S., Smith, M. P., and Ullyott, J. S., 2013, Provenancing silcrete in the Cape coastal zone:implications for Middle Stone Age research in South Africa, Journal of Human Evolution, 65, 682–8.
Neff, H., 1994, RQ-mode principal components analysis of ceramic compositional data, Archaeometry, 36,115–30.
Neff, H., 2000, Neutron activation analysis for provenance determination in archaeology, in Modern analytical methodsin art and archaeology (eds. E. Ciliberto and G. Spoto), 81–134, John Wiley & Sons, Inc., New York.
Negash, A., and Shackley, M. S., 2006, Geochemical provenance of obisidian artefacts from the MSA Site of Porc Epic,Ethiopia, Archaeometry, 48, 1–12.
Paton, C., Hellstrom, J., Paul, B., Woodhead, J., and Hergt, J., 2011, Iolite: freeware for the visualisation and processingof mass spectrometric data, Journal of Analytical Atomic Spectrometry, 26, 2508–18.
Pollard, A. M., Batt, C. M., Stern, B., and Young, S. M. M., 2007, Analytical chemistry in archaeology, CambridgeUniversity Press, Cambridge, UK.
Popelka-Filcoff, R. S., 2006, Applications of elemental analysis for archaeometric studies: analytical and statisticalmethods for understanding geochemical trends in ceramics, ochre and obsidian, Unpublished Ph.D. thesis, Universityof Missouri, Columbia, MO.
Popelka-Filcoff, R. S., Robertson, J. D., Glascock, M. D., and Descantes, C., 2007a, Trace element characterization ofochre from geological sources, Journal of Radioanalytical and Nuclear Chemistry, 272, 17–27.
Popelka-Filcoff, R. S., Miksa, E. J., Robertson, J. D., Glascock, M. D., and Wallace, H., 2008, Elemental analysis andcharacterization of ochre sources from southern Arizona, Journal of Archaeological Science, 35, 752–62.
Popelka-Filcoff, R. S., Craig, N., Glascock, M. D., Robertson, J. D., Aldenderfer, M., and Speakman, R. J., 2007b,Instrumental neutron activation analysis of ochre artifacts from Jiskairumoko, Peru Jiskairumoko-a Late-Terminalarchaic village, in Archaeological chemistry: analytical techniques and archaeological interpretation (eds. M. D.Glascock, R. J. Speakman and R. S. Popelka-Filcoff), 480–505, American Chemical Society, Washington, DC.
R Core Team, 2013, R: a language and environment for statistical computing, R Foundation for Statistical Computing,Vienna.
Russ, J., Bu, K., Hamrick, J., and Cizdziel, J. V., 2012, Laser ablation-inductively coupled plasma-mass spectrometryanalysis of Lower Pecos rock paints and possible pigment sources, in Collaborative endeavors in the chemicalanalysis of art and cultural heritage materials (eds. P. L. Lang and R. A. Armitage), 91–121, American ChemicalSociety, Washington, DC.
Sarah, G., Gratuze, B., and Barrandon, J.-N., 2007, Application of laser ablation inductively coupled plasma massspectrometry (LA–ICP–MS) for the investigation of ancient silver coins, Journal of Analytical Atomic Spectrometry,22, 1163.
Sokal, R. R., and Rohlf, F., 1995, The principles and practice of statistics in biological research, W. H. Freeman, NewYork.
Thompson, J. C., Mackay, A., Wright, D. K., Welling, M., Greaves, A., Gomani-Chindebvu, E., and Simengwa, D.,2012, Renewed investigations into the Middle Stone Age of northern Malawi, Quaternary International, 270,129–39.
Wadley, L. 2006, Revisiting cultural modernity and the role of ochre in the Middle Stone Age, in The prehistory of Africa;tracing the lineage of modern man (ed. H. Soodyall), 49–63, Jonathan Ball, Jeppestown, South Africa.
Watts, I., 2002, Ochre in the Middle Stone Age of Southern Africa: ritualised display or hide preservative? South AfricanArchaeological Bulletin, 57, 1–14.
Watts, I., 2010, The pigments from Pinnacle Point Cave 13B, Western Cape, South Africa, Journal of Human Evolution,59, 392–411.
Weigand, P. C., Harbottle, G., and Sayre, E. V., 1977, Turquoise sources and source analysis: Mesoamerican and thesouthwestern U.S.A., in Exchange systems in prehistory (eds. T. K. Earle and J. E. Ericson), 15–34, Academic Press,New York.
316 A. M. Zipkin et al.
© 2014 University of Oxford, Archaeometry 57, 2 (2015) 297–317
SUPPORTING INFORMATION
Additional Supporting Information may be found in the online version of this article at thepublisher’s web-site:
SI 1. Background – Ochre Formation and DiversitySI 2. Background – Ochre Provenance TechniquesSI 3. Source Sampling and DescriptionsSI 4. Instrumental Neutron Activation Analysis MethodsSI 5. Comparison of INAA and LA–ICPMS Results by NPMANOVATable S1: Concentrations in parts per million (ppm) for all elements measured by INAA duringanalysis of ochre samplesTable S2: Concentrations in parts per million (ppm) for all elements measured by LA–ICPMSduring analysis of Homogenized Ochre Chips and glue only chipsTable S3: Pearson correlations for each trace element with Fe, for concentrations measured byINAA for all ochre samples analysedTable S4: Pearson correlations for each trace element with Fe, for concentrations measured byLA–ICPMS and calculated using results from individual ablations of Homogenized Ochre ChipsTable S5: Repeatability/reproducibility scores for trace elements measured by LA–ICPMS onHOCsFigure S1. Exposure of ochreous sandy silt within the Chiwondo Bed near Malema Camp,MalawiFigure S2. Exposure of conglomerate containing ochreous framework clasts located on theMulowe River near Mutowa Village, MalawiFigure S3. Modern excavation for ochre pigments located near Kayelekera, Malawi; ochre fromthis source is used by local residents to decorate nearby structuresFigure S4. (a) Plain polarized light image of a thin section of an ochreous framework clast fromthe lithic polymict orthoconglomerate at the Mulowe-Mutowa source. (b) Plain polarized lightimage of a thin section of an ochre nodule recovered from a geotrench on Chaminade Hill,Karonga, Malawi near the Chaminade 1A Middle Stone Age siteFigure S5. Homogenized Ochre Chips mounted for ablation on a 2.5 cm diameter polished epoxydisc using Scotch 3M clear double sided adhesive tape
Distinguishing among ochre fingerprints with HOC LA–ICPMS 317
© 2014 University of Oxford, Archaeometry 57, 2 (2015) 297–317


